Embed Size (px)
Citation preview
Advanced 3D Visualization and Analysis of Phased Array UT Inspection Data
Johan Berlanger, David Reilly, Daniel Richard, Guy Maes (Zetec Inc., Canada)
Phased array is now a mature and widely adopted technology, and allows for highly efficient UT inspections on critical components in aerospace, oil & gas, heavy industry and power generation plants.
Still, the industry is continuously looking for innovative and efficient inspection solutions to more challenging inspection configurations, and this requires advanced software features.
This paper will present recently developed and enhanced software tools to support inspections on components with complex geometries:
− accurate CAD models can be imported from files, or can be generated using either a manual profiling tool, position C-scan UT data, or a laser scanning device
− advanced phased array probe types can be designed, simulated and controlled, to improve inspection capability for challenging inspections
− a versatile scanner simulation tool now supports various scanner types; linking of the phased array probe assembly with the scanner allows to generate accurate coverage maps
− rapid and efficient plotting of inspection data on complex surfaces in the 3D model, including rebounds and correction for couplant gap
− use of both Cartesian and polar coordinate systems, with appropriate tools for visualization, positioning and sizing of indications (cutting planes, 3D cursors, drawing tools)
Various practical examples will be presented, to illustrate the potential of the new software tools for design of advanced phased array probes and inspection sequences, and for display and analysis of inspection results in a 3D environment.
Advanced 3D visualization tools can be used for the design and validation of various UT inspections, and are also very useful during the analysis of the examination data, and for the detailed investigation of reported indications. This is true for both conventional UT and phased array UT inspections. However, advanced software tools are probably more essential for inspections involving phased arrays, as these are often applied on complex geometries (1), and can involve multiple beams generated from a single probe: for example, the increasing application of 2D arrays that can generate beams with a range of refraction and skew angles.
3D ray tracing can be utilized, for a given component and defect combination, to determine where a probe should be placed and what refraction and skew angles are required to insonify the defect. If a representative CAD model of the component is available, accurate information can be extracted regarding the incidence angle on the defect, thus enabling an initial assessment of detectability. Ray tracing also provides information regarding travel times for echoes scattered from the defect and for geometric echoes in the component. 3D rays can be used to provide a graphical representation of focal laws and their formation. Multiple rays can provide an indication of coverage achieved either for a single crystal or a phased array probe.
Beam simulation can be utilized to design probes and wedges, and to assess whether or not an available probe will be suitable for a particular application. Beam simulation can also provide
ABSTRACT
INTRODUCTION
useful information about specific probe characteristics: can a specific beam be adequately generated; presence of side lobes and grating lobes; relative strength of shear and compression wave components when using a wedge; the effect of ‘dead’ elements on the acoustic beam.
Accurate representation of the probe trajectory on the considered component (inspection sequence), in combination with the above-mentioned ray-tracing, will allow the UT technique developer to assess inspection coverage and to optimize the inspection technique.
Finally, accurate and realistic 3D visualization of UT examination data in the CAD model of the inspected component will drastically facilitate and expedite the analysis process for phased array inspections on complex components. This 3D representation, in combination with adequate software tools will allow for accurate positioning and sizing of flaw indications. In addition, flaw characterization may be improved by corroborating indications with 3D ray-tracing on the same CAD model.
Zetec introduced the new UltraVision® 3 software platform in 2008, and completed the migration of its earlier 3D package in 2010 (2). Since then, requests from multiple users and custom application development projects have led to many incremental improvements and several fundamental enhancements in the newest UV 3.5 release version.
The input information for any UT inspection technique development consists of the detailed inspection objectives, and a complete and accurate description of the inspection configuration.
The inspection objectives include a complete description of the flaw(s) to be considered: type, size, location, orientation and other characteristics; as well as the detailed requirements for detection and sizing of these flaws.
The description of the inspection configuration should include an accurate graphical representation of the component or weld to be examined, detailed information about base materials and weld materials, and any access restrictions that could be relevant to the implementation of the inspection techniques and equipment.
Obviously, the ability to use a CAD model of the component to be inspected in the UT and phased array inspection software package will greatly facilitate and expedite the inspection preparation. UltraVision® 3 offers various alternatives to achieve this goal.
For some inspection configurations, typically with complex but regular inspection surfaces, the software offers a set of pre-defined components with welded configurations that can be modified by the operator to represent the actual configuration.
In other cases, a realistic CAD file of the existing component is readily available, in which case it can be simply imported, using the *.SAT file format
However, for a large number of cases in the field, no accurate as-built CAD models are available. To deal with this, UltraVision 3 offers a “Specimen Generator” tool that enables the creation of a 3D specimen from a complex surface shape replicated with a manual profile tool.
Furthermore, CAD files generated by 3D laser scanning of the component surface using a flexible portable scanning device can be easily imported in the UltraVision environment.
A recently developed alternative is the creation of the surface profile from position C-Scan UT data acquired from a 0° channel (either phased array or conventional). In order to accurately create the rough and wavy surface, the raw position data needs some cleaning up. This processing of the position UT data is shown in Figure 1: on the left the raw position data with missing interface reflections, the middle image shows the result of the “Aberrant Point Removal” algorithm, whereas the right picture shows the smoothed final data.
COMPONENT SPECIFICATION
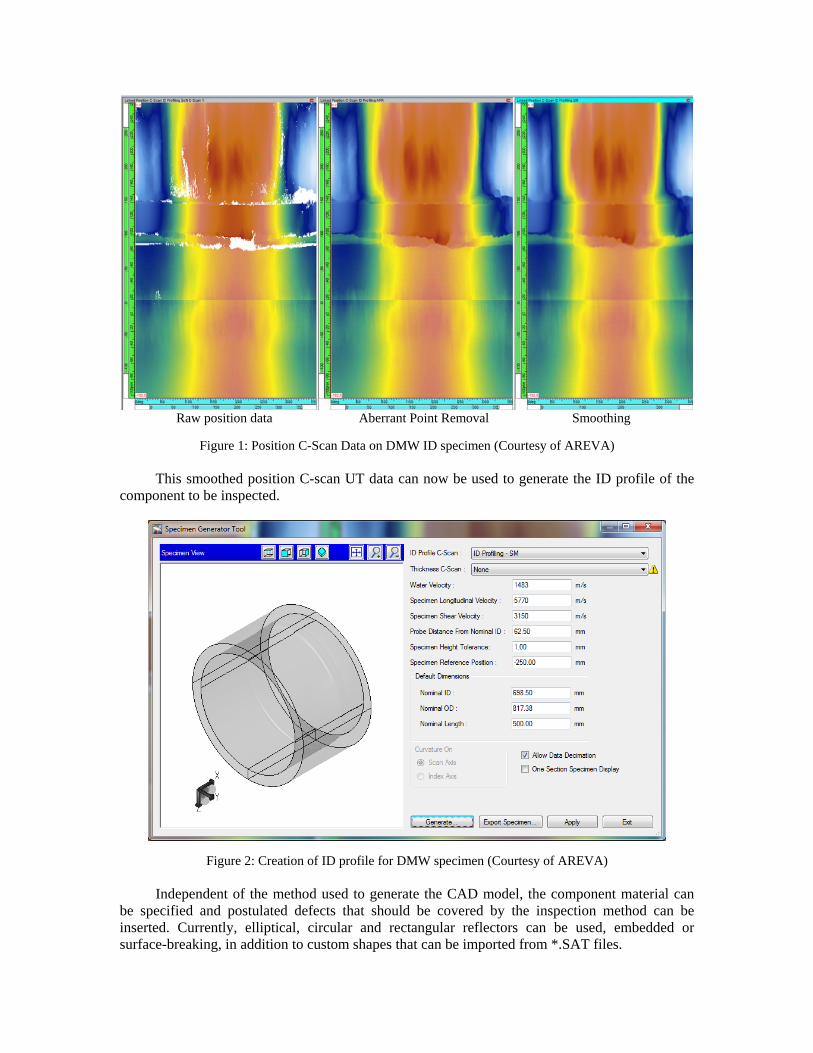
Raw position data Aberrant Point Removal Smoothing
Figure 1: Position C-Scan Data on DMW ID specimen (Courtesy of AREVA)
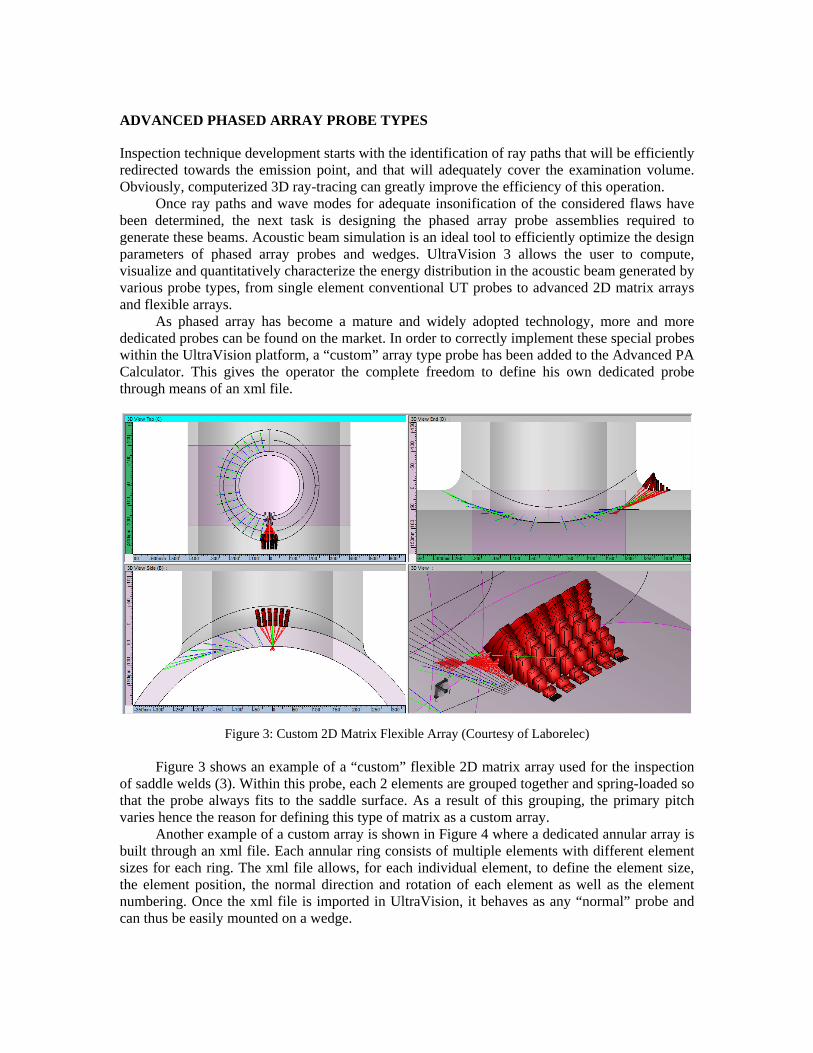
This smoothed position C-scan UT data can now be used to generate the ID profile of the component to be inspected.
Figure 2: Creation of ID profile for DMW specimen (Courtesy of AREVA)
Independent of the method used to generate the CAD model, the component material can be specified and postulated defects that should be covered by the inspection method can be inserted. Currently, elliptical, circular and rectangular reflectors can be used, embedded or surface-breaking, in addition to custom shapes that can be imported from *.SAT files.
Inspection technique development starts with the identification of ray paths that will be efficiently redirected towards the emission point, and that will adequately cover the examination volume. Obviously, computerized 3D ray-tracing can greatly improve the efficiency of this operation.
Once ray paths and wave modes for adequate insonification of the considered flaws have been determined, the next task is designing the phased array probe assemblies required to generate these beams. Acoustic beam simulation is an ideal tool to efficiently optimize the design parameters of phased array probes and wedges. UltraVision 3 allows the user to compute, visualize and quantitatively characterize the energy distribution in the acoustic beam generated by various probe types, from single element conventional UT probes to advanced 2D matrix arrays and flexible arrays.
As phased array has become a mature and widely adopted technology, more and more dedicated probes can be found on the market. In order to correctly implement these special probes within the UltraVision platform, a “custom” array type probe has been added to the Advanced PA Calculator. This gives the operator the complete freedom to define his own dedicated probe through means of an xml file.
Figure 3: Custom 2D Matrix Flexible Array (Courtesy of Laborelec)
Figure 3 shows an example of a “custom” flexible 2D matrix array used for the inspection of saddle welds (3). Within this probe, each 2 elements are grouped together and spring-loaded so that the probe always fits to the saddle surface. As a result of this grouping, the primary pitch varies hence the reason for defining this type of matrix as a custom array.
Another example of a custom array is shown in Figure 4 where a dedicated annular array is built through an xml file. Each annular ring consists of multiple elements with different element sizes for each ring. The xml file allows, for each individual element, to define the element size, the element position, the normal direction and rotation of each element as well as the element numbering. Once the xml file is imported in UltraVision, it behaves as any “normal” probe and can thus be easily mounted on a wedge.
ADVANCED PHASED ARRAY PROBE TYPES
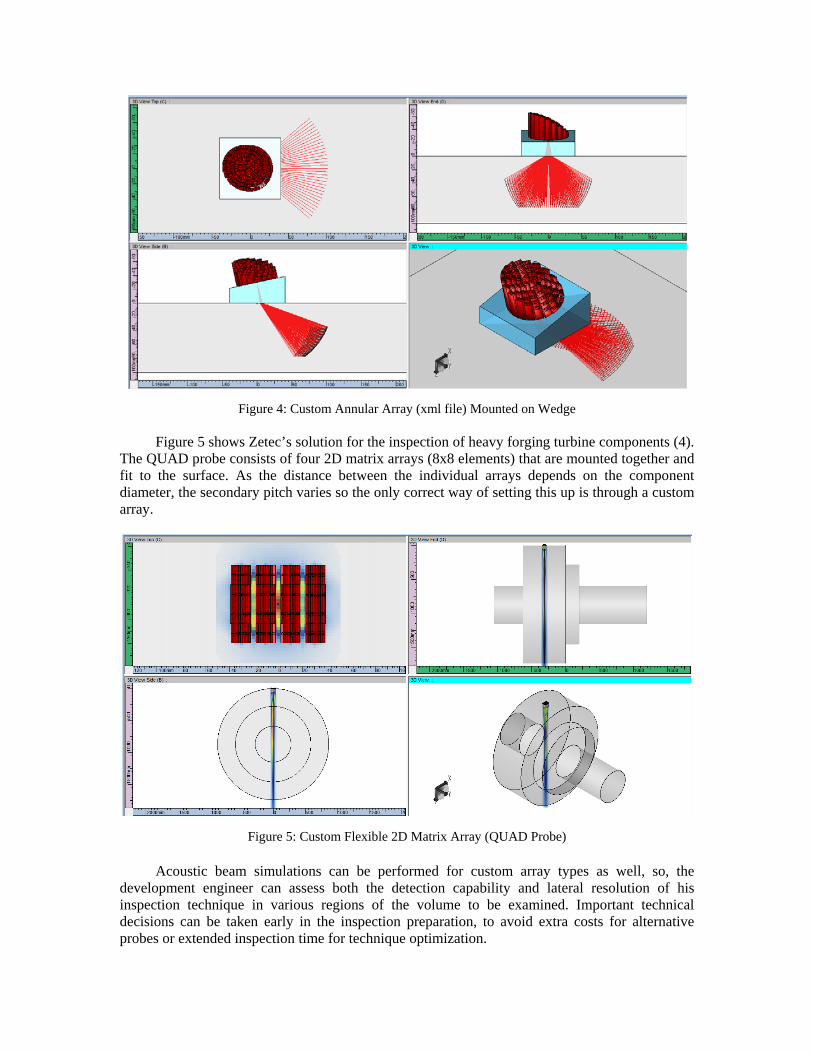
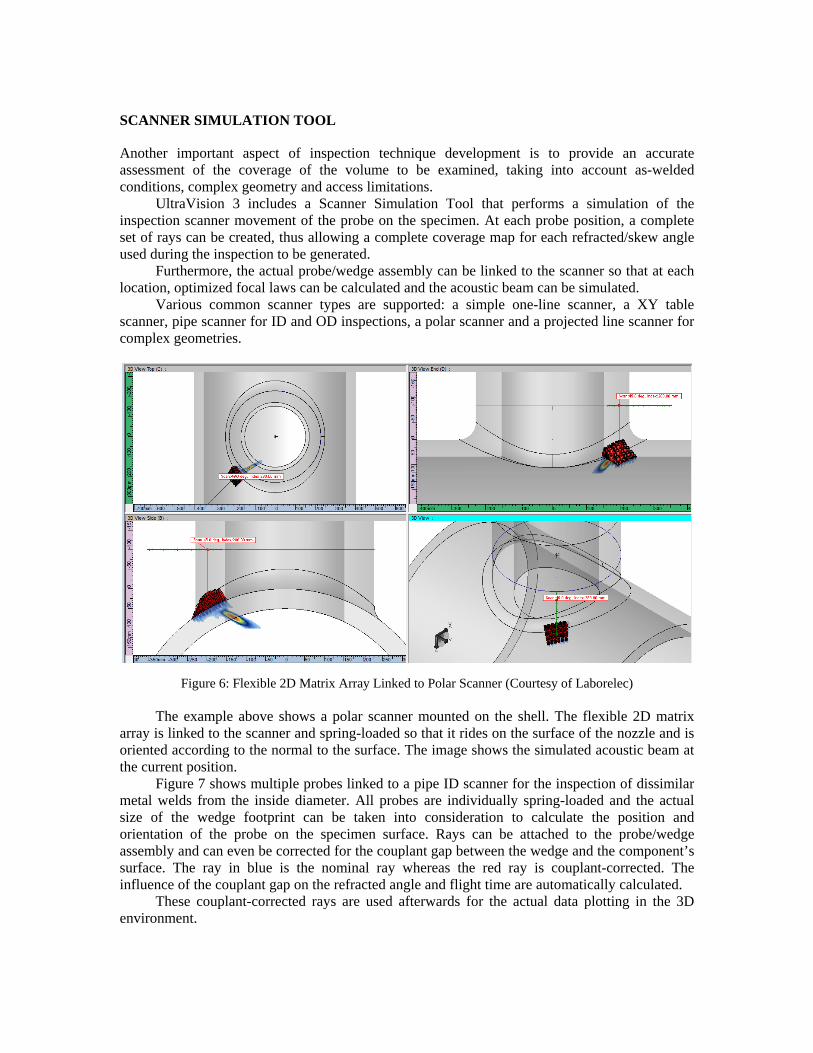
Figure 4: Custom Annular Array (xml file) Mounted on Wedge Figure 5 shows Zetec’s solution for the inspection of heavy forging turbine components (4).
The QUAD probe consists of four 2D matrix arrays (8x8 elements) that are mounted together and fit to the surface. As the distance between the individual arrays depends on the component diameter, the secondary pitch varies so the only correct way of setting this up is through a custom array.
Figure 5: Custom Flexible 2D Matrix Array (QUAD Probe)
Acoustic beam simulations can be performed for custom array types as well, so, the development engineer can assess both the detection capability and lateral resolution of his inspection technique in various regions of the volume to be examined. Important technical decisions can be taken early in the inspection preparation, to avoid extra costs for alternative probes or extended inspection time for technique optimization.
Another important aspect of inspection technique development is to provide an accurate assessment of the coverage of the volume to be examined, taking into account as-welded conditions, complex geometry and access limitations.
UltraVision 3 includes a Scanner Simulation Tool that performs a simulation of the inspection scanner movement of the probe on the specimen. At each probe position, a complete set of rays can be created, thus allowing a complete coverage map for each refracted/skew angle used during the inspection to be generated.
Furthermore, the actual probe/wedge assembly can be linked to the scanner so that at each location, optimized focal laws can be calculated and the acoustic beam can be simulated.
Various common scanner types are supported: a simple one-line scanner, a XY table scanner, pipe scanner for ID and OD inspections, a polar scanner and a projected line scanner for complex geometries.
Figure 6: Flexible 2D Matrix Array Linked to Polar Scanner (Courtesy of Laborelec)
The example above shows a polar scanner mounted on the shell. The flexible 2D matrix array is linked to the scanner and spring-loaded so that it rides on the surface of the nozzle and is oriented according to the normal to the surface. The image shows the simulated acoustic beam at the current position.
Figure 7 shows multiple probes linked to a pipe ID scanner for the inspection of dissimilar metal welds from the inside diameter. All probes are individually spring-loaded and the actual size of the wedge footprint can be taken into consideration to calculate the position and orientation of the probe on the specimen surface. Rays can be attached to the probe/wedge assembly and can even be corrected for the couplant gap between the wedge and the component’s surface. The ray in blue is the nominal ray whereas the red ray is couplant-corrected. The influence of the couplant gap on the refracted angle and flight time are automatically calculated.
These couplant-corrected rays are used afterwards for the actual data plotting in the 3D environment.
SCANNER SIMULATION TOOL
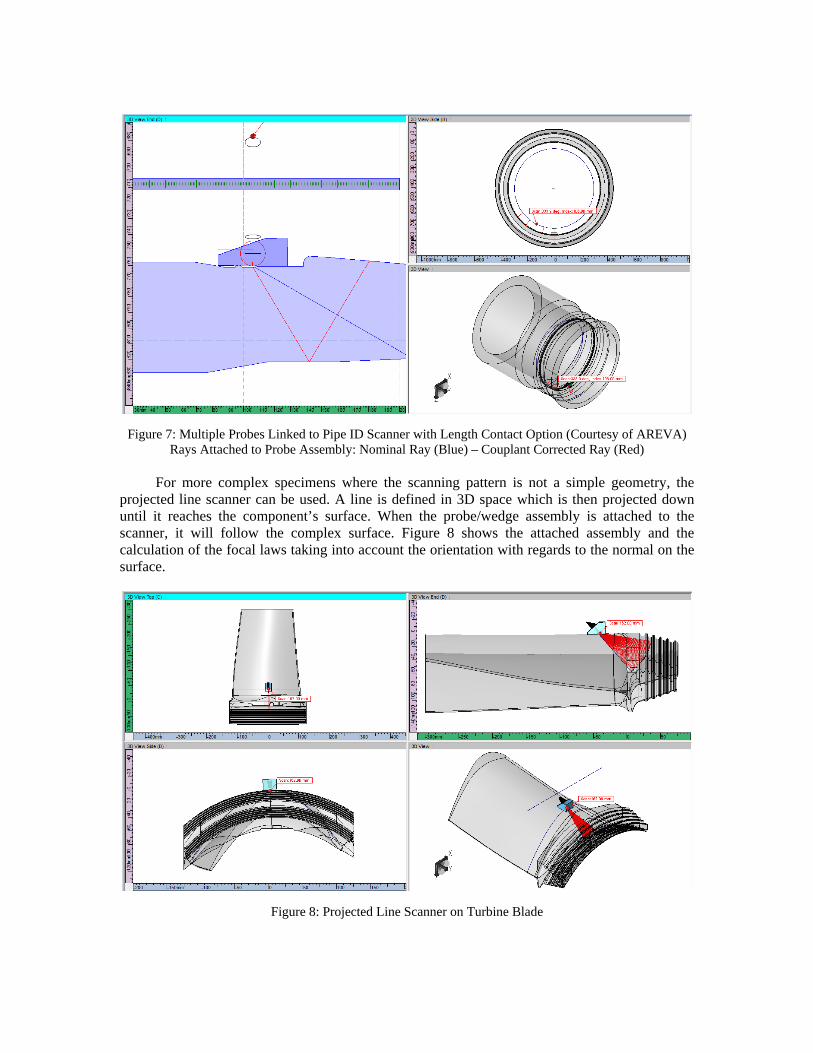
Figure 7: Multiple Probes Linked to Pipe ID Scanner with Length Contact Option (Courtesy of AREVA) Rays Attached to Probe Assembly: Nominal Ray (Blue) – Couplant Corrected Ray (Red)
For more complex specimens where the scanning pattern is not a simple geometry, the
projected line scanner can be used. A line is defined in 3D space which is then projected down until it reaches the component’s surface. When the probe/wedge assembly is attached to the scanner, it will follow the complex surface. Figure 8 shows the attached assembly and the calculation of the focal laws taking into account the orientation with regards to the normal on the surface.
Figure 8: Projected Line Scanner on Turbine Blade
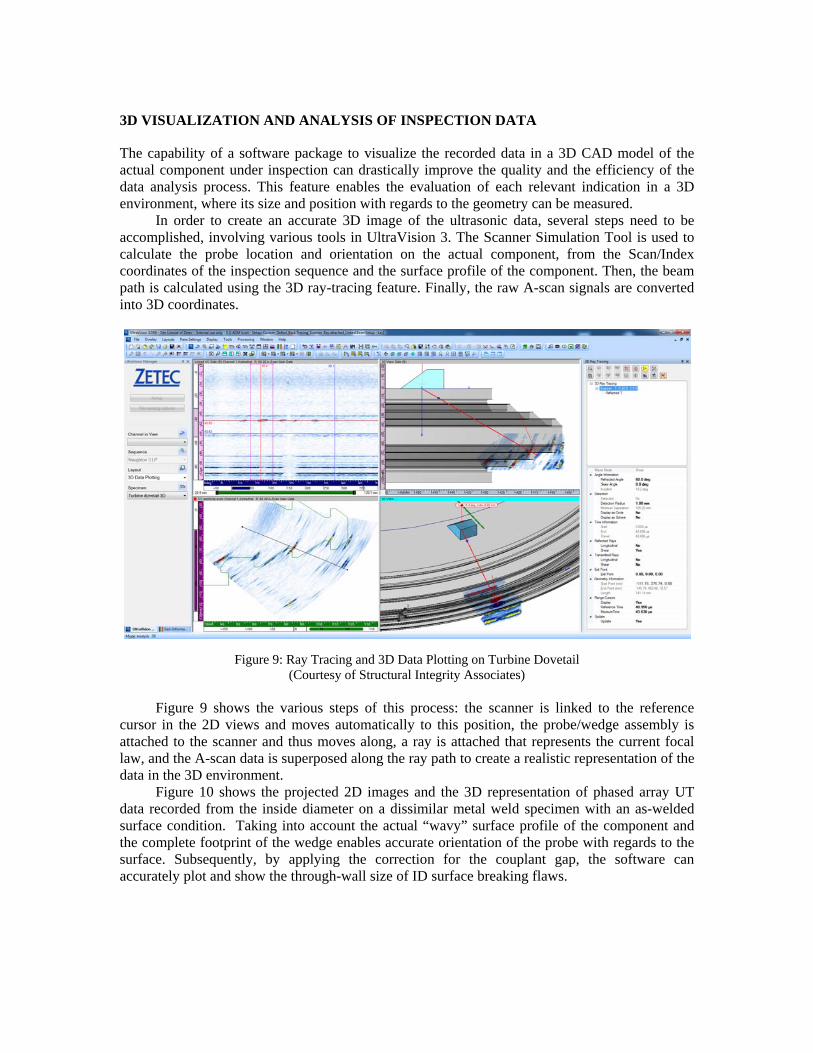
The capability of a software package to visualize the recorded data in a 3D CAD model of the actual component under inspection can drastically improve the quality and the efficiency of the data analysis process. This feature enables the evaluation of each relevant indication in a 3D environment, where its size and position with regards to the geometry can be measured.
In order to create an accurate 3D image of the ultrasonic data, several steps need to be accomplished, involving various tools in UltraVision 3. The Scanner Simulation Tool is used to calculate the probe location and orientation on the actual component, from the Scan/Index coordinates of the inspection sequence and the surface profile of the component. Then, the beam path is calculated using the 3D ray-tracing feature. Finally, the raw A-scan signals are converted into 3D coordinates.
Figure 9: Ray Tracing and 3D Data Plotting on Turbine Dovetail (Courtesy of Structural Integrity Associates)
Figure 9 shows the various steps of this process: the scanner is linked to the reference
cursor in the 2D views and moves automatically to this position, the probe/wedge assembly is attached to the scanner and thus moves along, a ray is attached that represents the current focal law, and the A-scan data is superposed along the ray path to create a realistic representation of the data in the 3D environment.
Figure 10 shows the projected 2D images and the 3D representation of phased array UT data recorded from the inside diameter on a dissimilar metal weld specimen with an as-welded surface condition. Taking into account the actual “wavy” surface profile of the component and the complete footprint of the wedge enables accurate orientation of the probe with regards to the surface. Subsequently, by applying the correction for the couplant gap, the software can accurately plot and show the through-wall size of ID surface breaking flaws.
3D VISUALIZATION AND ANALYSIS OF INSPECTION DATA
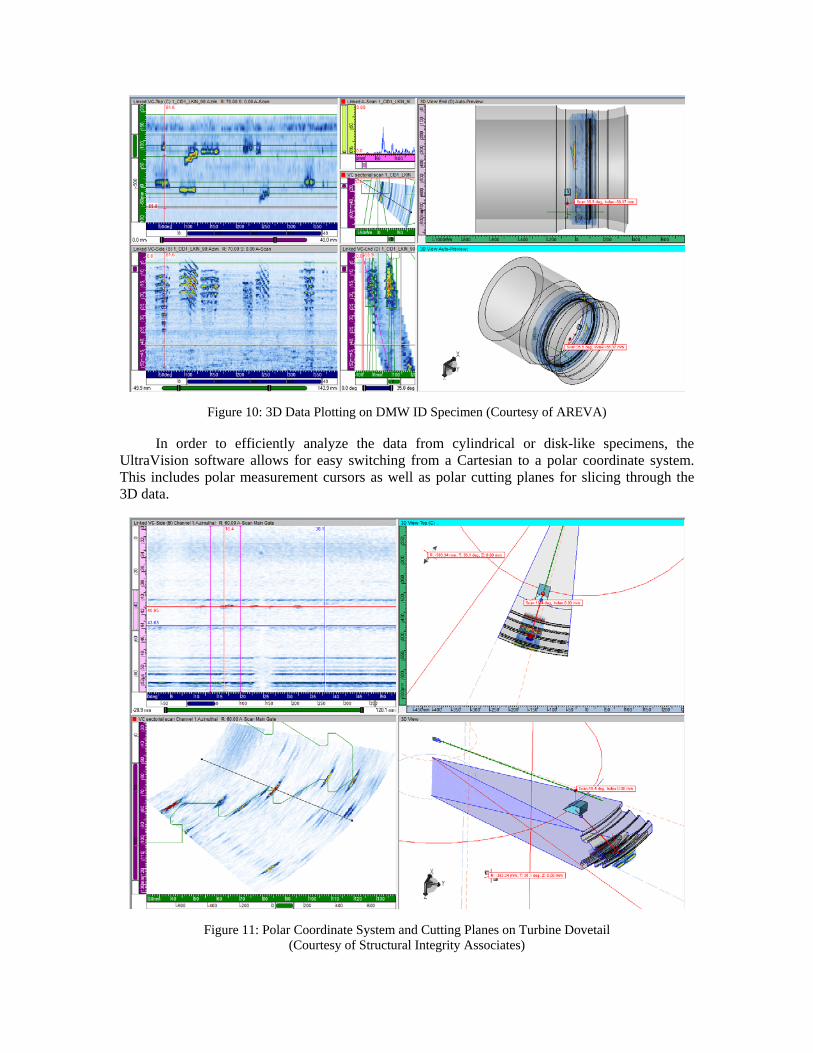
Figure 10: 3D Data Plotting on DMW ID Specimen (Courtesy of AREVA)
In order to efficiently analyze the data from cylindrical or disk-like specimens, the UltraVision software allows for easy switching from a Cartesian to a polar coordinate system. This includes polar measurement cursors as well as polar cutting planes for slicing through the 3D data.
Figure 11: Polar Coordinate System and Cutting Planes on Turbine Dovetail (Courtesy of Structural Integrity Associates)

1. The availability of accurate CAD models of the components to be examined is a necessary condition for successful PA UT technique development and inspection on complex geometries.
2. Advanced phased array probe types may be required to improve the inspection capability in challenging configurations; it is important for the software to support adequate focal law generation and acoustic beam simulation for such probe types.
3. Simulating the actual scanning mechanism and probe interface allows to generate accurate coverage maps during inspection technique development, to simulate the actual scanning conditions, and to define the environment for the 3D data plotting.
4. Accurate 3D UT imaging, taking into account actual component geometry, scanning mechanism, and probe contact, can drastically improve the interpretation of the examination data, specifically the characterization and sizing of potential flaws.
5. State-of-the-art software, including a complete 3D environment and powerful analysis tools is commercially available, and is being used to support various advanced inspection solutions.
1) G. Maes, S. Turgeon, D. Reilly, “Advanced Phased Array UT Inspection through Complex Surfaces”, 7th Int. Conf. on NDE in Relation to Structural Integrity for Nuclear and Pressurized Components, Yokohama, May 2009
2) D. Richard, G. Maes, D. Reilly, J. Berlanger, “Advanced Software Tools for Design and Implementation of Phased Array UT Inspection Techniques on Complex Components”, 8th Int. Conf. on NDE in Relation to Structural Integrity for Nuclear and Pressurized Components, Berlin, October 2010
3) D. Moussebois, “Inspection of Complex 3-D Surfaces with Conformable UT PA Transducer”, 9th Int. Conf. on NDE in Relation to Structural Integrity for Nuclear and Pressurized Components, Seattle, May 2012
4) P. Tremblay, D. Verspeelt, “Design and Validation of a Semi-Flexible Phased Array UT Probe for the Inspection of Large Forged Rotors”, 9th Int. Conf. on NDE in Relation to Structural Integrity for Nuclear and Pressurized Components, Seattle, May 2012
CONCLUSIONS
REFERENCES