Embed Size (px)
Citation preview

Half Year Report2013/14JPMorgan Indian
Investment Trust plcHalf Year Report & Accounts for the six months ended 31st March 2014
Indian HY cover_Indian HY Cover 23/05/2014 12:50 Page 2

Features
Contents
About the Company
1 Half Year Performance2 Chairman’s Statement4 Investment Managers’ Report
Investment Review
5 List of Investments6 Group Portfolio Analysis
Accounts
7 Group Income Statement8 Group Statement of Changes in Equity9 Group Balance Sheet10 Group Cash Flow Statement11 Notes to the Group Accounts
Shareholder Information
13 Interim Management Report14 Glossary of Terms and Definitions17 Information about the Company
Objective
Capital growth from investments in India.
Investment Policies
- To invest in a diversified portfolio of equity and equity-related securities of Indiancompanies.
- To invest also in companies which earn a material part of their revenues from India. - The Company will not invest in the other countries of the Indian sub-continent nor inSri Lanka.
- To invest no more than 15% of gross assets in other listed investment companies(including investment trusts).
- To use gearing when appropriate to increase potential returns to shareholders; theCompany’s gearing policy is to use short-term gearing for tactical purposes, up to amaximum level of 15% of shareholders’ funds.
Benchmark
MSCI India Index expressed in sterling terms.
Risk
Investors should note that there can be significant economic and political risksinherent in investing in a single emerging economy such as India. As such, the Indianmarket can exhibit more volatility than developed markets and this should be takeninto consideration when evaluating the suitability of the Company as a potentialinvestment.
Capital Structure
At 31st March 2014, the Company’s issued share capital comprised 125,617,586Ordinary shares of 25p each, including 19,474,788 shares held in Treasury.The Company’s Subscription shares expired on 2nd January 2014 and were allconverted to Ordinary shares,
Continuation Vote
The Company’s Articles of Association require that, at the Annual General Meeting tobe held in 2019 and at every fifth year thereafter, the Directors will propose aresolution that the Company continues as an investment trust.
Management Company
The Company employs JPMorgan Asset Management (UK) Limited (‘JPMAM’ or ‘theManager’) to manage its assets. With effect from 2nd June 2014 the Company’smanager will be JPMorgan Funds Limited.
FCA regulation of ‘non-mainstream pooled investments’
The Company currently conducts its affairs so that the shares issued by JPMorganIndian Investment Trust plc can be recommended by Independent Financial Advisersto ordinary retail investors in accordance with the FCA’s rules in relation to non-mainstream investment products and intends to continue to do so for theforeseeable future.
The shares are excluded from the FCA’s restrictions which apply to non-mainstreaminvestment products because they are shares in an investment trust.
Indian HY cover_Indian HY Cover 23/05/2014 12:50 Page 3

Half Year PerformanceTotal returns
+18.2%Portfolio return less fees and
expenses1,2
+15.9%Benchmark return3
Financial Data31stMarch 30th September %
2014 2013 change
Shareholders’ funds (£’000) 455,670 382,641 +19.1
Number of Ordinary shares in issue excluding shares held in Treasury 106,142,798 104,683,965 +1.4
Number of Subscription shares in issue1 — 5,749,790
Net asset value per Ordinary share2 429.3p 361.6p +18.7
Ordinary share price 372.5p 308.0p +20.9
Subscription share price1 — 25.0p
Ordinary share price discount to net asset value per share 13.3% 14.8%
1The Company’s Subscription shares expired on 2nd January 2014 and were all converted to Ordinary shares.2The net asset value (‘NAV’) as at 30th September 2013 is the diluted NAV and assumed that all outstanding Subscription
shares at that time had been converted at the year end.
A glossary of terms and definitions is provided on page 14.
+20.9%Return to Ordinary
shareholders4
+18.7%Return on net assets4
1Source: J.P. Morgan.2Return on net assets, that is net of management fees and administration expenses.3Source: MSCI. The Company’s benchmark is the MSCI India Index expressed in sterling terms.4Source: Morningstar.
1JPMorgan Indian Investment Trust plc. Half Year Report & Accounts 2014
Indian_pp01_16_Indian_pp01_16 23/05/2014 08:59 Page 1

Chairman’s Statement
Performance
The first six months of the Company’s financial year was a positive period for theIndian market. The Company’s benchmark, the MSCI India Index (in sterling terms),returned +15.9%. Your Company produced a total return on net assets of +18.7%, wellahead of the benchmark index. The return to shareholders was +20.9%, reflectinga narrowing of the discount from 14.8% to 13.3%. The background against which theCompany performed is discussed in more detail in the Investment Managers’ Reporton page 4.
Gearing
The Company has a one year floating rate US$25million loan facility with RBS toprovide the investment managers with the flexibility to gear the portfolio shouldcircumstances appear favourable. During the period the Investment Managersemployed gearing and as at 31st March 2014, the Company’s level of gearing was3.3%. Subsequent to the half year end, the loan facility was increased to $40million.
Continuation of the Company
I am very pleased to report that, at the Annual General Meeting held on 30th January2014, shareholders voted in favour of the Company’s continuation as an investmenttrust for a further five year period. As I explained in my Chairman’s Statement, themanagement fee was reduced from 1.2% to 1.0% of total assets with effect from1st October 2013 and the notice period was reduced to six months (for performancereasons, 12 months for all other reasons). The Board has also committed to undertakea tender offer, at net asset value less costs, of up to 25% of the issued share capitalif the Company under-performs its benchmark index over the three years to30th September 2016.
Discount Management
The Board has guidelines in place with regard to the management of the discountof share price to net asset value at which the Company’s shares trade. The Companycurrently holds 19,909,788 Ordinary shares in Treasury and, under current guidelines,these may only be reissued at a premium to the prevailing net asset value at the timeof reissue.
Share Capital
The subscription shares issued to shareholders in November 2008 (on the basisof one Subscription share for every five Ordinary shares previously held) expired on2nd January 2014. All of the remaining subscription shares in issue were convertedto ordinary shares, either by the subscription shareholders or by the trusteeappointed to act on behalf of the remaining subscription shareholders as at the dateof expiry.
2 JPMorgan Indian Investment Trust plc. Half Year Report & Accounts 2014
Indian_pp01_16_Indian_pp01_16 23/05/2014 08:59 Page 2

The Alternative Investment Fund Managers Directive (the ‘AIFMD’)
The deadline for full compliance with the AIFMD is 22nd July 2014. The Company willappoint JPMorgan Funds Limited as its AIFM and enter into a new managementagreement shortly. It will also appoint Bank of New York Mellon as its depositary witheffect from the same date.
Outlook
After a difficult year to 30th September 2013, it is pleasing to report on a strong sixmonths for the Indian market and in particular the Company’s outperformance. In theshort term, the market is likely to be volatile as a result of the recent election, but ourinvestment managers remain positive over the long term given attractive equityvaluations and expectations of continuing growth.
Hugh BollandChairman 23rd May 2014
3JPMorgan Indian Investment Trust plc. Half Year Report & Accounts 2014
Indian_pp01_16_Indian_pp01_16 23/05/2014 09:37 Page 3

JPMorgan Indian Investment Trust plc. Half Year Report & Accounts 20144
Investment Managers’ Report
Market Review
After the exceptional volatility in the third quarter of 2013, a delay in the reductionof the US Federal Reserve’s quantitative easing policy (the so-called ‘tapering’) andrising expectations about the Indian national elections led to a sharp rebound inequities in the first half of our financial year. The MSCI India index rose 15.9%(in sterling terms), led by strong inflows of over $10 billion from foreign portfolioinvestors.
The Indian Rupee, which had fallen precipitously in the third quarter of 2013, was wellsupported in the six month period by an inflow of some $34 billion from the specialdeposit scheme for non resident Indians. Expectations had been for an inflow ofperhaps half this amount.
Activity levels in the economy continued to be sluggish, with GDP growth for theDecember quarter at 4.7%, which was the seventh straight quarter of sub 5% growth.Industrial production was nearly flat in the first two months of 2014. On the positiveside, inflation decelerated meaningfully in the first quarter of 2014, as a sharpcorrection in food prices led to CPI inflation dropping by approximately 300 bps to8.3% in March. As a result, the central bank left policy rates unchanged in the latestpolicy meeting, after increasing rates by a cumulative 75 bps over the past sixmonths. That said, the prediction of a risk to the upcoming monsoon season from theEl Nino weather phenomenon has raised concerns due to the potential adverseimpact on agricultural output.
Earnings were mixed during the review period; while the Sensex constituents beatexpectations in the December quarter, reporting year-on-year sales and profit growthof 14% and 20% respectively, the March quarter was much more subdued withseveral stocks disappointing against expectations. However, share prices seem tosuggest that markets are looking past the near term challenges. This is also evident inthe consensus forecasts, which have been upgraded (albeit modestly) over the pastfew months.
Performance Review
The Company outperformed the benchmark in the first half of the financial year, asthe portfolio’s overweight positions in financials and consumer discretionary stocksproved beneficial.
Outlook
The results from the national elections were better than even the most optimisticexpectations. The B.J.P led by Mr. Narendra Modi won a clear majority, the firstin 30 years. Effectively, for the first time since foreign investors began investingin Indian equities, there will be a government that is not dependent on coalitionpartners for survival. This gives Mr. Modi the independence to pursue his statedagenda of kick-starting the economy.
Rukhshad ShroffRaj NairInvestment Managers 23rdMay 2014
Rajendra Nair
Rukhshad Shroff
Indian_pp01_16_Indian_pp01_16 23/05/2014 08:59 Page 4

JPMorgan Indian Investment Trust plc. Half Year Report & Accounts 2014 5
List of Investmentsat 31st March 2014
ValuationCompany Sector £’000 %
HDFC Bank Financials 46,021 10.1 Infosys Technologies1 Information Technology 42,612 9.4 Reliance Industries Energy 33,415 7.3 Tata Consultancy Services Information Technology 32,032 7.0 HDFC Financials 31,188 6.8 ITC Consumer Staples 29,380 6.5 Tata Motors1 Consumer Discretionary 20,282 4.5 Sun Pharmaceutical Industries Health Care 16,789 3.7 Associated Cement Materials 14,636 3.2 Kotak Mahindra Bank Financials 14,195 3.1 Indusind Bank Financials 13,968 3.1 Infrastructure Development Finance Financials 13,407 2.9 Ambuja Cements Materials 13,286 2.9 Mahindra & Mahindra Consumer Discretionary 12,974 2.9 Wipro Information Technology 9,963 2.2 Mahindra & Mahindra Financial Services Financials 9,644 2.1 Dr Reddys Laboratories Health Care 7,482 1.6 Divi’s Laboratories Health Care 6,334 1.4 Maruti Suzuki India Consumer Discretionary 6,325 1.4 National Thermal Power Utilities 6,084 1.3 Hindalco Industries Materials 6,027 1.3 ING Vysya Bank Financials 5,392 1.2 Axis Bank Financials 5,146 1.1 Shree Cements Materials 5,054 1.1 Bharat Heavy Electricals Industrials 4,903 1.1 Godrej Industries Materials 4,772 1.1 ICICI Bank Financials 4,649 1.0 Bharti Airtel Telecommunication Services 4,581 1.0 Shriram Transport Financials 4,101 0.9 Godrej Properties Financials 3,672 0.8 Great Eastern Shipping Industrials 3,618 0.8 Just Dial Information Technology 3,252 0.7 Cummins India Industrials 3,094 0.7 Balrampur Chini Mills Consumer Staples 3,023 0.7 Gujarat Pipavav Port Industrials 2,950 0.7 Gruh Finance Financials 2,936 0.6 Adani Power Utilities 2,433 0.5 JSW Energy Utilities 2,412 0.5 Grasim Industries Materials 2,372 0.5 Motilal Oswal Financial Services Financials 2,341 0.5 Bajaj Auto Consumer Discretionary 2,200 0.5 D B Corp Consumer Discretionary 2,181 0.5 Idea Cellular Telecommunication Services 2,123 0.5 Motherson Sumi Systems Consumer Discretionary 2,076 0.5 Oberoi Realty Financials 1,880 0.4 Jaiprakash Associate Industrials 1,553 0.3 Ashok Leyland Industrials 1,360 0.3 EIH Consumer Discretionary 938 0.2 Ascendas India Trust Financials 661 0.1 Bajaj Finserv Financials 256 0.1 DC Design Consumer Discretionary — — Net Current liabilities (16,303) (3.6)
Total Portfolio 455,670 100.0
1Includes ADR
Indian_pp01_16_Indian_pp01_16 23/05/2014 08:59 Page 5

31st March 2014 30th September 2013Active Active
Portfolio Benchmark Position Portfolio Benchmark Position%1 % % %1 % %
Financials 34.8 23.4 11.4 30.6 23.0 7.6
Information Technology 19.3 21.6 (2.3) 18.0 20.8 (2.8)
Consumer Discretionary 10.5 6.3 4.2 9.9 6.9 3.0
Materials 10.1 7.1 3.0 8.6 6.7 1.9
Energy 7.3 12.5 (5.2) 7.9 12.5 (4.6)
Consumer Staples 7.2 11.6 (4.4) 8.3 12.2 (3.9)
Health Care 6.7 6.3 0.4 7.4 7.4 —
Industrials 3.9 5.2 (1.3) 1.9 3.8 (1.9)
Utilities 2.3 3.7 (1.4) 1.4 3.9 (2.5)
Telecommunication Services 1.5 2.3 (0.8) 3.3 2.8 0.5
Liquidity funds — — — 1.8 — 1.8
Net current (liabilities)/assets (3.6) — (3.6) 0.9 — 0.9
Total 100.0 100.0 100.0 100.0
1Based on total assets less current liabilities of £455.6m (30th September 2013: £382.6m).
Group Portfolio Analysis
6 JPMorgan Indian Investment Trust plc. Half Year Report & Accounts 2014
Indian_pp01_16_Indian_pp01_16 23/05/2014 08:59 Page 6

Group Income Statementfor the six months ended 31st March 2014
(Unaudited) (Unaudited) (Audited)Six months ended Six months ended Year ended31st March 2014 31st March 2013 30th September 2013
Revenue Capital Total Revenue Capital Total Revenue Capital Total£’000 £’000 £’000 £’000 £’000 £’000 £’000 £’000 £’000
Investment income 1,153 — 1,153 1,241 — 1,241 5,885 — 5,885Other income — — — 3 — 3 1 — 1Gains/(losses) on investments held atfair value through profit or loss — 72,118 72,118 — 16,538 16,538 — (66,546) (66,546)
Foreign exchange gains/(losses) — 31 31 — (72) (72) — (127) (127)
Total income/(loss) 1,153 72,149 73,302 1,244 16,466 17,710 5,886 (66,673) (60,787)Management fee (2,023) — (2,023) (2,890) — (2,890) (5,614) — (5,614)Other administrative expenses (658) — (658) (668) — (668) (1,345) — (1,345)
(Loss)/profit before finance costs and taxation (1,528) 72,149 70,621 (2,314) 16,466 14,152 (1,073) (66,673) (67,746)
Finance costs (61) — (61) (85) — (85) (224) — (224)
(Loss)/profit before taxation (1,589) 72,149 70,560 (2,399) 16,466 14,067 (1,297) (66,673) (67,970)Taxation — — — — — — — — —
Net (loss)/profit (1,589) 72,149 70,560 (2,399) 16,466 14,067 (1,297) (66,673) (67,970)
(Loss)/earnings per Ordinaryshare (note 4)
– undiluted (1.51)p 68.54p 67.03p (2.20)p 15.08p 12.88p (1.21)p (62.18)p (63.39)p– diluted (1.51)p 68.54p 67.03p (2.17)p 14.89p 12.72p (1.21)p (62.18)p (63.39)p
The Group does not have any income or expense that is not included in net (loss)/profit for the period. Accordingly the ‘Net(loss)/profit for the period’ is also the ‘Total comprehensive income for the period’, as defined in IAS 1 (revised) and no separateStatement of Comprehensive Income has been presented.
The ‘Total’ column of this statement represents the Group’s Income Statement, prepared in accordance with IFRS. Thesupplementary ‘Revenue’ and ‘Capital’ columns are prepared under guidance published by the Association of InvestmentCompanies.
All items in the above statement derive from continuing operations. No operations were acquired or discontinued in the period.
All of the (loss)/profit and total comprehensive income is attributable to the equity shareholders of JPMorgan Indian InvestmentTrust plc, the Company. There are no minority interests.
7JPMorgan Indian Investment Trust plc. Half Year Report & Accounts 2014
Indian_pp01_16_Indian_pp01_16 23/05/2014 08:59 Page 7

Group Statement of Changesin Equity
Called up Exercised CapitalSix months ended share Share Other warrant Capital redemption Revenue31st March 2014 capital premium reserve reserve reserves reserve reserve Total(Unaudited) £’000 £’000 £’000 £’000 £’000 £’000 £’000 £’000
At 30th September 2013 30,124 83,019 41,929 5,886 231,854 6,362 (16,533) 382,641Exercise of Subscription shares into Ordinary shares (54) 54 — — — — — —
Issue of Ordinary shares on conversion of Subscription shares 1,338 14,241 — — — — — 15,579
Cancellation of Subscription shares (4) 4 — — — — — —Repurchase of shares into Treasury — — — — (13,110) — — (13,110)Net profit/(loss) for the period — — — — 72,149 — (1,589) 70,560
At 31st March 2014 31,404 97,318 41,929 5,886 290,893 6,362 (18,122) 455,670
Called up Exercised CapitalSix months ended share Share Other warrant Capital redemption Revenue31st March 2013 capital premium reserve reserve reserves reserve reserve Total(Unaudited) £’000 £’000 £’000 £’000 £’000 £’000 £’000 £’000
At 30th September 2012 30,032 82,000 41,929 5,886 337,232 6,362 (15,236) 488,205Exercise of Subscription shares into Ordinary shares (1) 1 — — — — — —
Issue of Ordinary shares on conversion of Subscription shares 20 218 — — — — — 238
Repurchase of shares into Treasury — — — — (33,891) — — (33,891)Net profit/(loss) for the period — — — — 16,466 — (2,399) 14,067
At 31st March 2013 30,051 82,219 41,929 5,886 319,807 6,362 (17,635) 468,619
Called up Exercised CapitalYear ended share Share Other warrant Capital redemption Revenue30th September 2013 capital premium reserve reserve reserves reserve reserve Total(Audited) £’000 £’000 £’000 £’000 £’000 £’000 £’000 £’000
At 30th September 2012 30,032 82,000 41,929 5,886 337,232 6,362 (15,236) 488,205Exercise of Subscription shares into Ordinary shares (4) 4 — — — — — —
Issue of Ordinary shares on conversion of Subscription shares 96 1,015 — — — — — 1,111
Repurchase of shares into Treasury — — — — (38,705) — — (38,705)Loss for the year — — — — (66,673) — (1,297) (67,970)
At 30th September 2013 30,124 83,019 41,929 5,886 231,854 6,362 (16,533) 382,641
8 JPMorgan Indian Investment Trust plc. Half Year Report & Accounts 2014
Indian_pp01_16_Indian_pp01_16 23/05/2014 08:59 Page 8
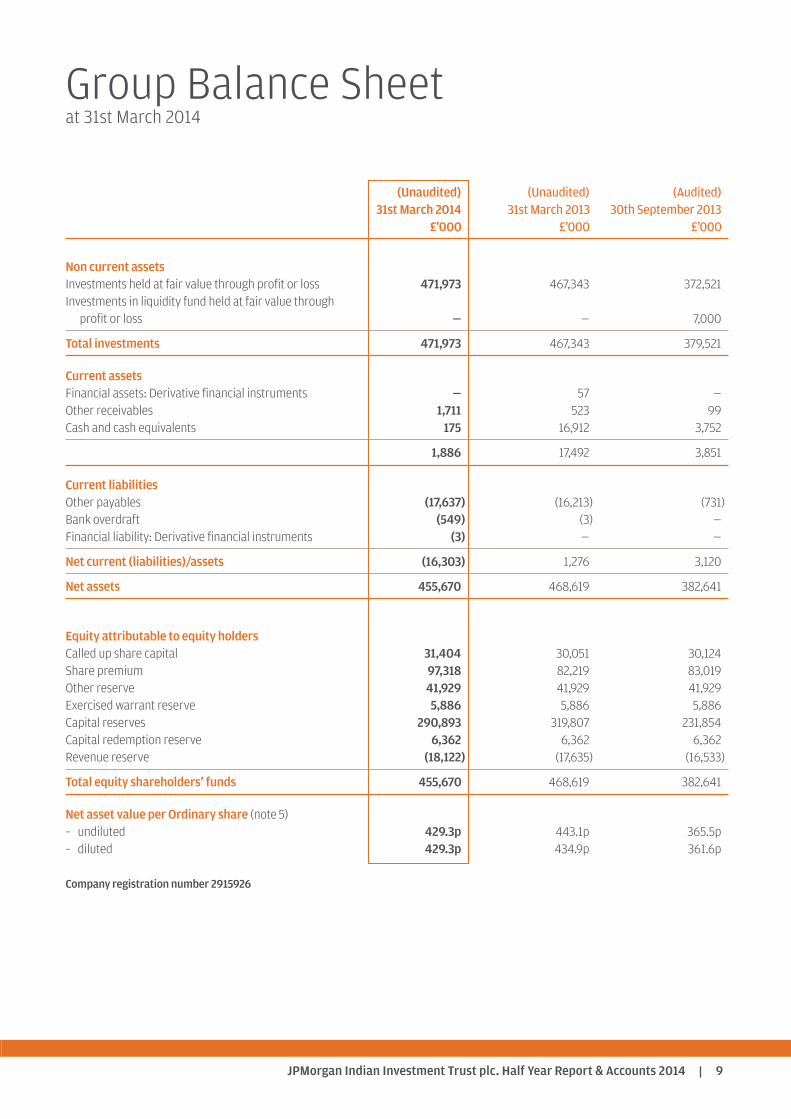
Group Balance Sheetat 31st March 2014
(Unaudited) (Unaudited) (Audited)31st March 2014 31st March 2013 30th September 2013
£’000 £’000 £’000
Non current assetsInvestments held at fair value through profit or loss 471,973 467,343 372,521Investments in liquidity fund held at fair value through profit or loss — — 7,000
Total investments 471,973 467,343 379,521
Current assetsFinancial assets: Derivative financial instruments — 57 —Other receivables 1,711 523 99Cash and cash equivalents 175 16,912 3,752
1,886 17,492 3,851
Current liabilitiesOther payables (17,637) (16,213) (731)Bank overdraft (549) (3) —Financial liability: Derivative financial instruments (3) — —
Net current (liabilities)/assets (16,303) 1,276 3,120
Net assets 455,670 468,619 382,641
Equity attributable to equity holdersCalled up share capital 31,404 30,051 30,124Share premium 97,318 82,219 83,019Other reserve 41,929 41,929 41,929Exercised warrant reserve 5,886 5,886 5,886Capital reserves 290,893 319,807 231,854Capital redemption reserve 6,362 6,362 6,362Revenue reserve (18,122) (17,635) (16,533)
Total equity shareholders’ funds 455,670 468,619 382,641
Net asset value per Ordinary share (note5)– undiluted 429.3p 443.1p 365.5p– diluted 429.3p 434.9p 361.6p
Company registration number 2915926
9JPMorgan Indian Investment Trust plc. Half Year Report & Accounts 2014
Indian_pp01_16_Indian_pp01_16 23/05/2014 08:59 Page 9

Group Cash Flow Statementfor the six months ended 31st March 2014
(Unaudited) (Unaudited) (Audited)Six months ended Six months ended Year ended31st March 2014 31st March 2013 30th September 2013
£’000 £’000 £’000
Operating activities Profit/(loss) before taxation 70,560 14,067 (67,970)Add back interest 61 85 224 Add back (gains)/losses on investments held at fair
value through profit or loss (72,118) (16,538) 66,546Foreign exchange losses — (59) — Unrealised foreign exchange gains/(losses) 3 — (3) Net (purchases)/sales of investments held at fair value
through profit or loss (20,335) 36,570 41,310(Increase)/decrease in other receivables (277) (405) 19(Increase)/decrease in amounts due from brokers (1,336) 2,259 2,259Increase in other payables (106) (501) (366)Increase/(decrease) in amounts due to brokers 2,186 (2,209) (2,240)
Net cash (outflow)/inflow from operating activities before interest payable and taxation (21,362) 33,269 39,779
Interest paid (61) (85) (224)
Net cash (outflow)/inflow from operating activities (21,423) 33,184 39,555
Financing activities Net proceeds from the issue of shares 15,580 238 1,111 Repurchase of shares (13,183) (35,903) (40,304)Increase/(decrease) in bank overdraft 549 (11) (14)Drawdown of short term loans 14,900 22,500 25,500 Net repayment of short term loans — (6,500) (25,500)
Net cash inflow/(outflow) from financing activities 17,846 (19,676) (39,207)
(Decrease)/increase in cash and cash equivalents (3,577) 13,508 348 Cash and cash equivalents at the start of the period 3,752 3,404 3,404
Cash and cash equivalents at the end of the period 175 16,912 3,752
10 JPMorgan Indian Investment Trust plc. Half Year Report & Accounts 2014
Indian_pp01_16_Indian_pp01_16 23/05/2014 12:46 Page 10

Notes to the Group Accountsfor the six months ended 31st March 2014
1. Principal activity
The principal activity of the Company is that of an investment trust company within the meaning of Section 1158 of theCorporation Tax Act 2010.
2. Financial statements
The financial information for the six months ended 31st March 2014 and 2013 has not been audited or reviewed by theCompany’s auditors.
The financial information contained in these half year accounts does not constitute statutory accounts as defined inSection 434 of the Companies Act 2006.
The information for the year ended 30th September 2013 has been extracted from the latest published audited financialstatements. Those accounts have been delivered to the Registrar of Companies and included the report of the auditors whichwas unqualified and did not contain a statement under either Section 498(2) or 498(3) of the Companies Act 2006.
3. Accounting policies
The financial statements have been prepared in accordance with International Financial Reporting Standards (‘IFRS’), whichcomprise standards and interpretations approved by the International Accounting Standards Board to the extent that theyhave been adopted by the European Union.
Where presentational guidance set out in the Statement of Recommended Practice (the ‘SORP’) for investment trusts issuedby the Association of Investment Companies in January 2009 is consistent with the requirements of IFRS, the financialstatements have been prepared on a basis compliant with the recommendations of the SORP.
The accounting policies applied to these half year accounts are consistent with those applied in the accounts for the yearended 30th September 2013.
11JPMorgan Indian Investment Trust plc. Half Year Report & Accounts 2014
Indian_pp01_16_Indian_pp01_16 23/05/2014 08:59 Page 11

4. (Loss)/earnings per Ordinary share
(Unaudited) (Unaudited) (Audited)Six months ended Six months ended Year ended31st March 2014 31st March 2013 30th September 2013
£’000 £’000 £’000
(Loss)/earnings per Ordinary share is based on the following:Revenue loss (1,589) (2,399) (1,297) Capital return/(loss) 72,149 16,466 (66,673)
Total return/(loss) 70,560 14,067 (67,970)
Weighted average number of Ordinary shares in issue during the period used for the purpose of undiluted calculation 105,268,164 109,209,640 107,223,518
Weighted average number of Ordinary shares in issue during the period used for the purpose of diluted calculation 105,268,164 110,615,487 107,223,518
UndilutedRevenue loss per share (1.51)p (2.20)p (1.21)pCapital return/(loss) per share 68.54p 15.08p (62.18)p
Total return/(loss) per share 67.03p 12.88p (63.39)p
Diluted1
Revenue loss per share (1.51)p (2.17)p (1.21)p Capital return/(loss) per share 68.54p 14.89p (62.18)p
Total return/(loss) per share 67.03p 12.72p (63.39)p
1The Subscription shares rights lapsed on 2nd January 2014.
5. Net asset value per Ordinary share
(Unaudited) (Unaudited) (Audited)31st March 2014 31st March 2013 30th September 2013
UndilutedOrdinary shareholders funds (£’000) 455,670 468,619 382,641Number of Ordinary shares in issue excluding shares held in Treasury 106,142,798 105,764,303 104,683,965
Net asset value per Ordinary share (pence) 429.3 443.1 365.5
Diluted1
Ordinary shareholders funds assuming exercise of Subscription shares (£’000) n/a 486,223 399,373
Number of potential Ordinary shares in issue excluding shares held in Treasury 106,142,798 111,813,755 110,433,755
Net asset value per Ordinary share (pence) 429.3 434.9 361.6
1The Subscription shares rights lapsed on 2nd January 2014.
The Company will only re-issue shares held in Treasury at a premium and therefore these shares have no dilutive potential.
Notes to the Group Accountscontinued
12 JPMorgan Indian Investment Trust plc. Half Year Report & Accounts 2014
Indian_pp01_16_Indian_pp01_16 23/05/2014 08:59 Page 12

Interim Management Report
The Company is required to make the following disclosures inits Half Year Report.
Principal Risks and Uncertainties
The principal risks and uncertainties faced by the Companyfall into the following broad categories: investment andstrategy; market; accounting, legal and regulatory; corporategovernance and shareholder relations; operational; goingconcern; financial; and political and economic. Information oneach of these areas is given in the Business Review within theAnnual Report and Accounts for the year ended30th September 2013.
Any change in taxation legislation or the taxation regimeapplicable to the Mauritian subsidiary company could affectthe value of the investments held by the Group, the Company’sability to provide returns to Shareholders or alter the post-taxreturns to Shareholders. In particular, it is intended that theMauritian subsidiary will continue to benefit from theIndia/Mauritius Double Tax Treaty. Future changes to Mauritianor Indian law or to the India/Mauritius Double Tax Treaty, or theinterpretations given to them by the regulatory authorities,could impose additional costs or obligations on the activities ofthe Mauritian subsidiary, which in turn may have adverseeffects on the performance of the Company. The terms of theIndia/Mauritius Double Tax Treaty were challenged in India butwere upheld by the Supreme Court of India in October 2003.However, more recently, there have been discussions betweenthe Indian and Mauritian authorities with regard to re-negotiation of the Treaty. Adverse tax consequences wouldresult if the Mauritian subsidiary ceased to qualify for thebenefits under the India/Mauritius Double Tax Treaty (forexample, if it were held that the Mauritian subsidiary was not aresident of Mauritius). There can be no assurance that theMauritian subsidiary will continue to qualify for or receive thebenefits of the India/Mauritius Double Tax Treaty or that theterms of the India/Mauritius Double tax Treaty will not bechanged. Such an event may require the Mauritian subsidiaryto pay or provide for tax liabilities that would reduce the netasset value of the Ordinary shares.
Related Parties Transactions
During the first six months of the current financial year, notransactions with related parties have taken place which havematerially affected the financial position or the performance ofthe Company during the period.
Going Concern
The Directors believe, having considered the Company’sinvestment objective, risk management policies, capitalmanagement policies and procedures, nature of the portfolioand expenditure projections, that the Company has adequateresources, an appropriate financial structure and suitablemanagement arrangements in place to continue in operationalexistence for the foreseeable future. For these reasons, theyconsider there is reasonable evidence to continue to adopt thegoing concern basis in preparing the accounts.
Directors’ Responsibilities
The Board of Directors confirms that, to the best of itsknowledge:
(i) the condensed set of financial statements containedwithin the half yearly financial report has beenprepared in accordance with the Accounting StandardsBoard’s Statement ‘Half Yearly Financial Reports’ andgives a true and fair view of the state of affairs of theCompany and of the assets, liabilities, financial positionand net return of the Company, as at 31st December2013, as required by the UK Listing Authority Disclosureand Transparency Rules 4.2.4R; and
(ii) the interim management report includes a fair review ofthe information required by 4.2.7R and 4.2.8R of the UKListing Authority Disclosure and Transparency Rules.
In order to provide these confirmations, and in preparing thesefinancial statements, the Directors are required to:
• select suitable accounting policies and then apply themconsistently;
• make judgements and accounting estimates that arereasonable and prudent;
• state whether applicable UK Accounting Standards havebeen followed, subject to any material departures disclosedand explained in the financial statements; and
• prepare the financial statements on the going concern basisunless it is inappropriate to presume that the Company willcontinue in business;
and the Directors confirm that they have done so.
For and on behalf of the BoardHugh BollandChairman 23rd May 2014
13JPMorgan Indian Investment Trust plc. Half Year Report & Accounts 2014
Indian_pp01_16_Indian_pp01_16 23/05/2014 08:59 Page 13

Glossary of Terms and Definitions
Portfolio return
Return on net assets, that is net of management fees andadministration expenses, but excluding the effect ofSubscription shares which have converted during the period.
Benchmark return
Total return on the benchmark, on a mid-market value tomid-market value basis, assuming that all dividends receivedwere reinvested into the shares of the underlying companiesat time the shares were quoted ex-dividend.
The benchmark is a recognised index of stocks which shouldnot be taken as wholly representative of the Company’sinvestment universe. The Company’s investment strategy doesnot ‘track’ this index and consequently, there may be somedivergence between the Company’s performance and that ofthe benchmark.
Return on net assets
Return on the net asset value per Ordinary share on a bid valueto bid value basis.
Return to Ordinary shareholders
Return to Ordinary shareholders, on a mid-market price tomid-market price basis.
Ordinary share price discount/premium to net asset value (‘NAV’)per share
If the share price of an investment trust is lower than the NAVper share, the shares are said to be trading at a discount. Thediscount is shown as a percentage of the NAV per share. Theopposite of a discount is a premium. It is more common for aninvestment trust’s shares to trade at a discount than at apremium.
Active position
The active position shows the difference between theCompany’s holding of an individual stock, sector or countrycompared with the weighting of that stock, sector or countrybenchmark index. A positive figure indicates a decision by theinvestment manager to own more of (i.e. be overweight) thatstock, sector or country compared with the benchmark.A negative figure indicates a decision to hold less of (i.e. beunderweight) that stock, sector or country compared with thebenchmark.
Fraudsters use persuasive and high-pressure tactics to lure investors into scams. They may offer to sell shares that turn out to beworthless or non-existent, or to buy shares at an inflated price in return for an upfront payment. While high profits are promised, ifyou buy or sell shares in this way you will probably lose your money.
Keep in mind that firms authorised by the FCAare unlikely to contact you out of the blue withan offer to buy or sell shares.
Do not get into a conversation, note the nameof the person and firm contacting you and thenend the call.
Check the Financial Services Register fromwww.fca.org.uk to see if the person and firmcontacting you is authorised by the FCA.
Beware of fraudsters claiming to be from anauthorised firm, copying its website or givingyou false contact details.
Use the firm’s contact details listed on theRegister if you want to call it back.
Call the FCA on 0800 111 6768 if the firm doesnot have contact details on the Register or youare told they are out of date.
Search the list of unauthorised firms to avoid atwww.fca.org.uk/scams.
Consider that if you buy or sell shares from anunauthorised firm you will not have access to theFinancial Ombudsman Service or FinancialServices Compensation Scheme.
Think about getting independent financial andprofessional advice before you hand over anymoney.
Remember: if it sounds too good to be true, itprobably is!
If you are approached by fraudsters please tell theFCA using the share fraud reporting form atwww.fca.org.uk/scams, where you can find outmore about investment scams.
You can also call the FCA Consumer Helpline on0800 111 6768.
If you have already paid money to share fraudstersyou should contact Action Fraud on 0300 123 2040.
5,000 people contact the Financial ConductAuthority about share fraud each year,with victims losing an average of £20,000
1 6
7
8
9
10
2
3
4
5
Beware of share fraud
How to avoid share fraud
Report a scam
In association with:
Financial Conduct Authority
14 JPMorgan Indian Investment Trust plc. Half Year Report & Accounts 2014
Indian_pp01_16_Indian_pp01_16 23/05/2014 08:59 Page 14

Notes
15JPMorgan Indian Investment Trust plc. Half Year Report & Accounts 2014
Indian_pp01_16_Indian_pp01_16 23/05/2014 08:59 Page 15

JPMorgan Indian Investment Trust plc. Half Year Report & Accounts 201416
Notes
Indian_pp01_16_Indian_pp01_16 23/05/2014 08:59 Page 16

HistoryThe Company was launched in May 1994 by a public offer of shareswhich raised £84 million before expenses. In November 2005 theCompany adopted its present name, JPMorgan Indian InvestmentTrust plc.
DirectorsHugh Bolland (Chairman) Richard Burns Rosemary Morgan Nimi PatelHugh Sandeman
Company NumbersCompany registration number: 2915926
Ordinary SharesLondon Stock Exchange Sedol Number: 0345035 ISIN: GB00345 03S9 Bloomberg: JII LS
Subscription SharesLondon Stock Exchange Sedol Number: B3CSXS1 ISIN: GB00B3C SX518 Bloomberg: JIIS LN
Market InformationThe Company’s net asset value (‘NAV’) per share is published daily viathe London Stock Exchange. The Company’s Ordinary shares arelisted on the London Stock Exchange and are quoted daily in theFinancial Times, The Times, The Daily Telegraph, The Scotsman andon the JPMorgan website at www.jpmindian.co.uk where theOrdinary share price is updated every fifteen minutes during tradinghours.
Websitewww.jpmindian.co.uk
Share TransactionsThe Company’s Ordinary shares may be dealt in directly through astockbroker or professional adviser acting on an investor’s behalf. Theymay also be purchased and held through the J.P. Morgan InvestmentAccount, J.P. Morgan ISA and J.P. Morgan SIPP. These products are allavailable on the online wealth manager service, J.P. MorganWealthManager+ available at www.jpmorganwealthmanagerplus.co.uk
Manager and Company Secretary JPMorgan Asset Management (UK) Limited. With effect from June 2014,the Company’s manager and company secretary will be JPMorganFunds Limited.
Company’s Registered Office60 Victoria EmbankmentLondon EC4Y 0JPTelephone number: 020 7742 4000
For company secretarial and administrative matters, please contactJonathan Latter.
CustodianJPMorgan Chase Bank, N.A.25 Bank StreetCanary WharfLondon E14 5JP
RegistrarsEquiniti LimitedReference 1087Aspect HouseSpencer RoadLancingWest Sussex BN99 6DATelephone: 0871 384 2327
Notifications of changes of address and enquiries regarding sharecertificates or dividend cheques should be made in writing to theRegistrar quoting reference 1087.
Registered shareholders can obtain further details on their holdingson the internet by visiting www.shareview.co.uk.
Independent AuditorDeloitte LLP Chartered Accountants and Statutory AuditorStonecutter Court 1 Stonecutter Street London EC4A 4TR
BrokersJPMorgan Cazenove Limited10 AldermanburyLondon EC2V 7RF
Savings Product AdministratorsFor queries on the J.P. Morgan Investment Account, J.P. Morgan ISA andJ.P. Morgan SIPP, see contact details on the back cover of this report.
Information about the Company
Financial CalendarFinancial year end 30th SeptemberFinal results announced DecemberHalf year end 31st MarchHalf year results announced MayInterim Management Statements announced January/JulyDividends N/AAnnual General Meeting January
A member of the AIC
JPMorgan Indian Investment Trust plc. Half Year Report & Accounts 2014 17
Indian HY cover_Indian HY Cover 23/05/2014 12:50 Page 4

J.P. Morgan HelplineFreephone 0800 20 40 20 or +44 (0)20 7742 9995
Your telephone call may be recorded for your security
www.jpmindian.co.uk
Indian HY cover_Indian HY Cover 23/05/2014 12:50 Page 1


![Sinope / [J.P. Six]](https://img.pdfslide.net/doc/110x75/577d22a21a28ab4e1e97df95/sinope-jp-six.jpg)