Embed Size (px)
Citation preview

A N N U A Lr e p o r t
E n g i n e e r i n g C a r e e r R e s o u r c e C e n t e r
20
13
20
14
>>>>>>>>>>>>>>>>>>>>>>>>>>>>>>>>>>>>>>>>>>>>>>>>>>>>>>>>>>>>

Annual Report 1
>>>>>>>>>>>>>>>>>>>>>>>>>>>>>>>>>>>>>>>>>
Welcome
I am pleased to share with you the 2013-2014 issue of the Engineering
Career Resource Center (ECRC) Annual Report. The report contains
information on the post-graduation activities of December 2012 – August
2013 graduates and hiring activity for the College of Engineering Internship
and Cooperative Education Program (Co-op).
This year showed salaries and hiring were solid as Michigan Engineers were highly sought by
numerous employers. Bachelor's and Master’s level students reported an increase in accepting
full-time employment over graduate school. Many majors saw average salary increases over
last year’s salaries.
The ECRC also provided a range of services to graduate and undergraduate students and
alumni of the College. As always, our goal is to assist students in gaining valuable professional
experiences that will help them make a successful transition from school to career. We focused
on resume writing, interviewing skills, mock interviews and job search strategies. We look
forward to another exciting year.
Sincerely,
Kerri Boivin
Director, Engineering Career Resource Center
College of Engineering
University of Michigan

Annual Report 32 Annual report
>>>>>>>>>>>>>>>>>>>>>>>>>>>>>>>>>>>>>>>>>
Co-op2012-13
Cooperative EducationThe non-credit Cooperative Education Program (Co-op) enables students
to alternate school and work terms and apply their skills to the work setting.
In addition to providing a source of valuable talent, co-op students offer
employers an opportunity to identify qualified candidates prior to graduation.
Ideally, co-op is eight-months of hands-on engineering experience, occurring
either May through December or January through August.
Total
205
Registered Co-op Students
Fall 2012
57
Winter 2013
49
Spring/Summer 2013
99

Annual Report 3
>>>>>>>>>>>>>>>>>>>>>>>>>>>>>>>>>>>>>>>>>2 Annual report
>>>>>>>>>>>>>>>>>>>>>>>>>>>>>>>>>>>>>>>>>
Co-op2012-13
† Programs with only one submission were omitted. †† 12 students reported hires, but did not provide salary information. Their data was omitted.
Co-op Salaries and Hires
Program† Hires†† Median Monthly Salary
Average Monthly Salary
Aerospace Engineering 9 $2,602 $2,629
Biomedical Engineering 4 $3,141 $3,120
Chemical Engineering 17 $3,566 $3,312
Civil Engineering 5 $1,968 $2,166
Computer Engineering 17 $4,996 $5,027
Computer Science 40 $5,368 $5,705
Electrical Engineering 17 $3,723 $3,467
Engineering (undeclared) 3 $2,340 $2,167
Industrial & Operations Engineering 38 $3,414 $3,306
Materials Science & Engineering 5 $3,129 $2,990
Mechanical Engineering 31 $3,351 $3,337

Annual Report 54 Annual report
>>>>>>>>>>>>>>>>>>>>>>>>>>>>>>>>>>>>>>>>>
Interns2012-13
InternshipsNon-credit internships are popular amongst U-M engineering and computer
science students. Students have the opportunity to gain valuable work
experience in an engineering environment. The assignments typically occur
May through August and may be in locations all over the world. Many
students at the College participate in internships. The internships in this
publication only include those that were reported to the ECRC.
Bachelor's (85%)
Master's (14%)
Doctoral (1%)
Total*
641
Bachelor's
544
Master's
87
Doctoral
10
Reported Internships*
* Data only reflects internships reported to the ECRC.
Annual Report 5
>>>>>>>>>>>>>>>>>>>>>>>>>>>>>>>>>>>>>>>>>4 Annual report
>>>>>>>>>>>>>>>>>>>>>>>>>>>>>>>>>>>>>>>>>
Interns2012-13
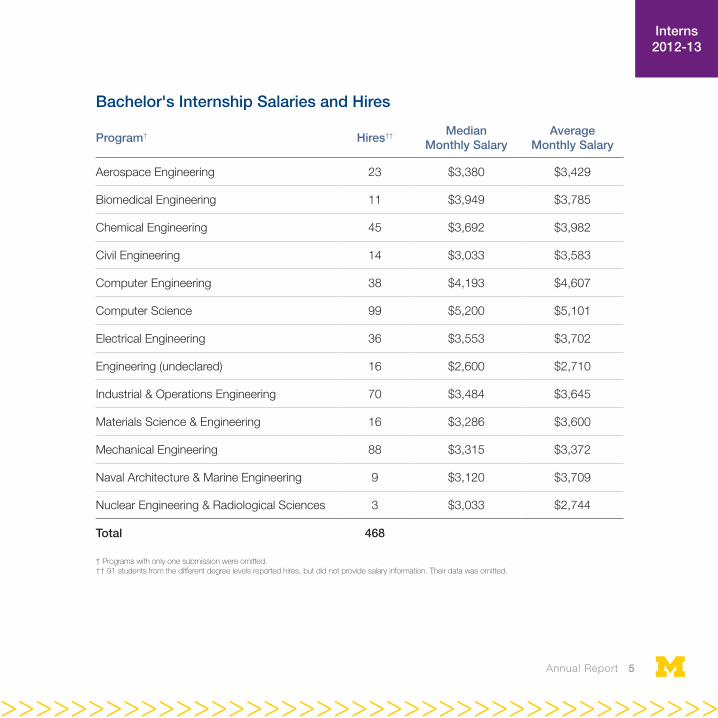
Bachelor's Internship Salaries and Hires
Program† Hires†† Median Monthly Salary
Average Monthly Salary
Aerospace Engineering 23 $3,380 $3,429
Biomedical Engineering 11 $3,949 $3,785
Chemical Engineering 45 $3,692 $3,982
Civil Engineering 14 $3,033 $3,583
Computer Engineering 38 $4,193 $4,607
Computer Science 99 $5,200 $5,101
Electrical Engineering 36 $3,553 $3,702
Engineering (undeclared) 16 $2,600 $2,710
Industrial & Operations Engineering 70 $3,484 $3,645
Materials Science & Engineering 16 $3,286 $3,600
Mechanical Engineering 88 $3,315 $3,372
Naval Architecture & Marine Engineering 9 $3,120 $3,709
Nuclear Engineering & Radiological Sciences 3 $3,033 $2,744
Total 468
† Programs with only one submission were omitted. †† 91 students from the different degree levels reported hires, but did not provide salary information. Their data was omitted.

Annual Report 7
>>>>>>>>>>>>>>>>>>>>>>>>>>>>>>>>>>>>>>>>>6 Annual report
>>>>>>>>>>>>>>>>>>>>>>>>>>>>>>>>>>>>>>>>>
Interns2012-13
† Programs with only one submission were omitted. †† 91 students from the different degree levels reported hires, but did not provide salary information. Their data was omitted.
Master's Internship Salaries and Hires
Program† Hires†† Median Monthly Salary
Average Monthly Salary
Aerospace Engineering 2 - $5,720
Automotive Engineering 5 $4,604 $4,097
Biomedical Engineering 4 $3,813 $3,813
Computer Science & Engineering 10 $6,067 $6,158
Electrical Engineering 10 $5,841 $5,936
Electrical Engineering: Systems 11 $5,547 $5,580
Energy Systems Engineering 2 - $3,207
Financial Engineering 4 $5,933 $5,717
Industrial & Operations Engineering 7 $4,680 $4,668
Manufacturing Engineering 3 $6,240 $5,330
Mechanical Engineering 11 $4,604 $4,184
Naval Architecture & Marine Engineering 2 - $4,369
Space Engineering 2 - $4,203
Total 73

Annual Report 7
>>>>>>>>>>>>>>>>>>>>>>>>>>>>>>>>>>>>>>>>>6 Annual report
>>>>>>>>>>>>>>>>>>>>>>>>>>>>>>>>>>>>>>>>>
296
Bachelor's2012-13
Bachelor's GraduatesPost-graduation Plans
Continuing education
Accepted full-time job offers
Seeking employment
Other
484
Note: Out of graduating class of 1,348, 806 responses were collected from December 2012 to September 30, 2013. Response rate = 60%.
17
9
2%
37%
1%
60%

Annual Report 98 Annual report
>>>>>>>>>>>>>>>>>>>>>>>>>>>>>>>>>>>>>>>>>
Bachelor's2012-13
Job Acceptances by ProgramData reflects total respondents indicating salary Base Salary Information
Respondents* Median Average Range
Aerospace Engineering 19 $63,000 $62,136 $39,520 - 80,000
Biomedical Engineering 9 $61,000 $59,844 $28,000 - 90,000
Chemical Engineering 52 $68,000 $68,813 $35,000 - 100,000
Civil Engineering 17 $53,000 $54,553 $36,400 - 89,000
Computer Engineering 21 $70,000 $72,524 $50,000 - 105,000
Computer Science 91 $80,000 $81,500 $42,000 - 110,004
Electrical Engineering 28 $65,000 $66,299 $40,000 - 87,000
Industrial & Operations Engineering 77 $63,500 $62,836 $40,000 - 83,200
Materials Science & Engineering 13 $62,400 $62,523 $50,000 - 71,400
Mechanical Engineering 78 $63,780 $63,997 $42,000 - 95,000
Naval Architecture & Marine Engineering 4 $62,000 $62,930 $57,720 - 70,000
Total 409 * Categories with two or less respondents were omitted.

Annual Report 9
>>>>>>>>>>>>>>>>>>>>>>>>>>>>>>>>>>>>>>>>>8 Annual report
>>>>>>>>>>>>>>>>>>>>>>>>>>>>>>>>>>>>>>>>>
Bachelor's2012-13
Job Acceptances by RegionData reflects total respondents indicating salary and location Base Salary Information
Respondents % Median Average Range
Midwest IA, IL, IN, KS, MI, MN, MO, NE, ND, OH, SD, WI 206 55% $64,000 $63,287 $28,000 - 100,000
West AK, CA, HI, ID, MT, NV, OR, UT, WA, WY 65 17% $82,000 $81,571 $39,520 - 110,004
Southwest AZ, CO, NM, OK, TX 37 10% $67,500 $68,769 $40,000 - 100,000
Northeast CT, MA, ME, NH, NJ, NY, RI, VT 31 8% $70,000 $73,506 $43,000 - 110,000
South AL, FL, GA, KY, LA, MS, NC, SC, TN 20 5% $66,000 $65,515 $43,000 - 90,000
Mid-Atlantic DC, DE, MD, PA, VA, WV 14 4% $68,000 $65,504 $43,000 - 89,500
International 3 1% $75,000 $66,667 $50,000 - 75,000
Total 376
Michigan 148 35%
California 38 9%
Illinois 38 9%
Washington 31 7%
Texas 30 7%
New York 19 5%
Wisconsin 15 4%
Ohio 13 3%
Other locations 90 21%
Total 422
1
2
2
3
4
5
6
7
Job Acceptances by State (Top 7)Data reflects total respondents indicating location

Annual Report 11
>>>>>>>>>>>>>>>>>>>>>>>>>>>>>>>>>>>>>>>>>10 Annual report
>>>>>>>>>>>>>>>>>>>>>>>>>>>>>>>>>>>>>>>>>
Bachelor's2012-13
Job Acceptances by SectorData reflects total respondents indicating salary and employer Base Salary Information
Respondents* % Median Average Range
Aerospace & Defense 17 4% $65,750 $66,539 $43,000 - 81,000
Automotive & Transport Equipment 55 14% $63,780 $63,527 $51,000 - 83,200
Chemicals 11 3% $68,000 $68,391 $63,000 - 72,800
Computer Hardware 6 2% $69,500 $69,417 $67,500 - 72,000
Computer Software & Services 100 25% $78,000 $78,610 $42,000 - 110,000
Conglomerates 6 2% $66,500 $69,500 $66,000 - 85,000
Consulting 38 10% $68,500 $67,907 $55,000 - 80,000
Consumer Products 15 4% $68,000 $68,875 $62,000 - 85,000
Electronics 4 1% $67,000 $66,500 $65,000 - 67,000
Energy 20 5% $80,000 $78,850 $62,000 - 100,000
Energy & Utilities 5 1% $60,000 $57,810 $42,000 - 67,548
Engineering Services 29 7% $63,000 $63,084 $36,400 - 110,004
Environmental 3 1% $40,000 $60,000 $35,000 - 105,000
Financial Services 17 4% $68,000 $70,176 $45,000 - 100,000
Government 15 4% $50,000 $52,256 $40,000 - 95,000
Healthcare Products & Services 9 2% $60,000 $59,333 $45,000 - 75,000
Manufacturing 24 6% $60,000 $58,181 $39,520 - 70,000
Materials & Construction 9 2% $53,000 $55,313 $42,000 - 65,000
Pharmaceutical 4 1% $66,500 $65,250 $60,000 - 68,000
Technology 5 1% $60,000 $62,200 $48,000 - 80,000
Transportation 6 2% $61,900 $61,300 $53,000 - 68,000
Total 398 * Categories with two or less respondents were omitted.
Annual Report 11
>>>>>>>>>>>>>>>>>>>>>>>>>>>>>>>>>>>>>>>>>10 Annual report
>>>>>>>>>>>>>>>>>>>>>>>>>>>>>>>>>>>>>>>>>
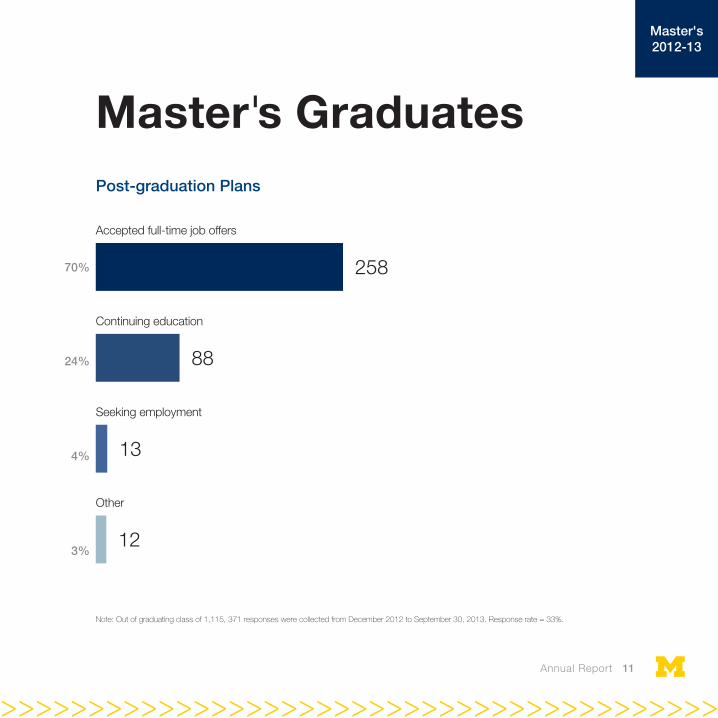
Master's2012-13
Master's GraduatesPost-graduation Plans
Continuing education
Accepted full-time job offers
Seeking employment
Other
88
258
13
12
Note: Out of graduating class of 1,115, 371 responses were collected from December 2012 to September 30, 2013. Response rate = 33%.
4%
24%
3%
70%

Annual Report 1312 Annual report
>>>>>>>>>>>>>>>>>>>>>>>>>>>>>>>>>>>>>>>>>
Master's2012-13
Job Acceptances by ProgramData reflects total respondents indicating salary
Base Salary Information
Respondents* Median Average Range
Aerospace Engineering 13 $70,000 $70,192 $54,000 - 79,000
Automotive Engineering 3 $75,000 $79,000 $65,000 - 97,000
Biomedical Engineering 9 $63,000 $60,111 $30,000 - 80,000
Civil Engineering 6 $61,000 $61,347 $50,000 - 80,000
Computer Science & Engineering 21 $95,000 $97,057 $65,000 - 116,000
Electrical Engineering 18 $89,000 $84,544 $48,000 - 103,000
Electrical Engineering: Systems 33 $80,000 $82,186 $57,200 - 107,000
Energy Systems Engineering 3 $75,000 $90,000 $75,000 - 120,000
Financial Engineering 12 $77,500 $78,750 $55,000 - 100,000
Industrial & Operations Engineering 20 $72,000 $72,315 $42,000 - 87,000
Manufacturing Engineering 3 $88,000 $80,000 $60,000 - 92,000
Materials Science & Engineering 3 $72,800 $82,600 $70,000 - 105,000
Mechanical Engineering 29 $74,000 $74,332 $52,500 - 93,500
Naval Architecture & Marine Engineering 4 $86,250 $80,875 $60,000 - 91,000
Space Engineering 4 $76,636 $77,318 $74,000 - 82,000
Total 181 * Categories with two or less respondents were omitted.

Annual Report 13
>>>>>>>>>>>>>>>>>>>>>>>>>>>>>>>>>>>>>>>>>12 Annual report
>>>>>>>>>>>>>>>>>>>>>>>>>>>>>>>>>>>>>>>>>
Master's2012-13
Job Acceptances by RegionData reflects total respondents indicating salary and location
Base Salary Information
Respondents % Median Average Range
Midwest IA, IL, IN, KS, MI, MN, MO, NE, ND, OH, SD, WI 73 43% $70,000 $69,426 $30,000 - 120,000
West AK, CA, HI, ID, MT, NV, OR, UT, WA, WY 52 30% $90,000 $89,554 $42,000 - 116,000
Northeast CT, MA, ME, NH, NJ, NY, RI, VT 19 11% $78,000 $78,868 $48,000 - 100,000
Southwest AZ, CO, NM, OK, TX 17 10% $80,000 $81,165 $60,000 - 105,000
South AL, FL, GA, KY, LA, MS, NC, SC, TN 4 2% $73,000 $72,750 $50,000 - 95,000
Mid-Atlantic DC, DE, MD, PA, VA, WV 4 2% $63,000 $67,500 $54,000 - 90,000
International 2 1% - $54,000 $48,000 - 60,000
Total 171
Michigan 54 27%
California 40 20%
Washington 19 9%
Massachusetts 12 6%
Texas 11 5%
Illinois 10 5%
Indiana 8 4%
Other locations 49 24%
Total 203
1
2
3
4
5
6
7
Job Acceptances by State (Top 7)Data reflects total respondents indicating location

Annual Report 15
>>>>>>>>>>>>>>>>>>>>>>>>>>>>>>>>>>>>>>>>>14 Annual report
>>>>>>>>>>>>>>>>>>>>>>>>>>>>>>>>>>>>>>>>>
Master's2012-13
* Categories with two or less respondents were omitted.
Job Acceptances by SectorData reflects total respondents indicating salary and employer
Base Salary Information
Respondents* % Median Average Range
Aerospace & Defense 18 10% $76,800 $75,283 $54,000 - 92,000
Automotive & Transport Equipment 23 13% $74,000 $73,514 $42,000 - 120,000
Computer Hardware 9 5% $82,000 $85,367 $72,000 - 107,000
Computer Software & Services 52 29% $89,000 $87,346 $59,000 - 116,000
Conglomerates 3 2% $75,000 $76,333 $74,000 - 80,000
Consulting 10 6% $67,500 $65,108 $48,000 - 84,000
Education/Academia 3 2% $30,000 $39,067 $30,000 - 57,200
Electronics 3 2% $95,000 $90,000 $80,000 - 95,000
Energy 9 5% $87,000 $84,778 $71,000 - 105,000
Engineering Services 14 8% $73,250 $74,893 $60,000 - 107,000
Financial Services 7 4% $75,000 $73,714 $55,000 - 90,000
Government 5 3% $63,000 $64,754 $43,500 - 90,000
Manufacturing 14 8% $71,000 $70,000 $52,500 - 92,000
Telecommunications 9 5% $90,000 $90,216 $89,940 - 92,000
Total 179
Annual Report 15
>>>>>>>>>>>>>>>>>>>>>>>>>>>>>>>>>>>>>>>>>14 Annual report
>>>>>>>>>>>>>>>>>>>>>>>>>>>>>>>>>>>>>>>>>
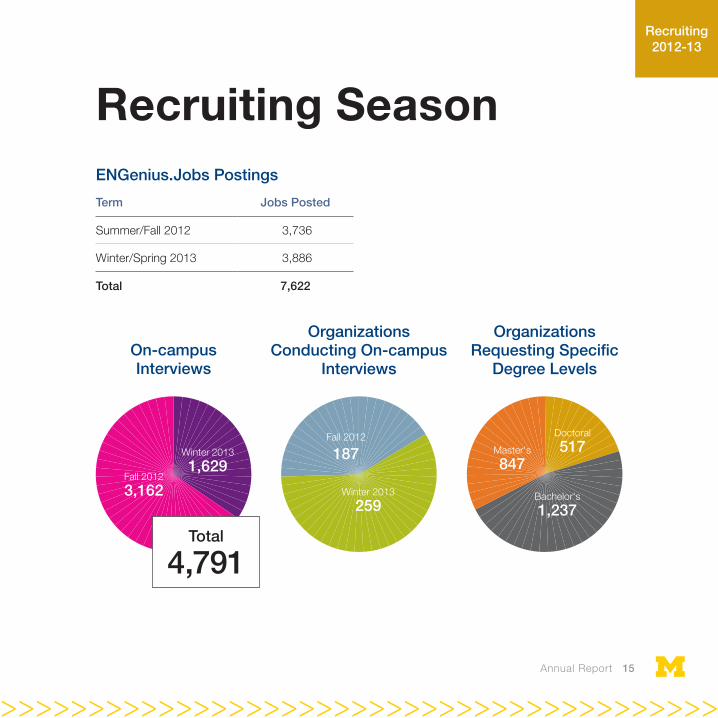
Recruiting2012-13
ENGenius.Jobs Postings
Term Jobs Posted
Summer/Fall 2012 3,736
Winter/Spring 2013 3,886
Total 7,622
Recruiting Season
Total
4,791
On-campus Interviews
Organizations Conducting On-campus
Interviews
Organizations Requesting Specific
Degree Levels
Bachelor's
1,237
Master's
847
Doctoral
517
Winter 2013
259
Fall 2012
187Fall 2012
3,162
Winter 2013
1,629

Annual Report 1716 Annual report
>>>>>>>>>>>>>>>>>>>>>>>>>>>>>>>>>>>>>>>>>
Recruiting2012-13
Undergraduate Majors Most Requested by Organizations
Major Requests* % of Jobs
Computer Science 3,547 60%
Computer Engineering 3,337 57%
Electrical Engineering 3,081 53%
Mechanical Engineering 2,888 49%
Industrial & Operations Engineering 2,195 37%
Chemical Engineering 1,812 31%
* 5,868 job postings sought undergraduate degree candidates from July 2012 to June 2013.

Annual Report 17
>>>>>>>>>>>>>>>>>>>>>>>>>>>>>>>>>>>>>>>>>16 Annual report
>>>>>>>>>>>>>>>>>>>>>>>>>>>>>>>>>>>>>>>>>
Recruiting2012-13
Top Hiring Companies (2012-2013)
Full-time Intern Co-op Total Hires
Amazon 18 16 17 51
Microsoft Corporation 32 13 4 49
Ford Motor Company 30 16 2 48
General Electric 11 17 7 35
Boeing Company, The 15 12 - 27
Chrysler, LLC 16 10 - 26
Intel Corporation 15 8 2 25
University of Michigan 13 11 1 25
Qualcomm, Inc. 11 8 5 24
Cisco Systems 14 7 2 23
Cummins, Inc. 6 12 3 21
Toyota (TEMA) 4 5 12 21
General Motors 14 6 - 20
Google 11 8 - 19
JP Morgan Chase 7 10 1 18
Shell 8 10 - 18
Unilever 2 6 9 17
Bosch 2 11 1 14
NASA 1 5 8 14
Complete list available at career.engin.umich.edu/companylist.pdf

College of Engineering
Engineering Career Resource Center
230 Chrysler Center
2121 Bonisteel Boulevard
Ann Arbor, Michigan 48109-2092
(734) 647-7160
career.engin.umich.edu
This publication includes post-graduate
and salary data reported as of September 30, 2013.
Regents of the University of Michigan: Mark J. Bernstein,
Julia Donovan Darlow, Laurence B. Deitch, Shauna Ryder Diggs,
Denise Ilitch, Andrea Fischer Newman, Andrew C. Richner,
Katherine E. White, Mary Sue Coleman, ex officio.
The University of Michigan, as an equal opportunity/affirmative action employer,
complies with all applicable federal and state laws regarding nondiscrimination
and affirmative action. The University of Michigan is committed to a policy of equal
opportunity for all persons and does not discriminate on the basis of race, color,
national origin, age, marital status, sex, sexual orientation, gender identity, gender
expression, disability, religion, height, weight, or veteran status in employment,
educational programs and activities, and admissions. Inquiries or complaints may
be addressed to the Senior Director for Institutional Equity, and Title IX/Section
504/ADA Coordinator, Office of Institutional Equity, 2072 Administrative Services
Building, Ann Arbor, Michigan 48109-1432, 734-763-0235, TTY 734-647-1388.
For other University of Michigan information call 734-764-1817.
© 2013 Regents of the University of Michigan
>>>>>>>>>>>>>>>>>>>>>>>>>>>>>>>>>>>>>>>>>>>>>>>>>>>>>>>>>>>>