Embed Size (px)
Citation preview
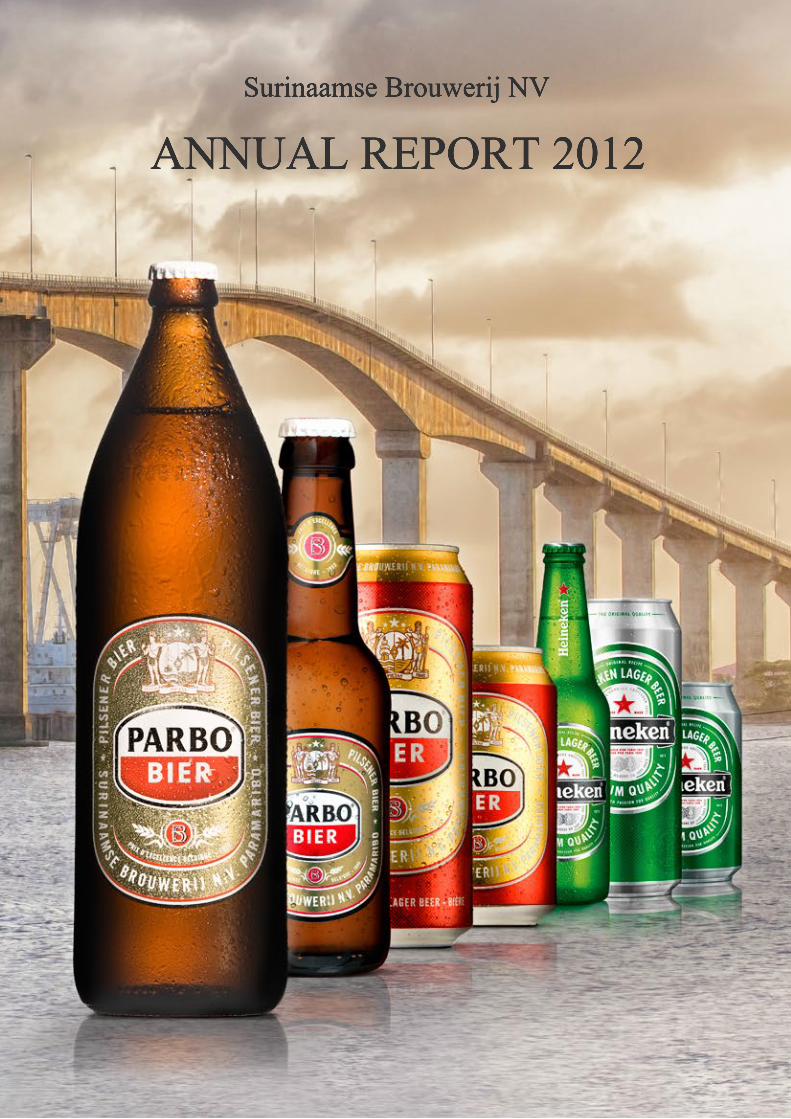
Surinaamse Brouwerij NV
ANNUAL REPORT 2012


Annual Report 2012
Surinaamse Brouwerij NV

Surinaamse Brouwerij NV Jaarverslag 2012
Supervisory Board and The Management Team
Company Profile
Preliminary Report of the Supervisory Board
Management Report
Five years consolidated key figures
Financial Statements
Consolidated balance sheet as at 31 December 2012
Consolidated income statement over 2012
Consolidated Statement of changes in equity
Consolidated cash flow statement
General notes
Notes to the consolidated balance sheet as at 31 December 2012
Notes to the consolidated income statement over 2012
Company balance sheet as at 31 December 2012
Company income statement over 2012
Notes to the company balance sheet and income statement
Additional information
Independent Auditor’s Report
Colophon
TABLE OF CONTENTS
3
4
5
6
15
16
16
17
18
19
20
23
29
32
33
34
36
38
39

Surinaamse Brouwerij NV Jaarverslag 2012 3
Supervisory Board and The Management TeamSupervisory Board: S.E. Jharap (voorzitter)
E. Ubalijoro
M. Loor
H. Parson
The Management TeamGeneral Manager: M.M. Kruijt
Brewery Manager: B. Rutten
Finance Manager: Z. Ramdjan-Habieb
Commercial Manager: M.H. Telting
Human Resource Manager: T. Wijdenbosch
Surinaamse Brouwerij NV Jaarverslag 20124
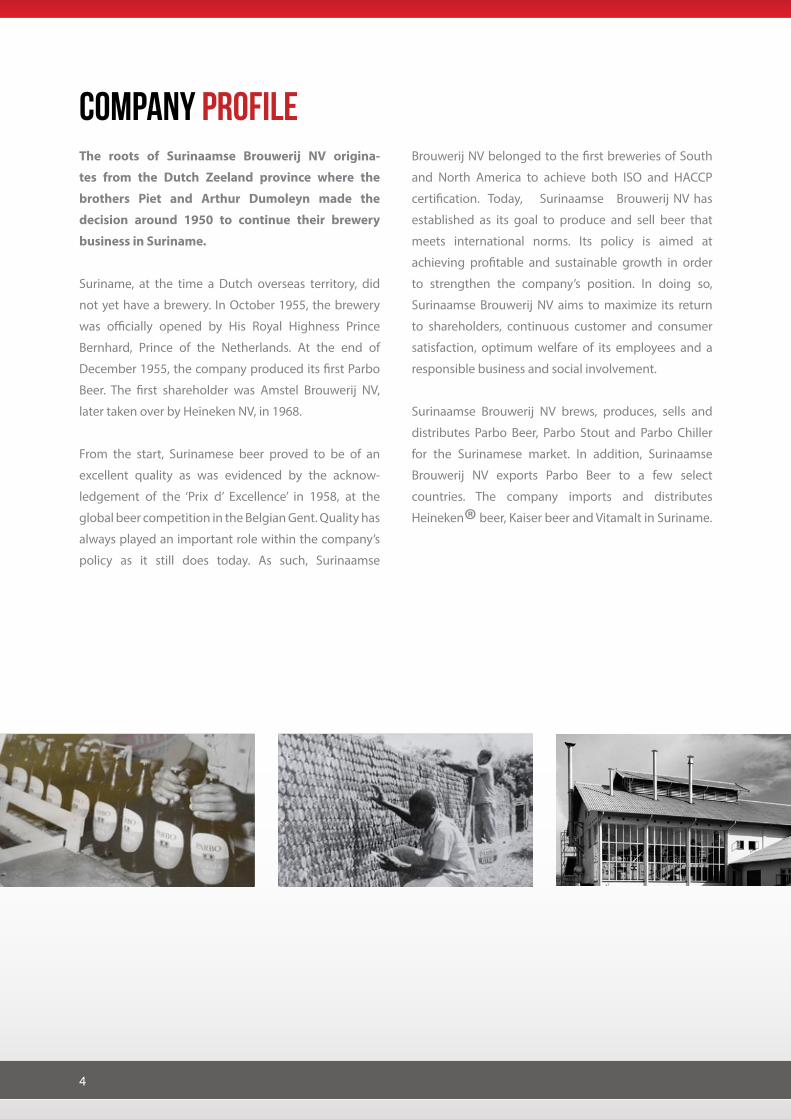
Company profileThe roots of Surinaamse Brouwerij NV origina-
tes from the Dutch Zeeland province where the
brothers Piet and Arthur Dumoleyn made the
decision around 1950 to continue their brewery
business in Suriname.
Suriname, at the time a Dutch overseas territory, did
not yet have a brewery. In October 1955, the brewery
was officially opened by His Royal Highness Prince
Bernhard, Prince of the Netherlands. At the end of
December 1955, the company produced its first Parbo
Beer. The first shareholder was Amstel Brouwerij NV,
later taken over by Heineken NV, in 1968.
From the start, Surinamese beer proved to be of an
excellent quality as was evidenced by the acknow-
ledgement of the ‘Prix d’ Excellence’ in 1958, at the
global beer competition in the Belgian Gent. Quality has
always played an important role within the company’s
policy as it still does today. As such, Surinaamse
Brouwerij NV belonged to the first breweries of South
and North America to achieve both ISO and HACCP
certification. Today, Surinaamse Brouwerij NV has
established as its goal to produce and sell beer that
meets international norms. Its policy is aimed at
achieving profitable and sustainable growth in order
to strengthen the company’s position. In doing so,
Surinaamse Brouwerij NV aims to maximize its return
to shareholders, continuous customer and consumer
satisfaction, optimum welfare of its employees and a
responsible business and social involvement.
Surinaamse Brouwerij NV brews, produces, sells and
distributes Parbo Beer, Parbo Stout and Parbo Chiller
for the Surinamese market. In addition, Surinaamse
Brouwerij NV exports Parbo Beer to a few select
countries. The company imports and distributes
Heineken® beer, Kaiser beer and Vitamalt in Suriname.

Surinaamse Brouwerij NV Jaarverslag 2012 5
Preliminary Report of the Supervisory BoardTo the shareholders
Pursuant to article 17, sub 3, of the statutes of
association, we herewith report on the financial
statements 2012 as drawn up by the Executive
Board. These documents have been approved by
the Supervisory Board and have been audited by
BDO Assurance NV.
The 2012 net profit amounts to SRD 34,406,334. From
this amount, in conformity with article 18, sub 2 of
the statutes of association, SRD 3.00 per preferential
share of SRD 50 nominal is accrued to the preferential
shareholders and SRD 0,25 per ordinary share of SRD 5
nominal is accrued to the ordinary shareholders. These
amounts are respectively 6% and 5% of the subscribed
and paid-in capital per share. This entitles the preferential
and ordinary shareholders to a statutory claim of
SRD 132 and SRD 23,715, respectively, after which an
amount of SRD 34,382,487 is at the disposal of the Ge-
neral Meeting of Shareholders.
The Executive Board’s proposal is to pay out a cash
dividend of SRD 357.75 per ordinary share of SRD 5
and SRD 3,577 per preferential share of SRD 50. With
this, the total dividend, including the statutory share,
amounts to SRD 358 per ordinary share of SRD 5 and
SRD 3,580 per preferential share of SRD 50.
With our approval, an interim-dividend of SRD 134 per
ordinary share of SRD 5 and SRD 1,340 per preferen-
tial share of SRD 50 was declared in December 2012.
The final dividend, at acceptance of our proposal, is
established at SRD 224 per ordinary share of SRD
5 and SRD 2,240 per preferential share of SRD 50.
These amounts are inclusive of the aforesaid statutory
dividend and shall become payable subject to deduction
of dividend tax.
We recommend that you approve the proposal from
the Executive Board and to adopt these financial
statements. This adoption thus discharges the
Executive Board for the administration and
management and the Supervisory Board for their
supervision.
We would like to express our gratitude for the way in
which the Executive Board and the personnel have
once again devoted their efforts in the reporting year
at hand.
Paramaribo, May 31 , 2013
Supervisory Board
S.E. Jharap
E. Ubalijoro
M. Loor
H. Parson

Surinaamse Brouwerij NV Jaarverslag 20126
ManagementReport The year 2012 has been an exciting year and a year of
change in which Surinaamse Brouwerij NV has realized
important strategic and operational results.
The total beer volume reached 228,681 hectoliter, a
growth of 8.3% compared to 2011, whilst EBIT (Earning
Before Interest and Taxes) reached a growth of 10.4%.
We managed to maintain our high market share.
The net result after tax amounted to SRD 34m, which
meant a growth of 11% compared to 2011.
Operating profit grew with 10% to SRD 54.7m and net
sales revenue with 18% to SRD 158.2m.
The revenue growth was mainly driven by the dispro-
portionate volume growth of the Heineken brand, a
positive change in the mix between Heineken (+5%)
and PARBO (-5%) and moderate price increases for
PARBO and Heineken in 2011 and a Heineken price
increase in 2012.
The variable costs grew with 32% primarily due to
Heineken volume growth +54%, increased malt
prices, increased packaging costs, extra truck ren-
tal costs and higher storage/demurrage costs of
production materials and Heineken imported product.
SRD / 1000 2012 2011 Delta
Revenue
Variable Cost
158,207
53,489
133,880
40,492
24,327
12,997
18%
23%
Gross Profit
Operational Cost
104,718
50,046
93,388
43,792
11,330
6,254
12%
14%
EBIT
Net Financing expenses
54,672
-912
49,596
-1,116
5,076
204
10%
-18%
Result before profit
Income tax
53,760
19,354
48,480
17,453
5,280
1,901
11%
11%
Net Result 34,406 31,027 3,379 11%
FINANCIAL OVERVIEW
The operational costs increased with 14% mainly
due to higher marketing costs related to rollout ‘Tru
Sranan Prisiri’ campaign, the introduction of new pa-
ckaging and packaging innovations, extra repair and
maintenance cost vehicles, purchase extra CO₂, higher
depreciation costs due to new investments, sala-
ry increase of average 15%, addition of Full Time
Employees (+1.9%), and net settlement fee for the
PARBO beer Trademark license for the Benelux.
The Free Operating Cash Flow increased with SRD
3.7m from SRD 16.2m to SRD 19.9m. This increase was
mainly due to our EBIT growth of SRD 5.1m and a
positive change of our working capital partly offset by
higher tax payments and more capex expenditures.

Surinaamse Brouwerij NV Jaarverslag 2012 7
Company VisionSurinaamse Brouwerij NV is the nr 1 preferred supplier
of all beverage suppliers in Suriname with the strongest
perceived offer to our customers in terms of volume,
value by preferred brands, beer of constant and high
quality and most committed people with respect for
society.
In summary the following highlights of 2012 can be
noted:
• Total volume growth of 8.3%
• Revenue growth of 18.2%
• EBIT growth of 10.4%
• Net Profit growth of 11%
• Total Rejuvenation of the PARBO packaging;
• A new 360 degrees advertising campaign “Tru
Sranan Prisiri” for PARBO
• Intensified sponsorships, activations and improved
visibility for PARBO
• Increased brand activities for the Heineken brand
in line with global advertising and sponsorship
programs,
• Further expansion of our Sub Zero Fridge Program
with another 500 fridges
• Expansion of our capacity and ensuring a consis-
tent high quality
• Renewal of a large part of our distribution fleet
• We regained the Trademark license of the PARBO
brand for the Benelux in May and restarted export
to the Netherlands in June.
• We won the Heineken Regional TPM (Total Produc-
tive Management) Award 2011 and reached the
highest level ever for the 2012 TPM Audit.
• Surinaamse Brouwerij NV is the # 1 performing
brewery in the Caribbean region and the # 3 in the
Americas within the Heineken Group of Companies
• Increased Sustainability activities with amongst
others extension of our scholarship program.
Sales & Marketing One of our key strategic pillars is to be Consumer
inspired, Customer Focused and Brand led.
The brand portfolio consists of two key brands: PARBO
beer, the true original Surinamese brand since 1955 and
Heineken® beer, the # 1 International premium brand.
Furthermore, we operate with Kaiser, a Brazilian brand
and Vitamalt, a non-alcoholic malt brand imported
from Denmark.
In a rapidly changing environment with growing
consumer demands the challenge is to keep your
brands appealing to a broad consumer audience and to
attract new consumers.
Brand developmentIn 2012 our total sales volumes reached a growth of
8.3% of which the domestic volumes grew with 7.6%
and the export volumes with 55%.
Brand portfolio - PARBO BeerThe PARBO brand had a moderate growth on the
domestic market of 1.4%, reaching
184,125 hl. In December 2011
we launched a fully integ-
rated new marketing cam-
paign for our Flagship brand
PARBO, “Tru Sranan Prisiri”.
During the course of 2012,
we have launched a number
of different TV spots and
installed various billboards around the country around
this theme.

Surinaamse Brouwerij NV Jaarverslag 20128
As part of the rejuvenation of the brand we upgraded
the core packaging for the Djogo with a new metalized
gold finish label and the 50cl and 33cl cans with a new
gold finish look. In September we launched our new
One Way 25cl bottle which replaced the mini Djogo
bottle. This new bottle is an attractive new pack within
the PARBO range and taps into the growing need of
more premium packaging.
PARBO has been exciting and inspiring many consu-
mers throughout the year with lots of events, sponsor-
ships and promotions. The major sponsorships were:
PARBO Phagwa Party, PARBO Beer Cup, PARBO Beer
Nights, PARBO Kawina and PARBO Pagara Prisiri. The
annual PARBO Kawina party moved to a new venue at
KKF that offered a safer, easier to reach, more qualitative,
better and broader experience to its thousands of
visitors.
PARBO has also been very active via Digital platforms.
Its webpages, but moreover its own Facebook page
is amongst the most frequented and popular in the
nation.
PARBO has demonstrated to be very close to the hearts
and minds of its many consumers.
Its appreciation is reflected in an equity score of 9,2, the
highest ever.
Consumers continue to inspire us and we will continue
to be innovative to further drive growth for the unique
PARBO brand, the pride of the nation of Suriname.
Brand portfolio - HEINEKEN BeerHeineken, the # 1 International premium beer brand
is sold, marketed and distributed by Surinaamse
Brouwerij since 2004. The last few years, the brand has
experienced impressive growth. This has been realized
through global advertising and sponsorship programs,
modern packaging, distinct taste and above all its
cosmopolitan and aspirational image. The brand grew
54% in volume and improved its consumer appreciation
(equity) with 10%. Heineken has grown into a substantial
brand within our portfolio with a share of 17%. We are
very proud of these results and feel blessed to have this
unique brand at the top of our range.
Brand Portfolio – other The rest of our portfolio consists of the Vitamalt brand
and the Kaiser brand.
Vitamalt continued on a relative stable, yet quite small
volume base.
The Kaiser brand, a brand from our sister Heineken
operation in Brazil, was launched two years ago for
tactical reasons, tapping into the growing Brazilian
consumer base.
During the course of 2012 we witnessed a strong
decline in demand for the brand due to the growing
demand of the Heineken brand. This has led to the
decision to terminate Kaiser within our brand portfolio
and stop selling it.
Sranan Biri – In December we launched our new brand;
Sranan Biri. Sranan Biri is a slightly caramelized dark
larger beer with 5% alcohol. It is ideally suited for festive
occasions as a so called special beer.
At the time of writing this report, there has been a ru-
ling on a legal procedure in which Surinaamse Brou-
werij NV is not considered the legitimate owner of the
Sranan Biri trademark. The Surinaamse Brouwerij NV
has decided to appeal this decision.

Surinaamse Brouwerij NV Jaarverslag 2012 9
ExportIn May 2012 we settled a long lasting legal dispute on
the Trademark license for the PARBO brand. We signed
a new distributor agreement and started the export of
PARBO beer to the Netherlands. In August we launched
the brand during a VIP party.
As a result, we have increased our export sales volumes
with 55% in 2012.
We continued exporting to both Guyana and French
Guyana. The growth of the export volume contributed
to the overall success of 2012.
Surinaamse Brouwerij will continue to conduct market
research to get insights on what other offerings would
be appealing to Surinamese consumers. Being part
of Heineken International, the world’s number three
brewing organization, gives us enormous leverage
in terms of brands to offer to consumers. We remain
committed to continuously engage with consumers
and be part of their conversations and offer them
attractive new packaging and possibly new brand
propositions.
Surinaamse Brouwerij NV Jaarverslag 201210
Supply Chain
Organization & safetyThe supply chain organization is the engine of our
brewery. It sources the raw and packaging materials
across the world. (given that most of it is simply not
available to buy in Suriname with the exception of
water and rice). It produces PARBO beer. Furthermore
it organizes the importation of HEINEKEN Beer from
the Netherlands and the exportation of PARBO beer
to the various export markets. Moreover it takes care
of the distribution of all products to all outlets across
Suriname.
The core of the supply chain is to deliver high quality
products On Time and In Full. We aim for the highest
possible and consistent quality with zero losses. This
has to be done in a safe working environment where
the target is: ZERO accidents.
In 2012 we recorded two accidents, fortunately with
minor impact. Enormous efforts have been done
to make Surinaamse Brouwerij a safe(r) working
environment. A safety coordinator has been recruited,
many safety trainings were done for all staff, unsafe
conditions and unsafe acts have been identified in
order to prevent potential incidents and accidents. As a
result, for all brewery visitors, the rules have been tigh-
tened.
PerformanceIn 2012, we have been able to produce completely ac-
cording to demand, whilst the volumes increased. This
has been achieved with the same production team.
Hence, we significantly improved our productivity. We
have exceeded a level of 5,000 hectoliters per produc-
tion employee, which is the highest productivity in the
Caribbean region.
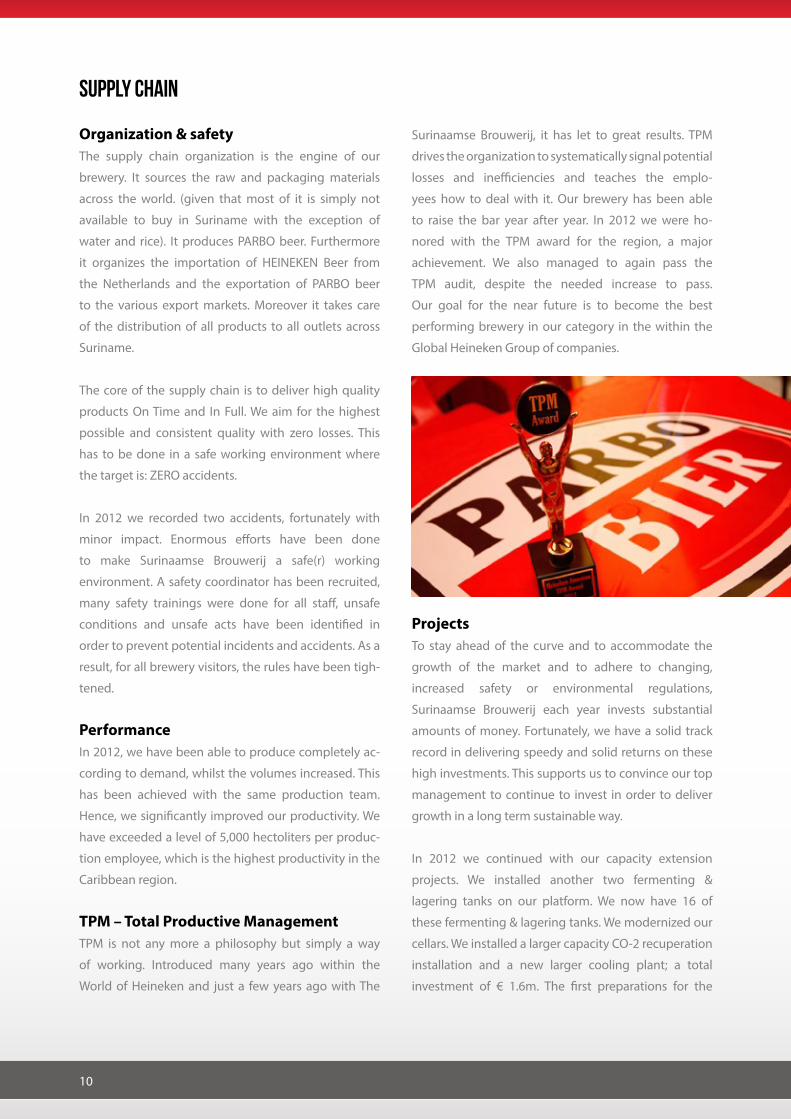
TPM – Total Productive ManagementTPM is not any more a philosophy but simply a way
of working. Introduced many years ago within the
World of Heineken and just a few years ago with The
Surinaamse Brouwerij, it has let to great results. TPM
drives the organization to systematically signal potential
losses and inefficiencies and teaches the emplo-
yees how to deal with it. Our brewery has been able
to raise the bar year after year. In 2012 we were ho-
nored with the TPM award for the region, a major
achievement. We also managed to again pass the
TPM audit, despite the needed increase to pass.
Our goal for the near future is to become the best
performing brewery in our category in the within the
Global Heineken Group of companies.
ProjectsTo stay ahead of the curve and to accommodate the
growth of the market and to adhere to changing,
increased safety or environmental regulations,
Surinaamse Brouwerij each year invests substantial
amounts of money. Fortunately, we have a solid track
record in delivering speedy and solid returns on these
high investments. This supports us to convince our top
management to continue to invest in order to deliver
growth in a long term sustainable way.
In 2012 we continued with our capacity extension
projects. We installed another two fermenting &
lagering tanks on our platform. We now have 16 of
these fermenting & lagering tanks. We modernized our
cellars. We installed a larger capacity CO-2 recuperation
installation and a new larger cooling plant; a total
investment of € 1.6m. The first preparations for the

Surinaamse Brouwerij NV Jaarverslag 2012 11
installation of a Waste Water Treatment Plant were done
in 2012; the whole project is estimated to be finalized
early 2014; a total investment of € 2.2m.
Management & distributionIn 2012 we further improved the efficiency of the
supply chain as well as the sustainability of it.
All our suppliers were audited against an international
supplier code, whereby they have to adhere to specific
rules & regulations. We reached a score of 98%. Joint
efforts between the Sales, production and distribution
departments have led to better forecasting the specific
market needs which has led to zero days Out of Stock,
an improvement versus 2011 and contribution to
satisfying our customers.
Quality Control & ImprovementIn our ongoing passion for quality, we aim at the
highest possible and consistent quality for all our
raw materials in order to guarantee the highest
quality of our beer. It is of crucial importance to check all
incoming raw materials on their quality specs. On top
of this we conduct various quality checks along the
process of brewing and fermenting and obviously of the
end result, our PARBO beer. In 2012 we have invested
in modern laboratory equipment which enables us to
better monitor processes and do analyses. For many
years Surinaamse Brouwerij has been ISO certified
already. In 2012 we reached the highest possible ISO
norm of ISO 9001- FSSC22000.
We realized again a significant improvement on our
first time right performance. First time right packaging
quality and beer production reached a level of 90%. This
level indicates a very good process control which allows
us to continuously produce high quality beer.

Surinaamse Brouwerij NV Jaarverslag 201212
Human ResourcesThe total number of employees (excluding employees
hired through external agencies) increased from 61.6 to
63.1. The people are key to our success.
In a high performing organization as Surinaamse
Brouwerij it is important to invest in people. For that
reason we continuously look for ways to support our
people by coaching and training. In 2012 we have
run a number of training programs. We spent a lot of
time and effort on training all staff on specific safety
modules. Furthermore, we worked on developing
leadership skills. A good example is the First Line
|Managers training in which our managers learn how
to train and coach their teams. This international
Heineken program has been proven successful in many
of our HEINEKEN operations across the world. Finally, we
have made a first start with developing specific Functional
Competencies. Our policy to aim at reducing the
sickness absence rates has been proven to be successful.
From 2009 onwards, when we introduced this policy,
rates have decreased from close to 4 % to 2.4%.
Corporate Social Responsibility – Brewing a Better FutureSustainability is essential in realizing our business
goals. We have fully embedded the HEINEKEN
Corporate framework “Brewing a Better Future”.
“Brewinga Better Future”, is a framework to support
realizing our responsibilities towards our employees,
the local community in which we operate and the
environment.
The HEINEKEN ambition is to be the greenest brewer of
the world. It consists of three strategic pillars:
1. Improvement - continuous improvement of the
environmental effects of our company and brands
In our brewery we constantly measure and aim to reduce
the quantities of water and energy used.
We also aim at reducing CO2 in all what we do. We are
100% compliant with environmental friendly fridges
and draft machines and we replaced eight delivery
trucks by new trucks with engines with all new specs
and lower CO2 emissions.
2. Empowerment - for our people and the community
that we operate in.
A good example of empowerment is the scholarship
program that Surinaamse Brouwerij NV started in 2011
and that we continued in 2012 with scholarships for
another three local students. We now support one in-
ternational scholar and five local scholars.
3. Impact - a positive impact of the role of beer in society.
In 2012 we continued our efforts to improve respon-
sible alcohol consumption. “Drink, but don’t drive”
and 18+ are the warnings that we published during
all our events and which we constantly mention on all
our delivery and commercial vehicles. We do realize

Surinaamse Brouwerij NV Jaarverslag 2012 13
Outlook 2013
The year 2013 will be the year of
change.
Our company has been growing
rapidly for the last decade. We have
reached international levels of
product quality, production
efficiency, brand performance
and consistent solid financial
performance. In order to continue
to deliver we recognize the need
for change and adapt to the
changing environment around us.
The management team will take
up the challenge to guide the
organization through this process
in a structured way. We have
indicated to the top management
that 2013 will be a transition year
in which we need to invest in
people (training, coaching and
hire of extra FTE’s), automation
of some of our key administrative
processes and further optimize our
production process to support the
organization in realizing its
ambitious goals.
Our aim is to create a solid foun-
dation for long-term sustainable
growth with the target to not only
grow but also win and outperform
the competition. We will spend
more time, effort and money
to build a position as sustainable
business partner with a solid
contribution to the environment
and society we operate in. We are
confident to state that Surinaamse
Brouwerij NV is well on its way to
meet this new challenge.
The Management Team
we need to further engage with
governmental and non-govern-
mental organizations to start
a dialogue on how to reduce
thenegative impact of alcohol
abuse.
In 2012 we were amongst a number
of HEINEKEN operating compa-
nies that developed a sustainabili-
ty factsheet in which we reported
the progress made in 2011 on the
above pillars and programs.
The year 2012 has been a dynamic
year with lots of challenges on our
path.
Helped by the growing economy
with GDP growth of 4.5% and a
substantial lower inflation rate of
4.4% compared to last year 15.3%,
we have been able to realize ano-
ther year of solid volume growth.

Surinaamse Brouwerij NV Jaarverslag 201214

Surinaamse Brouwerij NV Jaarverslag 2012 15
FIVE YEAR CONSOLIDATED KEY FIGURES To get a better insight into the actual development of the operating results, below table shows important data
from 2012-2008 from the annual figures expressed in Euros. For the balance sheet, the year-end exchange rate
is used and for the other variables, the average exchange rate.
In Euro‘s 2012 2011 2010 2009 2008
Balance sheet total 25,169,285 21,239,181 25,135,247 18,957,139 20,279,372
Net Revenue 36,792,230 30,337,664 27,764,303 22,196,962 17,974,607
Net profit 8,001,473 7,030,932 6,832,204 4,795,950 4,288,738
Cash dividend 7,934,279 7,018,468 6,832,169 4,779,834 4,286,771
Payout Ratio in % of net profit 100% 100% 100% 100% 100%
Cash dividend/ ordinary shares SRD 5 83.26 73.59 71.69 50.15 44.98
Number of issued and paid up
ordinary shares94,860 94,860 94,860 94,860 94,860
Net profit per SRD 5 share 84.35 74.12 72.02 50.56 45.21
Stock Market Value year-end 170.93 89.51 76.16 54.48 31.41
Share price/ earnings ratio 2.0 1.2 1.1 1.1 0.7
Number of personnel 97 96 92 89 92
Euro-exchange rates (SRD/Euro)
Year-end 4.420 4.330 3.770 4.130 3.989
Average 4.300 4.413 3.808 3.908 4.135
USD-exchange rates (SRD/USD)
Year-end 3.350 3.350 2.800 2.800 2.800
Average 3.350 3.350 2.800 2.800 2.800
Surinaamse Brouwerij NV Jaarverslag 201216
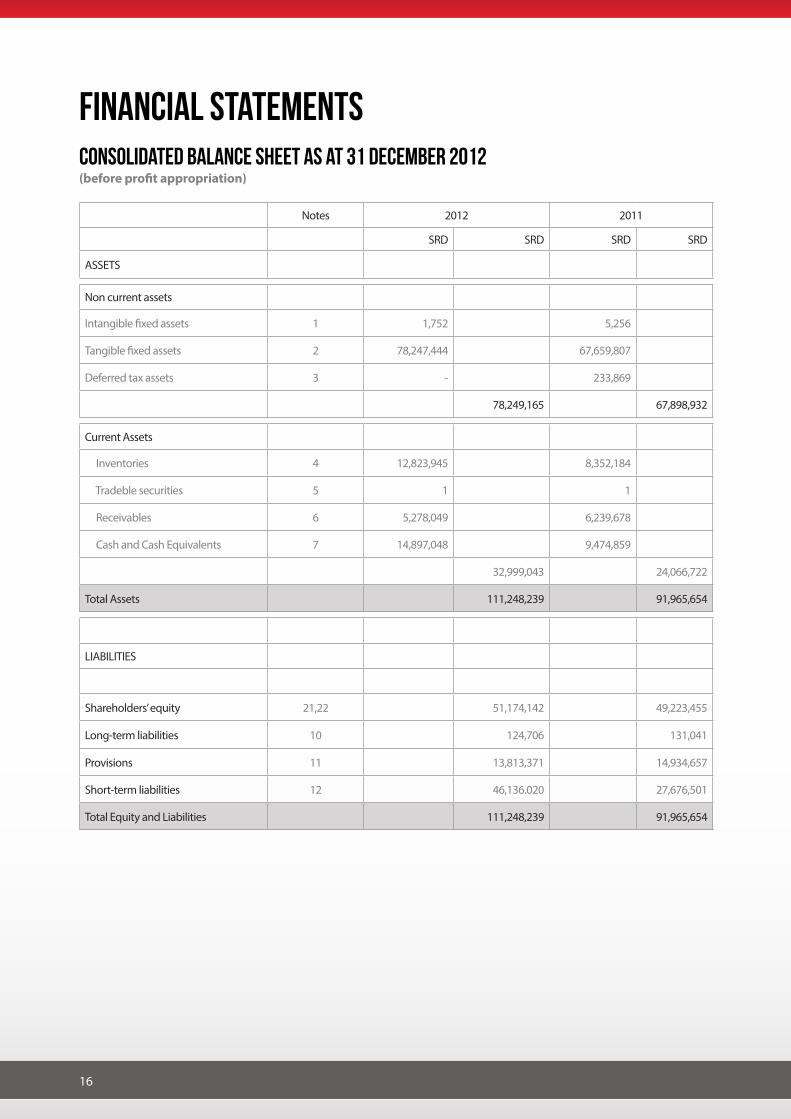
FINANCIAL STATEMENTS
(before profit appropriation)
Notes 2012 2011
SRD SRD SRD SRD
ASSETS
Non current assets
Intangible fixed assets 1 1,752 5,256
Tangible fixed assets 2 78,247,444 67,659,807
Deferred tax assets 3 - 233,869
78,249,165 67,898,932
Current Assets
Inventories 4 12,823,945 8,352,184
Tradeble securities 5 1 1
Receivables 6 5,278,049 6,239,678
Cash and Cash Equivalents 7 14,897,048 9,474,859
32,999,043 24,066,722
Total Assets 111,248,239 91,965,654
LIABILITIES
Shareholders’ equity 21,22 51,174,142 49,223,455
Long-term liabilities 10 124,706 131,041
Provisions 11 13,813,371 14,934,657
Short-term liabilities 12 46,136.020 27,676,501
Total Equity and Liabilities 111,248,239 91,965,654
CONSOLIDATED balance sheet AS at 31 DECEMBER 2012
Surinaamse Brouwerij NV Jaarverslag 2012 17
Notes 2012 2011
SRD SRD SRD SRD
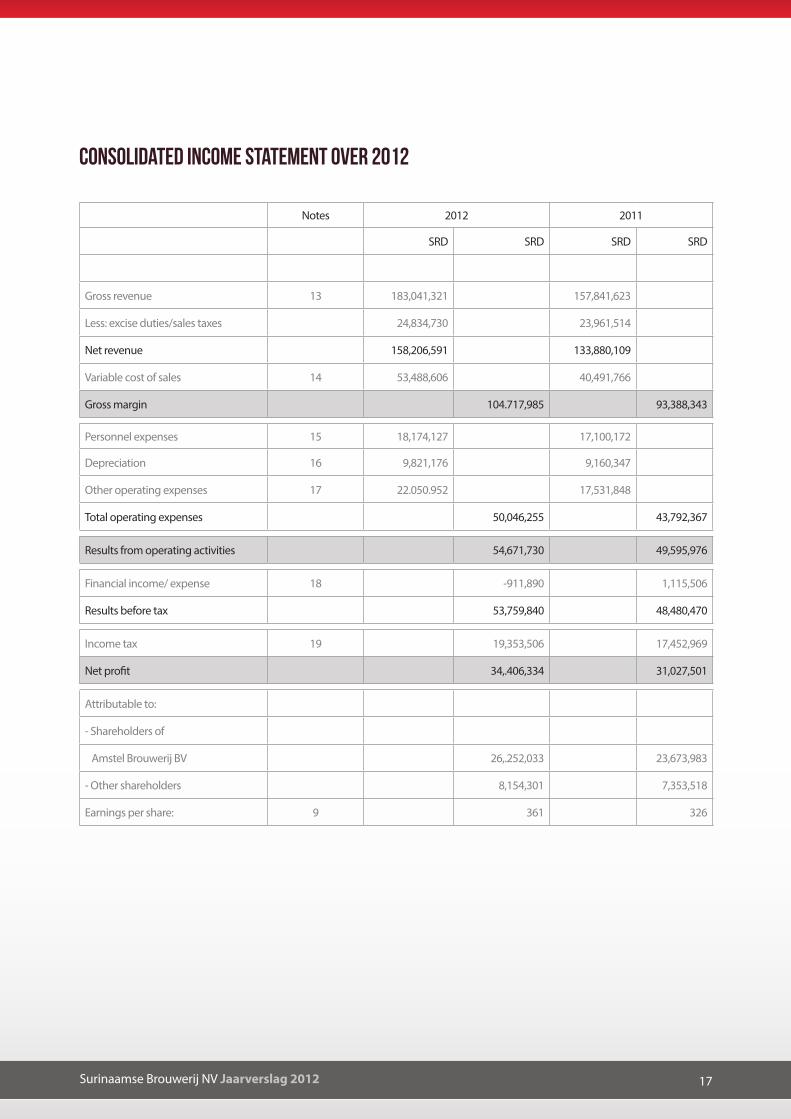
Gross revenue 13 183,041,321 157,841,623
Less: excise duties/sales taxes 24,834,730 23,961,514
Net revenue 158,206,591 133,880,109
Variable cost of sales 14 53,488,606 40,491,766
Gross margin 104.717,985 93,388,343
Personnel expenses 15 18,174,127 17,100,172
Depreciation 16 9,821,176 9,160,347
Other operating expenses 17 22.050.952 17,531,848
Total operating expenses 50,046,255 43,792,367
Results from operating activities 54,671,730 49,595,976
Financial income/ expense 18 -911,890 1,115,506
Results before tax 53,759,840 48,480,470
Income tax 19 19,353,506 17,452,969
Net profit 34,.406,334 31,027,501
Attributable to:
- Shareholders of
Amstel Brouwerij BV 26,.252,033 23,673,983
- Other shareholders 8,154,301 7,353,518
Earnings per share: 9 361 326
CONSOLIDATED INCOME STATEMENT OVER 2012

Surinaamse Brouwerij NV Jaarverslag 201218
Issued and paid
capitalRetained earnings Net profit Total
SRD SRD SRD SRD
Balance at 1 January 2012 476,500 17,743,301 31,003,654 49,223,455
Addition to retained earnings from
profit distribution 201155,001 -55,001 -
Dividend distribution 2011 - 11,150,100 -30,948,653 -19,798,553
Paid-out interim dividend 2012 - 12,770,200 - -12,770,200
Actuarial result provision post retirement
medical benefits- 120,196 - 120,196
Actuarial result provision post
retirement medical benefits (Parbo
Centrale NV).- 191 - 191
Excess Long Term Incentive Plan - 16,566 - 16,566
Net profit 2012 - - 34,406,334 34,406,334
Statutory dividend 2012 - - -23,847 -23,847
Balance at 31 December 2012 476,500 16,315,155 34,382,487 51,174,142
CONSOLIDATED STATEMENT OF CHANGES IN EQUITY

Surinaamse Brouwerij NV Jaarverslag 2012 19
CONSOLIDATED CASH FLOW STATEMENT 2012
2012 2011
SRD SRD SRD SRD
OPERATIONAL ACTIVITIES
Net profit 34,406,334 31,027,501
Adjustments for:
Depreciation intangible and
tangible fixed assets
9,823,154 9,188,474
Net financing income/ expenses 14,488 -30,716
Income tax expense 19,353,506 17,452,969
Cash Flow operational activities before changes in working
capital and provisions 63,597,482 57,638,228
Changes in inventories -4,471,761 -440,470
Changes in receivables 961,629 -3,567,781
Changes in short term debts 6,669,339 -3,152,036
Total changes in working capital 3,159,207 -7,160,337
Changes in provisions -1,121,286 2,832,236
Changes in deferred tax assets 233,869 -233,869
Changes in provisions and deferred tax -887,417 2,598,367
Cash flow business activities 65,869,272 53,076,258
Interest paid and received -14,488 30,716
Income tax paid -25,550,295 22,043,263
Cash flow used for interest and income tax -25,564,783 -22,012,547
Cash flow operational activities 40,304,489 31,063,711
INVESTING ACTIVITIES
Investment tangible fixed assets -20,407,287 -14,831,855
Cash flow investing activities -20,407,287 -14,831,855
Free operating cash flow 19,897,202 16,231,856
FINANCING ACTIVITIES
Dividends paid -32,190,614 -28,851,555
Changes in Long Term Incentive Plan 10,231 69,816
Changes in Acturial Results 120,387 -412,078
Cash flow financing activities -32,059,996 -29,193,817
Net cash flow -12,162,794 -12,961,961
Balance cash and cash equivalent (incl. bank overdraft)
January 1st7,539,458 20,501,419
Balance cash and cash equivalent (incl. bank overdraft)
December 31st -4,623,336 7,539,458

Surinaamse Brouwerij NV Jaarverslag 201220
Company informationSurinaamse Brouwerij NV is incorporated and domi-
ciled in Paramaribo, Suriname. The company is a majority
owned subsidiary of Amstel Brouwerij BV, a private
limited company established and registered in
Amsterdam, the Netherlands. Amstel Brouwerij BV
owns 76.3% of the shares of Surinaamse Brouwerij NV
and is a 100% subsidiary of Heineken NV, a corporation
established and registered in Amsterdam, the
Netherlands.
Surinaamse Brouwerij NV brews, bottles, imports, sells,
distributes and exports beer under the brand names
Parbo Bier, Parbo Chiller, Parbo Stout, Heineken®,
Kaiser and Vitamalt.
Summary of significant accounting policies
ConsolidatedThe financial statements have been prepared based on
historical cost prices.
These financial statements are prepared based on
management making certain judgments, estima-
tes and assumptions that affect the application of
accounting policies and reported amounts of as-
sets and liabilities, income and expenses. Estima-
tes in the financial statements are, amongst others,
related to the economic life span of the intangible
and tangible fixed assets and provisions. The esti-
mates and associated assumptions are based on
historical experience, actuarial calculations and on
various other factors that under the prevailing
circumstances are to be considered reasonable.
These factors form the basis for the assessment about
carrying values of assets and liabilities. This information
is not readily available from other sources. Actual
results may differ from these estimates.
GENERAL NOTEs The estimates and underlying assumptions are
continuously evaluated. Changes of estimates are
accounted for in the period in which the estimates
are adjusted, in case the changes solely impact the
reported year or are accounted for in the period in
which the estimates were adjusted and, in future
periods, in case the adaptation will impact both current
and future years.
The key judgments in applying estimates of
Surinamese Brouwerij NV for valuation and
determination of results are described in the notes to
the consolidated financial statements.
PRINCIPLES OF CONSOLIDATION
The consolidated financial statements comprise of the
financial data of Surinaamse Brouwerij NV and its 100%
subsidiaries Parbo Centrale NV and Premium Beverage
NV (dormant), of which Surinaamse Brouwerij NV has
the decisive control.
Elimination of transactions and balances at consolidationIntercompany balances and transactions and non-rea-
lized margins resulting from transactions between the
holding company and Parbo Centrale are eliminated in
the the consolidated financial statements.
FOREIGN CURRENCY translation
The functional and reporting currency is Suriname Dol-
lars (SRD).
Monetary balance sheet items denominated in foreign
currency are converted at the foreign exchange rates as
of the balance sheet date of ‘De Surinaamsche Bank N.V.’
These are as follows:
USD 1 = SRD 3.35
(at the end of 2011: USD 1 = SRD 3.35)
EURO 1 = SRD 4.42
(at the end of 2011: EURO 1 = SRD 4.33)

Surinaamse Brouwerij NV Jaarverslag 2012 21
Exchange rate differences occurring at the settlement or
otherwise, conversion of monetary balance sheet items,
are entered in the income statement. Transactions
in foreign currencies are converted in the income
statement to Surinamese Dollars at the exchange rate
prevailing at the date of the transaction.
PRINCIPLES BALANCE SHEET VALUATION
Intangible fixed assetsThe intangible fixed assets, comprise computer soft-
ware, which are valuated at cost price, less a straight line
depreciation based on the estimated economic life of 3
years, or otherwise lower net recoverable amount.
Tangible fixed assetsTangible fixed assets are valuated at the historic cost
price or manufacturing price, less straight line accumu-
lated depreciation based on the estimated economic
lives or lower recoverable amount. No depreciation is
applied to land and projects in progress. The estimated
economic lives are as follows:
• Buildings and premises 15-40 years
• Plant, equipment, furniture and fixtures 10-30 years
• Other tangible assets 5-15 years
InventoriesThe raw & auxiliary material inventories are valued at
cost price or lower market value. Semi finished products
are valued at the manufacturing costs i.e. the cost price
of the used raw and auxiliary material and the direct
production costs. Other stock is valued at the cost price.
Where necessary a provision is recorded for obsolete in-
ventory and deducted from the inventory value.
ReceivablesReceivables are valued at the nominal value, net of an
allowance for doubtful accounts
Long-term liabilitiesLong term liabilities relates to the Long Term Incentive
Plan for management, a remuneration system
maintained by Heineken International which is valued
at nominal value.
Provisions (general)The provisions are valued at the nominal value with the
exception of the provision for post employee benefits
which are determined by the actuary on a descounted
basis, pursuant to actuarial methods.
Provision deferred tax liabilities and assetsThe provision for deferred tax liabilities are calcu-
lated over temporary differences between com-
mercial and fiscal valuations of the balance sheet
items tangible fixed assets, stock and the pro-
vision for employee benefits, at the nominal
tax rate. Movements in the provision resulting from a
change of the tax rate are processed, depending on
the nature of the principles for the valuation, in the
income statement or in retained earnings.
Provision for post retirement medical be-nefitsThe provision for post retirement medical benefits is
build up based on commitments made by virtue of the
free medical health care for current and future pensi-
oners. The provision is determined based on actuarial
valuations.
Other assets and liabilitiesAll other assets and liabilities in the balance sheet are
valuated at par value.

Surinaamse Brouwerij NV Jaarverslag 201222
PRINCIPLES DETERMINATION OF RESULTS
Net revenue represents the proceeds from delivery of
goods and services to third parties, and is presented
after deduction of discounts, sales taxes and excise
duties.
The operating costs are determined taking into consi-
deration the principles for valuation and determination
of results and are allocated to the year to which they
relate.
Profits are accounted for in the year in which the goods
and/or services are delivered. Losses are accounted for
in the year in which they are identified.
The depreciation expenses are calculated on a straight
line basis, based on the expected economic lives.
Depreciation of investments during the year are made
proportionally from the date of acquisition or econo-
mic use in case of work in progress transfers.
Income tax is computed on the basis of the pre tax results
as accounted for in the income statement, taking into
account tax allowances and wholly or partially nonde-
ductible expenses.
CONSOLIDATED CASH FLOWThe consolidated cash flow statement is prepared using
the indirect method, whereby a distinction is made
between cash flows from operating, investing and
financing activities. The net cash flow from operating
activities is adjusted for income items in the profit and
loss account and changes in balance sheet items which
did not actually constitute a cash flow during the year.
In the cash flow statement are included cash items with
a maturity of less than one year, including cash and
bank balances/ overdrafts repayable on demand.

Surinaamse Brouwerij NV Jaarverslag 2012 23
NOTES TO THE CONSOLIDATED balance sheetAS at 31 DECEMBER 2012
2012 2011
SRD SRD
Balance as of 1 January 5,256 8,760
Depreciation -3,504 -3,504
Book value as of 31 December 1,752 5,256
2012 2011
SRD SRD
Land 2,348,762 2,348,762
Buildings 6,917,956 6,597,895
Plant, Equipment, furniture & fixtures 44,258,413 44,041,892
Returnable packaging 7,413,049 7,532,729
Vehicles 4,591,885 1,751,521
Projects in progress 12,717,379 5,387,008
Total 78,247,444 67,659,807
Land Buildings
Plant,
equipment,
furniture &
fixtures
Returnable
PackagingVehicles
Projects in
progressTotal
SRD SRD SRD SRD SRD SRD SRD
Book value 1 January 2012 2,348,762 6,597,895 44.041.892 7,532,729 1,751,521 5,387,008 67,659,807
Investments - 855,672 6,778,753 1,620,292 3,843,671 7,330,371 20,428,759
Disposals - - - - -197,725 - -197,725
Depreciation charge - -535,611 -6,562,232 -1,739,972 -981,835 - -9,819,650
Reversed depreciation
disposals- - - - 176,253 - 176,253
Book value 31 December
20122,348,762 6,917,956 44,258,413 7,413,049 4,591,885 12,717,379 78,247,444
1. INTANGIBLE FIxED ASSETS
2. TANGIBLE FIxED ASSETS
The movement of this item, in relation to the asset computer software is represented as follows:
The item tangible fixed assets are comprised of as follows:
The progress of this item per category is as follows:

Surinaamse Brouwerij NV Jaarverslag 201224
Depreciation is based on the estimated economic lives of the relevant assets. Land is not depreciated. ‘Projects in
progress’ includes advance payments on ordered tangible fixed assets under construction.
The fair value of the tangible fixed assets does not deviate significantly from the book value as of 31 December 2012.
For further details, reference is made to the provision for post retirement medical benefits.
2012 2011
SRD SRD
Opening balance 233,869 -
Actuarial losses year 2011 (SRD 649,636 at 36%) - 233,869
Actuarial gains year 2012 (SRD 187,807 at 36%) -67,611 -
Settlement with income tax payable 2012 -166,258 -
Closing balance - 233,869
3. DEFERRED TAx ASSETSIn 2011, in conformity with Heineken’s policy regarding ‘Pension accounting’, deferred tax was calculated over the actuarial result regarding the provision for employee benefits. At the end of 2012, the deferred tax asset was nil. In the reporting year it was decided to take the balance of the deferred tax asset as a tax deduction in the final tax return of 2012. The progress of this item is as follows:
2012 2011
SRD SRD
Raw and auxiliary materials 642,820 540,407
Semi-finished product 880,207 670,759
Finished product 5,359,332 2,249,518
POS materials 1,256,288 938,720
Packaging, technical, and materials 4,685,298 3,952,780
Total 12,823,945 8,352.,184
4. INVENTORIES The item ‘inventories’ is compiled as follows:
5. TRADABLE SECURITIES
The item ‘tradable securities’ regards one share of NV Hotelmaatschappij Torarica, valued at cost price. The market
value of the share at balance sheet date amounts to SRD 75.00.

Surinaamse Brouwerij NV Jaarverslag 2012 25
2012 2011
SRD SRD
Trade receivables 3,352,354 1,640,503
Group receivables 3,182 -
Other receivables and pre payments 1,922,513 4,599,175
Total 5,278,049 6,239,678
2012 2011
SRD SRD
Cash balances 147,590 131,700
Bank balances 14,749,458 9,343,159
Total 14,897,048 9,474,859
8. SHAREHOLDERS’ EQUITY
9. EARNINGS PER SHARE
6. RECEIVABLES
7. CASH AND CASH EQUIVALENTS
For a specification of the shareholders’ equity, reference is made to the company balance sheet as of 31 December
2012 of Surinaamse Brouwerij NV on page 74.
The calculation of the earnings per share for the amount of SRD 361.03 (2011: SRD 325.58) is based on the net
earnings of SRD 34,406,334 (2011: SRD 31,027,501) and the total number of issued shares converted to numbers of
nominal share of SRD 5 each. In 2012, this number is 95,300 shares similar as in 2011.
The compilation of the item ‘receivables’ is as follows:
The cash and cash equivalents comprise as follows:
With the exception of an amount of SRD 150,000 a fixed deposit at De Surinaamsche Bank N.V., has been
pledged as collateral for guarantees for benefit of the Collector of Import and Excise Duties, the cash and cash
equivalents are at free disposal of the company.
10. LONG-TERM LIABILITIES
This regards a liability for the Long Term Incentive Plan (LTIP) within the scope of the remuneration system as
maintained by Heineken International for management. At the end of the financial year, the liability amounted to SRD
124,706.

Surinaamse Brouwerij NV Jaarverslag 201226
2012 2011
SRD SRD
Deferred tax liabilities 5,876,343 6,098,731
Provision for post retirement medical benefits 7,937,028 8,183,720
Provision for reorganization expenses - 652,206
Total 13,813,371 14,934,657
11. PROVISIONS The item ‘provisions’ is comprised as follows:
Deferred tax liabilities
The provision for deferred tax liabilities is established through:
1. the difference between the tax and commercial valuation and profit determination. This tem-
porary difference relates to the balance sheet items ‘tangible fixed assets’ and inventory valuation.
The deviation for tangible fixed assets is on the one hand due to deviating principles of valuation
for tax purposes and on the other hand due to deviating useful lives resulting from fiscally accelerated depre-
ciation on specific production assets. The ‘iron stock system’ is applied for the tax valuation of specific inventory
groups.
2. a change in accounting policies with respect to the actuarial results on the provision for post retirement medical
benefits.
Fixed assets InventoriesPost Retirement
medical benefitsTotal
SRD SRD SRD SRD
Balance as of 1 January 2012 5,509,271 587,385 2,075 6,098,731
Release due to depreciations -454,489 - - -454,489
Increase due to elimination of
intercompany profit Parbo Centrale - 188,794 - 188,794
Increase due to increase valuation
difference of inventories - 46,638 - 46,638
Settlement actuarial result provision for
post retirement medical benefits with
income tax payable 2012
- - -2,075 -2,075
Adjustments -1,256 2 - -1,255
Balance as of 31 December 2012 5,053,524 822,819 - 5,876,343
The provision is specified as follows:

Surinaamse Brouwerij NV Jaarverslag 2012 27
Provision for post retirement medical benefits
This provision is based on commitments made by the employer for free medical care for beneficiaries and their rela-
tives entitled to these rights. The provision is based on actuarial calculations performed by the external actuary. The
movements in the financial year regard on the one hand, deductions for benefit withdrawals and premium
payments to Assuria Insurances and on the other hand additions to the provision based on the actuarial
valuation of the liability at the end of the reporting year. The calculation is based on current actuarial
assumptions in Suriname and a discount rate of 1,9%.
Effective fiscal year 2011, according to Heineken policies, a change occurred in the accounting policies and pre-
sentation of actuarial gains and losses whereby these actuarial results are recorded as comprehensive income in
shareholder’s equity taking into account a provision for deferred taxes.
The movement of this provision is as follows:
At the end of the financial year, the movement of the provision for reorganization expenses is as follows:
2012 2011
SRD SRD
PBO liabilities as of 1 January 8,183,720 5,172,422
Withdrawals -581,622 -528,758
Current service expenses (including interest) 638,011 649,930
Current and back service expenses -114,975 2,246,255
Actuarial results -188,106 643,871
PBO of liabilities as of 31 December 7,937,028 8,183,720
Actuarial (profit)/ loss Surinaamse Brouwerij NV -187,807 649,636
Actuarial profit Parbo Centrale NV -299 -5,764
Balance actuarial losses -188,106 643,872
Deferred tax assets (36% over the actuarial profit - Surinaamse Brouwerij NV) -67,611 233,869
Deferred tax assets (36% over the actuarial profit - Parbo Centrale NV) -108 2,075
Movement in shareholders’ equity (balanced) -120,387 412,078
Provision reorganization expenses
The withdrawal in the reporting year pertains to the settlement of a lawsuit with a former employee.
2012 2011
SRD SRD
Balance as at 1 January 652,206 652,206
Withdrawals -652,206 -
Balance as at 31 December - 652,206

Surinaamse Brouwerij NV Jaarverslag 201228
2012 2011
SRD SRD
Income tax payable 3,585,853 6,961,987
Affiliated companies 1,714,116 4,185,300
Returnable deposit liabilities 3,045,653 3,531,073
Suppliers 9,539,225 2,975,890
Excise duties and sales tax payable 2,666,240 2,190,495
Bank overdraft 19,520,384 1,935,401
Dividend payable 1,770,317 1,368,331
Personnel cost payable 1,573,357 1,274,157
Pensions contributions payable 548,537 548,537
Reorganizational expenses 205,916 481,871
Wage tax and AOV premiums payable 1,244,942 260,459
Other payables and accrued liabilities 721,480 1,963,000
Total 46,136,020 27,676,501
12. SHORT-TERM LIABILITIES The item ‘short term liabilities’ is compiled of as follows:

Surinaamse Brouwerij NV Jaarverslag 2012 29
NOTES TO THE CONSOLIDATED INCOME STATEMENT OVER 2012
2012 2011
SRD SRD
Domestic sales 182,575,173 157,477,820
Export 1,905,663 1,345,306
Total revenue 184,480,836 158,823,126
Discounts -1,439,515 -981,503
Gross revenue 183,041,321 157,841,623
2012 2011
SRD SRD
Raw and auxiliary materials 7,532,949 6,856,245
Packaging materials 10,860,433 8,674,273
Purchase value import beer 31,694,743 22,534,698
Other variable expenses 3,400,481 2,426,550
Total 53,488,606 40,491,766
13. GROSS REVENUE
14. VARIABLE COST OF SALES
Gross revenue is comprised as follows:
The variable expenses pertain primarily to the consumption of raw, auxiliary and packaging materials in the production process and the purchase value of import beer; this is compiled as follows:
2012 2011
SRD SRD
Wages, holiday allowances and bonuses 10,461.822 8,712,115
Employer’s pension contributions 1,265,800 1,598,944
Medical expenses including addition to provision post retirement medical benefits 1,106,834 3,463,827
Other personnel expenses 5,339,671 3,325,286
Total 18,174,127 17,100,172
Number of employed personnel in the reporting year in FTE’s (calculated in
conformity with the definition of Heineken International) at:
Surinaamse Brouwerij NV 66.9 64.5
Parbo Centrale NV 75.7 75.4
Total 142.6 139.9
15. PERSONNEL ExPENSESThe personnel expenses comprise as follows:

Surinaamse Brouwerij NV Jaarverslag 201230
2012 2011
SRD SRD
Depreciation tangible fixed assets 9,819,650 9,184,970
Depreciation intangible fixed assets 3,504 3,504
Profit on sale of tangible fixed assets -1,978 -28,127
Total 9,821,176 9,160,347
16. DEPRECIATIONUnder depreciation the results from the sale of tangible fixed assets is also accounted for. The item comprises as follows:
2012 2011
SRD SRD
Repair & Maintenance 3,012,329 2,126,748
Energy & Water 3,565,084 3,049,571
Marketing & Sales expenses 7,629,898 5,782,851
General and administrative expenses 7.843,641 6,572,678
Total 22,050,952 17,531,848
2012 2011
SRD SRD
Financial income
Interest income 31,214 41,254
Sub-total 31,214 41,254
Financial expenses
Exchange results -897,402 -1,146,222
Interest expenses -45,702 -10,538
Sub-total -943,104 -1,156,760
Balance financial income /expenses -911,890 -1,115,506
17. OTHER OPERATING ExPENSES
18. FINANCIAL INCOME/ExPENSES
These comprise of:
2012 2011
SRD SRD
Amount over which the income tax is calculated (pre tax income) 53,759,840 48,480,470
Commercial tax rate (36 %) 19,353,506 17,452,969
19. INCOME TAxThe result before income tax is calculated as follows:

Surinaamse Brouwerij NV Jaarverslag 2012 31

Surinaamse Brouwerij NV Jaarverslag 201232
Notes 2012 2011
SRD SRD SRD SRD
ASSETS
Fixed assets
Intangible fixed assets 1,752 5,256
Tangible fixed assets 78,247,444 67,659,807
Financial fixed assets- subsidiaries 20 4,733,944 5,067,971
Deferred taxation receivables - 233,869
82,983,140 72,966,903
Current assets
Inventories 5,846,744 4,158,485
Tradable securities 1 1
Receivables 5,006,334 4,032,352
Cash and cash equivalents 8,989,298 5,653,868
19,842,377 13,844,706
Total assets 102,825,517 86,811,609
LIABILITIES
Shareholders’ Equity
Issued and paid capital 21 476,500 476,500
Retained earnings 22 16,315,155 17,743,301
Result financial year 34,382,487 31,003,654
51,174,142 49,223,455
Long-term liabilities 124,706 131,041
Provisions 12,513,253 13,878,502
Short-term liabilities 39,013,416 23,578,611
Total equity end liabilities 102,825,517 86,811,609
COMPANY BALANCE SHEET AS OF 31 DECEMBER 2012(before profit appropriation)

Surinaamse Brouwerij NV Jaarverslag 2012 33
2012 2011
SRD SRD SRD SRD
Gross revenues 105,145,775 117,842,932
Less: excise duties and sales taxes 24,834,730 23,961,514
Net revenue 80,311,045 93,881,418
Variable cost of sales 19,031,732 27,765,946
Gross margin 61,279,313 66,115,472
Personnel expenses 12,624,777 11,372,242
Depreciation 9,821,176 9,160,347
Other operating expenses 6,929,859 6,524,832
Total operating expenses 29,375,812 27,057,421
Results from operating activities 31,903,501 39,058,051
Financial income/expenses -1,001,558 -1,071,206
Results before income tax 30,901,943 37,986,845
Income tax 11,124,699 13,675,264
Results after taxes 19,777,244 24,311,581
Results from subsidiaries (Parbo Centrale) 14,629,090 6,715,920
Net profit 34,406,334 31,027,501
Less: Statutory dividend 23,847 23,847
Results after statutory dividend 34,382,487 31,003,654
COMPANY INCOME STATEMENT oVER 2012

Surinaamse Brouwerij NV Jaarverslag 201234
NOTEs TO THE COMPANY BALANCE sheetAND INCOME STATEMENTIn order to provide insight in the valuation and movement of the company financial statement items “finan-
cial fixed assets” and “shareholders’ equity”, are separately disclosed in the company financial statements.
GeneralThe principles of valuation and determination of results for the company financial statements are the same as those
disclosed in the notes to the consolidated financial statements.
The wholly owned subsidiaries (Parbo Centrale and Premium Beverage Suriname NV) companies are valued at net
asset value. The result from the subsidiaries corresponds to the share in earnings of the relevant companies, over the
reporting year.
Parbo Centrale NVPremium Beverage
Suriname NVTotal
SRD SRD SRD
Net asset value as at 1 January 2012 6,719,778 5 6,719,783
Profit distribution -6,715,920 - 6,715,920
3,858 5 3,863
Result 2012 14,629,090 - 14,629,090
14,632,948 5 14,632,953
Actuarial results on provision post retirement medical
benefits 191 - 191
Net assset value as at 31 december 2012 14,633,139 5 14,633,144
Current account liabilities -9,899,200 - -9,899,200
Balance 4,733,939 5 4,733,944
20. FINANCIAL FIxED ASSETS-SUBSIDIARIESThe financial fixed assets are related to the wholly owned subsidiary Parbo Centrale NV and Premium Beverage Suriname NV (dormant), of which the progress is as follows:
Premium Beverage Suriname NV is a dormant company in which there are currently no activities.

Surinaamse Brouwerij NV Jaarverslag 2012 35
2012 2011
SRD SRD
Balance as at January 1st 17,743,301 20,347,147
- addition profit appropriation form previous financial year 55,001 132
- actuarial result from provision post retirement medical benefits (Surinaamse
Brouwerij NV)120,196 -415,767
- actuarial result from provision post retirement medical benefits (Parbo Centrale NV) 191 3,689
- Long Term Incentive Plan (LTIP) 16,566 -
- dividend payment from last year 11,150,100 8,958,200
- interim-dividend payment current year -12,770,200 -11,150,100
Balance as at December 31st 16,315,155 17,743,301
22. RETAINED EARNINGSThe progress of the item ‘retained earnings’ is as follows:
A revaluation reserve of SRD 3,389,954 is included (2011: SRD 4,001,553) in the balance of retained earnings as at 31
December 2012
Issued and paid share capital2012 2011
SRD SRD
94,860 nominal shares of par value SRD 5 474,300 474,300
44 preferential shares of par value SRD 50 2,200 2,200
Total 476,500 476,500
21. SHARE CAPITALShare capital amounts to SRD 2,382,500 and comprises of 476,060 authorised equity shares of SRD 5 and 44 preferenti-al shares at SRD 50, each. Of this amount, the following shares have been issued and paid in full, at the end of the reporting year:

Surinaamse Brouwerij NV Jaarverslag 201236
Additional InformationSharesThe preference shares are registered, ordinary bearer shares and if desired by name.
Authority rights meeting of preferential shareholdersThe executive board members are appointed by the General Meeting of Shareholders based on a binding nomination
of two persons for each vacancy where by the nomination is established by the meeting of preferential shareholders.
This procedure also applies at the appointment of the Supervisory Board members.
Statutory stipulation for profit distribution Of the net profits, 6% dividend is initially distributed over the paid-in preferential share capital to the holders of
preferential shares or to a lesser amount due to a lesser net profit and subsequently, 5% to the ordinary shareholders
over the paid-in capital on the ordinary shares or to a lesser amount due to a lesser net profit. The remaining amount
of the net profit is at the disposal of the General Meeting of Shareholders.
If, according to the adopted profit and loss account in any year loss was suffered, not covered by a reserve, no profit
distribution shall take place in the subsequent years, as long as said loss has not been settled.
Distribution of earnings 2011The General Meeting of Shareholders adopted the financial statements 2011 on July 4, 2012, and has approved below
profit distribution of 2011, as follows:
Per share In total
SRD SRD
Dividend preferential shares (44 shares at SRD 50 par value) 3,247.00 142,868
Dividend ordinary shares (94,860 shares at SRD 5 par value) 324.75 30,805,785
Total 30,948,653
Statutory dividend 23,847
Addition to the retained earnings 55,001
Net profit 2011 31,027,501

Surinaamse Brouwerij NV Jaarverslag 2012 37
Proposed distribution of earnings 2012The Management Team proposed the following distribution of earnings after deduction of the statutory profit sha-
ring, to the General Meeting of Shareholders, for approval.
This proposed distribution of earnings is not yet entered in the financial statements at issue.
In total
SRD
Net profit 2012 34,406,334
Less:
Statutory profit distribution preferential shares -132
Statutory profit distribution ordinary shares -23,715
At disposal for the General Meeting of Shareholders 34,382,487
The executive board proposed the following distribution of earnings of the net profit 2012, to be available to the
shareholders as follows:
In totaal
SRD
Cash dividend of SRD 3,577 to 44 preferential shares at SRD 50 par value 157,388
Cash dividend of SRD 357.75 to 94,860 equity shares at SRD 5 par value 33,936,165
Addition to retained earnings 288,934
Total 34,382,487

Surinaamse Brouwerij NV Jaarverslag 201238
INDEPENDENT AUDITOR’S REPORTIntroductionWe have audited the accompanying financial
statements 2012 of Surinaamse Brouwerij NV, included
on page 55 up to and inclusive of page 76 of the
annual report. These financial statements comprise the
consolidated and company balance sheet as at December
31, 2012, the consolidated and company income
statement, the consolidated statement of changes in
equity and the consolidated statement of cash flows
for the year ended December 31, 2012 and the notes,
comprising a summary of the accounting policies and
other explanatory information.
Management’s responsibility Management is responsible for the preparation and
fair presentation of these financial statements and for
the preparation of the management board report in
accordance with generally accepted accounting
principles. Furthermore management is responsible
for such internal control as it determines is necessary
to enable the preparation of the financial statements
that are free from material misstatement, whether due
to fraud or error.
Auditors’ responsibilityOur responsibility is to express an opinion on these
financial statements based on our audit. We conducted
our audit in accordance with generally accepted
auditing standards. These standards require that
we comply with ethical requirements and plan and
perform the audit to obtain reasonable assurance
about whether the financial statements are free of
material misstatement.
An audit involves performing procedures to obtain
audit evidence about the amounts and disclosures
in the financial statements. The procedures selected
depend on the auditors’ judgment, including the
assessment of the risks of material misstatement of the
financial statements, whether due to fraud or error.
In making those risk assessments, the auditor considers
internal control relevant to the entity’s preparation
and fair presentation of the financial statements in
order to design audit procedures that are appropriate
in the circumstances, but not for the purpose of
expressing an opinion on the effectiveness of the entity’s
internal control. An audit also includes evaluating the
appropriateness of accounting policies used and the
reasonableness of accounting estimates made by
management, as well as eval ating the overall
presentation of the financial statements.
We believe that the audit evidence we have obtained
is sufficient and appropriate to provide a basis for our
audit opinion.
Opinion with respect to the financial statementsIn our opinion, the financial statements give a true
and fair view of the financial position of Surinaamse
Brouwerij NV, as at December 31, 2012, and of its result
and cash flows for the year then ended in accordance
with generally accepted principles for financial
reporting.
Paramaribo, May 31, 2013
for BDO Assurance N.V.
W.K. Achthoven RA
Partner
Aan: de Algemene Vergadering van Aandeelhouders van Surinaamse Brouwerij NV

Surinaamse Brouwerij NV Jaarverslag 2012 39
Colofon
Surinaamse Brouwerij NVBrouwerijweg 1
PO BOx 1854
Paramaribo-Suriname
Telefoon: (597) 402255
Fax: (597) 404093
www.parbobier.com
Tekst / TextSurinaamse Brouwerij NV
BDO Assurance N.V.
Grafisch Ontwerp / Graphic designSpang Makandra Studio NV
Paramaribo-Suriname
Fotografie / PhotographyCollectie Surinaamse Brouwerij NV
Druk / PrintingQuick O‘ Print


![Huisstijl brouwerij 't_ij[1]](https://img.pdfslide.net/doc/110x75/55c0fc03bb61ebfe108b45b1/huisstijl-brouwerij-tij1.jpg)