Embed Size (px)
Citation preview
General Public Release
Closing the Nat Cat protection gap: Jakarta
General Public Release
ICRM S
emina
r 201
4
General Public Release
Surendra Kumar Singupalli | ICRM @ NTU | 10 Oct 2014 2
Agenda
• What is Nat Cat protection gap?
• Nat Cat risk to Jakarta
• Estimation of insured and insurable portfolio
• Assumptions for Nat Cat modeling
• Nat Cat protection gap: Jakarta
ICRM S
emina
r 201
4

General Public Release
Surendra Kumar Singupalli | ICRM @ NTU | 10 Oct 2014 3
0
50
100
150
200
250
300
350
400
450
1970 1975 1980 1985 1990 1995 2000 2005 2010
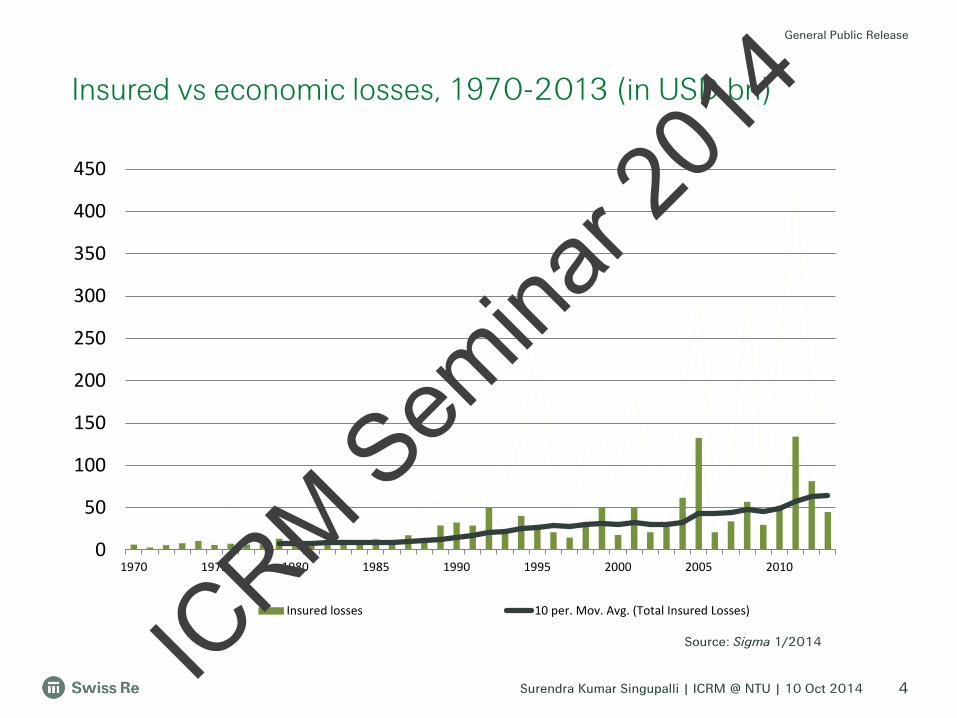
Insured losses Source: Sigma 1/2014
Insured vs economic losses, 1970-2013 (in USD bn)
ICRM S
emina
r 201
4
General Public Release
Surendra Kumar Singupalli | ICRM @ NTU | 10 Oct 2014 4
0
50
100
150
200
250
300
350
400
450
1970 1975 1980 1985 1990 1995 2000 2005 2010
Insured losses 10 per. Mov. Avg. (Total Insured Losses)
Source: Sigma 1/2014
Insured vs economic losses, 1970-2013 (in USD bn)
ICRM S
emina
r 201
4
General Public Release
Surendra Kumar Singupalli | ICRM @ NTU | 10 Oct 2014 5
0
50
100
150
200
250
300
350
400
450
1970 1975 1980 1985 1990 1995 2000 2005 2010
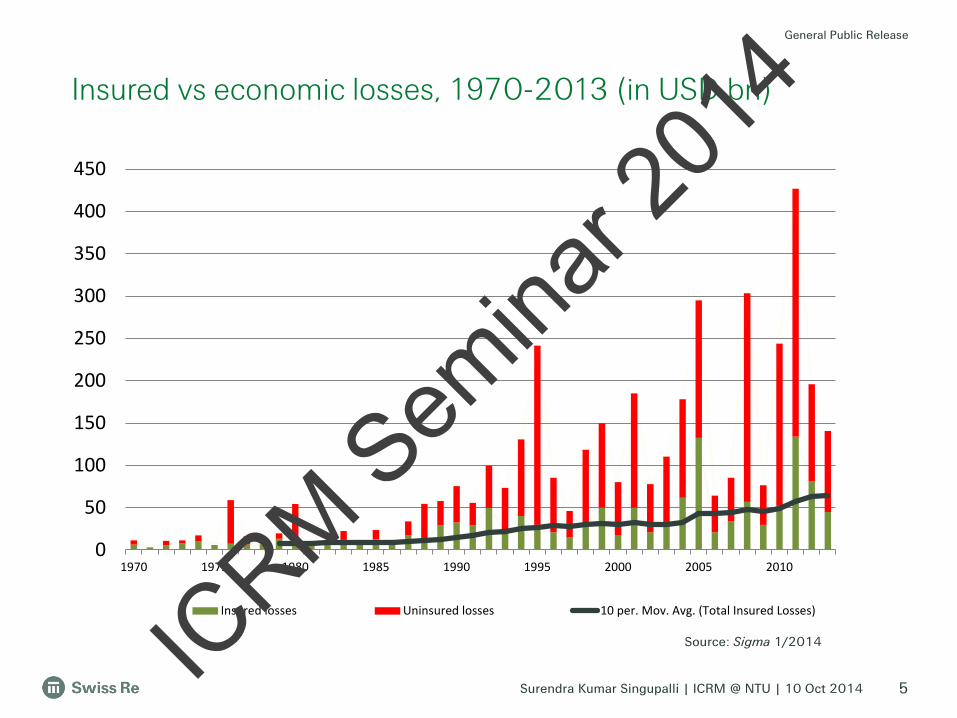
Insured losses Uninsured losses 10 per. Mov. Avg. (Total Insured Losses)
Source: Sigma 1/2014
Insured vs economic losses, 1970-2013 (in USD bn)
ICRM S
emina
r 201
4
General Public Release
Surendra Kumar Singupalli | ICRM @ NTU | 10 Oct 2014 6
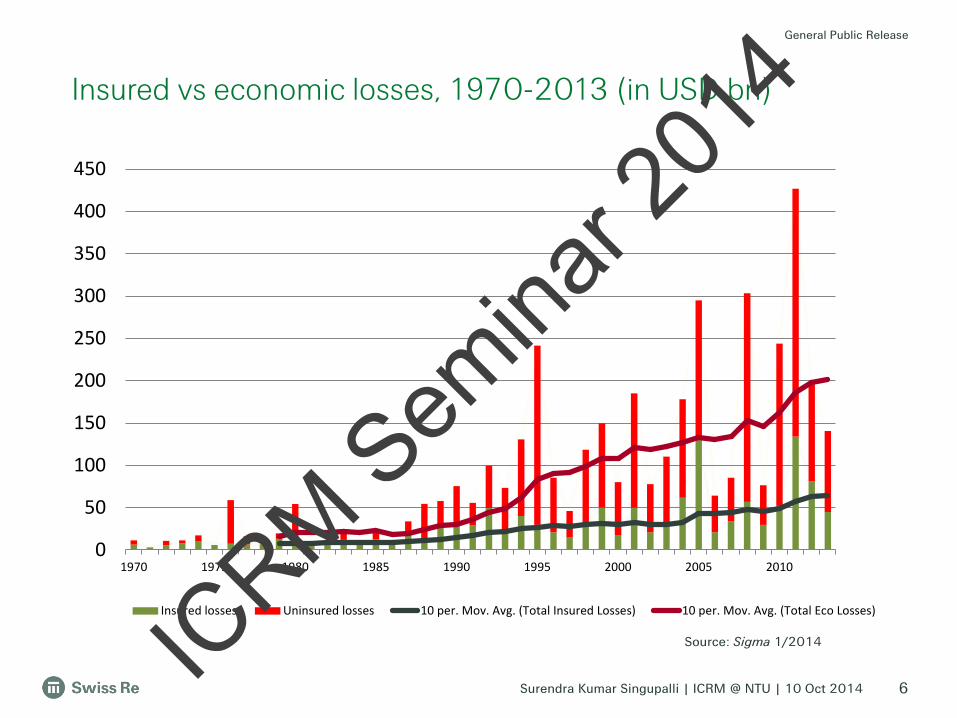
0
50
100
150
200
250
300
350
400
450
1970 1975 1980 1985 1990 1995 2000 2005 2010
Insured losses Uninsured losses 10 per. Mov. Avg. (Total Insured Losses) 10 per. Mov. Avg. (Total Eco Losses)
Source: Sigma 1/2014
Insured vs economic losses, 1970-2013 (in USD bn)
ICRM S
emina
r 201
4
General Public Release
Surendra Kumar Singupalli | ICRM @ NTU | 10 Oct 2014
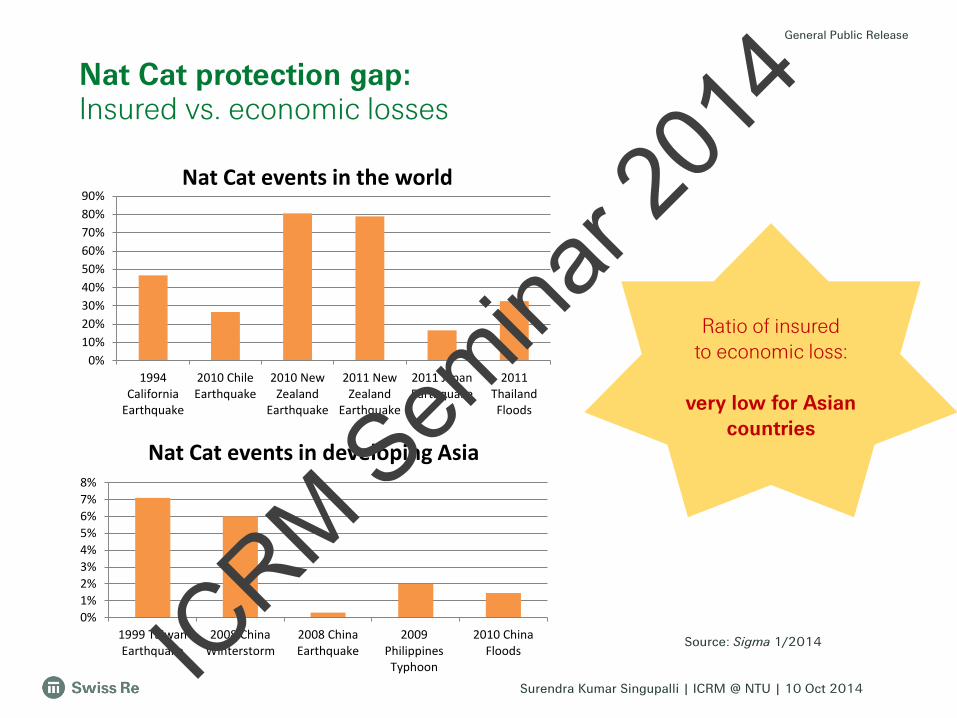
Nat Cat protection gap: Insured vs. economic losses
Ratio of insured to economic loss:
very low for Asian
countries
0%10%20%30%40%50%60%70%80%90%
1994California
Earthquake
2010 ChileEarthquake
2010 NewZealand
Earthquake
2011 NewZealand
Earthquake
2011 JapanEarthquake
2011ThailandFloods
Nat Cat events in the world
0%1%2%3%4%5%6%7%8%
1999 TaiwanEarthquake
2008 ChinaWinterstorm
2008 ChinaEarthquake
2009PhilippinesTyphoon
2010 ChinaFloods
Nat Cat events in developing Asia
Source: Sigma 1/2014 ICRM S
emina
r 201
4
General Public Release
Surendra Kumar Singupalli | ICRM @ NTU | 10 Oct 2014
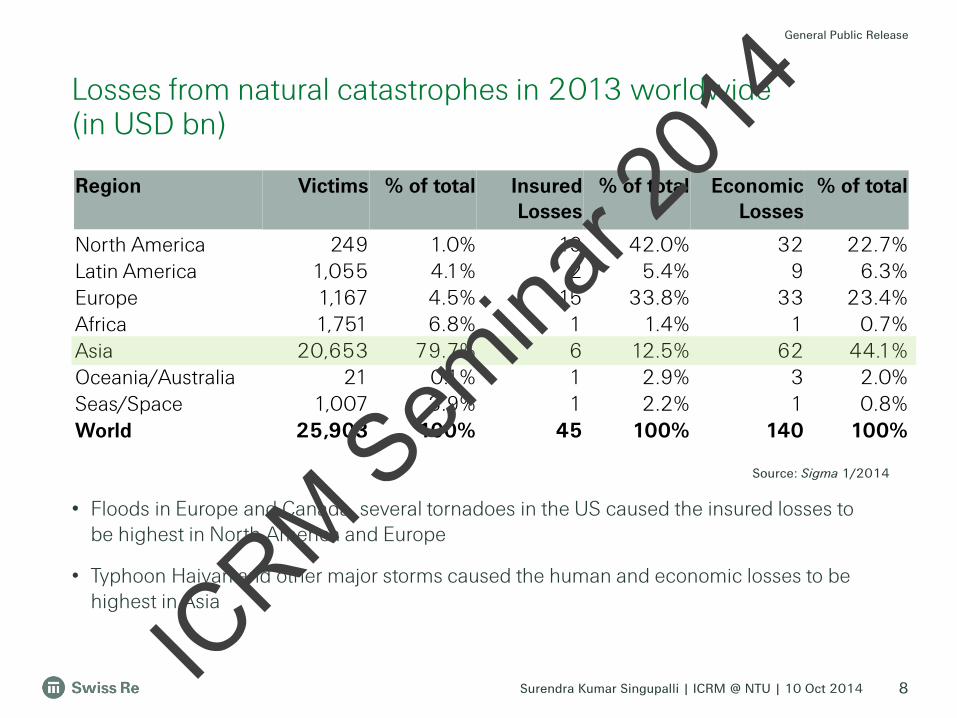
Losses from natural catastrophes in 2013 worldwide (in USD bn)
8
Region Victims % of total Insured Losses
% of total Economic Losses
% of total
North America 249 1.0% 19 42.0% 32 22.7% Latin America 1,055 4.1% 2 5.4% 9 6.3% Europe 1,167 4.5% 15 33.8% 33 23.4% Africa 1,751 6.8% 1 1.4% 1 0.7% Asia 20,653 79.7% 6 12.5% 62 44.1% Oceania/Australia 21 0.1% 1 2.9% 3 2.0% Seas/Space 1,007 3.9% 1 2.2% 1 0.8% World 25,903 100% 45 100% 140 100%
• Floods in Europe and Canada, several tornadoes in the US caused the insured losses to be highest in North America and Europe
• Typhoon Haiyan and other major storms caused the human and economic losses to be highest in Asia
Source: Sigma 1/2014
ICRM S
emina
r 201
4
General Public Release
Surendra Kumar Singupalli | ICRM @ NTU | 10 Oct 2014 9
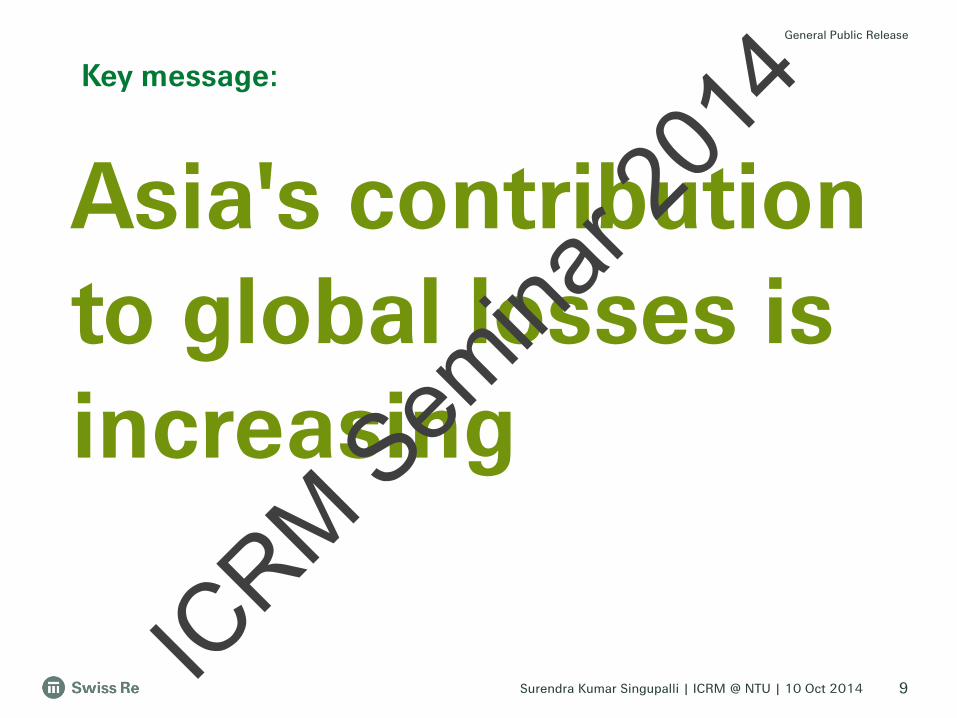
Asia's contribution to global losses is increasing
Key message:
ICRM S
emina
r 201
4

General Public Release
Surendra Kumar Singupalli | ICRM @ NTU | 10 Oct 2014
What's your view on "protection gap"? What is your organization doing about it?
10 ICRM S
emina
r 201
4

General Public Release
Surendra Kumar Singupalli | ICRM @ NTU | 10 Oct 2014 11
Agenda
• What is Nat Cat protection gap?
• Nat Cat risk to Jakarta
• Estimation of insured and insurable portfolio
• Assumptions for Nat Cat modeling
• Nat Cat protection gap: Jakarta
ICRM S
emina
r 201
4

General Public Release
Surendra Kumar Singupalli | ICRM @ NTU | 10 Oct 2014
Jakarta is a major economic driver of Indonesia, accounting for 16.3% of the national GDP.
It is experiencing very rapid urbanisation and population growth.
The city is located in an area exposed to various natural hazards.
Jakarta snapshot
12 IC
RM Sem
inar 2
014
General Public Release
Surendra Kumar Singupalli | ICRM @ NTU | 10 Oct 2014
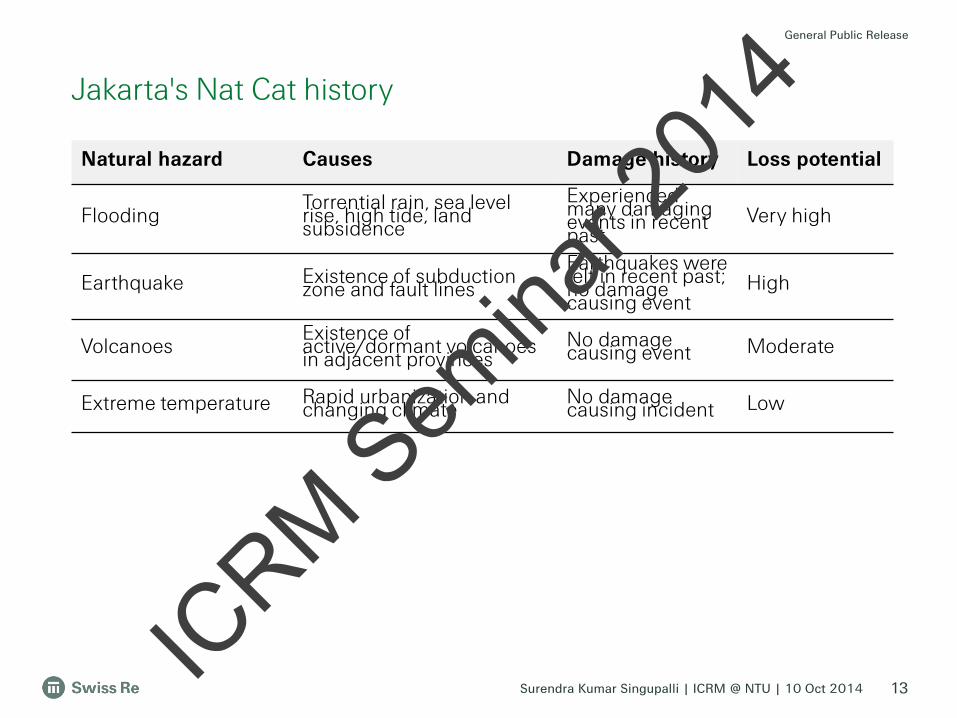
Jakarta's Nat Cat history
13
Natural hazard Causes Damage history Loss potential
Flooding Torrential rain, sea level rise, high tide, land subsidence
Experienced many damaging events in recent past
Very high
Earthquake Existence of subduction zone and fault lines
Earthquakes were felt in recent past; no damage causing event
High
Volcanoes Existence of active/dormant volcanoes in adjacent provinces
No damage causing event Moderate
Extreme temperature Rapid urbanization and changing climate
No damage causing incident Low
ICRM S
emina
r 201
4

General Public Release
Surendra Kumar Singupalli | ICRM @ NTU | 10 Oct 2014 14
Agenda
• What is Nat Cat protection gap?
• Nat Cat risk to Jakarta
• Estimation of insured and insurable portfolio
• Assumptions for Nat Cat modeling
• Nat Cat protection gap: Jakarta
ICRM S
emina
r 201
4
General Public Release
Surendra Kumar Singupalli | ICRM @ NTU | 10 Oct 2014 15
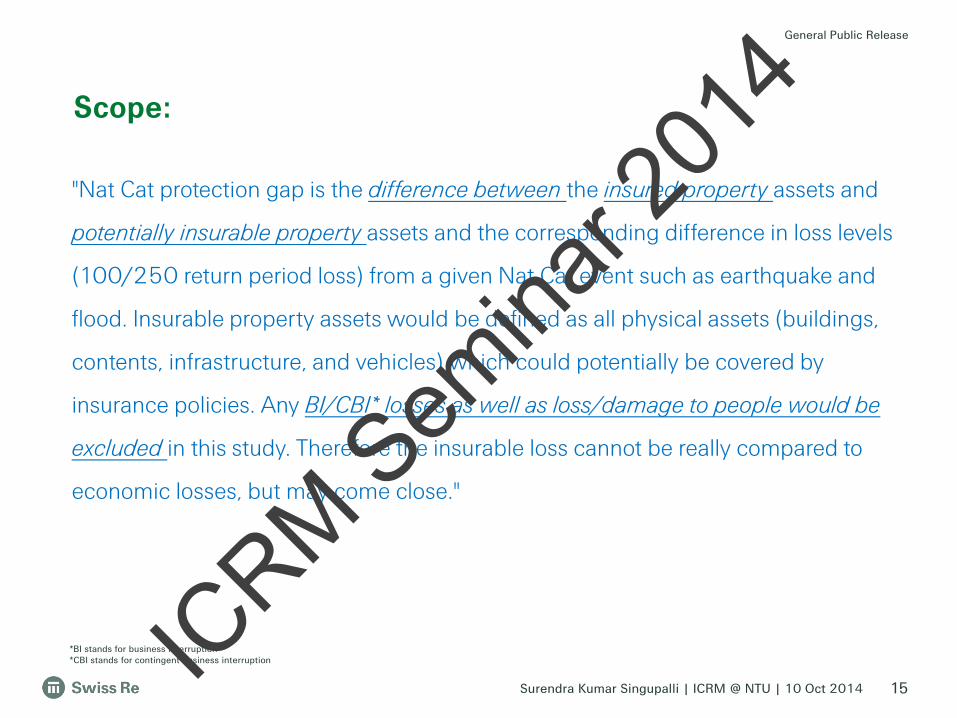
"Nat Cat protection gap is the difference between the insured property assets and
potentially insurable property assets and the corresponding difference in loss levels
(100/250 return period loss) from a given Nat Cat event such as earthquake and
flood. Insurable property assets would be defined as all physical assets (buildings,
contents, infrastructure, and vehicles) which could potentially be covered by
insurance policies. Any BI/CBI* losses as well as loss/damage to people would be
excluded in this study. Therefore the insurable loss cannot be really compared to
economic losses, but may come close."
Scope:
*BI stands for business interruption *CBI stands for contingent business interruption IC
RM Sem
inar 2
014
General Public Release
Surendra Kumar Singupalli | ICRM @ NTU | 10 Oct 2014
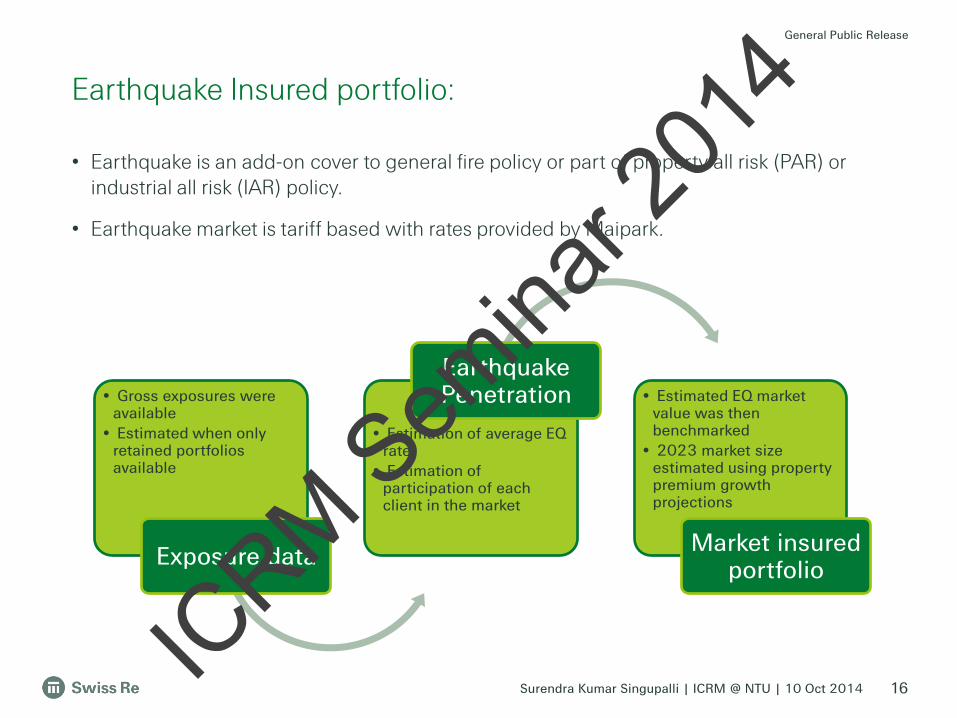
• Earthquake is an add-on cover to general fire policy or part of property all risk (PAR) or industrial all risk (IAR) policy.
• Earthquake market is tariff based with rates provided by Maipark.
Earthquake Insured portfolio:
16
• Gross exposures were available
• Estimated when only retained portfolios available
Exposure data
• Estimation of average EQ rate
• Estimation of participation of each client in the market
Earthquake Penetration • Estimated EQ market
value was then benchmarked
• 2023 market size estimated using property premium growth projections
Market insured portfolio
ICRM S
emina
r 201
4
General Public Release
Surendra Kumar Singupalli | ICRM @ NTU | 10 Oct 2014
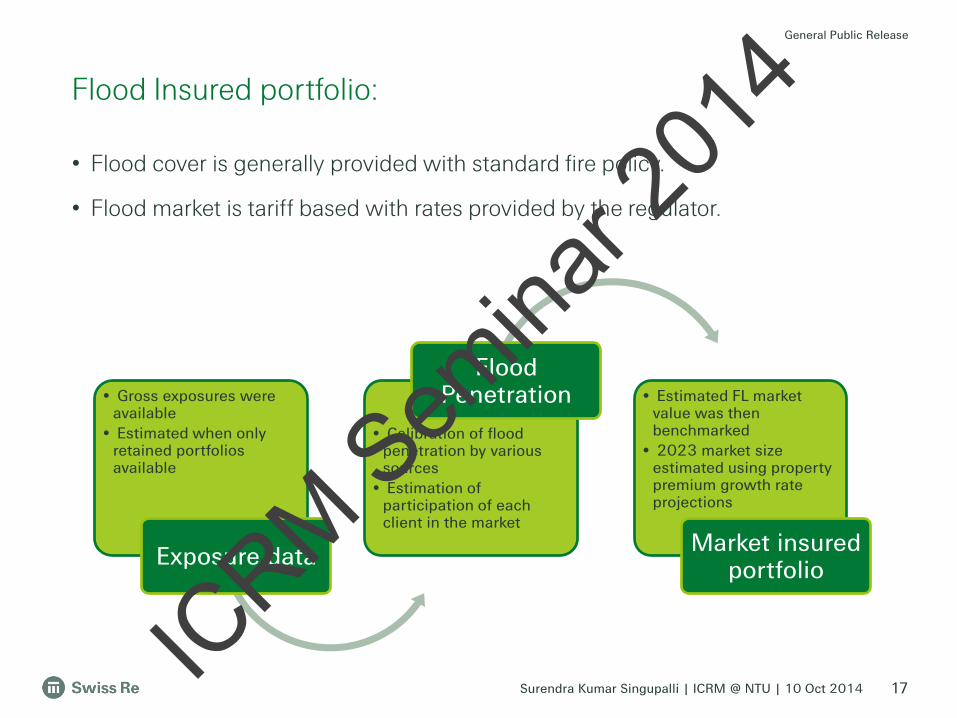
• Flood cover is generally provided with standard fire policy.
• Flood market is tariff based with rates provided by the regulator.
Flood Insured portfolio:
17
• Gross exposures were available
• Estimated when only retained portfolios available
Exposure data
• Calibration of flood penetration by various sources
• Estimation of participation of each client in the market
Flood Penetration • Estimated FL market
value was then benchmarked
• 2023 market size estimated using property premium growth rate projections
Market insured portfolio
ICRM S
emina
r 201
4

General Public Release
Surendra Kumar Singupalli | ICRM @ NTU | 10 Oct 2014
• Initially, available information on number of households, trends in construction industry, real estate trends and other sources were examined. Then, "Capital Stock" concept from the field of economics was used.
• OECD (Organization for Economic Co-operation and Development) defines it as follows:-
– "In the gross capital stock, assets are valued at their "as new" prices regardless of their actual age and condition. In the net capital stock, assets are valued at their market prices. These are lower than their "as new" prices by the amount of accumulated consumption of fixed capital."
• Gross capital stock is widely used as a broad indicator of the productive capacity of a country. Following methods are available:
– Perpetual Inventory Method
– Direct Survey Method
– Balance of Fixed Assets
Insurable portfolio:
18 ICRM S
emina
r 201
4
General Public Release
Surendra Kumar Singupalli | ICRM @ NTU | 10 Oct 2014
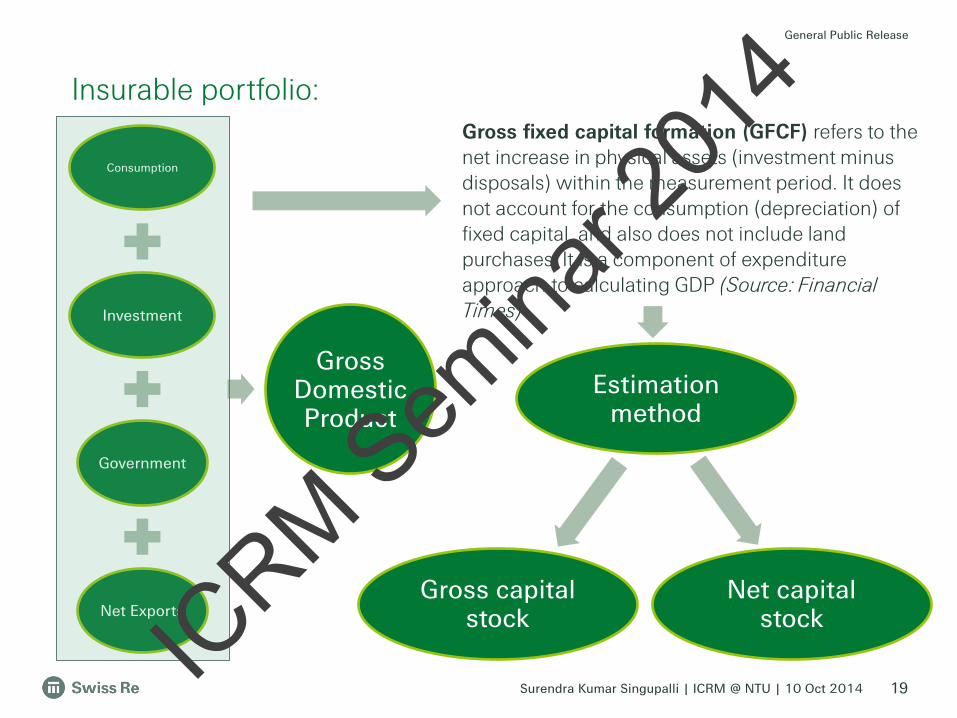
Insurable portfolio:
19
Consumption
Investment
Government
Net Exports
Gross Domestic Product
Gross fixed capital formation (GFCF) refers to the net increase in physical assets (investment minus disposals) within the measurement period. It does not account for the consumption (depreciation) of fixed capital, and also does not include land purchases. It is a component of expenditure approach to calculating GDP (Source: Financial Times)
Estimation method
Gross capital stock
Net capital stock IC
RM Sem
inar 2
014
General Public Release
Surendra Kumar Singupalli | ICRM @ NTU | 10 Oct 2014
• Gross fixed capital stock estimates were used as initial input.
• GDP growth assumptions were used to project the exposures for desired period.
• Jakarta's contribution to this was estimated based on GDP contribution over the years.
• Consumer price index movements are also taken into consideration.
• Ratio of insured to insurable portfolio was computed and sense check was done.
Insurable portfolio:
20 ICRM S
emina
r 201
4

General Public Release
Surendra Kumar Singupalli | ICRM @ NTU | 10 Oct 2014 21
Agenda
• What is Nat Cat protection gap?
• Nat Cat risk to Jakarta
• Estimation of insured and insurable portfolio
• Assumptions for Nat Cat modeling
• Nat Cat protection gap: Jakarta
ICRM S
emina
r 201
4
General Public Release
Surendra Kumar Singupalli | ICRM @ NTU | 10 Oct 2014
• Exposures and Modeling:
– Flood TSI was considered in the analyses as reported by the client.
– Average market split for occupancy and coverage was assumed.
– Average EQ rate in the market was assumed.
– Jakarta property premium growth assumed to be same as for Indonesia as whole.
– Assumed that growth of capital stock would be same as GDP growth.
– Assumed that future contribution of Jakarta to Indonesia GDP would increase.
– In future, residential and commercial participation in insurance is assumed to increase. BI take up rate for commercial and industrial risks are assumed to increase.
– Pragmatic approach was used to model flood. Flood protection measures are not taken into account as the study was interested in 100 and 250 year losses; at such levels most of the protection measures fail.
Assumptions
22 ICRM S
emina
r 201
4
General Public Release
Surendra Kumar Singupalli | ICRM @ NTU | 10 Oct 2014 23
Agenda
• What is Nat Cat protection gap?
• Nat Cat risk to Jakarta
• Estimation of insured and insurable portfolio
• Assumptions for Nat Cat modeling
• Nat Cat protection gap: Jakarta
ICRM S
emina
r 201
4
General Public Release
Surendra Kumar Singupalli | ICRM @ NTU | 10 Oct 2014
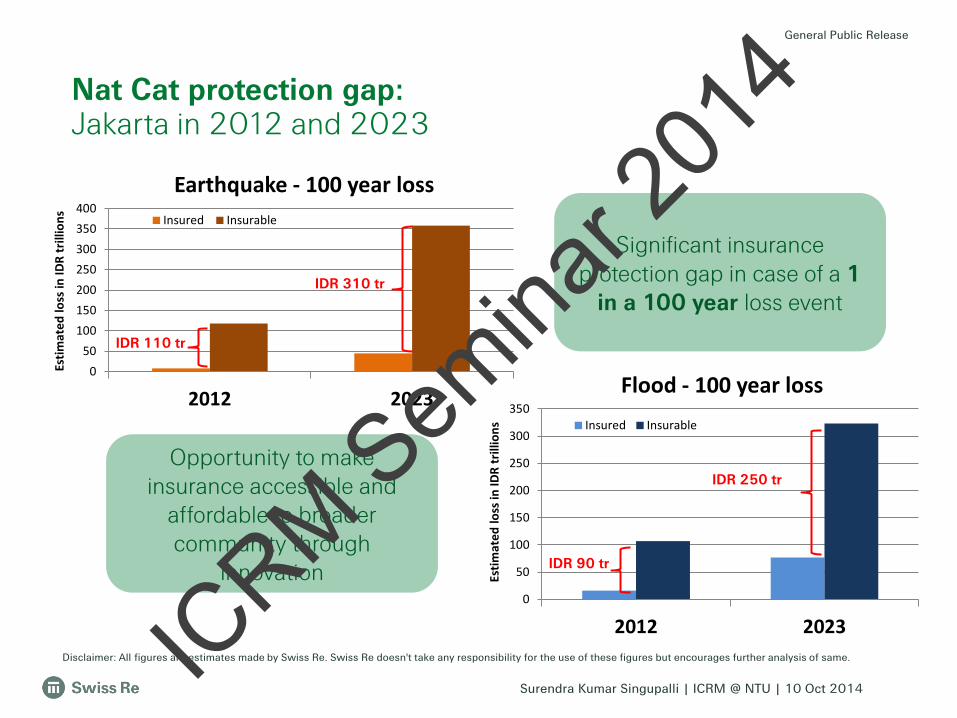
Nat Cat protection gap: Jakarta in 2012 and 2023
050
100150200250300350400
2012 2023
Estim
ated
loss
in ID
R tr
illio
ns
Earthquake - 100 year loss Insured Insurable
0
50
100
150
200
250
300
350
2012 2023
Estim
ated
loss
in ID
R tr
illio
ns
Flood - 100 year loss Insured Insurable
Opportunity to make insurance accessible and
affordable to broader community through
innovation
Significant insurance protection gap in case of a 1
in a 100 year loss event
IDR 110 tr
IDR 310 tr
IDR 90 tr
IDR 250 tr
Disclaimer: All figures are estimates made by Swiss Re. Swiss Re doesn't take any responsibility for the use of these figures but encourages further analysis of same. ICRM S
emina
r 201
4
General Public Release
Surendra Kumar Singupalli | ICRM @ NTU | 10 Oct 2014
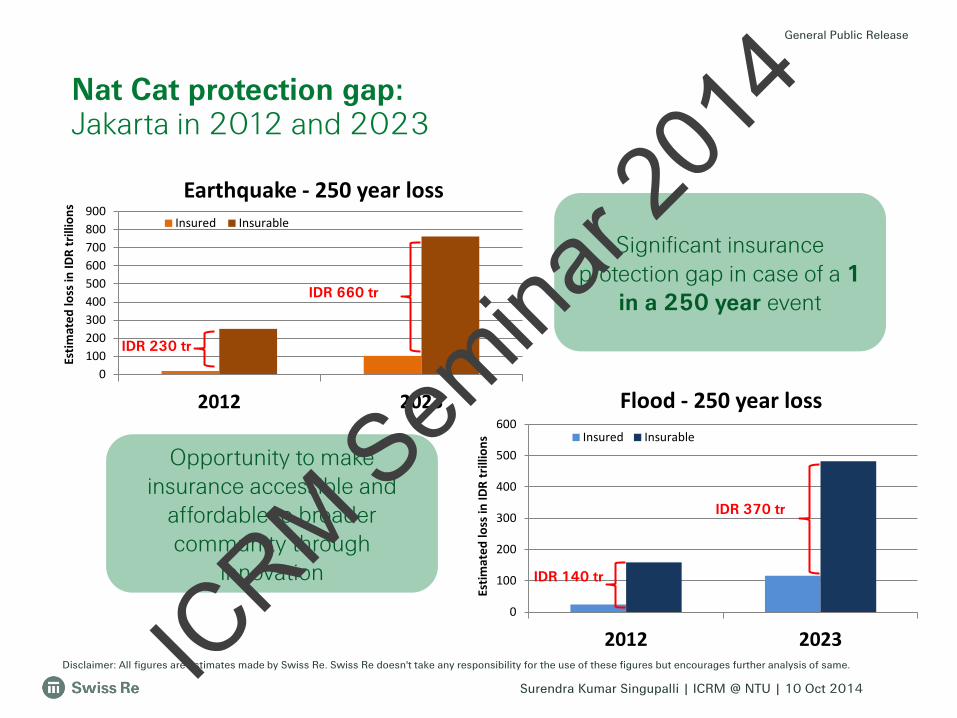
Nat Cat protection gap: Jakarta in 2012 and 2023
0100200300400500600700800900
2012 2023
Estim
ated
loss
in ID
R tr
illio
ns Earthquake - 250 year loss
Insured Insurable
0
100
200
300
400
500
600
2012 2023
Estim
ated
loss
in ID
R tr
illio
ns
Flood - 250 year loss Insured Insurable
Significant insurance protection gap in case of a 1
in a 250 year event
IDR 230 tr
IDR 660 tr
IDR 140 tr
IDR 370 tr
Opportunity to make insurance accessible and
affordable to broader community through
innovation
Disclaimer: All figures are estimates made by Swiss Re. Swiss Re doesn't take any responsibility for the use of these figures but encourages further analysis of same. ICRM S
emina
r 201
4

General Public Release
Surendra Kumar Singupalli | ICRM @ NTU | 10 Oct 2014
The extent of the damage caused by the most serious natural catastrophe is the 3rd highest worldwide for substantial damage and highest worldwide for moderate damage
DK/ NA No damage at all Minor damage; some repairs were needed Moderate damage; a part of your home was not
habitable Substantial damage; you had to relocate
temporarily or permanently
The protection gap in Jakarta is high. So is the perception of natural catastrophe risks.
* The "Risk perception survey" was conducted as part of the 150 -year anniversary, surveying 19 countries and 15 cities in 4 regions. The results are not based on hard data, but on perceptions of risk of the surveyed sample. Survey samples varied between 1'013 – 2'186 for countries, and 250 – 335 for cities. For more results: http://150.swissre.com/dialogue/riskwindow 26
Risk perception survey: Jakarta*
% of respondents, surveyed in Jakarta whose neighbourhood was hit by a natural catastrophe
A powerful storm A major flood A strong earthquake/tsunami A major draught Another natural catastrophe (i.e. major wildfire)
In Jakarta, perceived risk of flood and strong earthquake/ tsunami is highest worldwide. 33% of Indonesians say the biggest threat to their country comes from natural catastrophes. Many are worried that
things will get worse.
ICRM S
emina
r 201
4
General Public Release
Surendra Kumar Singupalli | ICRM @ NTU | 10 Oct 2014
1. Improve risk mitigation measures such as flood defences, evacuation and rescue procedures, early warning systems
2. Upgrade building codes and land-use plans based on hazard level (seismicity, soil quality, flood zones) to reduce exposure in high risk areas
3. Educate people, businessmen and public authorities to understand the concept and the value of insurance.
4. Making insurance accessible and affordable to a larger part of the population, businesses, municipalities, provincial and federal gov't.
5. Innovation in terms of risk transfer solutions (new products)
6. Improve the quality of information about physical assets: location, construction standard, occupancy, replacement value, etc.
How to close this Nat Cat protection gap
27 ICRM S
emina
r 201
4
General Public Release
Surendra Kumar Singupalli | ICRM @ NTU | 10 Oct 2014 28
Pro-active support needed by - government/industry/academia to close this protection gap
Key message:
ICRM S
emina
r 201
4
General Public Release
Surendra Kumar Singupalli | ICRM @ NTU | 10 Oct 2014 29 ICRM S
emina
r 201
4

General Public Release
Surendra Kumar Singupalli | ICRM @ NTU | 10 Oct 2014
Legal notice
30
©2014 Swiss Re. All rights reserved. You are not permitted to create any modifications or derivative works of this presentation or to use it for commercial or other public purposes without the prior written permission of Swiss Re.
The information and opinions contained in the presentation are provided as at the date of the presentation and are subject to change without notice. Although the information used was taken from reliable sources, Swiss Re does not accept any responsibility for the accuracy or comprehensiveness of the details given. All liability for the accuracy and completeness thereof or for any damage or loss resulting from the use of the information contained in this presentation is expressly excluded. Under no circumstances shall Swiss Re or its Group companies be liable for any financial or consequential loss relating to this presentation.
ICRM S
emina
r 201
4