Embed Size (px)
DESCRIPTION
Â
Citation preview
C
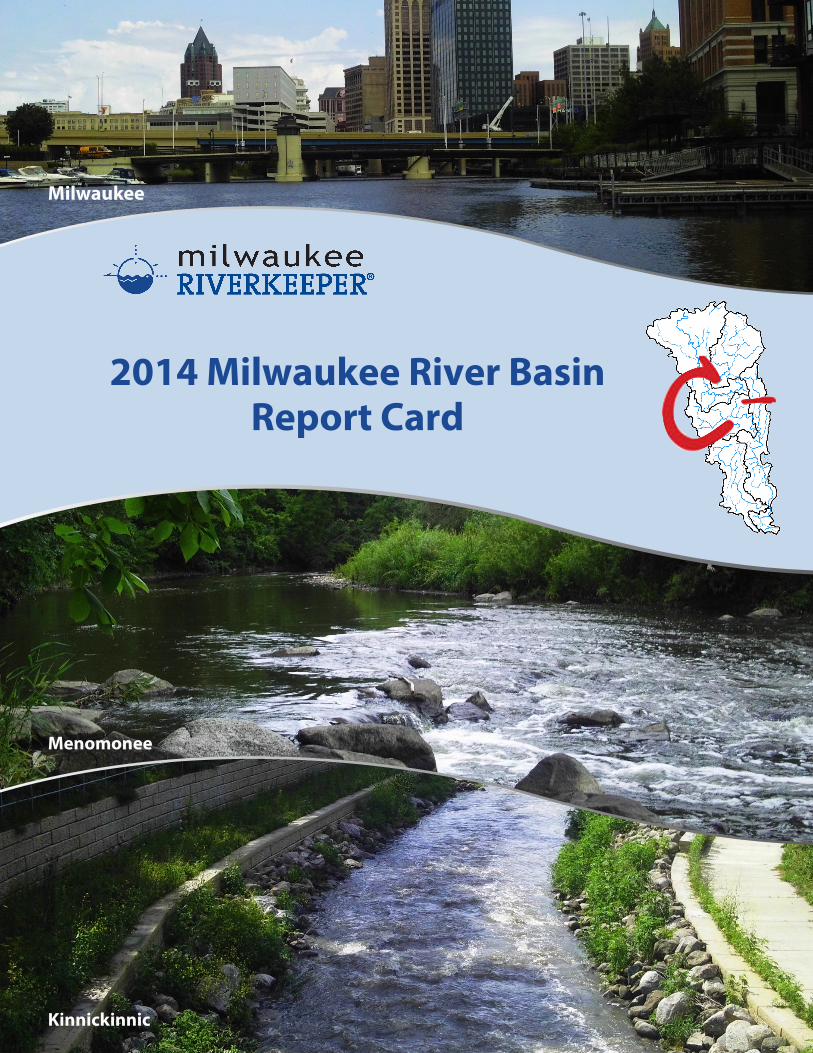
2014 Milwaukee River Basin Report Card
Milwaukee
Kinnickinnic
Menomonee
Intr
oduc
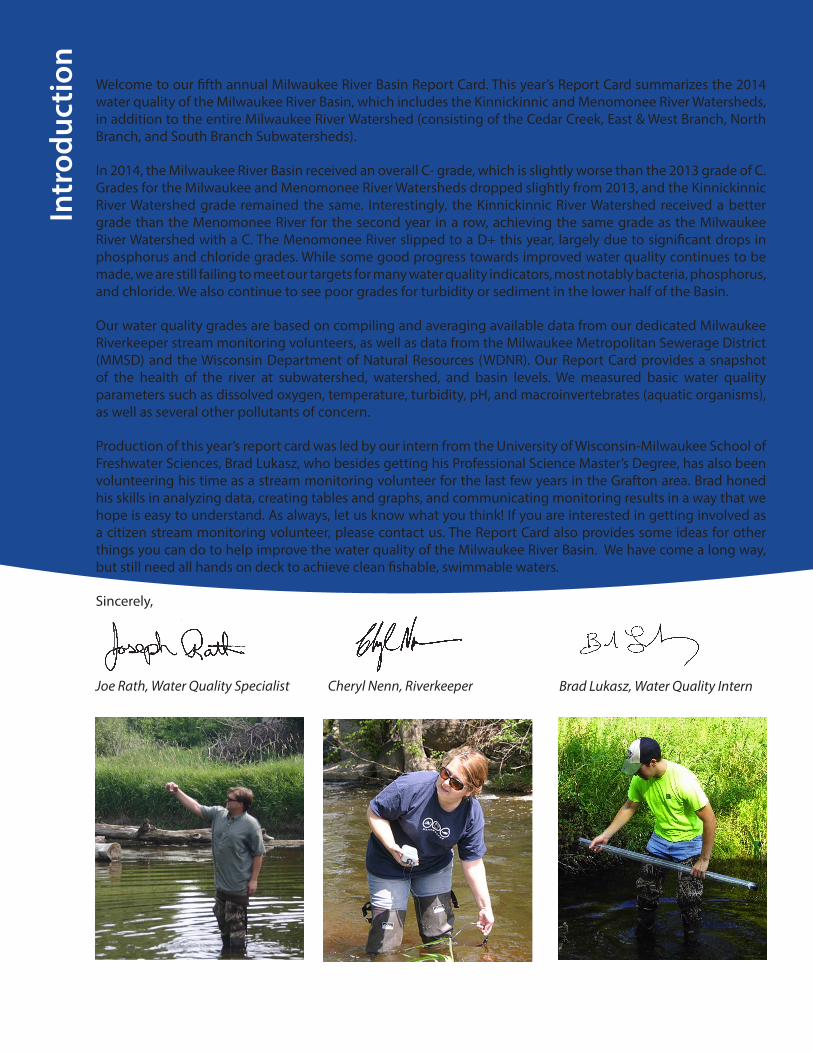
tion Dear Friend of the River,
Welcome to our fifth annual Milwaukee River Basin Report Card. This year’s Report Card summarizes the 2014 water quality of the Milwaukee River Basin, which includes the Kinnickinnic and Menomonee River Watersheds, in addition to the entire Milwaukee River Watershed (consisting of the Cedar Creek, East & West Branch, North Branch, and South Branch Subwatersheds).
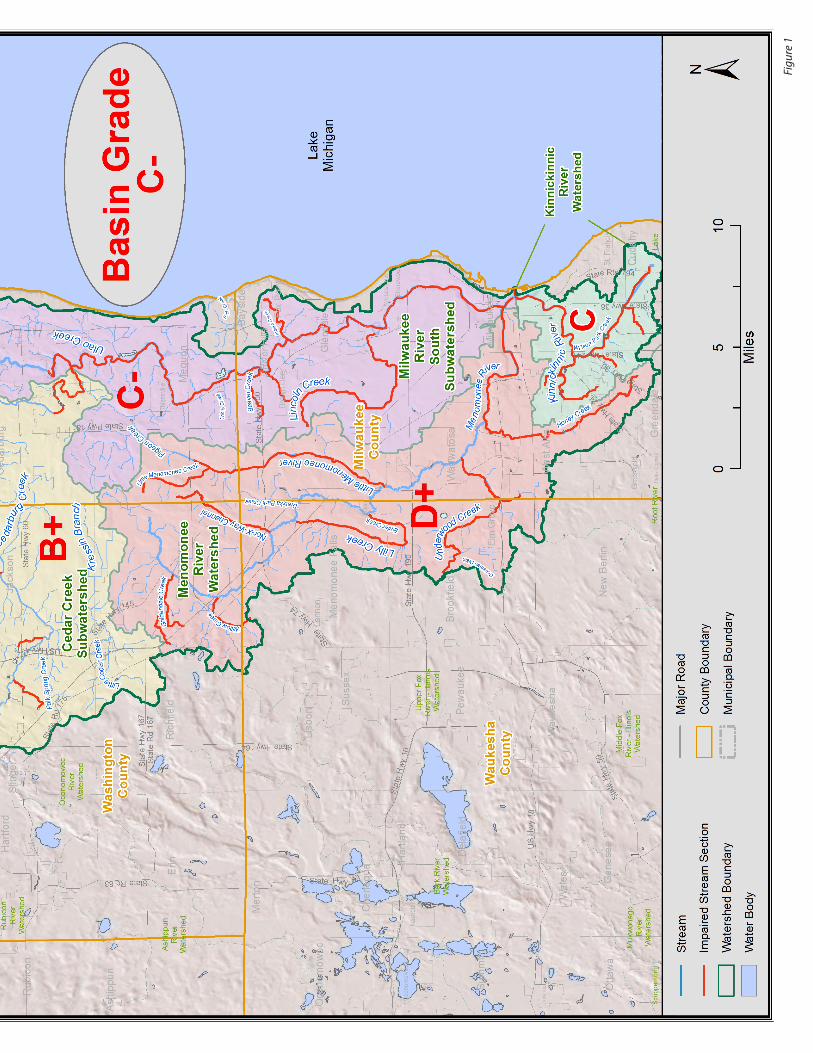
In 2014, the Milwaukee River Basin received an overall C- grade, which is slightly worse than the 2013 grade of C. Grades for the Milwaukee and Menomonee River Watersheds dropped slightly from 2013, and the Kinnickinnic River Watershed grade remained the same. Interestingly, the Kinnickinnic River Watershed received a better grade than the Menomonee River for the second year in a row, achieving the same grade as the Milwaukee River Watershed with a C. The Menomonee River slipped to a D+ this year, largely due to significant drops in phosphorus and chloride grades. While some good progress towards improved water quality continues to be made, we are still failing to meet our targets for many water quality indicators, most notably bacteria, phosphorus, and chloride. We also continue to see poor grades for turbidity or sediment in the lower half of the Basin.
Our water quality grades are based on compiling and averaging available data from our dedicated Milwaukee Riverkeeper stream monitoring volunteers, as well as data from the Milwaukee Metropolitan Sewerage District (MMSD) and the Wisconsin Department of Natural Resources (WDNR). Our Report Card provides a snapshot of the health of the river at subwatershed, watershed, and basin levels. We measured basic water quality parameters such as dissolved oxygen, temperature, turbidity, pH, and macroinvertebrates (aquatic organisms), as well as several other pollutants of concern.
Production of this year’s report card was led by our intern from the University of Wisconsin-Milwaukee School of Freshwater Sciences, Brad Lukasz, who besides getting his Professional Science Master’s Degree, has also been volunteering his time as a stream monitoring volunteer for the last few years in the Grafton area. Brad honed his skills in analyzing data, creating tables and graphs, and communicating monitoring results in a way that we hope is easy to understand. As always, let us know what you think! If you are interested in getting involved as a citizen stream monitoring volunteer, please contact us. The Report Card also provides some ideas for other things you can do to help improve the water quality of the Milwaukee River Basin. We have come a long way, but still need all hands on deck to achieve clean fishable, swimmable waters.
Sincerely,
Cheryl Nenn, Riverkeeper Brad Lukasz, Water Quality InternJoe Rath, Water Quality Specialist
What Our Grades Mean 2
Milwaukee River Basin 3
Milwaukee River Basin Map 4
Milwaukee River Watershed 6
Milwaukee River South and Cedar Creek Subwatersheds 8
North Branch and East & West Branch Subwatersheds 10
Menomonee River Watershed 12
Kinnickinnic River Watershed 16
Conductivity and Chloride 20
Turbidity and Temperature 22
Human Bacteroides and Phosphorus 24
Volunteer Monitor Spotlight 26
Ten Ways to Help Protect Water Quality 27
How We Grade Our Water Quality Parameters 28
Table of Contents
Water Quality Monitoring Program at a GlanceWho is monitoring?
90 Volunteer Stream Monitors, Milwaukee Riverkeeper Staff, as well as various MMSD and WDNR staff.
What do we monitor? We monitor water temperature, dissolved oxygen, pH, turbidity, phosphorus, conductivity, chloride, streamflow, bacteria, and macroinvertebrates.
When Do We Monitor?Volunteers collect baseline water quality data monthly from May through October. We install thermistors at most sites which measure temperature hourly. Staff monitor stormwater for bacteria from April through November. Staff and volunteers monitor conductivity and chloride during the winter “road salt” season. MMSD samples year round. WDNR monitors sporadically.
Where do we monitor?
We monitor throughout the Milwaukee River Basin (see watershed and subwatershed maps for locations).
Why do we monitor? We monitor for three primary reasons: to help identify sources of pollution; to help inform permitting and management decisions; and to measure the effectiveness of recently implemented policies and projects. Ultimately, monitoring measures our progress toward attaining the Clean Water Act goals of clean, fishable and swimmable rivers.
How do we monitor? Volunteers monitor the same location monthly, using protocols developed by WDNR and UW-Extension. Some parameter results are instant, while phosphorus, chloride, and bacteria samples are sent to a certified lab for analysis. We primarily monitor stormwater for bacteria where the storm sewer flows into the river. We also monitor whether best management practices are effective in removing pollutants from stormwater runoff.
1
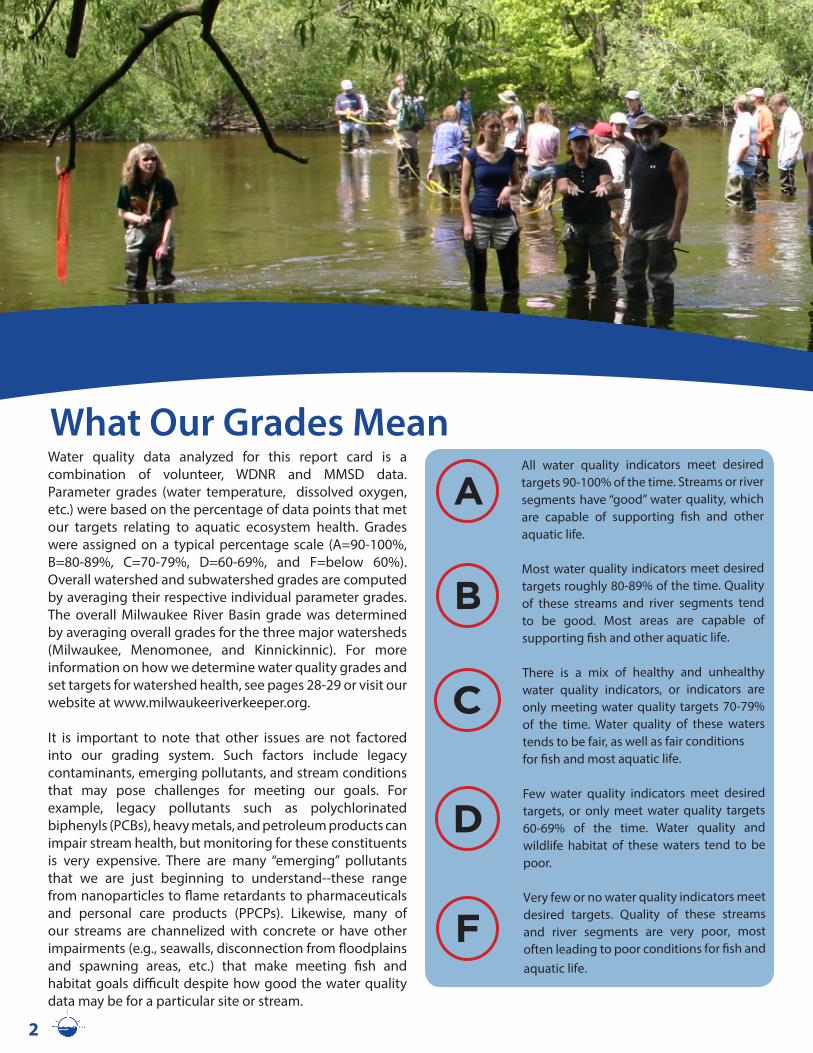
Water quality data analyzed for this report card is a combination of volunteer, WDNR and MMSD data. Parameter grades (water temperature, dissolved oxygen, etc.) were based on the percentage of data points that met our targets relating to aquatic ecosystem health. Grades were assigned on a typical percentage scale (A=90-100%, B=80-89%, C=70-79%, D=60-69%, and F=below 60%). Overall watershed and subwatershed grades are computed by averaging their respective individual parameter grades. The overall Milwaukee River Basin grade was determined by averaging overall grades for the three major watersheds (Milwaukee, Menomonee, and Kinnickinnic). For more information on how we determine water quality grades and set targets for watershed health, see pages 28-29 or visit our website at www.milwaukeeriverkeeper.org.
It is important to note that other issues are not factored into our grading system. Such factors include legacy contaminants, emerging pollutants, and stream conditions that may pose challenges for meeting our goals. For example, legacy pollutants such as polychlorinated biphenyls (PCBs), heavy metals, and petroleum products can impair stream health, but monitoring for these constituents is very expensive. There are many “emerging” pollutants that we are just beginning to understand--these range from nanoparticles to flame retardants to pharmaceuticals and personal care products (PPCPs). Likewise, many of our streams are channelized with concrete or have other impairments (e.g., seawalls, disconnection from floodplains and spawning areas, etc.) that make meeting fish and habitat goals difficult despite how good the water quality data may be for a particular site or stream.
All water quality indicators meet desired targets 90-100% of the time. Streams or river segments have “good” water quality, which are capable of supporting fish and other aquatic life.
Most water quality indicators meet desired targets roughly 80-89% of the time. Quality of these streams and river segments tend to be good. Most areas are capable of supporting fish and other aquatic life.
There is a mix of healthy and unhealthy water quality indicators, or indicators are only meeting water quality targets 70-79% of the time. Water quality of these waters tends to be fair, as well as fair conditions for fish and most aquatic life.
Few water quality indicators meet desired targets, or only meet water quality targets 60-69% of the time. Water quality and wildlife habitat of these waters tend to be poor.
Very few or no water quality indicators meet desired targets. Quality of these streams and river segments are very poor, most often leading to poor conditions for fish and
aquatic life.
What Our Grades Mean
2
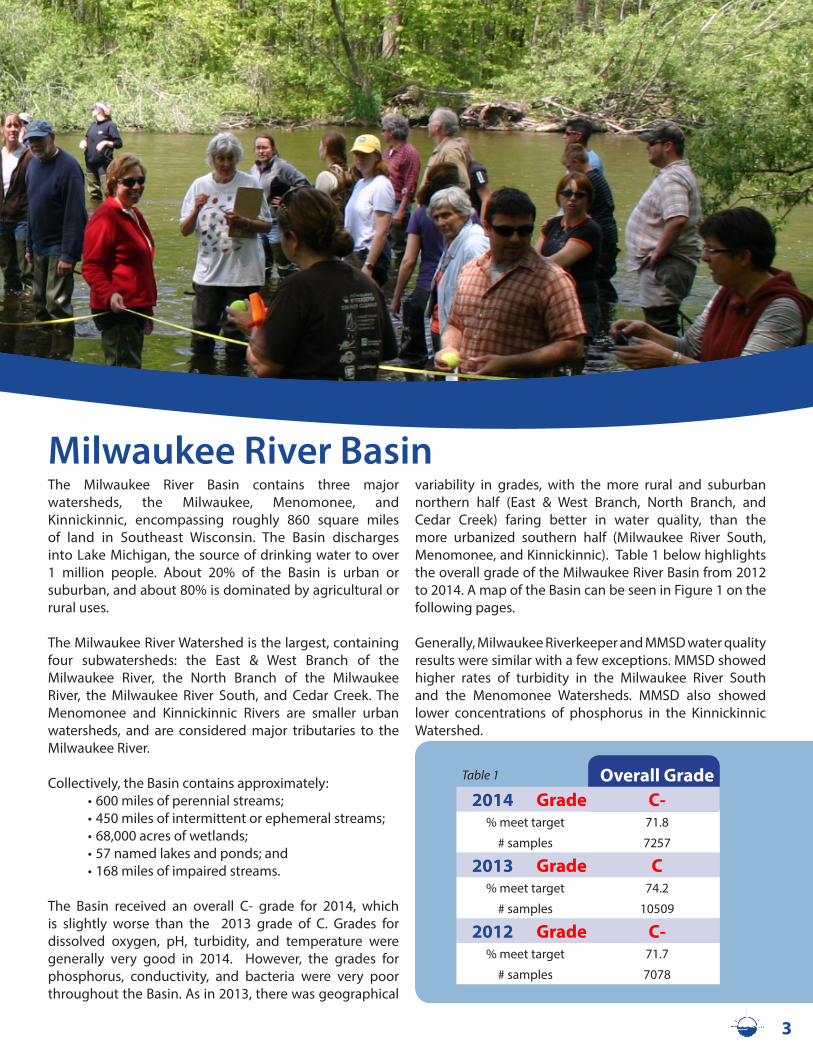
The Milwaukee River Basin contains three major watersheds, the Milwaukee, Menomonee, and Kinnickinnic, encompassing roughly 860 square miles of land in Southeast Wisconsin. The Basin discharges into Lake Michigan, the source of drinking water to over 1 million people. About 20% of the Basin is urban or suburban, and about 80% is dominated by agricultural or rural uses.
The Milwaukee River Watershed is the largest, containing four subwatersheds: the East & West Branch of the Milwaukee River, the North Branch of the Milwaukee River, the Milwaukee River South, and Cedar Creek. The Menomonee and Kinnickinnic Rivers are smaller urban watersheds, and are considered major tributaries to the Milwaukee River.
Collectively, the Basin contains approximately:•600 miles of perennial streams;•450 miles of intermittent or ephemeral streams;•68,000 acres of wetlands; •57 named lakes and ponds; and•168 miles of impaired streams.
The Basin received an overall C- grade for 2014, which is slightly worse than the 2013 grade of C. Grades for dissolved oxygen, pH, turbidity, and temperature were generally very good in 2014. However, the grades for phosphorus, conductivity, and bacteria were very poor throughout the Basin. As in 2013, there was geographical
variability in grades, with the more rural and suburban northern half (East & West Branch, North Branch, and Cedar Creek) faring better in water quality, than the more urbanized southern half (Milwaukee River South, Menomonee, and Kinnickinnic). Table 1 below highlights the overall grade of the Milwaukee River Basin from 2012 to 2014. A map of the Basin can be seen in Figure 1 on the following pages.
Generally, Milwaukee Riverkeeper and MMSD water quality results were similar with a few exceptions. MMSD showed higher rates of turbidity in the Milwaukee River South and the Menomonee Watersheds. MMSD also showed lower concentrations of phosphorus in the Kinnickinnic Watershed.
Table 1 Overall Grade2014 Grade C-
% meet target 71.8
# samples 7257
2013 Grade C% meet target 74.2
# samples 10509
2012 Grade C-% meet target 71.7
# samples 7078
Milwaukee River Basin
3
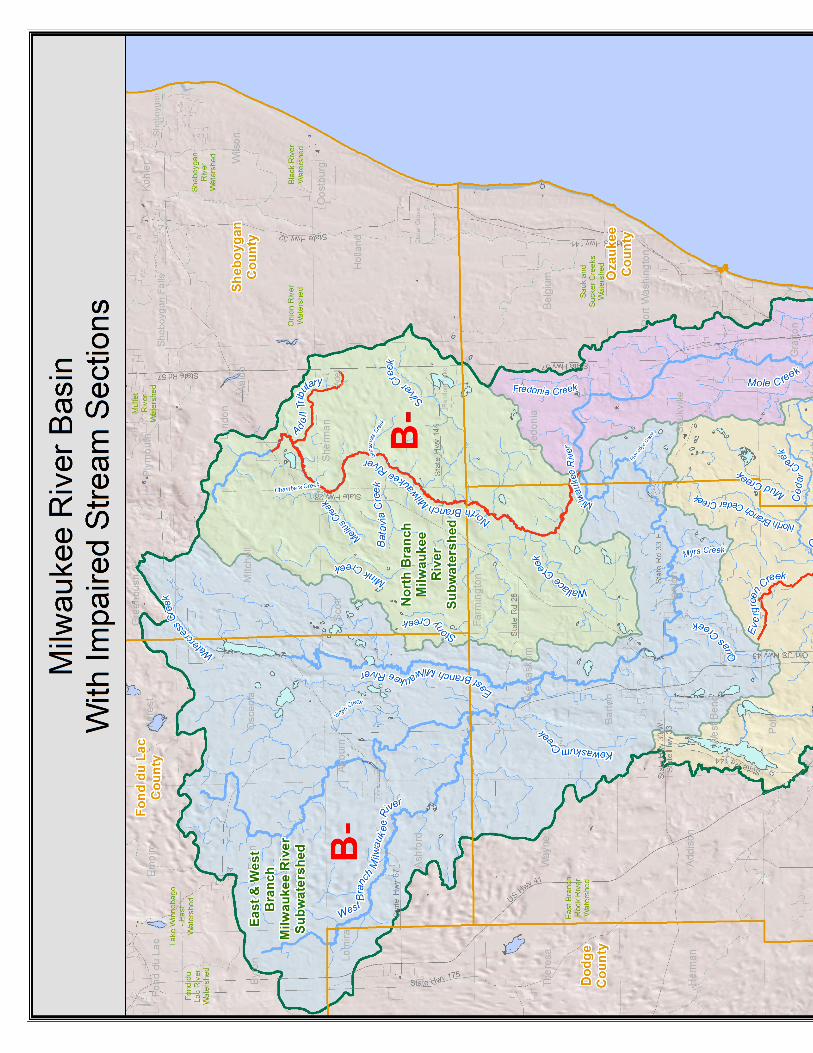
Figu
re 1
Counties Dodge Fond du Lac Milwaukee Ozaukee Sheboygan Washington
Communities Adell Bayside Brown Deer Campbellsport Cascade Cedarburg Fox Point Fredonia Germantown Glendale Grafton Fredonia Jackson Kewaskum Lyndon Mequon Milwaukee Newburg Random Lake Richfield River HIlls Saukville Shorewood Slinger Thiensville West Bend Whitefish Bay
So how healthy is the Milwaukee River and its tributaries? The Milwaukee River Watershed earned an overall water quality grade of a C in 2014, which is a small decline from a C+ grade in 2013. The watershed also received a C grade in 2011 and 2012, which suggests that we are holding pretty steady on overall water quality. The watershed received A grades for temperature and pH. Chloride and dissolved oxygen received A- grades. The chloride grade average for the watershed over the whole year was good, but many of the smaller creeks in the watershed (e.g., Ulao, Lincoln) have chloride levels exceeding what is considered safe for fish during winter and early spring months. This is a concern because too much chloride can be toxic to fish and other aquatic life.
The turbidity grade, which looks at the cloudiness or amount of suspended sediment in the water, was a D+ overall for the entire watershed. The northern subwatersheds all received A grades, but the Milwaukee River South Subwatershed D- grade drags down the overall watershed grade for turbidity. This is because the southern monitoring sites have lower water quality and there were also more monitoring sites and samples taken in the Milwaukee River South Subwatershed than in the 3 northern subwatersheds combined.
The watershed overall continues to get failing grades for phosphorus, receiving an F grade in 2014, as was the case in the last several years. The Milwaukee River South, Milwaukee River East & West Branch, and the Milwaukee River North Branch Subwatersheds all received F grades this year, with Cedar Creek receiving a D+. This shows there is a widespread problem with phosphorus or nutrients in our largest watershed, regardless of land use (e.g., urban or rural). Phosphorus is the limiting nutrient in most freshwater ecosystems, and excess phosphorus causes growth of nuisance algae as well as other water quality problems as it is broken down biologically in a stream.
Bacteria data is only available for the southern part of the watershed, and unfortunately, it receives an F grade every year. High levels of bacteria are likely due to agricultural and urban runoff as well as failing sewer infrastructure and septic tanks.
The Milwaukee River Watershed contains a wide variety of land uses. These include forests, grasslands, wetlands, urban, agriculture, and more. A large range of issues and problems can come with such vast differences in land use. In 1987, the International Joint Commission designated the Milwaukee River Estuary, essentially the confluence of our three
Milwaukee River Watershed
6
watersheds before they discharge to Lake Michigan, a Federal Area of Concern (AOC) due to historic modifications of the waterways and a toxic legacy of contamination. The AOC originally included the lower sections of the Milwaukee (3.11 miles), Menomonee (2.98 miles), and Kinnickinnic (2.49 miles) Rivers, the inner and outer harbors, and nearshore Lake Michigan waters. The AOC boundary was expanded considerably upstream in 2008 to capture areas known to have contaminated sediments from several Superfund sites. Boundaries were expanded to include the Milwaukee River upstream to its confluence with Cedar Creek, the lowest 5 miles of Cedar Creek (downstream from Bridge Road), the Menomonee River upstream to its confluence with the Little Menomonee River, and the Little Menomonee River upstream to Brown Deer Road. Designation as an AOC gives the Milwaukee River Estuary priority for funding under several Federal programs, which have helped clean up toxic hot spots of contamination.
Table 2 below shows the grades for the Milwaukee River Watershed for the past 3 years. The following sections break down the water quality and physical characteristics of each of the Milwaukee River’s four subwatersheds in more detail.
7
Table 2OverallGrade
DissolvedOxygen pH Turbidity Water
Temp Phosphorus Conductivity Chloride Bacteria
Milwaukee River Watershed2014 Grade C A- A D+ A F F A- F
% meet target 74.7 93.2 99.8 67.6 100 43.1 5.1 92.1 50.8
# samples 3176 458 454 435 462 450 235 444 238
2013 Grade C+ A A C A F F A F% meet target 77.3 93.9 99.0 74.7 100.0 53.1 7.9 96.6 45.5
# samples 4326 609 597 601 611 548 368 684 308
2012 Grade C A A D A F F C- D+% meet target 75.4 93.7 99.5 65.4 99.8 42.5 5.2 71.4 68.5
# samples 3106 557 549 552 591 188 349 28 292
Macroinvertebrate MonitoringIn 2014, volunteers monitored 12 sites for macrovinvertebrates in the Milwaukee River Watershed, including one location in the Cedar Creek Subwatershed and 11 sites in the Milwaukee River South Subwatershed.
The Cedar Creek site ranked on the low end of the "Fair" range. The Milwaukee River South sites received “Fair” or “Poor” grades, with the average grade for the subwatershed at the very low end of the "Fair" range. Hence, both subwatersheds receive a failing grade for macroinvertebrates.
Milwaukee River South and Cedar Creek SubwatershedsThe Milwaukee River South ranges from portions of the densely urban City of Milwaukee, through the northern suburbs, to mostly rural areas north of Saukville and west of Port Washington in Ozaukee County. It has an area of 154.2 square miles. The Milwaukee River South Subwatershed displays a wide range of water quality, from the impaired waters of the Milwaukee Estuary AOC, to portions of Mole Creek in Ozaukee County, which have been found to support cool to cold water fish species.
In 2014, 28 Milwaukee Riverkeeper volunteers monitored 37 sites in the Milwaukee River South Subwatershed. MMSD monitored 14 locations, contributing nearly 2,000 data points to our analysis. The overall grade has not changed much since 2010. The 2014 grade was a C-, just as it was in 2011 and 2012. The grade was a C in 2010 and 2013.
The Cedar Creek Subwatershed comprises an area of 128 square miles. It is primarily a rural watershed encompassing portions of the cities of Cedarburg and Jackson, and borders the northern suburbs in Ozaukee
and Washington Counties. The wetlands found in the Cedarburg Bog State Natural Area and the Jackson Marsh State Wildlife Area provide very important habitat for fish species and other wildlife. The lower 5 miles of Cedar Creek, before it discharges into the Milwaukee River, contains a Superfund site with PCBs from former industrial activities of Mercury Marine and Amcast. Clean up efforts that have been stalled for the better part of a decade are finally starting up again.
In 2014, 7 volunteers monitored 7 locations within the Cedar Creek Subwatershed. MMSD does not monitor the Cedar Creek Subwatershed because it is outside of their service area. Dissolved oxygen, water temperature, pH, and turbidity parameters scored A’s. However, phosphorus received a D+ with only 16 of 23 samples meeting the current standard.
Tables 3 and 4 list the land use percentages and some notable streams in these watersheds. A map and a table listing the grades can be viewed on the following page in Figure 3 and Table 5.
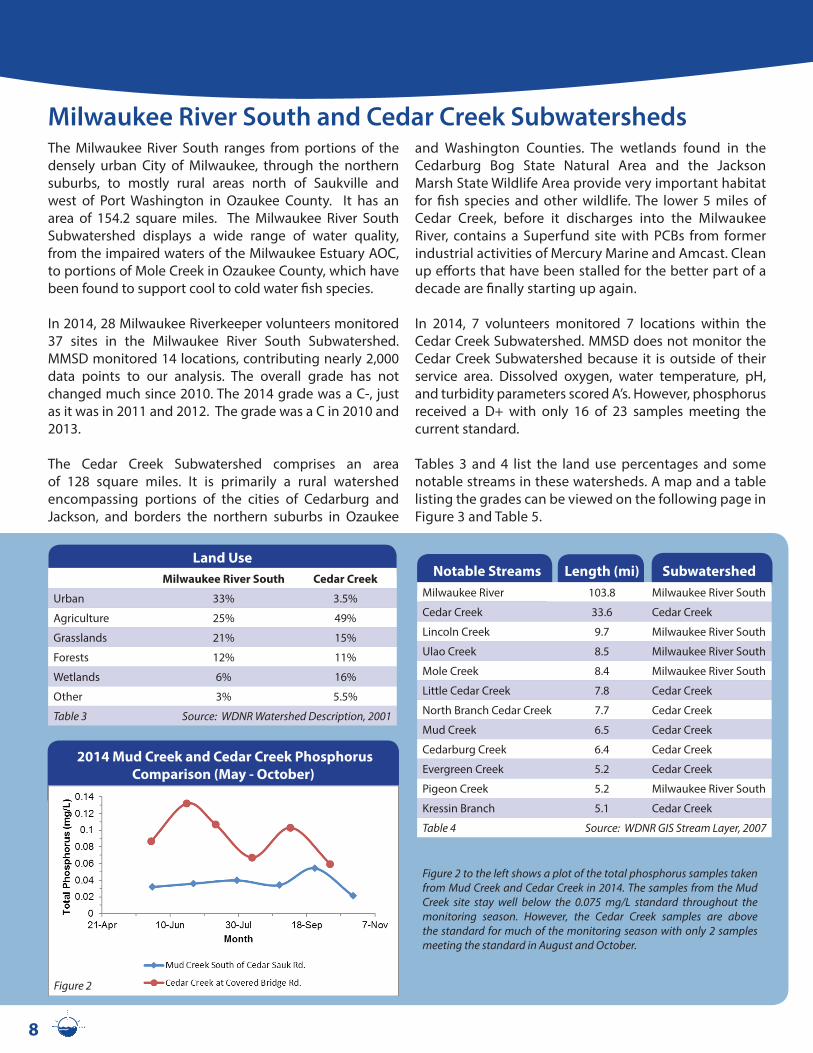
Figure 2 to the left shows a plot of the total phosphorus samples taken from Mud Creek and Cedar Creek in 2014. The samples from the Mud Creek site stay well below the 0.075 mg/L standard throughout the monitoring season. However, the Cedar Creek samples are above the standard for much of the monitoring season with only 2 samples meeting the standard in August and October.
8
Land UseMilwaukee River South Cedar Creek
Urban 33% 3.5%
Agriculture 25% 49%
Grasslands 21% 15%
Forests 12% 11%
Wetlands 6% 16%
Other 3% 5.5%
Table 3 Source: WDNR Watershed Description, 2001
2014 Mud Creek and Cedar Creek Phosphorus Comparison (May - October)
Figure 2
Notable Streams Length (mi) SubwatershedMilwaukee River 103.8 Milwaukee River South
Cedar Creek 33.6 Cedar Creek
Lincoln Creek 9.7 Milwaukee River South
Ulao Creek 8.5 Milwaukee River South
Mole Creek 8.4 Milwaukee River South
Little Cedar Creek 7.8 Cedar Creek
North Branch Cedar Creek 7.7 Cedar Creek
Mud Creek 6.5 Cedar Creek
Cedarburg Creek 6.4 Cedar Creek
Evergreen Creek 5.2 Cedar Creek
Pigeon Creek 5.2 Milwaukee River South
Kressin Branch 5.1 Cedar Creek
Table 4 Source: WDNR GIS Stream Layer, 2007
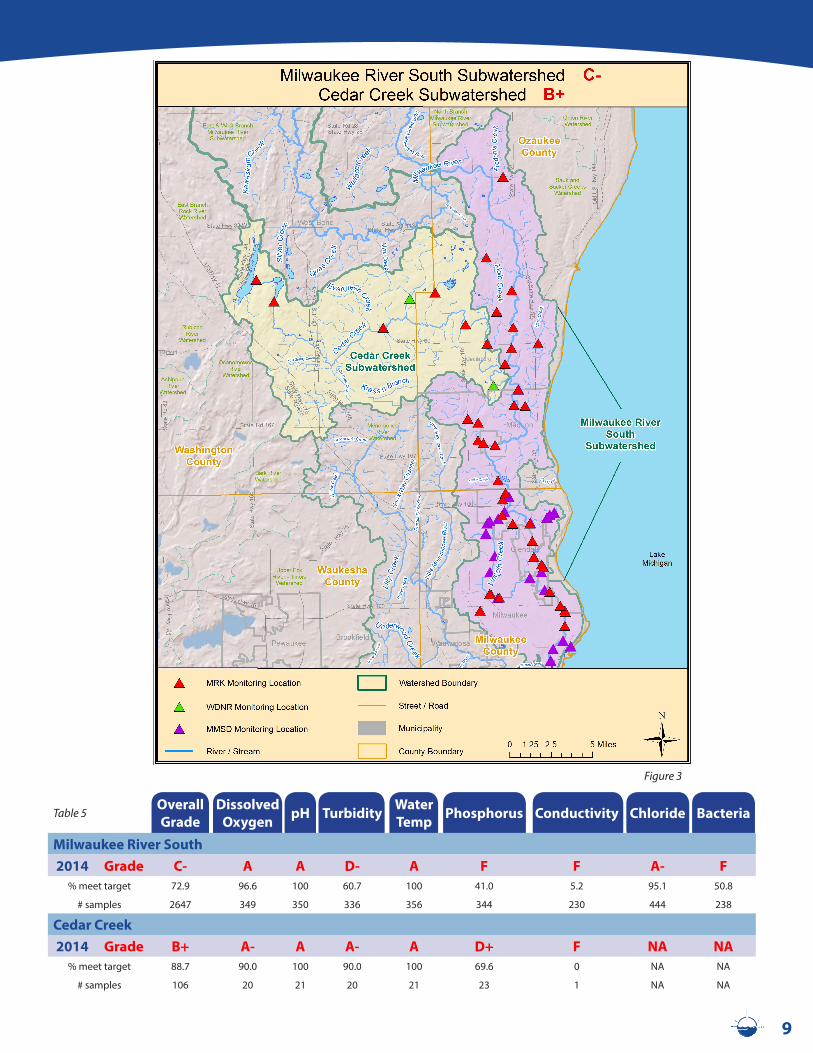
Figure 3
9
Table 5Overall Grade
Dissolved Oxygen pH Turbidity Water
Temp Phosphorus Conductivity Chloride Bacteria
Milwaukee River South2014 Grade C- A A D- A F F A- F
% meet target 72.9 96.6 100 60.7 100 41.0 5.2 95.1 50.8
# samples 2647 349 350 336 356 344 230 444 238
Cedar Creek2014 Grade B+ A- A A- A D+ F NA NA
% meet target 88.7 90.0 100 90.0 100 69.6 0 NA NA
# samples 106 20 21 20 21 23 1 NA NA
10
Table 6Overall Grade
Dissolved Oxygen pH Turbidity Water
Temp Phosphorus Conductivity Chloride
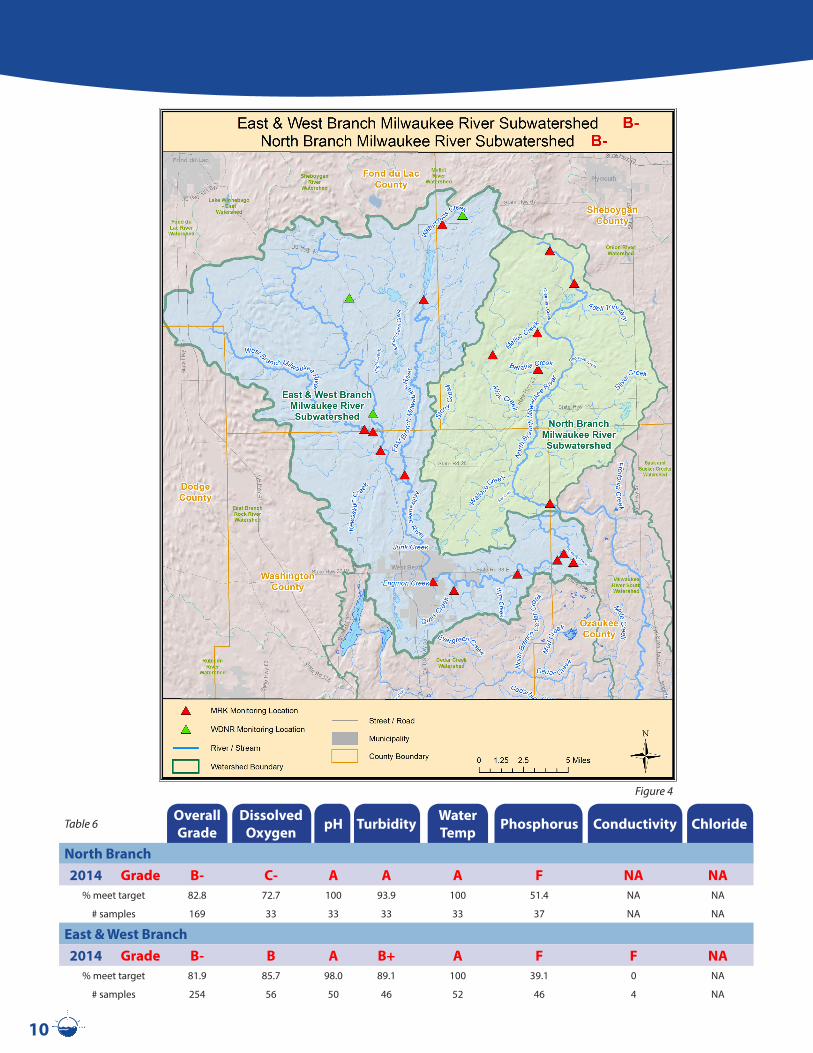
North Branch2014 Grade B- C- A A A F NA NA
% meet target 82.8 72.7 100 93.9 100 51.4 NA NA
# samples 169 33 33 33 33 37 NA NA
East & West Branch2014 Grade B- B A B+ A F F NA
% meet target 81.9 85.7 98.0 89.1 100 39.1 0 NA
# samples 254 56 50 46 52 46 4 NA
Figure 4
North Branch and East & West Branch SubwatershedsThe Milwaukee River North Branch Subwatershed is primarily rural and spans three counties: Ozaukee, Sheboygan, and Washington. It comprises 148.5 square miles. The only incorporated municipalities are the Villages of Adell, Cascade, and Random Lake. The North Branch has several small lakes within it, and contains the largest tract of undeveloped land in Southeast Wisconsin. The North Branch also has several miles of trout streams that support a wide variety of aquatic life.
In 2014, 4 volunteers monitored 6 locations in the North Branch. Turbidity, pH, and water temperature all received A’s in 2014. Dissolved oxygen and phosphorus did not score as high, receiving a C- and an F, respectively. The North Branch is heavily impacted by agricultural runoff, which is likely the cause of the failing grade for phosphorus. Streams are also small and tend to decrease in volume and flow during late summer, likely impacting oxygen levels.
The East & West Branch of the Milwaukee River covers 266 square miles, the largest land area in the Milwaukee River Watershed. This subwatershed spans across portions of Dodge, Fond du Lac, Ozaukee, Sheboygan, and Washington Counties. It is mostly rural, with
agriculture comprising nearly half of the land use, but also encompasses portions of the cities of West Bend, Newburg, Kewaskum, and Campbellsport. Portions of Auburn Lake Creek and the East Branch Milwaukee River are considered to be exceptional water resources, according to the WDNR.
Milwaukee Riverkeeper had 5 volunteers monitoring 11 different sites in 2014. The overall grade for the East & West Branch was a B-. Water temperature and pH scored A grades, while dissolved oxygen and turbidity received B and B+ grades. One failing grade in 2014 was for total phosphorus. Only 39.1% of the samples taken by our volunteers met the state standard of 0.075 mg/L. This is most likely due to pollution from agriculture, urban runoff, and treated effluent from wastewater treatment plants. The North Branch and East & West Branch were not monitored by MMSD because they are outside of their service area.
Tables 7 and 8 highlight the land uses and notable streams of these subwatersheds. Figure 3 and Table 6 on the previous page contain a site map and the grades for these subwatersheds.
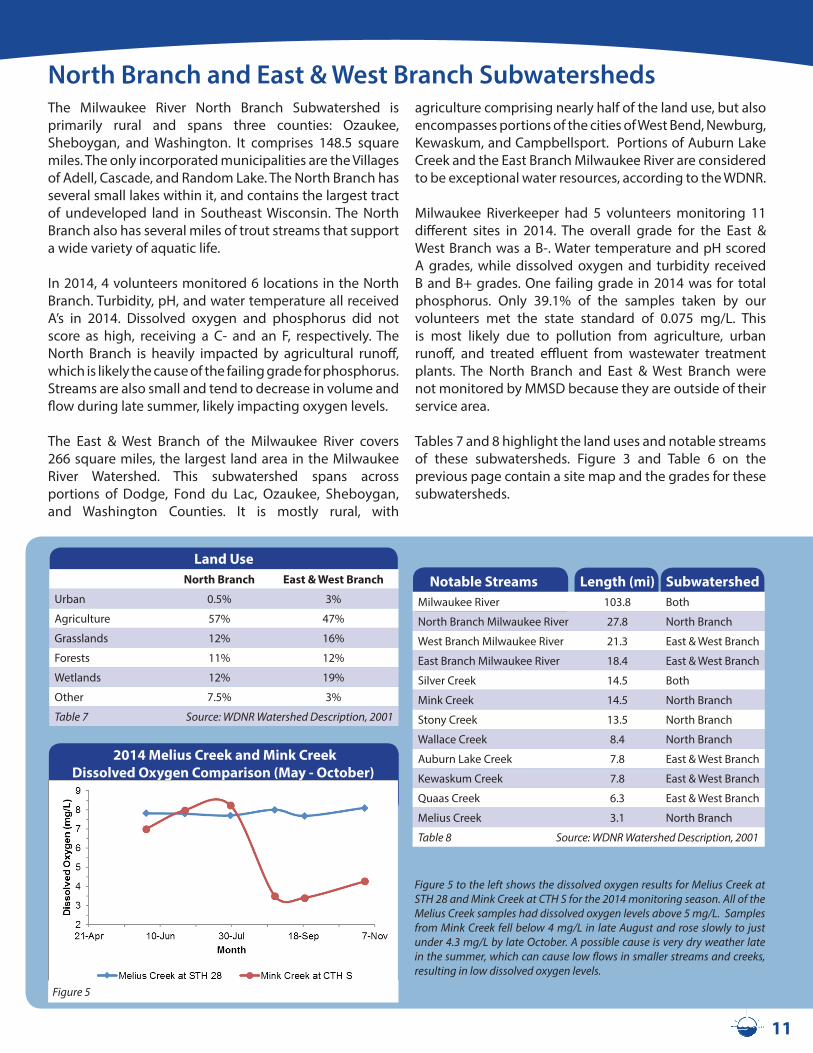
Figure 5 to the left shows the dissolved oxygen results for Melius Creek at STH 28 and Mink Creek at CTH S for the 2014 monitoring season. All of the Melius Creek samples had dissolved oxygen levels above 5 mg/L. Samples from Mink Creek fell below 4 mg/L in late August and rose slowly to just under 4.3 mg/L by late October. A possible cause is very dry weather late in the summer, which can cause low flows in smaller streams and creeks, resulting in low dissolved oxygen levels.
2014 Melius Creek and Mink Creek Dissolved Oxygen Comparison (May - October)
11
Land UseNorth Branch East & West Branch
Urban 0.5% 3%
Agriculture 57% 47%
Grasslands 12% 16%
Forests 11% 12%
Wetlands 12% 19%
Other 7.5% 3%
Table 7 Source: WDNR Watershed Description, 2001
Notable Streams Length (mi) SubwatershedMilwaukee River 103.8 Both
North Branch Milwaukee River 27.8 North Branch
West Branch Milwaukee River 21.3 East & West Branch
East Branch Milwaukee River 18.4 East & West Branch
Silver Creek 14.5 Both
Mink Creek 14.5 North Branch
Stony Creek 13.5 North Branch
Wallace Creek 8.4 North Branch
Auburn Lake Creek 7.8 East & West Branch
Kewaskum Creek 7.8 East & West Branch
Quaas Creek 6.3 East & West Branch
Melius Creek 3.1 North Branch
Table 8 Source: WDNR Watershed Description, 2001
Figure 5
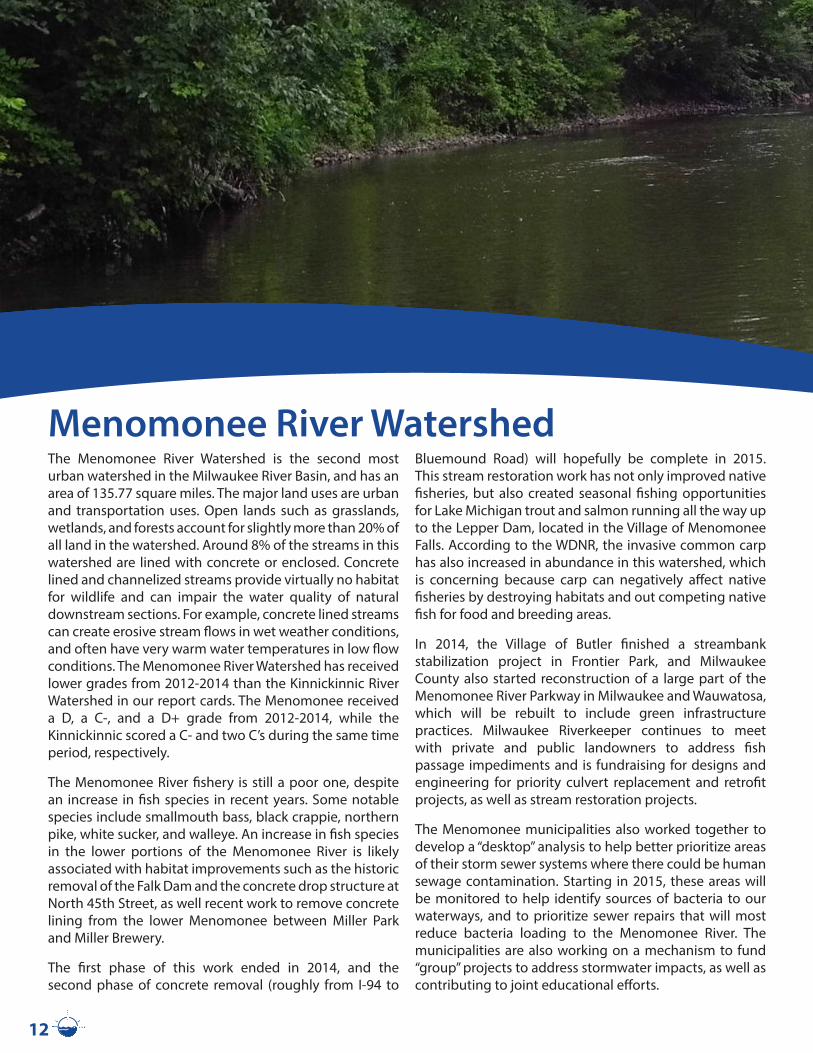
The Menomonee River Watershed is the second most urban watershed in the Milwaukee River Basin, and has an area of 135.77 square miles. The major land uses are urban and transportation uses. Open lands such as grasslands, wetlands, and forests account for slightly more than 20% of all land in the watershed. Around 8% of the streams in this watershed are lined with concrete or enclosed. Concrete lined and channelized streams provide virtually no habitat for wildlife and can impair the water quality of natural downstream sections. For example, concrete lined streams can create erosive stream flows in wet weather conditions, and often have very warm water temperatures in low flow conditions. The Menomonee River Watershed has received lower grades from 2012-2014 than the Kinnickinnic River Watershed in our report cards. The Menomonee received a D, a C-, and a D+ grade from 2012-2014, while the Kinnickinnic scored a C- and two C’s during the same time period, respectively.
The Menomonee River fishery is still a poor one, despite an increase in fish species in recent years. Some notable species include smallmouth bass, black crappie, northern pike, white sucker, and walleye. An increase in fish species in the lower portions of the Menomonee River is likely associated with habitat improvements such as the historic removal of the Falk Dam and the concrete drop structure at North 45th Street, as well recent work to remove concrete lining from the lower Menomonee between Miller Park and Miller Brewery.
The first phase of this work ended in 2014, and the second phase of concrete removal (roughly from I-94 to
Bluemound Road) will hopefully be complete in 2015. This stream restoration work has not only improved native fisheries, but also created seasonal fishing opportunities for Lake Michigan trout and salmon running all the way up to the Lepper Dam, located in the Village of Menomonee Falls. According to the WDNR, the invasive common carp has also increased in abundance in this watershed, which is concerning because carp can negatively affect native fisheries by destroying habitats and out competing native fish for food and breeding areas.
In 2014, the Village of Butler finished a streambank stabilization project in Frontier Park, and Milwaukee County also started reconstruction of a large part of the Menomonee River Parkway in Milwaukee and Wauwatosa, which will be rebuilt to include green infrastructure practices. Milwaukee Riverkeeper continues to meet with private and public landowners to address fish passage impediments and is fundraising for designs and engineering for priority culvert replacement and retrofit projects, as well as stream restoration projects.
The Menomonee municipalities also worked together to develop a “desktop” analysis to help better prioritize areas of their storm sewer systems where there could be human sewage contamination. Starting in 2015, these areas will be monitored to help identify sources of bacteria to our waterways, and to prioritize sewer repairs that will most reduce bacteria loading to the Menomonee River. The municipalities are also working on a mechanism to fund “group” projects to address stormwater impacts, as well as contributing to joint educational efforts.
Menomonee River Watershed
12
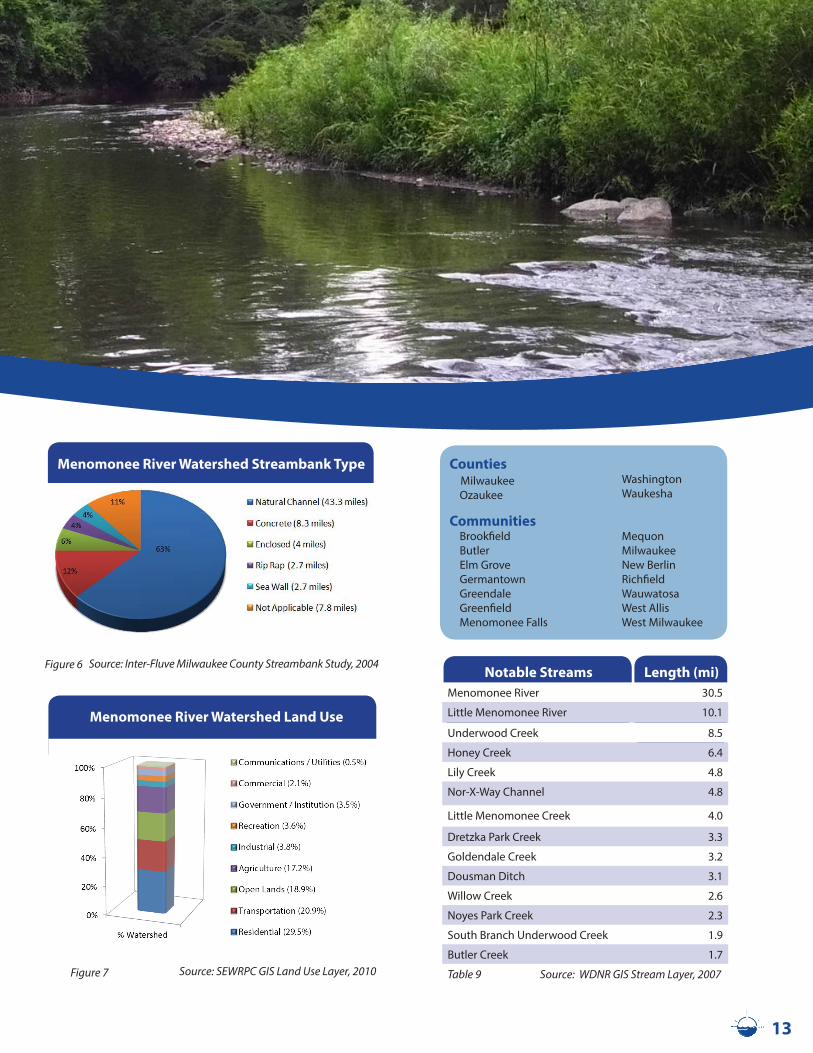
Figure 7 Source: SEWRPC GIS Land Use Layer, 2010
Source: Inter-Fluve Milwaukee County Streambank Study, 2004
Counties Milwaukee Ozaukee
WashingtonWaukesha
Communities Brookfield Butler Elm Grove Germantown Greendale Greenfield Menomonee Falls
Mequon MilwaukeeNew BerlinRichfieldWauwatosaWest AllisWest Milwaukee
Figure 6
13
Notable Streams Length (mi)Menomonee River 30.5
Little Menomonee River 10.1
Underwood Creek 8.5
Honey Creek 6.4
Lily Creek 4.8
Nor-X-Way Channel 4.8
Little Menomonee Creek 4.0
Dretzka Park Creek 3.3
Goldendale Creek 3.2
Dousman Ditch 3.1
Willow Creek 2.6
Noyes Park Creek 2.3
South Branch Underwood Creek 1.9
Butler Creek 1.7
Table 9 Source: WDNR GIS Stream Layer, 2007
Menomonee River Watershed Streambank Type
Menomonee River Watershed Land Use
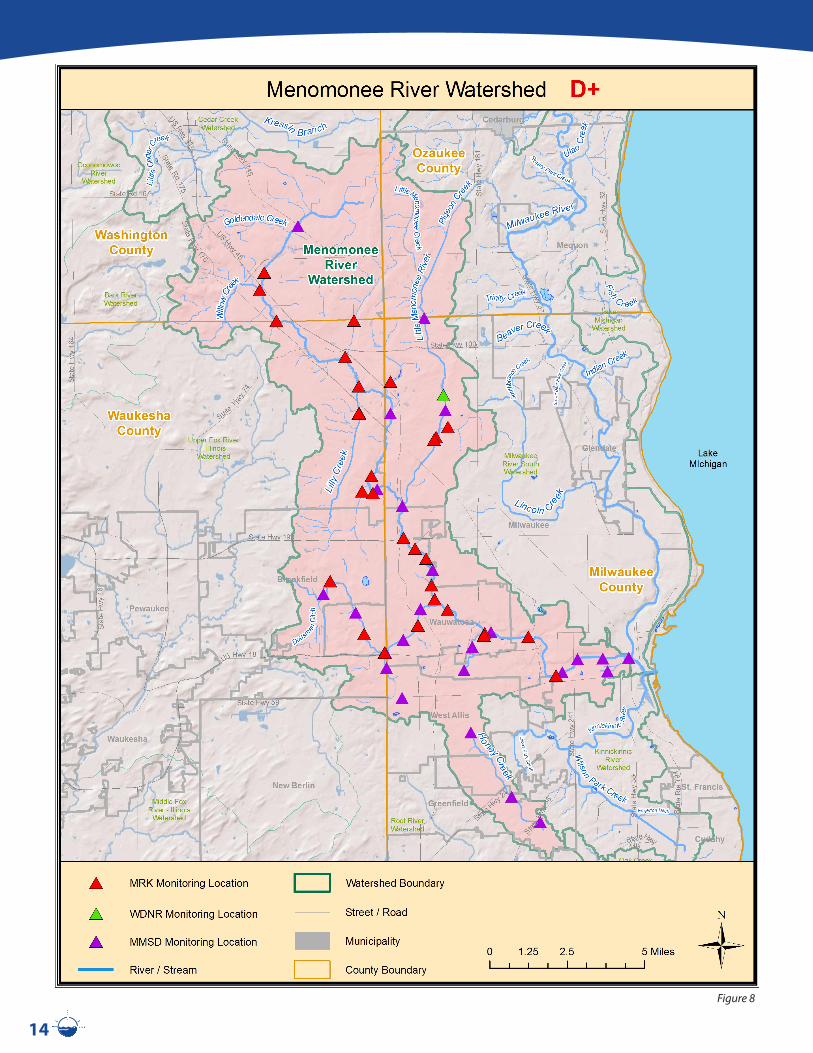
Figure 8
14
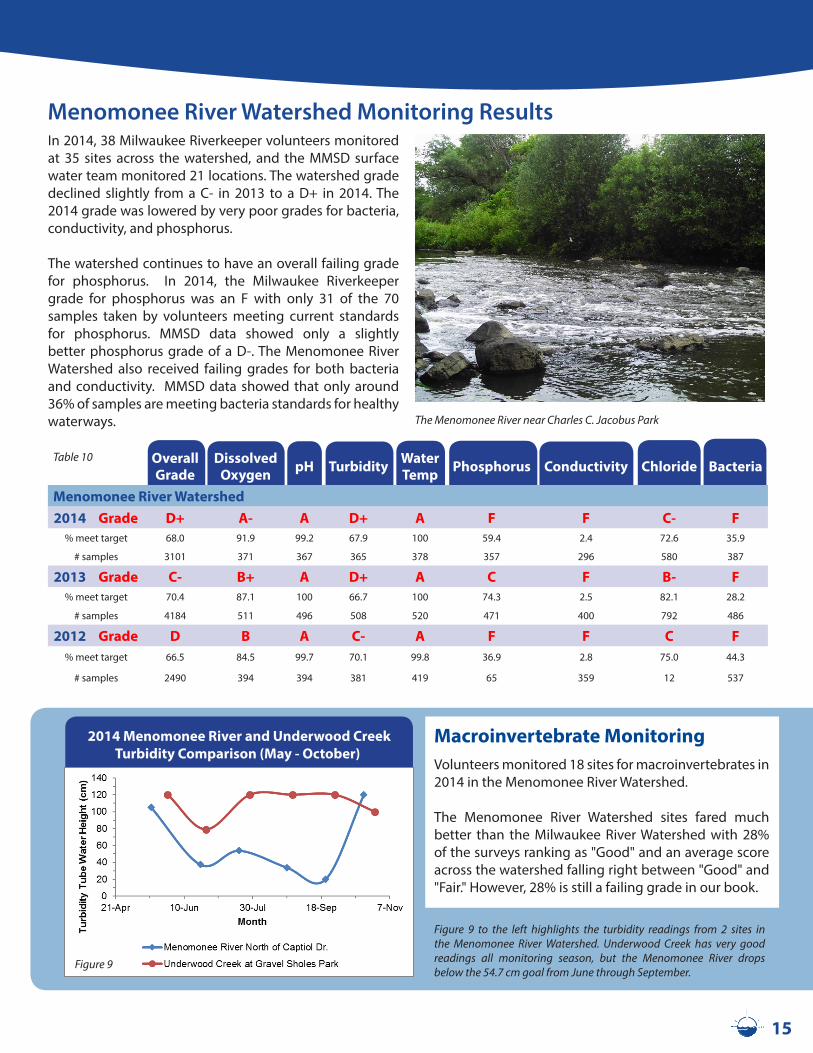
In 2014, 38 Milwaukee Riverkeeper volunteers monitored at 35 sites across the watershed, and the MMSD surface water team monitored 21 locations. The watershed grade declined slightly from a C- in 2013 to a D+ in 2014. The 2014 grade was lowered by very poor grades for bacteria, conductivity, and phosphorus.
The watershed continues to have an overall failing grade for phosphorus. In 2014, the Milwaukee Riverkeeper grade for phosphorus was an F with only 31 of the 70 samples taken by volunteers meeting current standards for phosphorus. MMSD data showed only a slightly better phosphorus grade of a D-. The Menomonee River Watershed also received failing grades for both bacteria and conductivity. MMSD data showed that only around 36% of samples are meeting bacteria standards for healthy waterways.
Table 10 OverallGrade
DissolvedOxygen pH Turbidity Water
Temp Phosphorus Conductivity Chloride Bacteria
Menomonee River Watershed2014 Grade D+ A- A D+ A F F C- F
% meet target 68.0 91.9 99.2 67.9 100 59.4 2.4 72.6 35.9
# samples 3101 371 367 365 378 357 296 580 387
2013 Grade C- B+ A D+ A C F B- F% meet target 70.4 87.1 100 66.7 100 74.3 2.5 82.1 28.2
# samples 4184 511 496 508 520 471 400 792 486
2012 Grade D B A C- A F F C F% meet target 66.5 84.5 99.7 70.1 99.8 36.9 2.8 75.0 44.3
# samples 2490 394 394 381 419 65 359 12 537
Menomonee River Watershed Monitoring Results
The Menomonee River near Charles C. Jacobus Park
Figure 9 to the left highlights the turbidity readings from 2 sites in the Menomonee River Watershed. Underwood Creek has very good readings all monitoring season, but the Menomonee River drops below the 54.7 cm goal from June through September.
15
2014 Menomonee River and Underwood Creek Turbidity Comparison (May - October)
Figure 9
Macroinvertebrate Monitoring Volunteers monitored 18 sites for macroinvertebrates in 2014 in the Menomonee River Watershed.
The Menomonee River Watershed sites fared much better than the Milwaukee River Watershed with 28% of the surveys ranking as "Good" and an average score across the watershed falling right between "Good" and "Fair." However, 28% is still a failing grade in our book.
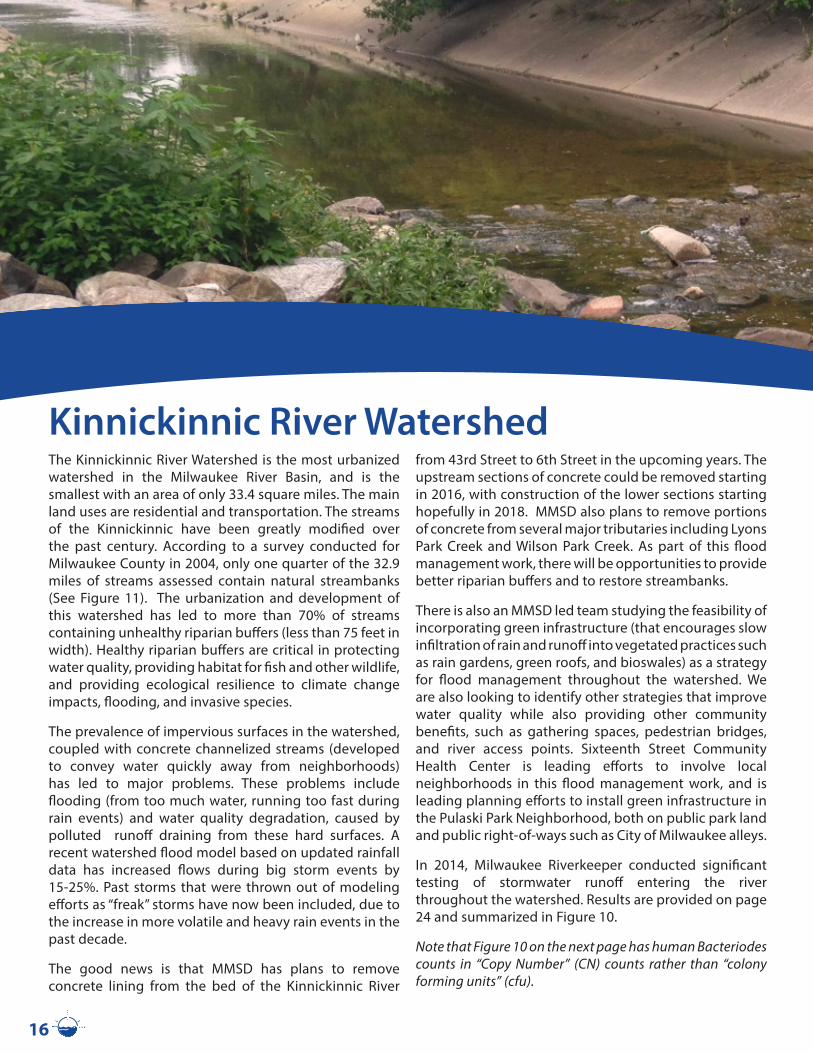
The Kinnickinnic River Watershed is the most urbanized watershed in the Milwaukee River Basin, and is the smallest with an area of only 33.4 square miles. The main land uses are residential and transportation. The streams of the Kinnickinnic have been greatly modified over the past century. According to a survey conducted for Milwaukee County in 2004, only one quarter of the 32.9 miles of streams assessed contain natural streambanks (See Figure 11). The urbanization and development of this watershed has led to more than 70% of streams containing unhealthy riparian buffers (less than 75 feet in width). Healthy riparian buffers are critical in protecting water quality, providing habitat for fish and other wildlife, and providing ecological resilience to climate change impacts, flooding, and invasive species.
The prevalence of impervious surfaces in the watershed, coupled with concrete channelized streams (developed to convey water quickly away from neighborhoods) has led to major problems. These problems include flooding (from too much water, running too fast during rain events) and water quality degradation, caused by polluted runoff draining from these hard surfaces. A recent watershed flood model based on updated rainfall data has increased flows during big storm events by 15-25%. Past storms that were thrown out of modeling efforts as “freak” storms have now been included, due to the increase in more volatile and heavy rain events in the past decade.
The good news is that MMSD has plans to remove concrete lining from the bed of the Kinnickinnic River
from 43rd Street to 6th Street in the upcoming years. The upstream sections of concrete could be removed starting in 2016, with construction of the lower sections starting hopefully in 2018. MMSD also plans to remove portions of concrete from several major tributaries including Lyons Park Creek and Wilson Park Creek. As part of this flood management work, there will be opportunities to provide better riparian buffers and to restore streambanks.
There is also an MMSD led team studying the feasibility of incorporating green infrastructure (that encourages slow infiltration of rain and runoff into vegetated practices such as rain gardens, green roofs, and bioswales) as a strategy for flood management throughout the watershed. We are also looking to identify other strategies that improve water quality while also providing other community benefits, such as gathering spaces, pedestrian bridges, and river access points. Sixteenth Street Community Health Center is leading efforts to involve local neighborhoods in this flood management work, and is leading planning efforts to install green infrastructure in the Pulaski Park Neighborhood, both on public park land and public right-of-ways such as City of Milwaukee alleys.
In 2014, Milwaukee Riverkeeper conducted significant testing of stormwater runoff entering the river throughout the watershed. Results are provided on page 24 and summarized in Figure 10.
Note that Figure 10 on the next page has human Bacteriodes counts in “Copy Number” (CN) counts rather than “colony forming units” (cfu).
Kinnickinnic River Watershed
16
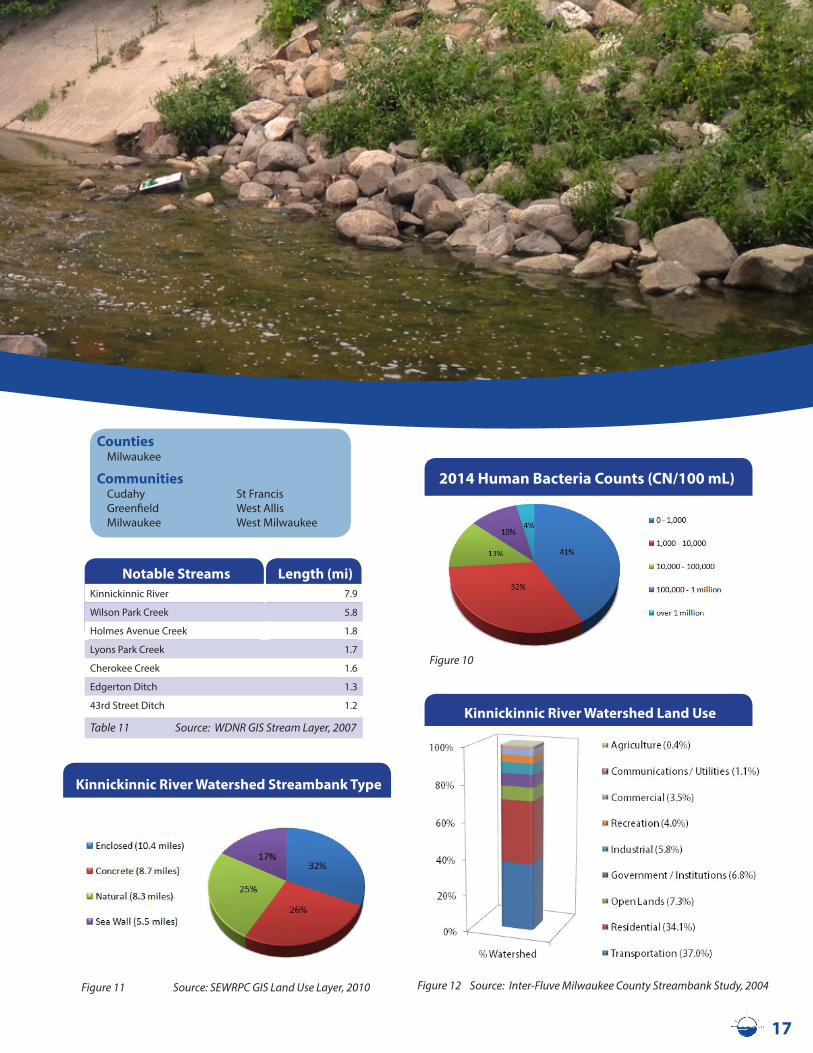
2014 Human Bacteria Counts (CN/100 mL)
Kinnickinnic River Watershed Land Use
Notable Streams Length (mi)Kinnickinnic River 7.9
Wilson Park Creek 5.8
Holmes Avenue Creek 1.8
Lyons Park Creek 1.7
Cherokee Creek 1.6
Edgerton Ditch 1.3
43rd Street Ditch 1.2
Table 11 Source: WDNR GIS Stream Layer, 2007
Counties Milwaukee
Communities Cudahy Greenfield Milwaukee
St FrancisWest AllisWest Milwaukee
Source: Inter-Fluve Milwaukee County Streambank Study, 2004Source: SEWRPC GIS Land Use Layer, 2010Figure 11 Figure 12
Figure 10
17
Kinnickinnic River Watershed Streambank Type
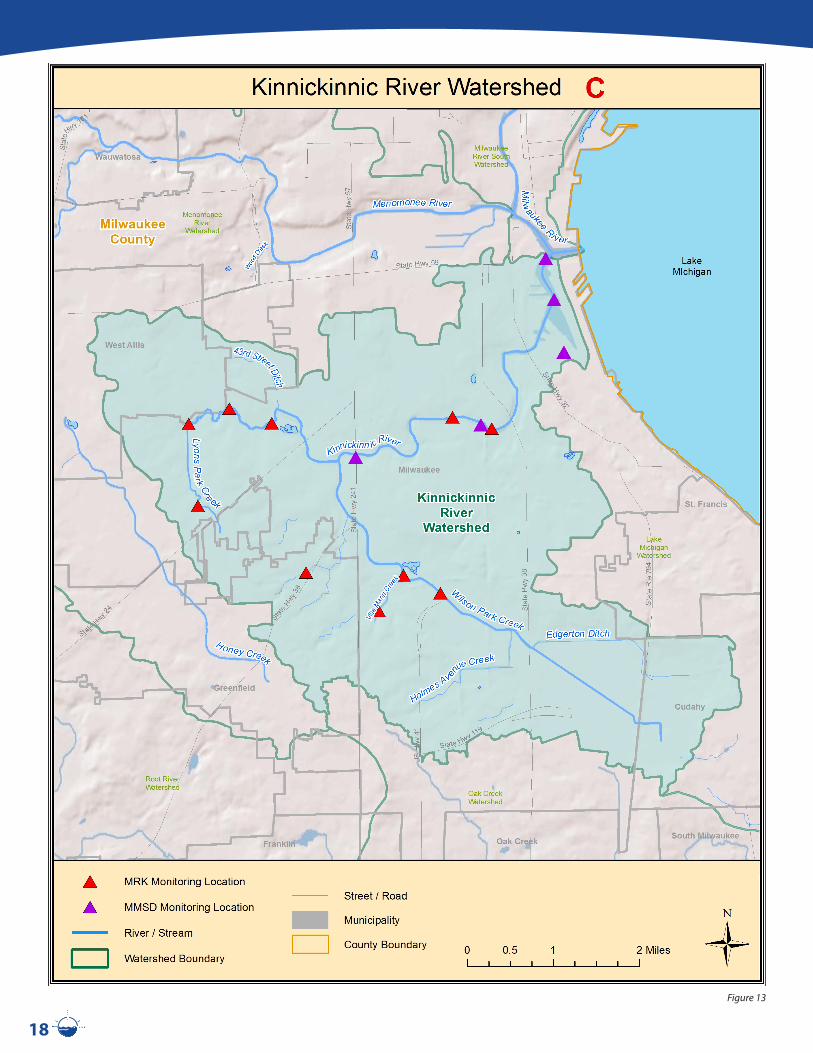
Figure 13
18
Kinnickinnic River Watershed Dissolved Oxygen
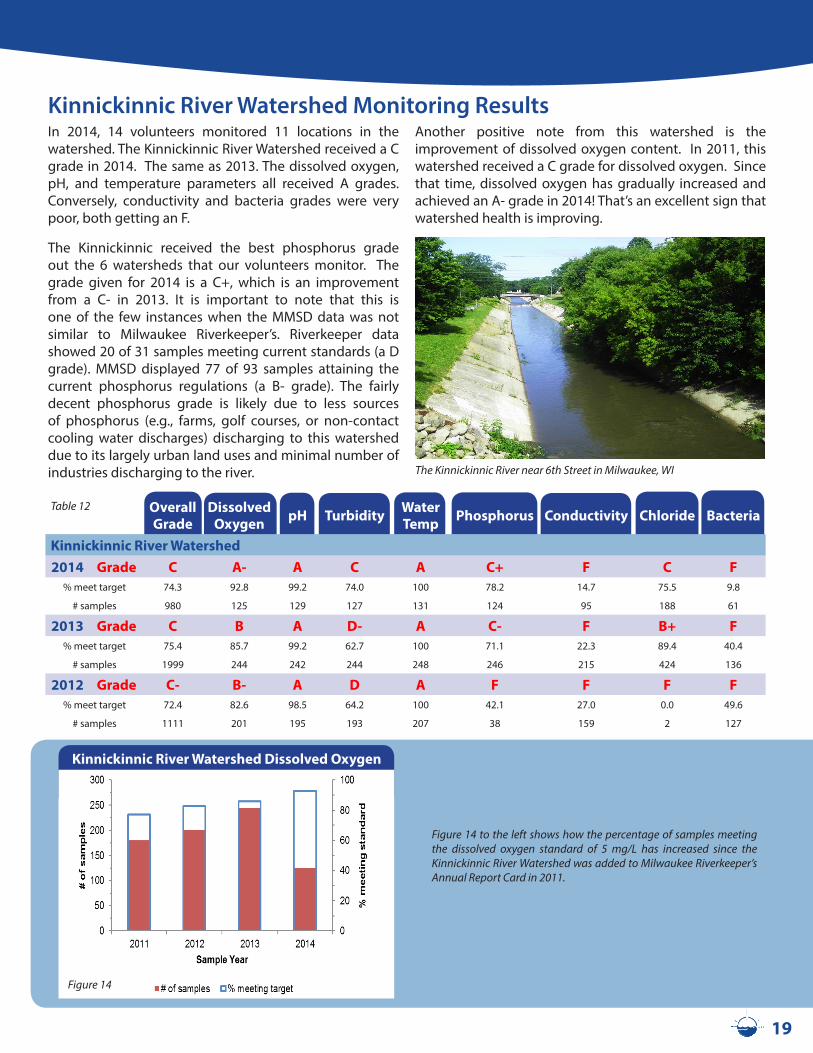
Table 12 OverallGrade
DissolvedOxygen pH Turbidity Water
Temp Phosphorus Conductivity Chloride Bacteria
Kinnickinnic River Watershed2014 Grade C A- A C A C+ F C F
% meet target 74.3 92.8 99.2 74.0 100 78.2 14.7 75.5 9.8
# samples 980 125 129 127 131 124 95 188 61
2013 Grade C B A D- A C- F B+ F% meet target 75.4 85.7 99.2 62.7 100 71.1 22.3 89.4 40.4
# samples 1999 244 242 244 248 246 215 424 136
2012 Grade C- B- A D A F F F F% meet target 72.4 82.6 98.5 64.2 100 42.1 27.0 0.0 49.6
# samples 1111 201 195 193 207 38 159 2 127
In 2014, 14 volunteers monitored 11 locations in the watershed. The Kinnickinnic River Watershed received a C grade in 2014. The same as 2013. The dissolved oxygen, pH, and temperature parameters all received A grades. Conversely, conductivity and bacteria grades were very poor, both getting an F.
The Kinnickinnic received the best phosphorus grade out the 6 watersheds that our volunteers monitor. The grade given for 2014 is a C+, which is an improvement from a C- in 2013. It is important to note that this is one of the few instances when the MMSD data was not similar to Milwaukee Riverkeeper’s. Riverkeeper data showed 20 of 31 samples meeting current standards (a D grade). MMSD displayed 77 of 93 samples attaining the current phosphorus regulations (a B- grade). The fairly decent phosphorus grade is likely due to less sources of phosphorus (e.g., farms, golf courses, or non-contact cooling water discharges) discharging to this watershed due to its largely urban land uses and minimal number of industries discharging to the river.
Another positive note from this watershed is the improvement of dissolved oxygen content. In 2011, this watershed received a C grade for dissolved oxygen. Since that time, dissolved oxygen has gradually increased and achieved an A- grade in 2014! That’s an excellent sign that watershed health is improving.
Kinnickinnic River Watershed Monitoring Results
The Kinnickinnic River near 6th Street in Milwaukee, WI
Figure 14 to the left shows how the percentage of samples meeting the dissolved oxygen standard of 5 mg/L has increased since the Kinnickinnic River Watershed was added to Milwaukee Riverkeeper’s Annual Report Card in 2011.
Figure 14
19
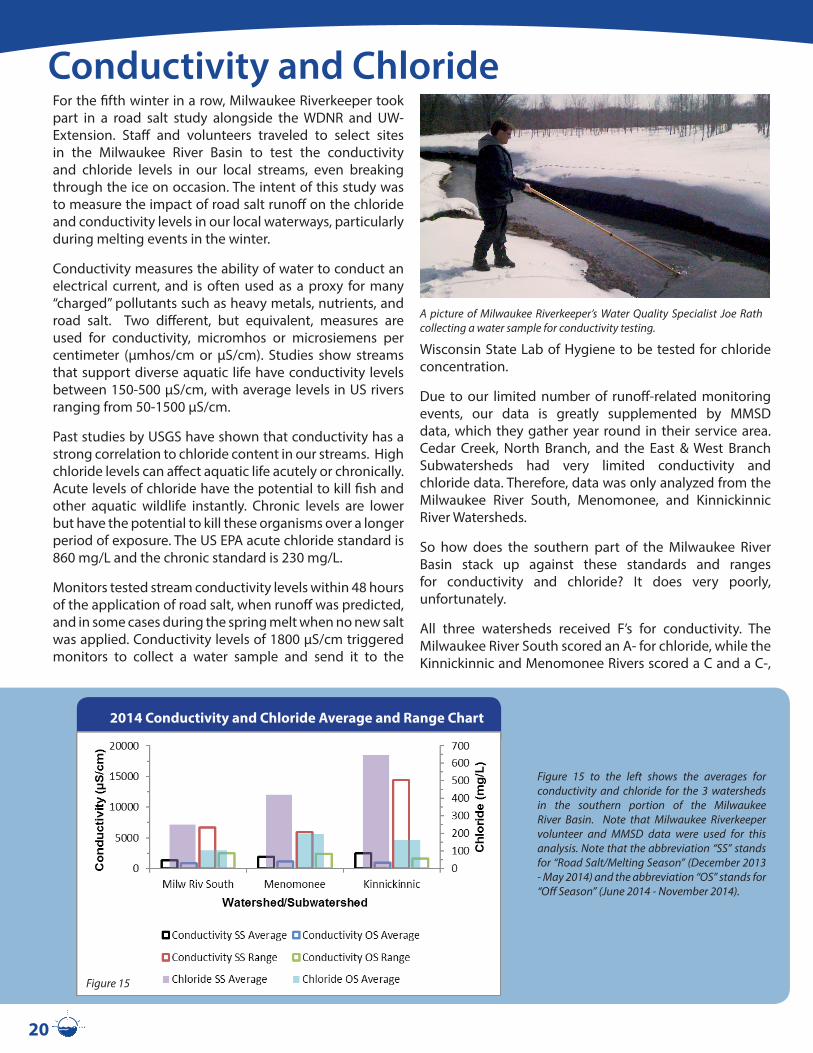
2014 Conductivity and Chloride Average and Range Chart
For the fifth winter in a row, Milwaukee Riverkeeper took part in a road salt study alongside the WDNR and UW-Extension. Staff and volunteers traveled to select sites in the Milwaukee River Basin to test the conductivity and chloride levels in our local streams, even breaking through the ice on occasion. The intent of this study was to measure the impact of road salt runoff on the chloride and conductivity levels in our local waterways, particularly during melting events in the winter.
Conductivity measures the ability of water to conduct an electrical current, and is often used as a proxy for many “charged” pollutants such as heavy metals, nutrients, and road salt. Two different, but equivalent, measures are used for conductivity, micromhos or microsiemens per centimeter (µmhos/cm or µS/cm). Studies show streams that support diverse aquatic life have conductivity levels between 150-500 µS/cm, with average levels in US rivers ranging from 50-1500 µS/cm.
Past studies by USGS have shown that conductivity has a strong correlation to chloride content in our streams. High chloride levels can affect aquatic life acutely or chronically. Acute levels of chloride have the potential to kill fish and other aquatic wildlife instantly. Chronic levels are lower but have the potential to kill these organisms over a longer period of exposure. The US EPA acute chloride standard is 860 mg/L and the chronic standard is 230 mg/L.
Monitors tested stream conductivity levels within 48 hours of the application of road salt, when runoff was predicted, and in some cases during the spring melt when no new salt was applied. Conductivity levels of 1800 µS/cm triggered monitors to collect a water sample and send it to the
Wisconsin State Lab of Hygiene to be tested for chloride concentration.
Due to our limited number of runoff-related monitoring events, our data is greatly supplemented by MMSD data, which they gather year round in their service area. Cedar Creek, North Branch, and the East & West Branch Subwatersheds had very limited conductivity and chloride data. Therefore, data was only analyzed from the Milwaukee River South, Menomonee, and Kinnickinnic River Watersheds.
So how does the southern part of the Milwaukee River Basin stack up against these standards and ranges for conductivity and chloride? It does very poorly, unfortunately.
All three watersheds received F’s for conductivity. The Milwaukee River South scored an A- for chloride, while the Kinnickinnic and Menomonee Rivers scored a C and a C-,
Conductivity and Chloride
Figure 15 to the left shows the averages for conductivity and chloride for the 3 watersheds in the southern portion of the Milwaukee River Basin. Note that Milwaukee Riverkeeper volunteer and MMSD data were used for this analysis. Note that the abbreviation “SS” stands for “Road Salt/Melting Season” (December 2013 - May 2014) and the abbreviation “OS” stands for “Off Season” (June 2014 - November 2014).
A picture of Milwaukee Riverkeeper’s Water Quality Specialist Joe Rath collecting a water sample for conductivity testing.
20
Figure 15
respectively. Smaller creeks with less water volume and flow tend to be more negatively impacted.
The fact that conductivity grades were on average poor throughout the year, suggests that salts are not the only factor affecting conductivity. Every river has different baseline conductivity due to it’s surrounding geology, as well as due to inputs of nitrates, sulfates, phosphates, heavy metals, and other chemicals. This means that agricultural runoff, stormwater, legacy pollution, and industrial discharge also contribute to the poor conductivity grades in the lower Milwaukee River Basin.
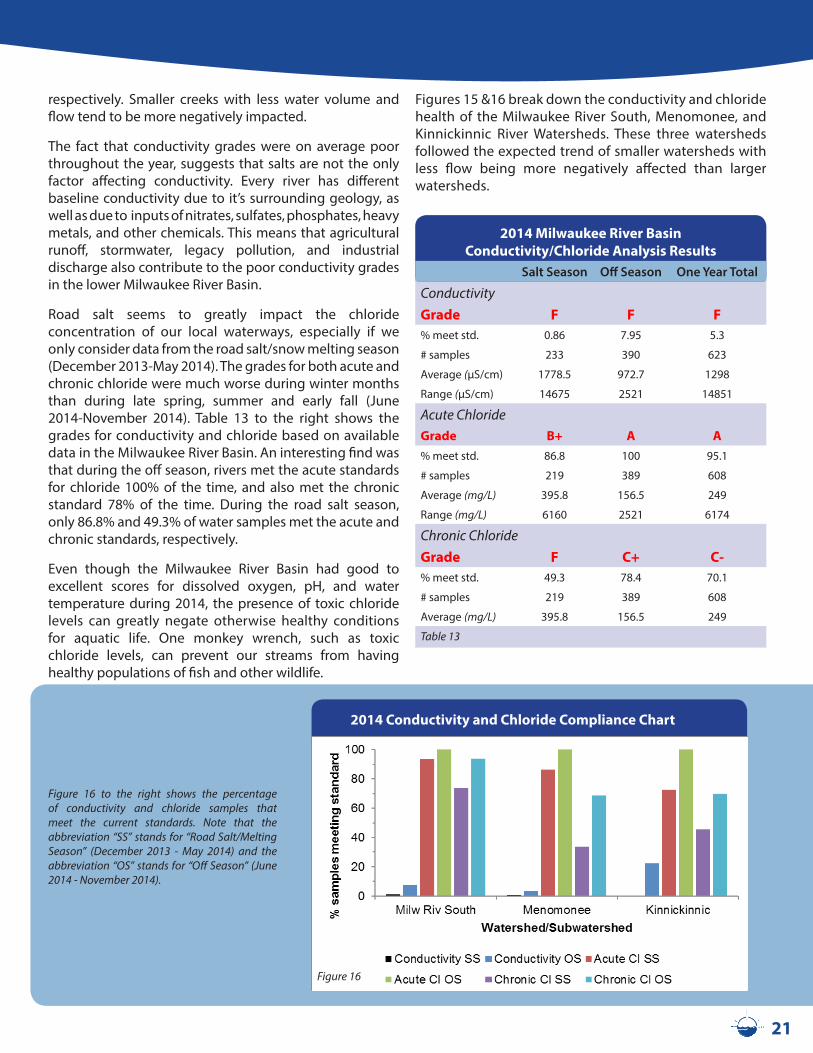
Road salt seems to greatly impact the chloride concentration of our local waterways, especially if we only consider data from the road salt/snow melting season (December 2013-May 2014). The grades for both acute and chronic chloride were much worse during winter months than during late spring, summer and early fall (June 2014-November 2014). Table 13 to the right shows the grades for conductivity and chloride based on available data in the Milwaukee River Basin. An interesting find was that during the off season, rivers met the acute standards for chloride 100% of the time, and also met the chronic standard 78% of the time. During the road salt season, only 86.8% and 49.3% of water samples met the acute and chronic standards, respectively.
Even though the Milwaukee River Basin had good to excellent scores for dissolved oxygen, pH, and water temperature during 2014, the presence of toxic chloride levels can greatly negate otherwise healthy conditions for aquatic life. One monkey wrench, such as toxic chloride levels, can prevent our streams from having healthy populations of fish and other wildlife.
Figures 15 &16 break down the conductivity and chloride health of the Milwaukee River South, Menomonee, and Kinnickinnic River Watersheds. These three watersheds followed the expected trend of smaller watersheds with less flow being more negatively affected than larger watersheds.
2014 Conductivity and Chloride Compliance Chart
2014 Milwaukee River Basin Conductivity/Chloride Analysis Results
Salt Season Off Season One Year Total
ConductivityGrade F F F% meet std. 0.86 7.95 5.3
# samples 233 390 623
Average (µS/cm) 1778.5 972.7 1298
Range (µS/cm) 14675 2521 14851
Acute ChlorideGrade B+ A A% meet std. 86.8 100 95.1
# samples 219 389 608
Average (mg/L) 395.8 156.5 249
Range (mg/L) 6160 2521 6174
Chronic ChlorideGrade F C+ C-% meet std. 49.3 78.4 70.1
# samples 219 389 608
Average (mg/L) 395.8 156.5 249
Table 13
Figure 16 to the right shows the percentage of conductivity and chloride samples that meet the current standards. Note that the abbreviation “SS” stands for “Road Salt/Melting Season” (December 2013 - May 2014) and the abbreviation “OS” stands for “Off Season” (June 2014 - November 2014).
21
Figure 16
Turbidity, transparency, and water clarity are terms that describe the amount of dissolved and suspended materials in a body of water, such as a lake or river. The presence of more suspended materials found in the water column results in a lower turbidity reading. Poor agricultural practices, lack of riparian buffers, stormwater runoff, and high levels of erosion can lead to higher levels of turbidity in our local rivers and streams.
High turbidity can have several negative impacts on an aquatic environment. Increases in turbidity tend to increase water temperature, as more suspended materials in the water are able to absorb and store heat. As waters warm, their ability to store dissolved oxygen decreases, potentially putting a strain on aquatic life. Turbidity can also limit dissolved oxygen levels by blocking sunlight from penetrating the water column deeply enough, which affects aquatic plants ability to photosynthesize and release dissolved oxygen into the water. Finally, turbid streams have a tendency to fill up stream beds with sediment over time, resulting in shallower water which can warm up more quickly, again leading to lower dissolved oxygen levels.
Turbidity directly impacts aquatic life as well. Sediments suspended in the water column can irritate fish gills leading to respiratory difficulties. Predators who hunt by sight find it more difficult to find their prey. In addition, suspended sediments eventually settle out on the
stream bed, covering rocks and filling in spaces where macroinvertebrates live.
Milwaukee Riverkeeper volunteers use a transparency tube to measure stream turbidity. The tubes are clear and have a disc at the bottom, which has an alternating black and white pattern exactly like a secchi disc (a device commonly used to measure water clarity in lakes). Monitors stand facing upstream and fill the tube with stream water. As they peer down the tube, they open a valve which slowly releases water from the tube. They close the valve when the black and white pattern at the bottom is clearly visible. The side of the tube is marked with a measuring tape, allowing the monitor to record the corresponding water level. The goal for turbidity when using a turbidity tube is to see a recorded height of 54.7 cm or more.
MMSD’s water quality team uses more complex and expensive equipment to measure turbidity, with their results reported in Nephelometric Turbidity Units (NTUs), and the goal being <10 NTU’s. A comparison of transparency tube readings to the NTU scale can be found on a chart developed by Kevin Fermanich on the “Water Action Volunteers” section of the UW-Extension website.
Turbidity remains a problem for the Milwaukee River Basin. The basin as a whole recorded a D+ for 2014 with only 636 out of 927 data points meeting the standards detailed above. The northern portion of the watershed had much better turbidity readings than the southern portion. In the north, the North Branch, Cedar Creek, and the East & West Branch scored an A, an A-, and a B+, respectively. In the south, the Kinnickinnic, Menomonee, and Milwaukee River South scored a C, a D+, and a D-, respectively. This same trend was observed in 2012 and 2013. The overall Basin turbidity grade is likely skewed lower, due to the greater number and poorer quality of samples from the lower half of the Basin.
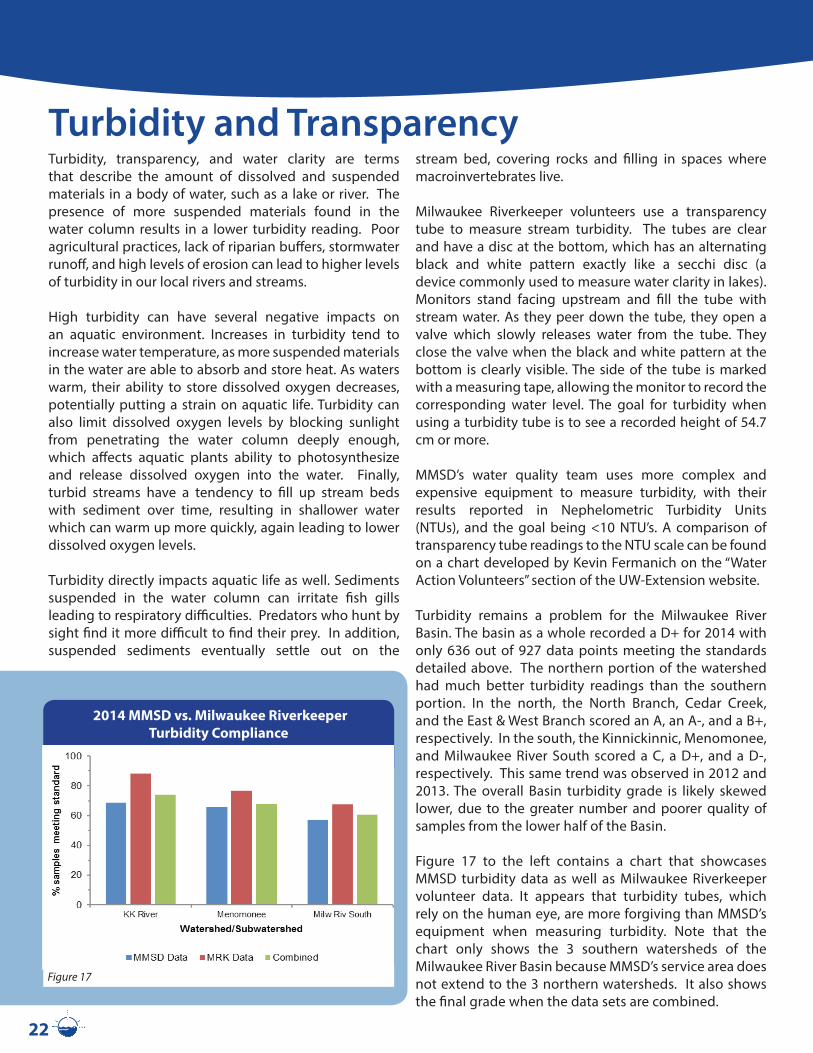
Figure 17 to the left contains a chart that showcases MMSD turbidity data as well as Milwaukee Riverkeeper volunteer data. It appears that turbidity tubes, which rely on the human eye, are more forgiving than MMSD’s equipment when measuring turbidity. Note that the chart only shows the 3 southern watersheds of the Milwaukee River Basin because MMSD’s service area does not extend to the 3 northern watersheds. It also shows the final grade when the data sets are combined.
22
Turbidity and Transparency
2014 MMSD vs. Milwaukee Riverkeeper Turbidity Compliance
Figure 17
Water temperature is important for fish and other aquatic life. Different aquatic animals--both vertebrates and invertebrates--require different temperatures to maximize survival and reproduction. The same animal may require different temperatures during different stages of its life and for different behaviors.
Many factors affect water temperature in a river or stream, including: weather, vegetative shade, groundwater inflow, the presence of dams or other barriers, stormwater runoff, and industrial discharge. In turn, increased water temperature generally lowers dissolved oxygen content, as warm water holds less dissolved oxygen than cool water. Temperature can also affect photosynthesis and metabolic rates of aquatic organisms.
The state of Wisconsin classifies its surface waters by the aquatic life that can survive and maintain populations in particular water temperature ranges. The two most common classifications are warm water sport fish communities (WWSF) and cold water communities. The majority of the rivers and streams in the Milwaukee River Basin are classified as WWSF or an attainable WWSF. Examples of fish that live in these waters are bluegill, crappie, large and smallmouth bass, walleye, and northern pike. The WDNR states that the temperature for a waterbody classified as a WWSF is not to exceed 31.7ºC (89.06ºF).
There are a few segments of streams in the Milwaukee River Basin that are classified as cold water communities. These streams are located in the North Branch and the East & West Branch Subwatersheds. These streams have also been identified by WDNR as trout streams. The maximum temperature for a cold water community, according to the WDNR, is 22ºC (71.6ºF). There are three classes of trout streams identified by the WDNR. Class 1 streams are high quality waters with sufficient natural reproduction to sustain trout populations at or near carrying capacity. Class 2 streams have some natural reproduction but not enough to sustain a sport fishery. Class 3 waters are marginal habitats
with no natural reproduction occurring. The East & West Branch Subwatershed contains 11.7 miles of class 2 trout waters. The North Branch Subwatershed has 13.7 miles of trout streams that is comprised of class 1 and class 2 trout waters.
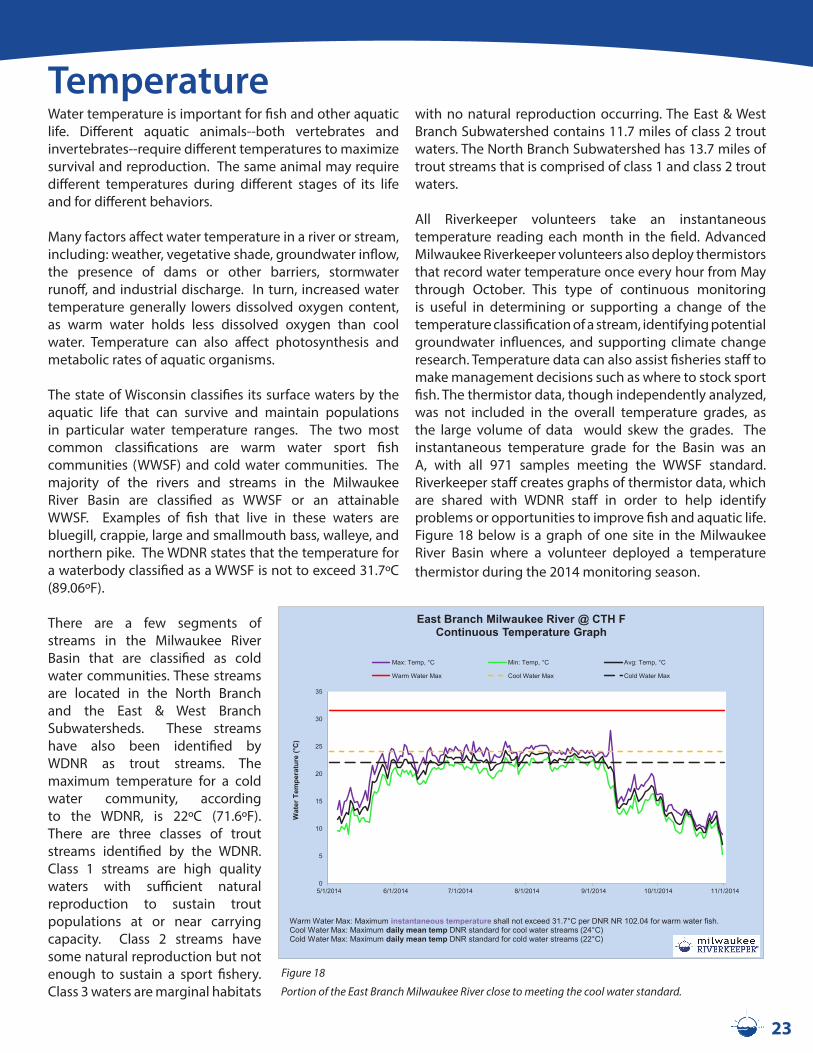
All Riverkeeper volunteers take an instantaneous temperature reading each month in the field. Advanced Milwaukee Riverkeeper volunteers also deploy thermistors that record water temperature once every hour from May through October. This type of continuous monitoring is useful in determining or supporting a change of the temperature classification of a stream, identifying potential groundwater influences, and supporting climate change research. Temperature data can also assist fisheries staff to make management decisions such as where to stock sport fish. The thermistor data, though independently analyzed, was not included in the overall temperature grades, as the large volume of data would skew the grades. The instantaneous temperature grade for the Basin was an A, with all 971 samples meeting the WWSF standard. Riverkeeper staff creates graphs of thermistor data, which are shared with WDNR staff in order to help identify problems or opportunities to improve fish and aquatic life. Figure 18 below is a graph of one site in the Milwaukee River Basin where a volunteer deployed a temperature thermistor during the 2014 monitoring season.
23
Temperature
0
5
10
15
20
25
30
35
5/1/2014 6/1/2014 7/1/2014 8/1/2014 9/1/2014 10/1/2014 11/1/2014
Wat
er T
empe
ratu
re (°
C)
East Branch Milwaukee River @ CTH FContinuous Temperature Graph
Max: Temp, °C Min: Temp, °C Avg: Temp, °C
Warm Water Max Cool Water Max Cold Water Max
Warm Water Max: Maximum instantaneous temperature shall not exceed 31.7°C per DNR NR 102.04 for warm water fish.Cool Water Max: Maximum daily mean temp DNR standard for cool water streams (24°C)Cold Water Max: Maximum daily mean temp DNR standard for cold water streams (22°C)
Figure 18
Portion of the East Branch Milwaukee River close to meeting the cool water standard.
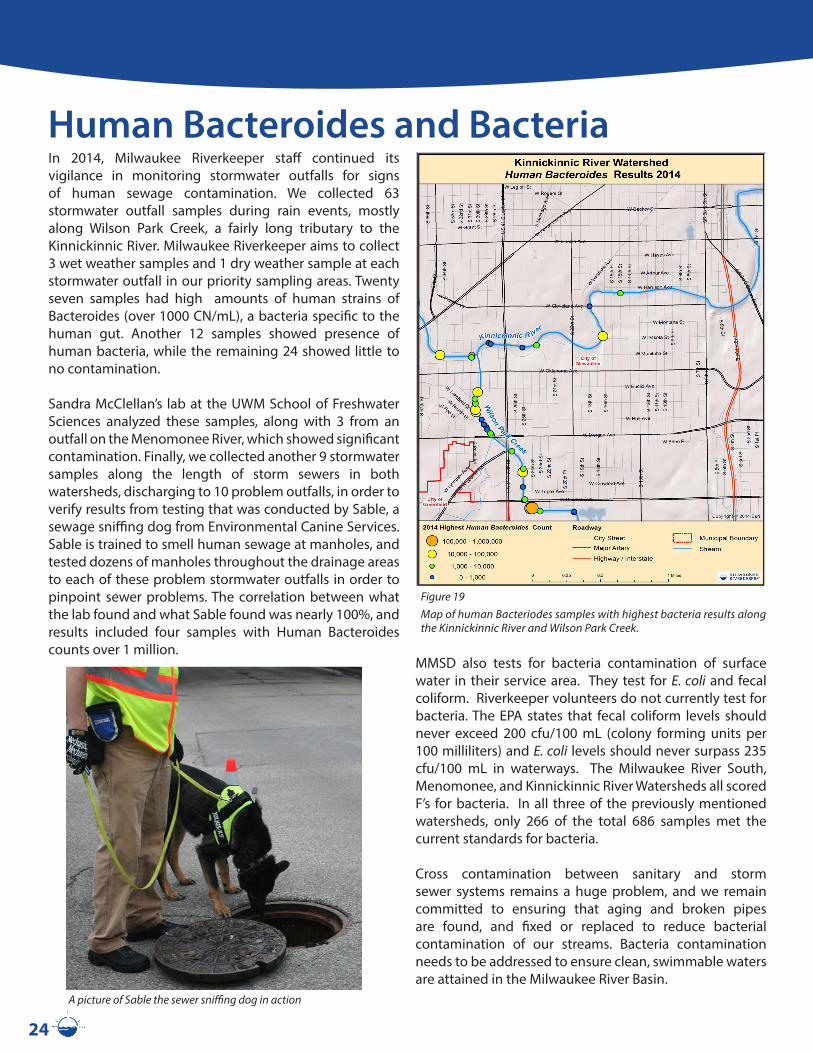
Human Bacteroides and BacteriaIn 2014, Milwaukee Riverkeeper staff continued its vigilance in monitoring stormwater outfalls for signs of human sewage contamination. We collected 63 stormwater outfall samples during rain events, mostly along Wilson Park Creek, a fairly long tributary to the Kinnickinnic River. Milwaukee Riverkeeper aims to collect 3 wet weather samples and 1 dry weather sample at each stormwater outfall in our priority sampling areas. Twenty seven samples had high amounts of human strains of Bacteroides (over 1000 CN/mL), a bacteria specific to the human gut. Another 12 samples showed presence of human bacteria, while the remaining 24 showed little to no contamination.
Sandra McClellan’s lab at the UWM School of Freshwater Sciences analyzed these samples, along with 3 from an outfall on the Menomonee River, which showed significant contamination. Finally, we collected another 9 stormwater samples along the length of storm sewers in both watersheds, discharging to 10 problem outfalls, in order to verify results from testing that was conducted by Sable, a sewage sniffing dog from Environmental Canine Services. Sable is trained to smell human sewage at manholes, and tested dozens of manholes throughout the drainage areas to each of these problem stormwater outfalls in order to pinpoint sewer problems. The correlation between what the lab found and what Sable found was nearly 100%, and results included four samples with Human Bacteroides counts over 1 million.
MMSD also tests for bacteria contamination of surface water in their service area. They test for E. coli and fecal coliform. Riverkeeper volunteers do not currently test for bacteria. The EPA states that fecal coliform levels should never exceed 200 cfu/100 mL (colony forming units per 100 milliliters) and E. coli levels should never surpass 235 cfu/100 mL in waterways. The Milwaukee River South, Menomonee, and Kinnickinnic River Watersheds all scored F’s for bacteria. In all three of the previously mentioned watersheds, only 266 of the total 686 samples met the current standards for bacteria.
Cross contamination between sanitary and storm sewer systems remains a huge problem, and we remain committed to ensuring that aging and broken pipes are found, and fixed or replaced to reduce bacterial contamination of our streams. Bacteria contamination needs to be addressed to ensure clean, swimmable waters are attained in the Milwaukee River Basin.
Figure 19
A picture of Sable the sewer sniffing dog in action
Map of human Bacteriodes samples with highest bacteria results along the Kinnickinnic River and Wilson Park Creek.
24
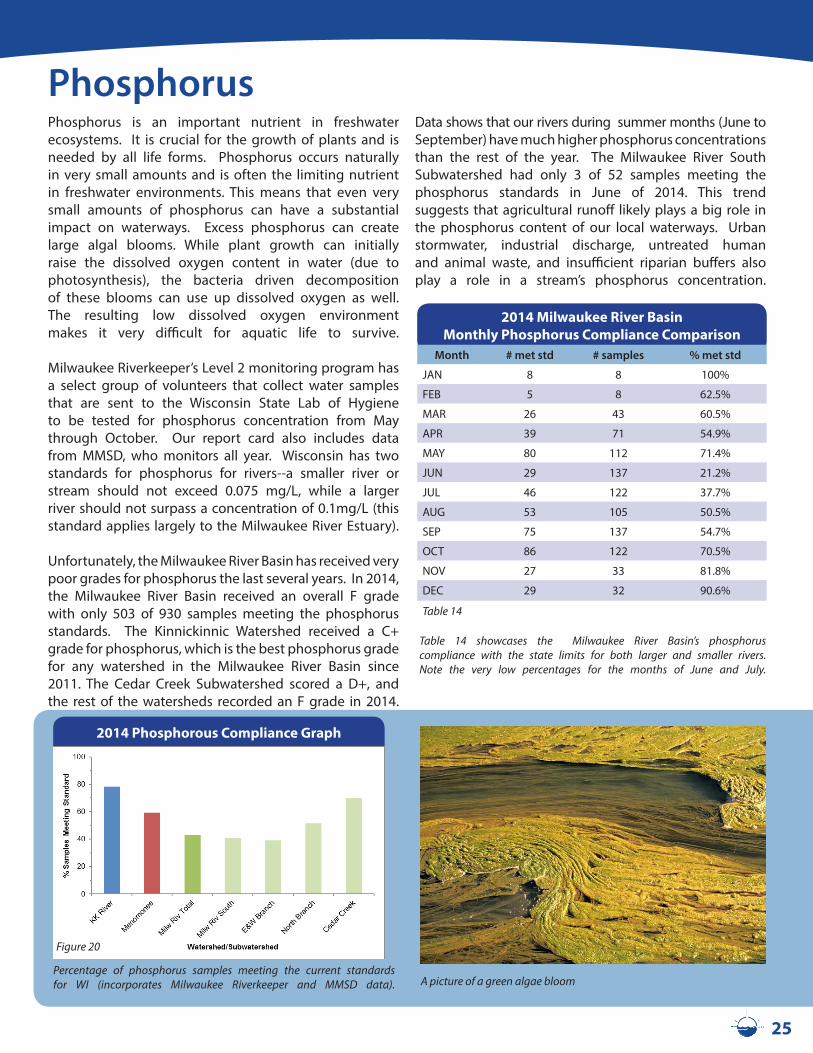
Phosphorus is an important nutrient in freshwater ecosystems. It is crucial for the growth of plants and is needed by all life forms. Phosphorus occurs naturally in very small amounts and is often the limiting nutrient in freshwater environments. This means that even very small amounts of phosphorus can have a substantial impact on waterways. Excess phosphorus can create large algal blooms. While plant growth can initially raise the dissolved oxygen content in water (due to photosynthesis), the bacteria driven decomposition of these blooms can use up dissolved oxygen as well. The resulting low dissolved oxygen environment makes it very difficult for aquatic life to survive.
Milwaukee Riverkeeper’s Level 2 monitoring program has a select group of volunteers that collect water samples that are sent to the Wisconsin State Lab of Hygiene to be tested for phosphorus concentration from May through October. Our report card also includes data from MMSD, who monitors all year. Wisconsin has two standards for phosphorus for rivers--a smaller river or stream should not exceed 0.075 mg/L, while a larger river should not surpass a concentration of 0.1mg/L (this standard applies largely to the Milwaukee River Estuary).
Unfortunately, the Milwaukee River Basin has received very poor grades for phosphorus the last several years. In 2014, the Milwaukee River Basin received an overall F grade with only 503 of 930 samples meeting the phosphorus standards. The Kinnickinnic Watershed received a C+ grade for phosphorus, which is the best phosphorus grade for any watershed in the Milwaukee River Basin since 2011. The Cedar Creek Subwatershed scored a D+, and the rest of the watersheds recorded an F grade in 2014.
Data shows that our rivers during summer months (June toSeptember) have much higher phosphorus concentrations than the rest of the year. The Milwaukee River South Subwatershed had only 3 of 52 samples meeting the phosphorus standards in June of 2014. This trend suggests that agricultural runoff likely plays a big role in the phosphorus content of our local waterways. Urban stormwater, industrial discharge, untreated human and animal waste, and insufficient riparian buffers also play a role in a stream’s phosphorus concentration.
2014 Phosphorous Compliance Graph
Phosphorus
2014 Milwaukee River Basin Monthly Phosphorus Compliance Comparison
Month # met std # samples % met std
JAN 8 8 100%
FEB 5 8 62.5%
MAR 26 43 60.5%
APR 39 71 54.9%
MAY 80 112 71.4%
JUN 29 137 21.2%
JUL 46 122 37.7%
AUG 53 105 50.5%
SEP 75 137 54.7%
OCT 86 122 70.5%
NOV 27 33 81.8%
DEC 29 32 90.6%
Table 14
Table 14 showcases the Milwaukee River Basin’s phosphorus compliance with the state limits for both larger and smaller rivers. Note the very low percentages for the months of June and July.
A picture of a green algae bloom
25
Percentage of phosphorus samples meeting the current standards for WI (incorporates Milwaukee Riverkeeper and MMSD data).
Figure 20
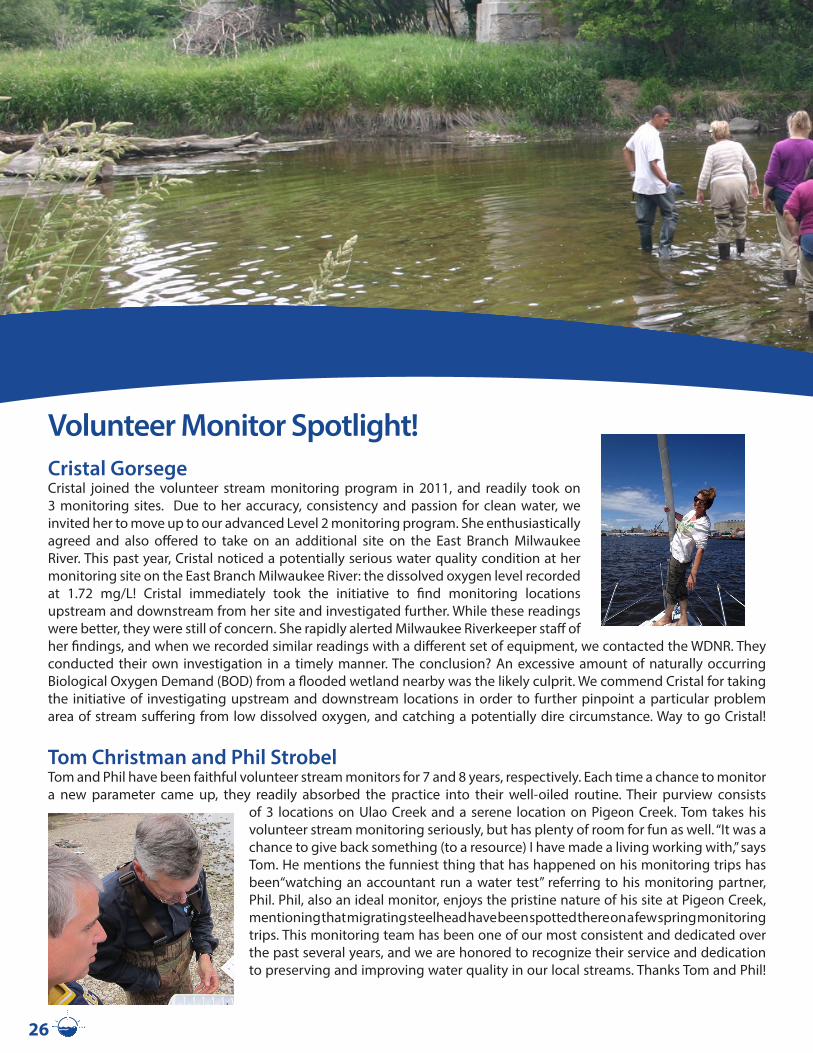
Volunteer Monitor Spotlight!Cristal GorsegeCristal joined the volunteer stream monitoring program in 2011, and readily took on 3 monitoring sites. Due to her accuracy, consistency and passion for clean water, we invited her to move up to our advanced Level 2 monitoring program. She enthusiastically agreed and also offered to take on an additional site on the East Branch Milwaukee River. This past year, Cristal noticed a potentially serious water quality condition at her monitoring site on the East Branch Milwaukee River: the dissolved oxygen level recorded at 1.72 mg/L! Cristal immediately took the initiative to find monitoring locations upstream and downstream from her site and investigated further. While these readings were better, they were still of concern. She rapidly alerted Milwaukee Riverkeeper staff of her findings, and when we recorded similar readings with a different set of equipment, we contacted the WDNR. They conducted their own investigation in a timely manner. The conclusion? An excessive amount of naturally occurring Biological Oxygen Demand (BOD) from a flooded wetland nearby was the likely culprit. We commend Cristal for taking the initiative of investigating upstream and downstream locations in order to further pinpoint a particular problem area of stream suffering from low dissolved oxygen, and catching a potentially dire circumstance. Way to go Cristal!
Tom Christman and Phil StrobelTom and Phil have been faithful volunteer stream monitors for 7 and 8 years, respectively. Each time a chance to monitor a new parameter came up, they readily absorbed the practice into their well-oiled routine. Their purview consists
of 3 locations on Ulao Creek and a serene location on Pigeon Creek. Tom takes his volunteer stream monitoring seriously, but has plenty of room for fun as well. “It was a chance to give back something (to a resource) I have made a living working with,” says Tom. He mentions the funniest thing that has happened on his monitoring trips has been“watching an accountant run a water test” referring to his monitoring partner, Phil. Phil, also an ideal monitor, enjoys the pristine nature of his site at Pigeon Creek, mentioning that migrating steelhead have been spotted there on a few spring monitoring trips. This monitoring team has been one of our most consistent and dedicated over the past several years, and we are honored to recognize their service and dedication to preserving and improving water quality in our local streams. Thanks Tom and Phil!
26
Top 10 Ways You Can Help Protect and Improve Our Waters!1. Conserve water both inside and outside the home. Reduce use of water during heavy rain storms to reduce stress
on local sewers and protect our rivers and Lake Michigan from sewage overflows.2. Clean up after your pets! Pet waste is a major source of bacteria in our rivers and streams.3. Reduce, minimize, or eliminate use of pesticides and salt on your lawn and paved surfaces.4. Decrease runoff! Install rain gardens, rain barrels, cisterns, and plant native vegetation to cutback the effect of the
paved surfaces around your home. This will reduce stormwater runoff by catching and encouraging slow infiltra-tion of rain and snow melt. Attend our rain barrel workshop in the spring!
5. Take unused pharmaceuticals to a disposal center! Most wastewater treatment plants are not designed to re-move pharmaceutical drugs from wastewater. These drugs can end up in rivers where they may harm and disrupt fish and aquatic life reproduction.
6. Vote GREEN and advocate for fishable, swimmable, drinkable rivers and lakes. Contact elected officials and let them know that the health of the rivers and Lake Michigan is important to you. Attend our advocacy events!
7. Get involved! Join us for river cleanups and other community events to clean up and protect our rivers and the land that drains to them. Find these events at www.milwaukeeriverkeeper.org!
8. Adopt a River! Keep an eye on a section of river near you and report potential sources of pollution from construc-tion sites or stormwater outfalls, eroding areas, and other problems to Milwaukee Riverkeeper at 414-287-0207 or to the WDNR at 1-800-TIP-WDNR.
9. Become a monitor! We train a new group of volunteers every spring. This is a great way to get involved and learn more about water quality and river health.
10. Stay up to date on current issues affecting water quality and wildlife habitat. Sign up for Riverkeeper news at www.milwaukeeriverkeeper.org to get updates or follow us on facebook and twitter @mkeriverkeeper!
Learn more about the health of the Milwaukee River Basin and donate to support Milwaukee Riverkeeper in our work of restoring streambanks, identifying pollution, and fighting for strong policies and enforcement of laws to keep our water clean at www.milwaukeeriverkeeper.org.
Donate at www.milwaukeeriverkeeper.org/donate
27
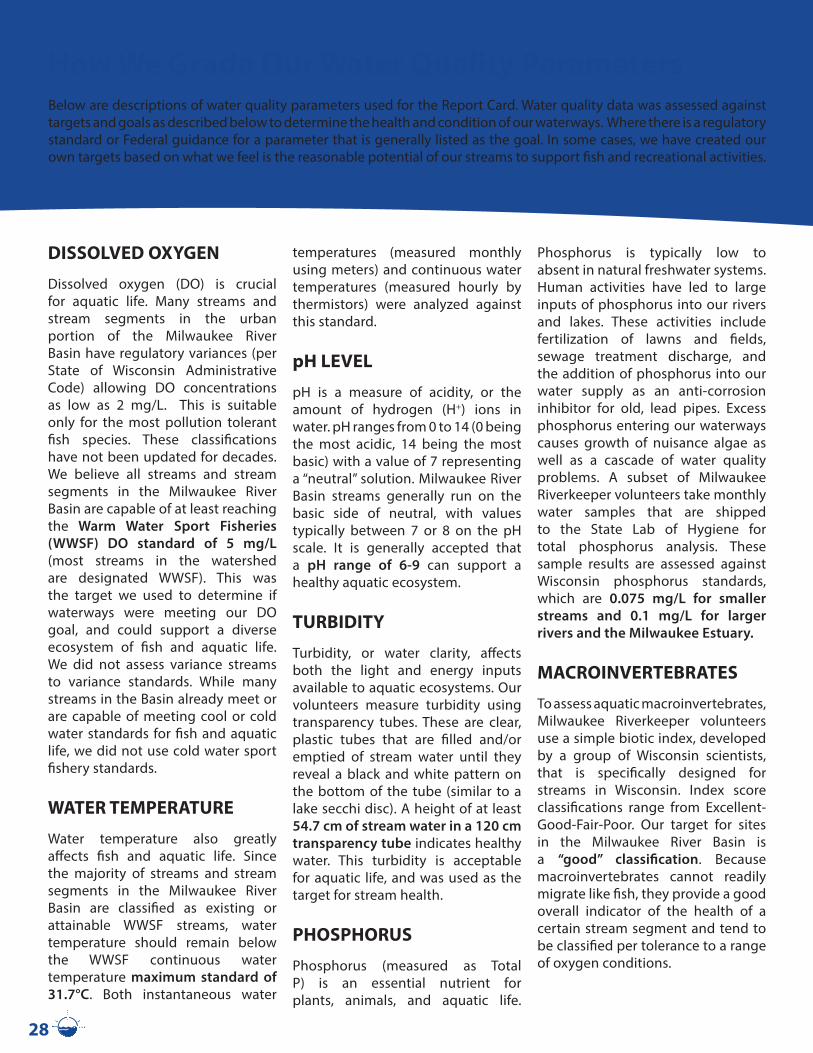
How We Grade Our Water Quality ParametersBelow are descriptions of water quality parameters used for the Report Card. Water quality data was assessed against targets and goals as described below to determine the health and condition of our waterways. Where there is a regulatory standard or Federal guidance for a parameter that is generally listed as the goal. In some cases, we have created our own targets based on what we feel is the reasonable potential of our streams to support fish and recreational activities.
DISSOLVED OXYGEN
Dissolved oxygen (DO) is crucial for aquatic life. Many streams and stream segments in the urban portion of the Milwaukee River Basin have regulatory variances (per State of Wisconsin Administrative Code) allowing DO concentrations as low as 2 mg/L. This is suitable only for the most pollution tolerant fish species. These classifications have not been updated for decades. We believe all streams and stream segments in the Milwaukee River Basin are capable of at least reaching the Warm Water Sport Fisheries (WWSF) DO standard of 5 mg/L (most streams in the watershed are designated WWSF). This was the target we used to determine if waterways were meeting our DO goal, and could support a diverse ecosystem of fish and aquatic life. We did not assess variance streams to variance standards. While many streams in the Basin already meet or are capable of meeting cool or cold water standards for fish and aquatic life, we did not use cold water sport fishery standards.
WATER TEMPERATURE
Water temperature also greatly affects fish and aquatic life. Since the majority of streams and stream segments in the Milwaukee River Basin are classified as existing or attainable WWSF streams, water temperature should remain below the WWSF continuous water temperature maximum standard of 31.7°C. Both instantaneous water
temperatures (measured monthly using meters) and continuous water temperatures (measured hourly by thermistors) were analyzed against this standard.
pH LEVEL
pH is a measure of acidity, or the amount of hydrogen (H+) ions in water. pH ranges from 0 to 14 (0 being the most acidic, 14 being the most basic) with a value of 7 representing a “neutral” solution. Milwaukee River Basin streams generally run on the basic side of neutral, with values typically between 7 or 8 on the pH scale. It is generally accepted that a pH range of 6-9 can support a healthy aquatic ecosystem.
TURBIDITY
Turbidity, or water clarity, affects both the light and energy inputs available to aquatic ecosystems. Our volunteers measure turbidity using transparency tubes. These are clear, plastic tubes that are filled and/or emptied of stream water until they reveal a black and white pattern on the bottom of the tube (similar to a lake secchi disc). A height of at least 54.7 cm of stream water in a 120 cm transparency tube indicates healthy water. This turbidity is acceptable for aquatic life, and was used as the target for stream health.
PHOSPHORUS
Phosphorus (measured as Total P) is an essential nutrient for plants, animals, and aquatic life.
Phosphorus is typically low to absent in natural freshwater systems. Human activities have led to large inputs of phosphorus into our rivers and lakes. These activities include fertilization of lawns and fields, sewage treatment discharge, and the addition of phosphorus into our water supply as an anti-corrosion inhibitor for old, lead pipes. Excess phosphorus entering our waterways causes growth of nuisance algae as well as a cascade of water quality problems. A subset of Milwaukee Riverkeeper volunteers take monthly water samples that are shipped to the State Lab of Hygiene for total phosphorus analysis. These sample results are assessed against Wisconsin phosphorus standards, which are 0.075 mg/L for smaller streams and 0.1 mg/L for larger rivers and the Milwaukee Estuary.
MACROINVERTEBRATES
To assess aquatic macroinvertebrates, Milwaukee Riverkeeper volunteers use a simple biotic index, developed by a group of Wisconsin scientists, that is specifically designed for streams in Wisconsin. Index score classifications range from Excellent-Good-Fair-Poor. Our target for sites in the Milwaukee River Basin is a “good” classification. Because macroinvertebrates cannot readily migrate like fish, they provide a good overall indicator of the health of a certain stream segment and tend to be classified per tolerance to a range of oxygen conditions.
28
CHLORIDE
High chloride concentrations in rivers and streams are toxic to aquatic organisms. Road salt runoff constitutes a large source of chloride. Elevated levels of chloride can disrupt an organism’s ability to maintain a natural internal water balance, which leads to impaired survival, growth, and/or reproduction. The Environmental Protection Agency (EPA) has set an acute chloride standard at 860 mg/L and a chronic chloride standard of 230 mg/L as targets for healthy streams. These levels recognize that high levels of chloride can be acutely or instantly toxic to fish, but that lower levels of chloride over a longer period of time or chronic exposure can be just as toxic. Chloride data was assessed against these targets to determine grades. Grades for acute and chronic criteria were averaged to determine an overall grade.
CONDUCTIVITY
Conductivity is a measure of the ability of water to pass an electrical current. Conductivity in water is affected by charged particles (ions), which can be both positive (cation) and negative (anion). Anions include chloride, nitrate, sulfate, and phosphate. Positive ions include sodium, magnesium, calcium, iron, and aluminum. Conductivity in streams is naturally affected by geology. Bedrock streams tend to have lower conductivity whereas streams passing through clay soils tend to have higher conductivity. Anthropogenic discharges to streams -- such as discharge of industrial waste (e.g., heavy metals), sewage, or other “charged” contaminants such as chloride, phosphate, and nitrate -- can raise conductivity. A conductivity reading of 150 - 500 µS/cm provides for a healthy aquatic ecosystem with mixed fisheries according to Federal guidance, and
this threshold was used as the target for determining water quality grades for this parameter.
BACTERIA
High bacteria concentrations impact not only stream health, but also human health. Regulatory agencies such as MMSD and WDNR regularly test for fecal coliform and E. coli bacteria in surface waters. According to State of Wisconsin Recreational Use Standards, fecal coliform levels should never exceed 200 CFU/100 mL (colony forming units/100 milliliter sample) in waterways, and the EPA established an E. coli standard of 235 CFU/100 mL for beaches. The percentage of samples meeting these recreational health targets was used to determine water quality grades for bacteria. Waters were not assessed to variance standards.
HUMAN BACTEROIDES
Historically high levels of bacteria along stretches of the Menomonee and Kinnickinnic Rivers in Milwaukee and Wauwatosa led Milwaukee Riverkeeper (along with the University of Wisconsin - Milwaukee School of Freshwater Sciences) to investigate the possibility that failing sewer infrastructure was the culprit. Sandra McLellan’s Lab at UWM has developed techniques to identify and quantify the presence and concentration of human bacteria in stormwater using a genetic test called qPCR, which can count DNA sequences in a sample that are associated with human sewage. We looked at the percentage of samples that tested negative for human strains of Bacteroides to determine our grade. For example, at least 90% of samples testing negative would be an A grade.
NOTE: It should be noted that DNR and volunteer baseline data was only analyzed from May – October. Bacteria data, such as human Bacteroides, was collected from April through November, and chloride and conductivity data was collected during the winter “road salt season” or roughly December through March.
MMSD, on the other hand, collects data year round. This heavily impacted our final chloride and conductivity grades. Also, MMSD confines their monitoring to sites in the Menomonee and Kinnickinnic River Watersheds, and the southern portion of the Milwaukee River South Subwatershed. Hence, the grades in the southern half of the Basin were heavily skewed towards MMSD data and grades for the upper half of our Basin had comparatively fewer data points.
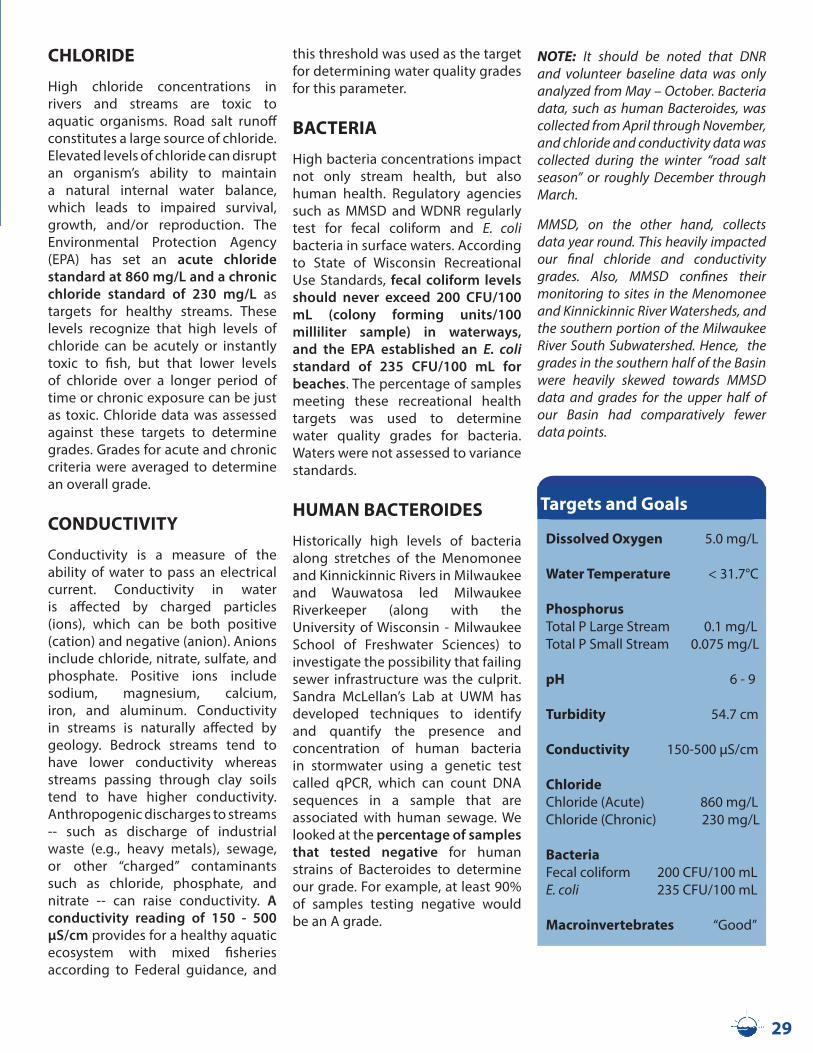
Dissolved Oxygen 5.0 mg/L
Water Temperature < 31.7°C
PhosphorusTotal P Large Stream 0.1 mg/LTotal P Small Stream 0.075 mg/L
pH 6 - 9
Turbidity 54.7 cm
Conductivity 150-500 µS/cm
ChlorideChloride (Acute) 860 mg/LChloride (Chronic) 230 mg/L
BacteriaFecal coliform 200 CFU/100 mLE. coli 235 CFU/100 mL
Macroinvertebrates “Good”
Targets and Goals
29

1845 N. Farwell Ave. Suite 100, Milwaukee, WI 53202414-287-0207 | www.milwaukeeriverkeeper.org
Help us monitor and advocate for our rivers. Donate at www.milwaukeeriverkeeper.org.
Our MissionMilwaukee Riverkeeper’s mission is to protect water quality and wildlife habitat in the river corridors and to advocate for sound land use in the Milwaukee, Menomonee, and Kinnickinnic River Watersheds. We envision a future where all people within the Milwaukee River Basin can enjoy clean drinking water and fishable, swimmable rivers.
Milwaukee Riverkeeper serves as an advocate and voice for the Milwaukee, Menomonee, and Kinnickinnic Rivers. Our core programming involves patrolling, monitoring, and advocating on behalf of the rivers. We also coordinate hands-on river restoration projects and organize thousands of volunteers each year in river cleanups. We connect people to water through river-focused events and educate our community about water quality and river health.
Milwaukee Riverkeeper is a licensed member of the Waterkeeper Alliance, an international coalition dedicated to clean water and healthy communities.
Clean Rivers & People Enjoying Them