Embed Size (px)
Citation preview
Milwaukee River Report Card
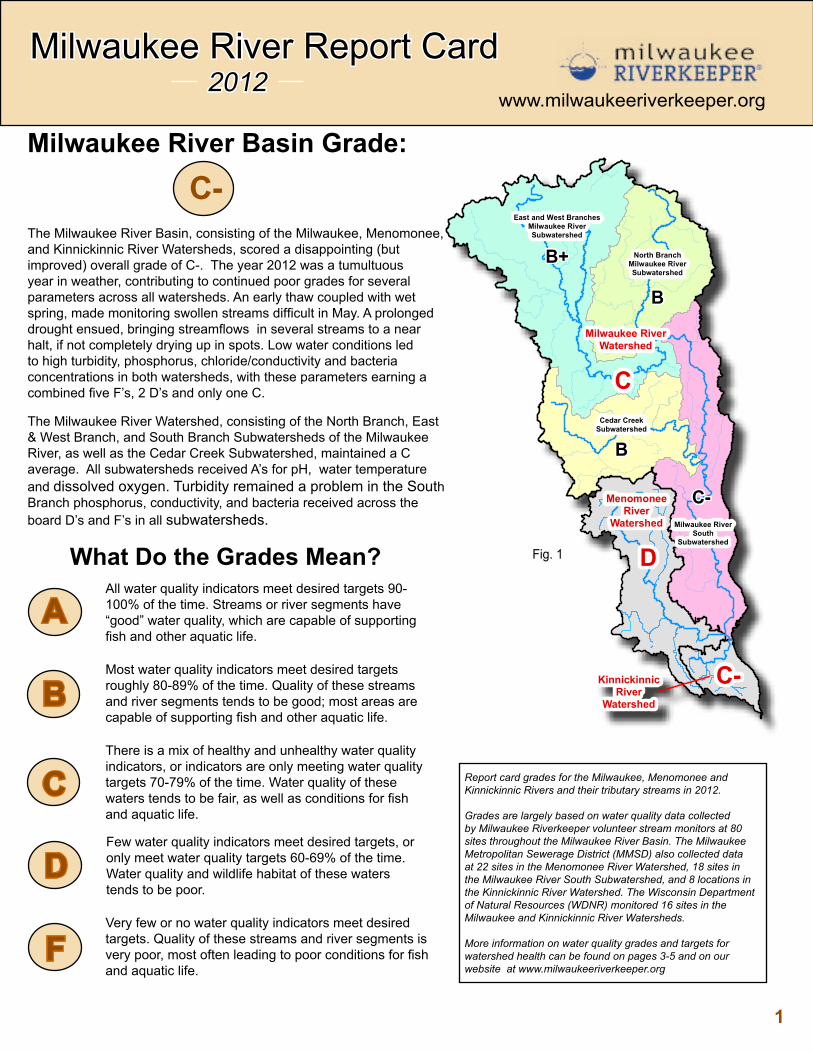
The Milwaukee River Basin, consisting of the Milwaukee, Menomonee, and Kinnickinnic River Watersheds, scored a disappointing (but improved) overall grade of C-. The year 2012 was a tumultuous year in weather, contributing to continued poor grades for several parameters across all watersheds. An early thaw coupled with wet spring, made monitoring swollen streams difficult in May. A prolonged drought ensued, bringing streamflows in several streams to a near halt, if not completely drying up in spots. Low water conditions led to high turbidity, phosphorus, chloride/conductivity and bacteria concentrations in both watersheds, with these parameters earning a combined five F’s, 2 D’s and only one C.
The Milwaukee River Watershed, consisting of the North Branch, East & West Branch, and South Branch Subwatersheds of the Milwaukee River, as well as the Cedar Creek Subwatershed, maintained a C average. All subwatersheds received A’s for pH, water temperature and dissolved oxygen. Turbidity remained a problem in the South Branch phosphorus, conductivity, and bacteria received across the board D’s and F’s in all subwatersheds.
Report card grades for the Milwaukee, Menomonee and Kinnickinnic Rivers and their tributary streams in 2012.
Grades are largely based on water quality data collected by Milwaukee Riverkeeper volunteer stream monitors at 80 sites throughout the Milwaukee River Basin. The Milwaukee Metropolitan Sewerage District (MMSD) also collected data at 22 sites in the Menomonee River Watershed, 18 sites in the Milwaukee River South Subwatershed, and 8 locations in the Kinnickinnic River Watershed. The Wisconsin Department of Natural Resources (WDNR) monitored 16 sites in the Milwaukee and Kinnickinnic River Watersheds.
More information on water quality grades and targets for watershed health can be found on pages 3-5 and on our website at www.milwaukeeriverkeeper.org
Milwaukee River Basin Grade:
2012
All water quality indicators meet desired targets 90-100% of the time. Streams or river segments have “good” water quality, which are capable of supporting fish and other aquatic life.
What Do the Grades Mean?
C-
Most water quality indicators meet desired targets roughly 80-89% of the time. Quality of these streams and river segments tends to be good; most areas are capable of supporting fish and other aquatic life.
There is a mix of healthy and unhealthy water quality indicators, or indicators are only meeting water quality targets 70-79% of the time. Water quality of these waters tends to be fair, as well as conditions for fish and aquatic life.
Few water quality indicators meet desired targets, or only meet water quality targets 60-69% of the time. Water quality and wildlife habitat of these waters tends to be poor.
Very few or no water quality indicators meet desired targets. Quality of these streams and river segments is very poor, most often leading to poor conditions for fish and aquatic life.
A
B
C
D
F
1
East and West BranchesMilwaukee RiverSubwatershed
B+
CCedar Creek
Subwatershed
D
North BranchMilwaukee RiverSubwatershed
B
B
C-
C-
Milwaukee RiverSouth
Subwatershed
Milwaukee RiverWatershed
KinnickinnicRiver
Watershed
MenomoneeRiver
Watershed
www.milwaukeeriverkeeper.org
Fig. 1
Dear Friend of the River,
Welcome to our third annual Milwaukee River Report Card. This year’s report card summarizes the 2012 water quality of the Milwaukee River Basin, which includes the Kinnickinnic and Menomonee River Watersheds, in addition to the Milwaukee River Watershed (consisting of the Cedar Creek, East & West Branch, North Branch and South Branch Subwatersheds). Water quality grades are based on data from our dedicated cadre of Milwaukee Riverkeeper citizen stream monitoring volunteers, as well as data from the Milwaukee Metropolitan Sewerage District (MMSD) and the Wisconsin Department of Natural Resources (WDNR).
This annual report card keeps you informed of our progress towards meeting the fishable, swimmable goals for our local watersheds as envisioned under the Clean Water Act. It provides a snapshot of the health of the river at subwatershed, watershed, and basin levels, as measured by basic water quality parameters such as dissolved oxygen, temperature, turbidity, pH, and macroinvertebrates (aquatic organisms). as well as data for contaminants such as bacteria, phosphorus, chloride, and conductivity which are major impediments to our rivers meeting their fishable and swimmable goals.
Lastly, the report card provides ideas for what you can do to help improve the water quality of our watersheds. If we are serious about achieving clean water and healthy communities, we must change the way we live on the land. By all working together, we can be the solution to the pollution affecting our waterways!
Sincerely,
Cheryl Nenn, Riverkeeper Joe Rath, Water Quality Specialist
P.S. If you are interested in becoming a citizen stream monitor, please contact us!
Introduction
1845 N. Farwell Ave., Suite 100Milwaukee, WI 53202
414-287-0207www.milwaukeeriverkeeper.org
Ta b l e o f C o n t e n t s
2
3
How Did We Grade Water Quality Parameters?
DISSOLVED OXYGEN (DO)
Dissolved oxygen is crucial for aquatic life. Some streams and steam segments in the Milwaukee River Basin have regulatory variances (per State of Wisconsin Administrative Code) allowing DO concentrations as low as 2 mg/L, which is suitable only for the most pollution tolerant fish species. However, we believe all streams and stream segments in the Milwaukee River Basin can reach at least the Warm Water Sport Fishery (WWSF) concentration of 5 mg/L (most streams in the watershed are designated WWSF), and this was the target we used to determine if waterways could support a diverse ecosystem of fish and aquatic life. There are many streams in the basin already meeting or capable of meeting cool or cold water standards for fish and aquatic life.
TEMPERATURE
Water temperature also greatly affects fish and aquatic life. As the majority of streams and stream segments in the Milwaukee River Basin are classified as existing or attainable WWSF streams, we believe the water temperature target should at least remain below the WWSF continuous water temperature maximum standard of 31.7°C. Both instantaneous water temperatures (measured monthly using meters) and continuous water temperatures
(measured hourly by thermistors) were analyzed against this standard.
pH LEVEL
pH is a measure of acidity, or the amount of hydrogen (H+) ions in the water. pH ranges from 0 to 14 (0 being most acidic, 14 being most basic) with a value of 7 representing a “neutral” solution. Milwaukee River Basin streams generally run on the basic side of neutral, with values typically between 7 or 8 on the pH scale. It is generally accepted that a pH range of 6-9 can support a healthy aquatic ecosystem.
TURBIDITY
Turbidity, or water clarity, affects both the light and energy inputs available to aquatic ecosystems. Our volunteers measure turbidity using transparency tubes; clear, plastic tubes, which are filled and/or emptied of stream water until they barely reveal the black and white pattern on the bottom of the tube (similar to a lake secchi disc). A height of at least 54.7 cm of stream water in a 120 cm transparency tube indicates a healthy water turbidity acceptable for aquatic life, and this was used as the target for stream health.
PHOSPHORUS
Phosphorus is an essential nutrient for plants, animals, and aquatic
life. Phosphorus is typically low to absent in natural freshwater systems. Human activities have led to large inputs of phosphorus into our rivers and lakes. These activities include fertilization of lawns and fields; sewage treatment discharge; and the addition of phosphorus into our water supply as an anti-corrosion inhibitor for old, lead pipes. Phosphorus entering our waterways causes growth of nuisance algae as well as a cascade of water quality problems (see phosphorus article on pg. 12). Riverkeeper advanced volunteers (or Level II) take monthly water samples that are shipped to the State Lab of Hygiene for total phosphorus analysis. These sample results are assessed against Wisconsin phosphorus standards, which are generally 0.075 mg/L for smaller streams and 0.1 mg/L for larger rivers and the Milwaukee Estuary. Riverkeeper beginner volunteers (Level I) use chemical titration kits (CHEMets kits) to test for orthophosphate, which is a common molecular form of phosphorus. The kits use acids that react with orthophosphate to turn water samples blue. Volunteers determine the level of orthophosphate by comparing the intensity of blue color to known standards, which get progressively darker in proportion to the orthophosphate present. Orthophosphate levels are assessed against EPA guidance of 0.1 mg/L, the
To determine water quality grades for the Milwaukee River Basin, a combination of Riverkeeper volunteer stream monitoring data and water quality data from two government agencies, WDNR and MMSD, were analyzed.
Data collected by Riverkeeper volunteers was assessed for several water quality parameters to determine grades for this report, including dissolved oxygen (DO), water temperature, pH, turbidity (or water clarity), and macroinvertebrate
life. Our citizen water quality monitors use standard, calibrated monitoring equipment to measure DO, water temperature, and pH on a monthly basis between May and October. Volunteers use transparency tubes to test for turbidity. Most volunteers also deploy continuous water temperature loggers called thermistors, which record hourly water temperature readings throughout the monitoring season. Macroinvertebrate data was used to assess aquatic ecosystem health. A subset of volunteers
also collected conductivity data, as well as collected water samples that were sent to the State Lab of Hygiene for chloride and total phosphorus analysis. WDNR water quality data for 16 sites and MMSD data from 48 sites was analyzed to supplement volunteer data.
Below is a description of water quality parameters assessed for the report card, and the targets or goals that water quality data was assessed against to determine health and condition of waterways.
4
Water Quality Parameters continued
recommended maximum for rivers and streams.
MACROINVERTEBRATES
To assess macroinvertebrates, Milwaukee Riverkeeper volunteers use a simple biotic index developed by a group of Wisconsin scientists and specifically designed for streams in Wisconsin. Index score classifications range from Excellent-Good-Fair-Poor. Our target for sites in the Milwaukee River Basin is a “good” classification. Because macroinvertebrates can’t readily migrate like fish, they provide a good overall indicator of the health of a certain reach of stream, and tend to be classified per their tolerance to a range of oxygen conditions
CHLORIDE
High chloride concentrations in rivers and streams are toxic to aquatic organisms. Road salt runoff constitutes a large source of chloride. Elevated levels of chloride can disrupt an organism’s ability to maintain a natural internal water balance, which leads to impaired survival, growth, and/or reproduction. The Environmental Protection Agency (EPA) has set an acute chloride standard at 860 mg/L and a chronic chloride standard of 230 mg/L as targets for healthy streams. These levels recognize that high levels of chloride can be acutely or instantly toxic to fish, but that lower levels of chloride over a longer period of time or chronic exposure can be just as toxic (see chloride article on pg. 14 for more information). Chloride data was assessed against these targets to determine grades. Grades for acute and chronic criteria were averaged to
determine an overall grade
CONDUCTIVITY
Conductivity is a measure of the ability of water to pass an electrical current. Conductivity in water is affected by charged particles (ions) which can be both positive (cation) and negative (anion). Anions (negative ions) include chloride, nitrate, sulfate and phosphate, and positive ions (cations) include sodium, magnesium, calcium, iron, and aluminum. Conductivity in streams is naturally affected by geology; for instance bedrock streams tend to have lower conductivity whereas streams passing through clay soils tend to have higher conductivity. Anthropogenic discharges to streams--such as discharge of industrial waste (e.g. heavy metals), sewage, or other “charged” contaminants such as chloride, phosphate, and nitrate--can raise conductivity. A conductivity reading of 150 - 500 umhos/cm provides for a healthy aquatic ecosystem with mixed fisheries, and this threshold was used as the target for determining water quality grades for this parameter.
BACTERIA
High bacteria concentrations impact not only stream health, but also human health. Regulatory agencies such as MMSD and WDNR regularly test for fecal coliform and E. coli bacteria. According to State of Wisconsin Recreational Use Standards, fecal coliform levels should never exceed 200 CFU/100 mL (colony forming units/100 milliliter sample) and the EPA established an E. coli standard of 235 CFU/100 mL (colony forming units/100
milliliter sample). The percentage of samples meeting these targets was used to determine water quality grades for bacteria.
HUMAN BACTEROIDES
Historically high levels of bacteria along stretches of the Menomonee and Kinnickinnic Rivers in Milwaukee and Wauwatosa led Milwaukee Riverkeeper (along with the Great Lakes Water Institute of the University of Wisconsin - Milwaukee or GLWI) to investigate the possibility that failing sewer infrastructure was the culprit. Sandra McLellan’s Lab at GLWI has developed techniques to identify and quantify the presence and concentration of human bacteria in stormwater using a genetic test called qPCR, which can count DNA sequences in a sample that are associated with human sewage. After four years of testing and analysis, we have found large concentrations of human waste entering the Menomonee and Kinnickinnic Rivers as well as Honey Creek and Underwood Creek, major tributaries to the Menomonee. We graded the streams based on the presence of human waste (percentage of samples testing negative for human strains of Bacteroides) entering the stream from stormwater outfalls.
NOTE: Grades for each water quality parameter are based on the percentage of time that the data points for the monitoring stations in each subwatershed meet our targets relating to overall aquatic ecosystem health. Grades were assigned on a typical percentage basis (90-100%=A, 80-89%=B, 70-79%=C, 60-69%=D and below 60%=F). Overall grades for each subwatershed were determined based on averaging grades for each individual parameter, and the overall watershed grade was determined by averaging the overall grades for each subwatershed. The overall Milwaukee River Basin grade was determined by averaging overall grades for the three watersheds.

What We Didn’t Grade in 2012
5
6
How Healthy is the Milwaukee River & its Tributaries?
Year Subwatershed DO pH Turbidity Water Temp Thermistors Phosphorus Conductivity
Cummulative Chloride
Cummulative Bacteria
2012 Milwaukee River South 93.0% 99.5% 59.4% 100.0% 99.8% 30.0% 5.3% 55.6% 68.5%A- A F A A F F F D+
2011 Milwaukee River South 97.4% 100.0% 67.0% 100.0% 99.0% 40.0% 7.5% 89.7% 53.1%A A D+ A A F F B+ F
2010 Milwaukee River South 96.0% 99.0% 67.0% 99.0% 99.9% 10.0% 48.0%A A D+ A A F F
2012 North Branch Milwaukee100.0% 100.0% 87.9% 100.0% 100.0% 50.0% 0.0%A A B+ A A F F
2011 North Branch Milwaukee70.0% 100.0% 85.0% 100.0% 99.0% 38.9% 0.0%C- A B A A F F
2010 North Branch Milwaukee64.7% 100.0% 76.5% 100.0% 100.0%D A C A A
2012 Cedar Creek 90.0% 100.0% 83.3% 100.0% 100.0% 62.1% 0.0%A- A B A A D- F
2011 Cedar Creek 94.9% 100.0% 93.9% 94.9% 99.8% 62.5% 4.8% 100.0%A A A A A D- F A
2010 Cedar Creek 95.0% 100.0% 92.5% 100.0% 99.8%A A A- A A
2012 East & West Branches 98.1% 98.0% 92.2% 100.0% 99.7% 58.5% 0.0%A A A- A A F F
2011 East & West Branches 100.0% 100.0% 100.0% 100.0% 100.0% 46.2% 0.0%A A A A A F F
2010 East & West Branches 100.0% 100.0% 91.7% 100.0%A A A- A
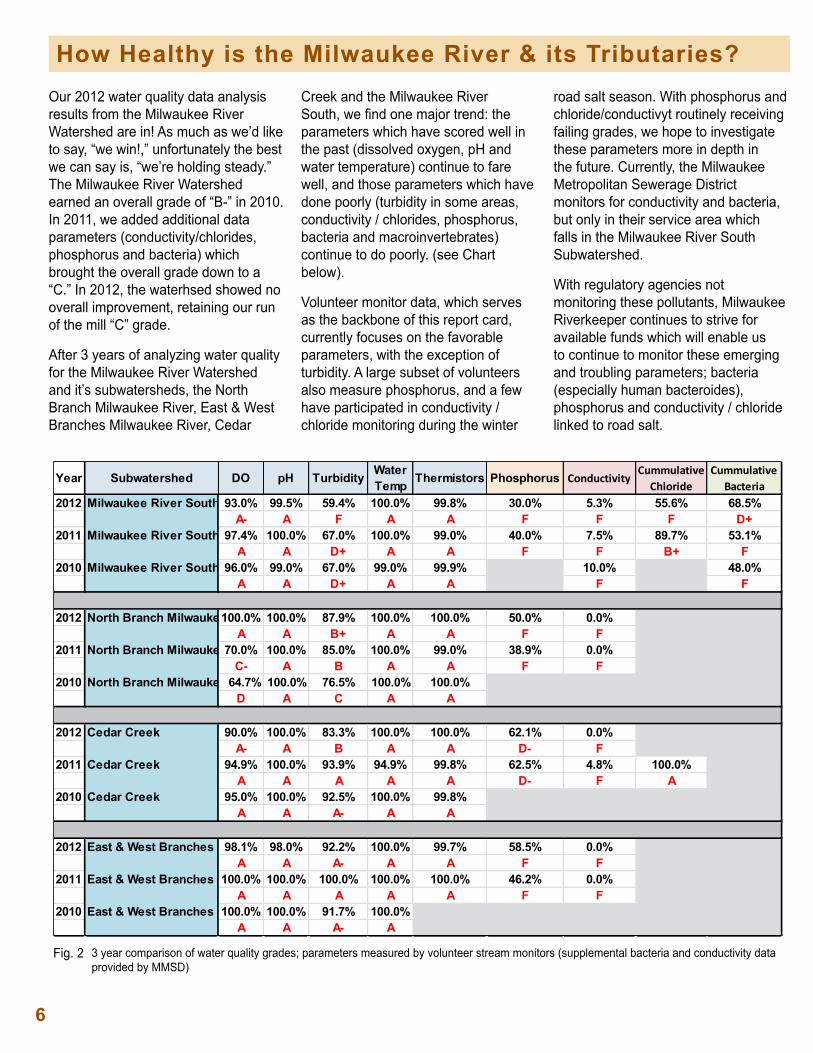
Our 2012 water quality data analysis results from the Milwaukee River Watershed are in! As much as we’d like to say, “we win!,” unfortunately the best we can say is, “we’re holding steady.” The Milwaukee River Watershed earned an overall grade of “B-” in 2010. In 2011, we added additional data parameters (conductivity/chlorides, phosphorus and bacteria) which brought the overall grade down to a “C.” In 2012, the waterhsed showed no overall improvement, retaining our run of the mill “C” grade.
After 3 years of analyzing water quality for the Milwaukee River Watershed and it’s subwatersheds, the North Branch Milwaukee River, East & West Branches Milwaukee River, Cedar
Creek and the Milwaukee River South, we find one major trend: the parameters which have scored well in the past (dissolved oxygen, pH and water temperature) continue to fare well, and those parameters which have done poorly (turbidity in some areas, conductivity / chlorides, phosphorus, bacteria and macroinvertebrates) continue to do poorly. (see Chart below).
Volunteer monitor data, which serves as the backbone of this report card, currently focuses on the favorable parameters, with the exception of turbidity. A large subset of volunteers also measure phosphorus, and a few have participated in conductivity / chloride monitoring during the winter
road salt season. With phosphorus and chloride/conductivyt routinely receiving failing grades, we hope to investigate these parameters more in depth in the future. Currently, the Milwaukee Metropolitan Sewerage District monitors for conductivity and bacteria, but only in their service area which falls in the Milwaukee River South Subwatershed.
With regulatory agencies not monitoring these pollutants, Milwaukee Riverkeeper continues to strive for available funds which will enable us to continue to monitor these emerging and troubling parameters; bacteria (especially human bacteroides), phosphorus and conductivity / chloride linked to road salt.
3 year comparison of water quality grades; parameters measured by volunteer stream monitors (supplemental bacteria and conductivity data provided by MMSD)
Fig. 2
###
#
#
#
#
#
#
#
##
####
#
###
#### ###
#
#
##
####
#
*
#
#
#
*
#
###
##
#
#
#
#
##
##
##
*
*
*
#
##
#
#
#
#
#
#
#
#
##
#
##
##
*
#
#
#
#*
*
#*
#
*# ##
DodgeCounty
MilwaukeeCounty
OzaukeeCounty
SheboyganCounty
Fond du LacCounty
WaukeshaCounty
Subwatershed
County Boundary
Lake Michigan
Stream
# MMSD Monitoring Location
# WDNR Monitoring Location
* MRK Macroinvertebrate Sampling Location
# MRK Monitoring Location
±0 5 102.5Miles
WashingtonCounty
B+B
C-
B LakeMichigan
OverallWatershed
Grade
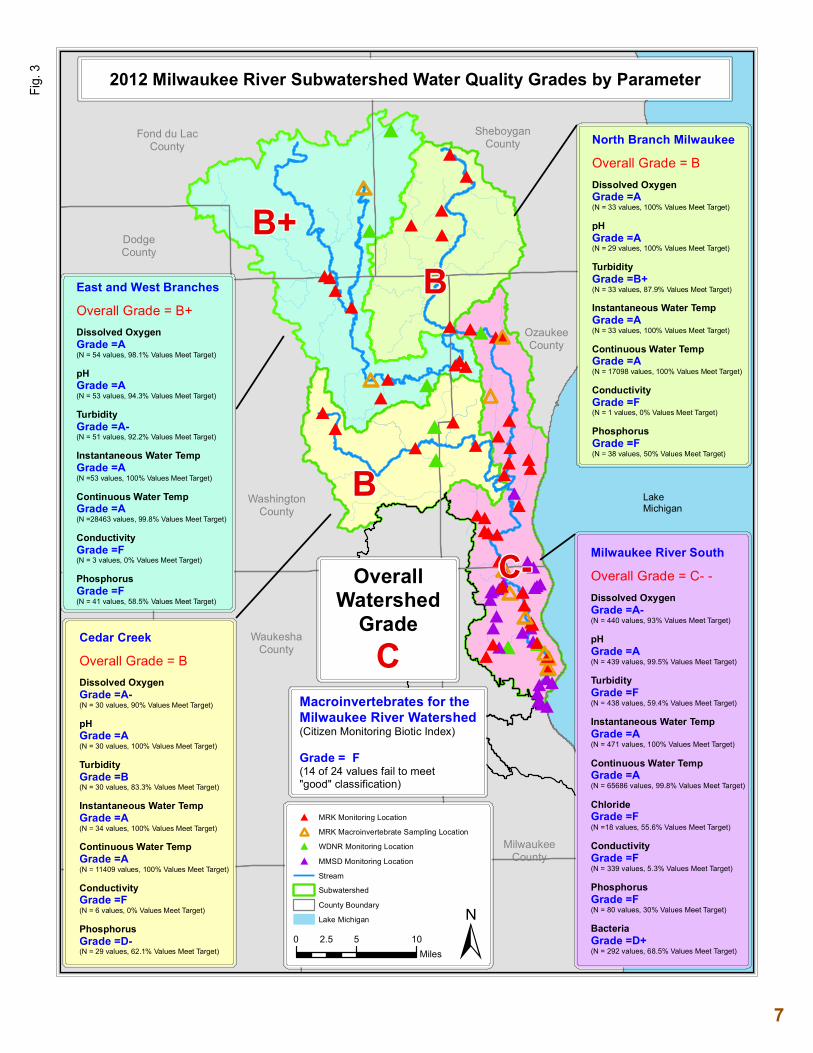
CMacroinvertebrates for theMilwaukee River Watershed(Citizen Monitoring Biotic Index)
Grade = F(14 of 24 values fail to meet"good" classification)
Milwaukee River South
Overall Grade = C- -Dissolved OxygenGrade =A-(N = 440 values, 93% Values Meet Target)
pHGrade =A(N = 439 values, 99.5% Values Meet Target)
TurbidityGrade =F(N = 438 values, 59.4% Values Meet Target)
Instantaneous Water TempGrade =A(N = 471 values, 100% Values Meet Target)
Continuous Water TempGrade =A(N = 65686 values, 99.8% Values Meet Target)
ChlorideGrade =F(N =18 values, 55.6% Values Meet Target)
ConductivityGrade =F(N = 339 values, 5.3% Values Meet Target)
PhosphorusGrade =F(N = 80 values, 30% Values Meet Target)
BacteriaGrade =D+(N = 292 values, 68.5% Values Meet Target)
Cedar Creek
Overall Grade = BDissolved OxygenGrade =A-(N = 30 values, 90% Values Meet Target)
pHGrade =A(N = 30 values, 100% Values Meet Target)
TurbidityGrade =B(N = 30 values, 83.3% Values Meet Target)
Instantaneous Water TempGrade =A(N = 34 values, 100% Values Meet Target)
Continuous Water TempGrade =A(N = 11409 values, 100% Values Meet Target)
ConductivityGrade =F(N = 6 values, 0% Values Meet Target)
PhosphorusGrade =D-(N = 29 values, 62.1% Values Meet Target)
North Branch Milwaukee
Overall Grade = BDissolved OxygenGrade =A(N = 33 values, 100% Values Meet Target)
pHGrade =A(N = 29 values, 100% Values Meet Target)
TurbidityGrade =B+(N = 33 values, 87.9% Values Meet Target)
Instantaneous Water TempGrade =A(N = 33 values, 100% Values Meet Target)
Continuous Water TempGrade =A(N = 17098 values, 100% Values Meet Target)
ConductivityGrade =F(N = 1 values, 0% Values Meet Target)
PhosphorusGrade =F(N = 38 values, 50% Values Meet Target)
2012 Milwaukee River Subwatershed Water Quality Grades by Parameter
East and West Branches
Overall Grade = B+ Dissolved OxygenGrade =A(N = 54 values, 98.1% Values Meet Target)
pHGrade =A(N = 53 values, 94.3% Values Meet Target)
TurbidityGrade =A-(N = 51 values, 92.2% Values Meet Target)
Instantaneous Water TempGrade =A(N =53 values, 100% Values Meet Target)
Continuous Water TempGrade =A(N =28463 values, 99.8% Values Meet Target)
ConductivityGrade =F(N = 3 values, 0% Values Meet Target)
PhosphorusGrade =F(N = 41 values, 58.5% Values Meet Target)
7
Fig.
3
Health of Kinnickinnic & Menomonee Rivers
8
Year Subwatershed DO pH Turbidity Water Temp Thermistors Phosphorus Conductivity
Cummulative Chloride
Fecal Coliform
Cummulative Bacteria
2012 Kinnickinnic River 82.6% 98.5% 64.2% 100.0% 98.6% 42.1% 27.0% 0.0% 48.7% 49.6%B- A D A A F F F F F
2011 Kinnickinnic River 76.7% 100.0% 51.4% 100.0% 100.0% 77.8% 12.6% 35.7% 33.3% 34.9%C+ A F A A C+ F F F F
2010 Kinnickinnic River
2012 Menomonee River 84.5% 99.7% 70.1% 100.0% 99.8% 36.9% 2.8% 75.0% 44.8% 44.3%B A C- A A F F C F F
2011 Menomonee River 93.8% 100.0% 53.2% 100.0% 100.0% 42.0% 5.2% 65.8% 51.2% 39.6%A A F A A F F F F F
2010 Menomonee River
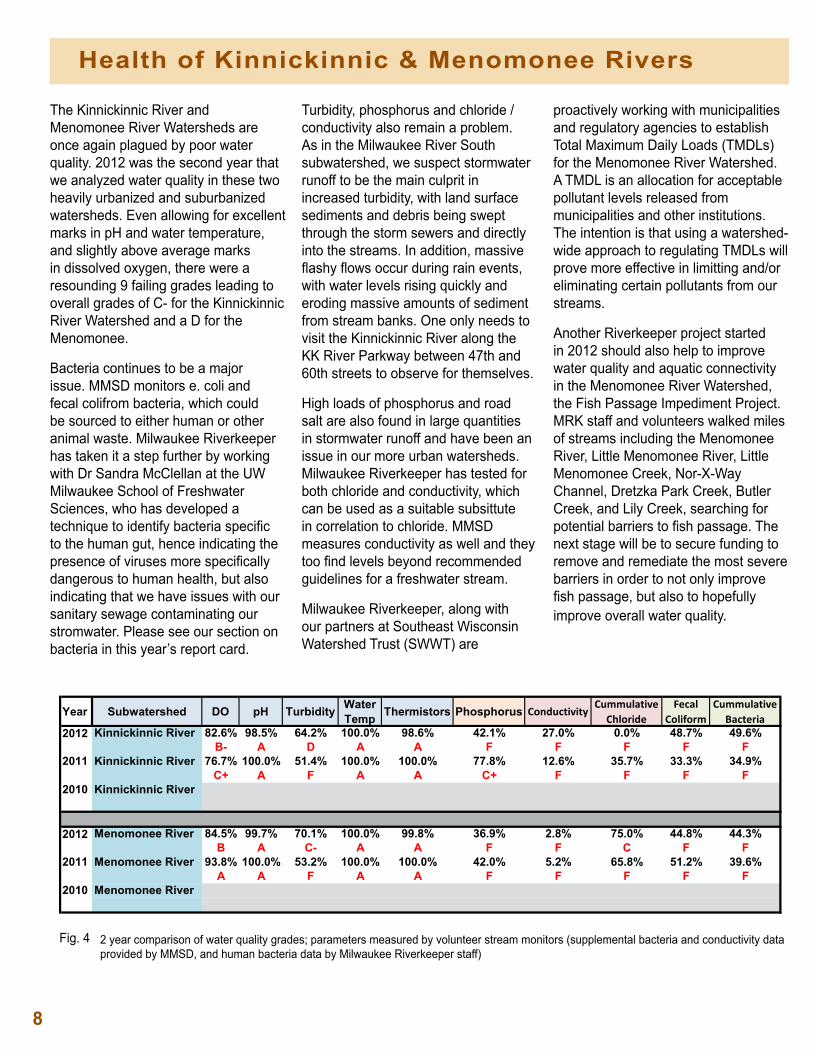
The Kinnickinnic River and Menomonee River Watersheds are once again plagued by poor water quality. 2012 was the second year that we analyzed water quality in these two heavily urbanized and suburbanized watersheds. Even allowing for excellent marks in pH and water temperature, and slightly above average marks in dissolved oxygen, there were a resounding 9 failing grades leading to overall grades of C- for the Kinnickinnic River Watershed and a D for the Menomonee.
Bacteria continues to be a major issue. MMSD monitors e. coli and fecal colifrom bacteria, which could be sourced to either human or other animal waste. Milwaukee Riverkeeper has taken it a step further by working with Dr Sandra McClellan at the UW Milwaukee School of Freshwater Sciences, who has developed a technique to identify bacteria specific to the human gut, hence indicating the presence of viruses more specifically dangerous to human health, but also indicating that we have issues with our sanitary sewage contaminating our stromwater. Please see our section on bacteria in this year’s report card.
Turbidity, phosphorus and chloride / conductivity also remain a problem. As in the Milwaukee River South subwatershed, we suspect stormwater runoff to be the main culprit in increased turbidity, with land surface sediments and debris being swept through the storm sewers and directly into the streams. In addition, massive flashy flows occur during rain events, with water levels rising quickly and eroding massive amounts of sediment from stream banks. One only needs to visit the Kinnickinnic River along the KK River Parkway between 47th and 60th streets to observe for themselves.
High loads of phosphorus and road salt are also found in large quantities in stormwater runoff and have been an issue in our more urban watersheds. Milwaukee Riverkeeper has tested for both chloride and conductivity, which can be used as a suitable subsittute in correlation to chloride. MMSD measures conductivity as well and they too find levels beyond recommended guidelines for a freshwater stream.
Milwaukee Riverkeeper, along with our partners at Southeast Wisconsin Watershed Trust (SWWT) are
proactively working with municipalities and regulatory agencies to establish Total Maximum Daily Loads (TMDLs) for the Menomonee River Watershed. A TMDL is an allocation for acceptable pollutant levels released from municipalities and other institutions. The intention is that using a watershed-wide approach to regulating TMDLs will prove more effective in limitting and/or eliminating certain pollutants from our streams.
Another Riverkeeper project started in 2012 should also help to improve water quality and aquatic connectivity in the Menomonee River Watershed, the Fish Passage Impediment Project. MRK staff and volunteers walked miles of streams including the Menomonee River, Little Menomonee River, Little Menomonee Creek, Nor-X-Way Channel, Dretzka Park Creek, Butler Creek, and Lily Creek, searching for potential barriers to fish passage. The next stage will be to secure funding to remove and remediate the most severe barriers in order to not only improve fish passage, but also to hopefully improve overall water quality.
2 year comparison of water quality grades; parameters measured by volunteer stream monitors (supplemental bacteria and conductivity data provided by MMSD, and human bacteria data by Milwaukee Riverkeeper staff)
Fig. 4
!(
!(
!(
!(
!(!( !(
!(
!(
!(
!(
!(
!(
!(
!(
!(
!(
!(
!(
!(!(!(
!(
!(
!(
!(
#
#
#
#
#
##
##
#
#
#
#
##
#
##
#
#
#
#
##
#
#
#
##
##
##
#
#
*#
#
#
*
#
*
*
*
#
#
#
#*
*
*
*
#
#
#
**
#
#
##
#
#
##
*##
##
*
*
*
*
*
#
Ozaukee
Washington
Waukesha
Milwaukee
Milwaukee
WashingtonCounty
Subwatershed
County Boundary
Lake Michigan
Stream
# MMSD Monitoring Location
# WDNR Monitoring Location
* MRK Macroinvertebrate Sampling Location
# MRK Monitoring Location
±0 2 41Miles
D
OzaukeeCounty
MilwaukeeCounty
Gol
dendale Creek
Will
owCre
ek
MenomoneeRiver
D
retzk
aPa
rkC
ree k
Littl
eM
enom
onee
Cre
ek
LakeMichigan
2012 Menomonee and KK River Watersheds Water Quality Grades
MenomoneeRiver
Watershed
KKRiver
Watershed
MenomoneeR
iver
Hon
eyCr
eek
K innickinnic R
iver
Wilson Park Creek C-
WaukeshaCounty
Underwo od Cre
ek
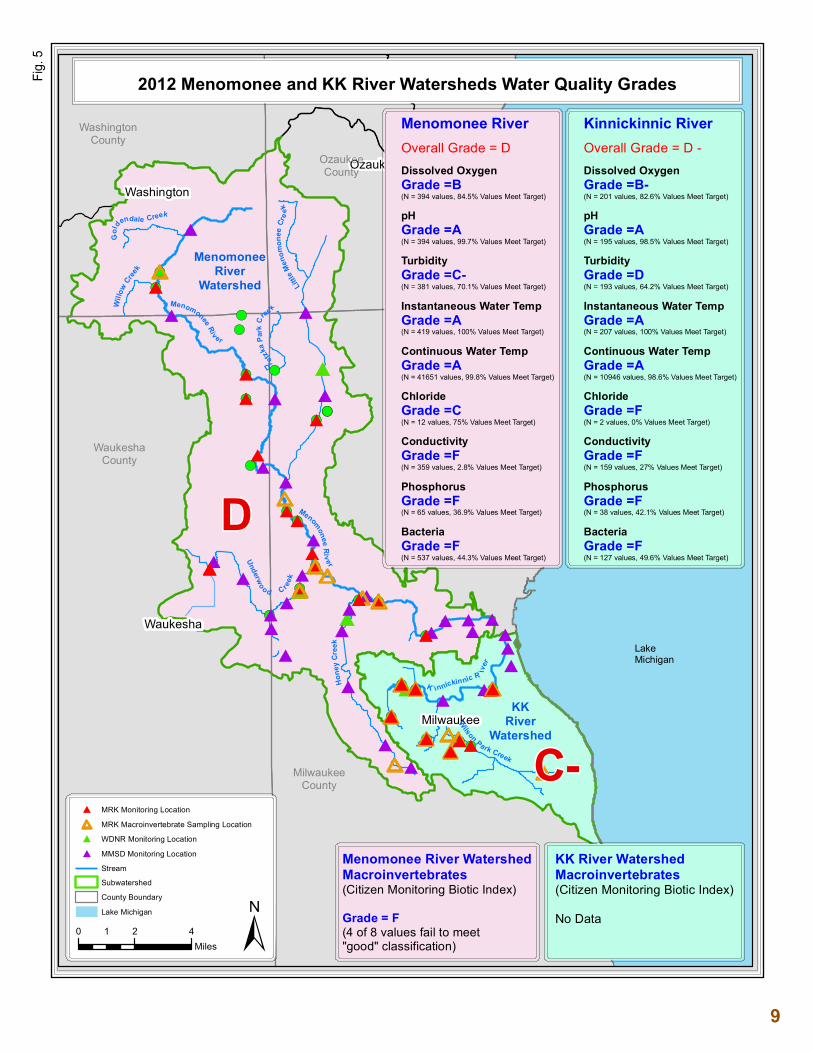
Menomonee RiverOverall Grade = D Dissolved OxygenGrade =B(N = 394 values, 84.5% Values Meet Target)
pHGrade =A(N = 394 values, 99.7% Values Meet Target)
TurbidityGrade =C-(N = 381 values, 70.1% Values Meet Target)
Instantaneous Water TempGrade =A(N = 419 values, 100% Values Meet Target)
Continuous Water TempGrade =A(N = 41651 values, 99.8% Values Meet Target)
ChlorideGrade =C(N = 12 values, 75% Values Meet Target)
ConductivityGrade =F(N = 359 values, 2.8% Values Meet Target)
PhosphorusGrade =F(N = 65 values, 36.9% Values Meet Target)
BacteriaGrade =F(N = 537 values, 44.3% Values Meet Target)
Kinnickinnic RiverOverall Grade = D - Dissolved OxygenGrade =B- (N = 201 values, 82.6% Values Meet Target)
pHGrade =A(N = 195 values, 98.5% Values Meet Target)
TurbidityGrade =D(N = 193 values, 64.2% Values Meet Target)
Instantaneous Water TempGrade =A(N = 207 values, 100% Values Meet Target)
Continuous Water TempGrade =A(N = 10946 values, 98.6% Values Meet Target)
ChlorideGrade =F(N = 2 values, 0% Values Meet Target)
ConductivityGrade =F(N = 159 values, 27% Values Meet Target)
PhosphorusGrade =F(N = 38 values, 42.1% Values Meet Target)
BacteriaGrade =F(N = 127 values, 49.6% Values Meet Target)
KK River WatershedMacroinvertebrates(Citizen Monitoring Biotic Index)
No Data
Menomonee River WatershedMacroinvertebrates(Citizen Monitoring Biotic Index)
Grade = F(4 of 8 values fail to meet"good" classification)
9
Fig.
5
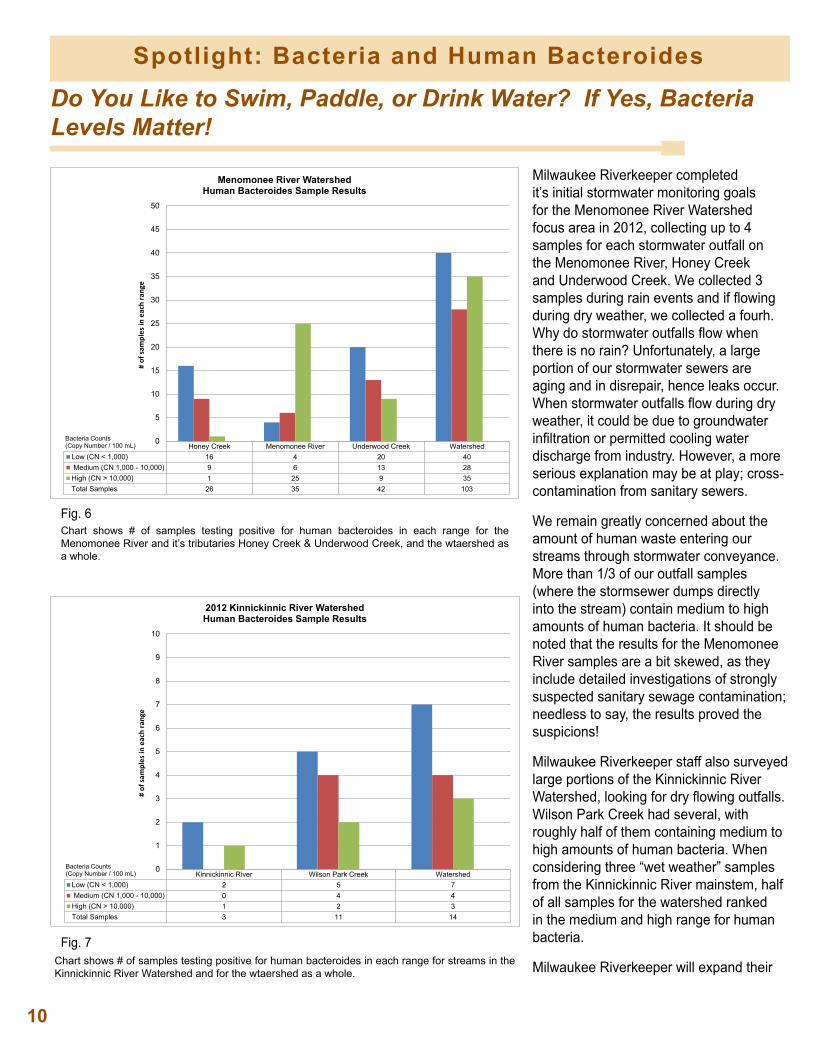
Chart shows # of samples testing positive for human bacteroides in each range for the Menomonee River and it’s tributaries Honey Creek & Underwood Creek, and the wtaershed as a whole.
10
Spotlight: Bacteria and Human Bacteroides
Milwaukee Riverkeeper completed it’s initial stormwater monitoring goals for the Menomonee River Watershed focus area in 2012, collecting up to 4 samples for each stormwater outfall on the Menomonee River, Honey Creek and Underwood Creek. We collected 3 samples during rain events and if flowing during dry weather, we collected a fourh. Why do stormwater outfalls flow when there is no rain? Unfortunately, a large portion of our stormwater sewers are aging and in disrepair, hence leaks occur. When stormwater outfalls flow during dry weather, it could be due to groundwater infiltration or permitted cooling water discharge from industry. However, a more serious explanation may be at play; cross-contamination from sanitary sewers.
We remain greatly concerned about the amount of human waste entering our streams through stormwater conveyance. More than 1/3 of our outfall samples (where the stormsewer dumps directly into the stream) contain medium to high amounts of human bacteria. It should be noted that the results for the Menomonee River samples are a bit skewed, as they include detailed investigations of strongly suspected sanitary sewage contamination; needless to say, the results proved the suspicions!
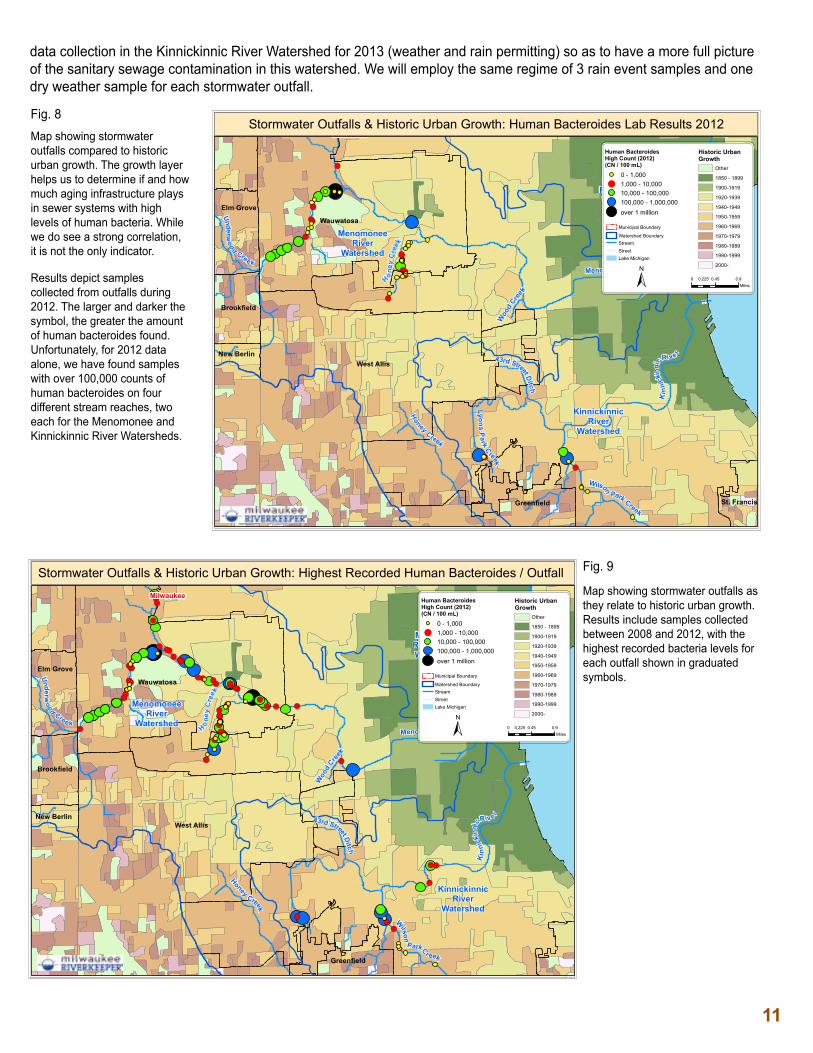
Milwaukee Riverkeeper staff also surveyed large portions of the Kinnickinnic River Watershed, looking for dry flowing outfalls. Wilson Park Creek had several, with roughly half of them containing medium to high amounts of human bacteria. When considering three “wet weather” samples from the Kinnickinnic River mainstem, half of all samples for the watershed ranked in the medium and high range for human bacteria.
Milwaukee Riverkeeper will expand their
Honey Creek Menomonee River Underwood Creek WatershedLow (CN < 1,000) 16 4 20 40 Medium (CN 1,000 - 10,000) 9 6 13 28High (CN > 10,000) 1 25 9 35Total Samples 26 35 42 103
0
5
10
15
20
25
30
35
40
45
50
# of
sam
ples
in e
ach
rang
e
Menomonee River WatershedHuman Bacteroides Sample Results
Bacteria Counts(Copy Number / 100 mL)
Kinnickinnic River Wilson Park Creek WatershedLow (CN < 1,000) 2 5 7 Medium (CN 1,000 - 10,000) 0 4 4High (CN > 10,000) 1 2 3Total Samples 3 11 14
0
1
2
3
4
5
6
7
8
9
10
# of
sam
ples
in e
ach
rang
e
2012 Kinnickinnic River WatershedHuman Bacteroides Sample Results
Bacteria Counts(Copy Number / 100 mL)
Do You Like to Swim, Paddle, or Drink Water? If Yes, Bacteria Levels Matter!
Chart shows # of samples testing positive for human bacteroides in each range for streams in the Kinnickinnic River Watershed and for the wtaershed as a whole.
Fig. 6
Fig. 7
11
data collection in the Kinnickinnic River Watershed for 2013 (weather and rain permitting) so as to have a more full picture of the sanitary sewage contamination in this watershed. We will employ the same regime of 3 rain event samples and one dry weather sample for each stormwater outfall.
!(
!(
!(
!(!(
!(
!(
!(
!(
!(
!(
!(
!(
!(
!(
!(
!(
!(
!(
!(
!(
!(
!(!(
!(
!(
!(
!(
!(
!(
!(
!(
!(
!(
!(
!(
!(
!(
!(
!(
!(
!(
!(
!(
!(
!(
!(
!(
!(
!(
!(!(!(
!(
!(
!(
!(
!(
!(
!(
!(
!(
!(
!(
!( !(
!(
!(
MilwaukeeMilwaukee
Milwaukee
Milwaukee
MilwaukeeRiver SouthWatershed
MenomoneeRiver
Watershed
KinnickinnicRiver
Watershed
Greenfield
Elm Grove
West AllisNew Berlin
Wauwatosa
Brookfield
Woo
dCre
ek
43rd Street Ditch
Wilson
ParkC
r eek
Honey Creek
Unde rwood
Cre ek
Milwau
ke
e River
Kin
nick
inni
cRiv e r
Menomonee River
Stormwater Outfalls & Historic Urban Growth: Highest Recorded Human Bacteroides / Outfall
0 0.45 0.90.225Miles
Historic UrbanGrowth
1850 - 1899
1900-1919
1920-1939
1940-1949
1950-1959
1960-1969
1970-1979
1980-1989
1990-1999
2000-
Other
±
StreamStreetLake Michigan
Municipal Boundary
Watershed Boundary
Human BacteroidesHigh Count (2012)(CN / 100 mL)
! 1,000 - 10,00010,000 - 100,000100,000 - 1,000,000over 1 million
0 - 1,000
Hone
yC
reek
!(
!(
!(
!(!(
!(
!(
!(
!(
!(
!(
!(
!(
!(
!(
!(
Milwaukee
MilwaukeeRiver SouthWatershed
MenomoneeRiver
Watershed
KinnickinnicRiver
Watershed
Greenfield
Elm Grove
West AllisNew Berlin
St. Francis
Wauwatosa
Brookfield
Woo
dCre
ek
43rd Street Ditch
Ly onsPark
C
reek
Wilson
Park Creek
Honey Creek
Underwood
Creek
Milwau
kee River
Kin
nick
inni
cRiv e r
Menomonee River
Stormwater Outfalls & Historic Urban Growth: Human Bacteroides Lab Results 2012
0 0.45 0.90.225Miles
Historic UrbanGrowth
1850 - 1899
1900-1919
1920-1939
1940-1949
1950-1959
1960-1969
1970-1979
1980-1989
1990-1999
2000-
Other
±
StreamStreetLake Michigan
Municipal Boundary
Watershed Boundary
Human BacteroidesHigh Count (2012)(CN / 100 mL)
! 1,000 - 10,00010,000 - 100,000100,000 - 1,000,000over 1 million
0 - 1,000
Hone
yC
reek
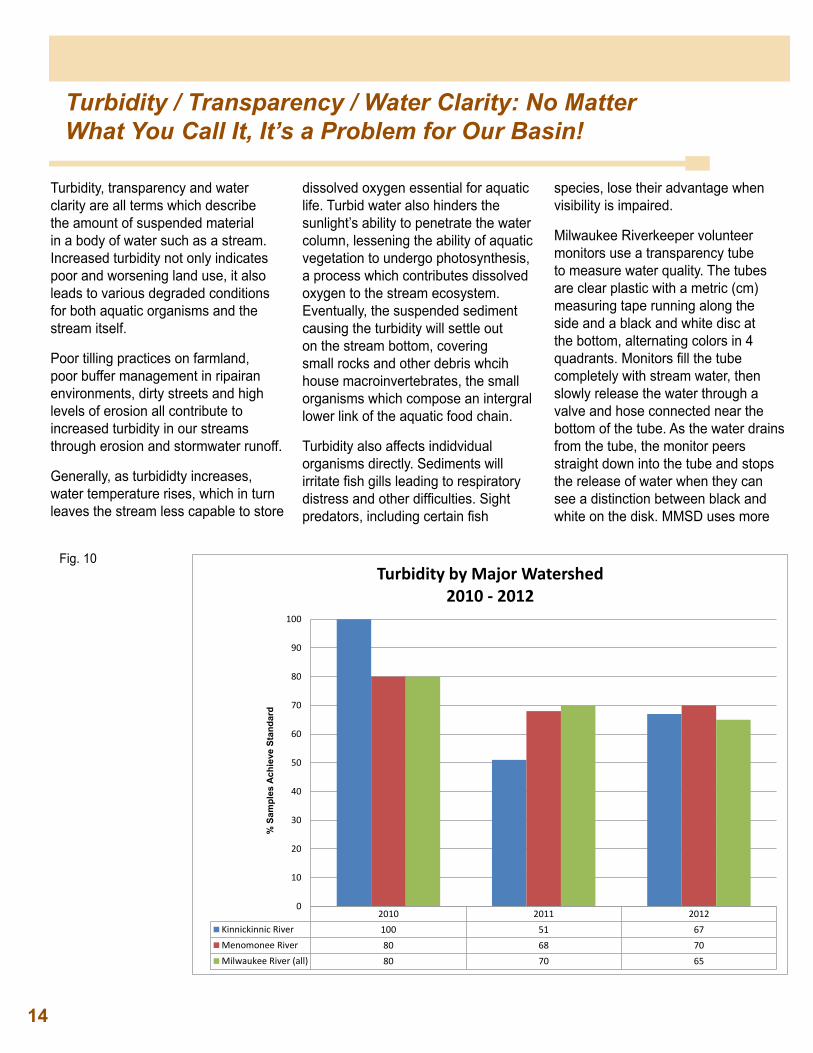
Map showing stormwater outfalls compared to historic urban growth. The growth layer helps us to determine if and how much aging infrastructure plays in sewer systems with high levels of human bacteria. While we do see a strong correlation, it is not the only indicator.
Results depict samples collected from outfalls during 2012. The larger and darker the symbol, the greater the amount of human bacteroides found. Unfortunately, for 2012 data alone, we have found samples with over 100,000 counts of human bacteroides on four different stream reaches, two each for the Menomonee and Kinnickinnic River Watersheds.
Map showing stormwater outfalls as they relate to historic urban growth. Results include samples collected between 2008 and 2012, with the highest recorded bacteria levels for each outfall shown in graduated symbols.
Fig. 8
Fig. 9
14
Turbidity / Transparency / Water Clarity: No Matter What You Call It, It’s a Problem for Our Basin!
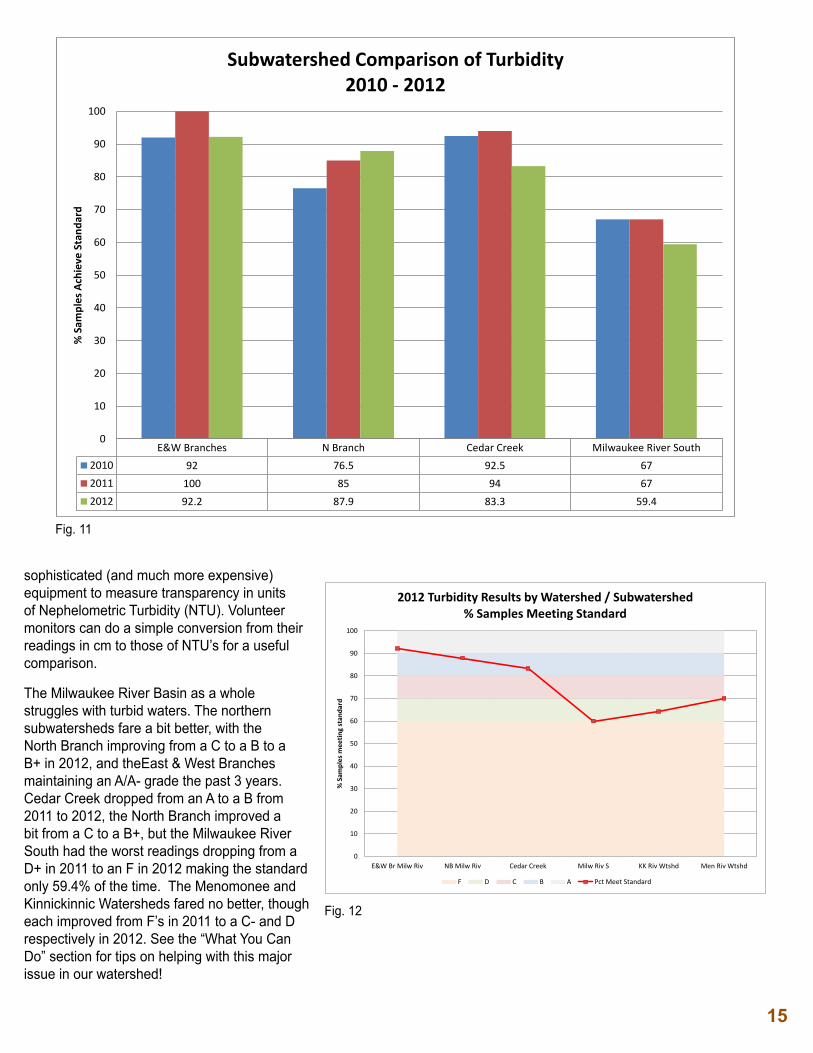
2010 2011 2012Kinnickinnic River 100 51 67Menomonee River 80 68 70Milwaukee River (all) 80 70 65
0
10
20
30
40
50
60
70
80
90
100
% S
ampl
es A
chie
ve S
tand
ard
Turbidity by Major Watershed 2010 - 2012
Turbidity, transparency and water clarity are all terms which describe the amount of suspended material in a body of water such as a stream. Increased turbidity not only indicates poor and worsening land use, it also leads to various degraded conditions for both aquatic organisms and the stream itself.
Poor tilling practices on farmland, poor buffer management in ripairan environments, dirty streets and high levels of erosion all contribute to increased turbidity in our streams through erosion and stormwater runoff.
Generally, as turbididty increases, water temperature rises, which in turn leaves the stream less capable to store
dissolved oxygen essential for aquatic life. Turbid water also hinders the sunlight’s ability to penetrate the water column, lessening the ability of aquatic vegetation to undergo photosynthesis, a process which contributes dissolved oxygen to the stream ecosystem. Eventually, the suspended sediment causing the turbidity will settle out on the stream bottom, covering small rocks and other debris whcih house macroinvertebrates, the small organisms which compose an intergral lower link of the aquatic food chain.
Turbidity also affects indidvidual organisms directly. Sediments will irritate fish gills leading to respiratory distress and other difficulties. Sight predators, including certain fish
species, lose their advantage when visibility is impaired.
Milwaukee Riverkeeper volunteer monitors use a transparency tube to measure water quality. The tubes are clear plastic with a metric (cm) measuring tape running along the side and a black and white disc at the bottom, alternating colors in 4 quadrants. Monitors fill the tube completely with stream water, then slowly release the water through a valve and hose connected near the bottom of the tube. As the water drains from the tube, the monitor peers straight down into the tube and stops the release of water when they can see a distinction between black and white on the disk. MMSD uses more
Fig. 10
15
E&W Branches N Branch Cedar Creek Milwaukee River South2010 92 76.5 92.5 672011 100 85 94 672012 92.2 87.9 83.3 59.4
0
10
20
30
40
50
60
70
80
90
100
% S
ampl
es A
chie
ve S
tand
ard
Subwatershed Comparison of Turbidity 2010 - 2012
sophisticated (and much more expensive) equipment to measure transparency in units of Nephelometric Turbidity (NTU). Volunteer monitors can do a simple conversion from their readings in cm to those of NTU’s for a useful comparison.
The Milwaukee River Basin as a whole struggles with turbid waters. The northern subwatersheds fare a bit better, with the North Branch improving from a C to a B to a B+ in 2012, and theEast & West Branches maintaining an A/A- grade the past 3 years. Cedar Creek dropped from an A to a B from 2011 to 2012, the North Branch improved a bit from a C to a B+, but the Milwaukee River South had the worst readings dropping from a D+ in 2011 to an F in 2012 making the standard only 59.4% of the time. The Menomonee and Kinnickinnic Watersheds fared no better, though each improved from F’s in 2011 to a C- and D respectively in 2012. See the “What You Can Do” section for tips on helping with this major issue in our watershed!
0
10
20
30
40
50
60
70
80
90
100
E&W Br Milw Riv NB Milw Riv Cedar Creek Milw Riv S KK Riv Wtshd Men Riv Wtshd
% S
ampl
es m
eetin
g st
anda
rd
2012 Turbidity Results by Watershed / Subwatershed % Samples Meeting Standard
F D C B A Pct Meet Standard
Fig. 11
Fig. 12
Nutrients: Aren’t They Supposed to Be Good For Us?
12
Spotlight: Phosphorus and Chloride
Cedar Creek E&W Branch North Branch Milw RiverSouth KK River Menomonee
River% Meet Stndrd 2011 57.0% 60.0% 39.0% 47.0% 78.0% 42.0%% Meet Stndrd 2012 63.0% 57.5% 47.4% 29.3% 43.2% 36.4%
0.0%
10.0%
20.0%
30.0%
40.0%
50.0%
60.0%
70.0%
80.0%
90.0%
% S
ampl
es M
eetin
g St
anda
rd
Watershed Phosphorus Compliance Comparison 2011 - 2012
Cedar Creek E & W BranchMilwaukee
North BranchMilwaukee
South BranchMilwaukee Kinnickinnic River Menomonee
RiverMay 100% 71% 33% 38% 50% 53%June 60% 29% 33% 8% 33% 8%July 20% 29% 33% 0% 43% 0%August 75% 43% 50% 23% 29% 38%September 50% 100% 40% 55% 57% 46%October 50% 86% 100% 50% 75% 70%
0%
20%
40%
60%
80%
100%
120%
% S
ampl
es in
Com
plia
nce
2012 Monthly Phosphorus Compliance by Watershed / Subwatershed
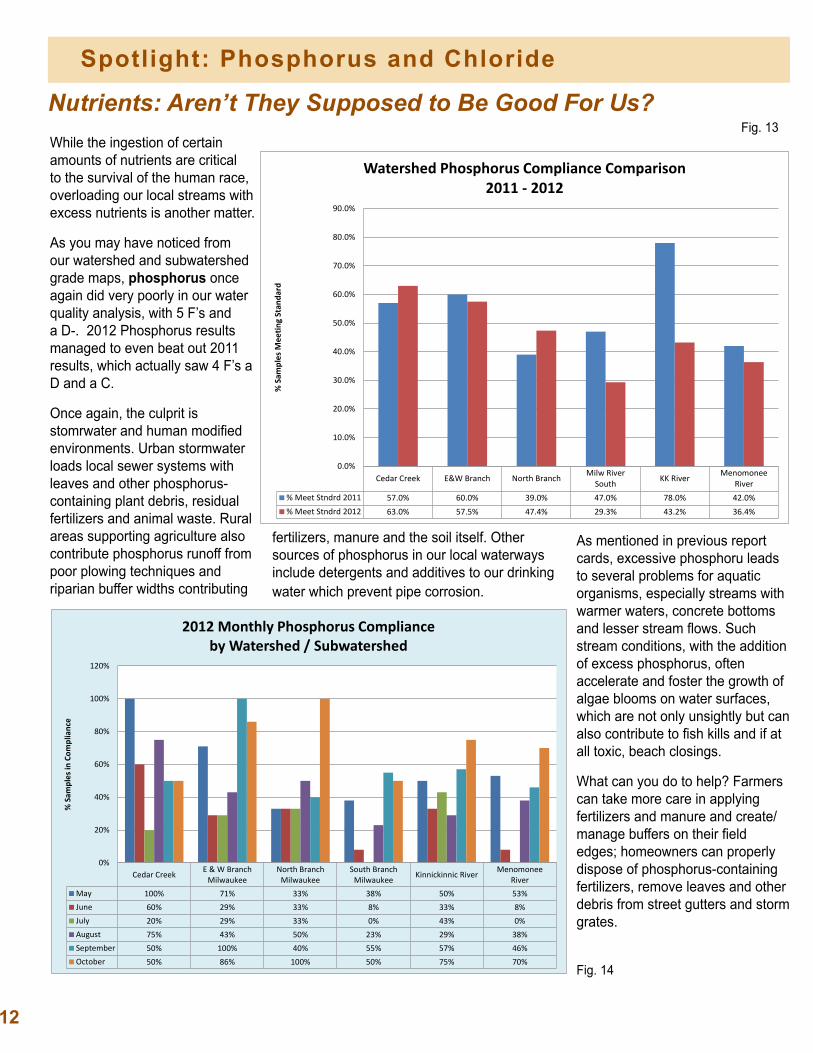
While the ingestion of certain amounts of nutrients are critical to the survival of the human race, overloading our local streams with excess nutrients is another matter.
As you may have noticed from our watershed and subwatershed grade maps, phosphorus once again did very poorly in our water quality analysis, with 5 F’s and a D-. 2012 Phosphorus results managed to even beat out 2011 results, which actually saw 4 F’s a D and a C.
Once again, the culprit is stomrwater and human modified environments. Urban stormwater loads local sewer systems with leaves and other phosphorus-containing plant debris, residual fertilizers and animal waste. Rural areas supporting agriculture also contribute phosphorus runoff from poor plowing techniques and riparian buffer widths contributing
fertilizers, manure and the soil itself. Other sources of phosphorus in our local waterways include detergents and additives to our drinking water which prevent pipe corrosion.
As mentioned in previous report cards, excessive phosphoru leads to several problems for aquatic organisms, especially streams with warmer waters, concrete bottoms and lesser stream flows. Such stream conditions, with the addition of excess phosphorus, often accelerate and foster the growth of algae blooms on water surfaces, which are not only unsightly but can also contribute to fish kills and if at all toxic, beach closings.
What can you do to help? Farmers can take more care in applying fertilizers and manure and create/manage buffers on their field edges; homeowners can properly dispose of phosphorus-containing fertilizers, remove leaves and other debris from street gutters and storm grates.
Fig. 13
Fig. 14
16
Fig. 16
Spotlight: Phosphorus and Chloride Fig. 15
2080
1710
525 546 316 309 307
2450
3170
4890
0
500
1000
1500
2000
2500
3000
3500
4000
4500
5000
Chl
orid
e C
once
ntra
tion
(mg/
L)
Kinnickinnic River @ 11th St Chloride Results2011 - 2013
Chloride Lab Results EPA Acute Std (860 mg/L) EPA Chronic Std (230 mg/L)
EPA Chronic
EPA Acute
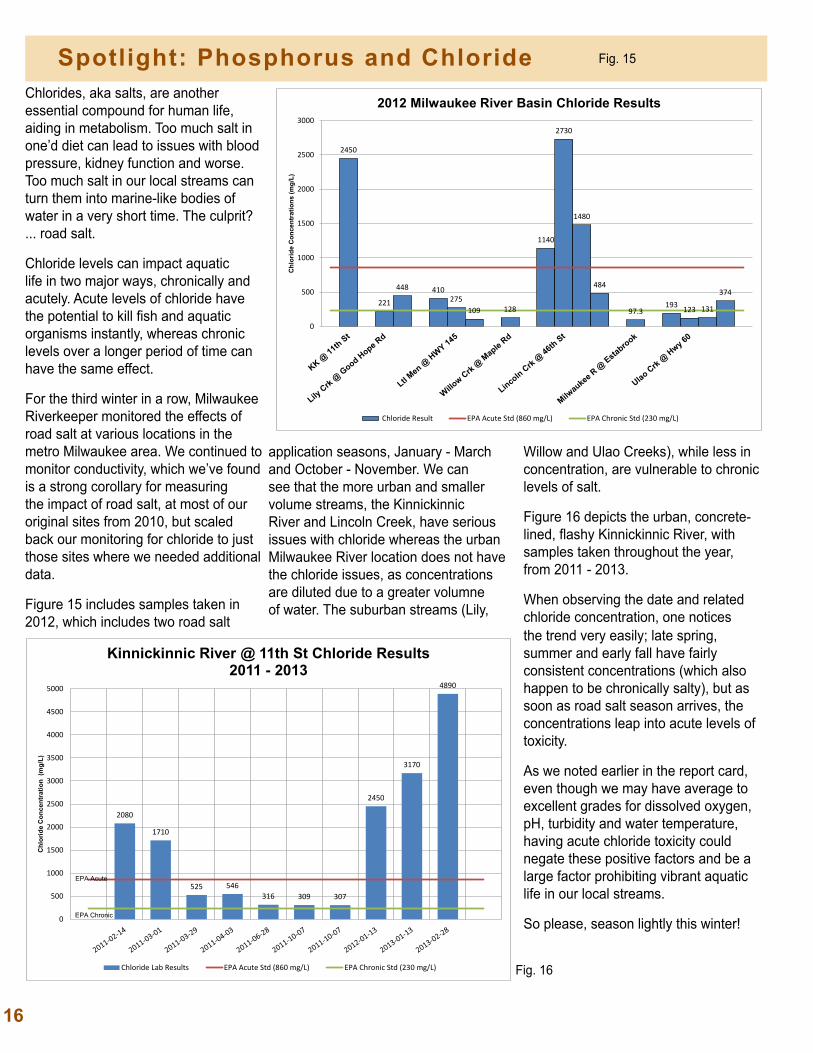
Chlorides, aka salts, are another essential compound for human life, aiding in metabolism. Too much salt in one’d diet can lead to issues with blood pressure, kidney function and worse. Too much salt in our local streams can turn them into marine-like bodies of water in a very short time. The culprit? ... road salt.
Chloride levels can impact aquatic life in two major ways, chronically and acutely. Acute levels of chloride have the potential to kill fish and aquatic organisms instantly, whereas chronic levels over a longer period of time can have the same effect.
For the third winter in a row, Milwaukee Riverkeeper monitored the effects of road salt at various locations in the metro Milwaukee area. We continued to monitor conductivity, which we’ve found is a strong corollary for measuring the impact of road salt, at most of our original sites from 2010, but scaled back our monitoring for chloride to just those sites where we needed additional data.
Figure 15 includes samples taken in 2012, which includes two road salt
2450
221
448 410 275
109 128
1140
2730
1480
484
97.3 193 123 131
374
0
500
1000
1500
2000
2500
3000
Chl
orid
e C
once
ntra
tions
(mg/
L)
2012 Milwaukee River Basin Chloride Results
Chloride Result EPA Acute Std (860 mg/L) EPA Chronic Std (230 mg/L)
application seasons, January - March and October - November. We can see that the more urban and smaller volume streams, the Kinnickinnic River and Lincoln Creek, have serious issues with chloride whereas the urban Milwaukee River location does not have the chloride issues, as concentrations are diluted due to a greater volumne of water. The suburban streams (Lily,
Willow and Ulao Creeks), while less in concentration, are vulnerable to chronic levels of salt.
Figure 16 depicts the urban, concrete-lined, flashy Kinnickinnic River, with samples taken throughout the year, from 2011 - 2013.
When observing the date and related chloride concentration, one notices the trend very easily; late spring, summer and early fall have fairly consistent concentrations (which also happen to be chronically salty), but as soon as road salt season arrives, the concentrations leap into acute levels of toxicity.
As we noted earlier in the report card, even though we may have average to excellent grades for dissolved oxygen, pH, turbidity and water temperature, having acute chloride toxicity could negate these positive factors and be a large factor prohibiting vibrant aquatic life in our local streams.
So please, season lightly this winter!
17
Conductivity measures the ability of water to conduct electricity. Many elements have this capability, and in our local streams it tends to be metals and salts, both naturally occuring as well as those contributed by humans.
Unfortunately, our local streams have a legacy of heavy metal and nutrient pollution; heavy metal pollution (no, not AC/DC or Led Zepplin) can be traced back to the industrial juggernaut that once was Milwaukee, whereas nutrient pollution (in the form of phosphorus and chloride) appear to be in their heyday.
Beginning in the winter of 2010-2011 Milwaukee Riverkeeper, in conjunction with UW-Extension, the USGS and the Wisconsin DNR, began monitoring chlorides and conductivity in Milwaukee
metro area streams. One major outcome, besides the realization that chlorides and conductivity are having a seriously deleterious impact on our local waterways, changing them from freshwater to marine environments for large portions of the winter, was that there is a strong correlation between chloride and conducitivity. Hence, conductivity may be used as a dependable surrogate when measuring the impact of road salt on our local streams.
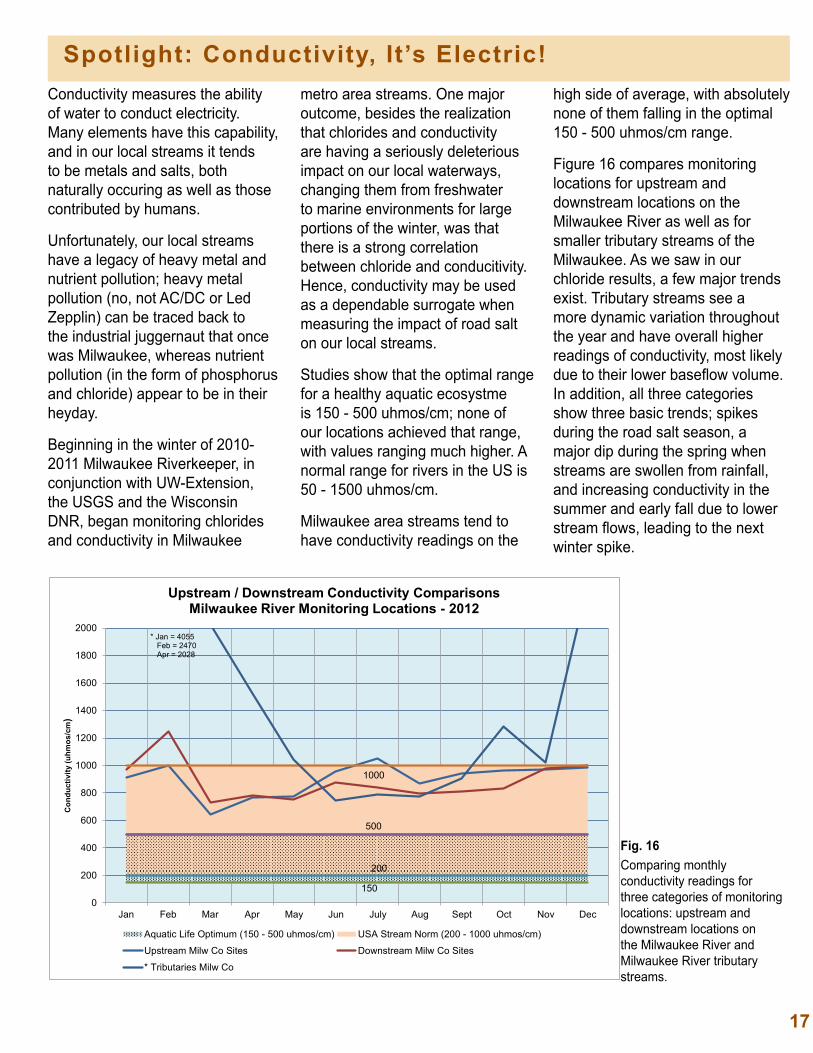
Studies show that the optimal range for a healthy aquatic ecosystme is 150 - 500 uhmos/cm; none of our locations achieved that range, with values ranging much higher. A normal range for rivers in the US is 50 - 1500 uhmos/cm.
Milwaukee area streams tend to have conductivity readings on the
high side of average, with absolutely none of them falling in the optimal 150 - 500 uhmos/cm range.
Figure 16 compares monitoring locations for upstream and downstream locations on the Milwaukee River as well as for smaller tributary streams of the Milwaukee. As we saw in our chloride results, a few major trends exist. Tributary streams see a more dynamic variation throughout the year and have overall higher readings of conductivity, most likely due to their lower baseflow volume. In addition, all three categories show three basic trends; spikes during the road salt season, a major dip during the spring when streams are swollen from rainfall, and increasing conductivity in the summer and early fall due to lower stream flows, leading to the next winter spike.
150
200
1000
500
0
200
400
600
800
1000
1200
1400
1600
1800
2000
Jan Feb Mar Apr May Jun July Aug Sept Oct Nov Dec
Con
duct
ivity
(uhm
os/c
m)
Upstream / Downstream Conductivity Comparisons Milwaukee River Monitoring Locations - 2012
Aquatic Life Optimum (150 - 500 uhmos/cm) USA Stream Norm (200 - 1000 uhmos/cm)
Upstream Milw Co Sites Downstream Milw Co Sites
* Tributaries Milw Co
* Jan = 4055 Feb = 2470 Apr = 2028
Fig. 16
Spotlight: Conductivity, It’s Electric!
Comparing monthly conductivity readings for three categories of monitoring locations: upstream and downstream locations on the Milwaukee River and Milwaukee River tributary streams.
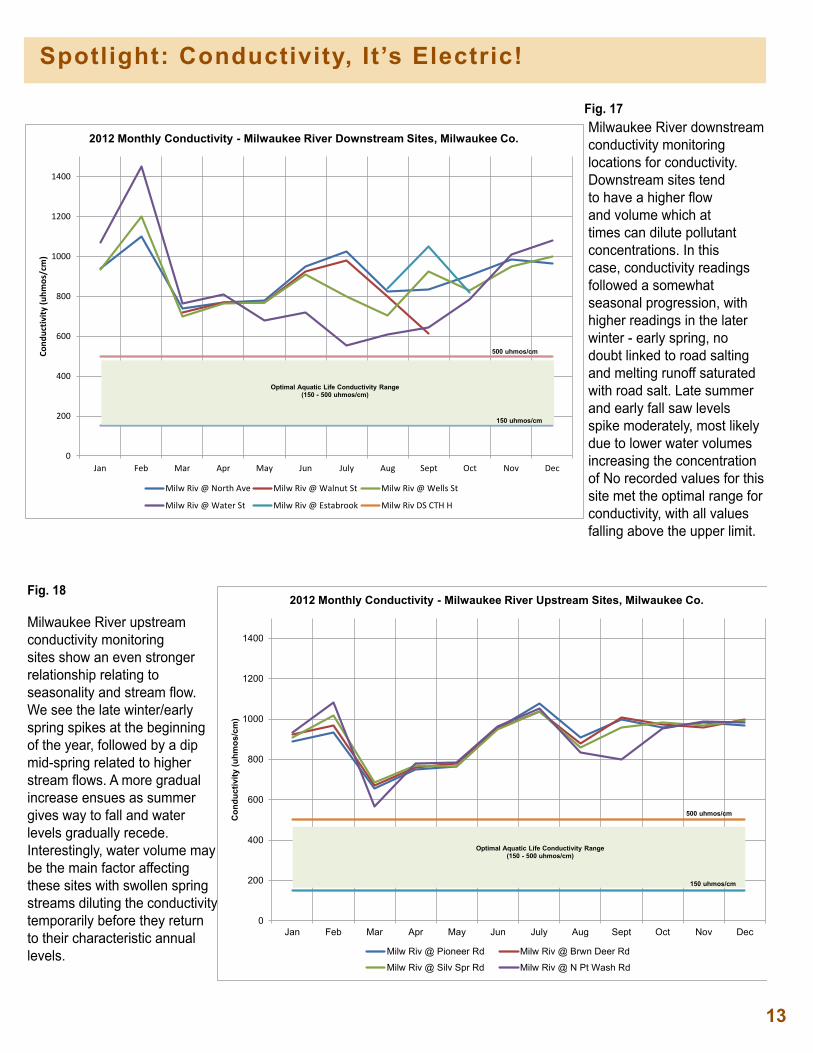
Fig. 18
13
0
200
400
600
800
1000
1200
1400
Jan Feb Mar Apr May Jun July Aug Sept Oct Nov Dec
Cond
uctiv
ity (u
hmos
/cm
)
2012 Monthly Conductivity - Milwaukee River Downstream Sites, Milwaukee Co.
Milw Riv @ North Ave Milw Riv @ Walnut St Milw Riv @ Wells St
Milw Riv @ Water St Milw Riv @ Estabrook Milw Riv DS CTH H
Optimal Aquatic Life Conductivity Range (150 - 500 uhmos/cm)
150 uhmos/cm
500 uhmos/cm
0
200
400
600
800
1000
1200
1400
Jan Feb Mar Apr May Jun July Aug Sept Oct Nov Dec
Con
duct
ivity
(uhm
os/c
m)
2012 Monthly Conductivity - Milwaukee River Upstream Sites, Milwaukee Co.
Milw Riv @ Pioneer Rd Milw Riv @ Brwn Deer Rd
Milw Riv @ Silv Spr Rd Milw Riv @ N Pt Wash Rd
500 uhmos/cm
Optimal Aquatic Life Conductivity Range (150 - 500 uhmos/cm)
150 uhmos/cm
Milwaukee River downstream conductivity monitoring locations for conductivity. Downstream sites tend to have a higher flow and volume which at times can dilute pollutant concentrations. In this case, conductivity readings followed a somewhat seasonal progression, with higher readings in the later winter - early spring, no doubt linked to road salting and melting runoff saturated with road salt. Late summer and early fall saw levels spike moderately, most likely due to lower water volumes increasing the concentration of No recorded values for this site met the optimal range for conductivity, with all values falling above the upper limit.
Spotlight: Conductivity, It’s Electric!
Fig. 17
Milwaukee River upstream conductivity monitoring sites show an even stronger relationship relating to seasonality and stream flow. We see the late winter/early spring spikes at the beginning of the year, followed by a dip mid-spring related to higher stream flows. A more gradual increase ensues as summer gives way to fall and water levels gradually recede. Interestingly, water volume may be the main factor affecting these sites with swollen spring streams diluting the conductivity temporarily before they return to their characteristic annual levels.
18
Milwaukee Riverkeeper is grateful to the more than 250 citizens who have actively participated in our volunteer stream monitoring programs since 2006. Two groups of monitors are highlighted below.
Bill & Sheila, Christine, & BrianThey were 5 disparate strangers at our 2010 spring training (ok, there is one couple in the bunch and they all hail from Bayview, but they didn’t know it at the time) who took it upon themselves to team up and monitor the difficult-to-access Kinnickinnic River Watershed.... four years later they are still together and have become good friends; they are, Team KK!Brian learned about stream monitor training after attending a river cleanup. Christine found herself cheering on Riverkeeper from a newspaper story and then noticed the mention of stream monitor training. Bill & Sheila just showed up to cause trouble ... kidding, of course, Bill & Sheila both have strong backgrounds in the sciences and bring experience and enthusiasm to the table.
Brian hopes his efforts to improve water quality in his neighborhood will inform others about respecting “the unique environment we have here in the Great Lakes region and [will] work to improve and protect it.” Christine likewise hopes to improve her surroundings, “I love the message that [Milwaukee] Riverkeeper is about making rivers swimmable and fishable. It makes me nuts to be on water that I can’t jump into.” She goes on to note, “I like that it {Milwaukee Riverkeeper] looks at the water up-close and scientifically, is a source of direct evidence, and is willing to both cooperate (and sue if necessary) to achieve results. Go Riverkeeper!”Sheila and Bill, both trained biologists, began monitoring upon retirement, realizing “we have done a lot of talking about water issues,
it is now time for us to DO something!” Their interactions with the river stretch back to their kids youth, “Our children used to catch crayfish in Wilson Creek. We know that the streams that flow into the KK River are now very polluted...Our monitoring can provide data to help” solve this problem. We obviously concur.Thanks Team KK!
Vo l u n t e e r M o n i t o r S p o t l i g h t
Team KK
If you are interested in joining Team KK & the Wolters as volunteer water quality monitors, please contact Milwaukee Riverkeeper. We hold trainings for Level 1 and Level 2 monitors each spring in late April or early May. For more information, see our website at www.milwaukeeriverkeeper.org, or contact Joe Rath at [email protected].
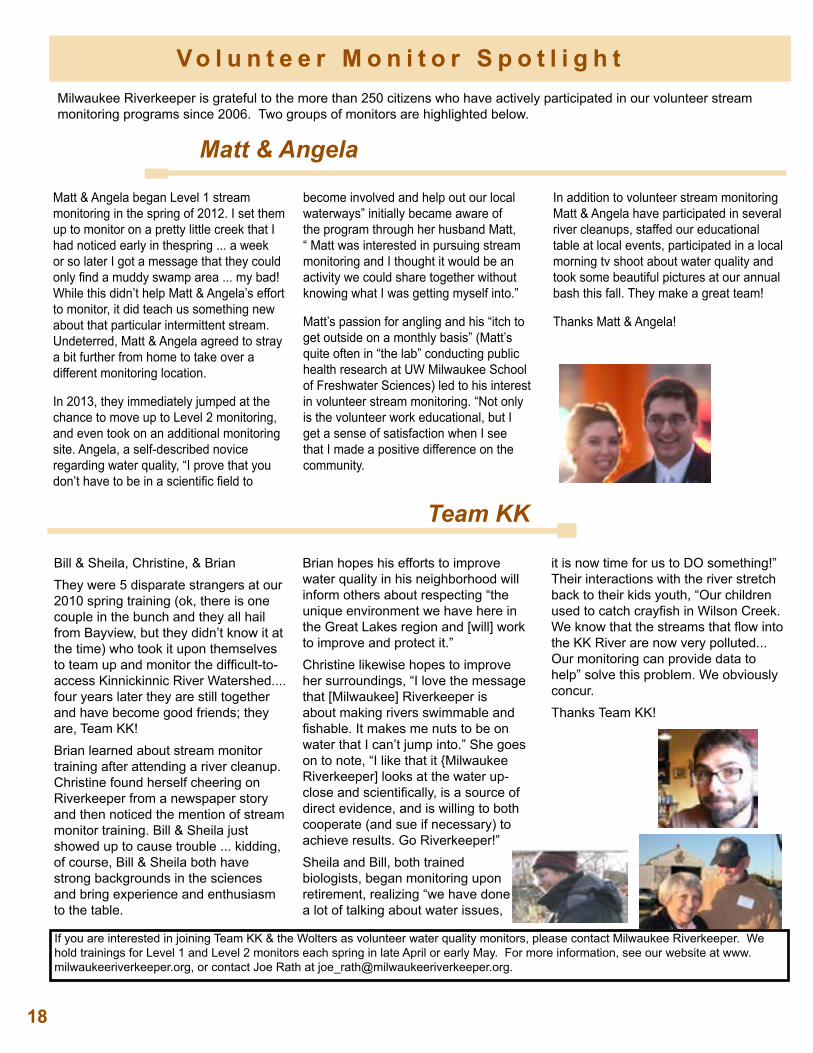
Matt & Angela
Matt & Angela began Level 1 stream monitoring in the spring of 2012. I set them up to monitor on a pretty little creek that I had noticed early in thespring ... a week or so later I got a message that they could only find a muddy swamp area ... my bad! While this didn’t help Matt & Angela’s effort to monitor, it did teach us something new about that particular intermittent stream. Undeterred, Matt & Angela agreed to stray a bit further from home to take over a different monitoring location.
In 2013, they immediately jumped at the chance to move up to Level 2 monitoring, and even took on an additional monitoring site. Angela, a self-described novice regarding water quality, “I prove that you don’t have to be in a scientific field to
become involved and help out our local waterways” initially became aware of the program through her husband Matt, “ Matt was interested in pursuing stream monitoring and I thought it would be an activity we could share together without knowing what I was getting myself into.”
Matt’s passion for angling and his “itch to get outside on a monthly basis” (Matt’s quite often in “the lab” conducting public health research at UW Milwaukee School of Freshwater Sciences) led to his interest in volunteer stream monitoring. “Not only is the volunteer work educational, but I get a sense of satisfaction when I see that I made a positive difference on the community.
In addition to volunteer stream monitoring Matt & Angela have participated in several river cleanups, staffed our educational table at local events, participated in a local morning tv shoot about water quality and took some beautiful pictures at our annual bash this fall. They make a great team!
Thanks Matt & Angela!

W h a t Y O U C a n D o
Reduce erosion and sediment entering the rivers1) Adopt a River -- keep an eye on a section of river near you. Contact us to learn how.
2) Educate and participate in land stewardship activities such as tree planting and invasive species removal.
3) Report potential sources of pollution from construction sites or stormwater outfalls, eroding areas, and other problems to Milwaukee Riverkeeper at 414-287-0207 or to the WDNR at 1-800-TIP-WDNR.
Below are some easy things you can do to help restore the health of the Milwaukee River Basin. Thank you for your help and support!
Reduce nutrients and polluted runoff1) Prevent stormwater runoff by catching and encouraging slow infiltration of rain into soils with rain gardens, rain barrels, cisterns, and planting of native vegetation.
2) Pick up after pets -- pet waste is a major source of bacteria to our rivers.
3) Use water wisely both inside and outside the home. Minimize use of water during heavy rain storms to reduce stress on local sewers and protect rivers from sewage overflows.
4) Minimize or eliminate use of fertilizers and pesticides on your property.
Stay engaged and help inform and educate others
1) Stay up-to-date on current issues affecting water quality and wildlife habitat. Sign up for Riverkeeper News.
2) Vote GREEN and advocate for fishable, swimmable, drinkable rivers and lakes. Contact elected officials and let them know that the health of the rivers and Lake Michigan is important to you.
3) Become involved in river cleanups, volunteer water quality monitoring, and other community events to protect our rivers and the land that drains to them.
19
5) Reduce or eliminate your use of salt on paved surfaces.
Milwaukee River Report Card2011
Our MissionMilwaukee Riverkeeper’s mission is to protect water quality and wildlife habitat in the river corridors and to advocate for sound land use in the Milwaukee, Menomonee, and Kinnickinnic River Watersheds.
Milwaukee Riverkeeper serves as an advocate and voice for the Milwaukee, Menomonee, and Kinnickinnic Rivers. Our core programming involves patrolling, monitoring, and advocating on behalf of the rivers. We also coordinate hands-on river restoration projects and organize thousands of volunteers each year in river cleanups. Milwaukee Riverkeeper is a licensed member of the Waterkeeper Alliance, an international coalition dedicated to clean water and healthy communities.
Milwaukee Riverkeeper1845 N. Farwell Ave., Suite 100Milwaukee, WI 53202(414) 287-0207www.milwaukeeriverkeeper.org
20