Embed Size (px)
Citation preview
COMPUTING RESEARCH NEWS, MAY 2015Vol. 27 / No. 5
http://cra.org/resources/crn-online/ 2
2014 Taulbee Survey Relentless Growth in Undergraduate CS Enrollment; Doctoral Degree Production Remains Strong, But No New Record By Stuart Zweben and Betsy Bizot
This article and the accompanying figures and tables present
the results from the 44th annual CRA Taulbee Survey1. The
survey, conducted annually by the Computing Research
Association, documents trends in student enrollment, degree
production, employment of graduates, and faculty salaries in
academic units in the United States and Canada that grant the
Ph.D. in computer science (CS), computer engineering (CE) or
information (I)2. Most of these academic units are departments,
but some are colleges or schools of information or computing.
In this report, we will use the term “department” to refer to the
unit offering the program.
CRA gathers survey data during the fall. Responses received
by January 26, 2015 are included in the analysis. The period
covered by the data varies from table to table. Degree
production and enrollment (Ph.D., Master’s, and Bachelor’s) refer
to the previous academic year (2013-14). Data for new students
in all categories refer to the current academic year (2014-
15). Projected student production and information on faculty
salaries are also for the current academic year; salaries are
those effective January 1, 2015.
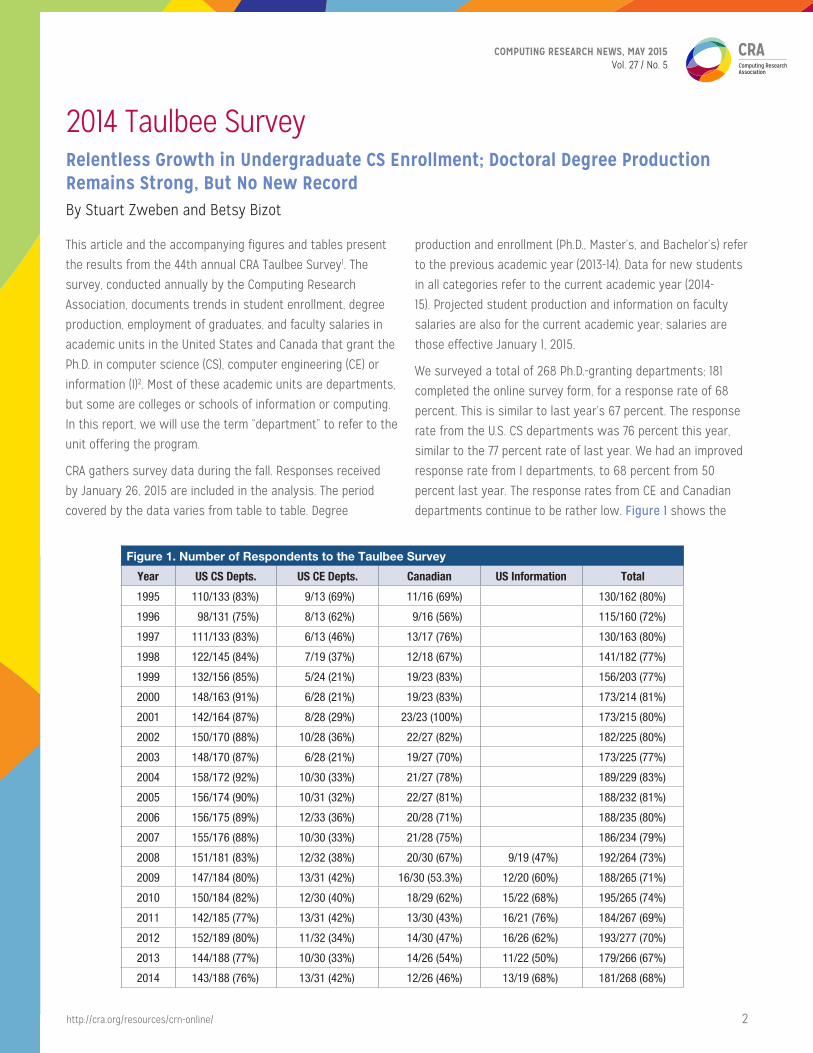
We surveyed a total of 268 Ph.D.-granting departments; 181
completed the online survey form, for a response rate of 68
percent. This is similar to last year’s 67 percent. The response
rate from the U.S. CS departments was 76 percent this year,
similar to the 77 percent rate of last year. We had an improved
response rate from I departments, to 68 percent from 50
percent last year. The response rates from CE and Canadian
departments continue to be rather low. Figure 1 shows the
Figure 1. Number of Respondents to the Taulbee Survey
Year US CS Depts. US CE Depts. Canadian US Information Total
1995 110/133 (83%) 9/13 (69%) 11/16 (69%) 130/162 (80%)
1996 98/131 (75%) 8/13 (62%) 9/16 (56%) 115/160 (72%)
1997 111/133 (83%) 6/13 (46%) 13/17 (76%) 130/163 (80%)
1998 122/145 (84%) 7/19 (37%) 12/18 (67%) 141/182 (77%)
1999 132/156 (85%) 5/24 (21%) 19/23 (83%) 156/203 (77%)
2000 148/163 (91%) 6/28 (21%) 19/23 (83%) 173/214 (81%)
2001 142/164 (87%) 8/28 (29%) 23/23 (100%) 173/215 (80%)
2002 150/170 (88%) 10/28 (36%) 22/27 (82%) 182/225 (80%)
2003 148/170 (87%) 6/28 (21%) 19/27 (70%) 173/225 (77%)
2004 158/172 (92%) 10/30 (33%) 21/27 (78%) 189/229 (83%)
2005 156/174 (90%) 10/31 (32%) 22/27 (81%) 188/232 (81%)
2006 156/175 (89%) 12/33 (36%) 20/28 (71%) 188/235 (80%)
2007 155/176 (88%) 10/30 (33%) 21/28 (75%) 186/234 (79%)
2008 151/181 (83%) 12/32 (38%) 20/30 (67%) 9/19 (47%) 192/264 (73%)
2009 147/184 (80%) 13/31 (42%) 16/30 (53.3%) 12/20 (60%) 188/265 (71%)
2010 150/184 (82%) 12/30 (40%) 18/29 (62%) 15/22 (68%) 195/265 (74%)
2011 142/185 (77%) 13/31 (42%) 13/30 (43%) 16/21 (76%) 184/267 (69%)
2012 152/189 (80%) 11/32 (34%) 14/30 (47%) 16/26 (62%) 193/277 (70%)
2013 144/188 (77%) 10/30 (33%) 14/26 (54%) 11/22 (50%) 179/266 (67%)
2014 143/188 (76%) 13/31 (42%) 12/26 (46%) 13/19 (68%) 181/268 (68%)
COMPUTING RESEARCH NEWS, MAY 2015Vol. 27 / No. 5
http://cra.org/resources/crn-online/ 3
history of response rates to the survey. Response rates are
inexact because some departments provide only partial data,
and some institutions provide a single joint response for
multiple departments. Thus, in some tables the number of
departments shown as reporting will not equal the overall
total number of respondents shown in Figure 1 for that
category of department.
To account for the changes in response rate, we will comment
not only on aggregate totals but also on averages per
department reporting or data from those departments that
responded to both this year’s and last year’s surveys. This is
a more accurate indication of the one-year changes affecting
the data.
Departments that responded to the survey were sent
preliminary results about faculty salaries in December 2014;
these results included additional distributional information not
contained in this report. The CRA Board views this as a benefit
of participating in the survey.
Degree, enrollment and faculty salary data for the U.S CS
departments are stratified according to a) whether the
institution is public or private, and b) the tenure-track faculty
size of the reporting department. The faculty size strata
deliberately overlap, so that data from most departments
affect multiple strata. This may be especially useful to
departments near the boundary of one stratum. Salary data
also is stratified according to the population of the locale in
which the institution is located.3 These stratifications allow
our readers to see multiple views of important data, and
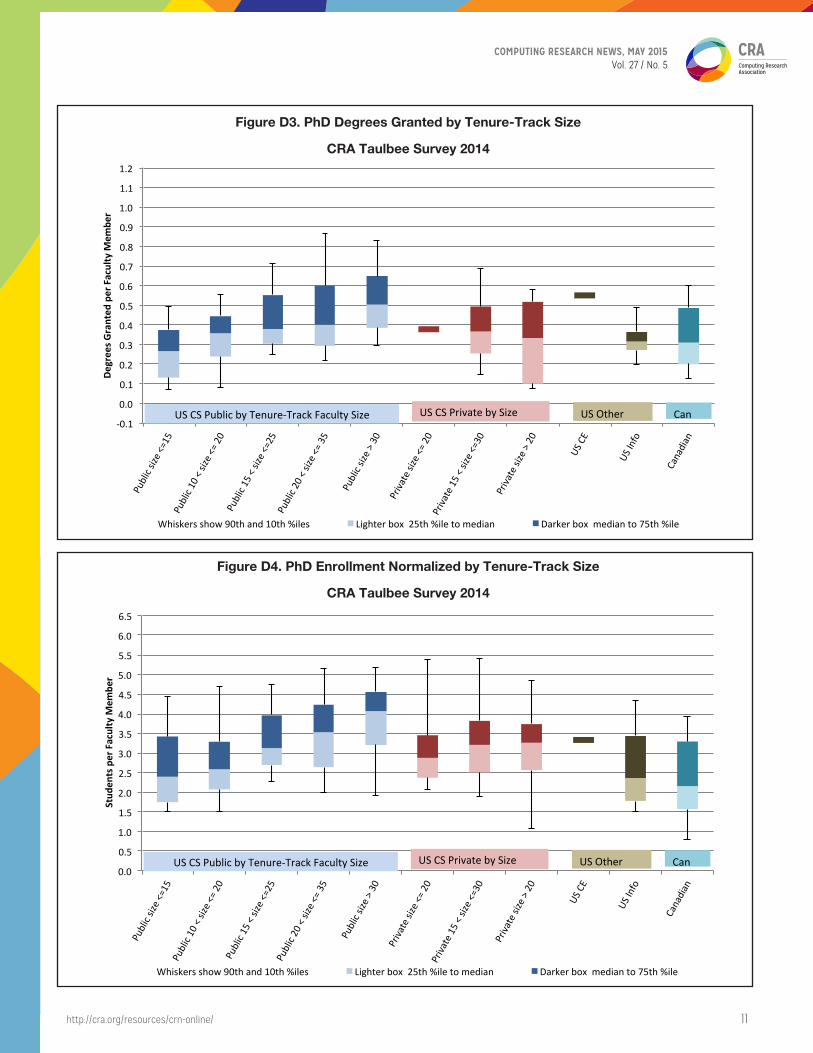
hopefully gain new insights from them. In addition to tabular
presentations of data, we will use “box and whisker” diagrams
to show medians, quartiles, and the range between the 10th
and 90th percentile data points.
This year marks our first use of the new hosting platform for
the survey using software by Peerfocus. The new environment
affords increased security and data validation capabilities,
and will soon provide the ability for CRA member respondents
to select obtain certain survey information for a self-selected
peer group.
We thank all respondents to this year’s questionnaire.
Departments that participated are listed at the end of this
article.
Doctoral Degree Production, Enrollments and Employment
(Tables D1-D10; Figures D1-D6)
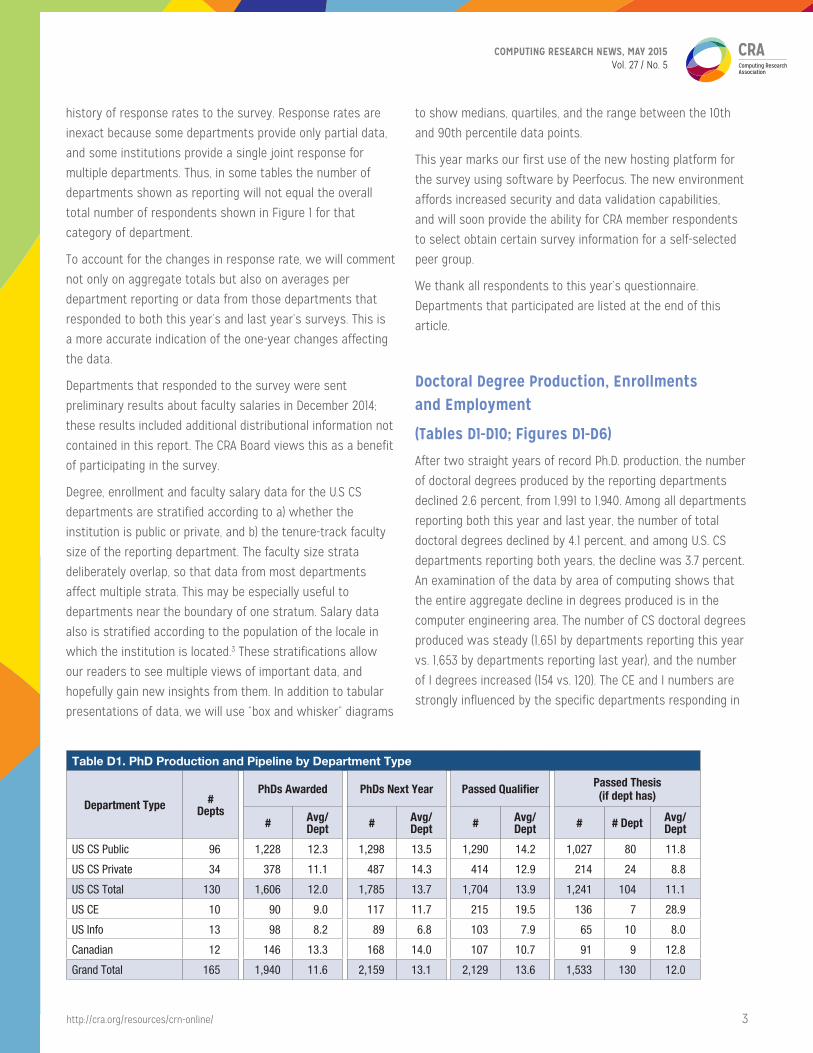
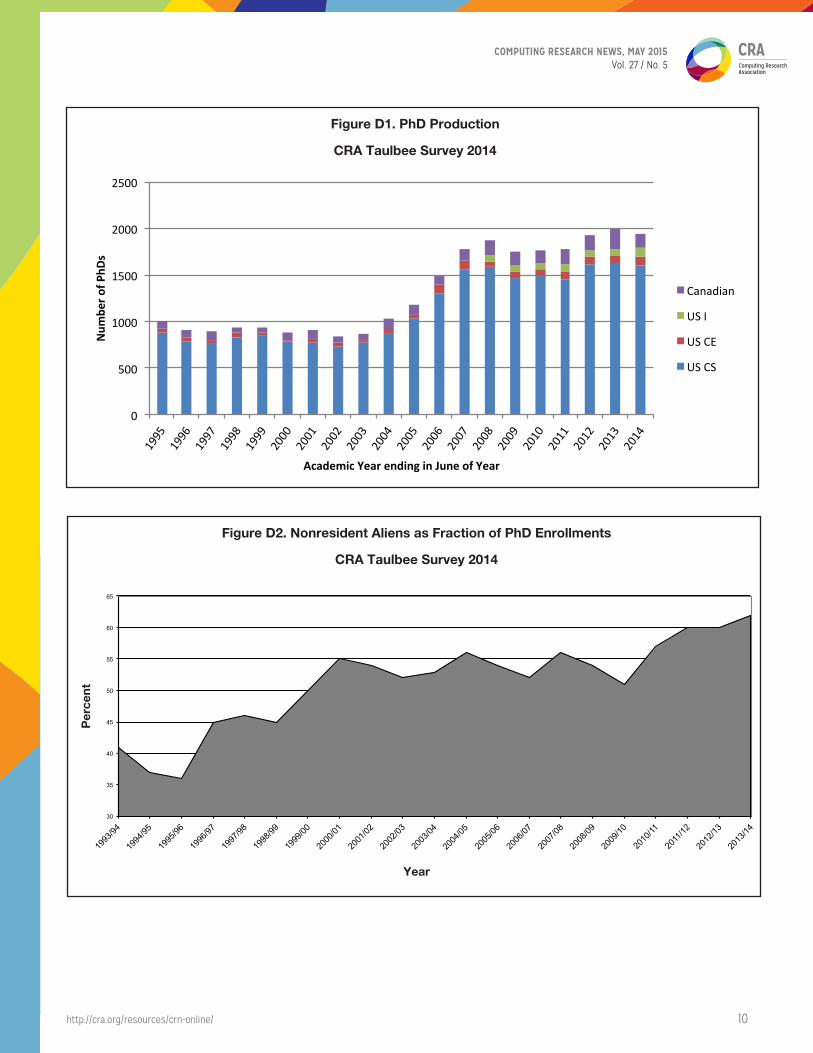
After two straight years of record Ph.D. production, the number
of doctoral degrees produced by the reporting departments
declined 2.6 percent, from 1,991 to 1,940. Among all departments
reporting both this year and last year, the number of total
doctoral degrees declined by 4.1 percent, and among U.S. CS
departments reporting both years, the decline was 3.7 percent.
An examination of the data by area of computing shows that
the entire aggregate decline in degrees produced is in the
computer engineering area. The number of CS doctoral degrees
produced was steady (1,651 by departments reporting this year
vs. 1,653 by departments reporting last year), and the number
of I degrees increased (154 vs. 120). The CE and I numbers are
strongly influenced by the specific departments responding in
Table D1. PhD Production and Pipeline by Department Type
Department Type # Depts
PhDs Awarded PhDs Next Year Passed Qualifier Passed Thesis(if dept has)
# Avg/ Dept # Avg/
Dept # Avg/ Dept # # Dept Avg/
Dept
US CS Public 96 1,228 12.3 1,298 13.5 1,290 14.2 1,027 80 11.8
US CS Private 34 378 11.1 487 14.3 414 12.9 214 24 8.8
US CS Total 130 1,606 12.0 1,785 13.7 1,704 13.9 1,241 104 11.1
US CE 10 90 9.0 117 11.7 215 19.5 136 7 28.9
US Info 13 98 8.2 89 6.8 103 7.9 65 10 8.0
Canadian 12 146 13.3 168 14.0 107 10.7 91 9 12.8
Grand Total 165 1,940 11.6 2,159 13.1 2,129 13.6 1,533 130 12.0
COMPUTING RESEARCH NEWS, MAY 2015Vol. 27 / No. 5
http://cra.org/resources/crn-online/ 4
a given year, since we receive data from only a small number
of these departments.
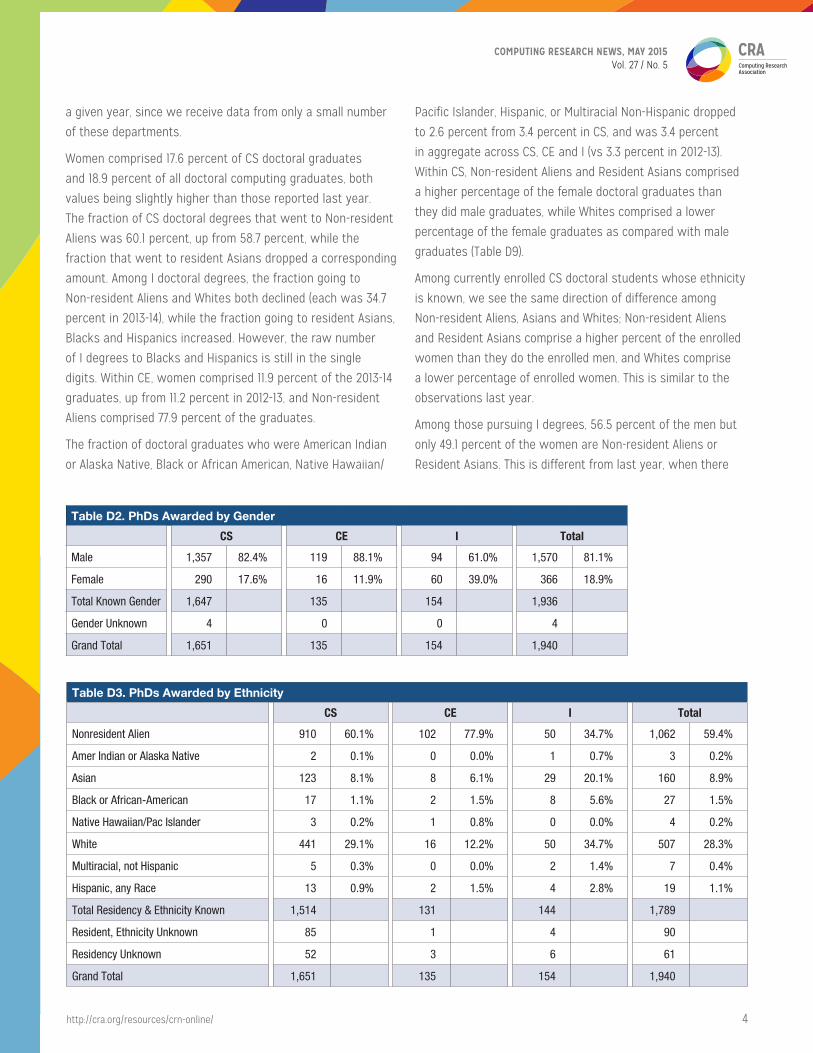
Women comprised 17.6 percent of CS doctoral graduates
and 18.9 percent of all doctoral computing graduates, both
values being slightly higher than those reported last year.
The fraction of CS doctoral degrees that went to Non-resident
Aliens was 60.1 percent, up from 58.7 percent, while the
fraction that went to resident Asians dropped a corresponding
amount. Among I doctoral degrees, the fraction going to
Non-resident Aliens and Whites both declined (each was 34.7
percent in 2013-14), while the fraction going to resident Asians,
Blacks and Hispanics increased. However, the raw number
of I degrees to Blacks and Hispanics is still in the single
digits. Within CE, women comprised 11.9 percent of the 2013-14
graduates, up from 11.2 percent in 2012-13, and Non-resident
Aliens comprised 77.9 percent of the graduates.
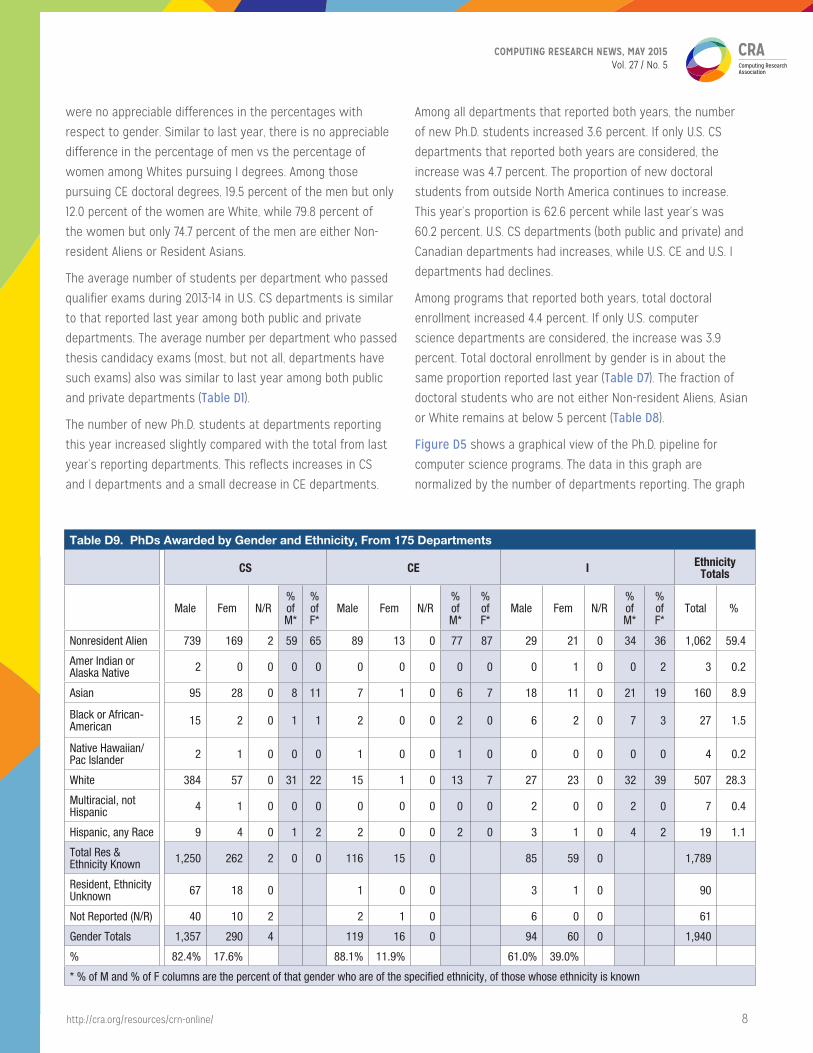
The fraction of doctoral graduates who were American Indian
or Alaska Native, Black or African American, Native Hawaiian/
Pacific Islander, Hispanic, or Multiracial Non-Hispanic dropped
to 2.6 percent from 3.4 percent in CS, and was 3.4 percent
in aggregate across CS, CE and I (vs 3.3 percent in 2012-13).
Within CS, Non-resident Aliens and Resident Asians comprised
a higher percentage of the female doctoral graduates than
they did male graduates, while Whites comprised a lower
percentage of the female graduates as compared with male
graduates (Table D9).
Among currently enrolled CS doctoral students whose ethnicity
is known, we see the same direction of difference among
Non-resident Aliens, Asians and Whites; Non-resident Aliens
and Resident Asians comprise a higher percent of the enrolled
women than they do the enrolled men, and Whites comprise
a lower percentage of enrolled women. This is similar to the
observations last year.
Among those pursuing I degrees, 56.5 percent of the men but
only 49.1 percent of the women are Non-resident Aliens or
Resident Asians. This is different from last year, when there
Table D3. PhDs Awarded by Ethnicity
CS CE I Total
Nonresident Alien 910 60.1% 102 77.9% 50 34.7% 1,062 59.4%
Amer Indian or Alaska Native 2 0.1% 0 0.0% 1 0.7% 3 0.2%
Asian 123 8.1% 8 6.1% 29 20.1% 160 8.9%
Black or African-American 17 1.1% 2 1.5% 8 5.6% 27 1.5%
Native Hawaiian/Pac Islander 3 0.2% 1 0.8% 0 0.0% 4 0.2%
White 441 29.1% 16 12.2% 50 34.7% 507 28.3%
Multiracial, not Hispanic 5 0.3% 0 0.0% 2 1.4% 7 0.4%
Hispanic, any Race 13 0.9% 2 1.5% 4 2.8% 19 1.1%
Total Residency & Ethnicity Known 1,514 131 144 1,789
Resident, Ethnicity Unknown 85 1 4 90
Residency Unknown 52 3 6 61
Grand Total 1,651 135 154 1,940
Table D2. PhDs Awarded by Gender
CS CE I Total
Male 1,357 82.4% 119 88.1% 94 61.0% 1,570 81.1%
Female 290 17.6% 16 11.9% 60 39.0% 366 18.9%
Total Known Gender 1,647 135 154 1,936
Gender Unknown 4 0 0 4
Grand Total 1,651 135 154 1,940
COMPUTING RESEARCH NEWS, MAY 2015Vol. 27 / No. 5
http://cra.org/resources/crn-online/ 5
Table D4. Employment of New PhD Recipients By Specialty
Artifi
cial
Inte
llige
nce
Com
pute
r-Su
ppor
ted
Co
oper
ativ
e W
ork
Data
base
s/In
form
atio
n Re
triev
al
Grap
hics
/Vis
ualiz
atio
n
Hard
war
e/Ar
chite
ctur
e
Hum
an-C
ompu
ter I
nter
actio
n
High
-Per
form
ance
Com
putin
g
Info
rmat
ics:
Bio
med
ica/
Ot
her S
cien
ce
Info
rmat
ion
Assu
ranc
e/Se
curit
y
Info
rmat
ion
Scie
nce
Info
rmat
ion
Syst
ems
Netw
orks
Oper
atin
g Sy
stem
s
Prog
ram
min
g La
ngua
ges/
Co
mpi
lers
Robo
tics/
Visi
on
Scie
ntifi
c/Nu
mer
ical
Com
putin
g
Soci
al C
ompu
ting/
So
cial
Info
rmat
ics
Softw
are
Engi
neer
ing
Theo
ry a
nd A
lgor
ithm
s
Othe
r
Tota
l
North American PhD Granting Depts.
Tenure-track 10 0 10 7 4 4 4 2 4 10 4 11 3 5 5 1 4 11 2 18 119 7.6%
Researcher 8 0 2 1 3 0 2 2 2 0 0 3 7 1 2 0 0 3 3 3 42 2.7%
Postdoc 17 1 7 12 9 6 4 18 5 4 4 10 2 13 11 2 2 12 17 25 181 11.6%
Teaching Faculty 4 0 2 0 1 0 0 3 3 0 3 0 0 2 1 0 5 3 4 11 42 2.7%
North American, Other Academic
Other CS/CE/I Dept. 4 0 3 1 2 1 2 0 1 3 1 2 0 1 0 0 0 1 0 7 29 1.9%
Non-CS/CE/I Dept 0 0 1 0 0 0 0 0 1 7 0 0 0 0 0 0 0 1 0 2 12 0.8%
North American, Non-Academic
Industry 85 0 78 57 47 23 27 30 32 7 24 93 41 34 43 9 13 93 36 124 896 57.5%
Government 8 0 2 2 0 1 2 0 5 3 0 2 1 0 3 2 0 3 1 11 46 3.0%
Self-Employed 2 1 1 3 1 0 1 0 0 1 0 0 1 0 1 0 0 0 0 7 19 1.2%
Unemployed 0 0 0 0 1 0 0 0 2 1 0 1 0 0 3 0 0 2 0 1 11 0.7%
Other 1 0 2 0 3 0 1 2 0 0 0 2 0 0 0 0 0 1 0 2 14 0.9%
Total Inside North America
139 2 108 83 71 35 43 57 55 36 36 124 55 56 69 14 24 130 63 211 1,411 90.6%
Outside North America
Ten-Track in PhD 4 0 2 3 2 0 2 1 3 3 2 5 0 0 1 0 1 3 0 6 38 2.4%
Researcher in PhD 0 0 0 0 0 0 0 0 0 0 0 1 0 0 1 0 0 0 0 0 2 0.1%
Postdoc in PhD 3 0 4 2 0 0 0 5 0 0 0 0 0 1 0 0 0 1 8 5 29 1.9%
Teaching in PhD 0 0 0 0 0 0 0 0 0 0 0 1 0 0 0 0 0 0 0 1 2 0.1%
Other Academic 0 0 0 0 0 1 0 0 0 1 0 0 0 0 0 1 0 0 1 2 6 0.4%
Industry 2 0 7 2 2 1 0 2 4 0 3 8 5 1 3 0 1 2 5 6 54 3.5%
Government 0 0 1 0 0 0 0 0 0 1 0 1 0 0 0 0 1 0 0 2 6 0.4%
Self-Employed 0 0 1 0 0 0 0 0 0 0 0 0 1 0 0 0 0 0 1 0 3 0.2%
Unemployed 0 0 0 0 0 0 0 0 0 0 0 0 0 0 0 0 0 0 0 2 2 0.1%
Other 1 0 0 0 0 2 1 0 0 0 0 1 0 0 0 0 0 0 0 0 5 0.3%
Total Outside NA 10 0 15 7 4 4 3 8 7 5 5 17 6 2 5 1 3 6 15 24 147 9.4%
Total with Employment Data, Inside North America plus Outside North America
149 2 123 90 75 39 46 65 62 41 41 141 61 58 74 15 27 136 78 235 1,558
Employment Type & Location Unknown
29 1 17 12 18 4 9 14 21 1 9 42 6 13 5 5 3 15 20 138 382
Grand Total 178 3 140 102 93 43 55 79 83 42 50 183 67 71 79 20 30 151 98 373 1,940
COMPUTING RESEARCH NEWS, MAY 2015Vol. 27 / No. 5
http://cra.org/resources/crn-online/ 6
Table D4a. Detail of Industry Employment
Artifi
cial
Inte
llige
nce
Com
pute
r-Su
ppor
ted
Co
oper
ativ
e W
ork
Data
base
s/
Info
rmat
ion
Retri
eval
Grap
hics
/Vis
ualiz
atio
n
Hard
war
e/Ar
chite
ctur
e
Hum
an-C
ompu
ter I
nter
actio
n
High
-Per
form
ance
Com
putin
g
Info
rmat
ics:
Bio
med
ica/
Ot
her S
cien
ce
Info
rmat
ion
Assu
ranc
e/Se
curit
y
Info
rmat
ion
Scie
nce
Info
rmat
ion
Syst
ems
Netw
orks
Oper
atin
g Sy
stem
s
Prog
ram
min
g La
ngua
ges/
Co
mpi
lers
Robo
tics/
Visi
on
Scie
ntifi
c/
Num
eric
al C
ompu
ting
Soci
al C
ompu
ting/
Soc
ial
Info
rmat
ics
Softw
are
Engi
neer
ing
Theo
ry a
nd A
lgor
ithm
s
Unkn
own
Othe
r
Tota
l
Inside North America
Research 52 0 39 28 29 13 13 11 14 4 5 42 18 15 22 4 4 31 13 23 39 419 46.8%
Non-Research 24 0 25 23 13 6 7 15 12 2 16 46 18 13 12 3 9 46 16 18 11 335 37.4%
Postdoctorate 3 0 1 2 1 0 1 2 0 0 2 1 0 2 4 0 0 0 2 7 0 28 3.1%
Type Not Specified 6 0 13 4 4 4 6 2 6 1 1 4 5 4 5 2 0 16 5 17 9 114 12.7%
Total Inside NA 85 0 78 57 47 23 27 30 32 7 24 93 41 34 43 9 13 93 36 65 59 896
Outside North America
Research 3 0 3 2 2 0 2 0 0 0 0 3 0 0 1 0 0 3 2 5 0 33 61.1%
Non-Research 1 0 0 0 0 0 0 0 0 0 0 2 0 0 0 0 0 1 0 0 1 11 20.4%
Postdoctorate 1 0 0 0 0 0 0 0 0 0 0 0 0 0 0 0 1 0 1 0 0 5 9.3%
Type Not Specified 1 0 1 0 0 1 0 0 0 0 0 2 0 0 1 0 0 0 0 0 0 5 9.3%
Total Outside NA 6 0 4 2 2 1 2 0 0 0 0 7 0 0 2 0 1 4 3 5 1 54
Table D5. New PhD Students by Department Type
CS CE I Total
Department Type New Admit
MS to PhD Total Avg. per
Dept.New
AdmitMS to PhD Total Avg. per
Dept.New
AdmitMS to PhD Total Avg. per
Dept. Total Avg. per Dept
US CS Public 1,448 204 1,652 17.0 84 16 100 7.7 67 7 74 7.4 1,826 18.4
US CS Private 581 17 598 17.1 4 0 4 2.0 17 0 17 5.7 619 17.7
US CS Total 2,029 221 2,250 17.0 88 16 104 6.9 84 7 91 7.0 2,445 18.2
US CE 0 0 0 0.0 85 11 96 8.7 5 0 5 5.0 101 9.2
US Information 2 0 2 2.0 0 0 0 0.0 113 9 122 9.4 124 9.5
Canadian 125 25 150 12.5 0 0 0 0.0 0 0 0 0.0 150 12.5
Grand Total 2,156 246 2,402 16.6 173 27 200 7.7 202 16 218 8.1 2,820 16.6
Table D5a. New PhD Students from Outside North America
Department Type CS CE I Total New
OutsideTotal New % outside
North America
US CS Public 1,103 70 29 1,202 1,826 65.8%
US CS Private 347 5 1 353 619 57.0%
Total US CS 1,450 75 30 1,555 2,445 63.6%
US CE 0 67 1 68 101 67.3%
US Info 0 0 56 56 124 45.2%
Canadian 87 0 0 87 150 58.0%
Grand Total 1,537 142 87 1,766 2,820 62.6%
COMPUTING RESEARCH NEWS, MAY 2015Vol. 27 / No. 5
http://cra.org/resources/crn-online/ 7
Table D6. PhD Enrollment by Department Type
Department Type
# Depts CS CE I Total
US CS Public 100 8,697 66.2% 368 66.2% 405 66.2% 9,470 66.2%
US CS Private 35 2,923 24.2% 60 24.2% 180 24.2% 3,163 24.2%
Total US CS 135 11,620 90.3% 428 90.3% 585 90.3% 12,633 90.3%
US CE 11 0 0.1% 809 0.1% 12 0.1% 821 0.1%
US Info 13 28 0.2% 0 0.2% 651 0.2% 679 0.2%
Canadian 10 793 9.3% 0 9.3% 140 9.3% 933 9.3%
Grand Total 169 12,441 1,237 1,388 15,066
Table D8. PhD Enrollment by Ethnicity
CS CE I Total
Nonresident Alien 7,223 63.0% 814 66.6% 520 44.1% 8,557 61.7%
Amer Indian or Alaska Native 18 0.2% 1 0.1% 1 0.1% 20 0.1%
Asian 596 5.2% 109 8.9% 113 9.6% 818 5.9%
Black or African-American 152 1.3% 14 1.1% 81 6.9% 247 1.8%
Native Hawaiian/Pac Islander 8 0.1% 6 0.5% 6 0.5% 20 0.1%
White 3,209 28.0% 225 18.4% 408 34.6% 3,842 27.7%
Multiracial, not Hispanic 64 0.6% 24 2.0% 18 1.5% 106 0.8%
Hispanic, any Race 200 1.7% 30 2.5% 32 2.7% 262 1.9%
Total Known 11,470 1,223 1,179 13,872
Resident, Ethnicity Unknown 494 12 184 690
Residency Unknown 477 2 25 504
Grand Total 12,441 1,237 1,388 15,066
Table D7. PhD Enrollment by Gender
CS CE I Total
Male 9,952 81.3% 1,049 84.8% 871 62.8% 11,872 79.9%
Female 2,284 18.7% 188 15.2% 517 37.2% 2,989 20.1%
Total Known Gender 12,236 1,237 1,388 14,861
Gender Unknown 205 0 0 205
Grand Total 12,441 1,237 1,388 15,066
COMPUTING RESEARCH NEWS, MAY 2015Vol. 27 / No. 5
http://cra.org/resources/crn-online/ 8
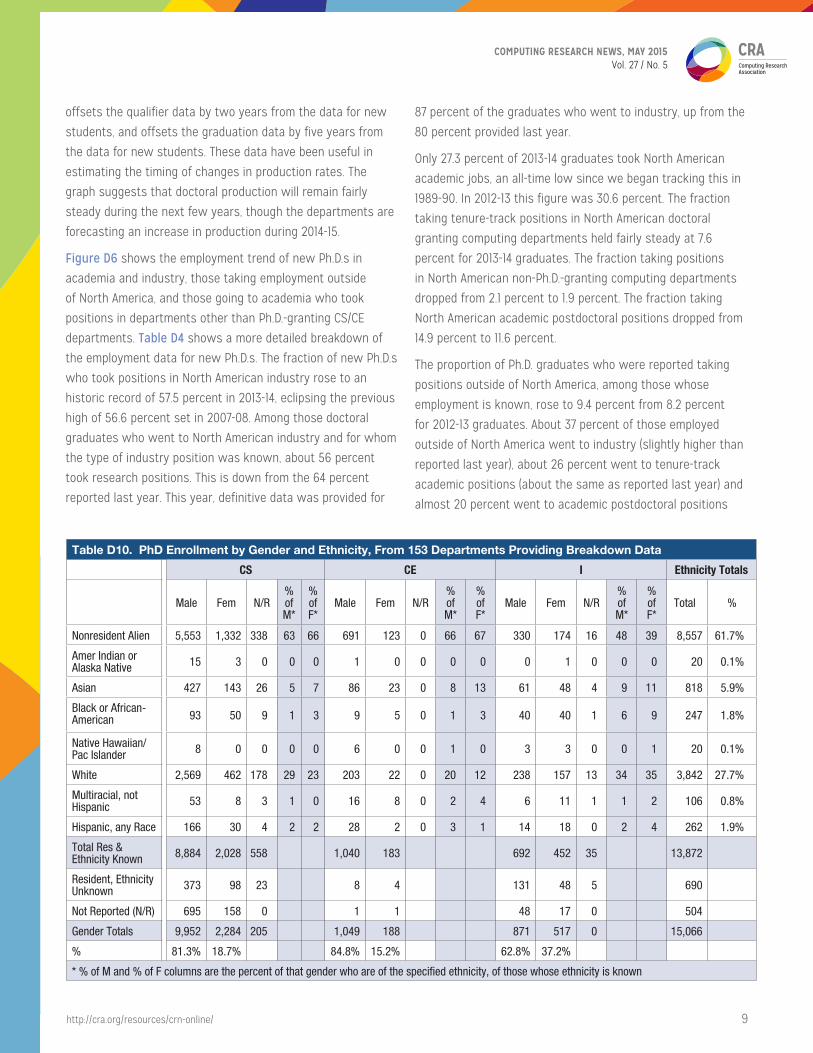
were no appreciable differences in the percentages with
respect to gender. Similar to last year, there is no appreciable
difference in the percentage of men vs the percentage of
women among Whites pursuing I degrees. Among those
pursuing CE doctoral degrees, 19.5 percent of the men but only
12.0 percent of the women are White, while 79.8 percent of
the women but only 74.7 percent of the men are either Non-
resident Aliens or Resident Asians.
The average number of students per department who passed
qualifier exams during 2013-14 in U.S. CS departments is similar
to that reported last year among both public and private
departments. The average number per department who passed
thesis candidacy exams (most, but not all, departments have
such exams) also was similar to last year among both public
and private departments (Table D1).
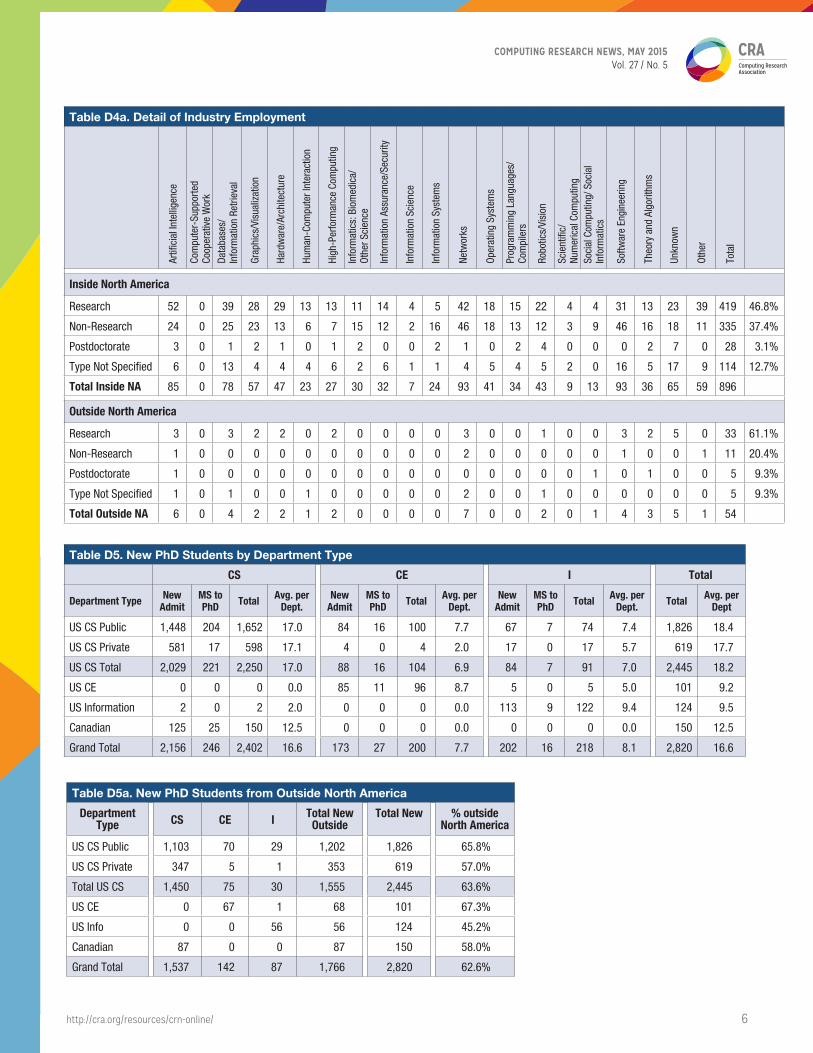
The number of new Ph.D. students at departments reporting
this year increased slightly compared with the total from last
year’s reporting departments. This reflects increases in CS
and I departments and a small decrease in CE departments.
Among all departments that reported both years, the number
of new Ph.D. students increased 3.6 percent. If only U.S. CS
departments that reported both years are considered, the
increase was 4.7 percent. The proportion of new doctoral
students from outside North America continues to increase.
This year’s proportion is 62.6 percent while last year’s was
60.2 percent. U.S. CS departments (both public and private) and
Canadian departments had increases, while U.S. CE and U.S. I
departments had declines.
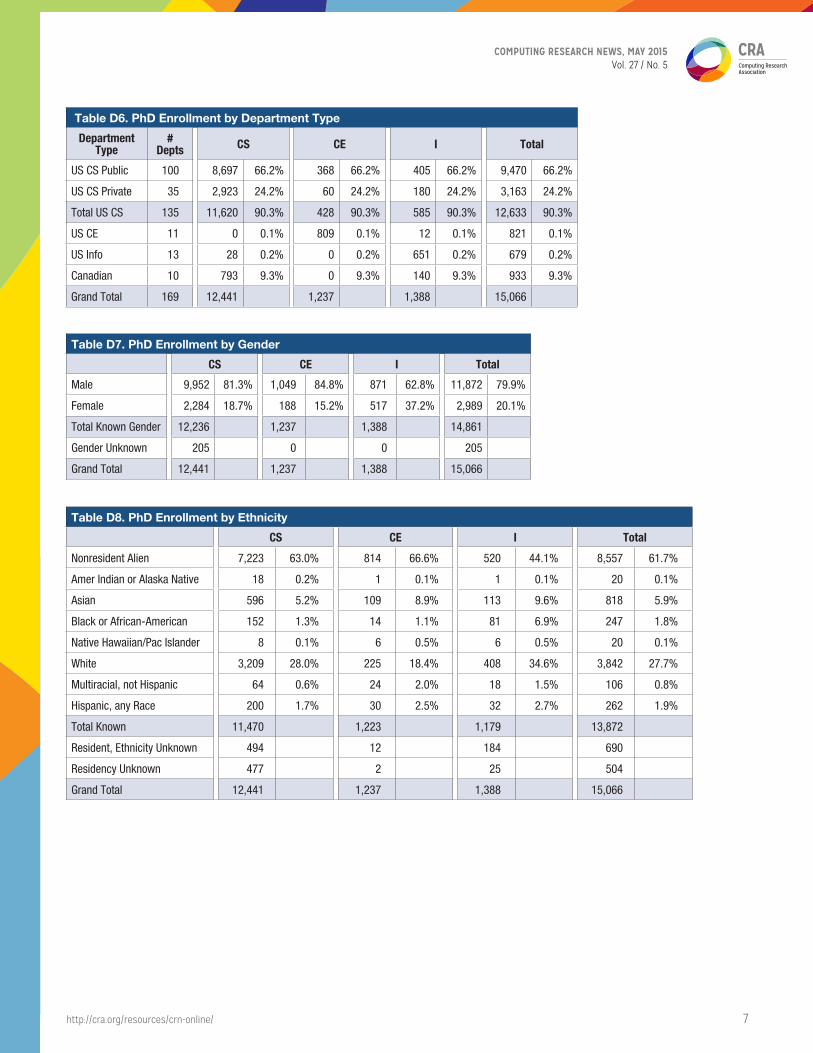
Among programs that reported both years, total doctoral
enrollment increased 4.4 percent. If only U.S. computer
science departments are considered, the increase was 3.9
percent. Total doctoral enrollment by gender is in about the
same proportion reported last year (Table D7). The fraction of
doctoral students who are not either Non-resident Aliens, Asian
or White remains at below 5 percent (Table D8).
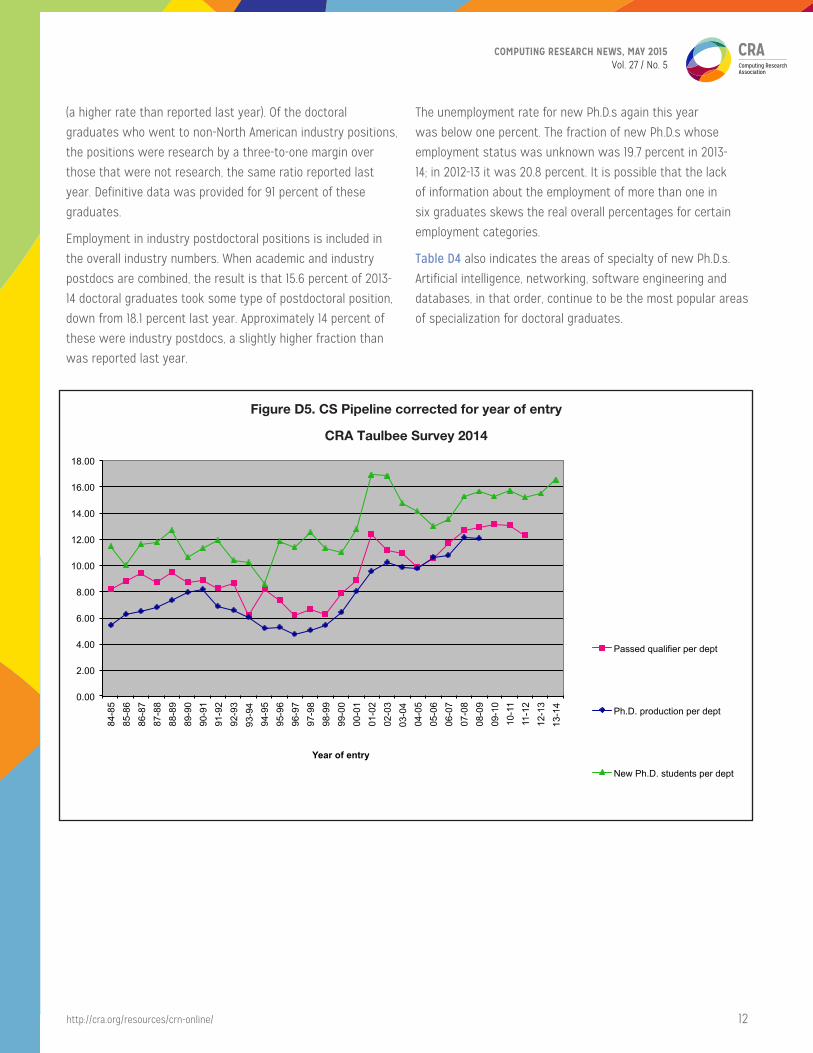
Figure D5 shows a graphical view of the Ph.D. pipeline for
computer science programs. The data in this graph are
normalized by the number of departments reporting. The graph
Table D9. PhDs Awarded by Gender and Ethnicity, From 175 Departments
CS CE I Ethnicity Totals
Male Fem N/R% of M*
% of F*
Male Fem N/R% of M*
% of F*
Male Fem N/R% of M*
% of F*
Total %
Nonresident Alien 739 169 2 59 65 89 13 0 77 87 29 21 0 34 36 1,062 59.4
Amer Indian or Alaska Native 2 0 0 0 0 0 0 0 0 0 0 1 0 0 2 3 0.2
Asian 95 28 0 8 11 7 1 0 6 7 18 11 0 21 19 160 8.9
Black or African-American 15 2 0 1 1 2 0 0 2 0 6 2 0 7 3 27 1.5
Native Hawaiian/ Pac Islander 2 1 0 0 0 1 0 0 1 0 0 0 0 0 0 4 0.2
White 384 57 0 31 22 15 1 0 13 7 27 23 0 32 39 507 28.3
Multiracial, not Hispanic 4 1 0 0 0 0 0 0 0 0 2 0 0 2 0 7 0.4
Hispanic, any Race 9 4 0 1 2 2 0 0 2 0 3 1 0 4 2 19 1.1
Total Res & Ethnicity Known 1,250 262 2 0 0 116 15 0 85 59 0 1,789
Resident, Ethnicity Unknown 67 18 0 1 0 0 3 1 0 90
Not Reported (N/R) 40 10 2 2 1 0 6 0 0 61
Gender Totals 1,357 290 4 119 16 0 94 60 0 1,940
% 82.4% 17.6% 88.1% 11.9% 61.0% 39.0%
* % of M and % of F columns are the percent of that gender who are of the specified ethnicity, of those whose ethnicity is known
COMPUTING RESEARCH NEWS, MAY 2015Vol. 27 / No. 5
http://cra.org/resources/crn-online/ 9
offsets the qualifier data by two years from the data for new
students, and offsets the graduation data by five years from
the data for new students. These data have been useful in
estimating the timing of changes in production rates. The
graph suggests that doctoral production will remain fairly
steady during the next few years, though the departments are
forecasting an increase in production during 2014-15.
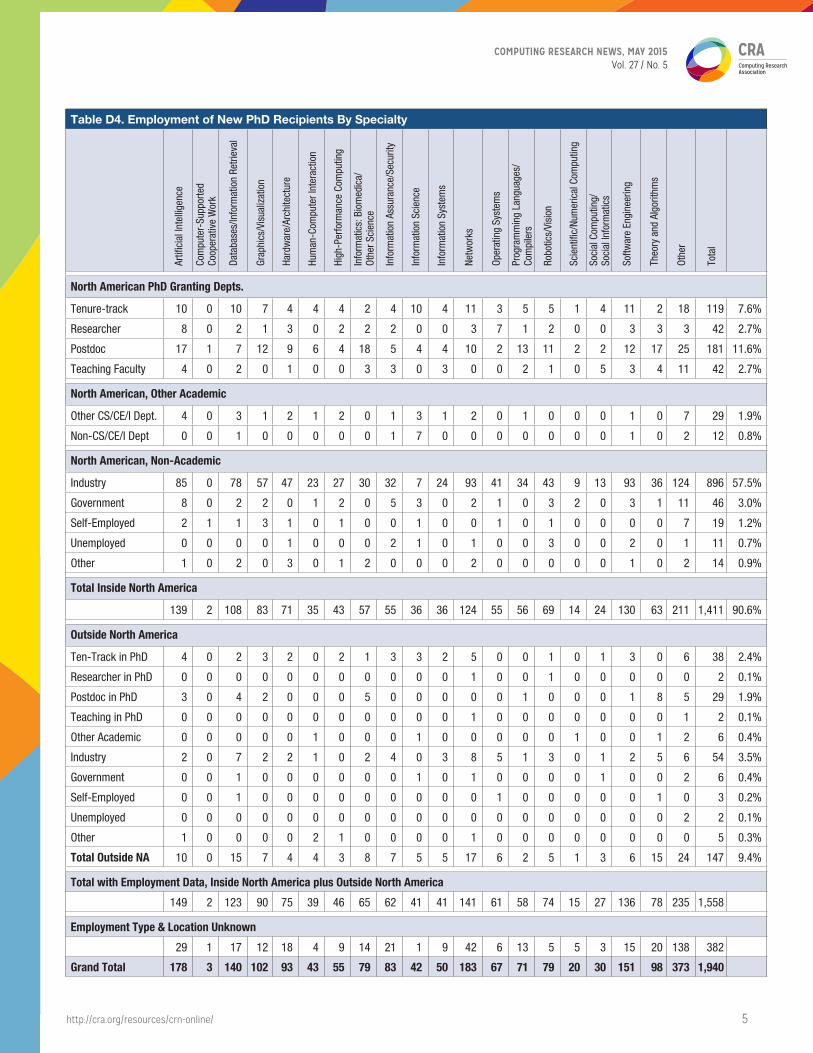
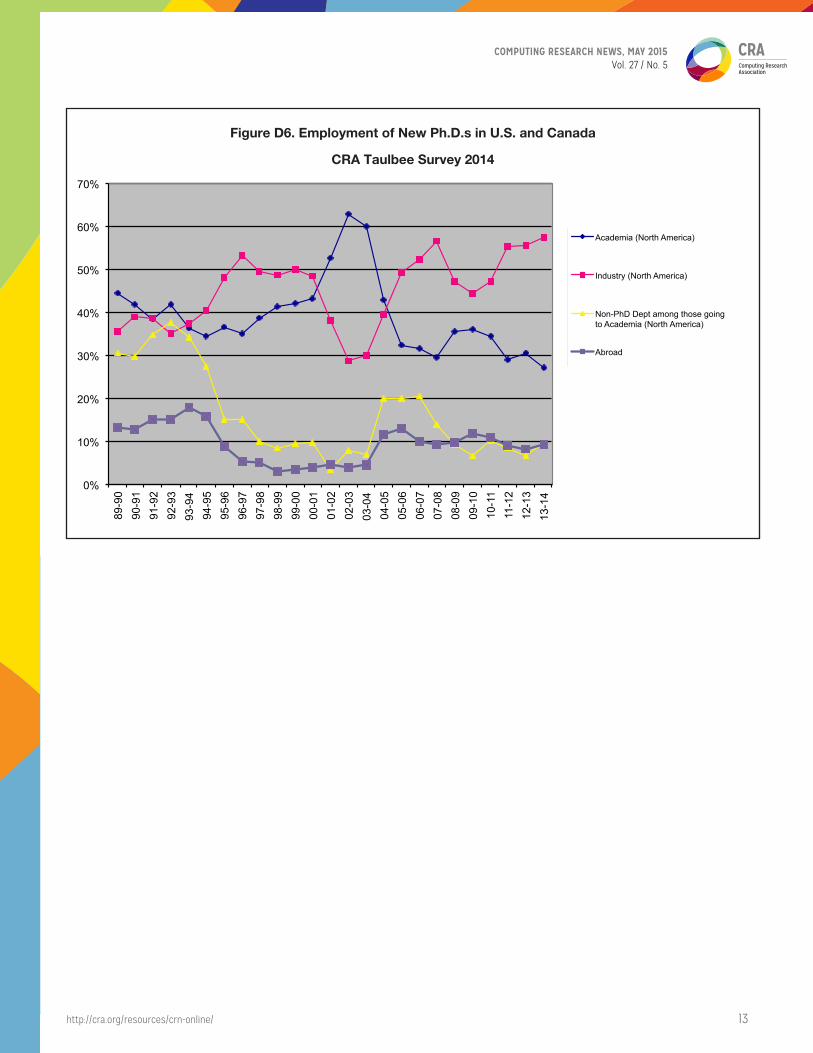
Figure D6 shows the employment trend of new Ph.D.s in
academia and industry, those taking employment outside
of North America, and those going to academia who took
positions in departments other than Ph.D.-granting CS/CE
departments. Table D4 shows a more detailed breakdown of
the employment data for new Ph.D.s. The fraction of new Ph.D.s
who took positions in North American industry rose to an
historic record of 57.5 percent in 2013-14, eclipsing the previous
high of 56.6 percent set in 2007-08. Among those doctoral
graduates who went to North American industry and for whom
the type of industry position was known, about 56 percent
took research positions. This is down from the 64 percent
reported last year. This year, definitive data was provided for
87 percent of the graduates who went to industry, up from the
80 percent provided last year.
Only 27.3 percent of 2013-14 graduates took North American
academic jobs, an all-time low since we began tracking this in
1989-90. In 2012-13 this figure was 30.6 percent. The fraction
taking tenure-track positions in North American doctoral
granting computing departments held fairly steady at 7.6
percent for 2013-14 graduates. The fraction taking positions
in North American non-Ph.D.-granting computing departments
dropped from 2.1 percent to 1.9 percent. The fraction taking
North American academic postdoctoral positions dropped from
14.9 percent to 11.6 percent.
The proportion of Ph.D. graduates who were reported taking
positions outside of North America, among those whose
employment is known, rose to 9.4 percent from 8.2 percent
for 2012-13 graduates. About 37 percent of those employed
outside of North America went to industry (slightly higher than
reported last year), about 26 percent went to tenure-track
academic positions (about the same as reported last year) and
almost 20 percent went to academic postdoctoral positions
Table D10. PhD Enrollment by Gender and Ethnicity, From 153 Departments Providing Breakdown Data
CS CE I Ethnicity Totals
Male Fem N/R% of M*
% of F*
Male Fem N/R% of M*
% of F*
Male Fem N/R% of M*
% of F*
Total %
Nonresident Alien 5,553 1,332 338 63 66 691 123 0 66 67 330 174 16 48 39 8,557 61.7%
Amer Indian or Alaska Native 15 3 0 0 0 1 0 0 0 0 0 1 0 0 0 20 0.1%
Asian 427 143 26 5 7 86 23 0 8 13 61 48 4 9 11 818 5.9%
Black or African-American 93 50 9 1 3 9 5 0 1 3 40 40 1 6 9 247 1.8%
Native Hawaiian/ Pac Islander 8 0 0 0 0 6 0 0 1 0 3 3 0 0 1 20 0.1%
White 2,569 462 178 29 23 203 22 0 20 12 238 157 13 34 35 3,842 27.7%
Multiracial, not Hispanic 53 8 3 1 0 16 8 0 2 4 6 11 1 1 2 106 0.8%
Hispanic, any Race 166 30 4 2 2 28 2 0 3 1 14 18 0 2 4 262 1.9%
Total Res & Ethnicity Known 8,884 2,028 558 1,040 183 692 452 35 13,872
Resident, Ethnicity Unknown 373 98 23 8 4 131 48 5 690
Not Reported (N/R) 695 158 0 1 1 48 17 0 504
Gender Totals 9,952 2,284 205 1,049 188 871 517 0 15,066
% 81.3% 18.7% 84.8% 15.2% 62.8% 37.2%
* % of M and % of F columns are the percent of that gender who are of the specified ethnicity, of those whose ethnicity is known
COMPUTING RESEARCH NEWS, MAY 2015Vol. 27 / No. 5
http://cra.org/resources/crn-online/ 10
Figure D1. PhD Production
CRA Taulbee Survey 2014
0
500
1000
1500
2000
2500
1995
1996
1997
1998
1999
2000
2001
2002
2003
2004
2005
2006
2007
2008
2009
2010
2011
2012
2013
2014
Num
ber o
f PhD
s
Academic Year ending in June of Year
Figure D1. PhD Produc:on CRA Taulbee Survey 2014
Canadian
US I
US CE
US CS
Figure D2. Nonresident Aliens as Fraction of PhD Enrollments
CRA Taulbee Survey 2014
30
35
40
45
50
55
60
65
1993
/94
1994
/95
1995
/96
1996
/97
1997
/98
1998
/99
1999
/00
2000
/01
2001
/02
2002
/03
2003
/04
2004
/05
2005
/06
2006
/07
2007
/08
2008
/09
2009
/10
2010
/11
2011
/12
2012
/13
2013
/14
Perc
ent
Year
Figure D2. Nonresident Aliens as Fraction of PhD Enrollments CRA Taulbee Survey 2014
Year
Per
cent
COMPUTING RESEARCH NEWS, MAY 2015Vol. 27 / No. 5
http://cra.org/resources/crn-online/ 11
Figure D3. PhD Degrees Granted by Tenure-Track Size
CRA Taulbee Survey 2014
Figure D4. PhD Enrollment Normalized by Tenure-Track Size
CRA Taulbee Survey 2014
-‐0.1
0.0
0.1
0.2
0.3
0.4
0.5
0.6
0.7
0.8
0.9
1.0
1.1
1.2
Public size <
=15
Public 10 < size <
= 20
Public 15 < size <
=25
Public 20 < size <
= 35
Public size >
30
Priva
te size <=
20
Priva
te 15 < s
ize <=
30
Priva
te size > 20
US CE
US Info
Canadian
Degr
ees G
rant
ed p
er F
acul
ty M
embe
r Figure D3. PhD Degrees Granted by Tenure-‐Track Size
CRA Taulbee Survey 2014
Whiskers show 90th and 10th %iles Lighter box 25th %ile to median Darker box median to 75th %ile
US CS Public by Tenure-‐Track Faculty Size US CS Private by Size US Other Can
0.0
0.5
1.0
1.5
2.0
2.5
3.0
3.5
4.0
4.5
5.0
5.5
6.0
6.5
Public size <
=15
Public 10 < size <
= 20
Public 15 < size <
=25
Public 20 < size <
= 35
Public size >
30
Priva
te size <=
20
Priva
te 15 < s
ize <=
30
Priva
te size > 20
US CE
US Info
Canadian
Stude
nts p
er Faculty M
embe
r
Figure D4. PhD Enrollment Normalized by Tenure-‐Track Size CRA Taulbee Survey 2014
Whiskers show 90th and 10th %iles Lighter box 25th %ile to median Darker box median to 75th %ile
US CS Public by Tenure-‐Track Faculty Size US CS Private by Size US Other Can
COMPUTING RESEARCH NEWS, MAY 2015Vol. 27 / No. 5
http://cra.org/resources/crn-online/ 12
Figure D5. CS Pipeline corrected for year of entry
CRA Taulbee Survey 2014
0.00
2.00
4.00
6.00
8.00
10.00
12.00
14.00
16.00
18.00
84-8
5 85
-86
86-8
7 87
-88
88-8
9 89
-90
90-9
1 91
-92
92-9
3 93
-94
94-9
5 95
-96
96-9
7 97
-98
98-9
9 99
-00
00-0
1 01
-02
02-0
3 03
-04
04-0
5 05
-06
06-0
7 07
-08
08-0
9 09
-10
10-1
1 11
-12
12-1
3 13
-14
Year of entry
Figure D5. CS Pipeline corrected for year of entry
Passed qualifier per dept
Ph.D. production per dept
New Ph.D. students per dept
(a higher rate than reported last year). Of the doctoral
graduates who went to non-North American industry positions,
the positions were research by a three-to-one margin over
those that were not research, the same ratio reported last
year. Definitive data was provided for 91 percent of these
graduates.
Employment in industry postdoctoral positions is included in
the overall industry numbers. When academic and industry
postdocs are combined, the result is that 15.6 percent of 2013-
14 doctoral graduates took some type of postdoctoral position,
down from 18.1 percent last year. Approximately 14 percent of
these were industry postdocs, a slightly higher fraction than
was reported last year.
The unemployment rate for new Ph.D.s again this year
was below one percent. The fraction of new Ph.D.s whose
employment status was unknown was 19.7 percent in 2013-
14; in 2012-13 it was 20.8 percent. It is possible that the lack
of information about the employment of more than one in
six graduates skews the real overall percentages for certain
employment categories.
Table D4 also indicates the areas of specialty of new Ph.D.s.
Artificial intelligence, networking, software engineering and
databases, in that order, continue to be the most popular areas
of specialization for doctoral graduates.
COMPUTING RESEARCH NEWS, MAY 2015Vol. 27 / No. 5
http://cra.org/resources/crn-online/ 13
0%
10%
20%
30%
40%
50%
60%
70%
89-9
0 90
-91
91-9
2 92
-93
93-9
4 94
-95
95-9
6 96
-97
97-9
8 98
-99
99-0
0 00
-01
01-0
2 02
-03
03-0
4 04
-05
05-0
6 06
-07
07-0
8 08
-09
09-1
0 10
-11
11-1
2 12
-13
13-1
4
Figure D6. Employment of New Ph.D.s in U.S. and Canada
Academia (North America)
Industry (North America)
Non-PhD Dept among those going to Academia (North America)
Abroad
Figure D6. Employment of New Ph.D.s in U.S. and Canada
CRA Taulbee Survey 2014
COMPUTING RESEARCH NEWS, MAY 2015Vol. 27 / No. 5
http://cra.org/resources/crn-online/ 14
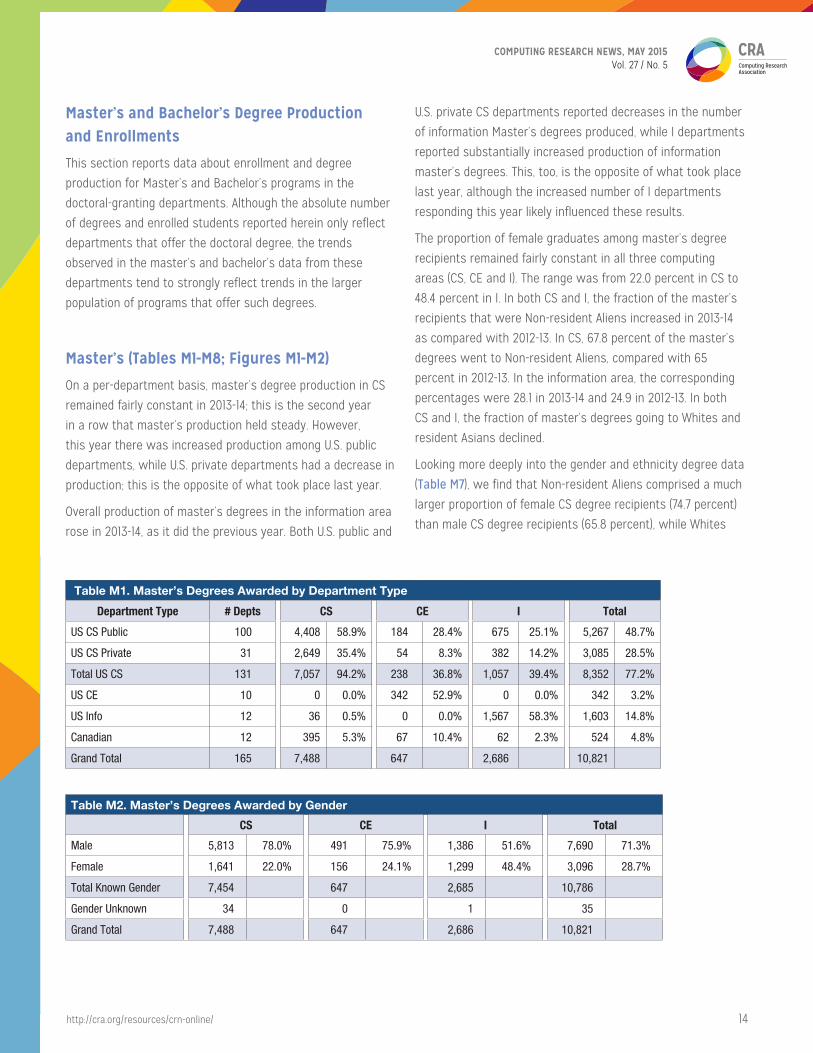
Master’s and Bachelor’s Degree Production and Enrollments
This section reports data about enrollment and degree
production for Master’s and Bachelor’s programs in the
doctoral-granting departments. Although the absolute number
of degrees and enrolled students reported herein only reflect
departments that offer the doctoral degree, the trends
observed in the master’s and bachelor’s data from these
departments tend to strongly reflect trends in the larger
population of programs that offer such degrees.
Master’s (Tables M1-M8; Figures M1-M2)
On a per-department basis, master’s degree production in CS
remained fairly constant in 2013-14; this is the second year
in a row that master’s production held steady. However,
this year there was increased production among U.S. public
departments, while U.S. private departments had a decrease in
production; this is the opposite of what took place last year.
Overall production of master’s degrees in the information area
rose in 2013-14, as it did the previous year. Both U.S. public and
U.S. private CS departments reported decreases in the number
of information Master’s degrees produced, while I departments
reported substantially increased production of information
master’s degrees. This, too, is the opposite of what took place
last year, although the increased number of I departments
responding this year likely influenced these results.
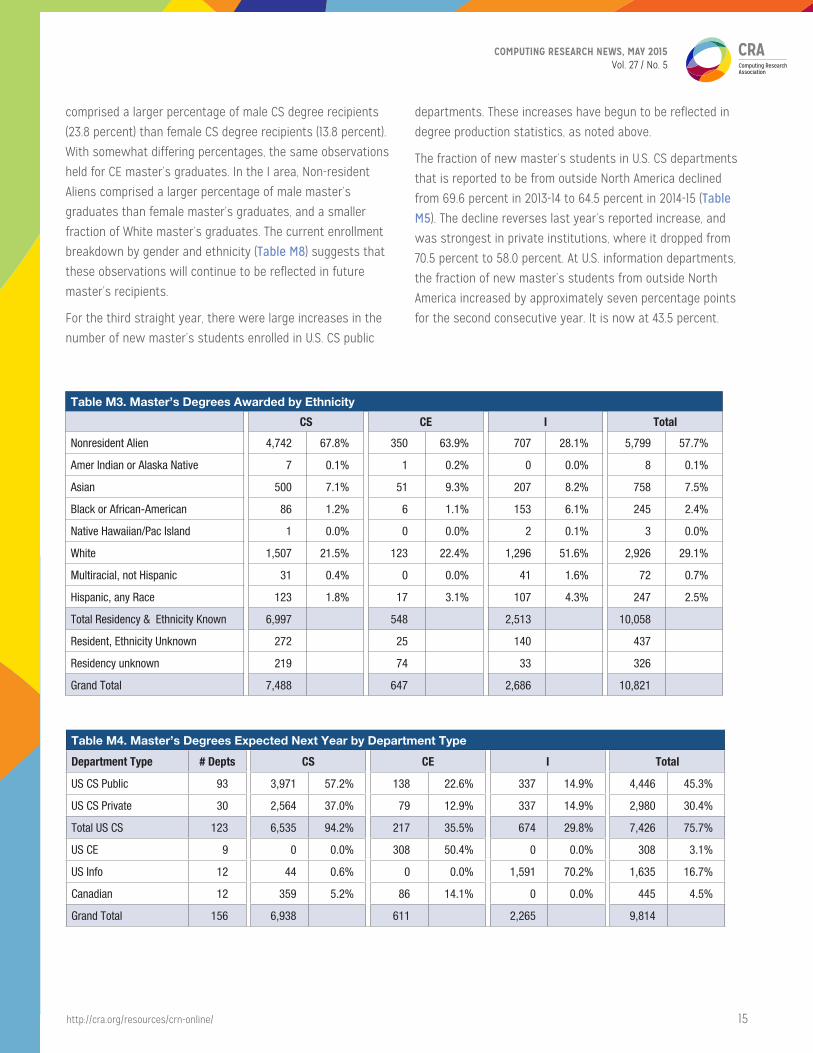
The proportion of female graduates among master’s degree
recipients remained fairly constant in all three computing
areas (CS, CE and I). The range was from 22.0 percent in CS to
48.4 percent in I. In both CS and I, the fraction of the master’s
recipients that were Non-resident Aliens increased in 2013-14
as compared with 2012-13. In CS, 67.8 percent of the master’s
degrees went to Non-resident Aliens, compared with 65
percent in 2012-13. In the information area, the corresponding
percentages were 28.1 in 2013-14 and 24.9 in 2012-13. In both
CS and I, the fraction of master’s degrees going to Whites and
resident Asians declined.
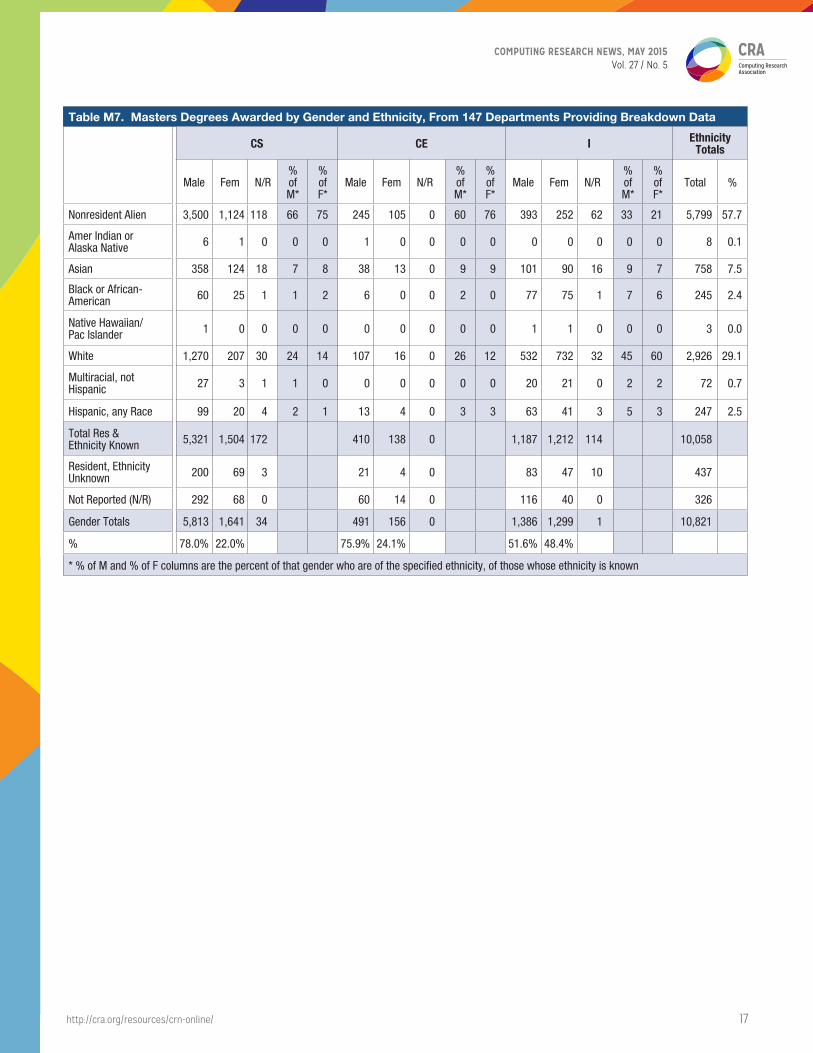
Looking more deeply into the gender and ethnicity degree data
(Table M7), we find that Non-resident Aliens comprised a much
larger proportion of female CS degree recipients (74.7 percent)
than male CS degree recipients (65.8 percent), while Whites
Table M1. Master’s Degrees Awarded by Department Type
Department Type # Depts CS CE I Total
US CS Public 100 4,408 58.9% 184 28.4% 675 25.1% 5,267 48.7%
US CS Private 31 2,649 35.4% 54 8.3% 382 14.2% 3,085 28.5%
Total US CS 131 7,057 94.2% 238 36.8% 1,057 39.4% 8,352 77.2%
US CE 10 0 0.0% 342 52.9% 0 0.0% 342 3.2%
US Info 12 36 0.5% 0 0.0% 1,567 58.3% 1,603 14.8%
Canadian 12 395 5.3% 67 10.4% 62 2.3% 524 4.8%
Grand Total 165 7,488 647 2,686 10,821
Table M2. Master’s Degrees Awarded by Gender
CS CE I Total
Male 5,813 78.0% 491 75.9% 1,386 51.6% 7,690 71.3%
Female 1,641 22.0% 156 24.1% 1,299 48.4% 3,096 28.7%
Total Known Gender 7,454 647 2,685 10,786
Gender Unknown 34 0 1 35
Grand Total 7,488 647 2,686 10,821
COMPUTING RESEARCH NEWS, MAY 2015Vol. 27 / No. 5
http://cra.org/resources/crn-online/ 15
comprised a larger percentage of male CS degree recipients
(23.8 percent) than female CS degree recipients (13.8 percent).
With somewhat differing percentages, the same observations
held for CE master’s graduates. In the I area, Non-resident
Aliens comprised a larger percentage of male master’s
graduates than female master’s graduates, and a smaller
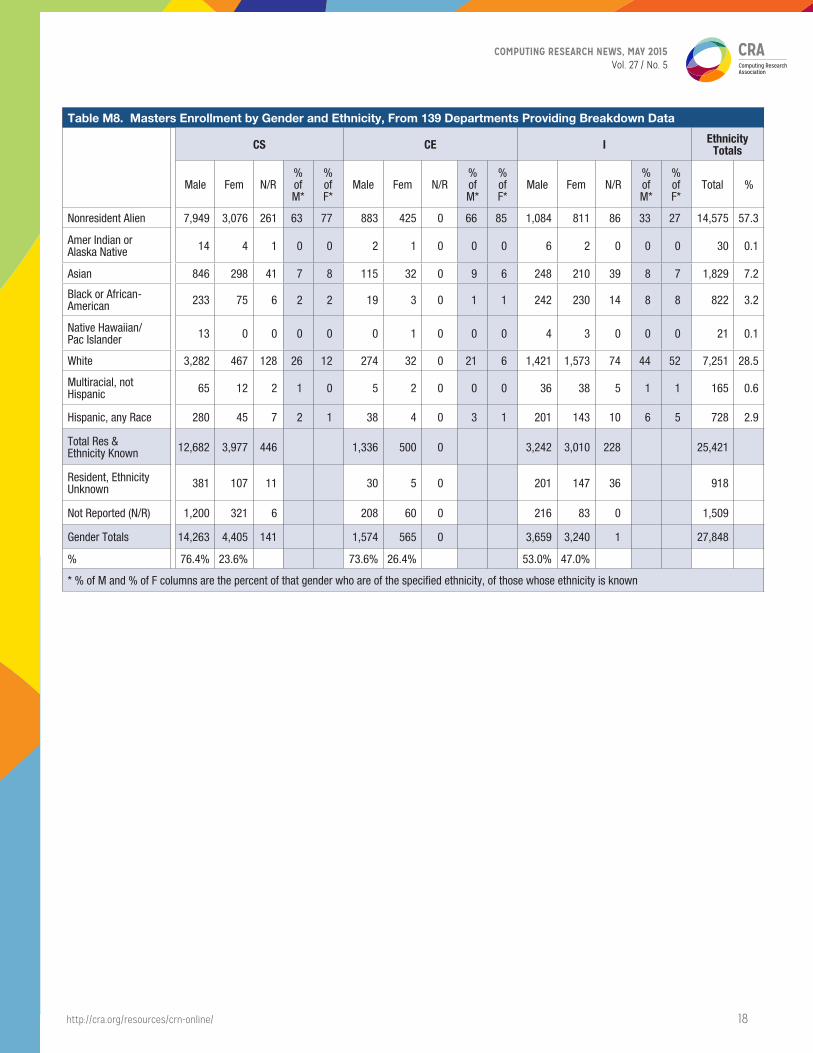
fraction of White master’s graduates. The current enrollment
breakdown by gender and ethnicity (Table M8) suggests that
these observations will continue to be reflected in future
master’s recipients.
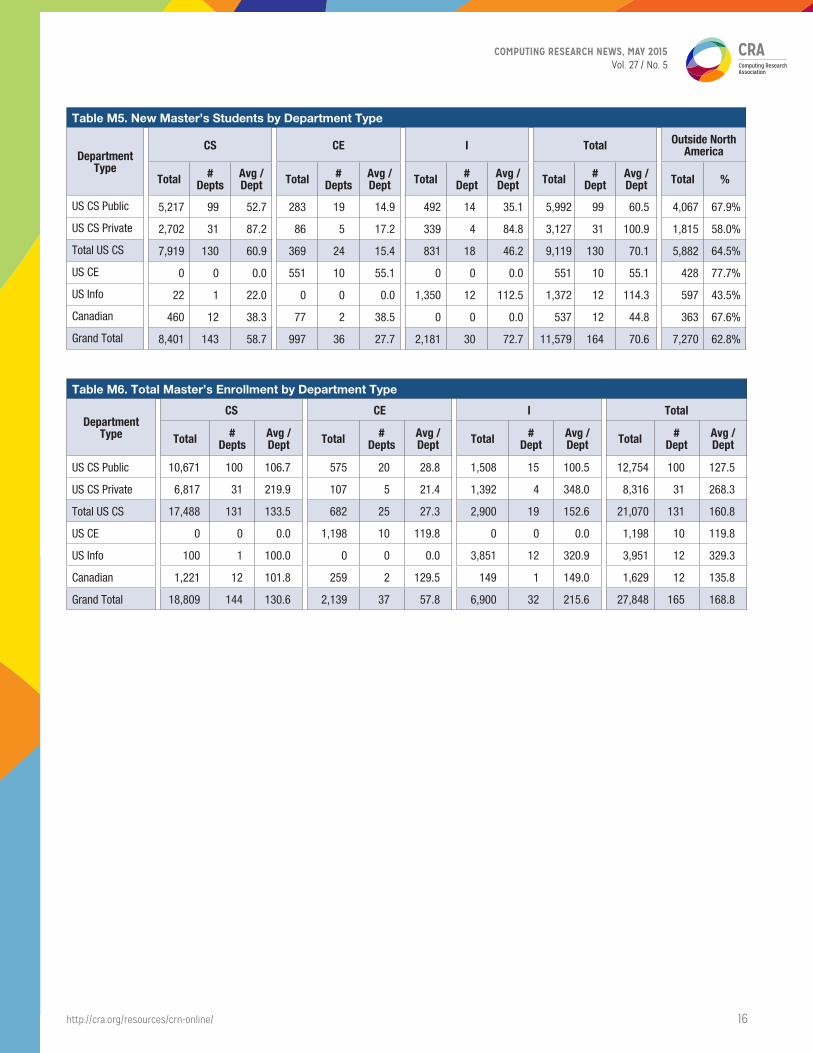
For the third straight year, there were large increases in the
number of new master’s students enrolled in U.S. CS public
departments. These increases have begun to be reflected in
degree production statistics, as noted above.
The fraction of new master’s students in U.S. CS departments
that is reported to be from outside North America declined
from 69.6 percent in 2013-14 to 64.5 percent in 2014-15 (Table
M5). The decline reverses last year’s reported increase, and
was strongest in private institutions, where it dropped from
70.5 percent to 58.0 percent. At U.S. information departments,
the fraction of new master’s students from outside North
America increased by approximately seven percentage points
for the second consecutive year. It is now at 43.5 percent.
Table M4. Master’s Degrees Expected Next Year by Department Type
Department Type # Depts CS CE I Total
US CS Public 93 3,971 57.2% 138 22.6% 337 14.9% 4,446 45.3%
US CS Private 30 2,564 37.0% 79 12.9% 337 14.9% 2,980 30.4%
Total US CS 123 6,535 94.2% 217 35.5% 674 29.8% 7,426 75.7%
US CE 9 0 0.0% 308 50.4% 0 0.0% 308 3.1%
US Info 12 44 0.6% 0 0.0% 1,591 70.2% 1,635 16.7%
Canadian 12 359 5.2% 86 14.1% 0 0.0% 445 4.5%
Grand Total 156 6,938 611 2,265 9,814
Table M3. Master’s Degrees Awarded by Ethnicity
CS CE I Total
Nonresident Alien 4,742 67.8% 350 63.9% 707 28.1% 5,799 57.7%
Amer Indian or Alaska Native 7 0.1% 1 0.2% 0 0.0% 8 0.1%
Asian 500 7.1% 51 9.3% 207 8.2% 758 7.5%
Black or African-American 86 1.2% 6 1.1% 153 6.1% 245 2.4%
Native Hawaiian/Pac Island 1 0.0% 0 0.0% 2 0.1% 3 0.0%
White 1,507 21.5% 123 22.4% 1,296 51.6% 2,926 29.1%
Multiracial, not Hispanic 31 0.4% 0 0.0% 41 1.6% 72 0.7%
Hispanic, any Race 123 1.8% 17 3.1% 107 4.3% 247 2.5%
Total Residency & Ethnicity Known 6,997 548 2,513 10,058
Resident, Ethnicity Unknown 272 25 140 437
Residency unknown 219 74 33 326
Grand Total 7,488 647 2,686 10,821
COMPUTING RESEARCH NEWS, MAY 2015Vol. 27 / No. 5
http://cra.org/resources/crn-online/ 16
Table M6. Total Master’s Enrollment by Department Type
Department Type
CS CE I Total
Total # Depts
Avg / Dept Total #
DeptsAvg / Dept Total #
DeptAvg / Dept Total #
DeptAvg / Dept
US CS Public 10,671 100 106.7 575 20 28.8 1,508 15 100.5 12,754 100 127.5
US CS Private 6,817 31 219.9 107 5 21.4 1,392 4 348.0 8,316 31 268.3
Total US CS 17,488 131 133.5 682 25 27.3 2,900 19 152.6 21,070 131 160.8
US CE 0 0 0.0 1,198 10 119.8 0 0 0.0 1,198 10 119.8
US Info 100 1 100.0 0 0 0.0 3,851 12 320.9 3,951 12 329.3
Canadian 1,221 12 101.8 259 2 129.5 149 1 149.0 1,629 12 135.8
Grand Total 18,809 144 130.6 2,139 37 57.8 6,900 32 215.6 27,848 165 168.8
Table M5. New Master’s Students by Department Type
Department Type
CS CE I Total Outside North America
Total # Depts
Avg / Dept Total #
DeptsAvg / Dept Total #
DeptAvg / Dept Total #
DeptAvg / Dept Total %
US CS Public 5,217 99 52.7 283 19 14.9 492 14 35.1 5,992 99 60.5 4,067 67.9%
US CS Private 2,702 31 87.2 86 5 17.2 339 4 84.8 3,127 31 100.9 1,815 58.0%
Total US CS 7,919 130 60.9 369 24 15.4 831 18 46.2 9,119 130 70.1 5,882 64.5%
US CE 0 0 0.0 551 10 55.1 0 0 0.0 551 10 55.1 428 77.7%
US Info 22 1 22.0 0 0 0.0 1,350 12 112.5 1,372 12 114.3 597 43.5%
Canadian 460 12 38.3 77 2 38.5 0 0 0.0 537 12 44.8 363 67.6%
Grand Total 8,401 143 58.7 997 36 27.7 2,181 30 72.7 11,579 164 70.6 7,270 62.8%
COMPUTING RESEARCH NEWS, MAY 2015Vol. 27 / No. 5
http://cra.org/resources/crn-online/ 17
Table M7. Masters Degrees Awarded by Gender and Ethnicity, From 147 Departments Providing Breakdown Data
CS CE I Ethnicity Totals
Male Fem N/R% of M*
% of F*
Male Fem N/R% of M*
% of F*
Male Fem N/R% of M*
% of F*
Total %
Nonresident Alien 3,500 1,124 118 66 75 245 105 0 60 76 393 252 62 33 21 5,799 57.7
Amer Indian or Alaska Native 6 1 0 0 0 1 0 0 0 0 0 0 0 0 0 8 0.1
Asian 358 124 18 7 8 38 13 0 9 9 101 90 16 9 7 758 7.5
Black or African-American 60 25 1 1 2 6 0 0 2 0 77 75 1 7 6 245 2.4
Native Hawaiian/ Pac Islander 1 0 0 0 0 0 0 0 0 0 1 1 0 0 0 3 0.0
White 1,270 207 30 24 14 107 16 0 26 12 532 732 32 45 60 2,926 29.1
Multiracial, not Hispanic 27 3 1 1 0 0 0 0 0 0 20 21 0 2 2 72 0.7
Hispanic, any Race 99 20 4 2 1 13 4 0 3 3 63 41 3 5 3 247 2.5
Total Res & Ethnicity Known 5,321 1,504 172 410 138 0 1,187 1,212 114 10,058
Resident, Ethnicity Unknown 200 69 3 21 4 0 83 47 10 437
Not Reported (N/R) 292 68 0 60 14 0 116 40 0 326
Gender Totals 5,813 1,641 34 491 156 0 1,386 1,299 1 10,821
% 78.0% 22.0% 75.9% 24.1% 51.6% 48.4%
* % of M and % of F columns are the percent of that gender who are of the specified ethnicity, of those whose ethnicity is known
COMPUTING RESEARCH NEWS, MAY 2015Vol. 27 / No. 5
http://cra.org/resources/crn-online/ 18
Table M8. Masters Enrollment by Gender and Ethnicity, From 139 Departments Providing Breakdown Data
CS CE I Ethnicity Totals
Male Fem N/R% of M*
% of F*
Male Fem N/R% of M*
% of F*
Male Fem N/R% of M*
% of F*
Total %
Nonresident Alien 7,949 3,076 261 63 77 883 425 0 66 85 1,084 811 86 33 27 14,575 57.3
Amer Indian or Alaska Native 14 4 1 0 0 2 1 0 0 0 6 2 0 0 0 30 0.1
Asian 846 298 41 7 8 115 32 0 9 6 248 210 39 8 7 1,829 7.2
Black or African-American 233 75 6 2 2 19 3 0 1 1 242 230 14 8 8 822 3.2
Native Hawaiian/ Pac Islander 13 0 0 0 0 0 1 0 0 0 4 3 0 0 0 21 0.1
White 3,282 467 128 26 12 274 32 0 21 6 1,421 1,573 74 44 52 7,251 28.5
Multiracial, not Hispanic 65 12 2 1 0 5 2 0 0 0 36 38 5 1 1 165 0.6
Hispanic, any Race 280 45 7 2 1 38 4 0 3 1 201 143 10 6 5 728 2.9
Total Res & Ethnicity Known 12,682 3,977 446 1,336 500 0 3,242 3,010 228 25,421
Resident, Ethnicity Unknown 381 107 11 30 5 0 201 147 36 918
Not Reported (N/R) 1,200 321 6 208 60 0 216 83 0 1,509
Gender Totals 14,263 4,405 141 1,574 565 0 3,659 3,240 1 27,848
% 76.4% 23.6% 73.6% 26.4% 53.0% 47.0%
* % of M and % of F columns are the percent of that gender who are of the specified ethnicity, of those whose ethnicity is known
COMPUTING RESEARCH NEWS, MAY 2015Vol. 27 / No. 5
http://cra.org/resources/crn-online/ 19
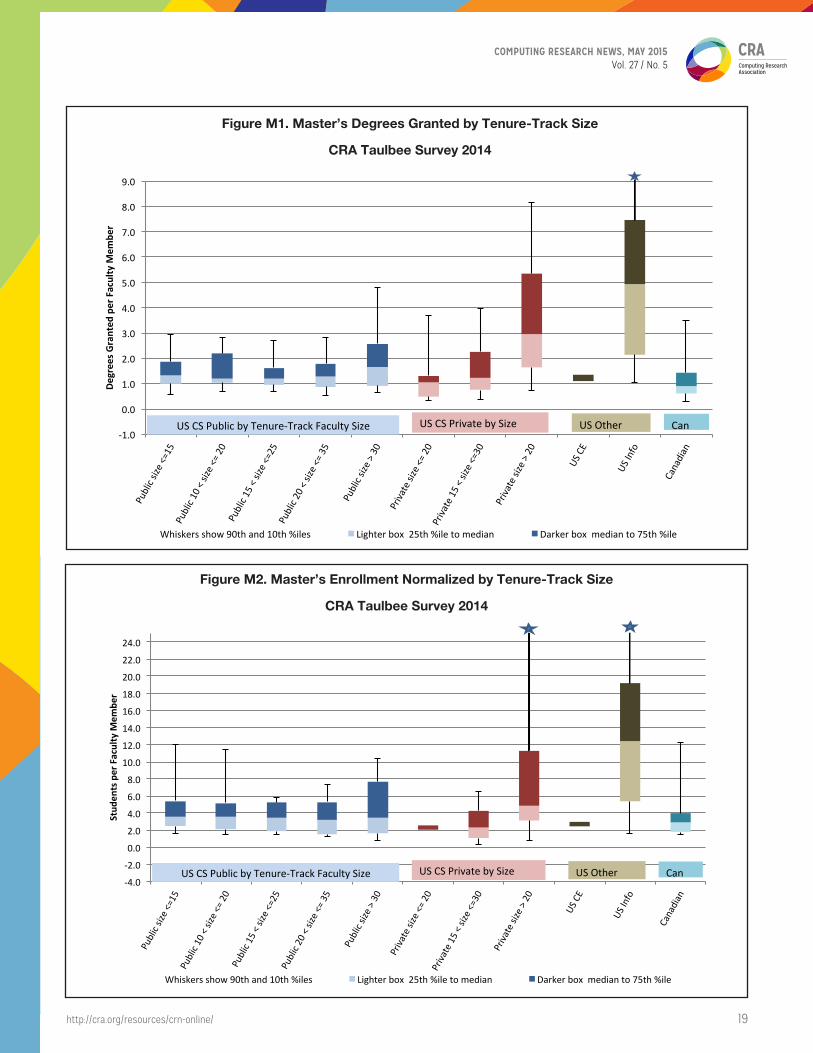
Figure M1. Master’s Degrees Granted by Tenure-Track Size
CRA Taulbee Survey 2014
-‐1.0
0.0
1.0
2.0
3.0
4.0
5.0
6.0
7.0
8.0
9.0
Public size <
=15
Public 10 < size <
= 20
Public 15 < size <
=25
Public 20 < size <
= 35
Public size >
30
Priva
te size <=
20
Priva
te 15 < s
ize <=
30
Priva
te size > 20
US CE
US Info
Canadian
Degr
ees G
rant
ed p
er F
acul
ty M
embe
r
Figure M1. Master's Degrees Granted by Tenure-‐Track Size CRA Taulbee Survey 2014
Whiskers show 90th and 10th %iles Lighter box 25th %ile to median Darker box median to 75th %ile
US CS Public by Tenure-‐Track Faculty Size US CS Private by Size US Other Can
Figure M2. Master’s Enrollment Normalized by Tenure-Track Size
CRA Taulbee Survey 2014
-‐4.0
-‐2.0
0.0
2.0
4.0
6.0
8.0
10.0
12.0
14.0
16.0
18.0
20.0
22.0
24.0
Public size <
=15
Public 10 < size <
= 20
Public 15 < size <
=25
Public 20 < size <
= 35
Public size >
30
Priva
te size <=
20
Priva
te 15 < s
ize <=
30
Priva
te size > 20
US CE
US Info
Canadian
Stud
ents
per
Fac
ulty
Mem
ber
Figure M2. Master's Enrollment Normalized by Tenure-‐Track Size CRA Taulbee Survey 2014
Whiskers show 90th and 10th %iles Lighter box 25th %ile to median Darker box median to 75th %ile
US CS Public by Tenure-‐Track Faculty Size US CS Private by Size US Other Can
COMPUTING RESEARCH NEWS, MAY 2015Vol. 27 / No. 5
http://cra.org/resources/crn-online/ 20
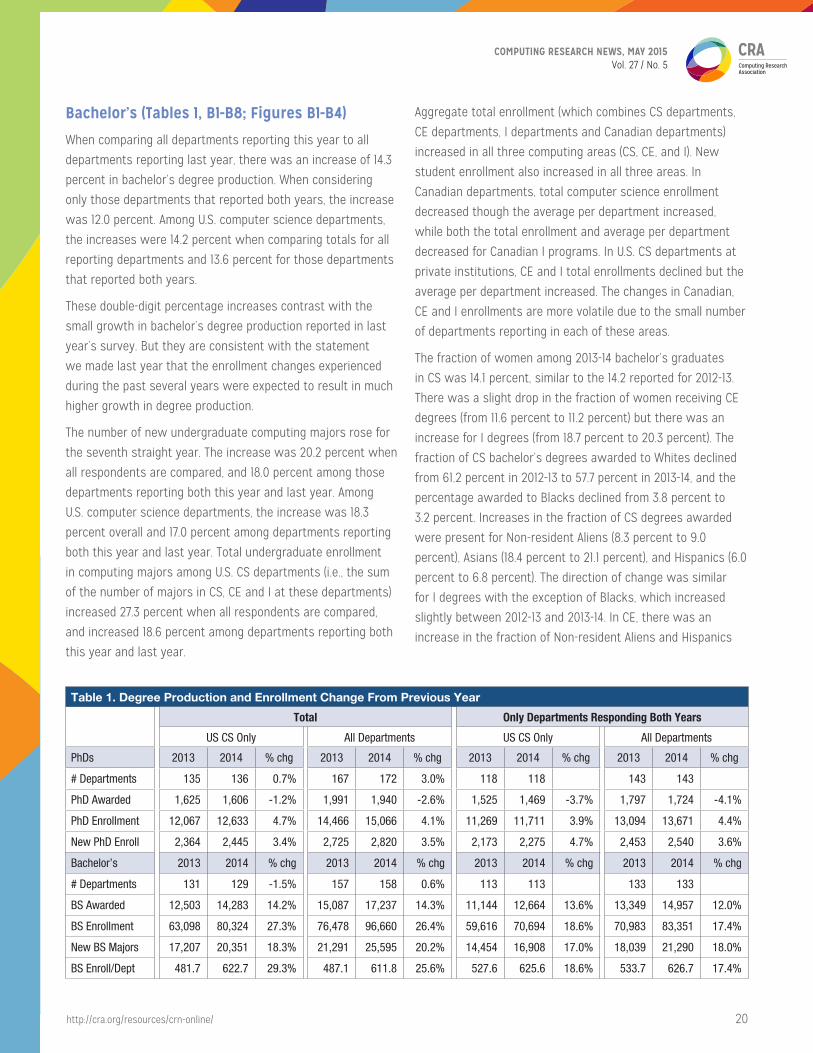
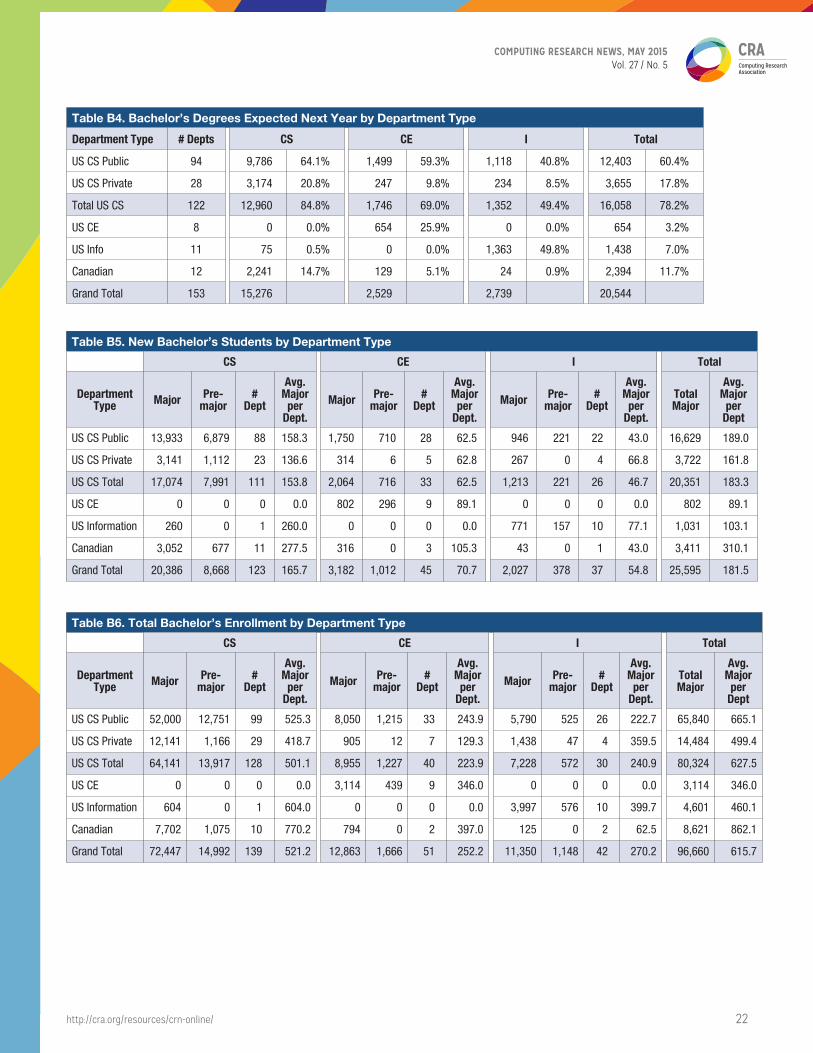
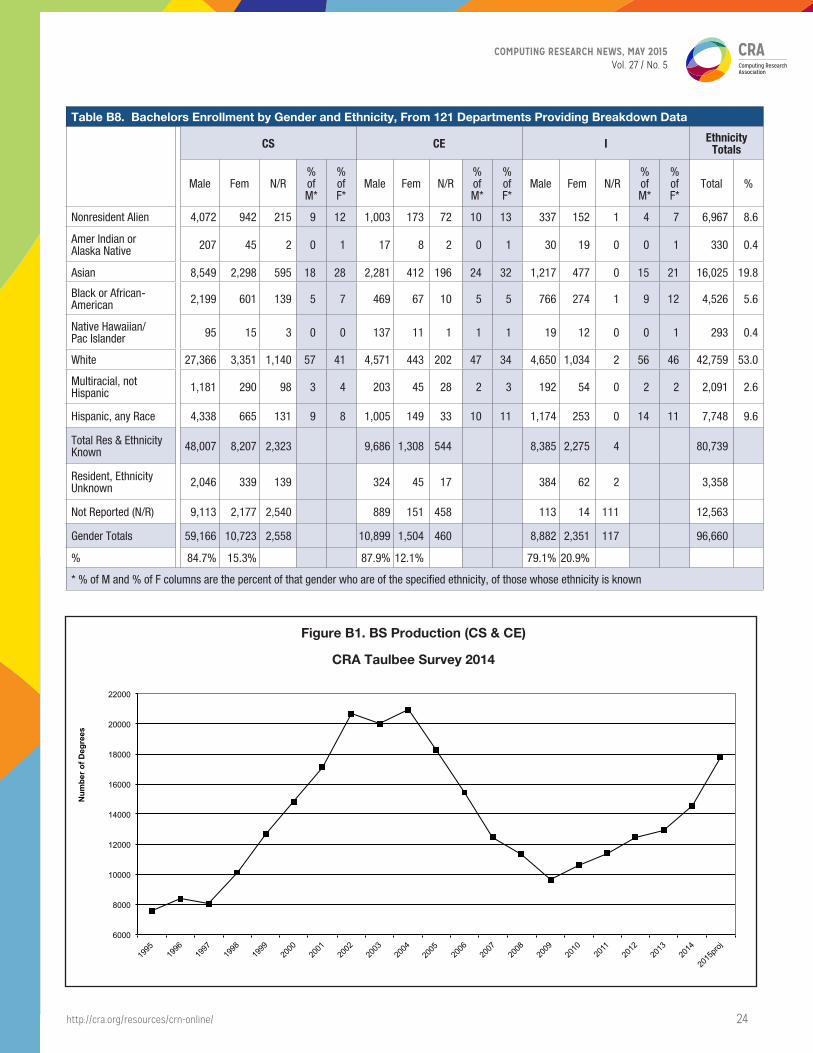
Bachelor’s (Tables 1, B1-B8; Figures B1-B4)
When comparing all departments reporting this year to all
departments reporting last year, there was an increase of 14.3
percent in bachelor’s degree production. When considering
only those departments that reported both years, the increase
was 12.0 percent. Among U.S. computer science departments,
the increases were 14.2 percent when comparing totals for all
reporting departments and 13.6 percent for those departments
that reported both years.
These double-digit percentage increases contrast with the
small growth in bachelor’s degree production reported in last
year’s survey. But they are consistent with the statement
we made last year that the enrollment changes experienced
during the past several years were expected to result in much
higher growth in degree production.
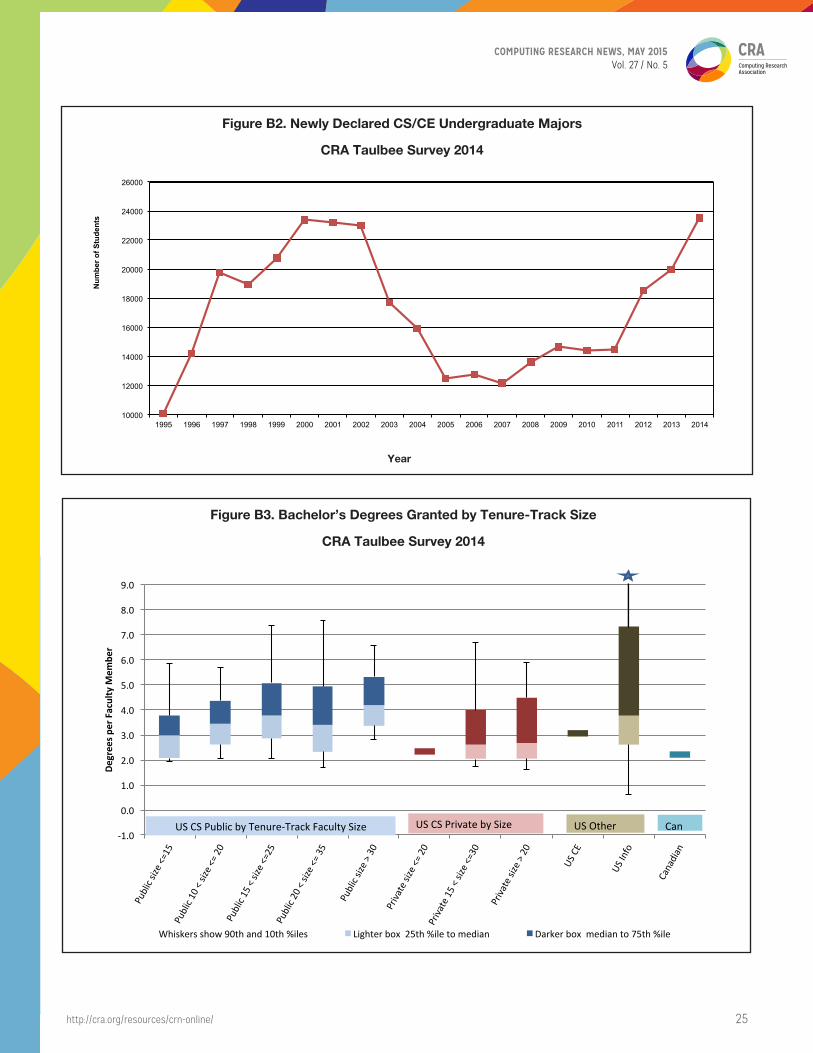
The number of new undergraduate computing majors rose for
the seventh straight year. The increase was 20.2 percent when
all respondents are compared, and 18.0 percent among those
departments reporting both this year and last year. Among
U.S. computer science departments, the increase was 18.3
percent overall and 17.0 percent among departments reporting
both this year and last year. Total undergraduate enrollment
in computing majors among U.S. CS departments (i.e., the sum
of the number of majors in CS, CE and I at these departments)
increased 27.3 percent when all respondents are compared,
and increased 18.6 percent among departments reporting both
this year and last year.
Aggregate total enrollment (which combines CS departments,
CE departments, I departments and Canadian departments)
increased in all three computing areas (CS, CE, and I). New
student enrollment also increased in all three areas. In
Canadian departments, total computer science enrollment
decreased though the average per department increased,
while both the total enrollment and average per department
decreased for Canadian I programs. In U.S. CS departments at
private institutions, CE and I total enrollments declined but the
average per department increased. The changes in Canadian,
CE and I enrollments are more volatile due to the small number
of departments reporting in each of these areas.
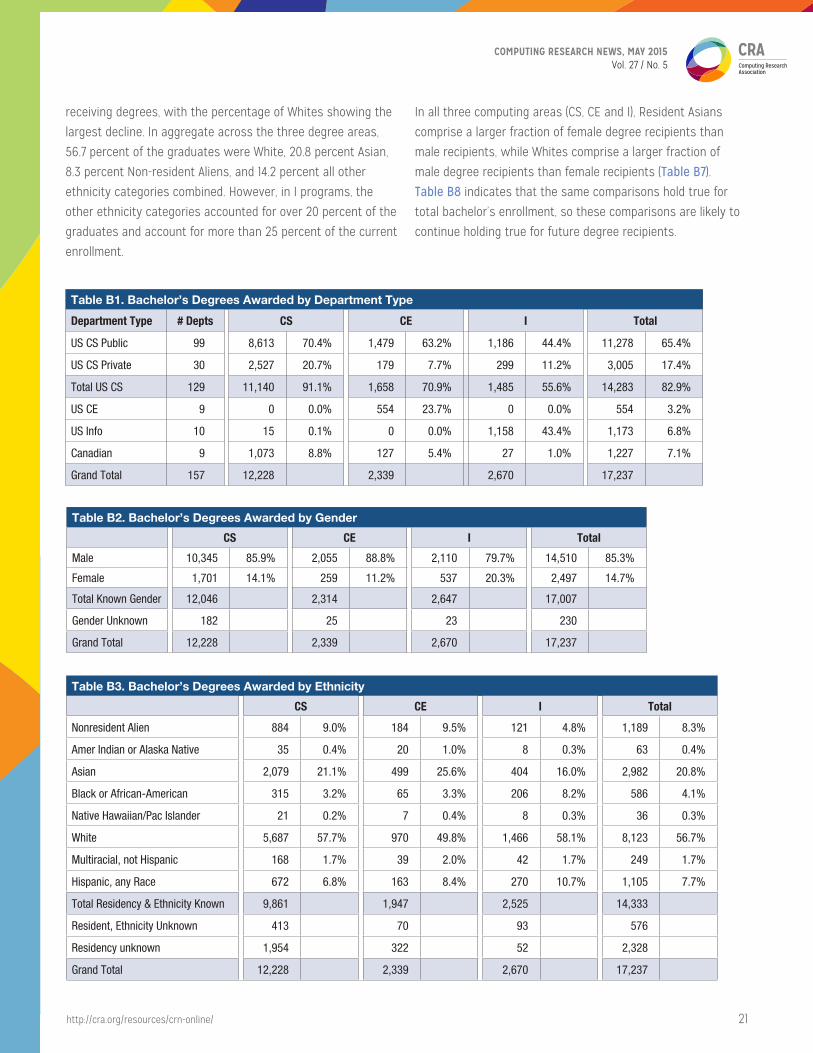
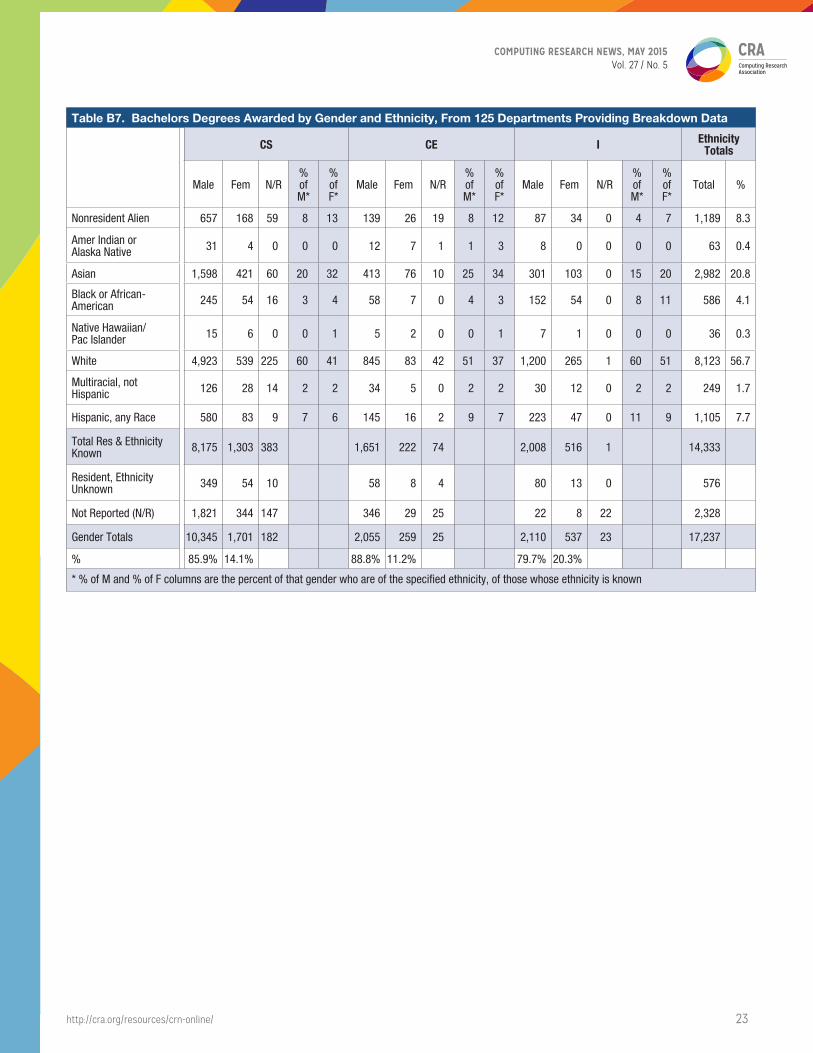
The fraction of women among 2013-14 bachelor’s graduates
in CS was 14.1 percent, similar to the 14.2 reported for 2012-13.
There was a slight drop in the fraction of women receiving CE
degrees (from 11.6 percent to 11.2 percent) but there was an
increase for I degrees (from 18.7 percent to 20.3 percent). The
fraction of CS bachelor’s degrees awarded to Whites declined
from 61.2 percent in 2012-13 to 57.7 percent in 2013-14, and the
percentage awarded to Blacks declined from 3.8 percent to
3.2 percent. Increases in the fraction of CS degrees awarded
were present for Non-resident Aliens (8.3 percent to 9.0
percent), Asians (18.4 percent to 21.1 percent), and Hispanics (6.0
percent to 6.8 percent). The direction of change was similar
for I degrees with the exception of Blacks, which increased
slightly between 2012-13 and 2013-14. In CE, there was an
increase in the fraction of Non-resident Aliens and Hispanics
Table 1. Degree Production and Enrollment Change From Previous Year
Total Only Departments Responding Both Years
US CS Only All Departments US CS Only All Departments
PhDs 2013 2014 % chg 2013 2014 % chg 2013 2014 % chg 2013 2014 % chg
# Departments 135 136 0.7% 167 172 3.0% 118 118 143 143
PhD Awarded 1,625 1,606 -1.2% 1,991 1,940 -2.6% 1,525 1,469 -3.7% 1,797 1,724 -4.1%
PhD Enrollment 12,067 12,633 4.7% 14,466 15,066 4.1% 11,269 11,711 3.9% 13,094 13,671 4.4%
New PhD Enroll 2,364 2,445 3.4% 2,725 2,820 3.5% 2,173 2,275 4.7% 2,453 2,540 3.6%
Bachelor’s 2013 2014 % chg 2013 2014 % chg 2013 2014 % chg 2013 2014 % chg
# Departments 131 129 -1.5% 157 158 0.6% 113 113 133 133
BS Awarded 12,503 14,283 14.2% 15,087 17,237 14.3% 11,144 12,664 13.6% 13,349 14,957 12.0%
BS Enrollment 63,098 80,324 27.3% 76,478 96,660 26.4% 59,616 70,694 18.6% 70,983 83,351 17.4%
New BS Majors 17,207 20,351 18.3% 21,291 25,595 20.2% 14,454 16,908 17.0% 18,039 21,290 18.0%
BS Enroll/Dept 481.7 622.7 29.3% 487.1 611.8 25.6% 527.6 625.6 18.6% 533.7 626.7 17.4%
COMPUTING RESEARCH NEWS, MAY 2015Vol. 27 / No. 5
http://cra.org/resources/crn-online/ 21
receiving degrees, with the percentage of Whites showing the
largest decline. In aggregate across the three degree areas,
56.7 percent of the graduates were White, 20.8 percent Asian,
8.3 percent Non-resident Aliens, and 14.2 percent all other
ethnicity categories combined. However, in I programs, the
other ethnicity categories accounted for over 20 percent of the
graduates and account for more than 25 percent of the current
enrollment.
In all three computing areas (CS, CE and I), Resident Asians
comprise a larger fraction of female degree recipients than
male recipients, while Whites comprise a larger fraction of
male degree recipients than female recipients (Table B7).
Table B8 indicates that the same comparisons hold true for
total bachelor’s enrollment, so these comparisons are likely to
continue holding true for future degree recipients.
Table B3. Bachelor’s Degrees Awarded by Ethnicity
CS CE I Total
Nonresident Alien 884 9.0% 184 9.5% 121 4.8% 1,189 8.3%
Amer Indian or Alaska Native 35 0.4% 20 1.0% 8 0.3% 63 0.4%
Asian 2,079 21.1% 499 25.6% 404 16.0% 2,982 20.8%
Black or African-American 315 3.2% 65 3.3% 206 8.2% 586 4.1%
Native Hawaiian/Pac Islander 21 0.2% 7 0.4% 8 0.3% 36 0.3%
White 5,687 57.7% 970 49.8% 1,466 58.1% 8,123 56.7%
Multiracial, not Hispanic 168 1.7% 39 2.0% 42 1.7% 249 1.7%
Hispanic, any Race 672 6.8% 163 8.4% 270 10.7% 1,105 7.7%
Total Residency & Ethnicity Known 9,861 1,947 2,525 14,333
Resident, Ethnicity Unknown 413 70 93 576
Residency unknown 1,954 322 52 2,328
Grand Total 12,228 2,339 2,670 17,237
Table B2. Bachelor’s Degrees Awarded by Gender
CS CE I Total
Male 10,345 85.9% 2,055 88.8% 2,110 79.7% 14,510 85.3%
Female 1,701 14.1% 259 11.2% 537 20.3% 2,497 14.7%
Total Known Gender 12,046 2,314 2,647 17,007
Gender Unknown 182 25 23 230
Grand Total 12,228 2,339 2,670 17,237
Table B1. Bachelor’s Degrees Awarded by Department Type
Department Type # Depts CS CE I Total
US CS Public 99 8,613 70.4% 1,479 63.2% 1,186 44.4% 11,278 65.4%
US CS Private 30 2,527 20.7% 179 7.7% 299 11.2% 3,005 17.4%
Total US CS 129 11,140 91.1% 1,658 70.9% 1,485 55.6% 14,283 82.9%
US CE 9 0 0.0% 554 23.7% 0 0.0% 554 3.2%
US Info 10 15 0.1% 0 0.0% 1,158 43.4% 1,173 6.8%
Canadian 9 1,073 8.8% 127 5.4% 27 1.0% 1,227 7.1%
Grand Total 157 12,228 2,339 2,670 17,237
COMPUTING RESEARCH NEWS, MAY 2015Vol. 27 / No. 5
http://cra.org/resources/crn-online/ 22
Table B6. Total Bachelor’s Enrollment by Department Type
CS CE I Total
Department Type Major Pre-
major#
Dept
Avg. Major
per Dept.
Major Pre-major
# Dept
Avg. Major
per Dept.
Major Pre-major
# Dept
Avg. Major
per Dept.
Total Major
Avg. Major
per Dept
US CS Public 52,000 12,751 99 525.3 8,050 1,215 33 243.9 5,790 525 26 222.7 65,840 665.1
US CS Private 12,141 1,166 29 418.7 905 12 7 129.3 1,438 47 4 359.5 14,484 499.4
US CS Total 64,141 13,917 128 501.1 8,955 1,227 40 223.9 7,228 572 30 240.9 80,324 627.5
US CE 0 0 0 0.0 3,114 439 9 346.0 0 0 0 0.0 3,114 346.0
US Information 604 0 1 604.0 0 0 0 0.0 3,997 576 10 399.7 4,601 460.1
Canadian 7,702 1,075 10 770.2 794 0 2 397.0 125 0 2 62.5 8,621 862.1
Grand Total 72,447 14,992 139 521.2 12,863 1,666 51 252.2 11,350 1,148 42 270.2 96,660 615.7
Table B5. New Bachelor’s Students by Department Type
CS CE I Total
Department Type Major Pre-
major#
Dept
Avg. Major
per Dept.
Major Pre-major
# Dept
Avg. Major
per Dept.
Major Pre-major
# Dept
Avg. Major
per Dept.
Total Major
Avg. Major
per Dept
US CS Public 13,933 6,879 88 158.3 1,750 710 28 62.5 946 221 22 43.0 16,629 189.0
US CS Private 3,141 1,112 23 136.6 314 6 5 62.8 267 0 4 66.8 3,722 161.8
US CS Total 17,074 7,991 111 153.8 2,064 716 33 62.5 1,213 221 26 46.7 20,351 183.3
US CE 0 0 0 0.0 802 296 9 89.1 0 0 0 0.0 802 89.1
US Information 260 0 1 260.0 0 0 0 0.0 771 157 10 77.1 1,031 103.1
Canadian 3,052 677 11 277.5 316 0 3 105.3 43 0 1 43.0 3,411 310.1
Grand Total 20,386 8,668 123 165.7 3,182 1,012 45 70.7 2,027 378 37 54.8 25,595 181.5
Table B4. Bachelor’s Degrees Expected Next Year by Department Type
Department Type # Depts CS CE I Total
US CS Public 94 9,786 64.1% 1,499 59.3% 1,118 40.8% 12,403 60.4%
US CS Private 28 3,174 20.8% 247 9.8% 234 8.5% 3,655 17.8%
Total US CS 122 12,960 84.8% 1,746 69.0% 1,352 49.4% 16,058 78.2%
US CE 8 0 0.0% 654 25.9% 0 0.0% 654 3.2%
US Info 11 75 0.5% 0 0.0% 1,363 49.8% 1,438 7.0%
Canadian 12 2,241 14.7% 129 5.1% 24 0.9% 2,394 11.7%
Grand Total 153 15,276 2,529 2,739 20,544
COMPUTING RESEARCH NEWS, MAY 2015Vol. 27 / No. 5
http://cra.org/resources/crn-online/ 23
Table B7. Bachelors Degrees Awarded by Gender and Ethnicity, From 125 Departments Providing Breakdown Data
CS CE I Ethnicity Totals
Male Fem N/R% of M*
% of F*
Male Fem N/R% of M*
% of F*
Male Fem N/R% of M*
% of F*
Total %
Nonresident Alien 657 168 59 8 13 139 26 19 8 12 87 34 0 4 7 1,189 8.3
Amer Indian or Alaska Native 31 4 0 0 0 12 7 1 1 3 8 0 0 0 0 63 0.4
Asian 1,598 421 60 20 32 413 76 10 25 34 301 103 0 15 20 2,982 20.8
Black or African-American 245 54 16 3 4 58 7 0 4 3 152 54 0 8 11 586 4.1
Native Hawaiian/ Pac Islander 15 6 0 0 1 5 2 0 0 1 7 1 0 0 0 36 0.3
White 4,923 539 225 60 41 845 83 42 51 37 1,200 265 1 60 51 8,123 56.7
Multiracial, not Hispanic 126 28 14 2 2 34 5 0 2 2 30 12 0 2 2 249 1.7
Hispanic, any Race 580 83 9 7 6 145 16 2 9 7 223 47 0 11 9 1,105 7.7
Total Res & Ethnicity Known 8,175 1,303 383 1,651 222 74 2,008 516 1 14,333
Resident, Ethnicity Unknown 349 54 10 58 8 4 80 13 0 576
Not Reported (N/R) 1,821 344 147 346 29 25 22 8 22 2,328
Gender Totals 10,345 1,701 182 2,055 259 25 2,110 537 23 17,237
% 85.9% 14.1% 88.8% 11.2% 79.7% 20.3%
* % of M and % of F columns are the percent of that gender who are of the specified ethnicity, of those whose ethnicity is known
COMPUTING RESEARCH NEWS, MAY 2015Vol. 27 / No. 5
http://cra.org/resources/crn-online/ 24
Table B8. Bachelors Enrollment by Gender and Ethnicity, From 121 Departments Providing Breakdown Data
CS CE I Ethnicity Totals
Male Fem N/R% of M*
% of F*
Male Fem N/R% of M*
% of F*
Male Fem N/R% of M*
% of F*
Total %
Nonresident Alien 4,072 942 215 9 12 1,003 173 72 10 13 337 152 1 4 7 6,967 8.6
Amer Indian or Alaska Native 207 45 2 0 1 17 8 2 0 1 30 19 0 0 1 330 0.4
Asian 8,549 2,298 595 18 28 2,281 412 196 24 32 1,217 477 0 15 21 16,025 19.8
Black or African-American 2,199 601 139 5 7 469 67 10 5 5 766 274 1 9 12 4,526 5.6
Native Hawaiian/ Pac Islander 95 15 3 0 0 137 11 1 1 1 19 12 0 0 1 293 0.4
White 27,366 3,351 1,140 57 41 4,571 443 202 47 34 4,650 1,034 2 56 46 42,759 53.0
Multiracial, not Hispanic 1,181 290 98 3 4 203 45 28 2 3 192 54 0 2 2 2,091 2.6
Hispanic, any Race 4,338 665 131 9 8 1,005 149 33 10 11 1,174 253 0 14 11 7,748 9.6
Total Res & Ethnicity Known 48,007 8,207 2,323 9,686 1,308 544 8,385 2,275 4 80,739
Resident, Ethnicity Unknown 2,046 339 139 324 45 17 384 62 2 3,358
Not Reported (N/R) 9,113 2,177 2,540 889 151 458 113 14 111 12,563
Gender Totals 59,166 10,723 2,558 10,899 1,504 460 8,882 2,351 117 96,660
% 84.7% 15.3% 87.9% 12.1% 79.1% 20.9%
* % of M and % of F columns are the percent of that gender who are of the specified ethnicity, of those whose ethnicity is known
Figure B1. BS Production (CS & CE)
CRA Taulbee Survey 2014
6000
8000
10000
12000
14000
16000
18000
20000
22000
1995
19
96
1997
19
98
1999
20
00
2001
20
02
2003
20
04
2005
20
06
2007
20
08
2009
20
10
2011
20
12
2013
20
14
2015
proj
Num
ber o
f Deg
rees
Year
Figure B1. BS Produc0on (CS & CE) CRA Taulbee Survey 2014
COMPUTING RESEARCH NEWS, MAY 2015Vol. 27 / No. 5
http://cra.org/resources/crn-online/ 25
Figure B2. Newly Declared CS/CE Undergraduate Majors
CRA Taulbee Survey 2014
Year
10000
12000
14000
16000
18000
20000
22000
24000
26000
1995 1996 1997 1998 1999 2000 2001 2002 2003 2004 2005 2006 2007 2008 2009 2010 2011 2012 2013 2014
Num
ber o
f Stu
dent
s
Year
Figure B2. Newly Declared CS/CE Undergraduate Majors CRA Taulbee Survey 2014
Figure B3. Bachelor’s Degrees Granted by Tenure-Track Size
CRA Taulbee Survey 2014
-‐1.0
0.0
1.0
2.0
3.0
4.0
5.0
6.0
7.0
8.0
9.0
Public size <
=15
Public 10 < size <
= 20
Public 15 < size <
=25
Public 20 < size <
= 35
Public size >
30
Priva
te size <=
20
Priva
te 15 < s
ize <=
30
Priva
te size > 20
US CE
US Info
Canadian
Degr
ees p
er Fac
ulty
Mem
ber
Figure B3. Bachelor's Degrees Granted by Tenure-‐Track Size CRA Taulbee Survey 2014
Whiskers show 90th and 10th %iles Lighter box 25th %ile to median Darker box median to 75th %ile
US CS Public by Tenure-‐Track Faculty Size US CS Private by Size US Other Can
COMPUTING RESEARCH NEWS, MAY 2015Vol. 27 / No. 5
http://cra.org/resources/crn-online/ 26
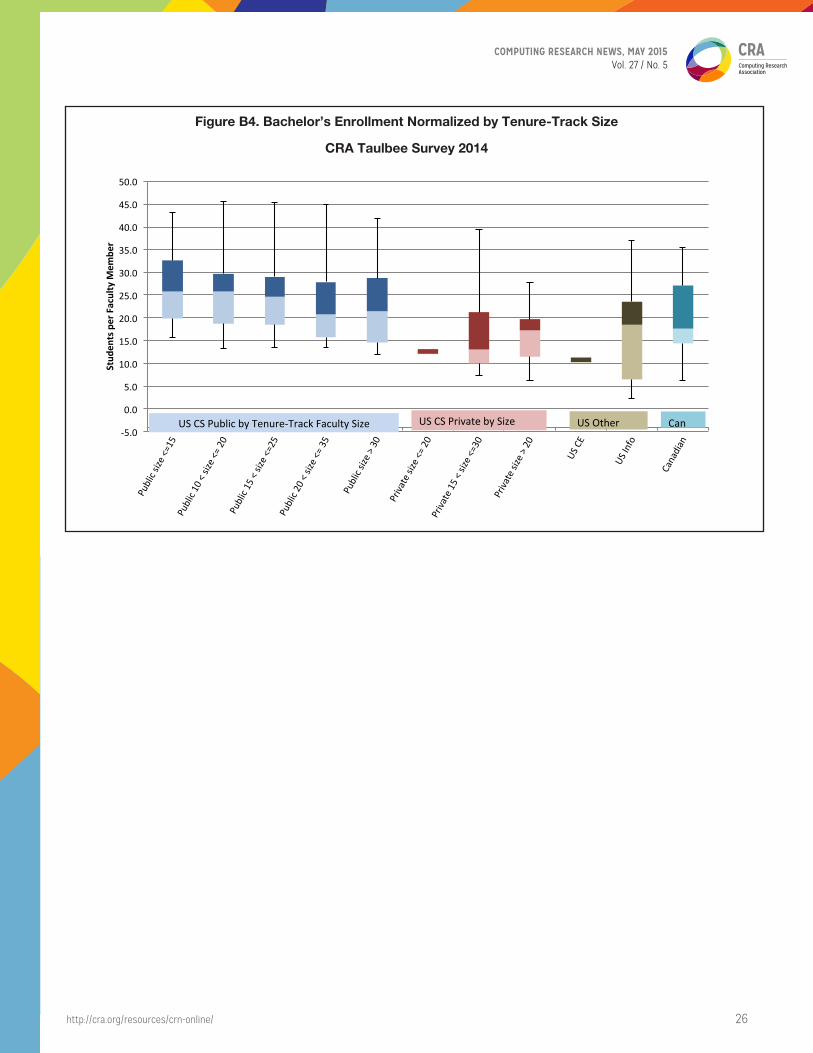
Figure B4. Bachelor’s Enrollment Normalized by Tenure-Track Size
CRA Taulbee Survey 2014
-‐5.0
0.0
5.0
10.0
15.0
20.0
25.0
30.0
35.0
40.0
45.0
50.0
Public size <
=15
Public 10 < size <
= 20
Public 15 < size <
=25
Public 20 < size <
= 35
Public size >
30
Priva
te size <=
20
Priva
te 15 < s
ize <=
30
Priva
te size > 20
US CE
US Info
Canadian
Stud
ents per
Fac
ulty
Mem
ber
Figure B4. Bachelor's Enrollment Normalized by Tenure-‐Track Size CRA Taulbee Survey 2014
Whiskers show 90th and 10th %iles Lighter box 25th %ile to median Darker box median to 75th %ile
US CS Public by Tenure-‐Track Faculty Size US CS Private by Size US Other Can
COMPUTING RESEARCH NEWS, MAY 2015Vol. 27 / No. 5
http://cra.org/resources/crn-online/ 27
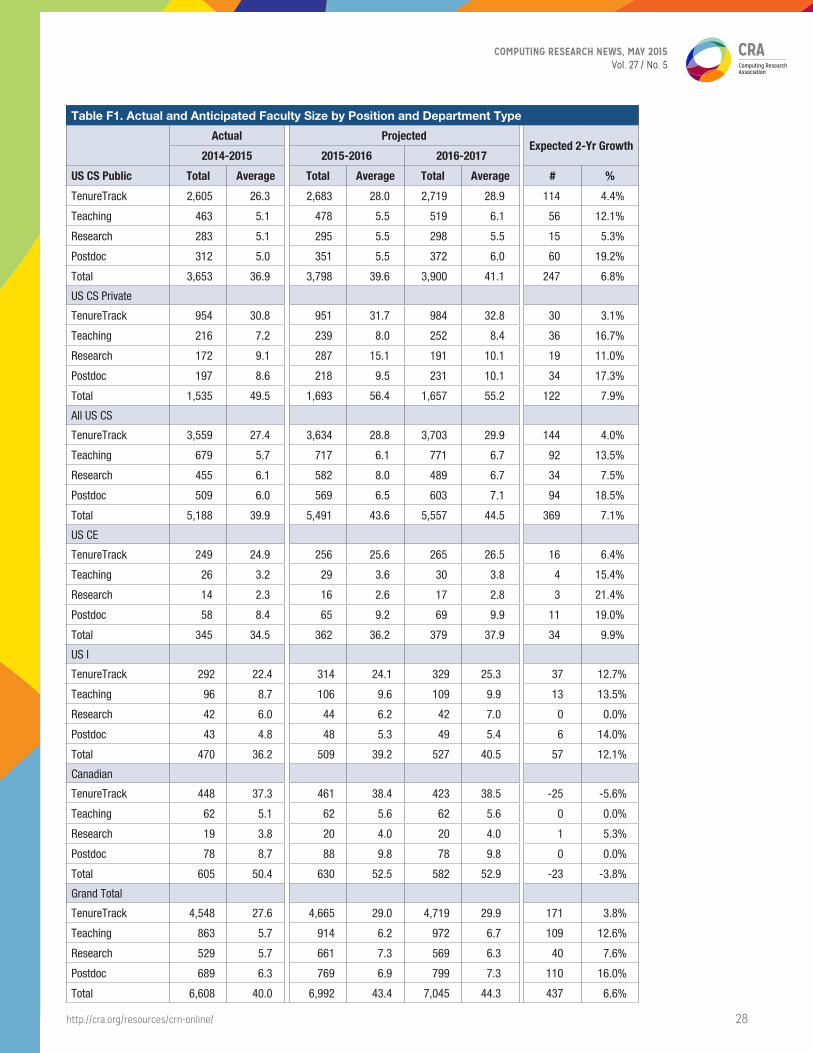
Faculty Demographics (Tables F1-F9)4
Table F1 shows the current and anticipated sizes, in FTE, for
tenure-track, teaching and research faculty, and postdocs.
The total tenure-track faculty count in U.S. CS departments
(3,559) is about the same as last year. However, there was an
increase from last year to this year, from 26.2 to 27.4, in the
average tenure-track faculty size per U.S. CS department. In
these departments, there also were increases in the number of
teaching and research faculty per department and the number of
postdocs per department. Canadian, CE and I departments have
much more volatile data due to the small number of departments
reporting in each of those categories.
As we have mentioned in previous Taulbee reports, Canadian
universities, on average, have several more tenure-track faculty
members per department than do U.S. universities, while
on average U.S. I departments and U.S. CE departments are
slightly smaller than U.S. CS departments. The observations
about U.S. CE and I departments may reflect the fact that we
ask departments to report only computing-related faculty, so
departments with Library Science or EE programs may report
only part of their faculty.
Among U.S. CS departments, those at private universities tend to
have more tenure-track, teaching faculty, research faculty and
postdocs than do those at public universities on average. This
observation also was made last year.
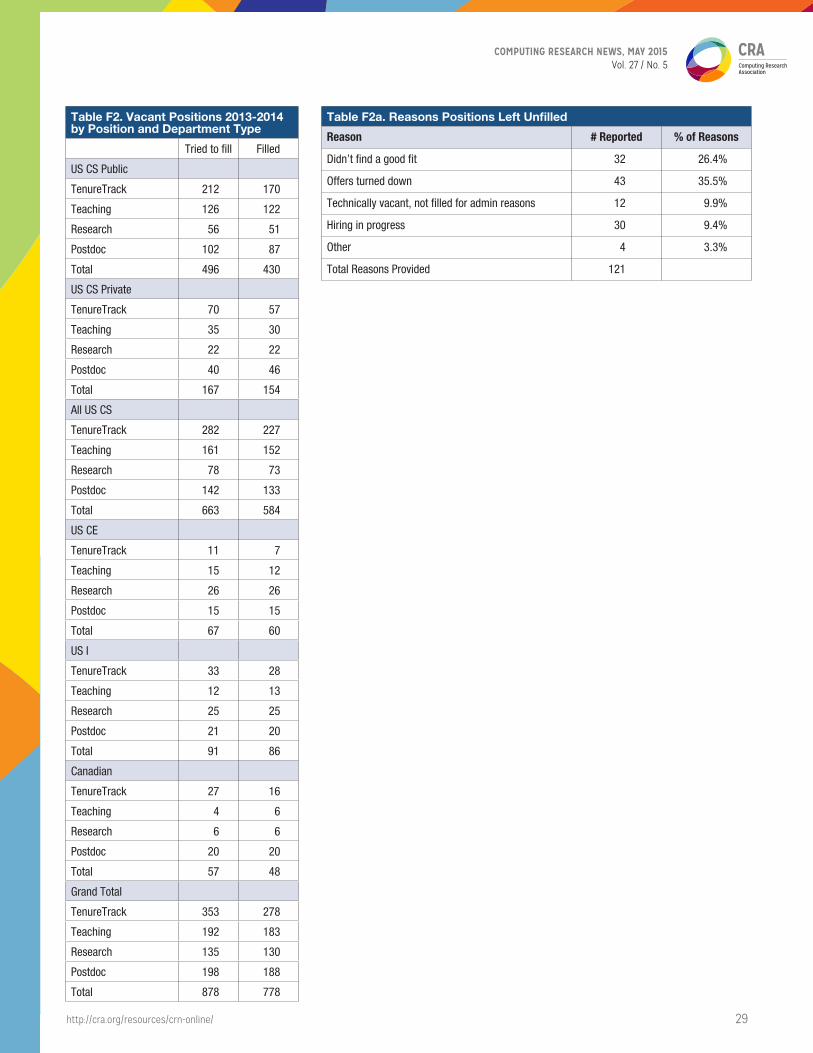
Table F2 summarizes faculty hiring this past year. There were
more tenure-track vacancies per reporting department (2.09) in
2013-14 than in2012-13 (1.98). U.S. CS departments had a slightly
greater average in 2013-14 than in 2012-13, due to increases per
public department. In aggregate, only 21.2 percent of the total
number of vacant tenure-track positions went unfilled; in 2012-13
there were 33.0 percent unfilled. The success rate at U.S. CS
departments jumped from 64.0 percent in 2012-13 to 80.2 percent
in 2013-14; increased success was enjoyed at both public and
private departments. Canadian departments had lower success
rates on average than did U.S. CS, U.S. CE and U.S. I departments.
In aggregate, there was more hiring in 2013-14 than in 2012-13 in
all categories of faculty.
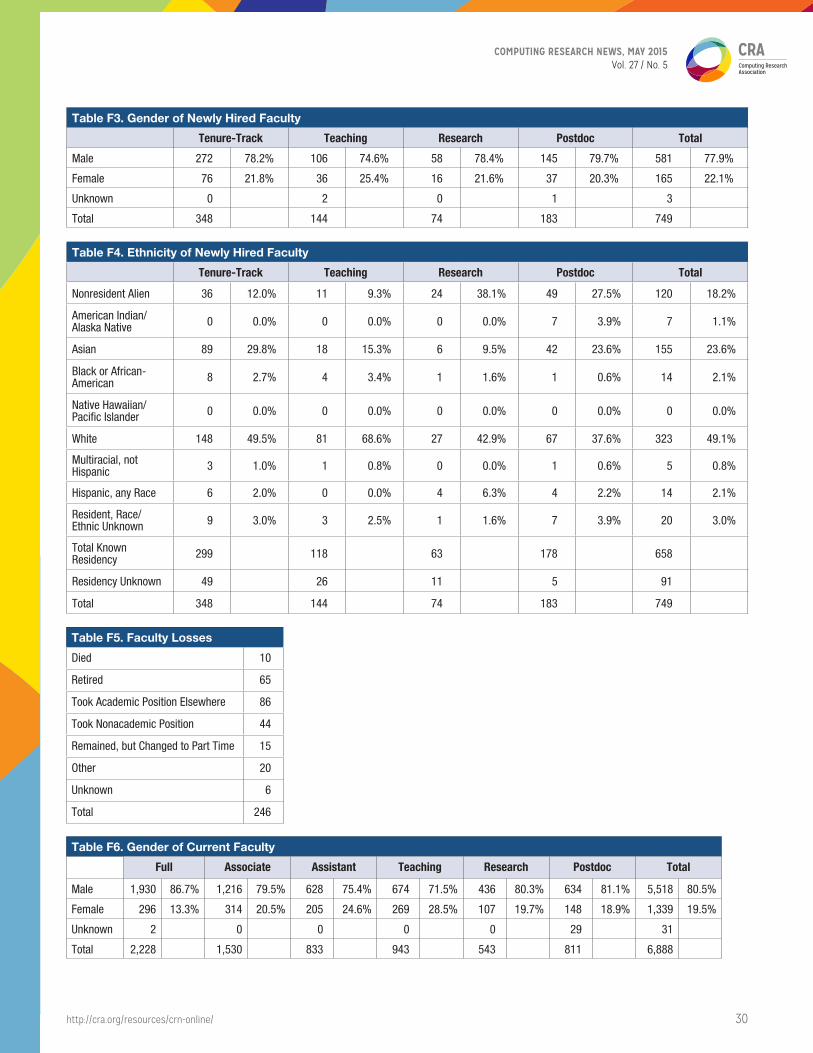
The fraction of women among those hired into all categories
of academic positions (tenure-track, teaching faculty, research
faculty and postdoc) was 22.1 percent in 2012-13, an increase
from 21.0 percent in 2012-13 (Table F3). However, in tenure-track
positions, the fraction was similar to the previous year (21.8
percent vs. 22.5 percent in 2012-13). There were increases in
the fraction of research faculty positions and postdoc positions
going to women as compared with those reported last year,
while the fraction of teaching positions going to women
decreased. The fraction of new female tenure-track and overall
faculty hires continues to exceed the fraction of new female
Ph.D.s produced this past year (18.9 percent).
Among new tenure-track faculty, the fraction who are white
rose from 47.4 percent to 49.5 percent, while the fraction who
are Non-resident Alien or Asian new hires dropped from 44.0
percent to 41.8 percent. Once again, whites dominated the newly
hired teaching faculty, with Asians and Non-resident Aliens
accounting for most of the remainder. Among research faculty,
whites comprised 42.9 percent of new hires, while Non-resident
Aliens or resident Asians in aggregate comprised 47.6 percent
of new hires. Among postdoc new hires, whites comprised 37.6
percent, with Non-resident Aliens and resident Asians collectively
comprising 51.1 percent (Table F4).
There were more faculty losses reported this year as compared
with last year (Table F5); this is the second consecutive year we
observed this. Once again, the larger fraction of losses is due to
movement to another (academic or non-academic) position.
This year, the fraction of women at the full professor rank was
about the same as last year, while the fraction at the associate
professor level rose (from 19.6 percent last year to 20.5 percent
this year) and the fraction at the assistant professor level fell
(from 26.2 percent to 24.6 percent) (Table F6). There also were
increases in the fraction of women among research faculty and
postdocs, while there was a decrease in the fraction of women
among teaching faculty. Whites, Asians and Non-resident Aliens
again account for about 90 percent of each category of faculty
members (Table F7).
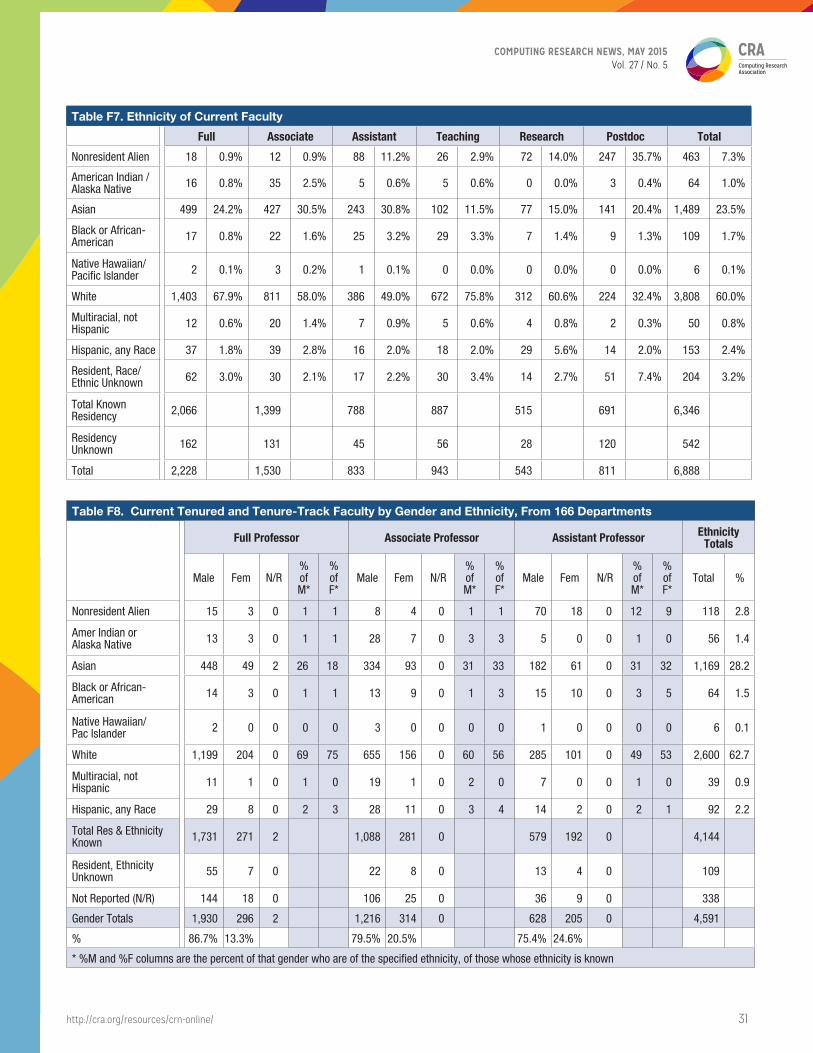
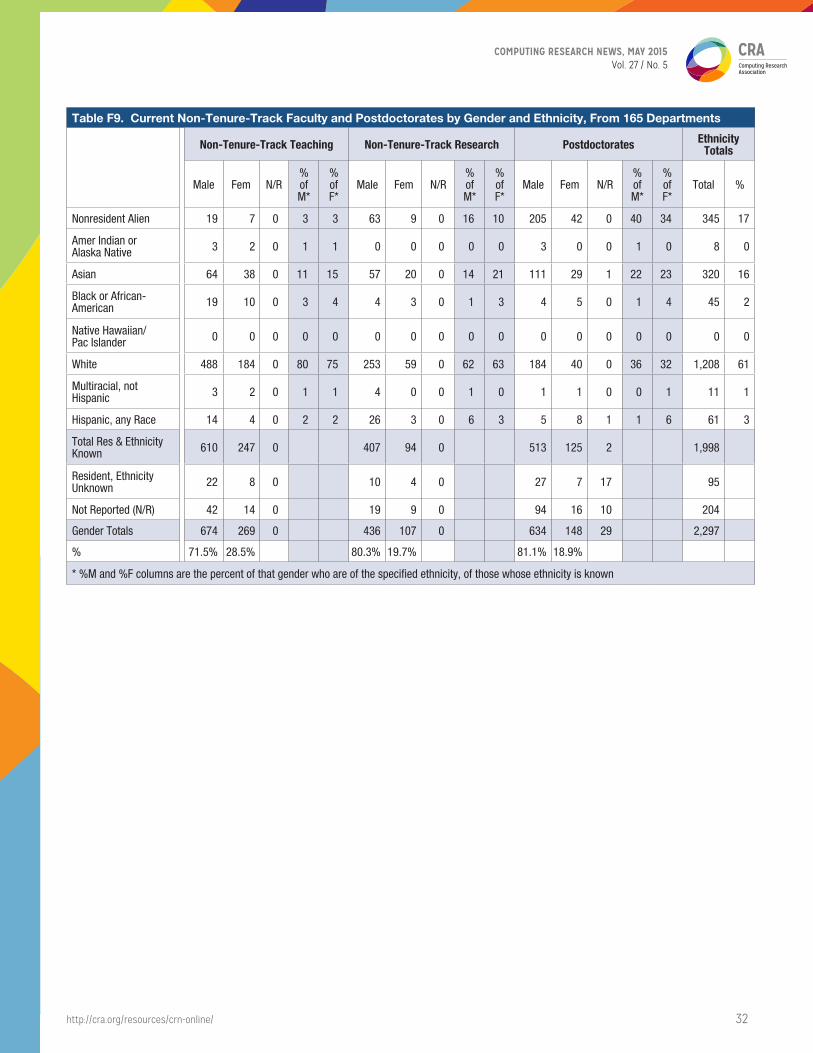
Ninety-five percent of departments provided gender by ethnicity
breakdowns for their current faculty members. (Table F8 And F9).
Whites comprised a greater percentage of female full professors
than they do male full professors, while the reverse is true at the
associate professor level. Asians comprise a greater percentage
of male full professors than they do female full professors, while
the reverse is true at the associate professor level.
For next year, U.S. CS departments forecast a modest 2.1 percent
growth in tenure-track faculty, and a 5.6 percent growth in
teaching faculty. However, they forecast an 11.8 percent growth
in postdocs.
COMPUTING RESEARCH NEWS, MAY 2015Vol. 27 / No. 5
http://cra.org/resources/crn-online/ 28
Table F1. Actual and Anticipated Faculty Size by Position and Department Type
Actual ProjectedExpected 2-Yr Growth
2014-2015 2015-2016 2016-2017
US CS Public Total Average Total Average Total Average # %
TenureTrack 2,605 26.3 2,683 28.0 2,719 28.9 114 4.4%
Teaching 463 5.1 478 5.5 519 6.1 56 12.1%
Research 283 5.1 295 5.5 298 5.5 15 5.3%
Postdoc 312 5.0 351 5.5 372 6.0 60 19.2%
Total 3,653 36.9 3,798 39.6 3,900 41.1 247 6.8%
US CS Private
TenureTrack 954 30.8 951 31.7 984 32.8 30 3.1%
Teaching 216 7.2 239 8.0 252 8.4 36 16.7%
Research 172 9.1 287 15.1 191 10.1 19 11.0%
Postdoc 197 8.6 218 9.5 231 10.1 34 17.3%
Total 1,535 49.5 1,693 56.4 1,657 55.2 122 7.9%
All US CS
TenureTrack 3,559 27.4 3,634 28.8 3,703 29.9 144 4.0%
Teaching 679 5.7 717 6.1 771 6.7 92 13.5%
Research 455 6.1 582 8.0 489 6.7 34 7.5%
Postdoc 509 6.0 569 6.5 603 7.1 94 18.5%
Total 5,188 39.9 5,491 43.6 5,557 44.5 369 7.1%
US CE
TenureTrack 249 24.9 256 25.6 265 26.5 16 6.4%
Teaching 26 3.2 29 3.6 30 3.8 4 15.4%
Research 14 2.3 16 2.6 17 2.8 3 21.4%
Postdoc 58 8.4 65 9.2 69 9.9 11 19.0%
Total 345 34.5 362 36.2 379 37.9 34 9.9%
US I
TenureTrack 292 22.4 314 24.1 329 25.3 37 12.7%
Teaching 96 8.7 106 9.6 109 9.9 13 13.5%
Research 42 6.0 44 6.2 42 7.0 0 0.0%
Postdoc 43 4.8 48 5.3 49 5.4 6 14.0%
Total 470 36.2 509 39.2 527 40.5 57 12.1%
Canadian
TenureTrack 448 37.3 461 38.4 423 38.5 -25 -5.6%
Teaching 62 5.1 62 5.6 62 5.6 0 0.0%
Research 19 3.8 20 4.0 20 4.0 1 5.3%
Postdoc 78 8.7 88 9.8 78 9.8 0 0.0%
Total 605 50.4 630 52.5 582 52.9 -23 -3.8%
Grand Total
TenureTrack 4,548 27.6 4,665 29.0 4,719 29.9 171 3.8%
Teaching 863 5.7 914 6.2 972 6.7 109 12.6%
Research 529 5.7 661 7.3 569 6.3 40 7.6%
Postdoc 689 6.3 769 6.9 799 7.3 110 16.0%
Total 6,608 40.0 6,992 43.4 7,045 44.3 437 6.6%
COMPUTING RESEARCH NEWS, MAY 2015Vol. 27 / No. 5
http://cra.org/resources/crn-online/ 29
Table F2. Vacant Positions 2013-2014 by Position and Department Type
Tried to fill Filled
US CS Public
TenureTrack 212 170
Teaching 126 122
Research 56 51
Postdoc 102 87
Total 496 430
US CS Private
TenureTrack 70 57
Teaching 35 30
Research 22 22
Postdoc 40 46
Total 167 154
All US CS
TenureTrack 282 227
Teaching 161 152
Research 78 73
Postdoc 142 133
Total 663 584
US CE
TenureTrack 11 7
Teaching 15 12
Research 26 26
Postdoc 15 15
Total 67 60
US I
TenureTrack 33 28
Teaching 12 13
Research 25 25
Postdoc 21 20
Total 91 86
Canadian
TenureTrack 27 16
Teaching 4 6
Research 6 6
Postdoc 20 20
Total 57 48
Grand Total
TenureTrack 353 278
Teaching 192 183
Research 135 130
Postdoc 198 188
Total 878 778
Table F2a. Reasons Positions Left Unfilled
Reason # Reported % of Reasons
Didn’t find a good fit 32 26.4%
Offers turned down 43 35.5%
Technically vacant, not filled for admin reasons 12 9.9%
Hiring in progress 30 9.4%
Other 4 3.3%
Total Reasons Provided 121
COMPUTING RESEARCH NEWS, MAY 2015Vol. 27 / No. 5
http://cra.org/resources/crn-online/ 30
Table F3. Gender of Newly Hired Faculty
Tenure-Track Teaching Research Postdoc Total
Male 272 78.2% 106 74.6% 58 78.4% 145 79.7% 581 77.9%
Female 76 21.8% 36 25.4% 16 21.6% 37 20.3% 165 22.1%
Unknown 0 2 0 1 3
Total 348 144 74 183 749
Table F4. Ethnicity of Newly Hired Faculty
Tenure-Track Teaching Research Postdoc Total
Nonresident Alien 36 12.0% 11 9.3% 24 38.1% 49 27.5% 120 18.2%
American Indian/ Alaska Native 0 0.0% 0 0.0% 0 0.0% 7 3.9% 7 1.1%
Asian 89 29.8% 18 15.3% 6 9.5% 42 23.6% 155 23.6%
Black or African-American 8 2.7% 4 3.4% 1 1.6% 1 0.6% 14 2.1%
Native Hawaiian/ Pacific Islander 0 0.0% 0 0.0% 0 0.0% 0 0.0% 0 0.0%
White 148 49.5% 81 68.6% 27 42.9% 67 37.6% 323 49.1%
Multiracial, not Hispanic 3 1.0% 1 0.8% 0 0.0% 1 0.6% 5 0.8%
Hispanic, any Race 6 2.0% 0 0.0% 4 6.3% 4 2.2% 14 2.1%
Resident, Race/ Ethnic Unknown 9 3.0% 3 2.5% 1 1.6% 7 3.9% 20 3.0%
Total Known Residency 299 118 63 178 658
Residency Unknown 49 26 11 5 91
Total 348 144 74 183 749
Table F5. Faculty Losses
Died 10
Retired 65
Took Academic Position Elsewhere 86
Took Nonacademic Position 44
Remained, but Changed to Part Time 15
Other 20
Unknown 6
Total 246
Table F6. Gender of Current Faculty
Full Associate Assistant Teaching Research Postdoc Total
Male 1,930 86.7% 1,216 79.5% 628 75.4% 674 71.5% 436 80.3% 634 81.1% 5,518 80.5%
Female 296 13.3% 314 20.5% 205 24.6% 269 28.5% 107 19.7% 148 18.9% 1,339 19.5%
Unknown 2 0 0 0 0 29 31
Total 2,228 1,530 833 943 543 811 6,888
COMPUTING RESEARCH NEWS, MAY 2015Vol. 27 / No. 5
http://cra.org/resources/crn-online/ 31
Table F7. Ethnicity of Current Faculty
Full Associate Assistant Teaching Research Postdoc Total
Nonresident Alien 18 0.9% 12 0.9% 88 11.2% 26 2.9% 72 14.0% 247 35.7% 463 7.3%
American Indian / Alaska Native 16 0.8% 35 2.5% 5 0.6% 5 0.6% 0 0.0% 3 0.4% 64 1.0%
Asian 499 24.2% 427 30.5% 243 30.8% 102 11.5% 77 15.0% 141 20.4% 1,489 23.5%
Black or African-American 17 0.8% 22 1.6% 25 3.2% 29 3.3% 7 1.4% 9 1.3% 109 1.7%
Native Hawaiian/ Pacific Islander 2 0.1% 3 0.2% 1 0.1% 0 0.0% 0 0.0% 0 0.0% 6 0.1%
White 1,403 67.9% 811 58.0% 386 49.0% 672 75.8% 312 60.6% 224 32.4% 3,808 60.0%
Multiracial, not Hispanic 12 0.6% 20 1.4% 7 0.9% 5 0.6% 4 0.8% 2 0.3% 50 0.8%
Hispanic, any Race 37 1.8% 39 2.8% 16 2.0% 18 2.0% 29 5.6% 14 2.0% 153 2.4%
Resident, Race/Ethnic Unknown 62 3.0% 30 2.1% 17 2.2% 30 3.4% 14 2.7% 51 7.4% 204 3.2%
Total Known Residency 2,066 1,399 788 887 515 691 6,346
Residency Unknown 162 131 45 56 28 120 542
Total 2,228 1,530 833 943 543 811 6,888
Table F8. Current Tenured and Tenure-Track Faculty by Gender and Ethnicity, From 166 Departments
Full Professor Associate Professor Assistant Professor Ethnicity Totals
Male Fem N/R% of M*
% of F*
Male Fem N/R% of M*
% of F*
Male Fem N/R% of M*
% of F*
Total %
Nonresident Alien 15 3 0 1 1 8 4 0 1 1 70 18 0 12 9 118 2.8
Amer Indian or Alaska Native 13 3 0 1 1 28 7 0 3 3 5 0 0 1 0 56 1.4
Asian 448 49 2 26 18 334 93 0 31 33 182 61 0 31 32 1,169 28.2
Black or African-American 14 3 0 1 1 13 9 0 1 3 15 10 0 3 5 64 1.5
Native Hawaiian/ Pac Islander 2 0 0 0 0 3 0 0 0 0 1 0 0 0 0 6 0.1
White 1,199 204 0 69 75 655 156 0 60 56 285 101 0 49 53 2,600 62.7
Multiracial, not Hispanic 11 1 0 1 0 19 1 0 2 0 7 0 0 1 0 39 0.9
Hispanic, any Race 29 8 0 2 3 28 11 0 3 4 14 2 0 2 1 92 2.2
Total Res & Ethnicity Known 1,731 271 2 1,088 281 0 579 192 0 4,144
Resident, Ethnicity Unknown 55 7 0 22 8 0 13 4 0 109
Not Reported (N/R) 144 18 0 106 25 0 36 9 0 338
Gender Totals 1,930 296 2 1,216 314 0 628 205 0 4,591
% 86.7% 13.3% 79.5% 20.5% 75.4% 24.6%
* %M and %F columns are the percent of that gender who are of the specified ethnicity, of those whose ethnicity is known
COMPUTING RESEARCH NEWS, MAY 2015Vol. 27 / No. 5
http://cra.org/resources/crn-online/ 32
Table F9. Current Non-Tenure-Track Faculty and Postdoctorates by Gender and Ethnicity, From 165 Departments
Non-Tenure-Track Teaching Non-Tenure-Track Research Postdoctorates Ethnicity Totals
Male Fem N/R% of M*
% of F*
Male Fem N/R% of M*
% of F*
Male Fem N/R% of M*
% of F*
Total %
Nonresident Alien 19 7 0 3 3 63 9 0 16 10 205 42 0 40 34 345 17
Amer Indian or Alaska Native 3 2 0 1 1 0 0 0 0 0 3 0 0 1 0 8 0
Asian 64 38 0 11 15 57 20 0 14 21 111 29 1 22 23 320 16
Black or African-American 19 10 0 3 4 4 3 0 1 3 4 5 0 1 4 45 2
Native Hawaiian/ Pac Islander 0 0 0 0 0 0 0 0 0 0 0 0 0 0 0 0 0
White 488 184 0 80 75 253 59 0 62 63 184 40 0 36 32 1,208 61
Multiracial, not Hispanic 3 2 0 1 1 4 0 0 1 0 1 1 0 0 1 11 1
Hispanic, any Race 14 4 0 2 2 26 3 0 6 3 5 8 1 1 6 61 3
Total Res & Ethnicity Known 610 247 0 407 94 0 513 125 2 1,998
Resident, Ethnicity Unknown 22 8 0 10 4 0 27 7 17 95
Not Reported (N/R) 42 14 0 19 9 0 94 16 10 204
Gender Totals 674 269 0 436 107 0 634 148 29 2,297
% 71.5% 28.5% 80.3% 19.7% 81.1% 18.9%
* %M and %F columns are the percent of that gender who are of the specified ethnicity, of those whose ethnicity is known
COMPUTING RESEARCH NEWS, MAY 2015Vol. 27 / No. 5
http://cra.org/resources/crn-online/ 33
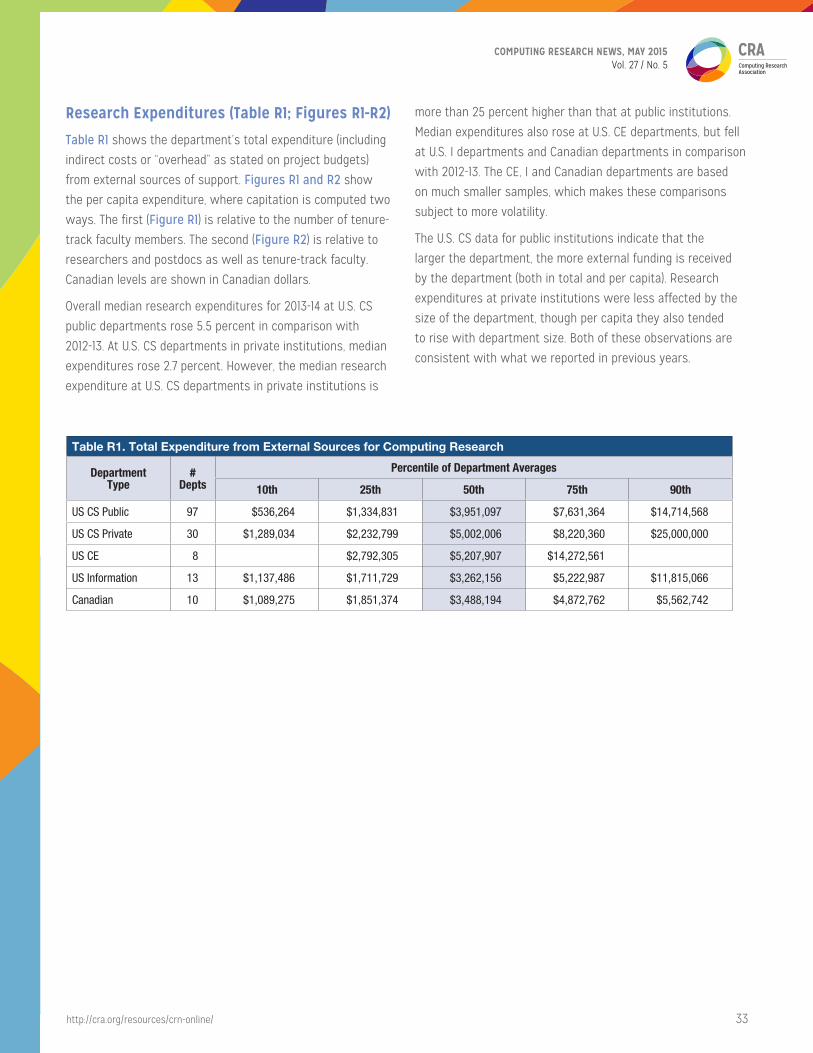
Research Expenditures (Table R1; Figures R1-R2)
Table R1 shows the department’s total expenditure (including
indirect costs or “overhead” as stated on project budgets)
from external sources of support. Figures R1 and R2 show
the per capita expenditure, where capitation is computed two
ways. The first (Figure R1) is relative to the number of tenure-
track faculty members. The second (Figure R2) is relative to
researchers and postdocs as well as tenure-track faculty.
Canadian levels are shown in Canadian dollars.
Overall median research expenditures for 2013-14 at U.S. CS
public departments rose 5.5 percent in comparison with
2012-13. At U.S. CS departments in private institutions, median
expenditures rose 2.7 percent. However, the median research
expenditure at U.S. CS departments in private institutions is
more than 25 percent higher than that at public institutions.
Median expenditures also rose at U.S. CE departments, but fell
at U.S. I departments and Canadian departments in comparison
with 2012-13. The CE, I and Canadian departments are based
on much smaller samples, which makes these comparisons
subject to more volatility.
The U.S. CS data for public institutions indicate that the
larger the department, the more external funding is received
by the department (both in total and per capita). Research
expenditures at private institutions were less affected by the
size of the department, though per capita they also tended
to rise with department size. Both of these observations are
consistent with what we reported in previous years.
Table R1. Total Expenditure from External Sources for Computing Research
Department Type
# Depts
Percentile of Department Averages
10th 25th 50th 75th 90th
US CS Public 97 $536,264 $1,334,831 $3,951,097 $7,631,364 $14,714,568
US CS Private 30 $1,289,034 $2,232,799 $5,002,006 $8,220,360 $25,000,000
US CE 8 $2,792,305 $5,207,907 $14,272,561
US Information 13 $1,137,486 $1,711,729 $3,262,156 $5,222,987 $11,815,066
Canadian 10 $1,089,275 $1,851,374 $3,488,194 $4,872,762 $5,562,742
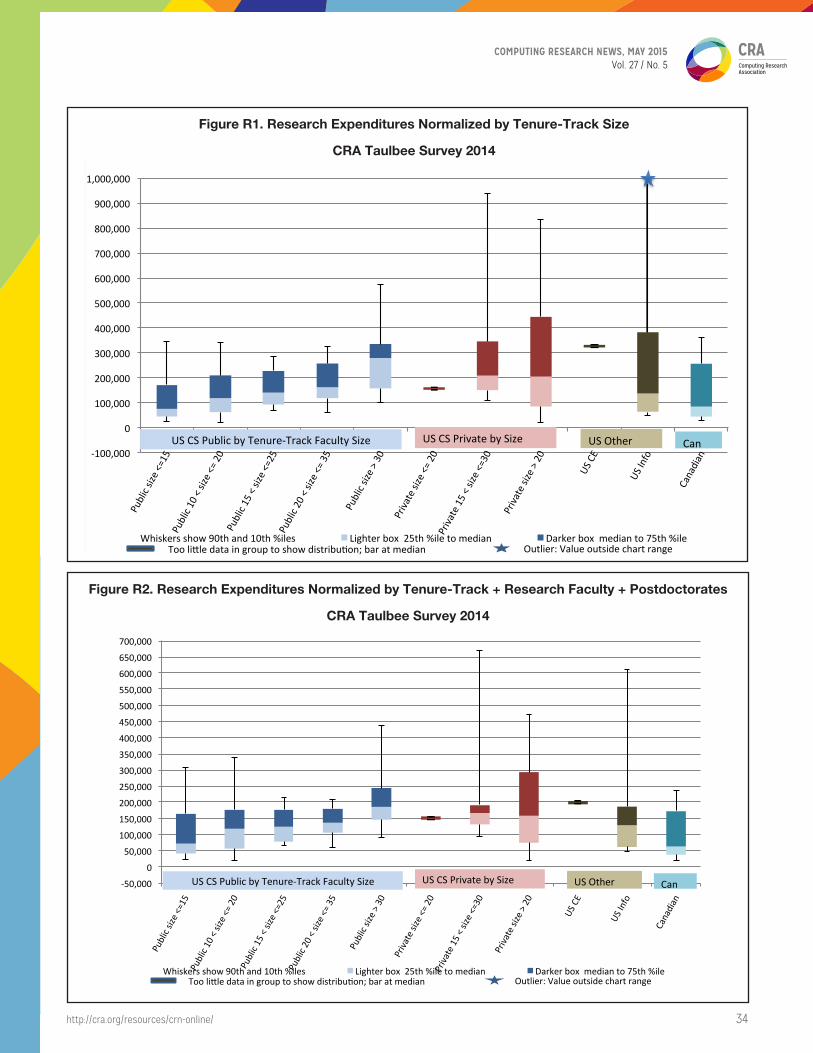
COMPUTING RESEARCH NEWS, MAY 2015Vol. 27 / No. 5
http://cra.org/resources/crn-online/ 34
Figure R2. Research Expenditures Normalized by Tenure-Track + Research Faculty + Postdoctorates
CRA Taulbee Survey 2014
-‐50,000
0
50,000
100,000
150,000
200,000
250,000
300,000
350,000
400,000
450,000
500,000
550,000
600,000
650,000
700,000
Public
size <
=15
Public
10 <
size <
= 20
Public
15 <
size <
=25
Public
20 <
size <
= 35
Public
size >
30
Priva
te si
ze <=
20
Priva
te 15 < s
ize <=
30
Priva
te si
ze >
20
US CE
US In
fo
Cana
dian
Figure R2. Research Expenditures Normalized by Tenure-‐Track + Research Faculty + Postdoctorates
CRA Taulbee Survey 2014
Whiskers show 90th and 10th %iles Lighter box 25th %ile to median Darker box median to 75th %ile
US CS Public by Tenure-‐Track Faculty Size US CS Private by Size US Other Can
Too liTle data in group to show distribuVon; bar at median Outlier: Value outside chart range
Figure R1. Research Expenditures Normalized by Tenure-Track Size
CRA Taulbee Survey 2014
-‐100,000
0
100,000
200,000
300,000
400,000
500,000
600,000
700,000
800,000
900,000
1,000,000
Public
size <
=15
Public
10 <
size <
= 20
Public
15 <
size <
=25
Public
20 <
size <
= 35
Public
size >
30
Priva
te si
ze <=
20
Priva
te 15 < s
ize <=
30
Priva
te si
ze >
20
US CE
US In
fo
Cana
dian
Figure R1. Research Expenditures Normalized by Tenure-‐Track Size CRA Taulbee Survey 2014
Whiskers show 90th and 10th %iles Lighter box 25th %ile to median Darker box median to 75th %ile
US CS Public by Tenure-‐Track Faculty Size US CS Private by Size US Other Can
Too liUle data in group to show distribuWon; bar at median Outlier: Value outside chart range
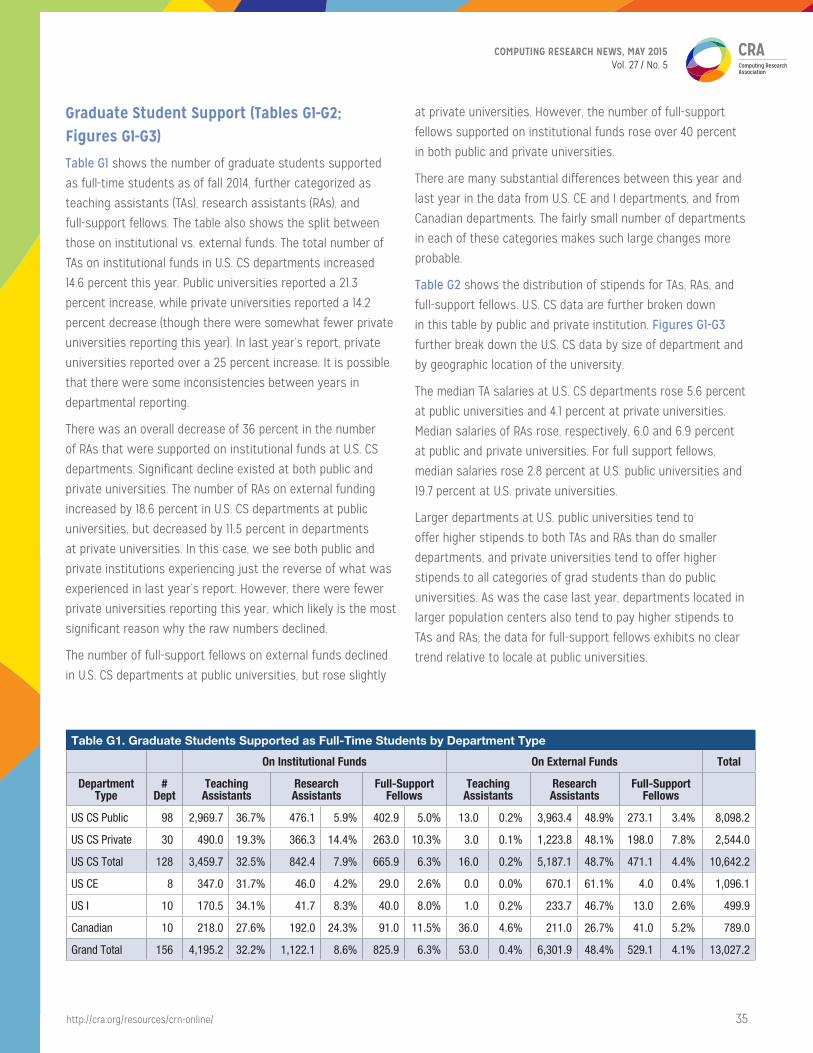
COMPUTING RESEARCH NEWS, MAY 2015Vol. 27 / No. 5
http://cra.org/resources/crn-online/ 35
Graduate Student Support (Tables G1-G2; Figures G1-G3)
Table G1 shows the number of graduate students supported
as full-time students as of fall 2014, further categorized as
teaching assistants (TAs), research assistants (RAs), and
full-support fellows. The table also shows the split between
those on institutional vs. external funds. The total number of
TAs on institutional funds in U.S. CS departments increased
14.6 percent this year. Public universities reported a 21.3
percent increase, while private universities reported a 14.2
percent decrease (though there were somewhat fewer private
universities reporting this year). In last year’s report, private
universities reported over a 25 percent increase. It is possible
that there were some inconsistencies between years in
departmental reporting.
There was an overall decrease of 36 percent in the number
of RAs that were supported on institutional funds at U.S. CS
departments. Significant decline existed at both public and
private universities. The number of RAs on external funding
increased by 18.6 percent in U.S. CS departments at public
universities, but decreased by 11.5 percent in departments
at private universities. In this case, we see both public and
private institutions experiencing just the reverse of what was
experienced in last year’s report. However, there were fewer
private universities reporting this year, which likely is the most
significant reason why the raw numbers declined.
The number of full-support fellows on external funds declined
in U.S. CS departments at public universities, but rose slightly
at private universities. However, the number of full-support
fellows supported on institutional funds rose over 40 percent
in both public and private universities.
There are many substantial differences between this year and
last year in the data from U.S. CE and I departments, and from
Canadian departments. The fairly small number of departments
in each of these categories makes such large changes more
probable.
Table G2 shows the distribution of stipends for TAs, RAs, and
full-support fellows. U.S. CS data are further broken down
in this table by public and private institution. Figures G1-G3 further break down the U.S. CS data by size of department and
by geographic location of the university.
The median TA salaries at U.S. CS departments rose 5.6 percent
at public universities and 4.1 percent at private universities.
Median salaries of RAs rose, respectively, 6.0 and 6.9 percent
at public and private universities. For full support fellows,
median salaries rose 2.8 percent at U.S. public universities and
19.7 percent at U.S. private universities.
Larger departments at U.S. public universities tend to
offer higher stipends to both TAs and RAs than do smaller
departments, and private universities tend to offer higher
stipends to all categories of grad students than do public
universities. As was the case last year, departments located in
larger population centers also tend to pay higher stipends to
TAs and RAs; the data for full-support fellows exhibits no clear
trend relative to locale at public universities.
Table G1. Graduate Students Supported as Full-Time Students by Department Type
On Institutional Funds On External Funds Total
Department Type
# Dept
Teaching Assistants
Research Assistants
Full-Support Fellows
Teaching Assistants
Research Assistants
Full-Support Fellows
US CS Public 98 2,969.7 36.7% 476.1 5.9% 402.9 5.0% 13.0 0.2% 3,963.4 48.9% 273.1 3.4% 8,098.2
US CS Private 30 490.0 19.3% 366.3 14.4% 263.0 10.3% 3.0 0.1% 1,223.8 48.1% 198.0 7.8% 2,544.0
US CS Total 128 3,459.7 32.5% 842.4 7.9% 665.9 6.3% 16.0 0.2% 5,187.1 48.7% 471.1 4.4% 10,642.2
US CE 8 347.0 31.7% 46.0 4.2% 29.0 2.6% 0.0 0.0% 670.1 61.1% 4.0 0.4% 1,096.1
US I 10 170.5 34.1% 41.7 8.3% 40.0 8.0% 1.0 0.2% 233.7 46.7% 13.0 2.6% 499.9
Canadian 10 218.0 27.6% 192.0 24.3% 91.0 11.5% 36.0 4.6% 211.0 26.7% 41.0 5.2% 789.0
Grand Total 156 4,195.2 32.2% 1,122.1 8.6% 825.9 6.3% 53.0 0.4% 6,301.9 48.4% 529.1 4.1% 13,027.2
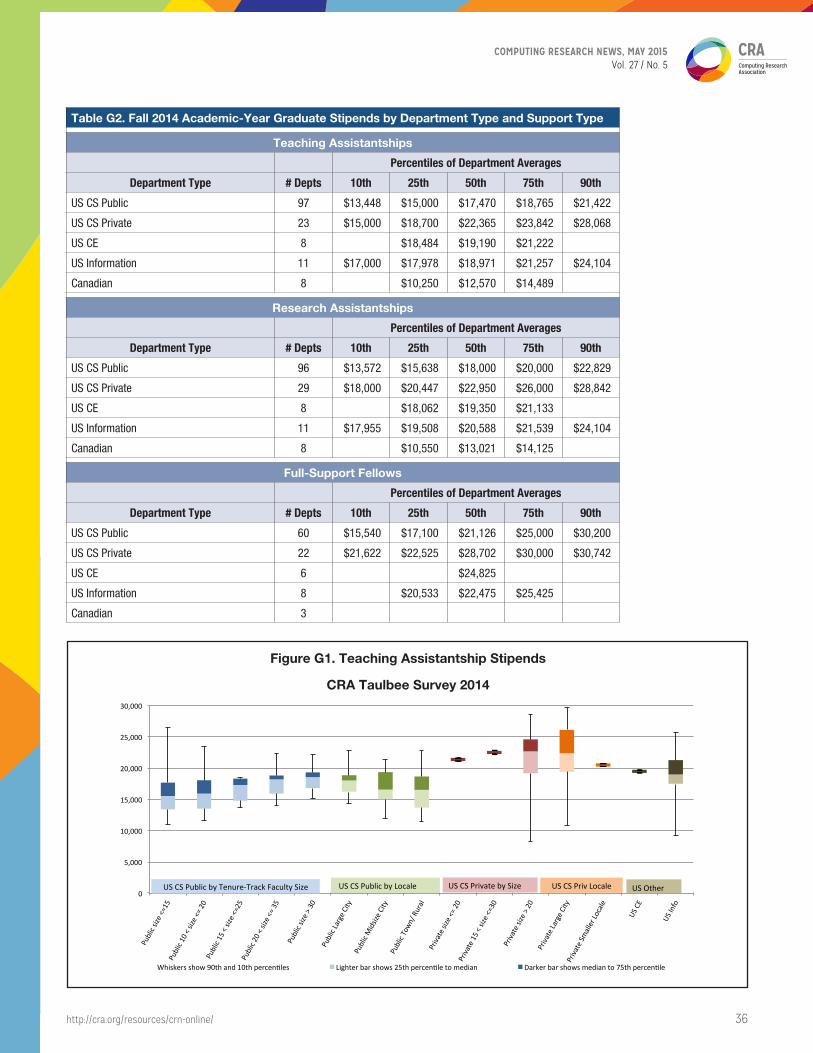
COMPUTING RESEARCH NEWS, MAY 2015Vol. 27 / No. 5
http://cra.org/resources/crn-online/ 36
Table G2. Fall 2014 Academic-Year Graduate Stipends by Department Type and Support Type
Teaching Assistantships
Percentiles of Department Averages
Department Type # Depts 10th 25th 50th 75th 90th
US CS Public 97 $13,448 $15,000 $17,470 $18,765 $21,422
US CS Private 23 $15,000 $18,700 $22,365 $23,842 $28,068
US CE 8 $18,484 $19,190 $21,222
US Information 11 $17,000 $17,978 $18,971 $21,257 $24,104
Canadian 8 $10,250 $12,570 $14,489
Research Assistantships
Percentiles of Department Averages
Department Type # Depts 10th 25th 50th 75th 90th
US CS Public 96 $13,572 $15,638 $18,000 $20,000 $22,829
US CS Private 29 $18,000 $20,447 $22,950 $26,000 $28,842
US CE 8 $18,062 $19,350 $21,133
US Information 11 $17,955 $19,508 $20,588 $21,539 $24,104
Canadian 8 $10,550 $13,021 $14,125
Full-Support Fellows
Percentiles of Department Averages
Department Type # Depts 10th 25th 50th 75th 90th
US CS Public 60 $15,540 $17,100 $21,126 $25,000 $30,200
US CS Private 22 $21,622 $22,525 $28,702 $30,000 $30,742
US CE 6 $24,825
US Information 8 $20,533 $22,475 $25,425
Canadian 3
Figure G1. Teaching Assistantship Stipends
CRA Taulbee Survey 2014
0
5,000
10,000
15,000
20,000
25,000
30,000
Public siz
e <=1
5 Pu
blic 10
< siz
e <= 2
0 Pu
blic 15
< siz
e <=2
5 Pu
blic 20
< siz
e <= 3
5 Pu
blic siz
e > 30
Public Large C
ity
Public Midsiz
e City
Pu
blic To
wn/ R
ural
Priva
te size <=
20
Priva
te 15 < s
ize <=
30
Priva
te size >
20
Priva
te La
rge C
ity
Priva
te Sm
aller Lo
cale
US CE
US In
fo
Figure G1. Teaching Assistantship S5pends CRA Taulbee Survey 2014
Whiskers show 90th and 10th percenOles Lighter bar shows 25th percenOle to median Darker bar shows median to 75th percenOle
US CS Public by Tenure-‐Track Faculty Size US CS Public by Locale US CS Private by Size US CS Priv Locale US Other
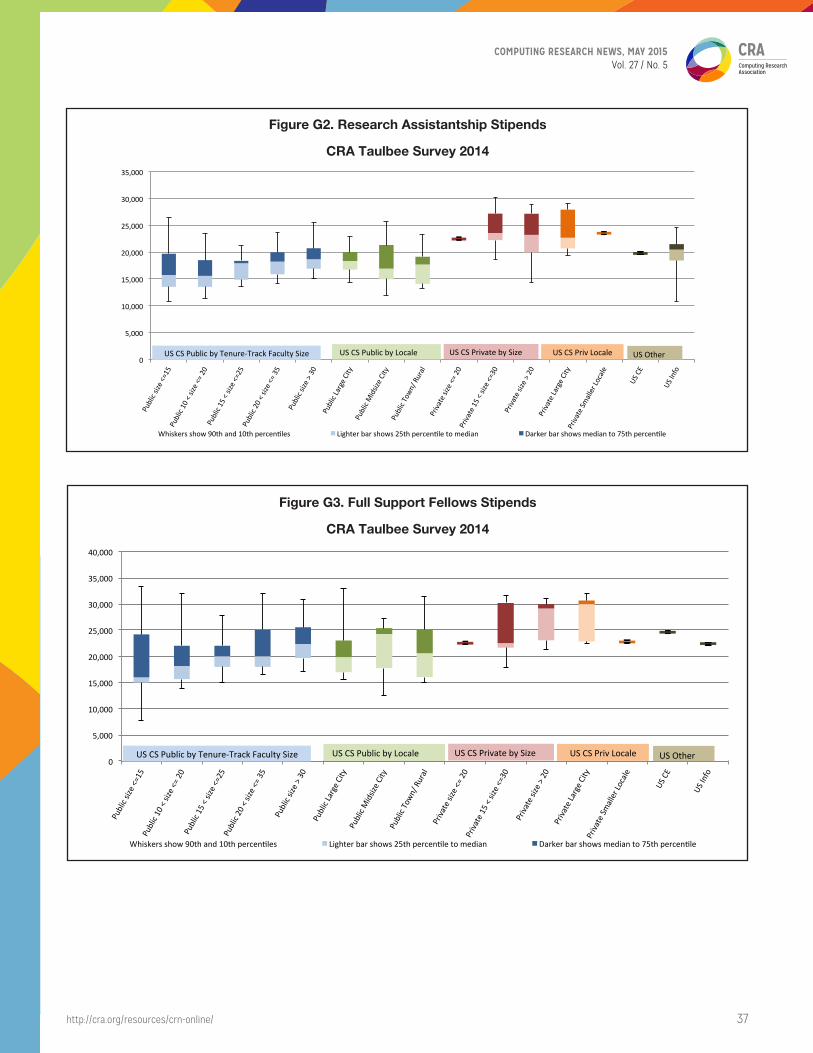
COMPUTING RESEARCH NEWS, MAY 2015Vol. 27 / No. 5
http://cra.org/resources/crn-online/ 37
Figure G2. Research Assistantship Stipends
CRA Taulbee Survey 2014
0
5,000
10,000
15,000
20,000
25,000
30,000
35,000
Public siz
e <=1
5 Pu
blic 10
< siz
e <= 2
0 Pu
blic 15
< siz
e <=2
5 Pu
blic 20
< siz
e <= 3
5 Pu
blic siz
e > 30
Public Large C
ity
Public Midsiz
e City
Pu
blic To
wn/ R
ural
Priva
te size <=
20
Priva
te 15 < s
ize <=
30
Priva
te size >
20
Priva
te La
rge C
ity
Priva
te Sm
aller Lo
cale
US CE
US In
fo
Figure G2. Research Assistantship S5pends CRA Taulbee Survey 2014
Whiskers show 90th and 10th percenOles Lighter bar shows 25th percenOle to median Darker bar shows median to 75th percenOle
US CS Public by Tenure-‐Track Faculty Size US CS Public by Locale US CS Private by Size US CS Priv Locale US Other
Figure G3. Full Support Fellows Stipends
CRA Taulbee Survey 2014
0
5,000
10,000
15,000
20,000
25,000
30,000
35,000
40,000
Public siz
e <=1
5 Pu
blic 10
< siz
e <= 2
0 Pu
blic 15
< siz
e <=2
5 Pu
blic 20
< siz
e <= 3
5 Pu
blic siz
e > 30
Public Large C
ity
Public Midsiz
e City
Pu
blic To
wn/ R
ural
Priva
te size <=
20
Priva
te 15 < s
ize <=
30
Priva
te size >
20
Priva
te La
rge C
ity
Priva
te Sm
aller Lo
cale
US CE
US In
fo
Figure G3. Full Support Fellows S2pends CRA Taulbee Survey 2014
Whiskers show 90th and 10th percenPles Lighter bar shows 25th percenPle to median Darker bar shows median to 75th percenPle
US CS Public by Tenure-‐Track Faculty Size US CS Public by Locale US CS Private by Size US CS Priv Locale US Other
COMPUTING RESEARCH NEWS, MAY 2015Vol. 27 / No. 5
http://cra.org/resources/crn-online/ 38
Faculty Salaries (Tables S1-S21; Figures S1-S9)
Each department was asked to report individual (but
anonymous) faculty salaries if possible; otherwise, the
department was requested to provide the mean salary for
each rank (full, associate, and assistant professors and
non-tenure-track teaching faculty, research faculty, and
post-doctorates) and the number of persons at each rank.
The salaries are those in effect on January 1, 2015. For
U.S. departments, nine-month salaries are reported in U.S.
dollars. For Canadian departments, twelve-month salaries
are reported in Canadian dollars. Respondents were asked
to include salary supplements such as salary monies from
endowed positions.
U.S. CS data are reported in Tables S1-S16 and in the box and
whiskers diagrams. Data for CE, I, Canadian and new Ph.D.s
are reported in Tables S17-S20. The tables and diagrams
contain distributional data (first decile, quartiles, and ninth
decile) computed from the department averages only. Thus,
for example, a table row labeled “50” or the median line in a
diagram is the median of the averages for the departments
that reported within the stratum (the number of such
departments reporting is shown in the “depts” row). It
therefore is not a true median of all of the salaries.
We also report salary data for senior faculty based on time in
rank, for meaningful comparison of individual or departmental
faculty salaries with national averages. We report associate
professor salaries for time in rank of 7 years or less, and of
more than 7 years. For full professors, we report time in rank
of 7 years or less, 8 to 15 years, and more than 15 years.
Those departments reporting salary data were provided a
summary report in December 2014. Those departments that
provided individual salaries were additionally provided more
comprehensive distributional information based on these
individual salaries. This year, about 75 percent of those
reporting salary data provided salaries at the individual level.
The remainder of this section updates the basic report
provided in December to all departments that provided salary
data. It reflects salary data received since the deadline for
that report.
Similar to past years, the data show that salaries at private
universities tend to be higher than those at public universities
in all faculty strata (Tables S2 and S3). At public universities,
salaries tend to be higher for larger departments (Tables
S4-S8). At private universities, full professor salaries are
somewhat higher in smaller locales, while associate professor
salaries are somewhat lower in smaller locales. Public
university salaries appear to be generally lower in smaller
locales for non-tenure-track faculty and for tenure-track
associate and assistant professors.
To provide a more meaningful comparison of this year’s
salaries with those from last year’s Taulbee report, we use
only those departments that reported both years. Because
some departments that reported both years provided only
aggregate salaries for their full and associate professors
during one year and in the other year reported them
by years in rank, we only include the salaries for all full
professors and for all associate professors in the year-to-
year comparison. Table S21 shows the change in median of
the average salaries in departments that reported both years
(the number of departments being compared is indicated
in each column). The table indicates that the median of the
average salaries has increased by 2-3 percent from 2013-14 to
2014-15 in most categories of faculty.
When interpreting these changes, it is important to remember
the effect that promotions have on the departmental data
from one year to the next, since individual faculty members
move from one rank to another. Thus, a department with a
small number of faculty members in a particular rank can
have its average salary in that rank change appreciably (in
either direction) by a single promotion to or from that rank.
Departures via resignation or retirement also impact these
figures, particularly in the non-tenure-track categories.
Because of the small number of Canadian and Computer
Engineering departments reporting, the values in those
columns are considerably more volatile.
For new Ph.D.s in tenure-track positions at U.S. computer
science, computer engineering, and I-school departments
(Table S20) the median of the averages increased by 2.5
percent vs. last year. Canadian departments did not report any
salaries this year for new Ph.D.s in tenure-track, teaching, or
non-tenure-track research positions.
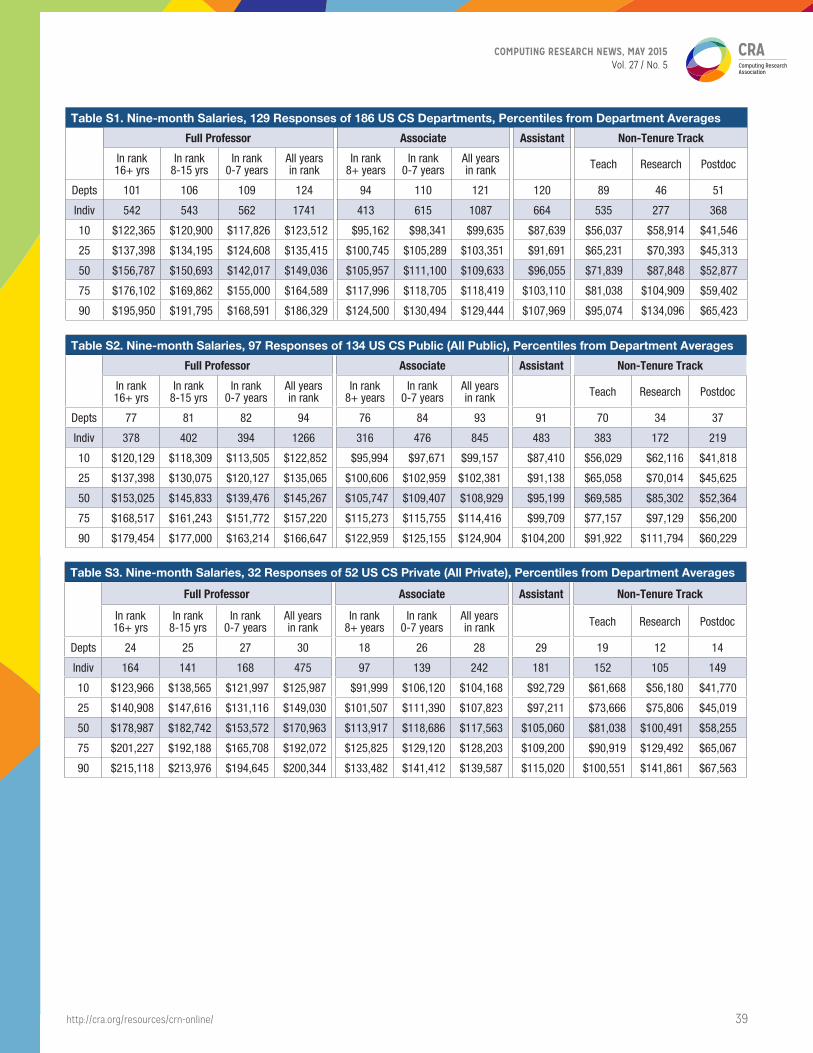
COMPUTING RESEARCH NEWS, MAY 2015Vol. 27 / No. 5
http://cra.org/resources/crn-online/ 39
Table S1. Nine-month Salaries, 129 Responses of 186 US CS Departments, Percentiles from Department Averages
Full Professor Associate Assistant Non-Tenure Track
In rank 16+ yrs
In rank 8-15 yrs
In rank 0-7 years
All years in rank
In rank 8+ years
In rank 0-7 years
All years in rank Teach Research Postdoc
Depts 101 106 109 124 94 110 121 120 89 46 51
Indiv 542 543 562 1741 413 615 1087 664 535 277 368
10 $122,365 $120,900 $117,826 $123,512 $95,162 $98,341 $99,635 $87,639 $56,037 $58,914 $41,546
25 $137,398 $134,195 $124,608 $135,415 $100,745 $105,289 $103,351 $91,691 $65,231 $70,393 $45,313
50 $156,787 $150,693 $142,017 $149,036 $105,957 $111,100 $109,633 $96,055 $71,839 $87,848 $52,877
75 $176,102 $169,862 $155,000 $164,589 $117,996 $118,705 $118,419 $103,110 $81,038 $104,909 $59,402
90 $195,950 $191,795 $168,591 $186,329 $124,500 $130,494 $129,444 $107,969 $95,074 $134,096 $65,423
Table S2. Nine-month Salaries, 97 Responses of 134 US CS Public (All Public), Percentiles from Department Averages
Full Professor Associate Assistant Non-Tenure Track
In rank 16+ yrs
In rank 8-15 yrs
In rank 0-7 years
All years in rank
In rank 8+ years
In rank 0-7 years
All years in rank Teach Research Postdoc
Depts 77 81 82 94 76 84 93 91 70 34 37
Indiv 378 402 394 1266 316 476 845 483 383 172 219
10 $120,129 $118,309 $113,505 $122,852 $95,994 $97,671 $99,157 $87,410 $56,029 $62,116 $41,818
25 $137,398 $130,075 $120,127 $135,065 $100,606 $102,959 $102,381 $91,138 $65,058 $70,014 $45,625
50 $153,025 $145,833 $139,476 $145,267 $105,747 $109,407 $108,929 $95,199 $69,585 $85,302 $52,364
75 $168,517 $161,243 $151,772 $157,220 $115,273 $115,755 $114,416 $99,709 $77,157 $97,129 $56,200
90 $179,454 $177,000 $163,214 $166,647 $122,959 $125,155 $124,904 $104,200 $91,922 $111,794 $60,229
Table S3. Nine-month Salaries, 32 Responses of 52 US CS Private (All Private), Percentiles from Department Averages
Full Professor Associate Assistant Non-Tenure Track
In rank 16+ yrs
In rank 8-15 yrs
In rank 0-7 years
All years in rank
In rank 8+ years
In rank 0-7 years
All years in rank Teach Research Postdoc
Depts 24 25 27 30 18 26 28 29 19 12 14
Indiv 164 141 168 475 97 139 242 181 152 105 149
10 $123,966 $138,565 $121,997 $125,987 $91,999 $106,120 $104,168 $92,729 $61,668 $56,180 $41,770
25 $140,908 $147,616 $131,116 $149,030 $101,507 $111,390 $107,823 $97,211 $73,666 $75,806 $45,019
50 $178,987 $182,742 $153,572 $170,963 $113,917 $118,686 $117,563 $105,060 $81,038 $100,491 $58,255
75 $201,227 $192,188 $165,708 $192,072 $125,825 $129,120 $128,203 $109,200 $90,919 $129,492 $65,067
90 $215,118 $213,976 $194,645 $200,344 $133,482 $141,412 $139,587 $115,020 $100,551 $141,861 $67,563
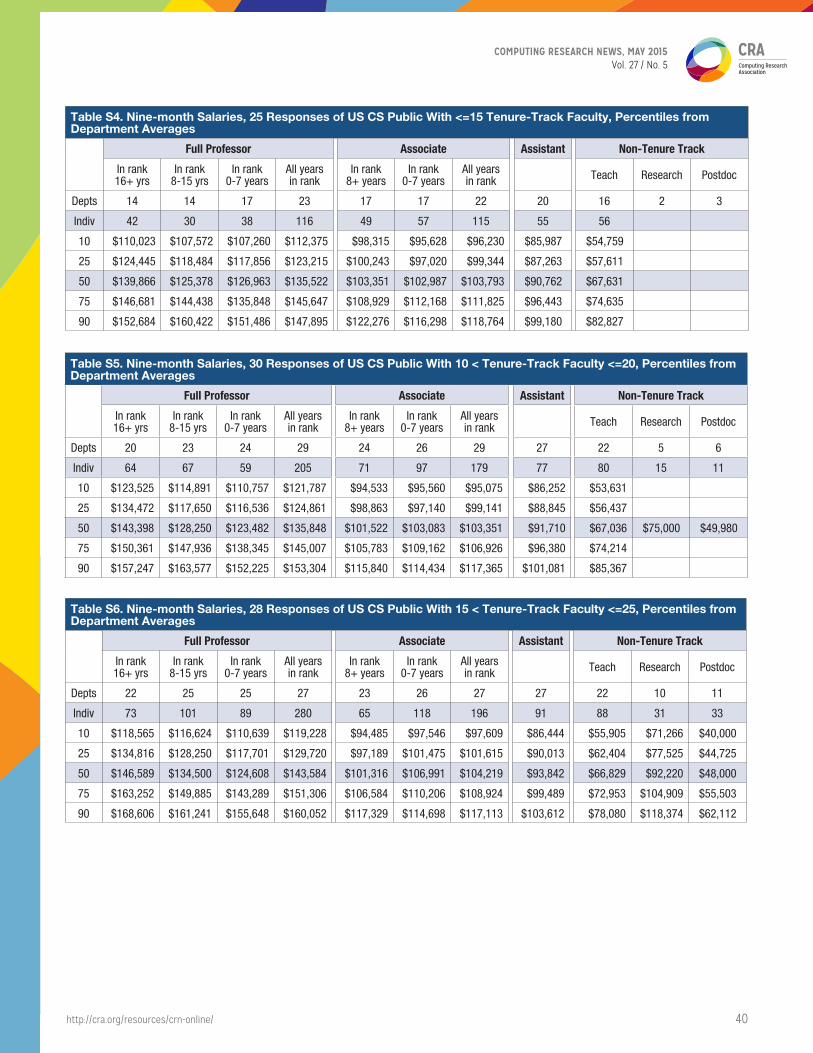
COMPUTING RESEARCH NEWS, MAY 2015Vol. 27 / No. 5
http://cra.org/resources/crn-online/ 40
Table S4. Nine-month Salaries, 25 Responses of US CS Public With <=15 Tenure-Track Faculty, Percentiles from Department Averages
Full Professor Associate Assistant Non-Tenure Track
In rank 16+ yrs
In rank 8-15 yrs
In rank 0-7 years
All years in rank
In rank 8+ years
In rank 0-7 years
All years in rank Teach Research Postdoc
Depts 14 14 17 23 17 17 22 20 16 2 3
Indiv 42 30 38 116 49 57 115 55 56
10 $110,023 $107,572 $107,260 $112,375 $98,315 $95,628 $96,230 $85,987 $54,759
25 $124,445 $118,484 $117,856 $123,215 $100,243 $97,020 $99,344 $87,263 $57,611
50 $139,866 $125,378 $126,963 $135,522 $103,351 $102,987 $103,793 $90,762 $67,631
75 $146,681 $144,438 $135,848 $145,647 $108,929 $112,168 $111,825 $96,443 $74,635
90 $152,684 $160,422 $151,486 $147,895 $122,276 $116,298 $118,764 $99,180 $82,827
Table S5. Nine-month Salaries, 30 Responses of US CS Public With 10 < Tenure-Track Faculty <=20, Percentiles from Department Averages
Full Professor Associate Assistant Non-Tenure Track
In rank 16+ yrs
In rank 8-15 yrs
In rank 0-7 years
All years in rank
In rank 8+ years
In rank 0-7 years
All years in rank Teach Research Postdoc
Depts 20 23 24 29 24 26 29 27 22 5 6
Indiv 64 67 59 205 71 97 179 77 80 15 11
10 $123,525 $114,891 $110,757 $121,787 $94,533 $95,560 $95,075 $86,252 $53,631
25 $134,472 $117,650 $116,536 $124,861 $98,863 $97,140 $99,141 $88,845 $56,437
50 $143,398 $128,250 $123,482 $135,848 $101,522 $103,083 $103,351 $91,710 $67,036 $75,000 $49,980
75 $150,361 $147,936 $138,345 $145,007 $105,783 $109,162 $106,926 $96,380 $74,214
90 $157,247 $163,577 $152,225 $153,304 $115,840 $114,434 $117,365 $101,081 $85,367
Table S6. Nine-month Salaries, 28 Responses of US CS Public With 15 < Tenure-Track Faculty <=25, Percentiles from Department Averages
Full Professor Associate Assistant Non-Tenure Track
In rank 16+ yrs
In rank 8-15 yrs
In rank 0-7 years
All years in rank
In rank 8+ years
In rank 0-7 years
All years in rank Teach Research Postdoc
Depts 22 25 25 27 23 26 27 27 22 10 11
Indiv 73 101 89 280 65 118 196 91 88 31 33
10 $118,565 $116,624 $110,639 $119,228 $94,485 $97,546 $97,609 $86,444 $55,905 $71,266 $40,000
25 $134,816 $128,250 $117,701 $129,720 $97,189 $101,475 $101,615 $90,013 $62,404 $77,525 $44,725
50 $146,589 $134,500 $124,608 $143,584 $101,316 $106,991 $104,219 $93,842 $66,829 $92,220 $48,000
75 $163,252 $149,885 $143,289 $151,306 $106,584 $110,206 $108,924 $99,489 $72,953 $104,909 $55,503
90 $168,606 $161,241 $155,648 $160,052 $117,329 $114,698 $117,113 $103,612 $78,080 $118,374 $62,112
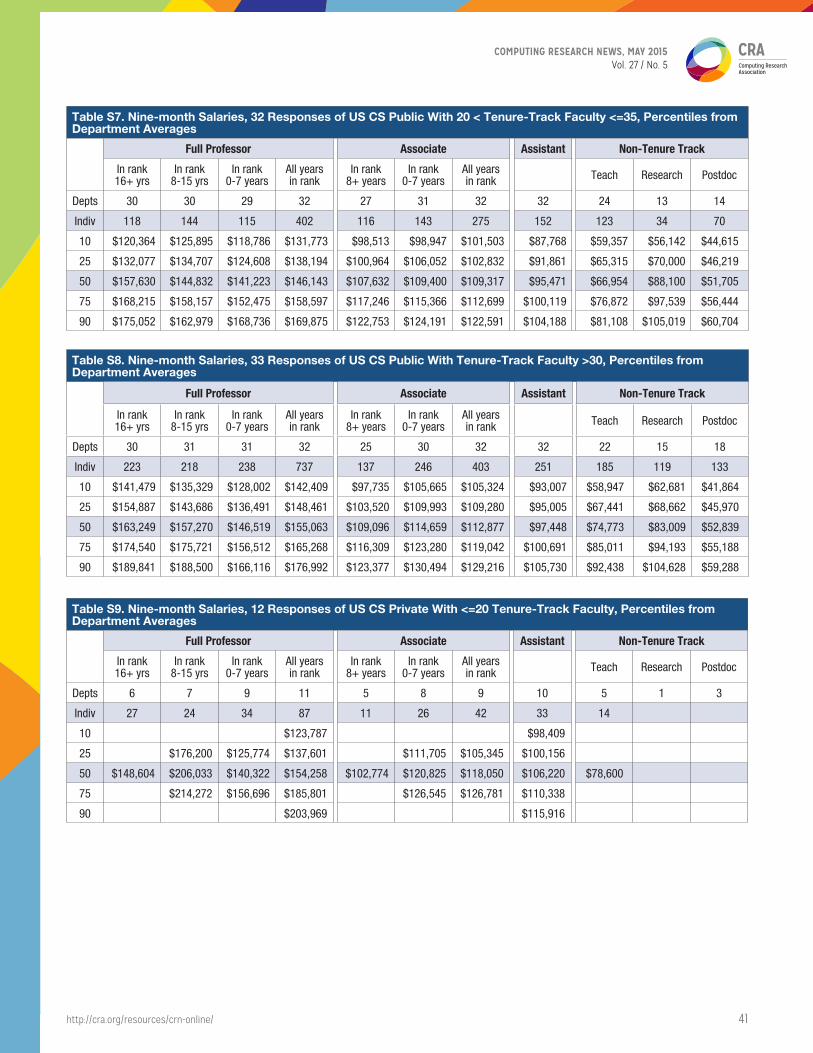
COMPUTING RESEARCH NEWS, MAY 2015Vol. 27 / No. 5
http://cra.org/resources/crn-online/ 41
Table S7. Nine-month Salaries, 32 Responses of US CS Public With 20 < Tenure-Track Faculty <=35, Percentiles from Department Averages
Full Professor Associate Assistant Non-Tenure Track
In rank 16+ yrs
In rank 8-15 yrs
In rank 0-7 years
All years in rank
In rank 8+ years
In rank 0-7 years
All years in rank Teach Research Postdoc
Depts 30 30 29 32 27 31 32 32 24 13 14
Indiv 118 144 115 402 116 143 275 152 123 34 70
10 $120,364 $125,895 $118,786 $131,773 $98,513 $98,947 $101,503 $87,768 $59,357 $56,142 $44,615
25 $132,077 $134,707 $124,608 $138,194 $100,964 $106,052 $102,832 $91,861 $65,315 $70,000 $46,219
50 $157,630 $144,832 $141,223 $146,143 $107,632 $109,400 $109,317 $95,471 $66,954 $88,100 $51,705
75 $168,215 $158,157 $152,475 $158,597 $117,246 $115,366 $112,699 $100,119 $76,872 $97,539 $56,444
90 $175,052 $162,979 $168,736 $169,875 $122,753 $124,191 $122,591 $104,188 $81,108 $105,019 $60,704
Table S8. Nine-month Salaries, 33 Responses of US CS Public With Tenure-Track Faculty >30, Percentiles from Department Averages
Full Professor Associate Assistant Non-Tenure Track
In rank 16+ yrs
In rank 8-15 yrs
In rank 0-7 years
All years in rank
In rank 8+ years
In rank 0-7 years
All years in rank Teach Research Postdoc
Depts 30 31 31 32 25 30 32 32 22 15 18
Indiv 223 218 238 737 137 246 403 251 185 119 133
10 $141,479 $135,329 $128,002 $142,409 $97,735 $105,665 $105,324 $93,007 $58,947 $62,681 $41,864
25 $154,887 $143,686 $136,491 $148,461 $103,520 $109,993 $109,280 $95,005 $67,441 $68,662 $45,970
50 $163,249 $157,270 $146,519 $155,063 $109,096 $114,659 $112,877 $97,448 $74,773 $83,009 $52,839
75 $174,540 $175,721 $156,512 $165,268 $116,309 $123,280 $119,042 $100,691 $85,011 $94,193 $55,188
90 $189,841 $188,500 $166,116 $176,992 $123,377 $130,494 $129,216 $105,730 $92,438 $104,628 $59,288
Table S9. Nine-month Salaries, 12 Responses of US CS Private With <=20 Tenure-Track Faculty, Percentiles from Department Averages
Full Professor Associate Assistant Non-Tenure Track
In rank 16+ yrs
In rank 8-15 yrs
In rank 0-7 years
All years in rank
In rank 8+ years
In rank 0-7 years
All years in rank Teach Research Postdoc
Depts 6 7 9 11 5 8 9 10 5 1 3
Indiv 27 24 34 87 11 26 42 33 14
10 $123,787 $98,409
25 $176,200 $125,774 $137,601 $111,705 $105,345 $100,156
50 $148,604 $206,033 $140,322 $154,258 $102,774 $120,825 $118,050 $106,220 $78,600
75 $214,272 $156,696 $185,801 $126,545 $126,781 $110,338
90 $203,969 $115,916
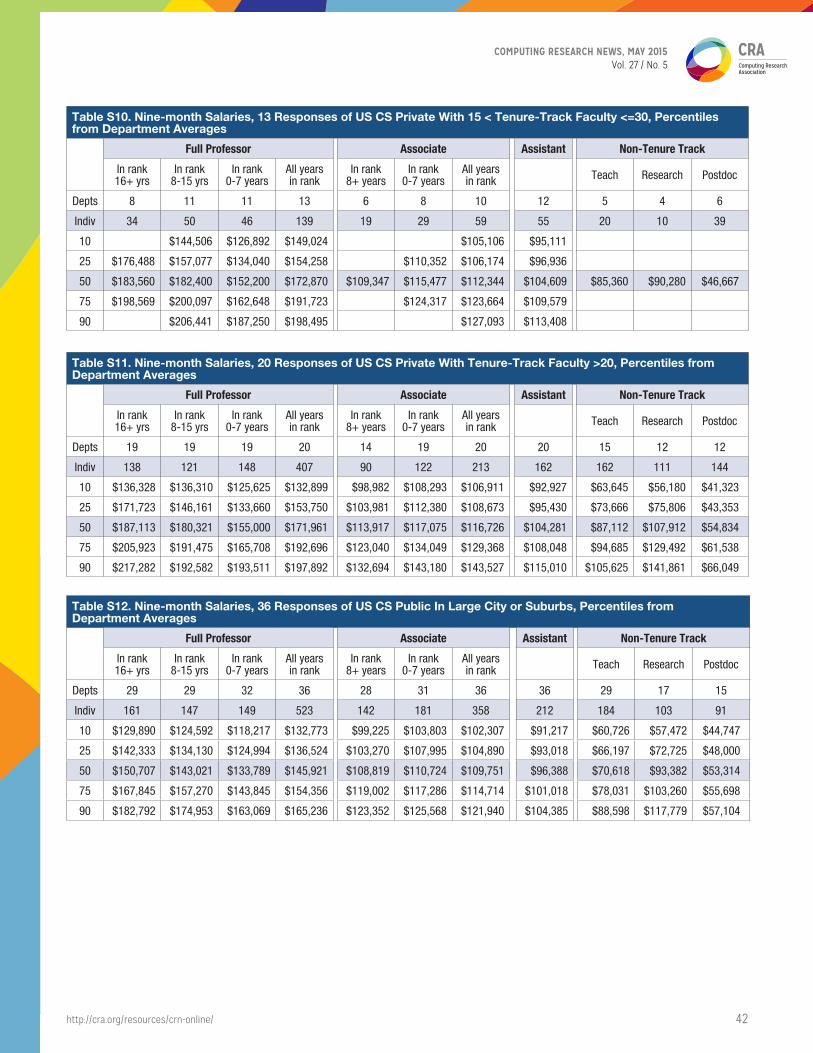
COMPUTING RESEARCH NEWS, MAY 2015Vol. 27 / No. 5
http://cra.org/resources/crn-online/ 42
Table S10. Nine-month Salaries, 13 Responses of US CS Private With 15 < Tenure-Track Faculty <=30, Percentiles from Department Averages
Full Professor Associate Assistant Non-Tenure Track
In rank 16+ yrs
In rank 8-15 yrs
In rank 0-7 years
All years in rank
In rank 8+ years
In rank 0-7 years
All years in rank Teach Research Postdoc
Depts 8 11 11 13 6 8 10 12 5 4 6
Indiv 34 50 46 139 19 29 59 55 20 10 39
10 $144,506 $126,892 $149,024 $105,106 $95,111
25 $176,488 $157,077 $134,040 $154,258 $110,352 $106,174 $96,936
50 $183,560 $182,400 $152,200 $172,870 $109,347 $115,477 $112,344 $104,609 $85,360 $90,280 $46,667
75 $198,569 $200,097 $162,648 $191,723 $124,317 $123,664 $109,579
90 $206,441 $187,250 $198,495 $127,093 $113,408
Table S11. Nine-month Salaries, 20 Responses of US CS Private With Tenure-Track Faculty >20, Percentiles from Department Averages
Full Professor Associate Assistant Non-Tenure Track
In rank 16+ yrs
In rank 8-15 yrs
In rank 0-7 years
All years in rank
In rank 8+ years
In rank 0-7 years
All years in rank Teach Research Postdoc
Depts 19 19 19 20 14 19 20 20 15 12 12
Indiv 138 121 148 407 90 122 213 162 162 111 144
10 $136,328 $136,310 $125,625 $132,899 $98,982 $108,293 $106,911 $92,927 $63,645 $56,180 $41,323
25 $171,723 $146,161 $133,660 $153,750 $103,981 $112,380 $108,673 $95,430 $73,666 $75,806 $43,353
50 $187,113 $180,321 $155,000 $171,961 $113,917 $117,075 $116,726 $104,281 $87,112 $107,912 $54,834
75 $205,923 $191,475 $165,708 $192,696 $123,040 $134,049 $129,368 $108,048 $94,685 $129,492 $61,538
90 $217,282 $192,582 $193,511 $197,892 $132,694 $143,180 $143,527 $115,010 $105,625 $141,861 $66,049
Table S12. Nine-month Salaries, 36 Responses of US CS Public In Large City or Suburbs, Percentiles from Department Averages
Full Professor Associate Assistant Non-Tenure Track
In rank 16+ yrs
In rank 8-15 yrs
In rank 0-7 years
All years in rank
In rank 8+ years
In rank 0-7 years
All years in rank Teach Research Postdoc
Depts 29 29 32 36 28 31 36 36 29 17 15
Indiv 161 147 149 523 142 181 358 212 184 103 91
10 $129,890 $124,592 $118,217 $132,773 $99,225 $103,803 $102,307 $91,217 $60,726 $57,472 $44,747
25 $142,333 $134,130 $124,994 $136,524 $103,270 $107,995 $104,890 $93,018 $66,197 $72,725 $48,000
50 $150,707 $143,021 $133,789 $145,921 $108,819 $110,724 $109,751 $96,388 $70,618 $93,382 $53,314
75 $167,845 $157,270 $143,845 $154,356 $119,002 $117,286 $114,714 $101,018 $78,031 $103,260 $55,698
90 $182,792 $174,953 $163,069 $165,236 $123,352 $125,568 $121,940 $104,385 $88,598 $117,779 $57,104
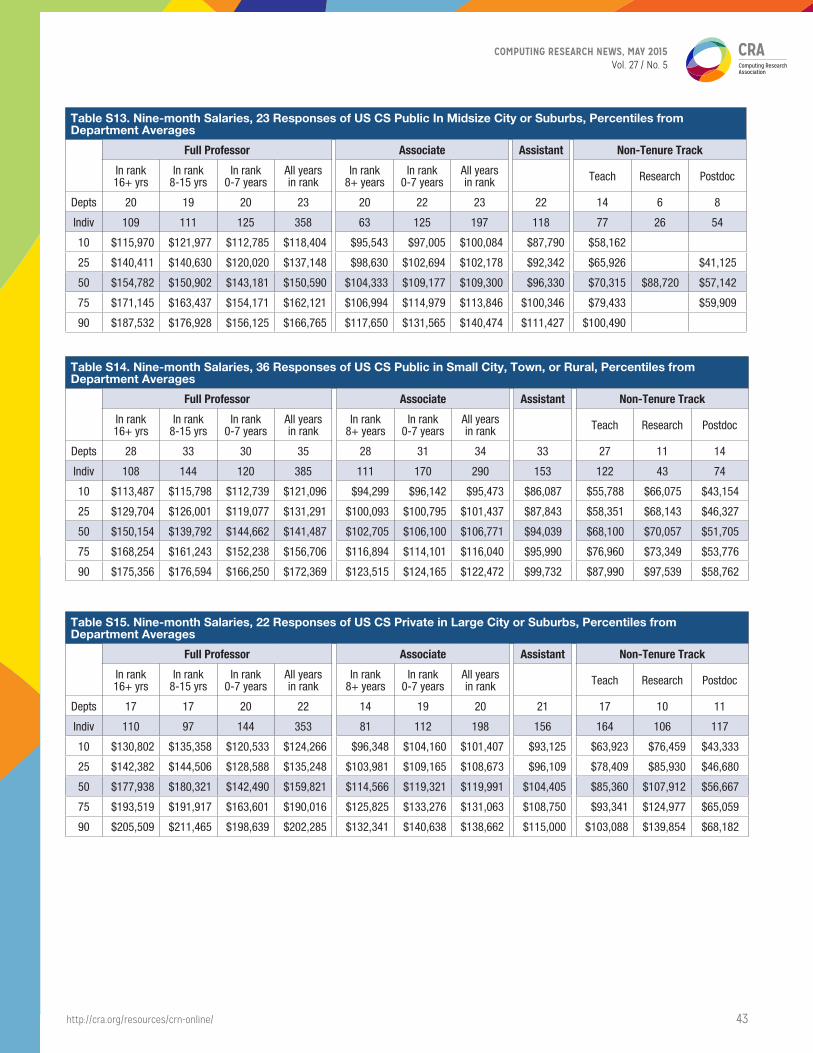
COMPUTING RESEARCH NEWS, MAY 2015Vol. 27 / No. 5
http://cra.org/resources/crn-online/ 43
Table S13. Nine-month Salaries, 23 Responses of US CS Public In Midsize City or Suburbs, Percentiles from Department Averages
Full Professor Associate Assistant Non-Tenure Track
In rank 16+ yrs
In rank 8-15 yrs
In rank 0-7 years
All years in rank
In rank 8+ years
In rank 0-7 years
All years in rank Teach Research Postdoc
Depts 20 19 20 23 20 22 23 22 14 6 8
Indiv 109 111 125 358 63 125 197 118 77 26 54
10 $115,970 $121,977 $112,785 $118,404 $95,543 $97,005 $100,084 $87,790 $58,162
25 $140,411 $140,630 $120,020 $137,148 $98,630 $102,694 $102,178 $92,342 $65,926 $41,125
50 $154,782 $150,902 $143,181 $150,590 $104,333 $109,177 $109,300 $96,330 $70,315 $88,720 $57,142
75 $171,145 $163,437 $154,171 $162,121 $106,994 $114,979 $113,846 $100,346 $79,433 $59,909
90 $187,532 $176,928 $156,125 $166,765 $117,650 $131,565 $140,474 $111,427 $100,490
Table S14. Nine-month Salaries, 36 Responses of US CS Public in Small City, Town, or Rural, Percentiles from Department Averages
Full Professor Associate Assistant Non-Tenure Track
In rank 16+ yrs
In rank 8-15 yrs
In rank 0-7 years
All years in rank
In rank 8+ years
In rank 0-7 years
All years in rank Teach Research Postdoc
Depts 28 33 30 35 28 31 34 33 27 11 14
Indiv 108 144 120 385 111 170 290 153 122 43 74
10 $113,487 $115,798 $112,739 $121,096 $94,299 $96,142 $95,473 $86,087 $55,788 $66,075 $43,154
25 $129,704 $126,001 $119,077 $131,291 $100,093 $100,795 $101,437 $87,843 $58,351 $68,143 $46,327
50 $150,154 $139,792 $144,662 $141,487 $102,705 $106,100 $106,771 $94,039 $68,100 $70,057 $51,705
75 $168,254 $161,243 $152,238 $156,706 $116,894 $114,101 $116,040 $95,990 $76,960 $73,349 $53,776
90 $175,356 $176,594 $166,250 $172,369 $123,515 $124,165 $122,472 $99,732 $87,990 $97,539 $58,762
Table S15. Nine-month Salaries, 22 Responses of US CS Private in Large City or Suburbs, Percentiles from Department Averages
Full Professor Associate Assistant Non-Tenure Track
In rank 16+ yrs
In rank 8-15 yrs
In rank 0-7 years
All years in rank
In rank 8+ years
In rank 0-7 years
All years in rank Teach Research Postdoc
Depts 17 17 20 22 14 19 20 21 17 10 11
Indiv 110 97 144 353 81 112 198 156 164 106 117
10 $130,802 $135,358 $120,533 $124,266 $96,348 $104,160 $101,407 $93,125 $63,923 $76,459 $43,333
25 $142,382 $144,506 $128,588 $135,248 $103,981 $109,165 $108,673 $96,109 $78,409 $85,930 $46,680
50 $177,938 $180,321 $142,490 $159,821 $114,566 $119,321 $119,991 $104,405 $85,360 $107,912 $56,667
75 $193,519 $191,917 $163,601 $190,016 $125,825 $133,276 $131,063 $108,750 $93,341 $124,977 $65,059
90 $205,509 $211,465 $198,639 $202,285 $132,341 $140,638 $138,662 $115,000 $103,088 $139,854 $68,182
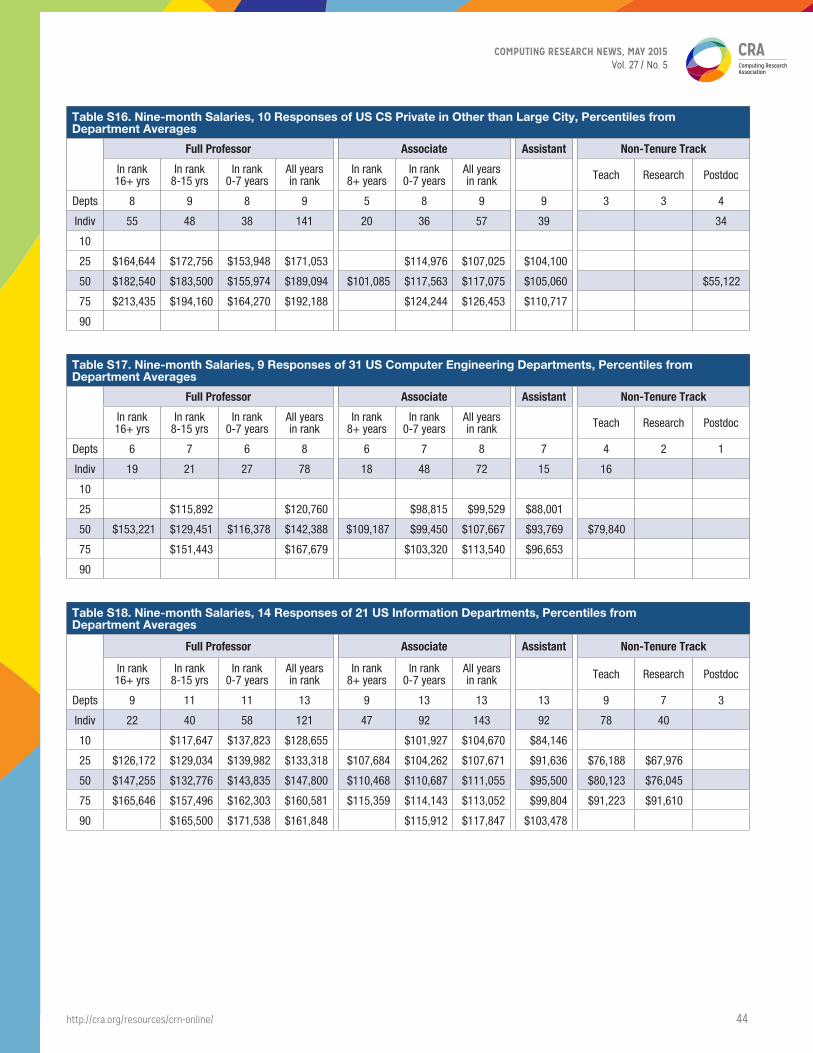
COMPUTING RESEARCH NEWS, MAY 2015Vol. 27 / No. 5
http://cra.org/resources/crn-online/ 44
Table S16. Nine-month Salaries, 10 Responses of US CS Private in Other than Large City, Percentiles from Department Averages
Full Professor Associate Assistant Non-Tenure Track
In rank 16+ yrs
In rank 8-15 yrs
In rank 0-7 years
All years in rank
In rank 8+ years
In rank 0-7 years
All years in rank Teach Research Postdoc
Depts 8 9 8 9 5 8 9 9 3 3 4
Indiv 55 48 38 141 20 36 57 39 34
10
25 $164,644 $172,756 $153,948 $171,053 $114,976 $107,025 $104,100
50 $182,540 $183,500 $155,974 $189,094 $101,085 $117,563 $117,075 $105,060 $55,122
75 $213,435 $194,160 $164,270 $192,188 $124,244 $126,453 $110,717
90
Table S17. Nine-month Salaries, 9 Responses of 31 US Computer Engineering Departments, Percentiles from Department Averages
Full Professor Associate Assistant Non-Tenure Track
In rank 16+ yrs
In rank 8-15 yrs
In rank 0-7 years
All years in rank
In rank 8+ years
In rank 0-7 years
All years in rank Teach Research Postdoc
Depts 6 7 6 8 6 7 8 7 4 2 1
Indiv 19 21 27 78 18 48 72 15 16
10
25 $115,892 $120,760 $98,815 $99,529 $88,001
50 $153,221 $129,451 $116,378 $142,388 $109,187 $99,450 $107,667 $93,769 $79,840
75 $151,443 $167,679 $103,320 $113,540 $96,653
90
Table S18. Nine-month Salaries, 14 Responses of 21 US Information Departments, Percentiles from Department Averages
Full Professor Associate Assistant Non-Tenure Track
In rank 16+ yrs
In rank 8-15 yrs
In rank 0-7 years
All years in rank
In rank 8+ years
In rank 0-7 years
All years in rank Teach Research Postdoc
Depts 9 11 11 13 9 13 13 13 9 7 3
Indiv 22 40 58 121 47 92 143 92 78 40
10 $117,647 $137,823 $128,655 $101,927 $104,670 $84,146
25 $126,172 $129,034 $139,982 $133,318 $107,684 $104,262 $107,671 $91,636 $76,188 $67,976
50 $147,255 $132,776 $143,835 $147,800 $110,468 $110,687 $111,055 $95,500 $80,123 $76,045
75 $165,646 $157,496 $162,303 $160,581 $115,359 $114,143 $113,052 $99,804 $91,223 $91,610
90 $165,500 $171,538 $161,848 $115,912 $117,847 $103,478
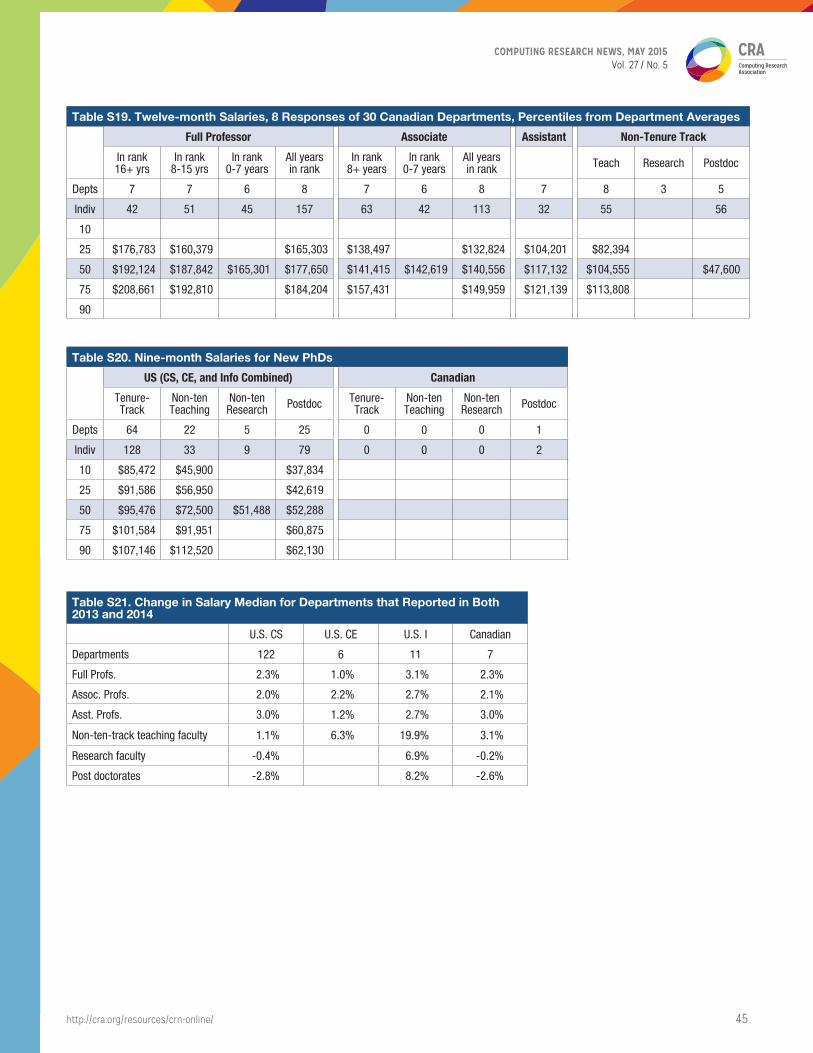
COMPUTING RESEARCH NEWS, MAY 2015Vol. 27 / No. 5
http://cra.org/resources/crn-online/ 45
Table S19. Twelve-month Salaries, 8 Responses of 30 Canadian Departments, Percentiles from Department Averages
Full Professor Associate Assistant Non-Tenure Track
In rank 16+ yrs
In rank 8-15 yrs
In rank 0-7 years
All years in rank
In rank 8+ years
In rank 0-7 years
All years in rank Teach Research Postdoc
Depts 7 7 6 8 7 6 8 7 8 3 5
Indiv 42 51 45 157 63 42 113 32 55 56
10
25 $176,783 $160,379 $165,303 $138,497 $132,824 $104,201 $82,394
50 $192,124 $187,842 $165,301 $177,650 $141,415 $142,619 $140,556 $117,132 $104,555 $47,600
75 $208,661 $192,810 $184,204 $157,431 $149,959 $121,139 $113,808
90
Table S20. Nine-month Salaries for New PhDs
US (CS, CE, and Info Combined) Canadian
Tenure-Track
Non-ten Teaching
Non-ten Research Postdoc Tenure-
TrackNon-ten Teaching
Non-ten Research Postdoc
Depts 64 22 5 25 0 0 0 1
Indiv 128 33 9 79 0 0 0 2
10 $85,472 $45,900 $37,834
25 $91,586 $56,950 $42,619
50 $95,476 $72,500 $51,488 $52,288
75 $101,584 $91,951 $60,875
90 $107,146 $112,520 $62,130
Table S21. Change in Salary Median for Departments that Reported in Both 2013 and 2014
U.S. CS U.S. CE U.S. I Canadian
Departments 122 6 11 7
Full Profs. 2.3% 1.0% 3.1% 2.3%
Assoc. Profs. 2.0% 2.2% 2.7% 2.1%
Asst. Profs. 3.0% 1.2% 2.7% 3.0%
Non-ten-track teaching faculty 1.1% 6.3% 19.9% 3.1%
Research faculty -0.4% 6.9% -0.2%
Post doctorates -2.8% 8.2% -2.6%
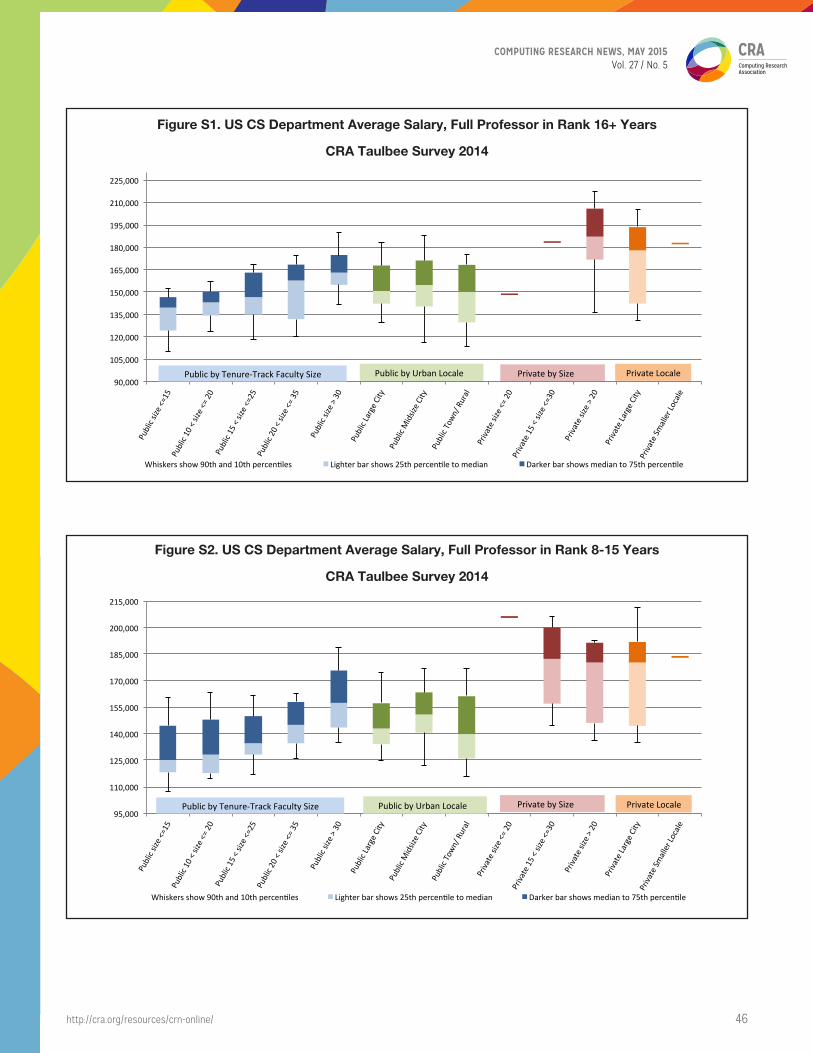
COMPUTING RESEARCH NEWS, MAY 2015Vol. 27 / No. 5
http://cra.org/resources/crn-online/ 46
Figure S1. US CS Department Average Salary, Full Professor in Rank 16+ Years
CRA Taulbee Survey 2014
Figure S2. US CS Department Average Salary, Full Professor in Rank 8-15 Years
CRA Taulbee Survey 2014
90,000
105,000
120,000
135,000
150,000
165,000
180,000
195,000
210,000
225,000
Public size <
=15
Public 10 < size <
= 20
Public 15 < size <
=25
Public 20 < size <
= 35
Public size >
30
Public Large C
ity
Public Midsize C
ity
Public Town
/ Rural
Private size <=
20
Private 15 < size <=
30
Private size > 20
Private Large C
ity
Private Sm
aller Locale
Figure S1. US CS Department Average Salary, Full Professor in Rank 16+ Years CRA Taulbee Survey 2014
Whiskers show 90th and 10th percenMles Lighter bar shows 25th percenMle to median Darker bar shows median to 75th percenMle
Public by Tenure-‐Track Faculty Size Public by Urban Locale Private by Size Private Locale
95,000
110,000
125,000
140,000
155,000
170,000
185,000
200,000
215,000
Public size <
=15
Public 10 < size <
= 20
Public 15 < size <
=25
Public 20 < size <
= 35
Public size >
30
Public Large C
ity
Public Midsize C
ity
Public Town
/ Rural
Private size <=
20
Private 15 < size <=
30
Private size > 20
Private Large C
ity
Private Sm
aller Locale
Figure S2. US CS Department Average Salary, Full Professor in Rank 8-‐15 Years CRA Taulbee Survey 2014
Whiskers show 90th and 10th percenNles Lighter bar shows 25th percenNle to median Darker bar shows median to 75th percenNle
Public by Tenure-‐Track Faculty Size Public by Urban Locale Private by Size Private Locale
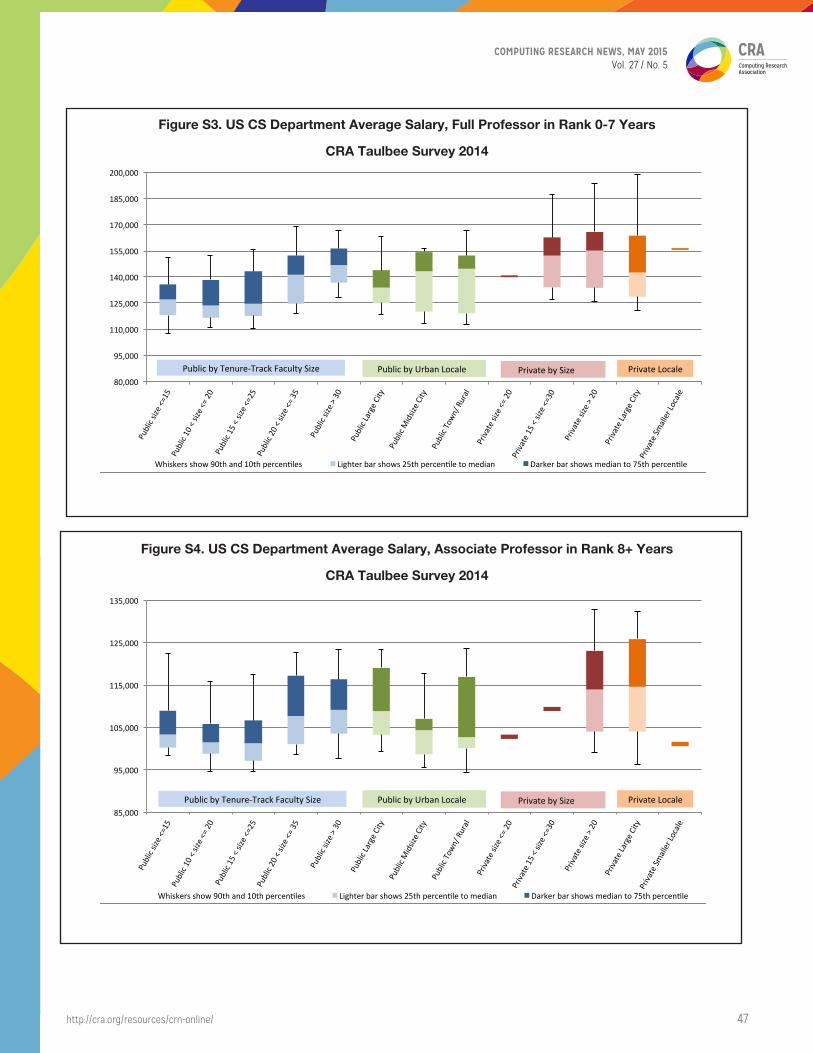
COMPUTING RESEARCH NEWS, MAY 2015Vol. 27 / No. 5
http://cra.org/resources/crn-online/ 47
Figure S3. US CS Department Average Salary, Full Professor in Rank 0-7 Years
CRA Taulbee Survey 2014
Figure S4. US CS Department Average Salary, Associate Professor in Rank 8+ Years
CRA Taulbee Survey 2014
80,000
95,000
110,000
125,000
140,000
155,000
170,000
185,000
200,000
Public size <
=15
Public 10 < size <
= 20
Public 15 < size <
=25
Public 20 < size <
= 35
Public size >
30
Public Large C
ity
Public Midsize C
ity
Public Town
/ Rural
Private size <=
20
Private 15 < size <=
30
Private size > 20
Private Large C
ity
Private Sm
aller Locale
Figure S3. US CS Department Average Salary, Full Professor in Rank 0-‐7 Years CRA Taulbee Survey 2014
Whiskers show 90th and 10th percenNles Lighter bar shows 25th percenNle to median Darker bar shows median to 75th percenNle
Public by Tenure-‐Track Faculty Size Public by Urban Locale Private by Size Private Locale
85,000
95,000
105,000
115,000
125,000
135,000
Public size <
=15
Public 10 < size <
= 20
Public 15 < size <
=25
Public 20 < size <
= 35
Public size >
30
Public Large C
ity
Public Midsize C
ity
Public Town
/ Rural
Private size <=
20
Private 15 < size <=
30
Private size > 20
Private Large C
ity
Private Sm
aller Locale
Figure S4. US CS Department Average Salary, Associate Professor in Rank 8+ Years CRA Taulbee Survey 2014
Whiskers show 90th and 10th percenLles Lighter bar shows 25th percenLle to median Darker bar shows median to 75th percenLle
Public by Tenure-‐Track Faculty Size Public by Urban Locale Private by Size Private Locale
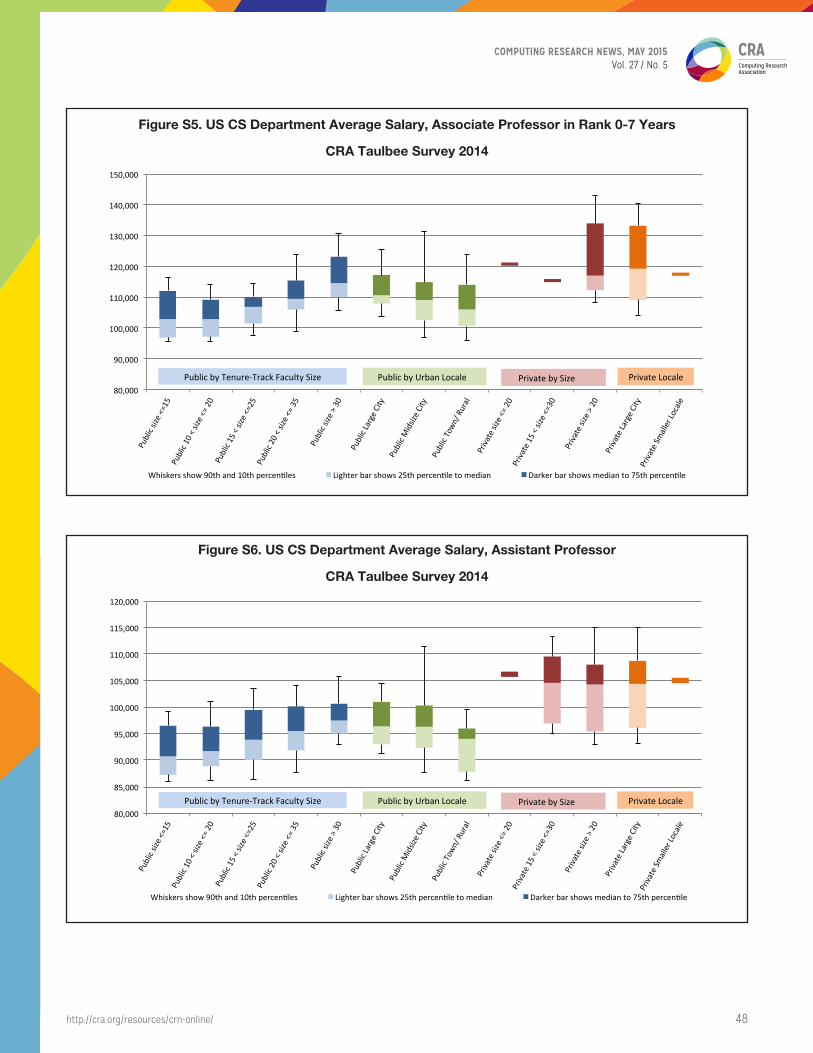
COMPUTING RESEARCH NEWS, MAY 2015Vol. 27 / No. 5
http://cra.org/resources/crn-online/ 48
Figure S5. US CS Department Average Salary, Associate Professor in Rank 0-7 Years
CRA Taulbee Survey 2014
Figure S6. US CS Department Average Salary, Assistant Professor
CRA Taulbee Survey 2014
80,000
90,000
100,000
110,000
120,000
130,000
140,000
150,000
Public size <
=15
Public 10 < size <
= 20
Public 15 < size <
=25
Public 20 < size <
= 35
Public size >
30
Public Large C
ity
Public Midsize C
ity
Public Town
/ Rural
Private size <=
20
Private 15 < size <=
30
Private size > 20
Private Large C
ity
Private Sm
aller Locale
Figure S5. US CS Department Average Salary, Associate Professor in Rank 0-‐7 Years CRA Taulbee Survey 2014
Whiskers show 90th and 10th percenMles Lighter bar shows 25th percenMle to median Darker bar shows median to 75th percenMle
Public by Tenure-‐Track Faculty Size Public by Urban Locale Private by Size Private Locale
80,000
85,000
90,000
95,000
100,000
105,000
110,000
115,000
120,000
Public size <
=15
Public 10 < size <
= 20
Public 15 < size <
=25
Public 20 < size <
= 35
Public size >
30
Public Large C
ity
Public Midsize C
ity
Public Town
/ Rural
Private size <=
20
Private 15 < size <=
30
Private size > 20
Private Large C
ity
Private Sm
aller Locale
Figure S6. US CS Department Average Salary, Assistant Professor CRA Taulbee Survey 2014
Whiskers show 90th and 10th percenLles Lighter bar shows 25th percenLle to median Darker bar shows median to 75th percenLle
Public by Tenure-‐Track Faculty Size Public by Urban Locale Private by Size Private Locale
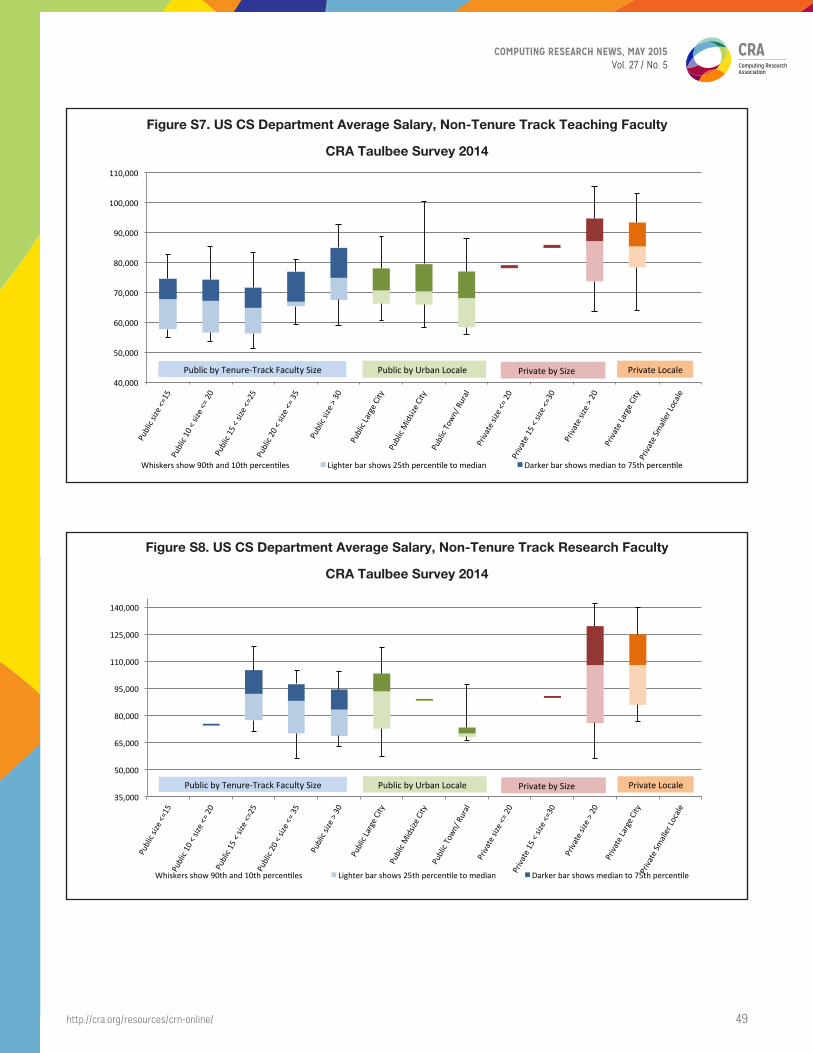
COMPUTING RESEARCH NEWS, MAY 2015Vol. 27 / No. 5
http://cra.org/resources/crn-online/ 49
Figure S7. US CS Department Average Salary, Non-Tenure Track Teaching Faculty
CRA Taulbee Survey 2014
Figure S8. US CS Department Average Salary, Non-Tenure Track Research Faculty
CRA Taulbee Survey 2014
40,000
50,000
60,000
70,000
80,000
90,000
100,000
110,000
Public size <
=15
Public 10 < size <
= 20
Public 15 < size <
=25
Public 20 < size <
= 35
Public size >
30
Public Large C
ity
Public Midsize C
ity
Public Town
/ Rural
Private size <=
20
Private 15 < size <=
30
Private size > 20
Private Large C
ity
Private Sm
aller Locale
Figure S7. US CS Department Average Salary, Non-‐Tenure Track Teaching Faculty CRA Taulbee Survey 2014
Whiskers show 90th and 10th percenOles Lighter bar shows 25th percenOle to median Darker bar shows median to 75th percenOle
Public by Tenure-‐Track Faculty Size Public by Urban Locale Private by Size Private Locale
35,000
50,000
65,000
80,000
95,000
110,000
125,000
140,000
Public size <
=15
Public 10 < size <
= 20
Public 15 < size <
=25
Public 20 < size <
= 35
Public size >
30
Public Large C
ity
Public Midsize C
ity
Public Town
/ Rural
Private size <=
20
Private 15 < size <=
30
Private size > 20
Private Large C
ity
Private Sm
aller Locale
Figure S8. US CS Department Average Salary, Non-‐Tenure Track Research Faculty CRA Taulbee Survey 2014
Whiskers show 90th and 10th percenNles Lighter bar shows 25th percenNle to median Darker bar shows median to 75th percenNle
Public by Tenure-‐Track Faculty Size Public by Urban Locale Private by Size Private Locale
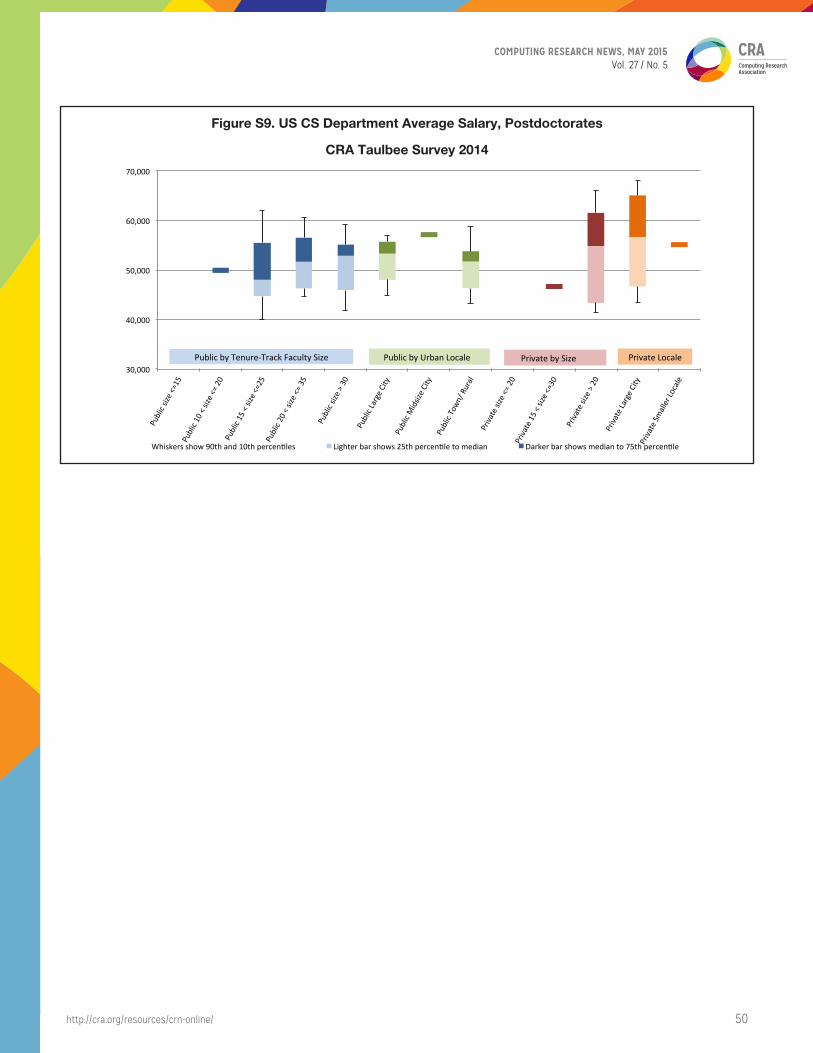
COMPUTING RESEARCH NEWS, MAY 2015Vol. 27 / No. 5
http://cra.org/resources/crn-online/ 50
Figure S9. US CS Department Average Salary, Postdoctorates
CRA Taulbee Survey 2014
30,000
40,000
50,000
60,000
70,000
Public size <
=15
Public 10 < size <
= 20
Public 15 < size <
=25
Public 20 < size <
= 35
Public size >
30
Public Large C
ity
Public Midsize C
ity
Public Town
/ Rural
Private size <=
20
Private 15 < size <=
30
Private size > 20
Private Large C
ity
Private Sm
aller Locale
Figure S9. US CS Department Average Salary, Postdoctorates CRA Taulbee Survey 2014
Whiskers show 90th and 10th percenNles Lighter bar shows 25th percenNle to median Darker bar shows median to 75th percenNle
Public by Tenure-‐Track Faculty Size Public by Urban Locale Private by Size Private Locale
COMPUTING RESEARCH NEWS, MAY 2015Vol. 27 / No. 5
http://cra.org/resources/crn-online/ 51
Concluding Observations
There is seemingly relentless teaching pressure on academic
computing departments from the undergraduate demand.
Yet, for the fourth time in five years, the fraction of doctoral
graduates who took tenure-track positions at doctoral-granting
departments declined. Industry continues to employ majority
of doctoral graduates, with most of those going to industry
taking research positions where the nature of their industry
position is known. The struggles that academic departments
face in coping with the increased demand remind us of the
high growth eras in the 80s and 90s.
Participating Departments
US CS Public (103): Arizona State, Auburn, Clemson, College
of William & Mary, Colorado School of Mines, Colorado State,
Florida International, Florida State, George Mason, Georgia
Tech, Georgia State, Indiana, Iowa State, Kansas State, Kent
State, Louisiana State, Michigan State, Michigan Technological
University, Mississippi State, Missouri Science & Technology,
Montana State, Naval Postgraduate School, New Jersey
Institute of Technology, New Mexico State, North Carolina
State, North Dakota State, Ohio State, Ohio, Oklahoma State,
Old Dominion, Oregon State, Pennsylvania State, Portland
State, Purdue, Rutgers, Stony Brook (SUNY), Temple, Texas A&M,
University at Albany, Universities of: Alabama (Birmingham
and Tuscaloosa), Arizona, Arkansas, Arkansas at Little Rock,
California (Berkeley, Davis, Irvine, Los Angeles, Riverside, San
Diego, Santa Barbara, and Santa Cruz), Central Florida, Colorado
(Boulder), Connecticut, Delaware, Florida, Georgia, Hawaii,
Houston, Idaho, Illinois (Chicago and Urbana Champaign), Iowa,
Kansas, Kentucky, Louisiana at Lafayette, Maryland (College
Park and Baltimore County), Massachusetts (Amherst and
Boston), Michigan, Minnesota, Mississippi, Missouri (Columbia),
Nebraska (Omaha and Lincoln), Nevada (Reno), New Hampshire,
North Carolina (Chapel Hill and Charlotte), North Dakota, North
Texas, Oklahoma, Oregon, Pittsburgh, Rhode Island, South
Carolina, South Florida, Tennessee (Knoxville), Texas (Austin,
Dallas, and El Paso), Utah, Vermont, Virginia, Washington,
Wisconsin (Madison), Wyoming, Virginia Tech, Washington State,
Western Michigan, and Wright State.
US CS Private (34): Boston University, Brown, Carnegie
Mellon, Case Western Reserve, Columbia, Cornell, DePaul,
Drexel, Duke, Florida Institute of Technology, Harvard, Illinois
Institute of Technology, Johns Hopkins, Lehigh, MIT, New York
University, Northeastern, Pace, Princeton, Rensselaer, Rice,
Rochester Institute of Technology, Stanford, Stevens Institute
of Technology, Toyota Technological Institute at Chicago, Tufts,
Universities of: Chicago, Pennsylvania, Rochester, Southern
California, and Tulsa, Washington in St. Louis, Worcester
Polytechnic Institute, and Yale.
US CE (10): Florida Institute of Technology, Iowa State, North
Carolina State, Princeton, Purdue, Santa Clara, Universities of:
California (Santa Cruz), Illinois (Urbana Champaign), New Mexico,
and Southern California, and Virginia Tech.
US Information (15): Cornell, Drexel, Florida State, Indiana,
Penn State, Syracuse, University at Albany (SUNY), Universities
of: California (Berkeley and Santa Cruz), Illinois (Urbana
Champaign), Maryland (Baltimore County), Michigan, North
Carolina (Chapel Hill), Pittsburgh, and Washington.
Canadian (11): Concordia, McGill, Simon Fraser, Universities of:
British Columbia, Calgary, Manitoba, New Brunswick, Toronto,
Victoria, Waterloo, and Western Ontario.
1The title of the survey honors the late Orrin E. Taulbee of the University of Pittsburgh, who conducted these surveys for the Computer Science Board until 1984, with retrospective annual data going back to 1970.
2Information (I) programs included here are Information Science, Information Systems, Information Technology, Informatics, and related disciplines with a strong computing component. Surveys were sent to CRA members, the CRA Deans group members, and participants in the iSchools Caucus (www.ischools.org) who met the criteria of granting Ph.D.s and being located in North America. Other I-programs who meet these criteria and would like to participate in the survey in future years are invited to contact [email protected] for inclusion.
3Classification of the population of an institution’s locale is in accordance with the Carnegie Classification database. Large cities are those with population >= 250,000. Mid-size cities have population between 100,000 and 250,000. Town/rural populations are less than 100,000.
4All faculty tables: The survey makes no distinction between faculty specializing in CS vs. CE programs. Every effort is made to minimize the inclusion of faculty in electrical engineering who are not computer engineers.