Embed Size (px)
Citation preview
NCDPI/ODSS/AS/LM/September 1, 2015 1
2014–15 Performance and Growth of North Carolina Public Schools
Executive Summary (September 2, 2015)
Statistical Summary of Results
This report provides growth and performance data for the 2014–15 school year based on analysis of all end-of-grade (EOG) tests and end-of-course (EOC) tests, which are aligned to the North Carolina Standard Course of Study in English Language Arts/Reading and Mathematics and the Essential Standards in Science, for all public schools and public charter schools. The following data are presented:
1. Growth: Reporting if schools exceeded, met, or did not meet growth expectations as defined and calculated in EVAAS
2. Performance: Reporting how schools performed on assessments, high school indicators, and School Performance Grades
3. Progress: Reporting if schools met or did not meet performance and participation targets set for each of the Annual Measurable Objectives (AMO)
Schools not included in the report may not have any tested grades or may have a transient or very small student population. Typically these schools are K–2 schools, special education schools, vocational/career schools, and hospital schools. Section I. Growth Results For the 2014–15 school year, school accountability growth results are presented for 2,496 of the 2,535 public schools that participated in the statewide testing program. Using all EOG and EOC test scores, school accountability growth is calculated using EVAAS, a value-added growth tool. Each school with the required data is designated as having exceeded growth, met growth, or not meet growth. The results for school accountability growth are shown in Table 1. Table 1. 2014–15 School Accountability Growth
Growth Category Number Percent Exceeded Expected Growth 689 27.6% Met Expected Growth 1,116 44.7% Did Not Meet Growth 691 27.7%
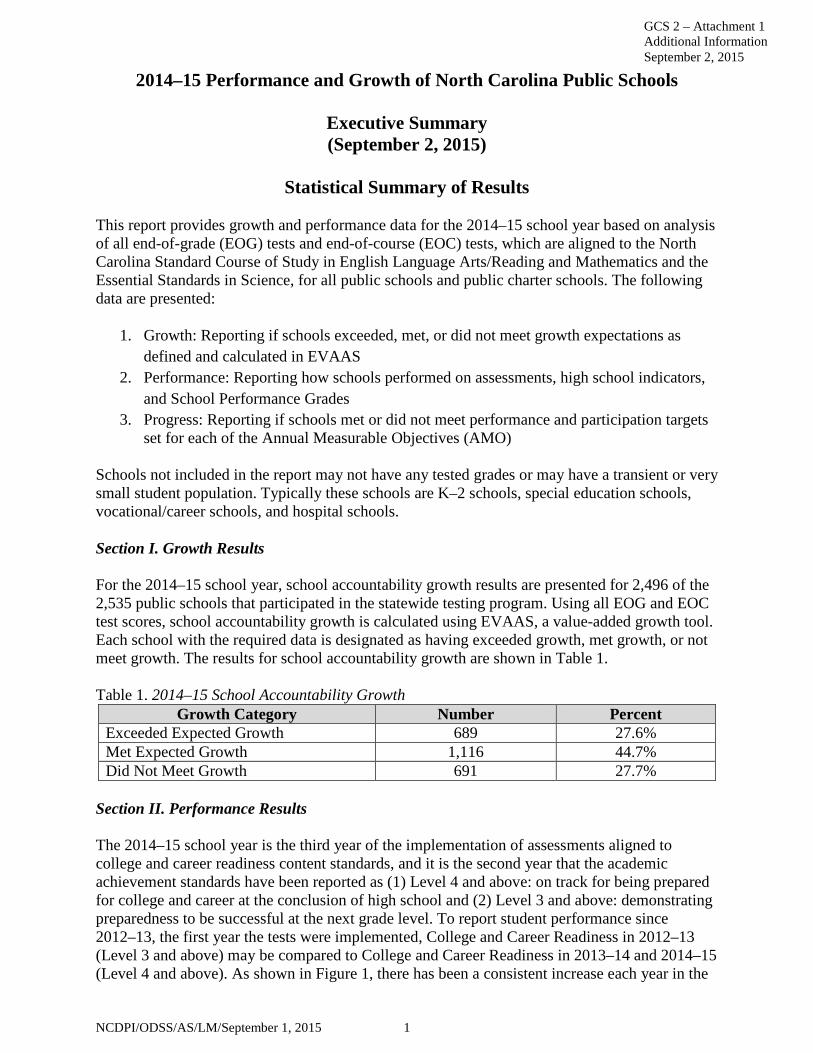
Section II. Performance Results The 2014–15 school year is the third year of the implementation of assessments aligned to college and career readiness content standards, and it is the second year that the academic achievement standards have been reported as (1) Level 4 and above: on track for being prepared for college and career at the conclusion of high school and (2) Level 3 and above: demonstrating preparedness to be successful at the next grade level. To report student performance since 2012–13, the first year the tests were implemented, College and Career Readiness in 2012–13 (Level 3 and above) may be compared to College and Career Readiness in 2013–14 and 2014–15 (Level 4 and above). As shown in Figure 1, there has been a consistent increase each year in the
GCS 2 – Attachment 1 Additional Information September 2, 2015
NCDPI/ODSS/AS/LM/September 1, 2015 2
percent of students demonstrating college and career readiness on the reading and mathematics tests for grades 3–8.
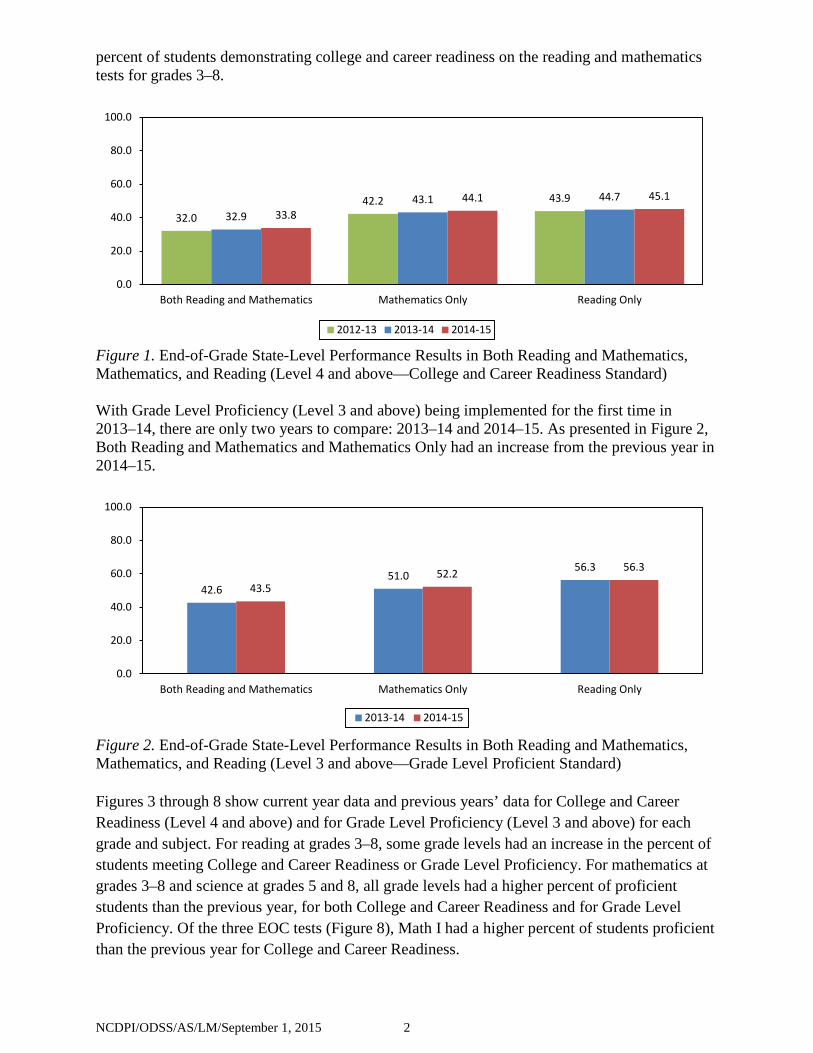
Figure 1. End-of-Grade State-Level Performance Results in Both Reading and Mathematics, Mathematics, and Reading (Level 4 and above—College and Career Readiness Standard) With Grade Level Proficiency (Level 3 and above) being implemented for the first time in 2013–14, there are only two years to compare: 2013–14 and 2014–15. As presented in Figure 2, Both Reading and Mathematics and Mathematics Only had an increase from the previous year in 2014–15.
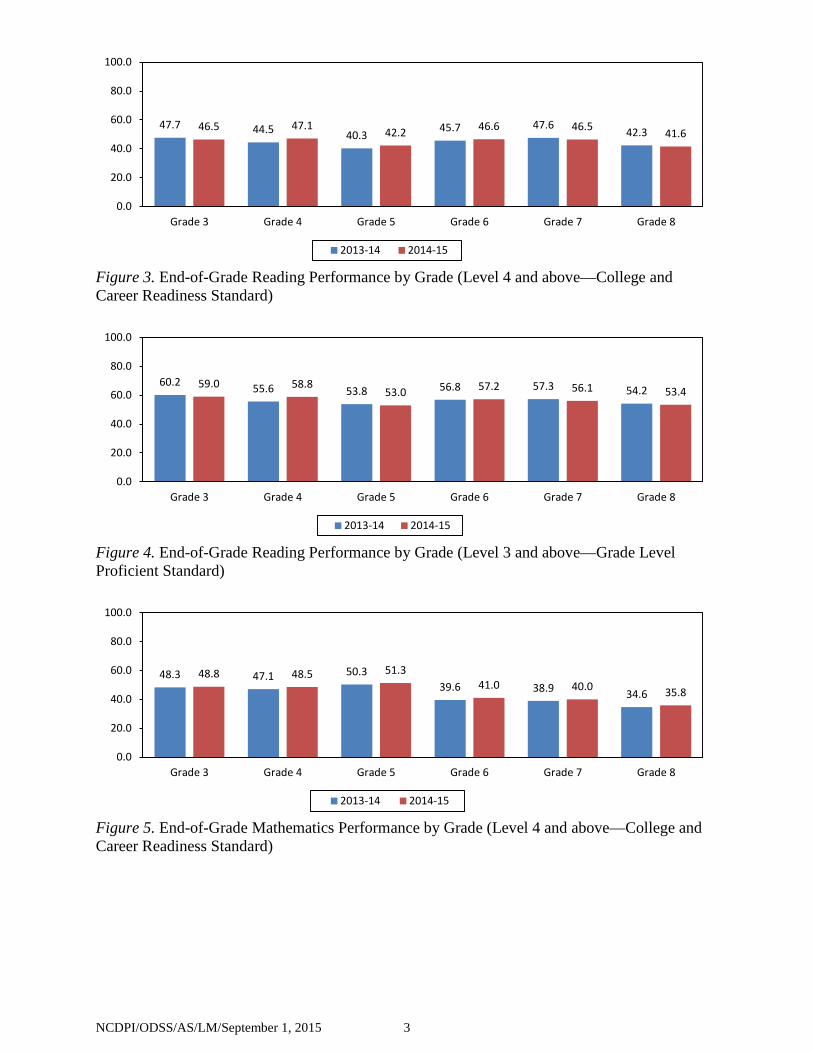
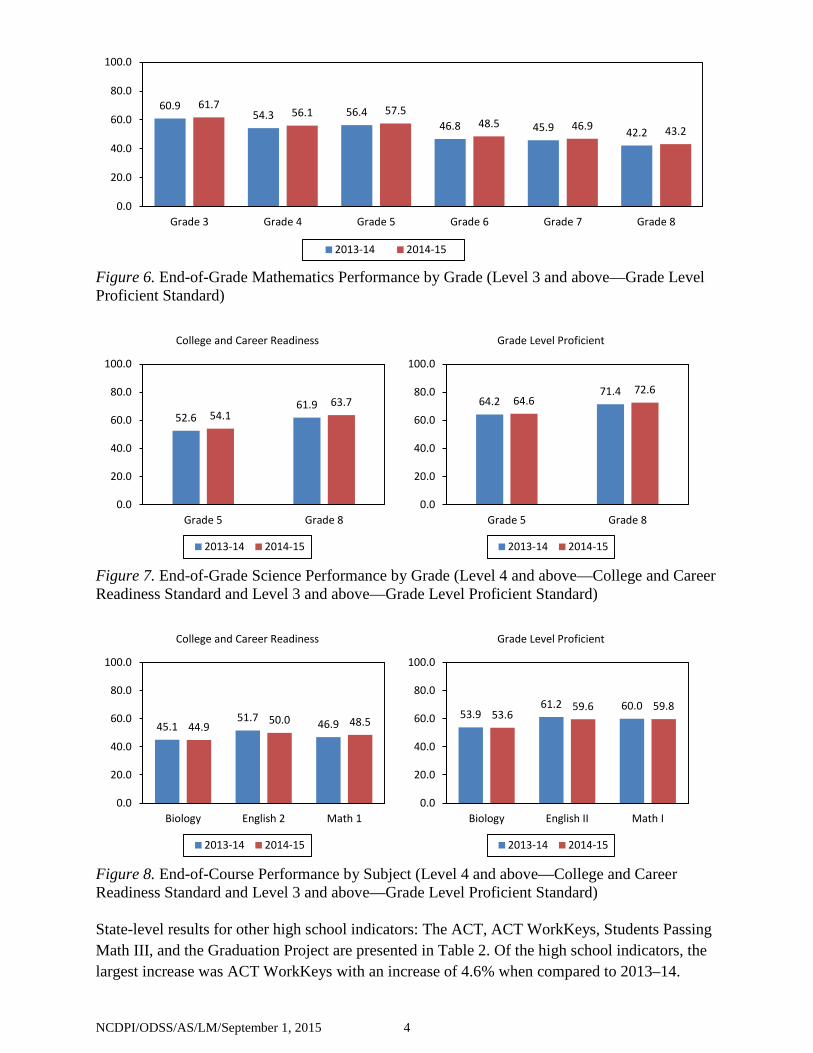
Figure 2. End-of-Grade State-Level Performance Results in Both Reading and Mathematics, Mathematics, and Reading (Level 3 and above—Grade Level Proficient Standard) Figures 3 through 8 show current year data and previous years’ data for College and Career Readiness (Level 4 and above) and for Grade Level Proficiency (Level 3 and above) for each grade and subject. For reading at grades 3–8, some grade levels had an increase in the percent of students meeting College and Career Readiness or Grade Level Proficiency. For mathematics at grades 3–8 and science at grades 5 and 8, all grade levels had a higher percent of proficient students than the previous year, for both College and Career Readiness and for Grade Level Proficiency. Of the three EOC tests (Figure 8), Math I had a higher percent of students proficient than the previous year for College and Career Readiness.
32.0 42.2 43.9
32.9 43.1 44.7
33.8 44.1 45.1
0.0
20.0
40.0
60.0
80.0
100.0
Both Reading and Mathematics Mathematics Only Reading Only
2012-13 2013-14 2014-15
42.6 51.0
56.3
43.5 52.2 56.3
0.0
20.0
40.0
60.0
80.0
100.0
Both Reading and Mathematics Mathematics Only Reading Only
2013-14 2014-15
NCDPI/ODSS/AS/LM/September 1, 2015 3
Figure 3. End-of-Grade Reading Performance by Grade (Level 4 and above—College and Career Readiness Standard)
Figure 4. End-of-Grade Reading Performance by Grade (Level 3 and above—Grade Level Proficient Standard)
Figure 5. End-of-Grade Mathematics Performance by Grade (Level 4 and above—College and Career Readiness Standard)
47.7 44.5 40.3 45.7 47.6
42.3 46.5 47.1 42.2 46.6 46.5 41.6
0.0
20.0
40.0
60.0
80.0
100.0
Grade 3 Grade 4 Grade 5 Grade 6 Grade 7 Grade 8
2013-14 2014-15
60.2 55.6 53.8 56.8 57.3 54.2 59.0 58.8 53.0 57.2 56.1 53.4
0.0
20.0
40.0
60.0
80.0
100.0
Grade 3 Grade 4 Grade 5 Grade 6 Grade 7 Grade 8
2013-14 2014-15
48.3 47.1 50.3 39.6 38.9 34.6
48.8 48.5 51.3 41.0 40.0 35.8
0.0
20.0
40.0
60.0
80.0
100.0
Grade 3 Grade 4 Grade 5 Grade 6 Grade 7 Grade 8
2013-14 2014-15
NCDPI/ODSS/AS/LM/September 1, 2015 4
Figure 6. End-of-Grade Mathematics Performance by Grade (Level 3 and above—Grade Level Proficient Standard)
Figure 7. End-of-Grade Science Performance by Grade (Level 4 and above—College and Career Readiness Standard and Level 3 and above—Grade Level Proficient Standard)
Figure 8. End-of-Course Performance by Subject (Level 4 and above—College and Career Readiness Standard and Level 3 and above—Grade Level Proficient Standard) State-level results for other high school indicators: The ACT, ACT WorkKeys, Students Passing Math III, and the Graduation Project are presented in Table 2. Of the high school indicators, the largest increase was ACT WorkKeys with an increase of 4.6% when compared to 2013–14.
60.9 54.3 56.4
46.8 45.9 42.2
61.7 56.1 57.5
48.5 46.9 43.2
0.0
20.0
40.0
60.0
80.0
100.0
Grade 3 Grade 4 Grade 5 Grade 6 Grade 7 Grade 8
2013-14 2014-15
52.6 61.9
54.1 63.7
0.0
20.0
40.0
60.0
80.0
100.0
Grade 5 Grade 8
College and Career Readiness
2013-14 2014-15
64.2 71.4
64.6 72.6
0.0
20.0
40.0
60.0
80.0
100.0
Grade 5 Grade 8
Grade Level Proficient
2013-14 2014-15
45.1 51.7 46.9 44.9 50.0 48.5
0.0
20.0
40.0
60.0
80.0
100.0
Biology English 2 Math 1
College and Career Readiness
2013-14 2014-15
53.9 61.2 60.0
53.6 59.6 59.8
0.0
20.0
40.0
60.0
80.0
100.0
Biology English II Math I
Grade Level Proficient
2013-14 2014-15
NCDPI/ODSS/AS/LM/September 1, 2015 5
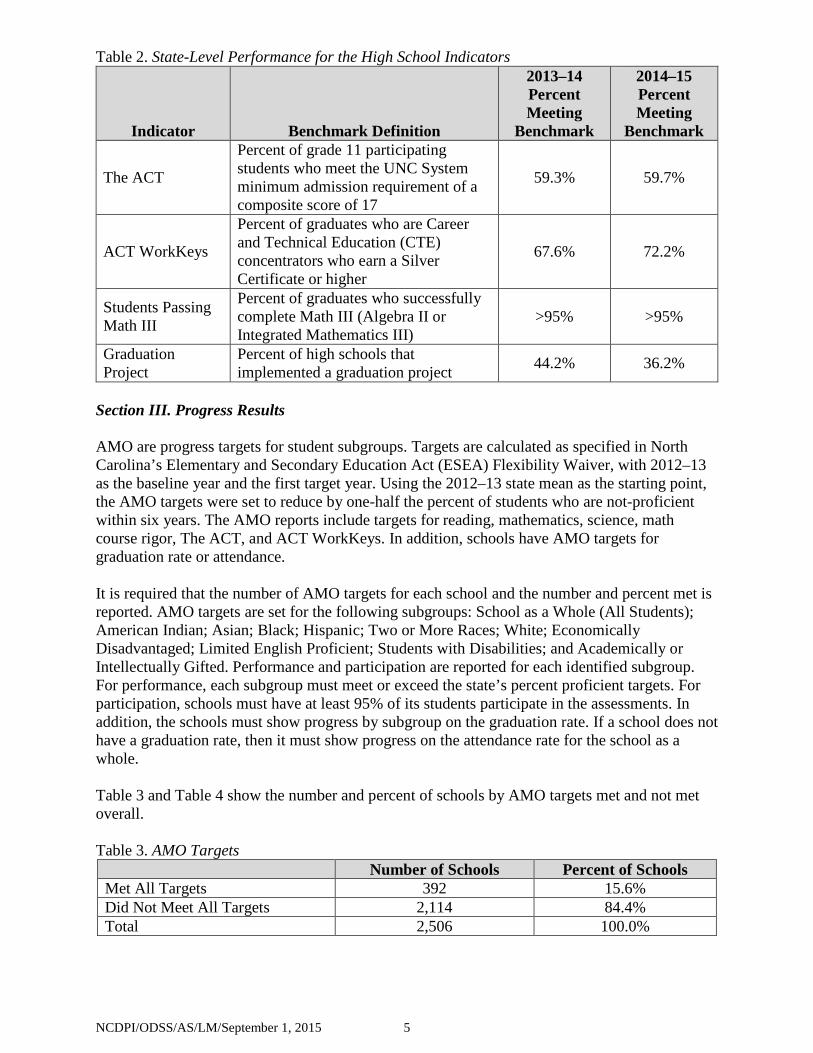
Table 2. State-Level Performance for the High School Indicators
Indicator Benchmark Definition
2013–14 Percent Meeting
Benchmark
2014–15 Percent Meeting
Benchmark
The ACT
Percent of grade 11 participating students who meet the UNC System minimum admission requirement of a composite score of 17
59.3% 59.7%
ACT WorkKeys
Percent of graduates who are Career and Technical Education (CTE) concentrators who earn a Silver Certificate or higher
67.6% 72.2%
Students Passing Math III
Percent of graduates who successfully complete Math III (Algebra II or Integrated Mathematics III)
>95% >95%
Graduation Project
Percent of high schools that implemented a graduation project 44.2% 36.2%
Section III. Progress Results AMO are progress targets for student subgroups. Targets are calculated as specified in North Carolina’s Elementary and Secondary Education Act (ESEA) Flexibility Waiver, with 2012–13 as the baseline year and the first target year. Using the 2012–13 state mean as the starting point, the AMO targets were set to reduce by one-half the percent of students who are not-proficient within six years. The AMO reports include targets for reading, mathematics, science, math course rigor, The ACT, and ACT WorkKeys. In addition, schools have AMO targets for graduation rate or attendance. It is required that the number of AMO targets for each school and the number and percent met is reported. AMO targets are set for the following subgroups: School as a Whole (All Students); American Indian; Asian; Black; Hispanic; Two or More Races; White; Economically Disadvantaged; Limited English Proficient; Students with Disabilities; and Academically or Intellectually Gifted. Performance and participation are reported for each identified subgroup. For performance, each subgroup must meet or exceed the state’s percent proficient targets. For participation, schools must have at least 95% of its students participate in the assessments. In addition, the schools must show progress by subgroup on the graduation rate. If a school does not have a graduation rate, then it must show progress on the attendance rate for the school as a whole. Table 3 and Table 4 show the number and percent of schools by AMO targets met and not met overall. Table 3. AMO Targets
Number of Schools Percent of Schools Met All Targets 392 15.6% Did Not Meet All Targets 2,114 84.4% Total 2,506 100.0%
NCDPI/ODSS/AS/LM/September 1, 2015 6
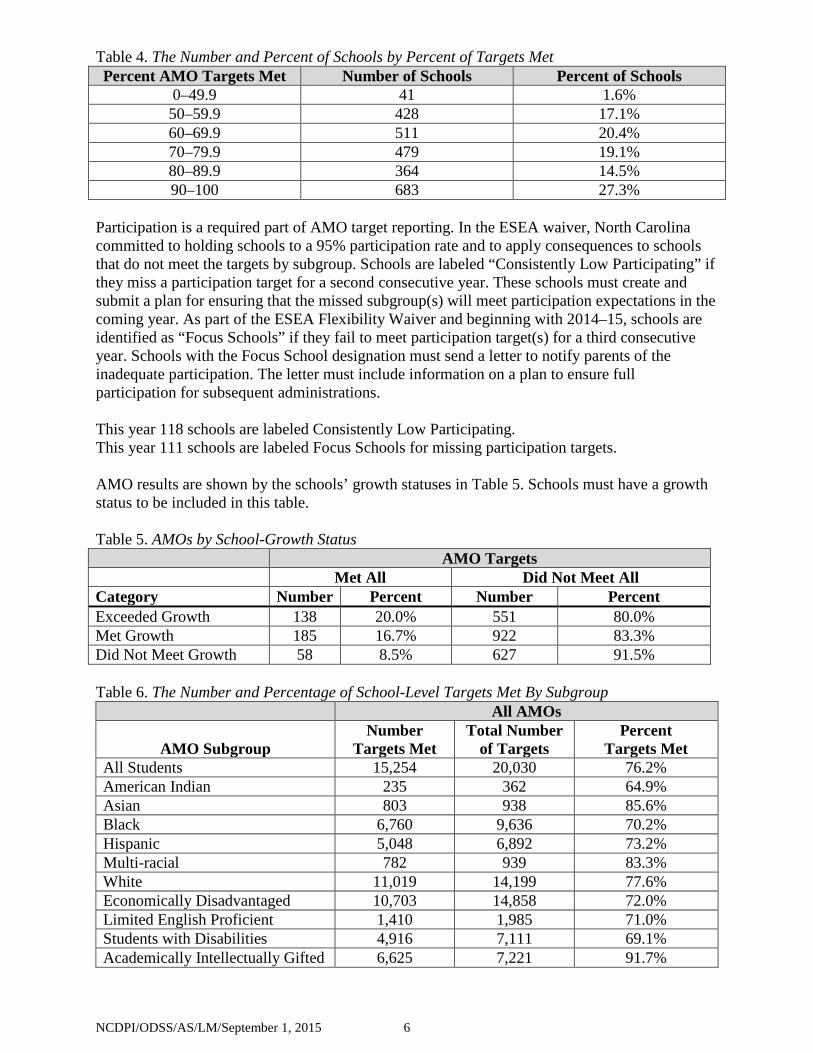
Table 4. The Number and Percent of Schools by Percent of Targets Met Percent AMO Targets Met Number of Schools Percent of Schools
0–49.9 41 1.6% 50–59.9 428 17.1% 60–69.9 511 20.4% 70–79.9 479 19.1% 80–89.9 364 14.5% 90–100 683 27.3%
Participation is a required part of AMO target reporting. In the ESEA waiver, North Carolina committed to holding schools to a 95% participation rate and to apply consequences to schools that do not meet the targets by subgroup. Schools are labeled “Consistently Low Participating” if they miss a participation target for a second consecutive year. These schools must create and submit a plan for ensuring that the missed subgroup(s) will meet participation expectations in the coming year. As part of the ESEA Flexibility Waiver and beginning with 2014–15, schools are identified as “Focus Schools” if they fail to meet participation target(s) for a third consecutive year. Schools with the Focus School designation must send a letter to notify parents of the inadequate participation. The letter must include information on a plan to ensure full participation for subsequent administrations. This year 118 schools are labeled Consistently Low Participating. This year 111 schools are labeled Focus Schools for missing participation targets. AMO results are shown by the schools’ growth statuses in Table 5. Schools must have a growth status to be included in this table. Table 5. AMOs by School-Growth Status AMO Targets Met All Did Not Meet All Category Number Percent Number Percent Exceeded Growth 138 20.0% 551 80.0% Met Growth 185 16.7% 922 83.3% Did Not Meet Growth 58 8.5% 627 91.5% Table 6. The Number and Percentage of School-Level Targets Met By Subgroup
All AMOs
AMO Subgroup Number
Targets Met Total Number
of Targets Percent
Targets Met All Students 15,254 20,030 76.2% American Indian 235 362 64.9% Asian 803 938 85.6% Black 6,760 9,636 70.2% Hispanic 5,048 6,892 73.2% Multi-racial 782 939 83.3% White 11,019 14,199 77.6% Economically Disadvantaged 10,703 14,858 72.0% Limited English Proficient 1,410 1,985 71.0% Students with Disabilities 4,916 7,111 69.1% Academically Intellectually Gifted 6,625 7,221 91.7%
NCDPI/ODSS/AS/LM/September 1, 2015 7
Section IV. School Performance Grades (A–F) Beginning with the 2013–14 school year data, per legislation (G.S. §115C-83.15) passed during the 2013 long session of the North Carolina General Assembly, School Performance Grades (A–F) based on test scores, and high schools’ additional indicators that measure college and career readiness, are reported for schools in North Carolina. The School Performance Grades are based on student achievement (80%) and growth (20%). The indicators and the proficiency standard or benchmark used for achievement include:
1. Annual EOG mathematics and reading assessments in grades 3–8 and science assessments in grades 5 and 8 (Level 3 and above)
2. Annual EOC assessments in Math I, Biology, and English II (Level 3 and above) 3. The percentage of graduates who complete Math III, Algebra II, or Integrated Math III
with a passing grade 4. The percentage of grade 11 students who achieve the minimum score required for
admission into a constituent institution of The University of North Carolina on The ACT (composite score of 17)
5. The percentage of graduates identified as Career and Technical Education concentrators who meet the Silver Certificate or higher on the ACT WorkKeys assessment
6. The percentage of students who graduate within four years of entering high school (Standard [4-Year] Cohort Graduation Rate)
The EVAAS model, which provides the growth measure, uses current and previous student test data to determine whether schools are maintaining or increasing student achievement from one year to the next. In the event that a school does not have a Growth Score, only the School Achievement Score is used to calculate the Performance Score. For the final Performance Score and Grade, if a school’s growth designation is Meets or Exceeds Expected Growth, but the inclusion of the school’s Growth Score reduces the school’s Performance Score and Grade, only the School Achievement Score may be used for the Performance Score and Grade. For 2014–15, there were eleven (11) schools that met this exception, and growth was not included in their final grade calculation. For 2014–15, the grade designations are set on a 15 point scale as follows:
A = 85–100 B = 70–84 C = 55–69 D = 40–54 F = 39 or Less Schools that earn an A designation and do not have significant achievement and/or graduation gaps are designated as an A+NG school. Significant achievement and graduation gaps are defined as in-school gaps that are above the three-year state average when averaging gaps in the previous year and at least one of the two prior years between the highest-achieving subgroup and lowest-achieving subgroup. Following is the state-level distribution of School Performance Grades, including the reading and mathematics grades for the K–8 schools and secondary analyses on growth, school type, poverty, and State Board of Education districts.
NCDPI/ODSS/AS/LM/September 1, 2015 8
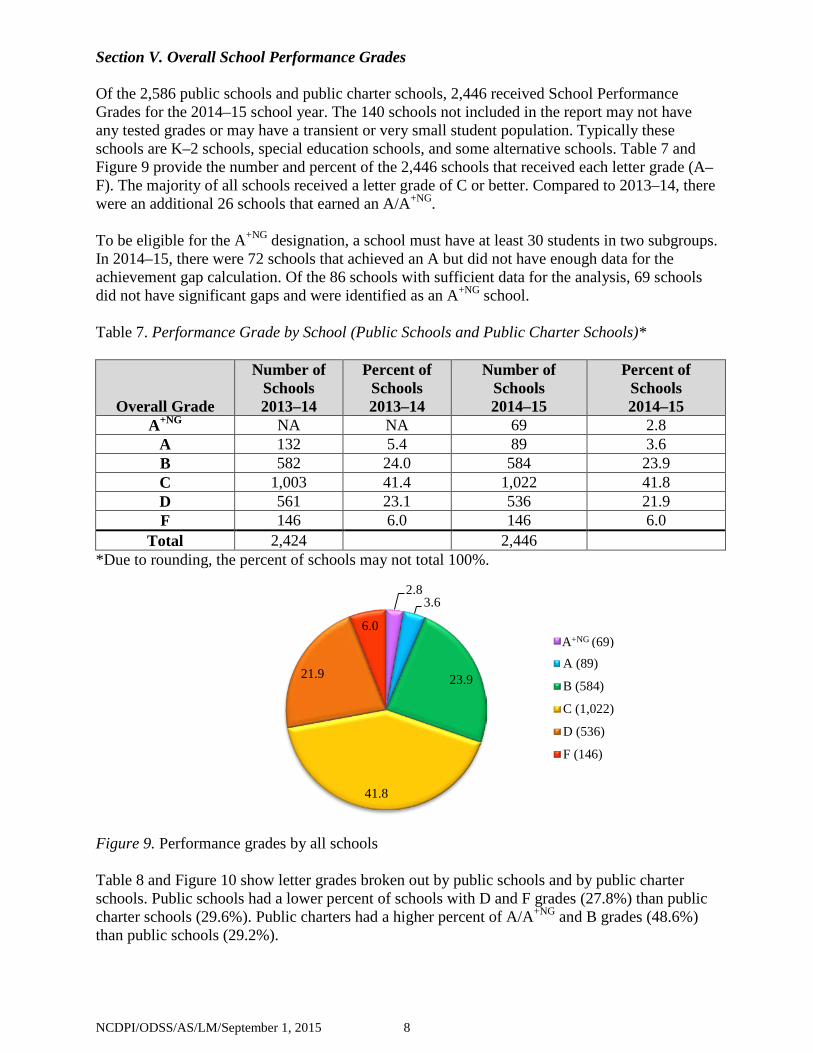
Section V. Overall School Performance Grades Of the 2,586 public schools and public charter schools, 2,446 received School Performance Grades for the 2014–15 school year. The 140 schools not included in the report may not have any tested grades or may have a transient or very small student population. Typically these schools are K–2 schools, special education schools, and some alternative schools. Table 7 and Figure 9 provide the number and percent of the 2,446 schools that received each letter grade (A–F). The majority of all schools received a letter grade of C or better. Compared to 2013–14, there were an additional 26 schools that earned an A/A+NG. To be eligible for the A+NG designation, a school must have at least 30 students in two subgroups. In 2014–15, there were 72 schools that achieved an A but did not have enough data for the achievement gap calculation. Of the 86 schools with sufficient data for the analysis, 69 schools did not have significant gaps and were identified as an A+NG school. Table 7. Performance Grade by School (Public Schools and Public Charter Schools)*
Overall Grade
Number of Schools 2013–14
Percent of Schools 2013–14
Number of Schools 2014–15
Percent of Schools 2014–15
A+NG NA NA 69 2.8 A 132 5.4 89 3.6 B 582 24.0 584 23.9 C 1,003 41.4 1,022 41.8 D 561 23.1 536 21.9 F 146 6.0 146 6.0
Total 2,424 2,446 *Due to rounding, the percent of schools may not total 100%.
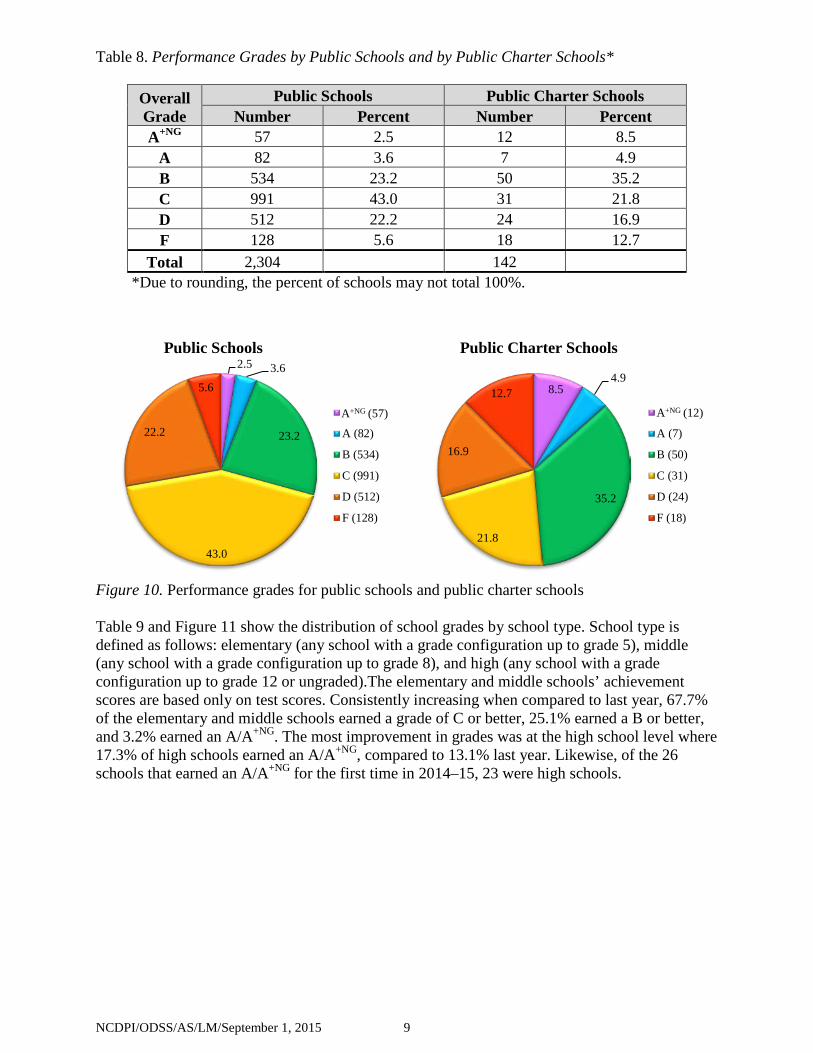
Figure 9. Performance grades by all schools Table 8 and Figure 10 show letter grades broken out by public schools and by public charter schools. Public schools had a lower percent of schools with D and F grades (27.8%) than public charter schools (29.6%). Public charters had a higher percent of A/A+NG and B grades (48.6%) than public schools (29.2%).
2.8 3.6
23.9
41.8
21.9
6.0
A (89)
B (584)
C (1,022)
D (536)
F (146)
A+NG (69)
NCDPI/ODSS/AS/LM/September 1, 2015 9
Table 8. Performance Grades by Public Schools and by Public Charter Schools*
Overall Grade
Public Schools Public Charter Schools Number Percent Number Percent
A+NG 57 2.5 12 8.5 A 82 3.6 7 4.9 B 534 23.2 50 35.2 C 991 43.0 31 21.8 D 512 22.2 24 16.9 F 128 5.6 18 12.7
Total 2,304
142 *Due to rounding, the percent of schools may not total 100%.
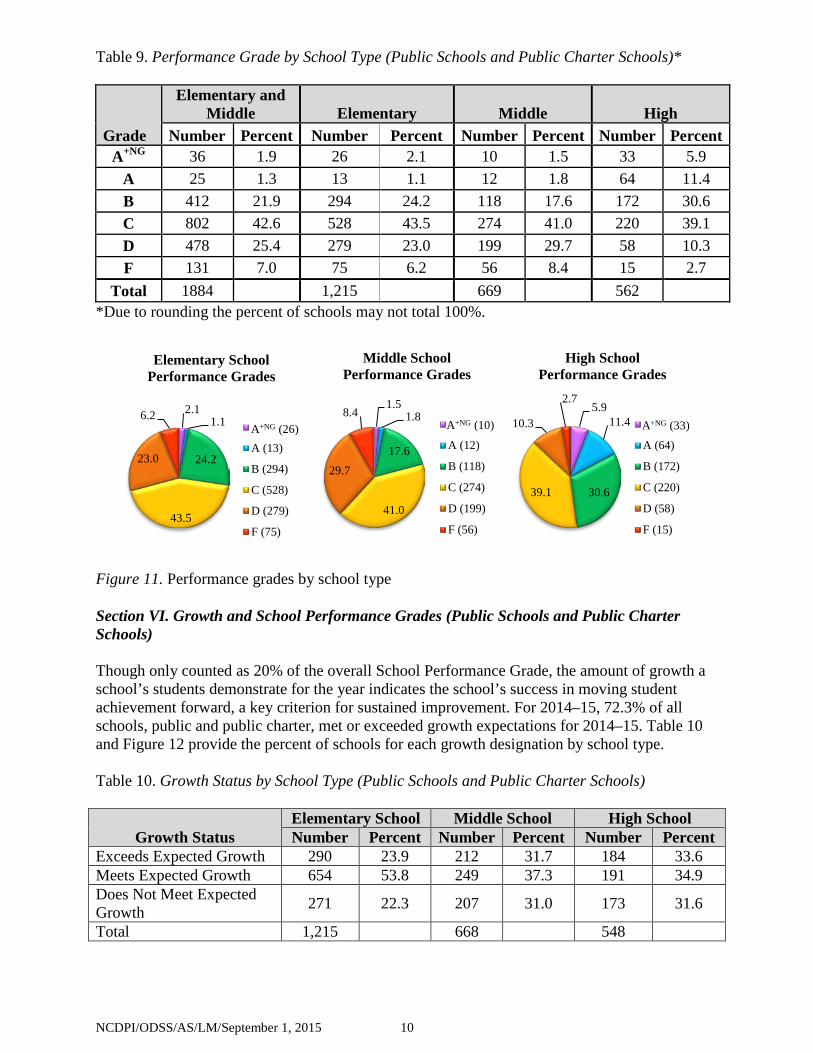
Figure 10. Performance grades for public schools and public charter schools Table 9 and Figure 11 show the distribution of school grades by school type. School type is defined as follows: elementary (any school with a grade configuration up to grade 5), middle (any school with a grade configuration up to grade 8), and high (any school with a grade configuration up to grade 12 or ungraded).The elementary and middle schools’ achievement scores are based only on test scores. Consistently increasing when compared to last year, 67.7% of the elementary and middle schools earned a grade of C or better, 25.1% earned a B or better, and 3.2% earned an A/A+NG. The most improvement in grades was at the high school level where 17.3% of high schools earned an A/A+NG, compared to 13.1% last year. Likewise, of the 26 schools that earned an A/A+NG for the first time in 2014–15, 23 were high schools.
2.5 3.6
23.2
43.0
22.2
5.6
Public Schools
A (82)
B (534)
C (991)
D (512)
F (128)
A+NG (57)
8.5 4.9
35.2
21.8
16.9
12.7
Public Charter Schools
A (7)
B (50)
C (31)
D (24)
F (18)
A+NG (12)
NCDPI/ODSS/AS/LM/September 1, 2015 10
Table 9. Performance Grade by School Type (Public Schools and Public Charter Schools)*
Grade
Elementary and Middle Elementary Middle High
Number Percent Number Percent Number Percent Number Percent A+NG 36 1.9 26 2.1 10 1.5 33 5.9
A 25 1.3 13 1.1 12 1.8 64 11.4 B 412 21.9 294 24.2 118 17.6 172 30.6 C 802 42.6 528 43.5 274 41.0 220 39.1 D 478 25.4 279 23.0 199 29.7 58 10.3 F 131 7.0 75 6.2 56 8.4 15 2.7
Total 1884 1,215 669 562 *Due to rounding the percent of schools may not total 100%.
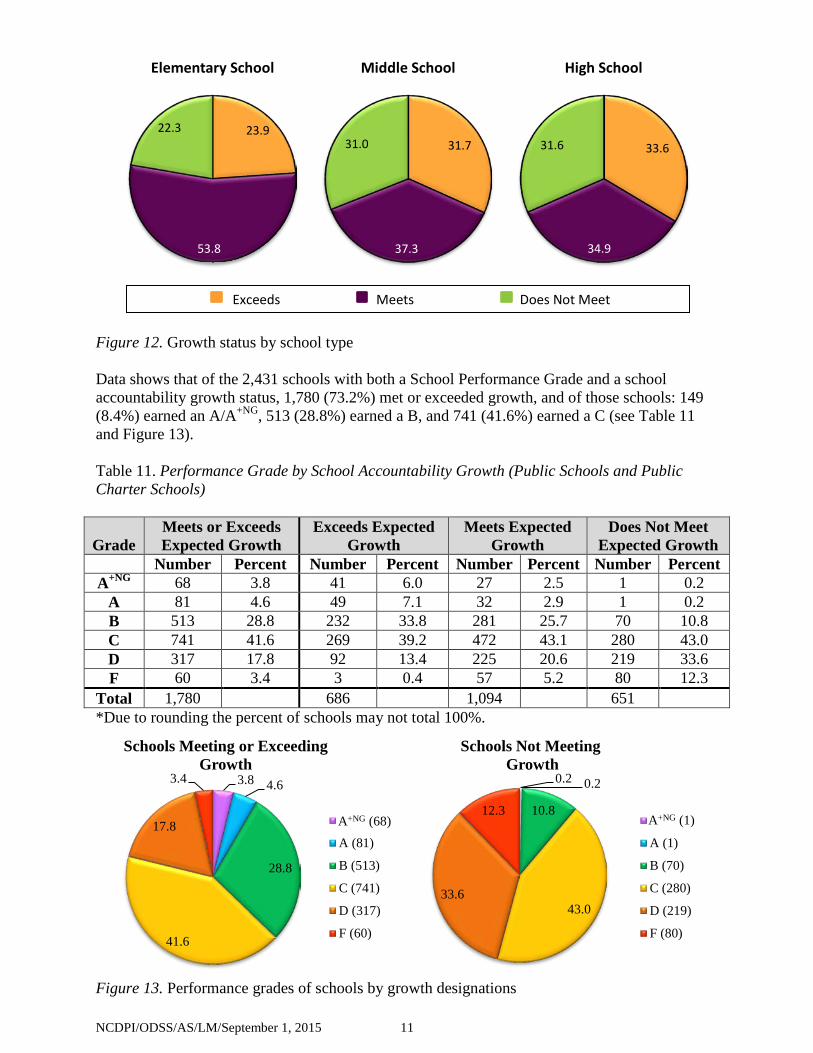
Figure 11. Performance grades by school type Section VI. Growth and School Performance Grades (Public Schools and Public Charter Schools) Though only counted as 20% of the overall School Performance Grade, the amount of growth a school’s students demonstrate for the year indicates the school’s success in moving student achievement forward, a key criterion for sustained improvement. For 2014–15, 72.3% of all schools, public and public charter, met or exceeded growth expectations for 2014–15. Table 10 and Figure 12 provide the percent of schools for each growth designation by school type. Table 10. Growth Status by School Type (Public Schools and Public Charter Schools)
Growth Status Elementary School Middle School High School Number Percent Number Percent Number Percent
Exceeds Expected Growth 290 23.9 212 31.7 184 33.6 Meets Expected Growth 654 53.8 249 37.3 191 34.9 Does Not Meet Expected Growth 271 22.3 207 31.0 173 31.6
Total 1,215 668 548
2.1 1.1
24.2
43.5
23.0
6.2
Elementary School Performance Grades
A (13)
B (294)
C (528)
D (279)
F (75)
A+NG (26)
1.5 1.8
17.6
41.0
29.7
8.4
Middle School Performance Grades
A (12)
B (118)
C (274)
D (199)
F (56)
A+NG (10) 5.9
11.4
30.6 39.1
10.3
2.7
High School Performance Grades
A (64)
B (172)
C (220)
D (58)
F (15)
A+NG (33)
NCDPI/ODSS/AS/LM/September 1, 2015 11
Figure 12. Growth status by school type Data shows that of the 2,431 schools with both a School Performance Grade and a school accountability growth status, 1,780 (73.2%) met or exceeded growth, and of those schools: 149 (8.4%) earned an A/A+NG, 513 (28.8%) earned a B, and 741 (41.6%) earned a C (see Table 11 and Figure 13). Table 11. Performance Grade by School Accountability Growth (Public Schools and Public Charter Schools)
Grade Meets or Exceeds Expected Growth
Exceeds Expected Growth
Meets Expected Growth
Does Not Meet Expected Growth
Number Percent Number Percent Number Percent Number Percent A+NG 68 3.8 41 6.0 27 2.5 1 0.2
A 81 4.6 49 7.1 32 2.9 1 0.2 B 513 28.8 232 33.8 281 25.7 70 10.8 C 741 41.6 269 39.2 472 43.1 280 43.0 D 317 17.8 92 13.4 225 20.6 219 33.6 F 60 3.4 3 0.4 57 5.2 80 12.3
Total 1,780 686 1,094 651 *Due to rounding the percent of schools may not total 100%.
Figure 13. Performance grades of schools by growth designations
23.9
53.8
22.3
Elementary School
31.7
37.3
31.0
Middle School
33.6
34.9
31.6
High School
3.8 4.6
28.8
41.6
17.8
3.4
Schools Meeting or Exceeding Growth
A (81)
B (513)
C (741)
D (317)
F (60)
A+NG (68)
0.2 0.2
10.8
43.0 33.6
12.3
Schools Not Meeting Growth
A (1)
B (70)
C (280)
D (219)
F (80)
A+NG (1)
Exceeds Meets Does Not Meet
NCDPI/ODSS/AS/LM/September 1, 2015 12
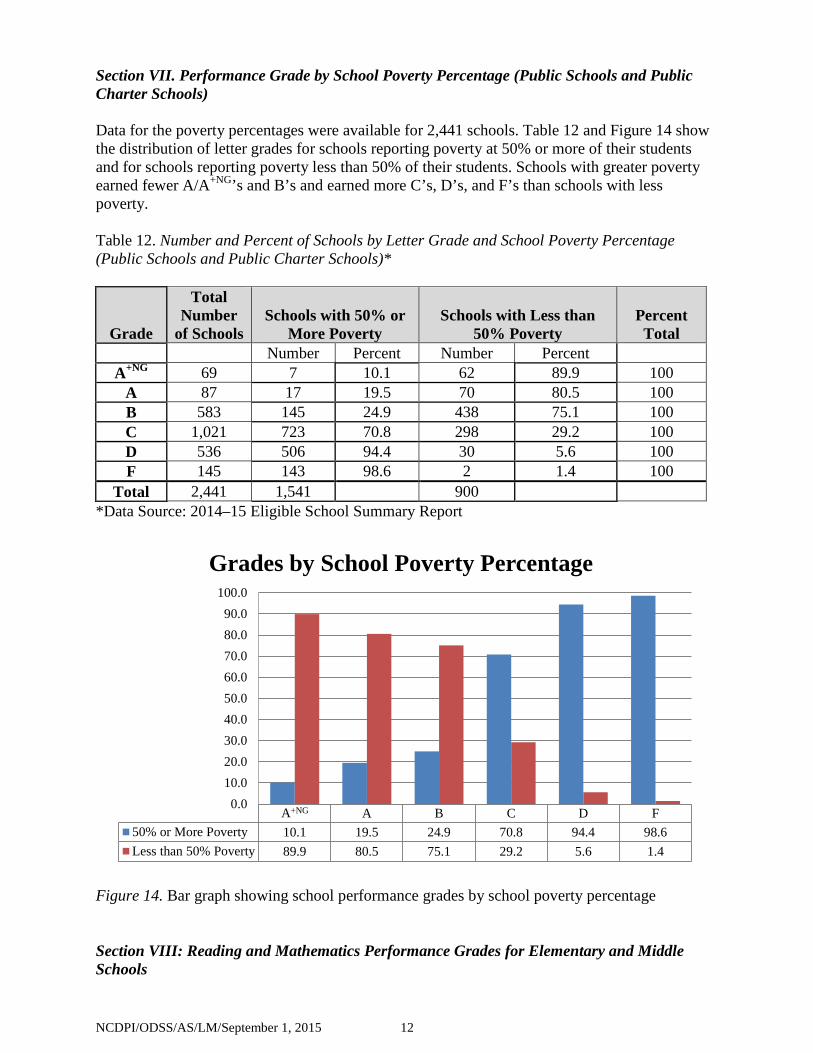
Section VII. Performance Grade by School Poverty Percentage (Public Schools and Public Charter Schools) Data for the poverty percentages were available for 2,441 schools. Table 12 and Figure 14 show the distribution of letter grades for schools reporting poverty at 50% or more of their students and for schools reporting poverty less than 50% of their students. Schools with greater poverty earned fewer A/A+NG’s and B’s and earned more C’s, D’s, and F’s than schools with less poverty. Table 12. Number and Percent of Schools by Letter Grade and School Poverty Percentage (Public Schools and Public Charter Schools)*
Grade
Total Number
of Schools Schools with 50% or
More Poverty Schools with Less than
50% Poverty Percent Total
Number Percent Number Percent A+NG 69 7 10.1 62 89.9 100
A 87 17 19.5 70 80.5 100 B 583 145 24.9 438 75.1 100 C 1,021 723 70.8 298 29.2 100 D 536 506 94.4 30 5.6 100 F 145 143 98.6 2 1.4 100
Total 2,441 1,541 900 *Data Source: 2014–15 Eligible School Summary Report
Figure 14. Bar graph showing school performance grades by school poverty percentage Section VIII: Reading and Mathematics Performance Grades for Elementary and Middle Schools
A B C D F50% or More Poverty 10.1 19.5 24.9 70.8 94.4 98.6Less than 50% Poverty 89.9 80.5 75.1 29.2 5.6 1.4
0.010.020.030.040.050.060.070.080.090.0
100.0
Grades by School Poverty Percentage
A+NG
NCDPI/ODSS/AS/LM/September 1, 2015 13
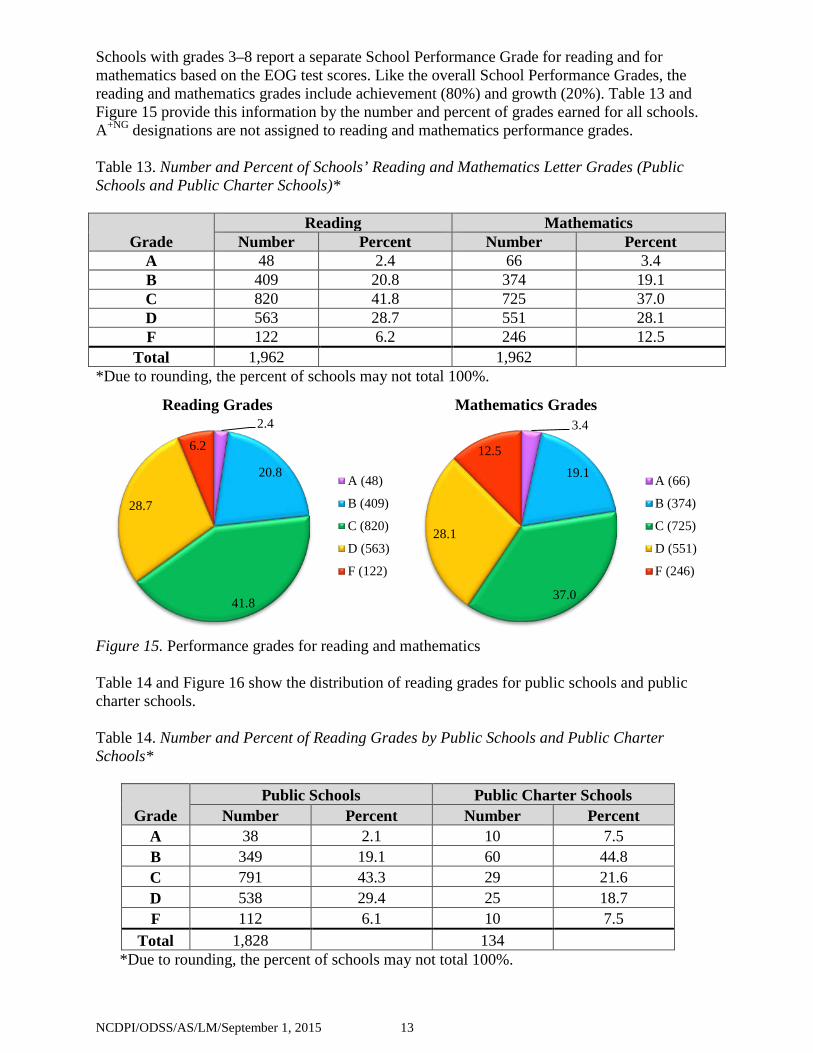
Schools with grades 3–8 report a separate School Performance Grade for reading and for mathematics based on the EOG test scores. Like the overall School Performance Grades, the reading and mathematics grades include achievement (80%) and growth (20%). Table 13 and Figure 15 provide this information by the number and percent of grades earned for all schools. A+NG designations are not assigned to reading and mathematics performance grades. Table 13. Number and Percent of Schools’ Reading and Mathematics Letter Grades (Public Schools and Public Charter Schools)*
Grade
Reading Mathematics Number Percent Number Percent
A 48 2.4 66 3.4 B 409 20.8 374 19.1 C 820 41.8 725 37.0 D 563 28.7 551 28.1 F 122 6.2 246 12.5
Total 1,962 1,962 *Due to rounding, the percent of schools may not total 100%.
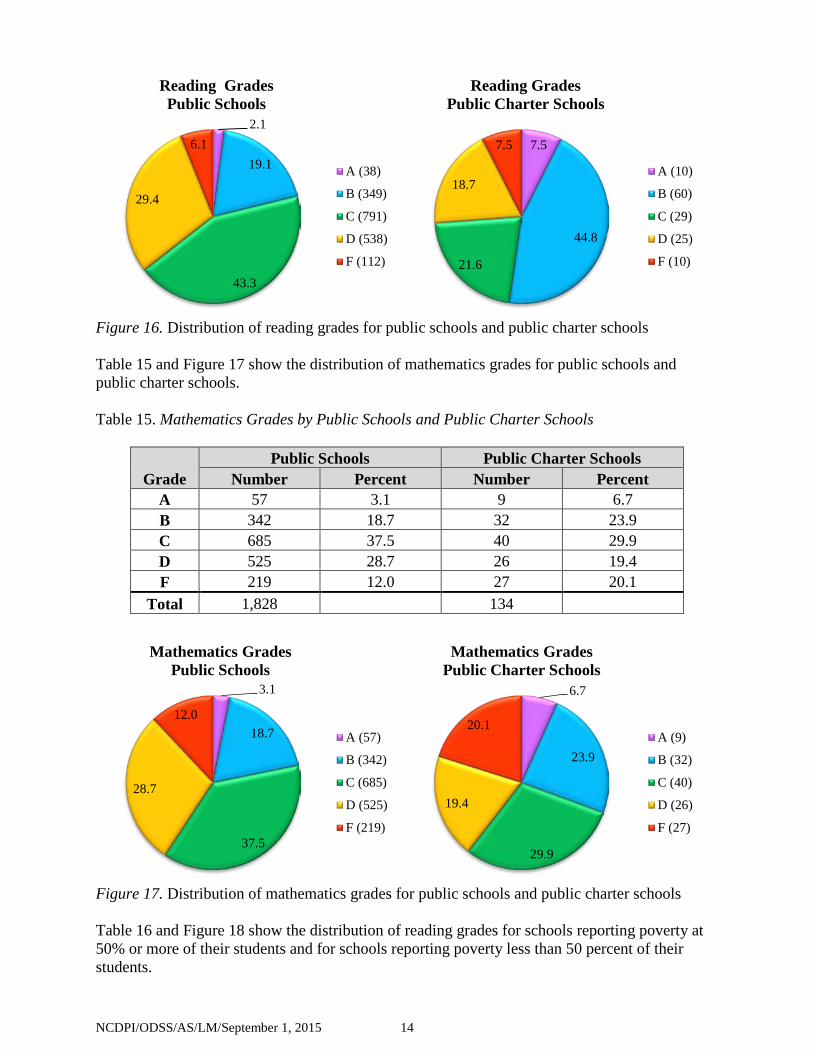
Figure 15. Performance grades for reading and mathematics Table 14 and Figure 16 show the distribution of reading grades for public schools and public charter schools. Table 14. Number and Percent of Reading Grades by Public Schools and Public Charter Schools*
Grade Public Schools Public Charter Schools
Number Percent Number Percent A 38 2.1 10 7.5 B 349 19.1 60 44.8 C 791 43.3 29 21.6 D 538 29.4 25 18.7 F 112 6.1 10 7.5
Total 1,828 134 *Due to rounding, the percent of schools may not total 100%.
2.4
20.8
41.8
28.7
6.2
Reading Grades
A (48)
B (409)
C (820)
D (563)
F (122)
3.4
19.1
37.0
28.1
12.5
Mathematics Grades
A (66)
B (374)
C (725)
D (551)
F (246)
NCDPI/ODSS/AS/LM/September 1, 2015 14
Figure 16. Distribution of reading grades for public schools and public charter schools Table 15 and Figure 17 show the distribution of mathematics grades for public schools and public charter schools. Table 15. Mathematics Grades by Public Schools and Public Charter Schools
Grade Public Schools Public Charter Schools
Number Percent Number Percent A 57 3.1 9 6.7 B 342 18.7 32 23.9 C 685 37.5 40 29.9 D 525 28.7 26 19.4 F 219 12.0 27 20.1
Total 1,828 134
Figure 17. Distribution of mathematics grades for public schools and public charter schools Table 16 and Figure 18 show the distribution of reading grades for schools reporting poverty at 50% or more of their students and for schools reporting poverty less than 50 percent of their students.
2.1
19.1
43.3
29.4
6.1
Reading Grades Public Schools
A (38)
B (349)
C (791)
D (538)
F (112)
7.5
44.8
21.6
18.7
7.5
Reading Grades Public Charter Schools
A (10)
B (60)
C (29)
D (25)
F (10)
3.1
18.7
37.5
28.7
12.0
Mathematics Grades Public Schools
A (57)
B (342)
C (685)
D (525)
F (219)
6.7
23.9
29.9
19.4
20.1
Mathematics Grades Public Charter Schools
A (9)
B (32)
C (40)
D (26)
F (27)
NCDPI/ODSS/AS/LM/September 1, 2015 15
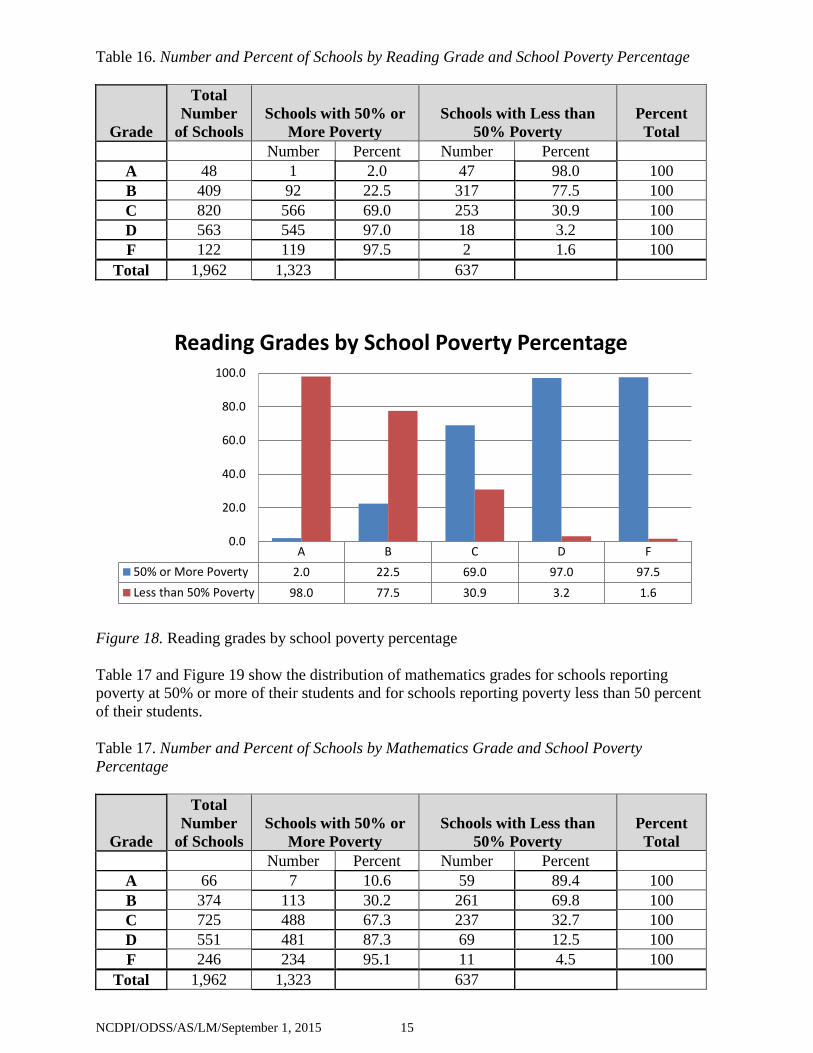
Table 16. Number and Percent of Schools by Reading Grade and School Poverty Percentage
Grade
Total Number
of Schools Schools with 50% or
More Poverty Schools with Less than
50% Poverty Percent Total
Number Percent Number Percent A 48 1 2.0 47 98.0 100 B 409 92 22.5 317 77.5 100 C 820 566 69.0 253 30.9 100 D 563 545 97.0 18 3.2 100 F 122 119 97.5 2 1.6 100
Total 1,962 1,323 637
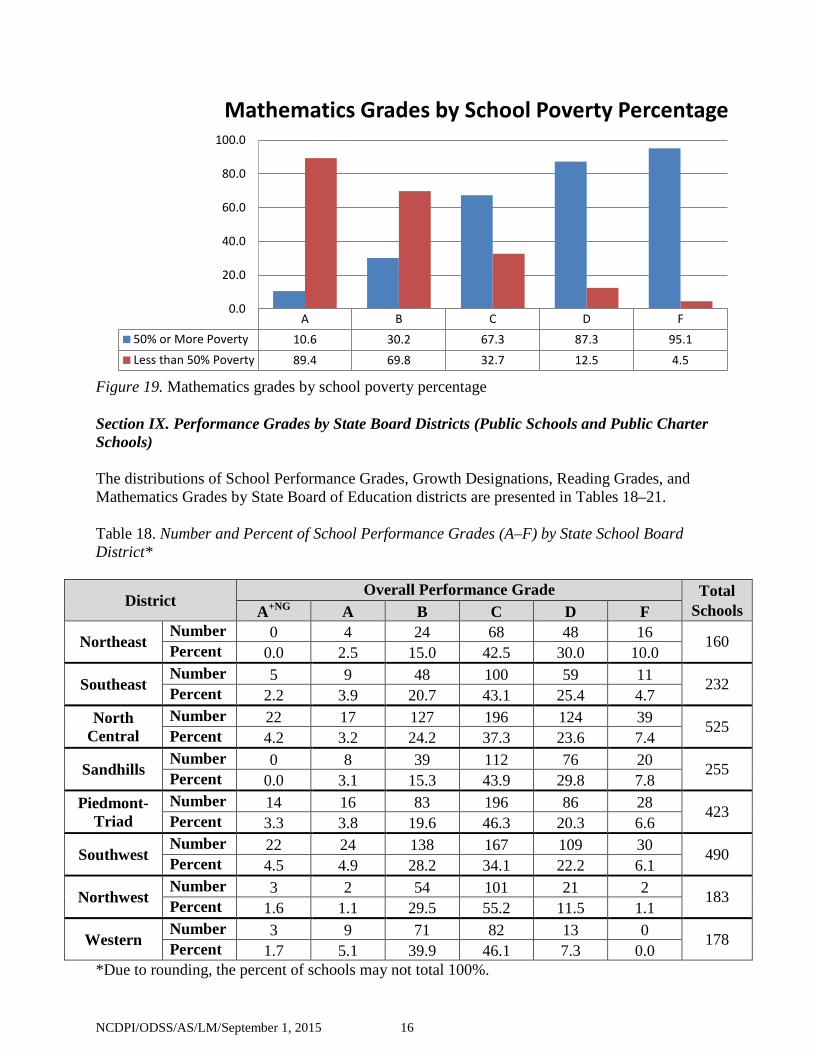
Figure 18. Reading grades by school poverty percentage Table 17 and Figure 19 show the distribution of mathematics grades for schools reporting poverty at 50% or more of their students and for schools reporting poverty less than 50 percent of their students. Table 17. Number and Percent of Schools by Mathematics Grade and School Poverty Percentage
Grade
Total Number
of Schools Schools with 50% or
More Poverty Schools with Less than
50% Poverty Percent Total
Number Percent Number Percent A 66 7 10.6 59 89.4 100 B 374 113 30.2 261 69.8 100 C 725 488 67.3 237 32.7 100 D 551 481 87.3 69 12.5 100 F 246 234 95.1 11 4.5 100
Total 1,962 1,323 637
A B C D F50% or More Poverty 2.0 22.5 69.0 97.0 97.5Less than 50% Poverty 98.0 77.5 30.9 3.2 1.6
0.0
20.0
40.0
60.0
80.0
100.0
Reading Grades by School Poverty Percentage
NCDPI/ODSS/AS/LM/September 1, 2015 16
Figure 19. Mathematics grades by school poverty percentage Section IX. Performance Grades by State Board Districts (Public Schools and Public Charter Schools) The distributions of School Performance Grades, Growth Designations, Reading Grades, and Mathematics Grades by State Board of Education districts are presented in Tables 18–21. Table 18. Number and Percent of School Performance Grades (A–F) by State School Board District*
District Overall Performance Grade Total
Schools A+NG A B C D F
Northeast Number 0 4 24 68 48 16 160 Percent 0.0 2.5 15.0 42.5 30.0 10.0
Southeast Number 5 9 48 100 59 11 232 Percent 2.2 3.9 20.7 43.1 25.4 4.7
North Central
Number 22 17 127 196 124 39 525 Percent 4.2 3.2 24.2 37.3 23.6 7.4
Sandhills Number 0 8 39 112 76 20 255 Percent 0.0 3.1 15.3 43.9 29.8 7.8
Piedmont-Triad
Number 14 16 83 196 86 28 423 Percent 3.3 3.8 19.6 46.3 20.3 6.6
Southwest Number 22 24 138 167 109 30 490 Percent 4.5 4.9 28.2 34.1 22.2 6.1
Northwest Number 3 2 54 101 21 2 183 Percent 1.6 1.1 29.5 55.2 11.5 1.1
Western Number 3 9 71 82 13 0 178 Percent 1.7 5.1 39.9 46.1 7.3 0.0
*Due to rounding, the percent of schools may not total 100%.
A B C D F50% or More Poverty 10.6 30.2 67.3 87.3 95.1Less than 50% Poverty 89.4 69.8 32.7 12.5 4.5
0.0
20.0
40.0
60.0
80.0
100.0
Mathematics Grades by School Poverty Percentage
NCDPI/ODSS/AS/LM/September 1, 2015 17
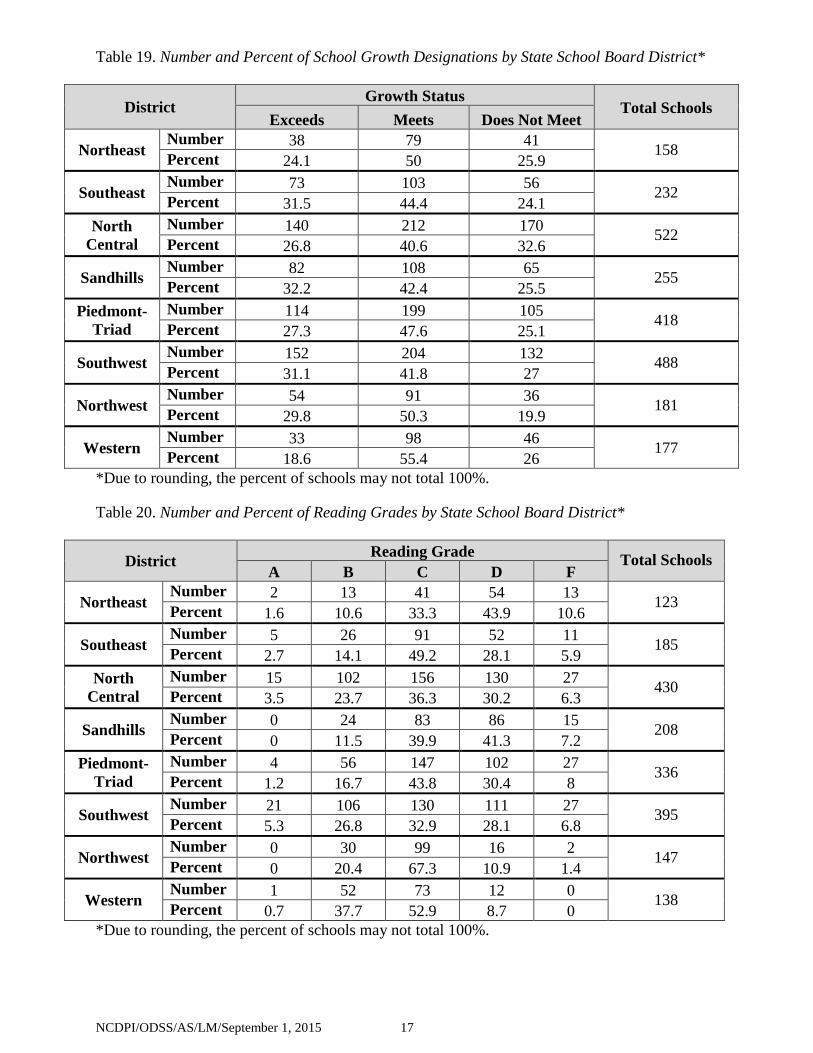
Table 19. Number and Percent of School Growth Designations by State School Board District*
District Growth Status
Total Schools Exceeds Meets Does Not Meet
Northeast Number 38 79 41 158 Percent 24.1 50 25.9
Southeast Number 73 103 56 232 Percent 31.5 44.4 24.1
North Central
Number 140 212 170 522 Percent 26.8 40.6 32.6
Sandhills Number 82 108 65 255 Percent 32.2 42.4 25.5
Piedmont-Triad
Number 114 199 105 418 Percent 27.3 47.6 25.1
Southwest Number 152 204 132 488 Percent 31.1 41.8 27
Northwest Number 54 91 36 181 Percent 29.8 50.3 19.9
Western Number 33 98 46 177 Percent 18.6 55.4 26
*Due to rounding, the percent of schools may not total 100%.
Table 20. Number and Percent of Reading Grades by State School Board District*
District Reading Grade Total Schools A B C D F
Northeast Number 2 13 41 54 13 123 Percent 1.6 10.6 33.3 43.9 10.6
Southeast Number 5 26 91 52 11 185 Percent 2.7 14.1 49.2 28.1 5.9
North Central
Number 15 102 156 130 27 430 Percent 3.5 23.7 36.3 30.2 6.3
Sandhills Number 0 24 83 86 15 208 Percent 0 11.5 39.9 41.3 7.2
Piedmont-Triad
Number 4 56 147 102 27 336 Percent 1.2 16.7 43.8 30.4 8
Southwest Number 21 106 130 111 27 395 Percent 5.3 26.8 32.9 28.1 6.8
Northwest Number 0 30 99 16 2 147 Percent 0 20.4 67.3 10.9 1.4
Western Number 1 52 73 12 0 138 Percent 0.7 37.7 52.9 8.7 0
*Due to rounding, the percent of schools may not total 100%.
NCDPI/ODSS/AS/LM/September 1, 2015 18
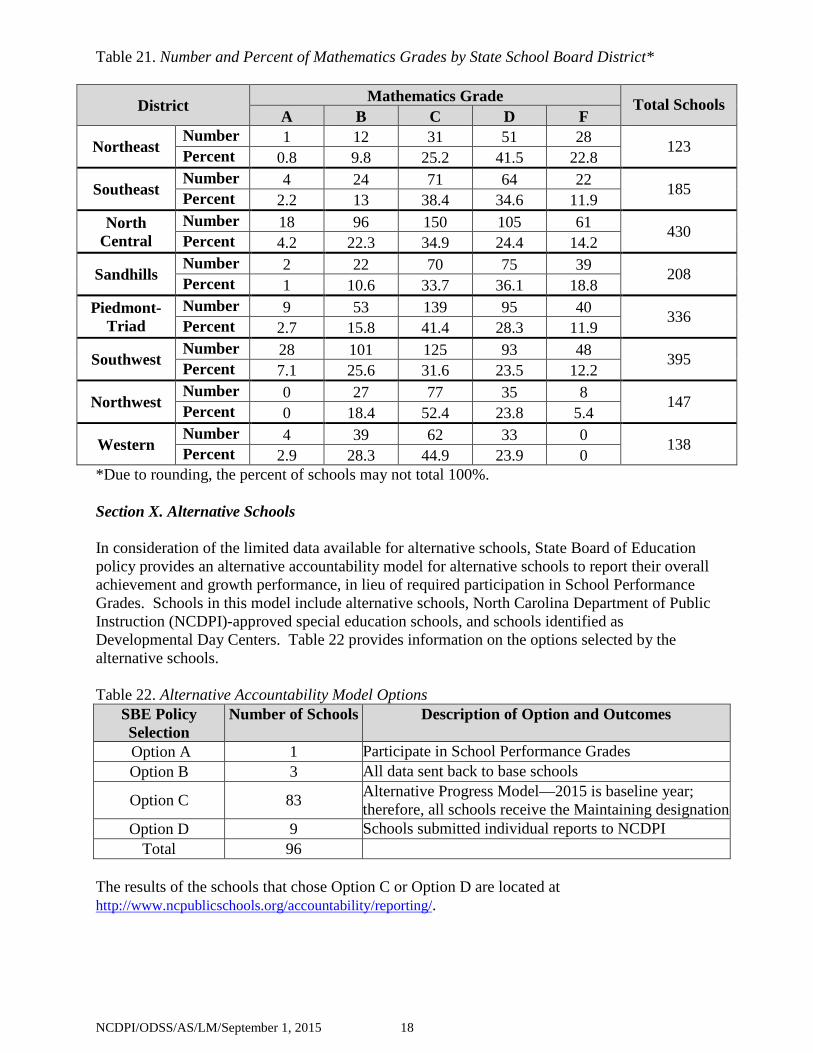
Table 21. Number and Percent of Mathematics Grades by State School Board District*
District Mathematics Grade Total Schools A B C D F
Northeast Number 1 12 31 51 28 123 Percent 0.8 9.8 25.2 41.5 22.8
Southeast Number 4 24 71 64 22 185 Percent 2.2 13 38.4 34.6 11.9
North Central
Number 18 96 150 105 61 430 Percent 4.2 22.3 34.9 24.4 14.2
Sandhills Number 2 22 70 75 39 208 Percent 1 10.6 33.7 36.1 18.8
Piedmont-Triad
Number 9 53 139 95 40 336 Percent 2.7 15.8 41.4 28.3 11.9
Southwest Number 28 101 125 93 48 395 Percent 7.1 25.6 31.6 23.5 12.2
Northwest Number 0 27 77 35 8 147 Percent 0 18.4 52.4 23.8 5.4
Western Number 4 39 62 33 0 138 Percent 2.9 28.3 44.9 23.9 0
*Due to rounding, the percent of schools may not total 100%. Section X. Alternative Schools In consideration of the limited data available for alternative schools, State Board of Education policy provides an alternative accountability model for alternative schools to report their overall achievement and growth performance, in lieu of required participation in School Performance Grades. Schools in this model include alternative schools, North Carolina Department of Public Instruction (NCDPI)-approved special education schools, and schools identified as Developmental Day Centers. Table 22 provides information on the options selected by the alternative schools. Table 22. Alternative Accountability Model Options
SBE Policy Selection
Number of Schools Description of Option and Outcomes
Option A 1 Participate in School Performance Grades Option B 3 All data sent back to base schools
Option C 83 Alternative Progress Model—2015 is baseline year; therefore, all schools receive the Maintaining designation
Option D 9 Schools submitted individual reports to NCDPI Total 96
The results of the schools that chose Option C or Option D are located at http://www.ncpublicschools.org/accountability/reporting/.
NCDPI/ODSS/AS/LM/September 1, 2015 19
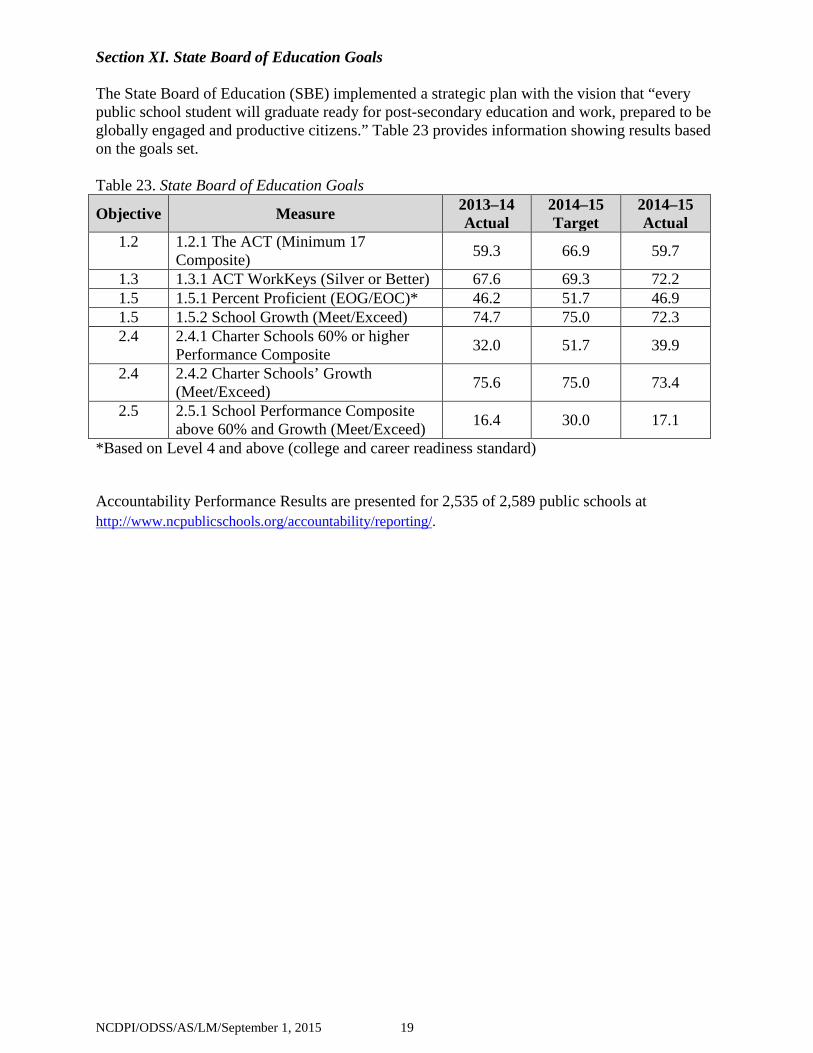
Section XI. State Board of Education Goals The State Board of Education (SBE) implemented a strategic plan with the vision that “every public school student will graduate ready for post-secondary education and work, prepared to be globally engaged and productive citizens.” Table 23 provides information showing results based on the goals set. Table 23. State Board of Education Goals
Objective Measure 2013–14 Actual
2014–15 Target
2014–15 Actual
1.2 1.2.1 The ACT (Minimum 17 Composite) 59.3 66.9 59.7
1.3 1.3.1 ACT WorkKeys (Silver or Better) 67.6 69.3 72.2 1.5 1.5.1 Percent Proficient (EOG/EOC)* 46.2 51.7 46.9 1.5 1.5.2 School Growth (Meet/Exceed) 74.7 75.0 72.3 2.4 2.4.1 Charter Schools 60% or higher
Performance Composite 32.0 51.7 39.9
2.4 2.4.2 Charter Schools’ Growth (Meet/Exceed) 75.6 75.0 73.4
2.5 2.5.1 School Performance Composite above 60% and Growth (Meet/Exceed) 16.4 30.0 17.1
*Based on Level 4 and above (college and career readiness standard)
Accountability Performance Results are presented for 2,535 of 2,589 public schools at http://www.ncpublicschools.org/accountability/reporting/.