Embed Size (px)
Citation preview

NCDPI/ODSS/AS/LM/September 7, 2017 1
2016–17 Performance and Growth of North Carolina Public Schools
Executive Summary
(September 7, 2017)
Statistical Summary of Results
This report provides growth and performance data for the 2016–17 school year based on analysis
of all end-of-grade (EOG) tests and end-of-course (EOC) tests, which are aligned to the North
Carolina Standard Course of Study in English Language Arts/Reading and Mathematics and the
Essential Standards in Science, for all district schools and charter schools. The following data
are presented:
1. Growth: Reporting if schools exceeded, met, or did not meet growth expectations as
defined and calculated in EVAAS.
2. Performance: Reporting how schools performed on assessments, high school indicators,
and School Performance Grades.
3. Participation: Reporting if schools met or did not meet assessment participation
requirements.
Schools not included in the report may not have any tested grades or may have a transient or very
small student population. Typically, these schools are K–2 schools, special education schools,
vocational/career schools, and hospital schools.
Accountability performance results for district and charter schools included in this report are
available in a variety of spreadsheets and reports. Please go to http://www.ncpublicschools.org/
accountability/reporting/ to view more detailed information on the schools, districts and the state. The
data will also be presented in the North Carolina School Report Cards later this fall.
Section I. Growth Results
For the 2016–17 school year, school accountability growth results are presented for 2,531 of the
2,566 public schools that participated in the statewide testing program. Using all EOG and EOC
test scores, school accountability growth is calculated using EVAAS, a value-added growth
modeling tool. Each school with the required data is designated as having exceeded expected
growth, met expected growth, or did not meet growth. The results for school accountability
growth are shown in Table 1.
Table 1. School Accountability Growth
Growth Category
2015–16
Number
2015–16
Percent
2016–17
Number
2016–17
Percent
Exceeded Expected Growth 691 27.5 666 26.3
Met Expected Growth 1,158 46.1 1,200 47.4
Did Not Meet Growth 663 26.4 665 26.3
Total 2,512 2,531
SLA 6 – Attachment 1
Additional Information
September 7, 2017

NCDPI/ODSS/AS/LM/September 7, 2017 2
Section II. Performance Results
The 2016–17 school year is the fifth year of the implementation of assessments aligned to
college- and career-readiness (CCR) content standards, and it is the fourth year that the academic
achievement standards have been reported as (1) Level 4 and above: on track for being prepared
for college and career at the conclusion of high school and (2) Level 3 and above: demonstrating
preparedness to be successful at the next grade level. To report student performance since
2012–13, the first year the tests were implemented, CCR in 2012–13 (Level 3 and above) may be
compared to CCR in 2013–14 and beyond (Level 4 and above). As shown in Figure 1, there
continues to be a consistent increase each year in the percent of students demonstrating CCR on
the mathematics tests for grades 3–8. For the first time in four years, CCR in reading decreased
slightly. However, students demonstrating CCR on both the reading and the mathematics in the
same year have continued an upward trend.
Figure 1. End-of-Grade State-Level Performance Results in Both Reading and Mathematics,
Mathematics only, and Reading only (Level 4 and above—College and Career Readiness (CCR)
Standard)
With Grade Level Proficiency (GLP) (Level 3 and above) being implemented for the first time in
2013–14, there are now four years to compare. As presented in Figure 2, results are trending
upward on all assessments.
Figure 2. End-of-Grade State-Level Performance Results in Both Reading and Mathematics,
Mathematics only, and Reading only (Level 3 and above—Grade Level Proficiency (GLP)
Standard)
32.0
42.2 43.9
32.9
43.1 44.7
33.8
44.1 45.1
35.4
47.0 45.8
35.5
47.6 45.5
BOTH READING AND MATHEMATICS MATHEMATICS ONLY READING ONLY
2012-13 2013-14 2014-15 2015-16 2016-17
42.651.0
56.3
43.552.2
56.3
45.054.7 56.9
45.955.4 57.5
BOTH READING AND MATHEMATICS MATHEMATICS ONLY READING ONLY
2013-14 2014-15 2015-16 2016-17

NCDPI/ODSS/AS/LM/September 7, 2017 3
Figures 3 through 8 show current year data and previous years’ data for CCR (Level 4 and
above) and for GLP (Level 3 and above) for each grade and subject. The 2016–17 data show
increases and decreases across grade levels (CCR or GLP) for reading and mathematics. Grade 8
science continues a trend of improvement while Grade 5 science decreased for the first time in
two years. All three of the EOC tests (Figure 8), Biology, English II and NC Math 1 had a
higher percent of students proficient than the previous year for CCR and GLP.
Figure 3. End-of-Grade Reading Performance by Grade (Level 4 and above—CCR Standard)
Figure 4. End-of-Grade Reading Performance by Grade (Level 3 and above—GLP Standard)
Figure 5. End-of-Grade Mathematics Performance by Grade (Level 4 and above—CCR
Standard)
46.5 47.142.2 46.6 46.5
41.647.8 45.7 43.1
49.5 47.141.5
46.1 43.7 42.550.4 48.9
41.7
GRADE 3 GRADE 4 GRADE 5 GRADE 6 GRADE 7 GRADE 8
2014-15 2015-16 2016-17
59.0 58.853.0 57.2 56.1 53.457.7 58.0 55.4 58.7 58.5
53.457.8 57.7 56.7 61.0 58.253.7
GRADE 3 GRADE 4 GRADE 5 GRADE 6 GRADE 7 GRADE 8
2014-15 2015-16 2016-17
48.8 48.5 51.341.0 40.0 35.8
51.7 51.1 54.044.3 42.0 38.5
52.1 50.9 53.945.3 43.0 39.6
GRADE 3 GRADE 4 GRADE 5 GRADE 6 GRADE 7 GRADE 8
2014-15 2015-16 2016-17

NCDPI/ODSS/AS/LM/September 7, 2017 4
Figure 6. End-of-Grade Mathematics Performance by Grade (Level 3 and above—GLP
Standard)
Figure 7. End-of-Grade Science Performance by Grade (Level 4 and above—CCR Standard and
Level 3 and above—GLP Standard)
Figure 8. End-of-Course Performance by Subject (Level 4 and above—CCR Standard and Level
3 and above—GLP Standard)
61.756.1 57.5
48.5 46.9 43.2
64.657.2 60.4
52.0 48.944.7
63.658.6 60.3
53.1 49.8 45.8
GRADE 3 GRADE 4 GRADE 5 GRADE 6 GRADE 7 GRADE 8
2014-15 2015-16 2016-17
54.163.761.8 64.5
59.166.2
GRADE 5 GRADE 8
College- and Career-Readiness
2014-15 2015-16 2016-17
44.950.0 48.647.3 49.6 49.847.5 50.1
54.1
BIOLOGY ENGLISH II NC MATH 1
College- and Career-Readiness
2014-15 2015-16 2016-17
64.672.671.6 73.970.1
75.5
GRADE 5 GRADE 8
Grade Level Proficiency
2014-15 2015-16 2016-17
53.759.6 59.855.5 58.8 60.5
56.160.7 64.3
BIOLOGY ENGLISH II NC MATH 1
Grade Level Proficiency
2014-15 2015-16 2016-17

NCDPI/ODSS/AS/LM/September 7, 2017 5
The following tables (2–5) provide student performance data by cohort over time. For example,
previous grade level performance (grades 3–7) is provided for the 2016–17 Grade 8 cohort.
However, student cohorts are not absolute as changes due to student mobility or other factors are
not considered.
Table 2. End-of-Grade Reading Performance Cohort Trend (Level 4 and above—CCR Standard)
Table 3. End-of-Grade Reading Performance Cohort Trend (Level 3 and above – Grade Level
Proficiency (GLP) Standard)
Table 4. End-of-Grade Mathematics Performance Cohort Trend (Level 4 and above—CCR
Standard)
Table 5. End-of-Grade Mathematics Performance Cohort Trend (Level 3 and above – Grade
Level Proficiency (GLP) Standard)

NCDPI/ODSS/AS/LM/September 7, 2017 6
State-level results for other high school indicators: ACT, ACT WorkKeys, Students Passing NC
Math 3, and the Graduation Project are presented in Table 6. For the fourth consecutive year the
percent of schools implementing and completing a Graduation Project has decreased.
Table 6. State-Level Performance for the High School Indicators
Indicator Benchmark Definition
2014–15
Percent
Meeting
Benchmark
2015–16
Percent
Meeting
Benchmark
2016–17
Percent
Meeting
Benchmark
ACT
Percent of grade 11
participating students who
meet the UNC System
minimum admission
requirement of a composite
score of 17
59.7 59.9 58.8
ACT
WorkKeys
Percent of graduates who are
Career and Technical
Education (CTE) concentrators
who earn a Silver Certificate
or higher
72.1 73.5 73.3
Students
Passing NC
Math 3
Percent of graduates who
complete NC Math 3 or Math
III with a passing grade.
>95 >95 >95
Graduation
Project
Percent of high schools that
implemented and completed a
graduation project
36.2 32.7 29.7
Section III. Participation Requirements
Effective with the passage of the Every Student Succeeds Act (ESSA) in December 2015, North
Carolina is no longer required to report Annual Measurable Objective (AMO) targets based on
proficiency targets. However, participation is still required to be reported. Participation
requirements apply to all state assessments administered by the state including EOG/EOC
assessments in English language arts/reading, mathematics, and science, the ACT, and ACT
WorkKeys.
In order to meet participation requirements, schools must have assessed at least 95% of eligible
students. Participation requirements are reported for the following student groups: School as a
whole (All Students); American Indian; Asian; Black; Hispanic; Two or More Races; White;
Economically Disadvantaged; Limited English Proficient; Students with Disabilities; and
Academically or Intellectually Gifted.
Table 7 shows the number and percent of schools who did or did not meet all of the participation
requirements.
Table 7. Participation Requirements
Number of Schools Percent of Schools
Met All Participation Requirements 2,253 88.6
Did Not Meet All Participation Requirements 289 11.4
Total 2,542

NCDPI/ODSS/AS/LM/September 7, 2017 7
Table 8. The Number and Percentage of School-Level Participation Requirements Met By
Student Group
Participation Expectations
Student Groups Number Met Total Number Percent Met
All Students 9,090 9,303 97.7
American Indian 171 176 97.2
Asian 577 583 99.0
Black 4,919 5,085 96.7
Hispanic 3,944 4,073 96.8
Two or More Races 648 664 97.6
White 7,150 7,237 98.8
Economically Disadvantaged 7,505 7,717 97.3
Limited English Proficient 1,085 1,183 91.7
Students with Disabilities 3,718 3,924 94.8
Academically/Intellectually Gifted 3,666 3,676 99.7
North Carolina is committed to ensuring that all students participate in required assessments and
applies consequences to schools that do not meet the targets by student group. Schools are
labeled “Consistently Low Participating” if they miss a participation target for a second
consecutive year. These schools must create and submit a plan for ensuring that the missed
subgroup(s) will meet participation expectations in the coming year. Schools are identified as
“Focus Schools” if they fail to meet participation target(s) for three or more consecutive years.
Schools with the Focus School designation must send a letter to notify parents of the inadequate
participation. The letter must include information on a plan to ensure full participation for
subsequent administrations.
This year 90 schools are labeled Consistently Low Participating which is an increase of 17
schools from the 2015–16 school year. Also, 57 schools are identified as Focus Schools for
missing participation requirements, 15 fewer schools than the previous year.
Section IV. School Performance Grades (A–F)
Beginning with the 2013–14 school year data, per legislation (G.S. §115C-83.15) passed during
the 2013 long session of the North Carolina General Assembly, School Performance Grades
(A–F) based on test scores, and high schools’ additional indicators that measure college- and
career-readiness, are reported for schools in North Carolina.
The School Performance Grades are based on student achievement (80%) and growth (20%).
The indicators and the proficiency standard or benchmark used for achievement include:
1. Annual EOG mathematics and reading assessments in grades 3–8 and science
assessments in grades 5 and 8 (Level 3 and above)
2. Annual EOC assessments in NC Math 1, Biology, and English II (Level 3 and above)
3. The percentage of graduates who complete NC Math 3 or Math III with a passing grade
4. The percentage of grade 11 students who achieve the minimum score required for
admission into a constituent institution of The University of North Carolina on the ACT
(composite score of 17)
5. The percentage of graduates identified as Career and Technical Education concentrators
who meet the Silver Certificate or higher on the ACT WorkKeys assessment

NCDPI/ODSS/AS/LM/September 7, 2017 8
6. The percentage of students who graduate within four years of entering high school
(Standard [4-Year] Cohort Graduation Rate)
The EVAAS model, which provides the growth measure, uses current and previous student test
data to determine whether schools are maintaining or increasing student achievement from one
year to the next. In the event that a school does not have a Growth Score, only the School
Achievement Score is used to calculate the Performance Score. For the final Performance Score
and Grade, if a school’s growth designation is Meets or Exceeds Expected Growth, but the
inclusion of the school’s Growth Score reduces the school’s Performance Score and Grade, only
the School Achievement Score may be used for the Performance Score and Grade. For 2016–17,
there are fifteen (15) schools that meet this exception, and growth is not included in their final
grade calculation.
For 2016–17, the grade designations are set on a 15-point scale as follows:
A = 85–100 B = 70–84 C = 55–69 D = 40–54 F = 39 or Less
Schools that earn an A designation and do not have significant achievement and/or graduation
gaps are designated as an A+NG school. Significant achievement and graduation gaps are defined
as in-school gaps that are above the three-year state average when averaging gaps in the previous
year and at least one of the two prior years between the highest-achieving subgroup and lowest-
achieving subgroup.
Following is the state-level distribution of School Performance Grades, including the reading and
mathematics grades for the K–8 schools and secondary analyses on growth, school type, poverty,
and State Board of Education districts.
Section V. Overall School Performance Grades
Of all district schools and charter schools, 2,478 received School Performance Grades (SPG) for
the 2016–17 school year. Of the schools not included in the SPG report, 96 are schools approved
to use the Alternative School Accountability Model, which is highlighted in Section X. The
remaining 48 may not have any tested grades or may have a transient or very small student
population. Typically, these schools are K–2 schools and special education schools. Table 9 and
Figure 9 provide the number and percent of the 2,478 schools that received each letter grade (A–
F). The majority of all schools received a letter grade of C or better. Compared to 2015–16, there
were an additional 11 schools that earned an A/A+NG.
To be eligible for the A+NG designation, a school must have at least 30 students in two subgroups.
In 2016–17, there were 76 schools that achieved an A but did not have enough data for the
achievement gap calculation (6 more than in 2015–16). Of the 105 schools with sufficient data
for the analysis, 87 schools did not have significant gaps and were identified as an A+NG school.

NCDPI/ODSS/AS/LM/September 7, 2017 9
Table 9. Performance Grade (District Schools and Charter Schools) *
Overall
Grade
Number
of
Schools
2013–14
Percent
of
Schools
2013–14
Number
of
Schools
2014–15
Percent
of
Schools
2014–15
Number
of
Schools
2015–16
Percent
of
Schools
2015–16
Number
of
Schools
2016–17
Percent
of
Schools
2016–17
A+NG NA NA 69 2.8 84 3.4 87 3.5
A 132 5.4 89 3.6 86 3.5 94 3.8
B 582 24.0 586 24.0 634 25.8 706 28.5
C 1,003 41.4 1,020 41.7 1,085 44.1 1,030 41.6
D 561 23.1 536 21.9 468 19.0 463 18.7
F 146 6.0 146 6.0 102 4.1 98 4.0
Total 2,424 2,446 2,459 2,478
*Due to rounding, the percent of schools may not total 100%.
Figure 9. Performance grades by all schools
Table 10 and Figure 10 show letter grades broken out by district schools and by charter schools.
District schools had a lower percent of schools with D and F grades (22.5%) than charter schools
(25.2%). Charters had a higher percent of A/A+NG and B grades (43.9%) than District schools
(35.2%). In all cases, the percent of D and F grades decreased and the percent of A/A+NG and B
grades increased.
Table 10. Performance Grades by District Schools and by Charter Schools*
Overall
Grade
District Schools Charter Schools
Number Percent Number Percent
A+NG 76 3.3 11 6.7
A 89 3.8 5 3.1
B 651 28.1 55 33.7
C 979 42.3 51 31.3
D 435 18.8 28 17.2
F 85 3.7 13 8.0
Total 2,315
163
*Due to rounding, the percent of schools may not total 100%.
3.53.8
28.5
41.6
18.7
4.0
A+NG(87)
A (94)
B (706)
C (1,030)
D (463)
F (98)

NCDPI/ODSS/AS/LM/September 7, 2017 10
Figure 10. Performance grades for district schools and charter schools
Table 11 and Figure 11 show the distribution of school grades by school type. School type is
defined as follows: elementary (any school with a grade configuration up to grade 5), middle
(any school with a grade configuration up to grade 8), and high (any school with a grade
configuration up to grade 12 or ungraded). The elementary and middle schools’ achievement
scores are based only on test scores. In 2016–17, 73.2% of the elementary and middle schools
earned a grade of C or better which represents a 0.1% decrease compared to the previous year,
29.4% earned a B or better which is a 2% increase from last year, and 3.8% earned an A/A+NG.
Table 11. Performance Grade by School Type (District Schools and Charter Schools)*
Grade
Elementary and
Middle Elementary Middle High
Number Percent Number Percent Number Percent Number Percent
A+NG 53 2.8 43 3.5 10 1.5 34 5.8
A 19 1.0 8 0.7 11 1.6 75 12.8
B 485 25.6 344 28.1 141 21.0 221 37.8
C 830 43.8 541 44.2 289 43.1 200 34.2
D 416 22.0 233 19.1 183 27.3 47 8.0
F 91 4.8 54 4.4 37 5.5 7 1.2
Total 1,894 1,223 671 584
*Due to rounding the percent of schools may not total 100%.
Figure 11. Performance grades by school type
3.3 3.8
28.1
42.3
18.8
3.7
District Schools
A (89)
B (651)
C (979)
D (435)
F (85)
A+NG (76)6.7
3.1
33.7
31.3
17.2
8.0
Charter Schools
A (5)
B (55)
C (51)
D (28)
F (13)
A+NG (11)
3.50.7
28.1
44.2
19.1
4.4
Elementary School
Performance Grades
A (8)
B (344)
C (541)
D (233)
F (54)
A+NG (43)
1.51.6
21.0
43.1
27.3
5.5
Middle School
Performance Grades
A (11)
B (141)
C (289)
D (183)
F (37)
A+NG (10)
5.8
12.8
37.8
34.2
8.0
1.2
High School
Performance Grades
A (75)
B (221)
C (200)
D (47)
F (7)
A+NG (34)

NCDPI/ODSS/AS/LM/September 7, 2017 11
Section VI. Growth and School Performance Grades (District Schools
and Charter Schools)
Though only counted as 20% of the overall SPG, the amount of growth a school’s students
demonstrate for the year indicates the school’s success in moving student achievement forward, a
key criterion for sustained improvement. For 2016–17, 73.7% of all schools, district and charter,
met or exceeded growth expectations. Table 12 and Figure 12 provide the percent of schools for
each growth designation by school type.
Table 12. Growth Status of Schools with School Performance Grades by School Type (District
Schools and Charter Schools)
Growth Status
Elementary School Middle School High School
Number Percent Number Percent Number Percent
Exceeds Expected Growth 289 23.6 186 27.8 190 33.3
Meets Expected Growth 693 56.7 284 42.4 207 36.3
Does Not Meet Growth 241 19.7 200 29.9 174 30.5
Total 1,223 670 571
Figure 12. Growth status by school type
Data shows that of the 2,464 schools with both a SPG and a school accountability growth status,
1,849 (75.0%) met or exceeded growth, and of those schools: 171 (9.2%) earned an A/A+NG, 632
(34.2%) earned a B, and 738 (39.9%) earned a C (see Table 13 and Figure 13).
Table 13. Performance Grade by School Accountability Growth (District Schools and Charter
Schools)
Meets or Exceeds
Expected Growth
Exceeds Expected
Growth
Meets Expected
Growth
Does Not Meet
Expected Growth
Grade Number Percent Number Percent Number Percent Number Percent
A+NG 86 4.7 45 6.8 41 3.5 1 0.2
A 85 4.6 52 7.8 33 2.8 1 0.2
B 632 34.2 288 43.3 344 29.1 73 11.9
C 738 39.9 227 34.1 511 43.2 290 47.2
D 270 14.6 52 7.8 218 18.4 193 31.4
F 38 2.1 1 0.2 37 3.1 57 9.3
Total 1,849 665 1,184 615
*Due to rounding the percent of schools may not total 100%.
23.6
56.7
19.7
Elementary School
27.8
42.4
29.9
Middle School
33.3
36.3
30.5
High School
Exceeds Meets Does Not Meet

NCDPI/ODSS/AS/LM/September 7, 2017 12
Figure 13. Performance grades of schools by growth designations
Section VII. Performance Grade by School Poverty Percentage
(District Schools and Charter Schools)
Data for the poverty percentages were available for 2,473 schools. Table 14 and Figure 14 show
for each letter grade the percent of all schools reporting poverty at 50% or more of their students
or reporting poverty at 50% or less of their students. Schools with greater poverty earned fewer
letter grades of A/A+NG and B and earned more C’s, D’s, and F’s than schools with less poverty.
Table 14. Number and Percent of Schools by Letter Grade and School Poverty Percentage
(District Schools and Charter Schools) *
Total
Number of
Schools
Schools with 50% or
More Poverty
Schools with Less than
50% Poverty
Grade Number Percent Number Percent
A+NG 87 9 10.3 78 89.7
A 91 15 16.5 76 83.5
B 705 219 31.1 486 68.9
C 1,029 713 69.3 316 30.7
D 463 425 91.8 38 8.2
F 98 96 98.0 2 2.0
Total 2,473 1,477 996
*Data Source: 2016–17 Eligible School Summary Report
4.74.6
34.2
39.9
14.6
2.1
Schools Meeting or Exceeding
Growth
A (85)
B (632)
C (738)
D (270)
F (38)
A+NG (86)
0.2 0.2
11.9
47.2
31.4
9.3
Schools Not Meeting
Growth
A (1)
B (73)
C (290)
D (193)
F (57)
A+NG (1)

NCDPI/ODSS/AS/LM/September 7, 2017 13
Figure 14. Bar graph showing school performance grades by school poverty percentage
Section VIII: Reading and Mathematics Performance Grades for
Elementary and Middle Schools
Schools with grades 3–8 report a separate letter grade for reading and for mathematics based on
the EOG test scores. Like the overall SPGs, the reading and mathematics grades include
achievement (80%) and growth (20%). Table 15 and Figure 15 provide this information by the
number and percent of grades earned for all schools. A+NG designations are not assigned to
reading and mathematics performance grades.
Table 15. Number and Percent of Schools’ Reading and Mathematics Letter Grades (District
Schools and Charter Schools)*
Grade
Reading Mathematics
Number Percent Number Percent
A 58 2.9 86 4.3
B 458 23.1 466 23.5
C 846 42.6 755 38.0
D 518 26.1 497 25.0
F 106 5.3 182 9.2
Total 1,986 1,986
*Due to rounding, the percent of schools may not total 100%.
A B C D F
50% or More Poverty 10.3 16.5 31.1 69.3 91.8 98.0
Less than 50% Poverty 89.7 83.5 68.9 30.7 8.2 2.0
0.0
20.0
40.0
60.0
80.0
100.0
Grades by School Poverty Percentage
A+NG

NCDPI/ODSS/AS/LM/September 7, 2017 14
Figure 15. Performance grades for reading and mathematics
Table 16 and Figure 16 show the distribution of reading grades for district schools and charter
schools.
Table 16. Number and Percent of Reading Grades by District Schools and Charter Schools*
Grade
District Schools Charter Schools
Number Percent Number Percent
A 47 2.6 11 7.0
B 388 21.2 70 44.3
C 802 43.9 44 27.8
D 497 27.2 21 13.3
F 94 5.1 12 7.6
Total 1,828 158
*Due to rounding, the percent of schools may not total 100%.
Figure 16. Distribution of reading grades for district schools and charter schools
2.9
23.1
42.6
26.1
5.3
Reading Grades
A (58)
B (458)
C (846)
D (518)
F (106)
4.3
23.5
38.0
25.0
9.2
Mathematics Grades
A (86)
B (466)
C (755)
D (497)
F (182)
2.6
21.2
43.9
27.2
5.1
Reading Grades
District Schools
A (47)
B (388)
C (802)
D (497)
F (94)
7.0
44.3
27.8
13.3
7.6
Reading Grades
Charter Schools
A (11)
B (70)
C (44)
D (21)
F (12)

NCDPI/ODSS/AS/LM/September 7, 2017 15
Table 17 and Figure 17 show the distribution of mathematics grades for district schools and
charter schools.
Table 17. Mathematics Grades by District Schools and Charter Schools
Grade
District Schools Charter Schools
Number Percent Number Percent
A 75 4.1 11 7.0
B 434 23.7 32 20.3
C 699 38.2 56 35.4
D 464 25.4 33 20.9
F 156 8.5 26 16.5
Total 1,828 158
Figure 17. Distribution of mathematics grades for district schools and charter schools
Table 18 and Figure 18 show for each reading letter grade the percent of all schools who are
reporting poverty at 50% or more of their students and that are reporting poverty at 50% or less
of their students.
Table 18. Number and Percent of Schools by Reading Grade and School Poverty Percentage
Grade
Total
Number
of Schools
Schools with 50% or More
Poverty
Schools with Less than 50%
Poverty
Number Percent Number Percent
A 58 3 5.2 55 94.8
B 457 109 23.9 348 76.1
C 846 597 70.6 249 29.4
D 518 478 92.3 40 7.7
F 105 105 100.0 0.0 0.0
Total 1,984 1,292 692
4.1
23.7
38.2
25.4
8.5
Mathematics Grades
District Schools
A (75)
B (434)
C (699)
D (464)
F (156)
7.0
20.3
35.4
20.9
16.5
Mathematics Grades
Charter Schools
A (11)
B (32)
C (56)
D (33)
F (26)

NCDPI/ODSS/AS/LM/September 7, 2017 16
Figure 18. Reading grades by school poverty percentage
Table 19 and Figure 19 show for each mathematics letter grade the percent of all schools who are
reporting poverty at 50% or more of their students and that are reporting poverty at 50% or less
of their students.
Table 19. Number and Percent of Schools by Mathematics Grade and School Poverty
Percentage
Grade
Total
Number
of Schools
Schools with 50% or More
Poverty
Schools with Less than 50%
Poverty
Number Percent Number Percent
A 86 9 10.5 77 89.5
B 465 194 41.7 271 58.3
C 755 489 64.8 266 35.2
D 497 430 86.5 67 13.5
F 181 170 93.9 11 6.1
Total 1,984 1,292 692
Figure 19. Mathematics grades by school poverty percentage
A B C D F
50% or More Poverty 5.2 23.9 70.6 92.3 100.0
Less than 50% Poverty 94.8 76.1 29.4 7.7 0.0
0.0
20.0
40.0
60.0
80.0
100.0
Reading Grades by School Poverty Percentage
A B C D F
50% or More Poverty 10.5 41.7 64.8 86.5 93.9
Less than 50% Poverty 89.5 58.3 35.2 13.5 6.1
0.0
20.0
40.0
60.0
80.0
100.0
Mathematics Grades by School Poverty Percentage

NCDPI/ODSS/AS/LM/September 7, 2017 17
Section IX. Performance Grades by State Board Districts (District
Schools and Charter Schools)
The distributions of SPGs, Growth Designations, Reading Grades, and Mathematics Grades by
State Board of Education districts are presented in Tables 20–23.
Table 20. Number and Percent of School Performance Grades by State School Board District*
District Overall Performance Grade Total
Schools A+NG A B C D F
Northeast Number 1 3 33 69 47 11
164 Percent 0.6 1.8 20.1 42.1 28.7 6.7
Southeast Number 5 9 60 104 49 8
235 Percent 2.1 3.8 25.5 44.3 20.9 3.4
North
Central
Number 22 22 154 203 105 28 534
Percent 4.1 4.1 28.8 38.0 19.7 5.2
Sandhills Number 4 7 54 120 57 11
253 Percent 1.6 2.8 21.3 47.4 22.5 4.3
Piedmont-
Triad
Number 12 18 117 176 76 24 423
Percent 2.8 4.3 27.7 41.6 18.0 5.7
Southwest Number 36 23 134 186 109 15
503 Percent 7.2 4.6 26.6 37.0 21.7 3.0
Northwest Number 3 5 67 99 10 1
185 Percent 1.6 2.7 36.2 53.5 5.4 0.5
Western Number 4 7 87 73 8 0
179 Percent 2.2 3.9 48.6 40.8 4.5 0.0
Virtual** Number 0 0 0 0 2 0
2 Percent 0 0 0 0 100.0 0
*Due to rounding, the percent of schools may not total 100%.
**The two virtual charter schools serve students across the state and are not assigned to a
specific district.
NCDPI/ODSS/AS/LM/September 7, 2017 18
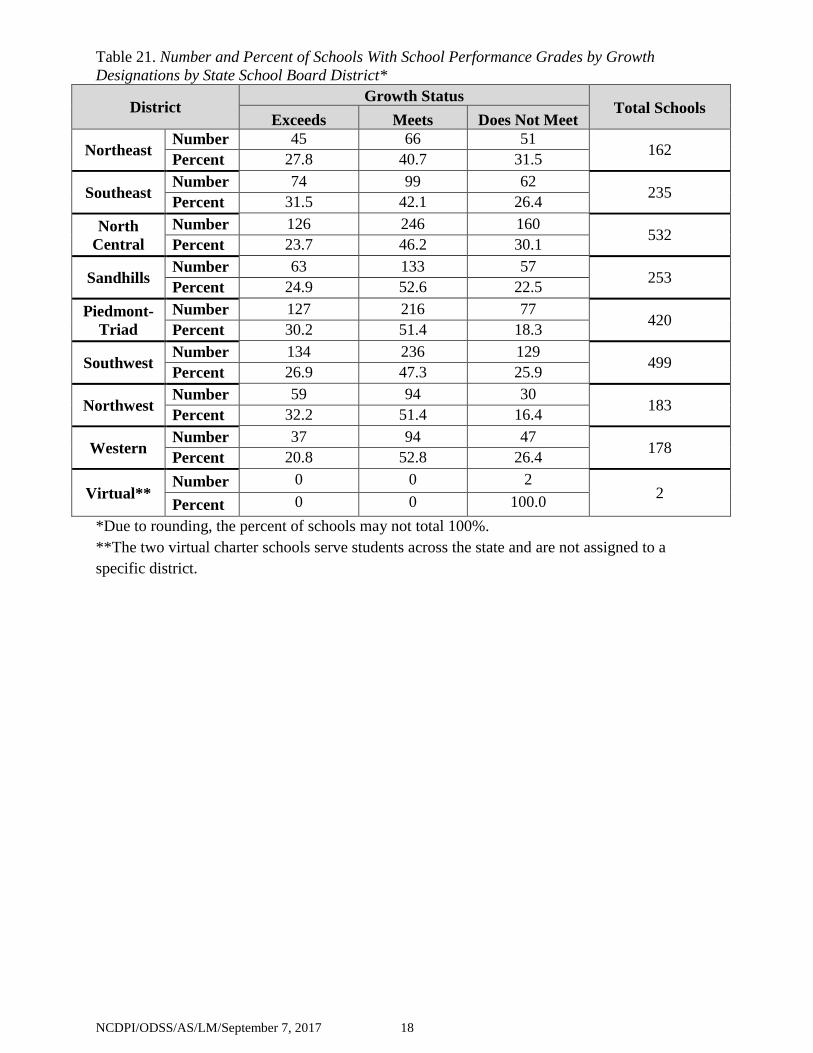
Table 21. Number and Percent of Schools With School Performance Grades by Growth
Designations by State School Board District*
District Growth Status
Total Schools Exceeds Meets Does Not Meet
Northeast Number 45 66 51
162 Percent 27.8 40.7 31.5
Southeast Number 74 99 62
235 Percent 31.5 42.1 26.4
North
Central
Number 126 246 160 532
Percent 23.7 46.2 30.1
Sandhills Number 63 133 57
253 Percent 24.9 52.6 22.5
Piedmont-
Triad
Number 127 216 77 420
Percent 30.2 51.4 18.3
Southwest Number 134 236 129
499 Percent 26.9 47.3 25.9
Northwest Number 59 94 30
183 Percent 32.2 51.4 16.4
Western Number 37 94 47
178 Percent 20.8 52.8 26.4
Virtual** Number 0 0 2
2 Percent 0 0 100.0
*Due to rounding, the percent of schools may not total 100%.
**The two virtual charter schools serve students across the state and are not assigned to a
specific district.
NCDPI/ODSS/AS/LM/September 7, 2017 19
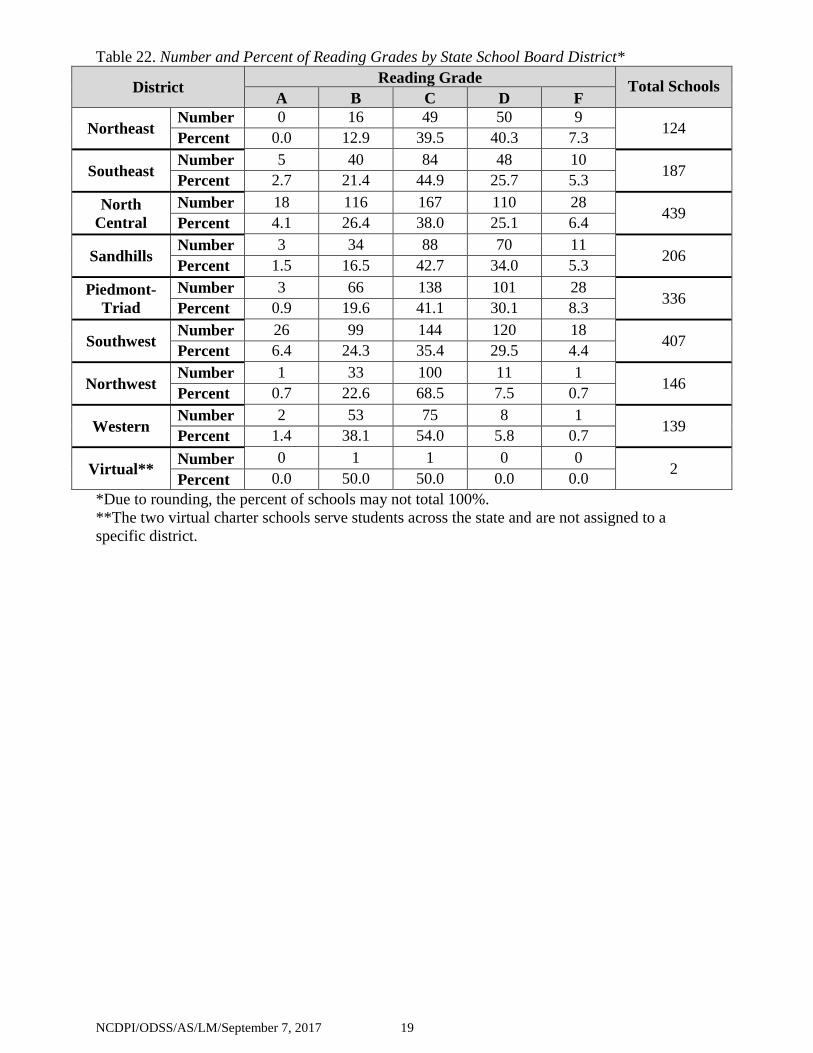
Table 22. Number and Percent of Reading Grades by State School Board District*
District Reading Grade
Total Schools A B C D F
Northeast Number 0 16 49 50 9
124 Percent 0.0 12.9 39.5 40.3 7.3
Southeast Number 5 40 84 48 10
187 Percent 2.7 21.4 44.9 25.7 5.3
North
Central
Number 18 116 167 110 28 439
Percent 4.1 26.4 38.0 25.1 6.4
Sandhills Number 3 34 88 70 11
206 Percent 1.5 16.5 42.7 34.0 5.3
Piedmont-
Triad
Number 3 66 138 101 28 336
Percent 0.9 19.6 41.1 30.1 8.3
Southwest Number 26 99 144 120 18
407 Percent 6.4 24.3 35.4 29.5 4.4
Northwest Number 1 33 100 11 1
146 Percent 0.7 22.6 68.5 7.5 0.7
Western Number 2 53 75 8 1
139 Percent 1.4 38.1 54.0 5.8 0.7
Virtual** Number 0 1 1 0 0
2 Percent 0.0 50.0 50.0 0.0 0.0
*Due to rounding, the percent of schools may not total 100%.
**The two virtual charter schools serve students across the state and are not assigned to a
specific district.

NCDPI/ODSS/AS/LM/September 7, 2017 20
Table 23. Number and Percent of Mathematics Grades by State School Board District*
District Mathematics Grade
Total Schools A B C D F
Northeast Number 0 16 39 49 20
124 Percent 0.0 12.9 31.5 39.5 16.1
Southeast Number 7 33 77 52 18
187 Percent 3.7 17.6 41.2 27.8 9.6
North
Central
Number 23 102 160 107 47 439
Percent 5.2 23.2 36.4 24.4 10.7
Sandhills Number 2 41 70 70 23
206 Percent 1.0 19.9 34.0 34.0 11.2
Piedmont-
Triad
Number 9 78 130 86 33 336
Percent 2.7 23.2 38.7 25.6 9.8
Southwest Number 36 98 148 87 38
407 Percent 8.8 24.1 36.4 21.4 9.3
Northwest Number 4 42 76 23 1
146 Percent 2.7 28.8 52.1 15.8 0.7
Western Number 5 56 55 22 1
139 Percent 3.6 40.3 39.6 15.8 0.7
Virtual** Number 0 0 0 1 1
2 Percent 0.0 0.0 0.0 50.0 50.0
*Due to rounding, the percent of schools may not total 100%.
**The two virtual charter schools serve students across the state and are not assigned to a
specific district.
Section X. Alternative Schools
In consideration of the limited data available for alternative schools, State Board of Education
policy provides an alternative accountability model for alternative schools to report their overall
achievement and growth performance, in lieu of required participation in School Performance
Grades. Schools in this model include alternative schools, North Carolina Department of Public
Instruction (NCDPI)-approved special education schools, and schools identified as
Developmental Day Centers. Table 24 provides information on the options selected by the
alternative schools.
Table 24. Alternative Accountability Model Options
SBE Policy
Selection Number of Schools Description of Option and Outcomes
Option A 0 Participate in School Performance Grades
Option B 4 All data sent back to base schools within the district
Option C 81 Alternative Progress Model
Option D 11 Schools submitted individual reports to NCDPI
Total 96

NCDPI/ODSS/AS/LM/September 7, 2017 21
Alternative schools who select Option C under the alternative model are evaluated based on their
performance in the current year compared to the previous year. Schools are considered
“Maintaining” if results stay within +/-3 points of the previous year. If more or less than 3 points
are earned, the schools are “Progressing” or “Declining” respectively. Table 25 shows the
results for the schools selecting Option C.
Table 25. Alternative Accountability Model Option C results*
Option C Results Number of Schools Percent of Schools
Progressing 18 22.2
Maintaining 41 50.6
Declining 22 27.2
Total 81
*Due to rounding, the percent of schools may not total 100%.
Under Option D, alternative schools are able to develop an alternative accountability model and
present their proposal to the State Board of Education for approval. After approval, schools are
required to submit a report, which is posted with the accountability reports.
The results of the schools that chose Option C or Option D are located at
http://www.ncpublicschools.org/accountability/reporting/.
Section XI. State Board of Education Goals
The State Board of Education (SBE) implemented a strategic plan with the vision that “every
public school student will graduate ready for post-secondary education and work, prepared to be
globally engaged and productive citizens.” Table 26 provides information showing results based
on the goals set for assessment and accountability measures. Unless specified, results include
data in all district schools and charter schools.
Table 26. State Board of Education Goals
Objective Measure
2015–16
Target
2015–16
Actual
2016–17
Target
2016–17
Actual
1.2 1.2.1 The ACT (Minimum 17
Composite) 71.1 59.9 75.3 58.8
1.3 1.3.1 ACT WorkKeys (Silver or
Better) 73.6 73.5 75.1 73.3
1.5 1.5.1a Percent Proficient
(EOG/EOC)* 47.3 48.8 47.7 49.2
1.5 1.5.1b Percent Proficient
(EOG/EOC)** 56.9 58.3 57.2 59.2
1.5 1.5.2 School Growth
(Meet/Exceed) 75.0 73.6 75.0 73.7
2.4 2.4.1a Charter Schools 60% or
higher Performance Composite* 43.0 37.8 45.0 33.7
2.4 2.4.1b Charter Schools 60% or
higher Performance Composite** 58.0 59.0 60.0 58.4
2.4 2.4.2 Charter Schools’ Growth
(Meet/Exceed) 75.0 70.4 75.0 70.1
2.5 2.5.1 Percent of Low-Performing
Schools 23.6 20.0 22.6 20.3

NCDPI/ODSS/AS/LM/September 7, 2017 22
Objective Measure
2015–16
Target
2015–16
Actual
2016–17
Target
2016–17
Actual
2.5 2.5.2 Percent of Low-Performing
Districts 9.6 8.7 5.2 9.6
*Based on Level 4 and above (CCR standard)
**Based on Level 3 and above (GLP standard)
Section XII. Low-Performing Schools and Districts The North Carolina General Assembly has enacted requirements to identify low-performing
schools, low-performing districts, and recurring low-performing schools based on legislative
requirements. The identification of these schools and districts requires them to develop plans for
improvement.
The overall number of low performing schools and districts has increased with the 2016–17
Accountability results. The recurring Low Performing Schools number has also increased by 53
from the previous year. Though the overall numbers for the state have increased, districts have
schools previously identified as low performing that are no longer low performing and schools
identified as low performing in 2016–17 that were not low performing last year. Table 27
displays the overall changes from 2015–16 to 2016–17.
Table 27. Number of Low-Performing Schools and Districts
2015–16 2016–17 Difference
Low-Performing Schools 489 505 +16
Low-Performing Districts 10 11 +1
Recurring Low-Performing Schools 415 468 +53
The lists of low-performing schools and districts can be found on the Accountability Services
website at http://www.ncpublicschools.org/accountability/reporting/.