Embed Size (px)
Citation preview

Annual Report
2015
A Strategic Investor inCanadian Mortgages

2015 ANNUAL REPORT | MCAN MORTGAGE CORPORATION
‐ 2 ‐
DESCRIPTION OF BUSINESS
MCAN Mortgage Corporation (“MCAN”) is a public company listed on the Toronto Stock Exchange (“TSX”) under the symbol MKP and is a reporting issuer in all provinces and territories in Canada. MCAN is a Loan Company under the Trust and Loan Companies Act (Canada) (the “Trust Act”) and also qualifies as a mortgage investment corporation (“MIC”) under the Income Tax Act (Canada) (the “Tax Act”). Our objective is to generate a reliable stream of income by investing our funds in a portfolio of mortgages (including single family residential, residential construction, non‐residential construction and commercial loans), as well as other types of loans and investments, real estate and securitization investments. We employ leverage by issuing term deposits eligible for Canada Deposit Insurance Corporation (“CDIC”) deposit insurance up to a maximum of five times capital (on a non‐consolidated basis in the MIC entity) as limited by the provisions of the Tax Act applicable to a MIC. Our term deposits are sourced through a network of independent financial agents. As a MIC, we are entitled to deduct from income for tax purposes 50% of capital gains dividends and 100% of non‐capital gains dividends that we pay to shareholders. Such dividends are received by our shareholders as capital gains dividends and interest income, respectively. MCAN’s wholly‐owned subsidiary, Xceed Mortgage Corporation (“Xceed”), focuses on the origination and sale to MCAN and third party mortgage aggregators of residential first‐charge mortgage products across Canada. As such, Xceed operates primarily in one industry segment through its sales team and mortgage brokers.
TABLE OF CONTENTS
PRESIDENT AND CEO’S MESSAGE TO SHAREHOLDERS .................................................................................................. 3
MANAGEMENT’S DISCUSSION AND ANALYSIS OF OPERATIONS ................................................................................... 5
CONSOLIDATED FINANCIAL STATEMENTS ................................................................................................................... 61
NOTES TO CONSOLIDATED FINANCIAL STATEMENTS .................................................................................................. 65
DIRECTORS ................................................................................................................................................................. 101
CORPORATE INFORMATION AND EXECUTIVE OFFICERS ........................................................................................... 102

2015 ANNUAL REPORT | MCAN MORTGAGE CORPORATION
‐ 3 ‐
MESSAGE TO SHAREHOLDERS MCAN Mortgage Corporation (“MCAN”, the “Company” or “we”) reported record net income for the year ended December 31, 2015 of $32.9 million, up 29% from $25.4 million in 2014. Earnings per share increased to $1.51 from $1.23, while return on average shareholders’ equity increased to 13.45% from 11.50%. The increase in net income was a result of a $4.6 million increase in securitization income from significant growth in our market mortgage‐backed securities (“MBS”) program mortgage portfolio, a $3.9 million increase in income from our equity investment in MCAP Commercial LP (“MCAP”) and a $2.5 million income distribution received on a commercial real estate investment in 2015, partially offset by a $1.2 million increase in the realized and unrealized loss from derivative financial instruments, a $1.1 million increase in operating expenses and a $1.1 million non‐recurring gain on sale of foreclosed real estate in 2014. Consistent with the prior quarter dividend increase, the Board of Directors declared a first quarter regular dividend of $0.29 per share to be paid March 31, 2016 to shareholders of record as of March 15, 2016. Corporate Assets Corporate assets totalled $1.16 billion at December 31, 2015, up $110 million from December 31, 2014. The Company’s growth of 10.5% in corporate assets for the year met its annualized 10% growth target. The corporate mortgage portfolio increased to $944 million at December 31, 2015, an increase of $49 million during the year, which included increases of $70 million in uninsured single family, $34 million in commercial and $10 million in completed inventory and decreases of $49 million in insured single family and $16 million in construction. We experienced growth in uninsured single family during 2015 through the continued expansion of our Xceed mortgage origination platform. We continued to take a measured approach to new loan originations as a result of a weakening economy and economic uncertainty in Canada, particularly in Alberta. The repositioning of the geographic concentration targets for the construction portfolio resulted in a 20% decrease in Alberta‐based corporate mortgages. Our repositioned origination with greater emphasis for growth in the Ontario corporate portfolio resulted in a 33% increase in that province’s outstanding balance. Portfolio quality improved in 2015. The impaired total mortgage ratio improved significantly to 0.11% at December 31, 2015 from 0.50% at December 31, 2014, while the impaired corporate mortgage ratio was 0.23%, improved from 0.92% at December 31, 2014. Both decreases were a result of the payout of impaired construction loans. Total mortgage arrears were $34 million at December 31, 2015, down $4 million from December 31, 2014. Economic volatility and continued weakness in oil prices continue to impact housing markets in Western Canada where job losses are expected to impact mortgage arrears. While our mortgage arrears decreased during 2015, we continue to remain vigilant and have adopted more conservative underwriting standards. Equity income from our investment in MCAP was $10.1 million in 2015, up from $6.2 million in 2014. MCAP had significant increases in income from securitized mortgages and origination fee income, partly offset by hedge losses incurred during 2015. Historically, MCAP’s annual earnings have been increasing with the growth of its mortgage originations and assets under administration. MCAP’s origination volumes were $14.3 billion in 2015. MCAP had $53.1 billion of assets under administration as at November 30, 2015. Securitization Assets Securitization activities in 2015 were strong with growth of 45% in outstanding securitized mortgages. During 2015 we issued and sold $589 million of new MBS to third parties through the market MBS program. As a result, income from the market MBS program increased significantly to $4.5 million due to 151% growth in the average market MBS portfolio balance from 2014. In December the company sold the residual economics (the “interest‐only strips”) associated with $147 million of mortgages that had been securitized through the market MBS program to a third party. The sale allowed us to derecognize the associated mortgages from our balance sheet and reduce the related capital utilization for regulatory purposes. This was the first sale of interest only strips that we have completed since 2012. We slowed origination volumes and our MBS securitization activities in the fourth quarter of 2015 due to reduced economics caused by unfavourable MBS spreads and a slower mortgage market caused by a slowing seasonal housing market. We continue to focus on internal origination through Xceed in the MBS program, as our retention of renewal rights on these mortgages improves profitability. In the fourth quarter of 2015 we commenced a program to upgrade the underwriting processes in our single family mortgage operations which also included the implementation of a new mortgage underwriting system. We believe that these enhancements will improve our capabilities in growing the Xceed platform for single family mortgage origination.

2015 ANNUAL REPORT | MCAN MORTGAGE CORPORATION
‐ 4 ‐
We believe that MCAN had a good year in 2015 with record net income reported despite the volatility in mortgage and financial markets. Considerable efforts went into repositioning our origination pipeline early in the year to moderate our exposure to Alberta where housing markets are being impacted by the decline in oil prices and weakening employment. We were also able to build origination in Ontario and British Columbia resulting in mortgage growth that achieved our target corporate asset growth objective of 10% by year end. This has allowed us to make use of the proceeds of the rights offering completed in July that generated $15.1 million of new share capital and created $87 million of additional income tax asset capacity. We have been vigilant in actively managing mortgage arrears which has resulted in a significant improvement in portfolio quality. Our focus for 2016 will be on managing the growth of corporate assets through challenging economic conditions. Earnings stability starts with a sound strategy and a grasp of market opportunity versus market risk. MCAN has raised capital, and we believe our balance sheet is very well positioned with low impaired mortgage ratios and arrears. We are focused on asset quality. We will continue to build our origination capabilities to maintain a scalable business that we believe is flexible in providing product and geographic diversification. With over half of our assets in insured mortgages, we have a balance sheet that, in our view, provides a solid risk adjusted return to our shareholders. We believe that we are well capitalized and positioned to invest when opportunities arise.
William Jandrisits President and Chief Executive Officer

2015 ANNUAL REPORT | MCAN MORTGAGE CORPORATION
‐ 5 ‐
MANAGEMENT’S DISCUSSION AND ANALYSIS OF OPERATIONS
This Management’s Discussion and Analysis of Operations (“MD&A”) should be read in conjunction with the consolidated balance sheets and accompanying notes as at December 31, 2015 and December 31, 2014 and the consolidated statements of income, changes in shareholders’ equity, comprehensive income and cash flows for the years then ended, which have been prepared in accordance with International Financial Reporting Standards (“IFRS”) and presented in Canadian currency. This MD&A has been presented as at February 25, 2016. Additional information regarding MCAN Mortgage Corporation (“MCAN”, the “Company” or “we”), including copies of our continuous disclosure materials such as the Annual Information Form, are available on the System for Electronic Document Analysis and Retrieval (“SEDAR”) at www.sedar.com and our website at www.mcanmortgage.com.
TABLE OF CONTENTS ‐ MD&A
A CAUTION ABOUT FORWARD‐LOOKING INFORMATION AND STATEMENTS .................................................................................. 6
SELECTED FINANCIAL INFORMATION ............................................................................................................................................... 8
HIGHLIGHTS .................................................................................................................................................................................... 10
OUTLOOK ........................................................................................................................................................................................ 11
RESULTS OF OPERATIONS ............................................................................................................................................................... 12
FINANCIAL POSITION ...................................................................................................................................................................... 20
SELECTED QUARTERLY FINANCIAL DATA ........................................................................................................................................ 30
SUMMARY OF FOURTH QUARTER RESULTS .................................................................................................................................... 31
SECURITIZATION PROGRAMS ......................................................................................................................................................... 35
CAPITAL MANAGEMENT ................................................................................................................................................................. 37
LIQUIDITY MANAGEMENT .............................................................................................................................................................. 42
RISK GOVERNANCE & MANAGEMENT ............................................................................................................................................ 43
DESCRIPTION OF CAPITAL STRUCTURE ........................................................................................................................................... 52
OFF‐BALANCE SHEET ARRANGEMENTS ......................................................................................................................................... 52
DIVIDEND POLICY AND RECORD ..................................................................................................................................................... 53
TRANSACTIONS WITH RELATED PARTIES ........................................................................................................................................ 54
FINANCIAL INSTRUMENTS AND OTHER INSTRUMENTS .................................................................................................................. 54
PEOPLE ............................................................................................................................................................................................ 54
REGULATORY COMPLIANCE ............................................................................................................................................................ 54
INTERNAL AUDIT ............................................................................................................................................................................. 54
CRITICAL ACCOUNTING ESTIMATES AND JUDGMENTS .................................................................................................................. 54
STANDARDS ISSUED BUT NOT YET EFFECTIVE ................................................................................................................................ 56
DISCLOSURE CONTROLS AND PROCEDURES AND INTERNAL CONTROLS OVER FINANCIAL REPORTING ........................................ 57
NON‐IFRS MEASURES ...................................................................................................................................................................... 57

2015 ANNUAL REPORT | MCAN MORTGAGE CORPORATION
‐ 6 ‐
A CAUTION ABOUT FORWARD‐LOOKING INFORMATION AND STATEMENTS This MD&A contains “forward‐looking statements” within the meaning of applicable Canadian securities laws. The words “may,” “believe,” “will,” “anticipate,” “expect,” “planned,” “estimate,” “project,” “future,” and other expressions that are predictions of or indicate future events and trends and that do not relate to historical matters identify forward‐looking statements. Such statements reflect management’s current beliefs and are based on information currently available to management. The forward‐looking statements in this MD&A include, among others, statements and assumptions with respect to: • the current business environment and outlook; • possible or assumed future results; • ability to create shareholder value; • business goals and strategy; • the stability of home prices; • effect of challenging conditions on us; • factors affecting our competitive position within the housing markets; • the price of oil and its impact on housing markets in Western Canada; • sufficiency of our access to capital resources; and • the timing of the effect of interest rate changes on our cash flows. The material factors or assumptions that were identified and applied by us in drawing conclusions or making forecasts or projections set out in the forward‐looking statements include, but are not limited to: • the Company’s ability to successfully implement and realize on its business goals and strategy; • factors and assumptions regarding interest rates; • housing sales and residential mortgage borrowing activities; • the effect of competition; • government regulation of the Company’s business; • computer failure or security breaches; • future capital and funding requirements; • the value of mortgage originations; • the expected margin between interest earned on mortgage portfolios and interest paid on deposits; • the relative continued health of real estate markets; • acceptance of the Company’s products in the marketplace; • availability of key personnel; • the Company’s operating cost structure; and • the current tax regime. Reliance should not be placed on forward‐looking statements because they involve known and unknown risks, uncertainties and other factors, which may cause the actual results to differ materially from the anticipated future results expressed or implied by such forward‐looking statements. Factors that could cause actual results to differ materially from those set forth in the forward‐looking statements include, but are not limited to: • global market activity; • worldwide demand for and related impact on oil and other commodity prices; • changes in government and economic policy; • changes in general economic, real estate and other conditions; • changes in interest rates; • changes in MBS spreads and swap rates; • MBS and mortgage prepayment rates; • mortgage rate and availability changes; • adverse legislation or regulation; • availability of MBS issuer allocation; • technology changes; • confidence levels of consumers; • ability to raise capital and term deposits on favourable terms; • our debt and leverage; • competitive conditions in the homebuilding industry, including product and pricing pressures; • ability to retain our executive officers and other employees; • litigation risk; • relationships with our mortgage originators; • additional risks and uncertainties, many of which are beyond our control, referred to in this MD&A and our other public filings
with the applicable Canadian regulatory authorities.

2015 ANNUAL REPORT | MCAN MORTGAGE CORPORATION
‐ 7 ‐
Subject to applicable securities law requirements, we undertake no obligation to publicly update any forward‐looking statements whether as a result of new information, future events or otherwise. However, any further disclosures made on related subjects in subsequent reports should be consulted.
ACRONYMS
ALCO Asset and Liability Committee HELOC Home Equity Line of Credit MBS Mortgage Backed Securities
BCBS Basel Committee on Banking Supervision
IAS International Accounting Standard
MD&A Management’s Discussion & Analysis
CAR Capital Adequacy Requirements
IASB International Accounting Standards Board
MIC Mortgage Investment Corporation
CDIC Canada Deposit Insurance Corporation
IFRIC IFRS Interpretations Committee
NHA National Housing Act
CET 1 Common Equity Tier 1 IFRS International Financial Reporting Standards
NSFR Net Stable Funding Ratio
CHT Canada Housing Trust IMPP Insured Mortgage Purchase Program
OSFI Office of the Superintendent of Financial Institutions
CMB Canada Mortgage Bonds LAR Liquidity Adequacy Requirements
RCB Risk Committee of the Board
CMHC Canada Mortgage and Housing Corporation
LCR Liquidity Coverage Ratio RAF Risk Appetite Framework
DRIP Dividend Reinvestment Plan LP ARA Limited Partner’s At‐Risk Amount
SEDAR System for Electronic Document Analysis and Retrieval
EIM Effective Interest Rate Method LTV Loan to Value (ratio) TSX Toronto Stock Exchange
2015 ANNUAL REPORT | MCAN MORTGAGE CORPORATION
‐ 8 ‐
SELECTED FINANCIAL INFORMATION
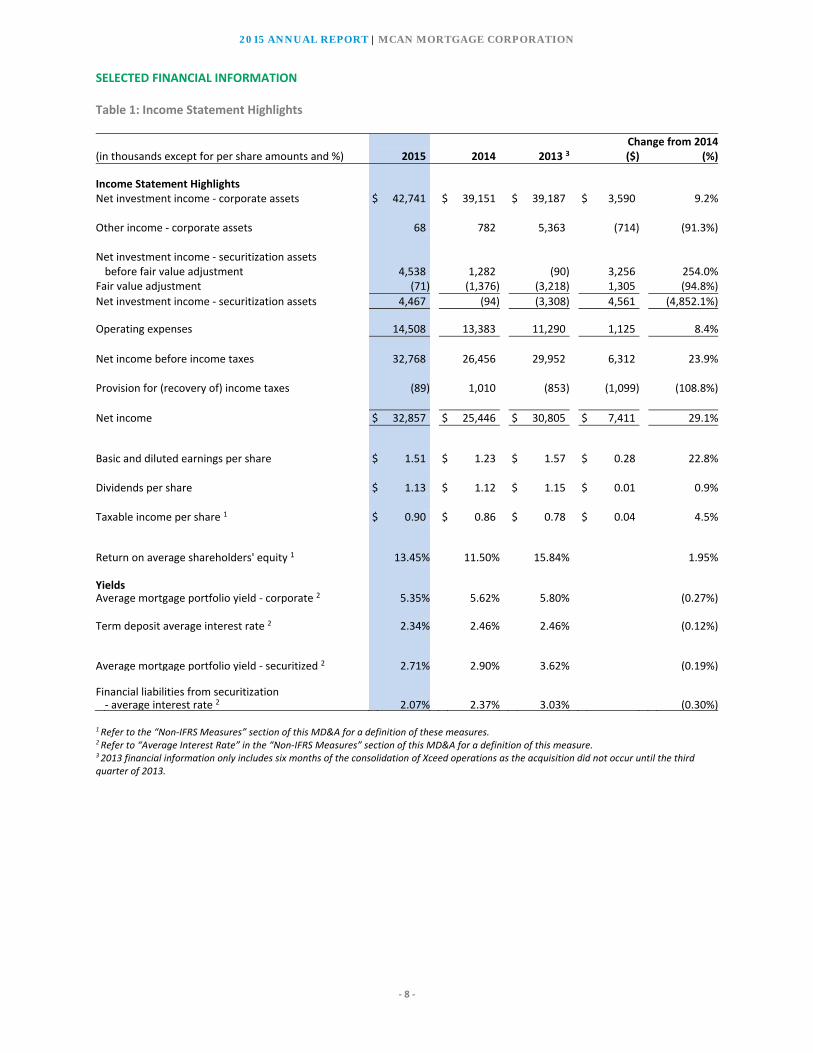
Table 1: Income Statement Highlights
Change from 2014(in thousands except for per share amounts and %) 2015 2014 2013 3 ($) (%)
Income Statement Highlights Net investment income ‐ corporate assets $ 42,741 $ 39,151 $ 39,187 $ 3,590 9.2% Other income ‐ corporate assets 68 782 5,363 (714) (91.3%) Net investment income ‐ securitization assets before fair value adjustment 4,538 1,282 (90) 3,256 254.0%Fair value adjustment (71) (1,376) (3,218) 1,305 (94.8%)
Net investment income ‐ securitization assets 4,467 (94) (3,308) 4,561 (4,852.1%)
Operating expenses 14,508 13,383 11,290 1,125 8.4%
Net income before income taxes 32,768 26,456 29,952 6,312 23.9% Provision for (recovery of) income taxes (89) 1,010 (853) (1,099) (108.8%)
Net income $ 32,857 $ 25,446 $ 30,805 $ 7,411 29.1%
Basic and diluted earnings per share $ 1.51 $ 1.23 $ 1.57 $ 0.28 22.8% Dividends per share $ 1.13 $ 1.12 $ 1.15 $ 0.01 0.9% Taxable income per share 1 $ 0.90 $ 0.86 $ 0.78 $ 0.04 4.5% Return on average shareholders' equity 1 13.45% 11.50% 15.84% 1.95% Yields Average mortgage portfolio yield ‐ corporate 2 5.35% 5.62% 5.80% (0.27%) Term deposit average interest rate 2 2.34% 2.46% 2.46% (0.12%) Average mortgage portfolio yield ‐ securitized 2 2.71% 2.90% 3.62% (0.19%) Financial liabilities from securitization ‐ average interest rate 2 2.07% 2.37% 3.03% (0.30%) 1 Refer to the “Non‐IFRS Measures” section of this MD&A for a definition of these measures. 2 Refer to “Average Interest Rate” in the “Non‐IFRS Measures” section of this MD&A for a definition of this measure. 3 2013 financial information only includes six months of the consolidation of Xceed operations as the acquisition did not occur until the third quarter of 2013.

2015 ANNUAL REPORT | MCAN MORTGAGE CORPORATION
‐ 9 ‐
Table 2: Balance Sheet Highlights
(in thousands except for per share amounts and %) Change from 2014As at December 31 2015 2014 2013 ($) (%) Balance Sheet Highlights
Assets Corporate $ 1,155,046 $ 1,045,352 $ 1,027,176 $ 109,694 10.5% Securitization 1,091,912 760,366 1,066,128 331,546 43.6%Total assets $ 2,246,958 $ 1,805,718 $ 2,093,304 $ 441,240 24.4% Mortgages ‐ corporate $ 944,109 $ 895,467 $ 868,833 $ 48,642 5.4%
Mortgages ‐ securitized $ 1,075,947 $ 741,184 $ 585,196 $ 334,763 45.2%
Liabilities Corporate $ 917,852 $ 834,310 $ 821,396 $ 83,542 10.0% Securitization 1,070,304 746,105 1,057,008 324,199 43.5%Total liabilities $ 1,988,156 $ 1,580,415 $ 1,878,404 $ 407,741 25.8% Shareholders' equity $ 258,802 $ 225,303 $ 214,900 $ 33,499 14.9%
Capital Ratios 1
Income Tax Assets to Capital Ratio 5.11 5.05 5.35 1.2%
Common Equity Tier 1 Capital Ratio (transitional) 23.64% 23.37% 21.36% 0.27%Common Equity Tier 1 Capital Ratio (all‐in) 23.08% 22.62% 20.31% 0.46%
Tier 1 Capital Ratio (transitional) 23.64% 23.37% 21.36% 0.27%Tier 1 Capital Ratio (all‐in) 23.08% 22.62% 20.31% 0.46%
Total Capital Ratio (transitional) 23.64% 23.37% 21.36% 0.27%Total Capital Ratio (all‐in) 23.08% 22.62% 20.31% 0.46%
Leverage ratio 2 9.96% n/a n/a n/aAssets to Capital Multiple 2 n/a 8.14 5.80 n/a Credit Quality
Impaired mortgage ratio (total) 1 0.11% 0.50% 0.51% (0.39%)Impaired mortgage ratio (corporate) 1 0.23% 0.92% 0.84% (0.69%)
Total mortgage arrears $ 34,250 $ 38,405 $ 38,456 $ (4,155) (10.8%)
Common Share Information (end of period)
Number of common shares outstanding 22,782 20,808 20,461 9.5%Book value per common share 1 $ 11.36 $ 10.83 $ 10.50 $ 0.53 4.9%Common share price ‐ close $ 12.14 $ 14.40 $ 13.00 $ (2.26) (15.7%)Market capitalization 1 $ 276,573 $ 299,635 $ 265,993 $ (23,062) (7.7%)
1 Refer to the “Non‐IFRS Measures” section of this MD&A for a definition of these measures. 2 Mortgages securitized through the market MBS program for which derecognition has not been achieved are included in regulatory assets in the leverage ratio and assets to capital multiple. The leverage ratio replaced the assets to capital multiple effective January 1, 2015 such that the leverage ratio is n/a for 2013 and 2014 and the assets to capital multiple is n/a for 2015. For further information, refer to the “Capital Management” section of this MD&A.
2015 ANNUAL REPORT | MCAN MORTGAGE CORPORATION
‐ 10 ‐
HIGHLIGHTS
Income Statement
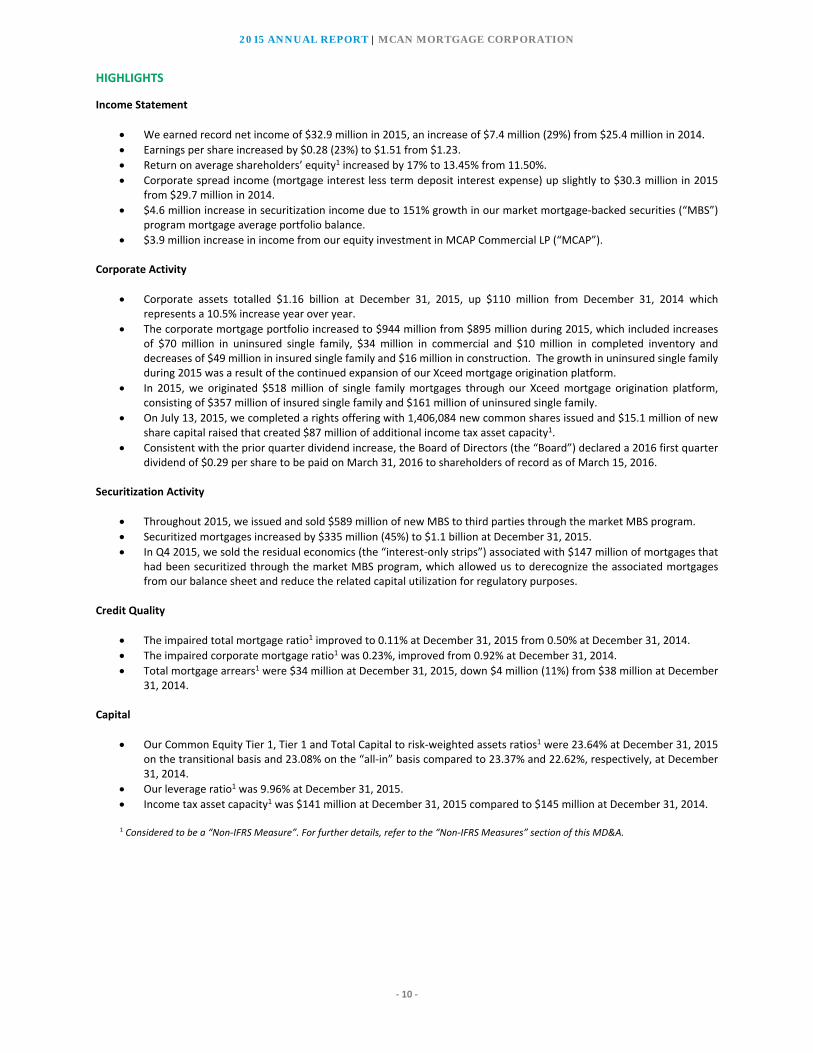
We earned record net income of $32.9 million in 2015, an increase of $7.4 million (29%) from $25.4 million in 2014.
Earnings per share increased by $0.28 (23%) to $1.51 from $1.23.
Return on average shareholders’ equity1 increased by 17% to 13.45% from 11.50%.
Corporate spread income (mortgage interest less term deposit interest expense) up slightly to $30.3 million in 2015 from $29.7 million in 2014.
$4.6 million increase in securitization income due to 151% growth in our market mortgage‐backed securities (“MBS”) program mortgage average portfolio balance.
$3.9 million increase in income from our equity investment in MCAP Commercial LP (“MCAP”).
Corporate Activity
Corporate assets totalled $1.16 billion at December 31, 2015, up $110 million from December 31, 2014 which represents a 10.5% increase year over year.
The corporate mortgage portfolio increased to $944 million from $895 million during 2015, which included increases of $70 million in uninsured single family, $34 million in commercial and $10 million in completed inventory and decreases of $49 million in insured single family and $16 million in construction. The growth in uninsured single family during 2015 was a result of the continued expansion of our Xceed mortgage origination platform.
In 2015, we originated $518 million of single family mortgages through our Xceed mortgage origination platform, consisting of $357 million of insured single family and $161 million of uninsured single family.
On July 13, 2015, we completed a rights offering with 1,406,084 new common shares issued and $15.1 million of new share capital raised that created $87 million of additional income tax asset capacity1.
Consistent with the prior quarter dividend increase, the Board of Directors (the “Board”) declared a 2016 first quarter dividend of $0.29 per share to be paid on March 31, 2016 to shareholders of record as of March 15, 2016.
Securitization Activity
Throughout 2015, we issued and sold $589 million of new MBS to third parties through the market MBS program.
Securitized mortgages increased by $335 million (45%) to $1.1 billion at December 31, 2015.
In Q4 2015, we sold the residual economics (the “interest‐only strips”) associated with $147 million of mortgages that had been securitized through the market MBS program, which allowed us to derecognize the associated mortgages from our balance sheet and reduce the related capital utilization for regulatory purposes.
Credit Quality
The impaired total mortgage ratio1 improved to 0.11% at December 31, 2015 from 0.50% at December 31, 2014.
The impaired corporate mortgage ratio1 was 0.23%, improved from 0.92% at December 31, 2014.
Total mortgage arrears1 were $34 million at December 31, 2015, down $4 million (11%) from $38 million at December 31, 2014.
Capital
Our Common Equity Tier 1, Tier 1 and Total Capital to risk‐weighted assets ratios1 were 23.64% at December 31, 2015 on the transitional basis and 23.08% on the “all‐in” basis compared to 23.37% and 22.62%, respectively, at December 31, 2014.
Our leverage ratio1 was 9.96% at December 31, 2015.
Income tax asset capacity1 was $141 million at December 31, 2015 compared to $145 million at December 31, 2014.
1 Considered to be a “Non‐IFRS Measure”. For further details, refer to the “Non‐IFRS Measures” section of this MD&A.

2015 ANNUAL REPORT | MCAN MORTGAGE CORPORATION
‐ 11 ‐
OUTLOOK Canadian real estate markets are experiencing mixed performances as some regional economies adjust to reduced oil prices and the negative impact on employment, while other regional economies benefit from the lower Canadian dollar and employment strength in the manufacturing sector. As a result, housing markets in the Prairie Provinces are experiencing declines in home sales volumes as the markets adjust to reduced oil prices, slow growth and increasing unemployment. Meanwhile, home sales remain steady in Canada’s largest cities, Toronto and Vancouver, as sales volumes continue to grow and housing inventory levels remain at historical lows due to building lot supply shortages. The rest of the country continues to see stable housing markets as a result of historically low mortgage rates. We expect financial markets to remain volatile for the first half of 2016 with significant fluctuations in stock markets as slowing global growth and volatility in international currencies impact reported earnings and earnings multiples. In Canada the impact of oil and commodity prices continues to impact a significant portion of the market, raising concerns over low or negative economic growth, increases in unemployment rates and the spillover effect to consumer confidence. Volatility in stock markets and the continued weakness in global oil prices could have a negative influence on consumer confidence and the economy in 2016. Consensus forecasted GDP growth rates for Canada are 1.4% in 2016. With low levels of economic growth, the risk of increased interest and mortgage rates is seen as low. We expect housing markets to continue to benefit from low mortgage rates and relatively stable employment in most of the country, with the exception of the Prairie Provinces. Although mortgage rates are expected to remain low, volatility within the bond market could marginally impact mortgage spreads as it did in the later part of 2015. Increased uncertainty in regional employment markets is expected to impact housing markets and could temper price appreciation in those markets. We expect housing sales, both new housing and resale, to decline moderately in the Prairie Provinces for 2016 due to weakness in demand. The key risks to the housing market are the prospects for slow, and possibly negative, economic growth and increases in regional unemployment rates. These factors could have a direct impact on the stability of the regional housing markets, particularly in Alberta. The current level of relatively low mortgage rates should help to support home affordability and keep price appreciation in line with inflation. The impact of oversupply in local housing markets could lead to significant price volatility. We will continue to be diligent in monitoring local housing markets in which we lend and will closely monitor our mortgage portfolio for early indicators of potential performance concerns. We expect construction activity to moderate nationally, with British Columbia and Ontario benefiting from the recent decline in the Canadian dollar and increased exports. Given economic uncertainty and slow growth projections for the Canadian economy, we are closely monitoring our construction portfolio and do not expect to materially grow the construction portfolio in 2016. Our portfolio remains well diversified with projects supported by presales in balanced markets and experienced developers. Our strategy remains focused on growth in our insured and uninsured single family mortgage portfolio sourced through our direct Xceed origination platform. Our current view is that 2016 originations and portfolio growth in single family mortgages will allow us to continue to achieve our annual corporate asset growth target of 10%, which will further diversify and re‐balance our portfolio to optimize return and lower our risk profile. We participated in the MBS securitization market with regular issuances throughout 2015 totaling $589 million. We expect our MBS volumes to moderate in the first half of 2016 as we have reduced our volume expectations in the first quarter to allow for a system upgrade that includes new underwriting software. With origination volumes surpassing $500 million in 2015, the adoption of the new system will facilitate the future growth of the Xceed platform. We believe that this upgrade will enhance its capabilities and productivity as well as enhance our risk management processes.

2015 ANNUAL REPORT | MCAN MORTGAGE CORPORATION
‐ 12 ‐
RESULTS OF OPERATIONS
Table 3: Net Income ‐ For the Years Ended December 31 Change from 2014(in thousands) 2015 2014 ($) (%) Net Investment Income ‐ Corporate Assets Mortgage interest $ 50,997 $ 50,426 $ 571 1% Equity income from MCAP Commercial LP 10,096 6,182 3,914 63% Fees 3,231 2,733 498 18% Marketable securities 2,076 1,925 151 8% Whole loan gain on sale income 626 1,296 (670) (52%) Realized and unrealized gain (loss) on financial instruments (2,914) (1,729) (1,185) 69% Interest on financial investments and other loans 3,506 822 2,684 327% Interest on cash and cash equivalents 730 848 (118) (14%) Gain on sale of foreclosed real estate ‐ 1,115 (1,115) (100%)
68,348 63,618 4,730 7%
Term deposit interest and expenses 20,671 20,709 (38) (0%) Mortgage expenses 3,823 3,820 3 0% Interest on loans payable 838 921 (83) (9%) Provision for (recovery of) credit losses 275 (983) 1,258 (128%)
25,607 24,467 1,140 5%
42,741 39,151 3,590 9%
Other Income ‐ Corporate Assets Gain on sale of investment in MCAP Commercial LP ‐ 711 (711) (100%) Gain on dilution of investment in MCAP Commercial LP 68 71 (3) (4%)
68 782 (714) (91%)
Net Investment Income ‐ Securitization Assets Mortgage interest 25,564 12,383 13,181 106% Interest on financial investments 1 428 (427) (100%) Interest on short‐term investments 76 835 (759) (91%) Other securitization income 121 1,343 (1,222) (91%)
25,762 14,989 10,773 72%
Interest on financial liabilities from securitization 19,763 13,087 6,676 51% Mortgage expenses 1,461 620 841 136%
21,224 13,707 7,517 55%
Net investment income before fair value adjustment 4,538 1,282 3,256 254% Fair value adjustment ‐ derivative financial instruments (71) (1,376) 1,305 (95%)
4,467 (94) 4,561 (4,852%)
Operating Expenses Salaries and benefits 8,515 7,154 1,361 19% General and administrative 5,993 6,229 (236) (4%)
14,508 13,383 1,125 8%
Net Income Before Income Taxes 32,768 26,456 6,312 24%Provision for (recovery of) income taxes (89) 1,010 (1,099) (109%)
Net Income $ 32,857 $ 25,446 $ 7,411 29%
Basic and diluted earnings per share $ 1.51 $ 1.23 $ 0.28 23%Dividends per share $ 1.13 $ 1.12 $ 0.01 1%

2015 ANNUAL REPORT | MCAN MORTGAGE CORPORATION
‐ 13 ‐
Net Income The $7.4 million increase in net income from 2014 was primarily due to higher securitization income from increased market MBS program volumes, an increase in equity income from our investment in MCAP and an income distribution received from a commercial real estate investment, partially offset by an increase in the realized and unrealized loss on financial instruments (caused by unexpected Bank of Canada prime rate decreases), higher operating expenses and a non‐recurring gain on sale of foreclosed real estate in 2014.
Net Investment Income ‐ Corporate Assets Mortgage interest income
Table 4: Interest Income and Average Rate by Mortgage Portfolio (Corporate)
For the Years Ended December 31 2015 2014
Average Interest Average Average Interest Average (in thousands except %) Balance Income Rate 1 Balance Income Rate 1
Single family ‐ Uninsured $ 318,892 $ 15,171 4.74% $ 252,513 $ 13,273 5.23%‐ Insured 143,685 5,154 3.58% 141,945 6,126 4.30%‐ Uninsured ‐ completed inventory 14,534 799 5.48% 48,002 2,652 5.50%Construction loans ‐ Residential 336,762 20,262 5.57% 363,260 20,441 5.60%‐ Non residential 1,186 65 5.52% 2,438 181 7.36%Commercial loans ‐ Uninsured 94,567 9,546 9.28% 88,114 7,753 8.76%
Average mortgages ‐ corporate portfolio $ 909,626 $ 50,997 5.35% $ 896,272 $ 50,426 5.62%
1 Average interest rate is equal to income/expense divided by the average balance on an annualized basis. The average interest rate as presented may not necessarily be equal to “Income/Expense” divided by “Average Balance”, as non‐recurring items such as discount income on impaired loans, deferred interest and prior period adjustments are excluded from the calculation of the average interest rate. Excluding discount income on impaired loans and deferred interest, non‐recurring items are immaterial for the years ended December 31, 2015 and December 31, 2014. Average interest rate is considered to be a non‐IFRS measure. Refer to the “Non‐IFRS Measures” section of this MD&A for a definition of this
measure. The increase in the average uninsured single family mortgage average portfolio was primarily due to increased originations from our internal Xceed origination platform in 2015. The majority of our insured single family originations from this channel were securitized through the market MBS program. The decrease in the construction loan portfolio is a result of the measured approach that we took to new loan originations in early 2015 and the geographic rebalancing of the portfolio given the current economic uncertainty in Western Canada. The decrease in the single family average mortgage portfolio yield is primarily due to lower market rates for the funding of new single family mortgages during 2015. Although the prime rate decreased by 0.30% during 2015, our construction average mortgage portfolio yield only decreased minimally during 2015 as the majority of loans in the portfolio contain an interest rate floor and therefore were not fully impacted by the decrease in the prime rate. Average mortgage portfolio yield is considered to be a non‐IFRS measure. For a definition of this measure, refer to the “Non‐IFRS Measures” section of this MD&A. Current year mortgage interest income includes $1.5 million of discount income from the payout of previously impaired construction loans and $529,000 of deferred interest on a commercial loan, both of which are excluded from the average mortgage portfolio yield as they are non‐recurring items. Equity income from MCAP Equity income from our investment in MCAP increased by $3.9 million (63%) from 2014. MCAP had significant increases in income from securitized mortgages and origination fee income, partly offset by hedge losses incurred during 2015. Realized and unrealized losses on financial instruments The realized and unrealized loss on financial instruments relates to the hedging of mortgage funding commitments to mitigate interest rate risk. We enter into forward starting interest rate swaps with a financial institution as part of this hedge. When the hedged mortgage is securitized through the market MBS program, the offsetting economic gain (loss) is realized over the term of

2015 ANNUAL REPORT | MCAN MORTGAGE CORPORATION
‐ 14 ‐
the mortgage through higher (lower) spread income. MBS yields were lower in the 2015 issuances due to volatility in the MBS market. If the hedged mortgages are sold to third parties on a whole loan basis, offsetting gains or losses are recognized in the period that the mortgages are sold. The interest rate on our forward starting swaps decreased significantly over the first three quarters of 2015, which led to a $2.9 million loss. In Q4 2015, we closed out these hedges and adjusted the structure of our term deposits to provide more natural hedging. The loss incurred on the forward starting swaps will be offset by the economic benefit realized through higher spread income from mortgages securitized through the market MBS program to be realized over the 5 year duration of these mortgages. Other net investment income Fees increased by $498,000 from 2014, primarily due to a non‐recurring fee received on a commercial loan. Marketable securities income increased by $151,000 from 2014, primarily due to a larger average portfolio. Whole loan gain on sale income decreased by $670,000 from 2014. The volume of mortgages sold to third parties decreased from $70 million in 2014 to $26 million in 2015 as spreads were more attractive in the MBS market in 2015 compared to the whole loan market. Interest on financial investments increased by $2.7 million from 2014, primarily due to a $2.5 million income distribution received from a commercial real estate investment compared to $676,000 in 2014. The balance of the increase relates to income earned on our KingSett High Yield Fund financial investment during 2015. In 2014 we recognized a $1.1 million gain on the sale of real estate that we had previously foreclosed upon. Term deposit interest and expenses decreased by $38,000 from 2014. The decrease was due to a drop in the average term deposit rate from 2.46% in 2014 to 2.34% in 2015, partially offset by the impact of a $33 million increase in the average term deposit balance from $811 million to $844 million. Similar to single family mortgages, market rates for new term deposits, all of which are fixed‐rate, decreased during 2015. Mortgage expenses, consisting primarily of mortgage servicing fees, were comparable to 2014 in line with a slightly higher average mortgage portfolio. Details of the provision for (recovery of) credit losses are discussed in “Credit Quality”.
Other Income ‐ Corporate Assets In 2014, we recorded a $0.7 million gain on the partial sale of our equity investment in MCAP. For further details, refer to the “Equity investment in MCAP” sub‐section of the “Financial Position” section of this MD&A.
Net Investment Income ‐ Securitization Assets Net investment income from securitization assets relates to MCAN’s participation in the market MBS program and the CMB program. Net investment income from the market MBS program has increased significantly since 2014 as we have continued to securitize insured single family mortgages through this program. For further details on these programs, refer to the “Securitization Programs” section of this MD&A. Market MBS Program Net income from the market MBS program was $4.5 million, up from $1.9 million in 2014. The increase was a result of a 151% increase in the average outstanding mortgage portfolio balance as we have continued to earn a stable return since re‐commencing this program in late 2013. In 2015, we sold $589 million of MBS to third parties (2014 ‐ $561 million). The majority of mortgages securitized in 2015 were originated through our internal Xceed platform, including all mortgages securitized in the third and fourth quarters of 2015. In 2014, only 28% of mortgages securitized through the market MBS program were originated internally, whereas the remainder were purchased from third parties. Our internally originated mortgages are significantly more profitable than externally purchased mortgages for market MBS program purposes.

2015 ANNUAL REPORT | MCAN MORTGAGE CORPORATION
‐ 15 ‐
Mortgage interest income was $25.5 million in 2015, a 138% increase from $10.7 million in 2014. The average portfolio balance increased from $375 million to $943 million, while the average yield decreased from 2.85% to 2.70%. Interest on financial liabilities from securitization was $19.5 million in 2015, up from $8.2 million in 2014. The market MBS liability average balance increased from $372 million to $949 million while the average interest rate decreased from 2.21% to 2.06%. The spread of the mortgage interest rate over the liability interest rate on new market MBS issuances decreased in the second half of 2015 as the MBS market was extremely volatile. In 2015, we sold the interest‐only strips associated with $147 million of mortgages that had been securitized through the market MBS program, from which we recognized a $42,000 gain and recorded a $2.6 million loan receivable. This transaction allowed us to derecognize the associated mortgages from our balance sheet and reduce the related capital utilization for regulatory purposes. The spread of the mortgage interest rate over the liability interest rate relating to the interest‐only strips sold was relatively low as they related to mortgages originally securitized in the second half of 2015. CMB Program Our participation in the CMB program ceased in 2015 with the maturity of the final CMB bond issuance. In 2015 we incurred a loss of $52,000 related to the CMB program as a result of minimal activity, whereas in 2014, we incurred a net loss of $2.0 million. For further information, refer to the “CMB Program” sub‐section of the “Securitization Programs” section of this MD&A. In 2014, mortgage interest income was $1.8 million on an average balance of $146 million and an average yield of 3.34%. Interest on financial investments and short‐term investments from 2014 relate to income earned on principal reinvestment assets. Other securitization income consists primarily of interest rate swap receipts. Interest on financial liabilities from securitization was $4.9 million on an average balance of $396 million and an average interest rate of 2.71%. The negative fair value adjustment to derivative financial instruments of $71,000 (2014 ‐ $1.4 million) relates to the CMB interest rate swaps.
2015 ANNUAL REPORT | MCAN MORTGAGE CORPORATION
‐ 16 ‐
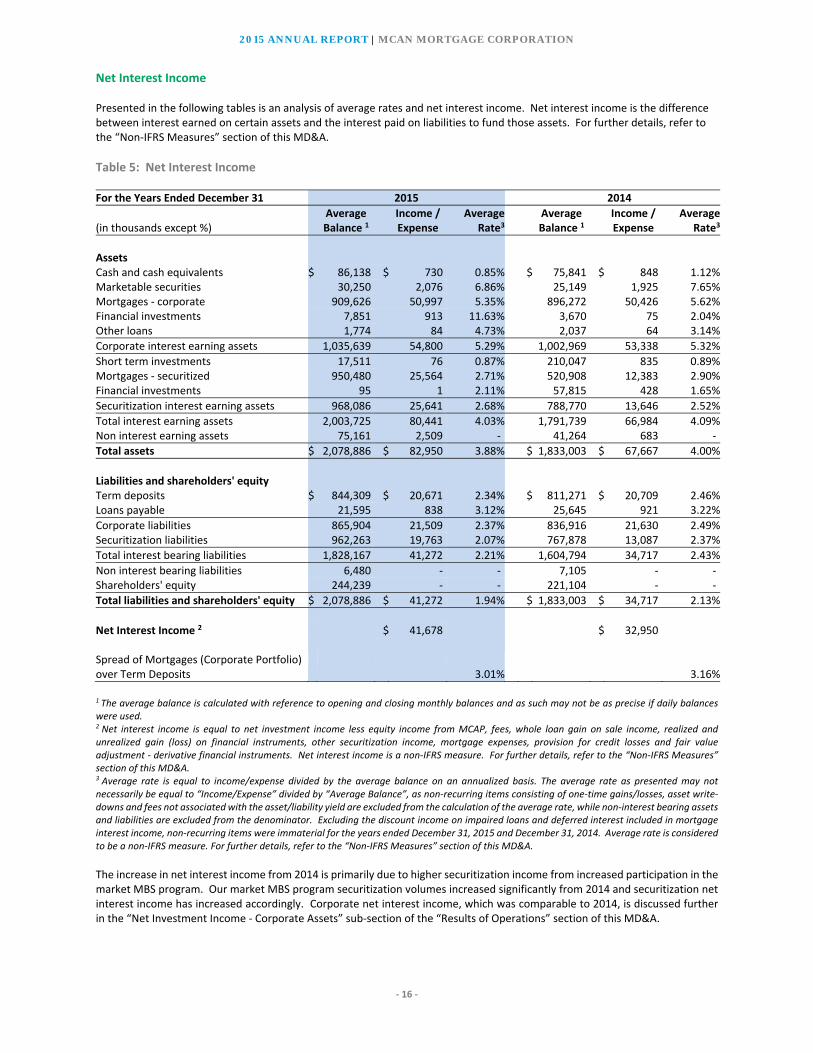
Net Interest Income Presented in the following tables is an analysis of average rates and net interest income. Net interest income is the difference between interest earned on certain assets and the interest paid on liabilities to fund those assets. For further details, refer to the “Non‐IFRS Measures” section of this MD&A.
Table 5: Net Interest Income
For the Years Ended December 31 2015 2014
Average Income / Average Average Income / Average(in thousands except %) Balance 1 Expense Rate3 Balance 1 Expense Rate3
Assets Cash and cash equivalents $ 86,138 $ 730 0.85% $ 75,841 $ 848 1.12%Marketable securities 30,250 2,076 6.86% 25,149 1,925 7.65%Mortgages ‐ corporate 909,626 50,997 5.35% 896,272 50,426 5.62%Financial investments 7,851 913 11.63% 3,670 75 2.04%Other loans 1,774 84 4.73% 2,037 64 3.14%
Corporate interest earning assets 1,035,639 54,800 5.29% 1,002,969 53,338 5.32%
Short term investments 17,511 76 0.87% 210,047 835 0.89%Mortgages ‐ securitized 950,480 25,564 2.71% 520,908 12,383 2.90%Financial investments 95 1 2.11% 57,815 428 1.65%
Securitization interest earning assets 968,086 25,641 2.68% 788,770 13,646 2.52%
Total interest earning assets 2,003,725 80,441 4.03% 1,791,739 66,984 4.09%Non interest earning assets 75,161 2,509 ‐ 41,264 683 ‐
Total assets $ 2,078,886 $ 82,950 3.88% $ 1,833,003 $ 67,667 4.00%
Liabilities and shareholders' equity Term deposits $ 844,309 $ 20,671 2.34% $ 811,271 $ 20,709 2.46%Loans payable 21,595 838 3.12% 25,645 921 3.22%
Corporate liabilities 865,904 21,509 2.37% 836,916 21,630 2.49%Securitization liabilities 962,263 19,763 2.07% 767,878 13,087 2.37%
Total interest bearing liabilities 1,828,167 41,272 2.21% 1,604,794 34,717 2.43%
Non interest bearing liabilities 6,480 ‐ ‐ 7,105 ‐ ‐Shareholders' equity 244,239 ‐ ‐ 221,104 ‐ ‐
Total liabilities and shareholders' equity $ 2,078,886 $ 41,272 1.94% $ 1,833,003 $ 34,717 2.13%
Net Interest Income 2 $ 41,678 $ 32,950 Spread of Mortgages (Corporate Portfolio) over Term Deposits 3.01% 3.16%
1 The average balance is calculated with reference to opening and closing monthly balances and as such may not be as precise if daily balances were used. 2 Net interest income is equal to net investment income less equity income from MCAP, fees, whole loan gain on sale income, realized and unrealized gain (loss) on financial instruments, other securitization income, mortgage expenses, provision for credit losses and fair value adjustment ‐ derivative financial instruments. Net interest income is a non‐IFRS measure. For further details, refer to the “Non‐IFRS Measures” section of this MD&A. 3 Average rate is equal to income/expense divided by the average balance on an annualized basis. The average rate as presented may not necessarily be equal to “Income/Expense” divided by “Average Balance”, as non‐recurring items consisting of one‐time gains/losses, asset write‐downs and fees not associated with the asset/liability yield are excluded from the calculation of the average rate, while non‐interest bearing assets and liabilities are excluded from the denominator. Excluding the discount income on impaired loans and deferred interest included in mortgage interest income, non‐recurring items were immaterial for the years ended December 31, 2015 and December 31, 2014. Average rate is considered to be a non‐IFRS measure. For further details, refer to the “Non‐IFRS Measures” section of this MD&A.
The increase in net interest income from 2014 is primarily due to higher securitization income from increased participation in the market MBS program. Our market MBS program securitization volumes increased significantly from 2014 and securitization net interest income has increased accordingly. Corporate net interest income, which was comparable to 2014, is discussed further in the “Net Investment Income ‐ Corporate Assets” sub‐section of the “Results of Operations” section of this MD&A.

2015 ANNUAL REPORT | MCAN MORTGAGE CORPORATION
‐ 17 ‐
Credit Quality
Table 6: Provisions for Credit Losses and Write‐offs (in thousands except basis points) Change from 2014For the Years Ended December 31 2015 2014 ($) (%)
Individual provision (recovery) Single family uninsured $ 78 $ 96 $ (18) (19%) Single family uninsured ‐ completed inventory ‐ (550) 550 (100%) Residential construction (55) 275 (330) (120%) Commercial uninsured ‐ (15) 15 (100%) $ 23 $ (194) $ 217 (112%) Collective provision (recovery) Single family uninsured $ 363 $ 357 $ 6 2% Single family uninsured ‐ completed inventory 42 (52) 94 (181%) Construction (99) (5) (94) 1,880% Commercial 341 (120) 461 (384%)Corporate mortgages ‐ total 647 180 467 259%Other provisions (recoveries) (395) (969) 574 (59%) $ 252 $ (789) $ 1,041 (132%) Total provision for (recovery of) credit losses $ 275 $ (983) $ 1,258 (128%) Corporate mortgage portfolio data: Provision for (recovery of) credit losses $ 670 $ (14) $ 684 (4,886%)Net write offs $ 385 $ 364 $ 21 6%Net write offs (basis points) 4.2 4.1 0.1 3%
Individual mortgage allowances are recorded to reduce a mortgage to its estimated realizable value. Activity in 2015 was minimal, while 2014 included the $550,000 reversal of a completed inventory loan allowance as a result of a partial repayment of the loan and increase in net realizable value and a $275,000 allowance on a residential construction loan as a result of cost overruns. Collective mortgage allowances represent losses that we believe have been incurred in the mortgage portfolio but have not yet been specifically identified. The collective provisions (recoveries) recorded during both years are consistent with the growth (reduction) in the size of the respective mortgage portfolios.
Other provisions (recoveries) in both years consist primarily of a reduction in the liability associated with the Xceed off‐balance sheet securitization portfolio. For further details, refer to the “Liabilities and Shareholders’ Equity” sub‐section of the “Financial Position” section of this MD&A. Write‐offs remained low in 2015 and related entirely to the uninsured single family mortgage portfolio.
Operating Expenses
Table 7: Operating Expenses (in thousands) Change from 2014For the Years Ended December 31 2015 2014 ($) (%) Salaries and benefits $ 8,515 $ 7,154 $ 1,361 19%General and administrative 5,993 6,229 (236) (4%)
$ 14,508 $ 13,383 $ 1,125 8%
The increase in salaries and benefits is a result of an increase in the number of employees and a higher variable compensation expense. As we have grown our internal origination platform through Xceed, we have continued to grow the size of our staff in both operations and the second line of defense to maintain sound corporate governance. Despite the increase in our scale of operations, general and administrative expenses decreased slightly from 2014 as a result of the increased efficiency of certain internal processes, in addition to higher tax refunds received.

2015 ANNUAL REPORT | MCAN MORTGAGE CORPORATION
‐ 18 ‐
Provision for Income Taxes Table 8: Income Taxes (in thousands) Change from 2014For the Years Ended December 31 2015 2014 ($) (%) Current tax provision $ ‐ $ 102 $ (102) (100%)Deferred tax provision (recovery) (89) 908 (997) (110%)
$ (89) $ 1,010 $ (1,099) (109%)
The deferred tax recovery in 2015 was due to tax losses recognized at the subsidiary level, while in 2014 we had a deferred tax provision due to the partial application of loss carry forwards as a result of taxable income earned at the subsidiary level. As at December 31, 2015, we had $12 million of losses available for carry‐forward in the MCAN mortgage investment corporation (“MIC”) parent company on a non‐consolidated basis, the benefit of which is not reflected in deferred taxes. For further information, refer to Note 4 to the consolidated financial statements.
Taxable Income The table below provides a reconciliation between net income for accounting purposes and taxable income. The adjustments below represent the difference between the individual components of net income for accounting and tax purposes. Taxable income is presented on a non‐consolidated basis and does not incorporate taxable income from Xceed and other subsidiaries as it does not directly impact MCAN’s non‐consolidated taxable income. The key differences between taxable income and pre‐tax net income for accounting purposes include differences between equity income from MCAP and Xceed and the gain on sale of the interest only strip for accounting and tax purposes, the treatment of market MBS program origination costs, the treatment of capital gains income and the non‐deductibility of fair value adjustments, collective provisions for credit losses and the amortization of upfront securitization program costs for tax purposes. As a MIC, we typically pay out all of our taxable income to shareholders through dividends. In addition, our MIC status allows us to deduct dividends paid within 90 days of year end from taxable income. Dividends that are deducted in the calculation of taxable income are not included in the table below. We purchase and originate insured mortgages that are securitized through the market MBS program (for further details on the market MBS program, refer to the “Securitization Programs” section of this MD&A). The purchase of mortgages involves the payment of an up‐front origination fee that is deductible for income tax purposes in the period that the mortgages are securitized, while for accounting purposes this fee is capitalized and amortized over the term of the associated mortgages. In 2015, we incurred $13.8 million of origination costs on market MBS mortgages (2014 ‐ $11.4 million). As at December 31, 2015, the unamortized origination fee balance was $17.1 million, which represents costs that are still to be expensed for non‐consolidated accounting purposes but will be added back in the calculation of taxable income. During 2014, we reorganized our equity investment in MCAP. For further information on the reorganization, refer to the “Equity Investment in MCAP” sub‐section of the “Financial Position” section of this MD&A. As a result of the reorganization, we recognized a $23.6 million gain on sale in MCAN on a non‐consolidated basis. For taxable income purposes, we recognized a 50% capital gain to taxable income with an impact of $11.8 million ($0.57 per share). The reorganization had no impact on the consolidated balance sheet or consolidated statement of income. Taxable income is considered to be a non‐IFRS measure. For further details, refer to the “Non‐IFRS Measures” section of this MD&A.

2015 ANNUAL REPORT | MCAN MORTGAGE CORPORATION
‐ 19 ‐
Table 9: Taxable Income Reconciliation 1
(in thousands) Q4 Q4 Annual AnnualFor the Periods Ended December 31 2015 2014 2015 2014
Net income for accounting purposes $ 9,450 $ 7,129 $ 32,857 $ 25,446Adjustments: Equity income from MCAP (3,610) (1,591) (5,919) (6,132) Equity income from subsidiaries 2 (2,522) (1,672) (440) (2,053) Provision for (recovery of) credit losses 2 527 82 557 28 Amortization of upfront securitization program costs 2 1,776 1,079 6,003 2,933 Market MBS program mortgage origination costs 3 (1,235) (3,438) (13,810) (11,447) Gain on sale of interest‐only strips 3,073 ‐ 3,073 ‐ Other securitization program cash outflows (209) (425) (1,639) (3,355) Fair value adjustment ‐ derivative financial instruments 2 ‐ 133 71 1,376 Capital gains (57) 5 (57) 64 Gain on dilution of investment in MCAP 2 ‐ ‐ (68) ‐ Reorganization of investment in MCAP 4 ‐ ‐ ‐ 11,756 Other items (373) (440) (1,048) (915)
Taxable Income $ 6,820 $ 862 $ 19,580 $ 17,701
1 Taxable income is presented above on a non‐consolidated basis for the MIC entity. The current year amounts presented above represent estimates as they are not finalized until the completion of our corporate tax filings. 2 Not deductible/recognizable in the calculation of taxable income. 3 Deductible in full for tax purposes as mortgages securitized; capitalized and amortized for accounting purposes. We finalized our 2014 tax position subsequent to year end after the completion of our corporate tax filings. Q4 2014 taxable income was revised from $1.4 million to $862,000 and fiscal 2014 taxable income was revised from $20.8 million to $17.7 million.
Summary of Three Year Results of Operations 2013 was highlighted by the acquisition of Xceed, which occurred at the start of the third quarter. In addition to providing us with an in‐house mortgage origination platform, it created significant incremental income through a bargain purchase gain and discount income earned on mortgages acquired as part of the acquisition. Additionally, we acquired renewal rights to a portfolio of off‐balance sheet mortgages. Earnings per share were $1.57, primarily due to the aforementioned non‐recurring items associated with the acquisition of Xceed and a dilution gain and partial gain on sale associated with the equity investment in MCAP. Securitization income declined as a result of a significant negative fair value adjustment to derivative financial instruments. Corporate assets increased steadily during the year and eclipsed the $1 billion level for the first time. Late in the year, MCAN re‐entered the market MBS program with a $168 million issuance. 2014 represented the first full year of the integration of Xceed into MCAN operations. We re‐launched the Xceed single family brand with mortgage brokers and originated over $200 million of new mortgages. Additionally, our securitization volumes through the market MBS program grew significantly to $561 million as the program provided incremental income to MCAN. Earnings per share decreased to $1.23, which was primarily due to the above‐noted non‐recurring items associated with MCAP and the acquisition of Xceed, partially offset by the significant increase in market MBS program securitization income. In 2015, we earned record net income of $32.9 million while earnings per share increased to $1.51. The Xceed origination platform increased significantly with $518 million in new mortgages originated. Our market MBS program securitization volumes were $589 million as the securitized mortgage portfolio continued to provide a reliable source of incremental income. Equity income from our investment in MCAP also increased by 63% to over $10 million. Corporate asset growth exceeded our 10% annual target as we finished the year with a $1.16 billion portfolio.
Cash Flows Operating activities provided cash flows of $22 million in 2015 and provided $15 million in 2014. 2014 had significantly lower net mortgage outflows as a result of CMB program mortgage maturities and a substantial net outflow from securitization liabilities from CMB bond liability maturities, while 2015 had an inflow from new market MBS program issuances. 2014 also had significant inflows from short‐term investments and financial investments as CMB reinvestment assets matured on the payout of the bond liability.

2015 ANNUAL REPORT | MCAN MORTGAGE CORPORATION
‐ 20 ‐
Investing activities provided cash flows of $4 million in 2015 and provided $8 million in 2014. 2014 included proceeds from the partial sale of the MCAP investment. Financing activities used cash flows of $1 million in 2015 and used $36 million in 2014. 2015 had a higher net inflow from the issuance of common shares from the rights offering, while 2014 had a net outflow associated with loans payable.
FINANCIAL POSITION
Table 10: Assets (in thousands) Change from 2014As at December 31 2015 2014 ($) (%) Corporate Assets Cash and cash equivalents $ 75,762 $ 51,090 $ 24,672 48% Marketable securities 40,735 24,900 15,835 64% Mortgages 944,109 895,467 48,642 5% Financial investments 41,793 28,469 13,324 47% Other loans 4,176 2,108 2,068 98% Equity investment in MCAP Commercial LP 44,191 38,792 5,399 14% Foreclosed real estate 529 686 (157) (23%) Deferred tax asset 1,125 773 352 46% Other assets 2,626 3,067 (441) (14%) 1,155,046 1,045,352 109,694 10% Securitization Assets Short‐term investments 13,112 16,763 (3,651) (22%) Mortgages 1,075,947 741,184 334,763 45% Financial investments ‐ 907 (907) (100%) Derivative financial instruments ‐ 71 (71) (100%) Other assets 2,853 1,441 1,412 98% 1,091,912 760,366 331,546 44% $ 2,246,958 $ 1,805,718 $ 441,240 24%
Mortgages ‐ Corporate & Securitized
Table 11: Mortgage Summary
(in thousands) Change from 2014As at December 31 2015 2014 ($) (%)
Corporate portfolio: Single family mortgages ‐ Uninsured $ 359,465 $ 289,128 $ 70,337 24% ‐ Insured 83,619 132,290 (48,671) (37%) ‐ Uninsured ‐ completed inventory 31,280 21,438 9,842 46%Construction loans ‐ Residential 349,808 371,808 (22,000) (6%) ‐ Non‐residential 5,595 ‐ 5,595 ‐Commercial loans ‐ Uninsured 114,342 80,803 33,539 42%
944,109 895,467 48,642 5%
Securitized portfolio: Single family insured ‐ Market MBS program 1,075,947 716,112 359,835 50%Single family insured ‐ CMB program ‐ 25,072 (25,072) (100%)
1,075,947 741,184 334,763 45%
$ 2,020,056 $ 1,636,651 $ 383,405 23%

2015 ANNUAL REPORT | MCAN MORTGAGE CORPORATION
‐ 21 ‐
Corporate and Securitized Mortgage Portfolio Analysis Figure 1: Total Corporate and Securitized Mortgage Portfolio (in thousands)
The decrease in securitized mortgages in Q4 2015 is a result of the sale of interest‐only strips and the derecognition of the associated mortgages from the balance sheet.
Figure 2: Corporate Mortgage Portfolio Composition by Product Type (in thousands)
2015 ANNUAL REPORT | MCAN MORTGAGE CORPORATION
‐ 22 ‐
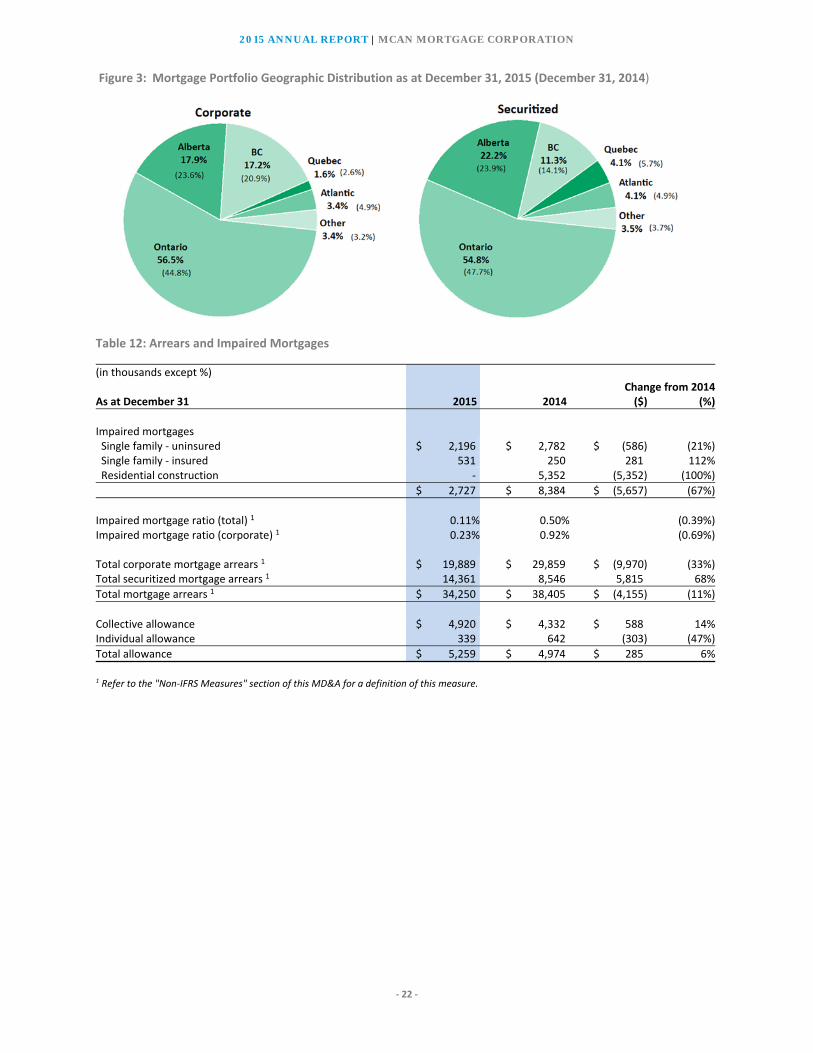
Figure 3: Mortgage Portfolio Geographic Distribution as at December 31, 2015 (December 31, 2014)
Table 12: Arrears and Impaired Mortgages (in thousands except %) Change from 2014As at December 31 2015 2014 ($) (%)
Impaired mortgages Single family ‐ uninsured $ 2,196 $ 2,782 $ (586) (21%) Single family ‐ insured 531 250 281 112% Residential construction ‐ 5,352 (5,352) (100%)
$ 2,727 $ 8,384 $ (5,657) (67%)
Impaired mortgage ratio (total) 1 0.11% 0.50% (0.39%)Impaired mortgage ratio (corporate) 1 0.23% 0.92% (0.69%) Total corporate mortgage arrears 1 $ 19,889 $ 29,859 $ (9,970) (33%)Total securitized mortgage arrears 1 14,361 8,546 5,815 68%
Total mortgage arrears 1 $ 34,250 $ 38,405 $ (4,155) (11%)
Collective allowance $ 4,920 $ 4,332 $ 588 14%Individual allowance 339 642 (303) (47%)
Total allowance $ 5,259 $ 4,974 $ 285 6%
1 Refer to the "Non‐IFRS Measures" section of this MD&A for a definition of this measure.

2015 ANNUAL REPORT | MCAN MORTGAGE CORPORATION
‐ 23 ‐
Figure 4: Impaired Corporate Mortgage Ratio
Impaired single family mortgages decreased slightly during 2015 and remained low by historical standards. At December 31, 2014, there were three impaired residential construction loans outstanding, two of which paid out during 2015 with no loss of principal. The other loan has had its individual allowance reduced from $275,000 to $220,000 as at December 31, 2015 and has a net book value of $nil. Construction arrears can be volatile given the relatively low volume of loans and the relative size of individual loans which can cause volatility in impaired mortgage ratios. The significant decrease in total corporate mortgage arrears from December 31, 2014 is primarily due to the aforementioned reduction in impaired mortgages, in addition to other decreases in single family mortgages past due but not impaired. The increase in total securitized mortgage arrears from December 31, 2014 is primarily due to growth in the portfolio. Economic volatility and continued weakness in oil prices continue to impact housing markets in western Canada where job losses are expected to impact mortgage arrears. While our mortgage arrears decreased slightly during 2015, we continue to remain vigilant and have adopted more conservative underwriting standards.
Corporate Mortgages The majority of our corporate mortgage growth took place in Q4 2015. As of September 30, 2015, our portfolio had decreased by $15 million for the year to date, however in Q4 2015 we had significant increases in construction, uninsured single family and completed inventory loans such that fiscal 2015 corporate mortgage growth was $49 million. Given current economic uncertainty, we do not expect similar growth in the first half of 2016. The growth in uninsured single family during 2015 is due to the continued increase in volumes from our internal Xceed origination platform throughout 2015. We issued a high level of commitments in the spring and summer which funded during the second half of the year. The decrease in insured single family is due to the fact that we were not building up the portfolio at year end to facilitate an early 2016 market MBS issuance. In early 2015, we took a measured approach to new construction loan originations and undertook a geographic rebalancing by reducing our exposure to Alberta which led to a significant decrease in the portfolio in the first half of 2015. After completing the rebalancing, we funded new commitments in the second half of 2015 that we had issued earlier in the year and accordingly the overall portfolio balance increased, including a significant Ontario‐based increase net of the Alberta reduction. Single family mortgages We invest in insured and uninsured single family mortgages in Canada, primarily originated through Xceed for our own corporate portfolio and for securitization activities. Uninsured mortgages may not exceed 80% of the value of the real estate securing such loans at the time of funding. For the purposes of this ratio, value is the appraised value of the property as determined by a qualified appraiser at the time of funding. Residential mortgages insured by CMHC or Genworth Financial Mortgage Insurance Company Canada Inc. (“Genworth”) may exceed this ratio.
2015 ANNUAL REPORT | MCAN MORTGAGE CORPORATION
‐ 24 ‐
Insured single family mortgage originations moderated in Q4 2015 as a result of increases in our mortgage rates to deal with volatility in MBS markets. We will continue to monitor the performance of housing markets as they adjust for new absorption levels. Uninsured single family mortgage originations through our internal Xceed platform led to strong mortgage fundings in 2015. We continue to monitor our portfolio for early delinquencies and continue to adjust our mortgage rates to ensure they are reflective of the changing risk in our core markets. As we securitize mortgages into the market MBS program, assets are effectively transferred from corporate mortgages to securitized mortgages on the balance sheet. The change contributes to changes in asset levels when corporate mortgages are securitized in the following quarter. For further information on MCAN‐issued market MBS retained for liquidity purposes and included in corporate insured single family mortgages, refer to the “Securitization Programs” section of this MD&A. Completed inventory loans Completed inventory loans are credit facilities extended to developers to provide interim mortgage financing on residential units (condominium or freehold), where all construction has been completed and therefore no further construction risk exists. Satisfactory confirmation that all units are substantially complete is required prior to funding all inventory loans. Final occupancy permits, condominium corporation registration and/or written confirmation by the cost consultant as to the completion of the units are examples of verification measures. Completed inventory loans remained low as new housing markets in Canada currently have a very tight supply of completed inventory. As such, these loans are difficult to originate, as existing inventory has been quickly sold by builders in recent quarters. We are currently closely monitoring inventory levels in some of our core markets to ensure we react to changes in the overall housing markets. Construction loans Residential construction loans are made to homebuilders to finance residential construction projects. These loans generally have a floating interest rate and terms of one to two years. Non‐residential construction loans, which provide construction financing for retail shopping developments, office buildings and industrial developments, may comprise up to one half of this limit. Our residential construction loan portfolio experienced reasonable growth in Q4 2015 after a reduction in the portfolio earlier in the year. Our portfolio concentrations in Western Canada continue to be monitored closely and our exposure to Alberta has decreased amidst the current economic conditions. Commercial loans Commercial loans include commercial term mortgages and high ratio mortgage loans. Commercial lending remains highly competitive, with an excess amount of capital in the market that has led to yield compression. Despite these limitations, we have continued to observe good opportunities for future loan commitments. Mortgage renewal rights Through Xceed, we retain the renewal rights to internally originated single family mortgages that are held as corporate or securitized mortgages or have been sold to third parties and derecognized from the balance sheet. At renewal, we may be able to renew these mortgages by offering clients attractive renewal options, thereby contributing to future revenues.

2015 ANNUAL REPORT | MCAN MORTGAGE CORPORATION
‐ 25 ‐
As at December 31, 2015, we had the renewal rights to $1.3 billion of single family mortgages (December 31, 2014 ‐ $735 million).
Table 13: Average Mortgage Loan to Value (LTV) Ratios
As at December 31 2015 2014
Corporate portfolio: Single family mortgages ‐ Uninsured 74.3% 72.0% ‐ Uninsured completed inventory 63.3% 64.5% ‐ Insured 85.9% 81.6%Construction loans ‐ Residential 66.1% 65.5% ‐ Non‐residential 59.4% ‐Commercial loans ‐ Uninsured 68.7% 72.0%
71.1% 70.5%
Securitized portfolio: Single family insured ‐ Market MBS Program 87.0% 85.2%Single family insured ‐ CMB Program ‐ 87.9%
87.0% 85.3%
79.5% 77.1%
Table 14: Mortgage Originations (in thousands) Q4 Q4 Annual AnnualFor the Periods Ended December 31 2015 2014 2015 2014
Single family ‐ insured $ 51,099 $ 51,133 $ 356,594 $ 119,921Single family ‐ uninsured 53,181 63,660 167,453 157,449Single family ‐ uninsured completed inventory ‐ 10,688 4,603 28,522Residential construction (advances) 89,689 148,100 173,117 408,847Non‐residential construction (advances) 5,215 ‐ 5,215 ‐Commercial 10,754 10,169 58,674 30,605
$ 209,938 $ 283,750 $ 765,656 $ 745,344
Insured single family originations increased significantly from 2014 due to our continued participation in the market MBS program. The proportion of internally originated mortgages in 2015 market MBS issuances was much higher than 2014. Although uninsured single family originations increased slightly from 2014, the proportion of internally originated mortgages is significantly higher in 2015 as a result of the growth of our internal Xceed origination platform and our decreased reliance on external originators. Single family originations were lower in Q4 2015 than in Q4 2014 as a result of an upgrade to a new mortgage underwriting system. We expect that the adoption of the new system will assist in facilitating the future growth of the Xceed origination platform. Residential construction advances decreased from 2014 due to the geographic rebalancing of the portfolio that commenced in early 2015 and led to lower volumes. Additional Information on Residential Mortgages and Home Equity Lines of Credit (“HELOCs”) In accordance with OSFI Guideline B‐20, Residential Mortgage Underwriting Practices and Procedures, additional information is provided on the composition of MCAN’s single family mortgage portfolio by insurance status and province, as well as amortization periods and Loan to Value ratio (“LTV”) by province. LTV is calculated as the ratio of the outstanding loan balance on an amortized cost basis to the value of the underlying collateral at the time of origination.

2015 ANNUAL REPORT | MCAN MORTGAGE CORPORATION
‐ 26 ‐
Insured mortgages include mortgages insured by CMHC or other approved insurers at origination and mortgages that are portfolio insured after origination. The HELOC balances displayed below relate to insured single family mortgages that have been acquired by MCAN. We do not originate HELOCs.
Table 15: Single Family Mortgages by Province as at December 31, 2015
(in thousands except %) Corporate Securitized
Insured % Uninsured % HELOCs % Insured % Total %
Ontario $ 42,449 50.9% $ 264,490 67.7% $ 122 52.2% $ 589,912 54.8% $ 896,973 57.9%Alberta 19,433 23.3% 54,815 14.0% 53 22.6% 239,192 22.2% 313,493 20.2%British Columbia 3,646 4.4% 41,809 10.7% 59 25.2% 121,811 11.3% 167,325 10.8%Quebec 6,887 8.3% 8,688 2.2% ‐ ‐ 43,960 4.1% 59,535 3.8%Atlantic Provinces 8,848 10.6% 11,303 2.9% ‐ ‐ 43,712 4.1% 63,863 4.1%Other 2,122 2.5% 9,640 2.5% ‐ ‐ 37,360 3.5% 49,122 3.2%
Total $ 83,385 100.0% $ 390,745 100.0% $ 234 100.0% $ 1,075,947 100.0% $ 1,550,311 100.0%
Table 16: Single Family Mortgages by Province as at December 31, 2014
(in thousands except %) Corporate Securitized
Insured % Uninsured % HELOCs % Insured % Total %
Ontario $ 63,474 48.0% $ 176,104 56.8% $ 116 41.1% $ 353,340 47.7% $ 593,034 50.0%Alberta 33,800 25.6% 43,844 14.1% 86 30.5% 177,481 23.9% 255,211 21.6%British Columbia 6,887 5.2% 51,047 16.4% 80 28.4% 104,243 14.1% 162,257 13.7%Quebec 9,739 7.4% 13,342 4.3% ‐ ‐ 42,579 5.7% 65,660 5.5%Atlantic Provinces 14,205 10.8% 17,722 5.7% ‐ ‐ 36,205 4.9% 68,132 5.8%Other 3,903 3.0% 8,507 2.7% ‐ ‐ 27,336 3.7% 39,746 3.4%
Total $ 132,008 100.0% $ 310,566 100.0% $ 282 100.0% $ 741,184 100.0% $ 1,184,040 100.0%
Table 17: Single Family Mortgages by Amortization Period as at December 31, 2015
(in thousands except %) Up to 20 >20 to 25 >25 to 30 >30 to 35 >35 to 40As at December 31, 2015 Years Years Years Years Years Total
Corporate $ 76,636 $ 79,032 $ 301,874 $ 16,434 $ 388 $ 474,364 16.2% 16.7% 63.6% 3.5% 0.0% 100.0% Securitized $ 119,194 $ 575,192 $ 277,016 $ 103,802 $ 743 $ 1,075,947 11.1% 53.5% 25.7% 9.6% 0.1% 100.0%
Total $ 195,830 $ 654,224 $ 578,890 $ 120,236 $ 1,131 $ 1,550,311 12.6% 42.2% 37.3% 7.8% 0.1% 100.0%
2015 ANNUAL REPORT | MCAN MORTGAGE CORPORATION
‐ 27 ‐
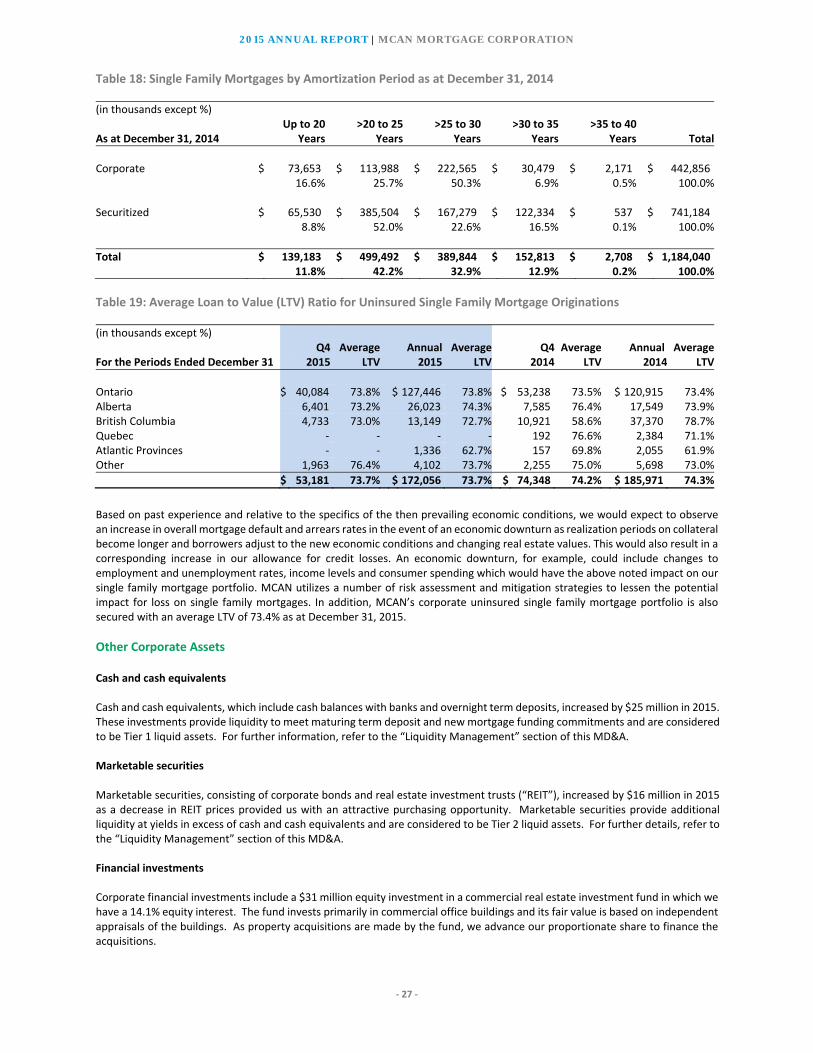
Table 18: Single Family Mortgages by Amortization Period as at December 31, 2014
(in thousands except %) Up to 20 >20 to 25 >25 to 30 >30 to 35 >35 to 40As at December 31, 2014 Years Years Years Years Years Total
Corporate $ 73,653 $ 113,988 $ 222,565 $ 30,479 $ 2,171 $ 442,856 16.6% 25.7% 50.3% 6.9% 0.5% 100.0% Securitized $ 65,530 $ 385,504 $ 167,279 $ 122,334 $ 537 $ 741,184 8.8% 52.0% 22.6% 16.5% 0.1% 100.0%
Total $ 139,183 $ 499,492 $ 389,844 $ 152,813 $ 2,708 $ 1,184,040 11.8% 42.2% 32.9% 12.9% 0.2% 100.0%
Table 19: Average Loan to Value (LTV) Ratio for Uninsured Single Family Mortgage Originations
(in thousands except %) Q4 Average Annual Average Q4 Average Annual AverageFor the Periods Ended December 31 2015 LTV 2015 LTV 2014 LTV 2014 LTV
Ontario $ 40,084 73.8% $ 127,446 73.8% $ 53,238 73.5% $ 120,915 73.4%Alberta 6,401 73.2% 26,023 74.3% 7,585 76.4% 17,549 73.9%British Columbia 4,733 73.0% 13,149 72.7% 10,921 58.6% 37,370 78.7%Quebec ‐ ‐ ‐ ‐ 192 76.6% 2,384 71.1%Atlantic Provinces ‐ ‐ 1,336 62.7% 157 69.8% 2,055 61.9%Other 1,963 76.4% 4,102 73.7% 2,255 75.0% 5,698 73.0%
$ 53,181 73.7% $ 172,056 73.7% $ 74,348 74.2% $ 185,971 74.3%
Based on past experience and relative to the specifics of the then prevailing economic conditions, we would expect to observe an increase in overall mortgage default and arrears rates in the event of an economic downturn as realization periods on collateral become longer and borrowers adjust to the new economic conditions and changing real estate values. This would also result in a corresponding increase in our allowance for credit losses. An economic downturn, for example, could include changes to employment and unemployment rates, income levels and consumer spending which would have the above noted impact on our single family mortgage portfolio. MCAN utilizes a number of risk assessment and mitigation strategies to lessen the potential impact for loss on single family mortgages. In addition, MCAN’s corporate uninsured single family mortgage portfolio is also secured with an average LTV of 73.4% as at December 31, 2015.
Other Corporate Assets
Cash and cash equivalents Cash and cash equivalents, which include cash balances with banks and overnight term deposits, increased by $25 million in 2015. These investments provide liquidity to meet maturing term deposit and new mortgage funding commitments and are considered to be Tier 1 liquid assets. For further information, refer to the “Liquidity Management” section of this MD&A. Marketable securities Marketable securities, consisting of corporate bonds and real estate investment trusts (“REIT”), increased by $16 million in 2015 as a decrease in REIT prices provided us with an attractive purchasing opportunity. Marketable securities provide additional liquidity at yields in excess of cash and cash equivalents and are considered to be Tier 2 liquid assets. For further details, refer to the “Liquidity Management” section of this MD&A. Financial investments Corporate financial investments include a $31 million equity investment in a commercial real estate investment fund in which we have a 14.1% equity interest. The fund invests primarily in commercial office buildings and its fair value is based on independent appraisals of the buildings. As property acquisitions are made by the fund, we advance our proportionate share to finance the acquisitions.
2015 ANNUAL REPORT | MCAN MORTGAGE CORPORATION
‐ 28 ‐
We have funded a $10.7 million investment in the KingSett High Yield Fund, in which we have a 9% equity interest. The fund invests in mortgages secured by real estate with a focus on mezzanine, subordinate and bridge mortgages and is carried at fair value. As mortgage advances are made by the fund, we advance our proportionate share. The fund pays a base monthly preferred distribution of 9%, and distributes any additional income earned on a quarterly basis. Our 2015 return was 13.1%. Our total funding commitment is $36 million, which consists of $24 million of capital advances for the fund and $12 million that supports credit facilities. Equity investment in MCAP We hold a 14.70% equity interest in MCAP, which represents 4.3 million units held by MCAN from 29.2 million total outstanding MCAP partnership units. The investment had a net book value of $44 million as at December 31, 2015. The Limited Partner’s At‐Risk Amount (“LP ARA”), which represents the cost base of the equity investment in MCAP for income tax purposes, was $42 million as at December 31, 2015. For further information on the LP ARA, refer to the “Non‐IFRS Measures” section of this MD&A. Our investment in MCAP creates a deduction from Total Capital under Basel III (refer to the “Capital Management” section of this MD&A), which is measured on an accounting basis and is phased in by 20% on an annual basis to 2018 such that the deduction is 40% in 2015. We have managed our investment in MCAP in line with our Risk Appetite Framework (“RAF”) and regulatory requirements in order to minimize this deduction from Total Capital under Basel III while optimizing the economic benefits of the investment. MCAP is an originator and servicer of mortgages for third party investors in Canada and securitizes mortgages on its own behalf. MCAP’s origination volumes were $14.3 billion in 2015. MCAP had $53.1 billion of assets under administration as at November 30, 2015. We currently use the equity basis of accounting for our investment in MCAP as per International Accounting Standard (“IAS”) 28, Investments in Associates and Joint Ventures, as we have significant influence in MCAP through our entitlement to a position on MCAP’s Board of Directors. If we experience further dilution we may no longer qualify for the equity basis of accounting. In that case, we would not recognize our pro‐rata share of MCAP’s net income as equity income, but would instead recognize distributions received from MCAP as income and would carry the investment as available for sale with changes in fair value recognized through accumulated other comprehensive income. Foreclosed real estate Foreclosed real estate consists of a real estate investment which was previously an impaired construction loan. This investment is carried at the lower of the carrying amount and fair value less estimated costs to sell.
Securitization Assets Securitization assets consist primarily of single family insured mortgages securitized through the market MBS program. Securitization asset activity for 2015 included items as follows:
$589 million of new mortgages retained on the balance sheet through new market MBS program issuances. The newly securitized market MBS program mortgages remained on the consolidated balance sheet as a result of MCAN’s retention of risks and rewards associated with these mortgages.
Derecognition of $147 million of mortgages from the balance sheet upon the sale of associated interest‐only strips.
Maturity of $28 million of CMB‐related assets as our participation in the program ended.
Net market MBS mortgage repayments of $79 million. For further information, refer to the “Securitization Programs” section of this MD&A.

2015 ANNUAL REPORT | MCAN MORTGAGE CORPORATION
‐ 29 ‐
Table 20: Liabilities and Shareholders' Equity
(in thousands) Change from 2014As at December 31 2015 2014 ($) (%)
Corporate Liabilities Term deposits $ 903,041 $ 821,742 $ 81,299 10% Current tax liabilities 100 120 (20) (17%) Deferred tax liabilities 2,299 1,246 1,053 85% Other liabilities 12,412 11,202 1,210 11%
917,852 834,310 83,542 10%
Securitization Liabilities Financial liabilities from securitization 1,070,304 746,063 324,241 43% Other liabilities ‐ 42 (42) (100%)
1,070,304 746,105 324,199 43%
1,988,156 1,580,415 407,741 26%
Shareholders’ Equity Share capital 206,382 183,939 22,443 12% Contributed surplus 510 510 ‐ ‐ Retained earnings 42,617 34,481 8,136 24% Accumulated other comprehensive income 9,293 6,373 2,920 46%
258,802 225,303 33,499 15%
$ 2,246,958 $ 1,805,718 $ 441,240 24%
Term deposits increased by $81 million (10%) in 2015, which was consistent with our growth in corporate assets. To fund our corporate operations, we issue term deposits that are eligible for Canada Deposit Insurance Corporation (“CDIC”) deposit insurance. The role of term deposits in managing liquidity risk is discussed in the “Liquidity Risk” sub‐section of the “Risk Governance and Management” section of this MD&A. Upon the acquisition of Xceed, we set up a reserve associated with Xceed’s off‐balance sheet securitized mortgage portfolio, which is expected to be incurred over the remaining duration of the portfolio and is included in other corporate liabilities. As at December 31, 2015, the balance of the reserve was $80,000 (December 31, 2014 ‐ $487,000) and the portion of the off balance sheet securitized mortgage balance that attracts a reserve was $4 million (December 31, 2014 ‐ $22 million). Financial liabilities from securitization relate to our participation in the market MBS program, representing MBS that we have sold to third parties but have not derecognized from our balance sheet. The balance increased by $324 million in 2015, consisting of $589 million of new liabilities issued through the market MBS program, the derecognition of $147 million of mortgages upon the sale of associated interest‐only strips, the maturity of $28 million of CMB‐related liabilities and $90 million of net liability repayments. For further information on the market MBS program, refer to the “Securitization Programs” section of this MD&A. Share capital increased by $22.4 million in 2015. We raised $15.1 million of new share capital through the rights offering and the Dividend Reinvestment Plan (“DRIP”) provided $7.3 million. For further information, refer to Note 22 to the consolidated financial statements. Retained earnings increased by $8.1 million, consisting of net income of $32.9 million less dividends of $24.7 million. Accumulated other comprehensive income, which represents unrealized gains or losses on available for sale marketable securities and financial investments, increased by $2.9 million in 2015. The fair value adjustment of a commercial real estate investment increased by $5.2 million, while the fair value adjustment to our marketable securities portfolio decreased by $2.3 million.

2015 ANNUAL REPORT | MCAN MORTGAGE CORPORATION
‐ 30 ‐
SELECTED QUARTERLY FINANCIAL DATA
Table 21: Selected Quarterly Financial Data (in thousands except for per
Q4/14 Q3/14 Q2/14 Q1/14 share amounts and %) Q4/15 Q3/15 Q2/15 Q1/15
Net investment income ‐ corporate assets $ 12,602 $ 8,996 $ 13,745 $ 7,398 $ 10,262 $ 8,707 $ 9,888 $ 10,292Other income ‐ corporate assets ‐ ‐ 68 ‐ 71 ‐ ‐ 711Gross investment income ‐ securitization assets 1,469 1,246 1,105 718 603 319 175 187Fair value adjustment ‐ ‐ (47) (24) (133) (414) (365) (464)
Net investment income ‐ securitization assets 1,469 1,246 1,058 694
470 (95) (190) (277)
Operating expenses 4,224 3,577 3,136 3,571 3,201 3,596 3,221 3,365
Net income before income taxes 9,847 6,665 11,735 4,521 7,602 5,016 6,477 7,361Provision for (recovery of) income taxes 397 (528) (183) 225
473 165 385 (13)
Net income $ 9,450 $ 7,193 $ 11,918 $ 4,296 $ 7,129 $ 4,851 $ 6,092 $ 7,374
Average mortgage portfolio yield ‐ corporate 1 5.31% 5.25% 5.34% 5.48% 5.43% 5.52% 5.55% 6.02%Average term deposit interest rate 1 2.27% 2.32% 2.38% 2.40% 2.43% 2.45% 2.46% 2.49% Basic and diluted earnings per share $ 0.42 $ 0.32 $ 0.56 $ 0.21 $ 0.34 $ 0.23 $ 0.30 $ 0.36Return on average shareholders' equity 1 14.66% 11.36% 20.16% 7.49% 12.76% 8.74% 11.01% 13.52% Dividends per share Regular $ 0.29 $ 0.28 $ 0.28 $ 0.28 $ 0.28 $ 0.28 $ 0.28 $ 0.28
Total $ 0.29 $ 0.28 $ 0.28 $ 0.28 $ 0.28 $ 0.28 $ 0.28 $ 0.28
1 Refer to the “Non‐IFRS Measures” section of this MD&A for a definition of these measures.
Net investment income from corporate assets was consistent throughout 2014. The significant increases in Q2 2015 and Q4 2015 were primarily due to higher equity income from MCAP and an income distribution from a commercial real estate investment, respectively. We have experienced a steady decrease in our corporate mortgage portfolio yield due to decreases in market rates for new fundings. Realized and unrealized hedge losses were volatile throughout 2014 and 2015. Net investment income from securitization assets was negative for most of 2014 as a result of the negative fair value adjustments relating to the CMB program. However, the growth in the market MBS program has led to steady quarterly increases in income in this asset class. Table 22: Ten Year Financial Summary
(in thousands except per share amounts) Net Earnings Dividends Shareholders’ Market
December 31 Income Per Share Per Share Assets1 Equity Capitalization 2015 (IFRS) $ 32,857 $ 1.51 $ 1.13 $ 1,155,046 $ 258,802 $ 276,573 2014 (IFRS) 25,446 1.23 1.12 1,044,579 225,303 299,635 2013 (IFRS) 30,805 1.57 1.15 1,027,176 214,900 265,993 2012 (IFRS) 16,494 0.94 1.42 950,686 177,781 262,393 2011 (IFRS) 24,262 1.50 1.81 753,799 158,465 225,951 2010 (IFRS) 31,667 2.20 1.19 538,118 125,079 200,249 2009 (CGAAP) 24,742 1.73 1.44 506,683 122,879 194,766 2008 (CGAAP) 30,348 2.14 0.96 570,154 116,609 129,438 2007 (CGAAP) 14,843 1.12 1.00 557,425 103,007 140,416 2006 (CGAAP) 15,211 1.23 1.18 498,107 84,611 141,052 1 2010‐2014 consist of corporate assets only as reported under IFRS. 2006‐2009 consist of total assets as reported under Canadian Generally Accepted Accounting Principles (“CGAAP”).

2015 ANNUAL REPORT | MCAN MORTGAGE CORPORATION
‐ 31 ‐
SUMMARY OF FOURTH QUARTER RESULTS
Table 23: Quarterly Net Income
(in thousands) December 31 September 30 December 31For the Quarters Ended 2015 2015 2014 Net Investment Income ‐ Corporate Assets Mortgage interest $ 12,610 $ 12,290 $ 12,519 Equity income from MCAP Commercial LP 2,070 1,992 1,767 Fees 937 1,231 901 Marketable securities 802 463 591 Whole loan gain on sale income 113 178 255 Realized and unrealized gain (loss) on financial instruments 2 (1,414) (971) Interest on financial investments and other loans 2,920 249 59 Interest on cash and cash equivalents 149 237 177 Gain on sale of foreclosed real estate ‐ ‐ 1,115
19,603 15,226 16,413
Term deposit interest and expenses 5,189 5,231 5,233 Mortgage expenses 1,124 900 928 Interest on loans payable 163 248 294 Provision for (recovery of) credit losses 525 (149) (304)
7,001 6,230 6,151
12,602 8,996 10,262
Other Income ‐ Corporate Assets Gain on dilution of investment in MCAP Commercial LP ‐ ‐ 71
‐ ‐ 71 Net Investment Income ‐ Securitization Assets Mortgage interest 7,556 6,942 4,250 Interest on financial investments ‐ ‐ 9 Interest on short‐term investments 8 9 91 Other securitization income 42 ‐ 131
7,606 6,951 4,481
Interest on financial liabilities from securitization 5,684 5,307 3,647 Mortgage expenses 453 398 231
6,137 5,705 3,878
Net investment income before fair value adjustment 1,469 1,246 603 Fair value adjustment ‐ derivative financial instruments ‐ ‐ (133)
1,469 1,246 470
Operating Expenses Salaries and benefits 2,586 1,996 1,795 General and administrative 1,638 1,581 1,406
4,224 3,577 3,201
Net Income Before Income Taxes 9,847 6,665 7,602Provision for (recovery of) income taxes 397 (528) 473
Net Income $ 9,450 $ 7,193 $ 7,129
Basic and diluted earnings per share $ 0.42 $ 0.32 $ 0.34Dividends per share $ 0.29 $ 0.28 $ 0.28

2015 ANNUAL REPORT | MCAN MORTGAGE CORPORATION
‐ 32 ‐
Q4 2015 vs. Q4 2014 Net Investment Income ‐ Corporate Assets Table 24: Interest Income and Average Rate by Mortgage Portfolio (Corporate) For the Quarters Ended December 31 2015 2014 Average Interest Average Average Interest Average(in thousands except %) Balance Income Rate 1 Balance Income Rate 1
Single family ‐ Uninsured $ 354,792 $ 4,026 4.53% $ 282,333 $ 3,566 5.00%‐ Insured 102,650 938 3.65% 159,537 1,619 4.02%‐ Uninsured (completed inventory) 19,822 229 4.59% 33,795 428 5.01%Construction loans ‐ Residential 348,882 4,883 5.59% 358,920 4,933 5.45%‐ Non‐residential 4,705 65 5.52% ‐ ‐ ‐Commercial loans ‐ Uninsured 101,567 2,469 8.88% 79,601 1,973 9.83%
Average mortgages ‐ corporate portfolio $ 932,418 $ 12,610 5.31% $ 914,186 $ 12,519 5.43%
1 Average interest rate is equal to income/expense divided by the average balance on an annualized basis. The average interest rate as presented may not necessarily be equal to “Income/Expense” divided by “Average Balance”, as non‐recurring items such as discount income on impaired loans, deferred interest and prior period adjustments are excluded from the calculation of the average interest rate. Excluding the aforementioned discount income on impaired loans, non‐recurring items are immaterial for the quarters ended December 31, 2015 and December 31, 2014. Average interest rate is considered to be a non‐IFRS measure. Refer to the “Non‐IFRS Measures” section of this MD&A for a definition of this measure. The increase in the average uninsured single family mortgage average portfolio in Q4 2015 over Q4 2014 was primarily due to increased originations from our internal Xceed origination platform in 2015. The average insured single family balance decreased as a result of lower market MBS program securitization volumes in Q4 2015 versus Q4 2014. The decrease in the Q4 2015 single family average mortgage portfolio yield from Q4 2014 is primarily due to lower market rates for the funding of new mortgages during 2015. Average mortgage portfolio yield is considered to be a non‐IFRS measure. For a definition of this measure, refer to the “Non‐IFRS Measures” section of this MD&A. Equity income from our ownership interest in MCAP increased by $0.3 million from Q4 2014 as a result of higher whole loan gain on sale income in Q4 2015. Interest on financial investments and other loans increased by $2.9 million from 2014, primarily due to a $2.5 million income distribution received on a commercial real estate investment in Q4 2015. For a discussion of realized and unrealized losses on financial instruments and gain on sale of foreclosed real estate, refer to the “Net Investment Income ‐ Corporate Assets” sub‐section of the “Results of Operations” section of this MD&A. Term deposit interest and expenses decreased by $44,000 from Q4 2014. The average outstanding balance increased from $820 million in Q4 2014 to $865 million in Q4 2015, while the average term deposit interest rate decreased from 2.43% in Q4 2014 to 2.27% in Q4 2015 as a result of lower market rates for new term deposits. For details of the provision for credit losses, refer to Table 26 of this MD&A. Net Investment Income ‐ Securitization Assets Mortgage interest income increased by $3.3 million from Q4 2014, while interest on financial liabilities from securitization increased by $2.0 million. The average securitized mortgage and liability balances have increased by 74% and 65%, respectively, as a result of a significant increase in the balance of outstanding mortgages securitized through the market MBS program. The Q4 2015 gain on sale of market MBS program interest‐only strips is discussed in the “Net Investment Income ‐ Securitization Assets” sub‐section of the “Results of Operations” section of this MD&A.

2015 ANNUAL REPORT | MCAN MORTGAGE CORPORATION
‐ 33 ‐
Operating Expenses Salaries and benefits increased by $791,000 from Q4 2014 as a result of an increase in the number of employees both in operations and the second line of defense and a higher variable compensation expense.
Q4 2015 vs. Q3 2015 Net Investment Income ‐ Corporate Assets Mortgage interest income increased by $0.3 million from Q3 2015. The average mortgage portfolio balance increased by $31 million from Q3 2015 and the average mortgage yield increased by 0.06%. The growth in the average balance consisted primarily of uninsured single family due to higher internal origination volumes and construction due to the funding of previously committed projects in Q4 2015. Equity income from our ownership interest in MCAP increased by $78,000 from Q3 2015. Fees decreased by $294,000 from Q3 2015, which included a non‐recurring deferred profit participation fee received on a commercial loan. Q3 2015 included a $1.4 million realized and unrealized loss on financial instruments as a result of a 0.20% decrease in the interest rate on our forward starting swaps. Q4 2015 activity was minimal as we stopped using forward starting swaps to hedge mortgage funding commitments and instead started using 5‐year fixed rate term deposits. Term deposit interest and expenses decreased by $42,000 from Q3 2015. The average outstanding balance increased by $14 million while the average interest rate decreased by 0.05% from Q3 2015. Net Investment Income ‐ Securitization Assets The increases of $0.6 million in mortgage interest income and $0.4 million in interest on financial liabilities from securitization from Q3 2015 are due to increases of $97 million in both the average market MBS mortgage and financial liability from securitization balances.

2015 ANNUAL REPORT | MCAN MORTGAGE CORPORATION
‐ 34 ‐
Net Interest Income Presented in the following tables is an analysis of average rates and net interest income. Net interest income is the difference between interest earned on certain assets and the interest paid on liabilities to fund those assets. For further details, refer to the “Non‐IFRS Measures” section of this MD&A. Table 25: Net Interest Income For the Quarters Ended December 31 2015 2014
Average Income / Average Average Income / Average (in thousands except %) Balance 1 Expense Rate 3 Balance 1 Expense Rate 3
Assets Cash and cash equivalents $ 74,384 $ 149 0.79% $ 70,623 $ 177 0.99% Marketable securities 38,829 802 8.19% 23,934 591 9.80% Mortgages 932,418 12,610 5.31% 914,186 12,519 5.43% Financial investments 9,149 382 16.57% 3,069 41 5.30% Other loans 2,027 29 5.68% 1,830 17 3.69%
Corporate interest earning assets 1,056,807 13,972 5.25% 1,013,642 13,345 5.22%
Short term investments 11,775 8 0.27% 60,048 90 1.19% Mortgages 1,126,839 7,556 2.66% 646,608 4,252 2.74% Financial investments ‐ ‐ ‐ 3,414 8 1.86%
Securitized interest earning assets 1,138,614 7,564 2.64% 710,070 4,350 2.67%
Total interest earning assets 2,195,421 21,536 3.90% 1,723,712 17,695 4.17% Non interest earning assets 83,036 2,509 ‐ 40,718 2 ‐
Total assets $ 2,278,457 $ 24,045 3.76% $ 1,764,430 $ 17,697 4.07%
Liabilities and shareholders' equity Term deposits $ 864,518 $ 5,189 2.27% $ 819,722 $ 5,233 2.43% Loans payable 14,234 163 3.06% 28,056 294 3.52%
Corporate liabilities 878,752 5,352 2.29% 847,778 5,527 2.49% Securitization liabilities 1,135,196 5,684 2.01% 686,595 3,647 2.22%
Total interest bearing liabilities 2,013,948 11,036 2.13% 1,534,373 9,174 2.37%
Non interest bearing liabilities 6,728 ‐ ‐ 6,527 ‐ ‐ Shareholders' equity 257,781 ‐ ‐ 223,530 ‐ ‐
Total liabilities and shareholders' equity $ 2,278,457 $ 11,036 1.88% $ 1,764,430 $ 9,174 2.06%
Net Interest Income 2 $ 13,009 $ 8,523
Spread of Mortgages (Corporate Portfolio) over Term Deposits 3.04% 3.00%
1 The average balances (excluding mortgages and term deposits) are calculated with reference to opening and closing monthly balances and as such may not be as precise as if daily balances were used. The average mortgage and term deposit balances are calculated using daily balances. 2 Net interest income is equal to net investment income less equity income from MCAP, fees, whole loan gain on sale income, realized and unrealized gain (loss) on financial instruments, gain on sale of foreclosed real estate, other securitization income, mortgage expenses, provision for credit losses and fair value adjustment ‐ derivative financial instruments. Net interest income is a non‐IFRS measure. Refer to the “Non‐IFRS Measures” section of this MD&A for a definition of this measure. 3 Average rate is equal to income/expense divided by the average balance on an annualized basis. The average rate as presented may not necessarily be equal to “Income/Expense” divided by “Average Balance”, as non‐recurring items consisting of one‐time gains/losses, asset write‐downs and fees not associated with the asset/liability yield are excluded from the calculation of the average rate. Non‐recurring items are immaterial for the quarters ended December 31, 2015 and December 31, 2014. Average rate is considered to be a non‐IFRS measure. Refer to the “Non‐IFRS Measures” section of this MD&A for a definition of this measure.

2015 ANNUAL REPORT | MCAN MORTGAGE CORPORATION
‐ 35 ‐
Credit Quality
Table 26: Provisions for Credit Losses and Write‐offs (in thousands except basis points) Change from 2014For the Quarters Ended December 31 2015 2014 ($) (%)
Individual provision (recovery) Single family uninsured $ 6 $ (29) $ 35 (121%) Residential construction ‐ 275 (275) (100%) Commercial uninsured ‐ (15) 15 (100%)
$ 6 $ 231 $ (225) (97%)
Collective provision (recovery) Single family uninsured $ 133 $ 306 $ (173) (57%) Single family uninsured ‐ completed inventory 96 (158) 254 (161%) Construction 291 176 115 65% Commercial 38 (94) 132 (140%)
Corporate mortgages ‐ total 558 230 328 143%Other provisions (recoveries) (39) (765) 726 (95%)
$ 519 $ (535) $ 1,054 (197%) Total provision for (recovery of) credit losses $ 525 $ (304) $ 829 (273%)
Corporate mortgage portfolio data: Provision for (recovery of) credit losses $ 564 $ 461 $ 103 22%Net write offs $ 45 $ 263 $ (218) (83%)Annualized net write offs (basis points) 1.9 11.5 17%
SECURITIZATION PROGRAMS We are an issuer of National Housing Act (“NHA”) MBS, which involves the securitization of insured mortgages to create MBS. We issue MBS through the market MBS program, which is an internal program where we leverage our regulatory asset capacity by originating or purchasing insured single family mortgages for securitization and sale to third parties, thus providing us with a reliable source of incremental income. We issued MBS through the CMB program; however our participation ceased during 2015 with the maturity of the last CMB bond issuance. Pursuant to the MBS program, investors of MBS receive monthly cash flows consisting of interest and scheduled and unscheduled principal payments. CMHC makes principal and interest payments in the event of any MBS default by the issuer, thus fulfilling the Timely Payment obligation to investors. In instances where we have sold MBS, where applicable, these sales are executed for the purposes of transferring various economic exposures that result in accounting outcomes noted for each program below. Each of the MBS programs noted below provide for many responsibilities that are linked to the issuer of these MBS instruments. We do not transfer program oversight or these specific responsibilities when selling MBS to other parties.
Market MBS Program As part of the market MBS program, we may sell MBS to third parties and may also sell the interest‐only strips to third parties. The MBS portion of the mortgage represents the core securitized mortgage principal and the right to receive coupon interest at a specified rate. The interest‐only strips represent the right to receive excess cash flows after satisfying the MBS coupon interest payment and any other expenses such as mortgage servicing. As part of this program, we originate and purchase insured single family mortgages to sell as MBS. During 2015, we pooled and sold $589 million of MBS to third parties. As we retained significant continuing involvement with the assets, the mortgage sales did not achieve derecognition and the associated mortgages remained on the balance sheet while a corresponding liability was incurred. The mortgage interest income and interest on the financial liability from securitization associated with these mortgages will be recognized on an accrual basis over the term of the mortgages. During 2015, we sold the interest‐only strips associated with $147 million of mortgages securitized through the market MBS program to third parties (2014 ‐ $nil). Subsequent to sale, we derecognized the securitized mortgages and associated financial liabilities from securitization from our balance sheet as a result of the transfer of substantially all risks and rewards of ownership to the purchaser of the interest‐only strip. As part of the transaction, we recognized a $2.6 million loan receivable from the third party purchaser and recognized a $42,000 gain on sale net of unamortized transaction costs.

2015 ANNUAL REPORT | MCAN MORTGAGE CORPORATION
‐ 36 ‐
We may issue market MBS through the NHA MBS program and retain the underlying MBS security for liquidity purposes instead of selling it to a third party. As at December 31, 2015, we held $21 million of retained MBS on our balance sheet (December 31, 2014 ‐ $26 million), which is included in the insured single family classification within corporate mortgages. The primary risks associated with the market MBS program are prepayment, liquidity and funding risk, including the obligation to fund 100% of any cash shortfall related to the Timely Payment (discussed below in the “Timely Payment” sub‐section) as part of the market MBS program. Prepayment risk includes the acceleration of the amortization of mortgage premiums as a result of early payouts. As part of the transaction agreement relating to the aforementioned sale of the interest‐only strips, in the case of an “Event of Default” per CMHC’s NHA MBS guidelines (generally relating to an issuer insolvency), we would forfeit the rights to any remaining loan receivable repayments. In the case of mortgage defaults, we are required to make scheduled principal and interest payments to investors as part of the Timely Payment (discussed below in the “Timely Payment” sub‐section) and then place the mortgage/property through the insurance claims process to recover any losses. These defaults may result in cash flow timing mismatches that may marginally increase funding and liquidity risks. Any mortgages securitized through the market MBS program for which derecognition is not achieved remain on the balance sheet as securitized assets and are also included in total exposures in the calculation of the leverage ratio. A corresponding liability is also recognized on the balance sheet for mortgage securitizations that fail derecognition. However, for income tax purposes, all mortgages securitized by MCAN achieve derecognition and are not included in income tax assets. For further details on total exposures, regulatory capital and income tax assets and capital, refer to the “Capital Management” and “Non‐IFRS Measures” sections of this MD&A. MCAN has capitalized certain mortgage acquisition costs. These costs are amortized using the effective interest method (“EIM”), which incorporates mortgage prepayment assumptions.
CMB Program
We previously participated in the CMB program, which involves the sale of MBS to the Canada Housing Trust (“CHT”). Our participation in the CMB program ceased during 2015 with the maturity of the last remaining CMB bond issuance. On the sale of MBS to CHT, we received proceeds for the sale and incurred a corresponding liability, which did not amortize over the term of the issuance and was payable in full at maturity. As the securitized mortgages repaid, we reinvested the collected principal in certain permitted investments. The securitized mortgages and reinvestment assets were held as collateral against the CMB liabilities. Since we retained substantially all risks and rewards of ownership on the sale of the securitized mortgages to CHT, we retained the mortgages, reinvestment assets and financial liabilities from securitization on the consolidated balance sheets until the maturity of the CMB issuance. We entered into pay “pay floating, receive fixed” interest rate swaps as part of the CMB program. The purpose of the interest rate swaps was to hedge interest rate risk on both securitized mortgages and principal reinvestment assets that had a floating interest rate, as substantially all interest payments on the securitization liabilities were fixed rate.
Timely Payment Consistent with all issuers of MBS, we are required to remit scheduled mortgage principal and interest payments to CMHC, even if these mortgage payments have not been collected from mortgagors, to ensure that the Timely Payment of principal and interest to MBS investors is effected. Similarly, at the maturity of the MBS pools that have been issued by MCAN, any outstanding principal must be paid to CMHC. We maintain the Timely Payment obligation in our role as MBS issuer until the maturity of the security. If we fail to make a scheduled principal and interest payment to CMHC, CMHC may enforce the assignment of the mortgages included in all MBS pools in addition to other assets backing the MBS issued. If mortgage payments have not been collected from mortgagors or mortgagors are unable to renew their mortgages at their scheduled maturities, we will be required to use our own financial resources to fund our pro‐rata share of these obligations until mortgage arrears are collected or proceeds are received from the mortgage insurers following the sale of the mortgaged properties. As part of the market MBS program, we are required to fund 100% of any cash shortfall unless we have sold the interest‐only strip, in which case the purchaser of the interest‐only strip is obligated to fund 100% of any cash shortfall. If the interest‐only

2015 ANNUAL REPORT | MCAN MORTGAGE CORPORATION
‐ 37 ‐
strip purchaser is not able to provide funds to cover any cash shortfalls, we will be required to use our own financial resources to fund our 100% share of this obligation until mortgage arrears are collected or proceeds are received from the mortgage insurers following the sale of the mortgaged properties.
CAPITAL MANAGEMENT Our primary capital management objectives are to maintain sufficient capital for regulatory purposes and to earn acceptable and sustainable risk‐weighted returns for our shareholders. Through our risk management and corporate governance framework, we assess current and projected economic, housing market, interest rate and credit conditions to determine appropriate levels of capital. We typically pay out all taxable income by way of dividends. Capital growth is achieved through retained earnings, public share offerings, rights offerings and the DRIP. Our capital management is driven by the guidelines set out by the Income Tax Act (Canada) (the “Tax Act”) and OSFI.
Income Tax Capital As a MIC under the Tax Act, we are limited to an income tax liabilities to capital ratio of 5:1 (or an income tax assets to capital ratio of 6:1), based on our non‐consolidated balance sheet in the MIC entity measured at its tax value. Securitization assets and liabilities (less accrued interest) are both excluded from the calculation of the income tax assets to capital ratio. We manage our income tax assets to a level of 5.75 times income tax capital on a non‐consolidated tax basis to provide a prudent cushion between the maximum permitted assets and total actual assets. Income tax asset capacity represents additional asset growth available to yield a 5.75 income tax assets to income tax capital ratio.
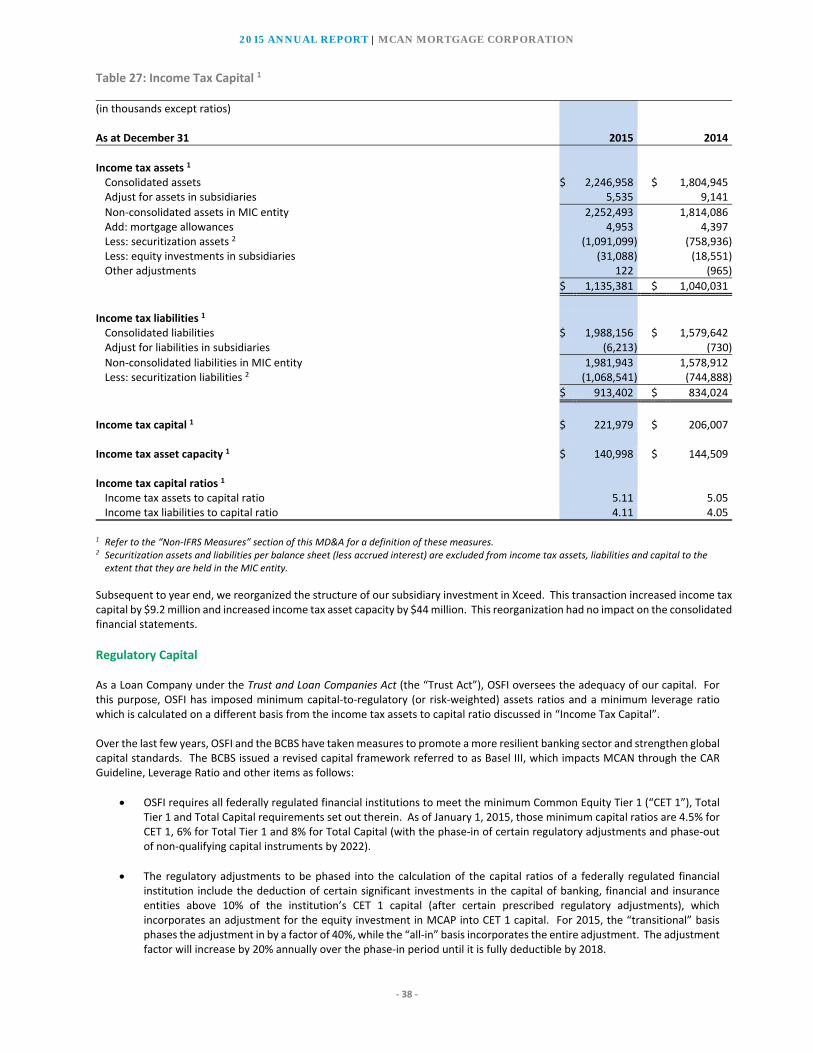
2015 ANNUAL REPORT | MCAN MORTGAGE CORPORATION
‐ 38 ‐
Table 27: Income Tax Capital 1
(in thousands except ratios) As at December 31 2015 2014
Income tax assets 1 Consolidated assets $ 2,246,958 $ 1,804,945 Adjust for assets in subsidiaries 5,535 9,141
Non‐consolidated assets in MIC entity 2,252,493 1,814,086 Add: mortgage allowances 4,953 4,397 Less: securitization assets 2 (1,091,099) (758,936) Less: equity investments in subsidiaries (31,088) (18,551) Other adjustments 122 (965)
$ 1,135,381 $ 1,040,031
Income tax liabilities 1 Consolidated liabilities $ 1,988,156 $ 1,579,642 Adjust for liabilities in subsidiaries (6,213) (730)
Non‐consolidated liabilities in MIC entity 1,981,943 1,578,912 Less: securitization liabilities 2 (1,068,541) (744,888)
$ 913,402 $ 834,024
Income tax capital 1 $ 221,979 $ 206,007 Income tax asset capacity 1 $ 140,998 $ 144,509 Income tax capital ratios 1 Income tax assets to capital ratio 5.11 5.05 Income tax liabilities to capital ratio 4.11 4.05
1 Refer to the “Non‐IFRS Measures” section of this MD&A for a definition of these measures.2 Securitization assets and liabilities per balance sheet (less accrued interest) are excluded from income tax assets, liabilities and capital to the extent that they are held in the MIC entity.
Subsequent to year end, we reorganized the structure of our subsidiary investment in Xceed. This transaction increased income taxcapital by $9.2 million and increased income tax asset capacity by $44 million. This reorganization had no impact on the consolidated financial statements.
Regulatory Capital As a Loan Company under the Trust and Loan Companies Act (the “Trust Act”), OSFI oversees the adequacy of our capital. For this purpose, OSFI has imposed minimum capital‐to‐regulatory (or risk‐weighted) assets ratios and a minimum leverage ratio which is calculated on a different basis from the income tax assets to capital ratio discussed in “Income Tax Capital”. Over the last few years, OSFI and the BCBS have taken measures to promote a more resilient banking sector and strengthen global capital standards. The BCBS issued a revised capital framework referred to as Basel III, which impacts MCAN through the CAR Guideline, Leverage Ratio and other items as follows:
OSFI requires all federally regulated financial institutions to meet the minimum Common Equity Tier 1 (“CET 1”), Total Tier 1 and Total Capital requirements set out therein. As of January 1, 2015, those minimum capital ratios are 4.5% for CET 1, 6% for Total Tier 1 and 8% for Total Capital (with the phase‐in of certain regulatory adjustments and phase‐out of non‐qualifying capital instruments by 2022).
The regulatory adjustments to be phased into the calculation of the capital ratios of a federally regulated financial institution include the deduction of certain significant investments in the capital of banking, financial and insurance entities above 10% of the institution’s CET 1 capital (after certain prescribed regulatory adjustments), which incorporates an adjustment for the equity investment in MCAP into CET 1 capital. For 2015, the “transitional” basis phases the adjustment in by a factor of 40%, while the “all‐in” basis incorporates the entire adjustment. The adjustment factor will increase by 20% annually over the phase‐in period until it is fully deductible by 2018.

2015 ANNUAL REPORT | MCAN MORTGAGE CORPORATION
‐ 39 ‐
As of January 1, 2015, OSFI replaced the assets to capital multiple with the leverage ratio. The leverage ratio is calculated as the ratio of Tier 1 Capital on an “all‐in” basis to total exposures, which includes on‐balance sheet assets and additional exposures for asset funding commitments, outstanding letters of credit and derivative financial instruments.
Commencing in 2016, OSFI will also require all federally regulated financial institutions to maintain a capital conservation buffer. The buffer will be phased in over time and will reach its final level of 2.5% in 2019.
In addition to the minimum capital requirements and capital conservation buffer to be maintained by all federally regulated institutions, OSFI expects all such institutions to attain target capital ratios equal to or greater than the 2019 minimum capital ratios and the 2019 capital conservation buffer well in advance of the phase‐in period. Accordingly, OSFI expects all federally regulated institutions to have a CET 1 ratio of 7% and a Total Tier 1 ratio of 8.5% and a Total Capital ratio of 10.5% (in each case, calculated on an “all in” basis giving effect to all regulatory adjustments that will be required by 2019 and including the 2019 capital conservation buffer). Failure to achieve such targets will serve as triggers for supervisory intervention.
OSFI began the phase‐in of the Credit Valuation Adjustment (“CVA”) risk capital charge in the first quarter of 2014. The CVA risk capital charge applicable to CET 1 is 64% in 2015. This will increase annually until it reaches 100% by 2019. The implementation of the CVA risk capital charge has had an insignificant impact on MCAN. Our internal target minimum CET 1, Tier 1 and Total Capital ratios are 20%. We expect to be able to meet OSFI’s requirements and expectations above without materially adversely affecting the Company’s business plan. We maintain prudent capital planning practices to ensure that we are adequately capitalized and continue to satisfy minimum standards and internal targets.
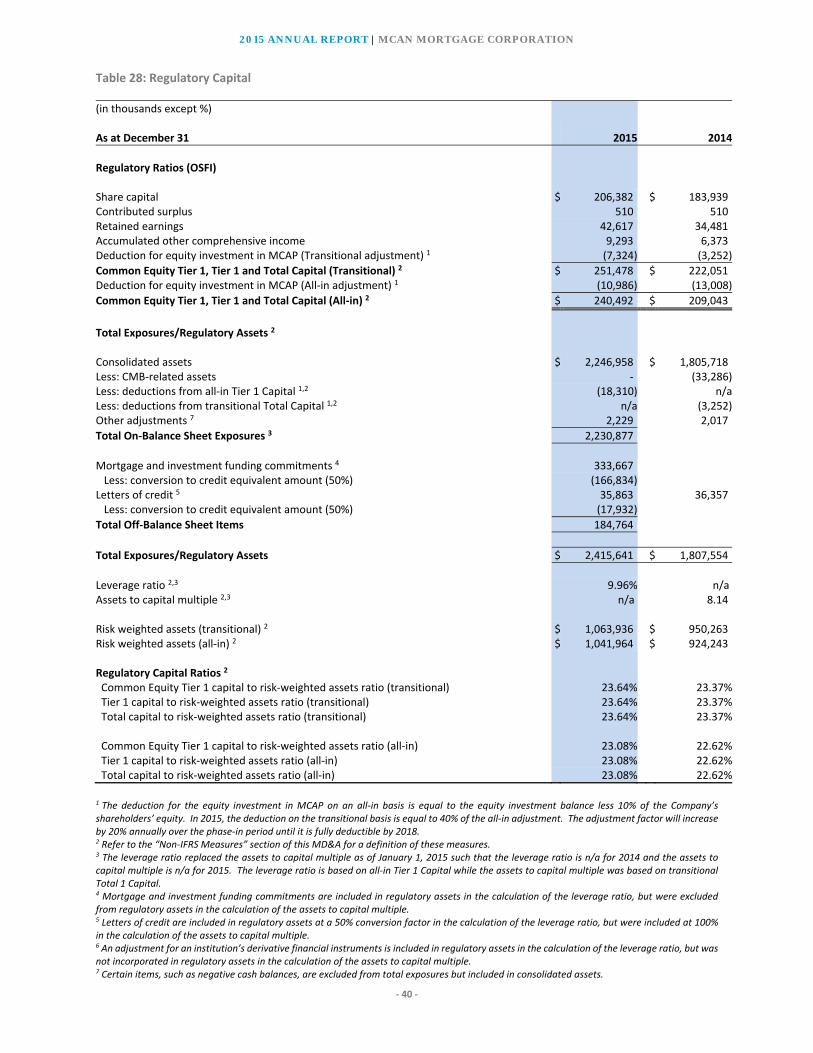
2015 ANNUAL REPORT | MCAN MORTGAGE CORPORATION
‐ 40 ‐
Table 28: Regulatory Capital
(in thousands except %) As at December 31 2015 2014
Regulatory Ratios (OSFI) Share capital $ 206,382 $ 183,939Contributed surplus 510 510Retained earnings 42,617 34,481Accumulated other comprehensive income 9,293 6,373Deduction for equity investment in MCAP (Transitional adjustment) 1 (7,324) (3,252)
Common Equity Tier 1, Tier 1 and Total Capital (Transitional) 2 $ 251,478 $ 222,051Deduction for equity investment in MCAP (All‐in adjustment) 1 (10,986) (13,008)
Common Equity Tier 1, Tier 1 and Total Capital (All‐in) 2 $ 240,492 $ 209,043
Total Exposures/Regulatory Assets 2 Consolidated assets $ 2,246,958 $ 1,805,718Less: CMB‐related assets ‐ (33,286)Less: deductions from all‐in Tier 1 Capital 1,2 (18,310) n/aLess: deductions from transitional Total Capital 1,2 n/a (3,252)Other adjustments 7 2,229 2,017
Total On‐Balance Sheet Exposures 3 2,230,877
Mortgage and investment funding commitments 4 333,667 Less: conversion to credit equivalent amount (50%) (166,834)Letters of credit 5 35,863 36,357 Less: conversion to credit equivalent amount (50%) (17,932)
Total Off‐Balance Sheet Items 184,764
Total Exposures/Regulatory Assets $ 2,415,641 $ 1,807,554
Leverage ratio 2,3 9.96% n/aAssets to capital multiple 2,3 n/a 8.14 Risk weighted assets (transitional) 2 $ 1,063,936 $ 950,263Risk weighted assets (all‐in) 2 $ 1,041,964 $ 924,243 Regulatory Capital Ratios 2 Common Equity Tier 1 capital to risk‐weighted assets ratio (transitional) 23.64% 23.37% Tier 1 capital to risk‐weighted assets ratio (transitional) 23.64% 23.37% Total capital to risk‐weighted assets ratio (transitional) 23.64% 23.37% Common Equity Tier 1 capital to risk‐weighted assets ratio (all‐in) 23.08% 22.62% Tier 1 capital to risk‐weighted assets ratio (all‐in) 23.08% 22.62% Total capital to risk‐weighted assets ratio (all‐in) 23.08% 22.62%
1 The deduction for the equity investment in MCAP on an all‐in basis is equal to the equity investment balance less 10% of the Company’s shareholders’ equity. In 2015, the deduction on the transitional basis is equal to 40% of the all‐in adjustment. The adjustment factor will increase by 20% annually over the phase‐in period until it is fully deductible by 2018. 2 Refer to the “Non‐IFRS Measures” section of this MD&A for a definition of these measures. 3 The leverage ratio replaced the assets to capital multiple as of January 1, 2015 such that the leverage ratio is n/a for 2014 and the assets to capital multiple is n/a for 2015. The leverage ratio is based on all‐in Tier 1 Capital while the assets to capital multiple was based on transitional Total 1 Capital. 4 Mortgage and investment funding commitments are included in regulatory assets in the calculation of the leverage ratio, but were excluded from regulatory assets in the calculation of the assets to capital multiple. 5 Letters of credit are included in regulatory assets at a 50% conversion factor in the calculation of the leverage ratio, but were included at 100% in the calculation of the assets to capital multiple. 6 An adjustment for an institution’s derivative financial instruments is included in regulatory assets in the calculation of the leverage ratio, but was not incorporated in regulatory assets in the calculation of the assets to capital multiple. 7 Certain items, such as negative cash balances, are excluded from total exposures but included in consolidated assets.
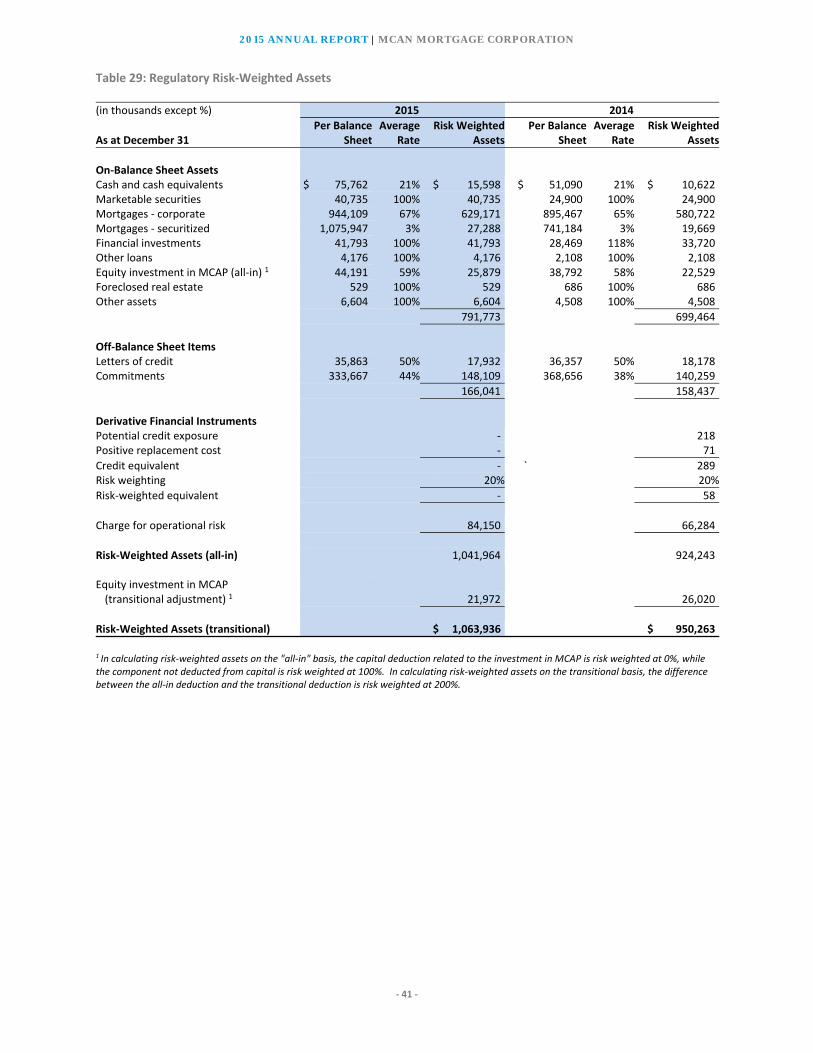
2015 ANNUAL REPORT | MCAN MORTGAGE CORPORATION
‐ 41 ‐
Table 29: Regulatory Risk‐Weighted Assets
(in thousands except %) 2015 2014
Per Balance Average Risk Weighted Per Balance Average Risk WeightedAs at December 31 Sheet Rate Assets Sheet Rate Assets
On‐Balance Sheet Assets Cash and cash equivalents $ 75,762 21% $ 15,598 $ 51,090 21% $ 10,622Marketable securities 40,735 100% 40,735 24,900 100% 24,900Mortgages ‐ corporate 944,109 67% 629,171 895,467 65% 580,722Mortgages ‐ securitized 1,075,947 3% 27,288 741,184 3% 19,669Financial investments 41,793 100% 41,793 28,469 118% 33,720Other loans 4,176 100% 4,176 2,108 100% 2,108Equity investment in MCAP (all‐in) 1 44,191 59% 25,879 38,792 58% 22,529Foreclosed real estate 529 100% 529 686 100% 686Other assets 6,604 100% 6,604 4,508 100% 4,508
791,773 699,464
Off‐Balance Sheet Items Letters of credit 35,863 50% 17,932 36,357 50% 18,178Commitments 333,667 44% 148,109 368,656 38% 140,259
166,041 158,437
Derivative Financial Instruments Potential credit exposure ‐ 218Positive replacement cost ‐ 71
Credit equivalent ‐ ` 289Risk weighting 20% 20%
Risk‐weighted equivalent ‐ 58
Charge for operational risk 84,150 66,284
Risk‐Weighted Assets (all‐in) 1,041,964 924,243 Equity investment in MCAP (transitional adjustment) 1 21,972 26,020
Risk‐Weighted Assets (transitional) $ 1,063,936 $ 950,263
1 In calculating risk‐weighted assets on the "all‐in" basis, the capital deduction related to the investment in MCAP is risk weighted at 0%, while the component not deducted from capital is risk weighted at 100%. In calculating risk‐weighted assets on the transitional basis, the difference between the all‐in deduction and the transitional deduction is risk weighted at 200%.
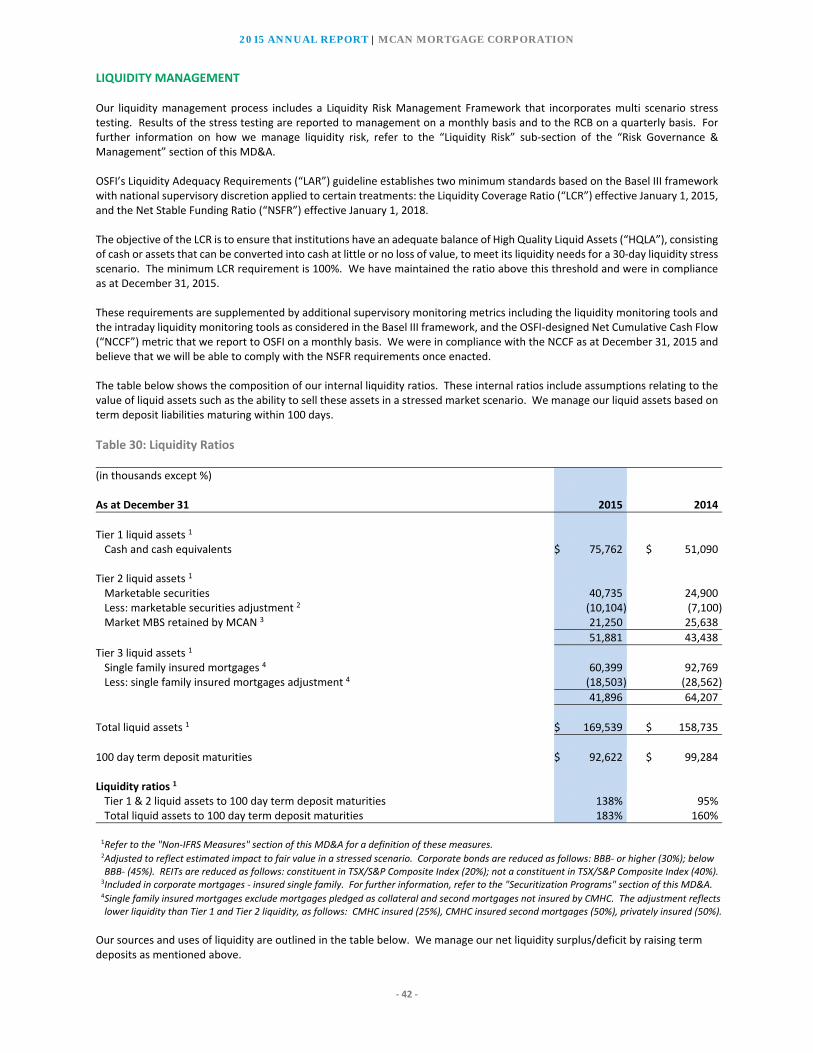
2015 ANNUAL REPORT | MCAN MORTGAGE CORPORATION
‐ 42 ‐
LIQUIDITY MANAGEMENT Our liquidity management process includes a Liquidity Risk Management Framework that incorporates multi scenario stress testing. Results of the stress testing are reported to management on a monthly basis and to the RCB on a quarterly basis. For further information on how we manage liquidity risk, refer to the “Liquidity Risk” sub‐section of the “Risk Governance & Management” section of this MD&A. OSFI’s Liquidity Adequacy Requirements (“LAR”) guideline establishes two minimum standards based on the Basel III framework with national supervisory discretion applied to certain treatments: the Liquidity Coverage Ratio (“LCR”) effective January 1, 2015, and the Net Stable Funding Ratio (“NSFR”) effective January 1, 2018. The objective of the LCR is to ensure that institutions have an adequate balance of High Quality Liquid Assets (“HQLA”), consisting of cash or assets that can be converted into cash at little or no loss of value, to meet its liquidity needs for a 30‐day liquidity stress scenario. The minimum LCR requirement is 100%. We have maintained the ratio above this threshold and were in compliance as at December 31, 2015. These requirements are supplemented by additional supervisory monitoring metrics including the liquidity monitoring tools and the intraday liquidity monitoring tools as considered in the Basel III framework, and the OSFI‐designed Net Cumulative Cash Flow (“NCCF”) metric that we report to OSFI on a monthly basis. We were in compliance with the NCCF as at December 31, 2015 and believe that we will be able to comply with the NSFR requirements once enacted. The table below shows the composition of our internal liquidity ratios. These internal ratios include assumptions relating to the value of liquid assets such as the ability to sell these assets in a stressed market scenario. We manage our liquid assets based on term deposit liabilities maturing within 100 days.
Table 30: Liquidity Ratios
(in thousands except %) As at December 31 2015 2014
Tier 1 liquid assets 1 Cash and cash equivalents $ 75,762 $ 51,090 Tier 2 liquid assets 1 Marketable securities 40,735 24,900 Less: marketable securities adjustment 2 (10,104) (7,100) Market MBS retained by MCAN 3 21,250 25,638
51,881 43,438
Tier 3 liquid assets 1 Single family insured mortgages 4 60,399 92,769 Less: single family insured mortgages adjustment 4 (18,503) (28,562)
41,896 64,207
Total liquid assets 1 $ 169,539 $ 158,735
100 day term deposit maturities $ 92,622 $ 99,284 Liquidity ratios 1 Tier 1 & 2 liquid assets to 100 day term deposit maturities 138% 95% Total liquid assets to 100 day term deposit maturities 183% 160%
1Refer to the "Non‐IFRS Measures" section of this MD&A for a definition of these measures. 2Adjusted to reflect estimated impact to fair value in a stressed scenario. Corporate bonds are reduced as follows: BBB‐ or higher (30%); below BBB‐ (45%). REITs are reduced as follows: constituent in TSX/S&P Composite Index (20%); not a constituent in TSX/S&P Composite Index (40%).
3Included in corporate mortgages ‐ insured single family. For further information, refer to the "Securitization Programs" section of this MD&A.4Single family insured mortgages exclude mortgages pledged as collateral and second mortgages not insured by CMHC. The adjustment reflects lower liquidity than Tier 1 and Tier 2 liquidity, as follows: CMHC insured (25%), CMHC insured second mortgages (50%), privately insured (50%).
Our sources and uses of liquidity are outlined in the table below. We manage our net liquidity surplus/deficit by raising term deposits as mentioned above.

2015 ANNUAL REPORT | MCAN MORTGAGE CORPORATION
‐ 43 ‐
Table 31: Liquidity Analysis
Within 3 Months 1 to 3 3 to 5 Over 5 December 31 December 31 (in thousands) 3 Months To 1 Year Years Years Years 2015 2014
Sources of liquidity Cash and cash equivalents $ 75,762 $ ‐ $ ‐ $ ‐ $ ‐ $ 75,762 $ 51,090Marketable securities ‐ 1,532 1,216 ‐ 37,987 40,735 24,900Mortgages ‐ corporate 86,930 416,596 401,719 31,284 7,580 944,109 895,467Financial investments ‐ ‐ ‐ ‐ 41,793 41,793 28,469Other loans 1,559 ‐ ‐ 2,617 ‐ 4,176 2,108
164,251 418,128 402,935 33,901 87,360 1,106,575 1,002,034
Uses of liquidity Term deposits 86,895 489,020 289,175 37,951 ‐ 903,041 821,742Other liabilities 12,412 ‐ ‐ ‐ ‐ 12,412 11,202
99,307 489,020 289,175 37,951 ‐ 915,453 832,944
Net liquidity surplus (deficit) $ 64,944 $ (70,892) $ 113,760 $ (4,050) $ 87,360 $ 191,122 $ 169,090
Off‐Balance Sheet Unfunded mortgage commitments $ 171,479 $ 84,508 $ 52,255 $ ‐ $ ‐ $ 308,242 $ 337,156Commitment ‐ KingSett High Yield Fund ‐ ‐ ‐ ‐ 25,425 25,425 31,500
$ 171,479 $ 84,508 $ 52,255 $ ‐ $ 25,425 $ 333,667 $ 368,656
Note: The above table excludes securitized assets and liabilities and pledged assets as their use is restricted to securitization program operations.
RISK GOVERNANCE AND MANAGEMENT We are exposed to a number of risks, including credit risk, liquidity and funding risk, market risk and interest rate risk, that can adversely affect our ability to achieve our business objectives or execute our business strategies, and which may result in a loss of earnings, capital and/or damage to our reputation. We mitigate these risks through prudent credit limits, established lending policies and procedures, effective monitoring and reporting, investment diversification and by the diligent management of assets and liabilities. We operate in changing regulatory and economic environments. As a result, we believe that our management team and the Board are particularly diligent in their consideration of all identified and emerging risks. Our goal is not to eliminate risk, as this would result in significantly reduced earnings, but rather to be proactive in our assessment and management of risk, as a means to gain a strategic advantage and ultimately enhance shareholder value. The risks that have been identified may not be the only risks that we face. Other risks of which we are not aware of or which we currently deem to be immaterial may surface and have a material adverse impact on our business, results from operations and financial condition. The shaded areas of this MD&A represent a discussion of risk factors and risk management policies and procedures relating to credit, liquidity, interest rate and market risks as required under IFRS 7, Financial Instruments: Disclosures. The relevant MD&A sections are identified by shading within boxes and the content forms an integral part of the consolidated financial statements.
Risk Governance The Risk Committee of the Board (“RCB”) is responsible for overseeing risk management across the Company. It looks to ensure the relevance of the Company’s RAF and its alignment with the Company’s strategy. It has the responsibility to ensure that the risk management function is independent from the business activity it oversees, and is supported by an Enterprise Risk Management framework (“ERMF”) consisting of policies, procedures and controls. The goal of the ERMF is to manage risks within the Company’s risk framework and appetite. The Chief Executive Officer (“CEO”) and the executive management team are responsible for developing the strategy and a comprehensive set of enterprise wide policies, including the RAF and ERMF for approval by the Board. They are responsible for fostering a strong risk culture through the “tone at the top” and applying the approved strategy and RAF to the business operations of the Company to help maximize, within the Company’s risk appetite, the benefit to shareholders and other

2015 ANNUAL REPORT | MCAN MORTGAGE CORPORATION
‐ 44 ‐
stakeholders from a portfolio of risks that the Company is willing to accept. MCAN’s Executive Committee recommends a risk appetite that aligns with the Mission Statement, Operating Philosophies and Goals and Objectives of the Company and the Operating Committee provides governance over the operations of MCAN to ensure that the strategy and tactics used by MCAN in its funding and investing activities are effective in meeting the Company’s stated objectives. The Company’s operating model is predicated on the three‐lines‐of‐defense approach to the management of risk. The operating areas headed by the CEO are the first line of defense in the Company’s management of risk. They “own” the risk in their areas of responsibility and are responsible for ensuring the Company pursues only suitable business opportunities that are within the Company’s risk appetite. The second line of defense establishes the enterprise level risk management frameworks and policies, and provides risk guidance and oversight of the effectiveness of first Line risk management practices. These activities are provided by:
The Chief Risk Officer (“CRO”), who is responsible for providing independent review and oversight of enterprise‐wide risks and for the fostering of a strong risk culture throughout the organization. The CRO has responsibility for maintaining and managing the RAF and in that regard for confirming and reporting on the significant business risks as identified by and assessed by the first line of defense of the Company.
The Chief Financial Officer (“CFO”), who is responsible for the accuracy and integrity of the Company’s accounting and financial reporting systems, financial statements, and planning and budgeting systems and documents. The CFO ensures legal and regulatory compliance for all financial matters within the Company. The CFO is responsible for the Company’s financial and capital plans which are presented to the Executive Committee and the Board for annual approval. Progress against these plans is regularly reported to the Board and regulators. The Finance department, led by the CFO, also updates the plan with periodic forecasts, advises the Board of anticipated outcomes, and recommends revisions to capital plans and structures as appropriate.
The Chief Compliance Officer (“CCO”), who is responsible for measuring, and reporting on, compliance with the Company’s policies and processes that have been designed to manage and mitigate regulatory compliance risk. The CCO is mandated to promote a sound compliance culture, report to the Board on compliance with legislative requirements and make recommendations related to compliance activities.
The Chief Anti‐Money Laundering Officer (“CAMLO”), who is responsible for the Company’s adherence to the Proceeds of Crime (Money Laundering) and Terrorist Financing Act (Canada) with regard to its deposit taking and lending activities.
The third line of defense is provided by MCAN’s internal audit group which monitors, and reports on, the effectiveness of controls, risk management, and governance practices within the Company.
Risk Appetite MCAN’s RAF sets out the approach to risk management used by the Company in pursuing its strategic and business objectives. Key principles that guide MCAN’s approach to risk appetite are as follows:
MCAN’s strategy, including business objectives, business plans and stakeholder expectations should be reflected in the risk appetite.
The approach should engage both top down senior management and Board leadership and bottom up involvement of employees at all levels.
Risk appetite considerations should be embedded in both strategic and day‐to‐day decisions and supported by a reinforced risk culture aligning decision making and risk.
The approach to risk appetite should reflect good industry practices and relevant regulatory guidance.
The approach should be forward looking and enable adaptation to changing business and market conditions; it should also give consideration to the skills, resources and technology required to manage and monitor identified risk exposures and the potential impacts of stressed conditions.
2015 ANNUAL REPORT | MCAN MORTGAGE CORPORATION
‐ 45 ‐
The RAF purposes and objectives are as follows:
Define maximum levels of risk that are within MCAN’s risk capacity including regulatory constraints in order to achieve its strategic objectives within appropriate and approved target returns.
Give consideration to all material risks reflecting all key aspects of the business.
Contain both qualitative and quantitative elements to define acceptable risk levels within MCAN’s risk capacity.
Set out limits and targets to enable the Board and senior management to assess MCAN’s performance and current risk levels relative to risk appetite.
Consider MCAN’s current capital position and ability to handle the range of results that may occur under normal operating conditions and under a range of stress scenarios.

2015 ANNUAL REPORT | MCAN MORTGAGE CORPORATION
‐ 46 ‐
The Board has overall responsibility for risk governance within MCAN. They provide oversight and carry out their risk management mandate primarily through the RCB, the Audit Committee of the Board (the “Audit Committee”), the Conduct Review, Corporate Governance and Human Resources Committee of the Board (the “CR, CG & HR Committee”) and the Enterprise Risk Management Ad Hoc Committee (the “ERM Ad Hoc Committee”). There is a further committee structure at the management level as illustrated in the following diagram:
text
Board of Directors
Term DepositsSingle FamilyMortgages
Construction Loans
Other Investments
Audit
Risk
CR,CG&HR
Board Committees
First line of defence
Management Committees
ComplianceRisk
Second line of defence
Internal Audit
Third line of defence
Finance
Executive Committee
CAMLO
1 Asset and Liability Committee 2 Compliance, Audit and Enterprise Risk Management Committee3 Capital Commitments Committee
4 Operating Committee
Disclosure ALCO 1 CAERM 2
CCC 3 Operating 4 SFMC 5 Deposit Rate 6
5 Single Family Management Committee6 Deposit Rate Setting Committee7 Enterprise Risk Management Ad Hoc Committee
ERM 7

2015 ANNUAL REPORT | MCAN MORTGAGE CORPORATION
‐ 47 ‐
Liquidity and Funding Risk Liquidity risk is the risk that cash inflows, supplemented by assets readily convertible to cash, will be insufficient to honour all cash outflow commitments (both on and off‐balance sheet) as they come due. The failure of borrowers to make regular mortgage payments increases the uncertainties associated with liquidity management, notwithstanding that we may eventually collect the amounts outstanding, which may result in a loss of earnings or capital, or have an otherwise adverse effect on our financial condition and results of operations. For information on the contractual maturities of certain obligations of the Company, refer to notes 17, 18, 21 and 31 to the consolidated financial statements. Liquidity Risk Management We closely monitor our liquidity position to ensure that we have sufficient cash to meet liability obligations as they become due. The RCB is responsible for the review and approval of liquidity policies. The Asset and Liability Committee (“ALCO”), which is comprised of management, is responsible for liquidity management. We have an internal target of a standard level of liquid investments (cash and cash equivalents, marketable securities, MCAN‐issued market MBS retained on our balance sheet, 75% of CMHC‐insured single family mortgages, 50% of CMHC‐insured single family second mortgages and 50% of privately insured mortgages) of at least 100% of term deposits maturing within 100 days. As at December 31, 2015 and December 31, 2014, we met this internal target. In addition, all single family mortgages are readily marketable within a time frame of one to three months, providing us with added flexibility to meet unexpected liquidity needs. We have access to capital through our ability to issue term deposits eligible for CDIC deposit insurance. These term deposits also provide us with the ability to fund asset growth as needed. We also maintain an overdraft facility to fund asset growth or meet our short‐term obligations as required. The overdraft facility is a component of a larger credit facility that also has a portion which guarantees letters of credit used to support the obligations of borrowers to municipalities in conjunction with construction loans. The total facility is $75 million, with sub‐limits of $50 million for overdrafts and $50 million for letters of credit. In addition, we maintain a credit warehouse facility which can be drawn as required as mortgage fundings occur, which bears interest at the prime rate. This facility provides up to $50 million of borrowings, and insured mortgages are eligible to act as collateral in the facility for a period of no longer than one year. Subsequent to year end, the credit warehouse facility counterparty ceased its operations and was placed under supervisory administration, and as a result thereof, the credit warehouse was terminated. We believe that the termination of the credit warehouse facility did not have a material impact on our operations or liquidity given the other sources of funding options available to the Company. We believe that our liquidity position and our access to capital markets in the form of term deposits and the banking facility support our ability to meet current and future commitments as they come due. Management has developed a Liquidity Risk Management Framework that is reviewed and approved annually by the Board. This framework details the daily, monthly and quarterly analysis that is performed by management. Management monitors changes in cash and cash requirements on a daily basis and formally reports to ALCO on a monthly basis. Management also completes monthly and quarterly stress testing which is reviewed by ALCO and the RCB. Management monitors trends in deposit concentration with significant term deposit brokers on a monthly basis. We have established and maintain liquidity policies and procedures which meet the standards set under the Trust Act and any regulations or guidelines issued by OSFI. For a discussion regarding liquidity risk relating to the maturity of securitization program liabilities, refer to the “Timely Payment Guarantee” sub‐section of the “Securitization Programs” section of this MD&A. Reputational Risk Reputational risk is the negative consequence of the occurrence of other risks and can occur from an activity undertaken by the Company, its affiliated companies, or its representatives. The loss of reputation can greatly affect shareholder value through reduced public confidence, a loss of business, legal action, or increased regulatory oversight. Reputation refers to the perception of the enterprise by various stakeholders. Typically key stakeholder groups include investors, customers, employees, suppliers and regulators. Perceptions may be impacted by various events including financial performance, specific adverse occurrences from events such as cyber security issues, unfavourable media coverage, and changes or actions of the corporation’s leadership. Failure to effectively manage reputation risk can result in reduced market capitalization, loss of client loyalty, and the inability to achieve our strategic objectives.

2015 ANNUAL REPORT | MCAN MORTGAGE CORPORATION
‐ 48 ‐
Reputational Risk Management We believe that the most effective way for the Company to safeguard its public reputation is through the successful management of the underlying risks in the business. Strategic and Business Risk Strategic and business risk is the risk of loss due to fluctuations in the external business environment, the failure of management to adjust its strategies and business activities for external events or business results, or the inability of the business to change its cost levels in response to those changes. Strategic and Business Risk Management Strategic and business risk is managed by the CEO and the Board. The Board approves the Company’s strategies at least annually and reviews results against those strategies at least quarterly. Operational Risk Operational risk is the potential for loss resulting from people, inadequate or failed internal processes, systems, or from external events. The risk of loss from people includes internal or external fraud, non‐adherence to internal procedures/values/objectives or unethical behaviour. The largest component of this risk has been separately identified as outsourcing risk. The remaining risks arise from the small size and entrepreneurial nature of MCAN, and the legacy systems used within it. The exposure to financial misreporting, inaccurate financial models, fraud, breaches in privacy, information security, attraction and retention of employees, and business continuity and recovery are included within operational risk. Operational Risk Management We manage operational risk through various committees and processes. Our management team reviews operational measures on a recurring basis as part of the Operating Committee, Compliance Audit and Enterprise Risk Management Committee, and ALCO. We also provide monthly updates to the Board to provide an update on operations and other key factors and issues that arise. We also maintain appropriate insurance coverage through a financial institution bond policy, which is reviewed at least annually by the Board for changes to coverage and our operations. Cyber Risk We collect and store confidential and personal information. Unauthorized access to the Company’s computer systems could result in the theft or publication of confidential information or the deletion or modification of records or could otherwise cause interruptions in the Company’s operations. In addition, despite the Company’s implementation of security measures, its systems are vulnerable to damages from computer viruses, natural disasters, unauthorized access, cyber‐attack and other similar disruptions. Any such system failure, accident or security breach could disrupt the Company’s delivery of services and make the Company’s applications unavailable or cause similar disruptions to the Company’s operations. If a person penetrates the Company’s network security or otherwise misappropriates sensitive data, we could be subject to liability or our business could be interrupted, and any of these developments could have a material adverse effect on the Company’s business, results of operations and financial condition. Cyber Risk Management We manage cyber risk through oversight by management, including an IT Management Committee, as well as the use of external third party advisors to provide technical expertise. Outsourcing Risk Outsourcing risk is the risk incurred when we contract out a business function to a service provider instead of performing the function ourselves, and the service provider performs at a lower standard than we would have under similar circumstances. We outsource the majority of our mortgage and loan origination, servicing and collections to MCAP and other third parties. Outsourcing Risk Management MCAN’s Outsourcing Policy, which is approved annually by the Board, incorporates the relevant requirements of OSFI Guideline B‐10, Outsourcing of Business Activities, Functions and Processes. We review our outsourced arrangements on an annual basis
2015 ANNUAL REPORT | MCAN MORTGAGE CORPORATION
‐ 49 ‐
to determine if the arrangement is material. If the arrangement is material it is subjected to a risk management program, which includes detailed monitoring activities. Credit Risk Credit risk is the risk of financial loss resulting from the failure of a counterparty, for any reason, to fully honour its financial or contractual obligations to the Company, primarily arising from our mortgage and lending activities. Fluctuations in real estate values may increase the risk of default and may also reduce the net realizable value of the collateral property to the Company. These risks may result in defaults and credit losses, which may result in a loss of earnings. Credit losses occur when a counter party fails to meet its obligations to the Company and the value realized on the sale of the underlying security deteriorates below the carrying amount of the exposure. Credit Risk Management
Credit and commitment exposure is closely monitored through a reporting process that includes a formal monthly review involving ALCO and a formal quarterly review involving the RCB. A CRO Report, which identifies, assesses, ranks and provides trending analysis on all material risks to the Company, is provided to the RCB on a quarterly basis. Weekly monitoring also takes place through our Capital Commitments Committee, which is comprised of certain members of management. Our exposure to credit risk is managed through prudent risk management policies and procedures that emphasize the quality and diversification of our investments. Credit limits, based on our risk appetite, which is approved by the Board at least annually, have been established for concentration by asset class, geographic region, dollar amount and borrower. These policies are amended on an ongoing basis to reflect changes in market conditions and our risk appetite. All members of management are subject to limits on their ability to commit the Company to credit risk. We identify potential risks in our mortgage portfolio by way of regular review of market metrics, which are a key component of quarterly market reports provided to the RCB. We also undertake site visits of active mortgage properties. Existing risks in our mortgage portfolio are identified by arrears reporting, portfolio diversification analysis, annual reviews of large loans and risk rating trends of the entire mortgage portfolio. The aforementioned reporting and analysis provides adequate monitoring of and control over our exposure to credit risk. In the current economic environment, we have increased our monitoring of real estate market values for single family mortgages, with independent assessments of value obtained as individual mortgages exceed 90 days in arrears. We assign a credit score and risk rating for all mortgages at the time of underwriting based on the quality of the borrower and the underlying real estate. Risk ratings are reviewed annually for large exposures, and whenever there is an amendment or a material adverse change such as a default or impairment. We have established a methodology for determining the adequacy of our collective allowances. The adequacy of collective allowances is assessed periodically, taking into consideration economic factors such as Gross Domestic Product, employment, housing market conditions as well as the current position in the economic cycle. We record an individual allowance to the extent that the estimated realizable value of a mortgage has decreased below its net book value. Individual allowances include all of the accumulated provisions for credit losses on a particular mortgage. Our maximum credit exposure on our individual financial assets is equal to the carrying value of the respective assets, except for our corporate mortgage portfolio, whose maximum credit exposure also includes outstanding commitments for future mortgage fundings. Interest Rate Risk Interest rate risk is the potential impact of changes in interest rates on our earnings and capital. Interest rate risk arises when our assets and liabilities, both on and off‐balance sheet, have mismatched repricing dates. Changes in interest rates where we have mismatched repricing dates may have an adverse effect on our financial condition and results of operations. In addition, interest rate risk may arise when changes in the underlying interest rates on assets do not match changes in the interest rates on liabilities. This potential mismatch may have an adverse effect on our financial condition and results of operations. Our exposure to interest rate risk is discussed further in Note 33 to the consolidated financial statements. Interest Rate Risk Management We evaluate our exposure to a variety of changes in interest rates across the term spectrum of our assets and liabilities, including both parallel and non‐parallel changes in interest rates. By managing and matching the terms of corporate assets and term
2015 ANNUAL REPORT | MCAN MORTGAGE CORPORATION
‐ 50 ‐
deposits so that they offset each other, we seek to reduce the risks associated with interest rate changes, and in conjunction with liquidity management policies and procedures, we also manage cash flow mismatches. ALCO reviews our interest rate exposure on a monthly basis using interest rate spread and gap analysis as well as interest rate sensitivity analysis based on various scenarios. This information is also formally reviewed by the RCB each quarter. We are exposed to interest rate risk on insured single family mortgages between the time that a mortgage rate is committed to borrowers and the time that the mortgage is funded, or in the case of mortgages securitized through the market MBS program, the time that the mortgage is securitized. To manage this risk, we may enter into interest rate swaps or we may match them with long‐term fixed‐rate term deposits. Ultimately, risk management is monitored and controlled at the highest level of the Company. ALCO reviews and manages these risks on a monthly basis. The Board also reviews and approves all risk management policies and procedures at least annually. Management reports to the Board on the status of risk management at least quarterly. Market Risk Market risk is the exposure to adverse changes in the value of financial assets. Our market risk factors include price risk on marketable securities, interest rates, real estate values, commodity prices and foreign exchange rates, among others. Any changes in these market risk factors may negatively affect the value of our financial assets, which may have an adverse effect on our financial condition and results of operations. We do not undertake trading activities as part of our regular operations, and therefore are not exposed to risks associated with activities such as market making, arbitrage or proprietary trading. Market Risk Management Our marketable securities portfolio is susceptible to market price risk arising from uncertainties about future values of the securities. We manage the equity price risk through diversification and limits on both individual and total securities. Reports on the portfolio are submitted to senior management on a regular basis and to the Board on a quarterly basis. Other Risk Factors General Litigation In the ordinary course of business, MCAN and its service providers (including MCAP), their subsidiaries and related parties may be party to legal proceedings that may result in unplanned payments to third parties. To the best of our knowledge, we do not expect the outcome of any of any existing proceedings to have a material adverse effect on the consolidated financial position or results of operations of the Company. Reliance on Key Personnel Our future performance is dependent on the abilities, experience and efforts of our management team and other key personnel. There is no assurance that we will be able to continue to attract and retain key personnel, although it remains a key objective of the Company. Should any key personnel be unwilling or unable to continue their employment with MCAN, there may be an adverse effect on our financial condition and results of operations. Economic Conditions Factors that could impact general business conditions include changes in short‐term and long‐term interest rates, commodity prices, inflation, consumer, business and government spending, real estate prices and adverse economic events. Regulatory Risk Changes in laws and regulations, including interpretation or implementation, may affect the Company by limiting the products or services that we can provide and increasing the ability of competitors to compete with our products and services. Also, any failure by the Company to comply with applicable laws and regulations may result in sanctions and financial penalties which may adversely impact our earnings and damage our reputation. Increasing regulations and expectations as a result of the recent financial crisis, both globally and domestically, have increased the cost and resources necessary to meet regulatory expectations for the Company.

2015 ANNUAL REPORT | MCAN MORTGAGE CORPORATION
‐ 51 ‐
Qualification as a Mortgage Investment Corporation Although we intend to qualify at all times as a MIC, no assurance can be provided in this regard. If for any reason we do not maintain our qualification as a MIC under the Tax Act, taxable dividends and capital gains dividends paid by MCAN on our common shares will cease to be fully or partly deductible in computing income for tax purposes and such dividends will no longer be deemed by the rules in the Tax Act that apply to MICs to have been received by shareholders as interest or a capital gain, as the case may be. As a consequence, the rules in the Tax Act regarding the taxation of public corporations and their shareholders should apply, with the result that the combined rate of corporate and shareholder tax could be significantly greater. Mortgage Renewal Risk We retain renewal rights on mortgages that we originate that are either sold to third parties or retained on the consolidated balance sheet. If mortgagors are unable to renew their mortgages at their scheduled maturities, we may be required to use our own financial resources to fund these obligations until mortgage arrears are collected or proceeds are received from mortgage insurers following the sale of mortgaged properties. Mortgage Prepayment Risk In acquiring certain mortgages from third parties, we pay a premium to the mortgage par value based on the expected term of the mortgage. To the extent that mortgages repay prior to maturity, we may be required to accelerate the amortization of the premium and sustain a financial loss. Competition Risk Our operations and income are a function of the interest rate environment, the availability of mortgage products at reasonable yields and the availability of term deposits at reasonable cost. The availability of mortgage products for the Company and the yields thereon are dependent on market competition. In the event that we are unable to compete successfully against our current or future competitors or raise term deposits to fund our lending activities, there may be an adverse effect on our financial condition and results of operations. Monetary Policy Our earnings are affected by the monetary policies of the Bank of Canada. Changes in the supply and demand of money and the general level of interest rates could affect our earnings. Changes in the level of interest rates affect the interest spread between our mortgages, loans and investments, securitization investments and term deposits, and as a result may impact our net investment income. Changes to monetary policy and in financial markets in general are beyond our control and are difficult to predict or anticipate. Environmental Risk We recognize that environmental hazards are a potential liability. This risk exposure can result from non‐compliance with environmental laws, either as principal or lender, which may negatively affect our financial condition and results of operations. We aim to mitigate this risk by complying with all environmental laws and by applying a rigorous environmental policy and procedures to our commercial and development lending activities. Changes in Laws and Regulations Changes to current laws, regulations, regulatory policies or guidelines (including changes in their interpretation, implementation or enforcement), the introduction of new laws, regulations, regulatory policies or guidelines or the exercise of discretionary oversight by regulatory or other competent authorities including OSFI, may adversely affect us, including by limiting the products or services that we provide, restricting the scope of our operations or business lines, increasing the ability of competitors to compete with our products and services or requiring us to cease carrying on business. In addition, delays in the receipt of any regulatory approvals and authorizations that may be necessary to the operation of our business may adversely affect our operations and financial condition. Our failure to comply with applicable laws and regulations may result in sanctions and financial penalties that could adversely impact our earnings and damage our reputation. Changes in Accounting Standards and Accounting Policies We may be subject to changes in the financial accounting and reporting standards that govern the preparation of our consolidated financial statements. These changes may materially impact how we record and report our financial condition and results of operations and, in certain circumstances, we may be required to retroactively apply a new or revised standard that results in our

2015 ANNUAL REPORT | MCAN MORTGAGE CORPORATION
‐ 52 ‐
restating prior period financial statements. Please refer to the “Standards Issued But Not Yet Effective” section of this MD&A for further details. Accuracy and Completeness of Information on Customers and Counterparties In deciding whether to extend credit or enter into other transactions with customers and counterparties, we rely on information furnished by them, including financial statements and other information. We may also rely on the representations of customers and counterparties as to the accuracy and completeness of that information. Our financial condition and results of operations may be negatively affected to the extent that we rely on financial statements and other information that do not comply with IFRS, that are materially misleading or that do not fairly represent, in all material respects, the financial condition and results of operations of the customers and counterparties. Leverage Leverage increases our potential exposure to all risk factors described above. No Assurance of Achieving Investment Objectives or Payment of Dividends As a result of the risks discussed above, there is no assurance that we will be able to achieve our investment objectives or be able to pay dividends at targeted or historic levels. The funds available for the payment of dividends to our shareholders will vary according to, among other things, the principal and interest payments received in respect of the Company’s investments. There can be no assurance that the Company will generate any returns or be able to pay dividends to our shareholders in the future.
DESCRIPTION OF CAPITAL STRUCTURE Our authorized share capital consists of an unlimited number of common shares with no par value. At December 31, 2015, there were 22,782,433 common shares outstanding. As at February 25, 2016, there were 22,862,723 common shares outstanding. In 2015, we closed a rights offering to common shareholders that raised $15.1 million of new share capital through the issuance of 1,406,084 common shares, creating $87 million of additional income tax asset capacity. During 2015, we issued 568,588 new shares under the DRIP out of treasury at the weighted average trading price for the 5 days preceding such issue less a discount of 2%. For additional information related to share capital, refer to Note 22 to the consolidated financial statements.
OFF‐BALANCE SHEET ARRANGEMENTS We have contractual obligations relating to an operating lease, in addition to outstanding commitments for future fundings of corporate mortgages and our investment in the KingSett High Yield Fund. We outsource the majority of our mortgage servicing and continue to pay servicing expenses as long as the mortgages remain on our balance sheet.
Table 32: Contractual Obligations
(in thousands) Less than One to Three to Over five As at December 31, 2015 one year three years five years years Total
Mortgage funding commitments $ 255,987 $ 52,255 $ ‐ $ ‐ $ 308,242Commitment ‐ KingSett High Yield Fund ‐ ‐ ‐ 25,425 25,425Operating lease 575 1,496 1,193 1,881 5,145
$ 256,562 $ 53,751 $ 1,193 $ 27,306 $ 338,812
We retain mortgage servicing obligations relating to mortgages securitized through the market MBS program where balance sheet derecognition has been achieved. For further information, refer to Note 6 to the consolidated financial statements. We provide letters of credit, which are not reflected on the consolidated balance sheet, for the purpose of supporting developer obligations to municipalities in conjunction with residential construction loans. For further information, refer to Note 32 to the consolidated financial statements.
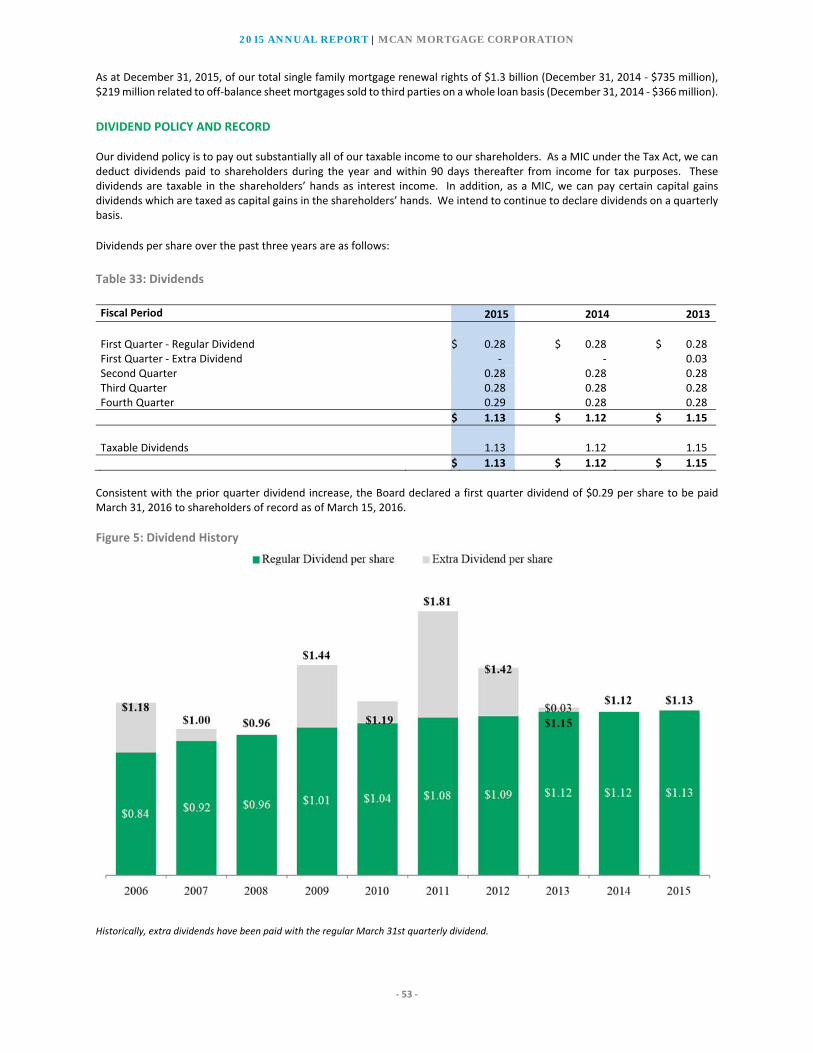
2015 ANNUAL REPORT | MCAN MORTGAGE CORPORATION
‐ 53 ‐
As at December 31, 2015, of our total single family mortgage renewal rights of $1.3 billion (December 31, 2014 ‐ $735 million), $219 million related to off‐balance sheet mortgages sold to third parties on a whole loan basis (December 31, 2014 ‐ $366 million).
DIVIDEND POLICY AND RECORD Our dividend policy is to pay out substantially all of our taxable income to our shareholders. As a MIC under the Tax Act, we can deduct dividends paid to shareholders during the year and within 90 days thereafter from income for tax purposes. These dividends are taxable in the shareholders’ hands as interest income. In addition, as a MIC, we can pay certain capital gains dividends which are taxed as capital gains in the shareholders’ hands. We intend to continue to declare dividends on a quarterly basis.
Dividends per share over the past three years are as follows:
Table 33: Dividends
Fiscal Period 2015 2014 2013
First Quarter ‐ Regular Dividend $ 0.28 $ 0.28 $ 0.28 First Quarter ‐ Extra Dividend ‐ ‐ 0.03 Second Quarter 0.28 0.28 0.28 Third Quarter 0.28 0.28 0.28 Fourth Quarter 0.29 0.28 0.28
$ 1.13 $ 1.12 $ 1.15
Taxable Dividends 1.13 1.12 1.15
$ 1.13 $ 1.12 $ 1.15
Consistent with the prior quarter dividend increase, the Board declared a first quarter dividend of $0.29 per share to be paid March 31, 2016 to shareholders of record as of March 15, 2016.
Figure 5: Dividend History
Historically, extra dividends have been paid with the regular March 31st quarterly dividend.
2015 ANNUAL REPORT | MCAN MORTGAGE CORPORATION
‐ 54 ‐
TRANSACTIONS WITH RELATED PARTIES Related party transactions for the years ended December 31, 2015 and December 31, 2014 are discussed in Note 30 to the consolidated financial statements.
FINANCIAL INSTRUMENTS AND OTHER INSTRUMENTS The majority of our consolidated balance sheet consists of financial instruments, and the majority of net income is derived from the related income, expenses, gains and losses. Financial instruments include cash and cash equivalents, short‐term investments, marketable securities, mortgages, financial investments, other loans, derivative financial instruments, financial liabilities from securitization, term deposits and loans payable, which are discussed throughout this MD&A. The use of financial instruments exposes us to interest rate, credit, liquidity and market risk. A discussion of these risks and how these risks are managed is found in the “Risk Governance and Management” section of this MD&A. Information on the financial statement classification and amounts of income, expenses, gains and losses associated with the instruments are located in the “Results from Operations” and “Financial Position” sections of this MD&A. Information on the determination of the fair value of financial instruments is located in the “Critical Accounting Estimates and Judgments” section of this MD&A.
PEOPLE As at December 31, 2015, we had 64 employees.
REGULATORY COMPLIANCE Our CCO ensures that management understands the impact of all relevant legislation affecting the business, assesses compliance with current and pending legislation and works with management to address any gaps in policies and procedures. We use a Regulatory Compliance Management System that ensures all managers assess their compliance with relevant legislation on a quarterly basis. Senior management liaises with regulators to keep them apprised of company progress and changes to our business. Our CCO reports quarterly to the CR, CG & HR Committee.
INTERNAL AUDIT The Internal Audit function, consisting of the Chief Audit Officer, has unrestricted access to our operations, records, property and personnel, including senior management, the Chair of the Audit Committee and the other members of the Board. Internal Audit formulates an annual risk‐based plan for approval by the Audit Committee and then undertakes internal audit reviews throughout the year with regular and direct reporting to both senior management and the Audit Committee.
CRITICAL ACCOUNTING ESTIMATES AND JUDGMENTS The preparation of the Company’s financial statements requires management to make judgments and estimations and assumptions that affect the reported amounts of revenues, expenses, assets and liabilities, and the disclosure of contingent liabilities, at the end of the reporting period. Estimates are considered carefully and reviewed at an appropriate level within MCAN. We believe that our estimates of the value of our assets and liabilities are appropriate. However, uncertainty about these assumptions and estimates could result in outcomes that require a material adjustment to the carrying amount of the asset or liability affected in future period.
Critical Accounting Estimates Fair value of financial instruments Where the fair values of financial assets and financial liabilities recorded in the consolidated financial statements cannot be derived from active markets, they are determined using a variety of valuation techniques that include the use of mathematical models. The inputs to these models are derived from observable market data where possible, but where observable market data are not available, estimates are required to establish fair values. These estimates include considerations of liquidity and model inputs such as discount rates, prepayment rates and default rate assumptions for certain investments.
2015 ANNUAL REPORT | MCAN MORTGAGE CORPORATION
‐ 55 ‐
Allowances for credit losses The allowance for credit losses reduces the carrying value of mortgage assets to provide for an estimate of the principal amounts that borrowers may not repay in the future. In assessing the estimated realizable value of assets, we must rely on estimates and exercise judgment regarding matters for which the ultimate outcome is unknown. A number of factors can affect the amount that we ultimately collect, including the quality of our own underwriting process and credit criteria, the diversification of the portfolio, the underlying security relating to the loans and the overall economic environment. Individual allowances include all of the accumulated provisions for losses on particular assets required to reduce the related assets to estimated realizable value. The collective allowance represents losses that we believe have been incurred but not yet specifically identified. The collective allowance is established by considering historical loss trends during economic cycles, the risk profile of our current portfolio, estimated losses for the current phase of the economic cycle and historic industry experience. Allowance rates depend on asset class, as different classes have varying underlying risks. Future changes in circumstances could materially affect our future provisions for credit losses from those provisions determined in the current year, and there could be a need to increase or decrease the allowance for credit losses. We review our individually significant mortgage balances at each consolidated financial statement date to assess whether an impairment loss should be recorded. In particular, estimates by management are required in the calculation of the amount and timing of future cash flows when determining the impairment loss. In estimating these cash flows, the Company makes assumptions about the borrower’s financial situation and the net realizable value of collateral. These estimates are based on assumptions about a number of factors and actual results may differ, resulting in future changes to the allowance. Mortgages that have been assessed individually and found not to be impaired and all individually insignificant mortgages are then assessed collectively, in groups of mortgages with similar risk characteristics, to determine whether a provision should be made due to incurred loss events for which there is objective evidence but whose effects are not yet evident. The collective assessment takes account of data from the mortgage portfolio (such as credit quality, levels of arrears, credit utilization, loan to value ratios, etc.), concentrations of risks and economic data (including levels of unemployment, real estate prices indices and the performance of different individual groups). There have been no recent changes to the methodology, nor are any expected in the foreseeable future. No trends, events or uncertainties exist that may affect the methodology and assumptions used. We complete a review of all provisioning policies at least annually. We continue to monitor asset performance and current economic conditions, focusing on any regionally specific issues to assess the adequacy of the current provisioning policies. Provisioning rates are reviewed on a quarterly basis. In addition to considering current economic conditions, we assessed the probability of default, expected loss as a result of default and the mortgage exposure at the time of default when establishing our collective allowance. We continue to review our underwriting and credit requirements on a regular basis, and we have taken measures as warranted by changes in the market and economic conditions. Our current provisioning rates consider the impact of a decline in real estate values and anticipated default/loss percentages that are sufficient to offset current and historical loss experiences. Mortgage prepayment rates In calculating the rate at which borrowers prepay their mortgages, the Company makes estimates based on its historical experience. These assumptions impact the timing of revenue recognition and the amortization of mortgage premiums using the effective interest rate method (“EIM”). Taxes Uncertainties exist with respect to the interpretation of complex tax regulations, changes in tax laws and the amount and timing of future taxable income in the subsidiaries of the Company. Differences arising between the actual results and the assumptions made, or future changes to such assumptions, could necessitate future adjustments to tax income and expense already recorded in the subsidiaries of the Company. The Company establishes provisions, based on reasonable estimates, for possible consequences of audits by relevant tax authorities. The amount of such provisions is based on various factors, such as experience of previous tax audits and interpretations of tax regulations by the responsible tax authority. As the Company assesses the probability of litigation and subsequent cash outflow with respect to taxes as remote, no contingent liability has been recognized. Deferred tax assets are recognized for all unused tax losses to the extent that it is probable that taxable income will be available against which the losses can be used in the subsidiaries of the Company. Significant management judgment is required to determine the amount of deferred tax assets that can be recognized in the subsidiaries of the Company, based upon the likely timing and the level of future taxable income together with future tax planning strategies.

2015 ANNUAL REPORT | MCAN MORTGAGE CORPORATION
‐ 56 ‐
Impairment of financial assets As applicable, the Company reviews financial assets at each consolidated financial statement date to assess whether an impairment loss should be recorded. In particular, estimates by management are required in the calculation of the amount and timing of future cash flows when determining the impairment loss. These estimates are based on assumptions about a number of factors and actual results may differ, resulting in future changes to the fair value of the asset.
Critical Accounting Judgments Going concern The Company’s management has made an assessment of the Company’s ability to continue as a going concern and is satisfied that the Company has the resources to continue in business for the foreseeable future. Furthermore, management is not aware of any material uncertainties that may cast significant doubt upon the Company’s ability to continue as a going concern. Therefore, the consolidated financial statements continue to be prepared on the going concern basis. Significant influence In determining whether it has significant influence over an entity, the Company makes certain judgments based on the applicable accounting standards. These judgments form the basis for the Company’s policies in accounting for its equity investments. Taxes As a MIC under the Tax Act, the Company is able to deduct from income for tax purposes dividends paid within 90 days of year‐end. The Company intends to maintain its status as a MIC and intends to pay sufficient dividends in current and future years to ensure that it is not subject to income taxes in the MIC entity on a non‐consolidated basis. Accordingly, the Company does not record a provision for current and deferred taxes within the MIC entity; however provisions are recorded as applicable in all subsidiaries of MCAN.
STANDARDS ISSUED BUT NOT YET EFFECTIVE Standards issued but not yet effective up to the date of issuance of the consolidated financial statements are listed below. This listing is of standards and interpretations issued, which we reasonably expect to be applicable at a future date. We intend to adopt those standards when they become effective. IFRS 9, Financial Instruments In July 2014, the IASB issued a final revised IFRS 9 standard. IFRS 9 uses a single approach to determine whether a financial asset is measured at amortized cost or fair value, replacing the multiple rules in IAS 39. The approach in IFRS 9 is based on how an entity manages its financial instruments in the context of its business model and the contractual cash flow characteristics of the financial assets. The new standard also includes an expected credit loss model to replace the current incurred loss model. Additionally, IFRS 9 has new hedge accounting principles that are aimed to align hedge accounting more closely with risk management. IFRS 9 is effective for annual periods beginning on or after January 1, 2018. The Company is in the process of assessing the impact of IFRS 9 on its consolidated financial statements. IFRS 15, Revenue from Contracts with Customers IFRS 15 provides a single principle‐based framework that applies to contracts with customers. IFRS 15 is effective for annual periods beginning on or after January 1, 2018. The Company is in the process of assessing the impact of IFRS 15 on its consolidated financial statements. IAS 1, Presentation of Financial Statements The Company will be required to adopt amendments to IAS 1, Presentation of Financial Statements, which includes amendments to further encourage companies to apply professional judgement in determining what information to disclose in their financial statements, for annual periods beginning on or after January 1, 2016. Management has concluded that the amendments to IAS 1 will have no impact on the Company’s consolidated financial statements.
2015 ANNUAL REPORT | MCAN MORTGAGE CORPORATION
‐ 57 ‐
IFRS 7, Financial Instruments: Disclosures The Company will be required to adopt amendments to IFRS 7, Financial Instruments: Disclosures, requiring increased disclosure regarding derecognition of financial assets and continuing involvement accounting, for annual periods beginning on or after January 1, 2016. Management has concluded that the amendments to IFRS 7 will have no impact on the Company’s consolidated financial statements. IFRS 16, Leases IFRS 16, Leases sets out the principles for the recognition, measurement, presentation and disclosure of leases for both parties to a contract, i.e., the customer (‘lessee’) and the supplier (‘lessor’). IFRS 16 is effective from January 1, 2019. All leases result in a company (the lessee) obtaining the right to use an asset at the start of the lease and, if lease payments are made over time, also obtaining financing. Accordingly, IFRS 16 eliminates the classification of leases as either operating leases or finance leases as is required by IAS 17 and, instead, introduces a single lessee accounting model. Applying that model, a lessee is required to recognise: (a) assets and liabilities for all leases with a term of more than 12 months, unless the underlying asset is of low value; and (b) depreciation of lease assets separately from interest on lease liabilities in the income statement. The Company has not yet determined the impact of IFRS 16 on its consolidated financial statements.
DISCLOSURE CONTROLS AND PROCEDURES AND INTERNAL CONTROLS OVER FINANCIAL REPORTING Disclosure Controls and Procedures (“DC&P”) A disclosure committee (the “Disclosure Committee”), comprised of members of our senior management is responsible for establishing and maintaining adequate disclosure controls and procedures. As of December 31, 2015, we have evaluated the effectiveness of the design and operation of our DC&P in accordance with requirements of National Instrument 52‐109 of the Canadian Securities Commission – Certification of Disclosure in Issuers’ Annual and Interim Filings (“NI 52‐109”). Our CEO and CFO supervised and participated in this evaluation. Based on the evaluation, our CEO and CFO concluded that our disclosure controls and procedures were effective to ensure that information required to be disclosed by us in reports we file or submit is recorded, processed, summarized and reported within the time periods specified in securities legislation and is accumulated and communicated to our management, including our CEO and CFO, to allow timely decisions regarding required disclosure. Internal Controls over Financial Reporting (“ICFR”) The Disclosure Committee is responsible for establishing and maintaining adequate ICFR. Under the supervision and with the participation of the Disclosure Committee, including our CEO and CFO, we evaluated the effectiveness of our ICFR based upon the framework issued by the Committee of Sponsoring Organizations of the Treadway Commission, a recognized control model, and the requirements of NI 52‐109. Based on the evaluation, our CEO and CFO concluded that our ICFR were effective as of December 31, 2015. Ernst & Young LLP, our Independent Registered Chartered Accountants, have audited our consolidated financial statements for the year ended December 31, 2015. Changes in ICFR There were no changes in our ICFR that occurred during the period beginning on January 1 and ending on December 31, 2015 that have materially affected, or are reasonably likely to materially affect, our ICFR. Inherent Limitations of Controls and Procedures All internal control systems, no matter how well designed, have inherent limitations. As a result, even systems determined to be effective may not prevent or detect misstatements on a timely basis, as systems can provide only reasonable assurance that the objectives of the control system are met. In addition, projections of any evaluation of the effectiveness of ICFR to future periods are subject to the risk that controls may become inadequate because of changes in conditions, or that the degree of compliance with the policies or procedures may change.
NON IFRS MEASURES We prepare our consolidated financial statements in accordance with International Financial Reporting Standards (“IFRS”). We use a number of financial measures to assess our performance. Some of these measures are not calculated in accordance with IFRS, are not defined by IFRS, and do not have standardized meanings that would ensure consistency and comparability between companies using these measures. The non‐IFRS measures used in this MD&A are defined as follows:

2015 ANNUAL REPORT | MCAN MORTGAGE CORPORATION
‐ 58 ‐
Return on Average Shareholders’ Equity Return on average shareholders’ equity is a profitability measure that presents the annualized net income available to shareholders’ equity as a percentage of the capital deployed to earn the income. We calculate return on average shareholders’ equity as a monthly average using all components of shareholders’ equity. Taxable Income Measures Taxable Income Measures include taxable income and taxable income per share. Taxable income represents MCAN’s net income on a non‐consolidated basis calculated under the provisions of the Tax Act applicable to a MIC. Taxable income is calculated as an estimate until we complete our annual tax returns subsequent to year end, at which point it is finalized. Average Interest Rate The average interest rate is a profitability measure that presents the average annualized yield of an asset or liability. Average mortgage portfolio yield (corporate or securitized), term deposit average interest rate, financial liabilities from securitization average interest rate and spread of mortgages over term deposits are examples of average interest rates. The average asset/liability balance that is incorporated into the average interest rate calculation is calculated on either a daily or monthly basis depending on the nature of the asset/liability. Please refer to the applicable tables containing average balances for further details. Net Interest Income Net interest income is a profitability measure that reflects net income earned only from interest‐bearing assets and liabilities. Impaired Mortgage Ratios The impaired mortgage ratios represent the ratio of impaired uninsured mortgages to both corporate and total (corporate and securitized) mortgage principal. Mortgage Arrears Mortgage arrears measures include total corporate mortgage arrears, total securitized mortgage arrears and total mortgage arrears. These measures represent the amount of mortgages from the corporate portfolio, securitized portfolio and the sum of the two, respectively, that are at least one day past due. Common Equity Tier 1, Tier 1 and Total Capital, Total Exposures, Regulatory Assets, Leverage Ratio, Assets to Capital Multiple and Risk Weighted Assets These measures provided in this MD&A are in accordance with guidelines issued by OSFI and are located on Table 28 of this MD&A and Note 34 to the consolidated financial statements. Tier 1, Tier 2, Tier 3 and Total Liquid Assets and Liquidity Ratios Tier 1, Tier 2, Tier 3 and Total Liquid Assets are internal metrics that quantify the balance sheet assets (or components of assets) that comprise various liquidity levels. Liquidity ratios represent the ratio of select tiers of liquid assets to term deposits maturing within 100 days. Income Tax Capital Measures Income tax assets, income tax liabilities and income tax capital represent assets, liabilities and capital as calculated on a non‐consolidated basis using the provisions of the Tax Act applicable to a MIC. The calculation of the income tax assets to capital ratio and income tax liabilities to capital ratio are based on these amounts. Income tax asset capacity represents additional income tax asset growth available to yield a 5.75 income tax assets to capital ratio, which is our target ratio. Market Capitalization Market capitalization is calculated as the number of common shares outstanding multiplied by the closing common share price as of that date. Book Value per Common Share Book value per common share is calculated as total shareholders’ equity divided by the number of common shares outstanding. Limited Partner’s At‐Risk Amount The value of our equity investment in MCAP for income tax purposes is referred to as the Limited Partner’s At‐Risk Amount (“LP ARA”), which represents the cost base of the limited partner’s investment in the partnership. The LP ARA is increased (decreased) by the partner’s share of partnership income (loss) on a tax basis, increased by the amount of capital contributions into the partnership and reduced by distributions received from the partnership.

2015 ANNUAL REPORT | MCAN MORTGAGE CORPORATION
‐ 59 ‐
STATEMENT OF MANAGEMENT’S RESPONSIBILITY FOR FINANCIAL INFORMATION The accompanying consolidated financial statements of MCAN Mortgage Corporation (“MCAN” or the “Company”) are the responsibility of management and have been approved by the Board of Directors. Management is responsible for the information and representations contained in these consolidated financial statements, the Management’s Discussion and Analysis of Operations and all other sections of the annual report. The consolidated financial statements have been prepared by management in accordance with International Financial Reporting Standards (“IFRS”), including the accounting requirements of our regulator, the Office of the Superintendent of Financial Institutions Canada. The Company’s accounting system and related internal controls are designed, and supporting procedures maintained to provide reasonable assurance that the Company’s financial records are complete and accurate and that assets are safeguarded against loss from unauthorized use or disposition. The Office of the Superintendent of Financial Institutions Canada makes such examination and enquiry into the affairs of MCAN as deemed necessary to be satisfied that the provisions of the Trust and Loan Companies Act are being duly observed for the benefit of depositors and that the Company is in sound financial condition. The Board of Directors is responsible for ensuring that management fulfils its responsibility for financial reporting and is ultimately responsible for reviewing and approving the consolidated financial statements. These responsibilities are carried out primarily through an Audit Committee of unrelated directors appointed by the Board of Directors. The Chief Financial Officer reviews internal controls, control systems and compliance matters and reports thereon to the Audit Committee. The Audit Committee meets periodically with management and the external auditors to discuss internal controls over the financial reporting process, auditing matters and financial reporting issues. The Audit Committee reviews the consolidated financial statements and recommends them to the Board of Directors for approval. The Audit Committee also recommends to the Board of Directors and Shareholders the appointment of external auditors and approval of their fees. The consolidated financial statements have been audited by the Company’s external auditors, Ernst & Young LLP, in accordance with Canadian generally accepted auditing standards. Ernst & Young LLP has full and free access to the Audit Committee.
William Jandrisits Jeff Bouganim
President and Chief Executive Officer Vice President and Chief Financial Officer
Toronto, Canada, February 26, 2016

2015 ANNUAL REPORT | MCAN MORTGAGE CORPORATION
‐ 60 ‐
Independent auditors’ report To the Shareholders of MCAN Mortgage Corporation We have audited the accompanying consolidated financial statements of MCAN Mortgage Corporation, which comprise the consolidated balance sheets as at December 31, 2015 and 2014, and the consolidated statements of income, comprehensive income, changes in shareholders’ equity and cash flows for the years ended December 31, 2015 and 2014, and a summary of significant accounting policies and other explanatory information. Management's responsibility for the consolidated financial statements Management is responsible for the preparation and fair presentation of these consolidated financial statements in accordance with International Financial Reporting Standards, and for such internal control as management determines is necessary to enable the preparation of consolidated financial statements that are free from material misstatement, whether due to fraud or error. Auditors' responsibility Our responsibility is to express an opinion on these consolidated financial statements based on our audits. We conducted our audits in accordance with Canadian generally accepted auditing standards. Those standards require that we comply with ethical requirements and plan and perform the audit to obtain reasonable assurance about whether the consolidated financial statements are free from material misstatement. An audit involves performing procedures to obtain audit evidence about the amounts and disclosures in the consolidated financial statements. The procedures selected depend on the auditors' judgment, including the assessment of the risks of material misstatement of the consolidated financial statements, whether due to fraud or error. In making those risk assessments, the auditors consider internal control relevant to the entity's preparation and fair presentation of the consolidated financial statements in order to design audit procedures that are appropriate in the circumstances, but not for the purpose of expressing an opinion on the effectiveness of the entity's internal control. An audit also includes evaluating the appropriateness of accounting policies used and the reasonableness of accounting estimates made by management, as well as evaluating the overall presentation of the consolidated financial statements. We believe that the audit evidence we have obtained in our audits is sufficient and appropriate to provide a basis for our audit opinion. Opinion In our opinion, the consolidated financial statements present fairly, in all material respects, the financial position of MCAN Mortgage Corporation as at December 31, 2015 and 2014 and its financial performance and its cash flows for the years ended December 31, 2015 and 2014 in accordance with International Financial Reporting Standards.
Toronto, Canada February 26, 2016
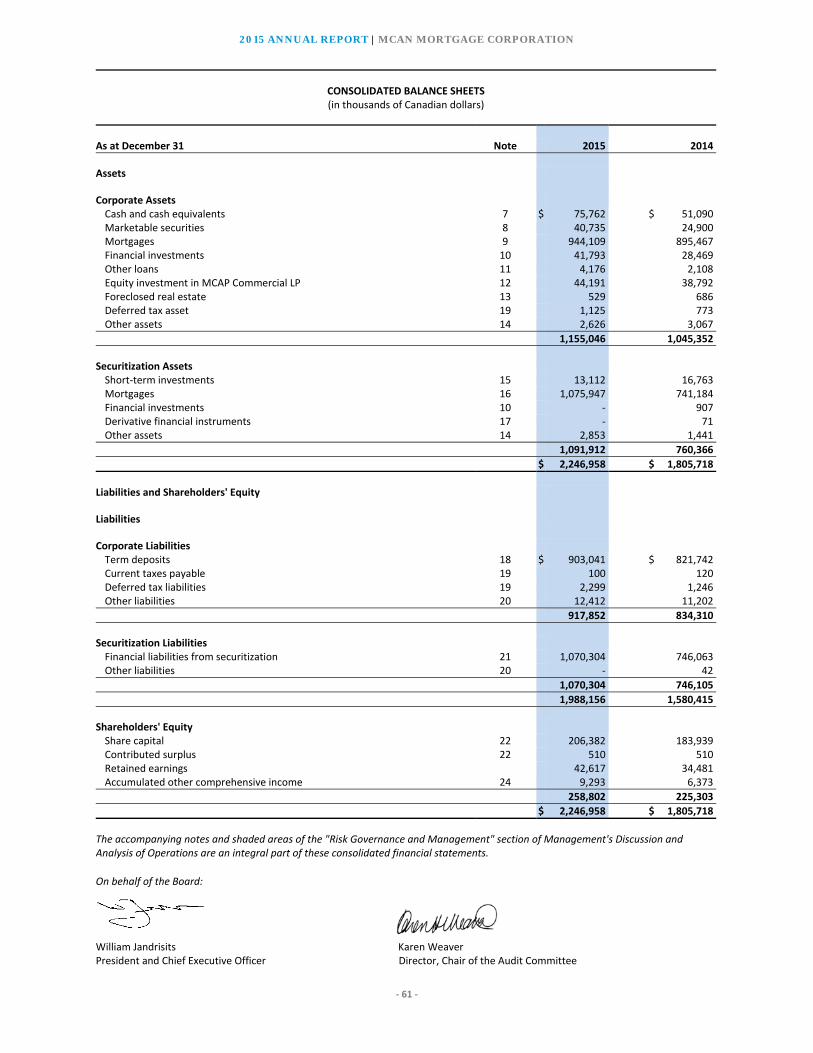
2015 ANNUAL REPORT | MCAN MORTGAGE CORPORATION
‐ 61 ‐
CONSOLIDATED BALANCE SHEETS (in thousands of Canadian dollars)
As at December 31 Note 2015 2014
Assets
Corporate Assets
Cash and cash equivalents 7 $ 75,762 $ 51,090 Marketable securities 8 40,735 24,900 Mortgages 9 944,109 895,467 Financial investments 10 41,793 28,469 Other loans 11 4,176 2,108 Equity investment in MCAP Commercial LP 12 44,191 38,792 Foreclosed real estate 13 529 686 Deferred tax asset 19 1,125 773 Other assets 14 2,626 3,067
1,155,046 1,045,352
Securitization Assets
Short‐term investments 15 13,112 16,763 Mortgages 16 1,075,947 741,184 Financial investments 10 ‐ 907 Derivative financial instruments 17 ‐ 71 Other assets 14 2,853 1,441
1,091,912 760,366
$ 2,246,958 $ 1,805,718
Liabilities and Shareholders' Equity
Liabilities
Corporate Liabilities
Term deposits 18 $ 903,041 $ 821,742 Current taxes payable 19 100 120 Deferred tax liabilities 19 2,299 1,246 Other liabilities 20 12,412 11,202
917,852 834,310
Securitization Liabilities
Financial liabilities from securitization 21 1,070,304 746,063 Other liabilities 20 ‐ 42
1,070,304 746,105
1,988,156 1,580,415
Shareholders' Equity
Share capital 22 206,382 183,939 Contributed surplus 22 510 510 Retained earnings 42,617 34,481 Accumulated other comprehensive income 24 9,293 6,373
258,802 225,303
$ 2,246,958 $ 1,805,718
The accompanying notes and shaded areas of the "Risk Governance and Management" section of Management's Discussion and Analysis of Operations are an integral part of these consolidated financial statements.
On behalf of the Board:
William Jandrisits Karen Weaver President and Chief Executive Officer Director, Chair of the Audit Committee

2015 ANNUAL REPORT | MCAN MORTGAGE CORPORATION
‐ 62 ‐
CONSOLIDATED STATEMENTS OF INCOME (in thousands of Canadian dollars except for per share amounts)
Years Ended December 31 Note 2015 2014
Net Investment Income ‐ Corporate Assets
Mortgage interest $ 50,997 $ 50,426 Equity income from MCAP Commercial LP 12 10,096 6,182 Fees 25 3,231 2,733 Marketable securities 2,076 1,925 Whole loan gain on sale income 29 626 1,296 Realized and unrealized loss on financial instruments 17 (2,914) (1,729) Interest on financial investments and other loans 3,506 822 Interest on cash and cash equivalents 730 848 Gain on sale of foreclosed real estate 13 ‐ 1,115
68,348 63,618
Term deposit interest and expenses 20,671 20,709 Mortgage expenses 26 3,823 3,820 Interest on loans payable 838 921 Provision for (recovery of) credit losses 27 275 (983)
25,607 24,467
42,741 39,151
Other Income ‐ Corporate Assets
Gain on sale of investment in MCAP Commercial LP 12 ‐ 711 Gain on dilution of investment in MCAP Commercial LP 12 68 71
68 782
Net Investment Income ‐ Securitization Assets
Mortgage interest 25,564 12,383 Interest on financial investments 1 428 Interest on short‐term investments 76 835 Other securitization income 28 121 1,343
25,762 14,989
Interest on financial liabilities from securitization 19,763 13,087 Mortgage expenses 26 1,461 620
21,224 13,707
Net investment income before fair value adjustment 4,538 1,282 Fair value adjustment ‐ derivative financial instruments 17 (71) (1,376)
4,467 (94)
Operating Expenses
Salaries and benefits 8,515 7,154 General and administrative 5,993 6,229
14,508 13,383
Net Income Before Income Taxes 32,768 26,456Provision for (recovery of) income taxes
Current 19 ‐ 102 Deferred 19 (89) 908
(89) 1,010
Net Income $ 32,857 $ 25,446
Basic and diluted earnings per share $ 1.51 $ 1.23
Dividends per share $ 1.13 $ 1.12
Weighted average number of basic and diluted shares (000's) 21,830 20,639
The accompanying notes and shaded areas of the "Risk Governance and Management" section of Management's Discussion and Analysisof Operations are an integral part of these consolidated financial statements.
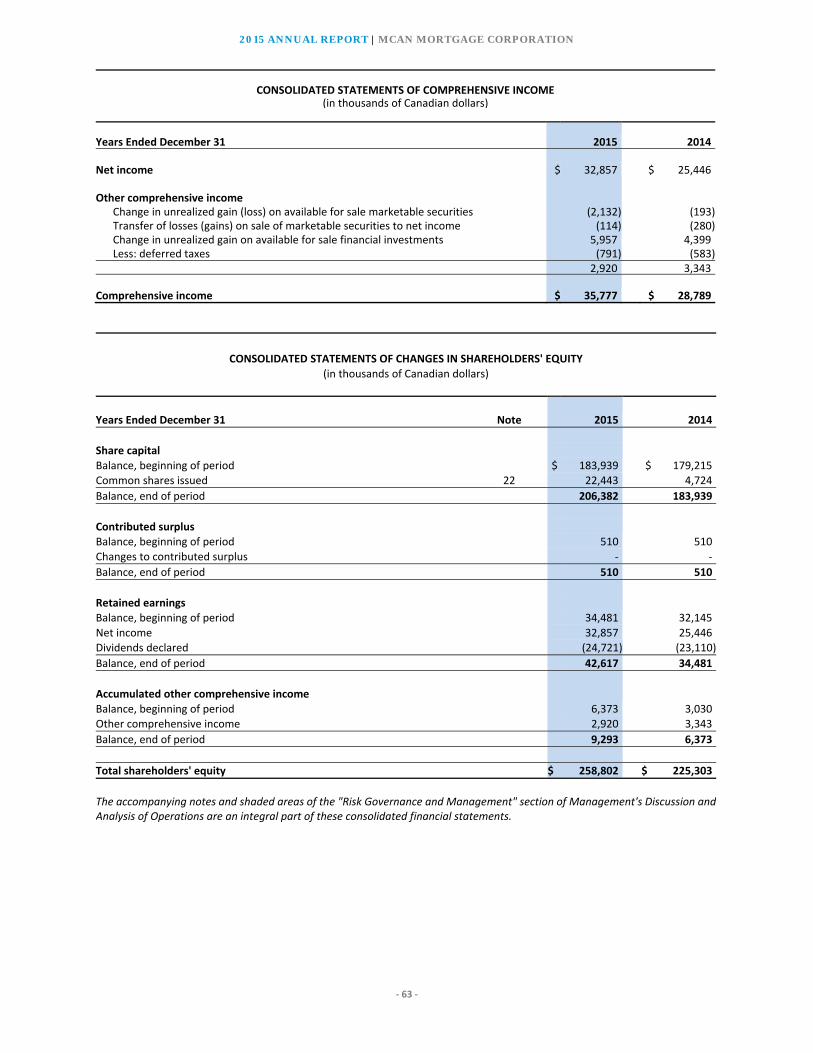
2015 ANNUAL REPORT | MCAN MORTGAGE CORPORATION
‐ 63 ‐
CONSOLIDATED STATEMENTS OF COMPREHENSIVE INCOME
(in thousands of Canadian dollars) Years Ended December 31 2015 2014 Net income $ 32,857 $ 25,446 Other comprehensive income Change in unrealized gain (loss) on available for sale marketable securities (2,132) (193) Transfer of losses (gains) on sale of marketable securities to net income (114) (280) Change in unrealized gain on available for sale financial investments 5,957 4,399 Less: deferred taxes (791) (583) 2,920 3,343 Comprehensive income $ 35,777 $ 28,789
CONSOLIDATED STATEMENTS OF CHANGES IN SHAREHOLDERS' EQUITY
(in thousands of Canadian dollars)
Years Ended December 31 Note 2015 2014
Share capital
Balance, beginning of period $ 183,939 $ 179,215Common shares issued 22 22,443 4,724
Balance, end of period 206,382 183,939
Contributed surplus Balance, beginning of period 510 510
Changes to contributed surplus ‐ ‐
Balance, end of period 510 510
Retained earnings Balance, beginning of period 34,481 32,145
Net income 32,857 25,446Dividends declared (24,721) (23,110)
Balance, end of period 42,617 34,481
Accumulated other comprehensive income
Balance, beginning of period 6,373 3,030Other comprehensive income 2,920 3,343
Balance, end of period 9,293 6,373
Total shareholders' equity $ 258,802 $ 225,303
The accompanying notes and shaded areas of the "Risk Governance and Management" section of Management's Discussion andAnalysis of Operations are an integral part of these consolidated financial statements.

2015 ANNUAL REPORT | MCAN MORTGAGE CORPORATION
‐ 64 ‐
CONSOLIDATED STATEMENTS OF CASH FLOWS
(in thousands of Canadian dollars)
Years Ended December 31 2015 2014
Cash provided by (used for): Operating Activities Net income $ 32,857 $ 25,446 Adjustments to determine cash flows relating to operating activities: Current taxes ‐ 102 Deferred taxes (89) 908 Equity income from MCAP Commercial LP (10,096) (6,182) Gain on dilution of MCAP Commercial LP (68) (71) Gain on sale of investment in MCAP Commercial LP ‐ (711) Provision for (recovery of) credit losses 275 (983) Fair value adjustment ‐ derivative financial instruments 71 1,376 Amortization of securitized mortgage and liability transaction costs 3,539 2,027 Amortization of other assets 349 617 Amortization of mortgage discounts (2,126) (1,169) Amortization of premium on marketable securities 45 48 Changes in operating assets and liabilities: Mortgages (531,690) (183,011) Term deposits 81,299 31,520 Financial liabilities from securitization 470,608 (308,717) Marketable securities (18,126) (3,735) Short‐term investments 3,651 353,637 Financial investments (6,461) 103,197 Other loans (2,068) 4,981 Other assets (274) (528) Other liabilities 286 (3,836)
Cash flows from operating activities 21,982 14,916
Investing Activities Distributions from MCAP Commercial LP 4,765 2,930 Decrease in foreclosed real estate 157 422 Proceeds on sale of investment in MCAP Commercial LP ‐ 4,488 Acquisition of capital and intangible assets (735) (327)
Cash flows from investing activities 4,187 7,513
Financing Activities Issue of common shares 22,443 4,724 Increase in loans payable ‐ (17,991) Dividends paid (23,940) (23,017)
Cash flows for financing activities (1,497) (36,284)
Increase in cash and cash equivalents 24,672 (13,855)Cash and cash equivalents, beginning of period 51,090 64,945
Cash and cash equivalents, end of period $ 75,762 $ 51,090
Supplementary Information 2015 2014
Interest received $ 80,720 $ 61,557Interest paid 36,397 30,795Distributions received from investments 5,627 1,952
The accompanying notes and shaded areas of the "Risk Governance and Management" section of Management's Discussion and Analysis of Operations are an integral part of these consolidated financial statements.

2015 ANNUAL REPORT | MCAN MORTGAGE CORPORATION
‐ 65 ‐
NOTES TO THE CONSOLIDATED FINANCIAL STATEMENTS
Note Page
1. Corporate Information .......................................................................................................................................... 66
2. Basis of Preparation .............................................................................................................................................. 66
3. Basis of Consolidation ........................................................................................................................................... 66
4. Summary of Significant Accounting Policies ......................................................................................................... 67
5. Significant Accounting Judgments and Estimates ................................................................................................. 75
6. Securitization Activities ......................................................................................................................................... 76
7. Cash and Cash Equivalents .................................................................................................................................... 79
8. Marketable Securities ........................................................................................................................................... 79
9. Mortgages ‐ Corporate .......................................................................................................................................... 79
10. Financial Investments ........................................................................................................................................... 82
11. Other Loans........................................................................................................................................................... 83
12. Equity Investment in MCAP Commercial LP ......................................................................................................... 83
13. Foreclosed Real Estate .......................................................................................................................................... 84
14. Other Assets .......................................................................................................................................................... 84
15. Short‐Term Investments ....................................................................................................................................... 85
16. Mortgages ‐ Securitized ........................................................................................................................................ 85
17. Derivative Financial Instruments .......................................................................................................................... 86
18. Term Deposits ....................................................................................................................................................... 87
19. Income Taxes ........................................................................................................................................................ 87
20. Other Liabilities ..................................................................................................................................................... 88
21. Financial Liabilities from Securitization ................................................................................................................ 88
22. Share Capital and Contributed Surplus ................................................................................................................. 88
23. Dividends .............................................................................................................................................................. 89
24. Accumulated Other Comprehensive Income ........................................................................................................ 89
25. Fees ....................................................................................................................................................................... 89
26. Mortgage Expenses ............................................................................................................................................... 89
27. Provision for Credit Losses .................................................................................................................................... 90
28. Other Securitization Income ................................................................................................................................. 90
29. Whole Loan Gain on Sale Income ......................................................................................................................... 90
30. Related Party Disclosures ..................................................................................................................................... 90
31. Commitments and Contingencies ......................................................................................................................... 92
32. Credit Facilities...................................................................................................................................................... 92
33. Interest Rate Sensitivity ........................................................................................................................................ 93
34. Capital Management ............................................................................................................................................ 94
35. Financial Instruments ........................................................................................................................................... 98
36. Comparative Amounts ........................................................................................................................................ 100

2015 ANNUAL REPORT | MCAN MORTGAGE CORPORATION (Dollar amounts in thousands except for per share amounts)
‐ 66 ‐
1. Corporate Information MCAN Mortgage Corporation (the “Company” or “MCAN”) is a Loan Company under the Trust and Loan Companies Act (Canada) (the “Trust Act”) and a Mortgage Investment Corporation (“MIC”) under the Income Tax Act (Canada) (the “Tax Act”). As a Loan Company under the Trust Act, the Company is subject to the guidelines and regulations set by the Office of the Superintendent of Financial Institutions Canada (“OSFI”). MCAN’s primary objective is to generate a reliable stream of income by investing its corporate funds in a portfolio of mortgages (including single family residential, residential construction, non‐residential construction and commercial loans), as well as other types of financial investments, loans and real estate investments. MCAN employs leverage by issuing term deposits eligible for Canada Deposit Insurance Corporation (“CDIC”) deposit insurance up to a maximum of five times capital (on a non‐consolidated income tax basis in the MIC entity) as limited by the provisions of the Tax Act applicable to a MIC. The term deposits are sourced through a network of independent financial agents. As a MIC, MCAN is entitled to deduct from income for tax purposes 50% of capital gains dividends and 100% of other dividends paid. Such dividends are received by shareholders as capital gains dividends and interest income, respectively. MCAN’s primary wholly owned subsidiary, Xceed Mortgage Corporation (“Xceed”), focuses on the origination and sale to MCAN and third party mortgage aggregators of residential first‐charge mortgage products across Canada. As such, Xceed operates primarily in one industry segment through its sales team and mortgage brokers. Xceed is incorporated in the province of Ontario. MCAN also participates in the National Housing Act (“NHA”) mortgage‐backed securities (“MBS”) program. For further details, refer to Note 6. MCAN is incorporated in Canada. MCAN and Xceed’s head office is located at 200 King Street West, Suite 600, Toronto, Ontario, Canada. MCAN is listed on the Toronto Stock Exchange under the symbol MKP. The consolidated financial statements were approved in accordance with a resolution of the Board of Directors on February 26, 2016.
2. Basis of Preparation
The consolidated financial statements of the Company have been prepared in accordance with International Financial Reporting Standards (“IFRS”), effective for the Company as at December 31, 2015, as issued by the International Accounting Standards Board (“IASB”), including the accounting guidance of OSFI. The consolidated financial statements have been prepared on a historical cost basis, except for cash and cash equivalents, marketable securities, foreclosed real estate, certain financial investments designated as available for sale and derivative financial instruments, which have been measured at fair value. The consolidated financial statements are presented in Canadian dollars. The Company separates its assets into its corporate and securitization portfolios for reporting purposes. Corporate assets represent the Company’s core strategic investments, and are funded by term deposits and share capital. Securitization assets consist primarily of mortgages that have been securitized through the market MBS program and the CMB program and subsequently sold to third parties, in addition to reinvestment assets such as short‐term investments purchased with CMB program mortgage principal repayments. These assets are funded by the cash received from the sale of the associated securities to third party investors. The obligations to repay funds are classified as financial liabilities from securitization.
3. Basis of Consolidation The consolidated financial statements include the balances of MCAN and its subsidiaries as at December 31, 2015.

2015 ANNUAL REPORT | MCAN MORTGAGE CORPORATION (Dollar amounts in thousands except for per share amounts)
‐ 67 ‐
3. Basis of Consolidation (continued) Subsidiaries are fully consolidated from the date on which the Company obtains control, and continue to be consolidated until the date that such control ceases. Per IFRS 10, Consolidated Financial Statements, an investor controls an investee when it is exposed, or has rights, to variable returns from its involvement with the investee and has the ability to affect those returns through its power over the investee. The financial statements of the subsidiaries are prepared for the same reporting period as the Company, using consistent accounting policies. All intercompany balances due to/from subsidiaries, income and expenses and unrealized gains and losses resulting from intercompany transactions and dividends are eliminated in full.
4. Summary of Significant Accounting Policies The following are the significant accounting policies applied by the Company in the preparation of its consolidated financial statements. Certain policies adopted in or relevant to fiscal 2015 and 2014 are also discussed below.
(1) Financial instruments ‐ initial recognition and subsequent measurement
(i) Date of recognition
All financial assets and liabilities are initially recognized on the trade date, which is the date that the Company becomes a party to the contractual provisions of the instrument.
(ii) Measurement of financial instruments All financial instruments are measured initially at their fair value plus, in the case of financial instruments not subsequently recorded at fair value through the consolidated statements of income, directly attributable transaction costs. Subsequent measurement and accounting treatment depends principally on the classification of financial instruments at initial recognition. The classification of an instrument in the measurement categories specified in IFRS depends on a number of factors, including the purpose and management’s intention for which the financial instruments were acquired and their contractual characteristics. The Company classifies its financial instruments in the measurement categories noted below:
a. Financial assets or financial liabilities held for trading
Financial assets or financial liabilities held for trading are recorded at fair value. Changes in fair value are recognized in the consolidated statements of income. Interest income or expense is recorded in the consolidated statements of income on the accrual basis.
A financial asset or financial liability is classified as held for trading if:
(a) it is acquired or incurred principally for the purpose of selling or repurchasing in the near term; (b) on initial recognition it is part of a portfolio of identified financial instruments that are managed together and for
which there is evidence of a recent actual pattern of short‐term profit‐taking; or
(c) it is a derivative (except for a derivative that is a financial guarantee contract or a designated and effective hedging instrument).
Derivatives are recorded at fair value and carried as assets when their fair value is positive and as liabilities when their fair value is negative. Changes in the fair value of derivatives are included in the consolidated statements of income. The Company uses derivative financial instruments such as interest rate swaps to economically hedge interest rate risk. No derivative financial instruments have been designated for hedge accounting.
2015 ANNUAL REPORT | MCAN MORTGAGE CORPORATION (Dollar amounts in thousands except for per share amounts)
‐ 68 ‐
4. Summary of Significant Accounting Policies (continued)
b. Available for sale financial investments
Available for sale investments include marketable securities, an equity investment in commercial real estate and an equity investment in a mortgage fund. Equity investments classified as available for sale are those that are neither classified as held for trading nor designated at fair value through the consolidated statements of income. Certain marketable securities are intended to be held for an indefinite period of time but may be sold in response to needs for liquidity or in response to changes in the market conditions.
c. Loans and receivables
The loans and receivables category includes mortgages, other loans, non‐derivative financial assets and certain financial investments with fixed or determinable payments that are not quoted in an active market, other than:
Those that the Company intends to sell immediately or in the near term and those that the Company upon initial recognition designates at fair value;
Those that the Company, upon initial recognition, designates as available for sale; or
Those for which the Company may not recover substantially all of its initial investment, other than because of credit deterioration.
After initial measurement, financial assets classified as loans and receivables are subsequently measured at amortized cost using the effective interest rate method (“EIM”), less any allowance for impairment. Amortized cost is calculated by taking into account any discount or premium on acquisition and fees and costs that are an integral part of the EIM. The amortization is included in mortgage interest income or interest on financial investments and other loans in the consolidated statements of income. The losses arising from impairment are recognized in the consolidated statements of income.
d. Financial liabilities
After initial recognition, interest bearing financial liabilities are subsequently measured at amortized cost using the EIM. Amortized cost is calculated by taking into account any discount or premium on acquisition and fees or costs using the EIM. The amortization is included in the related line in the consolidated statements of income. Unamortized premiums and discounts are recognized in the consolidated statements of income upon extinguishment of the liability.
(iii) Transaction costs
Transaction costs are incremental costs that are directly attributable to the acquisition, issue or disposal of a financial asset or financial liability. Transaction costs are capitalized and amortized over the expected life of the instrument using the EIM, except for transaction costs which are related to financial assets or financial liabilities classified as held for trading or designated at fair value, which are expensed.
(2) Derecognition of financial assets and financial liabilities (i) Financial assets
A financial asset (or, where applicable a part of a financial asset or part of a group of similar financial assets) is derecognized when:
The rights to receive cash flows from the asset have expired; or
The Company has transferred its rights to receive cash flows from the asset or has assumed an obligation to pay the received cash flows in full without material delay to a third party under a qualifying “pass‐through” arrangement; and either:
the Company has transferred substantially all the risks and rewards of ownership of the financial asset, or

2015 ANNUAL REPORT | MCAN MORTGAGE CORPORATION (Dollar amounts in thousands except for per share amounts)
‐ 69 ‐
4. Summary of Significant Accounting Policies (continued)
the Company has neither transferred nor retained substantially all the risks and rewards of ownership of the financial asset, but has transferred control of the financial asset.
When substantially all the risks and rewards of ownership of the financial asset have been transferred, the Company will derecognize the financial asset and recognize separately as assets or liabilities any rights and obligations created or retained in the transfer. When substantially all the risks and rewards of ownership of the financial asset have been retained, the Company continues to recognize the financial asset and also recognizes a financial liability for the consideration received. Certain transaction costs incurred are also capitalized and amortized using the EIM. When the Company has neither transferred nor retained substantially all the risks and rewards of ownership of the financial asset nor transferred control of the financial asset, the financial asset is recognized to the extent of the Company’s continuing involvement in the financial asset. In that case, the Company also recognizes an associated liability.
The transferred asset and the associated liability are measured on a basis that reflects the rights and obligations that the Company has retained.
(ii) Financial liabilities A financial liability is derecognized when the obligation under the liability is discharged or cancelled or expires. Where an existing financial liability is replaced by another from the same lender on substantially different terms, or the terms of an existing liability are substantially modified, such an exchange or modification is treated as a derecognition of the original liability and the recognition of a new liability and the difference in the respective carrying amounts is recognized in the consolidated statements of income.
(3) Determination of fair value Per IFRS 13, Fair Value Measurement, fair value is defined as the price that would be received to sell an asset or paid to transfer a liability in an orderly transaction between market participants at the measurement date. For all other financial instruments not traded in an active market, the fair value is determined by using appropriate valuation techniques. Valuation techniques include the discounted cash flow method, comparison to similar instruments for which market observable prices may exist and other relevant valuation models. Certain financial instruments are recorded at fair value using valuation techniques in which current market transactions or observable market data are not available. Where available, their fair value is determined using a valuation model that has been tested against prices or inputs to actual market transactions and using the Company’s best estimate of the most appropriate model assumptions. The fair value of certain real estate assets is determined using independent appraisals. Models and valuations are adjusted to reflect counterparty credit and liquidity spread and limitations in the models.
(4) Foreclosed assets held for sale Foreclosed assets are repossessed non‐financial assets where the Company gains title, ownership or possession of individual properties, such as real estate properties, which are managed for sale in an orderly manner with the proceeds, used to reduce or repay any outstanding debt. The Company holds foreclosed properties for sale rather than for its business use. Held‐for‐sale foreclosed assets are initially carried at fair value less costs to sell. In subsequent measurements, the asset is carried at the lower of its carrying amount and fair value less the estimated cost to sell at the date of foreclosure. Any difference between the carrying value of the asset before foreclosure and the initially estimated realizable amount of the asset is recorded in the provision for credit losses line of the consolidated statements of income. The Company predominantly relies on third‐party appraisals to determine the carrying value of foreclosed assets.
(5) Impairment of financial assets The Company assesses at each consolidated financial statement date whether there is any objective evidence that a financial asset or a group of financial assets is impaired. A financial asset or a group of financial assets is deemed to be impaired if, and only if, there is objective evidence of impairment as a result of one or more events that have occurred after the initial recognition of the asset (an incurred “loss event”) and that loss event (or events) has an impact on the estimated future cash flows of the financial asset or the group of financial assets that can be reliably estimated.

2015 ANNUAL REPORT | MCAN MORTGAGE CORPORATION (Dollar amounts in thousands except for per share amounts)
‐ 70 ‐
4. Summary of Significant Accounting Policies (continued) Impaired mortgages include uninsured mortgages that are more than 90 days in arrears or are less than 90 days in arrears but for which management does not have reasonable assurance that the full amount of principal and interest will be collected in a timely manner. An insured mortgage is considered to be impaired when the mortgage is 365 days past due, whether or not collection is in doubt. Evidence of impairment may include indications that the borrower or a group of borrowers is experiencing significant financial difficulty, the probability that they will enter bankruptcy or other financial reorganization, default or delinquency in interest or principal payments and where observable data indicates that there is a measurable decrease in the estimated future cash flows, such as changes in arrears or economic conditions that correlate with defaults.
(i) Financial assets carried at amortized cost For financial assets carried at amortized cost, the Company first assesses individually whether objective evidence of impairment exists for financial assets that are significant, or collectively for financial assets that are not individually significant. If the Company determines that no objective evidence of impairment exists for an individually assessed financial asset, it includes the asset in a group of financial assets with similar credit risk characteristics and collectively assesses them for impairment. Assets that are individually assessed for impairment and for which an impairment loss is, or continues to be, recognized are not included in a collective assessment of impairment. If there is objective evidence that an impairment loss has occurred, the amount of the loss is measured as the difference between the asset’s carrying amount and the present value of estimated future cash flows (excluding future expected credit losses that have not yet been incurred). The carrying amount of the asset is reduced through the use of an allowance account and the amount of the loss is recognized in the consolidated statements of income. Interest income continues to be accrued using the rate of interest used to discount the future cash flows for the purpose of measuring the impairment loss. The interest income is recorded as part of the related interest income component. Mortgages, together with the associated allowance, are written off when there is no realistic prospect of future recovery and all collateral has been realized. If, in a subsequent period, the amount of the estimated impairment loss increases or decreases because of an event occurring after the impairment was recognized, the previously recognized impairment loss is increased or reduced by adjusting the allowance account. If a write‐off is later recovered, the recovery is credited to the provision for credit losses.
The present value of the estimated future cash flows is discounted at the financial asset’s original effective interest rate (“EIR”). If a mortgage has a variable interest rate, the discount rate for measuring any impairment loss is the current EIR. The calculation of the present value of estimated future cash flows reflects the projected cash flows less costs to sell. For the purpose of a collective evaluation of impairment, financial assets are grouped on the basis of the Company’s internal system that considers credit risk characteristics such as asset type, industry, geographical location, collateral type, risk rating, past‐due status and other relevant factors. Risk ratings are mapped to rating agency assessments of corporate bonds. Corporate bond historical default rates are used for an actual historical period similar to the environment at the time of measurement, using factors such as housing starts, unemployment rate, and GDP growth. Future cash flows on a group of financial assets that are collectively evaluated for impairment are estimated on the basis of historical loss experience for assets with credit risk characteristics similar to those in the group. Historical loss experience is adjusted on the basis of current observable data to reflect the effects of current conditions on which the historical loss experience is based and to remove the effects of conditions in the historical period that do not exist currently. Estimates of changes in future cash flows reflect, and are directionally consistent with, changes in related observable data from year to year (such as changes in unemployment rates, property prices, payment status or other factors that are indicative of incurred losses in the group and their magnitude). The methodology and assumptions used for estimating future cash flows are reviewed regularly to reduce any differences between loss estimates and actual loss experience.
(ii) Available for sale financial investments
For available for sale financial investments, the Company assesses at the consolidated financial statement date whether there is objective evidence that an investment or a group of investments is impaired.
2015 ANNUAL REPORT | MCAN MORTGAGE CORPORATION (Dollar amounts in thousands except for per share amounts)
‐ 71 ‐
4. Summary of Significant Accounting Policies (continued) In the case of equity investments classified as available for sale, one of the indications of impairment would include a significant or prolonged decline in the fair value of the investment below its cost. “Significant” is evaluated against the original cost of the investment and “prolonged” against the period in which the fair value has been below its original cost. Where there is evidence of impairment, the cumulative loss ‐ measured as the difference between the acquisition cost and the current fair value, less any impairment loss on that investment previously recognized in the consolidated statements of income ‐ is removed from other comprehensive income and recognized in the consolidated statements of income. Impairment losses on equity investments are not reversed through the consolidated statements of income; increases in their fair value after impairment are recognized directly in other comprehensive income. In the case of debt instruments classified as available for sale, impairment is assessed based on the same criteria as financial assets carried at amortized cost. However, the amount recorded for impairment is the cumulative loss measured as the difference between the amortized cost and the current fair value, less any impairment loss on that investment previously recognized in the consolidated statements of income. Future interest income continues to be accrued based on the reduced carrying amount of the asset, using the rate of interest used to discount the future cash flows for the purpose of measuring the impairment loss. The interest income is recorded to the related interest income component. If, in a subsequent year, the fair value of a debt instrument increases and the increase can be objectively related to an event occurring after the impairment loss was recognized in the consolidated statements of income, the impairment loss is reversed through the consolidated statements of income.
(6) Offsetting financial instruments Financial assets and financial liabilities where the Company is considered the principal to the underlying transactions are offset and the net amount reported in the consolidated financial statements if, and only if, the Company currently has an enforceable legal right to offset the recognized amounts and there is an intention to settle on a net basis, or to realize the asset and settle the liability simultaneously. As at December 31, 2015, the Company did not have any outstanding transactions that are subject to netting contracts with third parties.
(7) Taxes (i) Current tax
Current tax assets and liabilities are measured at the amount expected to be recovered from or paid to the taxation authorities. The tax rates and tax laws used to compute the amount are those that are enacted or substantively enacted at the consolidated financial statement date. As a MIC under the Tax Act, the Company is able to deduct from income for tax purposes dividends paid within 90 days of year‐end. The Company intends to maintain its status as a MIC and intends to pay sufficient dividends in current and future years to ensure that it is not subject to income taxes in the MIC entity on a non‐consolidated basis. Accordingly, the Company does not record a provision for current taxes within the MIC entity, however provisions are recorded as applicable in all subsidiaries of MCAN. Current tax relating to items recognized directly to shareholders’ equity is recognized in equity and not in the consolidated statements of income. Management periodically evaluates positions taken in the Company’s tax returns with respect to situations in which applicable tax regulations are subject to interpretation, and establishes provisions where appropriate.
(ii) Deferred tax
Deferred tax is provided on temporary differences at the consolidated financial statement date between the tax bases of assets and liabilities and their carrying amounts for financial reporting purposes. Deferred tax liabilities are recognized for all taxable temporary differences, except:
In respect of taxable temporary differences associated with investments in subsidiaries or associates and interests in joint ventures where the timing of the reversal of the temporary differences can be controlled and it is probable that the temporary differences will not reverse in the foreseeable future.

2015 ANNUAL REPORT | MCAN MORTGAGE CORPORATION (Dollar amounts in thousands except for per share amounts)
‐ 72 ‐
4. Summary of Significant Accounting Policies (continued) Deferred tax assets are recognized for all deductible temporary differences, carry forward of unused tax credits and unused tax losses, to the extent that it is probable that taxable income will be available against which the deductible temporary differences, and the carry forward of unused tax credits and unused tax losses can be used, except in the following instances:
Where the deferred tax asset relating to the deductible temporary difference arises from the initial recognition of an asset or liability in a transaction that is not a business combination and, at the time of the transaction, affects neither the accounting income nor taxable income; and
In respect of deductible temporary differences associated with investments in subsidiaries or associates and interests in joint ventures, deferred tax assets are recognized only to the extent that it is probable that the temporary differences will reverse in the foreseeable future and taxable income will be available against which the temporary differences can be utilized.
The carrying amount of deferred tax assets is reviewed at each consolidated financial statement date and reduced to the extent that it is no longer probable that sufficient taxable income will be available to allow all or part of the deferred tax asset to be utilized. Unrecognized deferred tax assets are reassessed at each consolidated financial statement date and are recognized to the extent that it has become probable that future taxable income will allow the deferred tax asset to be recovered. Deferred tax assets and liabilities are measured at the tax rates that are expected to apply in the year when the asset is realized or the liability is settled, based on tax rates (and tax laws) that have been enacted or substantively enacted at the consolidated financial statement date. Deferred tax relating to items recognized directly in shareholders’ equity is recognized in shareholders’ equity and not in the consolidated statements of income. Deferred tax assets and deferred tax liabilities are offset if a legally enforceable right exists to set off current tax assets against current tax liabilities and the deferred taxes relate to the same taxable entity and the same taxation authority. As a MIC under the Tax Act, the Company is able to deduct from income for tax purposes dividends paid within 90 days of year‐end. The Company intends to maintain its status as a MIC and intends to pay sufficient dividends in current and future years to ensure that it is not subject to income taxes in the MIC entity on a non‐consolidated basis. Accordingly, the Company does not record a provision for deferred taxes within the MIC entity, however provisions are recorded as applicable in all subsidiaries of MCAN.
(8) Dividends on common shares Dividends on common shares are deducted from shareholders’ equity in the quarter that they are approved. Dividends that are approved after the consolidated financial statement date are not recognized as a liability in the consolidated financial statements but are disclosed as an event after the consolidated financial statement date.
(9) Investment in associate
The Company’s investment in its associate, MCAP Commercial LP (“MCAP”), is accounted for using the equity method. An associate is an entity in which the Company has significant influence. Under the equity method, the investment in the associate is carried on the consolidated balance sheets at cost plus post acquisition changes in the Company’s share of net assets of the associate. The consolidated statements of income reflect the Company’s proportionate share of the results of operations of the associate. Where there has been a change recognized directly in the equity of the associate, the Company recognizes its share of any changes and discloses this change, when applicable, in the consolidated statements of changes in shareholders’ equity. Unrealized gains and losses resulting from transactions between the Company and the associate are eliminated to the extent of the interest in the associate.
The most recent available financial statements of the associate are used by the investor in applying the equity method. When the financial statements of an associate used in applying the equity method are prepared as of a different date from that of the investor, adjustments shall be made for the effects of significant transactions or events that occur between that date and the date of the investor’s financial statements. Where necessary, adjustments are made to harmonize the accounting policies of the associate with those of the Company.

2015 ANNUAL REPORT | MCAN MORTGAGE CORPORATION (Dollar amounts in thousands except for per share amounts)
‐ 73 ‐
4. Summary of Significant Accounting Policies (continued) After application of the equity method, the Company determines whether it is necessary to recognize an additional impairment loss on the Company’s investment in its associate. The Company determines at each consolidated financial statement date whether there is any objective evidence that the investment in the associate is impaired. If this is the case, the Company then calculates the amount of impairment as the difference between the recoverable amount of the associate and its carrying value and recognizes the amount in the consolidated statements of income, thus reducing the carrying value by the amount of impairment.
(10) Revenue recognition Revenue is recognized to the extent that it is probable that the economic benefits will flow to the Company and that the revenue can be reliably measured, regardless of when the payment is being made. Revenue is measured at the fair value of the consideration received or receivable, taking into account contractually defined terms of payment and excluding taxes and duty. The Company assesses its revenue arrangements against specific criteria in order to determine if it is acting as principal or agent. The Company has concluded that it is acting as a principal in all of its revenue arrangements.
Interest income or expense For all financial investments measured at amortized cost and interest bearing financial assets classified as available for sale, interest income or expense is recorded using the EIM, which reflects the rate that exactly discounts the estimated future cash payments or receipts through the expected life of the financial instrument or a shorter period, where appropriate, to the net carrying amount of the financial asset or liability. The calculation takes into account the contractual interest rate, along with any fees or incremental costs that are directly attributable to the instrument and all other premiums or discounts. Interest income or expense is included in the appropriate component of the consolidated statements of income.
(11) Cash and short‐term investments
Cash and short‐term investments on the consolidated balance sheets comprise cash held at banks and short‐term deposits with original maturity dates of less than 90 days.
(12) Share‐based payment transactions
The cost of cash‐settled transactions is measured initially at fair value at the grant date, further details of which are discussed in Note 30. The obligations are adjusted for fluctuations in the market price of the Company’s common shares. Changes in the obligations are recorded as salaries and benefits in the consolidated statements of income with a corresponding change to other liabilities. The liability is re‐measured at fair value at each consolidated financial statement date up to and including the settlement date.
(13) Capital assets and intangible assets
Capital assets and intangible assets are recorded at cost less accumulated amortization. Amortization is recorded at the following rates: Capital assets Furniture and fixtures Five years straight line Computer hardware Three to five years straight line Leasehold improvements Lease term and one renewal straight line Intangible assets Computer software One year to five years straight line The amortization expense is included in the general and administrative operating expense category in the consolidated statement of income. The amortization period and the amortization method for capital assets and intangible assets are reviewed at least at the end of each reporting period.

2015 ANNUAL REPORT | MCAN MORTGAGE CORPORATION (Dollar amounts in thousands except for per share amounts)
‐ 74 ‐
4. Summary of Significant Accounting Policies (continued) Research and development costs Research costs are expensed as incurred. Development expenditures on an individual project are recognized as an intangible asset when the Company can demonstrate:
The technical feasibility of completing the intangible asset so that the asset will be available for use or sale
Its intention to complete and its ability and intention to use or sell the asset
How the asset will generate future economic benefits
The availability of resources to complete the asset
The ability to measure reliably the expenditure during development
(14) Share capital Ordinary shares are classified as equity. Incremental costs directly attributable to the issue of new ordinary shares are shown in equity as a deduction, net of tax, from the proceeds. Where the company purchases the company’s equity share capital (treasury shares), the consideration paid, including any directly attributable incremental costs is deducted from equity attributable to the company’s equity holders until the share are either cancelled or re‐issued. Where such ordinary shares are subsequently reissued, any consideration received, net of any directly attributable incremental transactions costs, is included in equity.
(15) Contingent liabilities
Provisions for legal claims are recognised when the group (a) has a present legal or constructive obligation as a result of past events; (b) it is probable that an outflow of resources will be required to settle the obligation; and (c) the amount has been reliably estimated. Provisions are measured at the present value of the expenditures expected to be required to settle the obligation using a pre‐tax rate that reflects current market assessments of the time value of money and the risks specific to the obligation. The increase in the provision due to passage of time is included in interest expense.
(16) Standards issued but not effective Standards issued but not yet effective up to the date of issuance of the Company’s consolidated financial statements are listed below. This listing is of standards and interpretations issued that the Company reasonably expects to be applicable at a future date. The Company intends to adopt those standards when they become effective. IFRS 9, Financial Instruments In July 2014, the IASB issued a final revised IFRS 9 standard. IFRS 9 uses a single approach to determine whether a financial asset is measured at amortized cost or fair value, replacing the multiple rules in IAS 39. The approach in IFRS 9 is based on how an entity manages its financial instruments in the context of its business model and the contractual cash flow characteristics of the financial assets. The new standard also includes an expected credit loss model to replace the current incurred loss model. Additionally, IFRS 9 has new hedge accounting principles that are aimed to align hedge accounting more closely with risk management. IFRS 9 is effective for annual periods beginning on or after January 1, 2018. The Company is in the process of assessing the impact of IFRS 9 on its consolidated financial statements. IFRS 15, Revenue from Contracts with Customers IFRS 15 provides a single principle‐based framework that applies to contracts with customers. IFRS 15 is effective for annual periods beginning on or after January 1, 2018. The Company is in the process of assessing the impact of IFRS 15 on its consolidated financial statements. IAS 1, Presentation of Financial Statements The Company will be required to adopt amendments to IAS 1, Presentation of Financial Statements, which includes amendments to further encourage companies to apply professional judgement in determining what information to disclose in their financial statements, for annual periods beginning on or after January 1, 2016. Management has concluded that the amendments to IAS 1 will have no impact on the Company’s consolidated financial statements.
2015 ANNUAL REPORT | MCAN MORTGAGE CORPORATION (Dollar amounts in thousands except for per share amounts)
‐ 75 ‐
4. Summary of Significant Accounting Policies (continued) IFRS 7, Financial Instruments: Disclosures The Company will be required to adopt amendments to IFRS 7, Financial Instruments: Disclosures, requiring increased disclosure regarding derecognition of financial assets and continuing involvement accounting, for annual periods beginning on or after January 1, 2016. Management has concluded that the amendments to IFRS 7 will have no impact on the Company’s consolidated financial statements.
IFRS 16, Leases IFRS 16, Leases sets out the principles for the recognition, measurement, presentation and disclosure of leases for both parties to a contract, i.e., the customer (‘lessee’) and the supplier (‘lessor’). IFRS 16 is effective from January 1, 2019. All leases result in a company (the lessee) obtaining the right to use an asset at the start of the lease and, if lease payments are made over time, also obtaining financing. Accordingly, IFRS 16 eliminates the classification of leases as either operating leases or finance leases as is required by IAS 17 and, instead, introduces a single lessee accounting model. Applying that model, a lessee is required to recognise: (a) assets and liabilities for all leases with a term of more than 12 months, unless the underlying asset is of low value; and (b) depreciation of lease assets separately from interest on lease liabilities in the income statement. The Company has not yet determined the impact of IFRS 16 on its consolidated financial statements.
5. Significant Accounting Judgments and Estimates
The preparation of the Company’s consolidated financial statements requires management to make judgments, estimates and assumptions that affect the reported amounts of revenues, expenses, assets and liabilities, and the disclosure of contingent liabilities, at the end of the reporting period. However, uncertainty about these assumptions and estimates could result in outcomes that require a material adjustment to the carrying amount of the asset or liability affected in future periods. (a) Significant Accounting Judgments Going concern The Company’s management has made an assessment of the Company’s ability to continue as a going concern and is satisfied that the Company has the resources to continue in business for the foreseeable future. Furthermore, management is not aware of any material uncertainties that may cast significant doubt upon the Company’s ability to continue as a going concern. Therefore, the consolidated financial statements continue to be prepared on the going concern basis. Significant influence In determining whether it has significant influence over an entity, the Company makes certain judgments based on the applicable accounting standards. These judgments form the basis for the Company’s policies in accounting for its equity investments. Taxes As a MIC under the Tax Act, the Company is able to deduct from income for tax purposes dividends paid within 90 days of year‐end. The Company intends to maintain its status as a MIC and intends to pay sufficient dividends in current and future years to ensure that it is not subject to income taxes in the MIC entity on a non‐consolidated basis. Accordingly, the Company does not record a provision for current and deferred taxes within the MIC entity, however provisions are recorded as applicable in all subsidiaries of MCAN. (b) Significant Accounting Estimates Fair value of financial instruments Where the fair values of financial assets and financial liabilities recorded in the consolidated financial statements cannot be derived from active markets, they are determined using a variety of valuation techniques that include the use of mathematical models. The inputs to these models are derived from observable market data where possible, but where observable market data are not available, estimates are required to establish fair values. These estimates include considerations of liquidity and model inputs such as discount rates, prepayment rates and default rate assumptions for certain investments.

2015 ANNUAL REPORT | MCAN MORTGAGE CORPORATION (Dollar amounts in thousands except for per share amounts)
‐ 76 ‐
5. Significant Accounting Judgments and Estimates (continued) Impairment losses on mortgages The Company reviews its individually significant mortgage balances at each consolidated financial statement date to assess whether an impairment loss should be recorded. In particular, estimates by management are required in the calculation of the amount and timing of future cash flows when determining the impairment loss. In estimating these cash flows, the Company makes assumptions about the borrower’s financial situation and the net realizable value of collateral. These estimates are based on assumptions about a number of factors, and actual results may differ, resulting in future changes to the allowance. Mortgages that have been assessed individually and found not to be impaired and all individually insignificant mortgages are then assessed collectively, in groups of mortgages with similar risk characteristics, to determine whether a provision should be made due to incurred loss events for which there is objective evidence but whose effects are not yet evident. The collective assessment takes account of data from the mortgage portfolio (such as credit quality, levels of arrears, credit utilization, loan to value ratios, etc.), concentrations of risks and economic data (including levels of unemployment, real estate price indices and the performance of different individual groups). Mortgage prepayment rates In calculating the rate at which borrowers prepay their mortgages, the Company makes estimates based on its historical experience. These assumptions impact the timing of revenue recognition and the amortization of mortgage premiums using the EIM. Taxes Deferred tax assets are recognized for all unused tax losses to the extent that it is probable that taxable income will be available against which the losses can be used in the subsidiaries of the Company. Significant management judgment is required to determine the amount of deferred tax assets that can be recognized in the subsidiaries of the Company, based upon the likely timing and the level of future taxable income together with future tax planning strategies. Further details on taxes are disclosed in Note 19. Impairment of financial assets As applicable, the Company reviews financial assets at each consolidated financial statement date to assess whether an impairment loss should be recorded. In particular, estimates by management are required in the calculation of the amount and timing of future cash flows when determining the impairment loss. These estimates are based on assumptions about a number of factors and actual results may differ, resulting in future changes to the fair value of the asset.
6. Securitization Activities The Company is an NHA MBS issuer, which involves the securitization of insured mortgages to create MBS. The Company issues MBS through the market MBS program, which is an internal program where it originates or purchases insured single family mortgages for securitization. The Company issued MBS through the CMB program; however its participation ceased during 2015 with the maturity of the last CMB bond issuance. Pursuant to the NHA MBS program, investors of MBS receive monthly cash flows consisting of interest and scheduled and unscheduled principal payments. Canada Mortgage and Housing Corporation (“CMHC”) makes principal and interest payments in the event of any MBS default by the issuer, thus fulfilling the timely payment obligation to investors. To date, the Company has sold MBS as part of the market MBS program and the CMB program, which are discussed below. Market MBS Program As part of the market MBS program, the Company may sell MBS to third parties and may also sell the net economics and cash flows from the underlying mortgages (“interest‐only strips”) to third parties. The MBS portion of the mortgage represents the core securitized mortgage principal and the right to receive coupon interest at a specified rate. The interest‐only strips represent the right to receive excess cash flows after satisfying the MBS coupon interest payment and any other expenses such as mortgage servicing. As part of this program, MCAN originates and purchases insured single family mortgages to sell as MBS.
2015 ANNUAL REPORT | MCAN MORTGAGE CORPORATION (Dollar amounts in thousands except for per share amounts)
‐ 77 ‐
6. Securitization Activities (continued) The primary risks associated with the market MBS program are prepayment, liquidity and funding risk, including the obligation to fund 100% of any cash shortfall related to the Timely Payment (discussed below) as part of the market MBS program. Any mortgages securitized through the market MBS program for which derecognition is not achieved remain on MCAN’s consolidated balance sheet as securitized assets and are also included in total exposures in the calculation of the leverage ratio (Note 34). For income tax purposes, mortgage securitizations by MCAN through the NHA MBS program are considered to be true mortgage sales and therefore are not included in income tax assets (Note 34). MCAN has capitalized certain mortgage acquisition costs. These costs are amortized using the EIM, which incorporates mortgage prepayment assumptions. During 2015, MCAN created $589,148 of new MBS which was sold to third parties (2014 ‐ $561,203). The securitized mortgages remain on MCAN’s consolidated balance sheet while a corresponding financial liability from securitization is incurred (Notes 16 and 21) at the time that the MBS is sold to third parties, due to the fact that MCAN retains significant continuing involvement with the assets. During 2015, MCAN sold the interest‐only strips associated with $147,219 of mortgages securitized through the market MBS program to third parties (2014 ‐ $nil). Subsequent to sale, MCAN derecognized the securitized mortgages and associated financial liabilities from securitization from its consolidated balance sheet as a result of the transfer of substantially all risks and rewards of ownership to the purchaser of the interest‐only strip. As part of the transaction, MCAN recognized a loan receivable from the third party purchaser (Note 11) and recognized a gain on sale net of unamortized transaction costs. In the case of mortgage defaults, MCAN is required to make scheduled principal and interest payments to investors as part of the Timely Payment Guarantee (discussed below) and then place the mortgage/property through the insurance claims process to recover any losses. These defaults may result in cash flow timing mismatches that may marginally increase funding and liquidity risks. CMB Program MCAN previously participated in the CMB program, which involves the sale of MBS to the Canada Housing Trust (“CHT”). MCAN’s participation in the CMB program ceased during 2015 with the maturity of the last remaining CMB bond issuance. On the sale of MBS to CHT, MCAN received proceeds for the sale and incurred a corresponding liability, which did not amortize over the term of the issuance and was payable in full at maturity. As the securitized mortgages repaid, MCAN reinvested the collected principal in certain permitted investments. The securitized mortgages and reinvestment assets were held as collateral against the CMB liabilities. Since MCAN retained substantially all risks and rewards of ownership on the sale of the securitized mortgages to CHT, MCAN retained the mortgages (Note 16), reinvestment assets (Notes 10 and 15) and financial liabilities from securitization (Note 21) on the consolidated balance sheets until the maturity of the CMB issuance. MCAN entered into “pay floating, receive fixed” interest rate swaps as part of the CMB program (Note 17). The purpose of the interest rate swaps was to hedge interest rate risk on both securitized mortgages and principal reinvestment assets that had a floating interest rate, as substantially all interest payments on the securitization liabilities were fixed rate.
Timely Payment Consistent with all issuers of MBS, the Company is required to remit scheduled mortgage principal and interest payments to CMHC, even if these mortgage payments have not been collected from mortgagors. Similarly, at the maturity of the MBS pools that have been issued by MCAN, any outstanding principal must be paid to CMHC. If the Company fails to make a scheduled principal and interest payment to CMHC, CMHC may enforce the assignment of the mortgages included in all MBS pools in addition to other assets backing the MBS issued. As part of the market MBS program, the Company is required to fund 100% of any cash shortfall unless it has sold the interest‐only strip, in which case the purchaser of the interest‐only strip is obligated to fund 100% of any cash shortfall.

2015 ANNUAL REPORT | MCAN MORTGAGE CORPORATION (Dollar amounts in thousands except for per share amounts)
‐ 78 ‐
6. Securitization Activities (Continued)
Transferred financial assets that are not derecognized in their entirety Market MBS Program Since MCAN neither transferred nor retained risks and rewards of ownership on sale and retained significant continuing involvement through the provision of the timely payment guarantee, the majority of the market MBS program sale transactions resulted in MCAN continuing to recognize the securitized mortgages and financial liabilities from securitization on its consolidated balance sheet. The securitized mortgage balance as at December 31, 2015 was $1,075,947 (December 31, 2014 ‐ $716,112) (Note 16). The financial liabilities from securitization balance as at December 31, 2015 was $1,070,304 (December 31, 2014 ‐ $708,122) (Note 21). CMB Program Since MCAN retained substantially all risks and rewards of ownership on sale, the previous CMB mortgage sale transactions resulted in MCAN recognizing the securitized mortgages, reinvestment assets and financial liabilities from securitization on its consolidated balance sheet. The remaining securitized mortgage balance as at December 31, 2014 was $25,072 (Note 16). The reinvestment asset balance as at December 31, 2014 was $12,395 (Notes 10 and 15). The financial liabilities from securitization balance as at December 31, 2014 was $37,941 (Note 21). These items were all removed from the consolidated balance sheet during 2015 upon the maturity of the CMB bond liability at which point the Company ceased its involvement in the CMB program. Transferred financial assets that are derecognized in their entirety but where the Company has a continuing involvement Market MBS Program MCAN sells MBS and the associated interest only strips to third parties and derecognizes the assets from its consolidated balance sheet as a result of the transfer of substantially all risks and rewards on sale. The Company’s continuing involvement is the ongoing obligation in its role as MBS issuer to service the mortgages and MBS until maturity. The total outstanding derecognized MBS balance related to the market MBS program as at December 31, 2015 was $334,232 (December 31, 2014 ‐ $230,578), which was not reflected as an asset or liability on MCAN’s consolidated balance sheets at either date. The MBS mature as follows: 2016 ‐ $29,272, 2017 ‐ $157,741, 2020 ‐ $147,219.
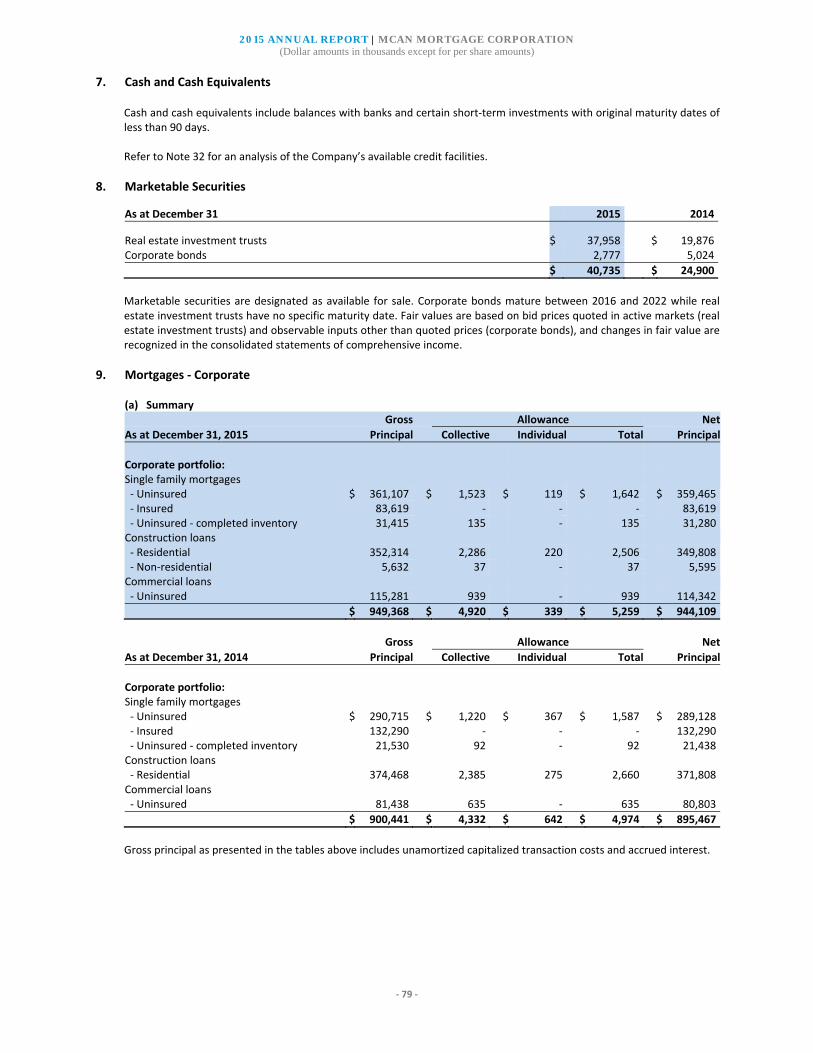
2015 ANNUAL REPORT | MCAN MORTGAGE CORPORATION (Dollar amounts in thousands except for per share amounts)
‐ 79 ‐
7. Cash and Cash Equivalents
Cash and cash equivalents include balances with banks and certain short‐term investments with original maturity dates of less than 90 days. Refer to Note 32 for an analysis of the Company’s available credit facilities.
8. Marketable Securities As at December 31 2015 2014
Real estate investment trusts $ 37,958 $ 19,876 Corporate bonds 2,777 5,024
$ 40,735 $ 24,900
Marketable securities are designated as available for sale. Corporate bonds mature between 2016 and 2022 while real estate investment trusts have no specific maturity date. Fair values are based on bid prices quoted in active markets (real estate investment trusts) and observable inputs other than quoted prices (corporate bonds), and changes in fair value are recognized in the consolidated statements of comprehensive income.
9. Mortgages ‐ Corporate (a) Summary Gross Allowance Net
As at December 31, 2015 Principal Collective Individual Total Principal
Corporate portfolio: Single family mortgages ‐ Uninsured $ 361,107 $ 1,523 $ 119 $ 1,642 $ 359,465 ‐ Insured 83,619 ‐ ‐ ‐ 83,619 ‐ Uninsured ‐ completed inventory 31,415 135 ‐ 135 31,280 Construction loans ‐ Residential 352,314 2,286 220 2,506 349,808 ‐ Non‐residential 5,632 37 ‐ 37 5,595 Commercial loans ‐ Uninsured 115,281 939 ‐ 939 114,342
$ 949,368 $ 4,920 $ 339 $ 5,259 $ 944,109
Gross Allowance Net
As at December 31, 2014 Principal Collective Individual Total Principal
Corporate portfolio: Single family mortgages ‐ Uninsured $ 290,715 $ 1,220 $ 367 $ 1,587 $ 289,128 ‐ Insured 132,290 ‐ ‐ ‐ 132,290 ‐ Uninsured ‐ completed inventory 21,530 92 ‐ 92 21,438 Construction loans ‐ Residential 374,468 2,385 275 2,660 371,808 Commercial loans ‐ Uninsured 81,438 635 ‐ 635 80,803
$ 900,441 $ 4,332 $ 642 $ 4,974 $ 895,467
Gross principal as presented in the tables above includes unamortized capitalized transaction costs and accrued interest.
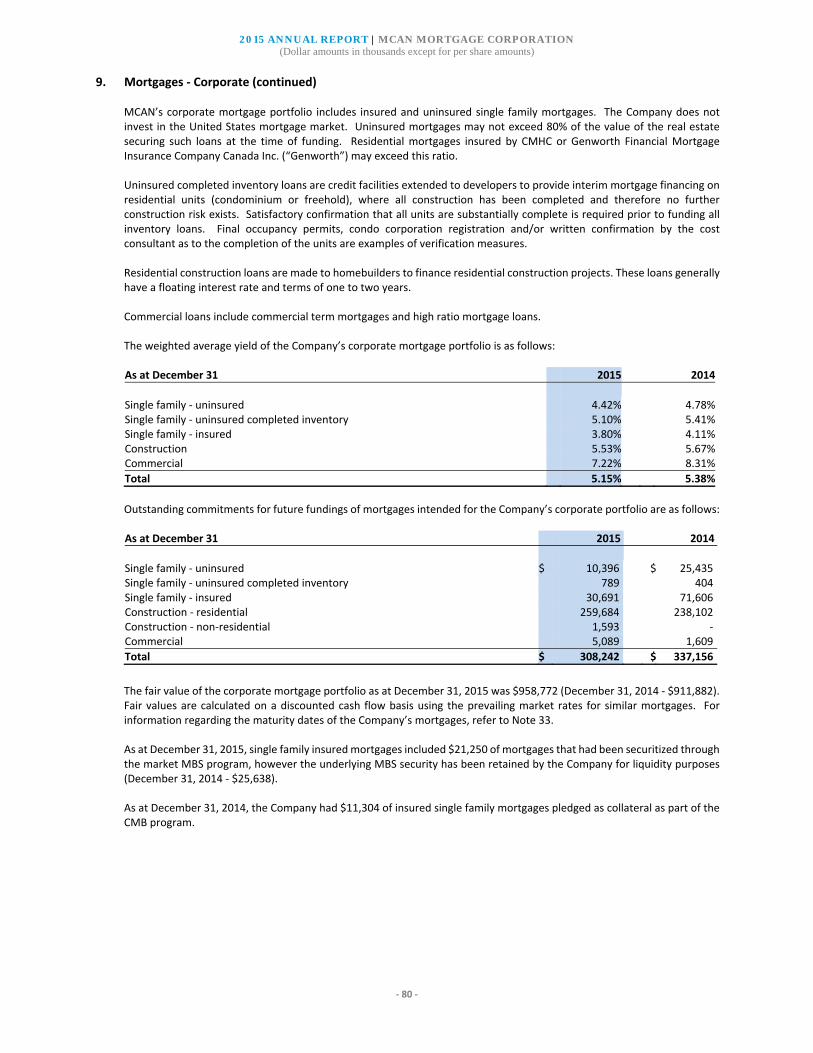
2015 ANNUAL REPORT | MCAN MORTGAGE CORPORATION (Dollar amounts in thousands except for per share amounts)
‐ 80 ‐
9. Mortgages ‐ Corporate (continued) MCAN’s corporate mortgage portfolio includes insured and uninsured single family mortgages. The Company does not invest in the United States mortgage market. Uninsured mortgages may not exceed 80% of the value of the real estate securing such loans at the time of funding. Residential mortgages insured by CMHC or Genworth Financial Mortgage Insurance Company Canada Inc. (“Genworth”) may exceed this ratio. Uninsured completed inventory loans are credit facilities extended to developers to provide interim mortgage financing on residential units (condominium or freehold), where all construction has been completed and therefore no further construction risk exists. Satisfactory confirmation that all units are substantially complete is required prior to funding all inventory loans. Final occupancy permits, condo corporation registration and/or written confirmation by the cost consultant as to the completion of the units are examples of verification measures. Residential construction loans are made to homebuilders to finance residential construction projects. These loans generally have a floating interest rate and terms of one to two years. Commercial loans include commercial term mortgages and high ratio mortgage loans. The weighted average yield of the Company’s corporate mortgage portfolio is as follows:
As at December 31 2015 2014
Single family ‐ uninsured 4.42% 4.78% Single family ‐ uninsured completed inventory 5.10% 5.41% Single family ‐ insured 3.80% 4.11% Construction 5.53% 5.67% Commercial 7.22% 8.31%
Total 5.15% 5.38%
Outstanding commitments for future fundings of mortgages intended for the Company’s corporate portfolio are as follows:
As at December 31 2015 2014
Single family ‐ uninsured $ 10,396 $ 25,435 Single family ‐ uninsured completed inventory 789 404 Single family ‐ insured 30,691 71,606 Construction ‐ residential 259,684 238,102 Construction ‐ non‐residential 1,593 ‐ Commercial 5,089 1,609
Total $ 308,242 $ 337,156
The fair value of the corporate mortgage portfolio as at December 31, 2015 was $958,772 (December 31, 2014 ‐ $911,882). Fair values are calculated on a discounted cash flow basis using the prevailing market rates for similar mortgages. For information regarding the maturity dates of the Company’s mortgages, refer to Note 33. As at December 31, 2015, single family insured mortgages included $21,250 of mortgages that had been securitized through the market MBS program, however the underlying MBS security has been retained by the Company for liquidity purposes (December 31, 2014 ‐ $25,638). As at December 31, 2014, the Company had $11,304 of insured single family mortgages pledged as collateral as part of the CMB program.

2015 ANNUAL REPORT | MCAN MORTGAGE CORPORATION (Dollar amounts in thousands except for per share amounts)
‐ 81 ‐
9. Mortgages ‐ Corporate (continued)
(b) Geographic Analysis
As at December 31, 2015 Single Family Construction Commercial Total
Ontario $ 307,061 $ 154,006 $ 72,275 $ 533,342 56.5%
Alberta 74,301 76,743 17,991 169,035 17.9%
British Columbia 45,514 104,855 12,430 162,799 17.2%
Quebec 15,575 ‐ ‐ 15,575 1.6%
Atlantic Provinces 20,151 ‐ 11,500 31,651 3.4%
Other 11,762 19,799 146 31,707 3.4%
$ 474,364 $ 355,403 $ 114,342 $ 944,109 100.0%
As at December 31, 2014 Single Family Construction Commercial Total
Ontario $ 239,694 $ 128,110 $ 33,086 $ 400,890 44.8% Alberta 77,730 101,607 31,716 211,053 23.6% British Columbia 58,014 125,873 3,523 187,410 20.9% Quebec 23,081 ‐ ‐ 23,081 2.6% Atlantic Provinces 31,927 ‐ 12,246 44,173 4.9% Other 12,410 16,218 232 28,860 3.2%
$ 442,856 $ 371,808 $ 80,803 $ 895,467 100.0%
(c) Mortgage Allowances
Details of the collective and individual allowances for mortgage credit losses for the current and prior years are as follows:
2015 2014 Collective Individual Total Collective Individual Total
Balance, beginning of year $ 4,332 $ 642 $ 4,974 $ 4,265 $ 1,087 $ 5,352 Provisions 647 721 1,368 180 686 866 Reversals of provisions ‐ (698) (698) ‐ (880) (880) Write‐offs, net (59) (326) (385) (113) (251) (364)
Balance, end of year $ 4,920 $ 339 $ 5,259 $ 4,332 $ 642 $ 4,974
(d) Arrears and Impaired Mortgages Mortgages past due but not impaired are as follows: 1 to 30 31 to 60 61 to 90 Over 90 As at December 31, 2015 days days days days Total
Single family ‐ uninsured $ 8,132 $ 3,374 $ 1,124 $ ‐ $ 12,630 Single family ‐ insured 2,269 273 ‐ 1,990 4,532
$ 10,401 $ 3,647 $ 1,124 $ 1,990 $ 17,162

2015 ANNUAL REPORT | MCAN MORTGAGE CORPORATION (Dollar amounts in thousands except for per share amounts)
‐ 82 ‐
9. Mortgages ‐ Corporate (continued) 1 to 30 31 to 60 61 to 90 Over 90 As at December 31, 2014 days days days days Total
Single family ‐ uninsured $ 7,877 $ 3,593 $ 2,600 $ ‐ $ 14,070 Single family ‐ insured 1,997 1,969 899 2,540 7,405
$ 9,874 $ 5,562 $ 3,499 $ 2,540 $ 21,475
Impaired mortgages (net of individual allowances) are as follows:
As at December 31, 2015 SF Insured SF UninsuredResidential
Construction Total
Ontario $ 98 $ 873 $ ‐ $ 971 Alberta ‐ 322 ‐ 322 Quebec 364 614 ‐ 978 Atlantic Provinces 69 143 ‐ 212 Other ‐ 244 ‐ 244
$ 531 $ 2,196 $ ‐ $ 2,727
As at December 31, 2014 SF Insured SF UninsuredResidential
Construction Total
Ontario $ ‐ $ 388 $ 4,826 $ 5,214 Alberta ‐ 386 ‐ 386 British Columbia ‐ 1,124 526 1,650 Quebec 250 694 ‐ 944 Atlantic Provinces ‐ 190 ‐ 190
$ 250 $ 2,782 $ 5,352 $ 8,384
10. Financial Investments
As at December 31 2015 2014 Corporate assets: Investment ‐ commercial real estate $ 31,102 $ 23,512 Investment ‐ KingSett High Yield Fund 10,691 4,500 Asset‐backed commercial paper ‐ 457 $ 41,793 $ 28,469 Securitization assets: Insured mortgage‐backed securities (in trust for CMB program) $ ‐ $ 907 $ ‐ $ 907
Corporate Assets The Company holds an equity investment in a commercial real estate investment fund in which it has a 14.1% equity interest. The fund invests primarily in commercial office buildings and its fair value is based on independent appraisals of the buildings. As property acquisitions are made by the fund, the Company advances its proportionate share to finance the acquisitions. During 2015, the Company recorded a $5,957 gross increase in the fair value of the investment (2014 ‐ $4,399), which is recognized in the consolidated statements of comprehensive income net of deferred taxes. Additionally, the Company recorded distribution income from this investment in 2015 of $2,509 (2014 ‐ $676), which is reflected in interest on financial investments and other loans.

2015 ANNUAL REPORT | MCAN MORTGAGE CORPORATION (Dollar amounts in thousands except for per share amounts)
‐ 83 ‐
10. Financial Investments (continued) The Company has funded an investment in the KingSett High Yield Fund in which it has a 9% equity interest. The fund invests in mortgages secured by real estate with a focus on mezzanine, subordinate and bridge mortgages. As mortgage advances are made by the fund, the Company advances its proportionate share. The fund pays a base monthly distribution of 9%, and distributes any additional income earned on a quarterly basis. The Company’s total funding commitment is $36,000, which consists of $24,000 of capital advances for the fund and $12,000 that supports credit facilities. As at December 31, 2015, the Company’s unfunded commitment was $25,425 (December 31, 2014 ‐ $31,500). Both investments noted above are designated as available for sale, with changes in fair value recognized in the consolidated statements of comprehensive income. Securitization Assets Insured MBS (held in trust for the CMB program) represented receivables from third party MBS issuers held as principal reinvestment assets as part of the Company’s participation in the CMB program. The weighted average yield was 1.53% as at December 31, 2014. The fair value of MBS held in trust for the CMB program as at December 31, 2014 was $907.
11. Other Loans As at December 31 Note 2015 2014
Loans receivable ‐ Executive Share Purchase Plan 30 $ 1,559 $ 1,523 Loans receivable ‐ MCAP 30 ‐ 164 Loans receivable ‐ other 6 2,617 421
$ 4,176 $ 2,108
All other loans are classified as loans and receivables.
12. Equity Investment in MCAP Commercial LP As at December 31, 2015, the Company held a 14.70% equity interest in MCAP (December 31, 2014 ‐ 14.75%), consisting of 15.0 % of voting class A units (December 31, 2014 ‐ 15.0 %), 0% of non‐voting class B units (December 31, 2014 ‐ 0%) and 17.0 % of non‐voting class C units (December 31, 2014 ‐ 17.0 %). The equity interest represents 4.3 million units held by MCAN from 29.2 million total outstanding MCAP partnership units. MCAN holds a 15.0% voting interest in MCAP through its class A units (December 31, 2014 ‐ 15.0%). Since MCAP’s fiscal year end is November 30th, MCAN records equity income from MCAP on a one‐month lag. To the extent that MCAP has a material transaction during the one‐month lag, MCAN is required to reflect the transaction in the month in which it occurred instead of the subsequent month. MCAP’s head office is located at 200 King Street West, Suite 400, Toronto, Ontario, Canada. Although MCAN’s voting interest in MCAP was less than 20% as at December 31, 2015, MCAN uses the equity basis of accounting for the investment as it has significant influence in MCAP per IAS 28, Investments in Associates and Joint Ventures, as a result of its entitlement to a position on MCAP’s Board of Directors. During 2015, the Company’s equity interest was reduced from 14.75% to 14.70% upon the issuance of new Class B units to another partner of MCAP. As a result of this transaction, the Company recognized a $68 gain on dilution.
Years Ended December 31 2015 2014
Balance, beginning of year $ 38,792 $ 39,246
Equity income 10,096 6,182 Dilution gain 68 71
Carrying value of portion of investment sold ‐ (2,219) Distributions received (4,765) (4,488)
Balance, end of year $ 44,191 $ 38,792
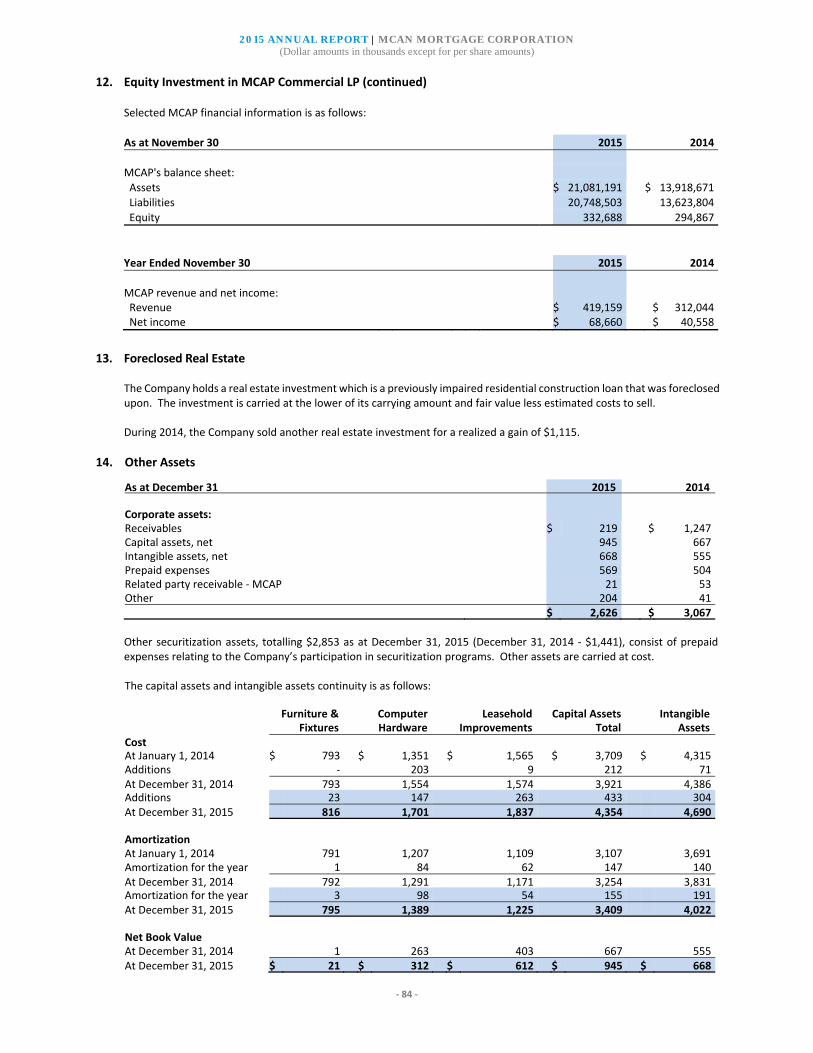
2015 ANNUAL REPORT | MCAN MORTGAGE CORPORATION (Dollar amounts in thousands except for per share amounts)
‐ 84 ‐
12. Equity Investment in MCAP Commercial LP (continued)
Selected MCAP financial information is as follows:
As at November 30 2015 2014
MCAP's balance sheet:
Assets $ 21,081,191 $ 13,918,671 Liabilities 20,748,503 13,623,804
Equity 332,688 294,867
Year Ended November 30 2015 2014
MCAP revenue and net income: Revenue $ 419,159 $ 312,044 Net income $ 68,660 $ 40,558
13. Foreclosed Real Estate
The Company holds a real estate investment which is a previously impaired residential construction loan that was foreclosed upon. The investment is carried at the lower of its carrying amount and fair value less estimated costs to sell. During 2014, the Company sold another real estate investment for a realized a gain of $1,115.
14. Other Assets As at December 31 2015 2014 Corporate assets: Receivables $ 219 $ 1,247 Capital assets, net 945 667 Intangible assets, net 668 555 Prepaid expenses 569 504 Related party receivable ‐ MCAP 21 53 Other 204 41 $ 2,626 $ 3,067
Other securitization assets, totalling $2,853 as at December 31, 2015 (December 31, 2014 ‐ $1,441), consist of prepaid expenses relating to the Company’s participation in securitization programs. Other assets are carried at cost.
The capital assets and intangible assets continuity is as follows: Furniture & Computer Leasehold Capital Assets Intangible Fixtures Hardware Improvements Total Assets Cost At January 1, 2014 $ 793 $ 1,351 $ 1,565 $ 3,709 $ 4,315 Additions ‐ 203 9 212 71 At December 31, 2014 793 1,554 1,574 3,921 4,386 Additions 23 147 263 433 304 At December 31, 2015 816 1,701 1,837 4,354 4,690 Amortization At January 1, 2014 791 1,207 1,109 3,107 3,691 Amortization for the year 1 84 62 147 140 At December 31, 2014 792 1,291 1,171 3,254 3,831 Amortization for the year 3 98 54 155 191 At December 31, 2015 795 1,389 1,225 3,409 4,022 Net Book Value At December 31, 2014 1 263 403 667 555 At December 31, 2015 $ 21 $ 312 $ 612 $ 945 $ 668

2015 ANNUAL REPORT | MCAN MORTGAGE CORPORATION (Dollar amounts in thousands except for per share amounts)
‐ 85 ‐
15. Short‐Term Investments As at December 31 2015 2014 Securitization program cash held in trust $ 13,112 $ 5,275 Commercial paper (in trust for CMB program) ‐ 11,488 $ 13,112 $ 16,763
Short term investments consist of cash held in trust for securitization programs and previously included commercial paper held as reinvestment assets for the CMB program, and mature within 90 days. Securitization program cash held in trust represents securitized mortgage principal collections from borrowers payable to MBS holders. The weighted average yield of the commercial paper was 1.18% at December 31, 2014.
16. Mortgages ‐ Securitized MCAN’s securitized mortgage portfolio consists of insured mortgages securitized through the market MBS program and, previously, the CMB program. These mortgages are held as collateral against the related securitization liabilities (Notes 6 and 21).
(a) Summary
As at December 31 2015 2014
Single family insured ‐ Market MBS program $ 1,075,947 $ 716,112 Single family insured ‐ CMB program ‐ 25,072
$ 1,075,947 $ 741,184
Certain capitalized transaction costs are included in mortgages and are amortized using the EIM. As at December 31, 2015, the unamortized capitalized cost balance was $13,563 (December 31, 2014 ‐ $9,089). The amortization of these transaction costs incorporates a 12% annual mortgage prepayment rate. All mortgages in the securitized portfolio are insured, therefore they do not have a collective allowance for credit losses. The fair value of the securitized mortgage portfolio as at December 31, 2015 was $1,107,168 (December 31, 2014 ‐ $762,537). The weighted average yield of the Company’s securitized mortgage portfolio is as follows:
As at December 31 2015 2014
Single family ‐ Market MBS program 2.48% 2.74% Single family ‐ CMB program ‐ 3.79%
Total 2.48% 2.78%
(b) Geographic Analysis As at December 31, 2015 December 31, 2014
Ontario $ 589,912 54.8% $ 353,340 47.7% Alberta 239,192 22.2% 177,481 23.9% British Columbia 121,811 11.3% 104,243 14.1% Quebec 43,960 4.1% 42,579 5.7% Atlantic Provinces 43,712 4.1% 36,205 4.9% Other 37,360 3.5% 27,336 3.7%
$ 1,075,947 100.0% $ 741,184 100.0%

2015 ANNUAL REPORT | MCAN MORTGAGE CORPORATION (Dollar amounts in thousands except for per share amounts)
‐ 86 ‐
16. Mortgages ‐ Securitized (continued) Mortgages past due but not impaired are as follows: 1 to 30 31 to 60 61 to 90 Over 90 As at December 31, 2015 days days days days Total
Single family ‐ Market MBS program $ 10,651 $ 1,849 $ 1,356 $ 505 $ 14,361
$ 10,651 $ 1,849 $ 1,356 $ 505 $ 14,361
1 to 30 31 to 60 61 to 90 Over 90 As at December 31, 2014 days days days days Total
Single family ‐ Market MBS program $ 5,684 $ 947 $ 80 $ 825 $ 7,536 Single family ‐ CMB program 757 ‐ 108 145 1,010
$ 6,441 $ 947 $ 188 $ 970 $ 8,546
There were no impaired securitized mortgages as at December 31, 2015 or December 31, 2014.
17. Derivative Financial Instruments The Company enters into interest rate swaps to manage interest rate risk between the time that a mortgage rate is committed to borrowers and the time that the mortgage is funded, or in the case of mortgages securitized through the market MBS program, the time that the mortgage is securitized. The interest rate swap counterparty is a Canadian chartered bank. The mortgage commitment interest rate swap is included in other assets or other liabilities depending on its balance. As part of its participation in the CMB program, the Company entered into “pay‐floating, receive‐fixed” interest rate swaps to hedge interest rate risk on both securitized mortgages and principal reinvestment assets that had a floating interest rate. The interest rate swaps are carried at fair value, which is calculated by discounting future net cash flows based on forward interest rates. As at December 31, 2015, there were no outstanding derivative financial instrument notional balances and the fair value of all instruments was $nil.
Less than One to Three to Over five As at December 31, 2014 one year three years five years years Total
Mortgage commitment interest rate swaps ‐ fair value $ ‐ $ ‐ $ (133) $ ‐ $ (133)
Mortgage commitment interest rate swaps ‐ outstanding notional $ ‐ $ ‐ $ 43,500 $ ‐ $ 43,500
CMB interest rate swaps ‐ fair value $ 71 $ ‐ $ ‐ $ ‐ $ 71
CMB interest rate swaps ‐ outstanding notional $ 6,066 $ ‐ $ ‐ $ ‐ $ 6,066
During 2015, the Company incurred net realized and unrealized losses of $2,914 (2014 ‐ $1,729) on the interest rate swaps used to hedge interest rate risk on mortgage funding commitments. Any offsetting gains are recognized over the duration of the mortgages securitized through the market MBS program through higher spread income, or in the case of mortgages hedged for whole loan sales, when the mortgages are sold to third parties. The Company does not apply hedge accounting and accordingly, changes in the fair value of the derivatives are not netted against income recognized from the hedged instruments (e.g. spread income over duration of market MBS program issuance, whole loan gains on sale).

2015 ANNUAL REPORT | MCAN MORTGAGE CORPORATION (Dollar amounts in thousands except for per share amounts)
‐ 87 ‐
17. Derivative Financial Instruments (continued) Activity related to the CMB interest rate swaps in the current and prior years was as follows: Years Ended December 31 2015 2014
Balance, beginning of year $ 71 $ 1,448 Net interest rate swap payments (receipts) (79) (1,343) Unrealized derivative financial instrument (loss) gain 8 (34)
(71) (1,377)
Balance, end of year $ ‐ $ 71
18. Term Deposits
Term deposits are issued to various individuals and institutions with original maturities ranging from 30 days to five years. The weighted average term deposit interest rate as at December 31, 2015 was 2.26% (December 31, 2014 ‐ 2.41%). The Company’s term deposits are eligible for CDIC deposit insurance. Term deposits mature as follows: less than one year ‐ $575,914 (December 31, 2014 ‐ $549,131); one to three years ‐ $289,178 (December 31, 2014 ‐ $233,070); three to five years ‐ $37,949 (December 31, 2014 ‐ $39,541). Term deposits are classified as other financial liabilities and are recorded at amortized cost. The estimated fair value of term deposits as at December 31, 2015 was $905,167 (December 31, 2014 ‐ $825,755), and is determined by discounting the contractual cash flows using market interest rates currently offered for deposits of similar remaining maturities.
19. Income Taxes The composition of the provision for (recovery) of income taxes is as follows: Years Ended December 31 2015 2014
Income before income taxes $ 32,768 $ 26,456 Statutory rate of tax 0% 0% Tax provision (recovery) before the following: ‐ ‐ Income subject to tax in subsidiaries (89) 1,010
$ (89) $ 1,010
Years Ended December 31 2015 2014
Current tax Current tax provision $ ‐ $ 102 Deferred tax provision (recovery) Financial investment 330 155 Relating to loss carry forward benefit (328) 813 Other (91) (60)
$ (89) $ 1,010
The composition of the deferred tax asset and liability is as follows: As at December 31 2015 2014
Deferred tax asset Loss carry forward benefit $ 910 $ 582 Other 215 191
$ 1,125 $ 773
Deferred tax liability Financial investments $ 2,299 $ 1,177 Other ‐ 69
$ 2,299 $ 1,246

2015 ANNUAL REPORT | MCAN MORTGAGE CORPORATION (Dollar amounts in thousands except for per share amounts)
‐ 88 ‐
19. Income Taxes (continued)
The Company has loss carry forward amounts in the non‐consolidated MIC entity of $11,710 (December 31, 2014 ‐ $6,175), the benefit of which has not been recorded to deferred taxes. Tax loss carry forwards expire after 20 years, as follows:
2032 $ 210 2033 5,965 2034 5,535
$ 11,710
20. Other Liabilities As at December 31 Note 2015 2014 Corporate liabilities: Accounts payable and accrued charges $ 5,805 $ 5,243 Dividends payable 6,607 5,826 Derivative financial instruments 17 ‐ 133 $ 12,412 $ 11,202 Securitization liabilities: Other $ ‐ $ 42 $ ‐ $ 42
21. Financial Liabilities from Securitization
Financial liabilities from securitization include financial liabilities relating to the Company’s participation in the market MBSprogram and, previously, the CMB program.
As at December 31 Note 2015 2014 Financial liabilities ‐ Market MBS program 6 $ 1,070,304 $ 708,122 Financial liabilities ‐ CMB program 6 ‐ 37,941
$ 1,070,304 $ 746,063
The financial liabilities ‐ market MBS program had a weighted average interest rate of 1.87% (December 31, 2014 ‐ 2.07%) as at December 31, 2015. The financial liabilities ‐ CMB program had a weighted average interest rate of 3.21% as at December 31, 2014. Financial liabilities from securitization as at December 31, 2015 mature as follows: 2018 ‐ $137,731, 2019 ‐ $504,041, 2020 ‐ $428,532.
22. Share Capital and Contributed Surplus
The authorized share capital of the Company is unlimited common shares with no par value.
Number Number
of Shares 2015 of Shares 2014
Balance, January 1 20,807,761 $ 183,939 20,460,936 $ 179,215
Issued
Rights offering 1,406,084 15,111 ‐ ‐
Dividend reinvestment plan 568,588 7,332 346,825 4,724
Balance, December 31 22,782,433 $ 206,382 20,807,761 $ 183,939

2015 ANNUAL REPORT | MCAN MORTGAGE CORPORATION (Dollar amounts in thousands except for per share amounts)
‐ 89 ‐
22. Share Capital and Contributed Surplus (continued) During 2015, the Company completed a rights offering. The rights offering raised net proceeds of $15,111 with 1,406,084 new common shares issued. During 2015, the Company issued 568,588 (2014 ‐346,825) shares under the dividend reinvestment plan (“DRIP”) out of treasury at the weighted average trading price for the 5 days preceding such issue less a discount of 2%. The DRIP participation rate for the December 31, 2015 dividend was 14% (December 31, 2014 ‐ 31%). The Company had no potentially dilutive instruments as at December 31, 2015 or December 31, 2014. Contributed surplus of $510 represents the discount on the repurchase of warrants in 2004.
23. Dividends
Subsequent to the end of the year and before the date that these consolidated financial statements were authorized for issuance, the Board declared a quarterly dividend of $0.29 per share payable on March 31, 2016 to shareholders of record as of March 15, 2016.
24. Accumulated Other Comprehensive Income
Accumulated other comprehensive income consists of unrealized gains and losses on available for sale marketable securitiesand financial investments.
As at December 31 2015 2014 To be reclassified to the income statement in subsequent periods: Unrealized gain (loss) on available for sale marketable securities $ (2,571) $ (325) Unrealized gain on available for sale financial investments 13,675 7,718 Less: deferred taxes (1,811) (1,020) 11,864 6,698 $ 9,293 $ 6,373
25. Fees
Fees include extension, renewal and letter of credit fees earned on the Company’s corporate mortgage portfolio.
26. Mortgage Expenses
Corporate Assets Years Ended December 31 2015 2014 Mortgage servicing expense $ 3,016 $ 2,952 Letter of credit expense 623 618 Other mortgage expenses 184 250 $ 3,823 $ 3,820
Letter of credit expense relates to outstanding letters of credit in one of the Company’s credit facilities, discussed in note 32. Securitization Assets Mortgage expenses associated with securitization assets consist primarily of mortgage servicing expenses.

2015 ANNUAL REPORT | MCAN MORTGAGE CORPORATION (Dollar amounts in thousands except for per share amounts)
‐ 90 ‐
27. Provision for Credit Losses Years Ended December 31 Note 2015 2014
Mortgages ‐ collective provisions 9 $ 647 $ 180 Mortgages ‐ individual provisions (reversals), net 9 23 (194) Other provisions (recoveries), net (395) (969) $ 275 $ (983)
28. Other Securitization Income
Other securitization income includes net interest rate swap receipts from the CMB program and market MBS program interest‐only strip gains on sale.
29. Whole Loan Gain on Sale Income
The Company regularly sells mortgages to third party mortgage aggregators on a whole‐loan basis with mortgage premiums received at the time of sale. The Company maintains renewal rights on these sales. During 2015, the Company sold $26,215 of insured mortgages (2014 ‐ $69,590) and recorded a gain on sale of $626 (2014 ‐ $1,296).
30. Related Party Disclosures
The consolidated financial statements include the financial statements of the Company and its equity‐accounted associate, MCAP. The Company holds a 14.70% equity interest in MCAP (December 31, 2014 ‐ 14.75%), a non‐public entity. MCAP’s principal activities include the origination and servicing of mortgages. The Company holds one of five seats on MCAP’s Board of Directors. Transactions between the Company and its subsidiaries meet the definition of related party transactions. If these transactions are eliminated on consolidation, they are not disclosed as related party transactions. During 2015, the Company purchased certain corporate services from MCAP in the amount of $231 (2014 ‐ $547) and purchased certain mortgage origination and administration services from MCAP in the amount of $3,840 (2014 ‐ $3,128). Also, the Company received $4,841 (2014 ‐ $1,720) of mortgage fees from MCAP. During 2015, the Company paid $5,346 in mortgage premiums to MCAP as part of the acquisition of mortgages securitized through the market MBS program (2014 ‐ $7,814). As at December 31, 2014, MCAN held loans receivable from MCAP of $164 bearing interest at 5% that were repaid during 2015. The Company holds construction loans totalling $3,971 as at December 31, 2015 for which the borrower is a close family member of a member of the Board (December 31, 2014 ‐ $5,285). The loans were contracted at market terms. All related party transactions noted above were in the normal course of business. Compensation of key management personnel, which include the President and Chief Executive Officer, Vice President and Chief Financial Officer, Vice President and Chief Investment Officer, Vice President and Chief Risk Officer and Vice President, Operations, is as follows:
Years Ended December 31 2015 2014
Salaries and short term employee benefits $ 2,220 $ 1,961 Other long term benefits 56 202
$ 2,276 $ 2,163
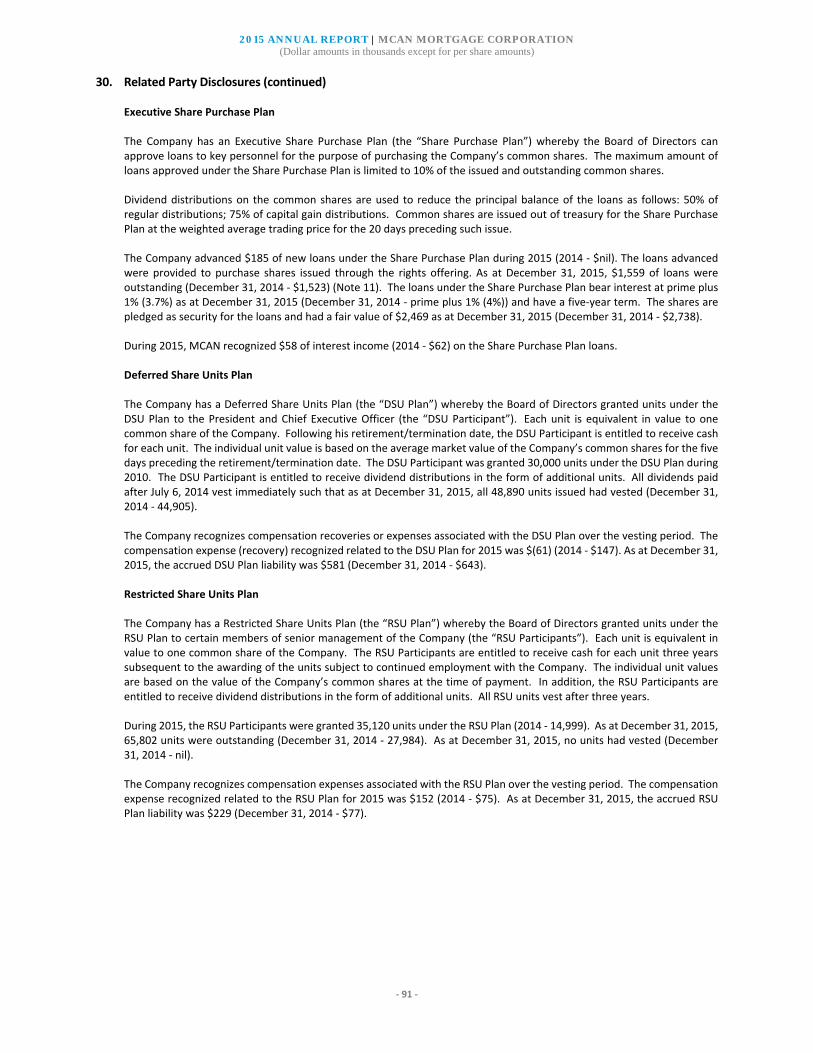
2015 ANNUAL REPORT | MCAN MORTGAGE CORPORATION (Dollar amounts in thousands except for per share amounts)
‐ 91 ‐
30. Related Party Disclosures (continued) Executive Share Purchase Plan The Company has an Executive Share Purchase Plan (the “Share Purchase Plan”) whereby the Board of Directors can approve loans to key personnel for the purpose of purchasing the Company’s common shares. The maximum amount of loans approved under the Share Purchase Plan is limited to 10% of the issued and outstanding common shares. Dividend distributions on the common shares are used to reduce the principal balance of the loans as follows: 50% of regular distributions; 75% of capital gain distributions. Common shares are issued out of treasury for the Share Purchase Plan at the weighted average trading price for the 20 days preceding such issue. The Company advanced $185 of new loans under the Share Purchase Plan during 2015 (2014 ‐ $nil). The loans advanced were provided to purchase shares issued through the rights offering. As at December 31, 2015, $1,559 of loans were outstanding (December 31, 2014 ‐ $1,523) (Note 11). The loans under the Share Purchase Plan bear interest at prime plus 1% (3.7%) as at December 31, 2015 (December 31, 2014 ‐ prime plus 1% (4%)) and have a five‐year term. The shares are pledged as security for the loans and had a fair value of $2,469 as at December 31, 2015 (December 31, 2014 ‐ $2,738). During 2015, MCAN recognized $58 of interest income (2014 ‐ $62) on the Share Purchase Plan loans. Deferred Share Units Plan The Company has a Deferred Share Units Plan (the “DSU Plan”) whereby the Board of Directors granted units under the DSU Plan to the President and Chief Executive Officer (the “DSU Participant”). Each unit is equivalent in value to one common share of the Company. Following his retirement/termination date, the DSU Participant is entitled to receive cash for each unit. The individual unit value is based on the average market value of the Company’s common shares for the five days preceding the retirement/termination date. The DSU Participant was granted 30,000 units under the DSU Plan during 2010. The DSU Participant is entitled to receive dividend distributions in the form of additional units. All dividends paid after July 6, 2014 vest immediately such that as at December 31, 2015, all 48,890 units issued had vested (December 31, 2014 ‐ 44,905).
The Company recognizes compensation recoveries or expenses associated with the DSU Plan over the vesting period. The compensation expense (recovery) recognized related to the DSU Plan for 2015 was $(61) (2014 ‐ $147). As at December 31, 2015, the accrued DSU Plan liability was $581 (December 31, 2014 ‐ $643). Restricted Share Units Plan The Company has a Restricted Share Units Plan (the “RSU Plan”) whereby the Board of Directors granted units under the RSU Plan to certain members of senior management of the Company (the “RSU Participants”). Each unit is equivalent in value to one common share of the Company. The RSU Participants are entitled to receive cash for each unit three years subsequent to the awarding of the units subject to continued employment with the Company. The individual unit values are based on the value of the Company’s common shares at the time of payment. In addition, the RSU Participants are entitled to receive dividend distributions in the form of additional units. All RSU units vest after three years. During 2015, the RSU Participants were granted 35,120 units under the RSU Plan (2014 ‐ 14,999). As at December 31, 2015, 65,802 units were outstanding (December 31, 2014 ‐ 27,984). As at December 31, 2015, no units had vested (December 31, 2014 ‐ nil). The Company recognizes compensation expenses associated with the RSU Plan over the vesting period. The compensation expense recognized related to the RSU Plan for 2015 was $152 (2014 ‐ $75). As at December 31, 2015, the accrued RSU Plan liability was $229 (December 31, 2014 ‐ $77).

2015 ANNUAL REPORT | MCAN MORTGAGE CORPORATION (Dollar amounts in thousands except for per share amounts)
‐ 92 ‐
31. Commitments and Contingencies The Company’s mortgage funding commitments relate primarily to its corporate residential construction loan portfolio. The commitment as noted below represents the undrawn portion of the authorized loan facility for construction and commercial loans. For single family mortgages, the commitment represents irrevocable offers to clients that the Company is contractually obligated to fund. For further details on the commitment associated with the KingSett High Yield Fund investment, refer to Note 10. The Company also has contractual obligations associated with its premises lease.
Less than One to Three to Over five As at December 31, 2015 one year three years five years years Total
Mortgage funding commitments $ 255,987 $ 52,255 $ ‐ $ ‐ $ 308,242 Commitment ‐ KingSett High Yield Fund ‐ ‐ ‐ 25,425 25,425 Operating lease 575 1,496 1,193 1,881 5,145
$ 256,562 $ 53,751 $ 1,193 $ 27,306 $ 338,812
The Company incurred $492 of operating lease expenses during 2015 (2014 ‐ $418), included in general and administrative expenses. The Company outsources the majority of its mortgage servicing and continues to pay servicing expenses as long as the mortgages remain on its consolidated balance sheet. In the ordinary course of business, MCAN and its service providers (including MCAP), their subsidiaries and related parties may from time to time be party to legal proceedings which may result in unplanned payments to third parties. To the best of its knowledge, the Company’s management does not expect the outcome of any existing proceedings to have a material effect on the consolidated financial position or results of operations of the Company.
32. Credit Facilities
The Company has a line of credit from a Canadian chartered bank that is a $75,000 facility bearing interest at prime plus 0.75% (3.45%) at December 31, 2015 (December 31, 2014 ‐ prime plus 0.75% (3.75%)). The facility has a sub limit of $50,000 for issued letters of credit and $50,000 for overdrafts, and is due and payable upon demand. As at December 31, 2015, the outstanding overdraft balance was $nil (December 31, 2014 ‐ $nil). The letters of credit have a term of up to one year from the date of issuance, plus a renewal clause providing for an automatic one‐year extension at the maturity date subject to the bank’s option to cancel by written notice at least 30 days prior to the letters of credit expiry date. The letters of credit are for the purpose of supporting developer obligations to municipalities in conjunction with residential construction loans. As at December 31, 2015, there were letters of credit in the amount of $35,863 issued (December 31, 2014 ‐ $36,357) and additional letters of credit in the amount of $22,936 committed but not issued (December 31, 2014 ‐ $16,347). The Company maintains a credit warehouse facility with a Schedule III Canadian bank which can be drawn as required as mortgage fundings occur. The facility bears interest at the prime rate (2.70%) and carries a standby charge on the unused portion of the facility equal to 0.25% of amounts up to $35,000 and 0.50% of amounts over $35,000. The facility provides for up to $50,000 of borrowings. Insured mortgages are eligible to act as collateral in the facility for a period of no longer than one year. As at December 31, 2015, the Company had borrowed $nil from this facility (December 31, 2014 ‐ $nil). Subsequent to year end, the Schedule III Canadian bank ceased its operations and was placed under supervisory administration. The credit warehouse facility was terminated as of this date. The termination of the credit warehouse facility did not have a material impact on the Company’s operations or liquidity given other sources of funding available to the Company.
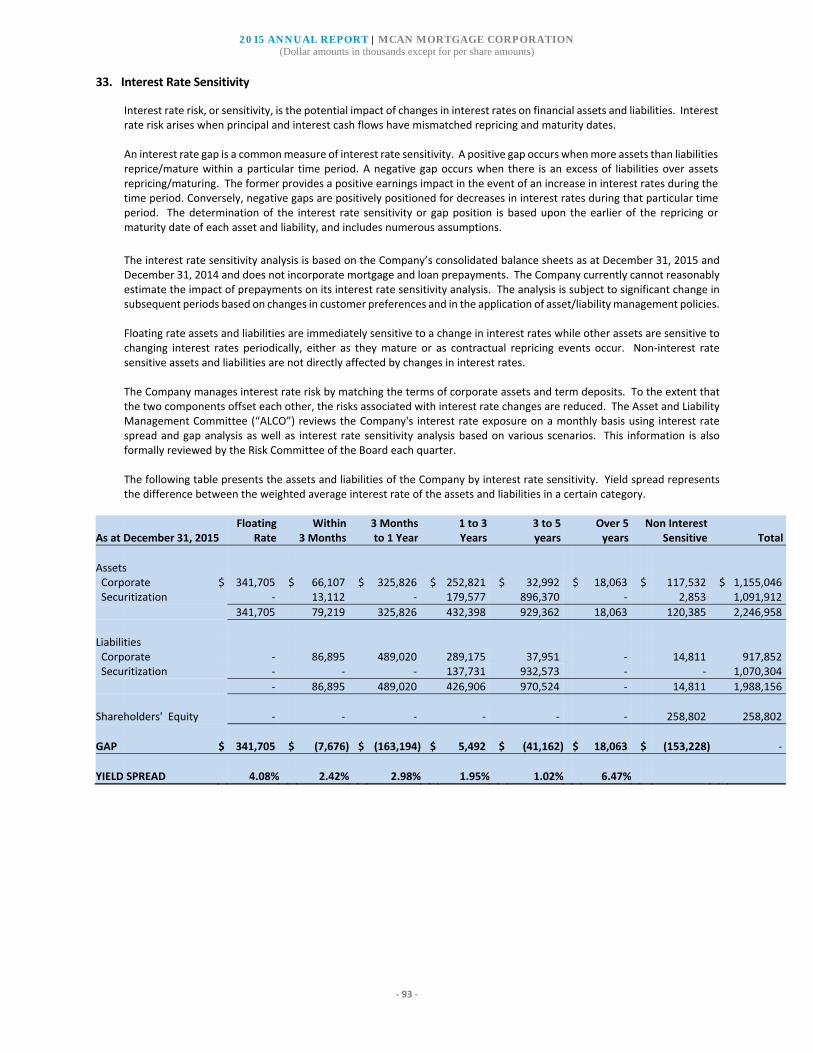
2015 ANNUAL REPORT | MCAN MORTGAGE CORPORATION (Dollar amounts in thousands except for per share amounts)
‐ 93 ‐
33. Interest Rate Sensitivity
Interest rate risk, or sensitivity, is the potential impact of changes in interest rates on financial assets and liabilities. Interest rate risk arises when principal and interest cash flows have mismatched repricing and maturity dates. An interest rate gap is a common measure of interest rate sensitivity. A positive gap occurs when more assets than liabilities reprice/mature within a particular time period. A negative gap occurs when there is an excess of liabilities over assets repricing/maturing. The former provides a positive earnings impact in the event of an increase in interest rates during the time period. Conversely, negative gaps are positively positioned for decreases in interest rates during that particular time period. The determination of the interest rate sensitivity or gap position is based upon the earlier of the repricing or maturity date of each asset and liability, and includes numerous assumptions.
The interest rate sensitivity analysis is based on the Company’s consolidated balance sheets as at December 31, 2015 and December 31, 2014 and does not incorporate mortgage and loan prepayments. The Company currently cannot reasonably estimate the impact of prepayments on its interest rate sensitivity analysis. The analysis is subject to significant change in subsequent periods based on changes in customer preferences and in the application of asset/liability management policies. Floating rate assets and liabilities are immediately sensitive to a change in interest rates while other assets are sensitive to changing interest rates periodically, either as they mature or as contractual repricing events occur. Non‐interest rate sensitive assets and liabilities are not directly affected by changes in interest rates. The Company manages interest rate risk by matching the terms of corporate assets and term deposits. To the extent that the two components offset each other, the risks associated with interest rate changes are reduced. The Asset and Liability Management Committee (“ALCO”) reviews the Company's interest rate exposure on a monthly basis using interest rate spread and gap analysis as well as interest rate sensitivity analysis based on various scenarios. This information is also formally reviewed by the Risk Committee of the Board each quarter. The following table presents the assets and liabilities of the Company by interest rate sensitivity. Yield spread represents the difference between the weighted average interest rate of the assets and liabilities in a certain category.
Floating Within 3 Months 1 to 3 3 to 5 Over 5 Non Interest As at December 31, 2015 Rate 3 Months to 1 Year Years years years Sensitive Total
Assets Corporate $ 341,705 $ 66,107 $ 325,826 $ 252,821 $ 32,992 $ 18,063 $ 117,532 $ 1,155,046 Securitization ‐ 13,112 ‐ 179,577 896,370 ‐ 2,853 1,091,912
341,705 79,219 325,826 432,398 929,362 18,063 120,385 2,246,958
Liabilities Corporate ‐ 86,895 489,020 289,175 37,951 ‐ 14,811 917,852 Securitization ‐ ‐ ‐ 137,731 932,573 ‐ ‐ 1,070,304
‐ 86,895 489,020 426,906 970,524 ‐ 14,811 1,988,156
Shareholders' Equity ‐ ‐ ‐ ‐ ‐ ‐ 258,802 258,802
GAP $ 341,705 $ (7,676) $ (163,194) $ 5,492 $ (41,162) $ 18,063 $ (153,228) ‐
YIELD SPREAD 4.08% 2.42% 2.98% 1.95% 1.02% 6.47%
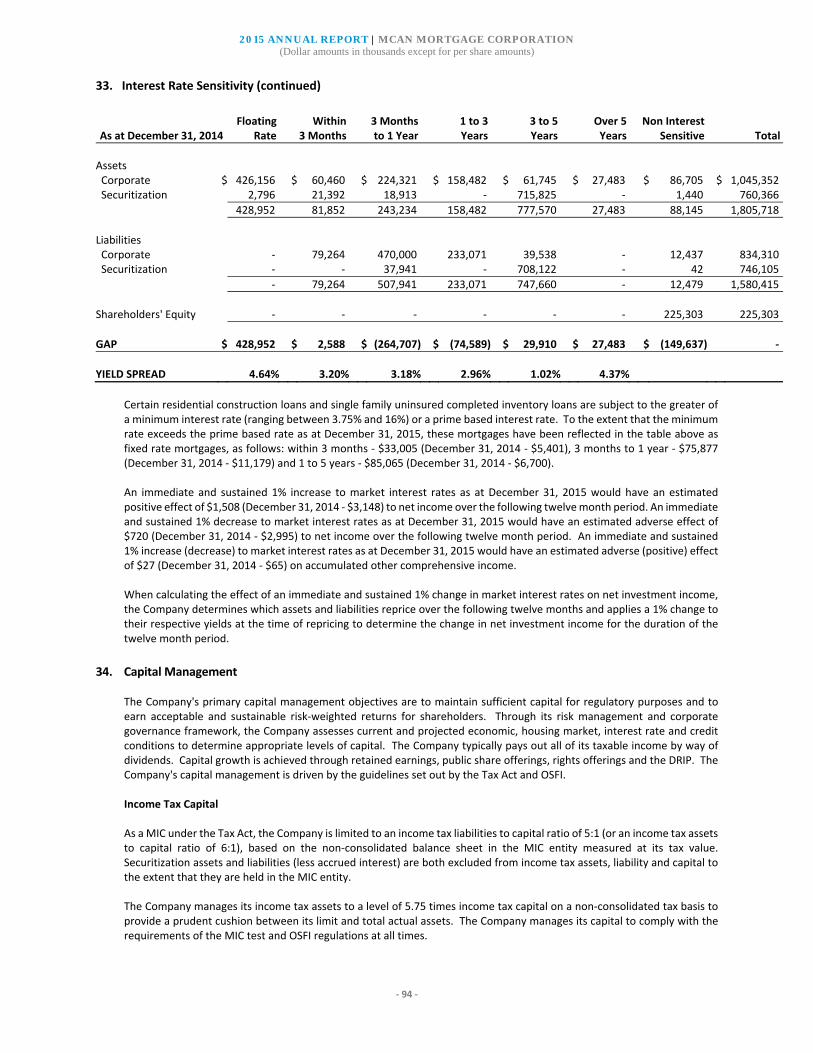
2015 ANNUAL REPORT | MCAN MORTGAGE CORPORATION (Dollar amounts in thousands except for per share amounts)
‐ 94 ‐
33. Interest Rate Sensitivity (continued)
Floating Within 3 Months 1 to 3 3 to 5 Over 5 Non Interest As at December 31, 2014 Rate 3 Months to 1 Year Years Years Years Sensitive Total
Assets Corporate $ 426,156 $ 60,460 $ 224,321 $ 158,482 $ 61,745 $ 27,483 $ 86,705 $ 1,045,352 Securitization 2,796 21,392 18,913 ‐ 715,825 ‐ 1,440 760,366
428,952 81,852 243,234 158,482 777,570 27,483 88,145 1,805,718
Liabilities Corporate ‐ 79,264 470,000 233,071 39,538 ‐ 12,437 834,310 Securitization ‐ ‐ 37,941 ‐ 708,122 ‐ 42 746,105
‐ 79,264 507,941 233,071 747,660 ‐ 12,479 1,580,415
Shareholders' Equity ‐ ‐ ‐ ‐ ‐ ‐ 225,303 225,303
GAP $ 428,952 $ 2,588 $ (264,707) $ (74,589) $ 29,910 $ 27,483 $ (149,637) ‐
YIELD SPREAD 4.64% 3.20% 3.18% 2.96% 1.02% 4.37%
Certain residential construction loans and single family uninsured completed inventory loans are subject to the greater of a minimum interest rate (ranging between 3.75% and 16%) or a prime based interest rate. To the extent that the minimum rate exceeds the prime based rate as at December 31, 2015, these mortgages have been reflected in the table above as fixed rate mortgages, as follows: within 3 months ‐ $33,005 (December 31, 2014 ‐ $5,401), 3 months to 1 year ‐ $75,877 (December 31, 2014 ‐ $11,179) and 1 to 5 years ‐ $85,065 (December 31, 2014 ‐ $6,700). An immediate and sustained 1% increase to market interest rates as at December 31, 2015 would have an estimated positive effect of $1,508 (December 31, 2014 ‐ $3,148) to net income over the following twelve month period. An immediate and sustained 1% decrease to market interest rates as at December 31, 2015 would have an estimated adverse effect of $720 (December 31, 2014 ‐ $2,995) to net income over the following twelve month period. An immediate and sustained 1% increase (decrease) to market interest rates as at December 31, 2015 would have an estimated adverse (positive) effect of $27 (December 31, 2014 ‐ $65) on accumulated other comprehensive income. When calculating the effect of an immediate and sustained 1% change in market interest rates on net investment income, the Company determines which assets and liabilities reprice over the following twelve months and applies a 1% change to their respective yields at the time of repricing to determine the change in net investment income for the duration of the twelve month period.
34. Capital Management
The Company's primary capital management objectives are to maintain sufficient capital for regulatory purposes and to earn acceptable and sustainable risk‐weighted returns for shareholders. Through its risk management and corporate governance framework, the Company assesses current and projected economic, housing market, interest rate and credit conditions to determine appropriate levels of capital. The Company typically pays out all of its taxable income by way of dividends. Capital growth is achieved through retained earnings, public share offerings, rights offerings and the DRIP. The Company's capital management is driven by the guidelines set out by the Tax Act and OSFI. Income Tax Capital As a MIC under the Tax Act, the Company is limited to an income tax liabilities to capital ratio of 5:1 (or an income tax assets to capital ratio of 6:1), based on the non‐consolidated balance sheet in the MIC entity measured at its tax value. Securitization assets and liabilities (less accrued interest) are both excluded from income tax assets, liability and capital to the extent that they are held in the MIC entity. The Company manages its income tax assets to a level of 5.75 times income tax capital on a non‐consolidated tax basis to provide a prudent cushion between its limit and total actual assets. The Company manages its capital to comply with the requirements of the MIC test and OSFI regulations at all times.
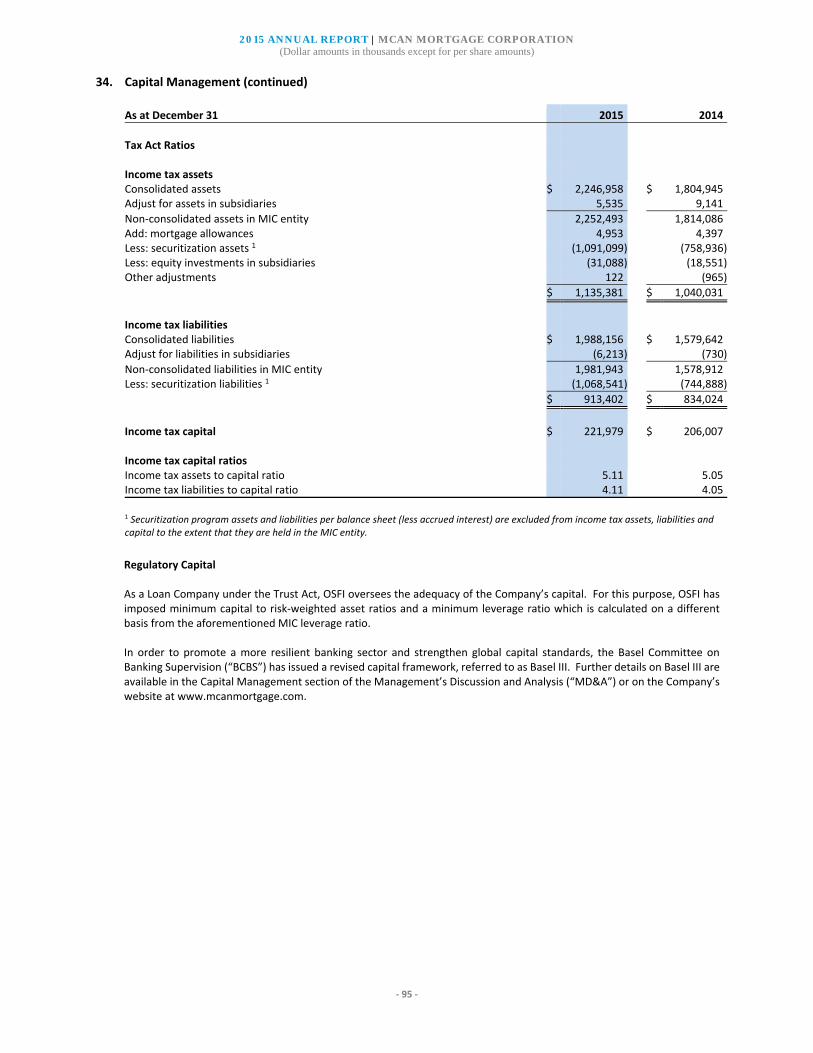
2015 ANNUAL REPORT | MCAN MORTGAGE CORPORATION (Dollar amounts in thousands except for per share amounts)
‐ 95 ‐
34. Capital Management (continued)
As at December 31 2015 2014
Tax Act Ratios Income tax assets Consolidated assets $ 2,246,958 $ 1,804,945 Adjust for assets in subsidiaries 5,535 9,141
Non‐consolidated assets in MIC entity 2,252,493 1,814,086 Add: mortgage allowances 4,953 4,397 Less: securitization assets 1 (1,091,099) (758,936) Less: equity investments in subsidiaries (31,088) (18,551) Other adjustments 122 (965)
$ 1,135,381 $ 1,040,031
Income tax liabilities Consolidated liabilities $ 1,988,156 $ 1,579,642 Adjust for liabilities in subsidiaries (6,213) (730)
Non‐consolidated liabilities in MIC entity 1,981,943 1,578,912 Less: securitization liabilities 1 (1,068,541) (744,888)
$ 913,402 $ 834,024
Income tax capital $ 221,979 $ 206,007 Income tax capital ratios Income tax assets to capital ratio 5.11 5.05 Income tax liabilities to capital ratio 4.11 4.05
1 Securitization program assets and liabilities per balance sheet (less accrued interest) are excluded from income tax assets, liabilities and capital to the extent that they are held in the MIC entity.
Regulatory Capital As a Loan Company under the Trust Act, OSFI oversees the adequacy of the Company’s capital. For this purpose, OSFI has imposed minimum capital to risk‐weighted asset ratios and a minimum leverage ratio which is calculated on a different basis from the aforementioned MIC leverage ratio. In order to promote a more resilient banking sector and strengthen global capital standards, the Basel Committee on Banking Supervision (“BCBS”) has issued a revised capital framework, referred to as Basel III. Further details on Basel III are available in the Capital Management section of the Management’s Discussion and Analysis (“MD&A”) or on the Company’s website at www.mcanmortgage.com.

2015 ANNUAL REPORT | MCAN MORTGAGE CORPORATION (Dollar amounts in thousands except for per share amounts)
‐ 96 ‐
34. Capital Management (continued) As at December 31 2015 2014
Regulatory Ratios (OSFI) Share capital $ 206,382 $ 183,939 Contributed surplus 510 510 Retained earnings 42,617 34,481 Accumulated other comprehensive income 9,293 6,373 Deduction for equity investment in MCAP (Transitional adjustment) 1 (7,324) (3,252)
Common Equity Tier 1, Tier 1 and Total Capital (Transitional) 251,478 222,051 Deduction for equity investment in MCAP (All‐in adjustment) 1 (10,986) (13,008)
Common Equity Tier 1, Tier 1 and Total Capital (All‐in) $ 240,492 $ 209,043
Total Exposures/Regulatory Assets 2 Consolidated assets $ 2,246,958 $ 1,805,718 Less: CMB‐related assets ‐ (33,286) Less: deductions from all‐in Tier 1 Capital 1,2 (18,310) n/a Less: deductions from transitional Total Capital 1,2 n/a (3,252) Other adjustments 5 2,229 2,017
Total On‐Balance Sheet Exposures 3 2,230,877
Mortgage and investment funding commitments 3 333,667 Less: conversion to credit equivalent amount (50%) (166,834) Letters of credit 4 35,863 36,357 Less: conversion to credit equivalent amount (50%) (17,932)
Off‐Balance Sheet Items 3 184,764
Total Exposures/Regulatory Assets 2 $ 2,415,641 $ 1,807,554
Leverage ratio 2 9.96% n/a Assets to capital multiple 2 n/a 8.14 Risk weighted assets (transitional) $ 1,063,936 $ 950,263 Risk weighted assets (all‐in) $ 1,041,964 $ 924,243 Regulatory Capital Ratios Common Equity Tier 1 capital to risk‐weighted assets ratio (transitional) 23.64% 23.37% Tier 1 capital to risk‐weighted assets ratio (transitional) 23.64% 23.37% Total capital to risk‐weighted assets ratio (transitional) 23.64% 23.37% Common Equity Tier 1 capital to risk‐weighted assets ratio (all‐in) 23.08% 22.62% Tier 1 capital to risk‐weighted assets ratio (all‐in) 23.08% 22.62% Total capital to risk‐weighted assets ratio (all‐in) 23.08% 22.62%
1 The deduction for the equity investment in MCAP is equal to the amount of the investment in excess of 10% of the Company’s shareholders’ equity on an all‐in basis. In 2015, the deduction on the transitional basis is equal to 40% of the all‐in adjustment (2014 ‐ 20%). 2 The leverage ratio replaced the assets to capital multiple as of January 1, 2015 such that the leverage ratio is n/a for 2014 and the assets to capital multiple is n/a for 2015. The leverage ratio is based on all‐in Tier 1 Capital while the assets to capital multiple was based on transitional Total 1 Capital. The leverage ratio refers to its denominator as “Total Exposures”, while the assets to capital multiple referred to its numerator as “Regulatory Assets”. 3 Not applicable for the assets to capital multiple as at December 31, 2014. Commitments are included in total exposures at a 50% conversion factor. 4 Letters of credit are included in total exposures at a 50% conversion factor in the calculation of the leverage ratio, but were included at 100% in the calculation of the assets to capital multiple. 5 Certain items, such as negative cash balances, are excluded from total exposures but included in consolidated assets.
As at December 31, 2015 and December 31, 2014, the Company was in compliance with the capital guidelines issued by OSFI under Basel III.
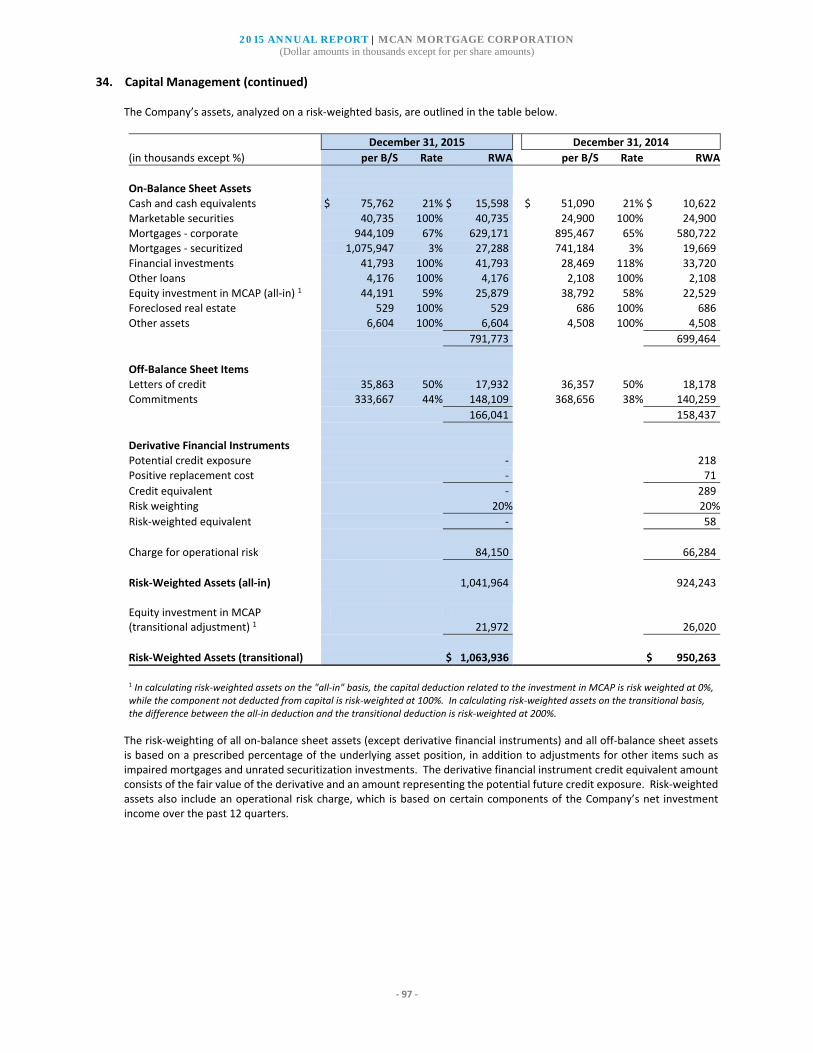
2015 ANNUAL REPORT | MCAN MORTGAGE CORPORATION (Dollar amounts in thousands except for per share amounts)
‐ 97 ‐
34. Capital Management (continued) The Company’s assets, analyzed on a risk‐weighted basis, are outlined in the table below.
December 31, 2015 December 31, 2014
(in thousands except %) per B/S Rate RWA per B/S Rate RWA
On‐Balance Sheet Assets
Cash and cash equivalents $ 75,762 21% $ 15,598 $ 51,090 21% $ 10,622 Marketable securities 40,735 100% 40,735 24,900 100% 24,900
Mortgages ‐ corporate 944,109 67% 629,171 895,467 65% 580,722 Mortgages ‐ securitized 1,075,947 3% 27,288 741,184 3% 19,669
Financial investments 41,793 100% 41,793 28,469 118% 33,720 Other loans 4,176 100% 4,176 2,108 100% 2,108
Equity investment in MCAP (all‐in) 1 44,191 59% 25,879 38,792 58% 22,529 Foreclosed real estate 529 100% 529 686 100% 686
Other assets 6,604 100% 6,604 4,508 100% 4,508
791,773 699,464
Off‐Balance Sheet Items
Letters of credit 35,863 50% 17,932 36,357 50% 18,178 Commitments 333,667 44% 148,109 368,656 38% 140,259
166,041 158,437
Derivative Financial Instruments
Potential credit exposure ‐ 218 Positive replacement cost ‐ 71
Credit equivalent ‐ 289
Risk weighting 20% 20%
Risk‐weighted equivalent ‐ 58
Charge for operational risk 84,150 66,284
Risk‐Weighted Assets (all‐in) 1,041,964 924,243
Equity investment in MCAP (transitional adjustment) 1 21,972 26,020
Risk‐Weighted Assets (transitional) $ 1,063,936 $ 950,263
1 In calculating risk‐weighted assets on the "all‐in" basis, the capital deduction related to the investment in MCAP is risk weighted at 0%, while the component not deducted from capital is risk‐weighted at 100%. In calculating risk‐weighted assets on the transitional basis, the difference between the all‐in deduction and the transitional deduction is risk‐weighted at 200%.
The risk‐weighting of all on‐balance sheet assets (except derivative financial instruments) and all off‐balance sheet assets is based on a prescribed percentage of the underlying asset position, in addition to adjustments for other items such as impaired mortgages and unrated securitization investments. The derivative financial instrument credit equivalent amount consists of the fair value of the derivative and an amount representing the potential future credit exposure. Risk‐weighted assets also include an operational risk charge, which is based on certain components of the Company’s net investment income over the past 12 quarters.

2015 ANNUAL REPORT | MCAN MORTGAGE CORPORATION (Dollar amounts in thousands except for per share amounts)
‐ 98 ‐
35. Financial Instruments The majority of the Company’s consolidated balance sheet consists of financial instruments, and the majority of net income is derived from the related income, expenses, gains and losses. Financial instruments include cash and cash equivalents, short‐term investments, marketable securities, mortgages, financial investments, other loans, financial liabilities from securitization, term deposits, loans payable and derivative financial instruments. All financial instruments that are carried on the consolidated balance sheets at fair value (marketable securities, certain financial investments and derivative financial instruments) or for which fair value is disclosed are estimated using valuation techniques based on observable market data such as market interest rates currently charged for similar financial investments to expected maturity dates. The following table summarizes financial assets reported at fair value and financial assets and liabilities for which fair values are disclosed. Financial assets and liabilities are classified into three levels, as follows: quoted prices in an active market (Level 1), fair value based on observable inputs other than quoted prices (Level 2) and fair value based on inputs that are not based on observable data (Level 3).
Carrying As at December 31, 2015 Level 1 Level 2 Level 3 Total value
Assets measured at fair value Cash and cash equivalents $ 75,762 $ ‐ $ ‐ $ 75,762 $ 75,762 Marketable securities 37,958 2,777 ‐ 40,735 40,735 Financial investments ‐ commercial real estate 1 ‐ ‐ 31,102 31,102 31,102 Financial investments ‐ KingSett High Yield Fund 2 ‐ ‐ 10,691 10,691 10,691 Securitization program cash held in trust 13,112 ‐ ‐ 13,112 13,112
$ 126,832 $ 2,777 $ 41,793 $ 171,402 $ 171,402
Assets for which fair values are disclosed Mortgages ‐ corporate 3 $ ‐ $ ‐ $ 958,772 $ 958,772 $ 944,109 Other loans 4 ‐ ‐ 4,176 4,176 4,176 Mortgages ‐ securitized 3 ‐ ‐ 1,107,168 1,107,168 1,075,947
$ ‐ $ ‐ $2,070,116 $2,070,116 $2,024,232
Liabilities measured at fair value Other liabilities ‐ corporate 5 $ ‐ $ ‐ $ 12,412 $ 12,412 $ 12,412 Liabilities for which fair values are disclosed Term deposits 6 $ ‐ $ ‐ $ 905,167 $ 905,167 $ 903,041 Financial liabilities from securitization 7 ‐ ‐ 1,103,339 1,103,339 1,070,304
$ ‐ $ ‐ $2,008,506 $2,008,506 $1,973,345
1 Fair value of investment is based on the underlying real estate properties determined by the discount cash flow method and direct capitalization method. The significant unobservable inputs are the capitalization rate and discount rate. 2 Fair value is based on returns earned by the fund in excess of its base rate. 3 Corporate and securitized fixed rate mortgages are calculated based on discounting the expected future cash flows of the mortgages, adjusting for credit risk and prepayment assumptions at current market rates for offered mortgages based on term, contractual maturities and product type. For variable rate mortgages, fair value is assumed to equal their carrying amount since there are no fixed spreads. The Company classifies its mortgages as level 3 given the fact that although many of the inputs to the valuation models used are observable, the mortgages are not specifically quoted in an open market. 4 Fair value is assumed to be the carrying value as underlying mortgages and loans are variable rate. 5 The carrying value of the asset/liability approximates fair value. 6 As term deposits are non‐transferable by the deposit holders, there is no observable market. As such, the fair value of the deposits is determined by discounting expected future cash flows of the deposits at current offered rates for deposits with similar terms. 7 Fair value of financial liabilities from securitization is determined using current market rates for MBS.

2015 ANNUAL REPORT | MCAN MORTGAGE CORPORATION (Dollar amounts in thousands except for per share amounts)
‐ 99 ‐
35. Financial Instruments (continued) Carrying As at December 31, 2014 Level 1 Level 2 Level 3 Total Value
Assets measured at fair value Cash and cash equivalents $ 51,090 $ ‐ $ ‐ $ 51,090 $ 51,090 Marketable securities 19,876 5,024 ‐ 24,900 24,900 Financial investments ‐ commercial real estate 1 ‐ ‐ 23,512 23,512 23,512 Financial investments ‐ KingSett High Yield Fund 2 ‐ ‐ 4,500 4,500 4,500 Securitization program cash held in trust 5,275 ‐ ‐ 5,275 5,275 Derivative financial instruments ‐ securitization ‐ 71 ‐ 71 71
$ 76,241 $ 5,095 $ 28,012 $ 109,348 $ 109,348
Assets for which fair values are disclosed Mortgages ‐ corporate 3 $ ‐ $ ‐ $ 911,882 $ 911,882 $ 895,467 Financial investments ‐ asset‐backed commercial paper 4 ‐ ‐ 457 457 457 Other loans 4 ‐ ‐ 2,108 2,108 2,108 Short‐term investments ‐ commercial paper ‐ 11,488 ‐ 11,488 11,488 Mortgages ‐ securitized 3 ‐ ‐ 762,537 762,537 741,184 Financial investments ‐ securitization ‐ 907 ‐ 907 907
$ ‐ $ 12,395 $1,676,984 $1,689,379 $1,651,611
Liabilities measured at fair value Other liabilities ‐ corporate 5 $ ‐ $ ‐ $ 11,202 $ 11,202 $ 11,202 Derivative financial instruments ‐ corporate ‐ 133 ‐ 133 133 Other liabilities ‐ securitization 5 ‐ ‐ 42 42 42
$ ‐ $ 133 $ 11,244 $ 11,377 $ 11,377
Liabilities for which fair values are disclosed Term deposits 6 $ ‐ $ ‐ $ 825,755 $ 825,755 $ 821,742 Financial liabilities from securitization 7 ‐ ‐ 756,984 756,984 746,063
$ ‐ $ ‐ $1,582,739 $1,582,739 $1,567,805
1 Fair value of investment is based on the underlying real estate properties determined by the discount cash flow method and direct capitalization method. The significant unobservable inputs are the capitalization rate and discount rate. 2 Fair value is based on returns earned by the fund in excess of its base rate. 3 Corporate and securitized fixed rate mortgages are calculated based on discounting the expected future cash flows of the mortgages, adjusting for credit risk and prepayment assumptions at current market rates for offered mortgages based on term, contractual maturities and product type. For variable rate mortgages, fair value is assumed to equal their carrying amount since there are no fixed spreads. The Company classifies its mortgages as level 3 given the fact that although many of the inputs to the valuation models used are observable, the mortgages are not specifically quoted in an open market. 4 Fair value is assumed to be the carrying value as underlying mortgages and loans are variable rate. 5 The carrying value of the asset/liability approximates fair value. 6 As term deposits are non‐transferable by the deposit holders, there is no observable market. As such, the fair value of the deposits is determined by discounting expected future cash flows of the deposits at current offered rates for deposits with similar terms. 7 Fair value of financial liabilities from securitization is determined using current market rates for MBS and CMB.
The following table shows the continuity of Level 3 financial assets recorded at fair value:
Balance, December 31, 2014 $ 28,012 Advances 7,824 Changes in fair value, recognized in other comprehensive income 5,957
Balance, December 31, 2015 $ 41,793
An increase of 0.25% to capitalization rates as at December 31, 2015 would result in a decrease to the fair value of Level 3 financial investments ‐ commercial real estate by $361 (December 31, 2014 ‐ $399). A decrease of 0.25% to capitalization rates as at December 31, 2015 would result in an increase to the fair value of Level 3 financial investments ‐ commercial real estate by $376 (December 31, 2014 ‐ $417). There were no transfers between levels during the years ended December 31, 2015 or December 31, 2014.

2015 ANNUAL REPORT | MCAN MORTGAGE CORPORATION (Dollar amounts in thousands except for per share amounts)
‐ 100 ‐
35. Financial Instruments (continued) Risk Management The types of risks to which the Company is exposed include but are not limited to interest rate, credit, liquidity and market risk. The Company’s enterprise risk management framework includes policies, guidelines and procedures, with oversight by senior management and the Board of Directors. These policies are developed and implemented by management and reviewed and approved annually by the Board of Directors. The nature of these risks and how they are managed is provided in the Risk Governance and Management section of the MD&A. Certain disclosures required under IFRS 7, Financial Instruments: Disclosures, related to the management of credit, interest rate, liquidity and market risks inherent with financial instruments are included in the MD&A. The relevant MD&A sections are identified by shading within boxes and the content forms an integral part of these consolidated financial statements.
36. Comparative Amounts Certain comparative amounts have been reclassified to conform to the presentation adopted in the current year. There was no impact to the financial position or net income as a result of these reclassifications.
2015 ANNUAL REPORT | MCAN MORTGAGE CORPORATION
‐ 101 ‐
DIRECTORS EXECUTIVE OFFICERS
Scott Coates Managing Director, Mortgage Investments, KingSett Capital Member of Audit Committee Member of Risk Committee Director since May 2014 Brydon Cruise President and Managing Partner, Brookfield Financial Chair of Risk Committee Director since May 2010 Verna Cuthbert Counsel, Fasken Martineau DuMoulin LLP Member of Conduct Review, Corporate Governance and Human Resources Committee Member of Risk Committee Director since September 2013 Susan Doré Corporate Director Member of Audit Committee Member of Conduct Review, Corporate Governance and Human Resources Committee Director since May 2010 William Jandrisits President and Chief Executive Officer, MCAN Mortgage Corporation Member of Enterprise Risk Management Ad Hoc Committee Director since August 2010 Brian A. Johnson Partner, Crown Realty Partners Member of Risk Committee Member of Enterprise Risk Management Ad Hoc Committee Chair of Conduct Review, Corporate Governance and Human Resources Committee Director since January 2001 Ian Sutherland Chair, MCAN Mortgage Corporation Member of Enterprise Risk Management Ad Hoc Committee Director since January 1991 Karen Weaver Executive Vice President and Chief Financial Officer, DH Corporation Chair of Audit Committee Director since November 2011 W. Terrence Wright Counsel, Pitblado LLP Member of Audit Committee Member of Conduct Review, Corporate Governance and Human Resources Committee Chair of Enterprise Risk Management Ad Hoc Committee Director since September 2013
William Jandrisits President and Chief Executive Officer Jeffrey Bouganim Vice President and Chief Financial Officer Michael Misener Vice President and Chief Investment Officer Derek Sutherland Vice President and Chief Risk Officer Carl Brown Vice President, Operations Business Continuity/Disaster Recovery Coordinator Sylvia Pinto Corporate Secretary Chief Compliance Officer Dipti Patel Chief Audit Officer

2015 ANNUAL REPORT | MCAN MORTGAGE CORPORATION
‐ 102 ‐
CORPORATE INFORMATION
Head Office 200 King Street West, Suite 600 Toronto, Ontario M5H 3T4 Tel: 416‐572‐4880 Tel: 1‐855‐213‐6226 (toll free) Fax: 416‐598‐4142 [email protected] Term Deposits Tel: 1‐800‐387‐9096 (toll free) Fax: 1‐877‐821‐0710 [email protected] Stock Listing Toronto Stock Exchange Symbol: MKP Corporate Counsel Goodmans LLP Toronto, Ontario Auditors Ernst & Young LLP Toronto, Ontario Bank Bank of Montreal First Canadian Place Toronto, Ontario Registrar and Transfer Agent Computershare Investor Services Inc. 100 University Avenue, 9th Floor Toronto, Ontario M5J 2Y1 Tel: 1‐800‐564‐6253 Websites www.mcanmortgage.com www.xceedmortgage.com
Dividend Reinvestment Plan (DRIP) For further information regarding MCAN’s Dividend Reinvestment Plan, please visit: www.mcanmortgage.com/investor‐relations/investor‐materials. An Enrolment Form may be obtained at any time upon written request addressed to the Plan Agent, Computershare. Registered Participants may also obtain Enrolment Forms online at www‐us.computershare.com/investor/. Shareholders For dividend information, change in share registration or address, lost certificates, estate transfers, or to advise of duplicate mailings, please call MCAN Mortgage Corporation’s Transfer Agent and Registrar, Computershare (see left for contact). Report Copies This MCAN Mortgage Corporation 2015 Annual Report is available for viewing/printing on our website at www.mcanmortgage.com, and also on SEDAR at www.sedar.com. To request a printed copy, please contact Ms. Sylvia Pinto, Corporate Secretary, or e‐mail [email protected]. General Information For general enquiries about MCAN Mortgage Corporation, please write to Ms. Sylvia Pinto, Corporate Secretary (head office details at left) or e‐mail [email protected]
Annual Meeting of Shareholders Wednesday, May 11, 2016 4:30pm (local time) St. Andrew’s Club & Conference Centre 150 King Street West, 27th Floor Toronto, Ontario All shareholders and prospective investors are invited to attend.

www.mcanmortgage.com
200 King Street West, Suite 600Toronto, ON M5H 3T4
Toll Free Phone: 1-855-213-6226Toronto Phone: 416-572-4880Fax: 416-598-4142


![Mcan presentation 2011_share[1]](https://img.pdfslide.net/doc/110x75/5554e1e4b4c9051b6e8b5479/mcan-presentation-2011share1.jpg)