Embed Size (px)
Citation preview
2015 BEHAVIORAL R ISK FACTOR SURVEY 29TH ANNUAL REPORT
HEALTH R ISK BEHAVIORS WITHIN THE STATE OF M ICHIGAN


2015 Behavioral Risk Factor Survey
Health Risk Behaviors within the State of Michigan
www.michigan.gov/brfs

RICK SNYDER Governor, State of Michigan
NICK LYON
Director, Michigan Department of Health and Human Services
SUSAN MORAN, MPH Senior Deputy Director, Population Health Administration
Michigan Department of Health and Human Services
SARAH LYON-CALLO, MA, MS Director, Bureau of Epidemiology and Population Health
Michigan Department of Health and Human Services
PATRICIA MCKANE, DVM, MPH Director, Lifecourse Epidemiology and Genomics Division
Michigan Department of Health and Human Services
CHRIS FUSSMAN, MS Maternal and Child Health Epidemiology Section Manager
Behavioral Risk Factor Surveillance System Coordinator Michigan Department of Health and Human Services
Printed June 2017
Permission is granted for the reproduction of this publication provided that all reproductions contain appropriate reference to the source through the inclusion of the following citation: Fussman C. 2017. Health Risk Behaviors within the State of Michigan: 2015 Behavioral Risk Factor Survey. 29th Annual Report. Lansing, MI: Michigan Department of Health and Human Services, Lifecourse Epidemiology and Genomics Division. This publication was supported in part through Cooperative Agreement DP15-1513 from the Centers for Disease Control and Prevention. Its contents are solely the responsibility of the authors and do not necessarily represent the official views of the Centers for Disease Control and Prevention.

Table of Contents
Methods ............................................................................................. ...................... vii
Summary ........................................................................................... ......................viii
Health Status Indicators
General Health Status ......................................................................................... 1
Quality of Life ...................................................................................................... 2
Disability .............................................................................................................. 3
Weight Status ...................................................................................................... 4
No Health Care Coverage (Among Adults 18-64 Years) .................................... 5
Health Insurance Type (Among Adults 18+ Years) ............................................ 6
Limited Health Care Coverage ............................................................................ 7
Social Context ..................................................................................................... 8
Risk Behavior Indicators
No Leisure Time Physical Activity ....................................................................... 9
Adequate Physical Activity .................................................................................. 10
Fruit and Vegetable Consumption ....................................................................... 11
Cigarette Smoking ............................................................................................... 12
Hookah Use ......................................................................................................... 13
Secondhand Smoke Exposure ............................................................................ 14
Alcohol Consumption ........................................................................................... 15
Seatbelt Use ........................................................................................................ 16
Hypertension Awareness and Medication Use .................................................... 17
Clinical Preventive Practices
Routine Checkup in Past Year ........................................................................... 18
Cholesterol Screening and Awareness .............................................................. 19
Colorectal Cancer Screening ............................................................................. 20
Adult Immunizations ............................................................................................ 21
HIV Testing ......................................................................................................... 22
Chronic Conditions
Asthma in Adults ................................................................................................. 23
Asthma in Children .............................................................................................. 24
Chronic Obstructive Pulmonary Disease (COPD) .............................................. 25
Arthritis ................................................................................................................ 26
Cardiovascular Disease ...................................................................................... 27
Cancer ................................................................................................................. 28
Diabetes .............................................................................................................. 29
Kidney Disease ................................................................................................... 30
Depression .......................................................................................................... 31
Acknowledgements .................................................................................................. 32
Bibliography ............................................................................................................. 33
vi

The Michigan Behavioral Risk Factor Survey (MiBRFS) is an annual, statewide telephone survey of Michigan adults aged 18 years and older that is conducted through a collaborative effort between the Population Health Surveillance Branch (PHSB) of the Centers for Disease Control and Prevention (CDC), the Michigan State University Institute for Public Policy and Social Research (IPPSR), and the Michigan Department of Health & Human Services (MDHHS). Michigan Behavioral Risk Factor Surveillance System (MiBRFSS) data contribute to the CDC Behavioral Risk Factor Surveillance System (BRFSS) that is conducted within every state, the District of Columbia, and several U.S. territories. In 2015, the MiBRFS collected data from both landline and cell phone respondents. The sample of landline telephone numbers was selected using a list-assisted, random-digit-dialed methodology with a disproportionate stratification based on phone bank density, and whether or not the phone numbers were directory listed. The sample of cell phone numbers was randomly selected from dedicated cellular telephone banks sorted on the basis of area code and exchange. A weighting methodology known as iterative proportional fitting or raking was used in 2015 to allow for the incorporation of cell phone data and to improve the accuracy of prevalence estimates based on MiBRFS data. Estimates based on this weighting methodology were weighted to adjust for the probabilities of selection and a raking adjustment factor that adjusted for the distribution of the Michigan adult population by telephone source (landline or cell phone), detailed race/ethnicity, education level, marital status, age by gender, gender by race/ethnicity, age by race/ethnicity, and renter/owner status. Due to the BRFSS methodology changes that were implemented in 2011, the 2015 MiBRFS estimates provided within this report should only be compared to estimates from 2011-2014 and not to estimates from years prior to 2011. Prevalence estimates and asymmetric 95% confidence intervals (95% CIs) were calculated using SAS-Callable SUDAAN (version 11.0.1), a statistical computing program that was designed for analyzing data from multistage sample surveys.
1 If the 95% CIs for two estimates from different subpopulations or survey years did not overlap, they were
considered to be statistically different. Unless otherwise specified, respondents who answered that they did not know or refused to answer were not included in the calculation of estimates. For comparison purposes, the median estimates from all 50 states and the District of Columbia were used as national estimates. In addition to this report, the MiBRFSS releases several additional publications each year. These publications provide statewide health estimates for Michigan adults as well as estimates among demographic and geographic subpopulations. MiBRFSS Surveillance Briefs are also published on a quarterly basis and highlight new topical data from the MiBRFSS, including data from MiBRFSS state-added questions. All of these publications can be found on the MiBRFSS website (www.michigan.gov/brfs).
Sample Results for the 2015 MiBRFS The total sample size for the 2015 MiBRFS was 8,935 (landline = 4,215; cell phone = 4,720). The response rate for the landline portion of the 2015 MiBRFS was 51.7%, while the response rate for the cell phone portion of the survey was 46.9%. The overall weighted response rate (landline and cell phones combined) for the 2015 MiBRFS was 49.9%. The overall weighted U.S. median response rate for 2015 was 47.2%.
2
Over the past several years, MDHHS has been able to maintain an annual MiBRFS sample size of at least 8,000 completed interviews. A larger annual sample size increases the utility of the survey by providing more precise estimates, allowing for an increased number of topics to be covered each year, and enables the calculation of estimates for more demographic and geographic subpopulations.
BRFSS Methods
vii
0
2000
4000
6000
8000
10000
12000
14000
'00 '01 '02 '03 '04 '05 '06 '07 '08 '09 '10 '11 '12 '13 '14 '15
#
Number of Interviews by Survey YearMichigan BRFS 2000-2015
Summary
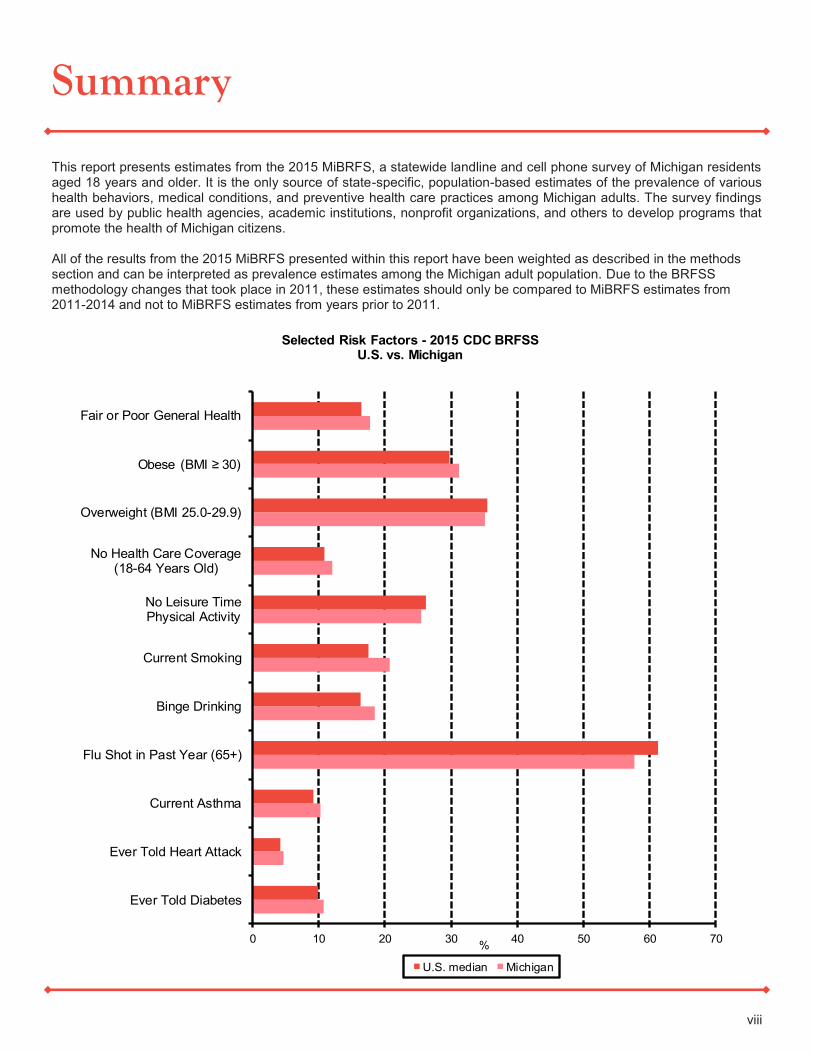
This report presents estimates from the 2015 MiBRFS, a statewide landline and cell phone survey of Michigan residents aged 18 years and older. It is the only source of state-specific, population-based estimates of the prevalence of various health behaviors, medical conditions, and preventive health care practices among Michigan adults. The survey findings are used by public health agencies, academic institutions, nonprofit organizations, and others to develop programs that promote the health of Michigan citizens. All of the results from the 2015 MiBRFS presented within this report have been weighted as described in the methods section and can be interpreted as prevalence estimates among the Michigan adult population. Due to the BRFSS methodology changes that took place in 2011, these estimates should only be compared to MiBRFS estimates from 2011-2014 and not to MiBRFS estimates from years prior to 2011.
viii
0 10 20 30 40 50 60 70
Ever Told Diabetes
Ever Told Heart Attack
Current Asthma
Flu Shot in Past Year (65+)
Binge Drinking
Current Smoking
No Leisure TimePhysical Activity
No Health Care Coverage(18-64 Years Old)
Overweight (BMI 25.0-29.9)
Obese (BMI ≥ 30)
Fair or Poor General Health
%
Selected Risk Factors - 2015 CDC BRFSSU.S. vs. Michigan
U.S. median Michigan

Summary, continued
Public Health Implications of Findings A number of themes emerge from the findings of the 2015 MiBRFS that have implications for public health.
Michigan continues to make strides in increasing access to health care coverage. In 2015, an estimated 12.0% (95% CI: 10.9-13.1) of Michigan adults aged 18-64 years reported not having any form of health care coverage. This represents a significant decrease of 4.6 percentage points since 2012 (16.6%). From 2012 to 2015, the prevalence of no health care coverage decreased among males (2012: 18.9% vs. 2015: 14.2%) and females (2012: 14.2% vs. 2015: 9.7%), as well as White, non-Hispanic (2012: 15.1% vs. 2015: 10.9%) and Black, non-Hispanic adults (2012: 24.3% vs. 2015: 12.5%). The Healthy Michigan Plan, which was implemented on April 1, 2014, makes health care benefits available to individuals at a low cost. As the Healthy Michigan Plan continues, we hope to observe further decreases in the number of Michigan adults aged 18-64 years who report not having any form of health care coverage.
Multiple chronic conditions continue to be a problem among Michigan adults. In 2015, an estimated 27.1% of Michigan adults reported that they had ever been told by a doctor that they had two or more of the following chronic health conditions: diabetes, cardiovascular disease, current asthma, COPD, cancer, arthritis, kidney disease, and/or depression. Furthermore, an additional 28.0% reported ever having only one of these chronic health conditions. The prevalence of multiple chronic conditions increased with age, and was significantly higher among females (31.2%) than males (22.8%). The prevalence of multiple chronic conditions was similar by race/ethnicity, but was significantly higher among the less educated and lower household income groups. Through public health efforts, such as the Million Hearts initiative, MDHHS chronic disease programs continue to work collaboratively toward reducing the burden of these chronic conditions within the Michigan adult population.
Racial disparities in weight status among Michigan adults have reemerged. In 2015, an estimated 31.2% of Michigan adults were classified as being obese (BMI ≥ 30.0). Prior to 2014, Black, non-Hispanic adults regularly reported significantly higher obesity prevalence estimates than White, non-Hispanic adults. In 2014, this disparity diminished with the prevalence of obesity among Black, non-Hispanic adults (33.6%) being similar to that of White, non-Hispanic adults (30.2%). Unfortunately, this racial disparity has reemerged in 2015 with 40.2% of Black, non-Hispanic adults reporting obesity compared to only 29.8% of White, non-Hispanic adults. In addition to targeting Michigan’s high burden populations, the Michigan Nutrition, Physical Activity and Obesity Program continues to develop initiatives that focus on improving nutrition and increasing physical activity among the entire Michigan population.
Smoking and secondhand smoke exposure have stabilized, but more progress is needed. In 2015, an estimated 20.7% of Michigan adults reported that they currently smoke cigarettes on a regular basis. Unfortunately, this means that one in every five Michigan adults currently smoke cigarettes. Even with the passage of the Michigan Smoke-Free Air Law on May 1, 2010, secondhand smoke exposure continues to be a problem in Michigan with an estimated 24.3% of adults reporting that they were exposed to secondhand smoke in their home or in a car within the past seven days. When focusing only on non-smokers, the prevalence of secondhand smoke exposure during the past seven days decreases to 14.6% (95% CI: 13.2-16.2). With a sustained emphasis on smoking cessation and smoke-free regulations, the MDHHS Tobacco Program anticipates that the prevalence of smoking and secondhand smoke exposure will start to decrease again within the coming years.
Binge drinking among Michigan adults remains higher than the U.S. median. In 2015, an estimated 18.5% of Michigan adults reported having at least one binge drinking episode within the past month. The prevalence of binge drinking among Michigan adults is significantly higher than the U.S. median binge drinking prevalence (16.3%). With exception of the 2010 survey year, the prevalence of binge drinking among Michigan adults has been higher than the U.S. median for the past decade. MDHHS’ Alcohol Surveillance Program provides data and statistics to local health departments and organizations committed to reducing adverse impacts of excessive alcohol consumption through the use of environmental and policy interventions described within the Guide to Community Preventive Services (http://www.thecommunityguide.org/index.html). MDHHS programs work in concert with local coalitions and other stakeholders to address excessive alcohol consumption throughout the state.
ix

Summary, continued
Future of the Michigan Behavioral Risk Factor Survey The target sample size for the 2016 MiBRFS is 11,080 total completed interviews. Of these 11,080 interviews, 4,432 will be completed with landline respondents, while the remaining 6,648 will be completed with cell phone respondents. The 2016 questionnaire will include approximately 60 state-added questions on numerous topics, including adverse childhood experiences, stroke, drug use, gambling, lung cancer screening, tobacco cessation, and cancer survivorship. The full 2016 MiBRFS questionnaire is available on the MiBRFSS website (www.michigan.gov/brfs). The BRFSS continues to adapt to challenges and expand its utility. The representativeness and validity of MiBRFS estimates has been improved. For example, due the drastic increase in the utilization of cell phone communication, the BRFSS now collects over half of the data from cell phone respondents. Furthermore, the CDC has implemented a new raking weighting methodology so that BRFSS estimates are more representative than ever before. Michigan has also expanded the utility of the MiBRFS through the following projects:
The maintenance of a larger MiBRFS sample size will allow for more precise estimates among racial/ethnic populations, especially when multiple years of data are combined.
Standalone BRFS-like oversample surveys of minority subpopulations are conducted on an annual basis as funding is available. The results of these minority oversample surveys are available on the MiBRFSS website.
Since 2005, questions have been included that randomly select one child in each household and obtain demographic characteristics of that child. This information allows us to ask health-related questions about this child and then to calculate estimates for childhood conditions, such as asthma.
An Asthma Call-Back survey that follows up on children and adults who were identified as having asthma during the MiBRFS interview has been conducted since 2005, allowing for collection of more detailed information on asthma management, clinical care, and impact of the disease on people’s lives. It is anticipated that this methodology could be useful for other subpopulations in the future.
In recent years, the MiBRFSS has expanded to include questions focusing on topics such as dental coverage, hookah use, secondhand smoke exposure, inadequate sleep, and prediabetes.
MiBRFSS estimates are used as progress indicators for federal grants focusing on the prevention and control of diabetes, heart disease, obesity and their associated risk factors (CDC 1422/1305).
The MiBRFSS is a main source of data for a number of the chronic disease and health promotion indicators that are routinely updated and readily available on the MDHHS website.
The MiBRFSS is the source for seven of the 20 indicators included within the Michigan Health and Wellness Dashboard (https://midashboard.michigan.gov/health-and-wellness). This project provides a quick assessment of the health and wellness of Michigan residents.
Several BRFSS indicators are used in the Robert Wood Johnson County Health Rankings. These rankings measure the overall health of nearly all counties within the United States and rank them within states.
In conclusion, the MiBRFS continues to serve the needs of public health officials, health care providers, researchers and local and state level policy makers, while presenting a number of opportunities for expanding our understanding of the risk factors and preventive behaviors for the major causes of disease and disability in Michigan.
x

0
5
10
15
20
'06 '07 '08 '09 '10 '11 '12 '13 '14 '15
%
General Health, Fair or PoorU.S. vs. Michigan, 2006-2015
U.S. median Michigan
General Health Status
Due to methodology changes that took place in 2011, BRFSS estimates from 2011 and moving forward cannot be compared to BRFSS estimates from 2010 and earlier.
Demographic
Characteristics
General Health, Fair or Poora
% 95% Confidence
Interval
Total 17.7 (16.7-18.7)
Age
18 - 24 8.6 (6.4-11.4)
25 - 34 12.8 (10.4-15.6)
35 - 44 14.5 (12.2-17.2)
45 - 54 20.9 (18.4-23.6)
55 - 64 23.2 (20.9-25.7)
65 - 74 21.3 (18.9-23.9)
75 + 23.7 (20.7-27.1)
Gender
Male 17.1 (15.7-18.7)
Female 18.1 (16.8-19.5)
Race/Ethnicity
White, non-Hispanic 16.0 (15.0-17.1)
Black, non-Hispanic 25.8 (22.5-29.4)
Other, non-Hispanic 17.2 (13.1-22.2)
Hispanic 21.2 (15.3-28.6)
Household Income
< $20,000 36.4 (33.0-39.9)
$20,000 - $34,999 24.6 (21.9-27.6)
$35,000 - $49,999 15.3 (13.0-18.0)
$50,000 - $74,999 10.1 (8.3-12.2)
≥ $75,000 6.8 (5.7-8.1)
Health Insurance
Insured 17.7 (16.7-18.7)
Uninsured 17.8 (14.5-21.7)
Disability Status
No disabilities 8.1 (7.3-9.0)
Adults with disabilities 46.5 (43.9-49.0) a Among all adults, the proportion reporting that their health, in general, was either fair or poor.
Self-assessed health is a measure of how a person perceives their own health. Self-assessed health status has been validated as a useful indicator of health among different populations and allows for broad comparisons across a variety of health conditions.3
In 2015, an estimated 17.7% of Michigan adults reported that
their general health was either fair or poor.
Fair or poor general health increased with age and
decreased with increasing household income level.
The prevalence of fair or poor general health was similar by
gender and health insurance status.
White, non-Hispanic adults (16.0%) reported a significantly
lower prevalence of fair or poor general health than Black, non-Hispanic adults (25.8%).
Adults with disabilities (46.5%) reported a significantly higher
prevalence of fair to poor health than adults without disabilities (8.1%).
The BRFSS methodology changes that were implemented in
2011 resulted in a spike in the prevalence of fair or poor general health among Michigan adults, but since these changes, the prevalence of fair to poor general health has remained within the 16%-17% range.
In 2015, the prevalence of fair or poor general health among
Michigan adults (17.7%) was higher that that of the U.S. median prevalence (16.4%).
1
0
5
10
15
20
'06 '07 '08 '09 '10 '11 '12 '13 '14 '15
%
Poor Physical and Mental HealthMichigan, 2006-2015
Poor Physical Health Poor Mental Health
Quality of Life
Due to methodology changes that took place in 2011, BRFSS estimates from 2011 and moving forward cannot be compared to BRFSS estimates from 2010 and earlier.
Demographic
Characteristics
Poor Physical Healtha Poor Mental Healthb
% 95% Confidence
Interval %
95% Confidence
Interval
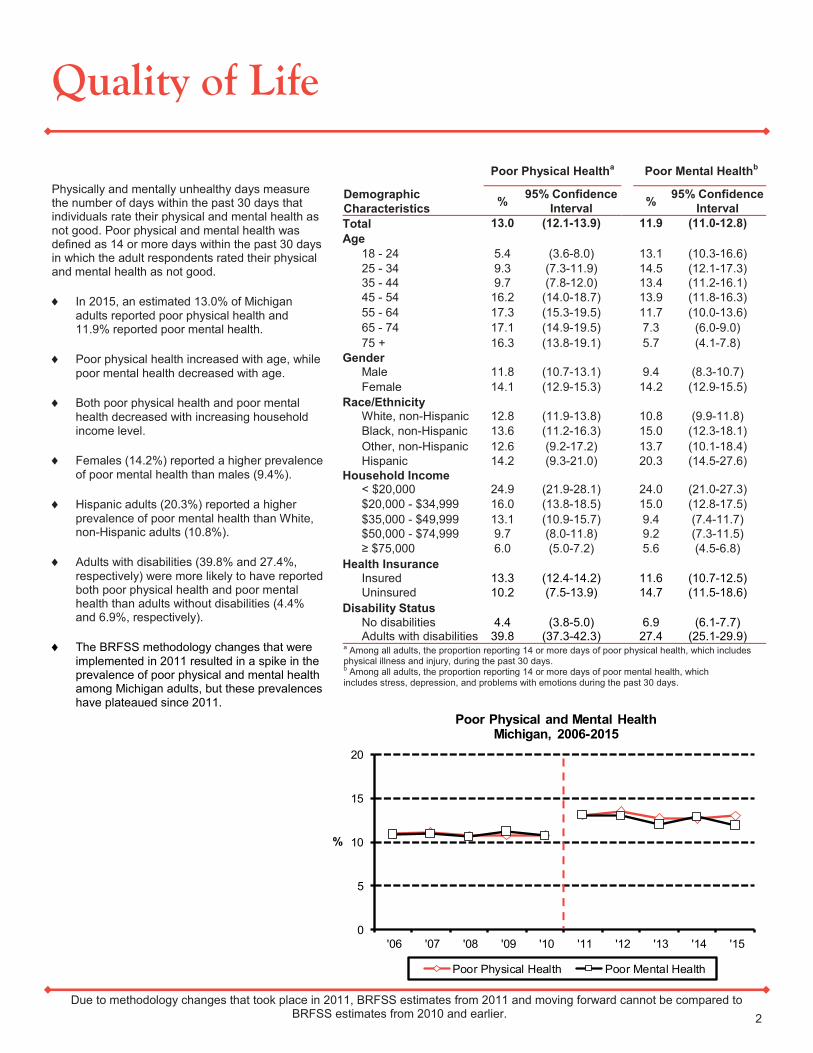
Total 13.0 (12.1-13.9) 11.9 (11.0-12.8)
Age
18 - 24 5.4 (3.6-8.0) 13.1 (10.3-16.6)
25 - 34 9.3 (7.3-11.9) 14.5 (12.1-17.3)
35 - 44 9.7 (7.8-12.0) 13.4 (11.2-16.1)
45 - 54 16.2 (14.0-18.7) 13.9 (11.8-16.3)
55 - 64 17.3 (15.3-19.5) 11.7 (10.0-13.6)
65 - 74 17.1 (14.9-19.5) 7.3 (6.0-9.0)
75 + 16.3 (13.8-19.1) 5.7 (4.1-7.8)
Gender
Male 11.8 (10.7-13.1) 9.4 (8.3-10.7)
Female 14.1 (12.9-15.3) 14.2 (12.9-15.5)
Race/Ethnicity
White, non-Hispanic 12.8 (11.9-13.8) 10.8 (9.9-11.8)
Black, non-Hispanic 13.6 (11.2-16.3) 15.0 (12.3-18.1)
Other, non-Hispanic 12.6 (9.2-17.2) 13.7 (10.1-18.4)
Hispanic 14.2 (9.3-21.0) 20.3 (14.5-27.6)
Household Income
< $20,000 24.9 (21.9-28.1) 24.0 (21.0-27.3)
$20,000 - $34,999 16.0 (13.8-18.5) 15.0 (12.8-17.5)
$35,000 - $49,999 13.1 (10.9-15.7) 9.4 (7.4-11.7)
$50,000 - $74,999 9.7 (8.0-11.8) 9.2 (7.3-11.5)
≥ $75,000 6.0 (5.0-7.2) 5.6 (4.5-6.8)
Health Insurance
Insured 13.3 (12.4-14.2) 11.6 (10.7-12.5)
Uninsured 10.2 (7.5-13.9) 14.7 (11.5-18.6)
Disability Status
No disabilities 4.4 (3.8-5.0) 6.9 (6.1-7.7) Adults with disabilities 39.8 (37.3-42.3) 27.4 (25.1-29.9)
a Among all adults, the proportion reporting 14 or more days of poor physical health, which includes physical illness and injury, during the past 30 days. b Among all adults, the proportion reporting 14 or more days of poor mental health, which includes stress, depression, and problems with emotions during the past 30 days.
Physically and mentally unhealthy days measure the number of days within the past 30 days that individuals rate their physical and mental health as not good. Poor physical and mental health was defined as 14 or more days within the past 30 days in which the adult respondents rated their physical and mental health as not good.
In 2015, an estimated 13.0% of Michigan
adults reported poor physical health and 11.9% reported poor mental health.
Poor physical health increased with age, while
poor mental health decreased with age.
Both poor physical health and poor mental
health decreased with increasing household income level.
Females (14.2%) reported a higher prevalence
of poor mental health than males (9.4%).
Hispanic adults (20.3%) reported a higher
prevalence of poor mental health than White, non-Hispanic adults (10.8%).
Adults with disabilities (39.8% and 27.4%,
respectively) were more likely to have reported both poor physical health and poor mental health than adults without disabilities (4.4% and 6.9%, respectively).
The BRFSS methodology changes that were
implemented in 2011 resulted in a spike in the prevalence of poor physical and mental health among Michigan adults, but these prevalences have plateaued since 2011.
2
Disability
Due to methodology changes that took place in 2011, BRFSS estimates from 2011 and moving forward cannot be compared to BRFSS estimates from 2010 and earlier.
Demographic
Characteristics
Total Disabilitya
% 95% Confidence
Interval
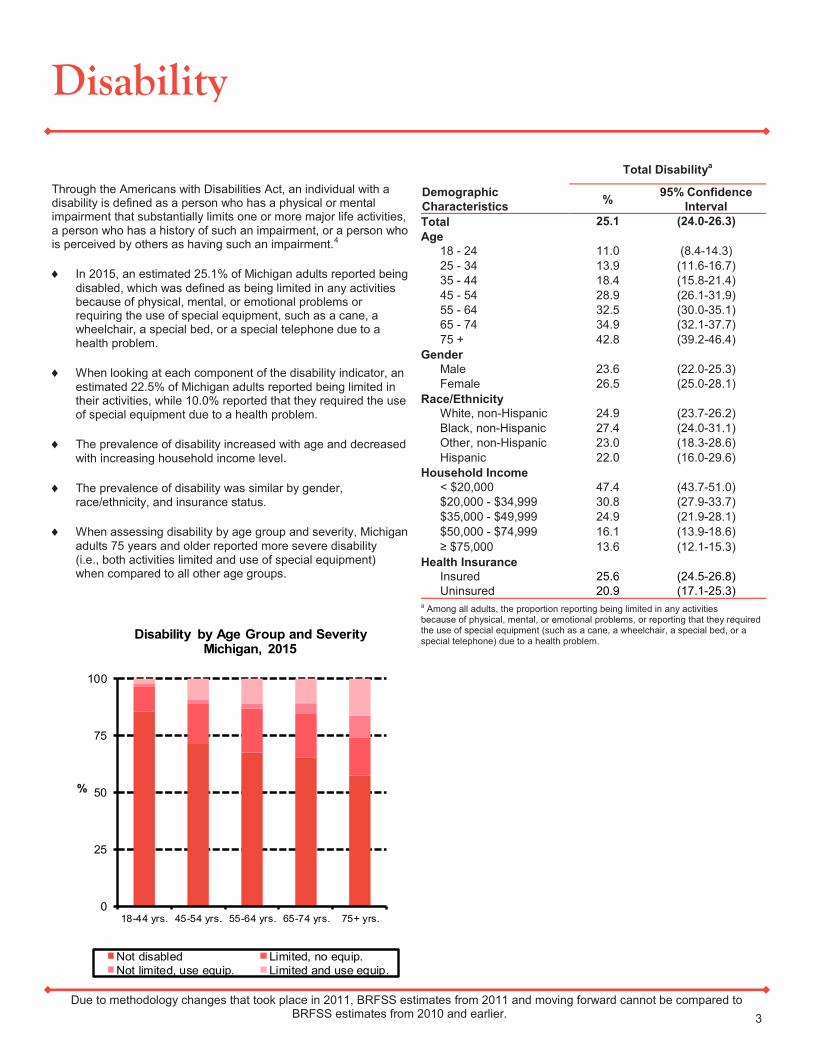
Total 25.1 (24.0-26.3)
Age
18 - 24 11.0 (8.4-14.3)
25 - 34 13.9 (11.6-16.7)
35 - 44 18.4 (15.8-21.4)
45 - 54 28.9 (26.1-31.9)
55 - 64 32.5 (30.0-35.1)
65 - 74 34.9 (32.1-37.7)
75 + 42.8 (39.2-46.4)
Gender
Male 23.6 (22.0-25.3)
Female 26.5 (25.0-28.1)
Race/Ethnicity
White, non-Hispanic 24.9 (23.7-26.2)
Black, non-Hispanic 27.4 (24.0-31.1)
Other, non-Hispanic 23.0 (18.3-28.6)
Hispanic 22.0 (16.0-29.6)
Household Income
< $20,000 47.4 (43.7-51.0)
$20,000 - $34,999 30.8 (27.9-33.7)
$35,000 - $49,999 24.9 (21.9-28.1)
$50,000 - $74,999 16.1 (13.9-18.6)
≥ $75,000 13.6 (12.1-15.3)
Health Insurance
Insured 25.6 (24.5-26.8)
Uninsured 20.9 (17.1-25.3) a Among all adults, the proportion reporting being limited in any activities because of physical, mental, or emotional problems, or reporting that they required the use of special equipment (such as a cane, a wheelchair, a special bed, or a special telephone) due to a health problem.
Through the Americans with Disabilities Act, an individual with a disability is defined as a person who has a physical or mental impairment that substantially limits one or more major life activities, a person who has a history of such an impairment, or a person who is perceived by others as having such an impairment.4
In 2015, an estimated 25.1% of Michigan adults reported being
disabled, which was defined as being limited in any activities because of physical, mental, or emotional problems or requiring the use of special equipment, such as a cane, a wheelchair, a special bed, or a special telephone due to a health problem.
When looking at each component of the disability indicator, an
estimated 22.5% of Michigan adults reported being limited in their activities, while 10.0% reported that they required the use of special equipment due to a health problem.
The prevalence of disability increased with age and decreased
with increasing household income level.
The prevalence of disability was similar by gender,
race/ethnicity, and insurance status.
When assessing disability by age group and severity, Michigan
adults 75 years and older reported more severe disability (i.e., both activities limited and use of special equipment) when compared to all other age groups.
3
0
25
50
75
100
18-44 yrs. 45-54 yrs. 55-64 yrs. 65-74 yrs. 75+ yrs.
%
Disability by Age Group and SeverityMichigan, 2015
Not disabled Limited, no equip.
Not limited, use equip. Limited and use equip.
0
10
20
30
40
50
'06 '07 '08 '09 '10 '11 '12 '13 '14 '15
%
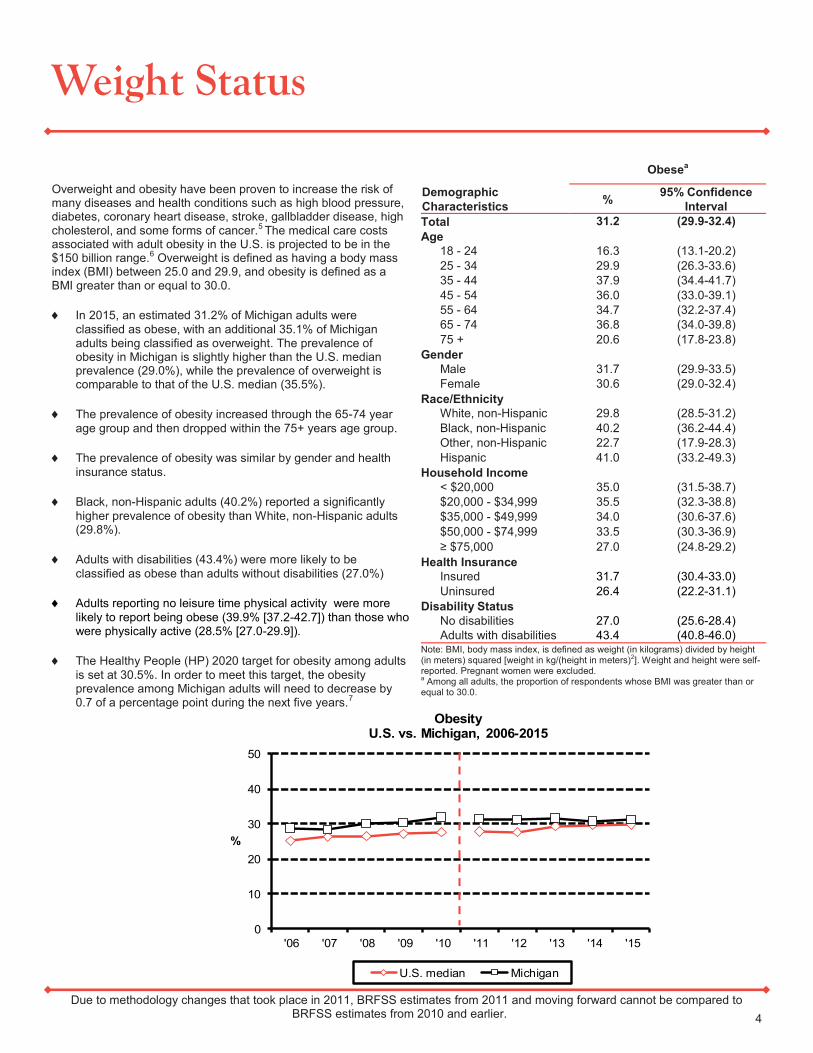
ObesityU.S. vs. Michigan, 2006-2015
U.S. median Michigan
Weight Status
Due to methodology changes that took place in 2011, BRFSS estimates from 2011 and moving forward cannot be compared to BRFSS estimates from 2010 and earlier.
Demographic
Characteristics
Obesea
% 95% Confidence
Interval
Total 31.2 (29.9-32.4)
Age
18 - 24 16.3 (13.1-20.2)
25 - 34 29.9 (26.3-33.6)
35 - 44 37.9 (34.4-41.7)
45 - 54 36.0 (33.0-39.1)
55 - 64 34.7 (32.2-37.4)
65 - 74 36.8 (34.0-39.8)
75 + 20.6 (17.8-23.8)
Gender
Male 31.7 (29.9-33.5)
Female 30.6 (29.0-32.4)
Race/Ethnicity
White, non-Hispanic 29.8 (28.5-31.2)
Black, non-Hispanic 40.2 (36.2-44.4)
Other, non-Hispanic 22.7 (17.9-28.3)
Hispanic 41.0 (33.2-49.3)
Household Income
< $20,000 35.0 (31.5-38.7)
$20,000 - $34,999 35.5 (32.3-38.8)
$35,000 - $49,999 34.0 (30.6-37.6)
$50,000 - $74,999 33.5 (30.3-36.9)
≥ $75,000 27.0 (24.8-29.2)
Health Insurance
Insured 31.7 (30.4-33.0)
Uninsured 26.4 (22.2-31.1)
Disability Status
No disabilities 27.0 (25.6-28.4)
Adults with disabilities 43.4 (40.8-46.0) Note: BMI, body mass index, is defined as weight (in kilograms) divided by height (in meters) squared [weight in kg/(height in meters)2]. Weight and height were self-reported. Pregnant women were excluded. a Among all adults, the proportion of respondents whose BMI was greater than or equal to 30.0.
Overweight and obesity have been proven to increase the risk of many diseases and health conditions such as high blood pressure, diabetes, coronary heart disease, stroke, gallbladder disease, high cholesterol, and some forms of cancer.5 The medical care costs associated with adult obesity in the U.S. is projected to be in the $150 billion range.6 Overweight is defined as having a body mass index (BMI) between 25.0 and 29.9, and obesity is defined as a BMI greater than or equal to 30.0.
In 2015, an estimated 31.2% of Michigan adults were
classified as obese, with an additional 35.1% of Michigan adults being classified as overweight. The prevalence of obesity in Michigan is slightly higher than the U.S. median prevalence (29.0%), while the prevalence of overweight is comparable to that of the U.S. median (35.5%).
The prevalence of obesity increased through the 65-74 year
age group and then dropped within the 75+ years age group.
The prevalence of obesity was similar by gender and health
insurance status.
Black, non-Hispanic adults (40.2%) reported a significantly
higher prevalence of obesity than White, non-Hispanic adults (29.8%).
Adults with disabilities (43.4%) were more likely to be
classified as obese than adults without disabilities (27.0%)
Adults reporting no leisure time physical activity were more
likely to report being obese (39.9% [37.2-42.7]) than those who were physically active (28.5% [27.0-29.9]).
The Healthy People (HP) 2020 target for obesity among adults
is set at 30.5%. In order to meet this target, the obesity prevalence among Michigan adults will need to decrease by 0.7 of a percentage point during the next five years.7
4
0
5
10
15
20
25
'06 '07 '08 '09 '10 '11 '12 '13 '14 '15
%
No Health Care CoverageAmong Adults Aged 18 to 64 Years
U.S. vs. Michigan, 2006-2015
U.S. median Michigan
Due to methodology changes that took place in 2011, BRFSS estimates from 2011 and moving forward cannot be compared to BRFSS estimates from 2010 and earlier.
Demographic
Characteristics
No Health Care Coverage Among Adults 18-64 Yearsa
% 95% Confidence
Interval
Total 12.0 (10.9-13.1)
Age
18 - 24 14.5 (11.4-18.3)
25 - 34 16.0 (13.3-19.1)
35 - 44 12.7 (10.3-15.6)
45 - 54 11.0 (9.1-13.4)
55 - 64 6.8 (5.5-8.3)
Gender
Male 14.2 (12.6-16.0)
Female 9.7 (8.4-11.3)
Race/Ethnicity
White, non-Hispanic 10.9 (9.7-12.2)
Black, non-Hispanic 12.5 (9.8-15.8)
Other, non-Hispanic 14.2 (9.9-19.8)
Hispanic 20.7 (14.4-28.8)
Household Income
< $20,000 17.1 (14.0-20.8)
$20,000 - $34,999 17.1 (14.1-20.7)
$35,000 - $49,999 11.6 (8.9-14.9)
$50,000 - $74,999 11.5 (8.9-14.7)
≥ $75,000 5.1 (3.9-6.7)
Disability Status
No disabilities 12.2 (11.0-13.5)
Adults with disabilities 10.6 (8.4-13.2) a Among adults aged 18-64 years, the proportion who reported having no health care coverage, including health insurance, prepaid plans such as HMOs, or government plans, such as Medicare or Indian Health Services.
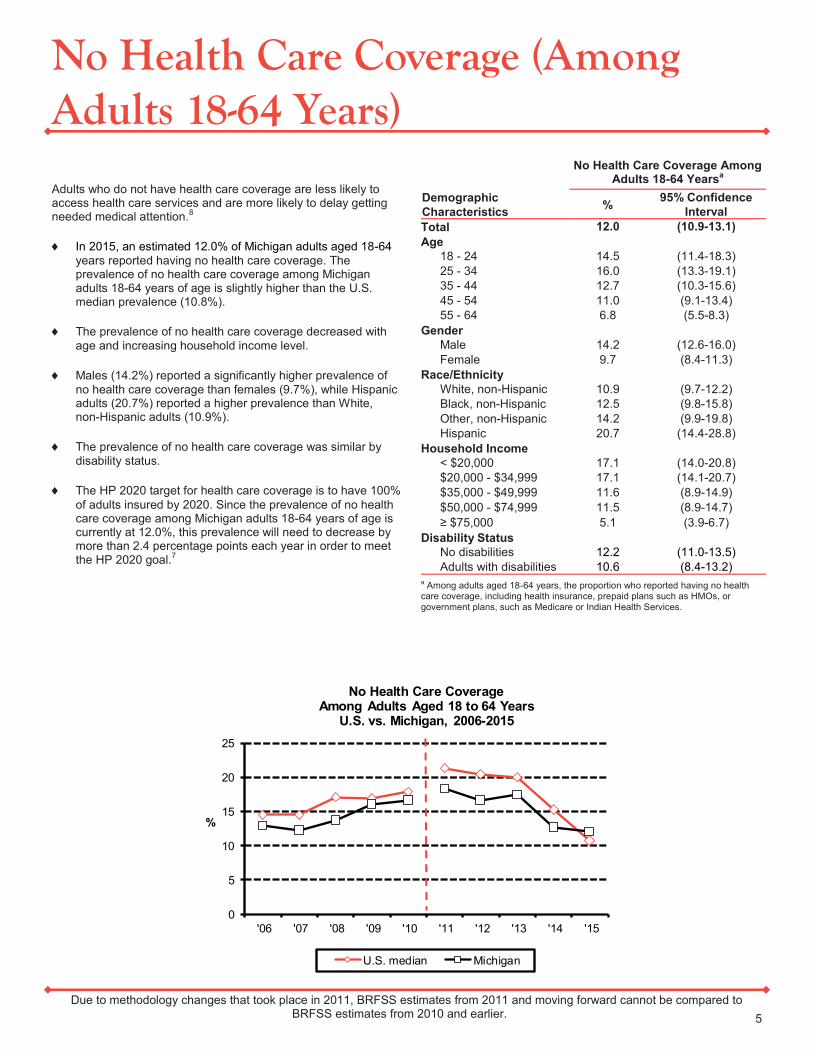
Adults who do not have health care coverage are less likely to access health care services and are more likely to delay getting needed medical attention.8
In 2015, an estimated 12.0% of Michigan adults aged 18-64
years reported having no health care coverage. The prevalence of no health care coverage among Michigan adults 18-64 years of age is slightly higher than the U.S. median prevalence (10.8%).
The prevalence of no health care coverage decreased with
age and increasing household income level.
Males (14.2%) reported a significantly higher prevalence of
no health care coverage than females (9.7%), while Hispanic adults (20.7%) reported a higher prevalence than White, non-Hispanic adults (10.9%).
The prevalence of no health care coverage was similar by
disability status.
The HP 2020 target for health care coverage is to have 100%
of adults insured by 2020. Since the prevalence of no health care coverage among Michigan adults 18-64 years of age is currently at 12.0%, this prevalence will need to decrease by more than 2.4 percentage points each year in order to meet the HP 2020 goal.7
5
No Health Care Coverage (Among Adults 18-64 Years)
Due to methodology changes that took place in 2011, BRFSS estimates from 2011 and moving forward cannot be compared to BRFSS estimates from 2010 and earlier.
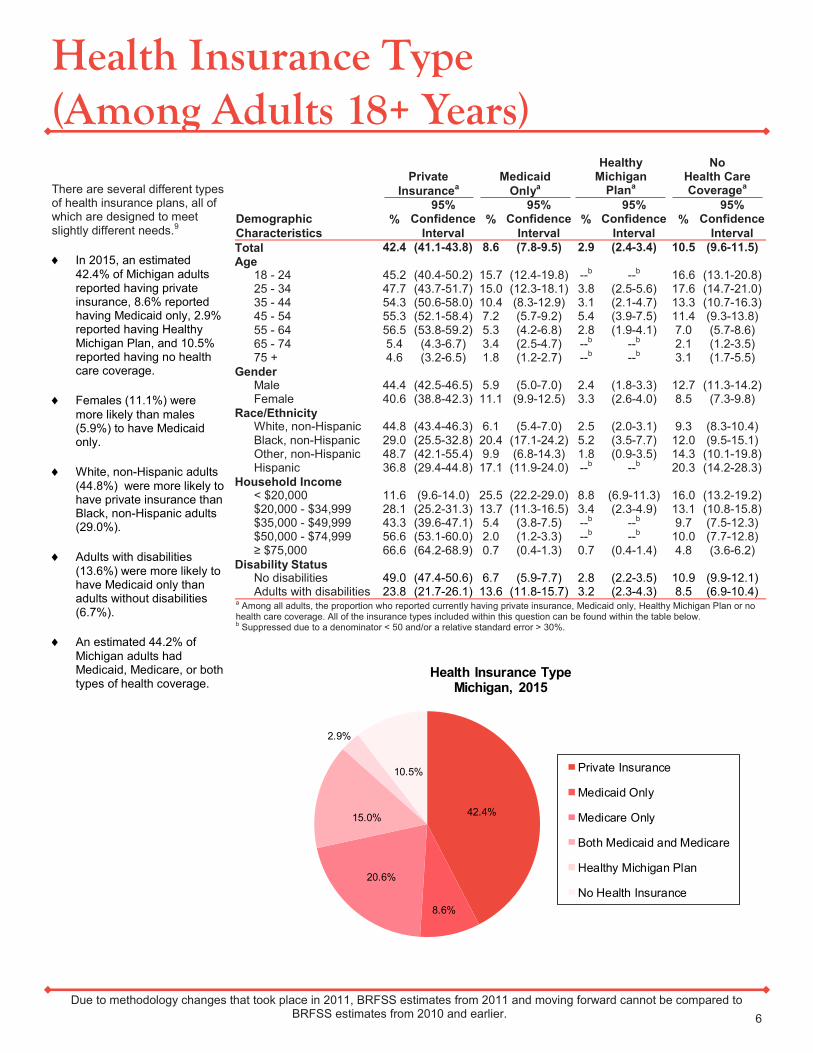
There are several different types of health insurance plans, all of which are designed to meet slightly different needs.9
In 2015, an estimated
42.4% of Michigan adults reported having private insurance, 8.6% reported having Medicaid only, 2.9% reported having Healthy Michigan Plan, and 10.5% reported having no health care coverage.
Females (11.1%) were
more likely than males (5.9%) to have Medicaid only.
White, non-Hispanic adults
(44.8%) were more likely to have private insurance than Black, non-Hispanic adults (29.0%).
Adults with disabilities
(13.6%) were more likely to have Medicaid only than adults without disabilities (6.7%).
An estimated 44.2% of
Michigan adults had Medicaid, Medicare, or both types of health coverage.
6
Health Insurance Type (Among Adults 18+ Years)
Demographic
Characteristics
Private
Insurancea Medicaid
Onlya
Healthy Michigan
Plana
No Health Care Coveragea
%
95% Confidence
Interval %
95% Confidence
Interval %
95% Confidence
Interval %
95% Confidence
Interval
Total 42.4 (41.1-43.8) 8.6 (7.8-9.5) 2.9 (2.4-3.4) 10.5 (9.6-11.5)
Age 18 - 24 45.2 (40.4-50.2) 15.7 (12.4-19.8) --b --b 16.6 (13.1-20.8) 25 - 34 47.7 (43.7-51.7) 15.0 (12.3-18.1) 3.8 (2.5-5.6) 17.6 (14.7-21.0) 35 - 44 54.3 (50.6-58.0) 10.4 (8.3-12.9) 3.1 (2.1-4.7) 13.3 (10.7-16.3) 45 - 54 55.3 (52.1-58.4) 7.2 (5.7-9.2) 5.4 (3.9-7.5) 11.4 (9.3-13.8) 55 - 64 56.5 (53.8-59.2) 5.3 (4.2-6.8) 2.8 (1.9-4.1) 7.0 (5.7-8.6) 65 - 74 5.4 (4.3-6.7) 3.4 (2.5-4.7) --b --b 2.1 (1.2-3.5) 75 + 4.6 (3.2-6.5) 1.8 (1.2-2.7) --b --b 3.1 (1.7-5.5)
Gender Male 44.4 (42.5-46.5) 5.9 (5.0-7.0) 2.4 (1.8-3.3) 12.7 (11.3-14.2) Female 40.6 (38.8-42.3) 11.1 (9.9-12.5) 3.3 (2.6-4.0) 8.5 (7.3-9.8)
Race/Ethnicity White, non-Hispanic 44.8 (43.4-46.3) 6.1 (5.4-7.0) 2.5 (2.0-3.1) 9.3 (8.3-10.4) Black, non-Hispanic 29.0 (25.5-32.8) 20.4 (17.1-24.2) 5.2 (3.5-7.7) 12.0 (9.5-15.1) Other, non-Hispanic 48.7 (42.1-55.4) 9.9 (6.8-14.3) 1.8 (0.9-3.5) 14.3 (10.1-19.8) Hispanic 36.8 (29.4-44.8) 17.1 (11.9-24.0) --b --b 20.3 (14.2-28.3)
Household Income < $20,000 11.6 (9.6-14.0) 25.5 (22.2-29.0) 8.8 (6.9-11.3) 16.0 (13.2-19.2) $20,000 - $34,999 28.1 (25.2-31.3) 13.7 (11.3-16.5) 3.4 (2.3-4.9) 13.1 (10.8-15.8) $35,000 - $49,999 43.3 (39.6-47.1) 5.4 (3.8-7.5) --b --b 9.7 (7.5-12.3) $50,000 - $74,999 56.6 (53.1-60.0) 2.0 (1.2-3.3) --b --b 10.0 (7.7-12.8) ≥ $75,000 66.6 (64.2-68.9) 0.7 (0.4-1.3) 0.7 (0.4-1.4) 4.8 (3.6-6.2)
Disability Status No disabilities 49.0 (47.4-50.6) 6.7 (5.9-7.7) 2.8 (2.2-3.5) 10.9 (9.9-12.1) Adults with disabilities 23.8 (21.7-26.1) 13.6 (11.8-15.7) 3.2 (2.3-4.3) 8.5 (6.9-10.4)
a Among all adults, the proportion who reported currently having private insurance, Medicaid only, Healthy Michigan Plan or no health care coverage. All of the insurance types included within this question can be found within the table below. b Suppressed due to a denominator < 50 and/or a relative standard error > 30%.
42.4%
8.6%
20.6%
15.0%
2.9%
10.5%
Health Insurance TypeMichigan, 2015
Private Insurance
Medicaid Only
Medicare Only
Both Medicaid and Medicare
Healthy Michigan Plan
No Health Insurance

Limited Health Care Coverage
Due to methodology changes that took place in 2011, BRFSS estimates from 2011 and moving forward cannot be compared to BRFSS estimates from 2010 and earlier.
Demographic
Characteristics
No Personal Health
Care Providera No Health Care
Access Due to Costb
% 95% Confidence
Interval %
95% Confidence
Interval
Total 14.8 (13.8-15.8) 12.7 (11.8-13.7)
Age
18 - 24 28.1 (24.3-32.3) 12.7 (9.9-16.1)
25 - 34 28.3 (24.9-31.9) 17.2 (14.4-20.3)
35 - 44 16.9 (14.1-20.0) 17.3 (14.5-20.4)
45 - 54 11.4 (9.5-13.6) 15.0 (12.9-17.5)
55 - 64 7.2 (6.0-8.8) 11.0 (9.3-12.9)
65 - 74 5.0 (3.8-6.6) 6.2 (4.9-7.8)
75 + 3.6 (2.4-5.3) 5.0 (3.6-6.9)
Gender
Male 20.2 (18.6-21.9) 12.1 (10.8-13.5)
Female 9.7 (8.6-10.9) 13.3 (12.0-14.7)
Race/Ethnicity
White, non-Hispanic 13.3 (12.3-14.4) 11.3 (10.3-12.3)
Black, non-Hispanic 18.1 (15.0-21.7) 16.6 (13.8-19.8)
Other, non-Hispanic 22.5 (17.6-28.2) 14.1 (9.9-19.7)
Hispanic 21.5 (15.2-29.6) 22.8 (16.7-30.3)
Household Income
< $20,000 20.2 (17.2-23.5) 23.5 (20.5-26.8)
$20,000 - $34,999 19.1 (16.4-22.1) 18.5 (16.0-21.4)
$35,000 - $49,999 12.2 (9.8-15.0) 12.2 (9.9-14.8)
$50,000 - $74,999 13.3 (10.9-16.2) 8.7 (6.9-11.0)
≥ $75,000 10.5 (8.9-12.3) 4.7 (3.6-6.0)
Health Insurance
Insured 11.7 (10.7-12.7) 10.7 (9.9-11.7)
Uninsured 41.9 (37.1-46.8) 30.0 (25.7-34.6)
Disability Status
No disabilities 16.7 (15.5-18.0) 10.0 (9.0-11.1) Adults with disabilities 8.6 (7.1-10.4) 20.8 (18.6-23.1)
a Among all adults, the proportion reporting that they did not have anyone that they thought of as their personal doctor or health care provider b Among all adults, the proportion reporting that in the past 12 months, they could not see a doctor when they needed to due to the cost.
Two additional indicators related to health care access are: 1) not having a personal doctor or health care provider and 2) having had a time during the past 12 months when an individual needed to see a doctor but could not because of the cost. Increases in access to primary care have been shown to substantially improve health-related outcomes.10
In 2015, an estimated 14.8% of Michigan adults
reported not having a personal health care provider, while 12.7% reported not seeing the doctor within the past 12 months due to cost.
The prevalences of both of these indicators
decreased with age and increasing household income level.
Males (20.2%) were more likely than females
(9.7%) to not have a personal health care provider.
Both Black, non-Hispanic (18.1% and 16.6%,
respectively) and Hispanic adults (21.5% and 22.8%, respectively) were more likely than White, non-Hispanic adults (13.3% and 11.3%, respectively) not to have a personal health care provider and not to have seen a doctor within the past 12 months due to cost.
Uninsured adults (41.9% and 30.0%,
respectively) were more likely not to have a personal health care provider and not to have seen a doctor within the past 12 months due to cost when compared to insured adults (11.7% and 10.7%, respectively).
7
0
5
10
15
20
25
No Personal Health Care Provider No Health Care Due to Cost
%
Health Care Access Indicators by GenderMichigan, 2015
Male
Female
Social Context
Due to methodology changes that took place in 2011, BRFSS estimates from 2011 and moving forward cannot be compared to BRFSS estimates from 2010 and earlier.
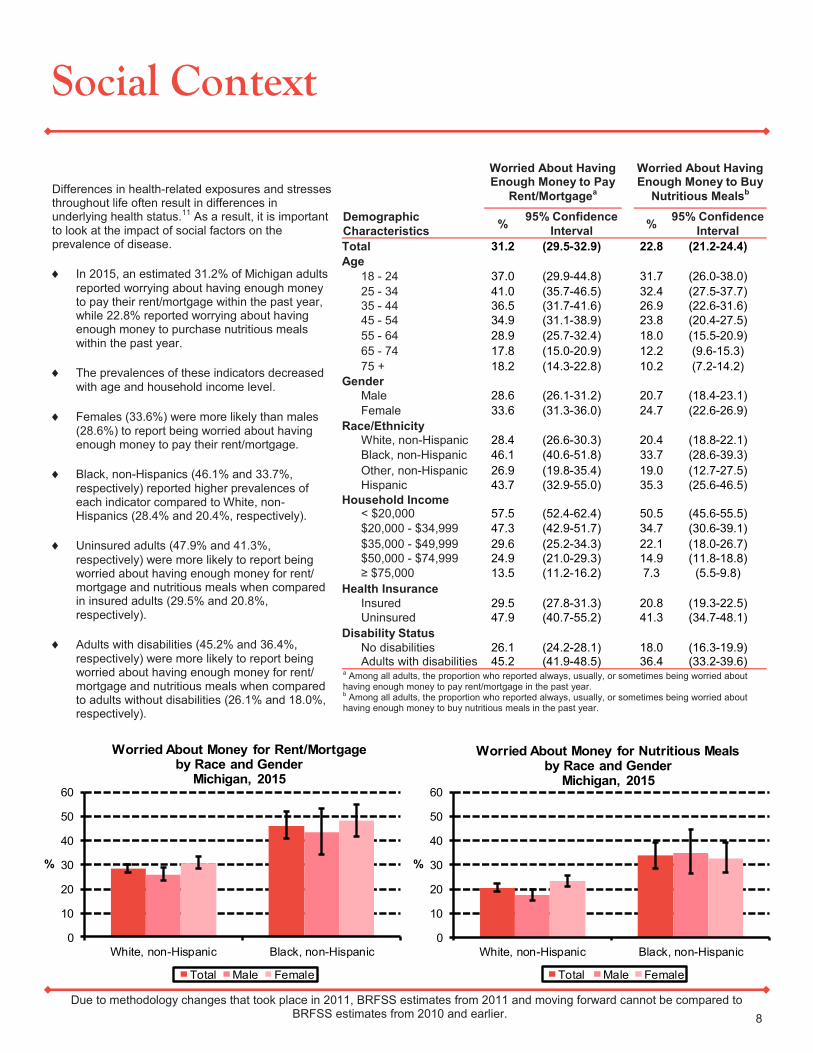
Differences in health-related exposures and stresses throughout life often result in differences in underlying health status.11 As a result, it is important to look at the impact of social factors on the prevalence of disease.
In 2015, an estimated 31.2% of Michigan adults
reported worrying about having enough money to pay their rent/mortgage within the past year, while 22.8% reported worrying about having enough money to purchase nutritious meals within the past year.
The prevalences of these indicators decreased
with age and household income level.
Females (33.6%) were more likely than males
(28.6%) to report being worried about having enough money to pay their rent/mortgage.
Black, non-Hispanics (46.1% and 33.7%,
respectively) reported higher prevalences of each indicator compared to White, non-Hispanics (28.4% and 20.4%, respectively).
Uninsured adults (47.9% and 41.3%,
respectively) were more likely to report being worried about having enough money for rent/mortgage and nutritious meals when compared in insured adults (29.5% and 20.8%, respectively).
Adults with disabilities (45.2% and 36.4%,
respectively) were more likely to report being worried about having enough money for rent/mortgage and nutritious meals when compared to adults without disabilities (26.1% and 18.0%, respectively).
8
Demographic
Characteristics
Worried About Having Enough Money to Pay
Rent/Mortgagea
Worried About Having Enough Money to Buy
Nutritious Mealsb
% 95% Confidence
Interval %
95% Confidence
Interval
Total 31.2 (29.5-32.9) 22.8 (21.2-24.4)
Age
18 - 24 37.0 (29.9-44.8) 31.7 (26.0-38.0)
25 - 34 41.0 (35.7-46.5) 32.4 (27.5-37.7)
35 - 44 36.5 (31.7-41.6) 26.9 (22.6-31.6)
45 - 54 34.9 (31.1-38.9) 23.8 (20.4-27.5)
55 - 64 28.9 (25.7-32.4) 18.0 (15.5-20.9)
65 - 74 17.8 (15.0-20.9) 12.2 (9.6-15.3)
75 + 18.2 (14.3-22.8) 10.2 (7.2-14.2)
Gender
Male 28.6 (26.1-31.2) 20.7 (18.4-23.1)
Female 33.6 (31.3-36.0) 24.7 (22.6-26.9)
Race/Ethnicity
White, non-Hispanic 28.4 (26.6-30.3) 20.4 (18.8-22.1)
Black, non-Hispanic 46.1 (40.6-51.8) 33.7 (28.6-39.3)
Other, non-Hispanic 26.9 (19.8-35.4) 19.0 (12.7-27.5)
Hispanic 43.7 (32.9-55.0) 35.3 (25.6-46.5)
Household Income
< $20,000 57.5 (52.4-62.4) 50.5 (45.6-55.5)
$20,000 - $34,999 47.3 (42.9-51.7) 34.7 (30.6-39.1)
$35,000 - $49,999 29.6 (25.2-34.3) 22.1 (18.0-26.7)
$50,000 - $74,999 24.9 (21.0-29.3) 14.9 (11.8-18.8)
≥ $75,000 13.5 (11.2-16.2) 7.3 (5.5-9.8)
Health Insurance
Insured 29.5 (27.8-31.3) 20.8 (19.3-22.5)
Uninsured 47.9 (40.7-55.2) 41.3 (34.7-48.1)
Disability Status
No disabilities 26.1 (24.2-28.1) 18.0 (16.3-19.9) Adults with disabilities 45.2 (41.9-48.5) 36.4 (33.2-39.6)
a Among all adults, the proportion who reported always, usually, or sometimes being worried about having enough money to pay rent/mortgage in the past year. b Among all adults, the proportion who reported always, usually, or sometimes being worried about having enough money to buy nutritious meals in the past year.
0
10
20
30
40
50
60
White, non-Hispanic Black, non-Hispanic
%
Worried About Money for Rent/Mortgageby Race and Gender
Michigan, 2015
Total Male Female
0
10
20
30
40
50
60
White, non-Hispanic Black, non-Hispanic
%
Worried About Money for Nutritious Mealsby Race and Gender
Michigan, 2015
Total Male Female
0
10
20
30
40
'06 '07 '08 '09 '10 '11 '12 '13 '14 '15
%
No Leisure Time Physical ActivityU.S. vs. Michigan, 2006-2015
U.S. median Michigan
No Leisure Time Physical Activity
Due to methodology changes that took place in 2011, BRFSS estimates from 2011 and moving forward cannot be compared to BRFSS estimates from 2010 and earlier.
Demographic
Characteristics
No Leisure Time Physical Activitya
% 95% Confidence
Interval
Total 25.5 (24.3-26.7)
Age
18 - 24 17.7 (14.2-21.9)
25 - 34 25.3 (21.9-29.0)
35 - 44 21.9 (18.8-25.3)
45 - 54 27.8 (24.9-30.8)
55 - 64 26.1 (23.7-28.7)
65 - 74 26.3 (23.8-29.0)
75 + 36.4 (32.8-40.1)
Gender
Male 23.7 (21.9-25.5)
Female 27.2 (25.6-28.9)
Race/Ethnicity
White, non-Hispanic 24.2 (23.0-25.6)
Black, non-Hispanic 30.2 (26.5-34.1)
Other, non-Hispanic 25.7 (19.7-32.7)
Hispanic 33.2 (25.9-41.6)
Household Income
< $20,000 33.6 (30.1-37.4)
$20,000 - $34,999 34.0 (30.9-37.3)
$35,000 - $49,999 25.6 (22.5-29.1)
$50,000 - $74,999 21.7 (19.0-24.8)
≥ $75,000 16.6 (14.7-18.6)
Health Insurance
Insured 25.4 (24.2-26.7)
Uninsured 26.2 (21.9-31.1)
Disability Status
No disabilities 21.4 (20.0-22.8)
Adults with disabilities 37.5 (35.0-40.0) a Among all adults, the proportion reporting they had not participated in any leisure time physical activities or exercises such as running, calisthenics, golf, gardening, or walking for exercise during the past month.
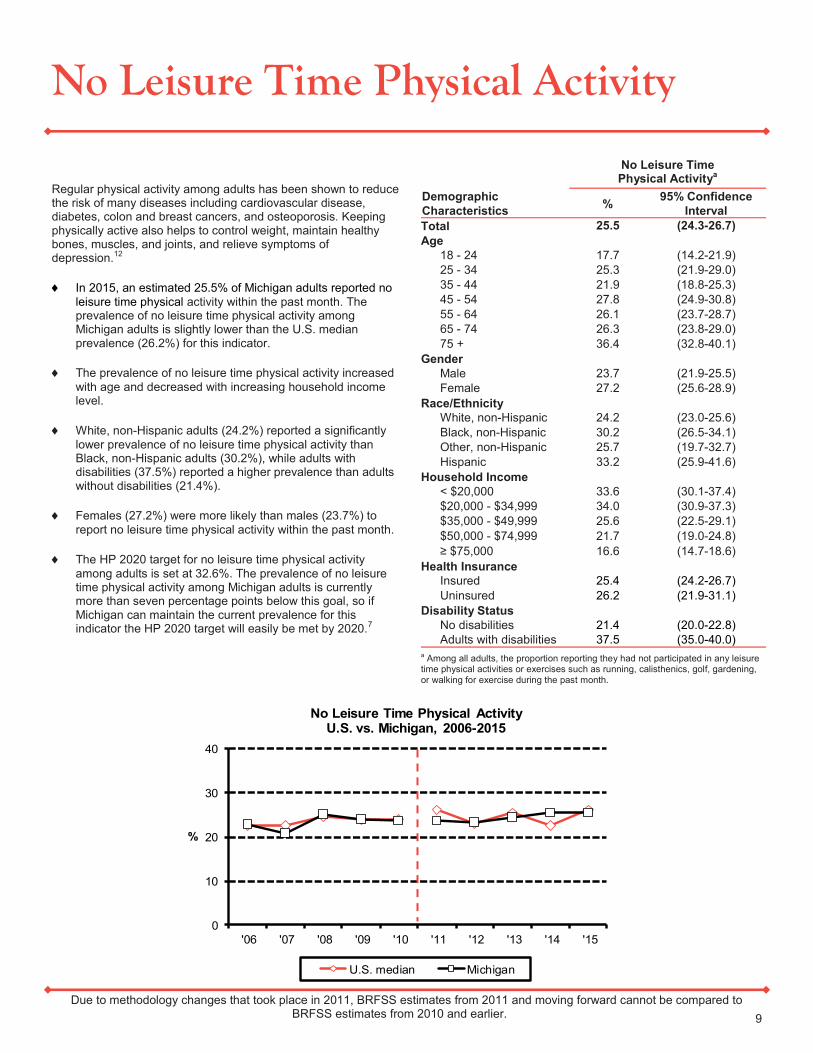
Regular physical activity among adults has been shown to reduce the risk of many diseases including cardiovascular disease, diabetes, colon and breast cancers, and osteoporosis. Keeping physically active also helps to control weight, maintain healthy bones, muscles, and joints, and relieve symptoms of depression.12
In 2015, an estimated 25.5% of Michigan adults reported no
leisure time physical activity within the past month. The prevalence of no leisure time physical activity among Michigan adults is slightly lower than the U.S. median prevalence (26.2%) for this indicator.
The prevalence of no leisure time physical activity increased
with age and decreased with increasing household income level.
White, non-Hispanic adults (24.2%) reported a significantly
lower prevalence of no leisure time physical activity than Black, non-Hispanic adults (30.2%), while adults with disabilities (37.5%) reported a higher prevalence than adults without disabilities (21.4%).
Females (27.2%) were more likely than males (23.7%) to
report no leisure time physical activity within the past month.
The HP 2020 target for no leisure time physical activity
among adults is set at 32.6%. The prevalence of no leisure time physical activity among Michigan adults is currently more than seven percentage points below this goal, so if Michigan can maintain the current prevalence for this indicator the HP 2020 target will easily be met by 2020.7
9
Adequate Physical Activity
Due to methodology changes that took place in 2011, BRFSS estimates from 2011 and moving forward cannot be compared to BRFSS estimates from 2010 and earlier.
Demographic
Characteristics
Adequate Physical Activitya
% 95% Confidence
Interval
Total 19.5 (18.5-20.7)
Age
18 - 24 27.8 (23.7-32.3)
25 - 34 23.4 (20.2-27.0)
35 - 44 18.6 (15.8-21.7)
45 - 54 15.7 (13.6-18.0)
55 - 64 19.1 (17.0-21.2)
65 - 74 17.0 (14.9-19.4)
75 + 14.9 (12.4-17.7)
Gender
Male 21.0 (19.4-22.8)
Female 18.1 (16.8-19.6)
Race/Ethnicity
White, non-Hispanic 19.3 (18.1-20.5)
Black, non-Hispanic 21.2 (17.8-25.1)
Other, non-Hispanic 20.8 (16.0-26.6)
Hispanic 18.8 (13.2-26.0)
Household Income
< $20,000 13.8 (11.3-16.6)
$20,000 - $34,999 17.0 (14.6-19.8)
$35,000 - $49,999 17.5 (14.8-20.7)
$50,000 - $74,999 21.6 (18.7-24.9)
≥ $75,000 24.0 (21.9-26.2)
Health Insurance
Insured 19.5 (18.4-20.6)
Uninsured 19.6 (15.7-24.2)
Disability Status
No disabilities 21.4 (20.1-22.8)
Adults with disabilities 13.7 (12.0-15.5) a Among all adults, the proportion reporting that they do either moderate physical activities for at least 150 minutes per week, vigorous physical activities for at least 75 minutes per week, or an equivalent combination of moderate and vigorous physical activities and also participate in muscle strengthening activities on two or
more days per week.
10
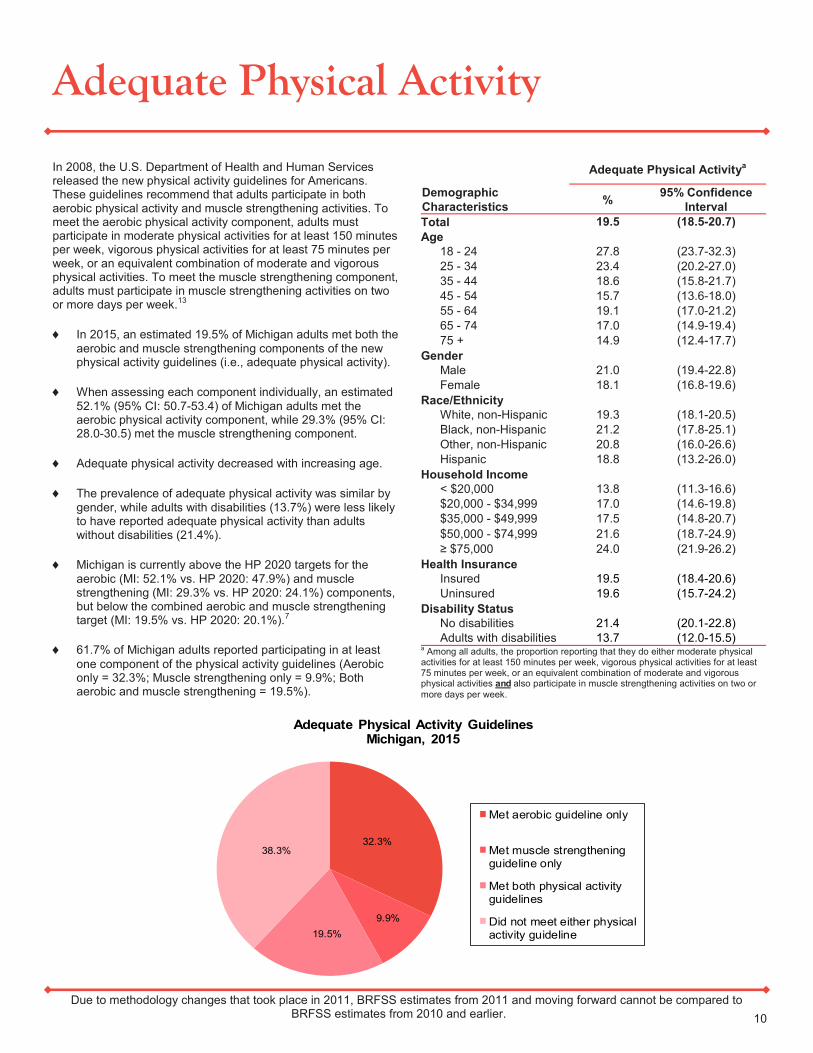
In 2008, the U.S. Department of Health and Human Services released the new physical activity guidelines for Americans. These guidelines recommend that adults participate in both aerobic physical activity and muscle strengthening activities. To meet the aerobic physical activity component, adults must participate in moderate physical activities for at least 150 minutes per week, vigorous physical activities for at least 75 minutes per week, or an equivalent combination of moderate and vigorous physical activities. To meet the muscle strengthening component, adults must participate in muscle strengthening activities on two or more days per week.13
In 2015, an estimated 19.5% of Michigan adults met both the
aerobic and muscle strengthening components of the new physical activity guidelines (i.e., adequate physical activity).
When assessing each component individually, an estimated
52.1% (95% CI: 50.7-53.4) of Michigan adults met the aerobic physical activity component, while 29.3% (95% CI: 28.0-30.5) met the muscle strengthening component.
Adequate physical activity decreased with increasing age.
The prevalence of adequate physical activity was similar by
gender, while adults with disabilities (13.7%) were less likely to have reported adequate physical activity than adults without disabilities (21.4%).
Michigan is currently above the HP 2020 targets for the
aerobic (MI: 52.1% vs. HP 2020: 47.9%) and muscle strengthening (MI: 29.3% vs. HP 2020: 24.1%) components, but below the combined aerobic and muscle strengthening target (MI: 19.5% vs. HP 2020: 20.1%).7
61.7% of Michigan adults reported participating in at least
one component of the physical activity guidelines (Aerobic only = 32.3%; Muscle strengthening only = 9.9%; Both aerobic and muscle strengthening = 19.5%).
32.3%
9.9%
19.5%
38.3%
Adequate Physical Activity GuidelinesMichigan, 2015
Met aerobic guideline only
Met muscle strengtheningguideline only
Met both physical activityguidelines
Did not meet either physicalactivity guideline

Fruit and Vegetable Consumption
Due to methodology changes that took place in 2011, BRFSS estimates from 2011 and moving forward cannot be compared to BRFSS estimates from 2010 and earlier. 11
A healthy diet rich in fruits and vegetables may reduce the risk of cancer and other chronic conditions.14 In 2011, the Centers for Disease Control and Prevention moved away from the 5 or more servings per day indicator and now uses the fruits less than one time per day and vegetables less than one time per day indicators.
In 2015, an estimated 39.7% of Michigan adults
reported consuming fruits less than one time per day, while 24.7% reported consuming vegetables less than one time per day.
Only 14.4% (95% CI: 13.5-15.3) of Michigan
adults reported consuming fruits and vegetables 5 or more times per day.
Both fruit and vegetable consumption improved
with increasing age and household income level, and males were more likely than females to eat fewer fruits and vegetables.
White, non-Hispanic and Black, non-Hispanic
adults reported similar prevalences of fruit consumption, while Black, non-Hispanic adults (35.1%) were more likely to eat vegetables less than once a day than White, non-Hispanic adults (22.9%).
White, non-Hispanic males were more likely to
report low fruit (44.8% vs. 33.3%) and vegetable (27.4% vs. 18.8%) consumption than were White, non-Hispanic females.
Black, non-Hispanic males and females
reported similar fruit and vegetable consumption patterns.
Demographic
Characteristics
Fruits
(< 1 Time / Day)a Vegetables
(< 1 Time / Day)b
% 95% Confidence
Interval %
95% Confidence
Interval
Total 39.7 (38.4-41.1) 24.7 (23.5-26.0)
Age
18 - 24 49.9 (45.1-54.6) 36.4 (31.9-41.1)
25 - 34 44.8 (40.8-48.8) 24.4 (21.1-28.1)
35 - 44 38.9 (35.2-42.6) 23.4 (20.3-26.8)
45 - 54 43.1 (40.0-46.3) 24.2 (21.5-27.2)
55 - 64 35.5 (32.9-38.1) 21.0 (18.8-23.3)
65 - 74 35.6 (32.8-38.5) 24.2 (21.7-26.9)
75 + 26.0 (22.7-29.7) 20.8 (17.6-24.5)
Gender
Male 45.4 (43.4-47.5) 28.8 (26.9-30.7)
Female 34.4 (32.6-36.2) 20.9 (19.4-22.5)
Race/Ethnicity
White, non-Hispanic 38.9 (37.4-40.4) 22.9 (21.7-24.3)
Black, non-Hispanic 43.6 (39.4-47.8) 35.1 (31.0-39.4)
Other, non-Hispanic 41.0 (34.5-47.9) 22.3 (17.2-28.4)
Hispanic 41.5 (33.6-49.9) 29.8 (22.7-38.2)
Household Income
< $20,000 47.7 (43.9-51.5) 32.7 (29.2-36.4)
$20,000 - $34,999 41.1 (37.8-44.5) 28.7 (25.7-31.8)
$35,000 - $49,999 37.3 (33.6-41.2) 23.4 (20.2-27.0)
$50,000 - $74,999 39.1 (35.7-42.7) 22.9 (20.0-26.2)
≥ $75,000 36.4 (34.0-38.9) 17.8 (15.8-20.0)
Health Insurance
Insured 39.0 (37.6-40.4) 24.1 (22.9-25.4)
Uninsured 46.8 (41.6-52.0) 30.6 (25.9-35.6)
Disability Status
No disabilities 38.9 (37.3-40.5) 24.4 (23.0-25.9) Adults with disabilities 42.2 (39.6-44.8) 25.7 (23.4-28.1)
a Among all adults, the proportion whose total reported consumption of fruits (including juice) was less than one time per day. b Among all adults, the proportion whose total reported consumption of vegetables was less than one time per day.
0
10
20
30
40
50
60
White, non-Hispanic Black, non-Hispanic
%
Fruit Consumption (< 1 Time / Day)by Race and Gender
Michigan, 2015
Total Male Female
0
10
20
30
40
50
White, non-Hispanic Black, non-Hispanic
%
Vegetable Consumption (< 1 Time / Day)by Race and Gender
Michigan, 2015
Total Male Female
0
5
10
15
20
25
30
'06 '07 '08 '09 '10 '11 '12 '13 '14 '15
%
Current Cigarette SmokingU.S. vs. Michigan, 2006-2015
U.S. median Michigan
Cigarette Smoking
Due to methodology changes that took place in 2011, BRFSS estimates from 2011 and moving forward cannot be compared to BRFSS estimates from 2010 and earlier.
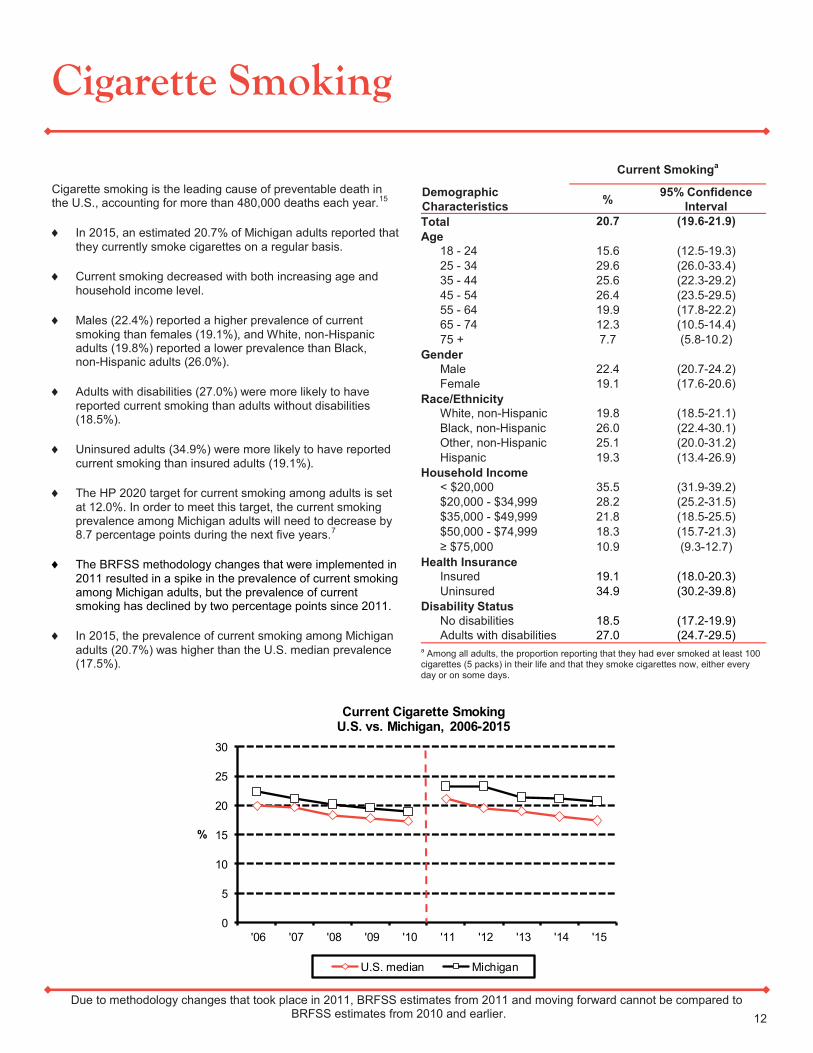
Cigarette smoking is the leading cause of preventable death in the U.S., accounting for more than 480,000 deaths each year.15
In 2015, an estimated 20.7% of Michigan adults reported that
they currently smoke cigarettes on a regular basis.
Current smoking decreased with both increasing age and
household income level.
Males (22.4%) reported a higher prevalence of current
smoking than females (19.1%), and White, non-Hispanic adults (19.8%) reported a lower prevalence than Black, non-Hispanic adults (26.0%).
Adults with disabilities (27.0%) were more likely to have
reported current smoking than adults without disabilities (18.5%).
Uninsured adults (34.9%) were more likely to have reported
current smoking than insured adults (19.1%).
The HP 2020 target for current smoking among adults is set
at 12.0%. In order to meet this target, the current smoking prevalence among Michigan adults will need to decrease by 8.7 percentage points during the next five years.7
The BRFSS methodology changes that were implemented in
2011 resulted in a spike in the prevalence of current smoking among Michigan adults, but the prevalence of current smoking has declined by two percentage points since 2011.
In 2015, the prevalence of current smoking among Michigan
adults (20.7%) was higher than the U.S. median prevalence (17.5%).
Demographic
Characteristics
Current Smokinga
% 95% Confidence
Interval
Total 20.7 (19.6-21.9)
Age
18 - 24 15.6 (12.5-19.3)
25 - 34 29.6 (26.0-33.4)
35 - 44 25.6 (22.3-29.2)
45 - 54 26.4 (23.5-29.5)
55 - 64 19.9 (17.8-22.2)
65 - 74 12.3 (10.5-14.4)
75 + 7.7 (5.8-10.2)
Gender
Male 22.4 (20.7-24.2)
Female 19.1 (17.6-20.6)
Race/Ethnicity
White, non-Hispanic 19.8 (18.5-21.1)
Black, non-Hispanic 26.0 (22.4-30.1)
Other, non-Hispanic 25.1 (20.0-31.2)
Hispanic 19.3 (13.4-26.9)
Household Income
< $20,000 35.5 (31.9-39.2)
$20,000 - $34,999 28.2 (25.2-31.5)
$35,000 - $49,999 21.8 (18.5-25.5)
$50,000 - $74,999 18.3 (15.7-21.3)
≥ $75,000 10.9 (9.3-12.7)
Health Insurance
Insured 19.1 (18.0-20.3)
Uninsured 34.9 (30.2-39.8)
Disability Status
No disabilities 18.5 (17.2-19.9)
Adults with disabilities 27.0 (24.7-29.5) a Among all adults, the proportion reporting that they had ever smoked at least 100 cigarettes (5 packs) in their life and that they smoke cigarettes now, either every day or on some days.
12
0
10
20
30
40
50
White, non-Hispanic Black, non-Hispanic
%
Vegetable Consumption (< 1 Time / Day)by Race and Gender
Michigan, 2015
Total Male Female
Hookah Use
Due to methodology changes that took place in 2011, BRFSS estimates from 2011 and moving forward cannot be compared to BRFSS estimates from 2010 and earlier. 13
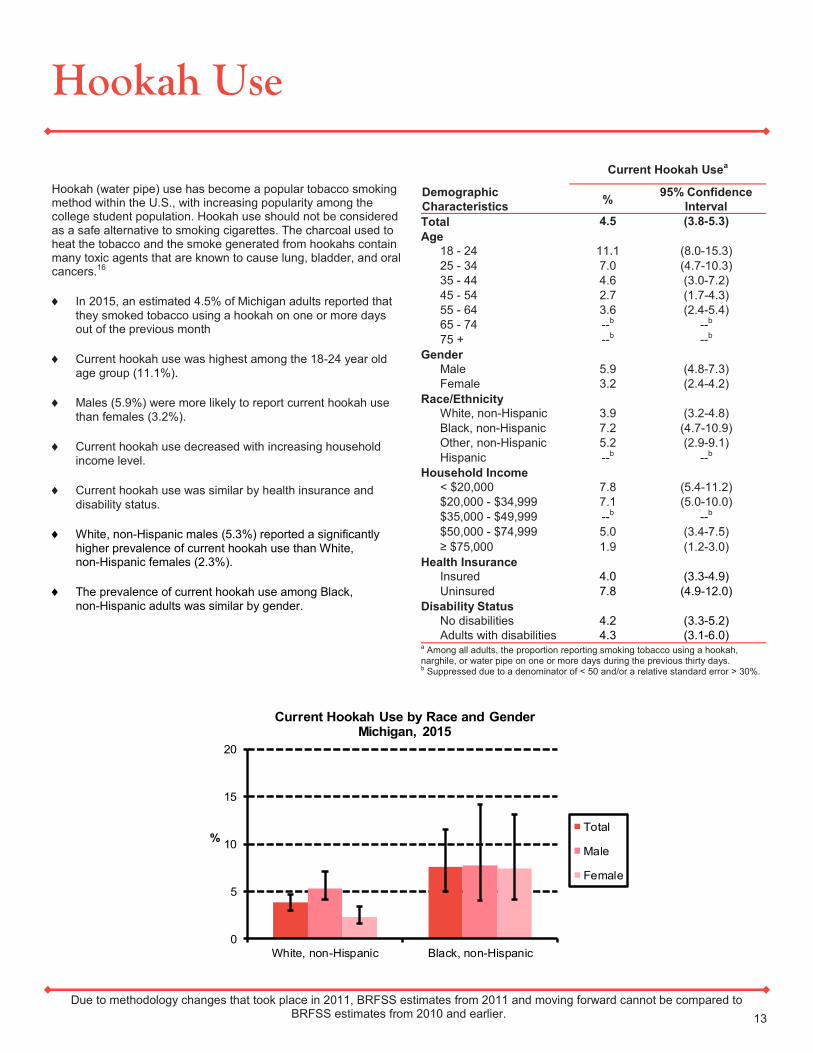
Hookah (water pipe) use has become a popular tobacco smoking method within the U.S., with increasing popularity among the college student population. Hookah use should not be considered as a safe alternative to smoking cigarettes. The charcoal used to heat the tobacco and the smoke generated from hookahs contain many toxic agents that are known to cause lung, bladder, and oral cancers.16
In 2015, an estimated 4.5% of Michigan adults reported that
they smoked tobacco using a hookah on one or more days out of the previous month
Current hookah use was highest among the 18-24 year old
age group (11.1%).
Males (5.9%) were more likely to report current hookah use
than females (3.2%).
Current hookah use decreased with increasing household
income level.
Current hookah use was similar by health insurance and
disability status.
White, non-Hispanic males (5.3%) reported a significantly
higher prevalence of current hookah use than White, non-Hispanic females (2.3%).
The prevalence of current hookah use among Black,
non-Hispanic adults was similar by gender.
Demographic
Characteristics
Current Hookah Usea
% 95% Confidence
Interval
Total 4.5 (3.8-5.3)
Age
18 - 24 11.1 (8.0-15.3)
25 - 34 7.0 (4.7-10.3)
35 - 44 4.6 (3.0-7.2)
45 - 54 2.7 (1.7-4.3)
55 - 64 3.6 (2.4-5.4)
65 - 74 --b --b
75 + --b --b
Gender
Male 5.9 (4.8-7.3)
Female 3.2 (2.4-4.2)
Race/Ethnicity
White, non-Hispanic 3.9 (3.2-4.8)
Black, non-Hispanic 7.2 (4.7-10.9)
Other, non-Hispanic 5.2 (2.9-9.1)
Hispanic --b --b
Household Income
< $20,000 7.8 (5.4-11.2)
$20,000 - $34,999 7.1 (5.0-10.0)
$35,000 - $49,999 --b --b
$50,000 - $74,999 5.0 (3.4-7.5)
≥ $75,000 1.9 (1.2-3.0)
Health Insurance
Insured 4.0 (3.3-4.9)
Uninsured 7.8 (4.9-12.0)
Disability Status
No disabilities 4.2 (3.3-5.2)
Adults with disabilities 4.3 (3.1-6.0) a Among all adults, the proportion reporting smoking tobacco using a hookah, narghile, or water pipe on one or more days during the previous thirty days. b Suppressed due to a denominator of < 50 and/or a relative standard error > 30%.
0
5
10
15
20
White, non-Hispanic Black, non-Hispanic
%
Current Hookah Use by Race and GenderMichigan, 2015
Total
Male
Female

Secondhand Smoke Exposure
Due to methodology changes that took place in 2011, BRFSS estimates from 2011 and moving forward cannot be compared to BRFSS estimates from 2010 and earlier.
Among adults who have never smoked, secondhand smoke exposure causes an estimated 34,000 heart disease deaths and 7,300 lung cancer deaths within the U.S. each year.15
In 2015, an estimated 24.3% of Michigan adults reported that
they were exposed to secondhand smoke in their home or car within the past seven days.
Secondhand smoke exposure decreased with both
increasing age and household income level.
Males (28.4%) were more likely than females (20.7%) to
report secondhand smoke exposure.
Black, non-Hispanic adults (36.3%) reported a significantly
higher prevalence of secondhand smoke exposure than White, non-Hispanic adults (21.9%).
Uninsured adults and adults with disabilities (40.7% and
29.3%, respectively) were more likely to have reported recent secondhand smoke exposure than insured adults and adults without disabilities (22.6% and 22.5%, respectively).
White, non-Hispanic females reported the lowest prevalence
of recent secondhand smoke exposure at 19.6%. White, non-Hispanic males and females (24.4% and 19.6%, respec-tively) reported lower prevalences of recent secondhand smoke exposure than Black, non-Hispanic males (47.0%).
Demographic
Characteristics
Secondhand Smoke Exposurea
% 95% Confidence
Interval
Total 24.3 (22.7-26.0)
Age
18 - 24 38.2 (31.9-44.9)
25 - 34 33.0 (28.1-38.2)
35 - 44 23.1 (19.1-27.7)
45 - 54 23.8 (20.2-27.7)
55 - 64 21.1 (18.3-24.2)
65 - 74 15.5 (12.8-18.6)
75 + 14.0 (10.3-18.6)
Gender
Male 28.4 (25.9-31.0)
Female 20.7 (18.7-22.8)
Race/Ethnicity
White, non-Hispanic 21.9 (20.2-23.7)
Black, non-Hispanic 36.3 (31.0-42.1)
Other, non-Hispanic 28.9 (20.9-38.5)
Hispanic 28.9 (19.8-40.1)
Household Income
< $20,000 46.1 (41.1-51.2)
$20,000 - $34,999 35.4 (31.1-40.0)
$35,000 - $49,999 24.0 (19.8-28.8)
$50,000 - $74,999 18.2 (14.8-22.1)
≥ $75,000 12.4 (10.1-15.1)
Health Insurance
Insured 22.6 (21.0-24.3)
Uninsured 40.7 (34.2-47.5)
Disability Status
No disabilities 22.5 (20.6-24.5)
Adults with disabilities 29.3 (26.3-32.5)
a Among all adults, the proportion reporting being exposed to secondhand smoke in their home or a car within the past seven days.
14
0
10
20
30
40
50
60
White, non-Hispanic Black, non-Hispanic
%
Secondhand Smoke Exposure by Race and GenderMichigan, 2015
Total
Male
Female
0
5
10
15
20
25
'06 '07 '08 '09 '10 '11 '12 '13 '14 '15
%
Binge DrinkingU.S. vs. Michigan, 2006-2015
U.S. median Michigan
Alcohol Consumption
Due to methodology changes that took place in 2011, BRFSS estimates from 2011 and moving forward cannot be compared to BRFSS estimates from 2010 and earlier.
Demographic
Characteristics
Binge Drinkinga
% 95% Confidence
Interval
Total 18.5 (17.5-19.6)
Age
18 - 24 26.7 (23.0-30.9)
25 - 34 27.0 (23.7-30.5)
35 - 44 25.3 (22.1-28.8)
45 - 54 18.5 (16.3-21.0)
55 - 64 14.4 (12.6-16.3)
65 - 74 8.1 (6.5-10.1)
75 + 3.0 (2.0-4.5)
Gender
Male 24.5 (22.8-26.3)
Female 12.9 (11.7-14.2)
Race/Ethnicity
White, non-Hispanic 19.3 (18.1-20.5)
Black, non-Hispanic 15.7 (12.8-19.0)
Other, non-Hispanic 12.7 (9.0-17.4)
Hispanic 20.3 (14.3-27.9)
Household Income
< $20,000 14.7 (12.2-17.6)
$20,000 - $34,999 17.1 (14.6-19.9)
$35,000 - $49,999 19.3 (16.2-22.7)
$50,000 - $74,999 21.6 (18.7-24.8)
≥ $75,000 23.1 (21.0-25.3)
Health Insurance
Insured 18.0 (16.9-19.1)
Uninsured 24.1 (20.0-28.8)
Disability Status
No disabilities 21.0 (19.7-22.3)
Adults with disabilities 11.2 (9.6-13.1) a Among all adults, the proportion reporting consumption of five or more drinks per occasion (for males) or four or more drinks per occasion (for women) at least once in the previous month.
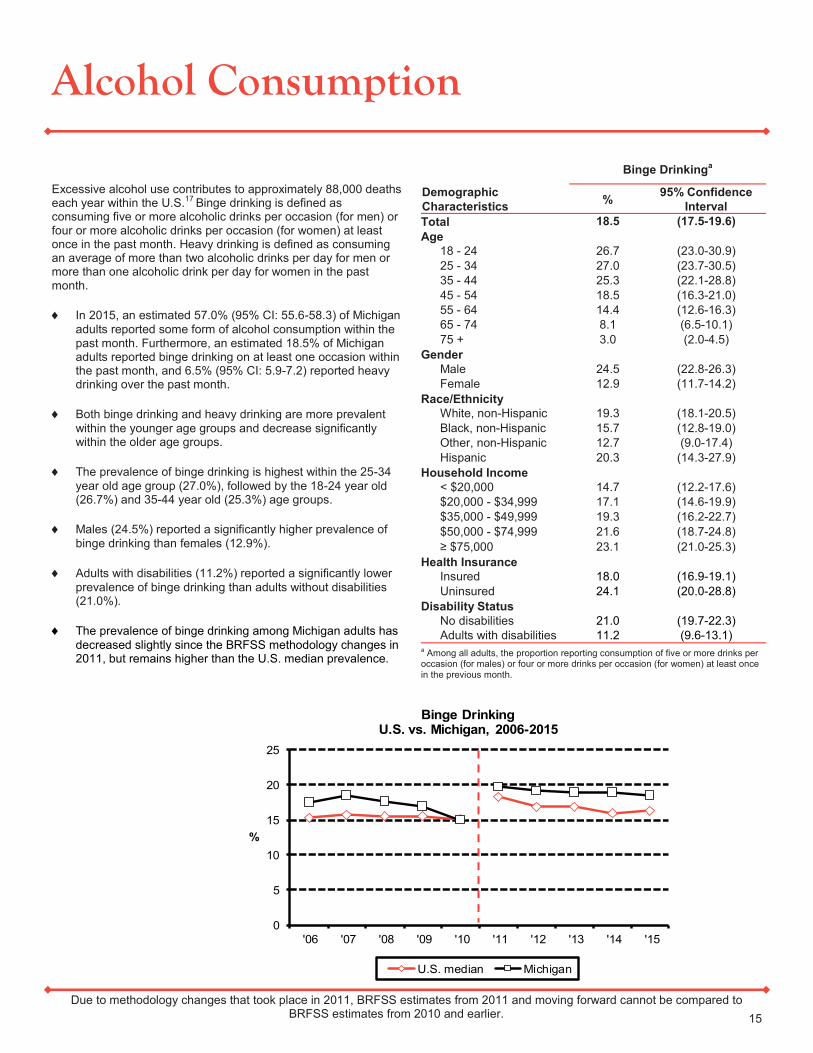
Excessive alcohol use contributes to approximately 88,000 deaths each year within the U.S.17 Binge drinking is defined as consuming five or more alcoholic drinks per occasion (for men) or four or more alcoholic drinks per occasion (for women) at least once in the past month. Heavy drinking is defined as consuming an average of more than two alcoholic drinks per day for men or more than one alcoholic drink per day for women in the past month.
In 2015, an estimated 57.0% (95% CI: 55.6-58.3) of Michigan
adults reported some form of alcohol consumption within the past month. Furthermore, an estimated 18.5% of Michigan adults reported binge drinking on at least one occasion within the past month, and 6.5% (95% CI: 5.9-7.2) reported heavy drinking over the past month.
Both binge drinking and heavy drinking are more prevalent
within the younger age groups and decrease significantly within the older age groups.
The prevalence of binge drinking is highest within the 25-34
year old age group (27.0%), followed by the 18-24 year old (26.7%) and 35-44 year old (25.3%) age groups.
Males (24.5%) reported a significantly higher prevalence of
binge drinking than females (12.9%).
Adults with disabilities (11.2%) reported a significantly lower
prevalence of binge drinking than adults without disabilities (21.0%).
The prevalence of binge drinking among Michigan adults has
decreased slightly since the BRFSS methodology changes in 2011, but remains higher than the U.S. median prevalence.
15
Seatbelt Use
Due to methodology changes that took place in 2011, BRFSS estimates from 2011 and moving forward cannot be compared to BRFSS estimates from 2010 and earlier.
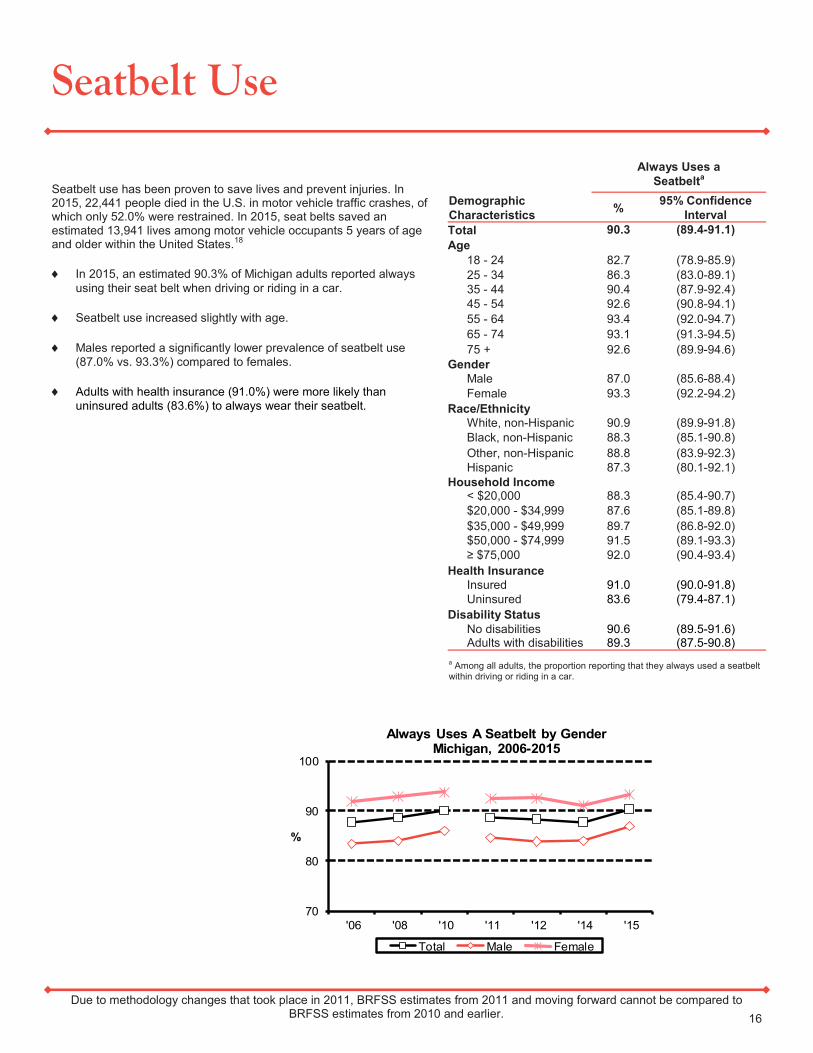
Seatbelt use has been proven to save lives and prevent injuries. In 2015, 22,441 people died in the U.S. in motor vehicle traffic crashes, of which only 52.0% were restrained. In 2015, seat belts saved an estimated 13,941 lives among motor vehicle occupants 5 years of age and older within the United States.18
In 2015, an estimated 90.3% of Michigan adults reported always
using their seat belt when driving or riding in a car.
Seatbelt use increased slightly with age.
Males reported a significantly lower prevalence of seatbelt use
(87.0% vs. 93.3%) compared to females.
Adults with health insurance (91.0%) were more likely than
uninsured adults (83.6%) to always wear their seatbelt.
16
Demographic
Characteristics
Always Uses a
Seatbelta
% 95% Confidence
Interval
Total 90.3 (89.4-91.1)
Age
18 - 24 82.7 (78.9-85.9)
25 - 34 86.3 (83.0-89.1)
35 - 44 90.4 (87.9-92.4)
45 - 54 92.6 (90.8-94.1)
55 - 64 93.4 (92.0-94.7)
65 - 74 93.1 (91.3-94.5)
75 + 92.6 (89.9-94.6)
Gender
Male 87.0 (85.6-88.4)
Female 93.3 (92.2-94.2)
Race/Ethnicity
White, non-Hispanic 90.9 (89.9-91.8)
Black, non-Hispanic 88.3 (85.1-90.8)
Other, non-Hispanic 88.8 (83.9-92.3)
Hispanic 87.3 (80.1-92.1)
Household Income
< $20,000 88.3 (85.4-90.7)
$20,000 - $34,999 87.6 (85.1-89.8)
$35,000 - $49,999 89.7 (86.8-92.0)
$50,000 - $74,999 91.5 (89.1-93.3)
≥ $75,000 92.0 (90.4-93.4)
Health Insurance
Insured 91.0 (90.0-91.8)
Uninsured 83.6 (79.4-87.1)
Disability Status
No disabilities 90.6 (89.5-91.6) Adults with disabilities 89.3 (87.5-90.8)
a Among all adults, the proportion reporting that they always used a seatbelt within driving or riding in a car.
70
80
90
100
'06 '08 '10 '11 '12 '14 '15
%
Always Uses A Seatbelt by GenderMichigan, 2006-2015
Total Male Female
0
10
20
30
40
'05 '07 '09 '11 '13 '15
%
Ever Told High Blood PressureU.S. vs. Michigan, 2005-2015
U.S. median Michigan
Hypertension Awareness and Medication Use
Due to methodology changes that took place in 2011, BRFSS estimates from 2011 and moving forward cannot be compared to BRFSS estimates from 2010 and earlier.
Demographic
Characteristics
Ever Told HBPa
% 95% Confidence
Interval
Total 33.1 (31.9-34.3)
Age
18 - 24 8.1 (6.0-10.9)
25 - 34 10.7 (8.7-13.1)
35 - 44 21.8 (19.0-24.8)
45 - 54 33.7 (30.9-36.7)
55 - 64 46.3 (43.7-48.9)
65 - 74 61.0 (58.1-63.7)
75 + 64.4 (60.9-67.8)
Gender
Male 34.3 (32.5-36.1)
Female 32.0 (30.5-33.5)
Race/Ethnicity
White, non-Hispanic 32.3 (31.1-33.6)
Black, non-Hispanic 43.0 (39.1-46.9)
Other, non-Hispanic 27.1 (22.2-32.7)
Hispanic 23.6 (17.8-30.5)
Household Income
< $20,000 38.9 (35.5-42.4)
$20,000 - $34,999 37.8 (34.8-40.8)
$35,000 - $49,999 40.0 (36.5-43.6)
$50,000 - $74,999 30.3 (27.4-33.3)
≥ $75,000 25.2 (23.3-27.3)
Health Insurance
Insured 34.5 (33.3-35.8)
Uninsured 21.1 (17.7-25.0)
Disability Status
No disabilities 27.0 (25.8-28.3)
Adults with disabilities 52.0 (49.4-54.5) a Among all adults, the proportion reporting that they were ever told by a doctor that they had high blood pressure (HBP). Women who had HBP only during pregnancy and adults who were borderline hypertensive were considered not to have been diagnosed.
17
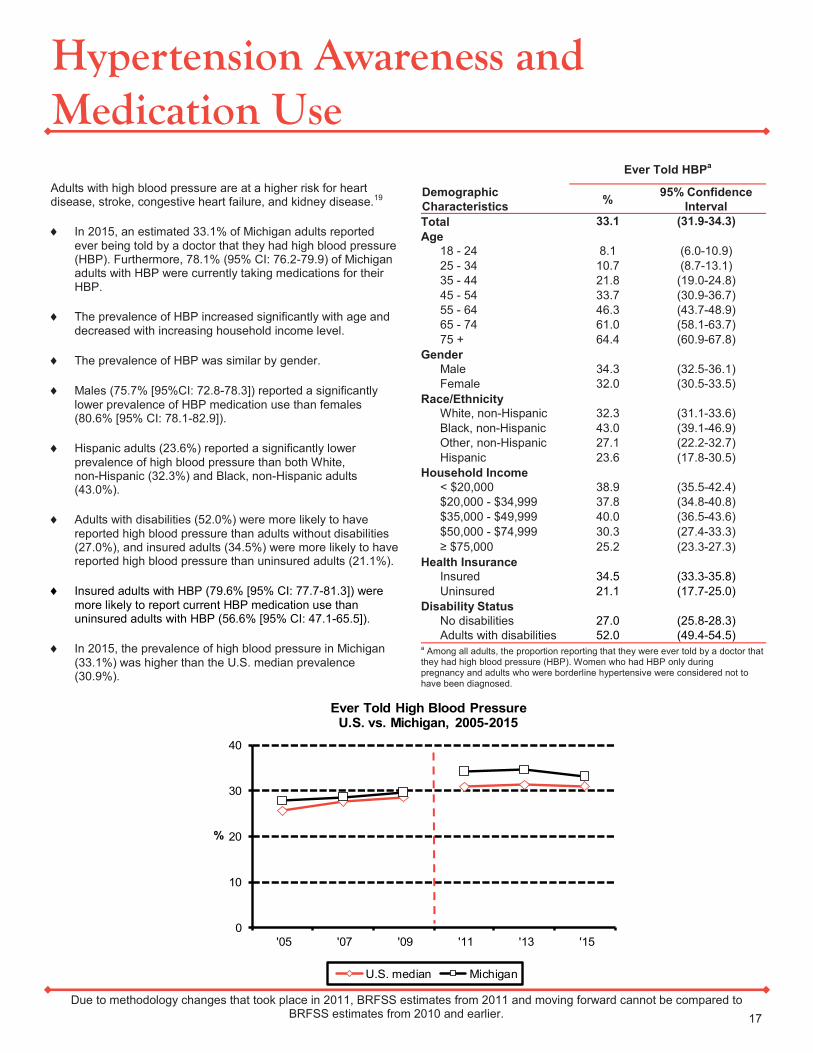
Adults with high blood pressure are at a higher risk for heart disease, stroke, congestive heart failure, and kidney disease.19
In 2015, an estimated 33.1% of Michigan adults reported
ever being told by a doctor that they had high blood pressure (HBP). Furthermore, 78.1% (95% CI: 76.2-79.9) of Michigan adults with HBP were currently taking medications for their HBP.
The prevalence of HBP increased significantly with age and
decreased with increasing household income level.
The prevalence of HBP was similar by gender.
Males (75.7% [95%CI: 72.8-78.3]) reported a significantly
lower prevalence of HBP medication use than females (80.6% [95% CI: 78.1-82.9]).
Hispanic adults (23.6%) reported a significantly lower
prevalence of high blood pressure than both White, non-Hispanic (32.3%) and Black, non-Hispanic adults (43.0%).
Adults with disabilities (52.0%) were more likely to have
reported high blood pressure than adults without disabilities (27.0%), and insured adults (34.5%) were more likely to have reported high blood pressure than uninsured adults (21.1%).
Insured adults with HBP (79.6% [95% CI: 77.7-81.3]) were
more likely to report current HBP medication use than uninsured adults with HBP (56.6% [95% CI: 47.1-65.5]).
In 2015, the prevalence of high blood pressure in Michigan
(33.1%) was higher than the U.S. median prevalence (30.9%).
Routine Checkup in Past Year
Due to methodology changes that took place in 2011, BRFSS estimates from 2011 and moving forward cannot be compared to BRFSS estimates from 2010 and earlier.
Demographic
Characteristics
Had a Routine Checkup Within The Past Yeara
% 95% Confidence
Interval
Total 72.0 (70.8-73.3)
Age
18 - 24 65.0 (60.5-69.2)
25 - 34 60.5 (56.7-64.2)
35 - 44 63.5 (59.8-67.0)
45 - 54 70.0 (67.0-72.8)
55 - 64 79.4 (77.1-81.4)
65 - 74 84.2 (81.8-86.2)
75 + 90.2 (87.8-92.2)
Gender
Male 67.3 (65.4-69.2)
Female 76.5 (74.9-78.1)
Race/Ethnicity
White, non-Hispanic 70.9 (69.5-72.3)
Black, non-Hispanic 78.4 (74.6-81.7)
Other, non-Hispanic 70.8 (64.9-76.0)
Hispanic 74.2 (66.6-80.6)
Household Income
< $20,000 71.9 (68.2-75.3)
$20,000 - $34,999 74.3 (71.2-77.1)
$35,000 - $49,999 70.0 (66.3-73.5)
$50,000 - $74,999 70.1 (66.8-73.3)
≥ $75,000 72.1 (69.7-74.3)
Health Insurance
Insured 74.7 (73.5-75.9)
Uninsured 47.9 (43.1-52.9)
Disability Status
No disabilities 69.9 (68.4-71.4)
Adults with disabilities 77.9 (75.6-80.1) a Among all adults, the proportion reporting a routine medical checkup within the past year.
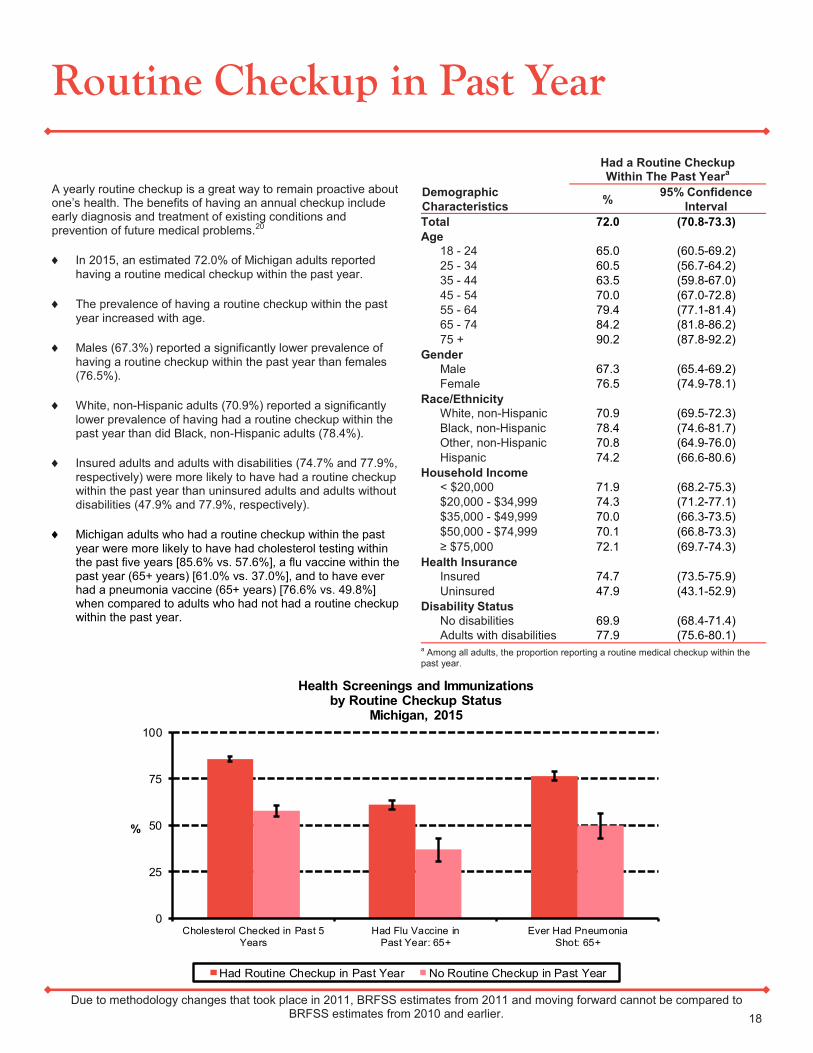
A yearly routine checkup is a great way to remain proactive about one’s health. The benefits of having an annual checkup include early diagnosis and treatment of existing conditions and prevention of future medical problems.20
In 2015, an estimated 72.0% of Michigan adults reported
having a routine medical checkup within the past year.
The prevalence of having a routine checkup within the past
year increased with age.
Males (67.3%) reported a significantly lower prevalence of
having a routine checkup within the past year than females (76.5%).
White, non-Hispanic adults (70.9%) reported a significantly
lower prevalence of having had a routine checkup within the past year than did Black, non-Hispanic adults (78.4%).
Insured adults and adults with disabilities (74.7% and 77.9%,
respectively) were more likely to have had a routine checkup within the past year than uninsured adults and adults without disabilities (47.9% and 77.9%, respectively).
Michigan adults who had a routine checkup within the past
year were more likely to have had cholesterol testing within the past five years [85.6% vs. 57.6%], a flu vaccine within the past year (65+ years) [61.0% vs. 37.0%], and to have ever had a pneumonia vaccine (65+ years) [76.6% vs. 49.8%] when compared to adults who had not had a routine checkup within the past year.
18
0
25
50
75
100
Cholesterol Checked in Past 5
Years
Had Flu Vaccine in
Past Year: 65+
Ever Had Pneumonia
Shot: 65+
%
Had Routine Checkup in Past Year No Routine Checkup in Past Year
Health Screenings and Immunizations by Routine Checkup Status
Michigan, 2015
10
20
30
40
50
'05 '07 '09 '11 '13 '15
%
Ever Told High CholesterolU.S. vs. Michigan, 2005-2015
U.S. median Michigan
Cholesterol Screening and Awareness
Due to methodology changes that took place in 2011, BRFSS estimates from 2011 and moving forward cannot be compared to BRFSS estimates from 2010 and earlier. 19
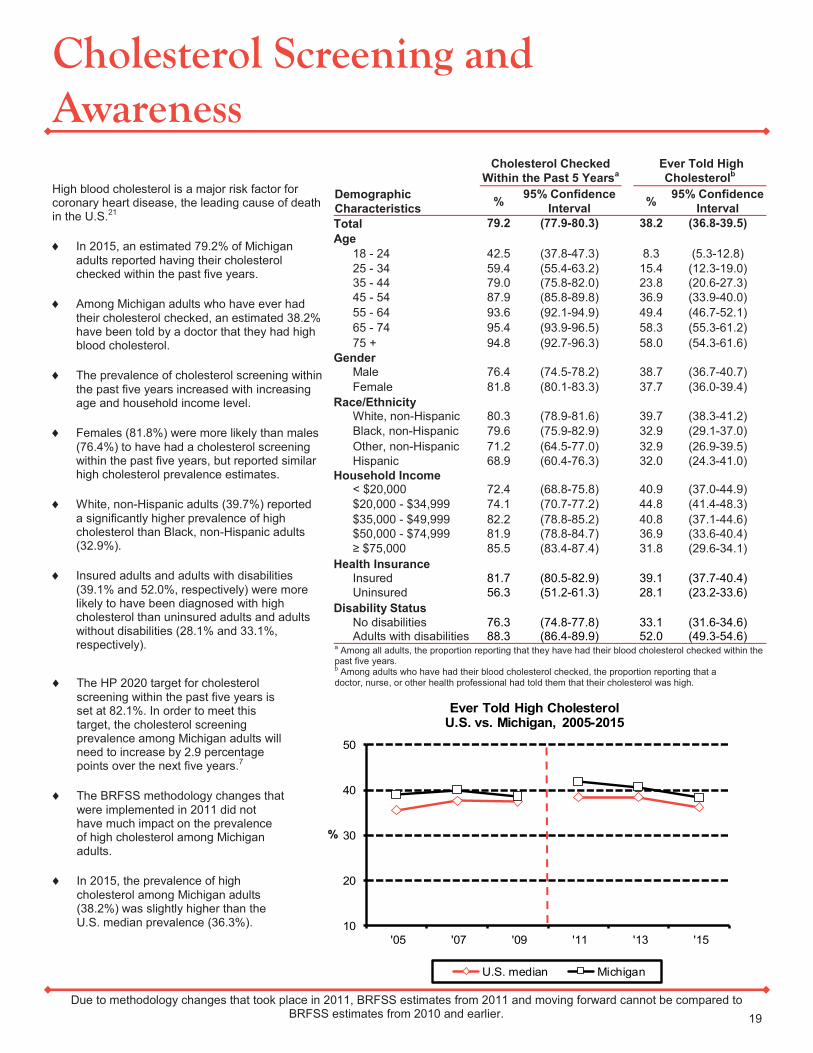
High blood cholesterol is a major risk factor for coronary heart disease, the leading cause of death in the U.S.21
In 2015, an estimated 79.2% of Michigan
adults reported having their cholesterol checked within the past five years.
Among Michigan adults who have ever had
their cholesterol checked, an estimated 38.2% have been told by a doctor that they had high blood cholesterol.
The prevalence of cholesterol screening within
the past five years increased with increasing age and household income level.
Females (81.8%) were more likely than males
(76.4%) to have had a cholesterol screening within the past five years, but reported similar high cholesterol prevalence estimates.
White, non-Hispanic adults (39.7%) reported
a significantly higher prevalence of high cholesterol than Black, non-Hispanic adults (32.9%).
Insured adults and adults with disabilities
(39.1% and 52.0%, respectively) were more likely to have been diagnosed with high cholesterol than uninsured adults and adults without disabilities (28.1% and 33.1%, respectively).
Demographic
Characteristics
Cholesterol Checked
Within the Past 5 Yearsa Ever Told High
Cholesterolb
% 95% Confidence
Interval %
95% Confidence
Interval
Total 79.2 (77.9-80.3) 38.2 (36.8-39.5)
Age
18 - 24 42.5 (37.8-47.3) 8.3 (5.3-12.8)
25 - 34 59.4 (55.4-63.2) 15.4 (12.3-19.0)
35 - 44 79.0 (75.8-82.0) 23.8 (20.6-27.3)
45 - 54 87.9 (85.8-89.8) 36.9 (33.9-40.0)
55 - 64 93.6 (92.1-94.9) 49.4 (46.7-52.1)
65 - 74 95.4 (93.9-96.5) 58.3 (55.3-61.2)
75 + 94.8 (92.7-96.3) 58.0 (54.3-61.6)
Gender
Male 76.4 (74.5-78.2) 38.7 (36.7-40.7)
Female 81.8 (80.1-83.3) 37.7 (36.0-39.4)
Race/Ethnicity
White, non-Hispanic 80.3 (78.9-81.6) 39.7 (38.3-41.2)
Black, non-Hispanic 79.6 (75.9-82.9) 32.9 (29.1-37.0)
Other, non-Hispanic 71.2 (64.5-77.0) 32.9 (26.9-39.5)
Hispanic 68.9 (60.4-76.3) 32.0 (24.3-41.0)
Household Income
< $20,000 72.4 (68.8-75.8) 40.9 (37.0-44.9)
$20,000 - $34,999 74.1 (70.7-77.2) 44.8 (41.4-48.3)
$35,000 - $49,999 82.2 (78.8-85.2) 40.8 (37.1-44.6)
$50,000 - $74,999 81.9 (78.8-84.7) 36.9 (33.6-40.4)
≥ $75,000 85.5 (83.4-87.4) 31.8 (29.6-34.1)
Health Insurance
Insured 81.7 (80.5-82.9) 39.1 (37.7-40.4)
Uninsured 56.3 (51.2-61.3) 28.1 (23.2-33.6)
Disability Status
No disabilities 76.3 (74.8-77.8) 33.1 (31.6-34.6) Adults with disabilities 88.3 (86.4-89.9) 52.0 (49.3-54.6)
a Among all adults, the proportion reporting that they have had their blood cholesterol checked within the past five years. b Among adults who have had their blood cholesterol checked, the proportion reporting that a doctor, nurse, or other health professional had told them that their cholesterol was high. The HP 2020 target for cholesterol
screening within the past five years is set at 82.1%. In order to meet this target, the cholesterol screening prevalence among Michigan adults will need to increase by 2.9 percentage points over the next five years.7
The BRFSS methodology changes that
were implemented in 2011 did not have much impact on the prevalence of high cholesterol among Michigan adults.
In 2015, the prevalence of high
cholesterol among Michigan adults (38.2%) was slightly higher than the U.S. median prevalence (36.3%).
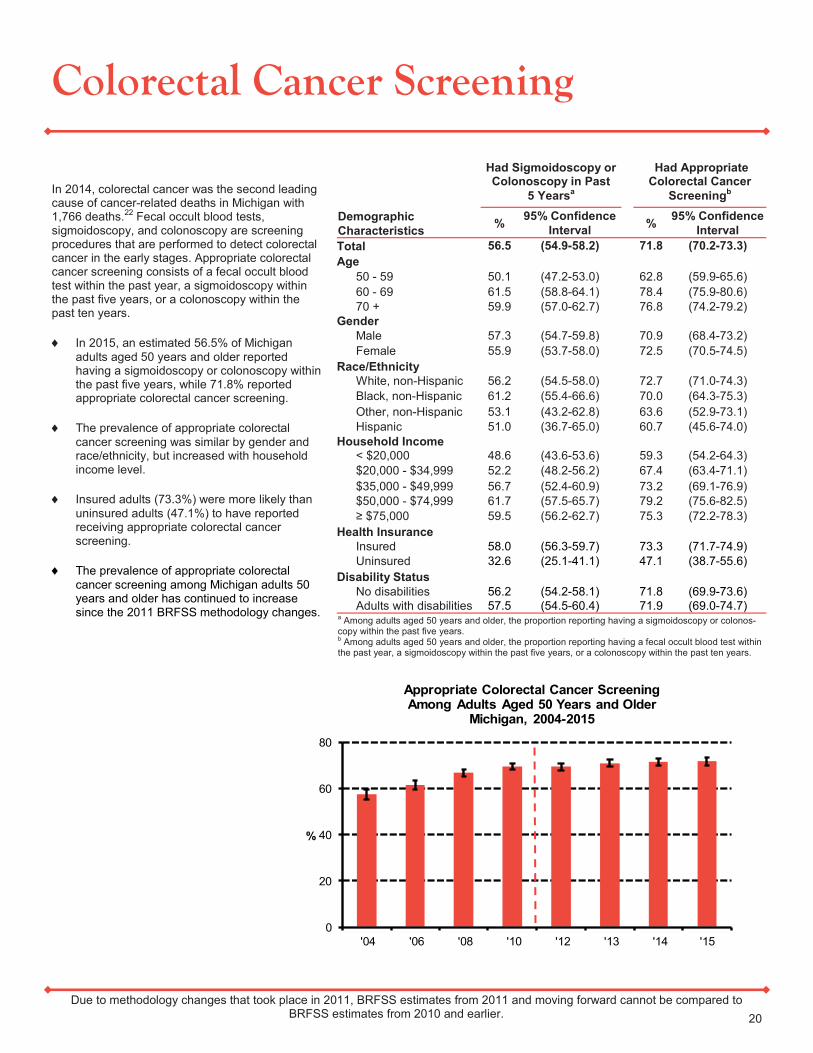
0
20
40
60
80
'04 '06 '08 '10 '12 '13 '14 '15
%
Appropriate Colorectal Cancer ScreeningAmong Adults Aged 50 Years and Older
Michigan, 2004-2015
Colorectal Cancer Screening
Due to methodology changes that took place in 2011, BRFSS estimates from 2011 and moving forward cannot be compared to BRFSS estimates from 2010 and earlier.
Demographic
Characteristics
Had Sigmoidoscopy or Colonoscopy in Past
5 Yearsa
Had Appropriate Colorectal Cancer
Screeningb
% 95% Confidence
Interval %
95% Confidence
Interval
Total 56.5 (54.9-58.2) 71.8 (70.2-73.3)
Age
50 - 59 50.1 (47.2-53.0) 62.8 (59.9-65.6)
60 - 69 61.5 (58.8-64.1) 78.4 (75.9-80.6)
70 + 59.9 (57.0-62.7) 76.8 (74.2-79.2)
Gender
Male 57.3 (54.7-59.8) 70.9 (68.4-73.2)
Female 55.9 (53.7-58.0) 72.5 (70.5-74.5)
Race/Ethnicity
White, non-Hispanic 56.2 (54.5-58.0) 72.7 (71.0-74.3)
Black, non-Hispanic 61.2 (55.4-66.6) 70.0 (64.3-75.3)
Other, non-Hispanic 53.1 (43.2-62.8) 63.6 (52.9-73.1)
Hispanic 51.0 (36.7-65.0) 60.7 (45.6-74.0)
Household Income
< $20,000 48.6 (43.6-53.6) 59.3 (54.2-64.3)
$20,000 - $34,999 52.2 (48.2-56.2) 67.4 (63.4-71.1)
$35,000 - $49,999 56.7 (52.4-60.9) 73.2 (69.1-76.9)
$50,000 - $74,999 61.7 (57.5-65.7) 79.2 (75.6-82.5)
≥ $75,000 59.5 (56.2-62.7) 75.3 (72.2-78.3)
Health Insurance
Insured 58.0 (56.3-59.7) 73.3 (71.7-74.9)
Uninsured 32.6 (25.1-41.1) 47.1 (38.7-55.6)
Disability Status
No disabilities 56.2 (54.2-58.1) 71.8 (69.9-73.6)
Adults with disabilities 57.5 (54.5-60.4) 71.9 (69.0-74.7) a Among adults aged 50 years and older, the proportion reporting having a sigmoidoscopy or colonos-copy within the past five years. b Among adults aged 50 years and older, the proportion reporting having a fecal occult blood test within the past year, a sigmoidoscopy within the past five years, or a colonoscopy within the past ten years.
In 2014, colorectal cancer was the second leading cause of cancer-related deaths in Michigan with 1,766 deaths.22 Fecal occult blood tests, sigmoidoscopy, and colonoscopy are screening procedures that are performed to detect colorectal cancer in the early stages. Appropriate colorectal cancer screening consists of a fecal occult blood test within the past year, a sigmoidoscopy within the past five years, or a colonoscopy within the past ten years.
In 2015, an estimated 56.5% of Michigan
adults aged 50 years and older reported having a sigmoidoscopy or colonoscopy within the past five years, while 71.8% reported appropriate colorectal cancer screening.
The prevalence of appropriate colorectal
cancer screening was similar by gender and race/ethnicity, but increased with household income level.
Insured adults (73.3%) were more likely than
uninsured adults (47.1%) to have reported receiving appropriate colorectal cancer screening.
The prevalence of appropriate colorectal
cancer screening among Michigan adults 50 years and older has continued to increase since the 2011 BRFSS methodology changes.
20
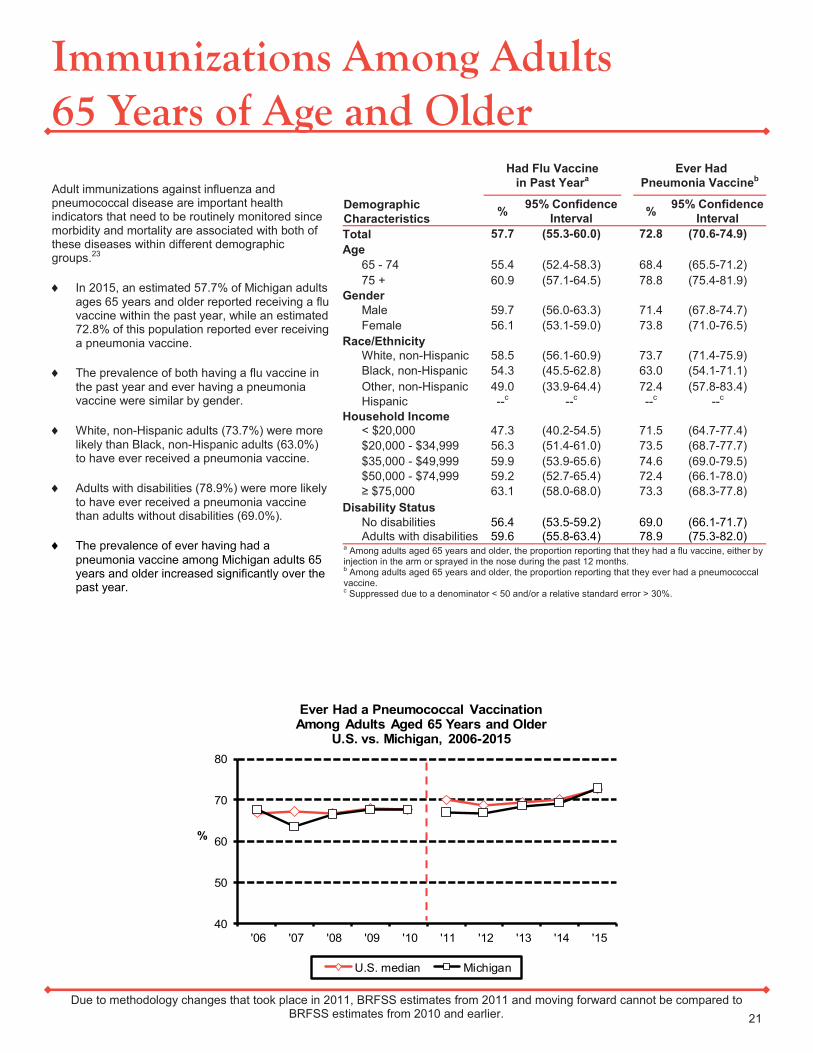
40
50
60
70
80
'06 '07 '08 '09 '10 '11 '12 '13 '14 '15
%
Ever Had a Pneumococcal VaccinationAmong Adults Aged 65 Years and Older
U.S. vs. Michigan, 2006-2015
U.S. median Michigan
Immunizations Among Adults 65 Years of Age and Older
Due to methodology changes that took place in 2011, BRFSS estimates from 2011 and moving forward cannot be compared to BRFSS estimates from 2010 and earlier.
Demographic
Characteristics
Had Flu Vaccine
in Past Yeara Ever Had
Pneumonia Vaccineb
% 95% Confidence
Interval %
95% Confidence
Interval
Total 57.7 (55.3-60.0) 72.8 (70.6-74.9)
Age
65 - 74 55.4 (52.4-58.3) 68.4 (65.5-71.2)
75 + 60.9 (57.1-64.5) 78.8 (75.4-81.9)
Gender
Male 59.7 (56.0-63.3) 71.4 (67.8-74.7)
Female 56.1 (53.1-59.0) 73.8 (71.0-76.5)
Race/Ethnicity
White, non-Hispanic 58.5 (56.1-60.9) 73.7 (71.4-75.9)
Black, non-Hispanic 54.3 (45.5-62.8) 63.0 (54.1-71.1)
Other, non-Hispanic 49.0 (33.9-64.4) 72.4 (57.8-83.4)
Hispanic --c --c --c --c
Household Income
< $20,000 47.3 (40.2-54.5) 71.5 (64.7-77.4)
$20,000 - $34,999 56.3 (51.4-61.0) 73.5 (68.7-77.7)
$35,000 - $49,999 59.9 (53.9-65.6) 74.6 (69.0-79.5)
$50,000 - $74,999 59.2 (52.7-65.4) 72.4 (66.1-78.0)
≥ $75,000 63.1 (58.0-68.0) 73.3 (68.3-77.8)
Disability Status
No disabilities 56.4 (53.5-59.2) 69.0 (66.1-71.7)
Adults with disabilities 59.6 (55.8-63.4) 78.9 (75.3-82.0) a Among adults aged 65 years and older, the proportion reporting that they had a flu vaccine, either by injection in the arm or sprayed in the nose during the past 12 months. b Among adults aged 65 years and older, the proportion reporting that they ever had a pneumococcal vaccine. c Suppressed due to a denominator < 50 and/or a relative standard error > 30%.
Adult immunizations against influenza and pneumococcal disease are important health indicators that need to be routinely monitored since morbidity and mortality are associated with both of these diseases within different demographic groups.23
In 2015, an estimated 57.7% of Michigan adults
ages 65 years and older reported receiving a flu vaccine within the past year, while an estimated 72.8% of this population reported ever receiving a pneumonia vaccine.
The prevalence of both having a flu vaccine in
the past year and ever having a pneumonia vaccine were similar by gender.
White, non-Hispanic adults (73.7%) were more
likely than Black, non-Hispanic adults (63.0%) to have ever received a pneumonia vaccine.
Adults with disabilities (78.9%) were more likely
to have ever received a pneumonia vaccine than adults without disabilities (69.0%).
The prevalence of ever having had a
pneumonia vaccine among Michigan adults 65 years and older increased significantly over the past year.
21
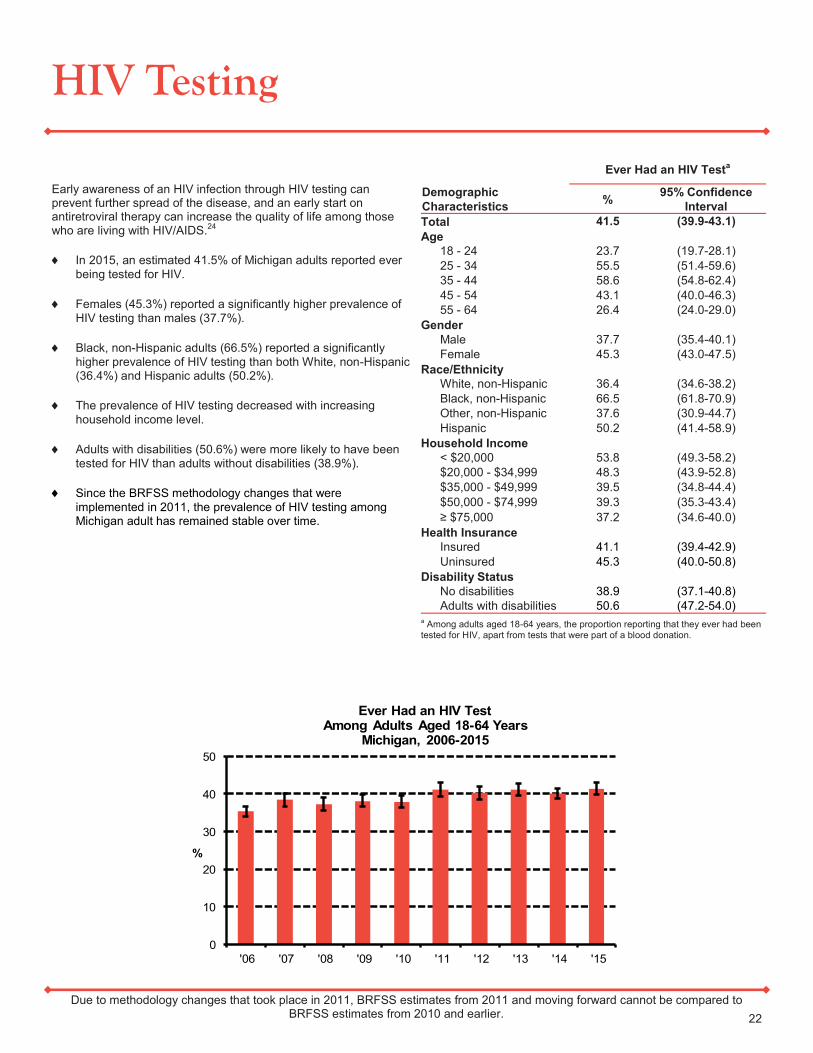
HIV Testing
Due to methodology changes that took place in 2011, BRFSS estimates from 2011 and moving forward cannot be compared to BRFSS estimates from 2010 and earlier.
Demographic
Characteristics
Ever Had an HIV Testa
% 95% Confidence
Interval
Total 41.5 (39.9-43.1)
Age
18 - 24 23.7 (19.7-28.1)
25 - 34 55.5 (51.4-59.6)
35 - 44 58.6 (54.8-62.4)
45 - 54 43.1 (40.0-46.3)
55 - 64 26.4 (24.0-29.0)
Gender
Male 37.7 (35.4-40.1)
Female 45.3 (43.0-47.5)
Race/Ethnicity
White, non-Hispanic 36.4 (34.6-38.2)
Black, non-Hispanic 66.5 (61.8-70.9)
Other, non-Hispanic 37.6 (30.9-44.7)
Hispanic 50.2 (41.4-58.9)
Household Income
< $20,000 53.8 (49.3-58.2)
$20,000 - $34,999 48.3 (43.9-52.8)
$35,000 - $49,999 39.5 (34.8-44.4)
$50,000 - $74,999 39.3 (35.3-43.4)
≥ $75,000 37.2 (34.6-40.0)
Health Insurance
Insured 41.1 (39.4-42.9)
Uninsured 45.3 (40.0-50.8)
Disability Status
No disabilities 38.9 (37.1-40.8)
Adults with disabilities 50.6 (47.2-54.0) a Among adults aged 18-64 years, the proportion reporting that they ever had been tested for HIV, apart from tests that were part of a blood donation.
Early awareness of an HIV infection through HIV testing can prevent further spread of the disease, and an early start on antiretroviral therapy can increase the quality of life among those who are living with HIV/AIDS.24
In 2015, an estimated 41.5% of Michigan adults reported ever
being tested for HIV.
Females (45.3%) reported a significantly higher prevalence of
HIV testing than males (37.7%).
Black, non-Hispanic adults (66.5%) reported a significantly
higher prevalence of HIV testing than both White, non-Hispanic (36.4%) and Hispanic adults (50.2%).
The prevalence of HIV testing decreased with increasing
household income level.
Adults with disabilities (50.6%) were more likely to have been
tested for HIV than adults without disabilities (38.9%).
Since the BRFSS methodology changes that were
implemented in 2011, the prevalence of HIV testing among Michigan adult has remained stable over time.
22
0
10
20
30
40
50
'06 '07 '08 '09 '10 '11 '12 '13 '14 '15
%
Ever Had an HIV Test Among Adults Aged 18-64 Years
Michigan, 2006-2015

0
5
10
15
20
'06 '07 '08 '09 '10 '11 '12 '13 '14 '15
%
Lifetime Adult AsthmaU.S. vs. Michigan, 2006-2015
U.S. median Michigan
Asthma in Adults
Due to methodology changes that took place in 2011, BRFSS estimates from 2011 and moving forward cannot be compared to BRFSS estimates from 2010 and earlier.
Demographic
Characteristics
Lifetime Asthmaa Current Asthmab
% 95% Confidence
Interval %
95% Confidence
Interval
Total 15.7 (14.8-16.7) 10.2 (9.5-11.0)
Age
18 - 24 21.3 (17.8-25.4) 13.3 (10.4-16.9)
25 - 34 19.2 (16.4-22.2) 9.8 (7.9-12.2)
35 - 44 16.4 (13.9-19.3) 9.7 (7.9-11.9)
45 - 54 15.5 (13.5-17.8) 11.3 (9.5-13.4)
55 - 64 13.2 (11.4-15.1) 9.4 (7.9-11.0)
65 - 74 13.2 (11.3-15.4) 9.6 (8.0-11.5)
75 + 10.1 (8.3-12.4) 8.2 (6.5-10.3)
Gender
Male 14.2 (12.8-15.7) 7.8 (6.8-9.0)
Female 17.2 (15.9-18.5) 12.5 (11.3-13.7)
Race/Ethnicity
White, non-Hispanic 15.3 (14.3-16.4) 9.9 (9.1-10.8)
Black, non-Hispanic 17.7 (14.8-21.0) 11.8 (9.4-14.6)
Other, non-Hispanic 17.1 (12.9-22.3) 11.6 (8.2-16.2)
Hispanic 16.8 (11.5-23.9) 11.5 (7.0-18.4)
Household Income
< $20,000 21.7 (18.9-24.8) 15.2 (12.9-17.8)
$20,000 - $34,999 16.4 (13.9-19.2) 11.3 (9.2-13.8)
$35,000 - $49,999 12.0 (9.8-14.6) 6.6 (5.1-8.5)
$50,000 - $74,999 14.3 (11.9-17.1) 7.4 (5.9-9.3)
≥ $75,000 14.4 (12.8-16.3) 8.8 (7.5-10.3)
Health Insurance
Insured 15.7 (14.7-16.7) 10.5 (9.7-11.4)
Uninsured 16.0 (12.7-19.9) 7.4 (5.4-9.9)
Disability Status
No disabilities 13.3 (12.2-14.4) 7.8 (7.0-8.7) Adults with disabilities 23.8 (21.7-26.2) 17.8 (16.0-19.9)
a Among all adults, the proportion reporting that they were ever told by a doctor, nurse, or other health care professional that they had asthma. b Among all adults, the proportion reporting that they still have asthma.
Asthma is a chronic inflammatory disorder of the lungs, characterized by wheezing, coughing, difficulty breathing, and chest tightness. Allergies, a family history of asthma or allergy, low birth weight, and exposure to tobacco smoke are just a few of the potential risk factors that are associated with the development of asthma.25
In 2015, an estimated 15.7% of Michigan adults
reported that they were ever diagnosed with asthma and 10.2% reported that they currently have asthma.
The prevalence of both lifetime and current
asthma decreased with age and increasing household income level.
Females reported a significantly higher
prevalence than males for both lifetime (17.2% vs. 14.2%) and current asthma (12.5% and 7.8%).
The prevalence of both lifetime and current
asthma were similar by race/ethnicity.
Adults with disabilities reported a significantly
higher prevalence than adults without disabilities for both lifetime (23.8% vs. 13.3%) and current asthma (17.8% vs. 7.8%).
In 2015, the prevalence of ever being
diagnosed with asthma among Michigan adults (15.7%) was higher than the U.S. median prevalence (14.3%).
23
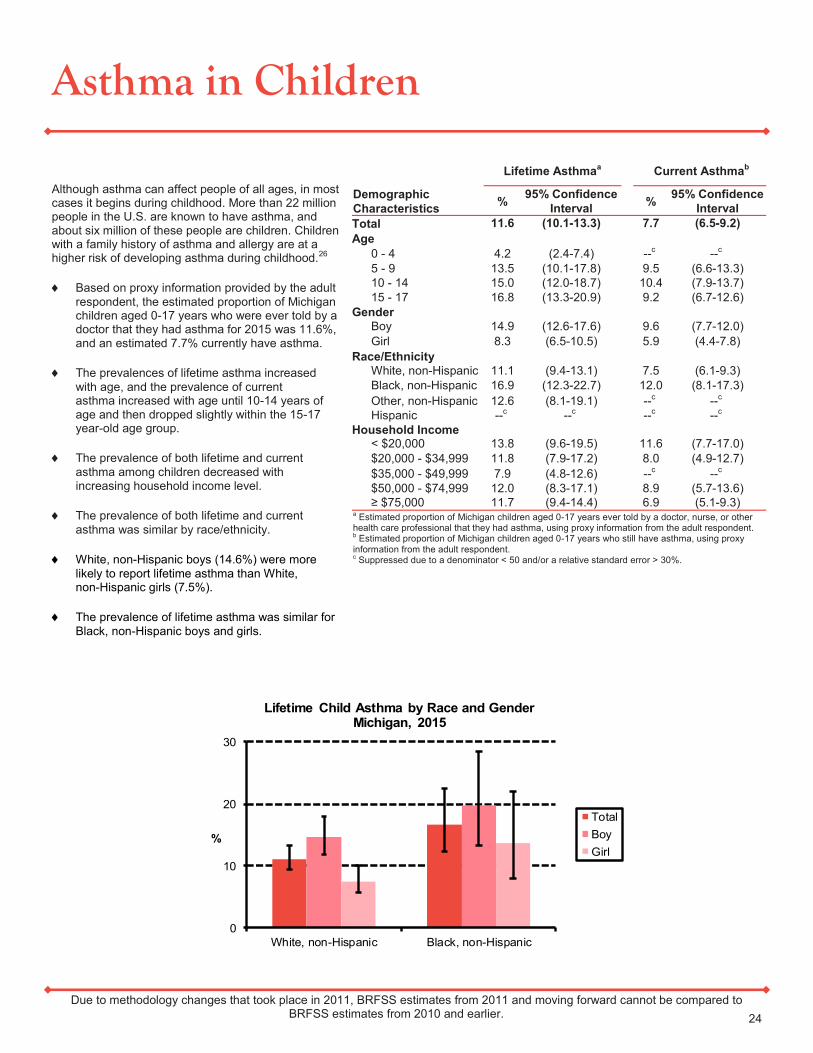
Asthma in Children
Due to methodology changes that took place in 2011, BRFSS estimates from 2011 and moving forward cannot be compared to BRFSS estimates from 2010 and earlier.
Demographic
Characteristics
Lifetime Asthmaa Current Asthmab
% 95% Confidence
Interval %
95% Confidence
Interval
Total 11.6 (10.1-13.3) 7.7 (6.5-9.2)
Age
0 - 4 4.2 (2.4-7.4) --c --c
5 - 9 13.5 (10.1-17.8) 9.5 (6.6-13.3)
10 - 14 15.0 (12.0-18.7) 10.4 (7.9-13.7)
15 - 17 16.8 (13.3-20.9) 9.2 (6.7-12.6)
Gender
Boy 14.9 (12.6-17.6) 9.6 (7.7-12.0)
Girl 8.3 (6.5-10.5) 5.9 (4.4-7.8)
Race/Ethnicity
White, non-Hispanic 11.1 (9.4-13.1) 7.5 (6.1-9.3)
Black, non-Hispanic 16.9 (12.3-22.7) 12.0 (8.1-17.3)
Other, non-Hispanic 12.6 (8.1-19.1) --c --c
Hispanic --c --c --c --c
Household Income
< $20,000 13.8 (9.6-19.5) 11.6 (7.7-17.0)
$20,000 - $34,999 11.8 (7.9-17.2) 8.0 (4.9-12.7)
$35,000 - $49,999 7.9 (4.8-12.6) --c --c
$50,000 - $74,999 12.0 (8.3-17.1) 8.9 (5.7-13.6)
≥ $75,000 11.7 (9.4-14.4) 6.9 (5.1-9.3) a Estimated proportion of Michigan children aged 0-17 years ever told by a doctor, nurse, or other health care professional that they had asthma, using proxy information from the adult respondent. b Estimated proportion of Michigan children aged 0-17 years who still have asthma, using proxy information from the adult respondent. c Suppressed due to a denominator < 50 and/or a relative standard error > 30%.
Although asthma can affect people of all ages, in most cases it begins during childhood. More than 22 million people in the U.S. are known to have asthma, and about six million of these people are children. Children with a family history of asthma and allergy are at a higher risk of developing asthma during childhood.26
Based on proxy information provided by the adult
respondent, the estimated proportion of Michigan children aged 0-17 years who were ever told by a doctor that they had asthma for 2015 was 11.6%, and an estimated 7.7% currently have asthma.
The prevalences of lifetime asthma increased
with age, and the prevalence of current asthma increased with age until 10-14 years of age and then dropped slightly within the 15-17 year-old age group.
The prevalence of both lifetime and current
asthma among children decreased with increasing household income level.
The prevalence of both lifetime and current
asthma was similar by race/ethnicity.
White, non-Hispanic boys (14.6%) were more
likely to report lifetime asthma than White, non-Hispanic girls (7.5%).
The prevalence of lifetime asthma was similar for
Black, non-Hispanic boys and girls.
24
0
10
20
30
White, non-Hispanic Black, non-Hispanic
%
Lifetime Child Asthma by Race and GenderMichigan, 2015
Total
Boy
Girl
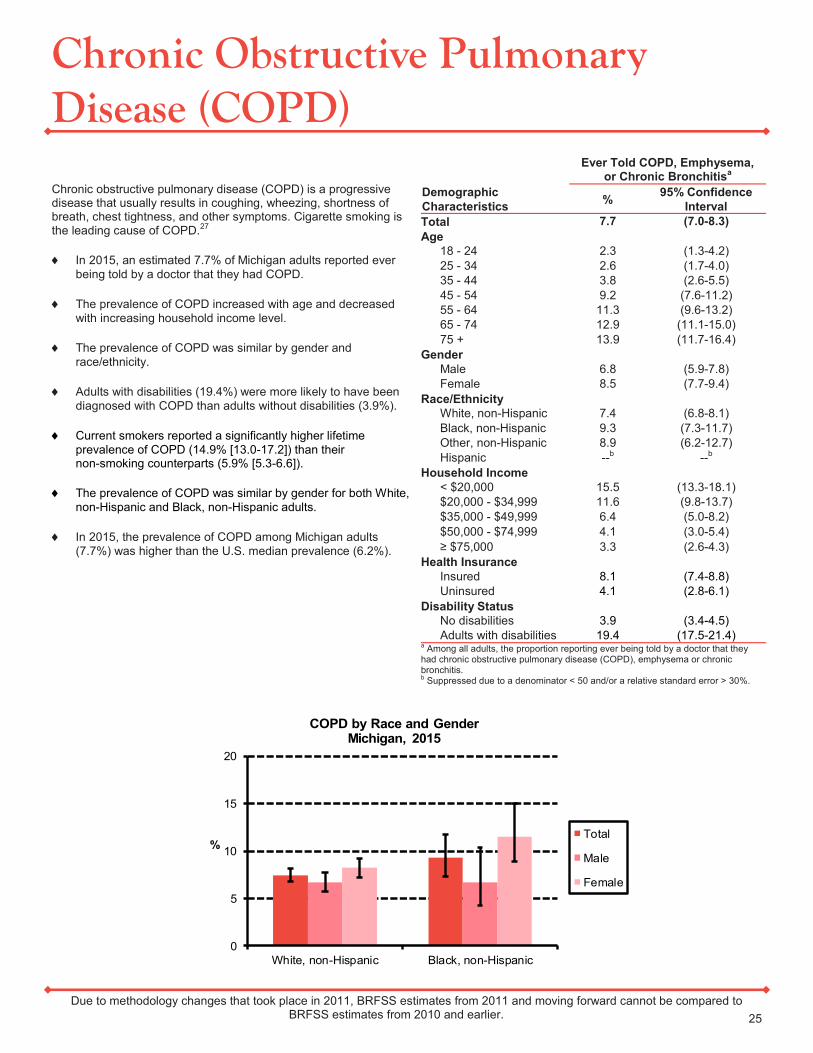
Chronic Obstructive Pulmonary Disease (COPD)
Due to methodology changes that took place in 2011, BRFSS estimates from 2011 and moving forward cannot be compared to BRFSS estimates from 2010 and earlier.
Demographic
Characteristics
Ever Told COPD, Emphysema, or Chronic Bronchitisa
% 95% Confidence
Interval
Total 7.7 (7.0-8.3)
Age
18 - 24 2.3 (1.3-4.2)
25 - 34 2.6 (1.7-4.0)
35 - 44 3.8 (2.6-5.5)
45 - 54 9.2 (7.6-11.2)
55 - 64 11.3 (9.6-13.2)
65 - 74 12.9 (11.1-15.0)
75 + 13.9 (11.7-16.4)
Gender
Male 6.8 (5.9-7.8)
Female 8.5 (7.7-9.4)
Race/Ethnicity
White, non-Hispanic 7.4 (6.8-8.1)
Black, non-Hispanic 9.3 (7.3-11.7)
Other, non-Hispanic 8.9 (6.2-12.7)
Hispanic --b --b
Household Income
< $20,000 15.5 (13.3-18.1)
$20,000 - $34,999 11.6 (9.8-13.7)
$35,000 - $49,999 6.4 (5.0-8.2)
$50,000 - $74,999 4.1 (3.0-5.4)
≥ $75,000 3.3 (2.6-4.3)
Health Insurance
Insured 8.1 (7.4-8.8)
Uninsured 4.1 (2.8-6.1)
Disability Status
No disabilities 3.9 (3.4-4.5)
Adults with disabilities 19.4 (17.5-21.4) a Among all adults, the proportion reporting ever being told by a doctor that they had chronic obstructive pulmonary disease (COPD), emphysema or chronic bronchitis. b Suppressed due to a denominator < 50 and/or a relative standard error > 30%.
Chronic obstructive pulmonary disease (COPD) is a progressive disease that usually results in coughing, wheezing, shortness of breath, chest tightness, and other symptoms. Cigarette smoking is the leading cause of COPD.27
In 2015, an estimated 7.7% of Michigan adults reported ever
being told by a doctor that they had COPD.
The prevalence of COPD increased with age and decreased
with increasing household income level.
The prevalence of COPD was similar by gender and
race/ethnicity.
Adults with disabilities (19.4%) were more likely to have been
diagnosed with COPD than adults without disabilities (3.9%).
Current smokers reported a significantly higher lifetime
prevalence of COPD (14.9% [13.0-17.2]) than their non-smoking counterparts (5.9% [5.3-6.6]).
The prevalence of COPD was similar by gender for both White,
non-Hispanic and Black, non-Hispanic adults.
In 2015, the prevalence of COPD among Michigan adults
(7.7%) was higher than the U.S. median prevalence (6.2%).
25
0
5
10
15
20
White, non-Hispanic Black, non-Hispanic
%
COPD by Race and GenderMichigan, 2015
Total
Male
Female

15
20
25
30
35
'05 '07 '09 '10 '11 '12 '13 '14 '15
%
Ever Told ArthritisU.S. vs. Michigan, 2005-2015
U.S. median Michigan
Arthritis
Due to methodology changes that took place in 2011, BRFSS estimates from 2011 and moving forward cannot be compared to BRFSS estimates from 2010 and earlier.
Demographic
Characteristics
Ever Told Arthritisa
% 95% Confidence
Interval
Total 30.0 (28.9-31.1)
Age
18 - 24 4.2 (2.7-6.6)
25 - 34 10.3 (8.2-12.7)
35 - 44 18.7 (16.1-21.6)
45 - 54 32.9 (30.1-35.9)
55 - 64 42.6 (40.0-45.2)
65 - 74 52.7 (49.8-55.6)
75 + 61.5 (57.9-65.0)
Gender
Male 25.2 (23.7-26.8)
Female 34.5 (33.0-36.1)
Race/Ethnicity
White, non-Hispanic 31.9 (30.6-33.2)
Black, non-Hispanic 26.4 (23.2-29.8)
Other, non-Hispanic 21.3 (17.0-26.3)
Hispanic 16.8 (12.1-22.9)
Household Income
< $20,000 37.8 (34.5-41.3)
$20,000 - $34,999 36.1 (33.1-39.1)
$35,000 - $49,999 36.1 (32.7-39.6)
$50,000 - $74,999 27.8 (25.0-30.8)
≥ $75,000 20.1 (18.3-22.0)
Health Insurance
Insured 31.6 (30.4-32.8)
Uninsured 17.4 (14.1-21.1)
Disability Status
No disabilities 20.1 (19.0-21.2)
Adults with disabilities 60.6 (58.0-63.1) a Among all adults, the proportion reporting ever being told by a doctor that they had some form of arthritis, rheumatoid arthritis, gout, lupus, or fibromyalgia.
Arthritis and rheumatism are the leading causes of disability within the U.S. These conditions have been diagnosed in over 54 million U.S. adults.28
In 2015, an estimated 30.0% of Michigan adults reported ever
being told by a doctor that they had some form of arthritis, rheumatoid arthritis, gout, lupus, or fibromyalgia.
Females (34.5%) reported a significantly higher prevalence of
arthritis than males (25.2%).
White, non-Hispanic adults (31.9%) reported a higher
prevalence of arthritis than Black, non-Hispanic adults (26.4%).
The prevalence of arthritis increased with age and decreased
with increasing household income level.
Uninsured adults (17.4%) were less likely to have been
diagnosed with arthritis than insured adults (31.6%), while adults with disabilities (60.6%) were more likely to have been diagnosed than adults without disabilities (20.1%).
In 2015, the prevalence of arthritis among Michigan adults
(30.0%) was significantly higher than the U.S. median prevalence (25.3%).
26
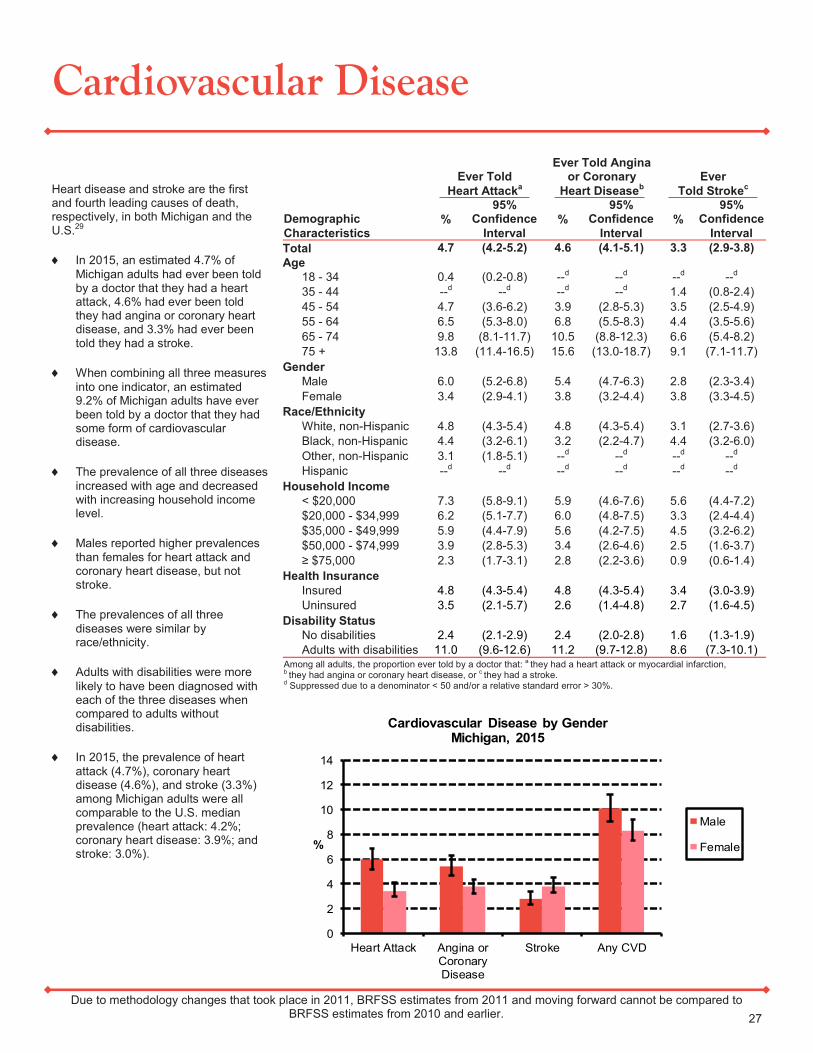
Cardiovascular Disease
Due to methodology changes that took place in 2011, BRFSS estimates from 2011 and moving forward cannot be compared to BRFSS estimates from 2010 and earlier.
Demographic
Characteristics
Ever Told
Heart Attacka
Ever Told Angina or Coronary
Heart Diseaseb
Ever
Told Strokec
%
95% Confidence
Interval %
95% Confidence
Interval %
95% Confidence
Interval
Total 4.7 (4.2-5.2) 4.6 (4.1-5.1) 3.3 (2.9-3.8)
Age
18 - 34 0.4 (0.2-0.8) --d --d --d --d
35 - 44 --d --d --d --d 1.4 (0.8-2.4)
45 - 54 4.7 (3.6-6.2) 3.9 (2.8-5.3) 3.5 (2.5-4.9)
55 - 64 6.5 (5.3-8.0) 6.8 (5.5-8.3) 4.4 (3.5-5.6)
65 - 74 9.8 (8.1-11.7) 10.5 (8.8-12.3) 6.6 (5.4-8.2)
75 + 13.8 (11.4-16.5) 15.6 (13.0-18.7) 9.1 (7.1-11.7)
Gender
Male 6.0 (5.2-6.8) 5.4 (4.7-6.3) 2.8 (2.3-3.4)
Female 3.4 (2.9-4.1) 3.8 (3.2-4.4) 3.8 (3.3-4.5)
Race/Ethnicity
White, non-Hispanic 4.8 (4.3-5.4) 4.8 (4.3-5.4) 3.1 (2.7-3.6)
Black, non-Hispanic 4.4 (3.2-6.1) 3.2 (2.2-4.7) 4.4 (3.2-6.0)
Other, non-Hispanic 3.1 (1.8-5.1) --d --d --d --d
Hispanic --d --d --d --d --d --d
Household Income
< $20,000 7.3 (5.8-9.1) 5.9 (4.6-7.6) 5.6 (4.4-7.2)
$20,000 - $34,999 6.2 (5.1-7.7) 6.0 (4.8-7.5) 3.3 (2.4-4.4)
$35,000 - $49,999 5.9 (4.4-7.9) 5.6 (4.2-7.5) 4.5 (3.2-6.2)
$50,000 - $74,999 3.9 (2.8-5.3) 3.4 (2.6-4.6) 2.5 (1.6-3.7)
≥ $75,000 2.3 (1.7-3.1) 2.8 (2.2-3.6) 0.9 (0.6-1.4)
Health Insurance
Insured 4.8 (4.3-5.4) 4.8 (4.3-5.4) 3.4 (3.0-3.9)
Uninsured 3.5 (2.1-5.7) 2.6 (1.4-4.8) 2.7 (1.6-4.5)
Disability Status
No disabilities 2.4 (2.1-2.9) 2.4 (2.0-2.8) 1.6 (1.3-1.9)
Adults with disabilities 11.0 (9.6-12.6) 11.2 (9.7-12.8) 8.6 (7.3-10.1) Among all adults, the proportion ever told by a doctor that: a they had a heart attack or myocardial infarction, b they had angina or coronary heart disease, or c they had a stroke. d Suppressed due to a denominator < 50 and/or a relative standard error > 30%.
Heart disease and stroke are the first and fourth leading causes of death, respectively, in both Michigan and the U.S.29
In 2015, an estimated 4.7% of
Michigan adults had ever been told by a doctor that they had a heart attack, 4.6% had ever been told they had angina or coronary heart disease, and 3.3% had ever been told they had a stroke.
When combining all three measures
into one indicator, an estimated 9.2% of Michigan adults have ever been told by a doctor that they had some form of cardiovascular disease.
The prevalence of all three diseases
increased with age and decreased with increasing household income level.
Males reported higher prevalences
than females for heart attack and coronary heart disease, but not stroke.
The prevalences of all three
diseases were similar by race/ethnicity.
Adults with disabilities were more
likely to have been diagnosed with each of the three diseases when compared to adults without disabilities.
In 2015, the prevalence of heart
attack (4.7%), coronary heart disease (4.6%), and stroke (3.3%) among Michigan adults were all comparable to the U.S. median prevalence (heart attack: 4.2%; coronary heart disease: 3.9%; and stroke: 3.0%).
27
0
2
4
6
8
10
12
14
Heart Attack Angina orCoronaryDisease
Stroke Any CVD
%
Cardiovascular Disease by GenderMichigan, 2015
Male
Female
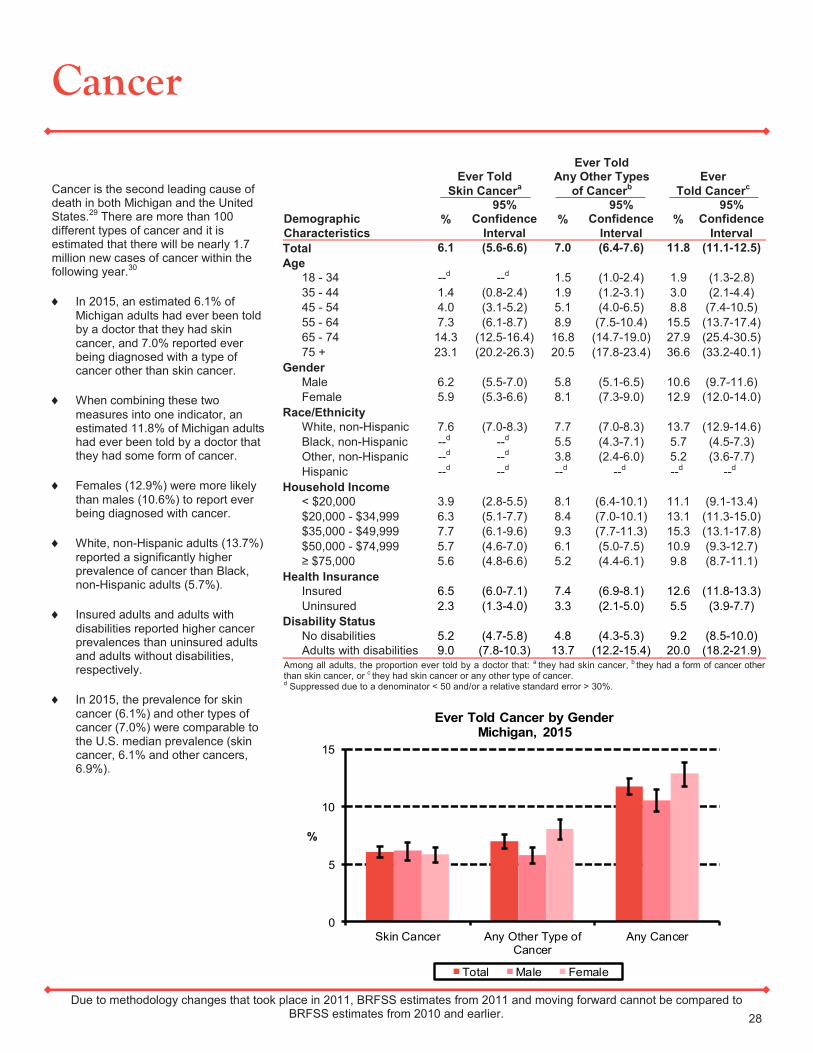
Cancer
Due to methodology changes that took place in 2011, BRFSS estimates from 2011 and moving forward cannot be compared to BRFSS estimates from 2010 and earlier.
Demographic
Characteristics
Ever Told
Skin Cancera
Ever Told Any Other Types
of Cancerb
Ever
Told Cancerc
%
95% Confidence
Interval %
95% Confidence
Interval %
95% Confidence
Interval
Total 6.1 (5.6-6.6) 7.0 (6.4-7.6) 11.8 (11.1-12.5)
Age
18 - 34 --d --d 1.5 (1.0-2.4) 1.9 (1.3-2.8)
35 - 44 1.4 (0.8-2.4) 1.9 (1.2-3.1) 3.0 (2.1-4.4)
45 - 54 4.0 (3.1-5.2) 5.1 (4.0-6.5) 8.8 (7.4-10.5)
55 - 64 7.3 (6.1-8.7) 8.9 (7.5-10.4) 15.5 (13.7-17.4)
65 - 74 14.3 (12.5-16.4) 16.8 (14.7-19.0) 27.9 (25.4-30.5)
75 + 23.1 (20.2-26.3) 20.5 (17.8-23.4) 36.6 (33.2-40.1)
Gender
Male 6.2 (5.5-7.0) 5.8 (5.1-6.5) 10.6 (9.7-11.6)
Female 5.9 (5.3-6.6) 8.1 (7.3-9.0) 12.9 (12.0-14.0)
Race/Ethnicity
White, non-Hispanic 7.6 (7.0-8.3) 7.7 (7.0-8.3) 13.7 (12.9-14.6)
Black, non-Hispanic --d --d 5.5 (4.3-7.1) 5.7 (4.5-7.3)
Other, non-Hispanic --d --d 3.8 (2.4-6.0) 5.2 (3.6-7.7)
Hispanic --d --d --d --d --d --d
Household Income
< $20,000 3.9 (2.8-5.5) 8.1 (6.4-10.1) 11.1 (9.1-13.4)
$20,000 - $34,999 6.3 (5.1-7.7) 8.4 (7.0-10.1) 13.1 (11.3-15.0)
$35,000 - $49,999 7.7 (6.1-9.6) 9.3 (7.7-11.3) 15.3 (13.1-17.8)
$50,000 - $74,999 5.7 (4.6-7.0) 6.1 (5.0-7.5) 10.9 (9.3-12.7)
≥ $75,000 5.6 (4.8-6.6) 5.2 (4.4-6.1) 9.8 (8.7-11.1)
Health Insurance
Insured 6.5 (6.0-7.1) 7.4 (6.9-8.1) 12.6 (11.8-13.3)
Uninsured 2.3 (1.3-4.0) 3.3 (2.1-5.0) 5.5 (3.9-7.7)
Disability Status
No disabilities 5.2 (4.7-5.8) 4.8 (4.3-5.3) 9.2 (8.5-10.0)
Adults with disabilities 9.0 (7.8-10.3) 13.7 (12.2-15.4) 20.0 (18.2-21.9) Among all adults, the proportion ever told by a doctor that: a they had skin cancer, b they had a form of cancer other than skin cancer, or c they had skin cancer or any other type of cancer. d Suppressed due to a denominator < 50 and/or a relative standard error > 30%.
Cancer is the second leading cause of death in both Michigan and the United States.29 There are more than 100 different types of cancer and it is estimated that there will be nearly 1.7 million new cases of cancer within the following year.30
In 2015, an estimated 6.1% of
Michigan adults had ever been told by a doctor that they had skin cancer, and 7.0% reported ever being diagnosed with a type of cancer other than skin cancer.
When combining these two
measures into one indicator, an estimated 11.8% of Michigan adults had ever been told by a doctor that they had some form of cancer.
Females (12.9%) were more likely
than males (10.6%) to report ever being diagnosed with cancer.
White, non-Hispanic adults (13.7%)
reported a significantly higher prevalence of cancer than Black, non-Hispanic adults (5.7%).
Insured adults and adults with
disabilities reported higher cancer prevalences than uninsured adults and adults without disabilities, respectively.
In 2015, the prevalence for skin
cancer (6.1%) and other types of cancer (7.0%) were comparable to the U.S. median prevalence (skin cancer, 6.1% and other cancers, 6.9%).
28
0
5
10
15
Skin Cancer Any Other Type ofCancer
Any Cancer
%
Ever Told Cancer by GenderMichigan, 2015
Total Male Female
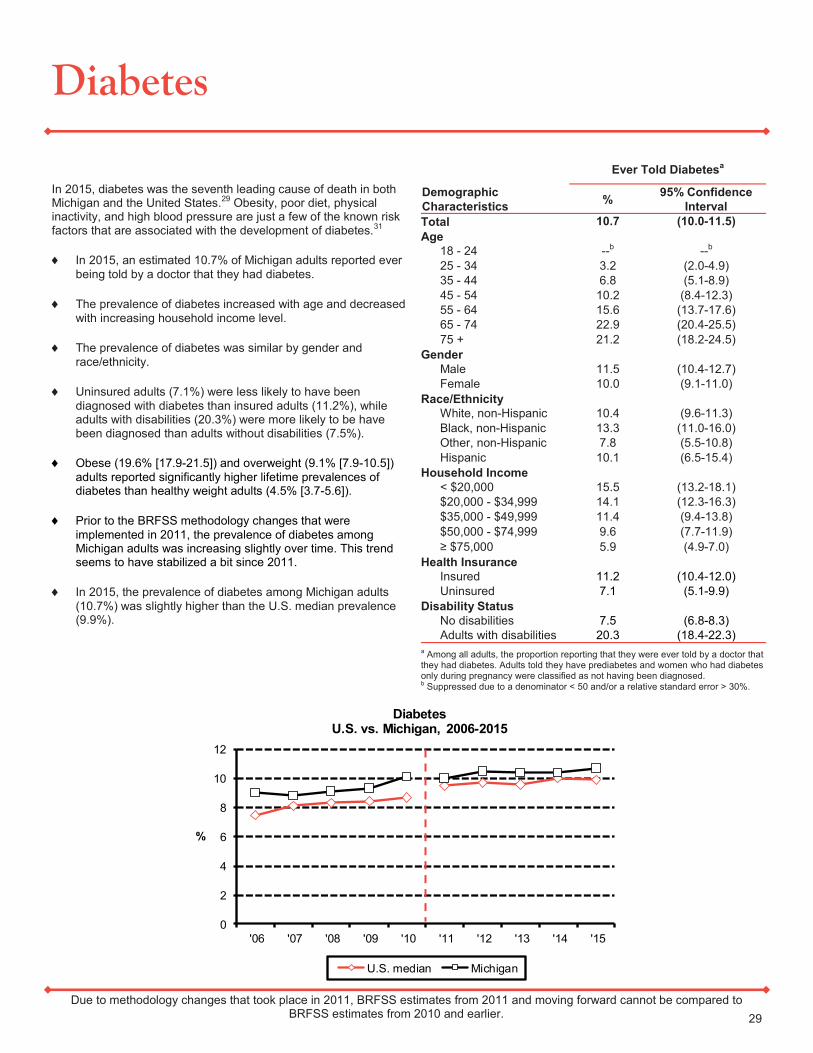
0
2
4
6
8
10
12
'06 '07 '08 '09 '10 '11 '12 '13 '14 '15
%
DiabetesU.S. vs. Michigan, 2006-2015
U.S. median Michigan
Diabetes
Due to methodology changes that took place in 2011, BRFSS estimates from 2011 and moving forward cannot be compared to BRFSS estimates from 2010 and earlier.
Demographic
Characteristics
Ever Told Diabetesa
% 95% Confidence
Interval
Total 10.7 (10.0-11.5)
Age
18 - 24 --b --b
25 - 34 3.2 (2.0-4.9)
35 - 44 6.8 (5.1-8.9)
45 - 54 10.2 (8.4-12.3)
55 - 64 15.6 (13.7-17.6)
65 - 74 22.9 (20.4-25.5)
75 + 21.2 (18.2-24.5)
Gender
Male 11.5 (10.4-12.7)
Female 10.0 (9.1-11.0)
Race/Ethnicity
White, non-Hispanic 10.4 (9.6-11.3)
Black, non-Hispanic 13.3 (11.0-16.0)
Other, non-Hispanic 7.8 (5.5-10.8)
Hispanic 10.1 (6.5-15.4)
Household Income
< $20,000 15.5 (13.2-18.1)
$20,000 - $34,999 14.1 (12.3-16.3)
$35,000 - $49,999 11.4 (9.4-13.8)
$50,000 - $74,999 9.6 (7.7-11.9)
≥ $75,000 5.9 (4.9-7.0)
Health Insurance
Insured 11.2 (10.4-12.0)
Uninsured 7.1 (5.1-9.9)
Disability Status
No disabilities 7.5 (6.8-8.3)
Adults with disabilities 20.3 (18.4-22.3)
a Among all adults, the proportion reporting that they were ever told by a doctor that they had diabetes. Adults told they have prediabetes and women who had diabetes only during pregnancy were classified as not having been diagnosed. b Suppressed due to a denominator < 50 and/or a relative standard error > 30%.
In 2015, diabetes was the seventh leading cause of death in both Michigan and the United States.29 Obesity, poor diet, physical inactivity, and high blood pressure are just a few of the known risk factors that are associated with the development of diabetes.31
In 2015, an estimated 10.7% of Michigan adults reported ever
being told by a doctor that they had diabetes.
The prevalence of diabetes increased with age and decreased
with increasing household income level.
The prevalence of diabetes was similar by gender and
race/ethnicity.
Uninsured adults (7.1%) were less likely to have been
diagnosed with diabetes than insured adults (11.2%), while adults with disabilities (20.3%) were more likely to be have been diagnosed than adults without disabilities (7.5%).
Obese (19.6% [17.9-21.5]) and overweight (9.1% [7.9-10.5])
adults reported significantly higher lifetime prevalences of diabetes than healthy weight adults (4.5% [3.7-5.6]).
Prior to the BRFSS methodology changes that were
implemented in 2011, the prevalence of diabetes among Michigan adults was increasing slightly over time. This trend seems to have stabilized a bit since 2011.
In 2015, the prevalence of diabetes among Michigan adults
(10.7%) was slightly higher than the U.S. median prevalence (9.9%).
29

Kidney Disease
Due to methodology changes that took place in 2011, BRFSS estimates from 2011 and moving forward cannot be compared to BRFSS estimates from 2010 and earlier.
Demographic
Characteristics
Ever Told Kidney Diseasea
% 95% Confidence
Interval
Total 3.4 (3.0-3.9)
Age
18 - 24 --b --b
25 - 34 1.1 (0.6-2.0)
35 - 44 2.0 (1.2-3.0)
45 - 54 2.3 (1.6-3.3)
55 - 64 4.5 (3.5-5.8)
65 - 74 7.0 (5.6-8.7)
75 + 8.7 (6.8-11.0)
Gender
Male 3.1 (2.5-3.7)
Female 3.8 (3.2-4.4)
Race/Ethnicity
White, non-Hispanic 3.4 (3.0-3.9)
Black, non-Hispanic 4.6 (3.3-6.4)
Other, non-Hispanic 2.3 (1.2-4.1)
Hispanic --b --b
Household Income
< $20,000 5.5 (4.2-7.0)
$20,000 - $34,999 5.0 (3.9-6.4)
$35,000 - $49,999 3.6 (2.5-5.0)
$50,000 - $74,999 2.6 (1.7-3.8)
≥ $75,000 1.9 (1.4-2.5)
Health Insurance
Insured 3.7 (3.3-4.2)
Uninsured --b --b
Disability Status
No disabilities 1.8 (1.5-2.2)
Adults with disabilities 8.5 (7.3-9.9) a Among all adults, the proportion reporting ever being told by a doctor that they had kidney disease. b Suppressed due to a denominator < 50 and/or a relative standard error > 30%.
Kidney disease is a condition in which the kidneys are damaged and cannot filter blood properly. Adults with diabetes or hypertension are at increased risk of kidney disease. Kidney disease is also a risk factor for the development of cardiovascular disease.32
In 2015, an estimated 3.4% of Michigan adults reported ever
being told by a doctor that they had kidney disease.
The prevalence of kidney disease increased with age and
decreased with increasing household income level.
The prevalence of kidney disease was similar by gender and
race/ethnicity.
Adults with disabilities (8.5%) were more likely to have been
diagnosed with kidney disease than adults without disabilities (1.8%).
Michigan adults with diabetes (9.8% [95% CI: 7.9-12.1])
were nearly four times more likely to have being diagnosed with kidney disease than adults without diabetes (2.7% [95% CI: 2.3-3.1]).
The prevalence of kidney disease was similar by gender for
both White, non-Hispanic and Black, non-Hispanic adults.
In 2015, the prevalence of kidney disease among Michigan
adults (3.4%) was similar to the U.S. median prevalence (2.7%).
30
0
2
4
6
8
10
White, non-Hispanic Black, non-Hispanic
%
Kidney Disease by Race and GenderMichigan, 2015
Total
Male
Female
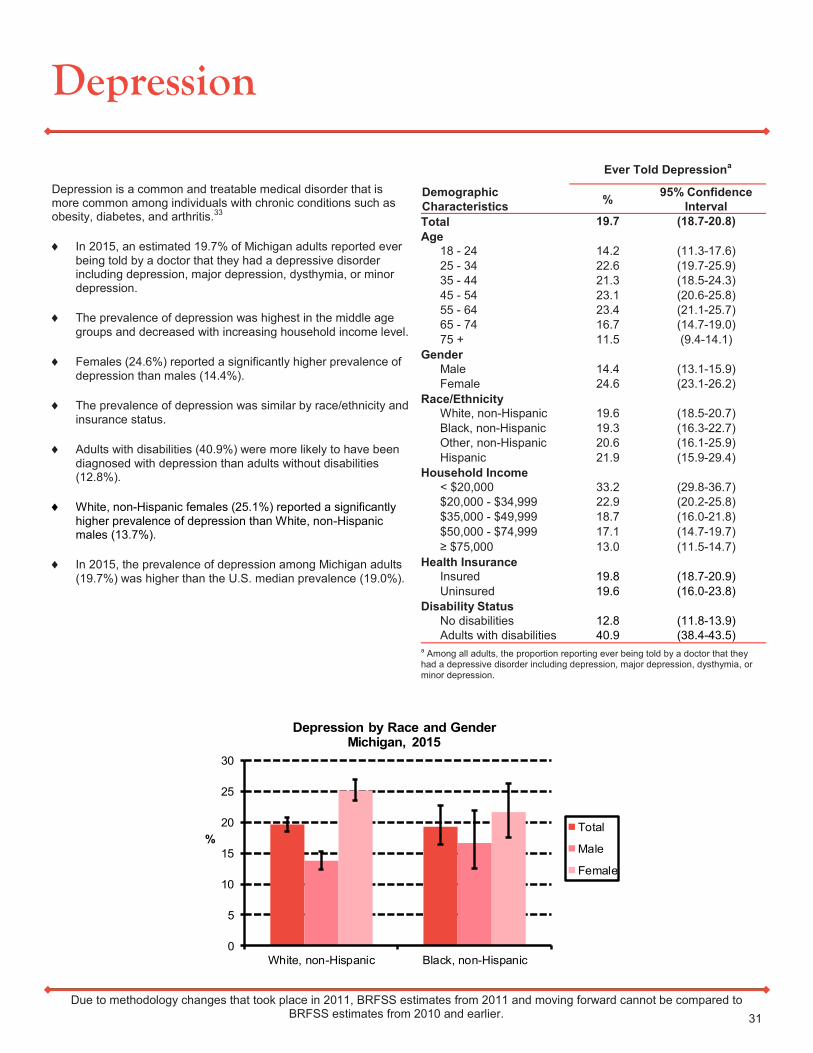
Depression
Due to methodology changes that took place in 2011, BRFSS estimates from 2011 and moving forward cannot be compared to BRFSS estimates from 2010 and earlier.
Demographic
Characteristics
Ever Told Depressiona
% 95% Confidence
Interval
Total 19.7 (18.7-20.8)
Age
18 - 24 14.2 (11.3-17.6)
25 - 34 22.6 (19.7-25.9)
35 - 44 21.3 (18.5-24.3)
45 - 54 23.1 (20.6-25.8)
55 - 64 23.4 (21.1-25.7)
65 - 74 16.7 (14.7-19.0)
75 + 11.5 (9.4-14.1)
Gender
Male 14.4 (13.1-15.9)
Female 24.6 (23.1-26.2)
Race/Ethnicity
White, non-Hispanic 19.6 (18.5-20.7)
Black, non-Hispanic 19.3 (16.3-22.7)
Other, non-Hispanic 20.6 (16.1-25.9)
Hispanic 21.9 (15.9-29.4)
Household Income
< $20,000 33.2 (29.8-36.7)
$20,000 - $34,999 22.9 (20.2-25.8)
$35,000 - $49,999 18.7 (16.0-21.8)
$50,000 - $74,999 17.1 (14.7-19.7)
≥ $75,000 13.0 (11.5-14.7)
Health Insurance
Insured 19.8 (18.7-20.9)
Uninsured 19.6 (16.0-23.8)
Disability Status
No disabilities 12.8 (11.8-13.9)
Adults with disabilities 40.9 (38.4-43.5) a Among all adults, the proportion reporting ever being told by a doctor that they had a depressive disorder including depression, major depression, dysthymia, or minor depression.
Depression is a common and treatable medical disorder that is more common among individuals with chronic conditions such as obesity, diabetes, and arthritis.33
In 2015, an estimated 19.7% of Michigan adults reported ever
being told by a doctor that they had a depressive disorder including depression, major depression, dysthymia, or minor depression.
The prevalence of depression was highest in the middle age
groups and decreased with increasing household income level.
Females (24.6%) reported a significantly higher prevalence of
depression than males (14.4%).
The prevalence of depression was similar by race/ethnicity and
insurance status.
Adults with disabilities (40.9%) were more likely to have been
diagnosed with depression than adults without disabilities (12.8%).
White, non-Hispanic females (25.1%) reported a significantly
higher prevalence of depression than White, non-Hispanic males (13.7%).
In 2015, the prevalence of depression among Michigan adults
(19.7%) was higher than the U.S. median prevalence (19.0%).
31
0
5
10
15
20
25
30
White, non-Hispanic Black, non-Hispanic
%
Depression by Race and GenderMichigan, 2015
Total
Male
Female

Acknowledgements
Data was collected for the 2015 Michigan Behavioral Risk Factor Survey (MiBRFS) by the Institute for Public Policy and Social Research, Office for Survey Research, at Michigan State University. The authors are grateful to Linda Stork, Debra Rusz, and the many BRFSS supervisors and interviewers for conducting the survey. The assistance and financial support provided by the Population Health Surveillance Branch of the Centers for Disease Control and Prevention and our many MDHHS program partners is greatly appreciated. We are especially grateful to the residents of Michigan who agreed to participate in this survey.
32
Bibliography
1. Research Triangle Institute. 2012. SUDAAN Language Manual, Volumes 1 and 2, Release 11. Research Triangle Park, NC: Research Triangle Institute.
2. Centers for Disease Control and Prevention. 2015. 2015 Summary Data Quality Report. https://www.cdc.gov/brfss/annual_data/2015/pdf/2015-sdqr.pdf. (May 2017).
3. Idler E, Benyamini Y. Self-rated Health and Mortality: a Review of Twenty-Seven Community Studies. J Health Soc Behav. 1997; 38(1): 21-37.
4. U.S. Department of Justice, Civil Rights Division. 2009. A Guide to Disability Rights Laws. https://www.ada.gov/cguide.htm. (May 2017).
5. National Institutes of Health, NHLBI Obesity Education Initiative. 1998. Clinical Guidelines on the Identification, Evaluation, and Treatment of Overweight and Obesity in Adults. https://www.nhlbi.nih.gov/files/docs/guidelines/ob_gdlns.pdf. (May 2017).
6. Finkelstein EA, Trogdon JG, Cohen JW, Dietz W. Annual Medical Spending Attributable to Obesity: Payer- and Service-specific Estimates. Health Affairs 2009; 28(5): w822-w831.
7. U.S. Department of Health and Human Services. 2015. Healthy People 2020 Topics and Objectives. https://www.healthypeople.gov/2020/topics-objectives. (May 2017).
8. Hoffman C, Paradise J. Health Insurance and Access to Health Care in the United States. Ann N Y Acad Sci. 1136: 149-160.
9. U.S. Centers for Medicare & Medicaid Services. 2017. How to Pick a Health Insurance Plan. https://www.healthcare.gov/choose-a-plan/plan-types/. (May 2017).
10. U.S. Census Bureau. 2016. Health Insurance Coverage in the United States: 2015. https://www.census.gov/content/ dam/Census/library/publications/2016/demo/p60-257.pdf. (May 2017).
11. Centers for Disease Control and Prevention. 2010. Social Determinants of Equity and Social Determinants of Health.
http://minorityhealth.hhs.gov/Assets/pdf/Checked/1/CamaraJones.pdf. (May 2017).
12. Centers for Disease Control and Prevention. 2015. Physical Activity and Health - The Benefits of Physical Activity. https://www.cdc.gov/physicalactivity/basics/pa-health/. (May 2017).
13. U.S. Department of Health and Human Services. 2008. 2008 Physical Activity Guidelines for Americans. https://
health.gov/paguidelines/pdf/paguide.pdf. (May 2017).
14. Centers for Disease Control and Prevention. 2013. State Indicator Report on Fruits and Vegetables. https://
www.cdc.gov/nutrition/downloads/state-indicator-report-fruits-vegetables-2013.pdf. (May 2017).
15. U.S. Department of Health and Human Services. 2014. The Health Consequences of Smoking - 50 Years of Progress: A Report of the Surgeon General. https://www.surgeongeneral.gov/library/reports/50-years-of-progress/full-report.pdf. (May 2017).
16. Cobb CO, Ward KD, Mziak W, Shihadeh A, Eissenberg T. Waterpipe Tobacco Smoking: An Emerging Health Crisis in the United States. American Journal of Health Behavior. 2010; 34(3): 275-285.
17. Centers for Disease Control and Prevention. Excessive Alcohol Use - Preventing a Leading Risk for Death, Disease, and Injury. 2015. https://www.cdc.gov/chronicdisease/resources/publications/aag/alcohol.htm. (May 2017).
18. U.S. Department of Transportation, National Highway Traffic Safety Administration. 2017. Traffic Safety Facts, 2015 Data - Occupant Protection. https://crashstats.nhtsa.dot.gov/Api/Public/Publication/812374. (May 2017).
33
Bibliography
19. Centers for Disease Control and Prevention. 2016. High Blood Pressure - High Blood Pressure Facts. https://
www.cdc.gov/bloodpressure/facts.htm. (May 2017).
20. Centers for Disease Control and Prevention. 2015. Family Health - Regular Checkups are Important. https://www.cdc.gov/family/checkup/. (May 2017).
21. Centers for Disease Control and Prevention. 2015. High Cholesterol Facts. https://www.cdc.gov/cholesterol/
facts.htm. (May 2017).
22. Michigan Department of Health and Human Services. 2016. 2014 Michigan Resident Death File. Division of Vital Records & Health Statistics.
23. Centers for Disease Control and Prevention. 2017. Recommended Adult Immunization Schedule, by Vaccine and Age Group - United States, 2017. https://www.cdc.gov/vaccines/schedules/hcp/imz/adult.html. (May 2017).
24. Panel on Antiretroviral Guidelines for Adults and Adolescents. Guidelines for the Use of Antiretroviral Agents in HIV-1-Infected Adults and Adolescents. Department of Health and Human Services. https://aidsinfo.nih.gov/contentfiles/lvguidelines/adultandadolescentgl.pdf. (May 2017).
25. Centers for Disease Control and Prevention. 2016. Asthma’s Impact on the Nation. https://www.cdc.gov/asthma/impacts_nation/. (May 2017).
26. U.S. Department of Health and Human Services, National Heart Lung and Blood Institute. 2014. Who is at Risk for Asthma? https://www.nhlbi.nih.gov/health/health-topics/topics/asthma/atrisk. (May 2017).
27. U.S. Department of Health and Human Services, National Heart Lung and Blood Institute. 2017. What is COPD? https://www.nhlbi.nih.gov/health/health-topics/topics/copd. (May 2017).
28. Centers for Disease Control and Prevention. 2017. Arthritis: Improving the Quality of Life for People With Arthritis. https://www.cdc.gov/chronicdisease/resources/publications/aag/arthritis.htm. (May 2017).
29. Michigan Department of Health and Human Services, Division of Vital Records & Health Statistics. 2015 Michigan Death Certificate Registry. https://www.mdch.state.mi.us/pha/osr/deaths/causrankcnty.asp. (May 2017).
30. National Cancer Institute. 2015. What is Cancer? https://www.cancer.gov/about-cancer/understanding/what-is-cancer. (May 2017).
31. Centers for Disease Control and Prevention. 2015. Diabetes Home - Basics About Diabetes. https://www.cdc.gov/diabetes/basics/diabetes.html. (May 2017).
32. Centers for Disease Control and Prevention. 2014. National Chronic Kidney Disease Fact Sheet, 2014. https://www.cdc.gov/diabetes/pubs/pdf/kidney_factsheet.pdf. (May 2017).
33. Centers for Disease Control and Prevention. Current Depression Among Adults - United States, 2006 and 2008. MMWR 2010; 59(38): 1229-1235.
34


Number of copies: 700 Total printing cost: $
Price per unit: $
MDHHS is an equal opportunity employer, service and program provider.