Embed Size (px)
Citation preview
2015 EFNEP Annual Update
Adult Outcomes 2015
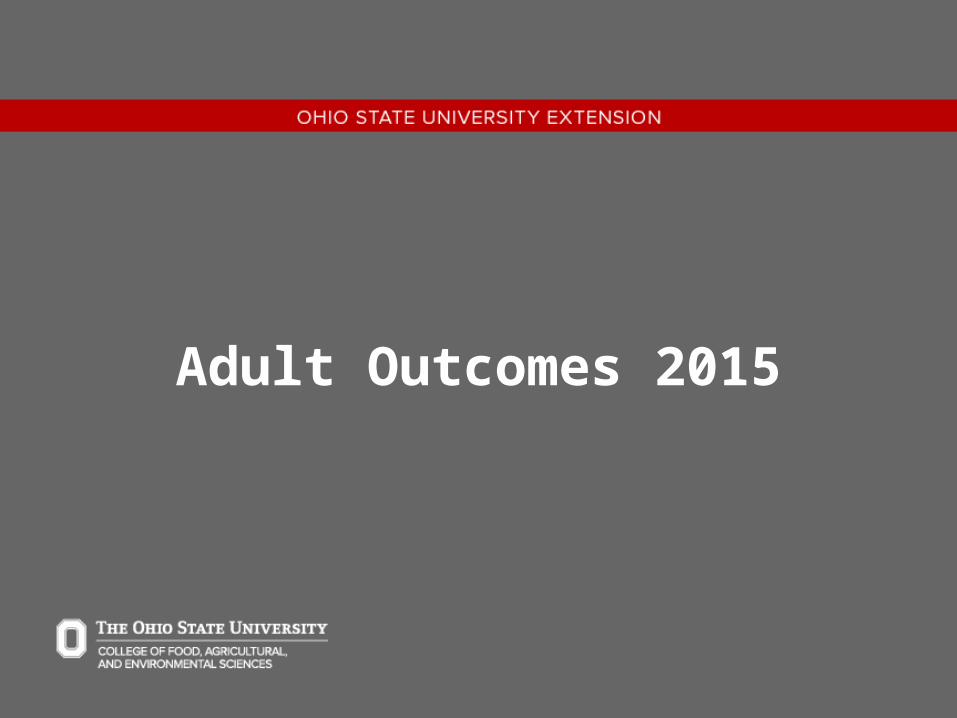
3,755 Participants
Average 4 Persons per
Family
15,037 Persons Reached
20,860 Total Lessons
19,006 Total Contacts
2,426 Graduates
with 8 Lessons
2015
5% under 1 year, 43% 1 to 5 years old,
16% each 6-8 and 9 to 12 years old, 20% older than 13
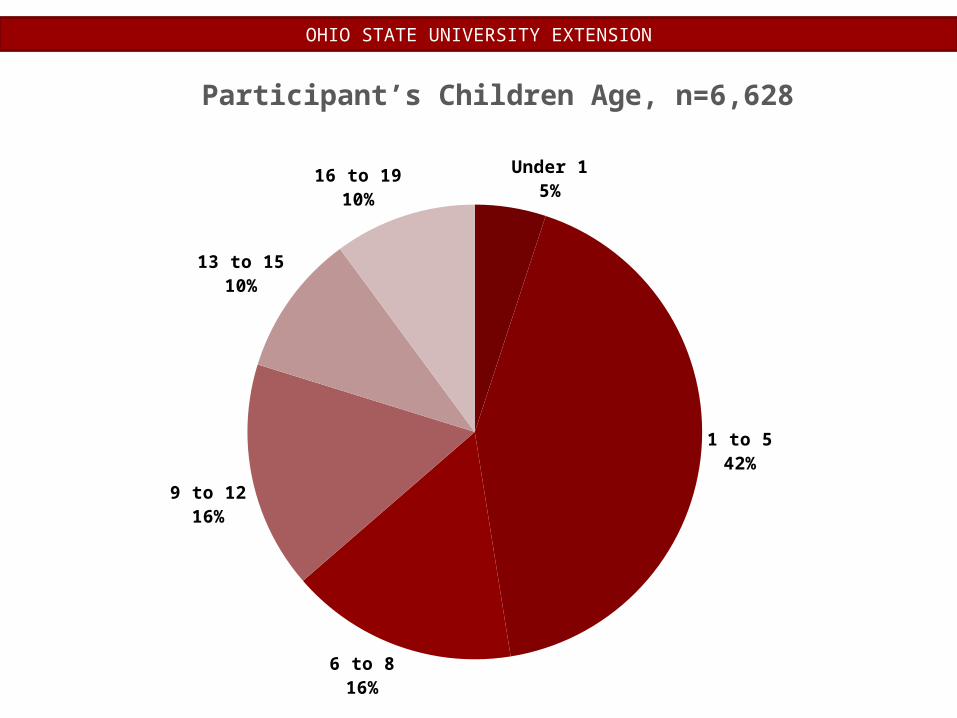
Under 15%
1 to 542%
6 to 816%
9 to 1216%
13 to 1510%
16 to 1910%
Participant’s Children Age, n=6,628
OHIO STATE UNIVERSITY EXTENSION
2007 2008 2009 2010 2011 2012 2013 2014 20150
1000
2000
3000
4000
5000
6000
7000
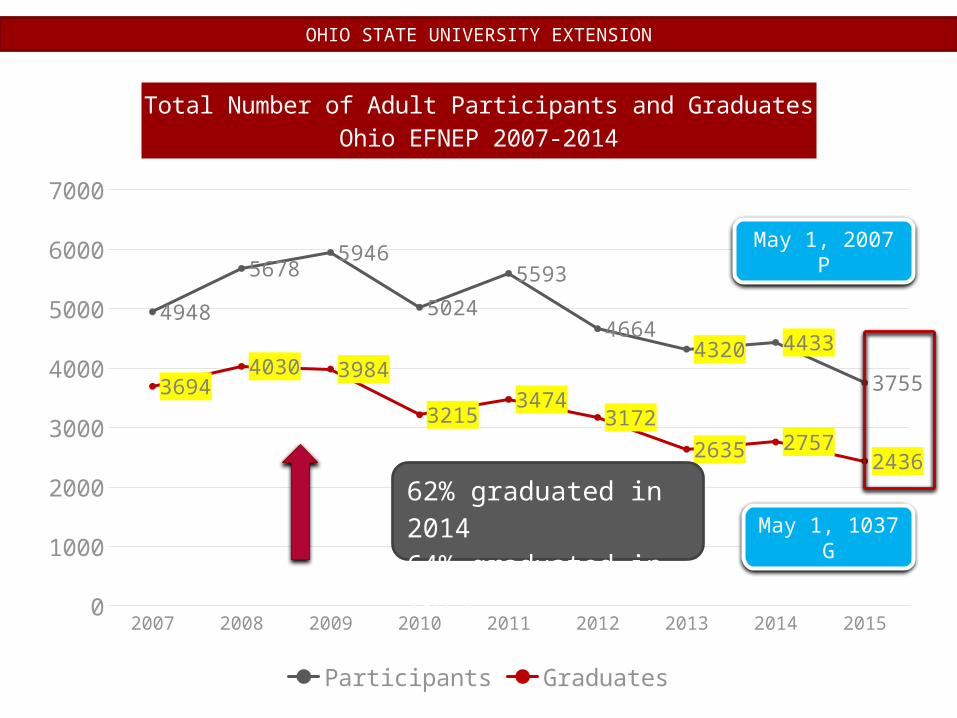
4948
56785946
5024
5593
46644320 4433
375536944030 3984
32153474
3172
2635 27572436
Total Number of Adult Participants and GraduatesOhio EFNEP 2007-2014
Participants Graduates
62% graduated in 201464% graduated in 2015
May 1, 2007 P
May 1, 1037 G
OHIO STATE UNIVERSITY EXTENSION

Difficult to maintain adult graduates
conduct an initial needs assessment including census mapping to locate potential participants and collaborative agencies
Demonstrate medium and long term impacts in communities
strategic approach to increase our presence in the community and number of participants. Plan open sites classes
Stablish relationship with State Specialists to facilitate collaboration in research
20142018
2019
20162015
2017
Increase EFNEP
presence
Expand our social media presence. YES!
OHIO STATE UNIVERSITY EXTENSION
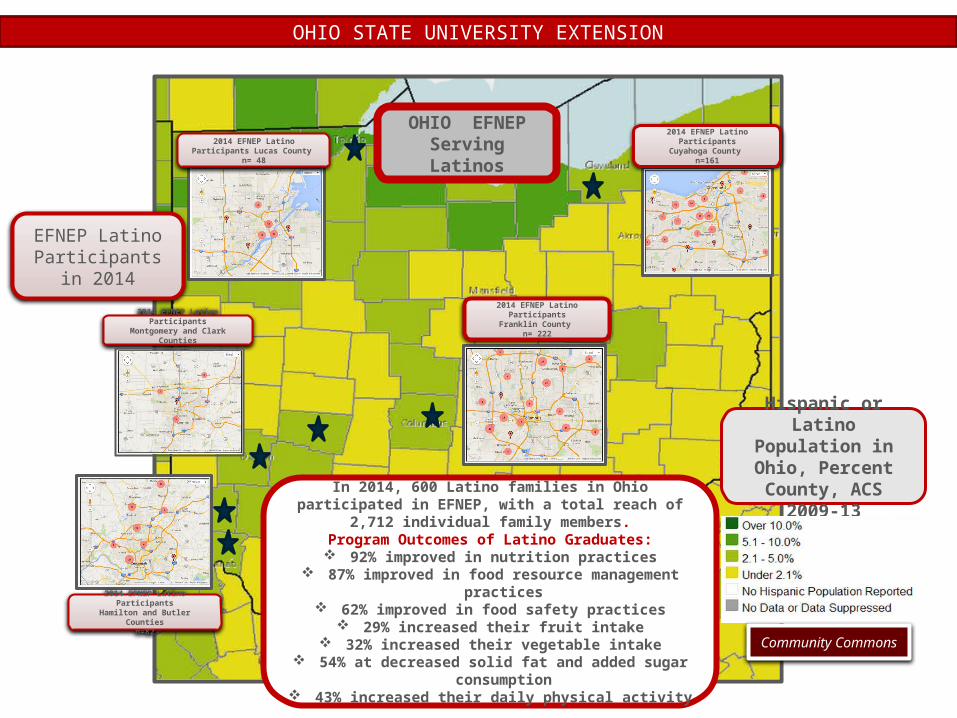
Hispanic or Latino Population in Ohio,
Percent County, ACS 2009-13
OHIO EFNEPServing Latinos
Community Commons
2014 EFNEP Latino ParticipantsFranklin County
n= 2222014 EFNEP Latino ParticipantsMontgomery and Clark Counties
n= 14
2014 EFNEP Latino ParticipantsHamilton and Butler Counties
n=82
2014 EFNEP Latino Participants Lucas County
n= 48
EFNEP Latino Participants in
2014
2014 EFNEP Latino ParticipantsCuyahoga County
n=161
In 2014, 600 Latino families in Ohio participated in EFNEP, with a total reach of 2,712 individual family members.
Program Outcomes of Latino Graduates: 92% improved in nutrition practices
87% improved in food resource management practices 62% improved in food safety practices
29% increased their fruit intake 32% increased their vegetable intake
54% at decreased solid fat and added sugar consumption
43% increased their daily physical activity
OHIO STATE UNIVERSITY EXTENSION
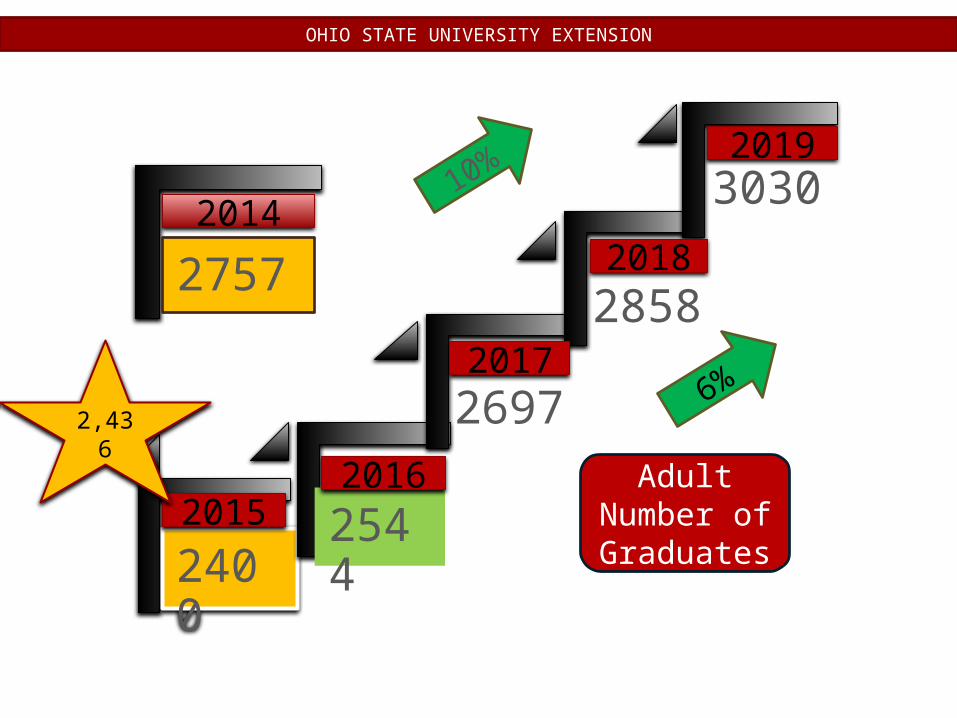
2757
2400
2697
3030
2544
2858
20142018
2019
20162015
2017
Adult Number of Graduates
6%
2,436
10%
OHIO STATE UNIVERSITY EXTENSION
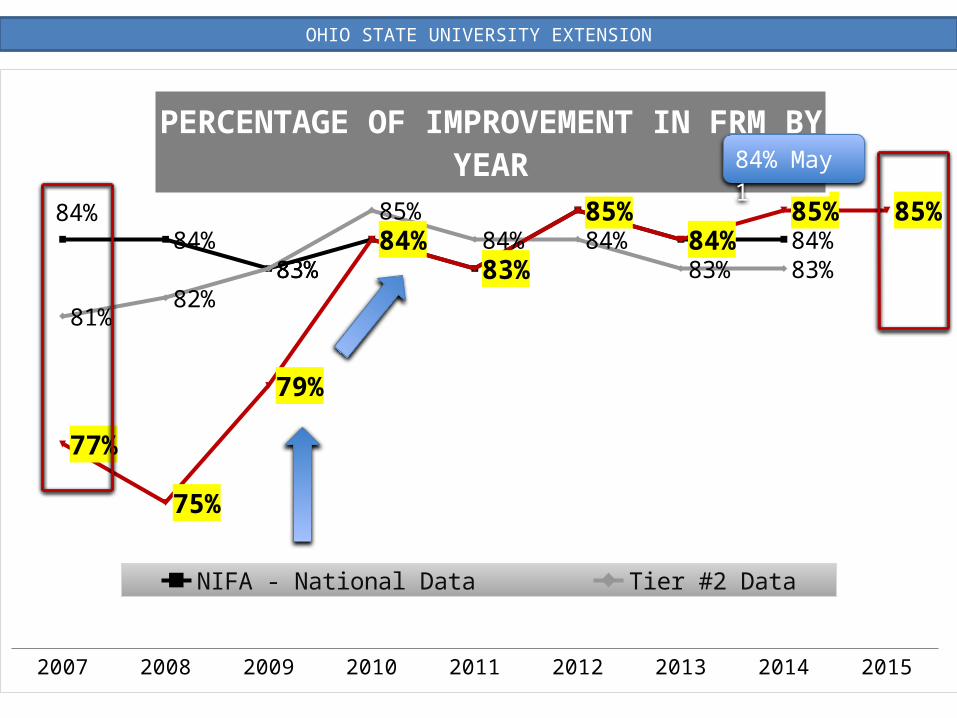
2007 2008 2009 2010 2011 2012 2013 2014 2015
84%84%
83%84%
83%
85%84% 84%
81%82%
83%
85%84% 84%
83% 83%
77%
75%
79%
84%83%
85%84%
85% 85%
PERCENTAGE OF IMPROVEMENT IN FRM BY YEAR
NIFA - National Data Tier #2 Data The Ohio State University
84% May 1
OHIO STATE UNIVERSITY EXTENSION
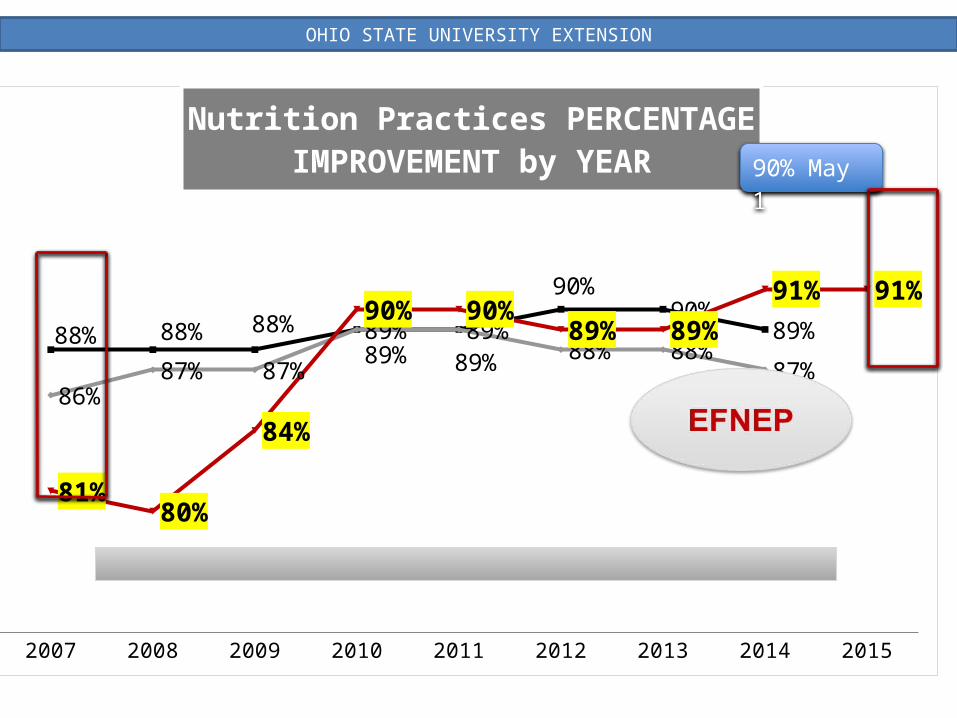
2007 2008 2009 2010 2011 2012 2013 2014 2015
88% 88% 88% 89% 89%
90%90%
89%
86%87% 87%
89% 89% 88% 88%87%
81%80%
84%
90% 90%89% 89%
91% 91%
Nutrition Practices PERCENTAGE IMPROVEMENT by YEAR
NIFA - National Data Tier #2 Data The Ohio State University
90% May 1
OHIO STATE UNIVERSITY EXTENSION
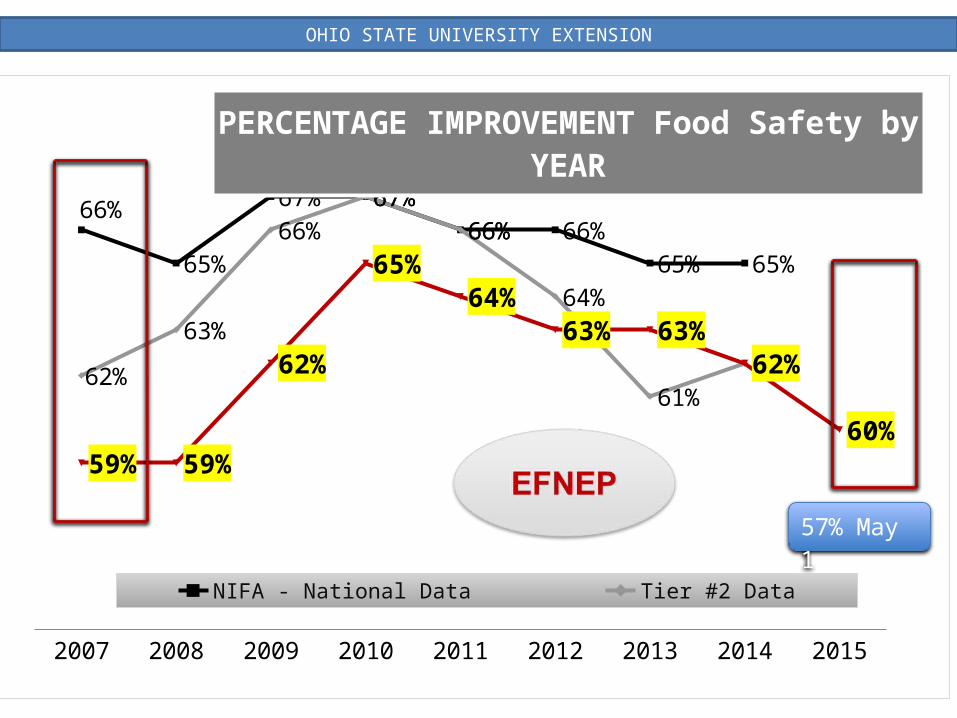
2007 2008 2009 2010 2011 2012 2013 2014 2015
66%
65%
67% 67%66% 66%
65% 65%
62%
63%
66%67%
66%
64%
61%62%
59% 59%
62%
65%64%
63% 63%62%
60%
PERCENTAGE IMPROVEMENT Food Safety by YEAR
NIFA - National Data Tier #2 Data The Ohio State University
57% May 1
OHIO STATE UNIVERSITY EXTENSION
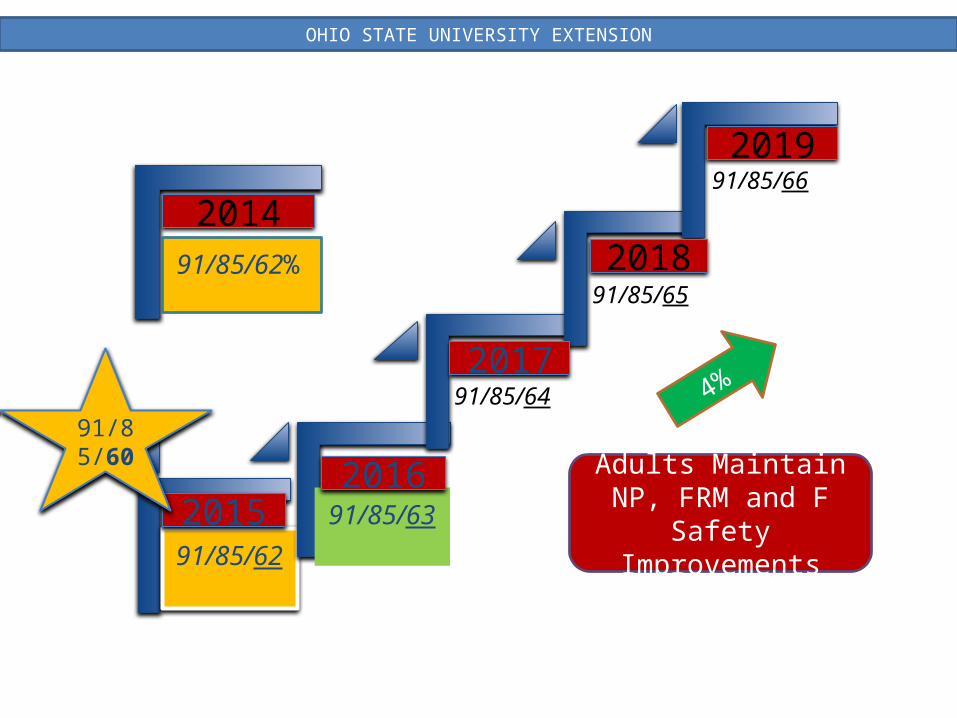
91/85/62%
91/85/62
91/85/64
91/85/66
91/85/63
91/85/65
20142018
2019
20162015
2017
Adults Maintain NP, FRM and F Safety
Improvements
4%
91/85/60
OHIO STATE UNIVERSITY EXTENSION
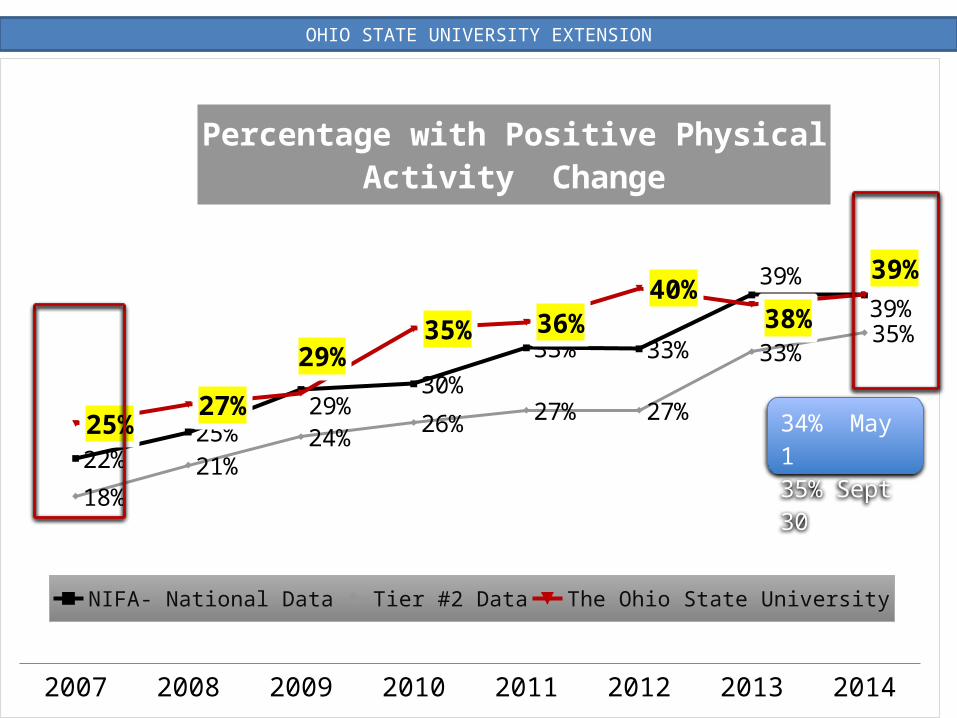
2007 2008 2009 2010 2011 2012 2013 2014
22%25%
29%30%
33% 33%
39%39%
18%21%
24%26% 27% 27%
33%35%
25%27%
29%35% 36%
40%38%
39%
Percentage with Positive Physical Activity Change
NIFA- National Data Tier #2 Data The Ohio State University
34% May 135% Sept 30
OHIO STATE UNIVERSITY EXTENSION
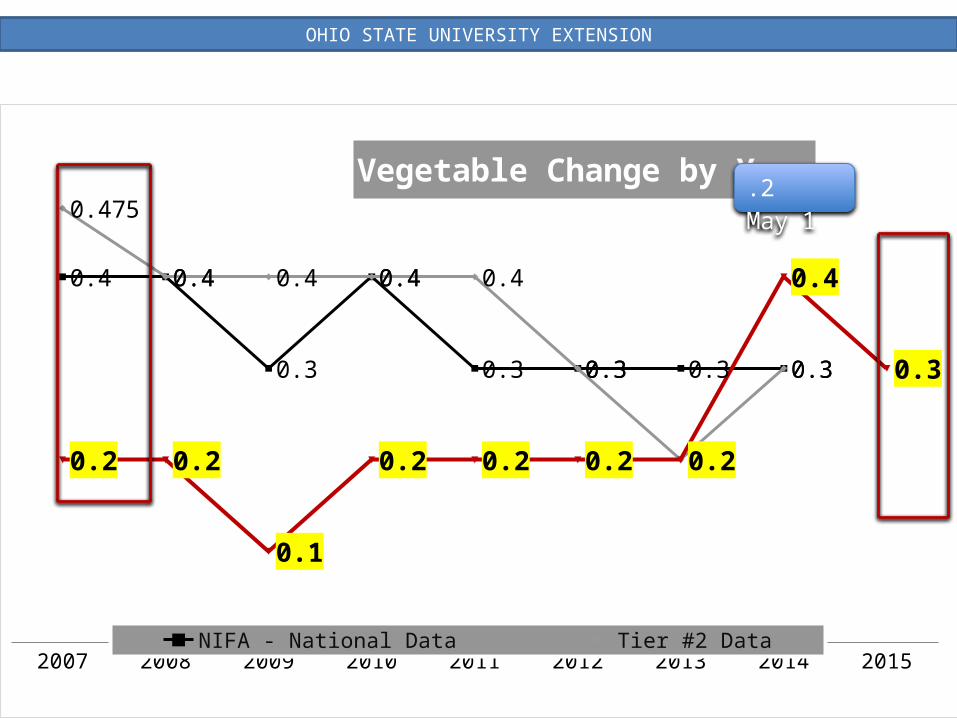
2007 2008 2009 2010 2011 2012 2013 2014 2015
0.4 0.4
0.3
0.4
0.3 0.3 0.3 0.3
0.475
0.4 0.4 0.4 0.4
0.3
0.2
0.3
0.2 0.2
0.1
0.2 0.2 0.2 0.2
0.4
0.3
Vegetable Change by Year
NIFA - National Data Tier #2 Data The Ohio State University
.2 May 1
OHIO STATE UNIVERSITY EXTENSION
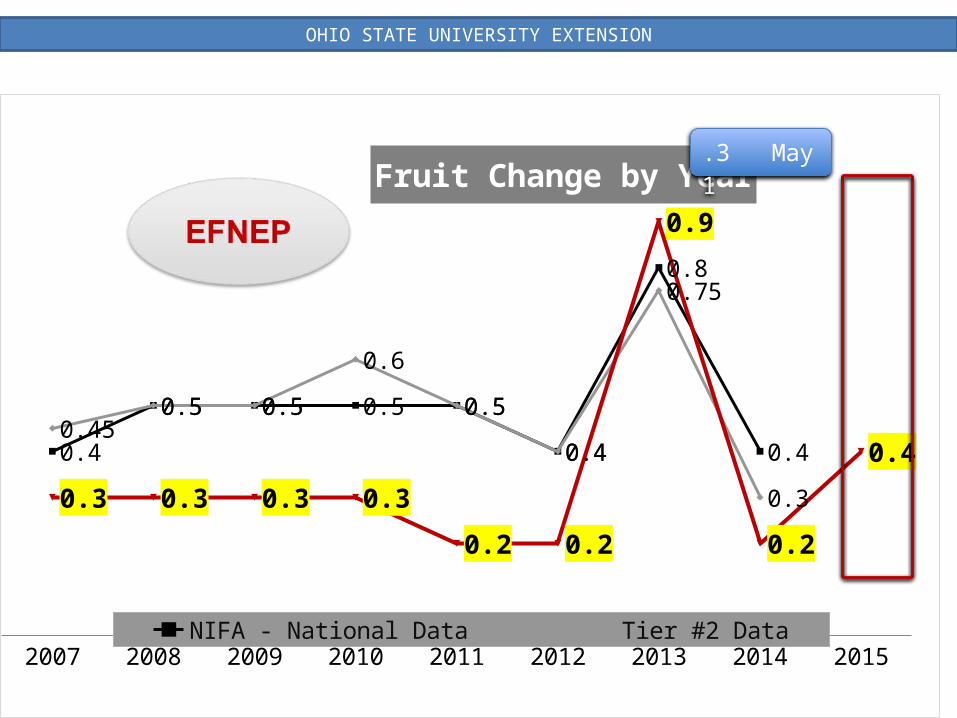
2007 2008 2009 2010 2011 2012 2013 2014 2015
0.4
0.5 0.5 0.5 0.5
0.4
0.8
0.40.45
0.5 0.5
0.6
0.5
0.4
0.75
0.30.3 0.3 0.3 0.3
0.2 0.2
0.9
0.2
0.4
Fruit Change by Year
NIFA - National Data Tier #2 Data The Ohio State University
.3 May 1
OHIO STATE UNIVERSITY EXTENSION
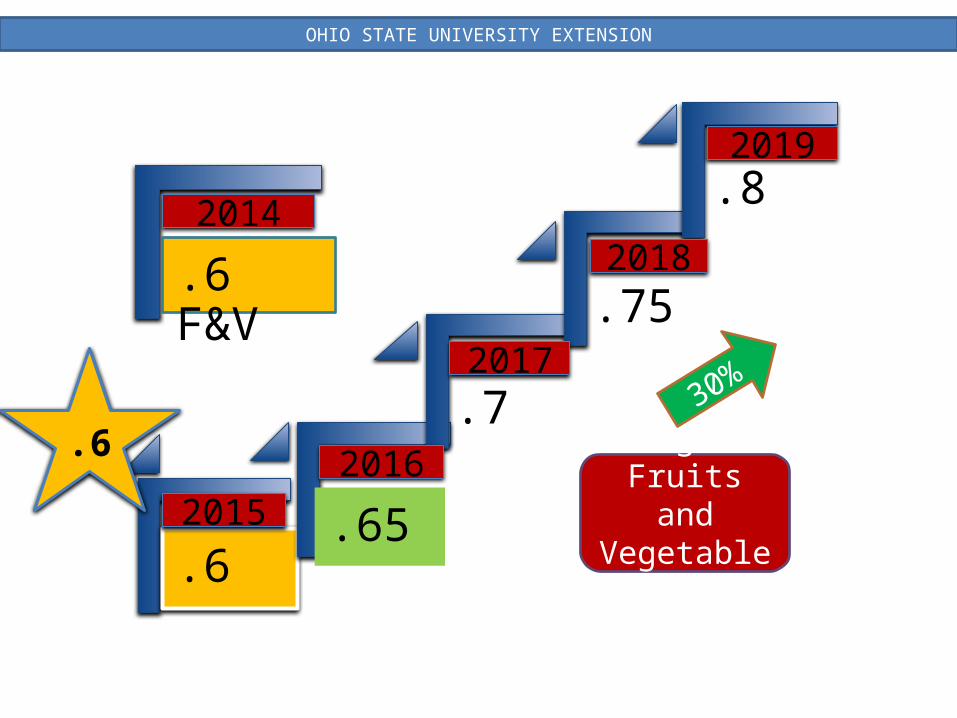
.6 F&V
.6
.7
.8
.65
.75
20142018
2019
20162015
2017
Change in Fruits and Vegetables
30%
.6
OHIO STATE UNIVERSITY EXTENSION
Youth Outcomes 2015
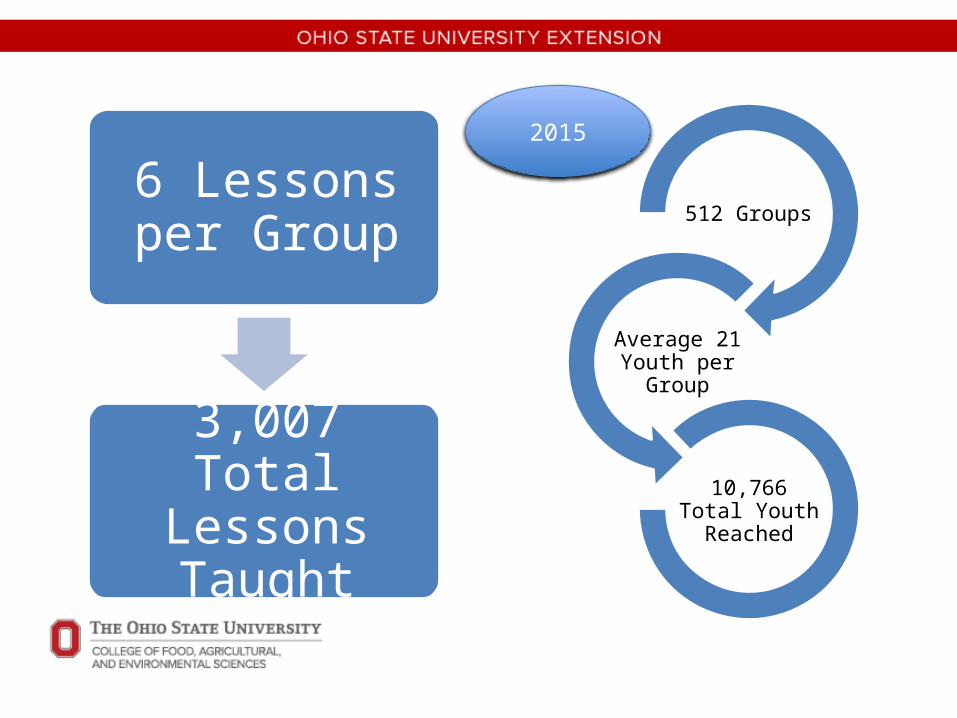
512 Groups
Average 21 Youth per
Group
10,766 Total Youth
Reached
6 Lessons per Group
3,007 Total Lessons Taught
2015
2007 2008 2009 2010 2011 2012 2013 20140
10,000
20,000
30,000
40,000
50,000
60,000
17,510
12,77110,611
7,693 6,377 6,175 6,6319,190
52530
39590 38200
32311
26783 25318
37797
54221
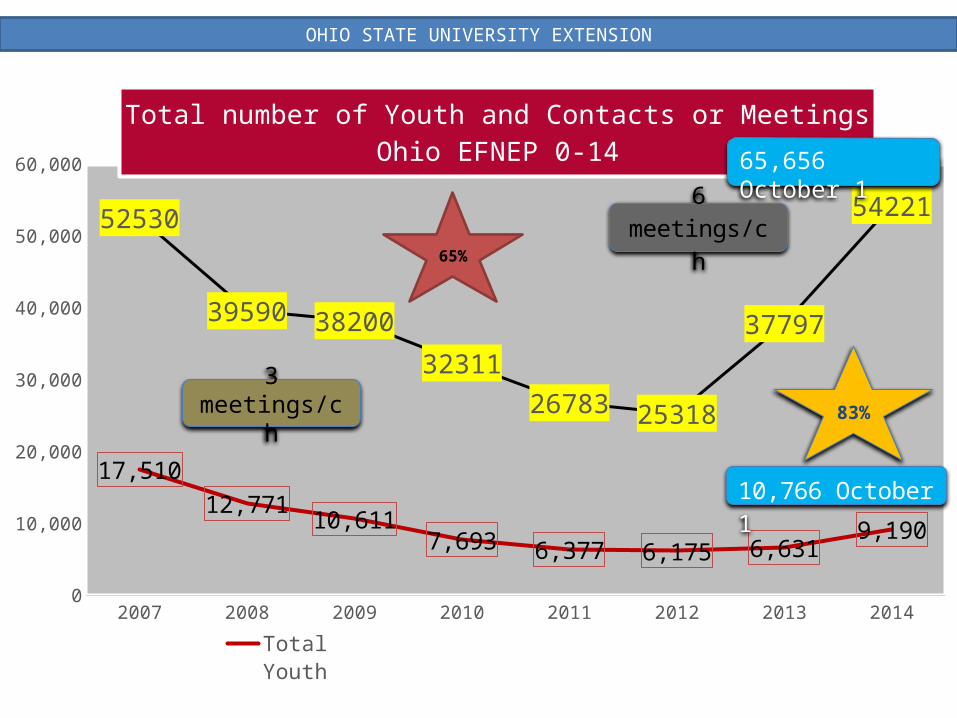
Total number of Youth and Contacts or Meetings Ohio EFNEP 0-14
Total Youth
Total number of contacts or meetings
6 meetings/ch
10,766 October 1
3 meetings/ch 83%
65%
65,656 October 1
OHIO STATE UNIVERSITY EXTENSION
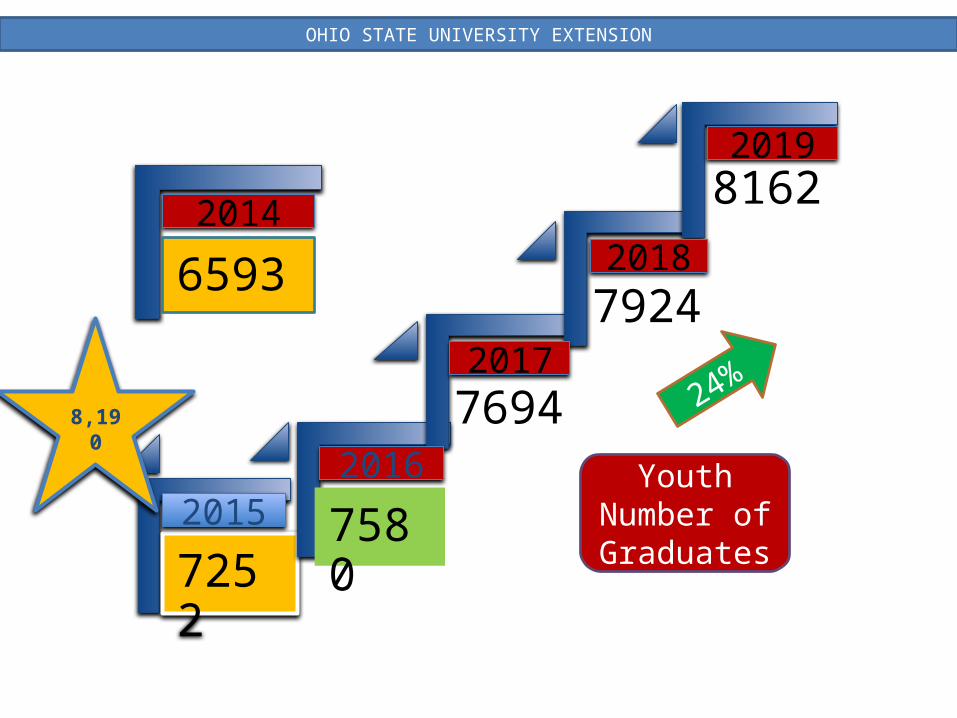
6593
7252
7694
8162
7580
7924
20142018
2019
20162015
2017
YouthNumber of Graduates
24%
8,190
OHIO STATE UNIVERSITY EXTENSION
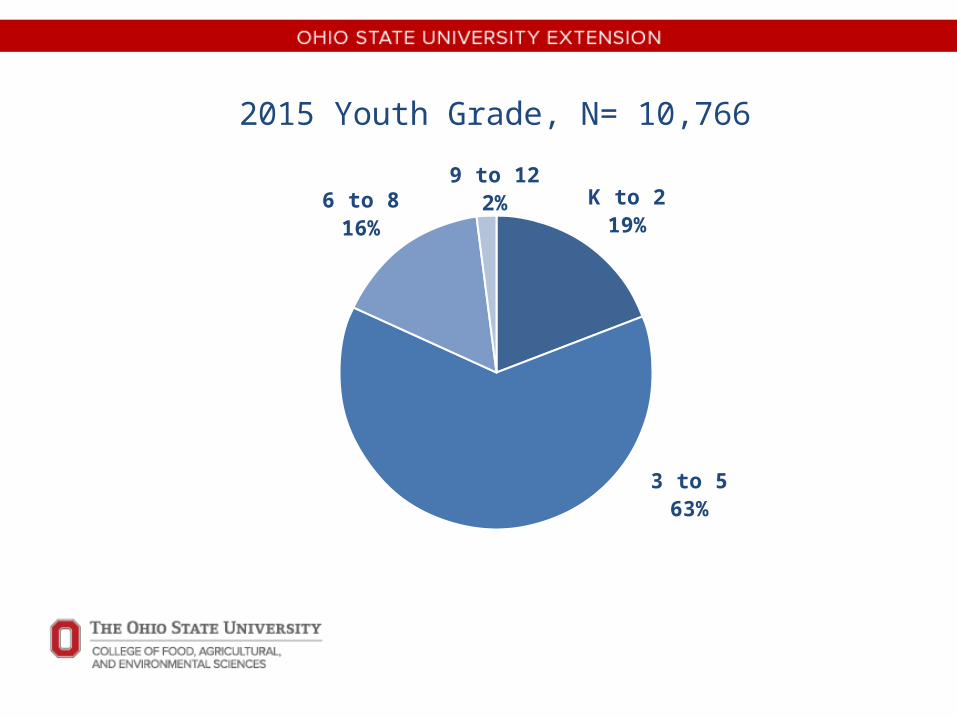
K to 219%
3 to 563%
6 to 816%
9 to 122%
2015 Youth Grade, N= 10,766
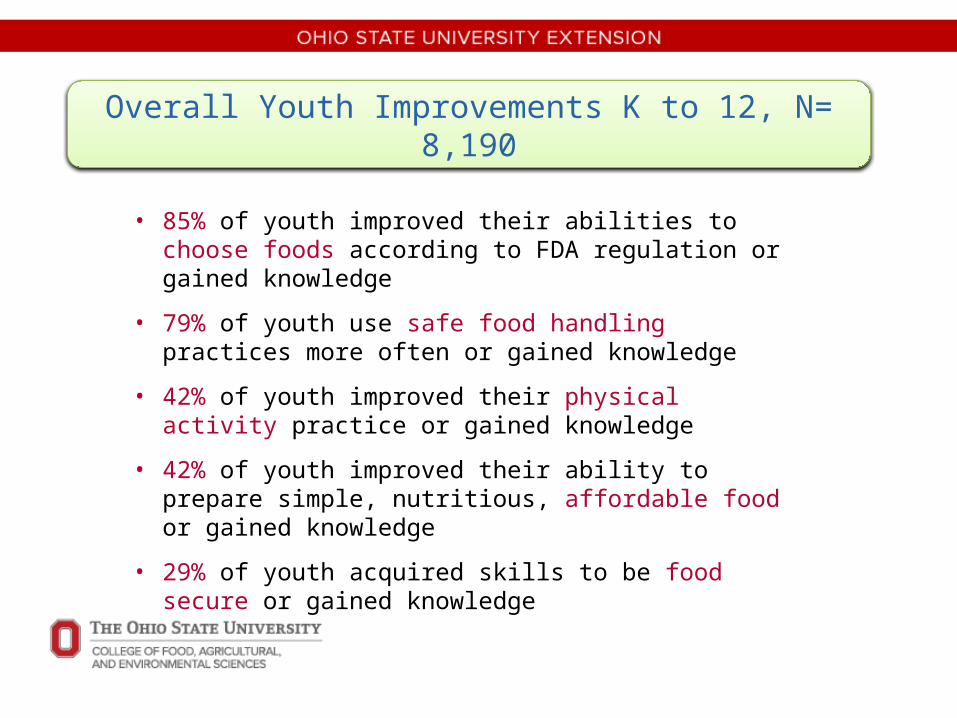
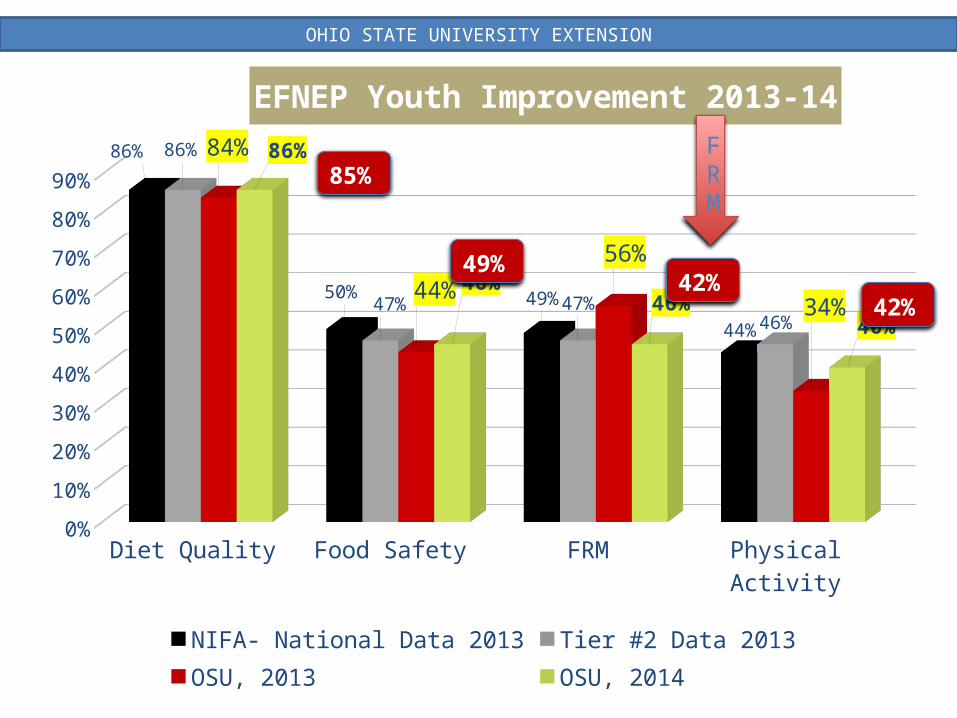
Overall Youth Improvements K to 12, N= 8,190
• 85% of youth improved their abilities to choose foods according to FDA regulation or gained knowledge
• 79% of youth use safe food handling practices more often or gained knowledge
• 42% of youth improved their physical activity practice or gained knowledge
• 42% of youth improved their ability to prepare simple, nutritious, affordable food or gained knowledge
• 29% of youth acquired skills to be food secure or gained knowledge
Diet Quality Food Safety FRM Physical Activity0%
10%
20%
30%
40%
50%
60%
70%
80%
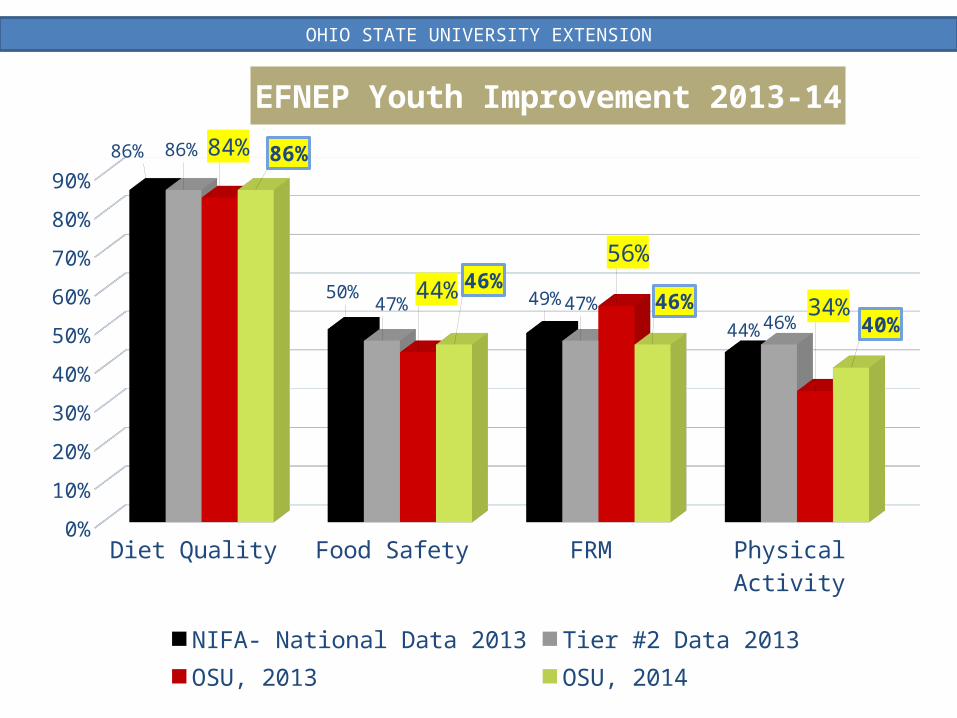
90%86%
50% 49%
44%
86%
47% 47%46%
84%
44%
56%
34%
86%
46%46%
40%
EFNEP Youth Improvement 2013-14
NIFA- National Data 2013 Tier #2 Data 2013OSU, 2013 OSU, 2014
OHIO STATE UNIVERSITY EXTENSION
Diet Quality Food Safety FRM Physical Activity0%
10%
20%
30%
40%
50%
60%
70%
80%
90%86%
50% 49%
44%
86%
47% 47%46%
84%
44%
56%
34%
86%
46%46%
40%
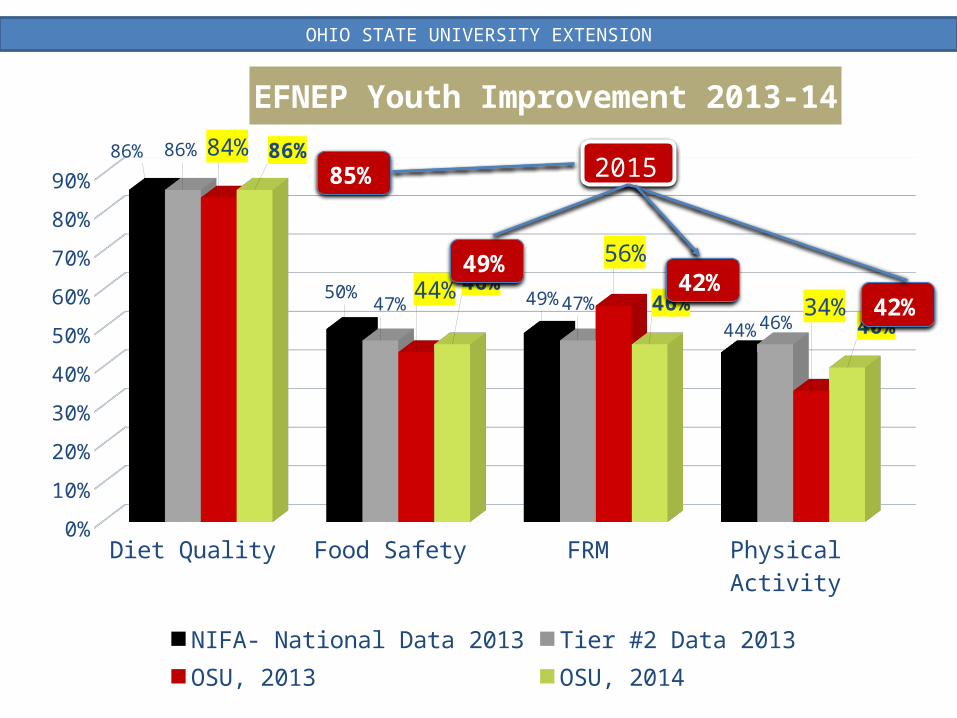
EFNEP Youth Improvement 2013-14
NIFA- National Data 2013 Tier #2 Data 2013OSU, 2013 OSU, 2014
85%
49%42%
42%
2015
OHIO STATE UNIVERSITY EXTENSION
Diet Quality Food Safety FRM Physical Activity0%
10%
20%
30%
40%
50%
60%
70%
80%
90%86%
50% 49%
44%
86%
47% 47%46%
84%
44%
56%
34%
86%
46%46%
40%
EFNEP Youth Improvement 2013-14
NIFA- National Data 2013 Tier #2 Data 2013OSU, 2013 OSU, 2014
85%
49%42%
42%
OHIO STATE UNIVERSITY EXTENSION
FRM
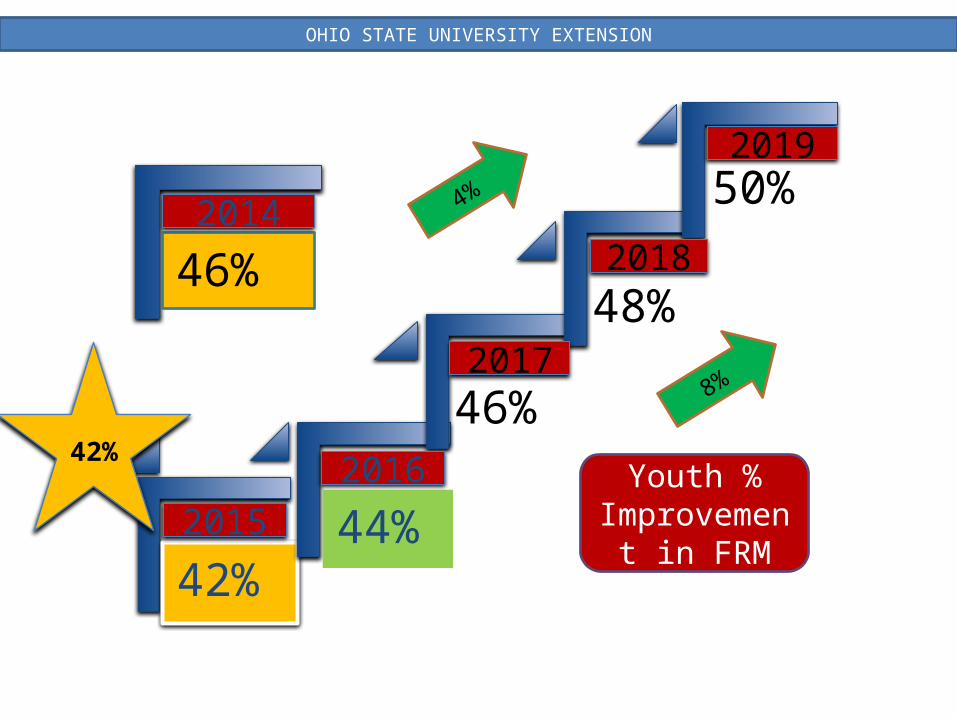
46%
42%
46%
50%
44%
48%
20142018
2019
2016
2015
2017
Youth % Improvement
in FRM
8%
42%
OHIO STATE UNIVERSITY EXTENSION
4%

OHIO STATE UNIVERSITY EXTENSION
Welcome! Thank you for your hard workSee you all in our Annual Visit
Enjoy our next activity


![Untitled-2 [saarf.com.pk] · Electrical Engineers Procurement Specialists Consultants ... 7 persons Il persons 13 persons 35 persons Professional degree Technical degree University](https://img.pdfslide.net/doc/110x75/5ec8fdf84cbfa7299d518157/untitled-2-saarfcompk-electrical-engineers-procurement-specialists-consultants.jpg)