Embed Size (px)
Citation preview

2015 first half results31 July 2015

Disclaimer
This presentation may contain forward-looking objectives and statements aboutVINCI’s financial situation, operating results, business activities and expansionstrategy.
These objectives and statements are based on assumptions that are dependentupon significant risk and uncertainty factors that may prove to be inexact. Theinformation is valid only at the time of writing and VINCI does not assume anyobligation to update or revise the objectives on the basis of new information orfuture or other events, subject to applicable regulations.
Additional information on the factors that could have an impact on VINCI’s financialresults is contained in the documents filed by the Group with the French securitiesregulator (AMF) and available on the Group’s website at www.vinci.com or onrequest from its head office.
2

VINCI Airports is operating 24 airports inPortugal, France, Cambodia and won anew 25-year concession for ToulonHyères since April 2015. Together, thesehandle a total of more than 47 millionpassengers a year.
Nuevo Pudahuel Airport (project) –Santiago de Chile

With a 4,386 km network, VINCIAutoroutes operates half of France’smotorways under concession and hasinvested around €9 bn in the construction,widening and improvement of itsinfrastructure since 2006. The works onthe A9 duplication near Montpelliershould be completed by 2017.

5
VINCI Concessions and VINCIConstruction are working togetheron the Ohio East End Crossing. ThisPPP includes the construction of a765 metre cable-stayed bridge, withworks scheduled for completion inautumn 2016.

VINCI Energies, with its exceptionally dense network of 1,500 business units in more than 50 countries, combines global reach with local service.
An automation training center of VINCI Energies at Acta in Antwerp, Belgium.

7
Eurovia is working on the NorthwestCorridor project in Atlanta, which isscheduled to open in 2018. The design-build project involves the construction ofreversible express lanes along a 48 kmstretch and the construction of 39bridges.
8
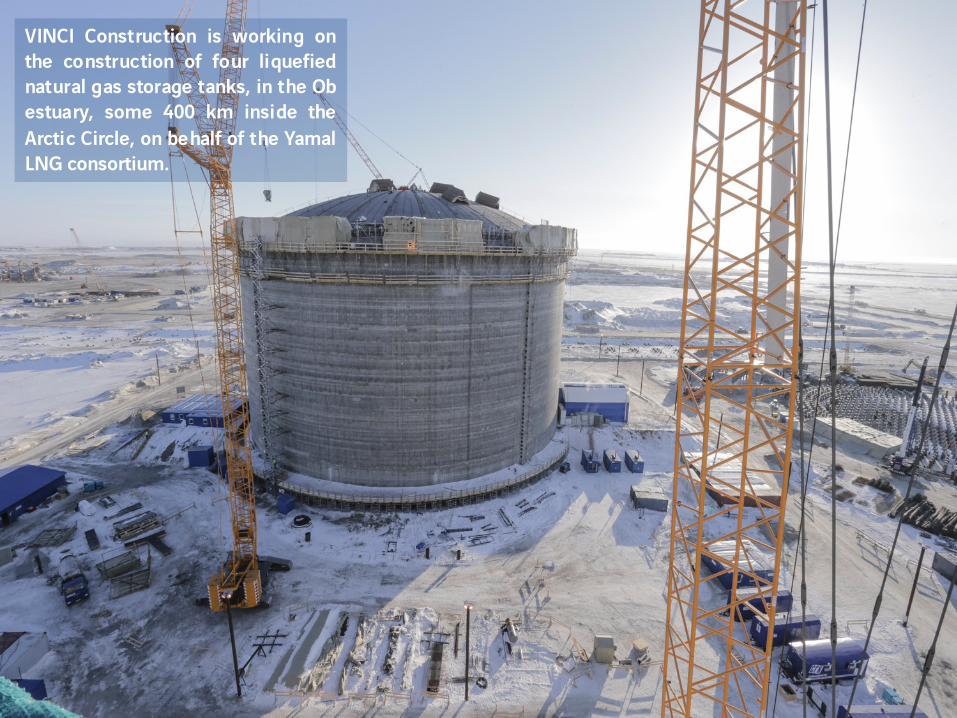
VINCI Construction is working onthe construction of four liquefiednatural gas storage tanks, in the Obestuary, some 400 km inside theArctic Circle, on behalf of the YamalLNG consortium.

2015 first half highlightsXavier Huillard, Chairman and CEO

10
A solid economic performance on a global scale
Good resilience of Group revenue -1.8% * Improvement of Group EBIT margin 8.6% +40bp * Increase of Group net income +6.3% **
Dynamic toll road traffic
Strong airport passenger traffic +11.7%+2.7%
Conc
essi
ons
Order book at 30 June €28.7 bn +2.8%vs 31 Dec. 2014
Cont
ract
ing
Order intake in 1H 2015 €15.3 bn -2.5%
* Excluding VINCI Park ** Excluding non-recurring items
Net financial debt - €1.0 bn vs 30 June 2014
Note: 2014 figures presented in this document are pro forma amounts adjusted in line with the change in accounting method arising from the application as of 1 January 2015 of IFRIC 21 “Levies”
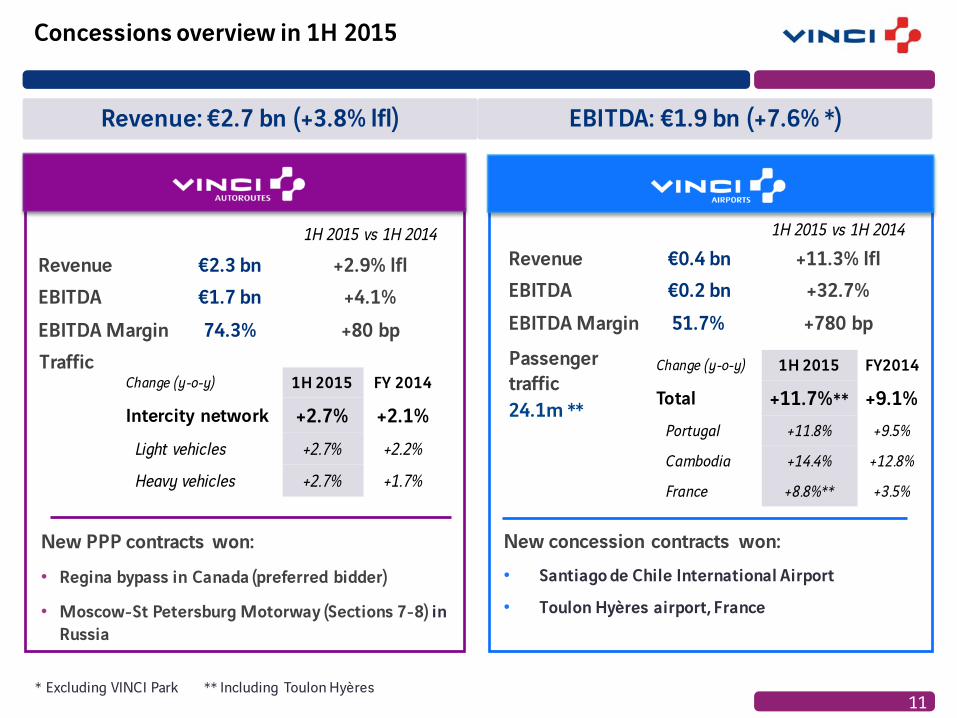
1H 2015 vs 1H 2014 Revenue €0.4 bn +11.3% lflEBITDA €0.2 bn +32.7%EBITDA Margin 51.7% +780 bp
Concessions overview in 1H 2015
11
1H 2015 vs 1H 2014
Revenue €2.3 bn +2.9% lflEBITDA €1.7 bn +4.1%EBITDA Margin 74.3% +80 bp
Revenue: €2.7 bn (+3.8% lfl) EBITDA: €1.9 bn (+7.6% *)
* Excluding VINCI Park
Change (y-o-y) 1H 2015 FY 2014
Intercity network +2.7% +2.1%Light vehicles +2.7% +2.2%
Heavy vehicles +2.7% +1.7%
Change (y-o-y) 1H 2015 FY2014
Total +11.7%** +9.1%Portugal +11.8% +9.5%
Cambodia +14.4% +12.8%
France +8.8%** +3.5%
Traffic Passengertraffic 24.1m **
** Including Toulon Hyères
New PPP contracts won: • Regina bypass in Canada (preferred bidder)
• Moscow-St Petersburg Motorway (Sections 7-8) in Russia
New concession contracts won: • Santiago de Chile International Airport
• Toulon Hyères airport, France
85
90
95
100
105
110
115
Q4 07
Q1 08
Q2 08
Q3 08
Q4 08
Q1 09
Q2 09
Q3 09
Q4 09
Q1 10
Q2 10
Q3 10
Q4 10
Q1 11
Q2 11
Q3 11
Q4 11
Q1 12
Q2 12
Q3 12
Q4 12
Q1 13
Q2 13
Q3 13
Q4 13
Q1 14
Q2 14
Q3 14
Q4 14
Q1 15
Q2 15
VINCI Autoroutes
12
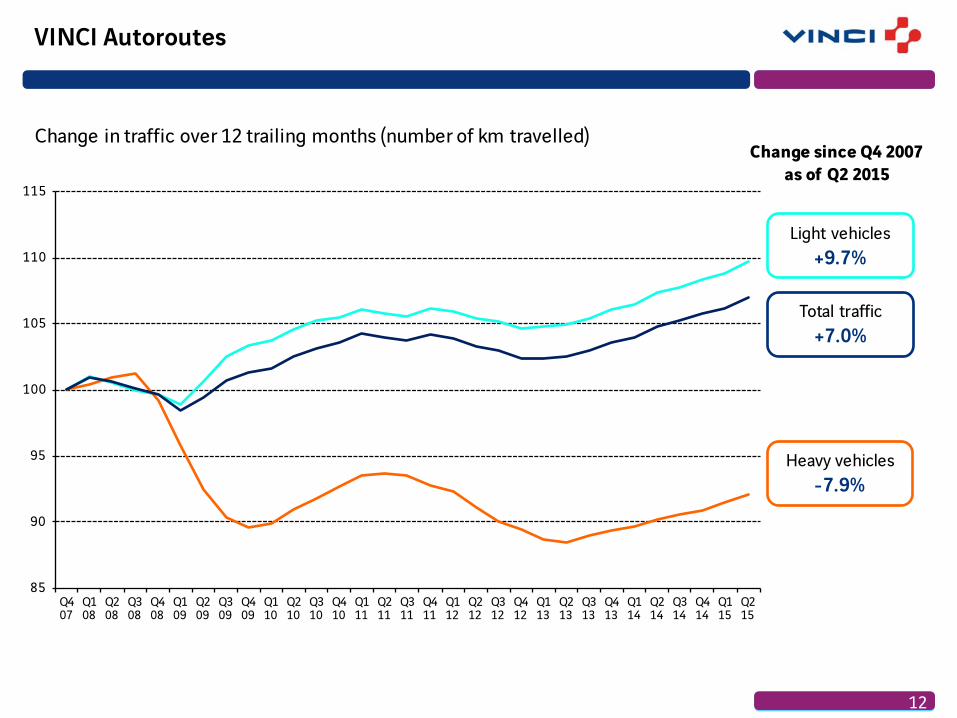
Light vehicles+9.7%
Heavy vehicles-7.9%
Total traffic+7.0%
Change in traffic over 12 trailing months (number of km travelled) Change since Q4 2007
as of Q2 2015
12
VINCI Autoroutes
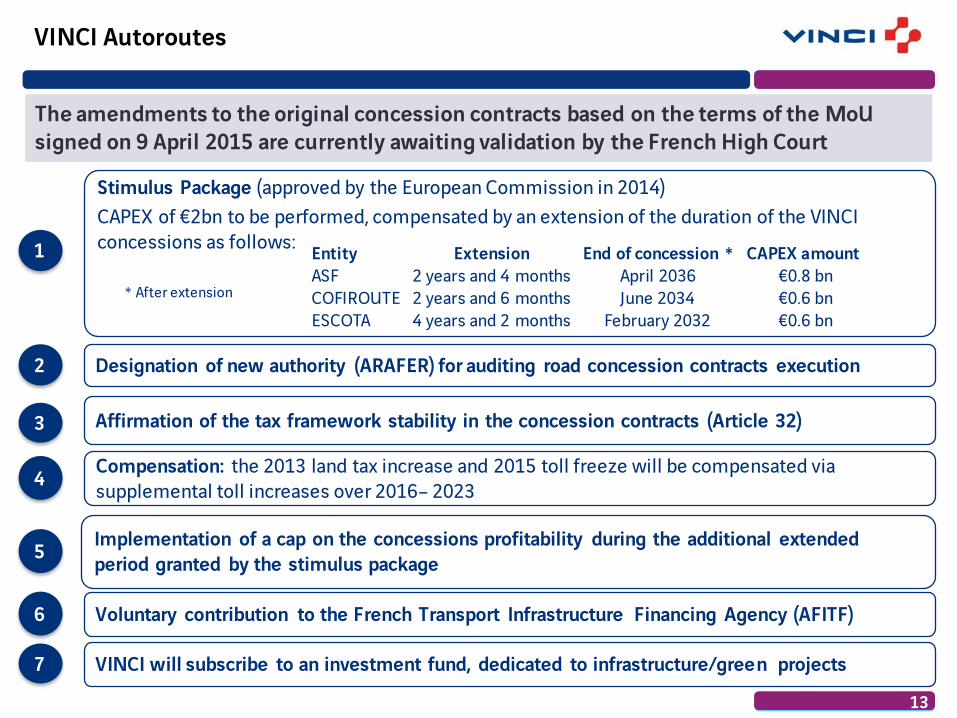
The amendments to the original concession contracts based on the terms of the MoUsigned on 9 April 2015 are currently awaiting validation by the French High Court
Stimulus Package (approved by the European Commission in 2014)CAPEX of €2bn to be performed, compensated by an extension of the duration of the VINCI concessions as follows:
Compensation: the 2013 land tax increase and 2015 toll freeze will be compensated via supplemental toll increases over 2016– 2023
Voluntary contribution to the French Transport Infrastructure Financing Agency (AFITF)
Entity Extension End of concession * CAPEX amountASF 2 years and 4 months April 2036 €0.8 bnCOFIROUTE 2 years and 6 months June 2034 €0.6 bnESCOTA 4 years and 2 months February 2032 €0.6 bn
* After extension
Designation of new authority (ARAFER) for auditing road concession contracts execution
Implementation of a cap on the concessions profitability during the additional extended period granted by the stimulus package
Affirmation of the tax framework stability in the concession contracts (Article 32)
VINCI will subscribe to an investment fund, dedicated to infrastructure/green projects
13
2
6
7
5
4
3
1

60%40%
Revenue €7.0 bn -8.1%
EBIT €103m -46.3%
1.5% -100bp
Revenue €3.4 bn -5.4%
EBIT € (48m) * -8.7%
-1.4% * stable
Revenue €4.8 bn +10.1%
EBIT €260m +13.2%
5.4% +10bp
53%47%54%46%
14
Contracting overview in 1H 2015
• Strong growth outside France thanks to recent acquisitions:
ü Imtech ICT (Europe) and Electrix (Australia/New Zealand) in 2014
ü Orteng Engenharia e Sistemas company in Brazilin 2015
• France traditional road maintenance activity penalised by the reduction of municipal budgets
• Good resilience of the EBIT thanks to railworks, improvement in Central Europe and adaptation measures in France
• Reduced activity in France and sharp decline in African subsidiaries and Entrepose (Oil & Gas market). UK restructuring well under way
• Good performance of SoletancheFreyssinet and VCGP (large projects division)
• Acquisition of HEB Construction in New Zealand
Revenue: €15.2 bn (-2.4%) EBIT: €0.3 bn (-14.6%)
France-1.4%
International+27.2%
International+4.6%
France-11.1%
International-0.9%
France-13.8%
* Not representative of full-year performance due to seasonal effects.
EBIT margin EBIT margin EBIT margin

> 2016
2015
2014
2013
2012
2011
Contracting - Tours–Bordeaux HSL
15
Tours-Bordeaux HSL: Auxance viaducts
SEA construction reaching 85% completion ahead of the schedule
All Group’s expertise employedCompletion of earthworks and civil engineeringworks for the 340 km South Europe Atlantic high-speed rail line in record time.Reception target date: 31 July 2017 (beginning ofcommercial operations)
Achi
eved
Fore
cast
€0.2 bn
€0.6 bn
€1.3 bn
€1.1 bn
~ €0.6 bn
~ €0.4 bn
1H 2015
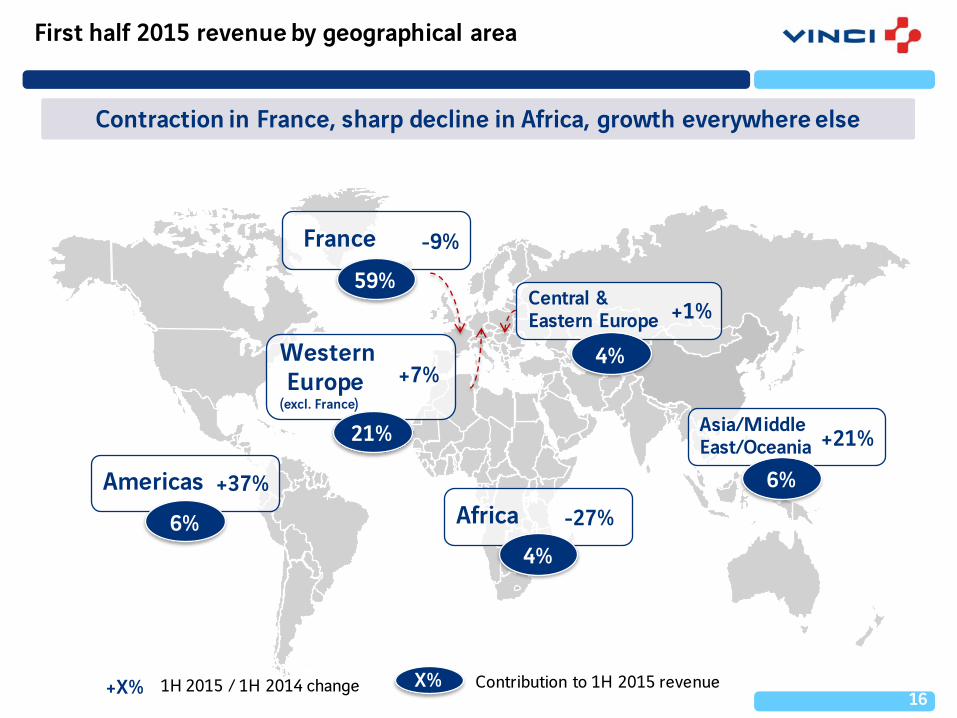
First half 2015 revenue by geographical area
16
France
WesternEurope
(excl. France)
Central & Eastern Europe
AfricaAmericas
Asia/Middle East/Oceania
59%
21%
4%
6%4%
6%
-9%
+7%
+1%
+21%
+37%
X% Contribution to 1H 2015 revenue+X% 1H 2015 / 1H 2014 change
Contraction in France, sharp decline in Africa, growth everywhere else
-27%

Increase of the order intake in Q2 2015 after a contraction in Q1 2015
Contracting order intake
France
International ex-EuropeEurope ex-France
Q1 2015Q1 2014 Q2 2015Q2 2014
7.78.7 7.6
7.0
+8%
Quarterly breakdown by geographical area
+23%
+6%
+3%
-12%
+17%
-20%
-2.5%
International+9%
France -11%
Δ∆ 15/14 June
VINCI EnergiesEuroviaVINCI Construction
(in € billions)
1H 20151H 2014
15.7-2.5%
+9%
-15%
-3%
15.3
Half-year breakdown by business line
17
-11%

2015 first half financial dataChristian Labeyrie, Executive Vice-President and CFO

2015 first half consolidated revenue
19
-8.3%
18,464 17,880
1H 2014
5.9%
-2.4%
1H 2015
Revenue change: -1.8% excl. VINCI Park
-3.2% actual
Scope & FXOrganic
-5.4%
3.8% -9.2%
Scope & FXOrganic
(in € millions) Concessions Contracting
Organic: -6.7% Scope: + 1.2% FX: + 2.3%

20
1H14 1H15
VINCI Autoroutes
VINCIAirports
ROI: €1,216m +10.7% *
EBIT Margin: 44.0% +120 bp *
VINCIEnergies
VINCIConstruction
ROI: €327m -11.0% EBIT Margin: 2.1% -30 bp
Recurring operating income (ROI)
(ROI in € millions and EBIT margin as % of revenue)
9911,068
120151
219251
(54)** (47)**
202
Group ROI: €1,586m +6.3% * Of which EBIT: €1,540m +2.9% *EBIT Margin: 8.6% +40 bp *
1H14 1H15 1H14 1H15
1H14 1H15
1H14 1H15
Concessions Contracting
Eurovia
* Excluding VINCI Park
123
** Not representative of full-year performance due to seasonal effects.
45.3%
47.4%
32.8%35.9% 5.3%
5.4%
-1.4%** -1.4%**
2.5%
1.5%

(in € millions) 1H 2015 1H 2014 Δ∆ 15/14 Δ∆ 15/14 excl.VINCI Park
Operating income from ordinary activities (EBIT) 1,540 1,582 (2.7%) +2.9%% of revenue 8.6% 8.6% +40 bp
- share-based payment expense (IFRS 2) (36) (42)
- operating income of equity-accounted cos. & other 82 37
Recurring operating income 1,586 1,577 +0.5% +6.3%Non-recurring operating items (9) 603
Operating income 1,577 2,180 (27.7%)Financial income/(expense) (281) (327)Taxes (462) (488)Effective tax rate 37.0% 26.7%Non-controlling interests (16) (17)
Net income attributable to owners of the parent 819 1,348 (39.3%)of which non-recurring operating items (9) 570
Net income excluding non-recurring items 827 778 +6.3%
Diluted earnings per share (in €) 1.47 2.39 (38.6%)
Diluted earnings per share ex-non-recurring (in €) 1.48 1.38 +7.5%
21
Income statement
Note: 2014 figures presented in this document are pro forma amounts adjusted in line with the change in accounting method arising from the application as of 1 January 2015 of IFRIC 21 “Levies”

22
Capital increases &
misc.0.6
Dividends(0.7)
Δ∆ WCR(0.8)
(13.3)EBITDA
2.5
(13.9)
Investments(0.7)
Acquisitions/Disposals
(0.2)
Free cash flow: €0.2 bn1H 2014: €(0.5) bn
Share buy-backs(0.5)
Contracting
ConcessionsNet financial debt at
31 Dec. 2014
(in € billions)
Change in net financial debt during the first half of 2015
Interest & taxes paid
(0.7)
Net financial debtat 30 June 2015

Consolidated balance sheet
(in € millions) 30 June 2015 31 Dec. 2014 30 June 2014
Non-current assets – concessions 27,470 27,691 27,892
Non-current assets – contracting and other 8,983 8,838 8,317
WCR, provisions and other current assets & liabilities (5,251) (5,962) (4,762)
Capital employed 31,202 30,568 31,447
Equity (14,889) (14,868) (14,301)
Non-current provisions and misc. long-term liabilities (2,437) (2,419) (2,260)
Long-term financing (17,327) (17,287) (16,561)
Gross financial debt (17,027) (17,821) (17,779)
Net cash managed 3,152 4,540 2,894
Net financial debt (13,875) (13,281) (14,885)
23

Reduction in gross debt cost (average rate):
May 2014: S&P confirms credit rating at A- Outlook Stable
March 2015: Moody’s confirms credit rating at Baa1 Outlook Stable
Financial policy
24
Optimise average gross financial debt maturity
4.9 years: average gross financial debtmaturity at 30 June 2015
20202015 2016 2017
2015-2021 maturity schedule (in € bn):
Optimise financing cost
3.51%1H 2015
2018 2019
Anti-dilution strategy
€186 m: CNA debt repayments (avg. rate of 4.55%)
€450 m: 2 year maturity debt repayment
€466m share buy-backs in 1H 2015
(8.8 mn shares)
Treasury stock : 42.2m shares as at 30 June 2015
(7.1% of capital)
€6.0 bn unused bank credit lines maturing May 2020
€3.2 bn net cash managed as of 30 June 2015
Maintain high level of liquidity
2021
2H
1.11.9 2.1
2.6
1.6 1.6 1.5
TSS
3.70%1H 2014

Outlook and strategyXavier Huillard, Chairman and CEO

-2.8%
+2%
-10%
-2%
Contracting order book
26
Stable order book between 30 June 2015 and 30 June 2014 *
June 15
27.9
7.5
14.0
6.5
Dec. 14
8.0
13.9
28.7
6.8
16.1
5.5
6.3
16.3
5.6
6.8
France
International ex-EuropeEurope ex-France
VINCI EnergiesEuroviaVINCI Construction
HSR Tours-Bordeaux (SEA)
Breakdown by geographical area Breakdown by business line
June 14
29.6
7.9
16.0
5.7
16.7
6.2
6.6
Δ∆ 15/14 JuneExcl. SEAActual
Δ∆ 15/14 JuneExcl. SEAActual
June 15Dec. 14June 14
stable
+3%
-7%
+2%
29.6 27.9-2.8%
-13%
+1%
+20%
28.7
* Excluding SEA
stable
-8%

An increase in Concessions revenue*, including upwards adjustment of traffic growth: now expected to be equivalent to that achieved in 2014 for both VINCI Autoroutes (>2%) and VINCI Airports (almost 9%).
27
2015 outlook
Revenue
Slight decline(actual)
Revenue generated
outside France is expected to increase and
represent more than 40% of total
revenue
EBIT Group marginincrease
Expected increase in EBIT to revenue percentage, driven by an improvement in the concessions contribution and a stabilisation of the contracting margins.
Net income** Slightly upNet income excluding non-recurring items should increase
slightly compared to 2014.
Overall evolution in Contracting revenue, comparable to that recorded for the first half (actual).- In France, revenue contraction should be close to 10%- Outside France, revenue should be up sharply,
essentially thanks to the acquisitions made.
The recent change in order intake seems to confirm that a low point could be reached in 2H 2015.
* excluding VINCI Park ** excluding non-recurring items
Conc
essi
ons
Cont
ract
ing

Dividend
28
2015 interim dividend
Interim dividend (all-cash) per share:
Compared to as of 1H 2014
§ Ex-date: 10 November 2015
§ Payment date: 12 November 2015
€0.57€0.55*
* excluding exceptional dividend of €0.45

Special focus on growth activities
Expand international
footprint in all business lines
Extract more value
from our current
positions
VINCI’s strategic priorities for sustainable, profitable growth
29
Create long-term value relying on VINCI’s integrated concession-construction model while maintaining financial discipline
ü Build on local knowledge & presence everywhereü Look for LT growth outside of Europe, particularly through acquisitionsü Focus on hi-tech, high value added sectors (Soletanche Freyssinet, ETF)
ü Develop synergies
ü Restructure under-performing country-business combinations,
ü Reinforce managerial and operational discipline
VINCI Airportsü Take advantage of
worldwide air traffic growth
ü Seek out greenfield and brownfield opportunities
VINCI Energiesü Huge external growth
potential
ü Structure & size permit expansion on a global scale

Thank you for your attention

AppendixesStructure and shareholder base
Business line profilesFinancial data

Structure and shareholder base

VINCI – A global leader in concessions and contracting
33
3,000business units
260,000worksites
Concessions2014 revenue: €5.8 bn
12 900 people
Contracting2014 revenue: €32.9 bn
171 700 people
VINCI Autoroutes VINCI Airports Eurovia VINCI
ConstructionOther
concessionsVINCI Energies
185,300employees
114,000employee shareholders
€38.7 bn2014 Group revenue
>110countries where VINCI operates
€27 bnmarket cap. at end 2014
61%shareholders outside France

34
Shareholder base at 30 June 2015
InstitutionalInvestors
Individual Investors
Employees
Qatar Holding LLC
Treasury Shares
Rest of World
Rest of Europe
United States
United Kingdom
France
69.1 %
Over 500 institutional investorsApproximately 185,000 individual shareholders114,700 Group employees and former employees are shareholders, including ~ 18,000 outside France
7.8%21.0%
17.1%
8.3% 14.9%
8.7%
9.8%
5.3%
7.1%

Business line profiles

Concessions

France 87%RoW 4%
Portugal 9%
Concessions Profile
= % of 2014 Concessions revenueXX%
Revenue 5,823France 5,101International 722
EBITDA 3,823as % of revenue 65.6%Net income 1,779*Capital employed 26,474
Free Cash Flow 1,597
Road, rail and bridge infra-structure, stadiums, parkings• Toll roads in Germany & Slovakia• Tunnels/bridges in France, UK, Canada,
Portugal & Greece• Rail: Tours Bordeaux HSR, Synerail,
Rhônexpress, • Stadiums under concessions: Stade de
France, Allianz Riviera, MMArena• 24.7% stake in VINCI Park
Toll Road operator in France• 4,386 km under concession • 4 concession operating companies: ASF,
Cofiroute, Escota and Arcour• over 2 million customers on the
networks every day
82% 12% 6%
€5.8 bn
2014 Key figures 2014 revenue by geographical area
OTHERCONCESSIONS
Regional and national airport operator• 11 regional airports in France• 10 national airports in Portugal• 3 national airports in Cambodia• 1 national airport in Chile• 46.8 million passengers• 100 regular airlines• 450 destinations worldwide• 8% stake in ADP
* Including the net disposal gain on the opening of VINCI Park’s share capital (€691 million) finalised on 4 June 2014
2014 data
37


VINCI Autoroutes
2033 2027 2031 2070 2086
(€ in millions)
Revenue 4,743
EBITDA 3,389
as % of revenue 71.4%
Net income 916
Capital employed 22,049
Free Cash Flow 1,467
Headcount at 31 December 2014 7,228
Europe’s leading Toll Road concession operator
2014 Key figures
ASFESCOTA
CofirouteA19 -Arcour
>35%of total motorway network
in France
End of concession
4,386 km under concession
approx. 50%of conceded French toll roads
39
(1)
(1) Toll tunnel connecting Rueil-Malmaison to Versailles / Vélizy


VINCI Airports
46.8 million passengers in 2014
2012
A key strategic focus for VINCI
23 airports managed *
8% stake in
A fast-growing, profitable business
48%Ebitda margin
in 2014
+9.1%FY 2014
+9.5%in Portugal
+12.8%in Cambodia
+3.5%in FranceMarket value: approx. €800m
Dynamic traffic trends
€3.6 bncapital
employed
Revenue (in €m)
170 629 7172013 PROFORMA 2014
10 Portugal35.1 million pax
10 France
6.0 million pax 3 Cambodia
5.7 million pax
Acquisition of
*25 in 2015 including Santiago Airport in Chile (>16 million pax) and Toulon Hyères Airport (0,5 million pax) 41

Aviation46%
Security/PRM13%
Ground Handling
15%
Non-Aviation26%
VINCI Airports
Underweight of Non-Aviation business upside
VINCI Airports revenue breakdown by activity (2014):
AviationQ Most of revenues are regulated: passenger & landing
feesDrivers: passenger traffic, ATMs*, regulatory framework
Non-Aviation Q Retail, real estate, car parks, car rental, advertisingQ Strong potential upside
Drivers: traffic, surfaces, lay-out, contract management
Ground handlingQ In Cambodia and France where integrated: directly
operated by airport managerQ In Portugal: Portway, 100% subsidiary of ANA
Drivers: ATMs, passenger traffic
Security / PRM**Q Mandatory activitiesQ At cost activities
* ATMs: Air traffic movements** PRM : Persons with reduced mobility
14
3
2
1
2
3
4
42

Country Name Description End of concession
VINCI share
Traffic risk
Consoli-dation*
VINCI AirportsCambodia Phnom Penh Concession
Siem Reap Concession 2040 70 % Yes FCSihanoukville Concession
France Quimper Cornouaille DSP (2014: 100 KPAX) 2016 100% Yes FCPoitiers-Biard DSP (2014: 110 KPAX) 2019 100% Yes FCGrenoble-Isère DSP (2014: 321 KPAX) 2023 100% Yes FCBretagne Rennes & Dinard DSP (2014: 615 KPAX) 2024 49% Yes EMClermont-Ferrand Auvergne DSP (2014: 425 KPAX) 2026 100% Yes FCChambéry-Savoie DSP (2014: 224 KPAX) 2029 100% Yes FC
Aéroports du Grand Ouest(Nantes Atlantique, Saint Nazaire) Concession (2014: 4,180 KPAX) 2065 85 % Yes FC
Toulon Hyères Concession** (2014: 550 KPAX) 2040 100% Yes FC
PortugalANA (10 airports in Lisbon, Porto, Faro, Madeira, Azores)
Concession(2014: 35,088 KPAX) 2063 100% Yes FC
Chile Santiago Concession *** (2014: >16m PAX) 2035 40% Yes EM
DSP: outsourced public service
2014: 5,728 KPAX
* FC: full consolidation; EM: equity method
VINCI Airports
** Beginning of the concession in April 2015*** Beginning of the concession in October 2015 43

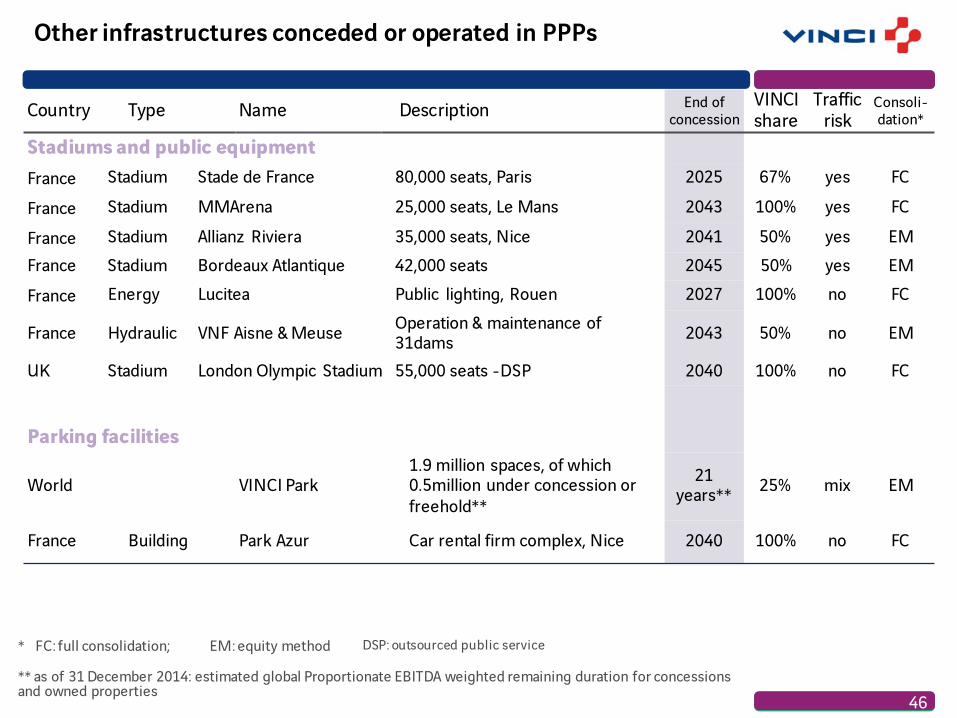
Other infrastructures conceded or operated in PPPs
Country Type Name Description End of concession
VINCI share
Traffic risk
Consoli-dation*
Road infrastructure
Germany Motorway A4 Horselberg 45 km 2037 50% yes EM
Germany Motorway A9 Thuringia/ Bavarian border 46.5 km 2031 50% no EM
Germany Motorway A5 Malsch–Offenburg 60 km 2039 54% yes EM
UK Road Hounslow PFI 432 km roads; 763 km sidewalks 2037 50% no EM
UK Road Isle of Wight PFI 821 km roads; 767 km sidewalks 2038 50% no EM
UK Road Newport Southern Distributor Road 10 km 2042 50% yes EM
Greece Motorway Athens-Corinth-Patras 201 km 2038 29,9% yes EM
Greece Motorway Maliakos–Kleidi 230 km 2038 13,8% yes EM
Slovakia Road Express way R1 52 km 2041 50% no EM
Russia HighwayMoscow- St Petersburg (Sections 1&2)
43 km 2040 50% yes EM
* FC: full consolidation; EM: equity method 44

Other infrastructures conceded or operated in PPPs
Country Type Name Description End of concession
VINCI share
Traffic risk
Consoli-dation*
Bridges and tunnelsFrance Tunnel Prado Carénage Road tunnel, Marseille 2025 33% yes EM
France Tunnel Prado Sud Road tunnel, Marseille 2055 58.5% yes EM
Greece Bridge Rion–Antirion 2.9 km mainland–Peloponnese link 2039 57.4% yes EM
Portugal Bridge Lusoponte Vasco da Gama & 25 de Abril bridges, Lisbon 2030 37.3% yes EM
Netherlands Tunnel Coentunnel 2 tunnels (4-lane dual carriageway), Amsterdam 2037 21% no EM
Canada Bridge Pont de la Confédération Link to Prince Edward Island 2032 20% yes EM
UK Bridge Severn Crossings Two bridges over the Severn 2018 35% yes EM
Rail infrastructure
France Rail RhônExpress 23 km light rail system, Lyon 2038 35% yes EM
Belgium Tunnel Liefkenshoek, Antwerp Rail tunnel under the Escaut 2050 28% no EM
• FC: full consolidation; EM: equity method
45
Other infrastructures conceded or operated in PPPs
Country Type Name Description End of concession
VINCI share
Traffic risk
Consoli-dation*
Stadiums and public equipmentFrance Stadium Stade de France 80,000 seats, Paris 2025 67% yes FC
France Stadium MMArena 25,000 seats, Le Mans 2043 100% yes FC
France Stadium Allianz Riviera 35,000 seats, Nice 2041 50% yes EMFrance Stadium Bordeaux Atlantique 42,000 seats 2045 50% yes EMFrance Energy Lucitea Public lighting, Rouen 2027 100% no FC
France Hydraulic VNF Aisne & Meuse Operation & maintenance of 31dams 2043 50% no EM
UK Stadium London Olympic Stadium 55,000 seats -DSP 2040 100% no FC
Parking facilities
World VINCI Park1.9 million spaces, of which 0.5million under concession or freehold**
21 years** 25% mix EM
France Building Park Azur Car rental firm complex, Nice 2040 100% no FC
* FC: full consolidation; EM: equity method
** as of 31 December 2014: estimated global Proportionate EBITDA weighted remaining duration for concessions and owned properties
DSP: outsourced public service
46

Conceded or PPP infrastructure under construction
Country Type Name Description End of concession
VINCI share
Traffic risk
Consoli-dation*
France Rail GSM-RailGround-train communication system on 14,000 km of track
2025 30% no EM
Bus TCSP Martinique Operation and maintenance of bus route and vehicles 2035 100% no FC
Rail SEA Tours-Bordeaux high-speed line
340 km of high-speed rail line 2061 33.4% yes EM
International
USA Bridge & Tunnel Ohio River Bridge Bridge (762 mtrs) and tunnel
(512 mtrs), Lyessville, KY 2051 33.3% no EM
Canada ** Highway Regina Bypass 61 km (2x2 lanes) 2045 37.5% no EM
Russia *** Highway Moscow Saint-Petersburg section 7 & 8
Design, construction, financing and operation of section 7 & 8 (138 km)
2042 40% no EM
* FC: full consolidation; EM: equity method** VINCI preferred bidder*** Financial closing and finalisation of the construction contract in July 2015
47

Contracting

UK 8%Central and Eastern
European 5%
RoE 6%
Americas 6%
France 57%
RoW 5%
Africa 5%
Germany 8%
49= % of 2014 Contracting revenueXX%
Revenue 32,916
France 18,842
International 14,074
EBIT 1,148
as % of revenue 3.5%
Net income 588
Net financial surplus 1,606
Order book at period end (€ billions) 27.9
Contracting Profile
France’s leading constructioncompany and a major global player• Building• Civil engineering• Design and construction of complex
projects• Specialised civil engineering• Hydraulic engineering
A world leader in transportand urban development infrastructure• Transport infrastructure (road, rail)• Urban development infrastructure• Quarries• Industrial production (asphalt)• Maintenance and servicing
A market leader in France and a major player in Europein energy and information technology services• Infrastructure• Industry• Service sector• Telecommunications
28% 25% 47%
€32.9 bn
2014 Key figures 2014 revenue by geographical area
Est. revenue split between non-public and public sources:Non-public: 58%; Public: 42%

VINCI Energies
(€ in millions)
Revenue 9,309France 5,258International 4,051
EBIT 519as % of revenue 5.6%Net income 330Net financial debt (264)Headcount at 31 December 2014 63,297
Germany 18%
Belgium 3%
Africa 3%Rest of the world 5%
France 56%
Netherlands 3%
Rest of Europe 8%
Switzerland 4%
€9.3 bn
2014 Key figures 2014 revenue by geographical area
Energy and communication networksClimate engineering Building technical managementFacilities Management
Industrial processes Air conditioningHeating and acoustic insulation Mechanical engineeringIndustrial maintenance
EnergyTransportPublic lighting & CCTV Network maintenance
Information & communication TechnologyTelecommunications networksBusiness communicationNetwork maintenance
ICTInfrastructureIndustry Service sector
26%30% 32% 12%
= % of the division’s 2014 revenueXX%
Est. revenue split between non-public and public sources:Non-public: 80%; Public: 20%
50
1,500Business
Units

(€ in millions)
Revenue 8,188France 4,886International 3,302
EBIT 249as % of revenue 3.0%Net income 73Net financial surplus 133Headcount at 31 December 2014 40,170
2014 Key figures
Central and Eastern Europe 10%
UK 7%
Rest of Europe 2%
Canada 6%
France 60%
Germany 9%
Rest of the Americas 5%Rest of the world 1%
€8.2 bn
2014 revenue by geographical area
Eurovia
= % of the division’s 2014 revenueXX%
Road building & maintenance Industry
ServicesTransport/urbandevelopment infrastructure QuarriesIndustrial production
Construction and renovation of transport infrastructure: roads, railways
70%
Design, maintenance and management of road, motorway and rail networks
7%
10 asphalt production plants
14%
Extraction, transformation, trading and logistics for aggregatesNetwork of over 400 quarries
9%
Revenue split between non-public and public sources:Non-public: 47%; Public: 53%
51
400Business
Units

Major civil engineering structures and buildings operated worldwide
VINCI Construction
UK 11%Central and Eastern
Europe 5%Rest of Europe 3%
Americas 6%
France 56%
Rest of the world 10%
Africa 9%
(€ in millions)
Revenue 15,419France 8,698International 6,721
EBIT 380as % of revenue 2.5%Net income 186Net financial surplus 1,736Headcount at 31 December 2014 68,185
€15.4 bn
2014 Key figures 2014 revenue by geographical area
28%40%
Generalist subsidiaries
Civil engineeringBuildingNon residential / Residential
= % of the division’s 2014 revenueXX%
Specialised subsidiaries Major projectsSpecialised civil engineeringserving global markets
32%
Est. revenue split between non-public and public sources:Non-public: 51%; Public: 49%
52
1,000Business
Units

Detailed consolidated financial statements

Consolidated revenue
Δ∆ 15/14€ in millions 1H 2015 1H 2014 Actual Comparable FY 2014
Concessions 2,699 2,594 4.0% 3.8% 5,564VINCI Autoroutes 2,258 2,194 3.0% 2.9% 4,743
VINCI Airports 384 340 12.7% 11.3% 717
Other Concessions 57 60 (6.2%) (8.1%) 104
Contracting 15,244 15,620 (2.4%) (8.3%) 32,916VINCI Energies 4,795 4,356 10.1% (1.8%) 9,309
Eurovia 3,445 3,641 (5.4%) (7.4%) 8,188
VINCI Construction 7,005 7,622 (8.1%) (12.6%) 15,419
VINCI Immobilier 261 281 (7.2%) 11,4% 587
Eliminations (324) (290) (623)
Revenue* excl. VINCI Park 17,880 18,205 (1.8%) (6.7%) 38,444VINCI Park 0 259 259
Total revenue * 17,880 18,464 (3.2%) (6.7%) 38,703
54* Excluding revenue derived from concession subsidiaries’ works
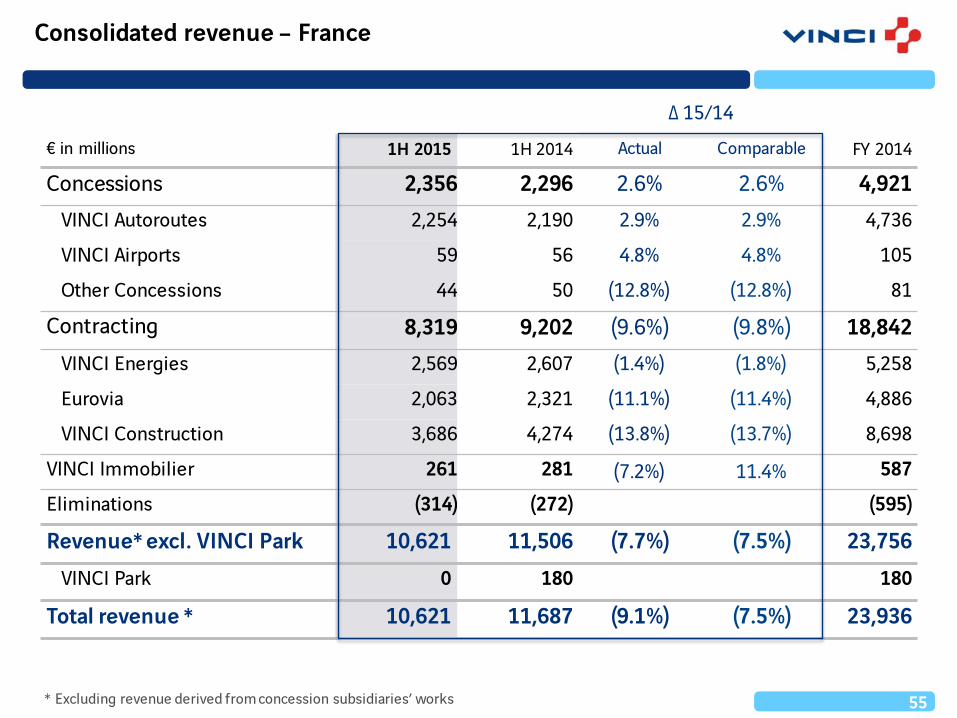
Consolidated revenue – France
Δ∆ 15/14€ in millions 1H 2015 1H 2014 Actual Comparable FY 2014
Concessions 2,356 2,296 2.6% 2.6% 4,921VINCI Autoroutes 2,254 2,190 2.9% 2.9% 4,736
VINCI Airports 59 56 4.8% 4.8% 105
Other Concessions 44 50 (12.8%) (12.8%) 81
Contracting 8,319 9,202 (9.6%) (9.8%) 18,842VINCI Energies 2,569 2,607 (1.4%) (1.8%) 5,258
Eurovia 2,063 2,321 (11.1%) (11.4%) 4,886
VINCI Construction 3,686 4,274 (13.8%) (13.7%) 8,698
VINCI Immobilier 261 281 (7.2%) 11.4% 587
Eliminations (314) (272) (595)
Revenue* excl. VINCI Park 10,621 11,506 (7.7%) (7.5%) 23,756VINCI Park 0 180 180
Total revenue * 10,621 11,687 (9.1%) (7.5%) 23,936
55* Excluding revenue derived from concession subsidiaries’ works

Consolidated revenue – international
Δ∆ 15/14
€ in millions 1H 2015 1H 2014 Actual Comparable FY 2014
Concessions 343 299 14.9% 12.6% 643VINCI Autoroutes 5 4 32.2% 13.9% 8
VINCI Airports 325 284 14.3% 12.5% 612
Other Concessions 13 10 26.2% 12.7% 23
Contracting 6,925 6,418 7.9% (6.4%) 14,074VINCI Energies 2,225 1,749 27.2% (1.7%) 4,051
Eurovia 1,382 1,320 4.6% (0.7%) 3,302
VINCI Construction 3,319 3,349 (0.9%) (11.2%) 6,721
Eliminations (10) (18) (28)
Revenue* exc. VINCI Park 7,259 6,699 8.4% (5.5%) 14,689
VINCI Park 0 78 78
Total revenue* 7,259 6,777 7.1% (5.5%) 14,767
56* Excluding revenue derived from concession subsidiaries’ works
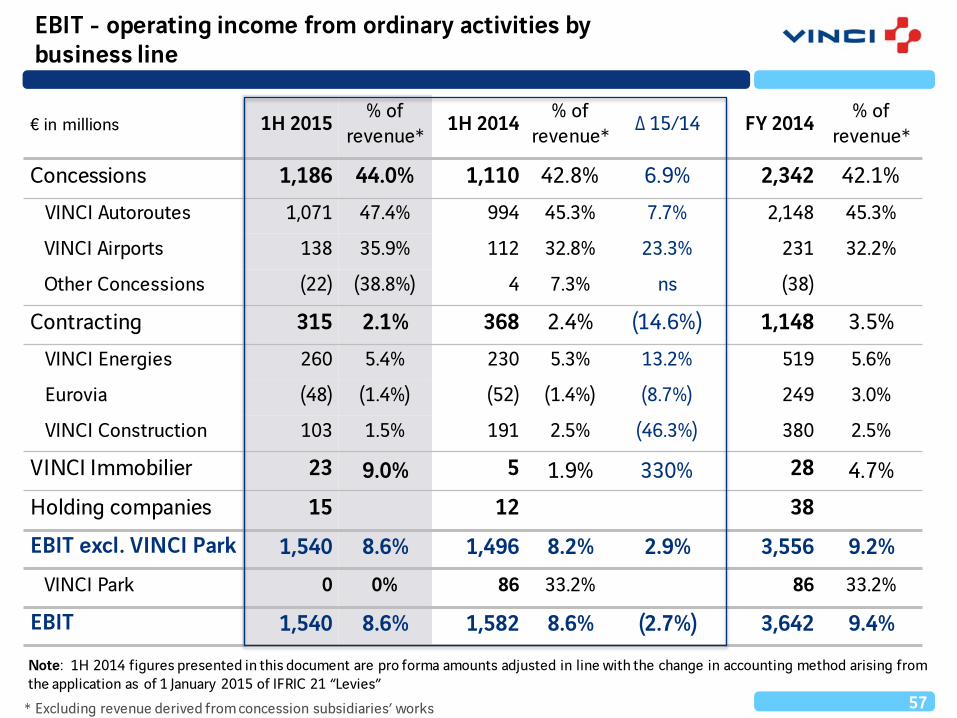
€ in millions 1H 2015 % of revenue* 1H 2014 % of
revenue* Δ∆ 15/14 FY 2014 % of revenue*
Concessions 1,186 44.0% 1,110 42.8% 6.9% 2,342 42.1%VINCI Autoroutes 1,071 47.4% 994 45.3% 7.7% 2,148 45.3%
VINCI Airports 138 35.9% 112 32.8% 23.3% 231 32.2%
Other Concessions (22) (38.8%) 4 7.3% ns (38)
Contracting 315 2.1% 368 2.4% (14.6%) 1,148 3.5%VINCI Energies 260 5.4% 230 5.3% 13.2% 519 5.6%
Eurovia (48) (1.4%) (52) (1.4%) (8.7%) 249 3.0%
VINCI Construction 103 1.5% 191 2.5% (46.3%) 380 2.5%
VINCI Immobilier 23 9.0% 5 1.9% 330% 28 4.7%Holding companies 15 12 38EBIT excl. VINCI Park 1,540 8.6% 1,496 8.2% 2.9% 3,556 9.2%
VINCI Park 0 0% 86 33.2% 86 33.2%
EBIT 1,540 8.6% 1,582 8.6% (2.7%) 3,642 9.4%
57
EBIT - operating income from ordinary activities by business line
* Excluding revenue derived from concession subsidiaries’ works
Note: 1H 2014 figures presented in this document are pro forma amounts adjusted in line with the change in accounting method arising fromthe application as of 1 January 2015 of IFRIC 21 “Levies”
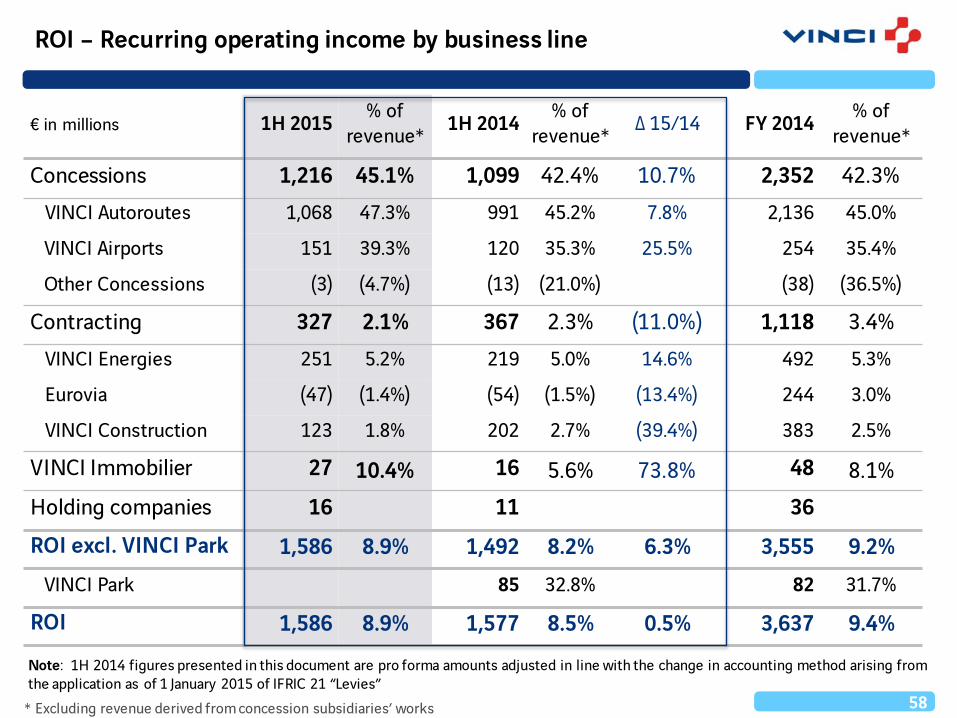
€ in millions 1H 2015 % of revenue* 1H 2014 % of
revenue* Δ∆ 15/14 FY 2014 % of revenue*
Concessions 1,216 45.1% 1,099 42.4% 10.7% 2,352 42.3%VINCI Autoroutes 1,068 47.3% 991 45.2% 7.8% 2,136 45.0%
VINCI Airports 151 39.3% 120 35.3% 25.5% 254 35.4%
Other Concessions (3) (4.7%) (13) (21.0%) (38) (36.5%)
Contracting 327 2.1% 367 2.3% (11.0%) 1,118 3.4%VINCI Energies 251 5.2% 219 5.0% 14.6% 492 5.3%
Eurovia (47) (1.4%) (54) (1.5%) (13.4%) 244 3.0%
VINCI Construction 123 1.8% 202 2.7% (39.4%) 383 2.5%
VINCI Immobilier 27 10.4% 16 5.6% 73.8% 48 8.1%Holding companies 16 11 36ROI excl. VINCI Park 1,586 8.9% 1,492 8.2% 6.3% 3,555 9.2%
VINCI Park 85 32.8% 82 31.7%
ROI 1,586 8.9% 1,577 8.5% 0.5% 3,637 9.4%
58
ROI – Recurring operating income by business line
* Excluding revenue derived from concession subsidiaries’ works
Note: 1H 2014 figures presented in this document are pro forma amounts adjusted in line with the change in accounting method arising fromthe application as of 1 January 2015 of IFRIC 21 “Levies”

Financial income/(expense)
€ in millions 1H 2015 1H 2014 Δ∆ 15/14 FY 2014
Cost of net financial debt (277) (304) 27 (616)
Other financial income and expenses (4) (23) 19 (61)
Borrowing costs capitalised 11 8 2 17
Liability discount cost (27) (32) 4 (80)
Foreign exchange gains and losses 13 0 13 2
Financial income/(expense) (281) (327) 46 (677)
59

€ in millions 1H 2015 % of revenue* 1H 2014 % of
revenue* Δ∆ 15/14 FY 2014 % of revenue*
Concessions 1,879 69.6% 1,746 67.3% 7.6% 3,730 67.0%VINCI Autoroutes 1,679 74.3% 1,612 73.5% 4.1% 3,389 71.4%
VINCI Airports 198 51.7% 149 43.9% 32.7% 342 47.7%
Other Concessions 3 4.6% (16) (25.8%) (1)
Contracting 557 3.7% 577 3.7% (3.4%) 1,624 4.9%VINCI Energies 279 5.8% 241 5.5% 15.8% 562 6.0%
Eurovia 35 1.0% 45 1.2% (22.9%) 437 5.3%
VINCI Construction 243 3.5% 291 3.8% (16.3%) 625 4.1%
VINCI Immobilier 23 8.9% 5 1.8% 349.0% 26 4.5%Holdings 11 8 88EBITDA** excl. VINCI Park 2,471 13.8% 2,336 12.8% 5.8% 5,468 14.2%
VINCI Park 0 93 36.0% 93 36.0%
EBITDA** 2,471 13.8% 2,429 13,2% 1.7% 5,561 14.4%
EBITDA*
Note: 1H 2014 figures presented in this document are pro forma amounts adjusted in line with the change in accounting method arising fromthe application as of 1 January 2015 of IFRIC 21 “Levies”
60** Excluding revenue derived from concession subsidiaries’ works * Cash flow from operations before tax and financing costs by business line
60

Cash flow statement (1/2)
€ in millions 1H 2015 1H 2014 FY 2014
EBITDA* 2,471 2,429 5,561
Change in WCR and current provisions (831) (1,250) (158)
Income taxes paid (465) (696) (1,282)
Net interest paid (331) (348) (586)
Dividends received from companies accounted for under the equity method 73 50 99
Net operating investments (273) (275) (637)
Operating cash flow 643 (89) 2,997
o/w Concessions 1,033 1,068 2,403
o/w Contracting (633) (1,175) 398
Growth investments in concessions & PPPs (396) (380) (799)
Free cash flow (after investments) 247 (469) 2,197
61* Cash flow from operations before tax and financing costs by business line

Cash flow statement (2/2)
€ in millions 1H 2015 1H 2014 FY 2014
Free cash flow (after investments) 247 (469) 2,197
Net financial investments and other cash flows (161) 774* 317
Cash flow before movements in share capital 86 305 2,515
Share capital increases and other operations 312 345 441
Dividends (683) (690) (1,287)
Share buy-backs (466) (770) (810)
Net cash flow for the period (752) (810) 859
Other and consolidation impacts 158 28 (37)
Change in net financial debt (594) (782) 823
62
* including the impacts of the opening of VINCI Park’s share capital and the buy out of Cofiroute non-controlling interests

Operating investments, net
€ in millions 1H 2015 1H 2014 Δ∆ 15/14 FY 2014
Concessions 17 27 (11) 63VINCI Autoroutes 5 6 (1) 12VINCI Airports 5 3 1 28VINCI Park 0 17 (17) 17Other Concessions 7 1 6 6
Contracting 310 296 14 680VINCI Energies 44 48 (4) 108Eurovia 97 93 4 218VINCI Construction 169 154 15 354
VINCI Immobilier and holdings 0 0 0 1Purchases of PP&E and intangible assets 327 324 3 744Proceeds from sales of PP&E and intangible assets (54) (49) 5 (108)Operating investments (net of disposals) 273 275 (1) 637
63

Growth investments in concessions and PPPs
€ in millions 1H 2015 1H 2014 Δ∆ 15/14 FY 2014
Concessions 385 385 0 806
VINCI Autoroutes 307 321 (14) 684
O/w : ASF / Escota 246 257 (11) 553
Cofiroute 61 64 (3) 130
VINCI Airports 53 31 22 59
VINCI Park 0 22 (22) 22
Other Concessions 25 11 14 41
Contracting 11 (5) 17 (6)Growth investments in concessions and PPPs (net) 396 380 16 799
64
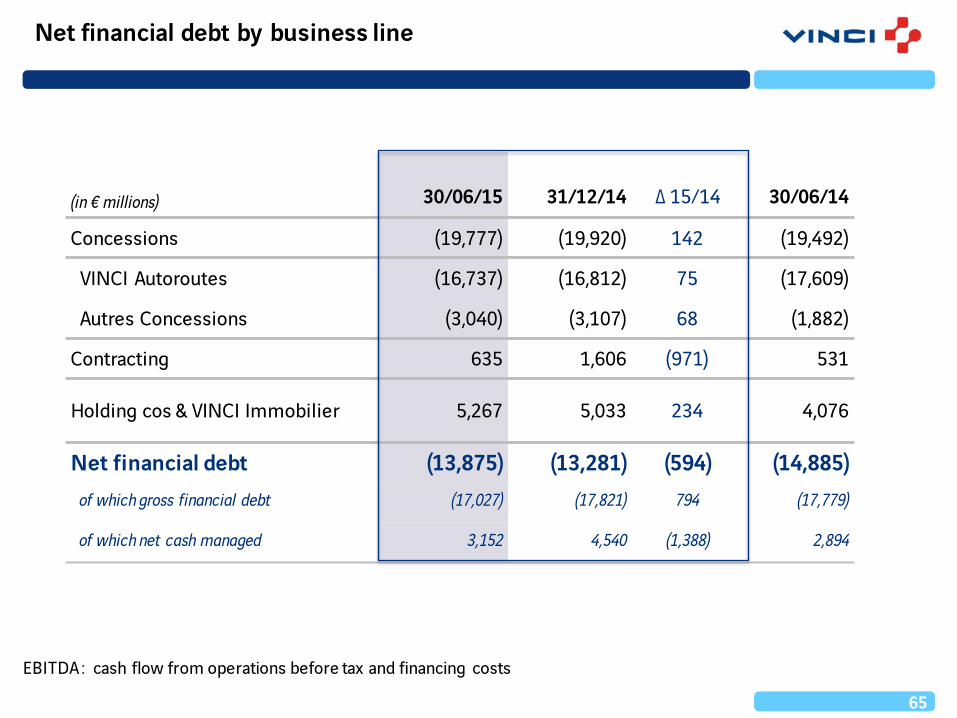
Net financial debt by business line
(in € millions) 30/06/15 31/12/14 Δ∆ 15/14 30/06/14
Concessions (19,777) (19,920) 142 (19,492)
VINCI Autoroutes (16,737) (16,812) 75 (17,609)
Autres Concessions (3,040) (3,107) 68 (1,882)
Contracting 635 1,606 (971) 531
Holding cos & VINCI Immobilier 5,267 5,033 234 4,076
Net financial debt (13,875) (13,281) (594) (14,885)of which gross financial debt (17,027) (17,821) 794 (17,779)
of which net cash managed 3,152 4,540 (1,388) 2,894
65
EBITDA : cash flow from operations before tax and financing costs

66
Other concessions Holdings and misc.CofirouteASF
Arcour
Maturity of gross financial debt
Average maturity of gross financial debt at end June 2015: 4.9 years (Concessions: 5.3 years)
Repayment schedule at end June 2015
0
500
1 000
1 500
2 000
2 500
3 000
S2 2015 2016 2017 2018 2019 2020 2021 2022 2023 2024 2025 2026 2027 2028 2029
TSS

Alexandra [email protected]: +33 1 47 16 33 46
67
IR Contacts and Agenda
CONTACT AGENDA
October 20153rd quarter 2015 information press release
November 2015Interim dividend ex-date
November 2015
Interim dividend payment date
22
10
12