Embed Size (px)
Citation preview

ISO-NE PUBLIC
David J. Ehrlich
S U P E R V I S O R , L O A D F O R E C A S T I N G
2015 Historical Market Data: Locational Marginal Prices Interface MW Flows
Planning Advisory Committee Meeting
J A N U A R Y 2 1 , 2 0 1 6 | M I L F O R D , M A
ISO-NE PUBLIC
2
• Average Real-time Locational Marginal Prices by subarea
– Hourly Dollar per MWh
– May have rounding and precision differences with Market Reports
• Internal Interfaces: Monthly Box Plots & Flow Duration Curves
– Percentage of Limit
• Percentages close to the limit may result from interface flows below the maximum due to conditions that reduce the transfer limit
• Market Information is summarized in other ISO-NE publications, such as the Annual Market Report : http://www.iso-ne.com/markets-operations/market-monitoring-mitigation/internal-monitor
• Presentation is meant to show general trends of real time data
– Anomalies within a trend are usually due to short-term events (for example, a generator or line outage)
• Real time data is subject to errors, missing data
Overview
ISO-NE PUBLIC
3
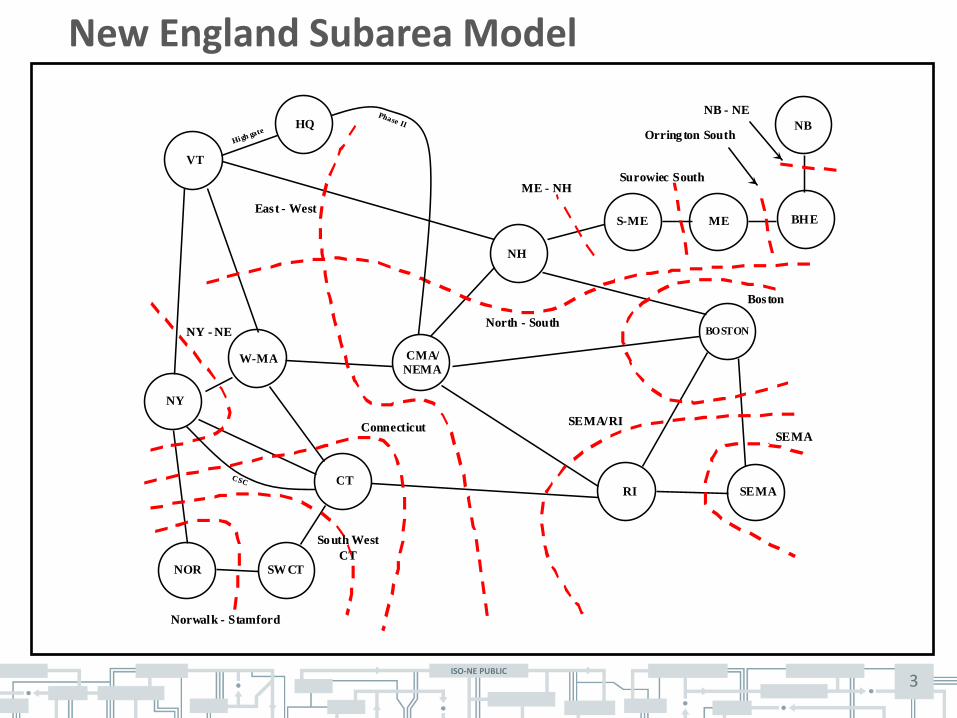
New England Subarea Model
NB
NH
BHEMES-ME
BOSTON
RI SEMACT
SW CTNOR
CMA/
NEMAW-MA
VT
NY
East - WestEast - West
Orring ton SouthOrring ton South
SurowiecSurowiec South SouthME - NHME - NH
North - SouthNorth - South
BostonBoston
SEMA/RISEMA/RI
SEMASEMA
NY - NENY - NE
South WestSouth West
CTCT
ConnecticutConnecticut
Norwalk - StamfordNorwalk - Stamford
NB - NENB - NE
HQ
High gate
High gate
Phase II
Phase II
CSCCSC
ISO-NE PUBLIC
4
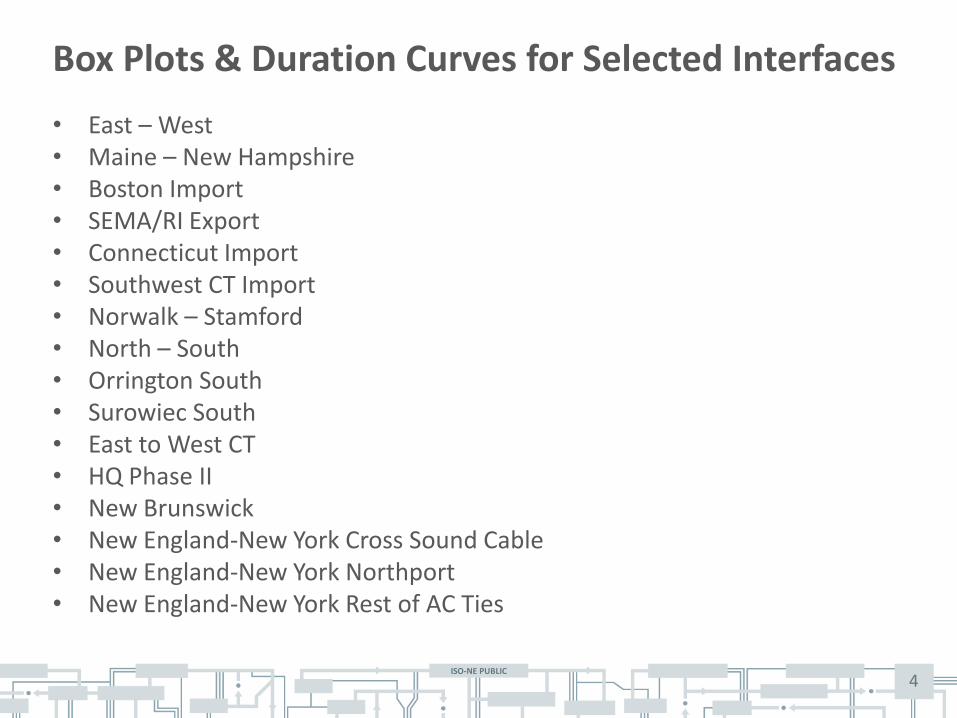
• East – West • Maine – New Hampshire • Boston Import • SEMA/RI Export • Connecticut Import • Southwest CT Import • Norwalk – Stamford • North – South • Orrington South • Surowiec South • East to West CT • HQ Phase II • New Brunswick • New England-New York Cross Sound Cable • New England-New York Northport • New England-New York Rest of AC Ties
Box Plots & Duration Curves for Selected Interfaces
ISO-NE PUBLIC
5
• HQ Phase II, New Brunswick, and New York Ties Metered Hourly Net Flows can be found on ISONE website
– http://www.iso-ne.com/isoexpress/web/reports/grid/-/tree/external-interface-metered-data
• Limits for internal interfaces are calculated in real time by Internal Limit Calculator and are dynamic
• 2010 – 2014 Flows and Limits for internal interfaces now posted on ISO-NE website and 2015 will be posted soon
– http://www.iso-ne.com/isoexpress/web/reports/load-and-demand/-/tree/historical-hourly-flows-and-limits
Interface Notes
ISO-NE PUBLIC
6
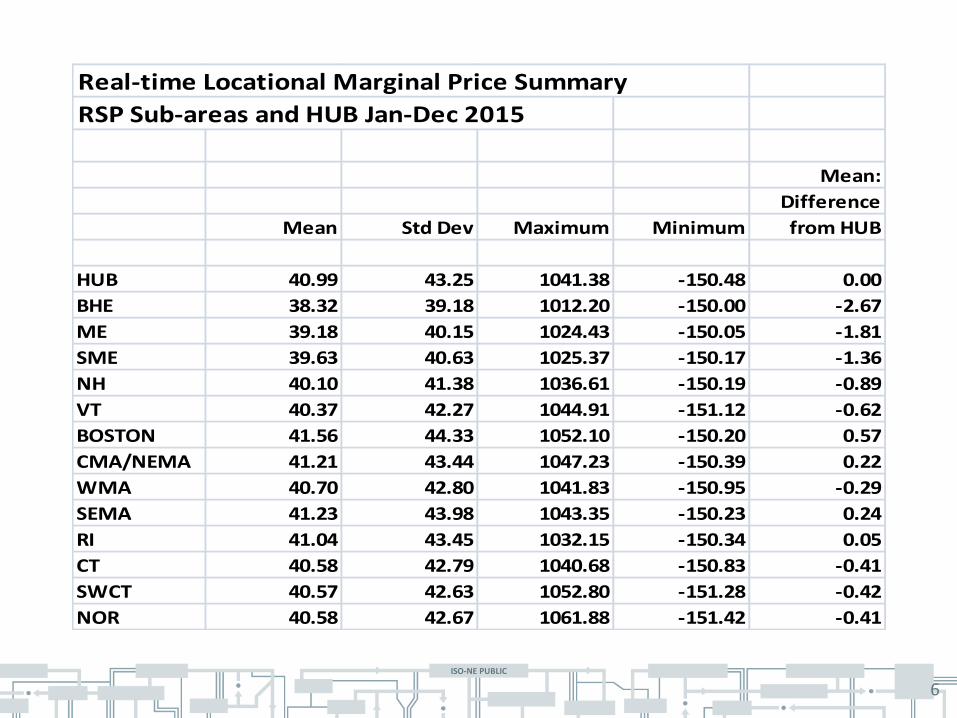
Real-time Locational Marginal Price Summary
RSP Sub-areas and HUB Jan-Dec 2015
Mean:
Difference
Mean Std Dev Maximum Minimum from HUB
HUB 40.99 43.25 1041.38 -150.48 0.00
BHE 38.32 39.18 1012.20 -150.00 -2.67
ME 39.18 40.15 1024.43 -150.05 -1.81
SME 39.63 40.63 1025.37 -150.17 -1.36
NH 40.10 41.38 1036.61 -150.19 -0.89
VT 40.37 42.27 1044.91 -151.12 -0.62
BOSTON 41.56 44.33 1052.10 -150.20 0.57
CMA/NEMA 41.21 43.44 1047.23 -150.39 0.22
WMA 40.70 42.80 1041.83 -150.95 -0.29
SEMA 41.23 43.98 1043.35 -150.23 0.24
RI 41.04 43.45 1032.15 -150.34 0.05
CT 40.58 42.79 1040.68 -150.83 -0.41
SWCT 40.57 42.63 1052.80 -151.28 -0.42
NOR 40.58 42.67 1061.88 -151.42 -0.41
ISO-NE PUBLIC
7
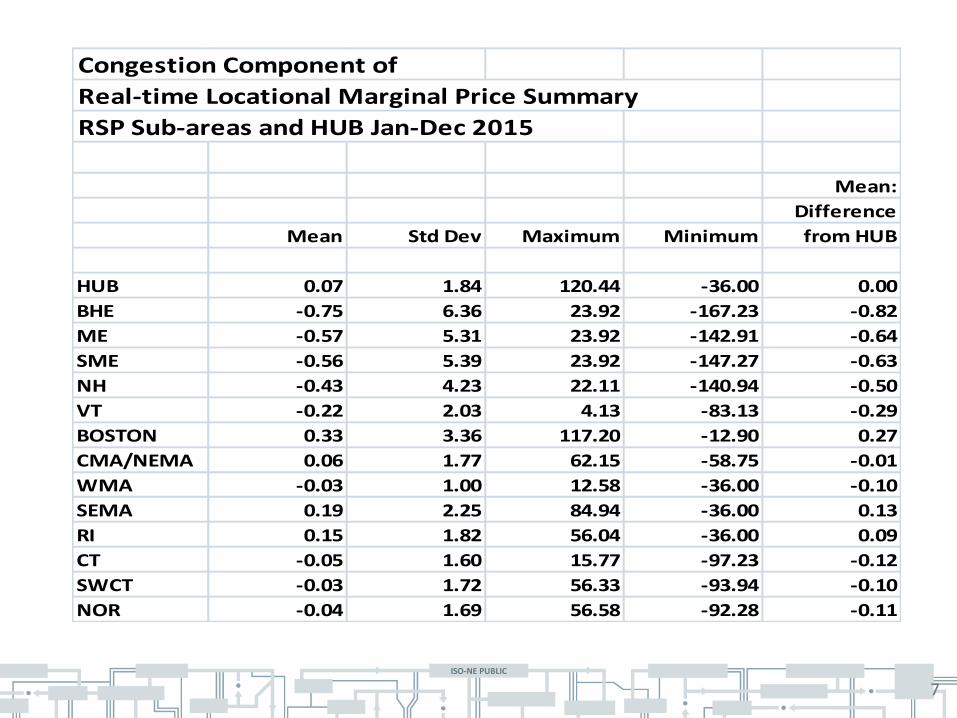
Congestion Component of
Real-time Locational Marginal Price Summary
RSP Sub-areas and HUB Jan-Dec 2015
Mean:
Difference
Mean Std Dev Maximum Minimum from HUB
HUB 0.07 1.84 120.44 -36.00 0.00
BHE -0.75 6.36 23.92 -167.23 -0.82
ME -0.57 5.31 23.92 -142.91 -0.64
SME -0.56 5.39 23.92 -147.27 -0.63
NH -0.43 4.23 22.11 -140.94 -0.50
VT -0.22 2.03 4.13 -83.13 -0.29
BOSTON 0.33 3.36 117.20 -12.90 0.27
CMA/NEMA 0.06 1.77 62.15 -58.75 -0.01
WMA -0.03 1.00 12.58 -36.00 -0.10
SEMA 0.19 2.25 84.94 -36.00 0.13
RI 0.15 1.82 56.04 -36.00 0.09
CT -0.05 1.60 15.77 -97.23 -0.12
SWCT -0.03 1.72 56.33 -93.94 -0.10
NOR -0.04 1.69 56.58 -92.28 -0.11
ISO-NE PUBLIC
8
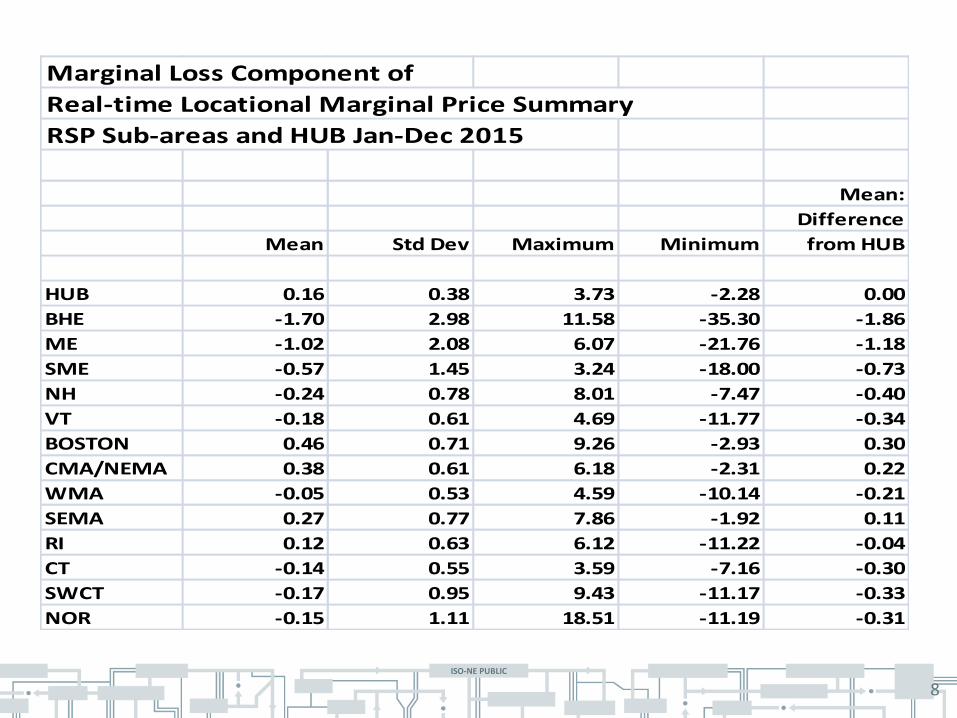
Marginal Loss Component of
Real-time Locational Marginal Price Summary
RSP Sub-areas and HUB Jan-Dec 2015
Mean:
Difference
Mean Std Dev Maximum Minimum from HUB
HUB 0.16 0.38 3.73 -2.28 0.00
BHE -1.70 2.98 11.58 -35.30 -1.86
ME -1.02 2.08 6.07 -21.76 -1.18
SME -0.57 1.45 3.24 -18.00 -0.73
NH -0.24 0.78 8.01 -7.47 -0.40
VT -0.18 0.61 4.69 -11.77 -0.34
BOSTON 0.46 0.71 9.26 -2.93 0.30
CMA/NEMA 0.38 0.61 6.18 -2.31 0.22
WMA -0.05 0.53 4.59 -10.14 -0.21
SEMA 0.27 0.77 7.86 -1.92 0.11
RI 0.12 0.63 6.12 -11.22 -0.04
CT -0.14 0.55 3.59 -7.16 -0.30
SWCT -0.17 0.95 9.43 -11.17 -0.33
NOR -0.15 1.11 18.51 -11.19 -0.31
ISO-NE PUBLIC
9
0.00
10.00
20.00
30.00
40.00
50.00
60.00
70.00
80.00
90.00
100.00
Do
llars
per
MW
h
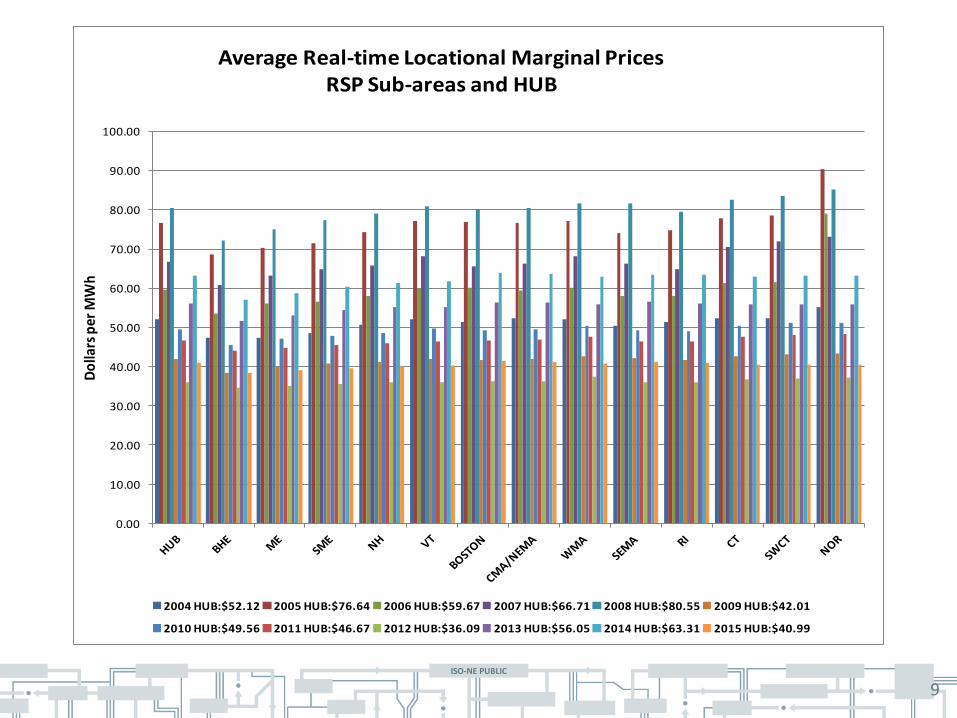
Average Real-time Locational Marginal PricesRSP Sub-areas and HUB
2004 HUB:$52.12 2005 HUB:$76.64 2006 HUB:$59.67 2007 HUB:$66.71 2008 HUB:$80.55 2009 HUB:$42.01
2010 HUB:$49.56 2011 HUB:$46.67 2012 HUB:$36.09 2013 HUB:$56.05 2014 HUB:$63.31 2015 HUB:$40.99
ISO-NE PUBLIC
10
-10.00
-5.00
0.00
5.00
10.00
15.00
20.00
Do
llars
per
MW
h
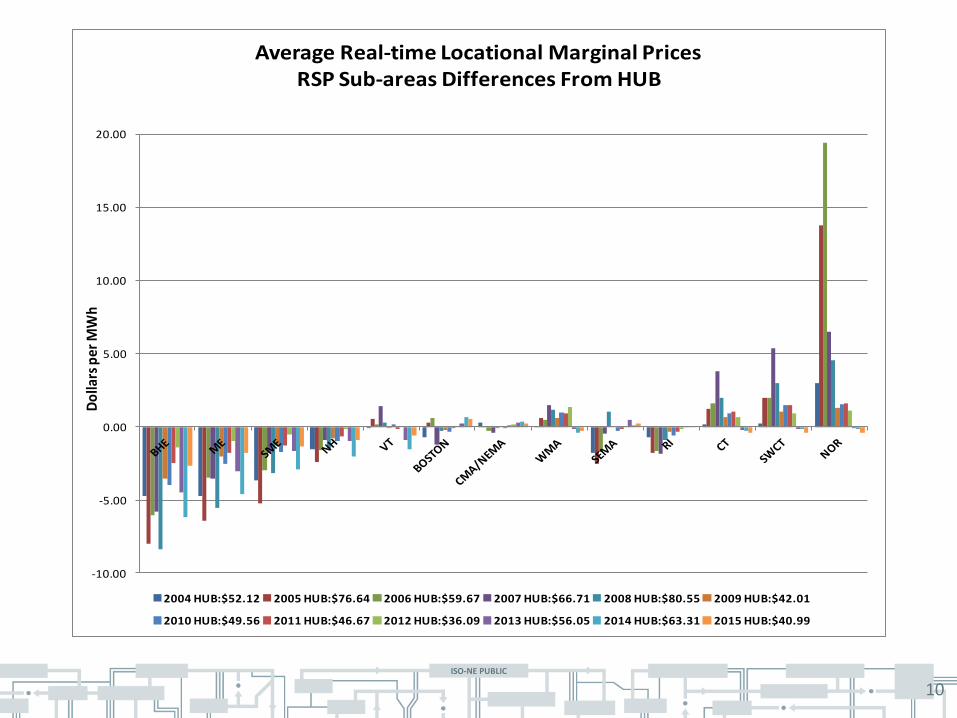
Average Real-time Locational Marginal PricesRSP Sub-areas Differences From HUB
2004 HUB:$52.12 2005 HUB:$76.64 2006 HUB:$59.67 2007 HUB:$66.71 2008 HUB:$80.55 2009 HUB:$42.01
2010 HUB:$49.56 2011 HUB:$46.67 2012 HUB:$36.09 2013 HUB:$56.05 2014 HUB:$63.31 2015 HUB:$40.99
ISO-NE PUBLIC
11
-5
0
5
10
15
20
Do
llars
per
MW
h
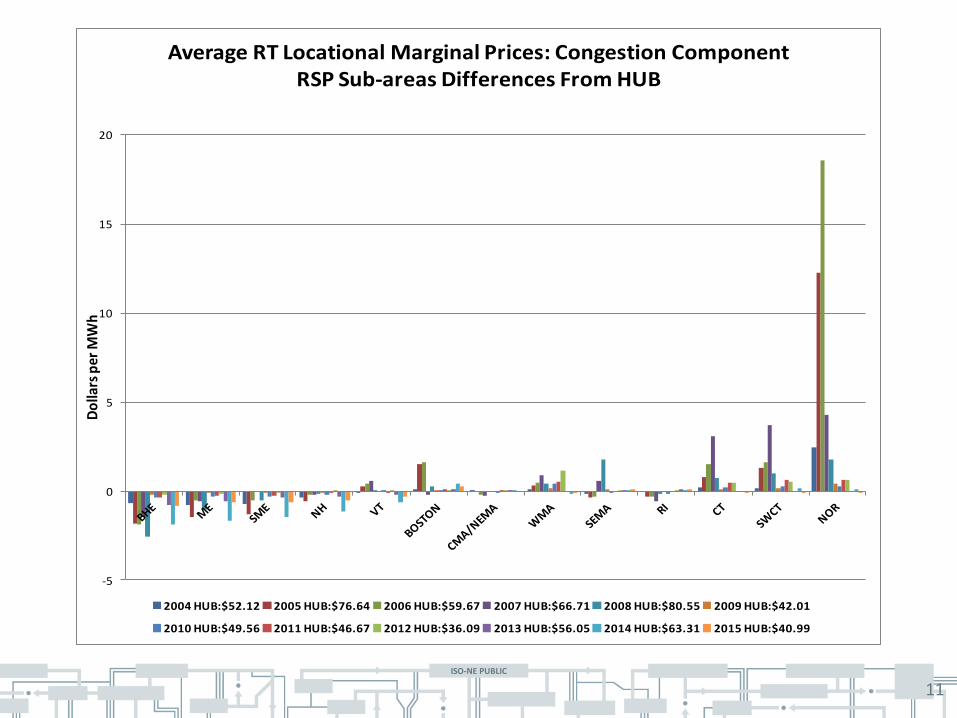
Average RT Locational Marginal Prices: Congestion ComponentRSP Sub-areas Differences From HUB
2004 HUB:$52.12 2005 HUB:$76.64 2006 HUB:$59.67 2007 HUB:$66.71 2008 HUB:$80.55 2009 HUB:$42.01
2010 HUB:$49.56 2011 HUB:$46.67 2012 HUB:$36.09 2013 HUB:$56.05 2014 HUB:$63.31 2015 HUB:$40.99
ISO-NE PUBLIC
12
-7
-6
-5
-4
-3
-2
-1
0
1
2
3
4
Do
llars
per
MW
h
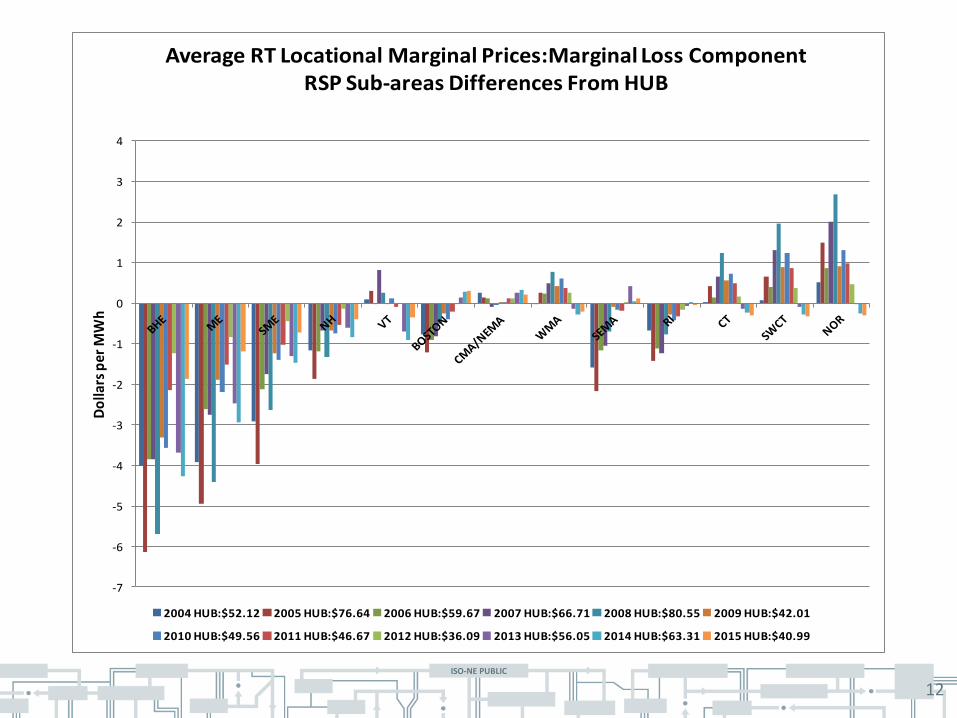
Average RT Locational Marginal Prices:Marginal Loss ComponentRSP Sub-areas Differences From HUB
2004 HUB:$52.12 2005 HUB:$76.64 2006 HUB:$59.67 2007 HUB:$66.71 2008 HUB:$80.55 2009 HUB:$42.01
2010 HUB:$49.56 2011 HUB:$46.67 2012 HUB:$36.09 2013 HUB:$56.05 2014 HUB:$63.31 2015 HUB:$40.99
ISO-NE PUBLIC
13
0.00
20.00
40.00
60.00
80.00
100.00
120.00
140.00
160.00
180.00
Jan Feb Mar Apr May Jun Jul Aug Sep Oct Nov Dec
Do
llars
per
MW
h
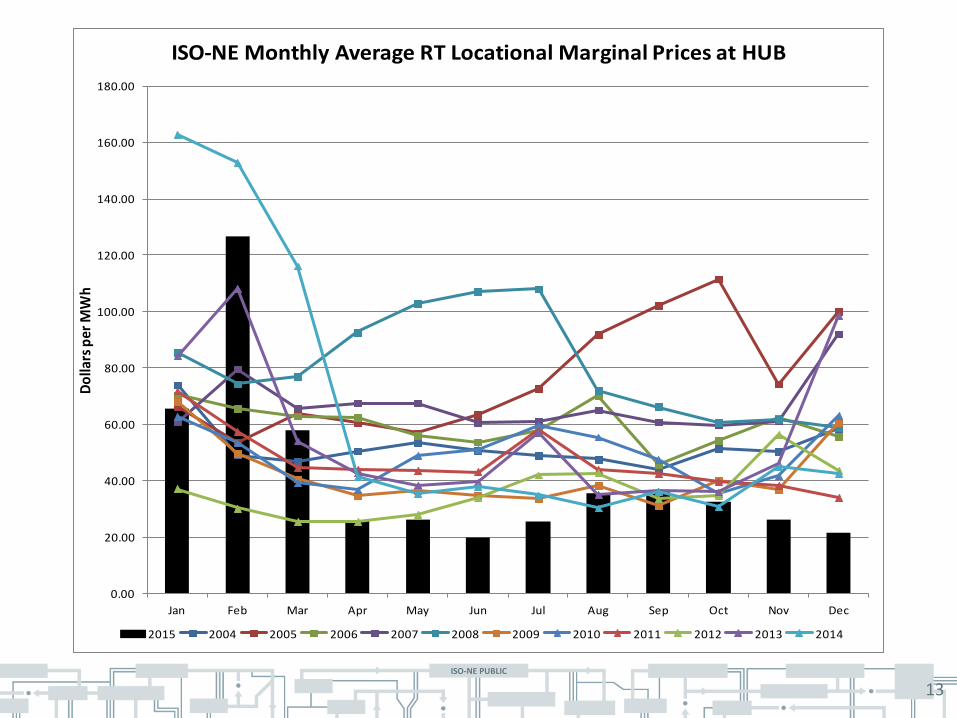
ISO-NE Monthly Average RT Locational Marginal Prices at HUB
2015 2004 2005 2006 2007 2008 2009 2010 2011 2012 2013 2014
ISO-NE PUBLIC
14
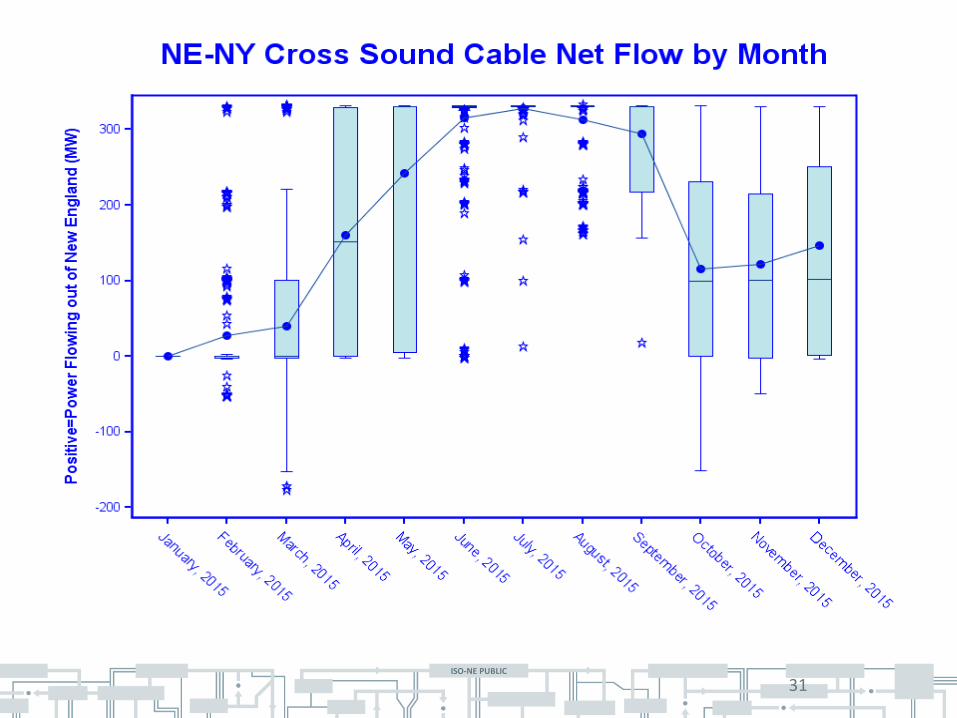
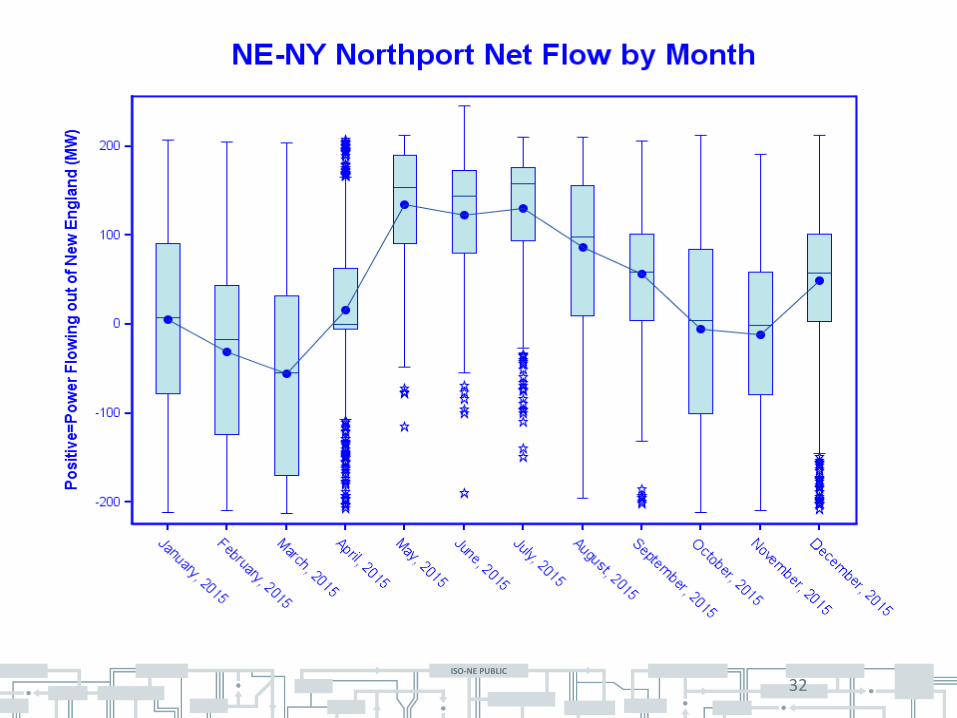
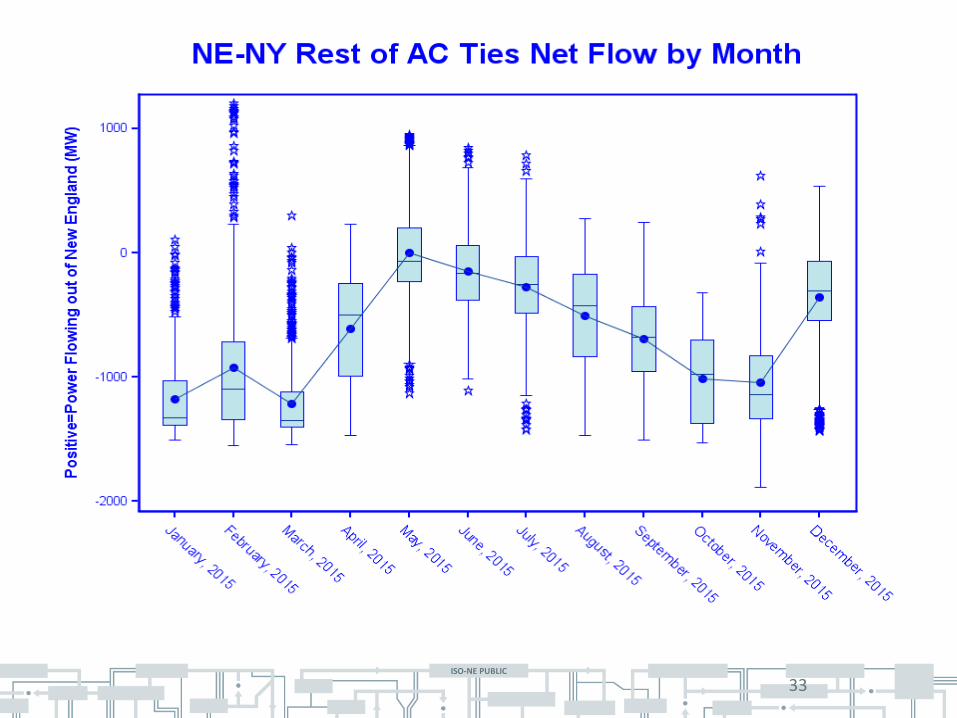
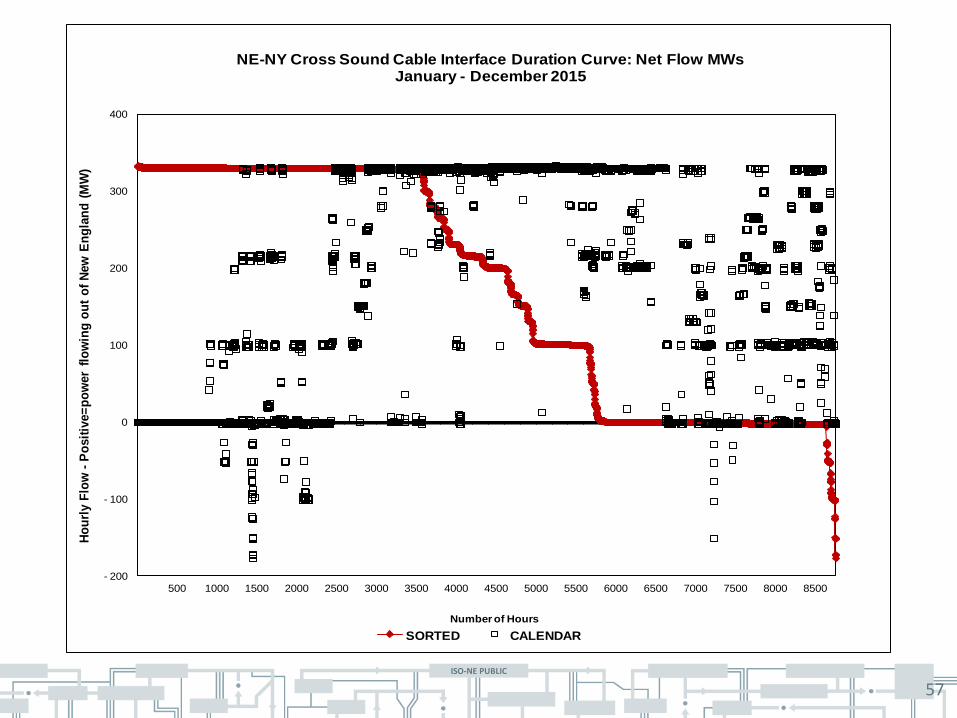
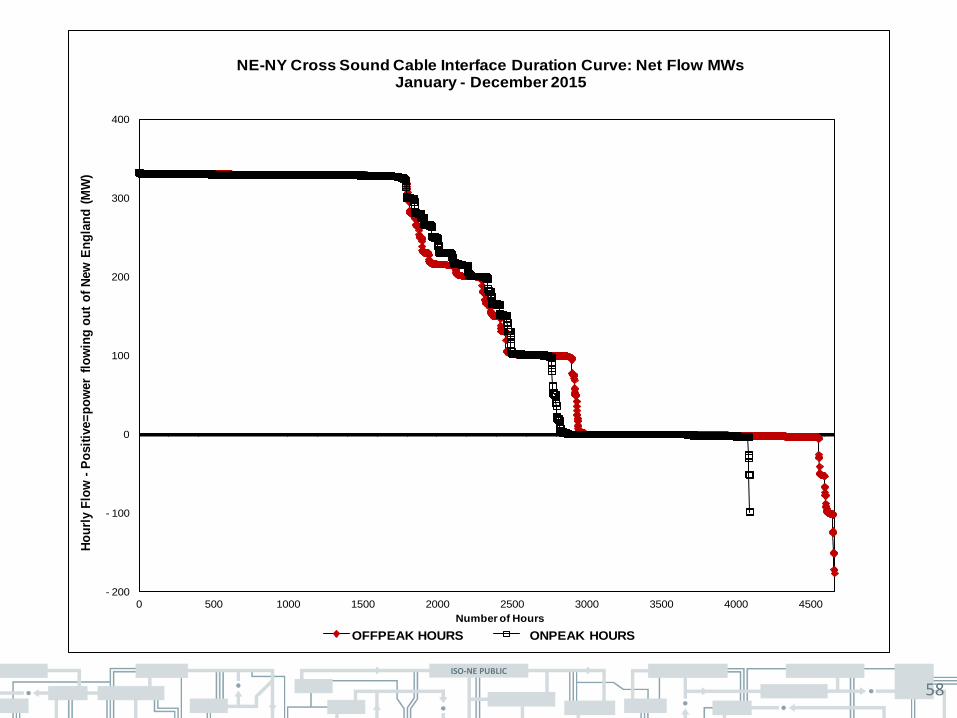
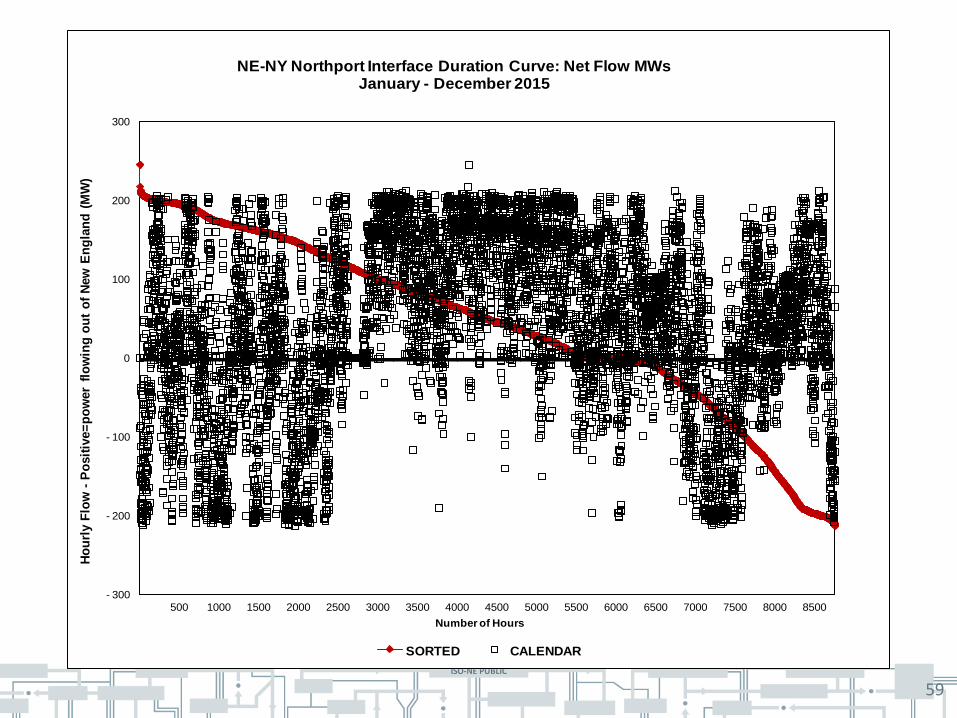
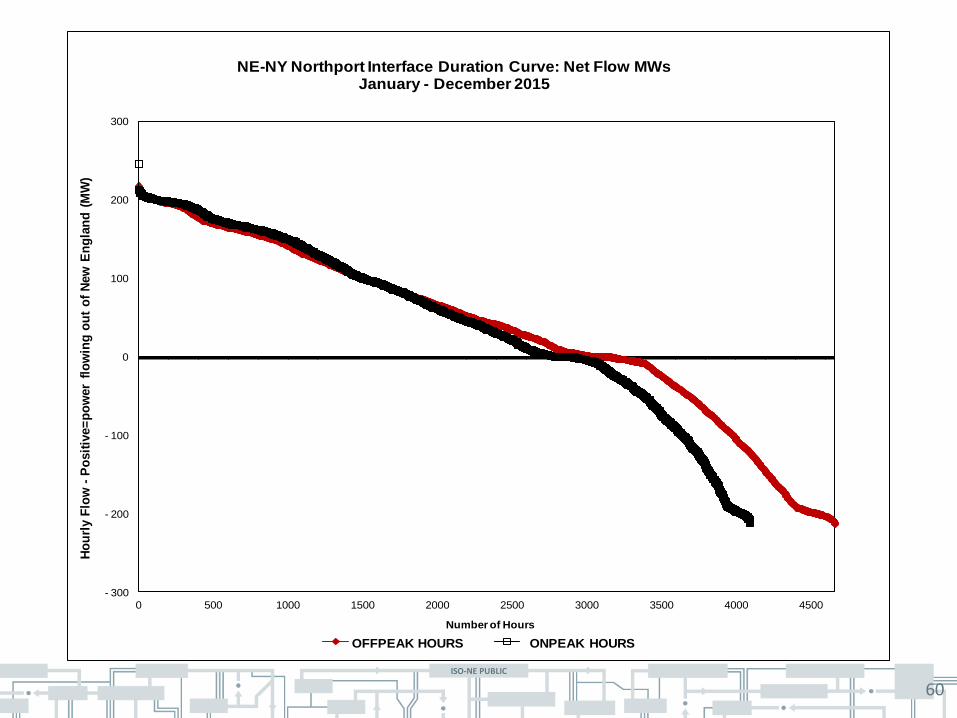
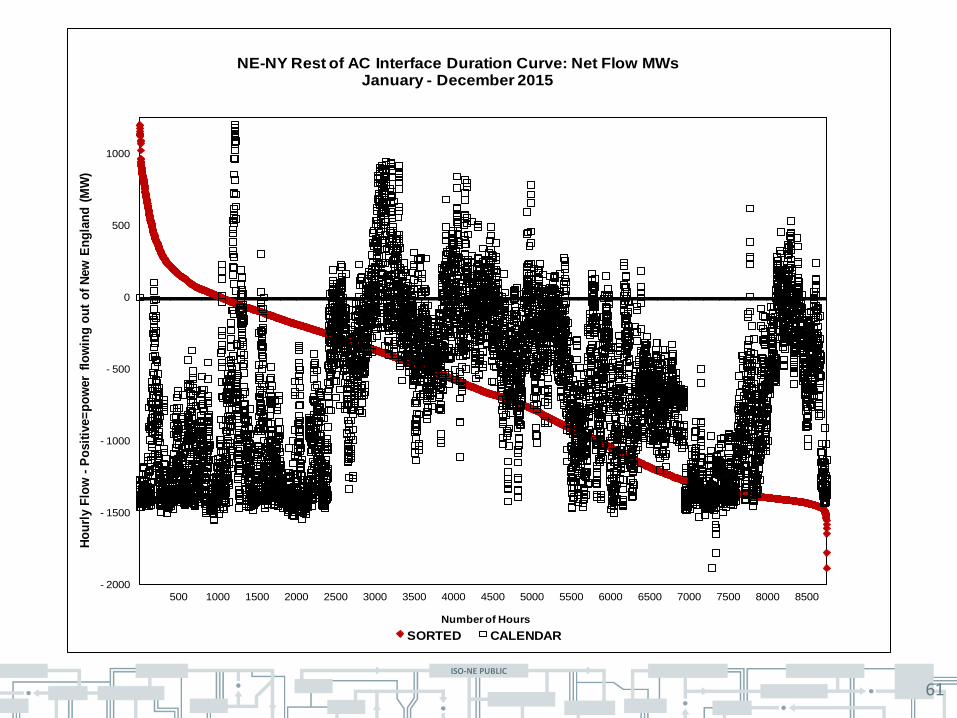
• The New York-New England interface runs along the border between the New England Control Area and the New York Control Area. This interface is shown as (1) the Cross Sound Cable-central CT to Long Island, (2) Northport-Norwalk CT to Long Island, and (3) the rest of the AC lines. A positive sign on the data indicates power flow from New England to New York.
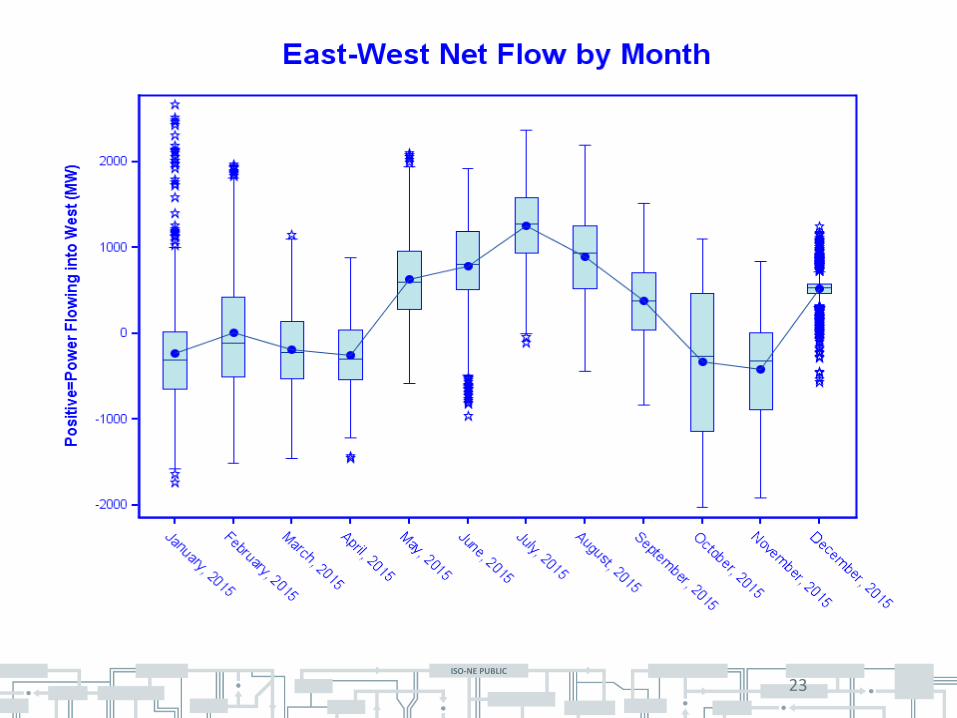
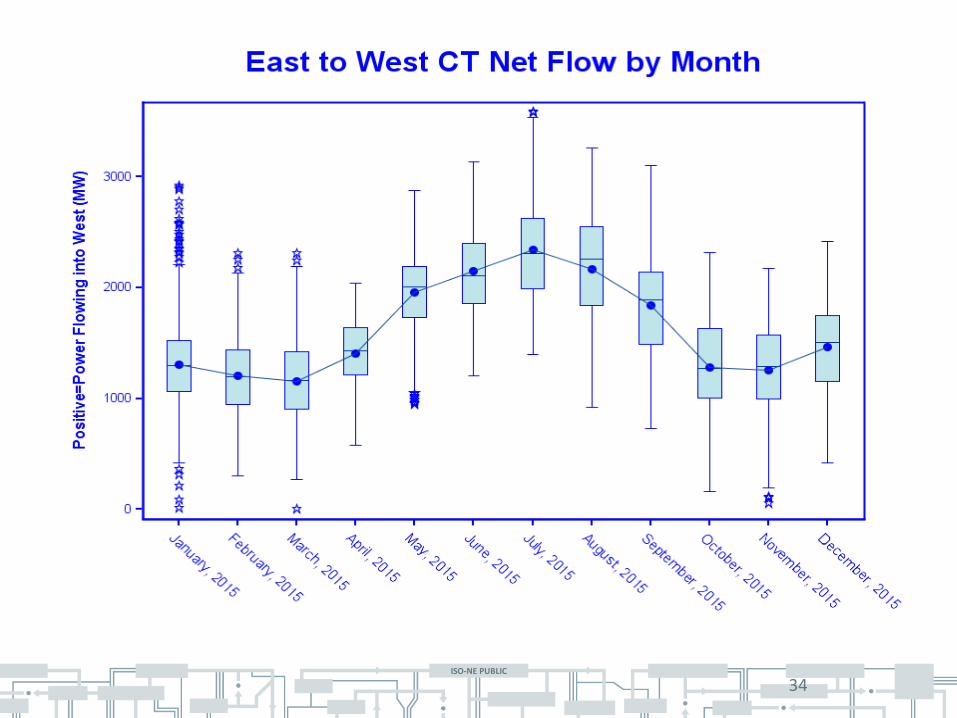
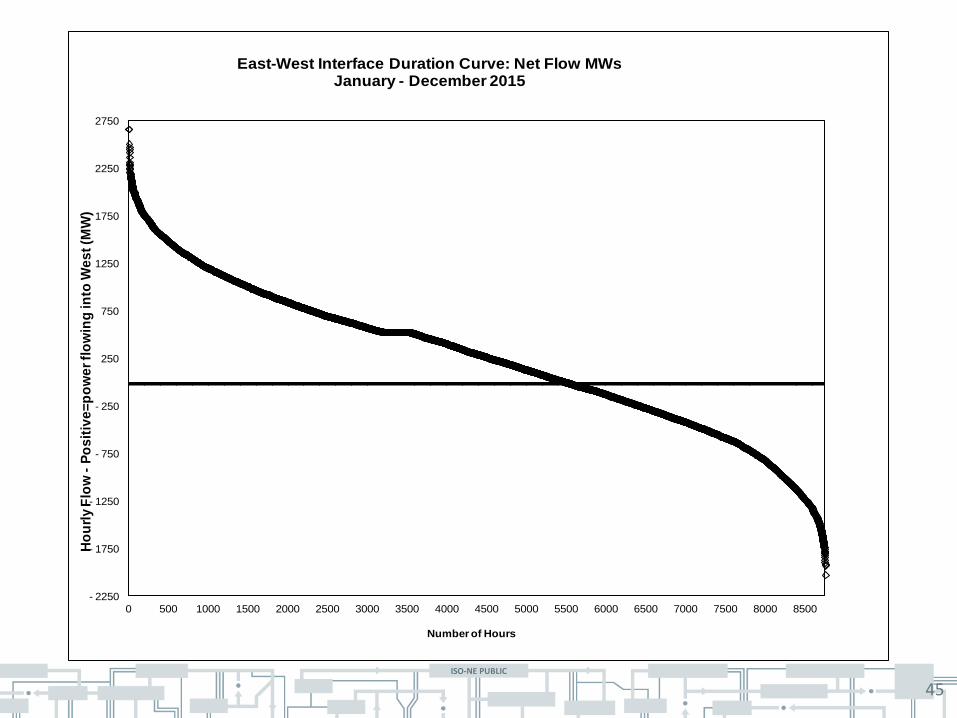
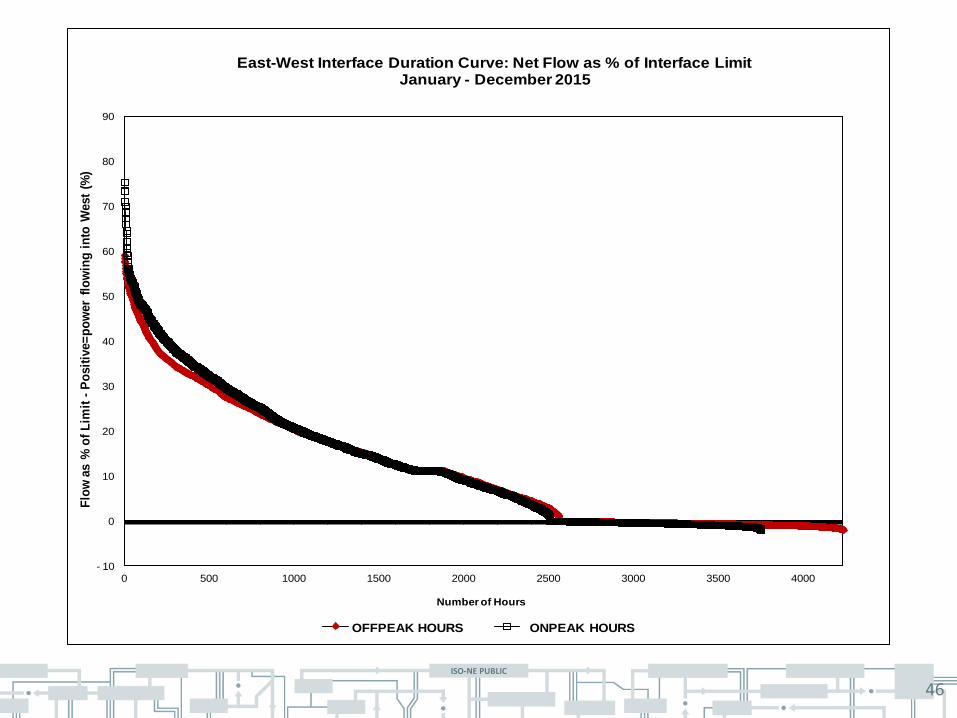
• The East-West interface runs south from northern Vermont, through central Massachusetts, and through Connecticut just west of the Rhode Island border. A positive sign on the data indicates power flow from East to West.
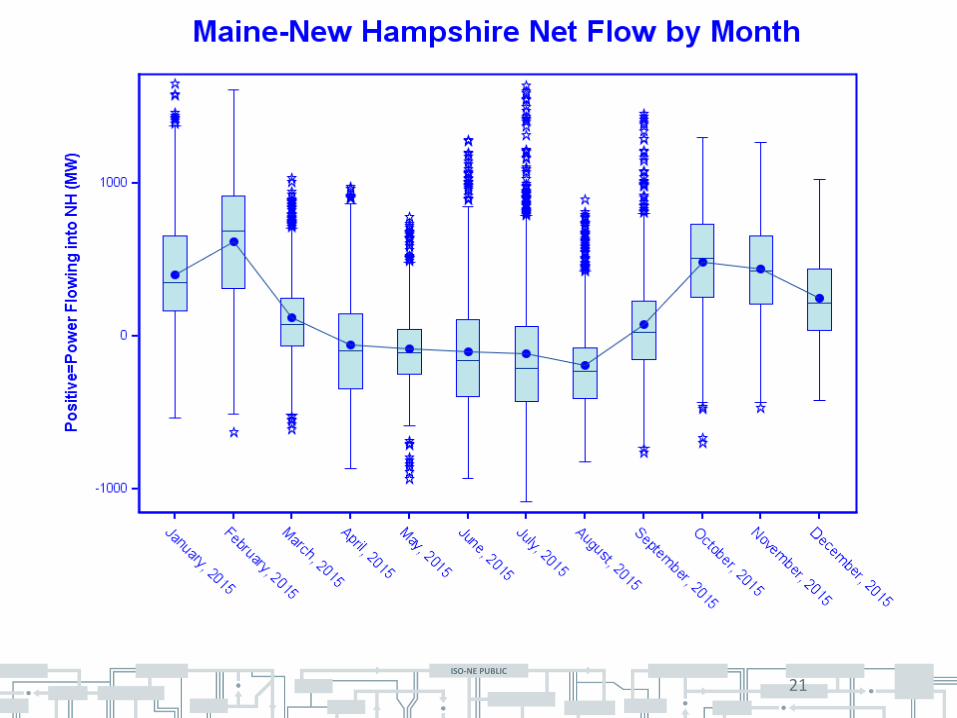
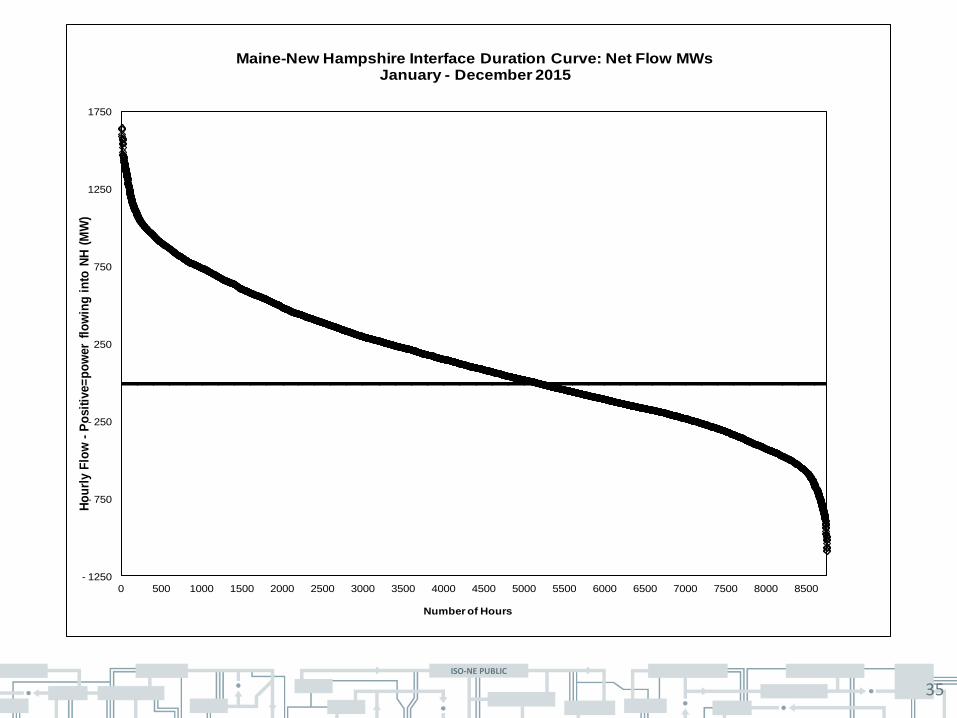
• The Maine-New Hampshire interface runs across part of southern Maine. A positive sign on the data indicates power flow from Maine to New Hampshire.
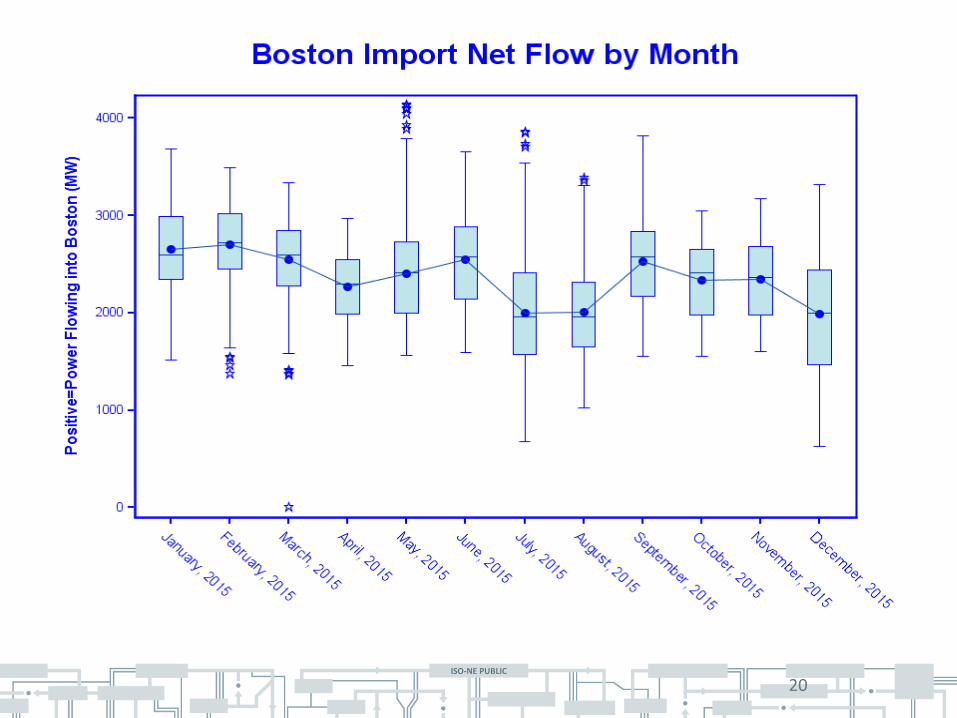
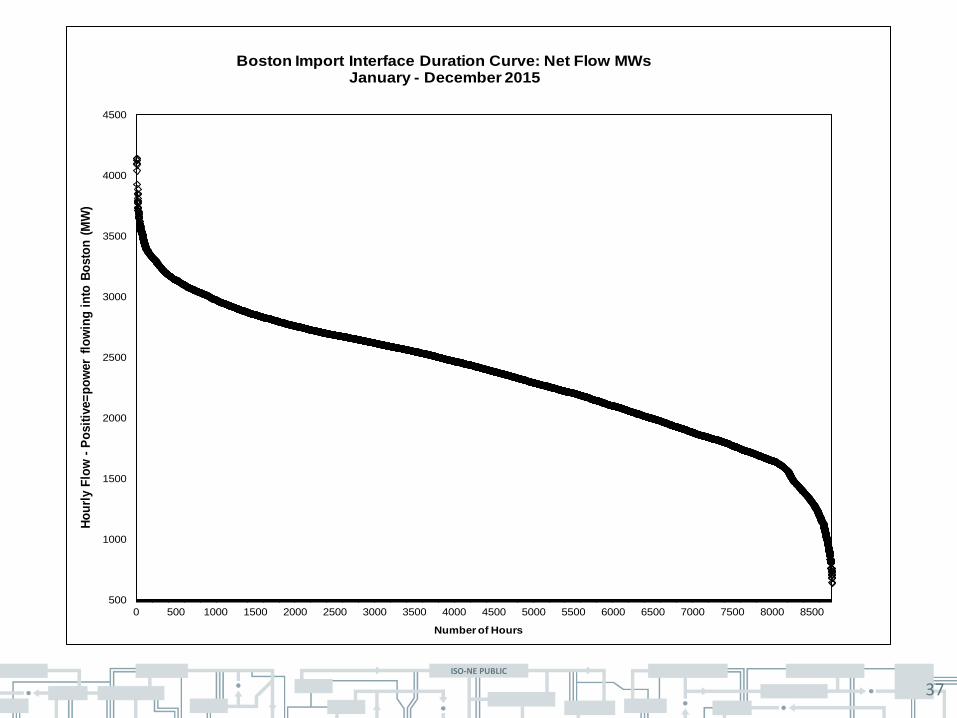
• The BOSTON import interface surrounds the northeastern area of Massachusetts, from the NH/MA border to just south of Boston. A positive sign indicates power flow into NEMA/BOSTON from the rest of New England.
Interface Details
ISO-NE PUBLIC
15
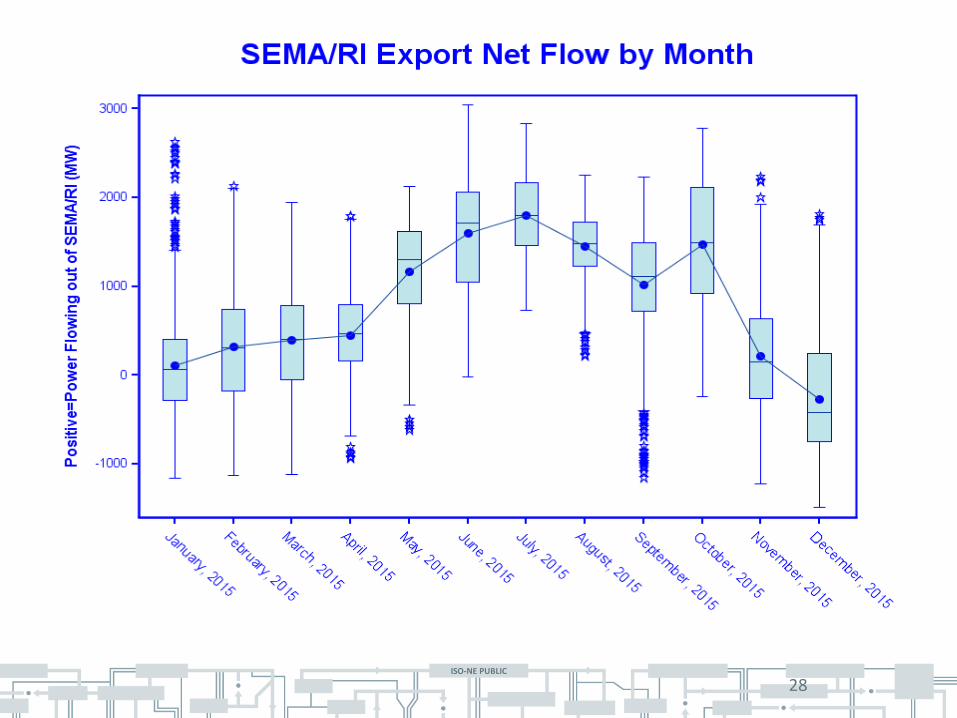
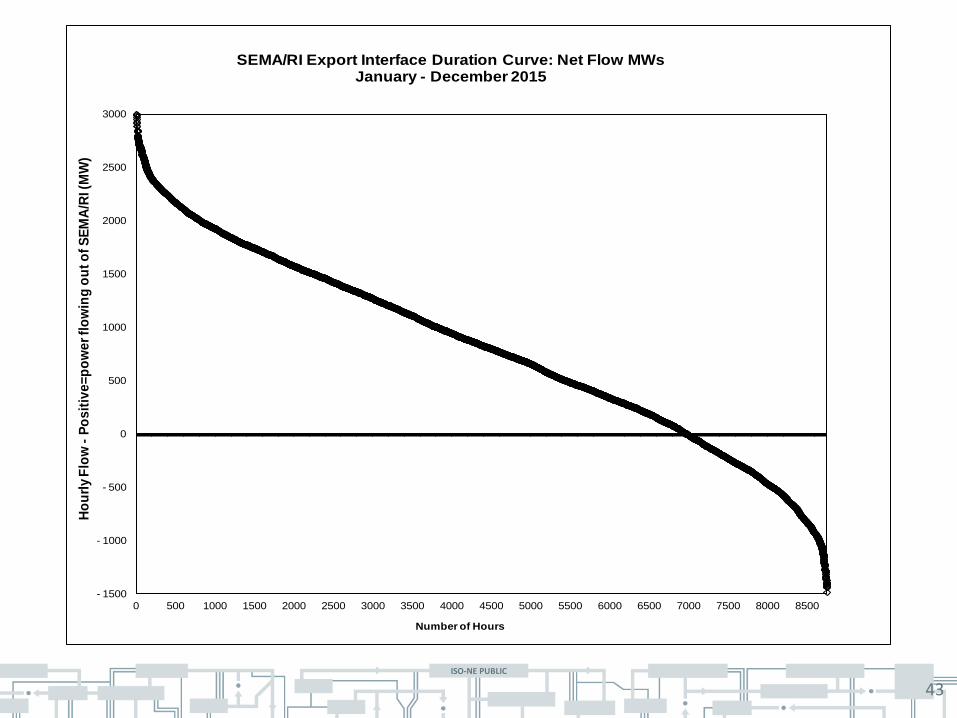
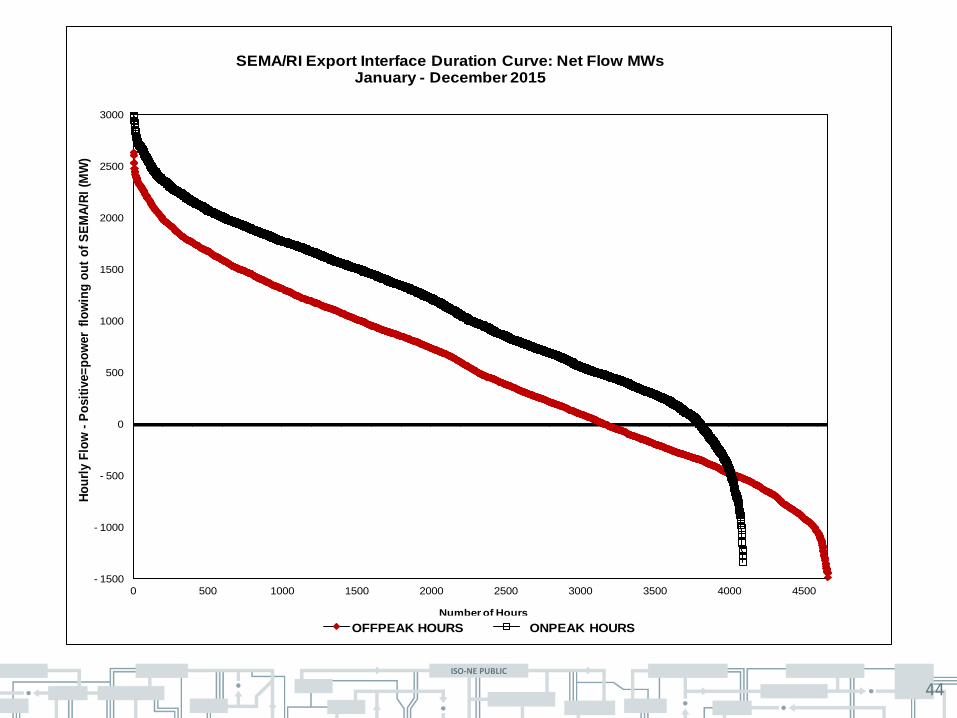
• The Southeastern Massachusetts/Rhode Island (SEMA/RI) export interface surrounds Massachusetts south of Boston and all of the state of Rhode Island. The western edge of the interface is the same as parts of the East-West and BOSTON import interfaces. A positive sign on the data indicates power flow into the rest of New England from SEMA/RI.
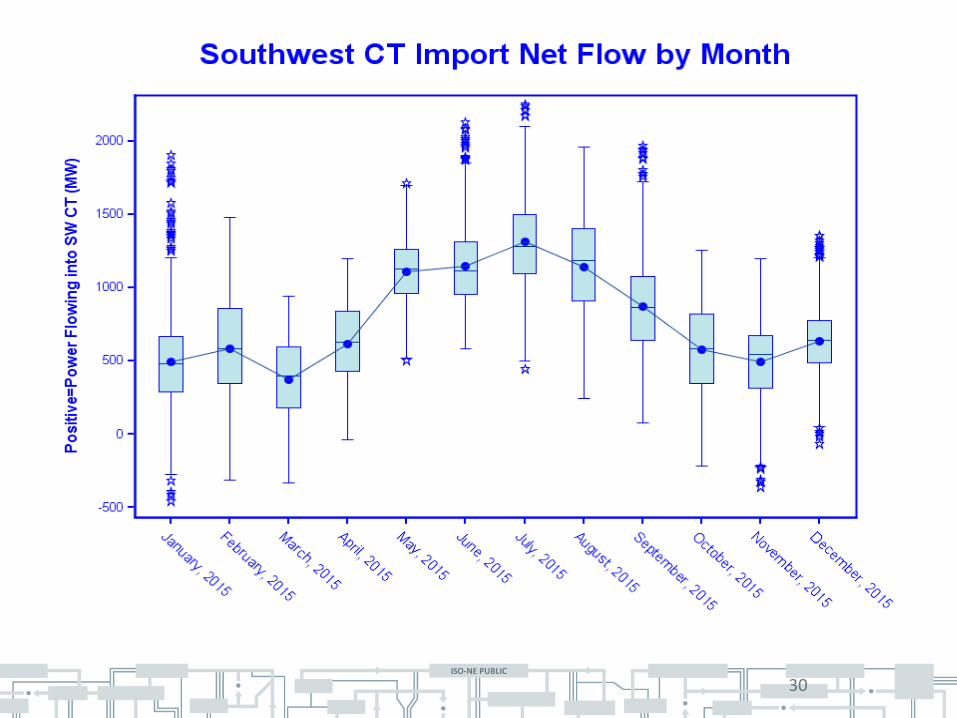
• The Southwest Connecticut import interface surrounds the southwestern corner of Connecticut. A positive sign indicates power flow into southwest Connecticut.
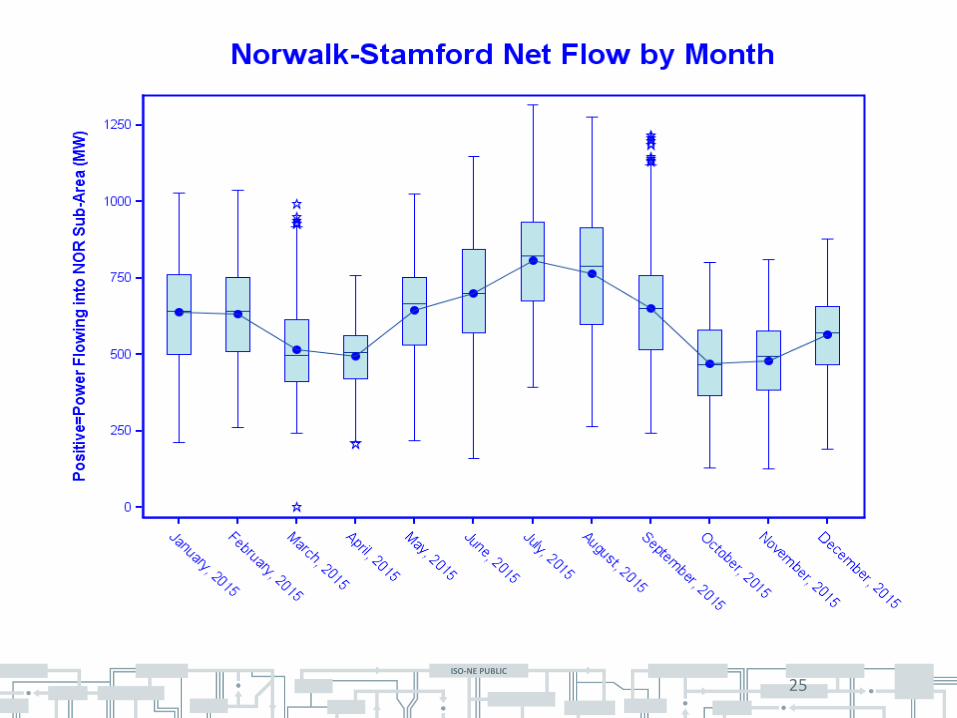
• The Norwalk-Stamford interface surrounds the extreme southwestern portion of southwest Connecticut, and lies within the Southwest Connecticut import interface. A positive sign indicates power flow into the region.
Interface Details, cont.
ISO-NE PUBLIC
16
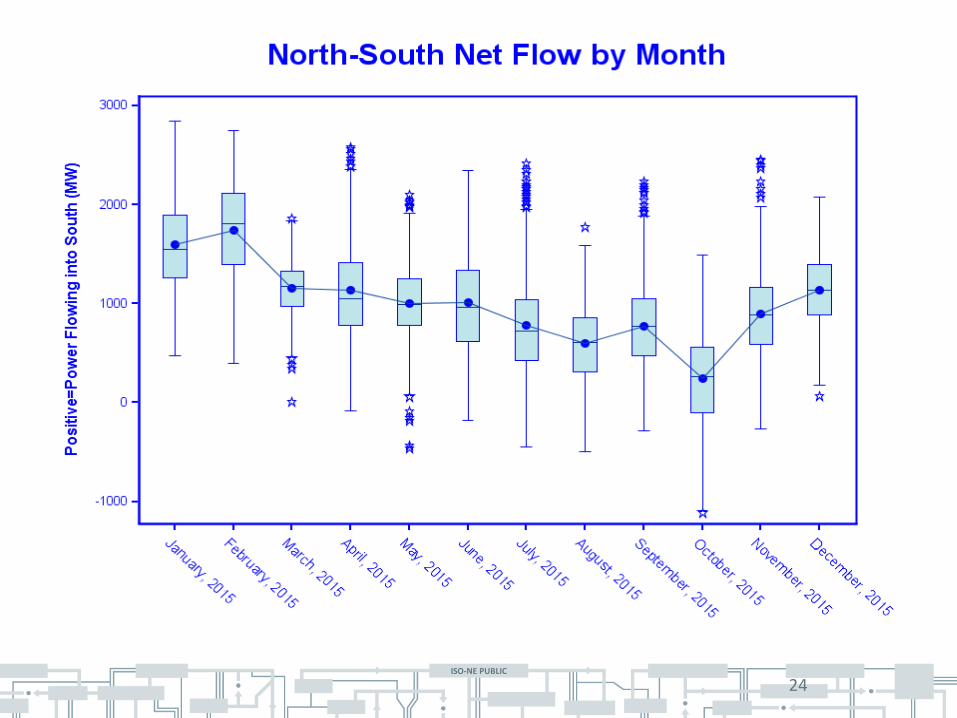
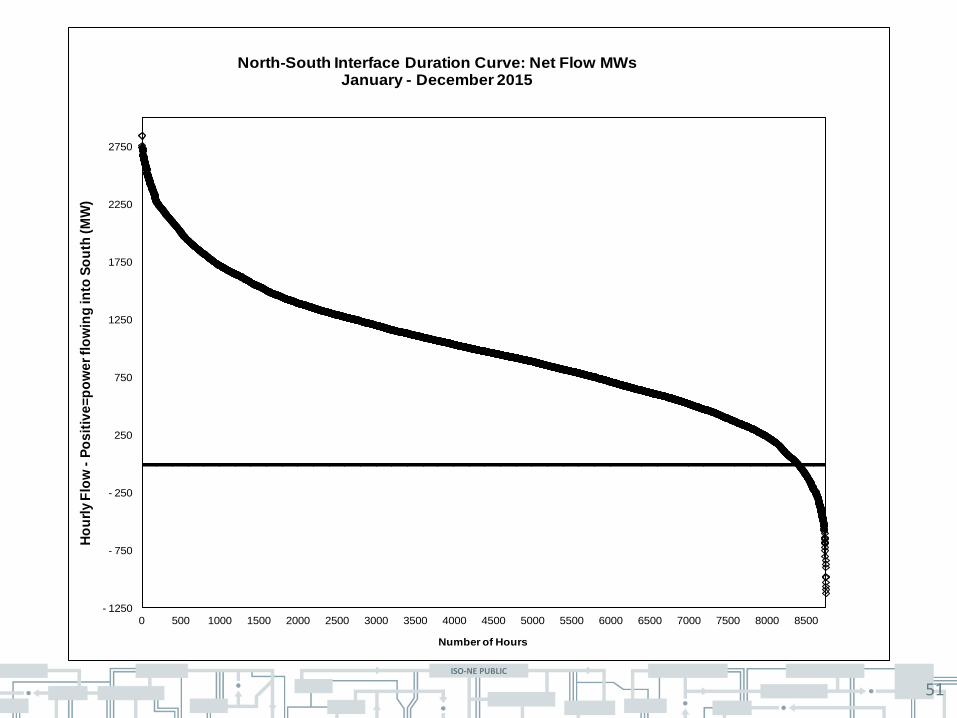
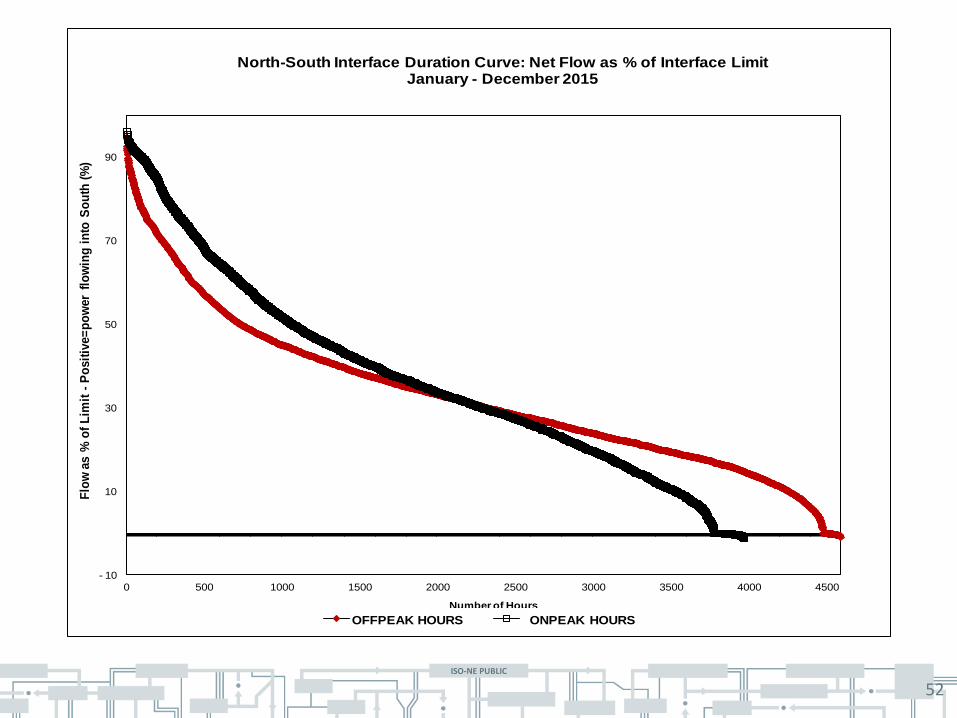
• The North - South interface runs across the southern borders of New Hampshire and Vermont, dividing the ISO-NE area into two separate three-state regions. A positive sign on the data indicates power flow from North to South.
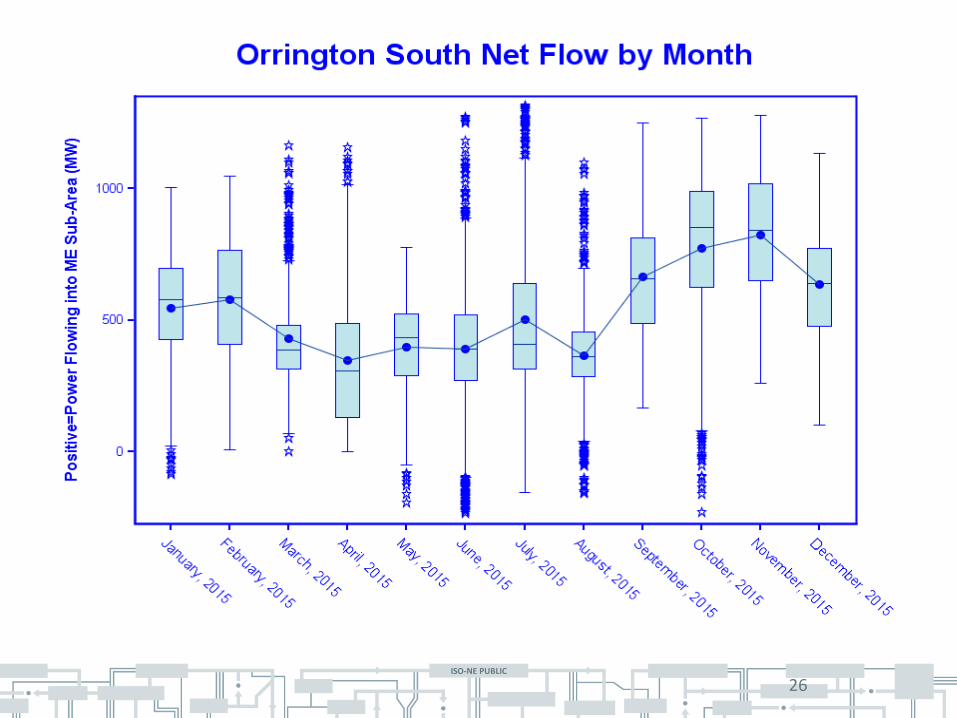
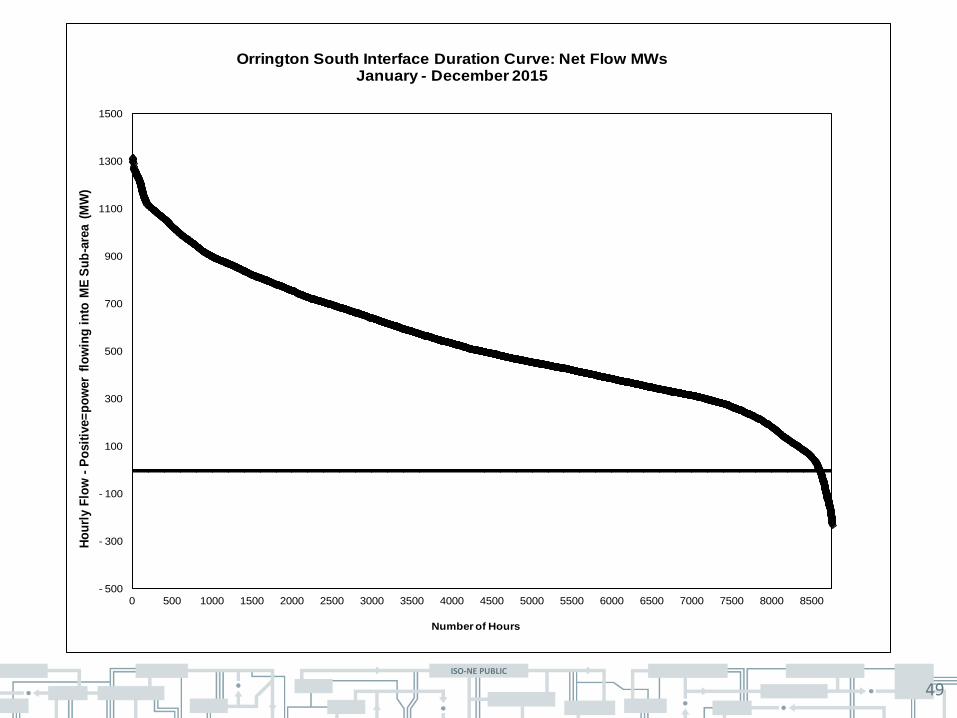
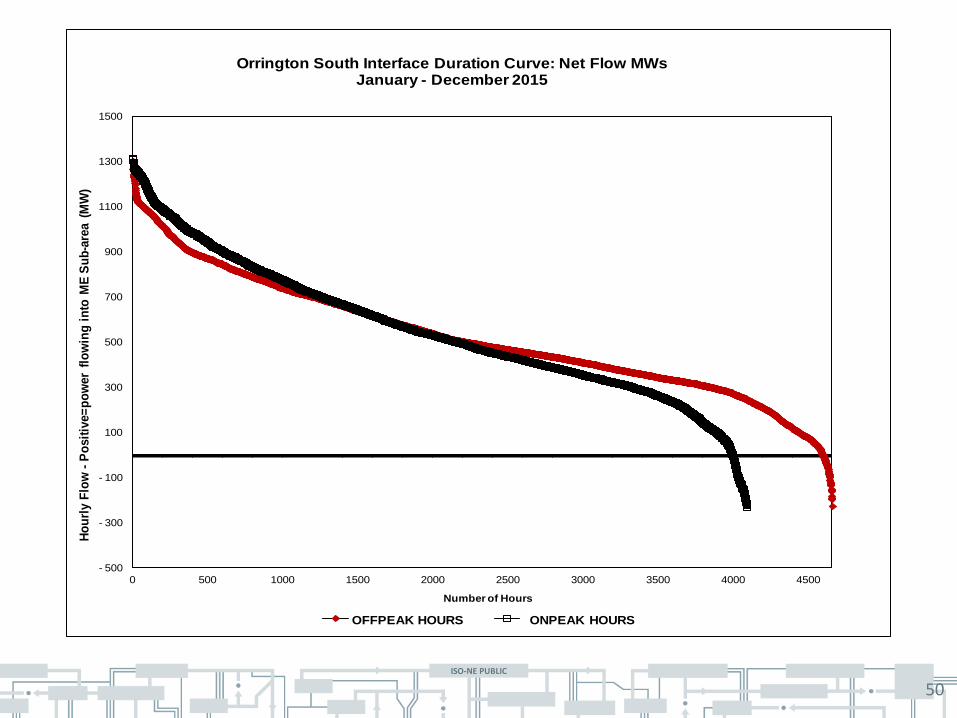
• The Orrington South interface separates the areas north and east of Bangor from the rest of Maine. A positive sign indicates a southwest power flow towards Portland.
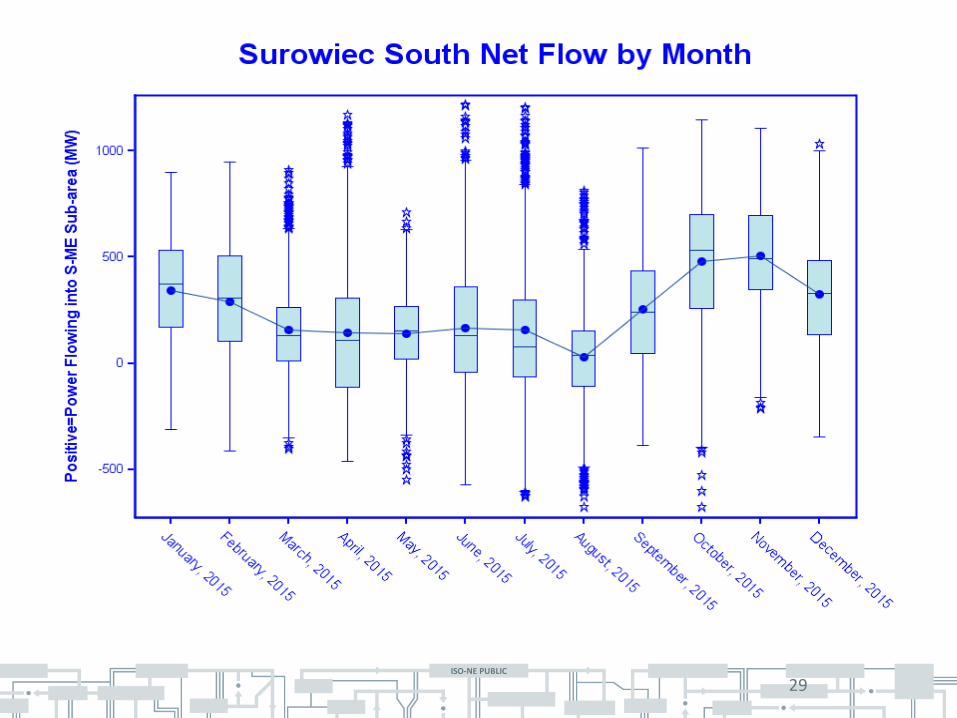
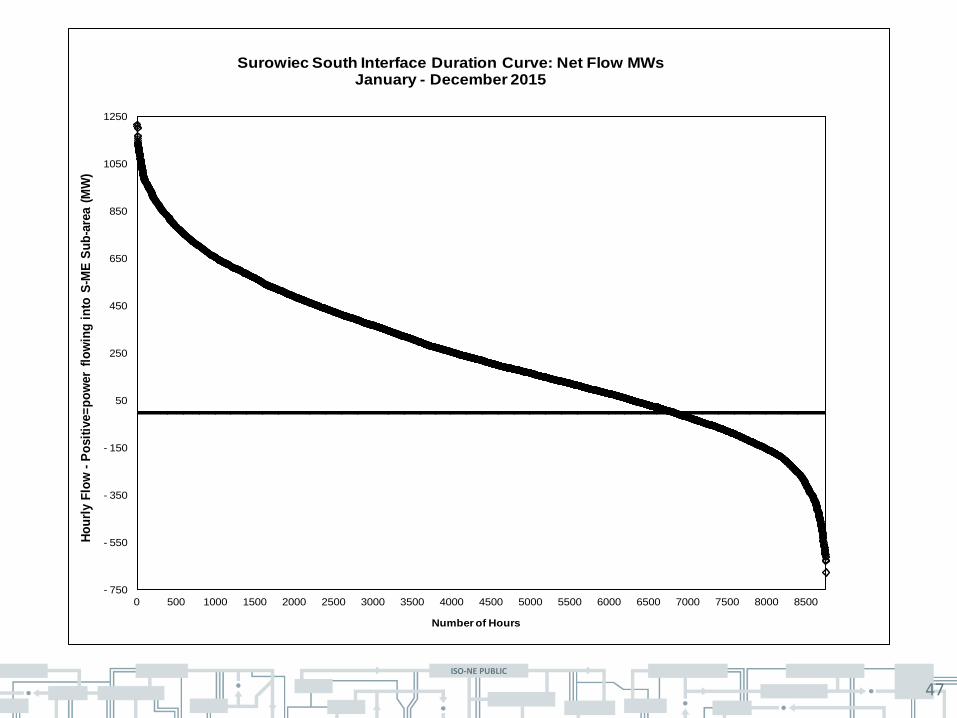
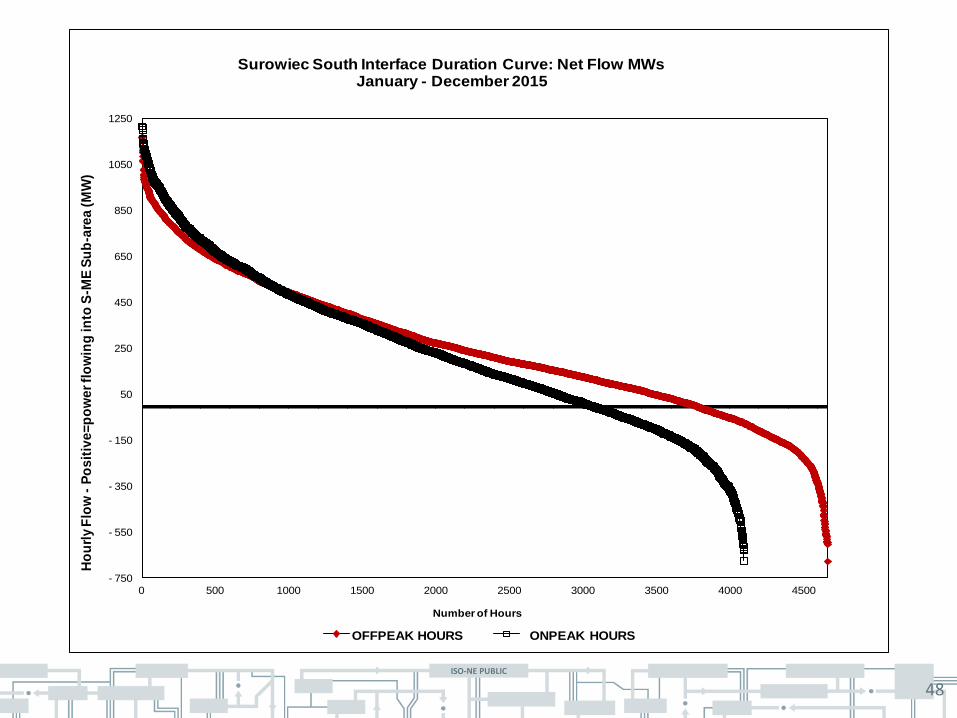
• The Surowiec South interface is just northeast of Portland, and lies across the lines going southwest from Maine Yankee, roughly separating southern ME from the rest of the state. A positive sign indicates power flow into the S-ME subarea.
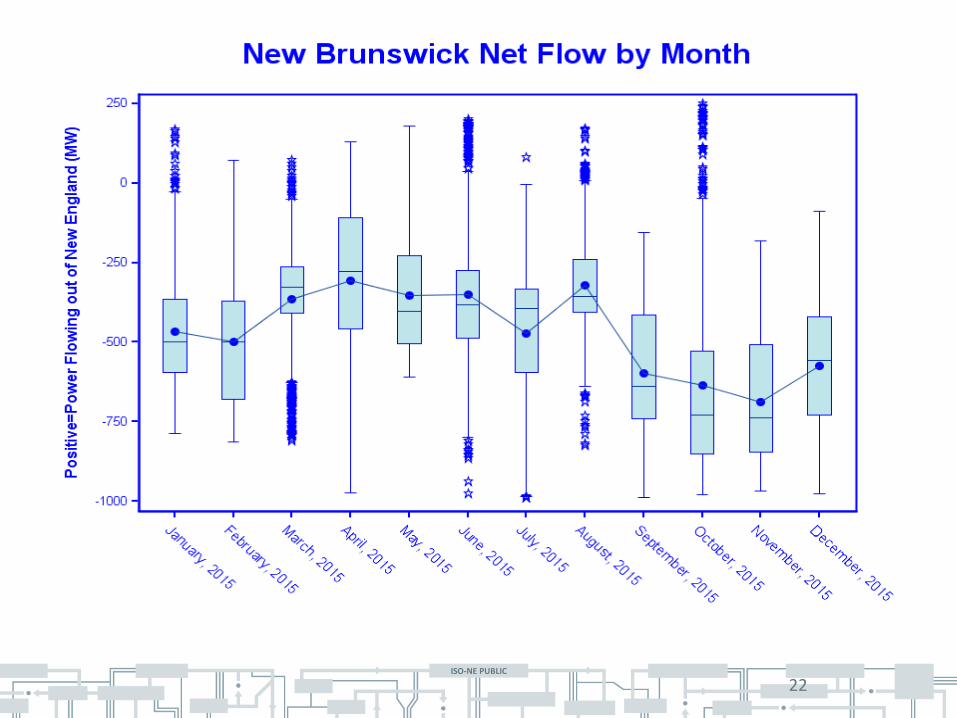
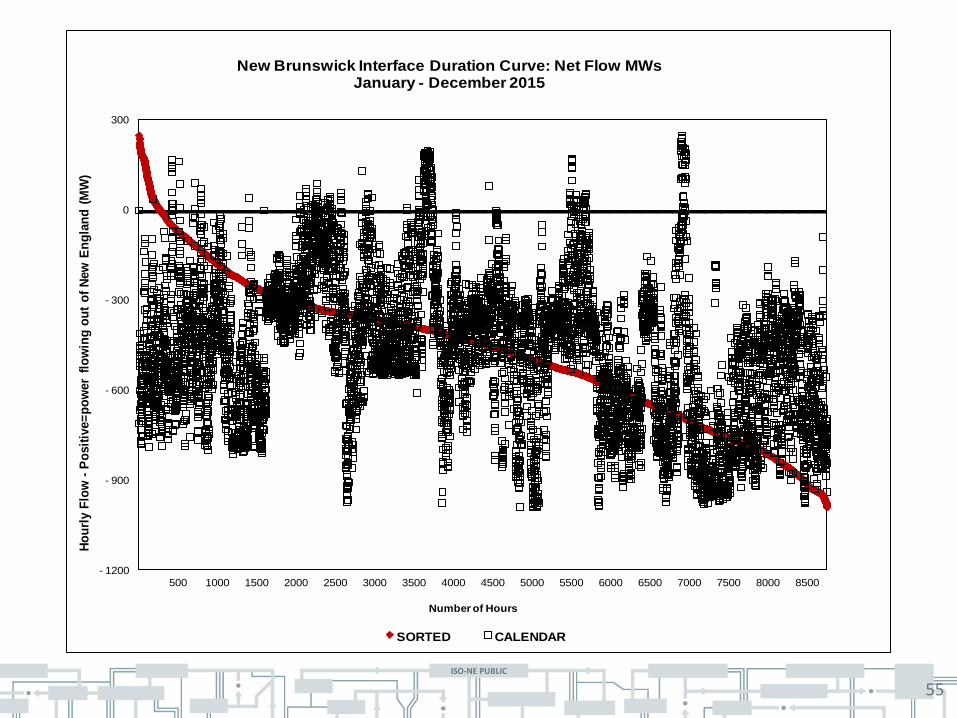
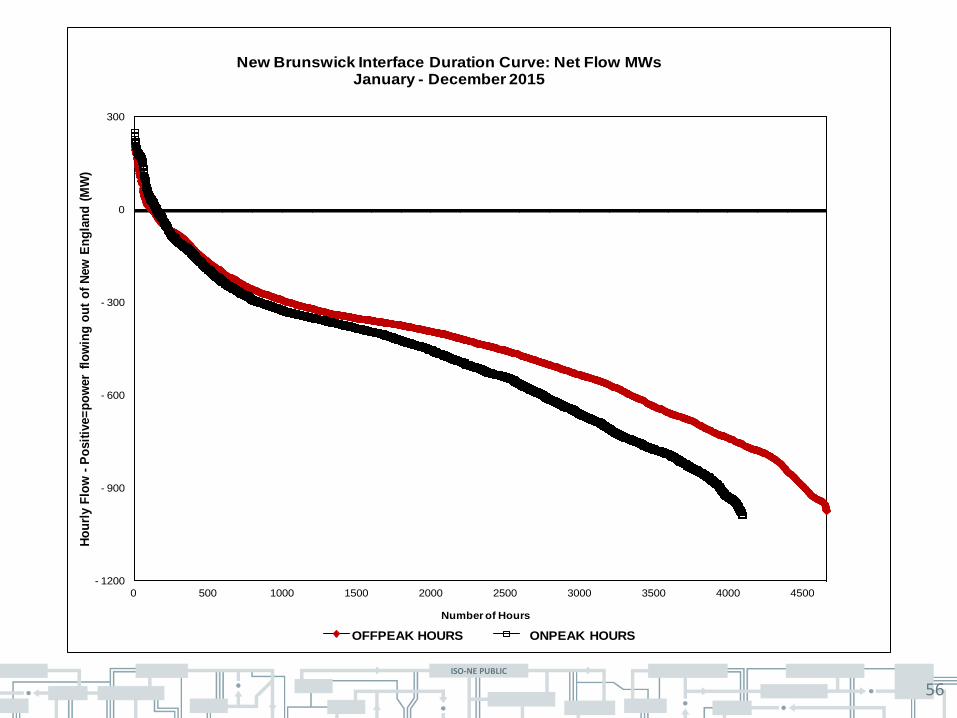
• The New Brunswick interface connects New England to the Maritimes. A positive sign indicates power flow from New England to the Maritimes.
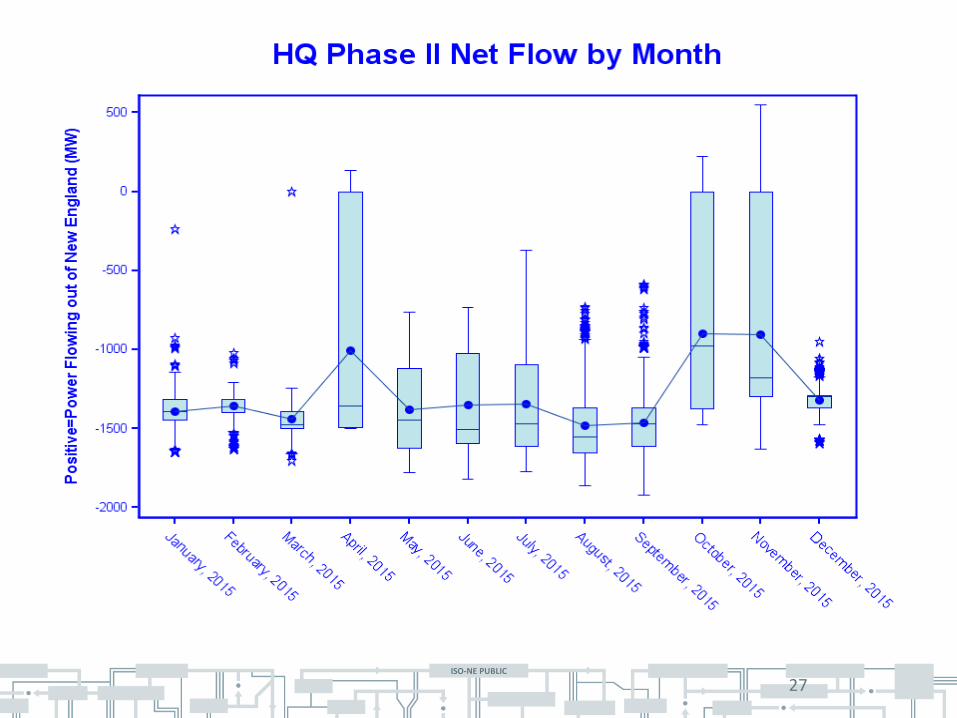
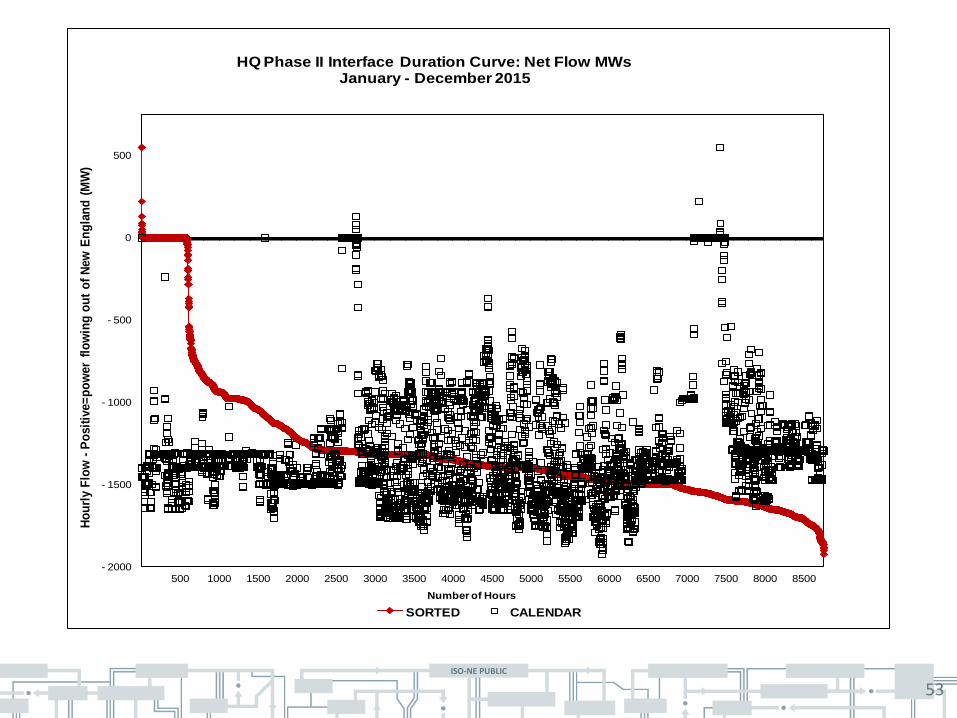
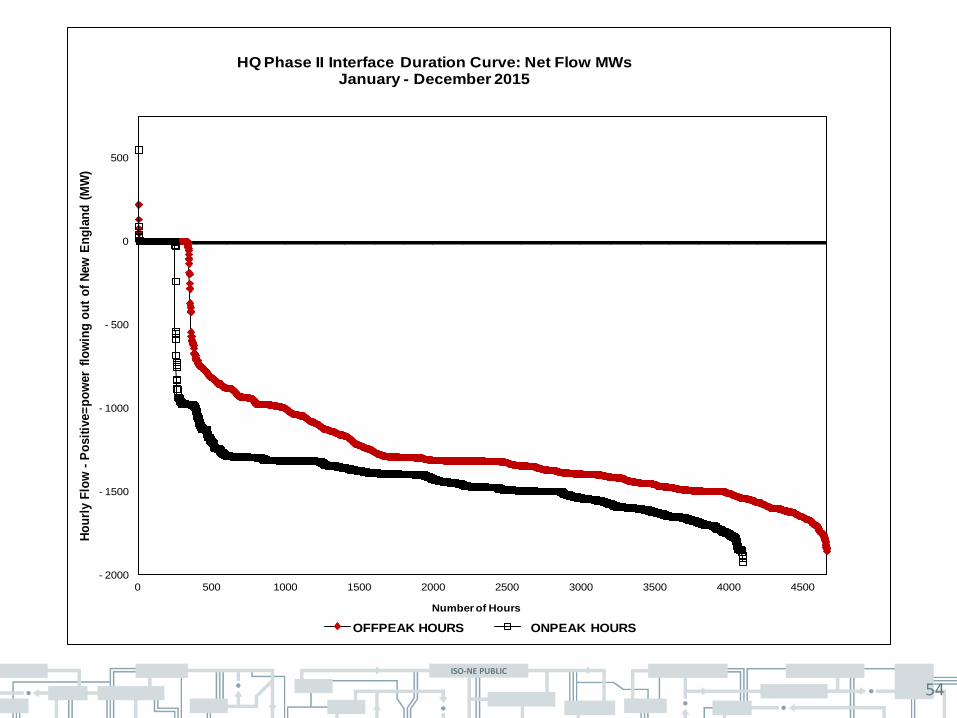
• The HQ Phase II interface connects New England to the Hydro Quebec System. A positive sign indicates power flow from New England to HQ.
Interface Details, cont.
ISO-NE PUBLIC
17
• The East to West CT interface is generally west of the Connecticut river, excluding the Hartford area. A positive sign on the data indicates power flow from East to West.
• On-peak hours are defined as non-holiday weekdays from 8 AM to 11 PM.
• For a technical description of the interfaces see the “Generic Interface Constraints” spreadsheet at:
– p://www.iso-ne.com/markets/hrly_data/support_docs/generic_interface_constraints.xls
Interface Details, cont.
ISO-NE PUBLIC
18
• The Connecticut Import interface surrounds most of the state of Connecticut. A positive sign indicates power flow into Connecticut from the rest of New England. In June 2015 changes were made that brought the Lake Road Generators into the CT load zone. See a presentation given to the RC at:
• http://www.iso-ne.com/static-assets/documents/committees/comm_wkgrps/relblty_comm/relblty/mtrls/2013/jul22232013/a11_ct_transfer_limits.pdf
• The data for the second half of the year was not available to me in time for this presentation, so the CT Import interface plots are not included in this presentation.
Interface Details, cont.
ISO-NE PUBLIC
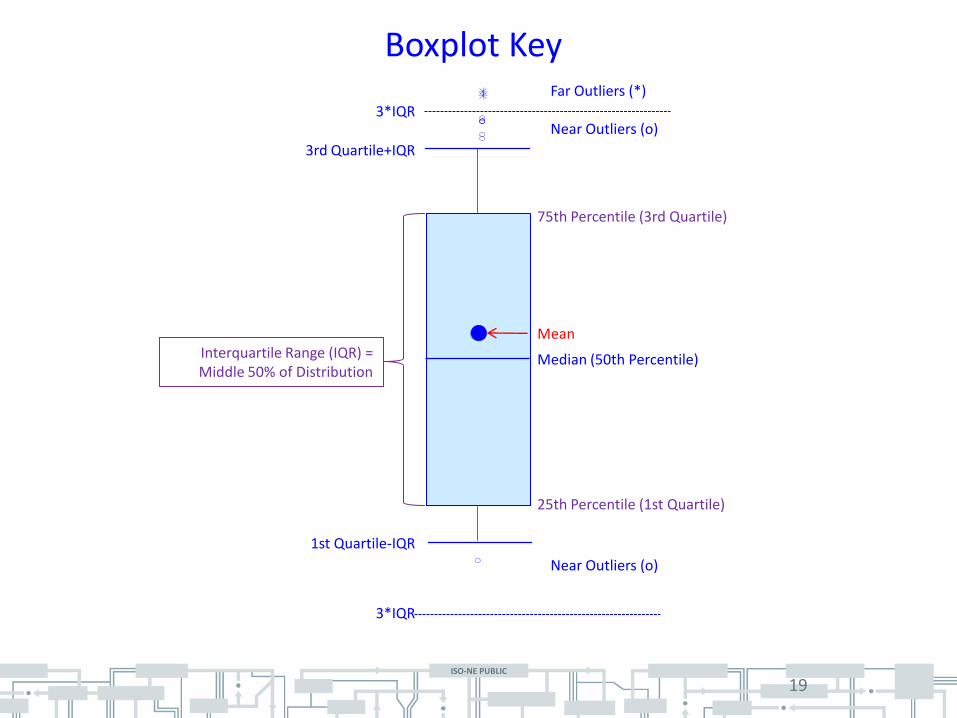
Boxplot Key Far Outliers (*)
75th Percentile (3rd Quartile)
Mean
Near Outliers (o)
Near Outliers (o)
Median (50th Percentile)
25th Percentile (1st Quartile)
1st Quartile-IQR
3rd Quartile+IQR
3*IQR
Interquartile Range (IQR) = Middle 50% of Distribution
3*IQR
19
ISO-NE PUBLIC
20
ISO-NE PUBLIC
21
ISO-NE PUBLIC
22
ISO-NE PUBLIC
23
ISO-NE PUBLIC
24
ISO-NE PUBLIC
25
ISO-NE PUBLIC
26
ISO-NE PUBLIC
27
ISO-NE PUBLIC
28
ISO-NE PUBLIC
29
ISO-NE PUBLIC
30
ISO-NE PUBLIC
31
ISO-NE PUBLIC
32
ISO-NE PUBLIC
33
ISO-NE PUBLIC
34
ISO-NE PUBLIC
35
- 1250
- 750
- 250
250
750
1250
1750
0 500 1000 1500 2000 2500 3000 3500 4000 4500 5000 5500 6000 6500 7000 7500 8000 8500
Ho
url
y F
low
-P
osit
ive=
po
wer
flo
win
g i
nto
NH
(M
W)
Number of Hours
Maine-New Hampshire Interface Duration Curve: Net Flow MWsJanuary - December 2015
ISO-NE PUBLIC
36
- 10
10
30
50
70
90
0 500 1000 1500 2000 2500 3000 3500 4000
Flo
w a
s %
of
Lim
it -
Po
sit
ive=
po
wer
flo
win
g i
nto
NH
(%
)
Number of Hours
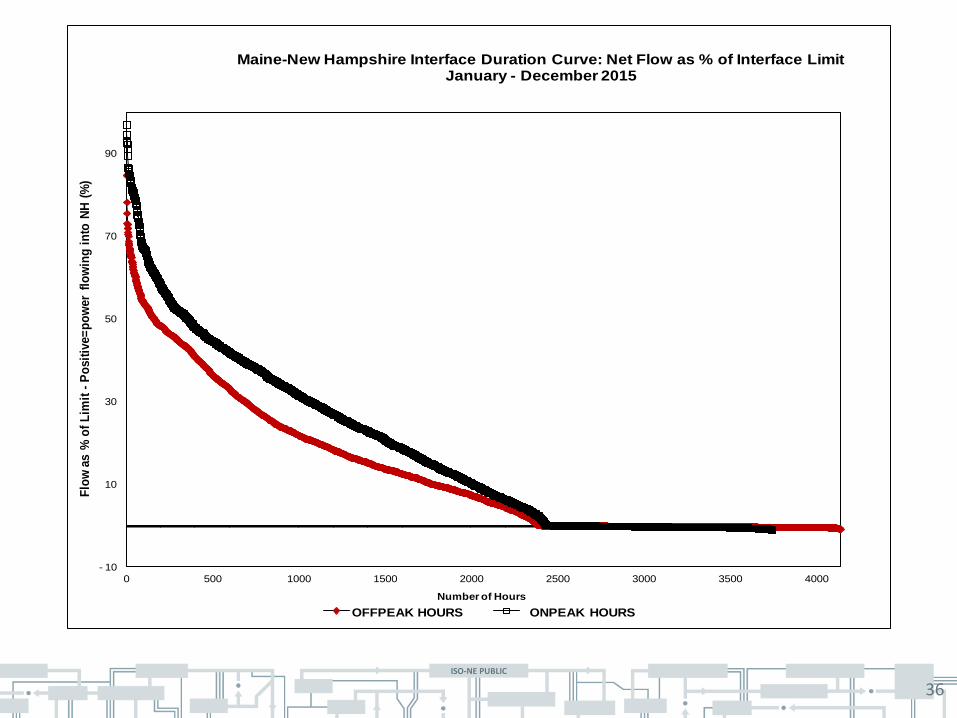
Maine-New Hampshire Interface Duration Curve: Net Flow as % of Interface LimitJanuary - December 2015
OFFPEAK HOURS ONPEAK HOURS
ISO-NE PUBLIC
37
500
1000
1500
2000
2500
3000
3500
4000
4500
0 500 1000 1500 2000 2500 3000 3500 4000 4500 5000 5500 6000 6500 7000 7500 8000 8500
Ho
url
y F
low
-P
osit
ive=
po
wer
flo
win
g i
nto
Bo
sto
n (
MW
)
Number of Hours
Boston Import Interface Duration Curve: Net Flow MWsJanuary - December 2015
ISO-NE PUBLIC
38
15
25
35
45
55
65
75
85
95
105
0 500 1000 1500 2000 2500 3000 3500 4000 4500
Flo
w a
s %
of
Lim
it -
Po
sit
ive=
po
wer
flo
win
g i
nto
Bo
sto
n (
%)
Number of Hours
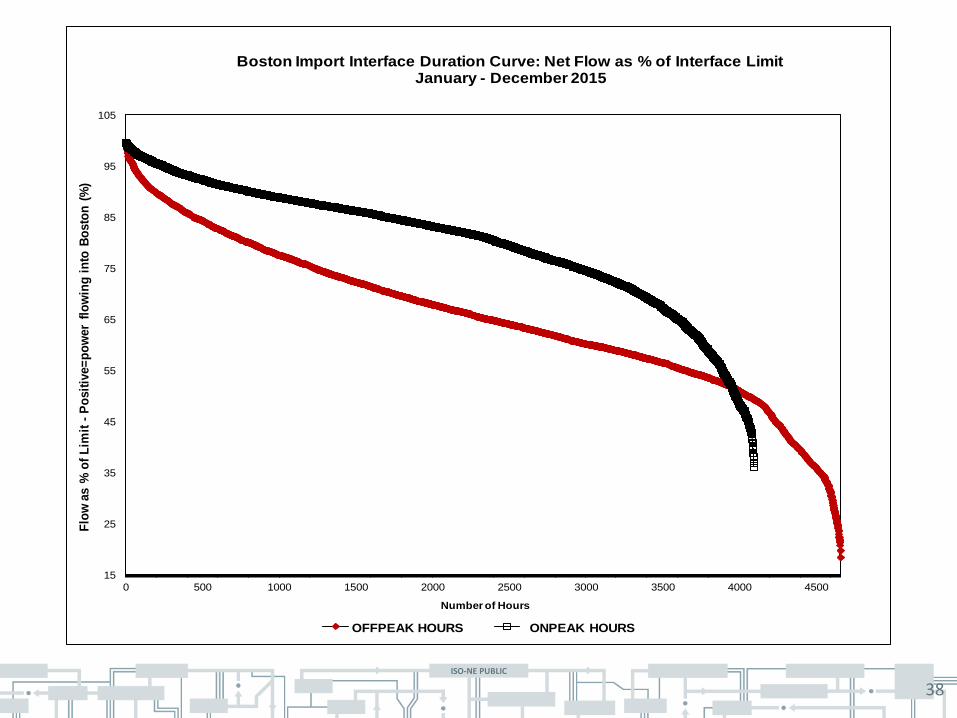
Boston Import Interface Duration Curve: Net Flow as % of Interface LimitJanuary - December 2015
OFFPEAK HOURS ONPEAK HOURS
ISO-NE PUBLIC
39
100
300
500
700
900
1100
1300
0 500 1000 1500 2000 2500 3000 3500 4000 4500 5000 5500 6000 6500 7000 7500 8000 8500
Ho
url
y F
low
-P
osit
ive=
po
wer
flo
win
g i
nto
NO
R S
ub
-are
a (
MW
)
Number of Hours
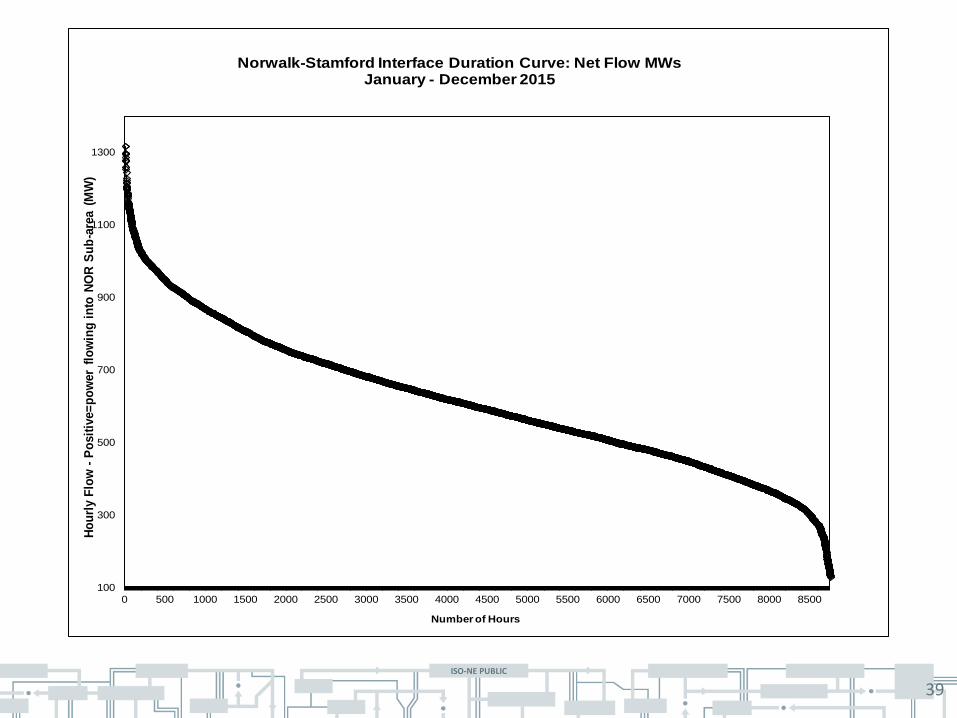
Norwalk-Stamford Interface Duration Curve: Net Flow MWsJanuary - December 2015
ISO-NE PUBLIC
40
5
15
25
35
45
55
65
75
85
95
105
0 500 1000 1500 2000 2500 3000 3500 4000 4500
Flo
w a
s %
of
Lim
it -
Po
sit
ive=
po
wer
flo
win
g i
nto
NO
R S
ub
-are
a (
%)
Number of Hours
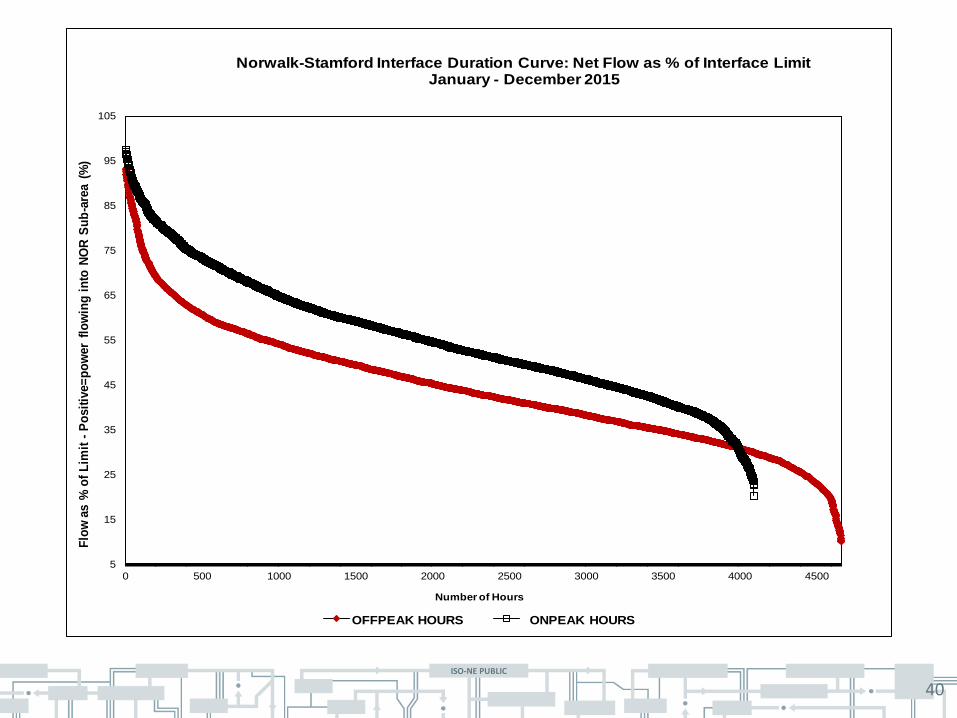
Norwalk-Stamford Interface Duration Curve: Net Flow as % of Interface LimitJanuary - December 2015
OFFPEAK HOURS ONPEAK HOURS
ISO-NE PUBLIC
41
- 500
0
500
1000
1500
2000
2500
0 500 1000 1500 2000 2500 3000 3500 4000 4500 5000 5500 6000 6500 7000 7500 8000 8500
Ho
url
y F
low
-P
osit
ive=
po
wer
flo
win
g i
nto
SW
CT
(M
W)
Number of Hours
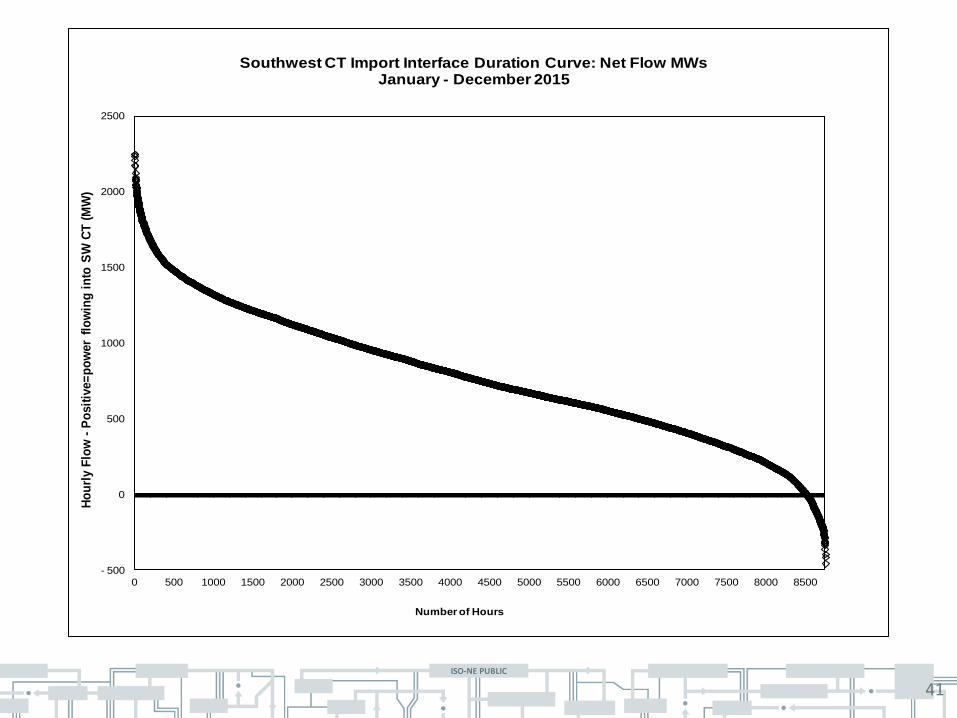
Southwest CT Import Interface Duration Curve: Net Flow MWsJanuary - December 2015
ISO-NE PUBLIC
42
- 10
10
30
50
70
90
0 500 1000 1500 2000 2500 3000 3500 4000 4500
Flo
w a
s %
of
Lim
it -
Po
sit
ive=
po
wer
flo
win
g i
nto
SW
CT
(%
)
Number of Hours
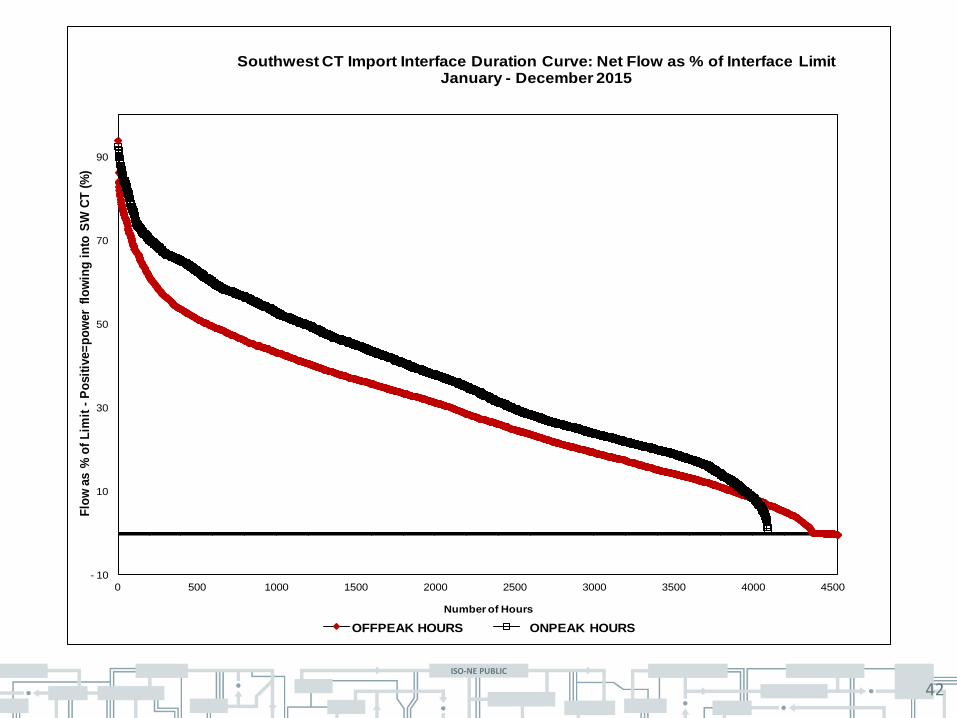
Southwest CT Import Interface Duration Curve: Net Flow as % of Interface LimitJanuary - December 2015
OFFPEAK HOURS ONPEAK HOURS
ISO-NE PUBLIC
43
- 1500
- 1000
- 500
0
500
1000
1500
2000
2500
3000
0 500 1000 1500 2000 2500 3000 3500 4000 4500 5000 5500 6000 6500 7000 7500 8000 8500
Ho
url
y F
low
-P
os
itiv
e=
po
we
r fl
ow
ing
ou
t o
f S
EM
A/R
I (M
W)
Number of Hours
SEMA/RI Export Interface Duration Curve: Net Flow MWsJanuary - December 2015
ISO-NE PUBLIC
44
- 1500
- 1000
- 500
0
500
1000
1500
2000
2500
3000
0 500 1000 1500 2000 2500 3000 3500 4000 4500
Ho
url
y F
low
-P
osit
ive=
po
wer
flo
win
g o
ut
of
SE
MA
/RI
(MW
)
Number of Hours
SEMA/RI Export Interface Duration Curve: Net Flow MWsJanuary - December 2015
OFFPEAK HOURS ONPEAK HOURS
ISO-NE PUBLIC
45
- 2250
- 1750
- 1250
- 750
- 250
250
750
1250
1750
2250
2750
0 500 1000 1500 2000 2500 3000 3500 4000 4500 5000 5500 6000 6500 7000 7500 8000 8500
Ho
url
y F
low
-P
os
itiv
e=
po
we
r fl
ow
ing
in
to W
es
t (M
W)
Number of Hours
East-West Interface Duration Curve: Net Flow MWsJanuary - December 2015
ISO-NE PUBLIC
46
- 10
0
10
20
30
40
50
60
70
80
90
0 500 1000 1500 2000 2500 3000 3500 4000
Flo
w a
s %
of
Lim
it -
Po
sit
ive=
po
wer
flo
win
g i
nto
West
(%)
Number of Hours
East-West Interface Duration Curve: Net Flow as % of Interface LimitJanuary - December 2015
OFFPEAK HOURS ONPEAK HOURS
ISO-NE PUBLIC
47
- 750
- 550
- 350
- 150
50
250
450
650
850
1050
1250
0 500 1000 1500 2000 2500 3000 3500 4000 4500 5000 5500 6000 6500 7000 7500 8000 8500
Ho
url
y F
low
-P
osit
ive=
po
wer
flo
win
g i
nto
S-M
E S
ub
-are
a (
MW
)
Number of Hours
Surowiec South Interface Duration Curve: Net Flow MWsJanuary - December 2015
ISO-NE PUBLIC
48
- 750
- 550
- 350
- 150
50
250
450
650
850
1050
1250
0 500 1000 1500 2000 2500 3000 3500 4000 4500
Ho
url
y F
low
-P
os
itiv
e=
po
we
r fl
ow
ing
in
to S
-ME
Su
b-a
rea
(M
W)
Number of Hours
Surowiec South Interface Duration Curve: Net Flow MWsJanuary - December 2015
OFFPEAK HOURS ONPEAK HOURS
ISO-NE PUBLIC
49
- 500
- 300
- 100
100
300
500
700
900
1100
1300
1500
0 500 1000 1500 2000 2500 3000 3500 4000 4500 5000 5500 6000 6500 7000 7500 8000 8500
Ho
url
y F
low
-P
osit
ive=
po
wer
flo
win
g i
nto
ME
Su
b-a
rea (
MW
)
Number of Hours
Orrington South Interface Duration Curve: Net Flow MWsJanuary - December 2015
ISO-NE PUBLIC
50
- 500
- 300
- 100
100
300
500
700
900
1100
1300
1500
0 500 1000 1500 2000 2500 3000 3500 4000 4500
Ho
url
y F
low
-P
osit
ive=
po
wer
flo
win
g i
nto
ME
Su
b-a
rea (
MW
)
Number of Hours
Orrington South Interface Duration Curve: Net Flow MWsJanuary - December 2015
OFFPEAK HOURS ONPEAK HOURS
ISO-NE PUBLIC
51
- 1250
- 750
- 250
250
750
1250
1750
2250
2750
0 500 1000 1500 2000 2500 3000 3500 4000 4500 5000 5500 6000 6500 7000 7500 8000 8500
Ho
url
y F
low
-P
os
itiv
e=
po
we
r fl
ow
ing
in
to S
ou
th (
MW
)
Number of Hours
North-South Interface Duration Curve: Net Flow MWsJanuary - December 2015
ISO-NE PUBLIC
52
- 10
10
30
50
70
90
0 500 1000 1500 2000 2500 3000 3500 4000 4500
Flo
w a
s %
of
Lim
it -
Po
sit
ive=
po
wer
flo
win
g i
nto
So
uth
(%
)
Number of Hours
North-South Interface Duration Curve: Net Flow as % of Interface LimitJanuary - December 2015
OFFPEAK HOURS ONPEAK HOURS
ISO-NE PUBLIC
53
- 2000
- 1500
- 1000
- 500
0
500
500 1000 1500 2000 2500 3000 3500 4000 4500 5000 5500 6000 6500 7000 7500 8000 8500
Ho
url
y F
low
-P
osit
ive=
po
wer
flo
win
g o
ut
of
New
En
gla
nd
(M
W)
Number of Hours
HQ Phase II Interface Duration Curve: Net Flow MWsJanuary - December 2015
SORTED CALENDAR
ISO-NE PUBLIC
54
- 2000
- 1500
- 1000
- 500
0
500
0 500 1000 1500 2000 2500 3000 3500 4000 4500
Ho
url
y F
low
-P
osit
ive=
po
wer
flo
win
g o
ut
of
New
En
gla
nd
(M
W)
Number of Hours
HQ Phase II Interface Duration Curve: Net Flow MWsJanuary - December 2015
OFFPEAK HOURS ONPEAK HOURS
ISO-NE PUBLIC
55
- 1200
- 900
- 600
- 300
0
300
500 1000 1500 2000 2500 3000 3500 4000 4500 5000 5500 6000 6500 7000 7500 8000 8500
Ho
url
y F
low
-P
osit
ive=
po
wer
flo
win
g o
ut
of
New
En
gla
nd
(M
W)
Number of Hours
New Brunswick Interface Duration Curve: Net Flow MWsJanuary - December 2015
SORTED CALENDAR
ISO-NE PUBLIC
56
- 1200
- 900
- 600
- 300
0
300
0 500 1000 1500 2000 2500 3000 3500 4000 4500
Ho
url
y F
low
-P
osit
ive=
po
wer
flo
win
g o
ut
of
New
En
gla
nd
(M
W)
Number of Hours
New Brunswick Interface Duration Curve: Net Flow MWsJanuary - December 2015
OFFPEAK HOURS ONPEAK HOURS
ISO-NE PUBLIC
57
- 200
- 100
0
100
200
300
400
500 1000 1500 2000 2500 3000 3500 4000 4500 5000 5500 6000 6500 7000 7500 8000 8500
Ho
url
y F
low
-P
osit
ive=
po
wer
flo
win
g o
ut
of
New
En
gla
nd
(M
W)
Number of Hours
NE-NY Cross Sound Cable Interface Duration Curve: Net Flow MWsJanuary - December 2015
SORTED CALENDAR
ISO-NE PUBLIC
58
- 200
- 100
0
100
200
300
400
0 500 1000 1500 2000 2500 3000 3500 4000 4500
Ho
url
y F
low
-P
osit
ive=
po
wer
flo
win
g o
ut
of
New
En
gla
nd
(M
W)
Number of Hours
NE-NY Cross Sound Cable Interface Duration Curve: Net Flow MWsJanuary - December 2015
OFFPEAK HOURS ONPEAK HOURS
ISO-NE PUBLIC
59
- 300
- 200
- 100
0
100
200
300
500 1000 1500 2000 2500 3000 3500 4000 4500 5000 5500 6000 6500 7000 7500 8000 8500
Ho
url
y F
low
-P
osit
ive=
po
wer
flo
win
g o
ut
of
New
En
gla
nd
(M
W)
Number of Hours
NE-NY Northport Interface Duration Curve: Net Flow MWsJanuary - December 2015
SORTED CALENDAR
ISO-NE PUBLIC
60
- 300
- 200
- 100
0
100
200
300
0 500 1000 1500 2000 2500 3000 3500 4000 4500
Ho
url
y F
low
-P
osit
ive=
po
wer
flo
win
g o
ut
of
New
En
gla
nd
(M
W)
Number of Hours
NE-NY Northport Interface Duration Curve: Net Flow MWsJanuary - December 2015
OFFPEAK HOURS ONPEAK HOURS
ISO-NE PUBLIC
61
- 2000
- 1500
- 1000
- 500
0
500
1000
500 1000 1500 2000 2500 3000 3500 4000 4500 5000 5500 6000 6500 7000 7500 8000 8500
Ho
url
y F
low
-P
osit
ive=
po
wer
flo
win
g o
ut
of
New
En
gla
nd
(M
W)
Number of Hours
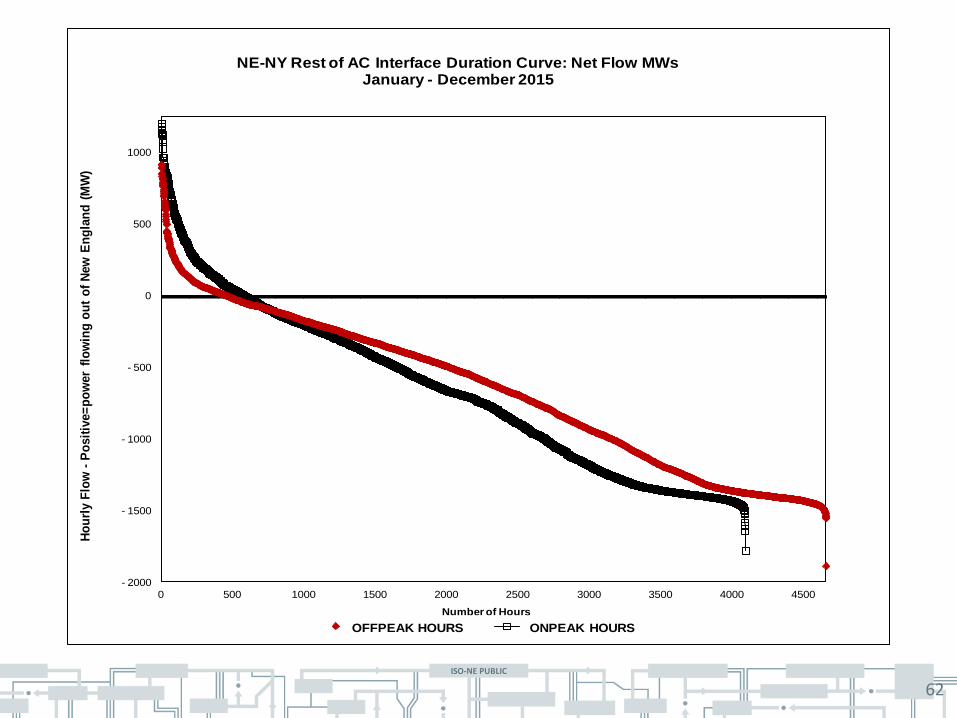
NE-NY Rest of AC Interface Duration Curve: Net Flow MWsJanuary - December 2015
SORTED CALENDAR
ISO-NE PUBLIC
62
- 2000
- 1500
- 1000
- 500
0
500
1000
0 500 1000 1500 2000 2500 3000 3500 4000 4500
Ho
url
y F
low
-P
osit
ive=
po
wer
flo
win
g o
ut
of
New
En
gla
nd
(M
W)
Number of Hours
NE-NY Rest of AC Interface Duration Curve: Net Flow MWsJanuary - December 2015
OFFPEAK HOURS ONPEAK HOURS
ISO-NE PUBLIC
63
0
500
1000
1500
2000
2500
3000
3500
4000
0 500 1000 1500 2000 2500 3000 3500 4000 4500 5000 5500 6000 6500 7000 7500 8000 8500
Ho
url
y F
low
-P
osit
ive=
po
wer
flo
win
g i
nto
West
(MW
)
Number of Hours
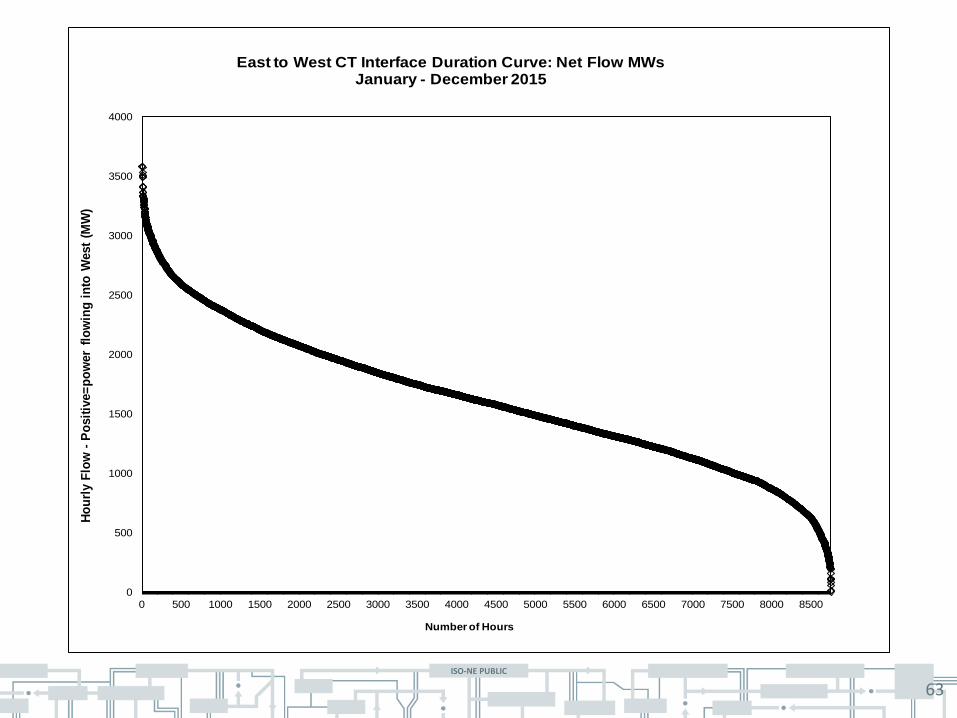
East to West CT Interface Duration Curve: Net Flow MWsJanuary - December 2015
ISO-NE PUBLIC
64
0
20
40
60
80
100
0 500 1000 1500 2000 2500 3000 3500 4000 4500
Flo
w a
s %
of
Lim
it -
Po
sit
ive=
po
wer
flo
win
g i
nto
West
(%)
Number of Hours
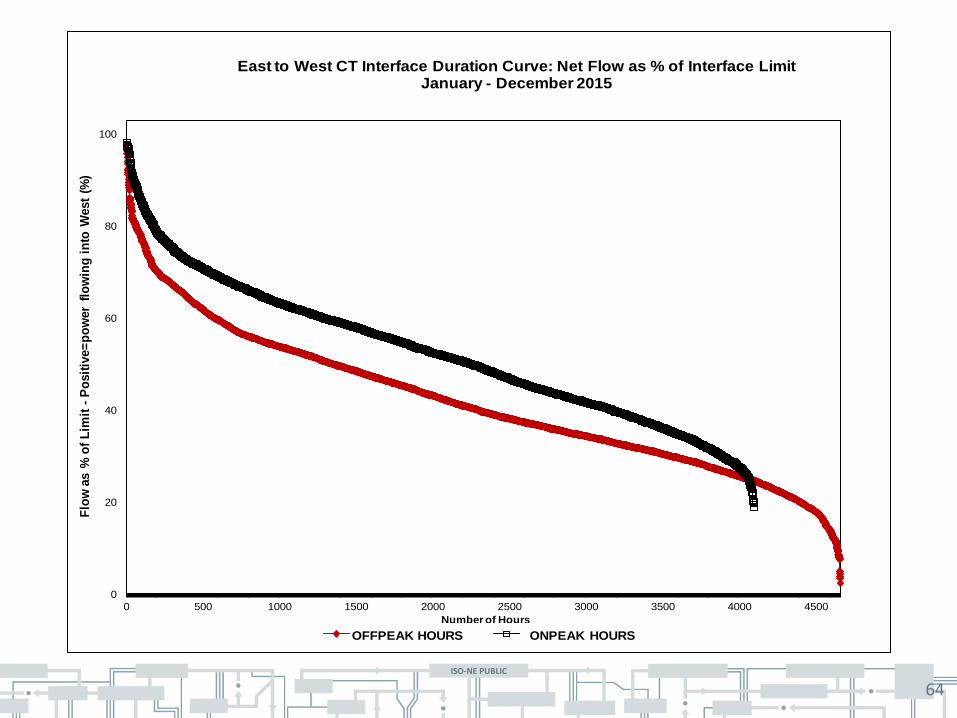
East to West CT Interface Duration Curve: Net Flow as % of Interface LimitJanuary - December 2015
OFFPEAK HOURS ONPEAK HOURS
ISO-NE PUBLIC
65
• The small Congestion Component of the Locational Marginal Prices suggests there is little congestion on the system.
• In general, interface flows operate closer to the limit on peak as opposed to off peak
• Portions of the system that are remote from load centers, especially northern ME, have high negative loss components
Observations


![arXiv:2005.01402v1 [eess.SY] 4 May 2020 · locational marginal price. We nd interesting convergent characteristics for MCI. Furthermore, we perform k-means clustering to classify](https://img.pdfslide.net/doc/110x75/60a2500d3c8d382a0c28c7c0/arxiv200501402v1-eesssy-4-may-2020-locational-marginal-price-we-nd-interesting.jpg)