Embed Size (px)
DESCRIPTION
Delaware Smarter Balanced Assessment Results for all groups
Citation preview
Smarter Balanced
Assessment Results
September 17, 2015
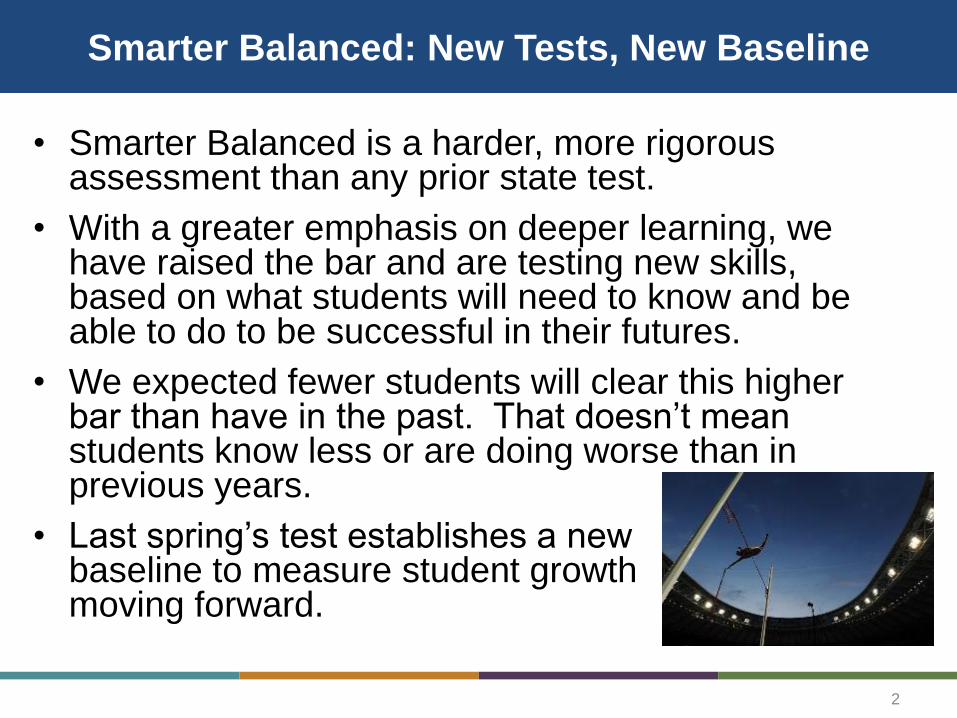
Smarter Balanced: New Tests, New Baseline
• Smarter Balanced is a harder, more rigorous assessment than any prior state test.
• With a greater emphasis on deeper learning, we have raised the bar and are testing new skills, based on what students will need to know and be able to do to be successful in their futures.
• We expected fewer students will clear this higher bar than have in the past. That doesn’t mean students know less or are doing worse than in previous years.
• Last spring’s test establishes a new baseline to measure student growth going moving forward.
2
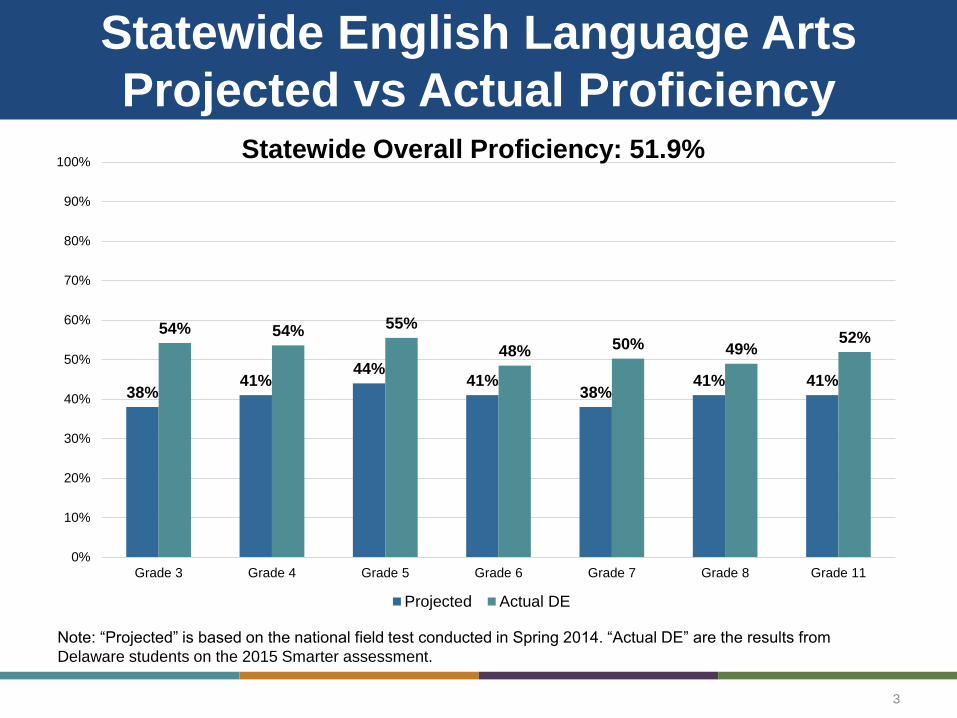
Statewide English Language Arts
Projected vs Actual Proficiency
3
38%41%
44%41%
38%41% 41%
54% 54% 55%
48% 50% 49%52%
0%
10%
20%
30%
40%
50%
60%
70%
80%
90%
100%
Grade 3 Grade 4 Grade 5 Grade 6 Grade 7 Grade 8 Grade 11
Projected Actual DE
Note: “Projected” is based on the national field test conducted in Spring 2014. “Actual DE” are the results from
Delaware students on the 2015 Smarter assessment.
Statewide Overall Proficiency: 51.9%
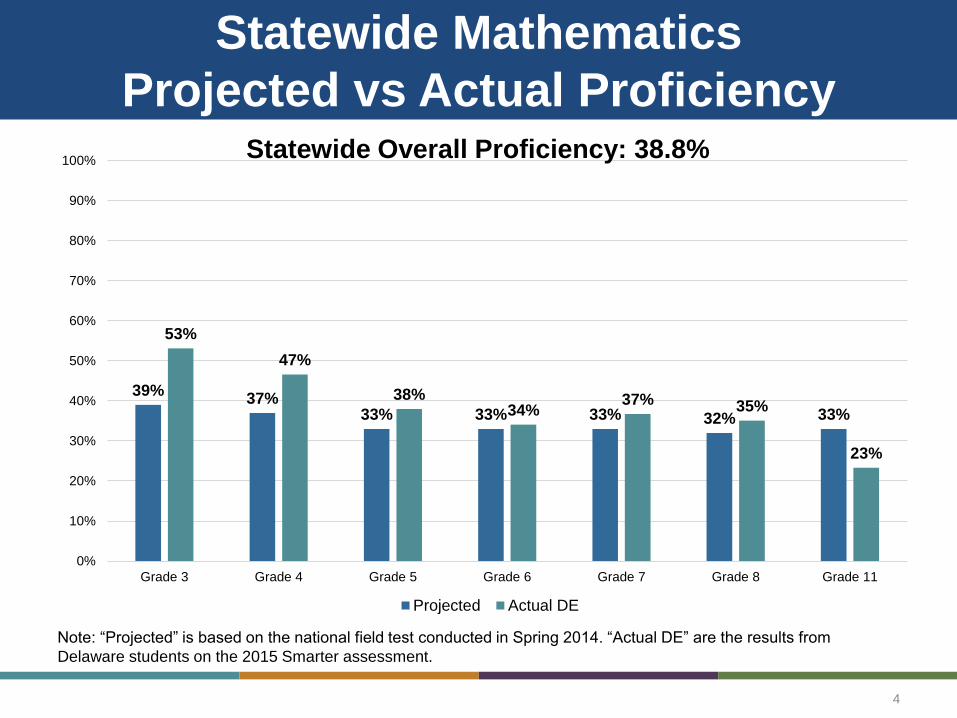
Statewide Mathematics
Projected vs Actual Proficiency
4
39%37%
33% 33% 33% 32% 33%
53%
47%
38%34%
37% 35%
23%
0%
10%
20%
30%
40%
50%
60%
70%
80%
90%
100%
Grade 3 Grade 4 Grade 5 Grade 6 Grade 7 Grade 8 Grade 11
Projected Actual DE
Note: “Projected” is based on the national field test conducted in Spring 2014. “Actual DE” are the results from
Delaware students on the 2015 Smarter assessment.
Statewide Overall Proficiency: 38.8%
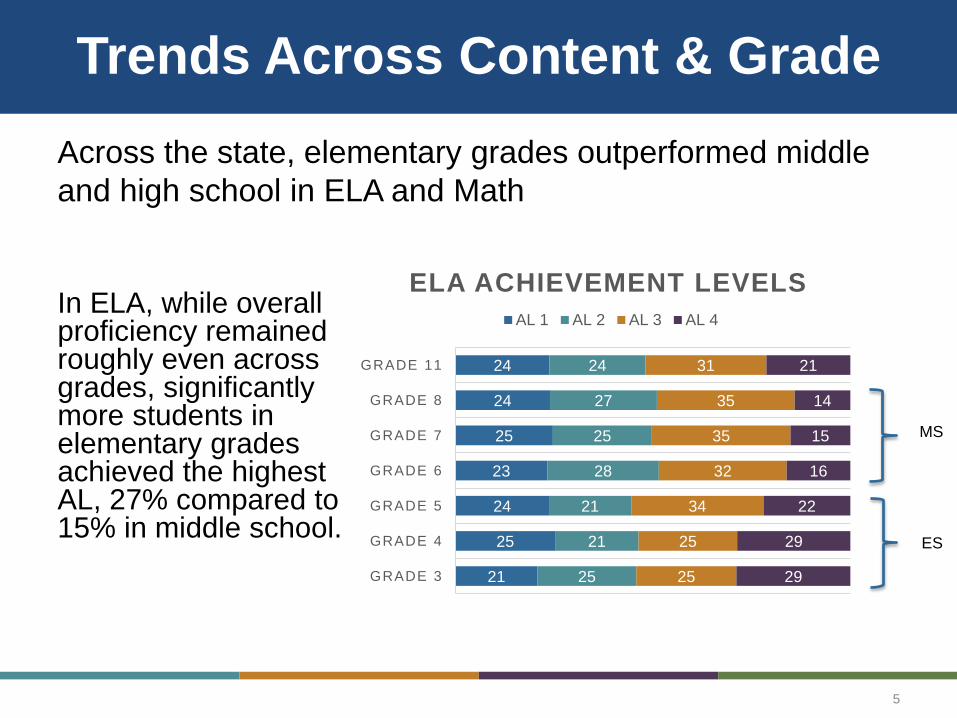
Trends Across Content & Grade
In ELA, while overall proficiency remained roughly even across grades, significantly more students in elementary grades achieved the highest AL, 27% compared to 15% in middle school.
5
21
25
24
23
25
24
24
25
21
21
28
25
27
24
25
25
34
32
35
35
31
29
29
22
16
15
14
21
GRADE 3
GRADE 4
GRADE 5
GRADE 6
GRADE 7
GRADE 8
GRADE 11
ELA ACHIEVEMENT LEVELS
AL 1 AL 2 AL 3 AL 4
Across the state, elementary grades outperformed middle
and high school in ELA and Math
MS
ES
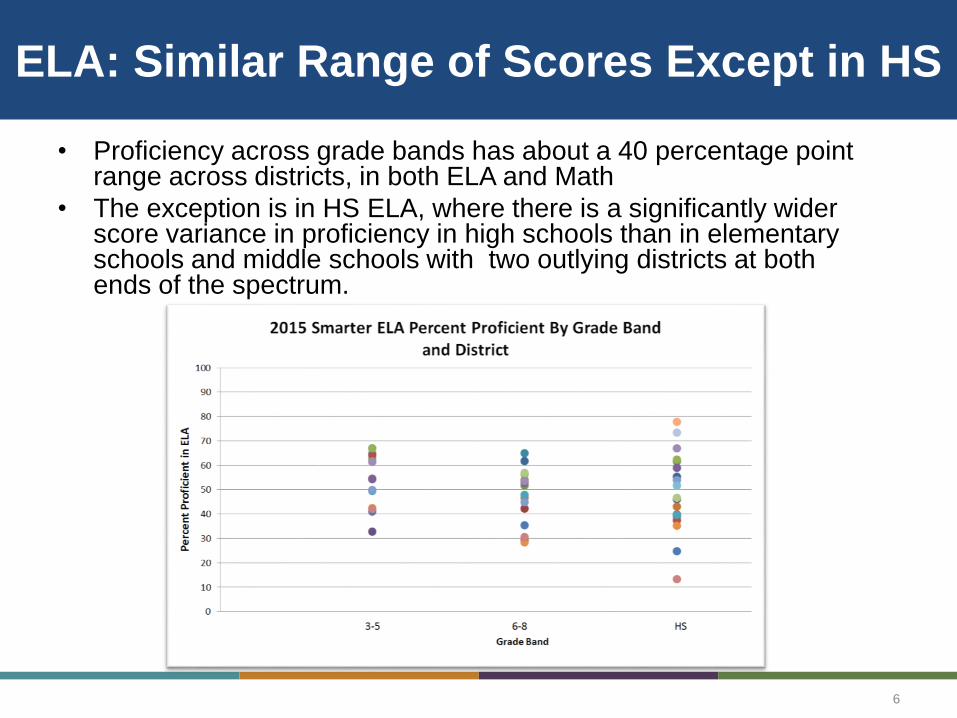
ELA: Similar Range of Scores Except in HS
• Proficiency across grade bands has about a 40 percentage point range across districts, in both ELA and Math
• The exception is in HS ELA, where there is a significantly wider score variance in proficiency in high schools than in elementary schools and middle schools with two outlying districts at both ends of the spectrum.
6
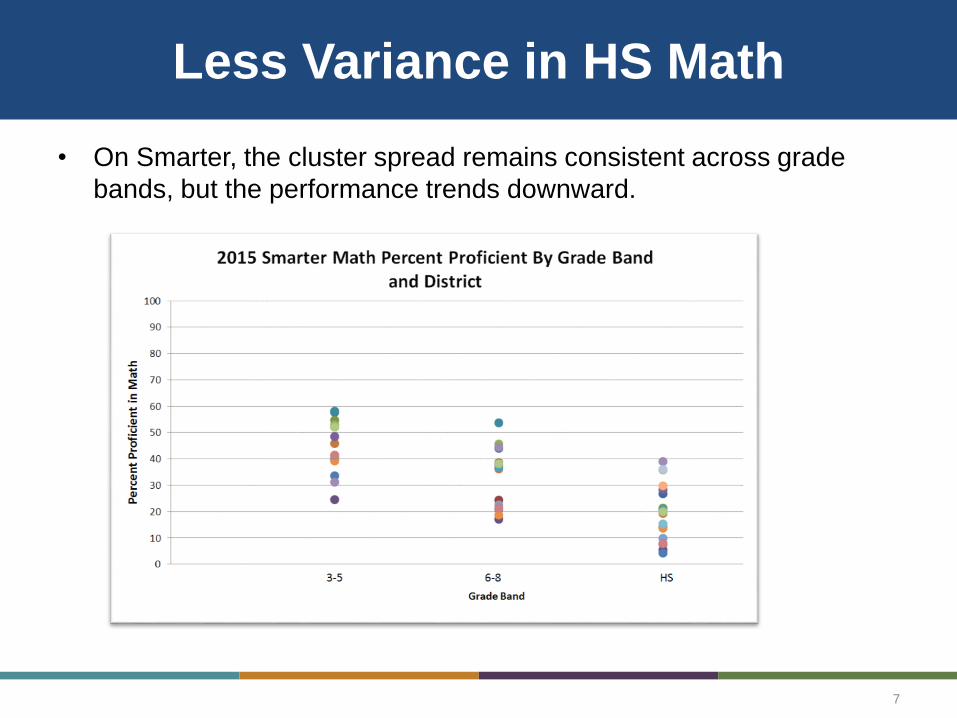
Less Variance in HS Math
• On Smarter, the cluster spread remains consistent across grade
bands, but the performance trends downward.
7
Claim Areas: Data on Skills and
Standards
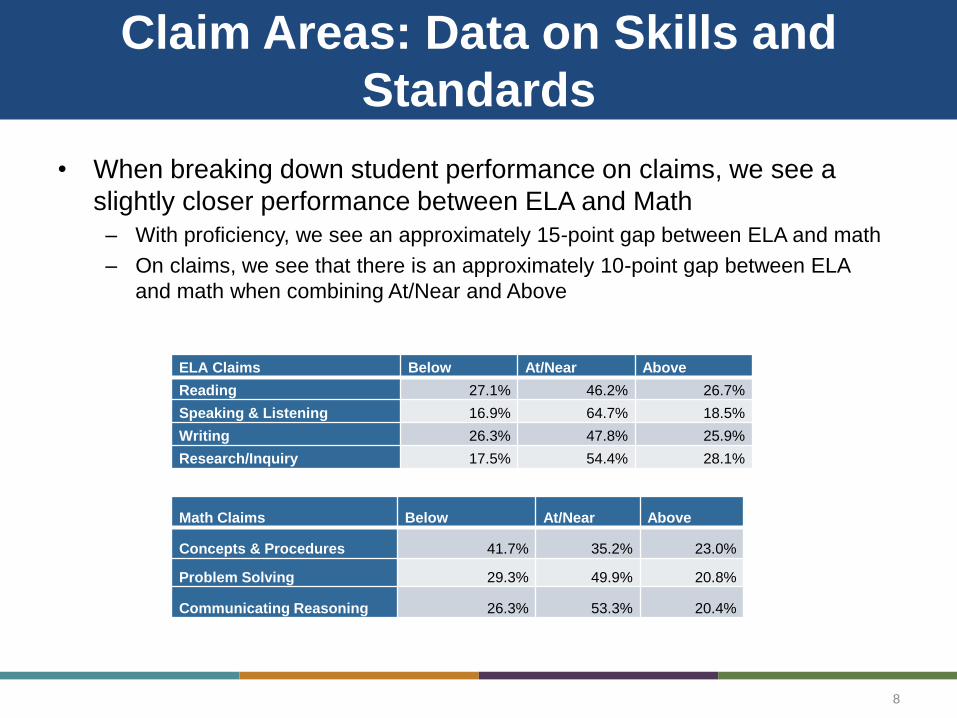
ELA Claims Below At/Near Above
Reading 27.1% 46.2% 26.7%
Speaking & Listening 16.9% 64.7% 18.5%
Writing 26.3% 47.8% 25.9%
Research/Inquiry 17.5% 54.4% 28.1%
8
Math Claims Below At/Near Above
Concepts & Procedures 41.7% 35.2% 23.0%
Problem Solving 29.3% 49.9% 20.8%
Communicating Reasoning 26.3% 53.3% 20.4%
• When breaking down student performance on claims, we see a
slightly closer performance between ELA and Math
– With proficiency, we see an approximately 15-point gap between ELA and math
– On claims, we see that there is an approximately 10-point gap between ELA
and math when combining At/Near and Above
ELA Achievement Levels, Disaggregated
9
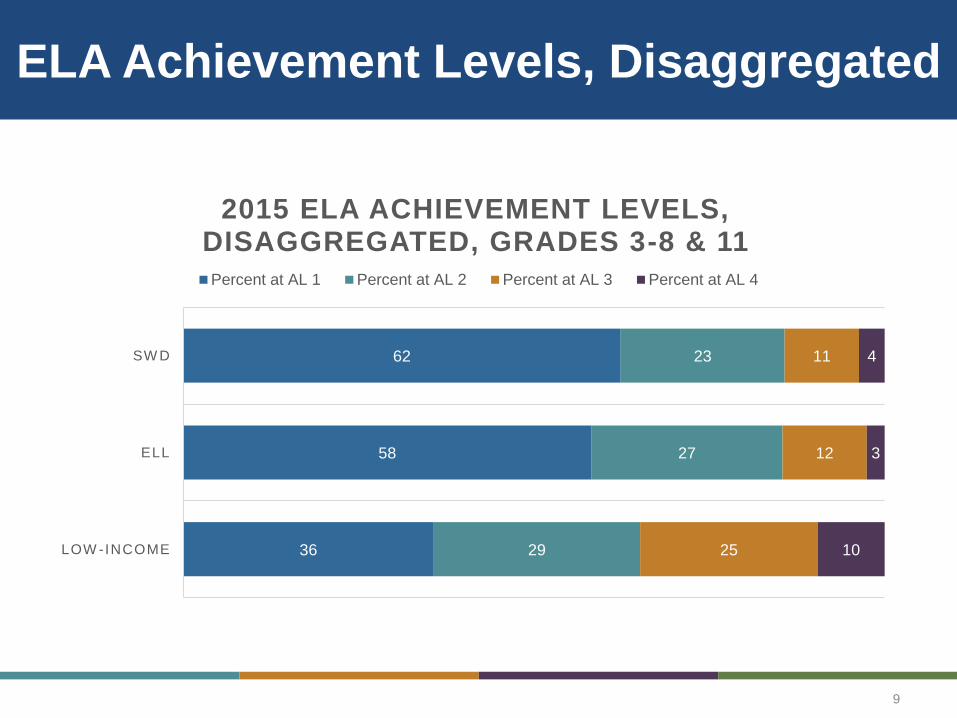
36
58
62
29
27
23
25
12
11
10
3
4
LOW -INCOME
ELL
SW D
2015 ELA ACHIEVEMENT LEVELS, DISAGGREGATED, GRADES 3-8 & 11
Percent at AL 1 Percent at AL 2 Percent at AL 3 Percent at AL 4
Math Achievement Levels,
Disaggregated
10
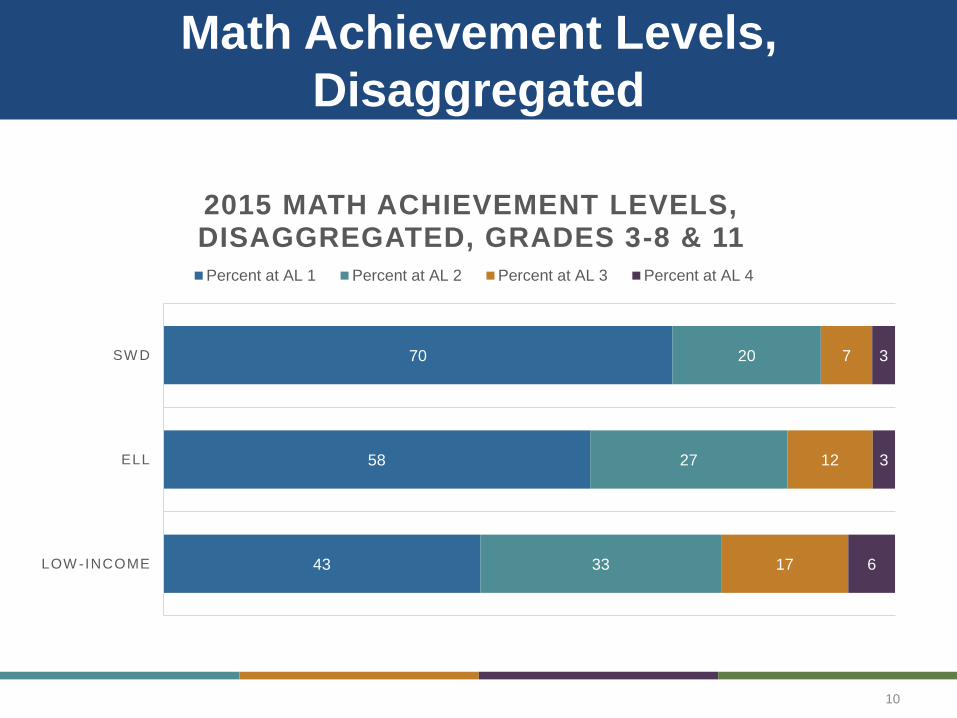
43
58
70
33
27
20
17
12
7
6
3
3
LOW -INCOME
ELL
SW D
2015 MATH ACHIEVEMENT LEVELS, DISAGGREGATED, GRADES 3-8 & 11
Percent at AL 1 Percent at AL 2 Percent at AL 3 Percent at AL 4
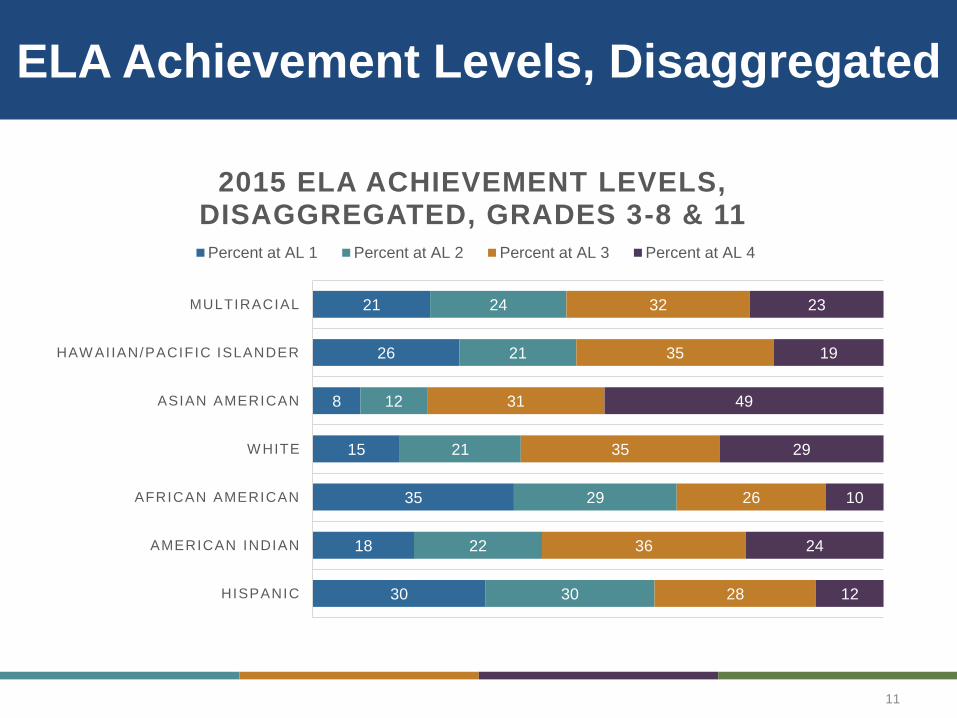
ELA Achievement Levels, Disaggregated
11
30
18
35
15
8
26
21
30
22
29
21
12
21
24
28
36
26
35
31
35
32
12
24
10
29
49
19
23
HISPANIC
AMERICAN INDIAN
AFRICAN AMERICAN
W HITE
ASIAN AMERICAN
HAW AIIAN/PACIFIC ISLANDER
MULTIRACIAL
2015 ELA ACHIEVEMENT LEVELS, DISAGGREGATED, GRADES 3-8 & 11
Percent at AL 1 Percent at AL 2 Percent at AL 3 Percent at AL 4
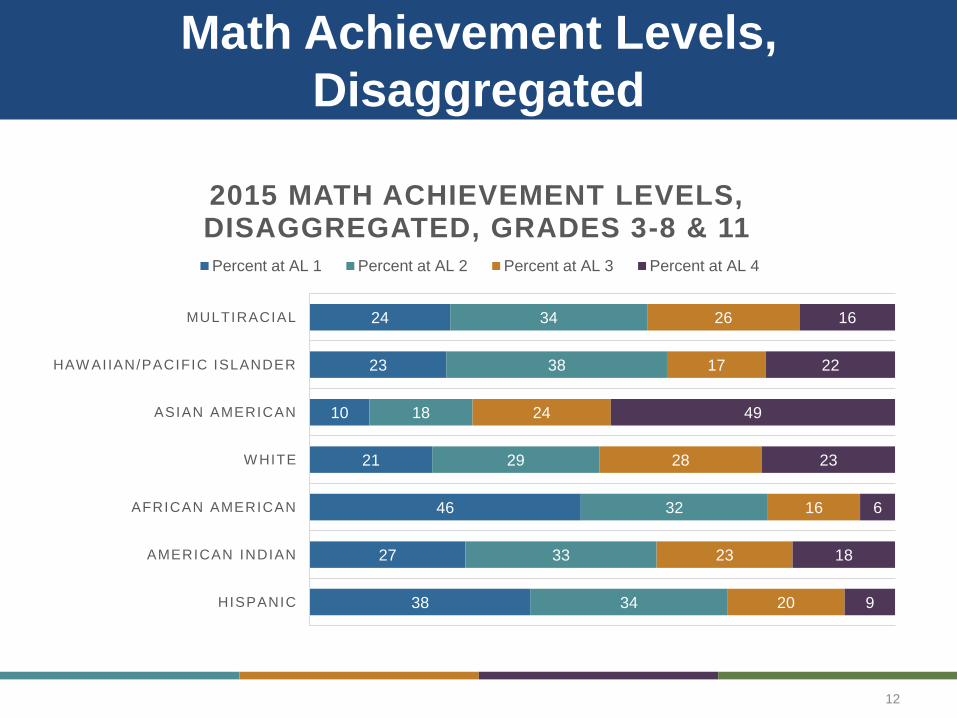
Math Achievement Levels,
Disaggregated
12
38
27
46
21
10
23
24
34
33
32
29
18
38
34
20
23
16
28
24
17
26
9
18
6
23
49
22
16
HISPANIC
AMERICAN INDIAN
AFRICAN AMERICAN
W HITE
ASIAN AMERICAN
HAW AIIAN/PACIFIC ISLANDER
MULTIRACIAL
2015 MATH ACHIEVEMENT LEVELS, DISAGGREGATED, GRADES 3-8 & 11
Percent at AL 1 Percent at AL 2 Percent at AL 3 Percent at AL 4
Subgroups
• Gaps in subgroups remain significant; we have much work yet to do
• Although gaps remain, the gaps in proficiency between subgroups did not increase overall, and are similar to gaps in previous years’ assessments
13
SMARTER PARTICIPATION
14
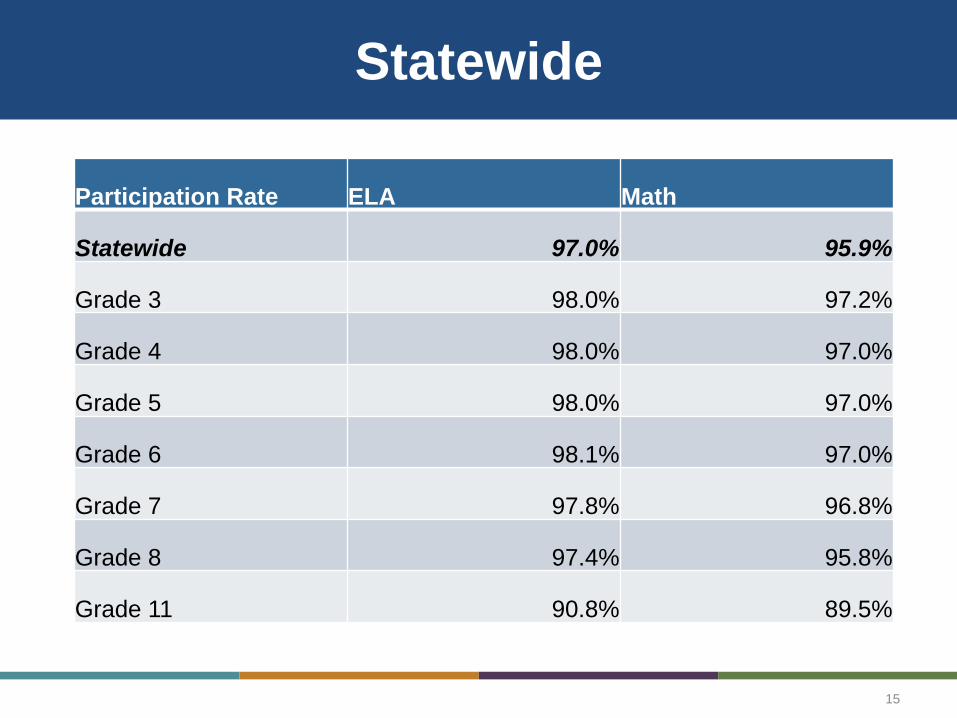
Statewide
Participation Rate ELA Math
Statewide 97.0% 95.9%
Grade 3 98.0% 97.2%
Grade 4 98.0% 97.0%
Grade 5 98.0% 97.0%
Grade 6 98.1% 97.0%
Grade 7 97.8% 96.8%
Grade 8 97.4% 95.8%
Grade 11 90.8% 89.5%
15
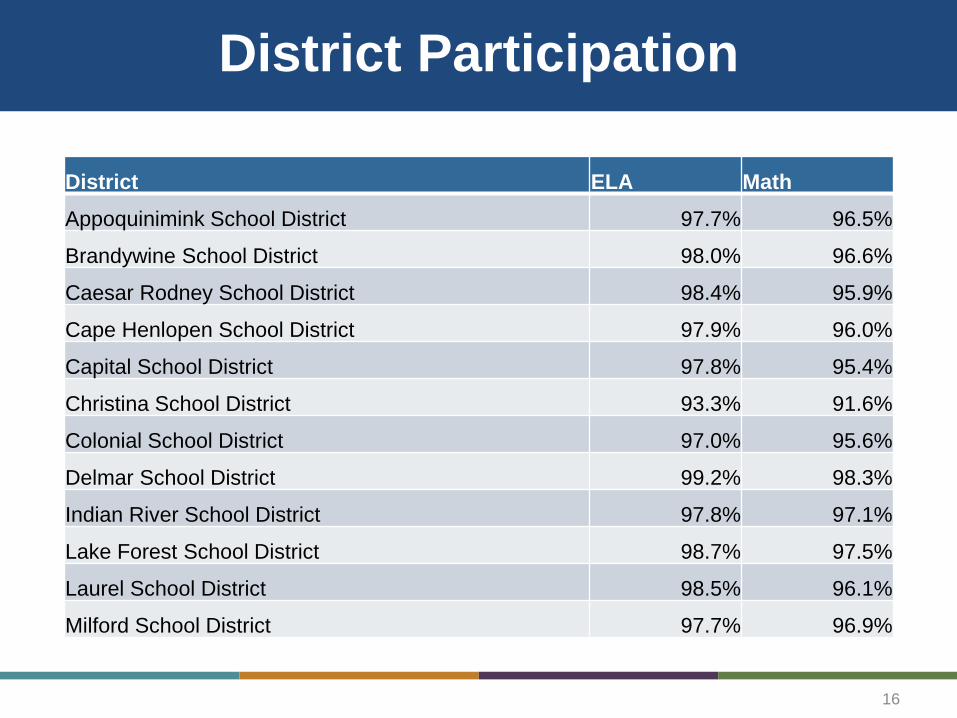
District Participation
District ELA Math
Appoquinimink School District 97.7% 96.5%
Brandywine School District 98.0% 96.6%
Caesar Rodney School District 98.4% 95.9%
Cape Henlopen School District 97.9% 96.0%
Capital School District 97.8% 95.4%
Christina School District 93.3% 91.6%
Colonial School District 97.0% 95.6%
Delmar School District 99.2% 98.3%
Indian River School District 97.8% 97.1%
Lake Forest School District 98.7% 97.5%
Laurel School District 98.5% 96.1%
Milford School District 97.7% 96.9%
16
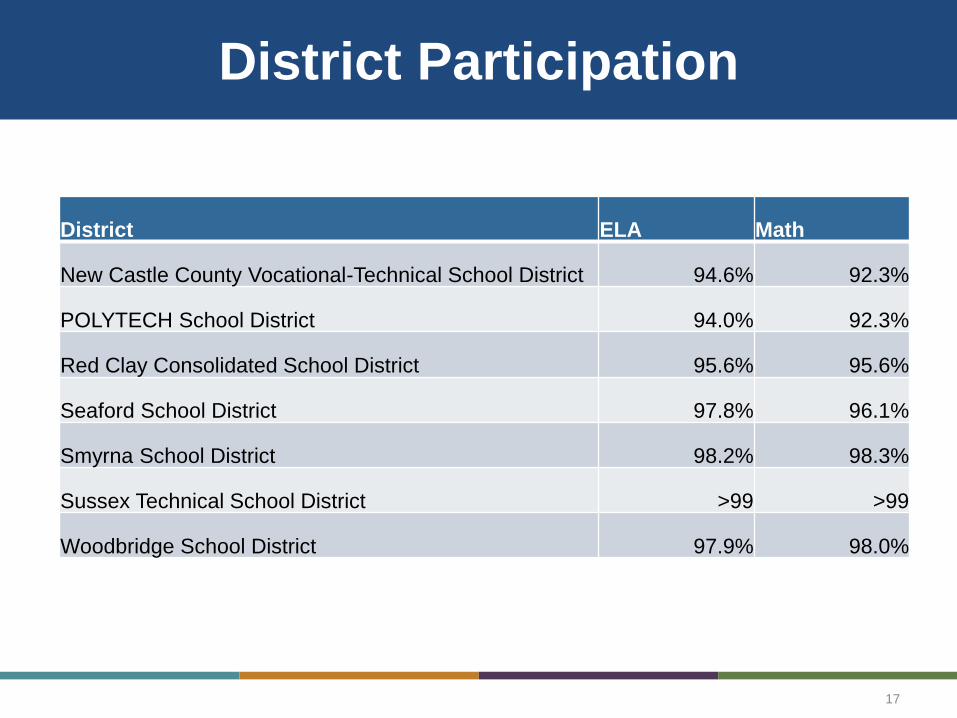
District Participation
District ELA Math
New Castle County Vocational-Technical School District 94.6% 92.3%
POLYTECH School District 94.0% 92.3%
Red Clay Consolidated School District 95.6% 95.6%
Seaford School District 97.8% 96.1%
Smyrna School District 98.2% 98.3%
Sussex Technical School District >99 >99
Woodbridge School District 97.9% 98.0%
17
STUDENT SURVEY
Smarter Assessment in Delaware
18
2015 Smarter Student Survey
• An online student survey was established
in order to collect valuable student
feedback on Smarter assessments in
ELA/Lit and mathematics.
• The survey consisted of 10 questions and
was designed for students at the
elementary, middle, and high school
levels.
19
Summary of Student Survey
• Over 7,000 students participated in the
survey across grades, including about
63.9% in grades 3-5, 34.7% in grades 6-8,
and 1.4% in grade 11.
• The survey results were summarized at
the state level by grade cluster.
• Many students provided comments and
feedback based on their experiences.
20
Survey Questions: Technology
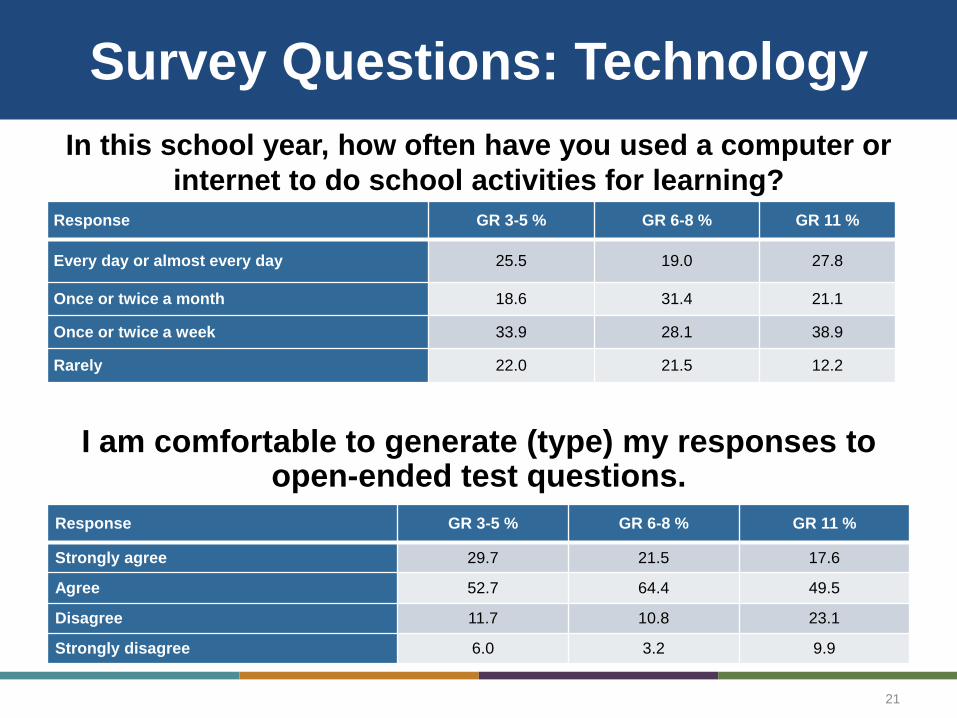
In this school year, how often have you used a computer or
internet to do school activities for learning?
Response GR 3-5 % GR 6-8 % GR 11 %
Every day or almost every day 25.5 19.0 27.8
Once or twice a month 18.6 31.4 21.1
Once or twice a week 33.9 28.1 38.9
Rarely 22.0 21.5 12.2
I am comfortable to generate (type) my responses to open-ended test questions.
21
Response GR 3-5 % GR 6-8 % GR 11 %
Strongly agree 29.7 21.5 17.6
Agree 52.7 64.4 49.5
Disagree 11.7 10.8 23.1
Strongly disagree 6.0 3.2 9.9
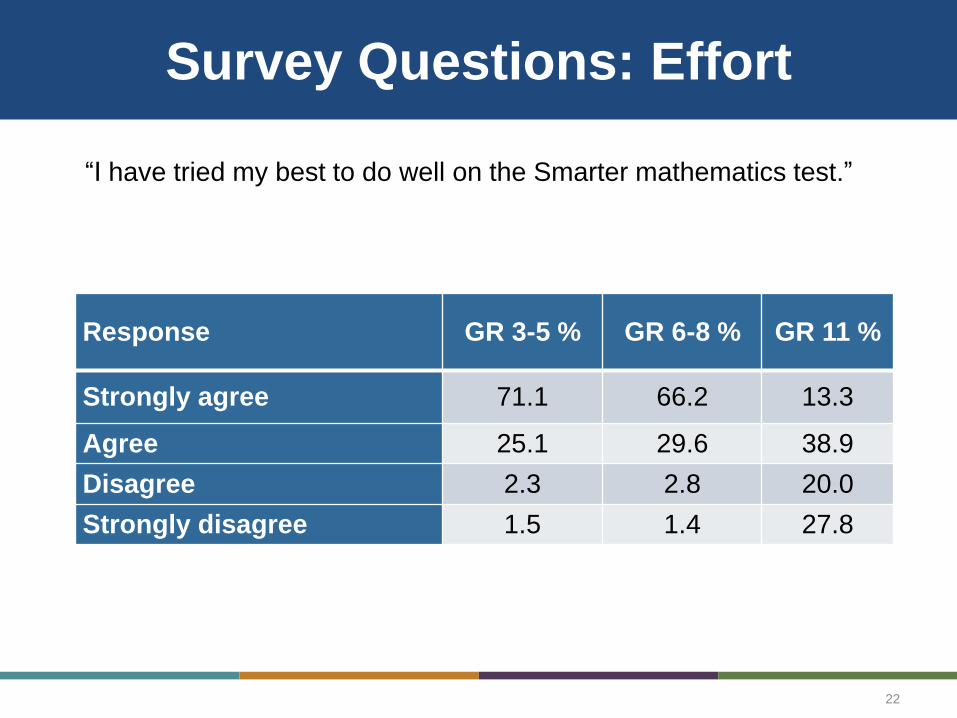
Survey Questions: Effort
Response GR 3-5 % GR 6-8 % GR 11 %
Strongly agree 71.1 66.2 13.3
Agree 25.1 29.6 38.9
Disagree 2.3 2.8 20.0
Strongly disagree 1.5 1.4 27.8
22
“I have tried my best to do well on the Smarter mathematics test.”
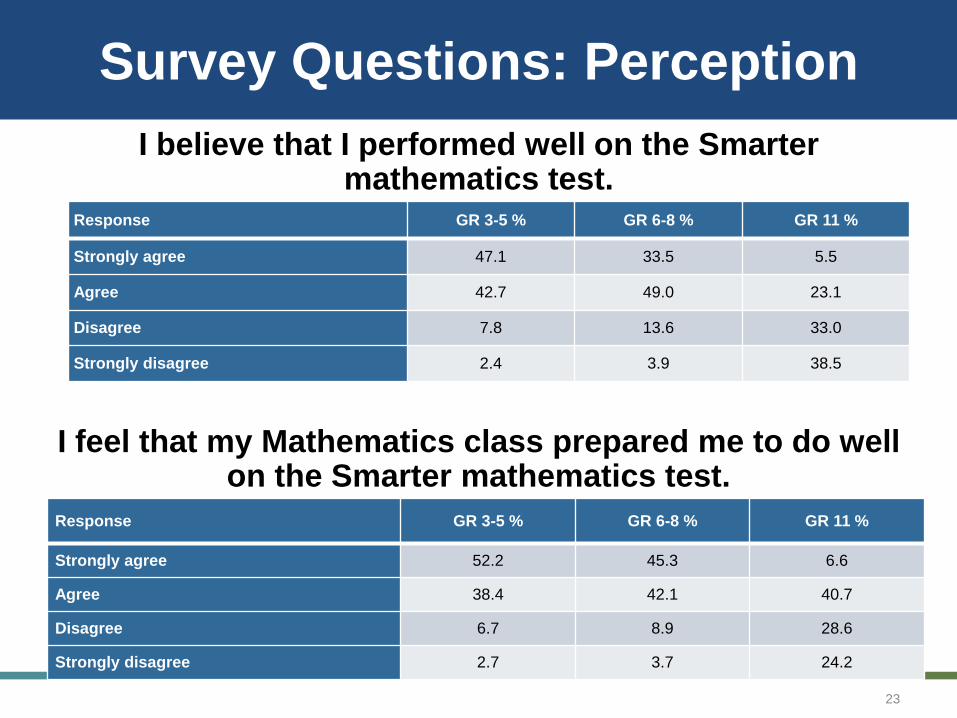
Survey Questions: Perception
I believe that I performed well on the Smarter mathematics test.
I feel that my Mathematics class prepared me to do well on the Smarter mathematics test.
23
Response GR 3-5 % GR 6-8 % GR 11 %
Strongly agree 47.1 33.5 5.5
Agree 42.7 49.0 23.1
Disagree 7.8 13.6 33.0
Strongly disagree 2.4 3.9 38.5
Response GR 3-5 % GR 6-8 % GR 11 %
Strongly agree 52.2 45.3 6.6
Agree 38.4 42.1 40.7
Disagree 6.7 8.9 28.6
Strongly disagree 2.7 3.7 24.2
Teaching and Learning
24
Possible Trends:
NAEP, Smarter and Other States
• Delaware’s performance shows both strengths and areas for growth compared to other states
• Smarter Balanced assessments are nationally/internationally benchmarked, and are expected to track closely with NAEP scores
• There are strong positive indications looking at Smarter data in the context of NAEP trends
25
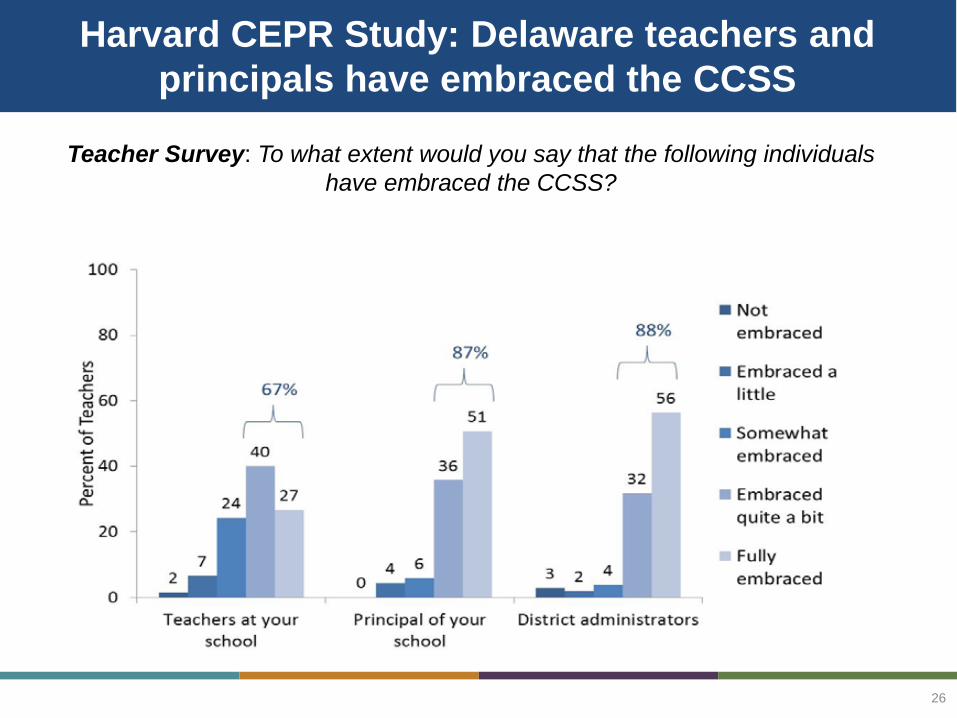
Harvard CEPR Study: Delaware teachers and
principals have embraced the CCSS
Teacher Survey: To what extent would you say that the following individuals
have embraced the CCSS?
26
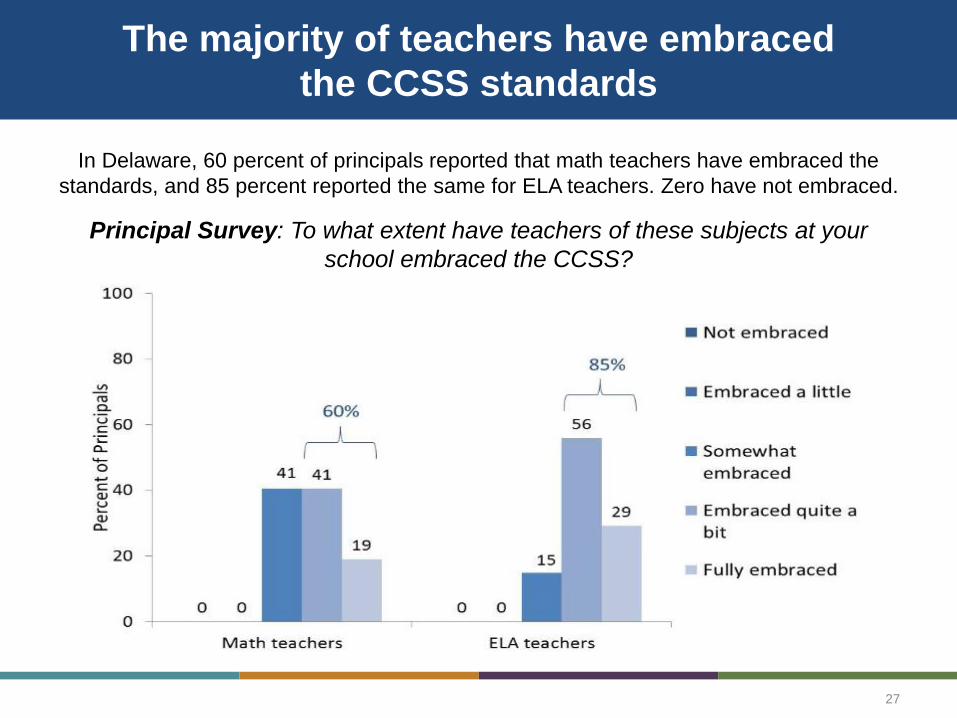
The majority of teachers have embraced
the CCSS standards
In Delaware, 60 percent of principals reported that math teachers have embraced the
standards, and 85 percent reported the same for ELA teachers. Zero have not embraced.
Principal Survey: To what extent have teachers of these subjects at your
school embraced the CCSS?
27
Bright Spots
There are many promising highlights as we focus on improvement for our
students:
• There are a number of schools with a high percentage of low income
students and proficiency at or above state average, demonstrating student
success:
– Examples include: Booker T. Washington, Towne Point, South Dover,
John M. Clayton, Lake Forest South and East
• Schools participating in Common Ground for the Common Core show
promising improvements in Common Core State Standards practices
• A number of schools with high low-income and minority populations that are
showing strong outcomes on equity measures such as educator
effectiveness, retention, and school climate, are also showing strengths on
student achievement, performing better than similar schools.
– Examples include: Kuumba, North Georgetown Elementary, North
Dover Elementary
28
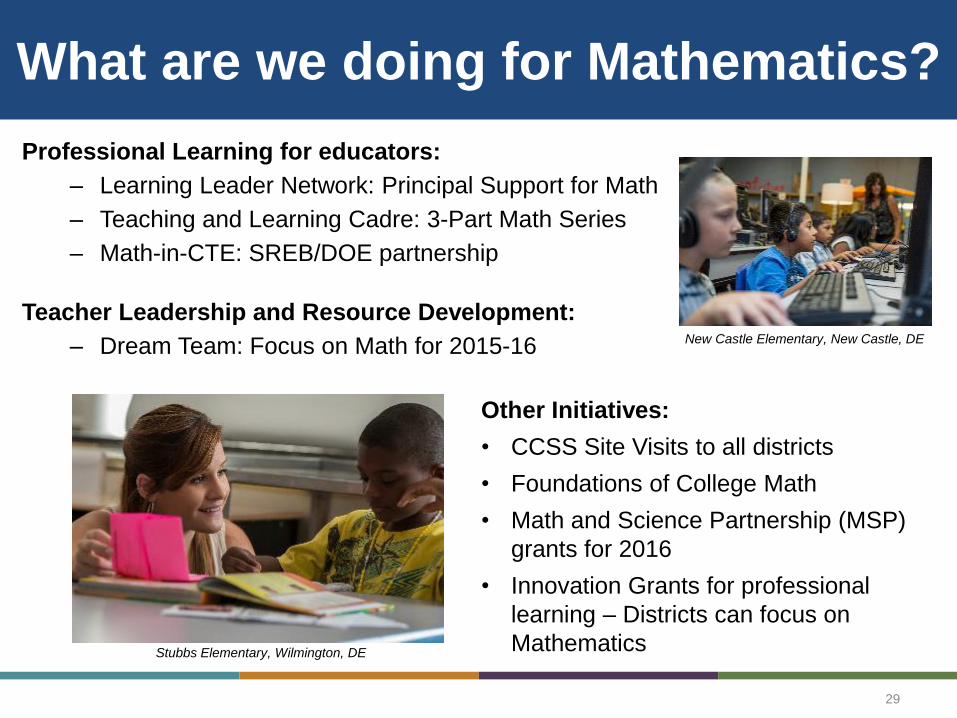
What are we doing for Mathematics?
Professional Learning for educators:
– Learning Leader Network: Principal Support for Math
– Teaching and Learning Cadre: 3-Part Math Series
– Math-in-CTE: SREB/DOE partnership
Teacher Leadership and Resource Development:
– Dream Team: Focus on Math for 2015-16
29
Other Initiatives:
• CCSS Site Visits to all districts
• Foundations of College Math
• Math and Science Partnership (MSP)
grants for 2016
• Innovation Grants for professional
learning – Districts can focus on
Mathematics
New Castle Elementary, New Castle, DE
Stubbs Elementary, Wilmington, DE
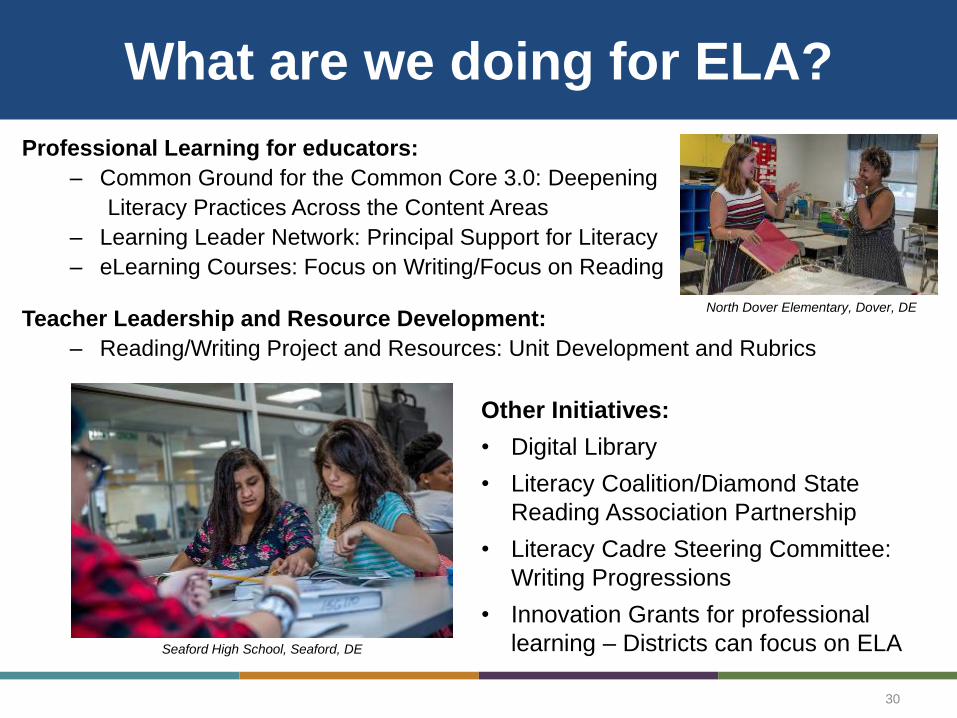
What are we doing for ELA?
Professional Learning for educators:
– Common Ground for the Common Core 3.0: Deepening
Literacy Practices Across the Content Areas
– Learning Leader Network: Principal Support for Literacy
– eLearning Courses: Focus on Writing/Focus on Reading
Teacher Leadership and Resource Development:
– Reading/Writing Project and Resources: Unit Development and Rubrics
30
Other Initiatives:
• Digital Library
• Literacy Coalition/Diamond State
Reading Association Partnership
• Literacy Cadre Steering Committee:
Writing Progressions
• Innovation Grants for professional
learning – Districts can focus on ELA
North Dover Elementary, Dover, DE
Seaford High School, Seaford, DE
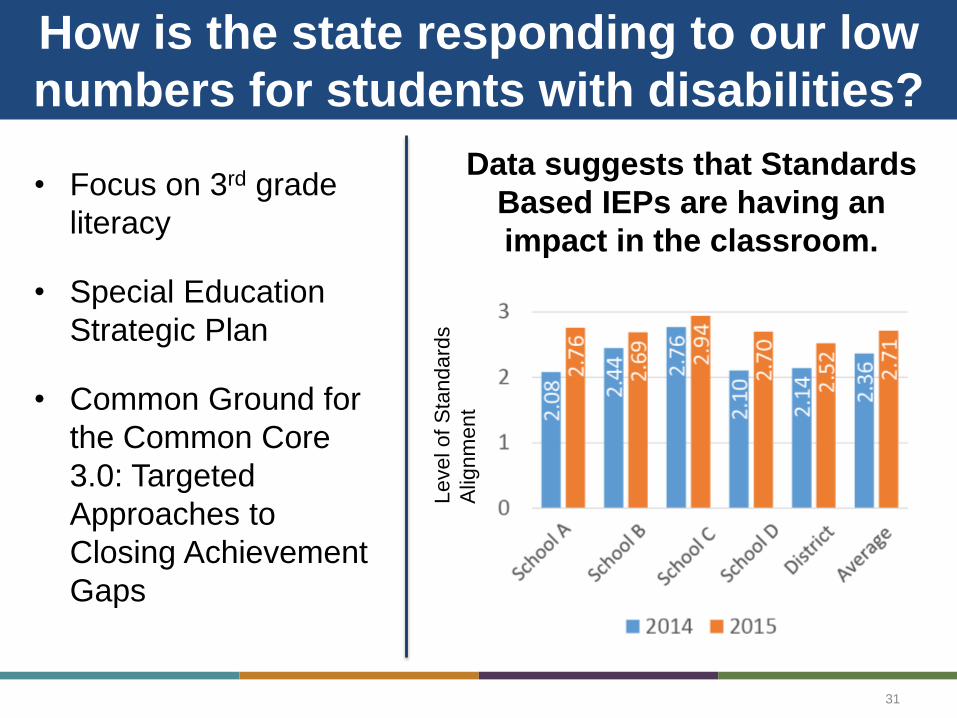
How is the state responding to our low
numbers for students with disabilities?
• Focus on 3rd grade
literacy
• Special Education
Strategic Plan
• Common Ground for
the Common Core
3.0: Targeted
Approaches to
Closing Achievement
Gaps
31
Level of
Sta
ndard
s
Alig
nm
en
t
Data suggests that Standards
Based IEPs are having an
impact in the classroom.
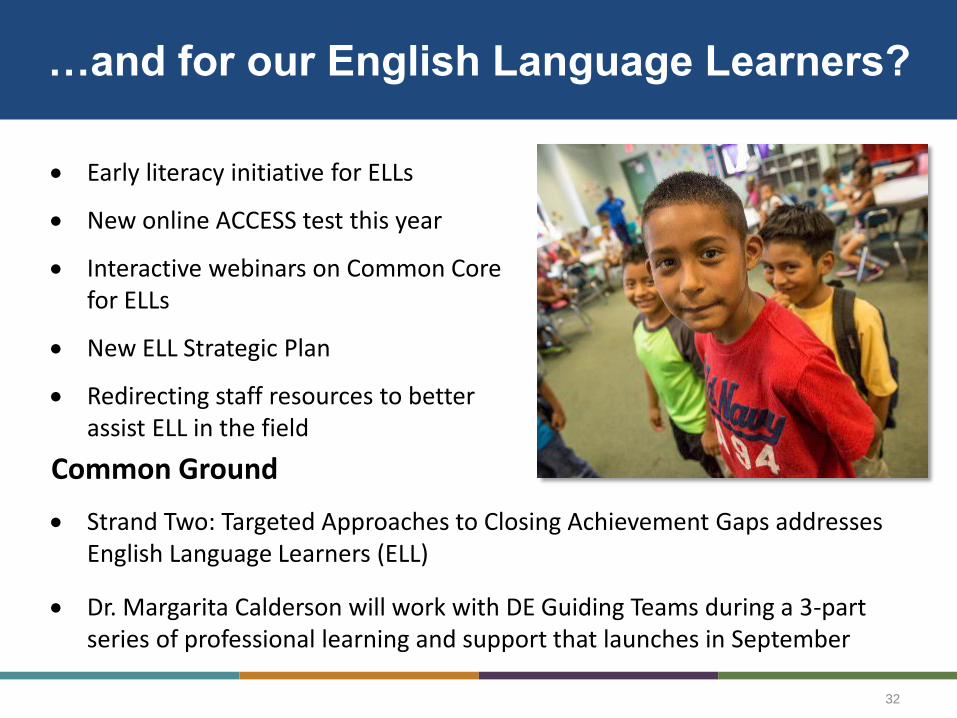
…and for our English Language Learners?
32
Early literacy initiative for ELLs
New online ACCESS test this year
Interactive webinars on Common Core for ELLs
New ELL Strategic Plan
Redirecting staff resources to better assist ELL in the field
Common Ground
Strand Two: Targeted Approaches to Closing Achievement Gaps addresses English Language Learners (ELL)
Dr. Margarita Calderson will work with DE Guiding Teams during a 3-part series of professional learning and support that launches in September
SMARTER RESOURCES AND
COMMUNICATIONS
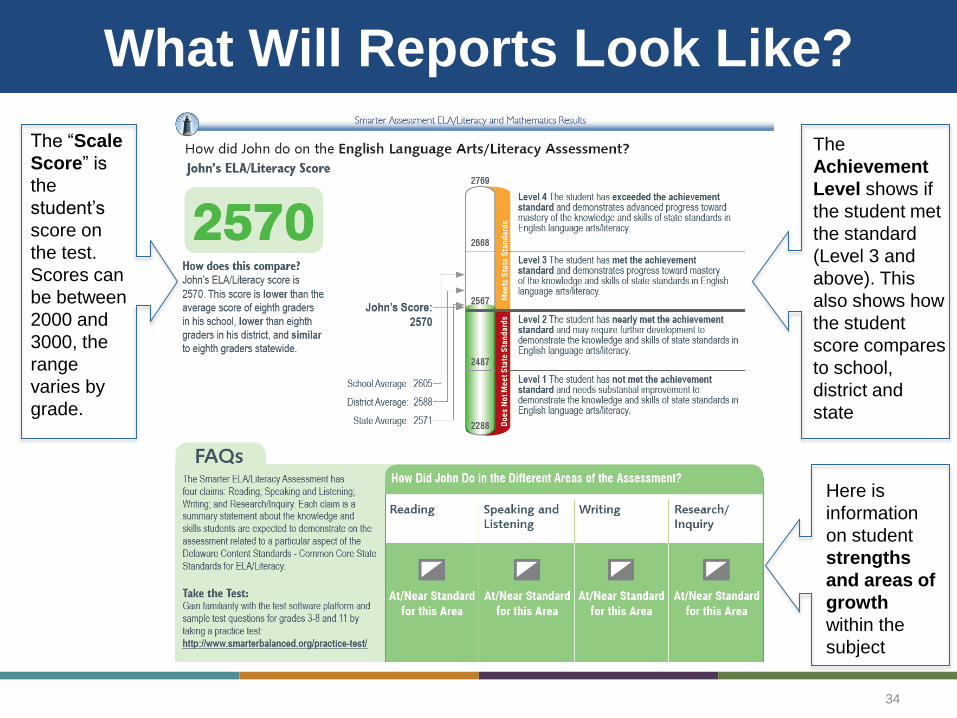
What Will Reports Look Like?
34
The “Scale
Score” is
the
student’s
score on
the test.
Scores can
be between
2000 and
3000, the
range
varies by
grade.
The
Achievement
Level shows if
the student met
the standard
(Level 3 and
above). This
also shows how
the student
score compares
to school,
district and
state
Here is
information
on student
strengths
and areas of
growth
within the
subject
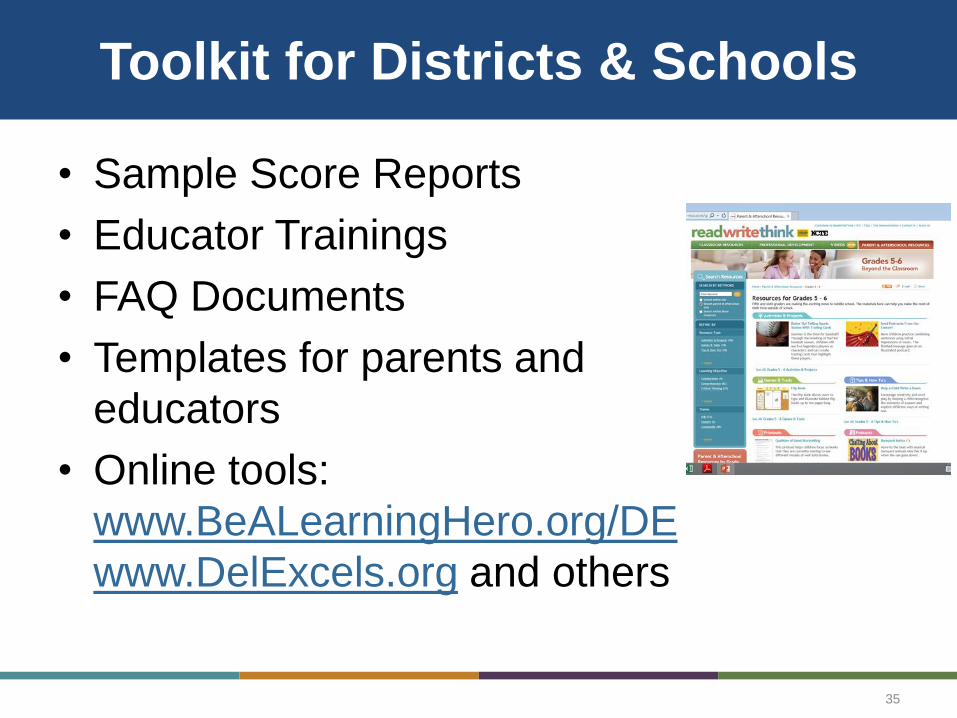
Toolkit for Districts & Schools
• Sample Score Reports
• Educator Trainings
• FAQ Documents
• Templates for parents and
educators
• Online tools:
www.BeALearningHero.org/DE
www.DelExcels.org and others
35
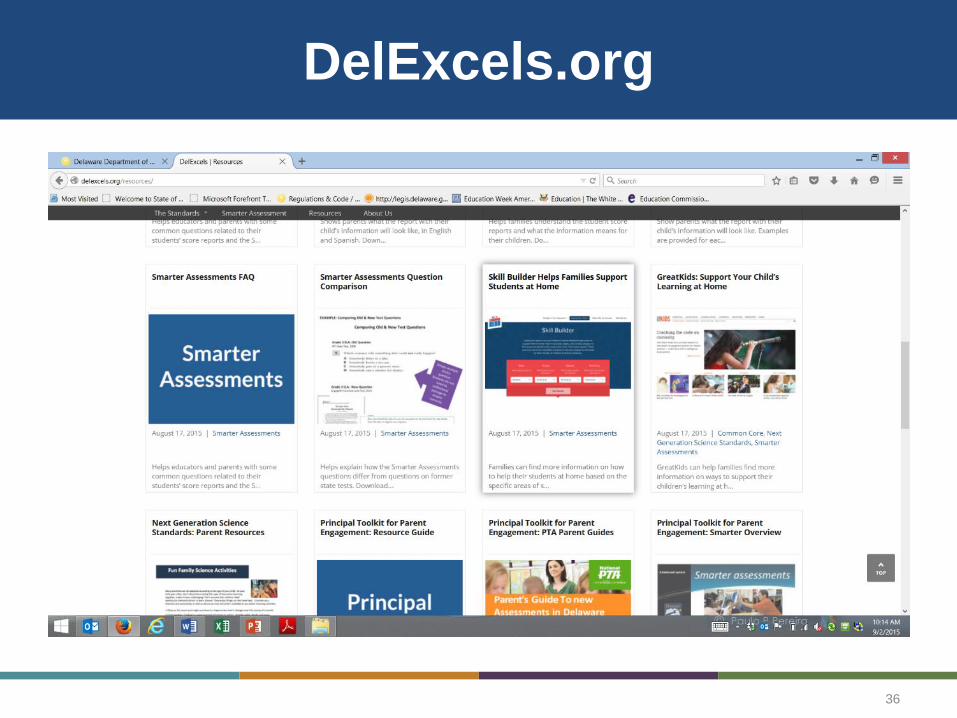
DelExcels.org
36
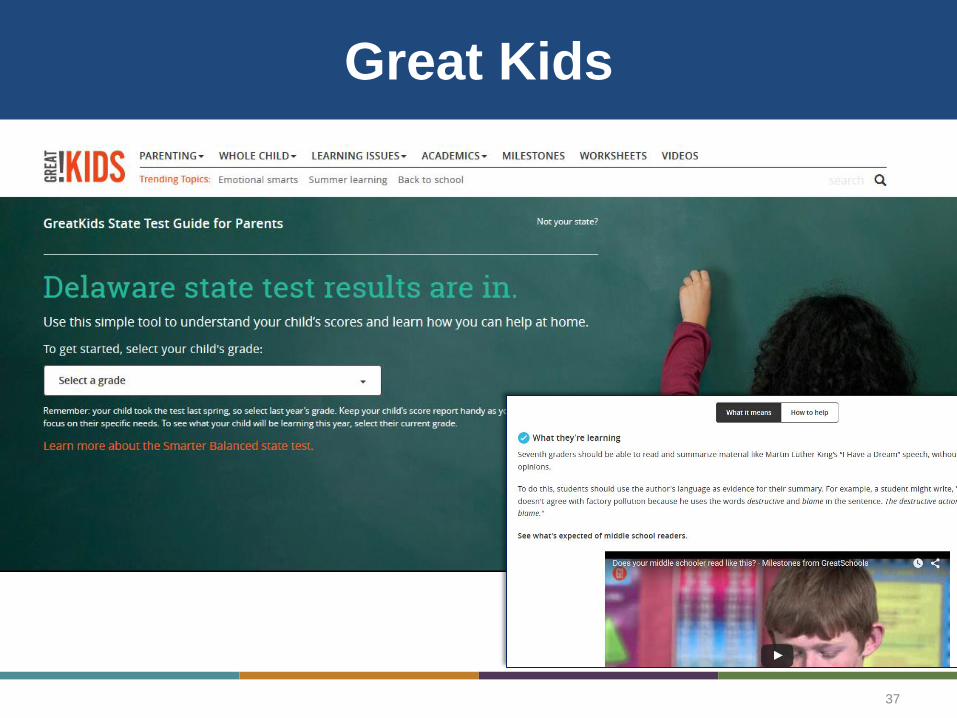
Great Kids
37
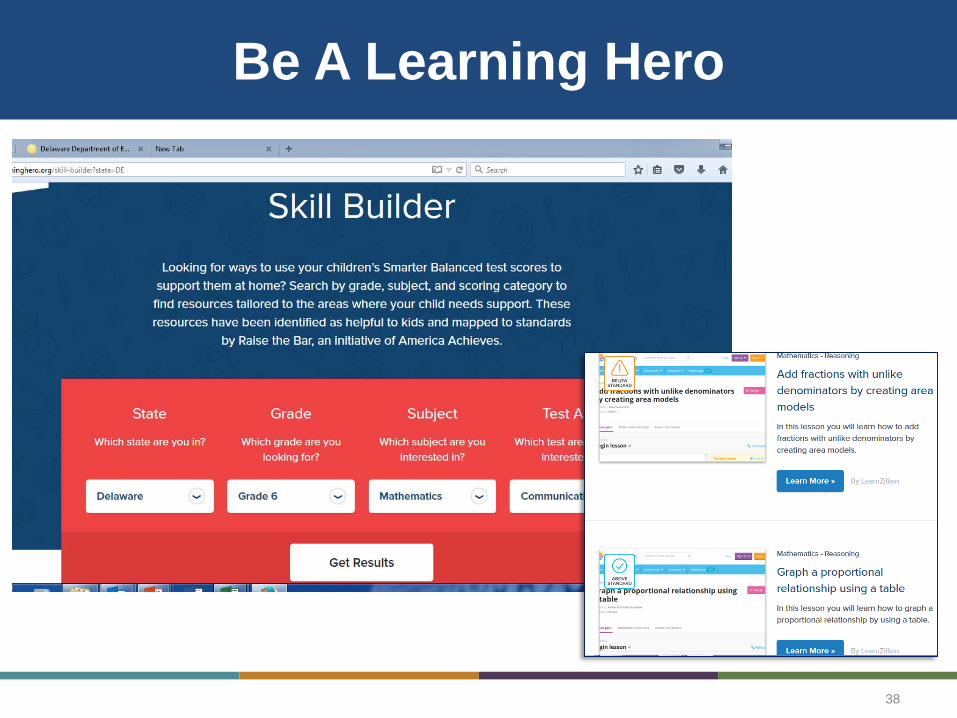
Be A Learning Hero
38