Embed Size (px)
DESCRIPTION
Alaska is teetering on what has been described as the state’s “fiscal cliff.” In most recent years, state revenue has been plentiful due to the high price of oil in spite of declining oil production. The last decade has seen a drop in oil production from 932,000 barrels per day in 2005 to 547,000 barrels in 2014. High oil prices masked the impact on the state treasury of declining oil production. Commonwealth North’s Board of Directors believes that this crucial first step—rightsizing state spending—is a fundamental starting point for sustainable spending in the future, which will only be strengthened by stable and diverse revenue sources.
Citation preview
42
Commonwealth North is a non-profit corporation, organized and existing under the
laws of the State of Alaska. Non-partisan in nature, its purpose is to inject
enlightened vitality into the world of commerce and public policy. As well as
providing a forum for State and National speakers, working committees study critical
issues facing Alaska and prepare well-researched action papers, such as this one.
Commonwealth North
711 M Street, Suite 104 • Anchorage, Alaska 99501
Tel: (907) 258-9522 • Fax: (907) 276-6350 • [email protected]
Thank you to Northrim Bank for generously sponsoring this report.
i
The State’s Operating Budget:
Critical Crossroads, Choices, and Opportunities
Table of Contents
and
Summary of Recommendations
Page
Introduction ...........................................................................................................1
Background: About State Spending
• Operating Budget ............................................................................................4
• Revenue Sources .............................................................................................4
Operating Budget Major Cost Drivers
• Cost of Health Care .................................................................................. 6
Recommendation: Given the state’s fiscal reality, the
Administration and unions re-open negotiations to identify steps
to realize short- and long-term health care savings.
Recommendation: The Administration and Legislature take steps
to implement the Alaska Health Care Commission’s “Core
Strategies for Health Care Transformation” to achieve cost
savings, with priority to re-writing the state’s insurance code to
make it more consumer-friendly and less company oriented, and
establish a system that publishes health care costs so consumers
can be informed of costs.
• State Employee Salary Costs ..........................................................................8
Recommendation: Given the state’s fiscal reality, the
Administration and unions re-open negotiations to identify savings
in salary and other benefit costs.
• Formula-Driven Programs ..............................................................................11
Recommendation: All formula-driven programs must be reviewed
in terms of policy goals, results being achieved, and cost
effectiveness. If necessary, statutory or regulatory changes should
be made.
• Medicaid ..........................................................................................................11
ii
Recommendation: The Administration and the Legislature immediately embark on a Medicaid reform initiative to ensure that the state can continue to provide services to those most in need.
Revenue Earmarks
• Designated Fund Sources .............................................................................. 14
Recommendation: The Governor appoint, with legislative approval, a committee of experts to analyze, within a short period of time, what designated revenue accounts have no legal restriction on use and can be appropriated to the general fund, including any statutory changes that will be necessary.
• Designated Reserves ..................................................................................... 14
Recommendation: The Legislature appropriate designated reserve balances to the general fund so these funds are available to fund priority State services.
Focus on Results, Not How Much to Spend
• Determine Appropriate State Services ...................................................... 15
Recommendation: The Administration and Legislature undertakes a review of state services to evaluate the following:
o Based on constitutional responsibilities, is a program a service the state is required to do;
o If it is appropriate, analyze the results the program is getting—how effective is it in achieving its intended purpose;
o Examine the cost to deliver current results—what’s the “return on investment” in terms of cost compared to results/effectiveness;
o Evaluate if the state is the only entity that can provide the service or if it would be more cost effective and responsive if the services were contracted out or shed through privatization; and/or
o If it isn’t a state responsibility, stop providing the service.
• Fund Effective Programs ............................................................................... 15
Recommendation: The Legislature increase the number of in-‐depth performance reviews conducted to more than one department per year so increased information is available to identify potential savings.
iii
Recommendation: The Legislature undertakes an in-‐depth review of performance frameworks and measures during the interim.
Recommendation: The Legislature integrate use of program performance measures into its budget review to ensure public dollars are spent on effective services; and
Recommendation: The Legislature engage citizens in this review process, which will provide legislators and the Administration with differing perspectives and advance citizen understanding of state services.
Recommendation: The Governor appoint a citizen-‐led commission to conduct a management review of state operations that engages the departments and citizens to identify savings and opportunities to improve service delivery.
Recommendation: Put in place an approval process, such as that used by Congress in the Base Realignment and Closure (BRAC) decision-‐making, to increase the likelihood that comprehensive reforms will be enacted.
Engage Alaskans in Meeting the Challenge
• Statewide Dialogue ....................................................................................... 17
Recommendation: The Governor and Legislature engage Alaskans in a series of dialogues in which they discuss the state’s future; the responsibilities of the state and individual Alaskans in that future; and how achieving that vision will be funded.
• Clear, Balanced Information is Critical .......................................................... 18
Recommendation: Develop a plan for a multiyear approach to communicate critical operating budget issues in cooperation with other public and private organizations. Such efforts must identify general “consumer level” messaging that attracts public interest in Alaska’s budget and the challenges we face. It is critical to engage the public with social media-‐sized bites of information that drive clicks to detail, and that helps to enhance an understanding of the needs and vision of the state.
Changes to Budget Processes and Practices
• Citizen input into Governor’s Budget ........................................................... 19
Recommendation: The Governor establishes citizen advisory panels to provide input during development of the Governor’s proposed budget.
iv
• Move Up Governor’s Budget Submission ..................................................... 19
Recommendation: Require the Governor to submit the proposed budget to the Legislature by November 15th each year to enable the Legislature to get an earlier start to its review.
• Establish Revenue Limit ................................................................................ 19
Recommendation: Limit the amount of savings that can be spent in any one fiscal year to ensure prudent use and extend availability.
• Maximum Flexibility to Identify/Implement Savings ................................... 19
Recommendation: The Legislature approve an FY 16 operating budget that includes approximately seven months of funding that is structured to provide maximum flexibility to the Administration to identify and implement program savings during the fiscal year. This extraordinary approach would include a mechanism by which the Administration would report back to the Legislature next legislative session on implemented and proposed program changes and the level of funding required for the balance of the fiscal year.
• Establish Joint Ways and Means Committee ................................................ 21
Recommendation: Establish a Joint Ways and Means Committee tasked with introduction of a resolution at the start of each session that establishes the overall amount of revenue that will be available for the following fiscal year’s budget, including the amount that will come from savings. The Legislature then takes action on such a resolution within the first two weeks of the session.
• Revenue Forecasting Reliability .................................................................... 21
Recommendation: The Joint Ways and Means Committee review the state’s revenue forecasting methodology to ensure the degree of reliability in making spending decisions and identify options that could improve reliability.
• More Time for Budget Deliberations ............................................................ 22
Recommendation: The Legislature revises its schedule to increase the time available for oversight of State spending. This can include:
o Returning to the Constitution’s 120 day session limit;
v
o Increasing the number of interim meetings for Finance Committee/subcommittee work;
o Convening special session(s) devoted to budget issues; and/or
o Extending the session by 4 weeks in odd-‐year (with two weeks added on each end).
• Current Fiscal Year Budget Reduction Plan .................................................. 23
Recommendation: The Legislature and Governor develop and implement a contingency plan that identifies steps that will be taken to reduce current fiscal year spending due to a dramatic drop in expected revenue.
• Forward Funding ........................................................................................... 23
Recommendation: Evaluate the potential benefits to forward fund the state budget based on prior year revenue.
• Deposit Savings to Statutory Budget Reserve .............................................. 23
Recommendation: Deposit the CBR balance into the statutory budget reserve.
vi
The State’s Operating Budget:
Critical Crossroads, Choices, and Opportunities
Appendices
Page
A Growth in Operating Budget – FY 04 to FY 14 .............................................25
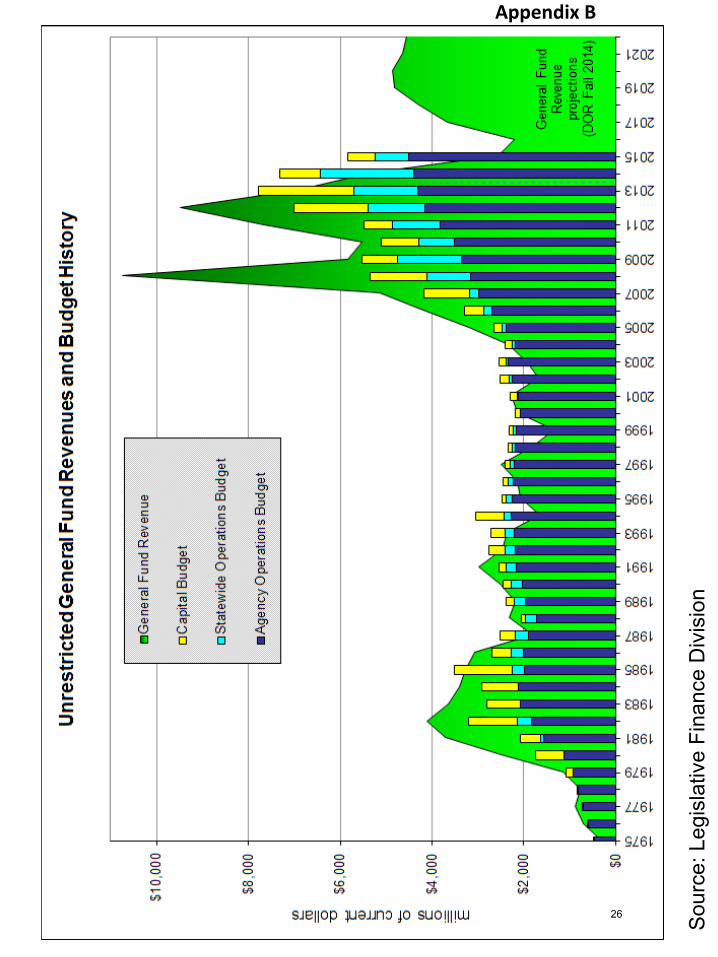
B Unrestricted General Fund Revenues and Budget History ........ 26
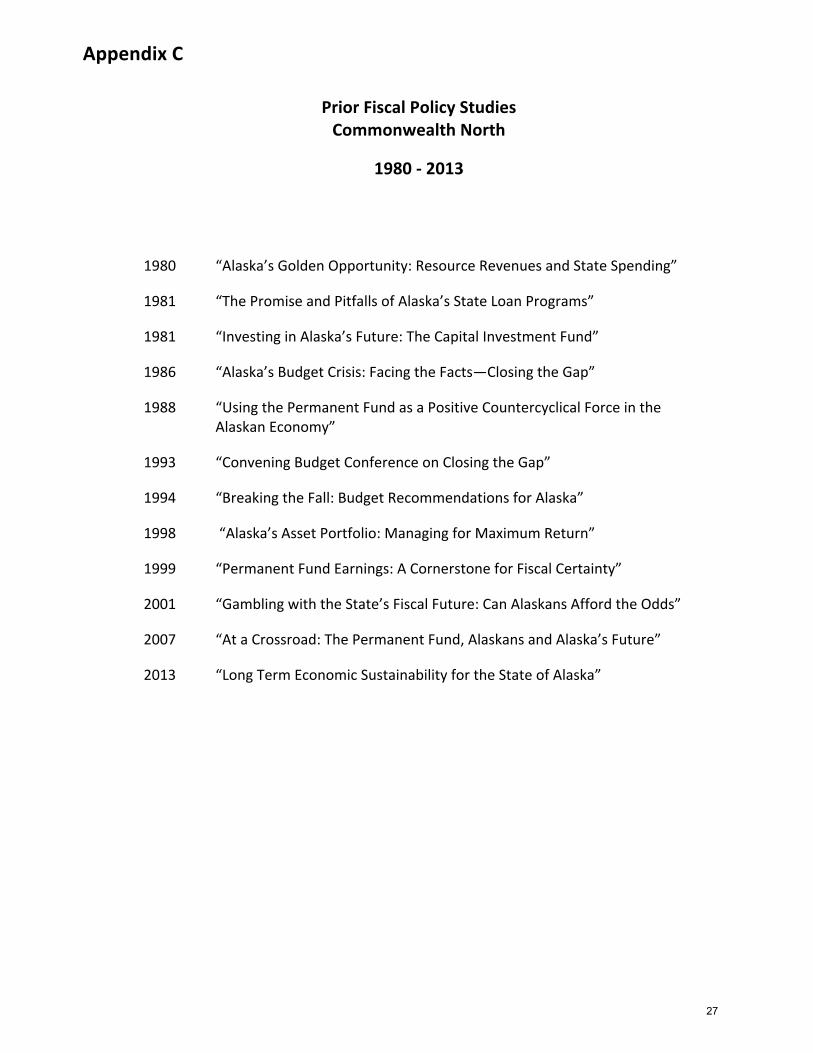
C Prior CWN Fiscal Policy Studies 1980 – 2013 ............................. 27
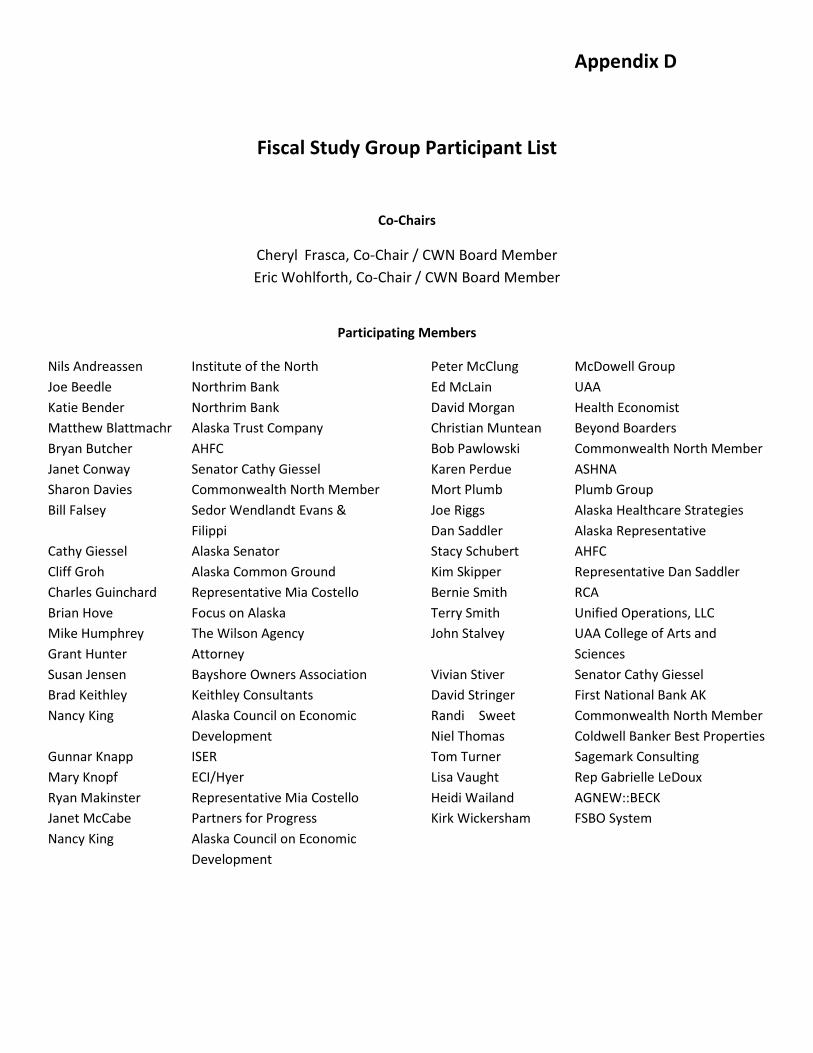
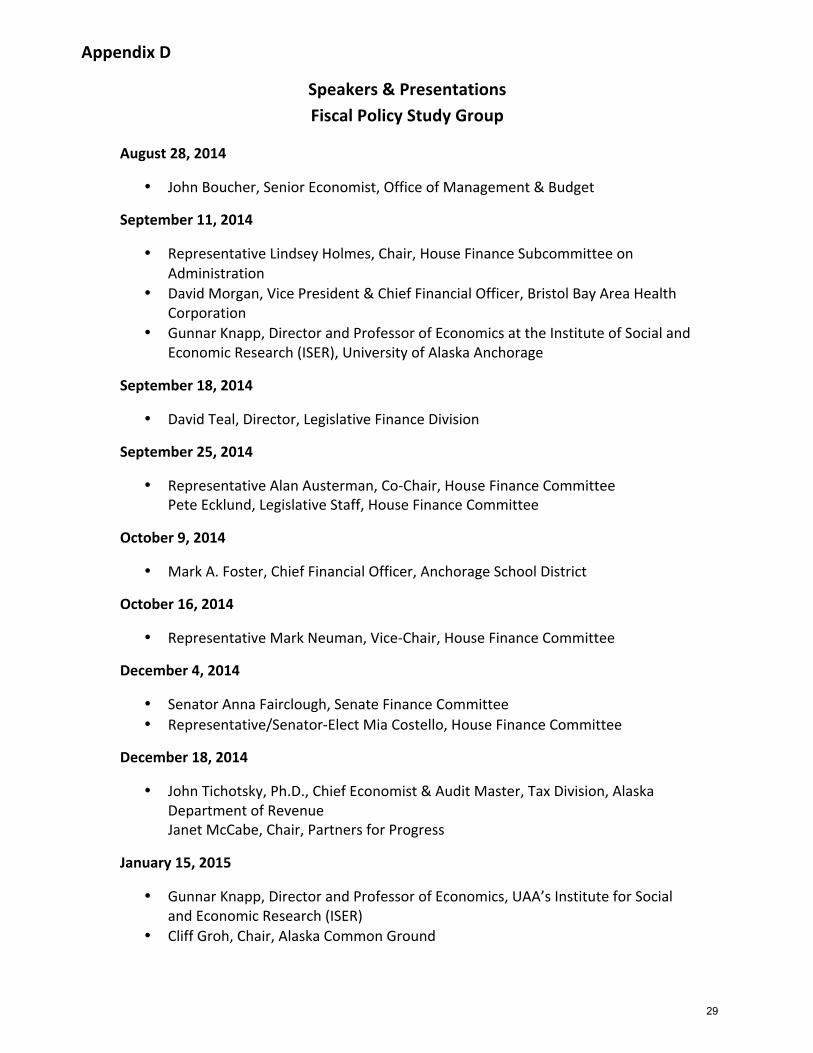
D Fiscal Policy Study Group Participants & Presentations ............ 28
E FY 15 Operating Budget Health Care Costs ............................... 30
F Key Provisions of State Employee Health Benefit Plans ............ 31
G Alaska Health Care Commission Core Strategies ....................... 32
H Bargaining Unit Monetary Terms .............................................. 34
I Personal Services Bargaining Unity Position Counts .................. 35
J FY 13 Medicaid Claim Activity ................................................... 37
K Fund Sources & Fund Groups .................................................... 39
L AS 37.04.014 Responsibilities of the Legislature ....................... 42
M HB 105 (1983) Operating Budget Structure ............................... 46
vii
State Operating Budget: Critical Crossroads, Choices, and Opportunities
Charts
Page
1 FY 15 Operating Budget – General Funds ................................... 4
2 FY 15 Revenue Sources ............................................................... 4
3 Oil Production Forecast Tested Against Actual 1989-‐2013 ........ 21
4 Oil Production Forecast Tested Against Actual 1989-‐2010 ........ 22
Tables
1 Impact of Taking Certain Funds/Spending “Off the Table” ......... 5
2 Health Care Costs – FY 15 Budget ............................................... 6
3 Summary of Selected Monetary Terms ....................................... 9
4 FY 15 Formula Programs ............................................................ 11
5 Historical Medicaid Expenditures .............................................. 12
6 Medicaid Costs ........................................................................... 13
7 Designated Reserves .................................................................. 14
1
State of Alaska Operating Budget: Critical Crossroads, Choices, and Opportunities
February 2015
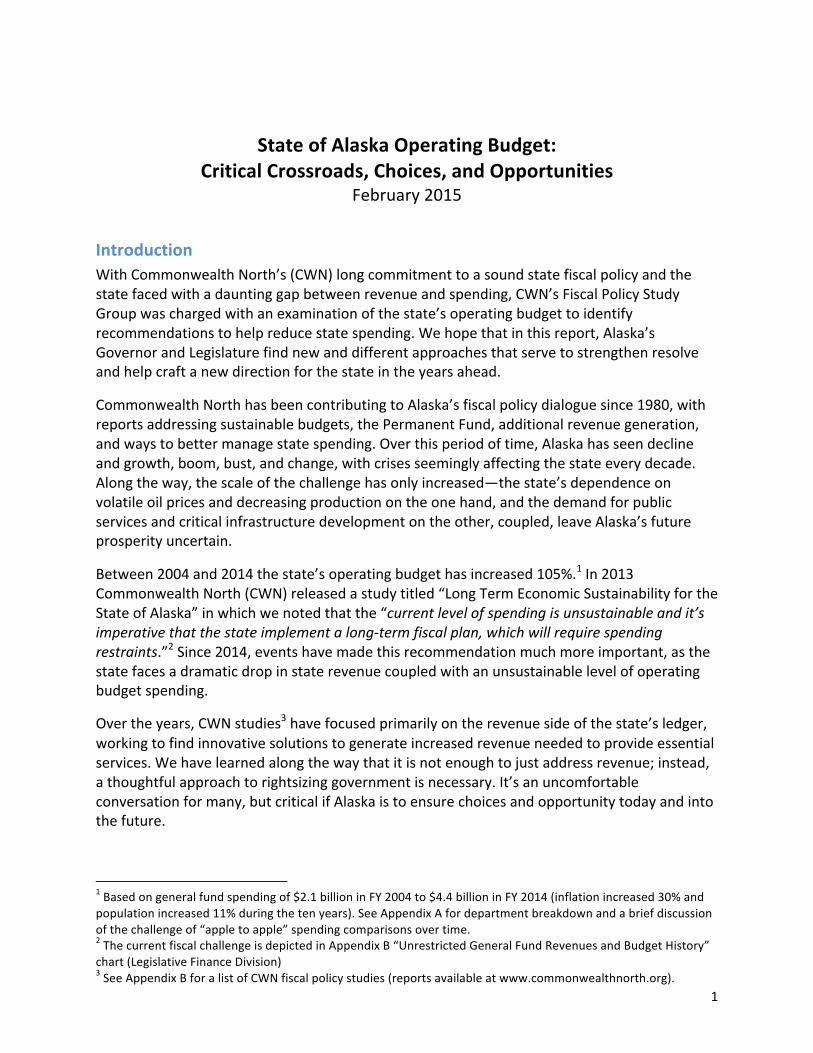
Introduction With Commonwealth North’s (CWN) long commitment to a sound state fiscal policy and the state faced with a daunting gap between revenue and spending, CWN’s Fiscal Policy Study Group was charged with an examination of the state’s operating budget to identify recommendations to help reduce state spending. We hope that in this report, Alaska’s Governor and Legislature find new and different approaches that serve to strengthen resolve and help craft a new direction for the state in the years ahead.
Commonwealth North has been contributing to Alaska’s fiscal policy dialogue since 1980, with reports addressing sustainable budgets, the Permanent Fund, additional revenue generation, and ways to better manage state spending. Over this period of time, Alaska has seen decline and growth, boom, bust, and change, with crises seemingly affecting the state every decade. Along the way, the scale of the challenge has only increased—the state’s dependence on volatile oil prices and decreasing production on the one hand, and the demand for public services and critical infrastructure development on the other, coupled, leave Alaska’s future prosperity uncertain.
Between 2004 and 2014 the state’s operating budget has increased 105%.1 In 2013 Commonwealth North (CWN) released a study titled “Long Term Economic Sustainability for the State of Alaska” in which we noted that the “current level of spending is unsustainable and it’s imperative that the state implement a long-‐term fiscal plan, which will require spending restraints.”2 Since 2014, events have made this recommendation much more important, as the state faces a dramatic drop in state revenue coupled with an unsustainable level of operating budget spending.
Over the years, CWN studies3 have focused primarily on the revenue side of the state’s ledger, working to find innovative solutions to generate increased revenue needed to provide essential services. We have learned along the way that it is not enough to just address revenue; instead, a thoughtful approach to rightsizing government is necessary. It’s an uncomfortable conversation for many, but critical if Alaska is to ensure choices and opportunity today and into the future.
1 Based on general fund spending of $2.1 billion in FY 2004 to $4.4 billion in FY 2014 (inflation increased 30% and population increased 11% during the ten years). See Appendix A for department breakdown and a brief discussion of the challenge of “apple to apple” spending comparisons over time. 2 The current fiscal challenge is depicted in Appendix B “Unrestricted General Fund Revenues and Budget History” chart (Legislative Finance Division) 3 See Appendix B for a list of CWN fiscal policy studies (reports available at www.commonwealthnorth.org).
2
We highlight “resolve” because the challenge is not as simple as manipulating spending scenarios on a spreadsheet. Resolve is necessary because state spending is directly tied to the people’s interest. It is rare that legislators hear advocacy against spending on a program or project. Yet pro-‐spending advocates are quite formidable. In the same manner, there few are calling for Alaskans to contribute to government revenue. Fingers point quickly elsewhere.
Commonwealth North understands this challenge—citizens are disconnected from the spending at the state level. Individual Alaskans don’t have “skin in the game.” If spending goes up, Alaskans don’t pay more in taxes; if spending is reduced, citizens don’t see the benefit. Compounding this challenge are general attitudes toward policymakers; legislators are highly regarded for the projects they fund in their districts and they also get the blame when services are diminished or eliminated. This results in a budget process Alaskans don’t perceive as relevant to their lives and a system that rewards elected officials for decisions that increase spending.
It is difficult in this context to make hard decisions, or to even begin to reconcile clashing interests. Indeed, the effort to do so results in a new critical crossroad for Alaska. Meeting these challenges will require leaders who can negotiate and compromise when necessary, and sacrifice in the short term for long-‐term prosperity. This crossroad will require difficult decision-‐making.
The Fiscal Policy Study Group began meeting in August 2014.4 At that time the State of Alaska had just begun a new fiscal year with a budget that required an average price of $105 per barrel of oil to fund it. Five months later the price of oil had plummeted and state revenue is estimated to be just half of what was expected when the Legislature adjourned in April 2014.
Alaska is teetering on what has been described as the state’s “fiscal cliff.” In most recent years, state revenue has been plentiful due to the high price of oil in spite of declining oil production. The last decade has seen a drop in oil production from 932,000 barrels per day in 2005 to 547,000 barrels in 2014. High oil prices masked the impact on the state treasury of declining oil production.
This Report—and corresponding recommendations—from the Study Group:
• Examines the major cost drivers of operating budget spending; • Reviews all revenue in order to identify funding available for highest priority services; • Scrutinizes program outcomes, and identifies inefficiencies and ineffectiveness; • Suggests changes to budget processes and practices, including program elimination; and • Engages Alaskans in meeting these challenges.
Commonwealth North recognizes that there are many approaches that can be used to reduce spending, including department consolidations, centralization of administrative-‐type services, and so on, which are not addressed in this Report. Also not found in this Report are recommendations for addressing revenue generation, nor ways to strengthen Alaska’s economy. These are for another day, though Commonwealth North recognizes the value of
4 Appendix D is a list of study group participants and speakers.
3
both. Commonwealth North’s Board of Directors believes that this crucial first step—rightsizing state spending—is a fundamental starting point for sustainable spending in the future, which will only be strengthened by stable and diverse revenue sources.
We commend the Governor for soliciting cost-‐saving ideas from Alaskans, and commend both the Administration and Legislature for rolling up their sleeves. Given the urgency of making critical decisions, we ask that the Governor and Legislature make the needed and recommended changes discussed in this Report over the next two years.
4
Background: About State Spending State spending primarily consists of two budgets:
• Capital that funds infrastructure and related projects that tend to be one-‐time in nature; and
• Operating that funds the day-‐to-‐day operations of state departments and their programs—from the State Troopers, to school districts, to vital statistics. These costs generally are reoccurring, which means these costs increase each year. The operating budget has increased 105% over the last ten years. For this reason CWN chose to examine the operating budget to better understand these reoccurring obligations.
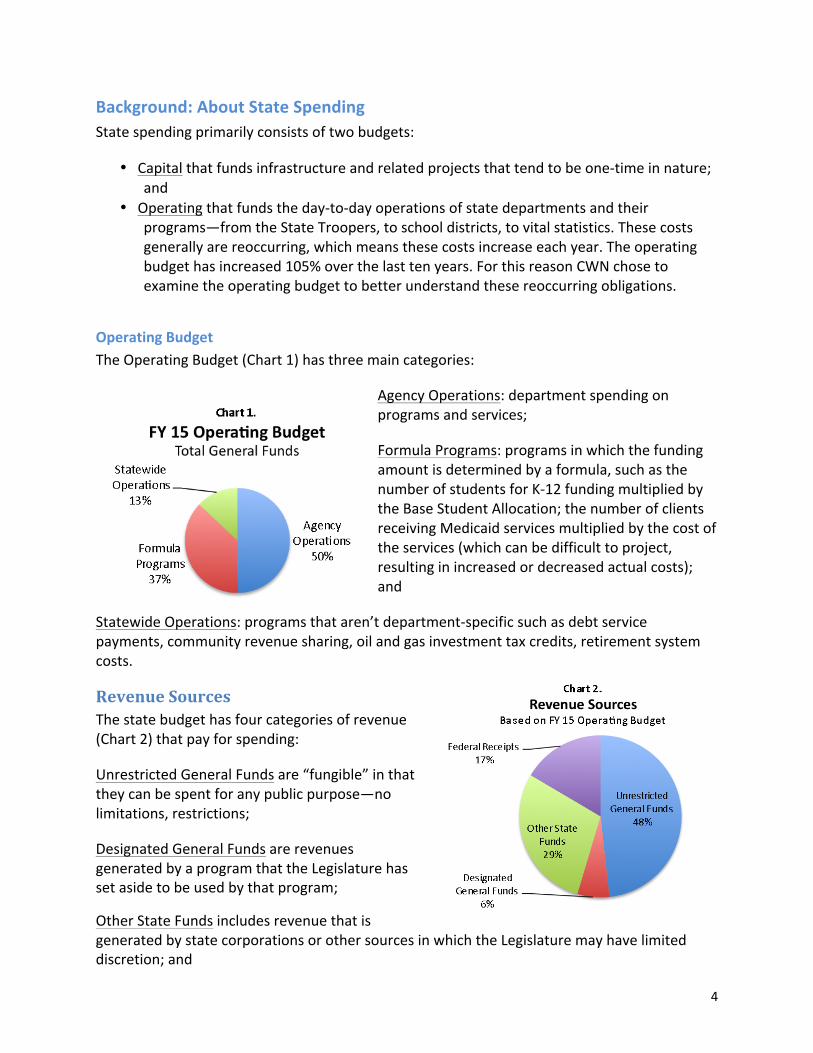
Operating Budget The Operating Budget (Chart 1) has three main categories:
Agency Operations: department spending on programs and services;
Formula Programs: programs in which the funding amount is determined by a formula, such as the number of students for K-‐12 funding multiplied by the Base Student Allocation; the number of clients receiving Medicaid services multiplied by the cost of the services (which can be difficult to project, resulting in increased or decreased actual costs); and
Statewide Operations: programs that aren’t department-‐specific such as debt service payments, community revenue sharing, oil and gas investment tax credits, retirement system costs.
Revenue Sources The state budget has four categories of revenue (Chart 2) that pay for spending:
Unrestricted General Funds are “fungible” in that they can be spent for any public purpose—no limitations, restrictions;
Designated General Funds are revenues generated by a program that the Legislature has set aside to be used by that program;
Other State Funds includes revenue that is generated by state corporations or other sources in which the Legislature may have limited discretion; and
5
Federal Receipts includes revenue from the Federal government that is limited in the purpose for which the funds can be used (e.g./, Medicaid funds, some education programs).
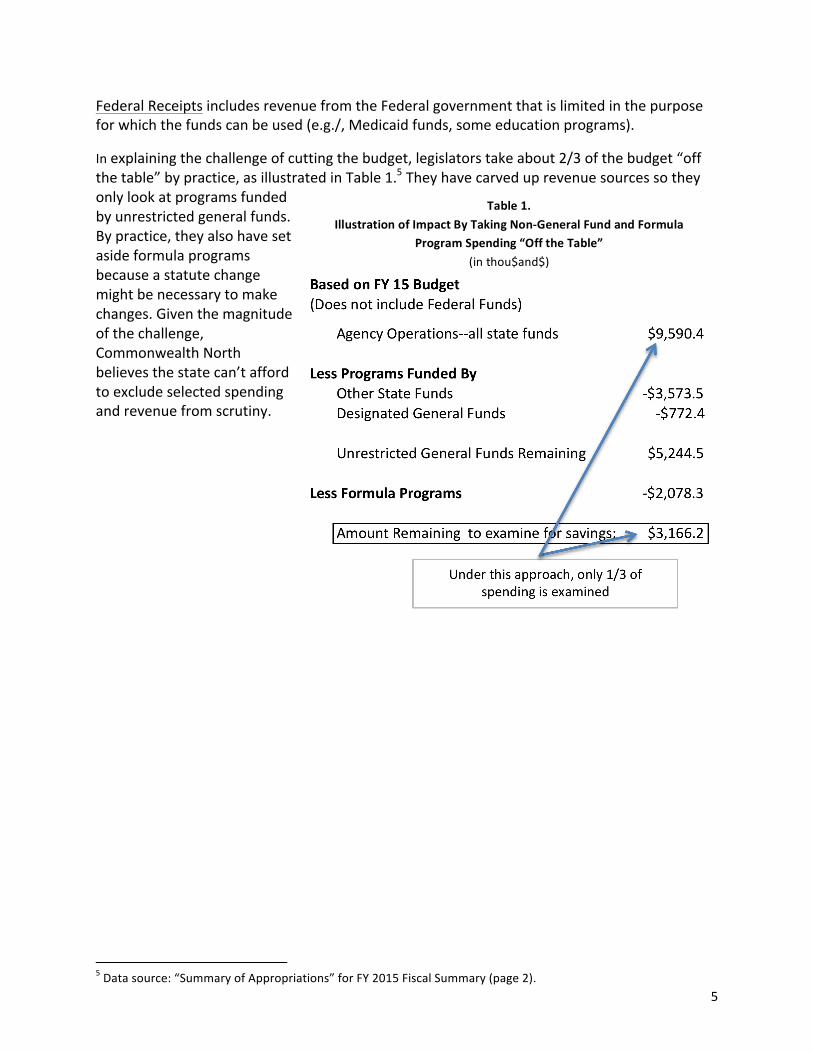
In explaining the challenge of cutting the budget, legislators take about 2/3 of the budget “off the table” by practice, as illustrated in Table 1.5 They have carved up revenue sources so they only look at programs funded by unrestricted general funds. By practice, they also have set aside formula programs because a statute change might be necessary to make changes. Given the magnitude of the challenge, Commonwealth North believes the state can’t afford to exclude selected spending and revenue from scrutiny.
5 Data source: “Summary of Appropriations” for FY 2015 Fiscal Summary (page 2).
Table 1.
Illustration of Impact By Taking Non-‐General Fund and Formula Program Spending “Off the Table”
(in thou$and$)
6
Operating Budget: Major Cost Drivers
Cost of Health Care The State of Alaska is a significant health care consumer. Alaska is one of the most expensive health care markets in the country and health care has been the primary driver of increased cost per state employee and retiree.
The Alaska Health Care Commission has undertaken analysis and identified steps to address this significant and growing cost, not only to the state’s budget but also to that of the private sector, local governments, and families. The Commission found:6
¥ Commercial health care premiums in Alaska are approximately 30% higher when compared to the average in comparable states;7
¥
¥
¥
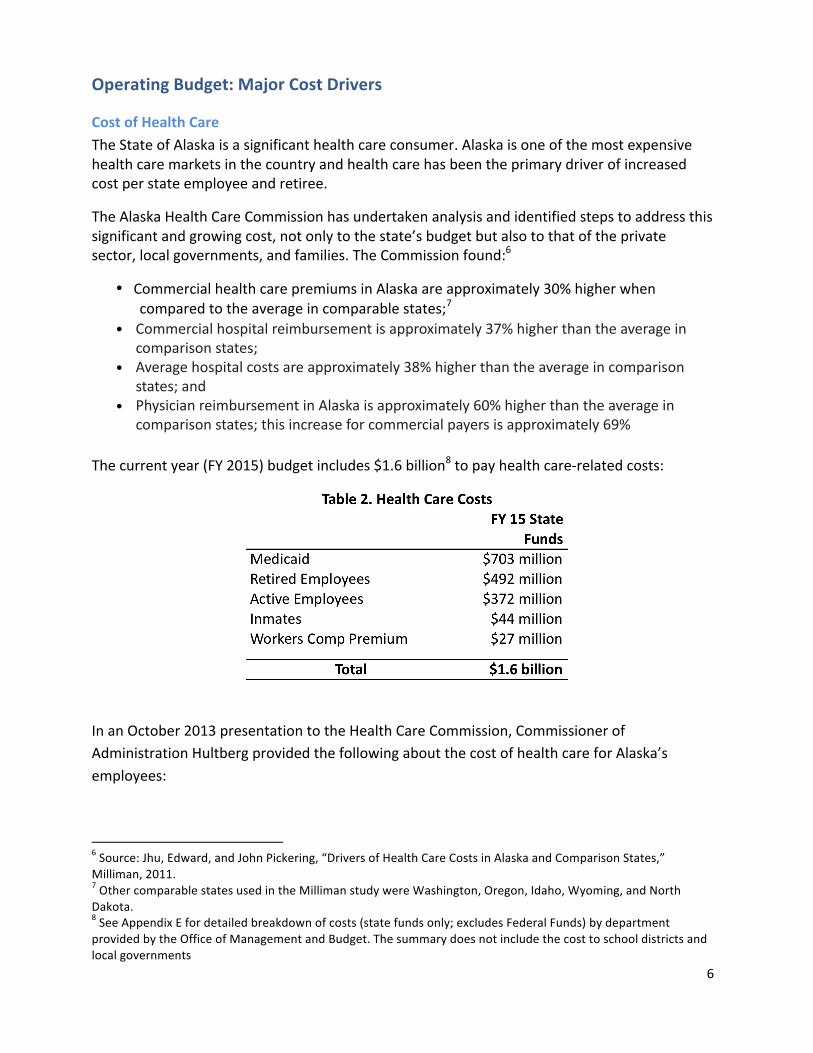
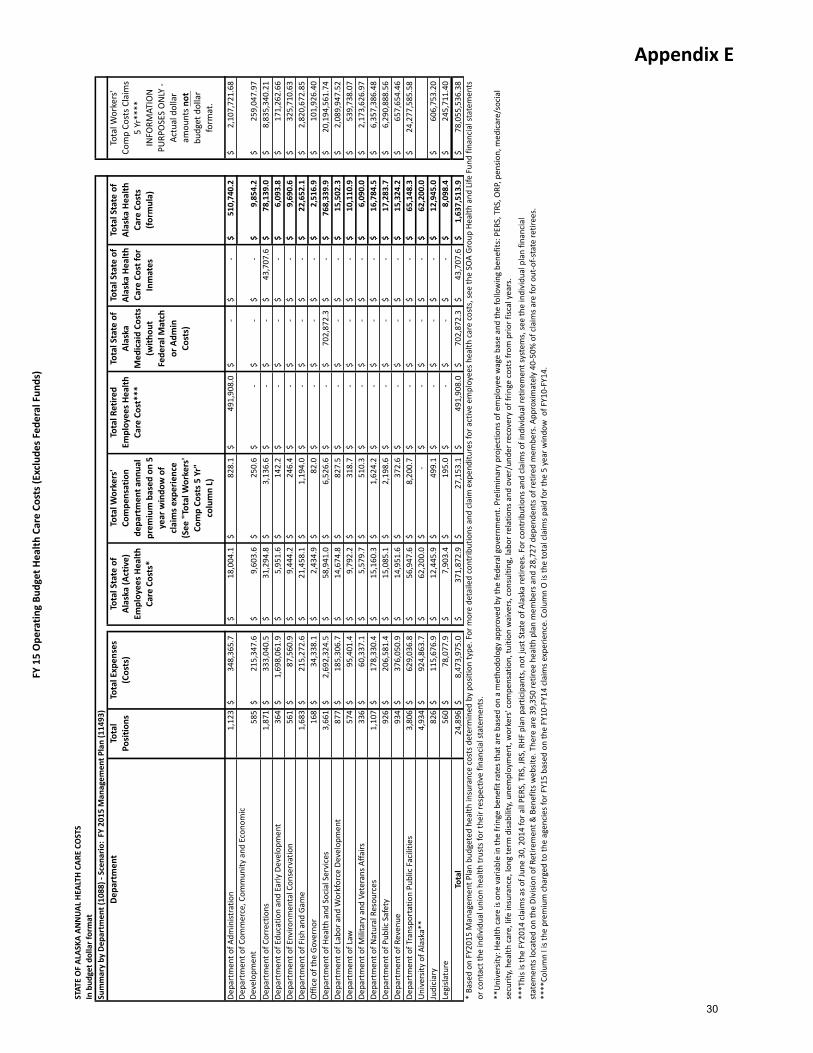
The current year (FY 2015) budget includes $1.6 billion8 to pay health care-‐related costs:
In an October 2013 presentation to the Health Care Commission, Commissioner of Administration Hultberg provided the following about the cost of health care for Alaska’s employees:
6 Source: Jhu, Edward, and John Pickering, “Drivers of Health Care Costs in Alaska and Comparison States,” Milliman, 2011. 7 Other comparable states used in the Milliman study were Washington, Oregon, Idaho, Wyoming, and North Dakota. 8 See Appendix E for detailed breakdown of costs (state funds only; excludes Federal Funds) by department provided by the Office of Management and Budget. The summary does not include the cost to school districts and local governments
Commercial hospital reimbursement is approximately 37% higher than the average in comparison states;Average hospital costs are approximately 38% higher than the average in comparison states; and Physician reimbursement in Alaska is approximately 60% higher than the average in comparison states; this increase for commercial payers is approximately 69%
Updated page 6.indd 1 2/24/2015 4:15:44 PM
7
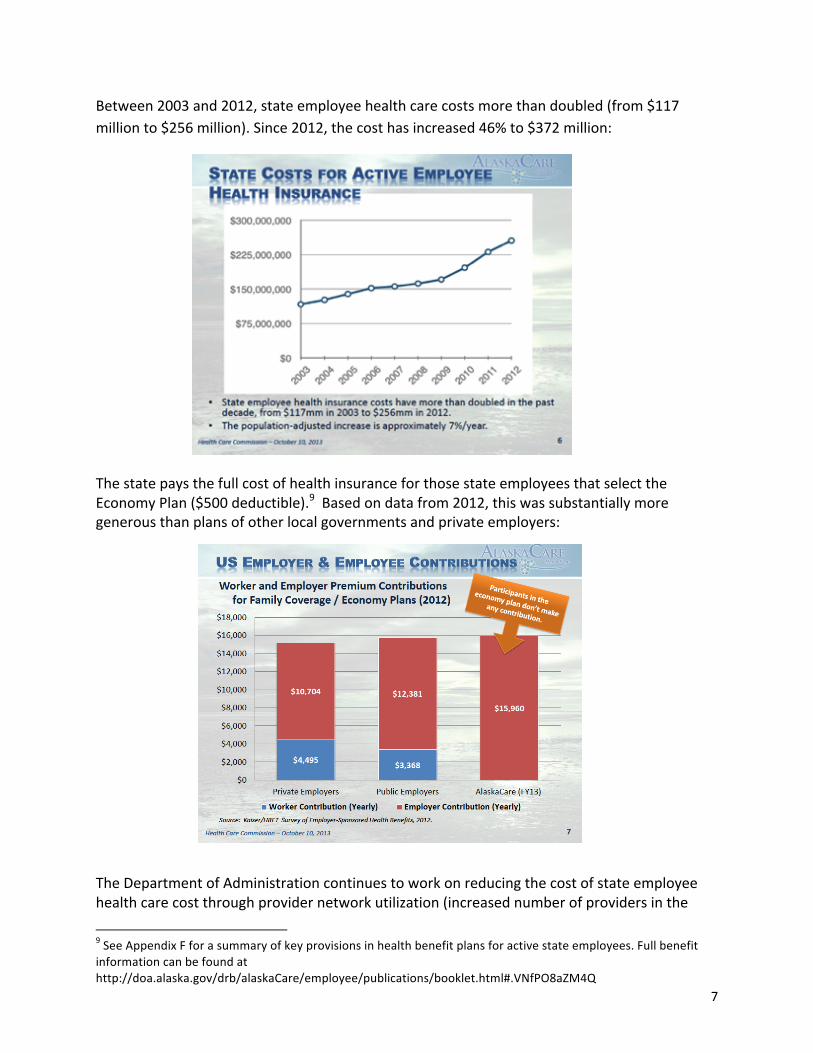
Between 2003 and 2012, state employee health care costs more than doubled (from $117 million to $256 million). Since 2012, the cost has increased 46% to $372 million:
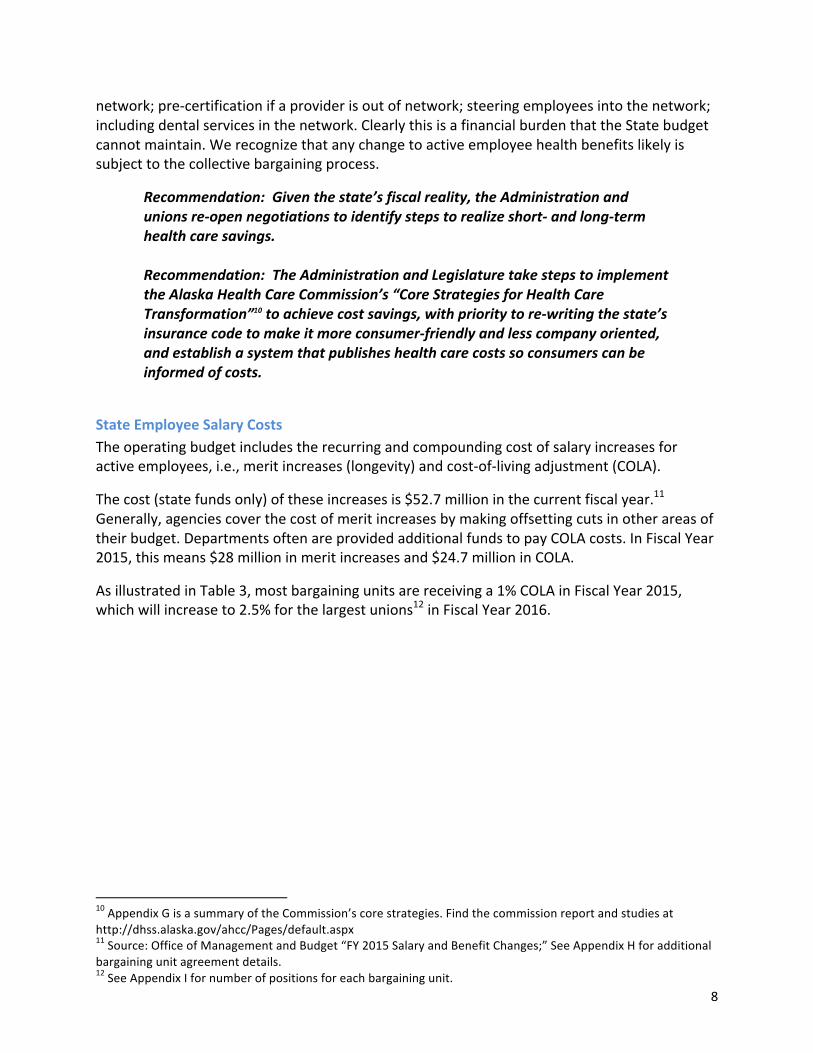
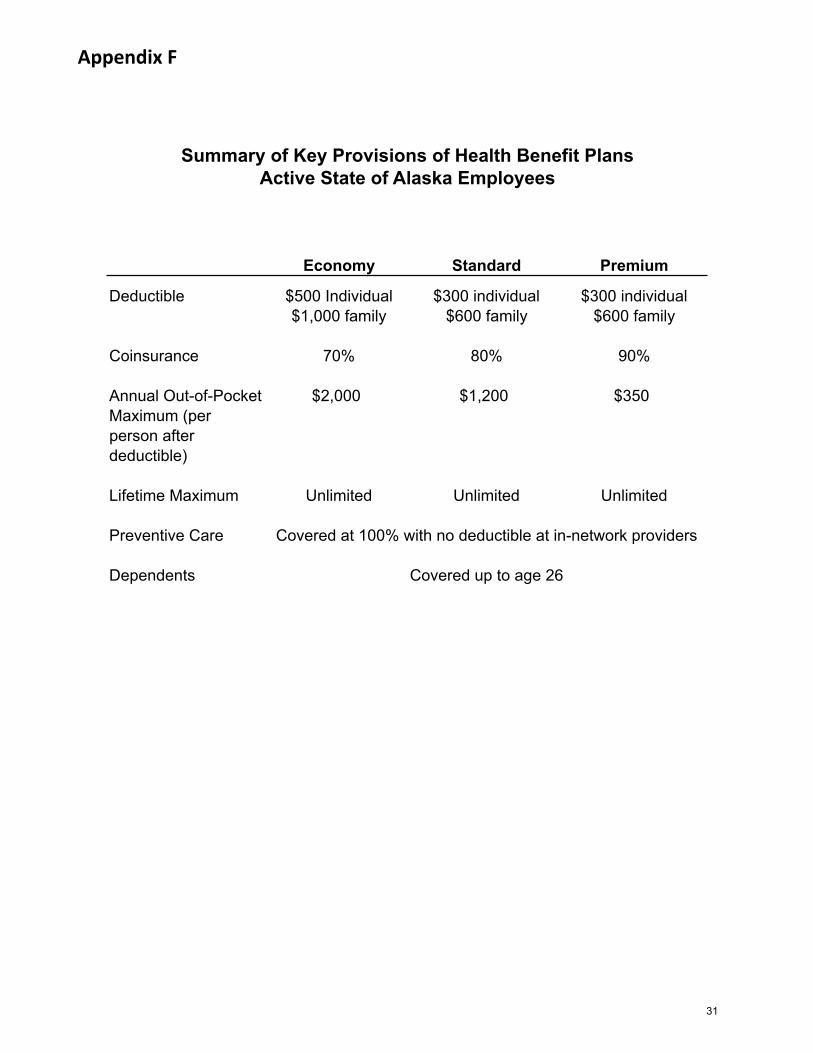
The state pays the full cost of health insurance for those state employees that select the Economy Plan ($500 deductible).9 Based on data from 2012, this was substantially more generous than plans of other local governments and private employers:
The Department of Administration continues to work on reducing the cost of state employee health care cost through provider network utilization (increased number of providers in the
9 See Appendix F for a summary of key provisions in health benefit plans for active state employees. Full benefit information can be found at http://doa.alaska.gov/drb/alaskaCare/employee/publications/booklet.html#.VNfPO8aZM4Q
8
network; pre-‐certification if a provider is out of network; steering employees into the network; including dental services in the network. Clearly this is a financial burden that the State budget cannot maintain. We recognize that any change to active employee health benefits likely is subject to the collective bargaining process.
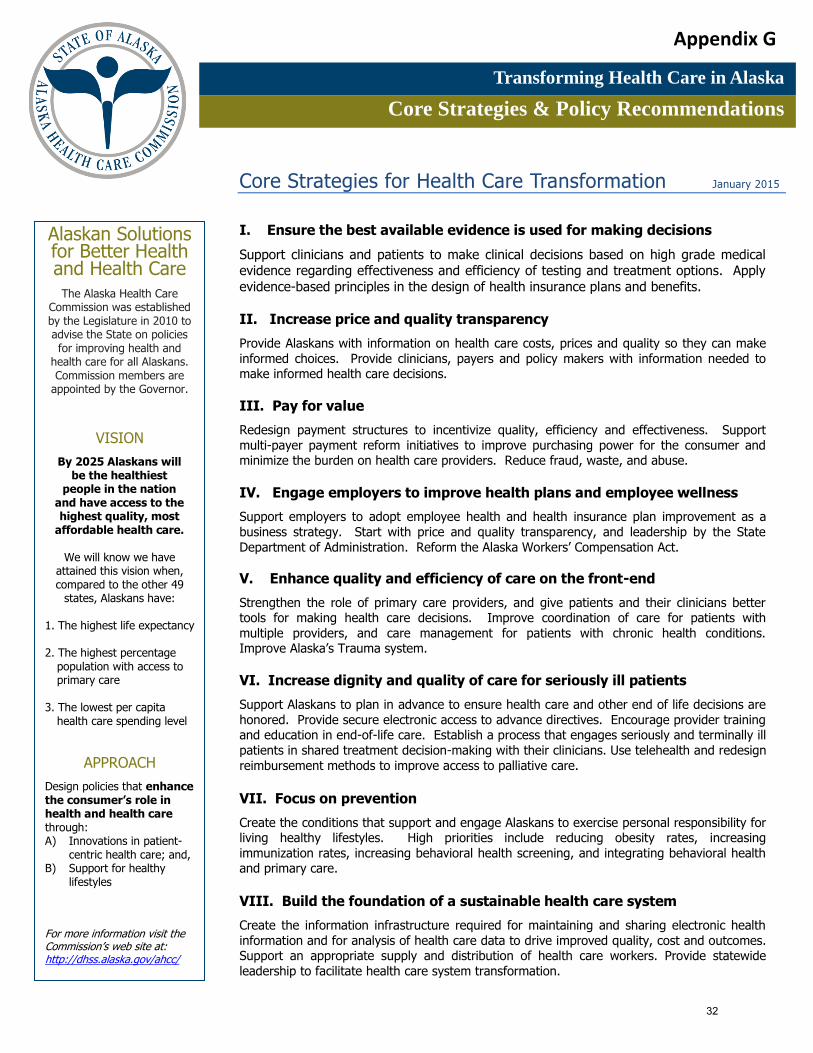
Recommendation: Given the state’s fiscal reality, the Administration and unions re-‐open negotiations to identify steps to realize short-‐ and long-‐term health care savings. Recommendation: The Administration and Legislature take steps to implement the Alaska Health Care Commission’s “Core Strategies for Health Care Transformation”10 to achieve cost savings, with priority to re-‐writing the state’s insurance code to make it more consumer-‐friendly and less company oriented, and establish a system that publishes health care costs so consumers can be informed of costs.
State Employee Salary Costs The operating budget includes the recurring and compounding cost of salary increases for active employees, i.e., merit increases (longevity) and cost-‐of-‐living adjustment (COLA).
The cost (state funds only) of these increases is $52.7 million in the current fiscal year.11 Generally, agencies cover the cost of merit increases by making offsetting cuts in other areas of their budget. Departments often are provided additional funds to pay COLA costs. In Fiscal Year 2015, this means $28 million in merit increases and $24.7 million in COLA.
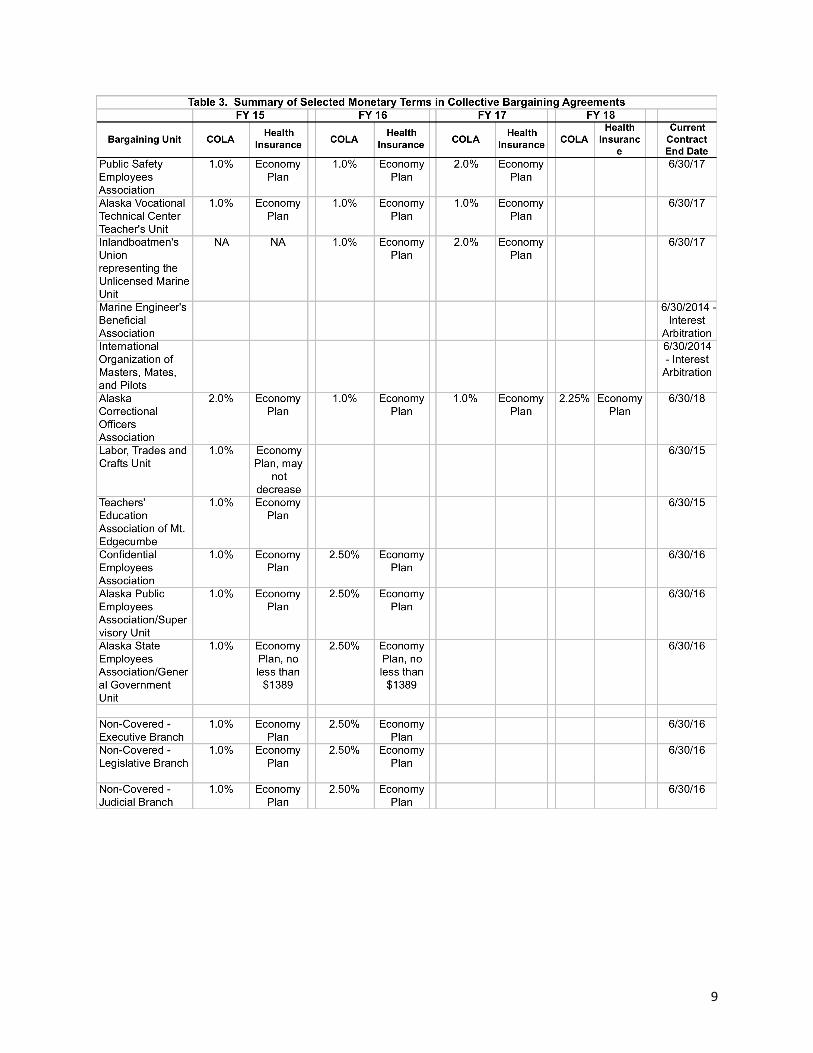
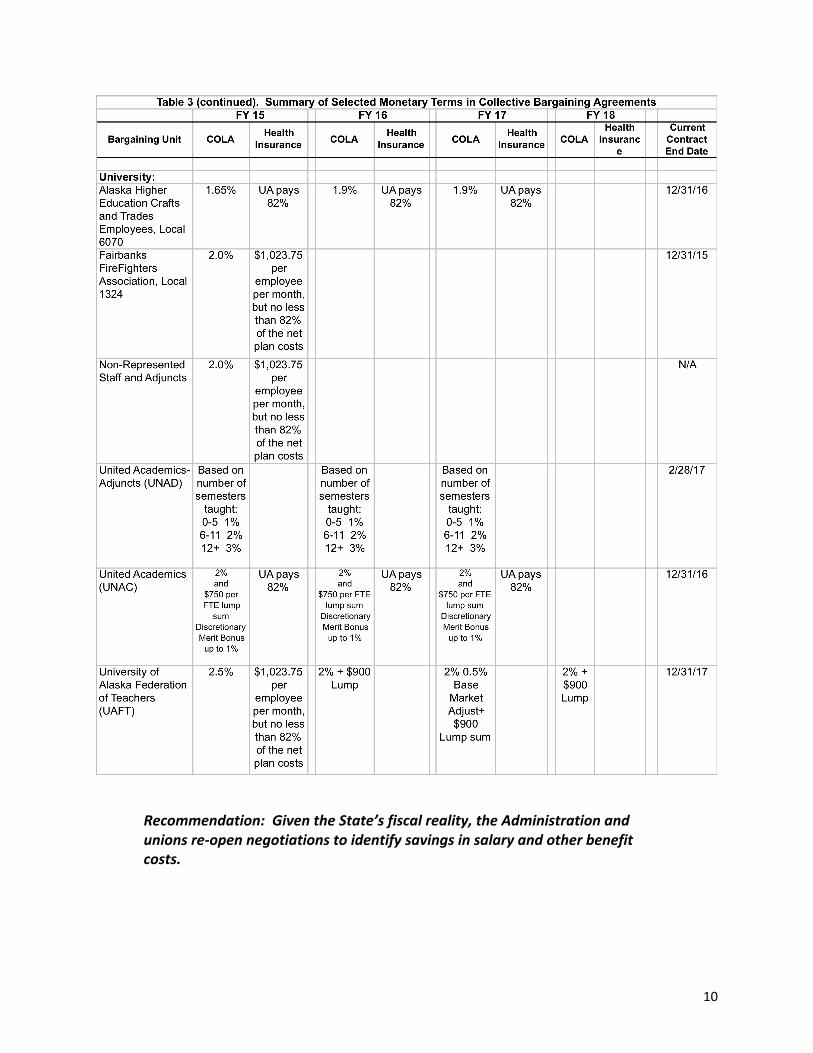
As illustrated in Table 3, most bargaining units are receiving a 1% COLA in Fiscal Year 2015, which will increase to 2.5% for the largest unions12 in Fiscal Year 2016.
10 Appendix G is a summary of the Commission’s core strategies. Find the commission report and studies at http://dhss.alaska.gov/ahcc/Pages/default.aspx 11 Source: Office of Management and Budget “FY 2015 Salary and Benefit Changes;” See Appendix H for additional bargaining unit agreement details. 12 See Appendix I for number of positions for each bargaining unit.
9
10
Recommendation: Given the State’s fiscal reality, the Administration and unions re-‐open negotiations to identify savings in salary and other benefit costs.
11
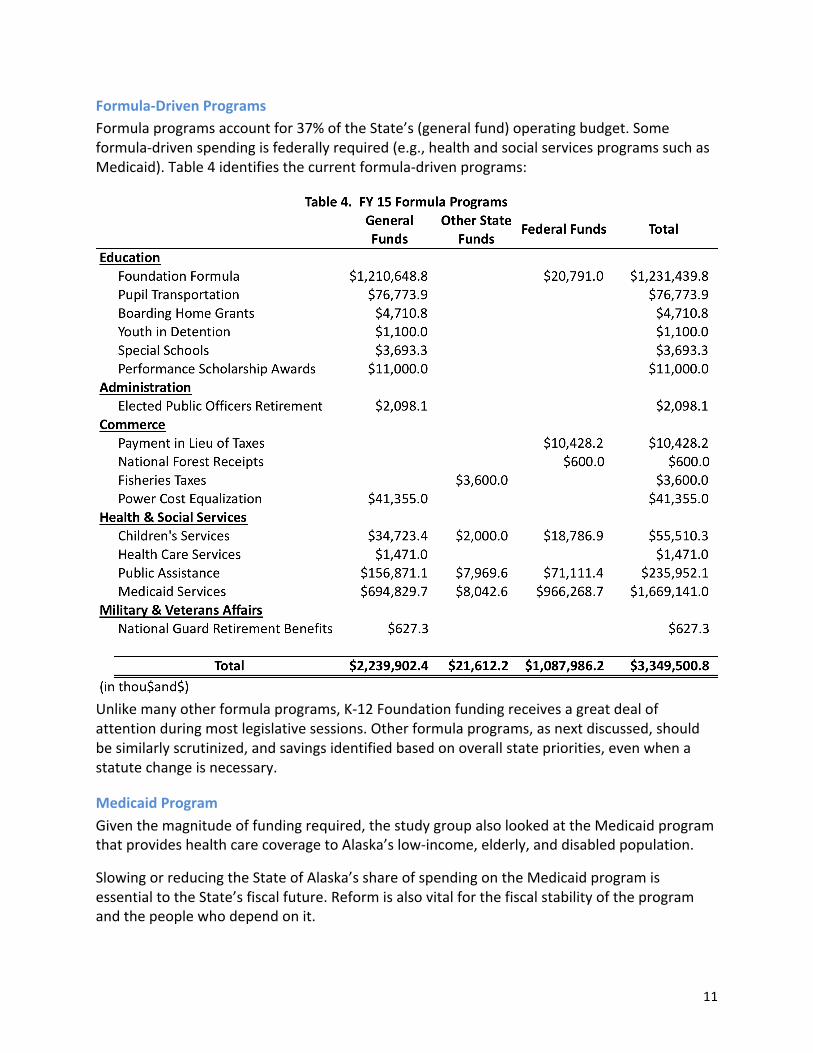
Formula-‐Driven Programs Formula programs account for 37% of the State’s (general fund) operating budget. Some formula-‐driven spending is federally required (e.g., health and social services programs such as Medicaid). Table 4 identifies the current formula-‐driven programs:
Unlike many other formula programs, K-‐12 Foundation funding receives a great deal of attention during most legislative sessions. Other formula programs, as next discussed, should be similarly scrutinized, and savings identified based on overall state priorities, even when a statute change is necessary.
Medicaid Program Given the magnitude of funding required, the study group also looked at the Medicaid program that provides health care coverage to Alaska’s low-‐income, elderly, and disabled population.
Slowing or reducing the State of Alaska’s share of spending on the Medicaid program is essential to the State’s fiscal future. Reform is also vital for the fiscal stability of the program and the people who depend on it.
12
Approximately 150,000 Alaskans depend on Medicaid for their health care coverage. Medicaid patients most often need more intensive health care services due to their health and socio-‐economic status.
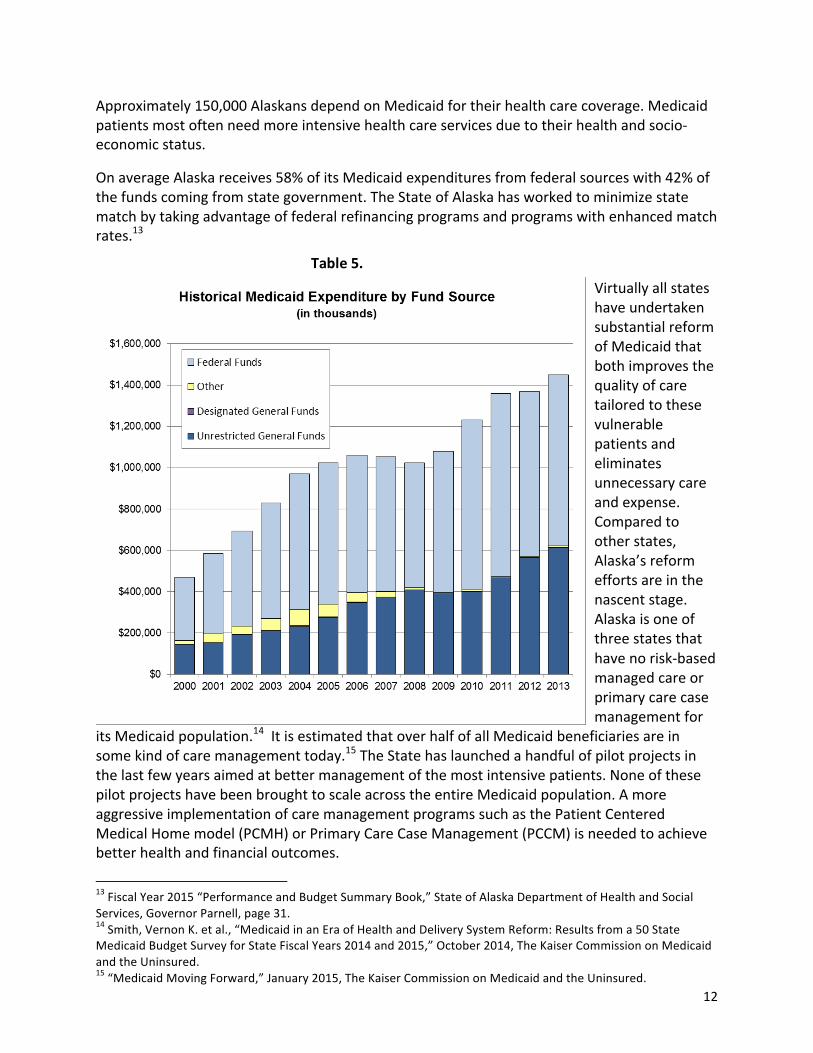
On average Alaska receives 58% of its Medicaid expenditures from federal sources with 42% of the funds coming from state government. The State of Alaska has worked to minimize state match by taking advantage of federal refinancing programs and programs with enhanced match rates.13
Virtually all states have undertaken substantial reform of Medicaid that both improves the quality of care tailored to these vulnerable patients and eliminates unnecessary care and expense. Compared to other states, Alaska’s reform efforts are in the nascent stage. Alaska is one of three states that have no risk-‐based managed care or primary care case management for
its Medicaid population.14 It is estimated that over half of all Medicaid beneficiaries are in some kind of care management today.15 The State has launched a handful of pilot projects in the last few years aimed at better management of the most intensive patients. None of these pilot projects have been brought to scale across the entire Medicaid population. A more aggressive implementation of care management programs such as the Patient Centered Medical Home model (PCMH) or Primary Care Case Management (PCCM) is needed to achieve better health and financial outcomes.
13 Fiscal Year 2015 “Performance and Budget Summary Book,” State of Alaska Department of Health and Social Services, Governor Parnell, page 31. 14 Smith, Vernon K. et al., “Medicaid in an Era of Health and Delivery System Reform: Results from a 50 State Medicaid Budget Survey for State Fiscal Years 2014 and 2015,” October 2014, The Kaiser Commission on Medicaid and the Uninsured. 15 “Medicaid Moving Forward,” January 2015, The Kaiser Commission on Medicaid and the Uninsured.
Table 5.
13
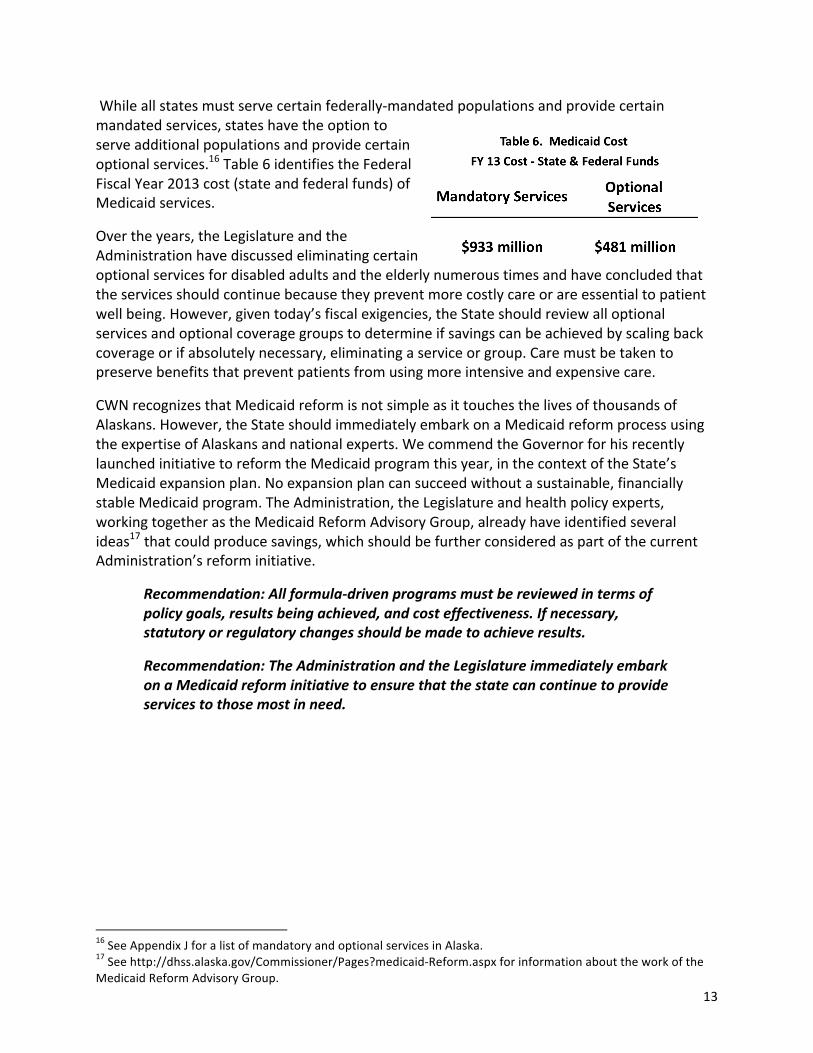
While all states must serve certain federally-‐mandated populations and provide certain mandated services, states have the option to serve additional populations and provide certain optional services.16 Table 6 identifies the Federal Fiscal Year 2013 cost (state and federal funds) of Medicaid services.
Over the years, the Legislature and the Administration have discussed eliminating certain optional services for disabled adults and the elderly numerous times and have concluded that the services should continue because they prevent more costly care or are essential to patient well being. However, given today’s fiscal exigencies, the State should review all optional services and optional coverage groups to determine if savings can be achieved by scaling back coverage or if absolutely necessary, eliminating a service or group. Care must be taken to preserve benefits that prevent patients from using more intensive and expensive care.
CWN recognizes that Medicaid reform is not simple as it touches the lives of thousands of Alaskans. However, the State should immediately embark on a Medicaid reform process using the expertise of Alaskans and national experts. We commend the Governor for his recently launched initiative to reform the Medicaid program this year, in the context of the State’s Medicaid expansion plan. No expansion plan can succeed without a sustainable, financially stable Medicaid program. The Administration, the Legislature and health policy experts, working together as the Medicaid Reform Advisory Group, already have identified several ideas17 that could produce savings, which should be further considered as part of the current Administration’s reform initiative.
Recommendation: All formula-‐driven programs must be reviewed in terms of policy goals, results being achieved, and cost effectiveness. If necessary, statutory or regulatory changes should be made to achieve results.
Recommendation: The Administration and the Legislature immediately embark on a Medicaid reform initiative to ensure that the state can continue to provide services to those most in need.
16 See Appendix J for a list of mandatory and optional services in Alaska. 17 See http://dhss.alaska.gov/Commissioner/Pages?medicaid-‐Reform.aspx for information about the work of the Medicaid Reform Advisory Group.
14
Revenue Earmarks Designated Fund Sources
“Fences” have been built around two categories of budget revenue: “designated general funds” and “other state funds.” These fences limit how these revenues can be spent and are Alaska’s version of revenue “earmarks.” This is especially true for “designated general funds,” which includes revenue such as park fees, occupational licensing fees, Marine Highway fares, revolving loan payments, and University tuition. The Legislature tends to have less latitude in spending “other state funds,” which includes revenue generated by activities of state corporations (e.g., Permanent Fund, Alaska Housing Finance) and revenue that needs to be segregated for other legal reasons or obligations.
There are 49 different “designated general fund” accounts and 53 “other state fund” accounts.18 By practice, the Legislature has not scrutinized programs funded by these sources as those that are funded by the unrestricted general funds. The practical result is that programs such as the State Troopers (funded by unrestricted general funds) get more scrutiny than the budgets for occupational licensing boards because these boards “pay their own way” (with designated funds).
Alaska can no longer afford this practice of earmarking revenue, which limits access to funding by high priority state responsibilities. There would be an additional $772 million in the general fund if these earmarks were eliminated.
Recommendation: The Governor appoint, with legislative approval, a committee of experts to analyze, within a short period of time, what designated revenue accounts have no legal restriction on use and can be appropriated to the general fund, including any statutory changes that will be necessary.
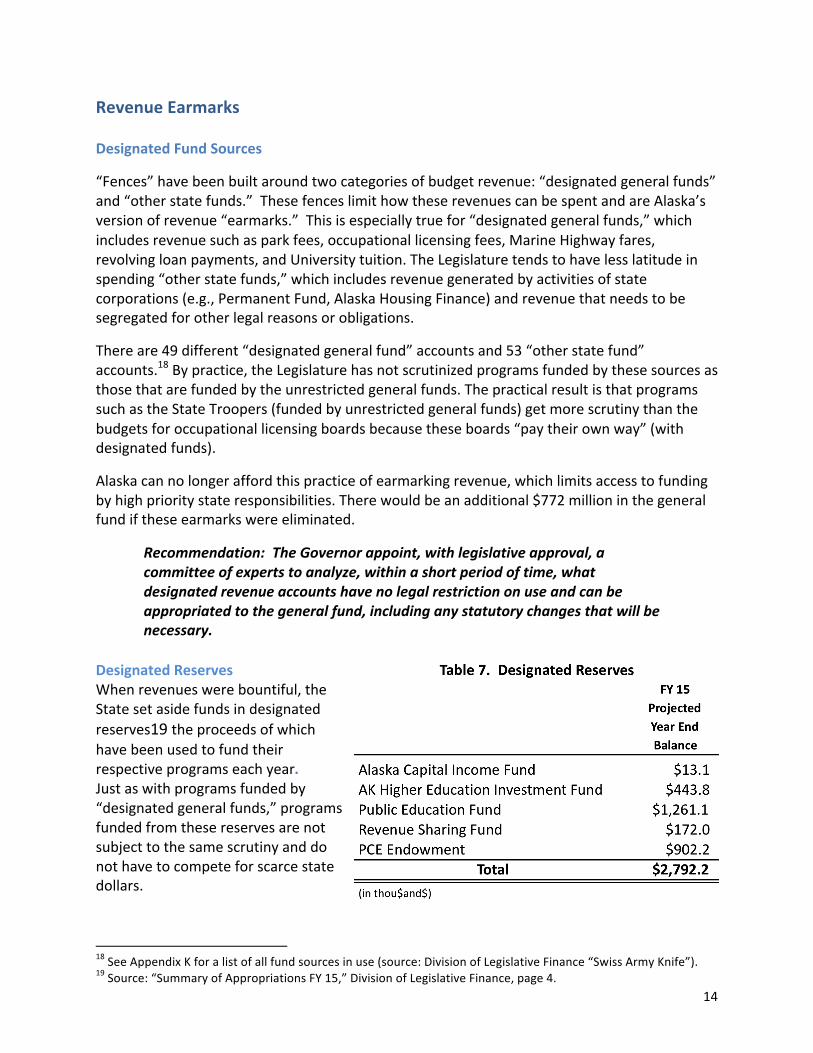
Designated Reserves When revenues were bountiful, the State set aside funds in designated reserves19 the proceeds of which have been used to fund their respective programs each year. Just as with programs funded by “designated general funds,” programs funded from these reserves are not subject to the same scrutiny and do not have to compete for scarce state dollars.
18 See Appendix K for a list of all fund sources in use (source: Division of Legislative Finance “Swiss Army Knife”). 19 Source: “Summary of Appropriations FY 15,” Division of Legislative Finance, page 4.
15
In light of the unrestricted general fund shortfall, Alaska no longer can afford to have these set-‐asides. The Legislature should amend state statutes and appropriate these reserves to the general fund.
Recommendation: The Legislature appropriate designated reserve balances to the general fund so these funds are available to fund priority State services.
Focus on Results, Not How Much to Spend
Alaska’s budget decision-‐makers typically focus on the incremental change (both increases and decreases) in spending from one year to the next instead of examining the full budget, or base budget. The result is that the base continues from year to year with minimal scrutiny.
Determine Appropriate State Services Given the systemic nature of this current budget challenge decision-‐makers need to dramatically shift their attention to evaluating the effectiveness of state programs and the cost associated with getting those results.
Recommendation: The Administration and Legislature undertakes a review of state services to evaluate the following:
• Based on constitutional responsibilities, is a program a service the State is required to do;
• If it is appropriate, analyze the results the program is getting—how effective is it in achieving its intended purpose;
• Examine the cost to deliver current results—what’s the “return on investment” in terms of cost compared to results/effectiveness;
• Evaluate if the State is the only entity that can provide the service or if it would be more cost effective and responsive if the services were contracted out or shed through privatization; and/or
• If it is not a State responsibility, stop providing the service.
The answers to these questions will inform budget decision-‐makers and identify ineffective and/or cost-‐prohibitive programs for elimination.
Fund Effective Programs State law (Executive Budget Act AS 37.07.014)20requires that the Legislature review state programs based on performance, which it has done somewhat in the past. The House Finance Committee is diligently working to include this information as part of the work of its subcommittees. Some departments, such as the Department of Health and Social Services, has made significant progress in providing performance-‐focused information as part of its budget presentations.
20 Find AS 37.07.014 as Appendix L.
16
While performance-‐based frameworks for many of the other state agencies currently exist,21 many still need additional work to ensure they include meaningful performance measures linked to program costs. It also will be important for the Legislature to review the frameworks to ensure the performance measures programs and reflect results that Alaskans value and are not selective information by program advocates.
We commend the steps the Legislature has taken to acquire results-‐based information. Recent efforts include:
• In-‐depth performance reviews of departments (ch 19 SLA 13), sponsored by Rep. Mike Chenault, now are required. The Department of Corrections was the first review completed in December 2014 and we look forward to learning how the study informs the Legislature and Administration’s discussions/decision-‐making. The law prescribes that one department be reviewed each year;
Recommendation: The Legislature increase the number of in-‐depth performance reviews conducted to more than one department per year so increased information is available to identify potential savings.
• Periodic review of expenditures such as tax credits (ch 61 SLA 14) by Rep. Steve Thompson provides the Legislature with a tool to evaluate the effectiveness of these expenditures in achieving public policy goals (i.e., results).
We believe that the 90-‐day session limits the ability for legislators to undertake the level of examination to ensure meaningful performance information is in place to inform its decision-‐making. We would like to acknowledge that some Finance subcommittees have worked extensively during the interim with their assigned department and believe this should be an expectation of Finance Committee membership.
Recommendations:
• The Legislature undertake an in-‐depth review of performance frameworks and measures during the interim;
• The Legislature integrate use of program performance measures into its budget review to ensure public dollars are spent on effective services; and
• The Legislature engage citizens in this review process, which will provide legislators and the Administration with differing perspectives and advance citizen understanding of state services.
Performance frameworks are an important tool for departments to effectively manage
21 See http://omb.alaska.gov/html/performance/department-key-indicators.html. Some departments are making progress in developing frameworks that strategically align programs with goals and identification of corresponding performance measures.
17
programs and resources. Most importantly, performance-‐based data will also inform the Governor’s budget and management decision-‐making.
Another tool available to assist in review of the State’s roles and responsibilities is a comprehensive management review of state services and methods of delivery. Governor Hammond created a citizen-‐led Blue Ribbon Commission that reviewed state services; Governor Hickel used an in-‐house team to examine state programs and operations.
Recommendation: The Governor appoint a citizen-‐led commission to conduct a management review of state operations that engages the departments and citizens to identify savings and opportunities to improve service delivery.
An important part to such a review process will be an opportunity for Alaskans to comment on recommendations. The study group also realizes that implementation of recommendations from such a review can be expected to meet with tremendous resistance, irrespective of citizen engagement.
Given the seriousness of the challenge that needs to be met, the Governor and Legislature may need alternate strategies to implement recommendations. One such process could be the voting mechanism Congress uses to approve or reject the Base Realignment and Closure (BRAC) recommendations. The Federal process involves a panel that makes recommendations to the President who can approve or make changes. The list is sent to Congress, which has 45 days to enact a resolution of disapproval. If Congress fails to pass a resolution, the recommendations become final.
Recommendation: Put in place an approval process, such as that used by Congress in the Base Realignment and Closure (BRAC) decision-‐making, to increase the likelihood that comprehensive reforms will be enacted.
Engage Alaskans in Meeting the Challenge
To responsibly address the State’s fiscal choices, it will be important that Alaskans also understand the fiscal challenge facing the state. For over 25 years Alaskans have periodically heard about the imminent “fiscal cliff” but events have always intervened that re-‐routed the state from falling. There’s good reason for citizens to be skeptical of the problem and therefore, unwilling to accept solutions.
Statewide Dialogue For these reasons Alaskans need to be engaged in a different type of discussion about the challenge and then, based on their understanding, have an opportunity to provide constructive input to political leaders on what steps they believe the state should take. If such an opportunity is provided, we believe Alaskans will be more willing to provide the “political permission” many elected officials may need to make the politically difficult budget decisions.
Unlike most approaches to public testimony and participation, a dialogue is not about winning the argument or changing someone’s mind. Instead, a dialogue provides participants with an opportunity to constructively discuss options with their neighbors and friends; weigh the
18
choices; and offer recommendations on the choices and trade-‐offs they would be willing to make. It enables common ground to be identified, which can assist elected officials in making decisions that are based on the values of local communities. Such a process increases participants’ understanding of the challenge our leaders are facing.
Recommendation: The Governor and Legislature22 engage Alaskans in a series of dialogues in which they discuss the state’s future; the responsibilities of the state and individual Alaskans in that future; and how achieving that vision will be funded.
Clear, Balanced Information is Critical Important to good policy decision-‐making are informed citizens. Effective communication of balanced, objective information is integral but is a challenge in this era of political gamesmanship that are immediately tweeted, posted, etc. Irrespective, CWN believes it is extremely important to convey budget information at a “consumer level.”
We appreciate the House’s efforts (through www.AlaskaBudget.com) to provide objective budget information and encourage increased efforts to drive Alaskans to the website. We also appreciate the work that the Legislature’s Division of Legislative Finance does, especially its overview of the Governor’s proposed budget (but unfortunately its primary focus is on incremental changes). The Department of Revenue’s Revenue Forecast has come a long way over the years in presenting information so it is more “consumer friendly.”
Commonwealth North has a longstanding history of addressing the fiscal policy needs of the state, and we have identified a number of organizations with similar concerns. These include the three-‐legged stool campaign by First National Bank Alaska; the Alaskanomics blog by Northrim Bank; ISER supported works; Alaska Common Ground’s continued efforts; and Commonwealth North’s historical and current efforts.
Recommendation: Develop a plan for a multiyear approach to communicate critical operating budget issues in cooperation with other public and private organizations. Such efforts must identify general “consumer level” messaging that attracts public interest in Alaska’s budget and the challenges we face. It is critical to engage the public with social media-‐sized bites of information that drive clicks to detail, and that helps to enhance an understanding of the needs and vision of the state.
Among the tools discussed to advance Alaskans understanding of the challenges is an easy-‐to-‐use spreadsheet that allows a user to input adjustments to budget items to see the effect on other budget items.
CWN also encourages a review of past efforts to engage the public in drafting Alaska’s fiscal future. A new effort to inform Alaskans on our fiscal challenges needs to treat Alaskans like stakeholders in the future of our State.
22 It is important that the Governor and Legislature both sponsor the dialogues so that Alaskans will believe it is worth their time to participate because the state’s leaders are listening to what they have to say.
19
Changes to Budget Processes and Practices The following are recommendations on steps that we believe will improve some current budget practices.
Citizen Input into Governor’s Budget During development of a Governor’s proposed budget, the primary source of input is state departments, who are very effective members of the “spending lobby.” CWN believes there would be value for the Governor to also solicit other points of view from citizens prior to submission of the budget to the Legislature.
Recommendation: The Governor establishes citizen advisory panels to provide input during development of the Governor’s proposed budget.23
Move Up Governor’s Budget Submission Currently the Governor is required by law to submit the proposed budget to the Legislature by December 15th of each year. Given the budget challenges and limited session length, we believe it is important that the Legislature have additional time to scrutinize state spending and program results.
Recommendation: Require the Governor to submit the proposed budget to the Legislature by November 15th each year24 to enable the Legislature to get an earlier start to its review.
This change also will require the Department of Revenue to move up release of its revenue forecast so as to inform budget decision-‐makers.
Establish Revenue Limit As evidenced by this legislative session’s focus, one of the most effective restraints on spending is the lack of revenue. While we commend past efforts to save surplus revenue in reserve accounts, ironically its availability can undermine the political will to make sustainable reductions.
Recommendation: Limit the amount of savings that can be spent in any one fiscal year to ensure prudent use and extend availability.
In other words, decide what you can afford to spend up-‐front and base a budget on it. Maximum Flexibility to Identify/Implement Savings Given the magnitude of the budget challenge, a significant challenge in the 2015 legislative session is the time the Legislature has to evaluate the budget proposed by the Governor. An
23 Oregon has “Citizen Program Funding Teams” that advise the Governor on budget priorities, rank programs in terms of priorities, and recommend funding levels. It is re-thinking this role for citizens because the initial task delegated an overwhelming responsibility to citizen volunteers in trying to understand complex programs. The thinking is to have citizens advise later in the process in order to limit the commitment of time and effort required for them to participate in the process. Of note is that State agencies were concerned that they would still have the opportunity to justify their budget to the Governor after the citizen groups made their recommendations.
24 An accommodation should be made in budget submission timeframe when a new governor is elected.
20
even more significant challenge has been the timeframe in which Alaska’s newly elected Governor had to evaluate and propose a budget that is responsive to the State’s dramatic revenue shortfall.
Recognizing the unusual nature of the challenge and timeframes, CWN recommends that the Legislature take an unusual step of structuring25 the operating budget so that the Administration has maximum flexibility to have more time to evaluate and implement changes that will result in significant savings.
Two options that could provide this type of flexibility are:
• Make one reduced-‐level appropriation to the Executive Branch that is allocated to each department26, and one appropriation to the Judiciary and to the Legislative branches. For the Executive Branch, this would give maximum latitude to move funds within and between departments, as savings are identified; or
• Make one reduced-‐level appropriation to each department, the Judiciary, Legislature, and University.27 While this does not provide as much flexibility as the first option, it would still provide more latitude than the more typical appropriation/allocation structure.
We recognize this type of extraordinary step infringes on the Legislature’s fundamental responsibility, the power of appropriation. The Legislature also could include a “report back” mechanism in a broadly structured appropriations bill that only provides seven months funding (instead of the full fiscal year) for state operations. This mechanism would require the Administration to report to the Legislature next session on the changes made and/or proposed to achieve required savings. The Legislature then would be in a position to approve the changes and final five months of funding.
Recommendation: The Legislature approves an FY 16 operating budget that provides approximately seven months of funding and is structured to provide maximum flexibility to the Administration to identify and implement program savings during the fiscal year. This extraordinary approach would include a mechanism by which the Administration would report back to the Legislature next legislative session on implemented and proposed program changes and funding required for the balance of the fiscal year.
25 The importance of the level of “appropriation” is that a department does not have the authority to move money between appropriations (only the Legislature has this power to set appropriation levels). Within an appropriation, the Legislature “allocates” funds to different purposes; departments can move funds between allocations. 26 For years the University of Alaska’s budget has been structured with one appropriation, which gives flexibility to the Board of Regents to make changes during the fiscal year in the amount allocated among campuses and programs. 27 In 1983 the Governor proposed a department-‐level appropriations structure bill for the operating and capital budgets (HB 105; see Appendix M); final budget bill ultimately approved by the Legislature returned to the traditional appropriations structure that limited management flexibility.
21
Establish Joint Ways and Means Committee28 We also recommend that the Legislature create a Joint Ways and Means Committee to bring focus to the revenue side of the Legislature’s budget decision-‐making. We recommend that the joint committee recommend, and the Legislature approve by resolution, the amount of State revenue on which the Legislature will base the following fiscal year’s budget.
Recommendation: Establish a Joint Ways and Means Committee tasked with introduction of a resolution at the start of each session that establishes the overall amount of revenue that will be available for the following fiscal year’s budget, including the amount that will come from savings. The Legislature then takes action on such a resolution within the first two weeks of the session.
Earlier release of the fall revenue forecast will enable the Joint Ways and Means Committee to start meeting in November in order to prepare a resolution for introduction at the start of the Legislative session.
Revenue Forecasting Reliability Given the importance of oil production to the State budget, the study group reviewed the reliability of Alaska North Slope oil production forecasts as presented in the Alaska Department of Revenue’s (ADOR) Fall Revenue Sources Books.
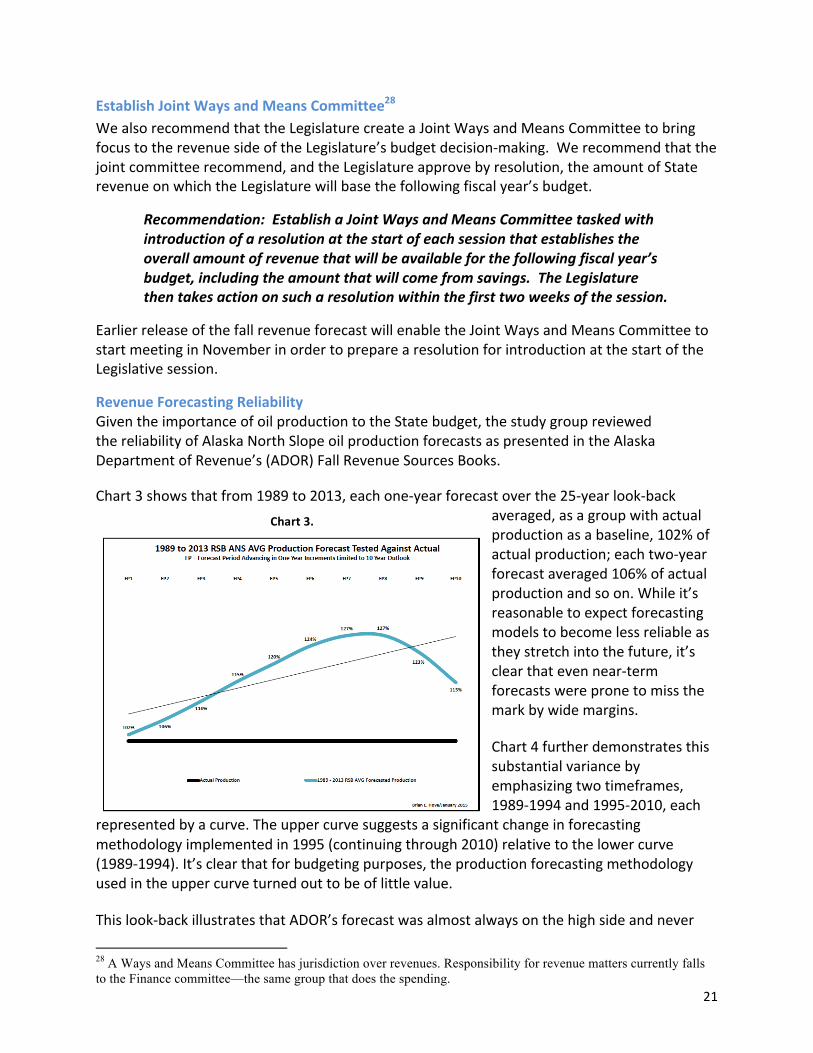
Chart 3 shows that from 1989 to 2013, each one-‐year forecast over the 25-‐year look-‐back averaged, as a group with actual production as a baseline, 102% of actual production; each two-‐year forecast averaged 106% of actual production and so on. While it’s reasonable to expect forecasting models to become less reliable as they stretch into the future, it’s clear that even near-‐term forecasts were prone to miss the mark by wide margins.
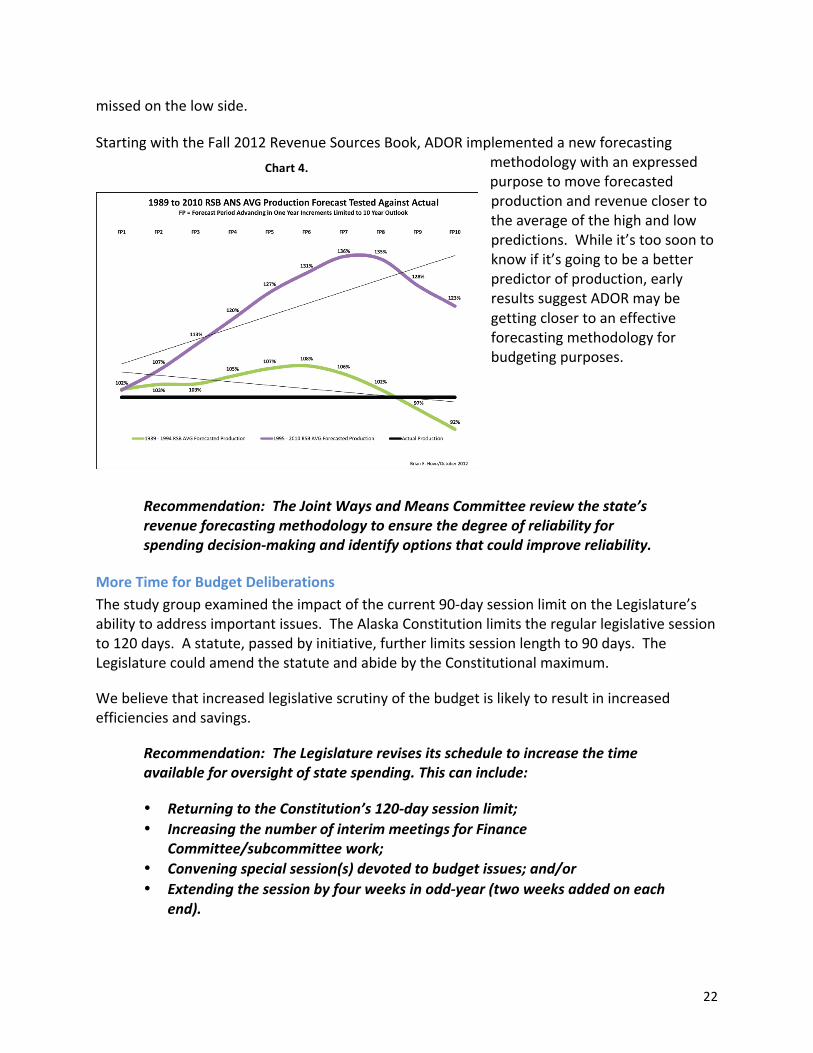
Chart 4 further demonstrates this substantial variance by emphasizing two timeframes, 1989-‐1994 and 1995-‐2010, each
represented by a curve. The upper curve suggests a significant change in forecasting methodology implemented in 1995 (continuing through 2010) relative to the lower curve (1989-‐1994). It’s clear that for budgeting purposes, the production forecasting methodology used in the upper curve turned out to be of little value.
This look-‐back illustrates that ADOR’s forecast was almost always on the high side and never
28 A Ways and Means Committee has jurisdiction over revenues. Responsibility for revenue matters currently falls to the Finance committee—the same group that does the spending.
Chart 3.
22
missed on the low side.
Starting with the Fall 2012 Revenue Sources Book, ADOR implemented a new forecasting methodology with an expressed purpose to move forecasted production and revenue closer to the average of the high and low predictions. While it’s too soon to know if it’s going to be a better predictor of production, early results suggest ADOR may be getting closer to an effective forecasting methodology for budgeting purposes.
Recommendation: The Joint Ways and Means Committee review the state’s revenue forecasting methodology to ensure the degree of reliability for spending decision-‐making and identify options that could improve reliability.
More Time for Budget Deliberations The study group examined the impact of the current 90-‐day session limit on the Legislature’s ability to address important issues. The Alaska Constitution limits the regular legislative session to 120 days. A statute, passed by initiative, further limits session length to 90 days. The Legislature could amend the statute and abide by the Constitutional maximum.
We believe that increased legislative scrutiny of the budget is likely to result in increased efficiencies and savings.
Recommendation: The Legislature revises its schedule to increase the time available for oversight of state spending. This can include:
• Returning to the Constitution’s 120-‐day session limit; • Increasing the number of interim meetings for Finance
Committee/subcommittee work; • Convening special session(s) devoted to budget issues; and/or • Extending the session by four weeks in odd-‐year (two weeks added on each
end).
Chart 4.
23
Current Fiscal Year Budget Reduction Plan State revenue has dropped nearly 50% in the current fiscal year when compared to what was expected. While much of the Legislature’s and Governor’s focus is on next fiscal year’s budget, it also is important to take steps to slow down current fiscal year spending.
CWN believes it would be prudent for the Legislature and Governor to have an agreed-‐upon contingency plan of what actions will be taken when revenues dramatically decline.
Recommendation: The Legislature and Governor develop and implement a contingency plan that identifies steps that will be taken to reduce current fiscal year spending due to a dramatic drop in expected revenue.
Biennial Budget (Not Recommended) The study group discussed the pros and cons of moving to a biennial budget. A National Conference of State Legislatures 2011 report29 on annual/biennial budget cycles was inconclusive on the benefits of annual and biennial budget cycles, by most measures. However, the study did find that “forecasting is likely to prove more accurate in annual budget states than in biennial budget states, possibly reducing the need for supplemental appropriations and special legislative sessions.”
As shown in the Charts 3 and 4, Alaska has difficulty accurately forecasting oil revenue beyond one year, which typically has comprised some 90% of the State’s general fund revenue. We concluded that the revenue uncertainty would be compounded by a biennial budget cycle and for this reason do not recommend Alaska move to a biennial budget cycle.
Forward Funding The study group also discussed the challenge of basing state spending on revenue that is difficult to predict with certainty (see Charts 3 and 4). Forward funding30 the budget could help by basing spending on the actual amount of revenue collected the prior year. This approach has its challenges given the current revenue environment because it would require funding the first and following year’s budget at the same time in order to get a forward funding framework in place. Regardless, we believe it merits evaluation.
Recommendation: Evaluate the potential benefits to forward fund the state budget based on prior year revenue.
Deposit Savings to Statutory Budget Reserve The Constitutional Budget Reserve31 (CBR) was created to save surplus revenue so it would be available to support services when revenue fell. Under those circumstances, a simple majority
29 Snell, Ronald K., “State Experiences With Annual and Biennial Budgeting,” National Conference of State Legislatures, April 2011. 30 For several years the Legislature has been forward funding K-12 by depositing revenue into the Public Education Fund that then will be appropriated the following year. 31 Voters created the Constitutional Budget Reserve (CBR) in 1990. Initially, settlements from disputed oil and gas settlements were the primary source for deposits. Since then the Legislature has also deposited surplus revenue into the CBR.
24
vote is required to access the revenue. If the Legislature wants to use the CBR to spend more money than it did the prior year, a super-‐majority vote (3/4 of each legislative body) is required.
Over the years, the high threshold to get enough votes to meet the super-‐majority vote requirement has resulted in the unintended consequence of spending even more money by funding additional projects or programs in order to get needed votes.
The current revenue forecast should mean the Legislature would require only a majority vote to access these reserves in the near term. Looking beyond, the Legislature should re-‐examine the super-‐majority vote requirement to ensure prudent use of the reserve funds or take a one-‐time vote to place the CBR into the statutory budget reserve32 that only requires a majority vote to use.
Recommendation: Deposit the CBR balance into the statutory budget reserve.
32 The statutory budget reserve fund differs from the CBR by not requiring a super-majority vote to access funds.
Appendix A
Operating Budget General Funds Only
FY 04 FY 14 % Change
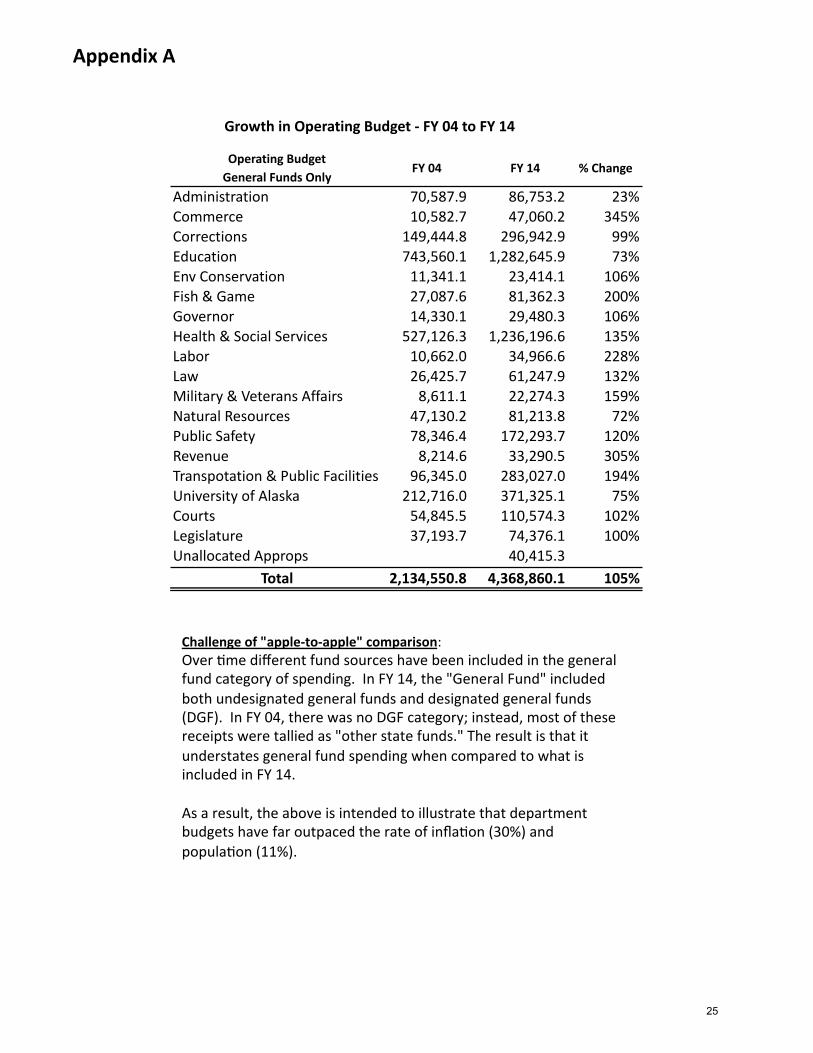
Administration 70,587.9 86,753.2 23%Commerce 10,582.7 47,060.2 345%Corrections 149,444.8 296,942.9 99%Education 743,560.1 1,282,645.9 73%Env Conservation 11,341.1 23,414.1 106%Fish & Game 27,087.6 81,362.3 200%Governor 14,330.1 29,480.3 106%Health & Social Services 527,126.3 1,236,196.6 135%Labor 10,662.0 34,966.6 228%Law 26,425.7 61,247.9 132%Military & Veterans Affairs 8,611.1 22,274.3 159%Natural Resources 47,130.2 81,213.8 72%Public Safety 78,346.4 172,293.7 120%Revenue 8,214.6 33,290.5 305%Transpotation & Public Facilities 96,345.0 283,027.0 194%University of Alaska 212,716.0 371,325.1 75%Courts 54,845.5 110,574.3 102%Legislature 37,193.7 74,376.1 100%Unallocated Approps 40,415.3 #DIV/0!
Total 2,134,550.8 4,368,860.1 105%
Growth in Operating Budget -‐ FY 04 to FY 14
Challenge of "apple-‐to-‐apple" comparison: Over \me different fund sources have been included in the general fund category of spending. In FY 14, the "General Fund" included both undesignated general funds and designated general funds (DGF). In FY 04, there was no DGF category; instead, most of these receipts were tallied as "other state funds." The result is that it understates general fund spending when compared to what is included in FY 14. As a result, the above is intended to illustrate that department budgets have far outpaced the rate of infla\on (30%) and popula\on (11%).
25
Sou
rce:
Leg
isla
tive
Fina
nce
Div
isio
n
26
Appendix B
Appendix C
Prior Fiscal Policy Studies Commonwealth North
1980 -‐ 2013
1980 “Alaska’s Golden Opportunity: Resource Revenues and State Spending”
1981 “The Promise and Pitfalls of Alaska’s State Loan Programs”
1981 “Investing in Alaska’s Future: The Capital Investment Fund”
1986 “Alaska’s Budget Crisis: Facing the Facts—Closing the Gap”
1988 “Using the Permanent Fund as a Positive Countercyclical Force in the Alaskan Economy”
1993 “Convening Budget Conference on Closing the Gap”
1994 “Breaking the Fall: Budget Recommendations for Alaska”
1998 “Alaska’s Asset Portfolio: Managing for Maximum Return”
1999 “Permanent Fund Earnings: A Cornerstone for Fiscal Certainty”
2001 “Gambling with the State’s Fiscal Future: Can Alaskans Afford the Odds”
2007 “At a Crossroad: The Permanent Fund, Alaskans and Alaska’s Future”
2013 “Long Term Economic Sustainability for the State of Alaska”
27
Appendix D
Fiscal Study Group Participant List
Co-Chairs
Cheryl Frasca, Co-Chair / CWN Board Member
Eric Wohlforth, Co-Chair / CWN Board Member
Participating Members
Nils Andreassen Institute of the North
Joe Beedle Northrim Bank
Katie Bender Northrim Bank
Matthew Blattmachr Alaska Trust Company
Bryan Butcher AHFC
Janet Conway Senator Cathy Giessel
Sharon Davies Commonwealth North Member
Bill Falsey Sedor Wendlandt Evans &
Filippi
Cathy Giessel Alaska Senator
Cliff Groh Alaska Common Ground
Charles Guinchard Representative Mia Costello
Brian Hove Focus on Alaska
Mike Humphrey The Wilson Agency
Grant Hunter Attorney
Susan Jensen Bayshore Owners Association
Brad Keithley Keithley Consultants
Nancy King Alaska Council on Economic
Development
Gunnar Knapp ISER
Mary Knopf ECI/Hyer
Ryan Makinster Representative Mia Costello
Janet McCabe Partners for Progress
Nancy King Alaska Council on Economic
Development
Peter McClung McDowell Group
Ed McLain UAA
David Morgan Health Economist
Christian Muntean Beyond Boarders
Bob Pawlowski Commonwealth North Member
Karen Perdue ASHNA
Mort Plumb Plumb Group
Joe Riggs Alaska Healthcare Strategies
Dan Saddler Alaska Representative
Stacy Schubert AHFC
Kim Skipper Representative Dan Saddler
Bernie Smith RCA
Terry Smith Unified Operations, LLC
John Stalvey UAA College of Arts and
Sciences
Vivian Stiver Senator Cathy Giessel
David Stringer First National Bank AK
Randi Sweet Commonwealth North Member
Niel Thomas Coldwell Banker Best Properties
Tom Turner Sagemark Consulting
Lisa Vaught Rep Gabrielle LeDoux
Heidi Wailand AGNEW::BECK
Kirk Wickersham FSBO System
Appendix D
Speakers & Presentations Fiscal Policy Study Group
August 28, 2014
• John Boucher, Senior Economist, Office of Management & Budget
September 11, 2014
• Representative Lindsey Holmes, Chair, House Finance Subcommittee on Administration
• David Morgan, Vice President & Chief Financial Officer, Bristol Bay Area Health Corporation
• Gunnar Knapp, Director and Professor of Economics at the Institute of Social and Economic Research (ISER), University of Alaska Anchorage
September 18, 2014
• David Teal, Director, Legislative Finance Division
September 25, 2014
• Representative Alan Austerman, Co-‐Chair, House Finance Committee Pete Ecklund, Legislative Staff, House Finance Committee
October 9, 2014
• Mark A. Foster, Chief Financial Officer, Anchorage School District
October 16, 2014
• Representative Mark Neuman, Vice-‐Chair, House Finance Committee
December 4, 2014
• Senator Anna Fairclough, Senate Finance Committee • Representative/Senator-‐Elect Mia Costello, House Finance Committee
December 18, 2014
• John Tichotsky, Ph.D., Chief Economist & Audit Master, Tax Division, Alaska Department of Revenue
Janet McCabe, Chair, Partners for Progress
January 15, 2015
• Gunnar Knapp, Director and Professor of Economics, UAA’s Institute for Social and Economic Research (ISER)
• Cliff Groh, Chair, Alaska Common Ground
29
FY 15 Ope
rating Bud
get H
ealth Ca
re Costs (E
xclude
s Fede
ral Fun
ds)
STAT
E OF ALA
SKA ANNUAL HEA
LTH CARE
COSTS
In bud
get do
llar form
atSummary by Dep
artm
ent (10
88) -‐ Scena
rio: FY 20
15 M
anagem
ent P
lan (114
93)
Dep
artm
ent
Total
Position
sTotal Expen
ses
(Costs)
Total State of
Alaska (Active)
Employees Health
Care Costs*
Total W
orkers'
Compe
nsation
depa
rtmen
t an
nual
prem
ium based
on 5
year windo
w of
claims expe
rien
ce
(See "Total W
orkers'
Comp Co
sts 5 Yr"
column L)
Total R
etired
Em
ployees Health
Care Cost***
Total State of
Alaska
Med
icaid Co
sts
(witho
ut
Fede
ral M
atch
or Adm
in
Costs)
Total State of
Alaska Health
Care Cost for
Inmates
Total State of
Alaska Health
Care Costs
(formula)
Total W
orkers'
Comp Co
sts Claims
5 Yr****
INFO
RMATION
PURP
OSES ONLY -‐
Actual dollar
amou
nts no
t bu
dget dollar
form
at.
Dep
artm
ent o
f Adm
inistration
1,123
348,365.7
$
18,004.1
$
828.1
$
491,908.0
$
-‐$
-‐
$
510,740.2
$
2,107,721.68
$
Dep
artm
ent o
f Com
merce, Com
mun
ity and
Econo
mic
Develop
ment
585
215,347.6
$
9,603.6
$
250.6
$
-‐$
-‐
$
-‐$
9,854.2
$
259,047.97
$
Dep
artm
ent o
f Corrections
1,871
333,040.5
$
31,294.8
$
3,136.6
$
-‐$
-‐
$
43,707.6
$
78,139.0
$
8,835,340.21
$
Dep
artm
ent o
f Edu
catio
n and Early Develop
men
t364
1,698,061.9
$
5,951.6
$
142.2
$
-‐$
-‐
$
-‐$
6,093.8
$
171,262.66
$
Dep
artm
ent o
f Enviro
nmen
tal Con
servation
561
87,560.9
$
9,444.2
$
246.4
$
-‐$
-‐
$
-‐$
9,690.6
$
325,710.63
$
Dep
artm
ent o
f Fish and Gam
e1,683
215,272.6
$
21,458.1
$
1,194.0
$
-‐$
-‐
$
-‐$
22,652.1
$
2,820,672.85
$
Office of th
e Governo
r168
34,338.1
$
2,434.9
$
82.0
$
-‐$
-‐
$
-‐$
2,516.9
$
101,926.40
$
Dep
artm
ent o
f Health
and
Social Services
3,661
2,692,324.5
$
58,941.0
$
6,526.6
$
-‐$
702,872.3
$
-‐$
768,339.9
$
20,194,561.74
$
Dep
artm
ent o
f Labor and
Workforce Develop
men
t877
185,306.7
$
14,674.8
$
827.5
$
-‐$
-‐
$
-‐$
15,502.3
$
2,089,947.52
$
Dep
artm
ent o
f Law
574
95,401.4
$
9,792.2
$
318.7
$
-‐$
-‐
$
-‐$
10,110.9
$
539,738.07
$
Dep
artm
ent o
f Military and
Veterans Affairs
336
60,337.1
$
5,579.7
$
510.3
$
-‐$
-‐
$
-‐$
6,090.0
$
2,173,626.97
$
Dep
artm
ent o
f Natural Resou
rces
1,107
178,330.4
$
15,160.3
$
1,624.2
$
-‐$
-‐
$
-‐$
16,784.5
$
6,357,386.48
$
Dep
artm
ent o
f Pub
lic Safety
926
206,581.4
$
15,085.1
$
2,198.6
$
-‐$
-‐
$
-‐$
17,283.7
$
6,290,888.56
$
Dep
artm
ent o
f Reven
ue934
376,050.9
$
14,951.6
$
372.6
$
-‐$
-‐
$
-‐$
15,324.2
$
657,654.46
$
Dep
artm
ent o
f Transpo
rtation Pu
blic Facilitie
s3,806
629,036.8
$
56,947.6
$
8,200.7
$
-‐$
-‐
$
-‐$
65,148.3
$
24,277,585.58
$
University
of A
laska**
4,934
924,863.7
$
62,200.0
$
-‐$
-‐
$
-‐$
-‐
$
62,200.0
$
Judiciary
826
115,676.9
$
12,445.9
$
499.1
$
-‐$
-‐
$
-‐$
12,945.0
$
606,753.20
$
Legislature
560
78,077.9
$
7,903.4
$
195.0
$
-‐$
-‐
$
-‐$
8,098.4
$
245,711.40
$
Total
24,896
8,473,975.0
$
371,872.9
$
27,153.1
$
491,908.0
$
702,872.3
$
43,707.6
$
1,637,513.9
$
78,055,536.38
$
****Co
lumn I is the prem
ium charged
to th
e agen
cies fo
r FY15
based
on the FY10
-‐FY14 claims expe
rien
ce. Colum
n O is th
e total claim
s paid fo
r the 5 year windo
w of FY10-‐FY14
.
* Ba
sed on
FY201
5 Managem
ent P
lan bu
dgeted
health
insurance costs de
term
ined
by po
sitio
n type
. For m
ore de
tailed contribu
tions and
claim
expen
ditures for active em
ployees he
alth care costs, see th
e SO
A Group
Health
and
Life Fun
d fin
ancial statemen
tsor con
tact th
e individu
al union
health
trusts fo
r their respective fin
ancial statemen
ts.
**University
: Health
care is one
variable in th
e fringe ben
efit rates that are based
on a metho
dology app
roved by th
e fede
ral governm
ent. Prelim
inary projectio
ns of e
mployee wage base and
the following be
nefits: PER
S, TRS, O
RP, pen
sion
, med
icare/social
security, health
care, life insurance, long te
rm disability, une
mploymen
t, workers' com
pensation, tu
ition
waivers, con
sulting, labor re
latio
ns and
over/un
der recovery of fringe costs from
prior fiscal years.
***This is th
e FY20
14 claim
s as of Jun
e 30
, 201
4 for all PER
S, TRS, JRS, R
HF plan participants, not just State of A
laska retirees. For con
tributions and
claim
s of individu
al re
tirem
ent systems, see th
e individu
al plan fin
ancial
statem
ents located on
the Division of Retire
men
t & Ben
efits web
site. The
re are 39,35
0 retiree health
plan mem
bers and
28,72
7 de
pend
ents of retire
d mem
bers. A
pproximately 40
-‐50%
of claim
s are for ou
t-‐of-‐state re
tirees.
Appendix E
30
Appendix F
Economy Standard Premium
Deductible $500 Individual$1,000 family
$300 individual$600 family
$300 individual$600 family
Coinsurance 70% 80% 90%
Annual Out-of-Pocket Maximum (per person after deductible)
$2,000 $1,200 $350
Lifetime Maximum Unlimited Unlimited Unlimited
Preventive Care
Dependents
Covered at 100% with no deductible at in-network providers
Covered up to age 26
Summary of Key Provisions of Health Benefit PlansActive State of Alaska Employees
31
Core Strategies for Health Care Transformation January 2015
I. Ensure the best available evidence is used for making decisions
Support clinicians and patients to make clinical decisions based on high grade medical evidence regarding effectiveness and efficiency of testing and treatment options. Apply
evidence-based principles in the design of health insurance plans and benefits.
II. Increase price and quality transparency
Provide Alaskans with information on health care costs, prices and quality so they can make
informed choices. Provide clinicians, payers and policy makers with information needed to make informed health care decisions.
III. Pay for value
Redesign payment structures to incentivize quality, efficiency and effectiveness. Support
multi-payer payment reform initiatives to improve purchasing power for the consumer and minimize the burden on health care providers. Reduce fraud, waste, and abuse.
IV. Engage employers to improve health plans and employee wellness
Support employers to adopt employee health and health insurance plan improvement as a
business strategy. Start with price and quality transparency, and leadership by the State
Department of Administration. Reform the Alaska Workers’ Compensation Act.
V. Enhance quality and efficiency of care on the front-end
Strengthen the role of primary care providers, and give patients and their clinicians better tools for making health care decisions. Improve coordination of care for patients with
multiple providers, and care management for patients with chronic health conditions. Improve Alaska’s Trauma system.
VI. Increase dignity and quality of care for seriously ill patients
Support Alaskans to plan in advance to ensure health care and other end of life decisions are
honored. Provide secure electronic access to advance directives. Encourage provider training and education in end-of-life care. Establish a process that engages seriously and terminally ill
patients in shared treatment decision-making with their clinicians. Use telehealth and redesign
reimbursement methods to improve access to palliative care.
VII. Focus on prevention
Create the conditions that support and engage Alaskans to exercise personal responsibility for living healthy lifestyles. High priorities include reducing obesity rates, increasing
immunization rates, increasing behavioral health screening, and integrating behavioral health and primary care.
VIII. Build the foundation of a sustainable health care system
Create the information infrastructure required for maintaining and sharing electronic health
information and for analysis of health care data to drive improved quality, cost and outcomes. Support an appropriate supply and distribution of health care workers. Provide statewide
leadership to facilitate health care system transformation.
Alaskan Solutions for Better Health and Health Care
The Alaska Health Care Commission was established by the Legislature in 2010 to advise the State on policies for improving health and
health care for all Alaskans. Commission members are
appointed by the Governor.
VISION
By 2025 Alaskans will be the healthiest
people in the nation and have access to the highest quality, most
affordable health care.
We will know we have attained this vision when, compared to the other 49
states, Alaskans have:
1. The highest life expectancy
2. The highest percentagepopulation with access toprimary care
3. The lowest per capitahealth care spending level
APPROACH
Design policies that enhance the consumer’s role in health and health care through: A) Innovations in patient-
centric health care; and,B) Support for healthy
lifestyles
For more information visit the Commission’s web site at: http://dhss.alaska.gov/ahcc/
Transforming Health Care in Alaska
Core Strategies & Policy Recommendations
Appendix G
32
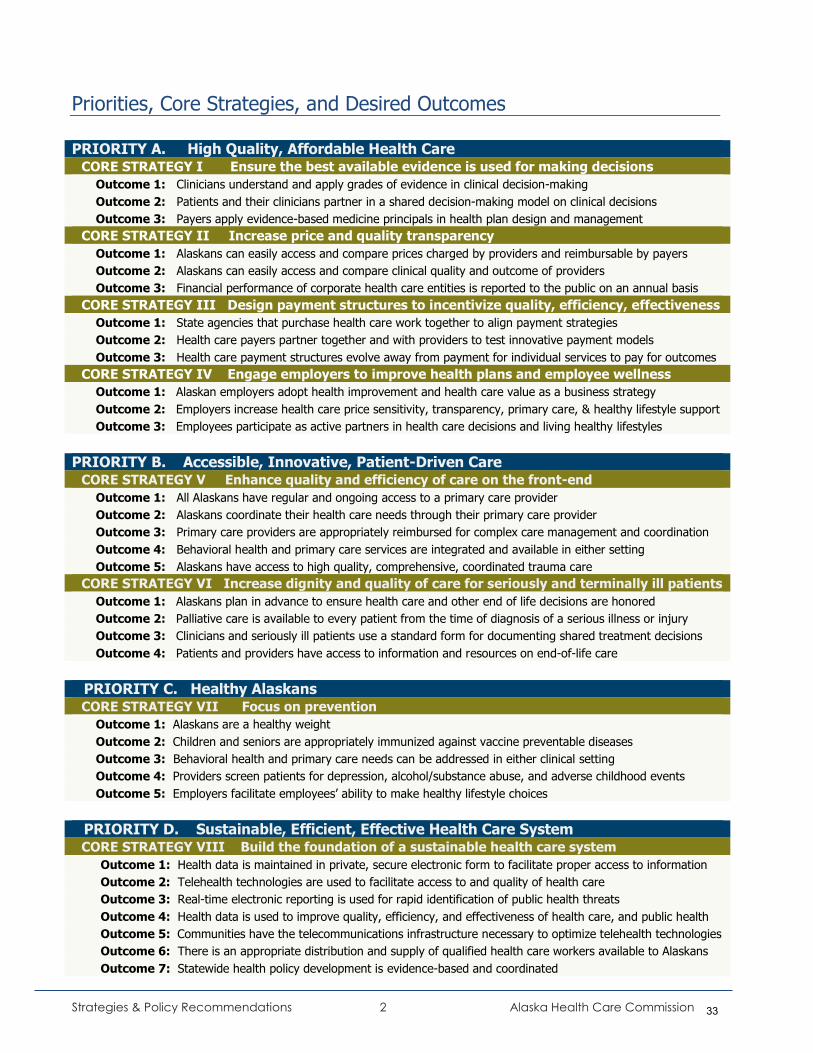
Strategies & Policy Recommendations 2 Alaska Health Care Commission
Priorities, Core Strategies, and Desired Outcomes
PRIORITY A. High Quality, Affordable Health Care CORE STRATEGY I Ensure the best available evidence is used for making decisions
Outcome 1: Clinicians understand and apply grades of evidence in clinical decision-making
Outcome 2: Patients and their clinicians partner in a shared decision-making model on clinical decisions
Outcome 3: Payers apply evidence-based medicine principals in health plan design and management
CORE STRATEGY II Increase price and quality transparency
Outcome 1: Alaskans can easily access and compare prices charged by providers and reimbursable by payers
Outcome 2: Alaskans can easily access and compare clinical quality and outcome of providers
Outcome 3: Financial performance of corporate health care entities is reported to the public on an annual basis
CORE STRATEGY III Design payment structures to incentivize quality, efficiency, effectiveness
Outcome 1: State agencies that purchase health care work together to align payment strategies
Outcome 2: Health care payers partner together and with providers to test innovative payment models
Outcome 3: Health care payment structures evolve away from payment for individual services to pay for outcomes
CORE STRATEGY IV Engage employers to improve health plans and employee wellness
Outcome 1: Alaskan employers adopt health improvement and health care value as a business strategy
Outcome 2: Employers increase health care price sensitivity, transparency, primary care, & healthy lifestyle support
Outcome 3: Employees participate as active partners in health care decisions and living healthy lifestyles
PRIORITY B. Accessible, Innovative, Patient-Driven Care
CORE STRATEGY V Enhance quality and efficiency of care on the front-end
Outcome 1: All Alaskans have regular and ongoing access to a primary care provider
Outcome 2: Alaskans coordinate their health care needs through their primary care provider
Outcome 3: Primary care providers are appropriately reimbursed for complex care management and coordination
Outcome 4: Behavioral health and primary care services are integrated and available in either setting
Outcome 5: Alaskans have access to high quality, comprehensive, coordinated trauma care
CORE STRATEGY VI Increase dignity and quality of care for seriously and terminally ill patients
Outcome 1: Alaskans plan in advance to ensure health care and other end of life decisions are honored
Outcome 2: Palliative care is available to every patient from the time of diagnosis of a serious illness or injury
Outcome 3: Clinicians and seriously ill patients use a standard form for documenting shared treatment decisions
Outcome 4: Patients and providers have access to information and resources on end-of-life care
PRIORITY C. Healthy Alaskans CORE STRATEGY VII Focus on prevention
Outcome 1: Alaskans are a healthy weight
Outcome 2: Children and seniors are appropriately immunized against vaccine preventable diseases
Outcome 3: Behavioral health and primary care needs can be addressed in either clinical setting
Outcome 4: Providers screen patients for depression, alcohol/substance abuse, and adverse childhood events
Outcome 5: Employers facilitate employees’ ability to make healthy lifestyle choices
PRIORITY D. Sustainable, Efficient, Effective Health Care System CORE STRATEGY VIII Build the foundation of a sustainable health care system
Outcome 1: Health data is maintained in private, secure electronic form to facilitate proper access to information
Outcome 2: Telehealth technologies are used to facilitate access to and quality of health care
Outcome 3: Real-time electronic reporting is used for rapid identification of public health threats
Outcome 4: Health data is used to improve quality, efficiency, and effectiveness of health care, and public health
Outcome 5: Communities have the telecommunications infrastructure necessary to optimize telehealth technologies
Outcome 6: There is an appropriate distribution and supply of qualified health care workers available to Alaskans
Outcome 7: Statewide health policy development is evidence-based and coordinated
33
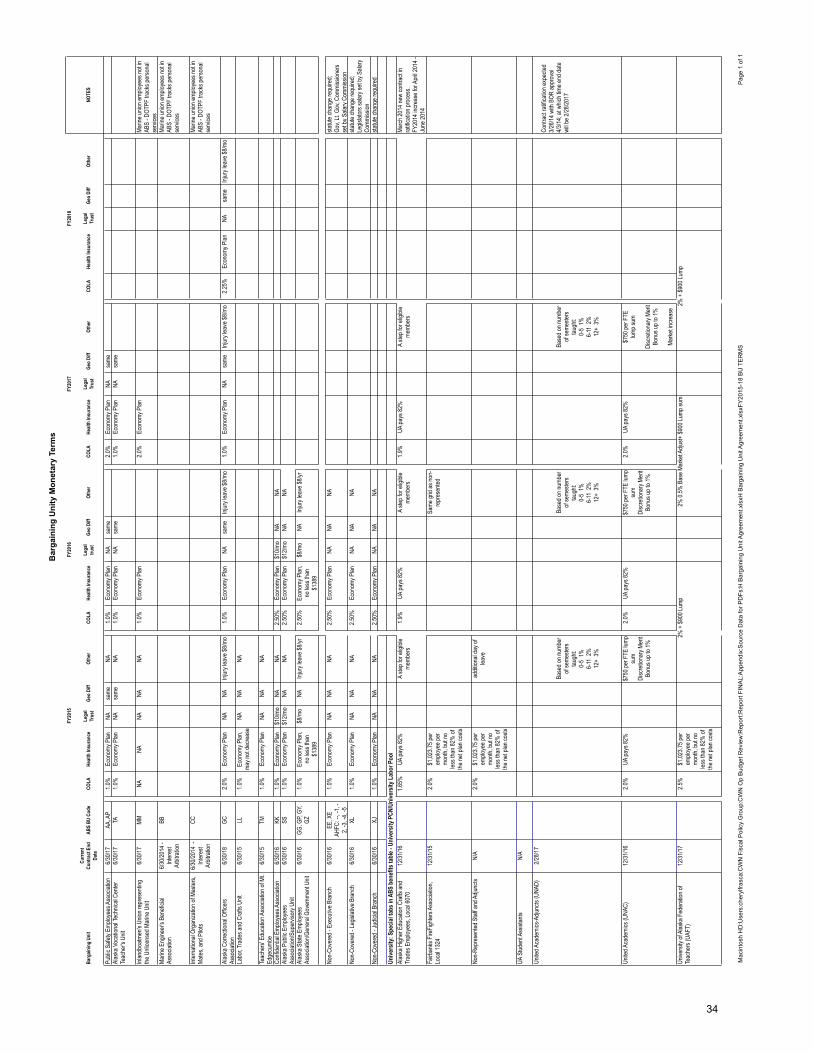
Bar
gain
ing
Uni
ty M
onet
ary
Term
s
Mac
into
sh H
D:U
sers
:che
rylfr
asca
:CW
N F
isca
l Pol
icy
Gro
up:C
WN
Op
Bud
get R
evie
w:R
epor
t:Rep
ort F
INA
L:A
ppen
dix:
Sou
rce
Dat
a fo
r PD
Fs:H
Bar
gain
ing
Uni
t Agr
eem
ent.x
lsxH
Bar
gain
ing
Uni
t Agr
eem
ent.x
lsxF
Y20
15-1
8 B
U T
ER
MS
Pag
e 1
of 1
Barg
ainin
g Un
itCu
rrent
Co
ntra
ct E
nd
Date
ABS
BU C
ode
COLA
Healt
h In
sura
nce
Lega
l Tr
ust
Geo
Diff
Othe
rCO
LAHe
alth
Insu
ranc
eLe
gal
trust
Geo
Diff
Othe
rCO
LAHe
alth
Insu
ranc
eLe
gal
Trus
tGe
o Di
ffOt
her
COLA
Healt
h In
sura
nce
Lega
l Tr
ust
Geo
Diff
Othe
rNO
TES
Publi
c Safe
ty Em
ploye
es A
ssoc
iation
6/30/1
7AA
, AP
1.0%
Econ
omy P
lanNA
same
NA1.0
%Ec
onom
y Plan
NAsa
me2.0
%Ec
onom
y Plan
NAsa
meAl
aska
Voc
ation
al Te
chnic
al Ce
nter
Teac
her's
Unit
6/30/1
7TA
1.0%
Econ
omy P
lanNA
same
NA1.0
%Ec
onom
y Plan
NAsa
me1.0
%Ec
onom
y Plan
NAsa
me
Inlan
dboa
tmen
's Un
ion re
pres
entin
g the
Unli
cens
ed M
arine
Unit
6/30/1
7MM
NANA
NANA
NA1.0
%Ec
onom
y Plan
2.0%
Econ
omy P
lanMa
rine u
nion e
mploy
ees n
ot in
ABS
- DOT
PF tr
acks
perso
nal
servi
ces
Marin
e Eng
ineer
's Be
nefic
ial
Asso
ciatio
n6/3
0/201
4 -
Inter
est
Arbit
ratio
n
BBMa
rine u
nion e
mploy
ees n
ot in
ABS
- DOT
PF tr
acks
perso
nal
servi
ces
Inter
natio
nal O
rgan
izatio
n of M
aster
s, Ma
tes, a
nd P
ilots
6/30/2
014
- Int
eres
t Ar
bitra
tion
CCMa
rine u
nion e
mploy
ees n
ot in
ABS
- DOT
PF tr
acks
perso
nal
servi
ces
Alas
ka C
orre
ction
al Of
ficer
s As
socia
tion
6/30/1
8GC
2.0%
Econ
omy P
lanNA
NAInj
ury l
eave
$8/m
o1.0
%Ec
onom
y Plan
NAsa
meInj
ury l
eave
$8/m
o1.0
%Ec
onom
y Plan
NAsa
meInj
ury l
eave
$8/m
o2.2
5%Ec
onom
y Plan
NAsa
meInj
ury l
eave
$8/m
o
Labo
r, Tra
des a
nd C
rafts
Unit
6/30/1
5LL
1.0%
Econ
omy P
lan,
may n
ot de
creas
eNA
NANA
Teac
hers'
Edu
catio
n Ass
ociat
ion of
Mt.
Edge
cumb
e6/3
0/15
TM1.0
%Ec
onom
y Plan
NANA
NA
Confi
denti
al Em
ploye
es A
ssoc
iation
6/30/1
6KK
1.0%
Econ
omy P
lan$1
0/mo
NANA
2.50%
Econ
omy P
lan$1
0/mo
NANA
Alas
ka P
ublic
Emp
loyee
s As
socia
tion/S
uper
visor
y Unit
6/30/1
6SS
1.0%
Econ
omy P
lan$1
2/mo
NANA
2.50%
Econ
omy P
lan$1
2/mo
NANA
Alas
ka S
tate E
mploy
ees
Asso
ciatio
n/Gen
eral
Gove
rnme
nt Un
it6/3
0/16
GG, G
P, GY
, GZ
1.0%
Econ
omy P
lan,
no le
ss th
an
$138
9
$8/m
oNA
Injur
y lea
ve $8
/yr2.5
0%Ec
onom
y Plan
, no
less
than
$1
389
$8/m
oNA
Injur
y lea
ve $8
/yr
Non-
Cove
red -
Exe
cutiv
e Bra
nch
6/30/1
6EE
, XE
AHFC
: --,
-1, -
2, -3
, -4,
-5
1.0%
Econ
omy P
lanNA
NANA
2.50%
Econ
omy P
lanNA
NANA
statut
e cha
nge r
equir
ed;
Gov,
Lt. G
ov, C
ommi
ssion
ers
set b
y Sala
ry Co
mmiss
ionNo
n-Co
vere
d - Le
gislat
ive B
ranc
h6/3
0/16
XL1.0
%Ec
onom
y Plan
NANA
NA2.5
0%Ec
onom
y Plan
NANA
NAsta
tute c
hang
e req
uired
; Le
gislat
ors s
alary
set b
y Sala
ry Co
mmiss
ionNo
n-Co
vere
d - Ju
dicial
Bra
nch
6/30/1
6XJ
1.0%
Econ
omy P
lanNA
NANA
2.50%
Econ
omy P
lanNA
NANA
statut
e cha
nge r
equir
ed
Unive
rsity
: Spe
cial t
abs i
n ABS
ben
efits
tabl
e - U
nive
rsity
PCN
/Uni
vers
ity L
abor
Poo
l Al
aska
High
er E
duca
tion C
rafts
and
Trad
es E
mploy
ees,
Loca
l 607
012
/31/16
1.65%
UA pa
ys 82
%A
step f
or el
igible
me
mber
s1.9
%UA
pays
82%
A ste
p for
eligi
ble
memb
ers
1.9%
UA pa
ys 82
%A
step f
or el
igible
me
mber
sMa
rch 20
14 ne
w co
ntrac
t in
ratifi
catio
n pro
cess
.FY
2014
incre
ase f
or A
pril 2
014 -
Ju
ne 20
14Fa
irban
ks F
ireFig
hters
Asso
ciatio
n, Lo
cal 1
324
12/31
/152.0
%$1
,023.7
5 per
em
ploye
e per
mo
nth, b
ut no
les
s tha
n 82%
of
the ne
t plan
costs
Same
grid
as no
n-re
pres
ented
Non-
Repr
esen
ted S
taff a
nd A
djunc
tsN/
A2.0
%$1
,023.7
5 per
em
ploye
e per
mo
nth, b
ut no
les
s tha
n 82%
of
the ne
t plan
costs
addit
ional
day o
f lea
ve
UA S
tuden
t Ass
istan
tsN/
A
Unite
d Aca
demi
cs-A
djunc
ts (U
NAD)
2/28/1
7
Base
d on n
umbe
r of
seme
sters
taugh
t:0-
5 1%
6-11
2%
12+
3%
Base
d on n
umbe
r of
seme
sters
taugh
t:0-
5 1%
6-11
2%
12+
3%
Base
d on n
umbe
r of
seme
sters
taugh
t:0-
5 1%
6-11
2%
12+
3%
Contr
act r
atific
ation
expe
cted
3/26/1
4 with
BOR
appr
oval
4/3/14
; at w
hich t
ime e
nd da
te wi
ll be 2
/28/20
17
Unite
d Aca
demi
cs (U
NAC)
12/31
/162.0
%UA
pays
82%
$750
per F
TE lu
mp
sum
Disc
retio
nary
Merit
Bonu
s up t
o 1%
2.0%
UA pa
ys 82
%$7
50 pe
r FTE
lump
su
mDi
scre
tiona
ry Me
rit Bo
nus u
p to 1
%
2.0%
UA pa
ys 82
%$7
50 pe
r FTE
lum
p sum
Disc
retio
nary
Merit
Bonu
s up t
o 1%
Marke
t incre
ase
Unive
rsity
of Al
aska
Fed
erati
on of
Te
ache
rs (U
AFT)
12/31
/172.5
%$1
,023.7
5 per
em
ploye
e per
mo
nth, b
ut no
les
s tha
n 82%
of
the ne
t plan
costs
2% +
$900
Lump
2% 0.
5% B
ase M
arke
t Adju
st+ $9
00 Lu
mp su
m2%
+ $9
00 Lu
mp
FY20
15FY
2016
FY20
17FY
2018
34
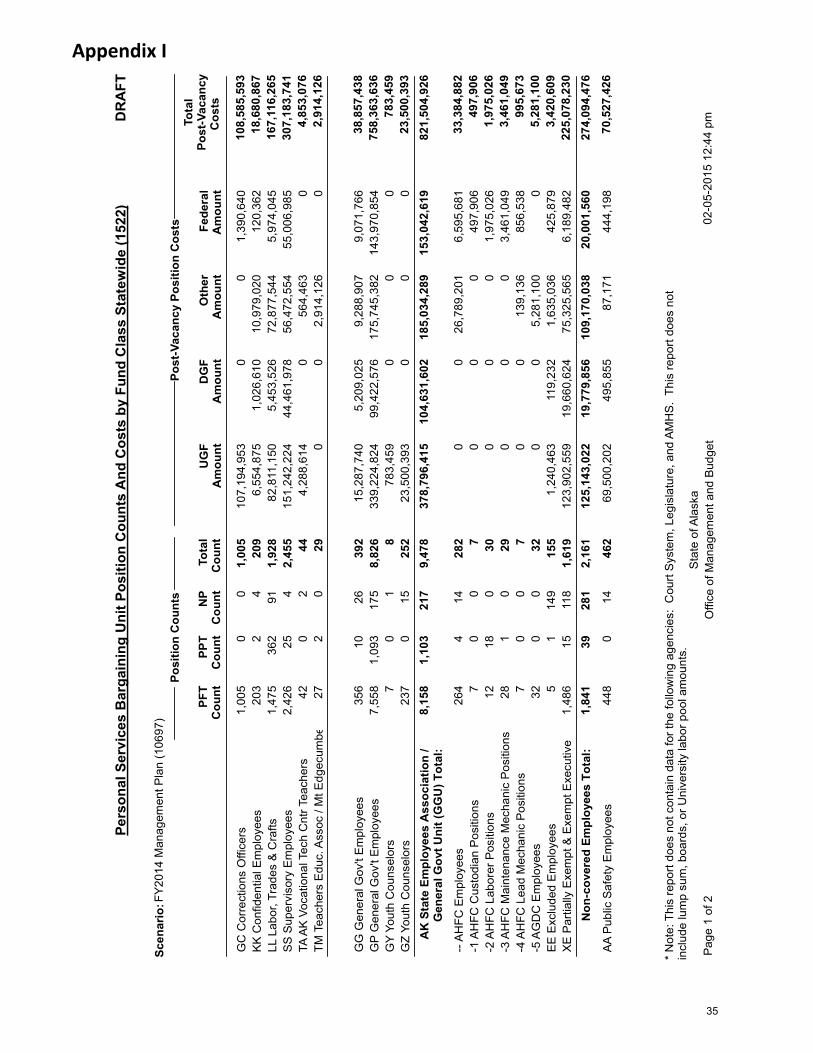
Pers
onal
Ser
vice
s B
arga
inin
g U
nit P
ositi
on C
ount
s A
nd C
osts
by
Fund
Cla
ss S
tate
wid
e (1
522)
DR
AFT
Scen
ario
:FY
2014
Man
agem
ent P
lan
(106
97)
Tota
lPo
st-V
acan
cyC
osts
Post
-Vac
ancy
Pos
ition
Cos
ts
UG
FA
mou
ntD
GF
Am
ount
Oth
erA
mou
ntFe
dera
lA
mou
ntPF
TC
ount
PPT
Cou
ntN
PC
ount
Tota
lC
ount
Posi
tion
Cou
nts
GC
Cor
rect
ions
Offi
cers
108,
585,
593
1,00
50
01,
005
1,39
0,64
00
010
7,19
4,95
3K
K C
onfid
entia
l Em
ploy
ees
18,6
80,8
6 720
32
420
912
0,36
210
,979
,020
1,02
6,61
06,
554,
875
LL L
abor
, Tra
des
& C
rafts
167,
116,
265
1,47
536
291
1,92
85,
974,
045
72,8
77,5
445,
453,
526
82,8
11,1
50S
S S
uper
viso
ry E
mpl
oyee
s30
7,18
3,74
12,
426
254
2,45
555
,006
,985
56,4
72,5
5444
,461
,978
151,
242,
224
TA A
K V
ocat
iona
l Tec
h C
ntr T
each
ers
4,85
3,07
642
02
440
564,
463
04,
288,
614
TM T
each
ers
Edu
c. A
ssoc
/ M
t Edg
ecum
b e2,
914,
126
272
029
02,
914,
126
00
GG
Gen
eral
Gov
't E
mpl
oyee
s38
,857
,43 8
356
1026
392
9,07
1,76
69,
288,
907
5,20
9,02
515
,287
,740
GP
Gen
eral
Gov
't E
mpl
oyee
s75
8,36
3,63
67,
558
1,09
317
58,
826
143,
970,
854
175,
745,
382
99,4
22,5
7633
9,22
4,82
4G
Y Yo
uth
Cou
nsel
ors
783,
459
70
18
00
078
3,45
9G
Z Yo
uth
Cou
nsel
ors
23,5
00,3
9 323
70
1525
20
00
23,5
00,3
9382
1,50
4,92
68,
158
1,10
321
79,
478
153,
042,
619
185,
034,
289
104,
631,
602
378,
796,
415
AK
Sta
te E
mpl
oyee
s A
ssoc
iatio
n /
Gen
eral
Gov
t Uni
t (G
GU
) Tot
al:
-- A
HFC
Em
ploy
ees
33,3
84,8
8226
44
1428
26,
595,
681
26,7
89,2
010
0-1
AH
FC C
usto
dian
Pos
ition
s49
7,90
67
00
749
7,90
60
00
-2 A
HFC
Lab
orer
Pos
ition
s1,
975,
026
1218
030
1,97
5,02
60
00
-3 A
HFC
Mai
nten
ance
Mec
hani
c P
ositi
ons
3,46
1,04
928
10
293,
461,
049
00
0-4
AH
FC L
ead
Mec
hani
c P
ositi
ons
995,
673
70
07
856,
538
139,
136
00
-5 A
GD
C E
mpl
oyee
s5,
281,
100
320
032
05,
281,
100
00
EE
Exc
lude
d E
mpl
oyee
s3,
420,
609
51
149
155
425,
879
1,63
5,03
611
9,23
21,
240,
463
XE
Par
tially
Exe
mpt
& E
xem
pt E
xecu
tive
225,
078,
230
1,48
615
118
1,61
96,
189,
482
75,3
25,5
6519
,660
,624
123,
902,
559
274,
094,
476
1,84
139
281
2,16
120
,001
,560
109,
170,
038
19,7
79,8
5612
5,14
3,02
2N
on-c
over
ed E
mpl
oyee
s To
tal:
AA
Pub
lic S
afet
y E
mpl
oyee
s70
,527
,426
448
014
462
444,
198
87,1
7149
5,85
569
,500
,202
*N
ote:
Thi
s re
port
does
not
con
tain
dat
a fo
r the
follo
win
g ag
enci
es:
Cou
rt S
yste
m, L
egis
latu
re, a
nd A
MH
S.
This
repo
rt do
es n
otin
clud
e lu
mp
sum
, boa
rds,
or U
nive
rsity
labo
r poo
l am
ount
s.
Offi
ce o
f Man
agem
ent a
nd B
udge
t S
tate
of A
lask
a 02
-05-
2015
12:
44 p
mP
age
1 of
2
Appendix I
35
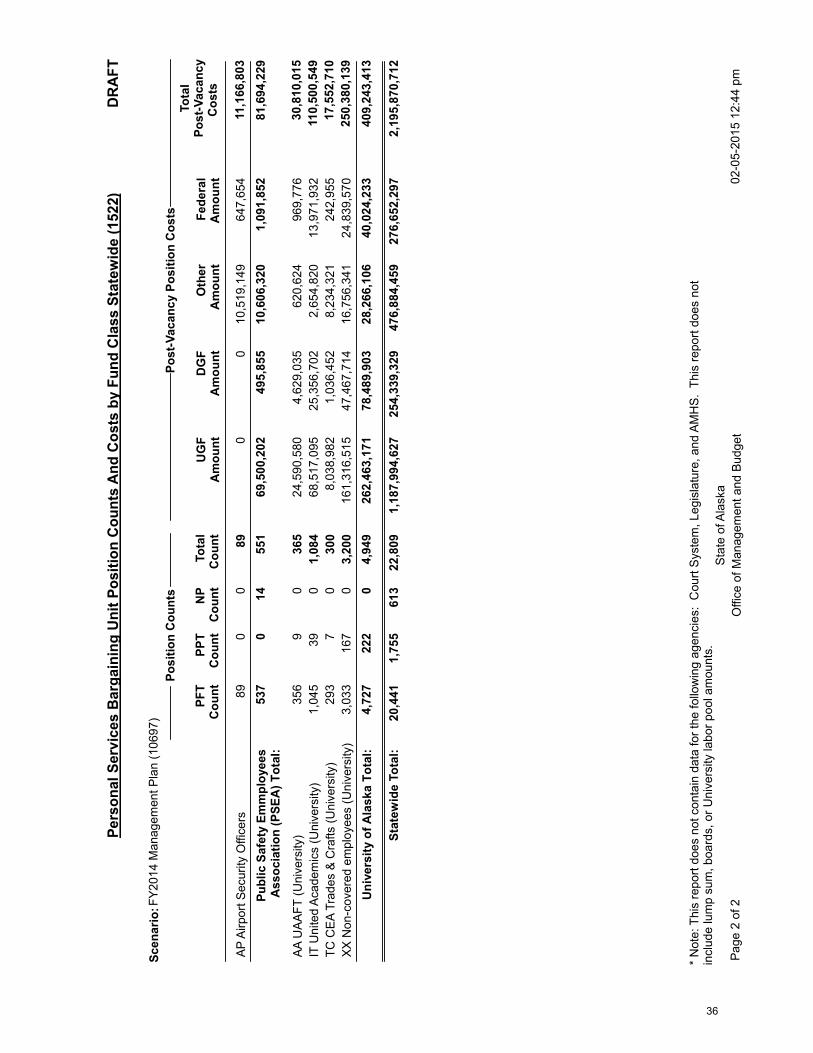
Pers
onal
Ser
vice
s B
arga
inin
g U
nit P
ositi
on C
ount
s A
nd C
osts
by
Fund
Cla
ss S
tate
wid
e (1
522)
DR
AFT
Scen
ario
:FY2
014
Man
agem
ent P
lan
(106
97)
Tota
lPo
st-V
acan
cyC
osts
Post
-Vac
ancy
Pos
ition
Cos
ts
UG
FA
mou
ntD
GF
Am
ount
Oth
erA
mou
ntFe
dera
lA
mou
ntPF
TC
ount
PPT
Cou
ntN
PC
ount
Tota
lC
ount
Posi
tion
Cou
nts
AP A
irpor
t Sec
urity
Offi
cers
11,1
66,8
0 389
00
8964
7,65
410
,519
,149
00
81,6
94,2
2953
70
1455
11,
091,
852
10,6
06,3
2049
5,85
569
,500
,202
Publ
ic S
afet
y Em
mpl
oyee
sA
ssoc
iatio
n (P
SEA
) Tot
al:
AA U
AAFT
(Uni
vers
ity)
30,8
10,0
1 535
69
036
596
9,77
662
0,62
44,
629,
035
24,5
90,5
80IT
Uni
ted
Acad
emic
s (U
nive
rsity
)11
0,50
0,54
91,
045
390
1,08
413
,971
,932
2,65
4,82
025
,356
,702
68,5
17,0
95TC
CEA
Tra
des
& C
rafts
(Uni
vers
ity)
17,5
52,7
1029
37
030
024
2,95
58,
234,
321
1,03
6,45
28,
038,
982
XX N
on-c
over
ed e
mpl
oyee
s (U
nive
rsity
)25
0,38
0,13
93,
033
167
03,
200
24,8
39,5
7016
,756
,341
47,4
67,7
1416
1,31
6,51
540
9,24
3,41
34,
727
222
04,
949
40,0
24,2
3328
,266
,106
78,4
89,9
0326
2,46
3,17
1U
nive
rsity
of A
lask
a To
tal:
2,19
5,87
0,71
21,
187,
994,
627
254,
339,
329
476,
884,
459
276,
652,
297
20,4
411,
755
613
22,8
09St
atew
ide
Tota
l:
*Not
e: T
his
repo
rt do
es n
ot c
onta
in d
ata
for t
he fo
llow
ing
agen
cies
: C
ourt
Syst
em, L
egis
latu
re, a
nd A
MH
S. T
his
repo
rt do
es n
otin
clud
e lu
mp
sum
, boa
rds,
or U
nive
rsity
labo
r poo
l am
ount
s.
Offi
ce o
f Man
agem
ent a
nd B
udge
t S
tate
of A
lask
a 02
-05-
2015
12:
44 p
mPa
ge 2
of 2
36
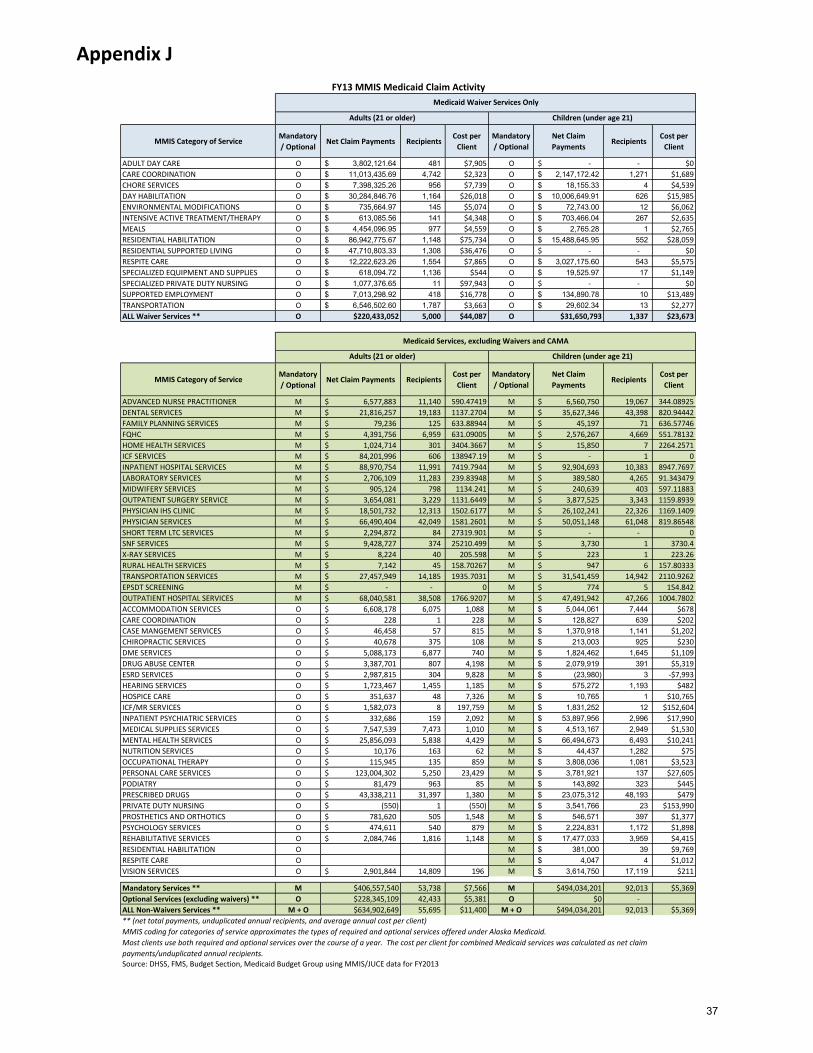
DHSS Log 2565
MMIS Category of ServiceMandatory
/ OptionalNet Claim Payments Recipients
Cost per
Client
Mandatory
/ Optional
Net Claim
Payments Recipients
Cost per
Client
ADULT DAY CARE O 3,802,121.64$ 481 $7,905 O -$ - $0
CARE COORDINATION O 11,013,435.69$ 4,742 $2,323 O 2,147,172.42$ 1,271 $1,689
CHORE SERVICES O 7,398,325.26$ 956 $7,739 O 18,155.33$ 4 $4,539
DAY HABILITATION O 30,284,846.76$ 1,164 $26,018 O 10,006,649.91$ 626 $15,985
ENVIRONMENTAL MODIFICATIONS O 735,664.97$ 145 $5,074 O 72,743.00$ 12 $6,062
INTENSIVE ACTIVE TREATMENT/THERAPY O 613,085.56$ 141 $4,348 O 703,466.04$ 267 $2,635
MEALS O 4,454,096.95$ 977 $4,559 O 2,765.28$ 1 $2,765
RESIDENTIAL HABILITATION O 86,942,775.67$ 1,148 $75,734 O 15,488,645.95$ 552 $28,059
RESIDENTIAL SUPPORTED LIVING O 47,710,803.33$ 1,308 $36,476 O -$ - $0
RESPITE CARE O 12,222,623.26$ 1,554 $7,865 O 3,027,175.60$ 543 $5,575
SPECIALIZED EQUIPMENT AND SUPPLIES O 618,094.72$ 1,136 $544 O 19,525.97$ 17 $1,149
SPECIALIZED PRIVATE DUTY NURSING O 1,077,376.65$ 11 $97,943 O -$ - $0
SUPPORTED EMPLOYMENT O 7,013,298.92$ 418 $16,778 O 134,890.78$ 10 $13,489
TRANSPORTATION O 6,546,502.60$ 1,787 $3,663 O 29,602.34$ 13 $2,277
ALL Waiver Services ** O $220,433,052 5,000 $44,087 O $31,650,793 1,337 $23,673
MMIS Category of ServiceMandatory
/ OptionalNet Claim Payments Recipients
Cost per
Client
Mandatory
/ Optional
Net Claim
Payments Recipients
Cost per
Client
ADVANCED NURSE PRACTITIONER M 6,577,883$ 11,140 590.47419 M 6,560,750$ 19,067 344.08925
DENTAL SERVICES M 21,816,257$ 19,183 1137.2704 M 35,627,346$ 43,398 820.94442
FAMILY PLANNING SERVICES M 79,236$ 125 633.88944 M 45,197$ 71 636.57746
FQHC M 4,391,756$ 6,959 631.09005 M 2,576,267$ 4,669 551.78132
HOME HEALTH SERVICES M 1,024,714$ 301 3404.3667 M 15,850$ 7 2264.2571
ICF SERVICES M 84,201,996$ 606 138947.19 M -$ 1 0
INPATIENT HOSPITAL SERVICES M 88,970,754$ 11,991 7419.7944 M 92,904,693$ 10,383 8947.7697
LABORATORY SERVICES M 2,706,109$ 11,283 239.83948 M 389,580$ 4,265 91.343479
MIDWIFERY SERVICES M 905,124$ 798 1134.241 M 240,639$ 403 597.11883
OUTPATIENT SURGERY SERVICE M 3,654,081$ 3,229 1131.6449 M 3,877,525$ 3,343 1159.8939
PHYSICIAN IHS CLINIC M 18,501,732$ 12,313 1502.6177 M 26,102,241$ 22,326 1169.1409
PHYSICIAN SERVICES M 66,490,404$ 42,049 1581.2601 M 50,051,148$ 61,048 819.86548
SHORT TERM LTC SERVICES M 2,294,872$ 84 27319.901 M -$ - 0
SNF SERVICES M 9,428,727$ 374 25210.499 M 3,730$ 1 3730.4
X-RAY SERVICES M 8,224$ 40 205.598 M 223$ 1 223.26
RURAL HEALTH SERVICES M 7,142$ 45 158.70267 M 947$ 6 157.80333
TRANSPORTATION SERVICES M 27,457,949$ 14,185 1935.7031 M 31,541,459$ 14,942 2110.9262
EPSDT SCREENING M -$ - 0 M 774$ 5 154.842
OUTPATIENT HOSPITAL SERVICES M 68,040,581$ 38,508 1766.9207 M 47,491,942$ 47,266 1004.7802
ACCOMMODATION SERVICES O 6,608,178$ 6,075 1,088 M 5,044,061$ 7,444 $678
CARE COORDINATION O 228$ 1 228 M 128,827$ 639 $202
CASE MANGEMENT SERVICES O 46,458$ 57 815 M 1,370,918$ 1,141 $1,202
CHIROPRACTIC SERVICES O 40,678$ 375 108 M 213,003$ 925 $230
DME SERVICES O 5,088,173$ 6,877 740 M 1,824,462$ 1,645 $1,109
DRUG ABUSE CENTER O 3,387,701$ 807 4,198 M 2,079,919$ 391 $5,319
ESRD SERVICES O 2,987,815$ 304 9,828 M (23,980)$ 3 -$7,993
HEARING SERVICES O 1,723,467$ 1,455 1,185 M 575,272$ 1,193 $482
HOSPICE CARE O 351,637$ 48 7,326 M 10,765$ 1 $10,765
ICF/MR SERVICES O 1,582,073$ 8 197,759 M 1,831,252$ 12 $152,604
INPATIENT PSYCHIATRIC SERVICES O 332,686$ 159 2,092 M 53,897,956$ 2,996 $17,990
MEDICAL SUPPLIES SERVICES O 7,547,539$ 7,473 1,010 M 4,513,167$ 2,949 $1,530
MENTAL HEALTH SERVICES O 25,856,093$ 5,838 4,429 M 66,494,673$ 6,493 $10,241
NUTRITION SERVICES O 10,176$ 163 62 M 44,437$ 1,282 $75
OCCUPATIONAL THERAPY O 115,945$ 135 859 M 3,808,036$ 1,081 $3,523
PERSONAL CARE SERVICES O 123,004,302$ 5,250 23,429 M 3,781,921$ 137 $27,605
PODIATRY O 81,479$ 963 85 M 143,892$ 323 $445
PRESCRIBED DRUGS O 43,338,211$ 31,397 1,380 M 23,075,312$ 48,193 $479
PRIVATE DUTY NURSING O (550)$ 1 (550) M 3,541,766$ 23 $153,990
PROSTHETICS AND ORTHOTICS O 781,620$ 505 1,548 M 546,571$ 397 $1,377
PSYCHOLOGY SERVICES O 474,611$ 540 879 M 2,224,831$ 1,172 $1,898
REHABILITATIVE SERVICES O 2,084,746$ 1,816 1,148 M 17,477,033$ 3,959 $4,415
RESIDENTIAL HABILITATION O M 381,000$ 39 $9,769
RESPITE CARE O M 4,047$ 4 $1,012
VISION SERVICES O 2,901,844$ 14,809 196 M 3,614,750$ 17,119 $211
Mandatory Services ** M $406,557,540 53,738 $7,566 M $494,034,201 92,013 $5,369
Optional Services (excluding waivers) ** O $228,345,109 42,433 $5,381 O $0 -
ALL Non-Waivers Services ** M + O $634,902,649 55,695 $11,400 M + O $494,034,201 92,013 $5,369
** (net total payments, unduplicated annual recipients, and average annual cost per client)
MMIS coding for categories of service approximates the types of required and optional services offered under Alaska Medicaid.
Source: DHSS, FMS, Budget Section, Medicaid Budget Group using MMIS/JUCE data for FY2013
Most clients use both required and optional services over the course of a year. The cost per client for combined Medicaid services was calculated as net claim
payments/unduplicated annual recipients.
FY13 MMIS Medicaid Claim Activity
Adults (21 or older) Children (under age 21)
Medicaid Waiver Services Only
Adults (21 or older) Children (under age 21)
Medicaid Services, excluding Waivers and CAMA
Appendix J
37
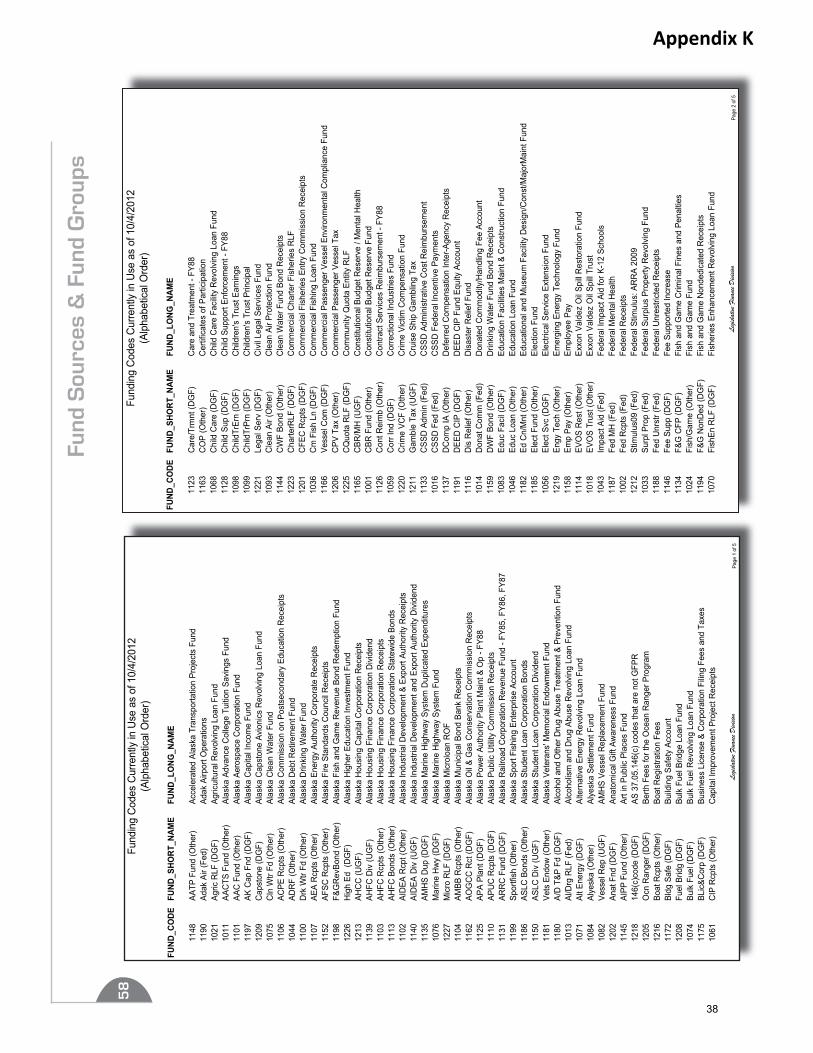
58
Fund
Sou
rces
& F
und
Gro
ups
Fund
ing
Cod
es C
urre
ntly
in U
se a
s of
10/
4/20
12(A
lpha
betic
al O
rder
)
FUND
_CODE
FUND
_SHO
RT_N
AME
FUND
_LONG
_NAM
E
1148
AATP
Fun
d (O
ther
)Ac
cele
rate
d Al
aska
Tra
nspo
rtatio
n Pr
ojec
ts F
und
1190
Adak
Air
(Fed
)Ad
ak A
irpor
t Ope
ratio
ns10
21Ag
ric R
LF (D
GF)
Agric
ultu
ral R
evol
ving
Loa
n Fu
nd10
11AA
CTS
Fun
d (O
ther
)Al
aska
Adv
ance
Col
lege
Tui
tion
Savi
ngs
Fund
1101
AAC
Fun
d (O
ther
)Al
aska
Aer
ospa
ce C
orpo
ratio
n Fu
nd11
97AK
Cap
Fnd
(DG
F)Al
aska
Cap
ital I
ncom
e Fu
nd12
09C
apst
one
(DG
F)Al
aska
Cap
ston
e Av
ioni
cs R
evol
ving
Loa
n Fu
nd10
75C
ln W
tr Fd
(Oth
er)
Alas
ka C
lean
Wat
er F
und
1106
ACPE
Rcp
ts (O
ther
)Al
aska
Com
mis
sion
on
Post
seco
ndar
y Ed
ucat
ion
Rec
eipt
s10
44AD
RF
(Oth
er)
Alas
ka D
ebt R
etire
men
t Fun
d11
00D
rk W
tr Fd
(Oth
er)
Alas
ka D
rinki
ng W
ater
Fun
d11
07AE
A R
cpts
(Oth
er)
Alas
ka E
nerg
y Au
thor
ity C
orpo
rate
Rec
eipt
s11
52AF
SC R
cpts
(Oth
er)
Alas
ka F
ire S
tand
ards
Cou
ncil
Rec
eipt
s11
98F&
GR
evBo
nd (O
ther
)Al
aska
Fis
h an
d G
ame
Rev
enue
Bon
d R
edem
ptio
n Fu
nd12
26H
igh
Ed (
DG
F)Al
aska
Hig
her E
duca
tion
Inve
stm
ent F
und
1213
AHC
C (U
GF)
Alas
ka H
ousi
ng C
apita
l Cor
pora
tion
Rec
eipt
s11
39AH
FC D
iv (U
GF)
Alas
ka H
ousi
ng F
inan
ce C
orpo
ratio
n D
ivid
end
1103
AHFC
Rcp
ts (O
ther
)Al
aska
Hou
sing
Fin
ance
Cor
pora
tion
Rec
eipt
s11
13AH
FC B
onds
(Oth
er)
Alas
ka H
ousi
ng F
inan
ce C
orpo
ratio
n St
atew
ide
Bond
s11
02AI
DEA
Rcp
t (O
ther
)Al
aska
Indu
stria
l Dev
elop
men
t & E
xpor
t Aut
horit
y R
ecei
pts
1140
AID
EA D
iv (U
GF)
Alas
ka In
dust
rial D
evel
opm
ent a
nd E
xpor
t Aut
horit
y D
ivid
end
1135
AMH
S D
up (D
GF)
Alas
ka M
arin
e H
ighw
ay S
yste
m D
uplic
ated
Exp
endi
ture
s10
76M
arin
e H
wy
(DG
F)Al
aska
Mar
ine
Hig
hway
Sys
tem
Fun
d12
27M
icro
RLF
(DG
F)Al
aska
Mic
rolo
an R
OF
1104
AMBB
Rcp
ts (O
ther
)Al
aska
Mun
icip
al B
ond
Bank
Rec
eipt
s11
62AO
GC
C R
ct (D
GF)
Alas
ka O
il &
Gas
Con
serv
atio
n C
omm
issi
on R
ecei
pts
1125
APA
Plan
t (D
GF)
Alas
ka P
ower
Aut
horit
y Pl
ant M
aint
& O
p - F
Y88
1110
APU
C R
cpts
(DG
F)Al
aska
Pub
lic U
tility
Com
mis
sion
Rec
eipt
s11
31AR
RC
Fun
d (D
GF)
Alas
ka R
ailro
ad C
orpo
ratio
n R
even
ue F
und
- FY8
5, F
Y86,
FY8
711
99Sp
ortfi
sh (O
ther
)Al
aska
Spo
rt Fi
shin
g En
terp
rise
Acco
unt
1186
ASLC
Bon
ds (O
ther
)Al
aska
Stu
dent
Loa
n C
orpo
ratio
n Bo
nds
1150
ASLC
Div
(UG
F)Al
aska
Stu
dent
Loa
n C
orpo
ratio
n D
ivid
end
1181
Vets
End
ow (O
ther
)Al
aska
Vet
eran
s' M
emor
ial E
ndow
men
t Fun
d11
80A/
D T
&P F
d (D
GF)
Alco
hol a
nd O
ther
Dru
g Ab
use
Trea
tmen
t & P
reve
ntio
n Fu
nd10
13Al
/Drg
RLF
(Fed
)Al
coho
lism
and
Dru
g Ab
use
Rev
olvi
ng L
oan
Fund
1071
Alt E
nerg
y (D
GF)
Alte
rnat
ive
Ener
gy R
evol
ving
Loa
n Fu
nd10
84Al
yesk
a (O
ther
)Al
yesk
a Se
ttlem
ent F
und
1082
Vess
el R
ep (U
GF)
AMH
S Ve
ssel
Rep
lace
men
t Fun
d12
02An
at F
nd (D
GF)
Anat
omic
al G
ift A
war
enes
s Fu
nd11
45AI
PP F
und
(Oth
er)
Art i
n Pu
blic
Pla
ces
Fund
1218
146(
c)co
de (D
GF)
AS 3
7.05
.146
(c) c
odes
that
are
not
GFP
R12
05O
cn R
ange
r (D
GF)
Berth
Fee
s fo
r the
Oce
an R
ange
r Pro
gram
1216
Boat
Rcp
ts (O
ther
)Bo
at R
egis
tratio
n Fe
es11
72Bl
dg S
afe
(DG
F)Bu
ildin
g Sa
fety
Acc
ount
1208
Fuel
Brid
g (D
GF)
Bulk
Fue
l Brid
ge L
oan
Fund
1074
Bulk
Fue
l (D
GF)
Bulk
Fue
l Rev
olvi
ng L
oan
Fund
1175
BLic
&Cor
p (D
GF)
Busi
ness
Lic
ense
& C
orpo
ratio
n Fi
ling
Fees
and
Tax
es10
61C
IP R
cpts
(Oth
er)
Cap
ital I
mpr
ovem
ent P
roje
ct R
ecei
pts
Legis
lative
Fina
nce D
ivisio
nPa
ge 1
of 5
Fund
ing
Cod
es C
urre
ntly
in U
se a
s of
10/
4/20
12(A
lpha
betic
al O
rder
)
FUND
_CODE
FUND
_SHO
RT_N
AME
FUND
_LONG
_NAM
E
1123
Car
e/Tr
mnt
(DG
F)C
are
and
Trea
tmen
t - F
Y88
1163
CO
P (O
ther
)C
ertif
icat
es o
f Par
ticip
atio
n10
68C
hild
Car
e (D
GF)
Chi
ld C
are
Faci
lity
Rev
olvi
ng L
oan
Fund
1128
Chi
ld S
up (D
GF)
Chi
ld S
uppo
rt En
forc
emen
t - F
Y88
1098
Chi
ldTr
Ern
(DG
F)C
hild
ren'
s Tr
ust E
arni
ngs
1099
Chi
ldTr
Prn
(DG
F)C
hild
ren'
s Tr
ust P
rinci
pal
1221
Lega
l Ser
v (D
GF)
Civ
il Le
gal S
ervi
ces
Fund
1093
Cle
an A
ir (O
ther
)C
lean
Air
Prot
ectio
n Fu
nd11
44C
WF
Bond
(Oth
er)
Cle
an W
ater
Fun
d Bo
nd R
ecei
pts
1223
Cha
rterR
LF (D
GF)
Com
mer
cial
Cha
rter F
ishe
ries
RLF
1201
CFE
C R
cpts
(DG
F)C
omm
erci
al F
ishe
ries
Entry
Com
mis
sion
Rec
eipt
s10
36C
m F
ish
Ln (D
GF)
Com
mer
cial
Fis
hing
Loa
n Fu
nd11
66Ve
ssel
Com
(DG
F)C
omm
erci
al P
asse
nger
Ves
sel E
nviro
nmen
tal C
ompl
ianc
e Fu
nd12
06C
PV T
ax (O
ther
)C
omm
erci
al P
asse
nger
Ves
sel T
ax12
25C
Quo
ta R
LF (D
GF)
Com
mun
ity Q
uota
Ent
ity R
LF11
65C
BR/M
H (U
GF)
Con
stitu
tiona
l Bud
get R
eser
ve /
Men
tal H
ealth
1001
CBR
Fun
d (O
ther
)C
onst
itutio
nal B
udge
t Res
erve
Fun
d11
26C
ont R
eim
b (O
ther
)C
ontra
ct S
ervi
ces
Rei
mbu
rsem
ent -
FY8
810
59C
orr I
nd (D
GF)
Cor
rect
iona
l Ind
ustri
es F
und
1220
Crim
e VC
F (O
ther
)C
rime
Vict
im C
ompe
nsat
ion
Fund
1211
Gam
ble
Tax
(UG
F)C
ruis
e Sh
ip G
ambl
ing
Tax
1133
CSS
D A
dmin
(Fed
)C
SSD
Adm
inis
trativ
e C
ost R
eim
burs
emen
t10
16C
SSD
Fed
(Fed
)C
SSD
Fed
eral
Ince
ntiv
e Pa
ymen
ts11
37D
Com
p IA
(Oth
er)
Def
erre
d C
ompe
nsat
ion
Inte
r-Age
ncy
Rec
eipt
s11
91D
EED
CIP
(DG
F)D
EED
CIP
Fun
d Eq
uity
Acc
ount
1116
Dis
Rel
ief (
Oth
er)
Dis
aste
r Rel
ief F
und
1014
Don
at C
omm
(Fed
)D
onat
ed C
omm
odity
/Han
dlin
g Fe
e Ac
coun
t11
59D
WF
Bond
(Oth
er)
Drin
king
Wat
er F
und
Bond
Rec
eipt
s10
83Ed
uc F
acil
(DG
F)Ed
ucat
ion
Faci
litie
s M
aint
& C
onst
ruct
ion
Fund
1046
Educ
Loa
n (O
ther
)Ed
ucat
ion
Loan
Fun
d11
82Ed
Cn/
Mnt
(Oth
er)
Educ
atio
nal a
nd M
useu
m F
acilit
y D
esig
n/C
onst
/Maj
orM
aint
Fun
d11
85El
ect F
und
(Oth
er)
Elec
tion
Fund
1056
Elec
t Svc
(DG
F)El
ectri
cal S
ervi
ce E
xten
sion
Fun
d12
19En
gy T
ech
(Oth
er)
Emer
ging
Ene
rgy
Tech
nolo
gy F
und
1158
Emp
Pay
(Oth
er)
Empl
oyee
Pay
1114
EVO
S R
est (
Oth
er)
Exxo
n Va
ldez
Oil
Spill
Res
tora
tion
Fund
1018
EVO
S Tr
ust (
Oth
er)
Exxo
n Va
ldez
Oil
Spill
Trus
t10
43Im
pact
Aid
(Fed
)Fe
dera
l Im
pact
Aid
for K
-12
Scho
ols
1187
Fed
MH
(Fed
)Fe
dera
l Men
tal H
ealth
1002
Fed
Rcp
ts (F
ed)
Fede
ral R
ecei
pts
1212
Stim
ulus
09 (F
ed)
Fede
ral S
timul
us: A
RR
A 20
0910
33Su
rpl P
rop
(Fed
)Fe
dera
l Sur
plus
Pro
perty
Rev
olvi
ng F
und
1188
Fed
Unr
str (
Fed)
Fede
ral U
nres
trict
ed R
ecei
pts
1146
Fee
Supp
(DG
F)Fe
e Su
ppor
ted
Incr
ease
1134
F&G
CFP
(DG
F)Fi
sh a
nd G
ame
Crim
inal
Fin
es a
nd P
enal
ties
1024
Fish
/Gam
e (O
ther
)Fi
sh a
nd G
ame
Fund
1194
F&G
Non
Ded
(DG
F)Fi
sh a
nd G
ame
Non
dedi
cate
d R
ecei
pts
1070
Fish
En R
LF (D
GF)
Fish
erie
s En
hanc
emen
t Rev
olvi
ng L
oan
Fund
Legis
lative
Fina
nce D
ivisio
nPa
ge 2
of 5
Appendix K
38
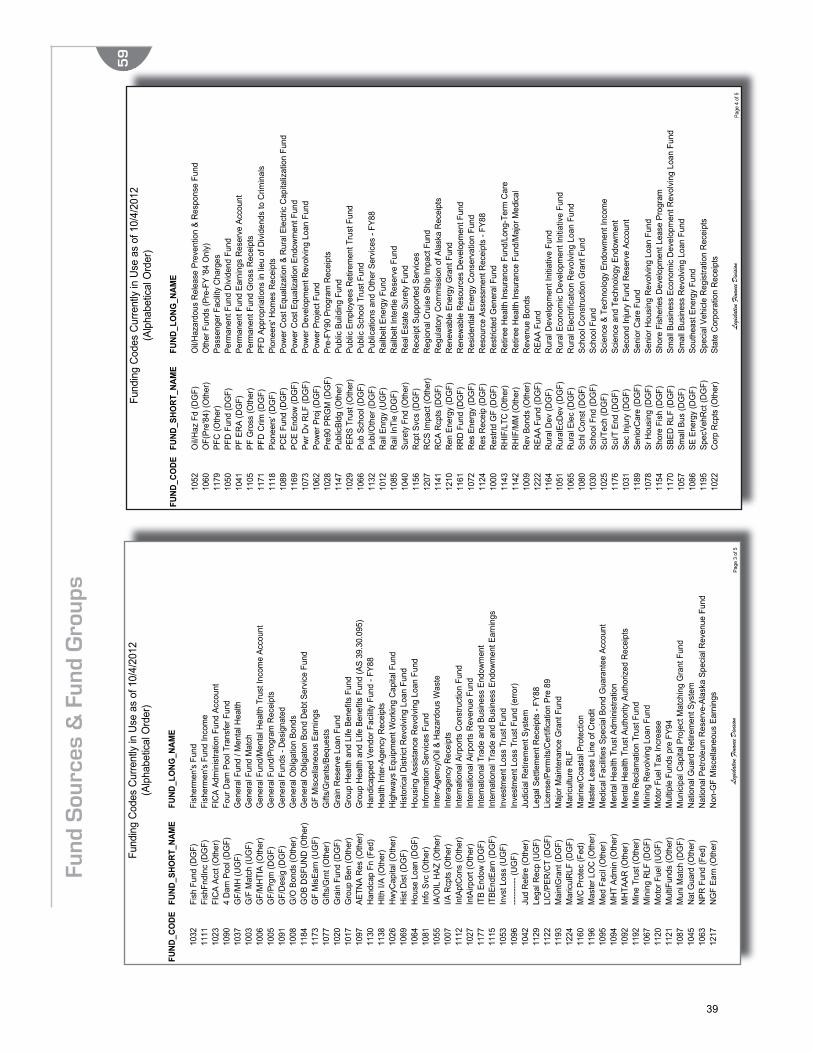
59
Fund
ing
Cod
es C
urre
ntly
in U
se a
s of
10/
4/20
12(A
lpha
betic
al O
rder
)
FUND
_CODE
FUND
_SHO
RT_N
AME
FUND
_LONG
_NAM
E
1032
Fish
Fun
d (D
GF)
Fish
erm
en's
Fund
1111
Fish
FndI
nc (D
GF)
Fish
erm
en's
Fund
Inco
me
1023
FIC
A Ac
ct (O
ther
)FI
CA
Adm
inis
tratio
n Fu
nd A
ccou
nt10
904
Dam
Poo
l (D
GF)
Four
Dam
Poo
l Tra
nsfe
r Fun
d10
37G
F/M
H (U
GF)
Gen
eral
Fun
d / M
enta
l Hea
lth10
03G
/F M
atch
(UG
F)G
ener
al F
und
Mat
ch10
06G
F/M
HTI
A (O
ther
)G
ener
al F
und/
Men
tal H
ealth
Tru
st In
com
e Ac
coun
t10
05G
F/Pr
gm (D
GF)
Gen
eral
Fun
d/Pr
ogra
m R
ecei
pts
1091
GF/
Des
ig (D
GF)
Gen
eral
Fun
ds -
Des
igna
ted
1008
G/O
Bon
ds (O
ther
)G
ener
al O
blig
atio
n Bo
nds
1184
GO
B D
SFU
ND
(Oth
er)
Gen
eral
Obl
igat
on B
ond
Deb
t Ser
vice
Fun
d11
73G
F M
isEa
rn (U
GF)
GF
Mis
cella
neou
s Ea
rnin
gs10
77G
ifts/
Grn
t (O
ther
)G
ifts/
Gra
nts/
Bequ
ests
1020
Gra
in F
und
(DG
F)G
rain
Res
erve
Loa
n Fu
nd10
17G
roup
Ben
(Oth
er)
Gro
up H
ealth
and
Life
Ben
efits
Fun
d10
97AE
TNA
Res
(Oth
er)
Gro
up H
ealth
and
Life
Ben
efits
Fun
d (A
S 39
.30.
095)
1130
Han
dcap
Fn
(Fed
)H
andi
capp
ed V
endo
r Fac
ility
Fund
- FY
8811
38H
lth I/
A (O
ther
)H
ealth
Inte
r-Age
ncy
Rec
eipt
s10
26H
wyC
apita
l (O
ther
)H
ighw
ays
Equi
pmen
t Wor
king
Cap
ital F
und
1069
His
t Dis
t (D
GF)
His
toric
al D
istri
ct R
evol
ving
Loa
n Fu
nd10
64H
ouse
Loa
n (D
GF)
Hou
sing
Ass
ista
nce
Rev
olvi
ng L
oan
Fund
1081
Info
Svc
(Oth
er)
Info
rmat
ion
Serv
ices
Fun
d10
55IA
/OIL
HAZ
(Oth
er)
Inte
r-Age
ncy/
Oil
& H
azar
dous
Was
te10
07I/A
Rcp
ts (O
ther
)In
tera
genc
y R
ecei
pts
1112
IntA
ptC
ons
(Oth
er)
Inte
rnat
iona
l Airp
orts
Con
stru
ctio
n Fu
nd10
27In
tAirp
ort (
Oth
er)
Inte
rnat
iona
l Airp
orts
Rev
enue
Fun
d11
77IT
B En
dow
(DG
F)In
tern
atio
nal T
rade
and
Bus
ines
s En
dow
men
t11
15IT
BEnd
Earn
(DG
F)In
tern
atio
nal T
rade
and
Bus
ines
s En
dow
men
t Ear
ning
s10
53In
vst L
oss
(UG
F)In
vest
men
t Los
s Tr
ust F
und
1096
------
---- (
UG
F)In
vest
men
t Los
s Tr
ust F
und
(erro
r)10
42Ju
d R
etire
(Oth
er)
Judi
cial
Ret
irem
ent S
yste
m11
29Le
gal R
ecp
(UG
F)Le
gal S
ettle
men
t Rec
eipt
s - F
Y88
1122
LIC
/PER
/CT
(DG
F)Li
cens
e/Pe
rmits
/Cer
tific
atio
n Pr
e 89
1193
Mai
ntG
rant
(DG
F)M
ajor
Mai
nten
ance
Gra
nt F
und
1224
Mar
icul
RLF
(DG
F)M
aric
ultu
re R
LF11
60M
/C P
rote
c (F
ed)
Mar
ine/
Coa
stal
Pro
tect
ion
1196
Mas
ter L
OC
(Oth
er)
Mas
ter L
ease
Lin
e of
Cre
dit
1095
Med
Fac
il (O
ther
)M
edic
al F
acilit
ies
Spec
ial B
ond
Gua
rant
ee A
ccou
nt10
94M
HT
Adm
in (O
ther
)M
enta
l Hea
lth T
rust
Adm
inis
tratio
n10
92M
HTA
AR (O
ther
)M
enta
l Hea
lth T
rust
Aut
horit
y Au
thor
ized
Rec
eipt
s11
92M
ine
Trus
t (O
ther
)M
ine
Rec
lam
atio
n Tr
ust F
und
1067
Min
ing
RLF
(DG
F)M
inin
g R
evol
ving
Loa
n Fu
nd11
20M
otor
Fue
l (U
GF)
Mot
or F
uel T
ax In
crea
se11
21M
ultiF
unds
(Oth
er)
Mul
tiple
Fun
ds p
re F
Y94
1087
Mun
i Mat
ch (D
GF)
Mun
icip
al C
apita
l Pro
ject
Mat
chin
g G
rant
Fun
d10
45N
at G
uard
(Oth
er)
Nat
iona
l Gua
rd R
etire
men
t Sys
tem
1063
NPR
Fun
d (F
ed)
Nat
iona
l Pet
role
um R
eser
ve-A
lask
a Sp
ecia
l Rev
enue
Fun
d12
17N
GF
Earn
(Oth
er)
Non
-GF
Mis
cella
neou
s Ea
rnin
gs
Legis
lative
Fina
nce D
ivisio
nPa
ge 3
of 5
Fund
Sou
rces
& F
und
Gro
ups
Fund
ing
Cod
es C
urre
ntly
in U
se a
s of
10/
4/20
12(A
lpha
betic
al O
rder
)
FUND
_CODE
FUND
_SHO
RT_N
AME
FUND
_LONG
_NAM
E
1052
Oil/
Haz
Fd
(DG
F)O
il/H
azar
dous
Rel
ease
Pre
vent
ion
& R
espo
nse
Fund
1060
OF(
Pre'
84) (
Oth
er)
Oth
er F
unds
(Pre
-FY
'84
Onl
y)11
79PF
C (O
ther
)Pa
ssen
ger F
acilit
y C
harg
es10
50PF
D F
und
(DG
F)Pe
rman
ent F
und
Div
iden
d Fu
nd10
41PF
ER
A (D
GF)
Perm
anen
t Fun
d Ea
rnin
gs R
eser
ve A
ccou
nt11
05PF
Gro
ss (O
ther
)Pe
rman
ent F
und
Gro
ss R
ecei
pts
1171
PFD
Crim
(DG
F)PF
D A
ppro
pria
tions
in li
eu o
f Div
iden
ds to
Crim
inal
s11
18Pi
onee
rs' (
DG
F)Pi
onee
rs' H
omes
Rec
eipt
s10
89PC
E Fu
nd (D
GF)
Pow
er C
ost E
qual
izat
ion
& R
ural
Ele
ctric
Cap
italiz
atio
n Fu
nd11
69PC
E En
dow
(DG
F)Po
wer
Cos
t Equ
aliz
atio
n En
dow
men
t Fun
d10
73Pw
r Dv
RLF
(DG
F)Po
wer
Dev
elop
men
t Rev
olvi
ng L
oan
Fund
1062
Pow
er P
roj (
DG
F)Po
wer
Pro
ject
Fun
d10
28Pr
e90
PRG
M (D
GF)
Pre-
FY90
Pro
gram
Rec
eipt
s11
47Pu
blic
Bldg
(Oth
er)
Publ
ic B
uild
ing
Fund
1029
PER
S Tr
ust (
Oth
er)
Publ
ic E
mpl
oyee
s R
etire
men
t Tru
st F
und
1066
Pub
Scho
ol (D
GF)
Publ
ic S
choo
l Tru
st F
und
1132
Publ
/Oth
er (D
GF)
Publ
icat
ions
and
Oth
er S
ervi
ces
- FY8
810
12R
ail E
nrgy
(UG
F)R
ailb
elt E
nerg
y Fu
nd10
85R
ail I
nTie
(DG
F)R
ailb
elt I
nter
tie R
eser
ve F
und
1040
Sure
ty F
nd (O
ther
)R
eal E
stat
e Su
rety
Fun
d11
56R
cpt S
vcs
(DG
F)R
ecei
pt S
uppo
rted
Serv
ices
1207
RC
S Im
pact
(Oth
er)
Reg
iona
l Cru
ise
Ship
Impa
ct F
und
1141
RC
A R
cpts
(DG
F)R
egul
ator
y C
omm
issi
on o
f Ala
ska
Rec
eipt
s12
10R
en E
nerg
y (D
GF)
Ren
ewab
le E
nerg
y G
rant
Fun
d11
61R
RD
Fun
d (D
GF)
Ren
ewab
le R
esou
rces
Dev
elop
men
t Fun
d10
72R
es E
nerg
y (D
GF)
Res
iden
tial E
nerg
y C
onse
rvat
ion
Fund
1124
Res
Rec
eip
(DG
F)R
esou
rce
Asse
ssm
ent R
ecei
pts
- FY8
810
00R
estrt
d G
F (D
GF)
Res
trict
ed G
ener
al F
und
1143
RH
IF/L
TC (O
ther
)R
etire
e H
ealth
Insu
ranc
e Fu
nd/L
ong-
Term
Car
e11
42R
HIF
/MM
(Oth
er)
Ret
iree
Hea
lth In
sura
nce
Fund
/Maj
or M
edic
al10
09R
ev B
onds
(Oth
er)
Rev
enue
Bon
ds12
22R
EAA
Fund
(DG
F)R
EAA
Fund
1164
Rur
al D
ev (D
GF)
Rur
al D
evel
opm
ent I
nitia
tive
Fund
1051
Rur
alEc
Dev
(DG
F)R
ural
Eco
nom
ic D
evel
opm
ent I
nitia
tive
Fund
1065
Rur
al E
lec
(DG
F)R
ural
Ele
ctrif
icat
ion
Rev
olvi
ng L
oan
Fund
1080
Schl
Con
st (D
GF)
Scho
ol C
onst
ruct
ion
Gra
nt F
und
1030
Scho
ol F
nd (D
GF)
Scho
ol F
und
1025
Sci/T
ech
(DG
F)Sc
ienc
e &
Tech
nolo
gy E
ndow
men
t Inc
ome
1176
Sci/T
End
(DG
F)Sc
ienc
e an
d Te
chno
logy
End
owm
ent
1031
Sec
Inju
ry (D
GF)
Seco
nd In
jury
Fun
d R
eser
ve A
ccou
nt11
89Se
nior
Car
e (D
GF)
Seni
or C
are
Fund
1078
Sr H
ousi
ng (D
GF)
Seni
or H
ousi
ng R
evol
ving
Loa
n Fu
nd11
54Sh
ore
Fish
(DG
F)Sh
ore
Fish
erie
s D
evel
opm
ent L
ease
Pro
gram
1170
SBED
RLF
(DG
F)Sm
all B
usin
ess
Econ
omic
Dev
elop
men
t Rev
olvi
ng L
oan
Fund
1057
Smal
l Bus
(DG
F)Sm
all B
usin
ess
Rev
olvi
ng L
oan
Fund
1086
SE E
nerg
y (D
GF)
Sout
heas
t Ene
rgy
Fund
1195
Spec
VehR
ct (D
GF)
Spec
ial V
ehic
le R
egis
tratio
n R
ecei
pts
1022
Cor
p R
cpts
(Oth
er)
Stat
e C
orpo
ratio
n R
ecei
pts
Legis
lative
Fina
nce D
ivisio
nPa
ge 4
of 5
39
60
Fund
Sou
rces
& F
und
Gro
ups
Fund
ing
Cod
es C
urre
ntly
in U
se a
s of
10/
4/20
12(A
lpha
betic
al O
rder
)
FUND
_CODE
FUND
_SHO
RT_N
AME
FUND
_LONG
_NAM
E
1153
Stat
e La
nd (D
GF)
Stat
e La
nd D
ispo
sal I
ncom
e Fu
nd10
19R
efor
est (
DG
F)St
ate
Land
Ref
ores
tatio
n Fu
nd10
54ST
EP (D
GF)
Stat
e Tr
aini
ng &
Em
ploy
men
t Pro
gram
1108
Stat
Des
ig (O
ther
)St
atut
ory
Des
igna
ted
Prog
ram
Rec
eipt
s11
36SB
S IA
(Oth
er)
Supp
lem
enta
l Ben
efits
Sys
tem
s In
ter-A
genc
y R
ecei
pts
1178
tem
p co
de (D
GF)
tem
pora
ry c
ode
1034
Teac
h R
et (O
ther
)Te
ache
rs R
etire
men
t Tru
st F
und
1151
VoTe
ch E
d (D
GF)
Tech
nica
l Voc
atio
nal E
duca
tion
Prog
ram
Rec
eipt
s11
09Te
st F
ish
(DG
F)Te
st F
ishe
ries
Rec
eipt
s11
55Ti
mbe
r Rcp
(DG
F)Ti
mbe
r Sal
e R
ecei
pts
1119
Toba
c Se
tl (U
GF)
Toba
cco
Settl
emen
t11
67To
bSet
Sale
(Oth
er)
Toba
cco
Settl
emen
t Rev
enue
Sal
e11
68To
b ED
/CES
(DG
F)To
bacc
o U
se E
duca
tion
and
Ces
satio
n Fu
nd10
58To
ur R
LF (D
GF)
Tour
ism
Rev
olvi
ng L
oan
Fund
1049
Trng
Bld
g (D
GF)
Trai
ning
and
Bui
ldin
g Fu
nd11
49TA
PL (F
ed)
Tran
s-Al
aska
Pip
elin
e Sy
stem
Lia
bilit
y Fu
nd11
83Tr
ans
Proj
(Oth
er)
Tran
spor
tatio
n Pr
ojec
t Fun
d12
28U
GFS
eque
st (U
GF)
UG
F As
soci
ated
with
Seq
uest
ratio
n10
79Ta
nk R
LF (D
GF)
Und
ergr
ound
Sto
rage
Tan
k R
evol
ving
Loa
n Fu
nd12
15U
CR
Rcp
ts (O
ther
)U
nifie
d C
arrie
r Reg
istra
tion
Rec
eipt
s10
88U
nInc
Mtc
h (D
GF)
Uni
ncor
pora
ted
Com
mun
ity C
apita
l Mat
chin
g G
rant
Fun
d10
15U
A/D
FA S
VC (D
GF)
Uni
vers
ity o
f Ala
ska
Dor
mito
ry/F
ood/
Auxi
liary
Ser
vice
1039
UA/
ICR
(DG
F)U
nive
rsity
of A
lask
a In
dire
ct C
ost R
ecov
ery
1010
UA/
INT
INC
(DG
F)U
nive
rsity
of A
lask
a In
tere
st In
com
e11
74U
A I/A
(Oth
er)
Uni
vers
ity o
f Ala
ska
Intra
-Age
ncy
Tran
sfer
s10
48U
niv
Rcp
t (D
GF)
Uni
vers
ity o
f Ala
ska
Res
trict
ed R
ecei
pts
1038
UA/
STF
SVC
(DG
F)U
nive
rsity
of A
lask
a St
uden
t Tui
tion/
Fees
/Ser
vice
s10
04G
en F
und
(UG
F)U
nres
trict
ed G
ener
al F
und
Rec
eipt
s11
27U
ser F
ees
(DG
F)U
ser F
ees
- FY8
810
47SS
BG (F
ed)
USH
HS
Soci
al S
ervi
ces
Bloc
k G
rant
1200
VehR
ntlT
ax (D
GF)
Vehi
cle
Ren
tal T
ax R
ecei
pts
1035
Vets
RLF
(DG
F)Ve
tera
ns R
evol
ving
Loa
n Fu
nd11
17Vo
c Sm
Bus
(Oth
er)
Voca
tiona
l Reh
abilit
atio
n Sm
all B
usin
ess
Ente
rpris
e Fu
nd12
14W
hitT
unne
l (O
ther
)W
hitti
er T
unne
l Tol
ls12
03W
CBe
nGF
(DG
F)W
orke
rs C
ompe
nsat
ion
Bene
fits
Gua
rant
ee F
und
1157
Wrk
rs S
afe
(DG
F)W
orke
rs S
afet
y an
d C
ompe
nsat
ion
Adm
inis
tratio
n Ac
coun
t
Legis
lative
Fina
nce D
ivisio
nPa
ge 5
of 5
THE SWISS ARMY
KNIF
E G
UID
E T
O B
UDGETS
40
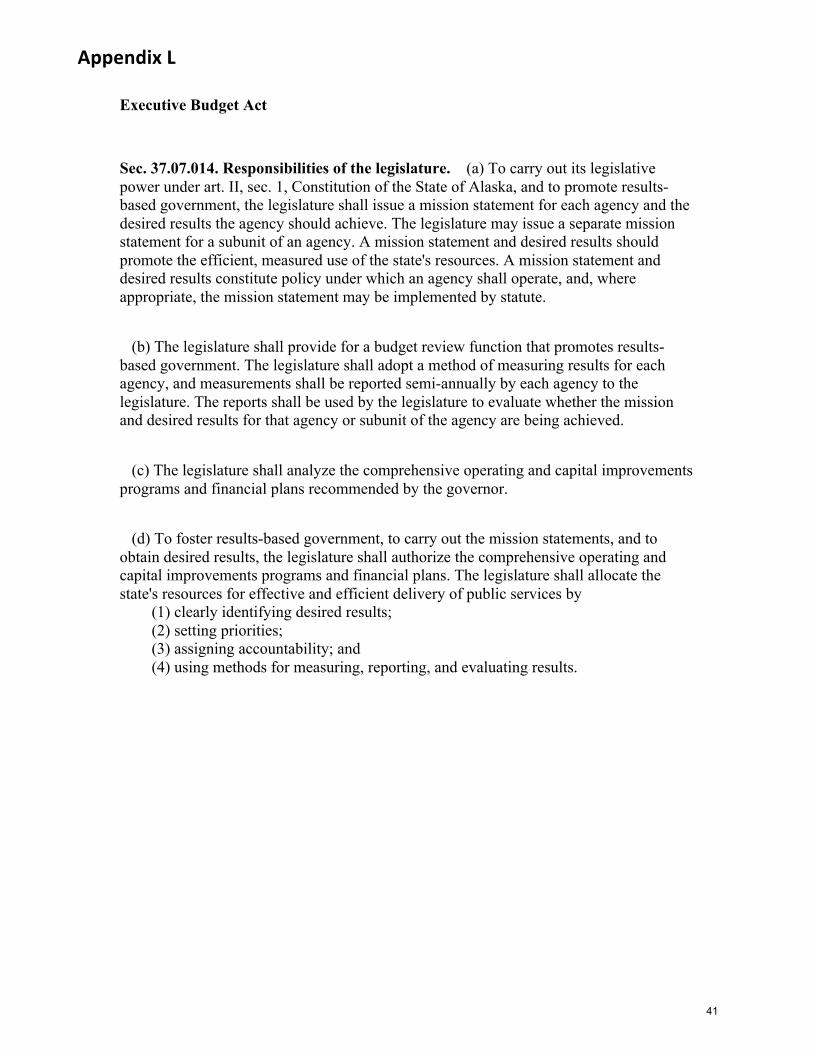
Appendix L
Executive Budget Act
Sec. 37.07.014. Responsibilities of the legislature. (a) To carry out its legislative power under art. II, sec. 1, Constitution of the State of Alaska, and to promote results-based government, the legislature shall issue a mission statement for each agency and the desired results the agency should achieve. The legislature may issue a separate mission statement for a subunit of an agency. A mission statement and desired results should promote the efficient, measured use of the state's resources. A mission statement and desired results constitute policy under which an agency shall operate, and, where appropriate, the mission statement may be implemented by statute.
(b) The legislature shall provide for a budget review function that promotes results-based government. The legislature shall adopt a method of measuring results for each agency, and measurements shall be reported semi-annually by each agency to the legislature. The reports shall be used by the legislature to evaluate whether the mission and desired results for that agency or subunit of the agency are being achieved.
(c) The legislature shall analyze the comprehensive operating and capital improvements programs and financial plans recommended by the governor.
(d) To foster results-based government, to carry out the mission statements, and to obtain desired results, the legislature shall authorize the comprehensive operating and capital improvements programs and financial plans. The legislature shall allocate the state's resources for effective and efficient delivery of public services by (1) clearly identifying desired results; (2) setting priorities; (3) assigning accountability; and (4) using methods for measuring, reporting, and evaluating results.
41
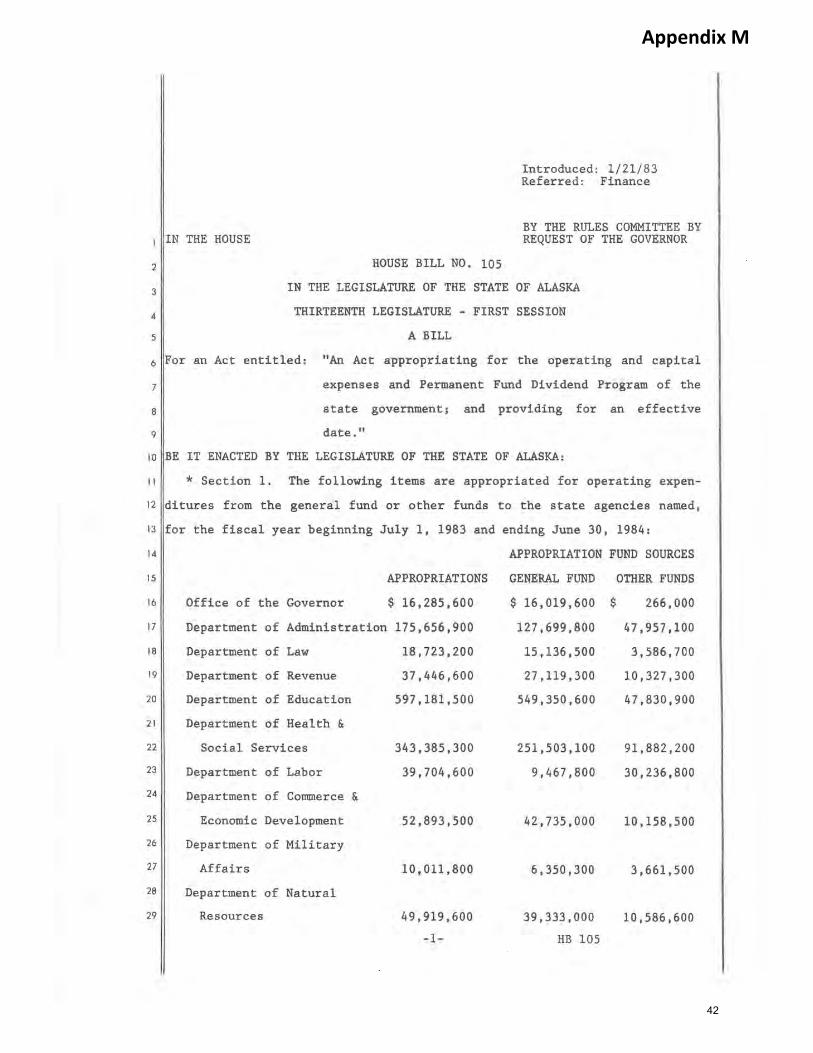
Appendix M
42
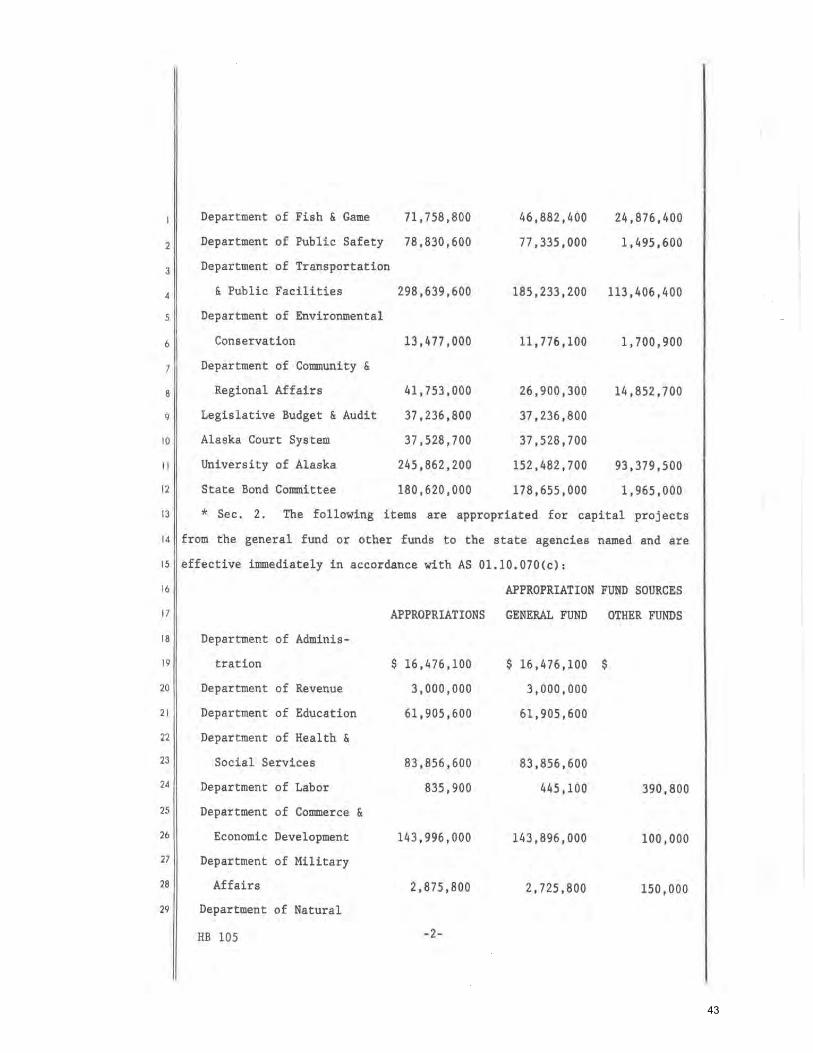
2
3
4
5
6
7
8
9
10
11
12
Department of Fish & Game
Department of Public Safety
Department of Transportation
71,758,800
78,830,600
& Public Facilities 298,639,600
Department of Environmental
Conservation 13,477,000
Department of Community &
Regional Affairs 41,753,000
Legislative Budget & Audit 37,236,800
Alaska Court System 37,528,700
University of Alaska 245,862,200
State Bond Committee 180,620,000
46,882,400
77. 335. 000
185,233,200
11,776,100
26,900,300
37,236,800
37,528,700
152,482,700
178,655,000
24,876,400
1,495,600
113,406,400
1,700,900
14,852,700
93,379,500
1,965,000
13 * Sec. 2. The following items are appropriated for capital projects
14 from the general fund or other funds to the state agencies named and are
15 effective immediately in accordance with AS Ol.10.070(c):
16 APPROPRIATION FUND SOURCES
17
18 Department of Adminis-
19
20
21
22
23
24
tration
Department of Revenue
Department of Education
Department of Health &
Social Services
Department of Labor
25 Department of Commerce &
26
27
28
Economic Development
Department of Military
Affairs
29 Department of Natural
RB 105
APPROPRIATIONS
$ 16,476,100
3,000,000
61,905,600
83,856,600
835,900
143,996,000
2,875,800
-2-
GENERAL FUND
$ 16,476,100 $
3,000,000
61,905,600
83,856,600
445,100
143,896,000
2,725,800
OTHER FUNDS
390,800
100,000
150,000
43
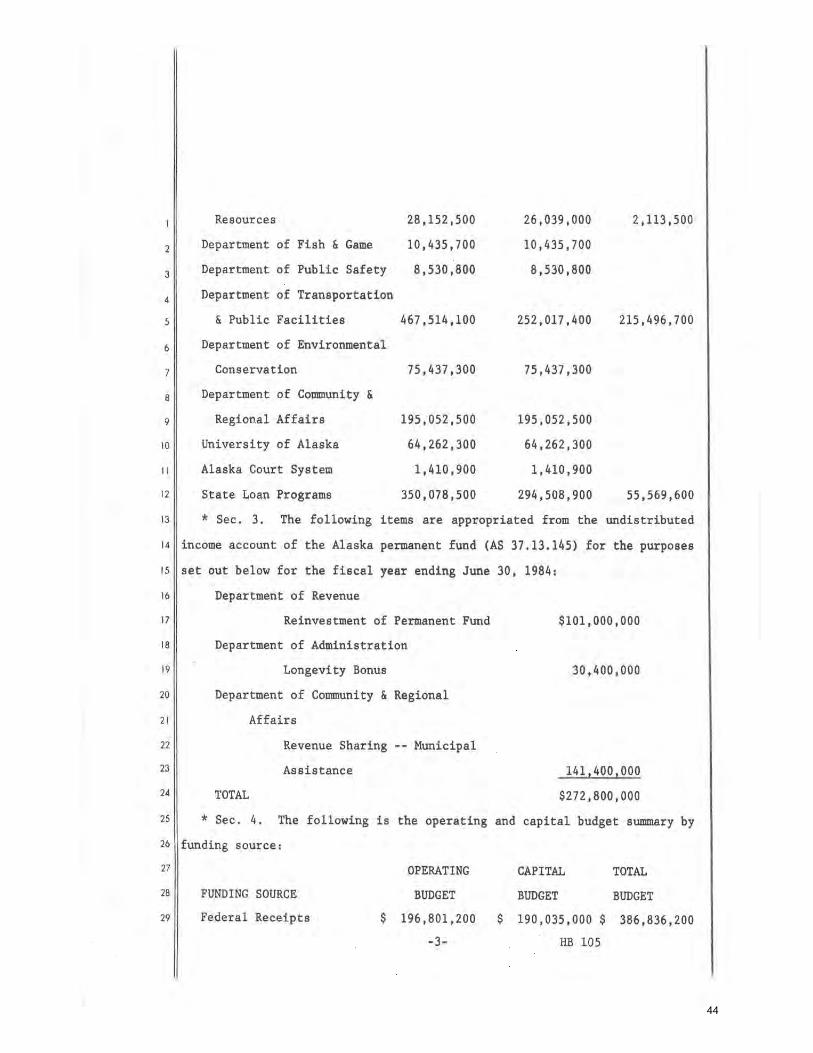
2
3
4
5
Resources
Department of Fish & Game
Department of Public Safety
Department of Transportation
& Public Facilities
6 Department of Environmental
7 Conservation
8 Department of Community &
9
10
11
12
Regional Affairs
University of Alaska
Alaska Court System
State Loan Programs
28,152,500
10,435,700
8,530,800
467,514,100
75,437,300
195,052,500
64,262,300
1,410,900
350,078,500
26,039,000
10,435,700
8,530,800
252,017,400
75,437,300
195,052,500
64,262,300
1,410,900
294,508,900
2,113,500
215,496,700
55,569,600
13 * Sec. 3. The following items are appropriated from the undistributed
14 income account of the Alaska permanent fund (AS 37.13.145) for the purposes
15 set out below for the fiscal year ending June 30, 1984:
16 Department of Revenue
17 Reinvestment of Permanent Fund
18 Department of Administration
19 Longevity Bonus
20 Department of Community & Regional
21 Affairs
22 Revenue Sharing -- Municipal
23
24 TOTAL
Assistance
$101,000,000
30,400,000
141,400,000
$272,800,000
25 * Sec. 4. The following is the operating and capital budget summary by
26 funding source:
27 OPERATING CAPITAL TOTAL
28 FUNDING SOURCE BUDGET BUDGET BUDGET
29 Federal Receipts $ 196,801,200 $ 190,035,000 $ 386,836,200
-3- HB 105
44
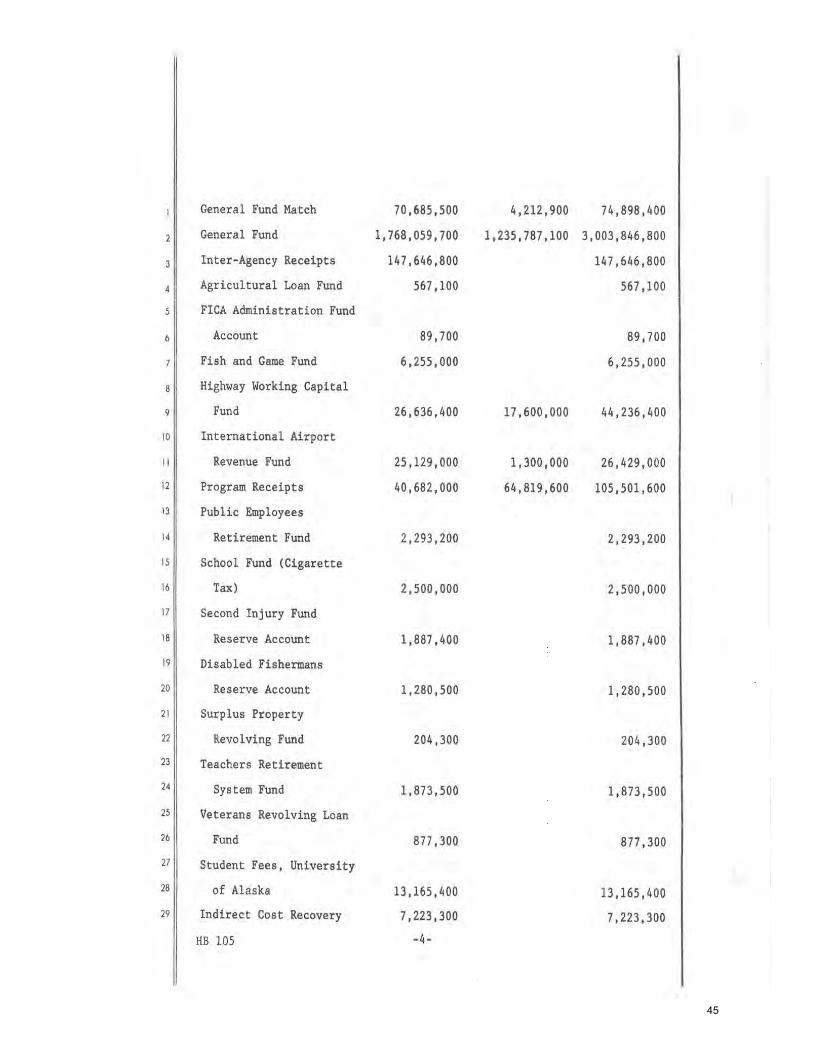
General Fund Match 70,685,500 4,212,900 74,898,400
2 General Fund 1,768,059,700 1,235,787,100 3,003,846,800
3 Inter-Agency Receipts 147,646,800 147,646,800
4 Agricultural Loan Fund 567,100 567,100
5 FICA Administration Fund
6 Account 89,700 89,700
7 Fish and Game Fund 6,255,000 6,255,000
8 Highway Working Capital
9 Fund 26,636,400 17,600,000 44,236,400
10 International Airport
11 Revenue Fund 25,129,000 1,300,000 26,429,000
12 Program Receipts 40,682,000 64,819,600 105,501,600
13 Public Employees
14 Retirement Fund 2,293,200 2,293,200
15 School Fund (Cigarette
16 Tax) 2,500,000 2,500,000
17 Second Injury Fund
18 Reserve Account 1,887,400 1,887,400
19 Disabled Fishermans
20 Reserve Account 1,280,500 1,280,500
21 Surplus Property
22 Revolving Fund 204,300 204,300
23 Teachers Retirement
24 System Fund 1,873,500 1,873,500
25 Veterans Revolving Loan
26 Fund 877. 300 877 ,300
27 Student Fees, University
28 of Alaska 13,165,400 13,165,400
29 Indirect Cost Recovery 7,223,300 7,223,300
HB 105 -4-45
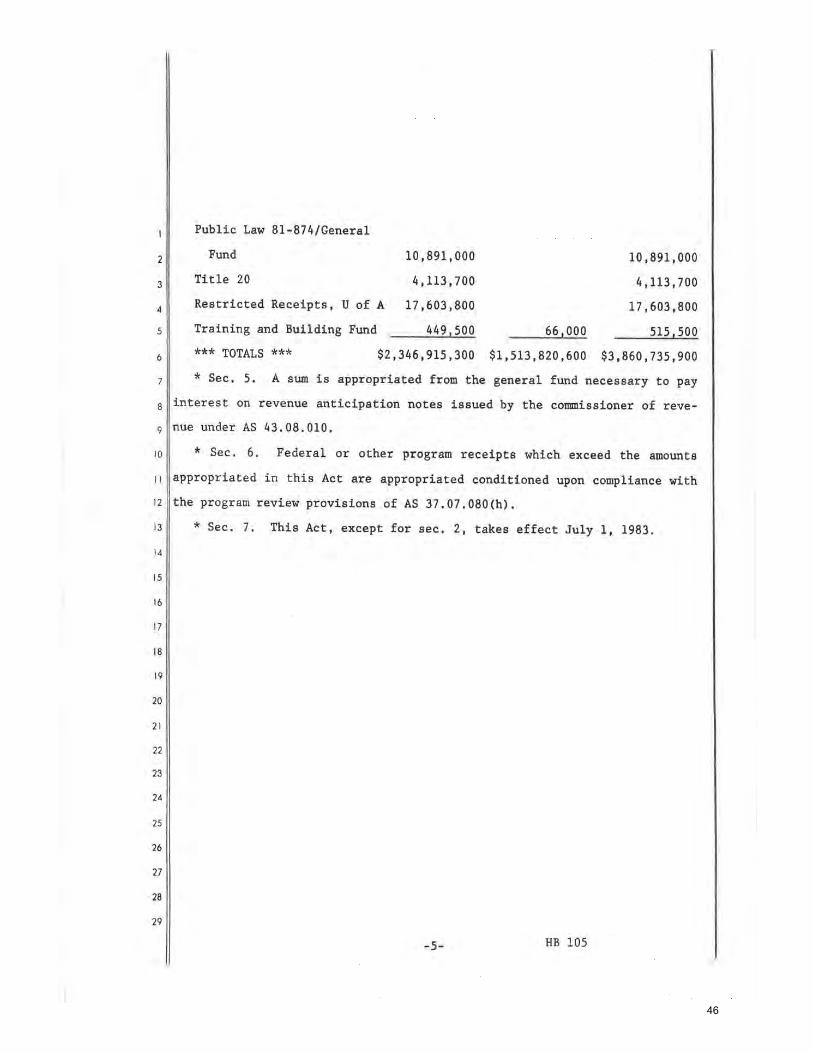
2
3
4
5
6
Public Law 81-874/General
Fund 10,891,000
Title 20 4,113,700
Restricted Receipts, U of A 17,603,800
Training and Building Fund 449,500
*** TOTALS *** $2,346,915,300
66,000
$1,513,820,600
10,891,000
4,113,700
17,603,800
515,500
$3,860,735,900
7 * Sec. 5. A sum is appropriated from the general fund necessary to pay
8 interest on revenue anticipation notes issued by the commissioner of reve-
9 nue under AS 43.08.010.
10 * Sec. 6. Federal or other program receipts which exceed the amounts
11 appropriated in this Act are appropriated conditioned upon compliance with
12 the program review provisions of AS 37.07.080(h).
13 * Sec. 7. This Act, except for sec. 2, takes effect July 1, 1983.
14
15
16
17
18
19
20
21
22
23
24
25
26
27
28
29
-5- HB 105
46
42
Commonwealth North is a non-profit corporation, organized and existing under the
laws of the State of Alaska. Non-partisan in nature, its purpose is to inject
enlightened vitality into the world of commerce and public policy. As well as
providing a forum for State and National speakers, working committees study critical
issues facing Alaska and prepare well-researched action papers, such as this one.
Commonwealth North
711 M Street, Suite 104 • Anchorage, Alaska 99501
Tel: (907) 258-9522 • Fax: (907) 276-6350 • [email protected]