Embed Size (px)
Citation preview
1 1© 2003 Thomson© 2003 Thomson/South-Western/South-Western Slide Slide
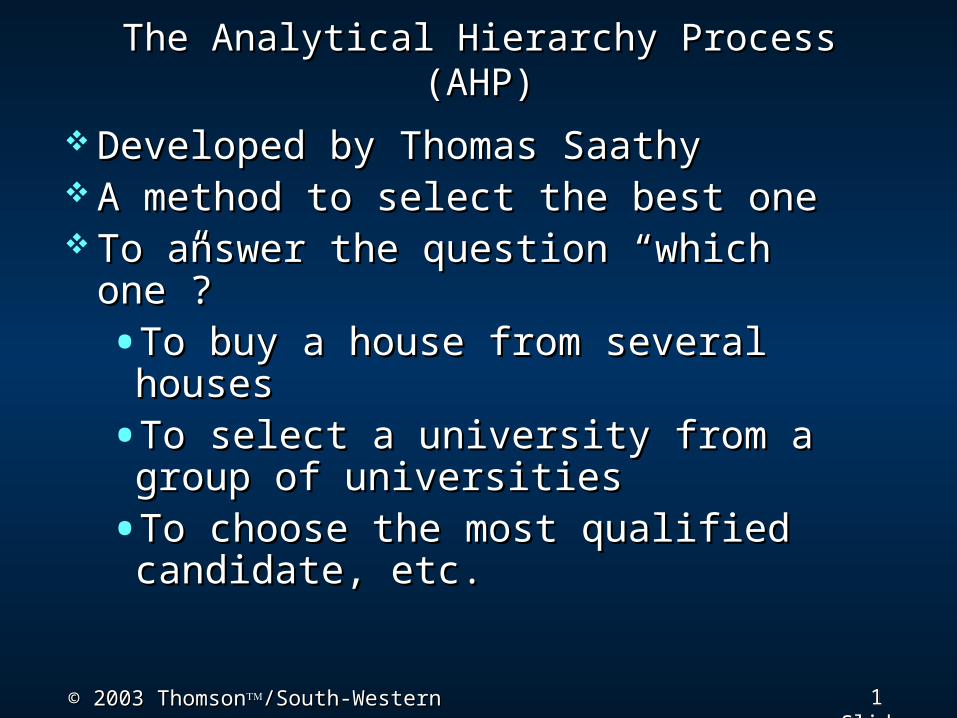
The Analytical Hierarchy Process (AHP)The Analytical Hierarchy Process (AHP)
Developed by Thomas SaathyDeveloped by Thomas Saathy A method to select the best one A method to select the best one To answer the question “which one”?To answer the question “which one”?
•To buy a house from several To buy a house from several houseshouses
•To select a university from a group To select a university from a group of universitiesof universities
•To choose the most qualified To choose the most qualified candidate, etc.candidate, etc.

2 2© 2003 Thomson© 2003 Thomson/South-Western/South-Western Slide Slide
The Analytical Hierarchy Process The Analytical Hierarchy Process (AHP)(AHP)
AHP is a method to generate a AHP is a method to generate a numerical score to rank each numerical score to rank each decision alternativesdecision alternatives
The numerical score can be The numerical score can be calculated manually or can use calculated manually or can use excelexcel
3 3© 2003 Thomson© 2003 Thomson/South-Western/South-Western Slide Slide
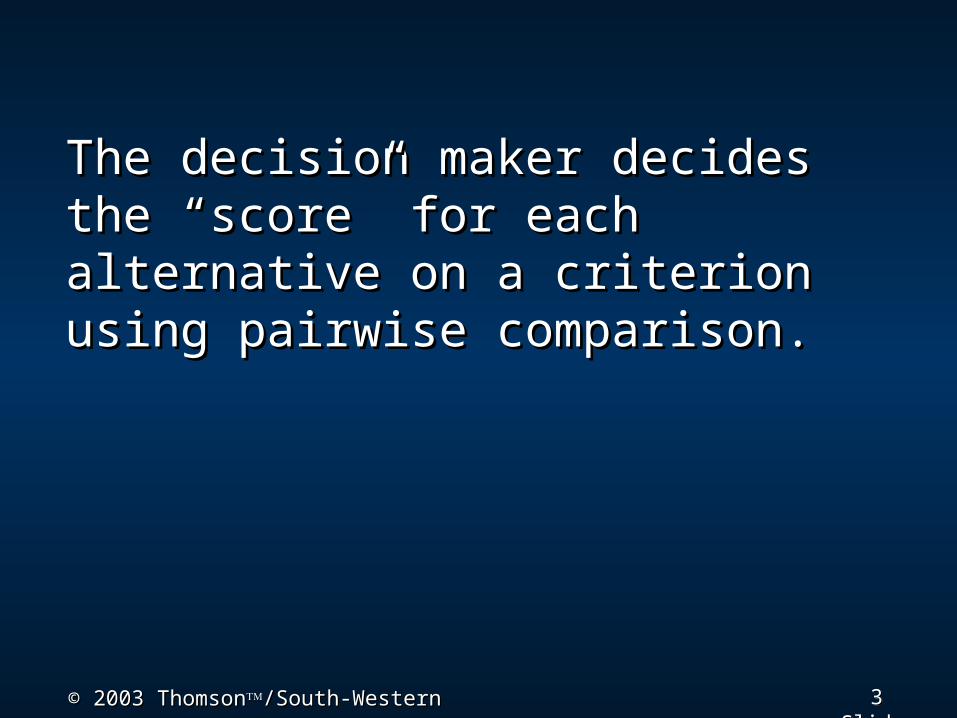
The decision maker decides the The decision maker decides the “score” for each alternative on a “score” for each alternative on a criterion using pairwise criterion using pairwise comparison.comparison.
4 4© 2003 Thomson© 2003 Thomson/South-Western/South-Western Slide Slide
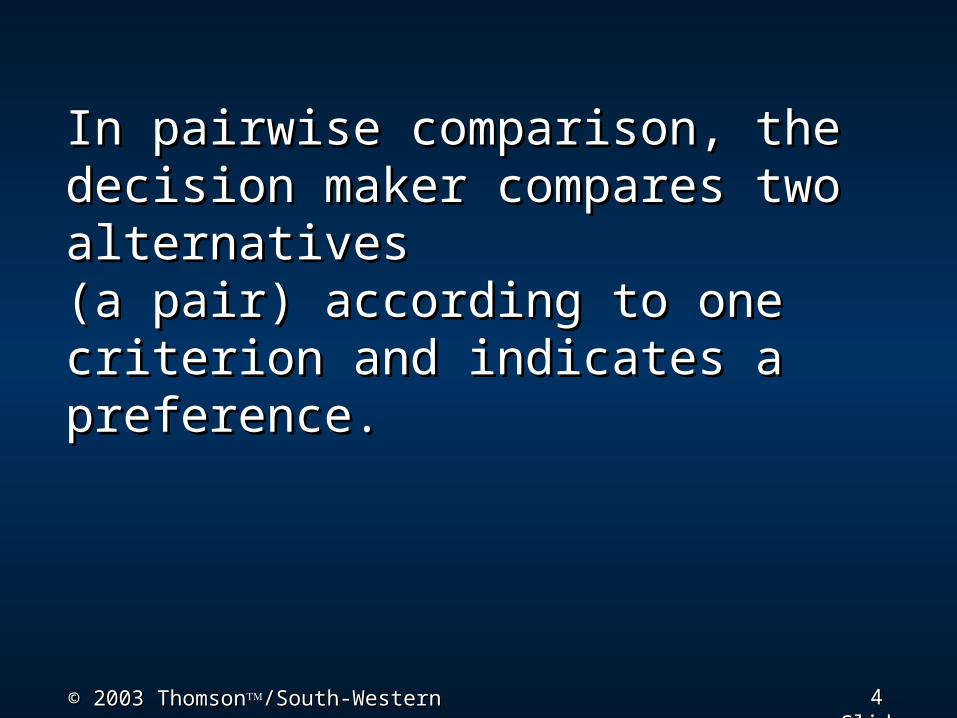
In pairwise comparison, the In pairwise comparison, the decision maker compares two decision maker compares two alternatives alternatives (a pair) according to one criterion (a pair) according to one criterion and indicates a preference. and indicates a preference.
5 5© 2003 Thomson© 2003 Thomson/South-Western/South-Western Slide Slide
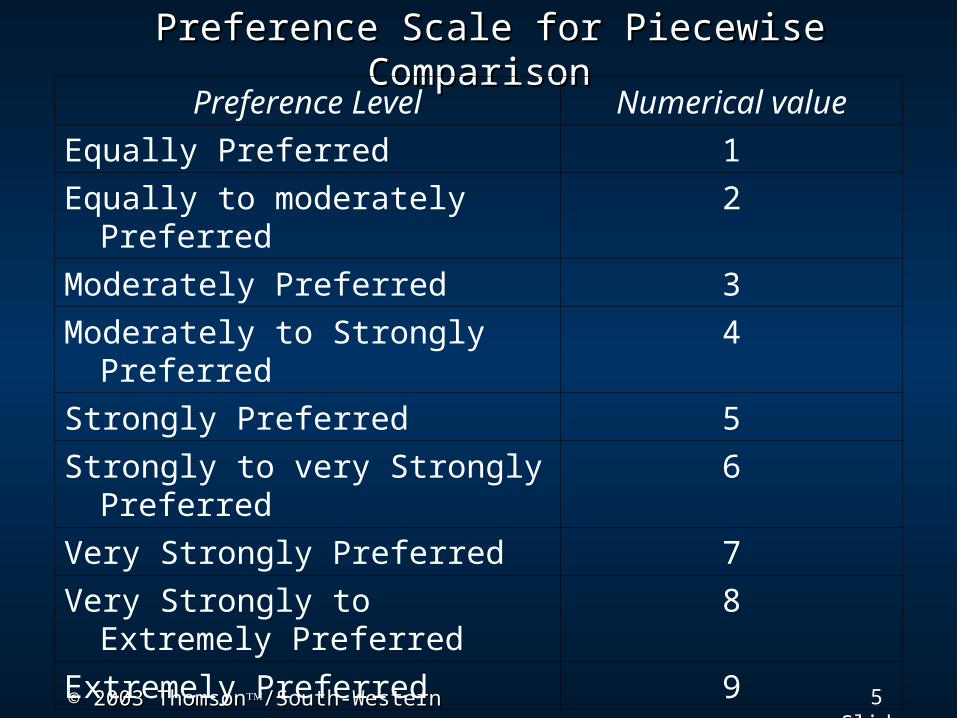
Preference Scale for Piecewise ComparisonPreference Scale for Piecewise ComparisonPreference Level Numerical value
Equally Preferred 1
Equally to moderately Preferred
2
Moderately Preferred 3
Moderately to Strongly Preferred
4
Strongly Preferred 5
Strongly to very Strongly Preferred
6
Very Strongly Preferred 7
Very Strongly to Extremely Preferred
8
Extremely Preferred 9
6 6© 2003 Thomson© 2003 Thomson/South-Western/South-Western Slide Slide
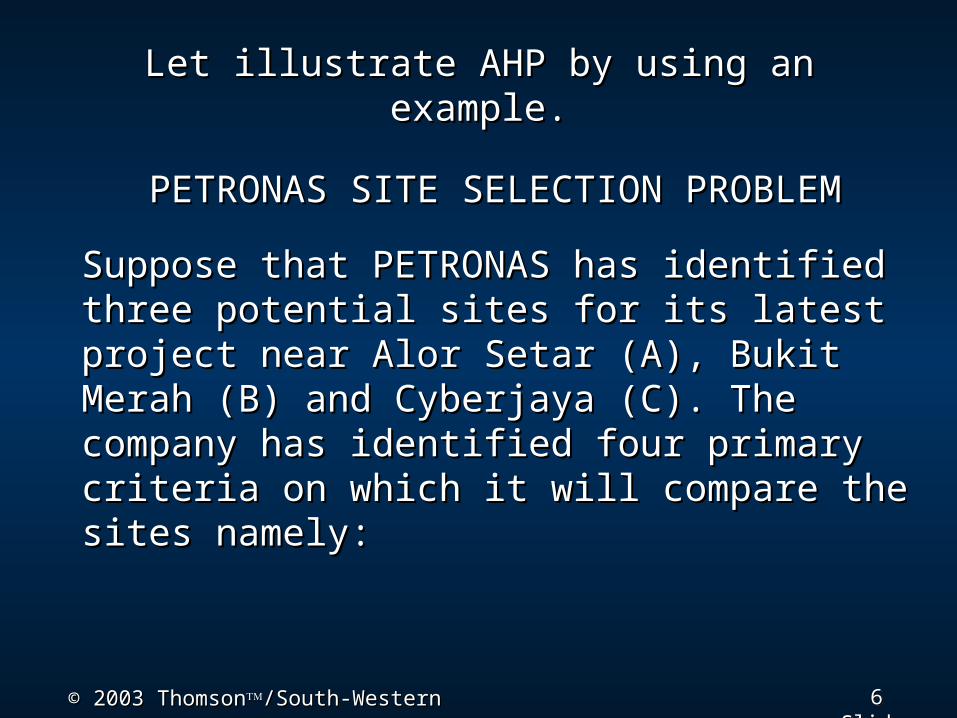
Let illustrate AHP by using an example.Let illustrate AHP by using an example.
Suppose that PETRONAS has identified Suppose that PETRONAS has identified three potential sites for its latest project three potential sites for its latest project near Alor Setar (A), Bukit Merah (B) and near Alor Setar (A), Bukit Merah (B) and Cyberjaya (C). The company has identified Cyberjaya (C). The company has identified four primary criteria on which it will four primary criteria on which it will compare the sites namely:compare the sites namely:
PETRONAS SITE SELECTION PROBLEMPETRONAS SITE SELECTION PROBLEM
7 7© 2003 Thomson© 2003 Thomson/South-Western/South-Western Slide Slide
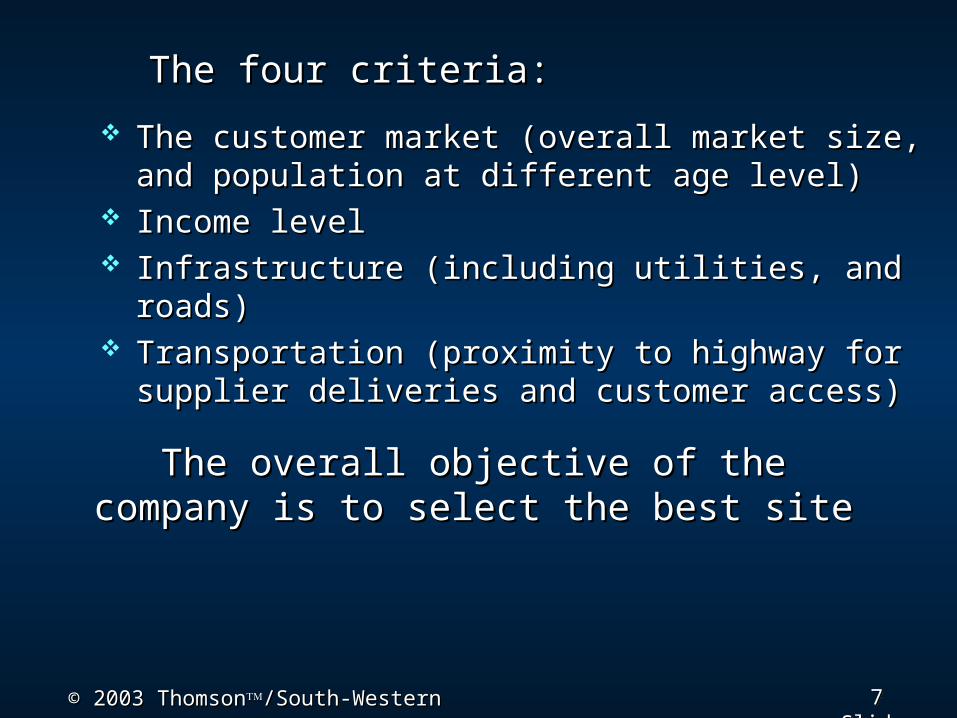
The customer market (overall market size, and The customer market (overall market size, and population at different age level)population at different age level)
Income levelIncome level Infrastructure (including utilities, and roads)Infrastructure (including utilities, and roads) Transportation (proximity to highway for supplier Transportation (proximity to highway for supplier
deliveries and customer access)deliveries and customer access)
The overall objective of the company is to The overall objective of the company is to select the best siteselect the best site
The four criteria:The four criteria:
8 8© 2003 Thomson© 2003 Thomson/South-Western/South-Western Slide Slide
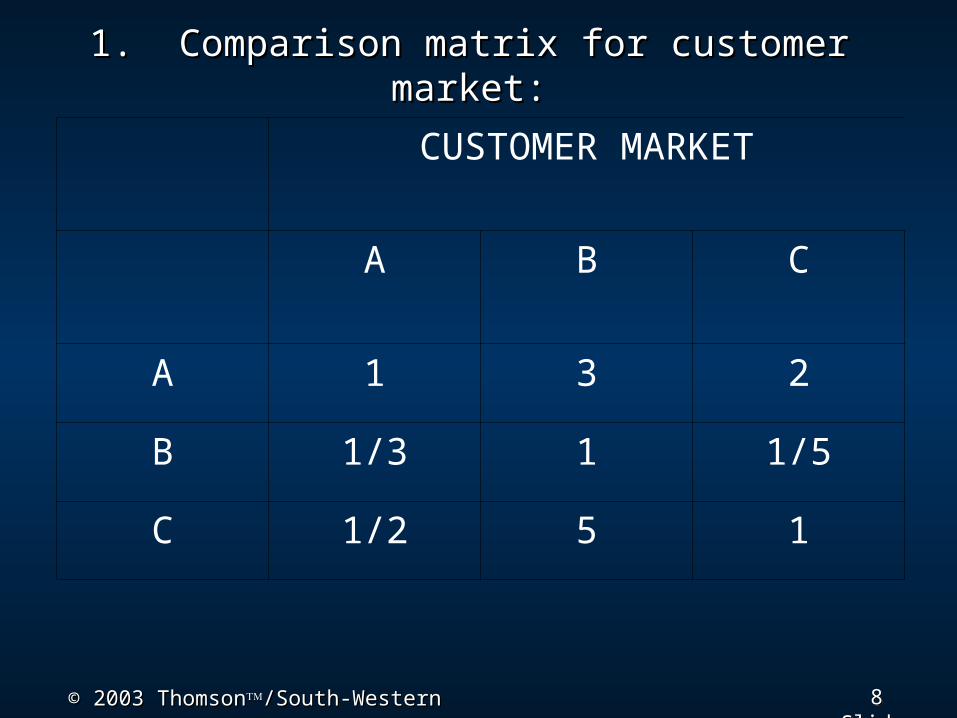
1. Comparison matrix for customer market:1. Comparison matrix for customer market:
CUSTOMER MARKET
A B C
A 1 3 2
B 1/3 1 1/5
C 1/2 5 1
9 9© 2003 Thomson© 2003 Thomson/South-Western/South-Western Slide Slide
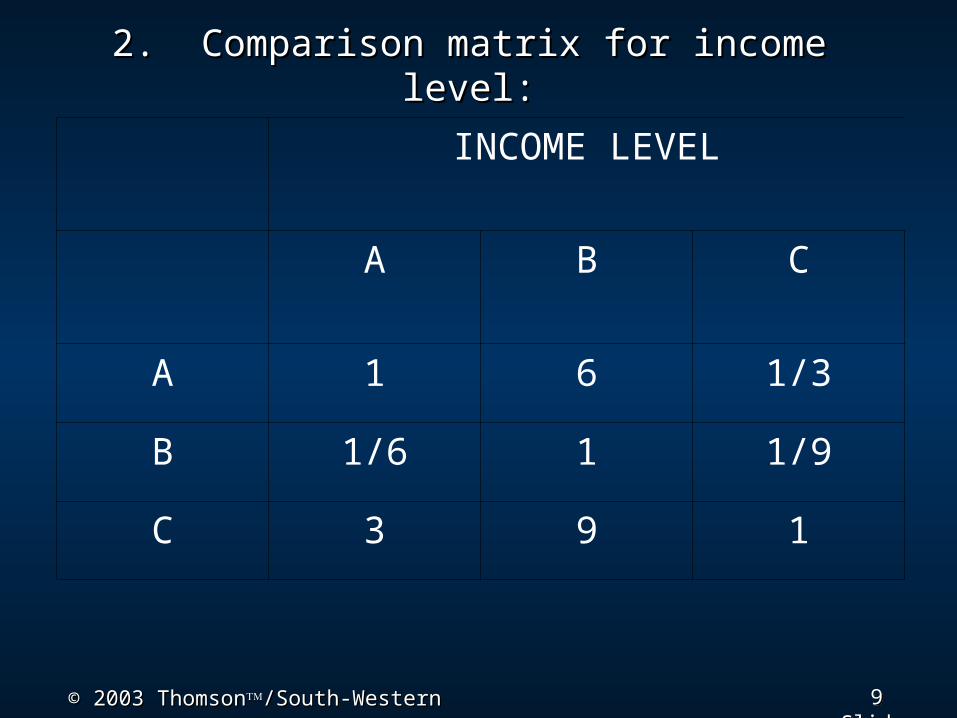
2. Comparison matrix for income level:2. Comparison matrix for income level:
INCOME LEVEL
A B C
A 1 6 1/3
B 1/6 1 1/9
C 3 9 1
10 10© 2003 Thomson© 2003 Thomson/South-Western/South-Western Slide Slide
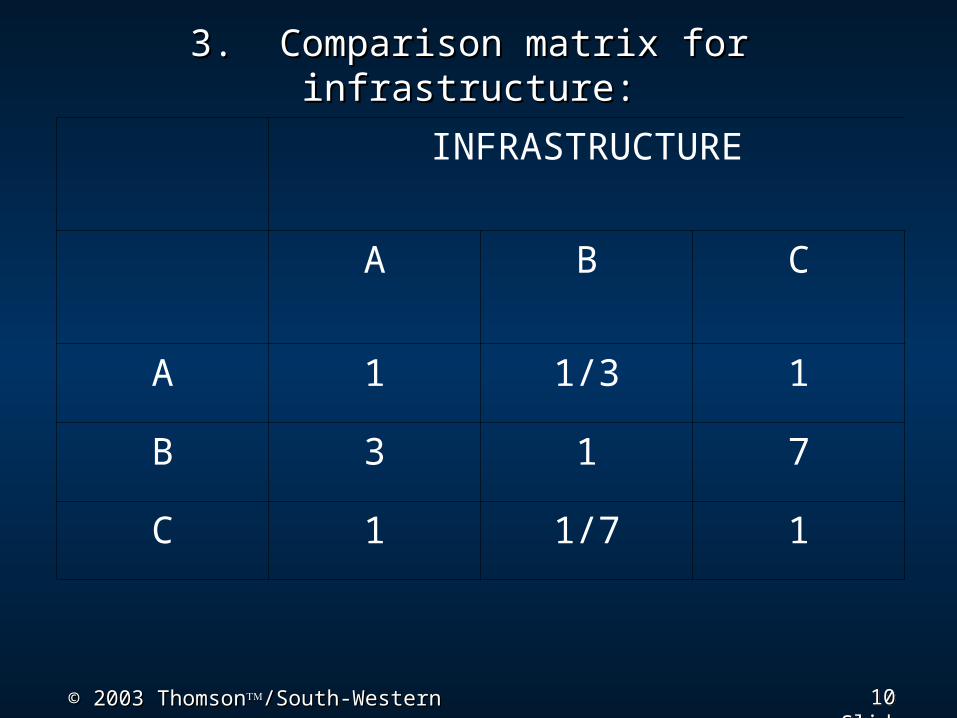
3. Comparison matrix for infrastructure:3. Comparison matrix for infrastructure:
INFRASTRUCTURE
A B C
A 1 1/3 1
B 3 1 7
C 1 1/7 1
11 11© 2003 Thomson© 2003 Thomson/South-Western/South-Western Slide Slide
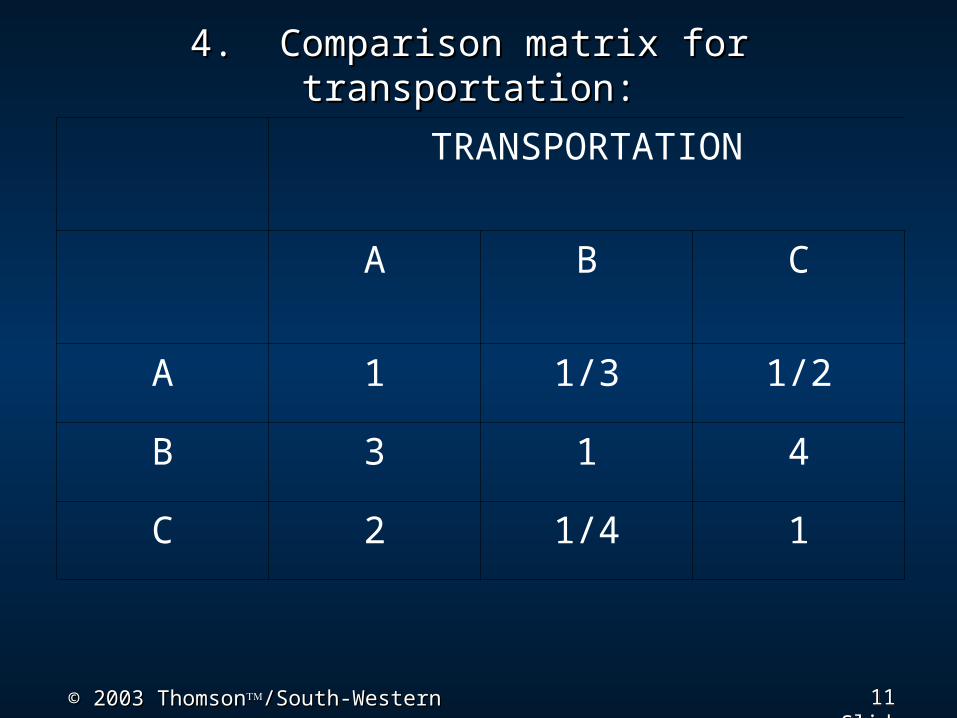
4. Comparison matrix for transportation:4. Comparison matrix for transportation:
TRANSPORTATION
A B C
A 1 1/3 1/2
B 3 1 4
C 2 1/4 1

12 12© 2003 Thomson© 2003 Thomson/South-Western/South-Western Slide Slide
Let us do Let us do synthesizationsynthesization: decision : decision alternatives are prioritized within each alternatives are prioritized within each
criterion.criterion.STEP 1STEP 1 CUSTOMER MARKET
A B C
A 1 3 2
B 1/3 1 1/5
C 1/2 5 1
Total 11/6 9 16/5
13 13© 2003 Thomson© 2003 Thomson/South-Western/South-Western Slide Slide
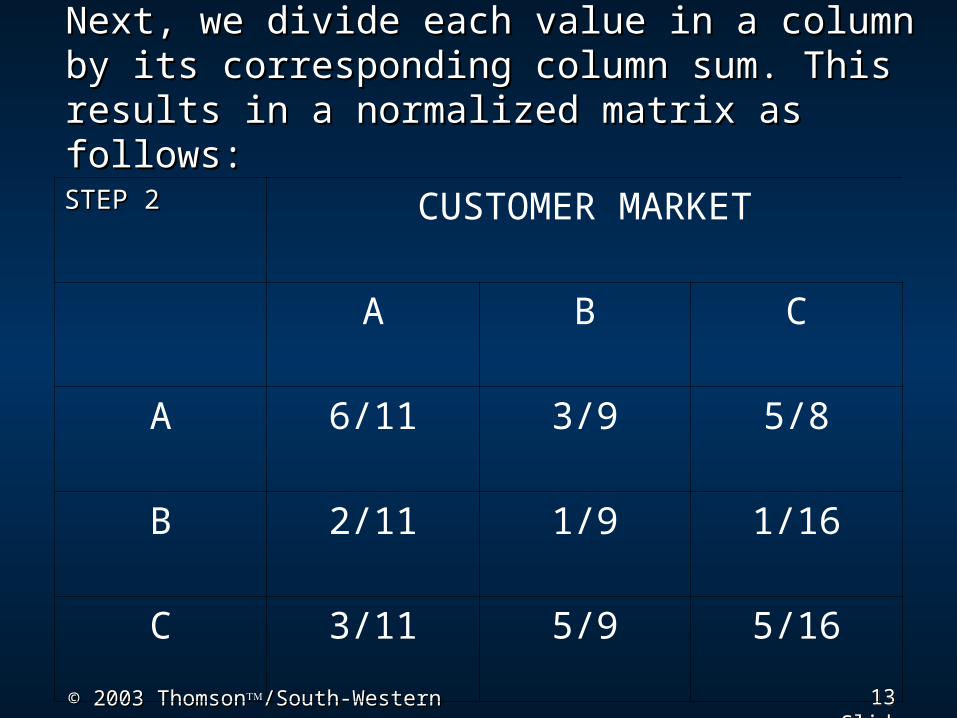
Next, we divide each value in a column by its Next, we divide each value in a column by its corresponding column sum. This results in a corresponding column sum. This results in a normalized matrix as follows:normalized matrix as follows:
STEP 2STEP 2 CUSTOMER MARKET
A B C
A 6/11 3/9 5/8
B 2/11 1/9 1/16
C 3/11 5/9 5/16
14 14© 2003 Thomson© 2003 Thomson/South-Western/South-Western Slide Slide
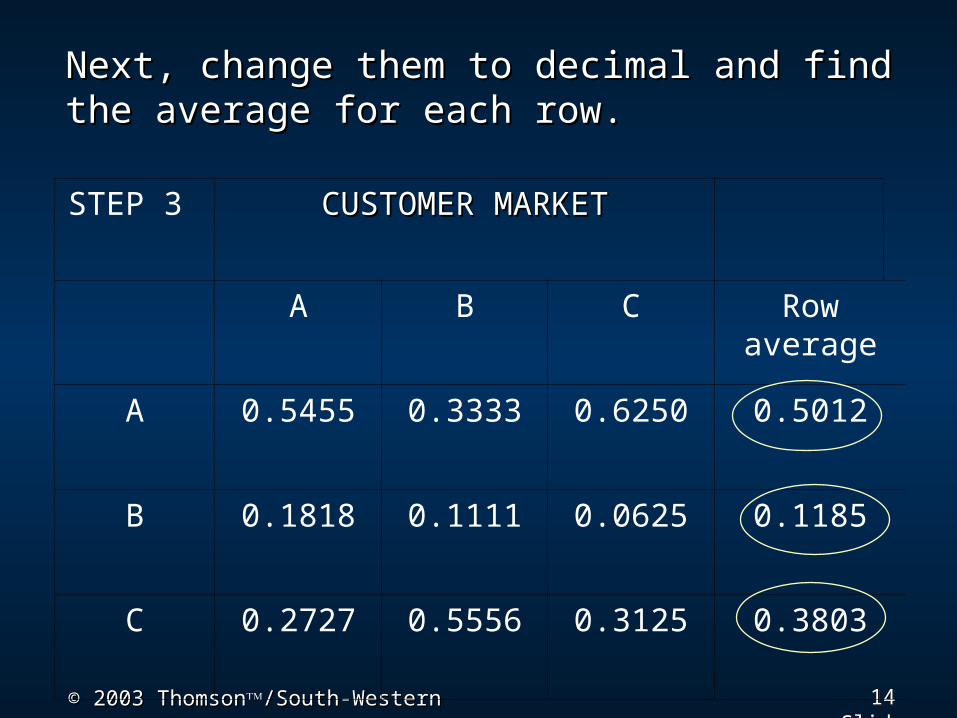
Next, change them to decimal and find the Next, change them to decimal and find the average for each row.average for each row.
STEP 3 CUSTOMER MARKETCUSTOMER MARKET
A B C Rowaverage
A 0.5455 0.3333 0.6250 0.5012
B 0.1818 0.1111 0.0625 0.1185
C 0.2727 0.5556 0.3125 0.3803
15 15© 2003 Thomson© 2003 Thomson/South-Western/South-Western Slide Slide
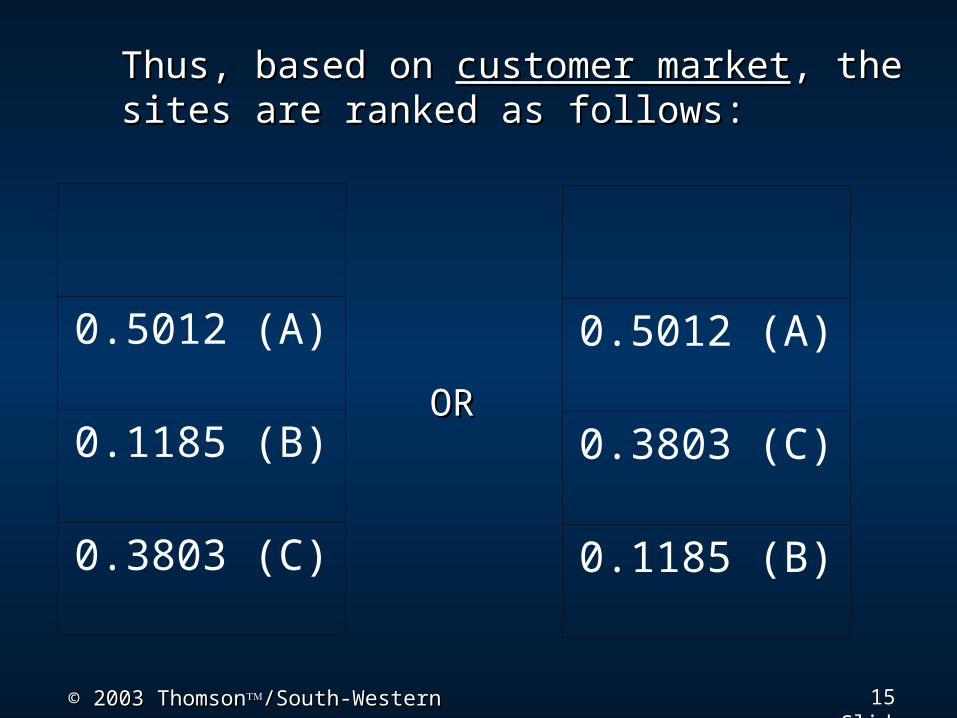
Thus, based on Thus, based on customer marketcustomer market, the sites , the sites are ranked as follows:are ranked as follows:
0.5012 (A)
0.1185 (B)
0.3803 (C)
OROR
0.5012 (A)
0.3803 (C)
0.1185 (B)
16 16© 2003 Thomson© 2003 Thomson/South-Western/South-Western Slide Slide
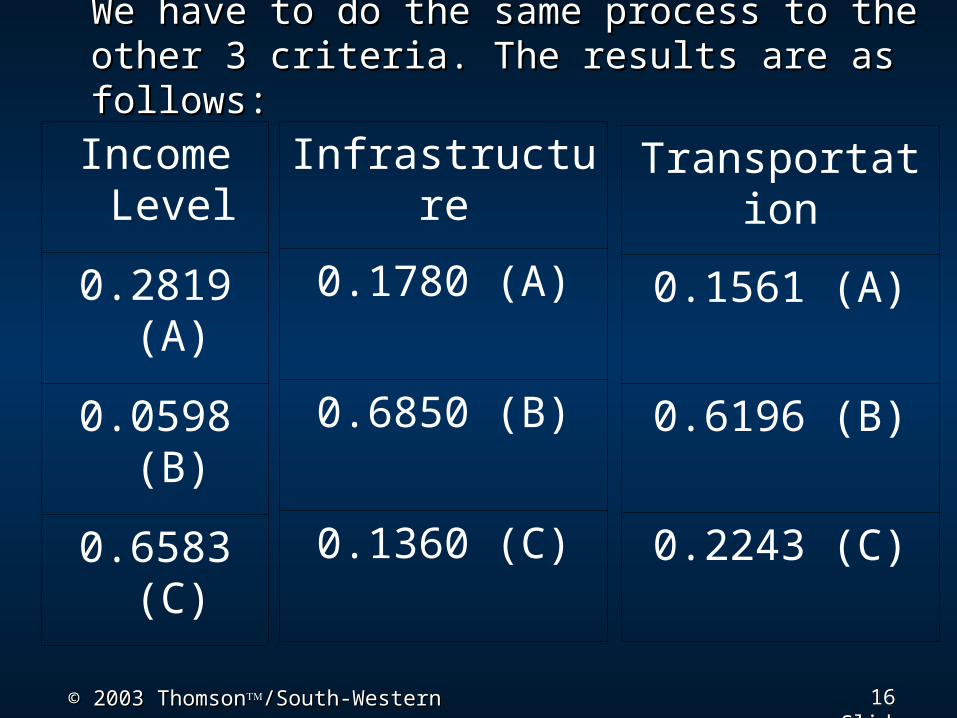
We have to do the same process to the We have to do the same process to the other 3 criteria. The results are as follows:other 3 criteria. The results are as follows:
Income Level
0.2819 (A)
0.0598 (B)
0.6583 (C)
Infrastructure
0.1780 (A)
0.6850 (B)
0.1360 (C)
Transportation
0.1561 (A)
0.6196 (B)
0.2243 (C)
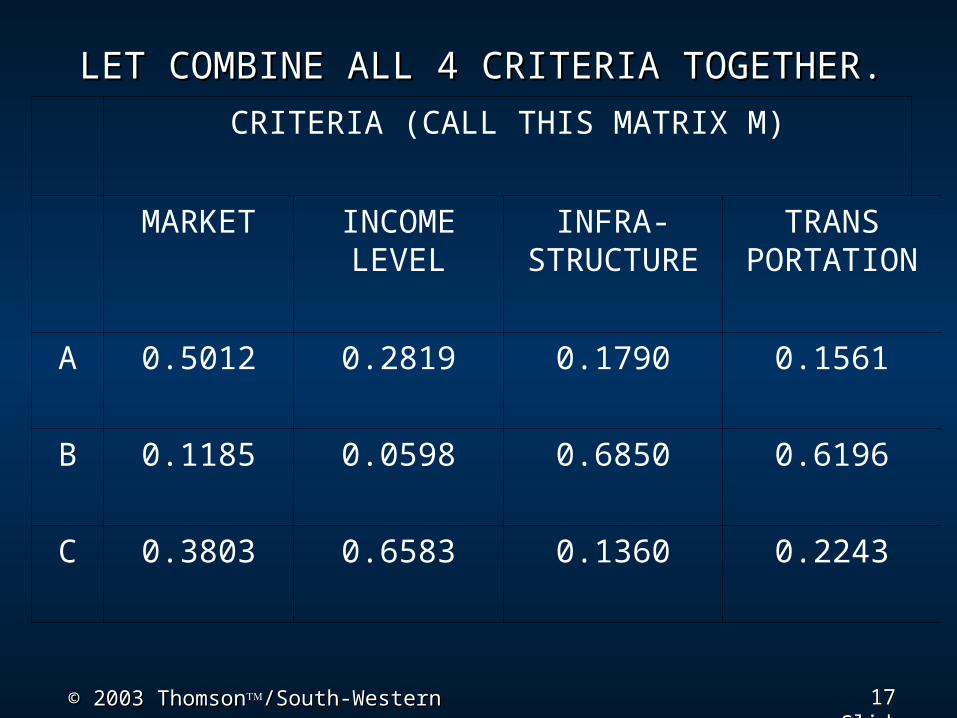
17 17© 2003 Thomson© 2003 Thomson/South-Western/South-Western Slide Slide
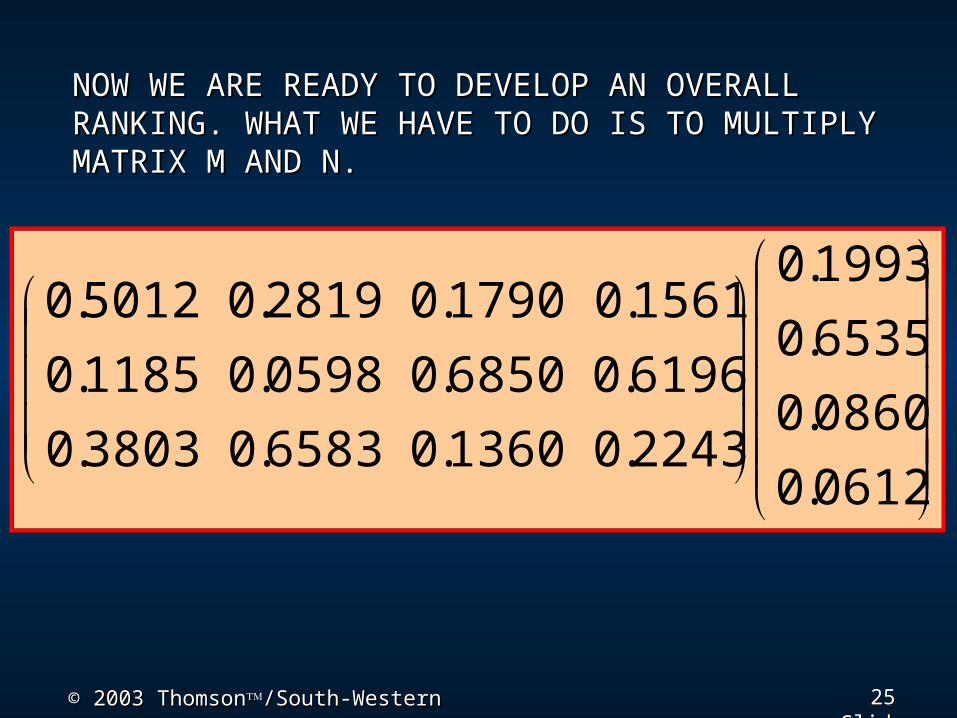
CRITERIA (CALL THIS MATRIX M)
MARKET INCOME LEVEL
INFRA-STRUCTURE
TRANSPORTATION
A 0.5012 0.2819 0.1790 0.1561
B 0.1185 0.0598 0.6850 0.6196
C 0.3803 0.6583 0.1360 0.2243
LET COMBINE ALL 4 CRITERIA TOGETHER.LET COMBINE ALL 4 CRITERIA TOGETHER.

18 18© 2003 Thomson© 2003 Thomson/South-Western/South-Western Slide Slide
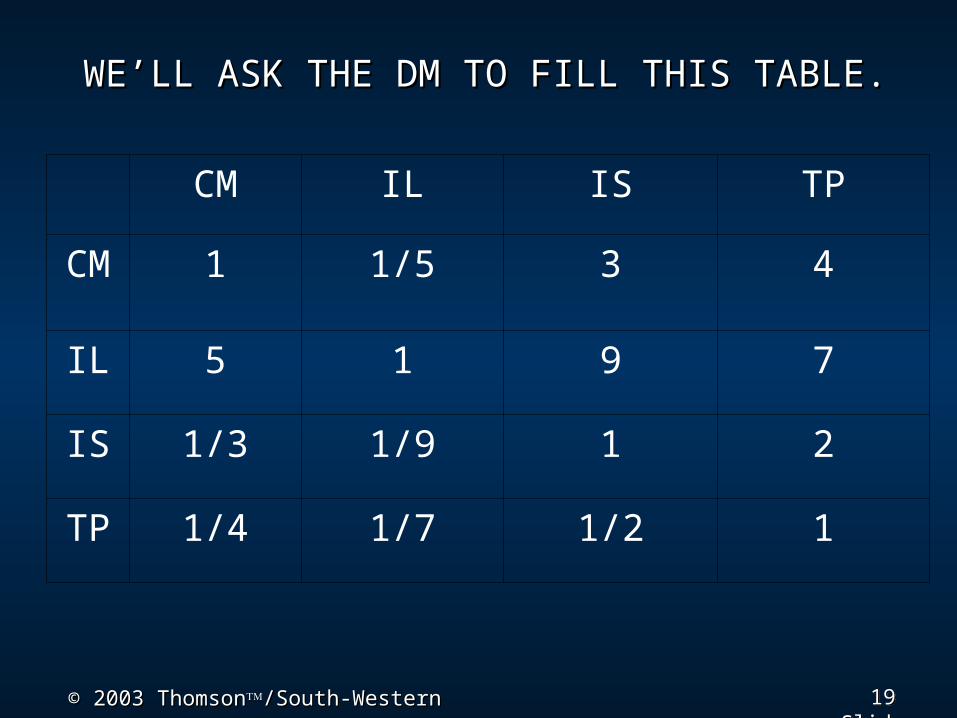
NEXT, WE WANT TO RANK THE CRITERIA.NEXT, WE WANT TO RANK THE CRITERIA.
19 19© 2003 Thomson© 2003 Thomson/South-Western/South-Western Slide Slide
CM IL IS TP
CM 1 1/5 3 4
IL 5 1 9 7
IS 1/3 1/9 1 2
TP 1/4 1/7 1/2 1
WE’LL ASK THE DM TO FILL THIS TABLE.WE’LL ASK THE DM TO FILL THIS TABLE.
20 20© 2003 Thomson© 2003 Thomson/South-Western/South-Western Slide Slide
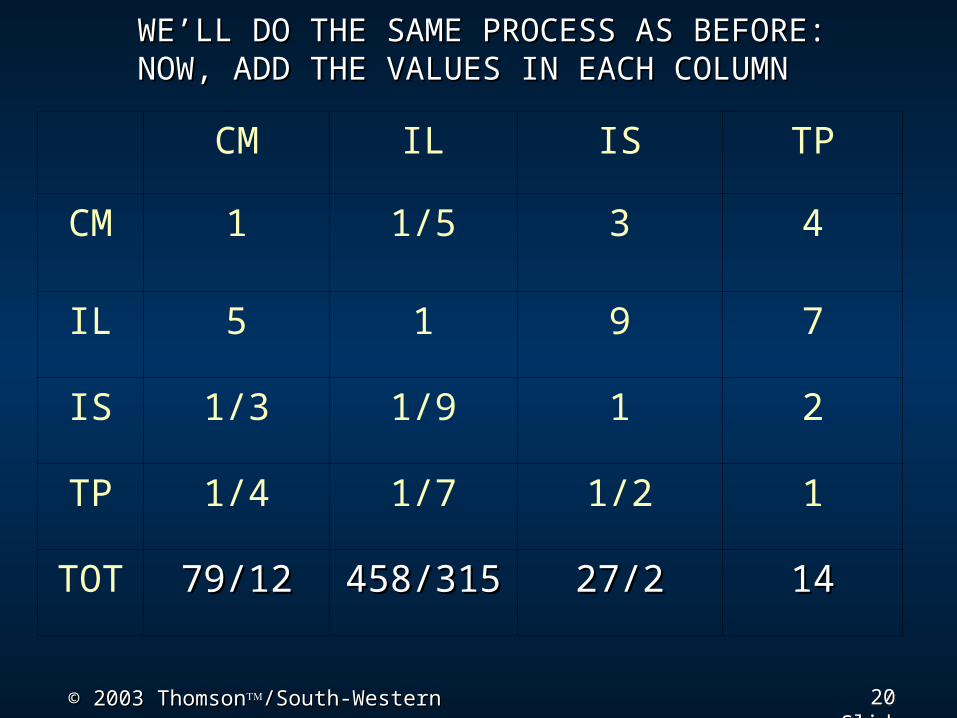
WE’LL DO THE SAME PROCESS AS BEFORE: WE’LL DO THE SAME PROCESS AS BEFORE: NOW, ADD THE VALUES IN EACH COLUMNNOW, ADD THE VALUES IN EACH COLUMN
CM IL IS TP
CM 1 1/5 3 4
IL 5 1 9 7
IS 1/3 1/9 1 2
TP 1/4 1/7 1/2 1
TOT 79/1279/12 458/315458/315 27/227/2 1414
21 21© 2003 Thomson© 2003 Thomson/South-Western/South-Western Slide Slide
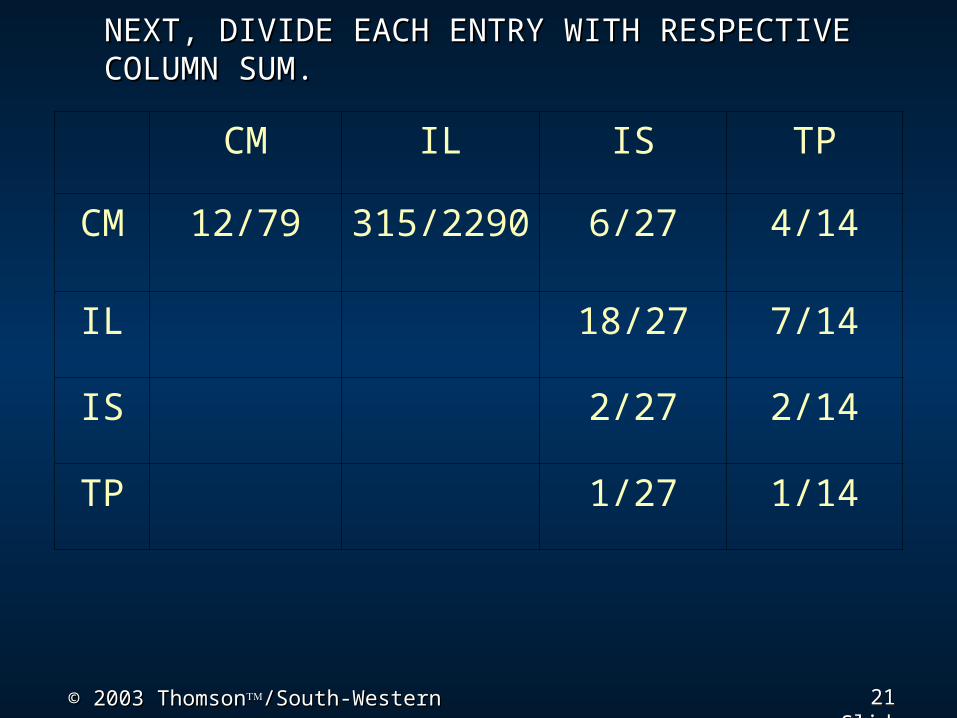
NEXT, DIVIDE EACH ENTRY WITH RESPECTIVE NEXT, DIVIDE EACH ENTRY WITH RESPECTIVE COLUMN SUM.COLUMN SUM.
CM IL IS TP
CM 12/79 315/2290 6/27 4/14
IL 18/27 7/14
IS 2/27 2/14
TP 1/27 1/14
22 22© 2003 Thomson© 2003 Thomson/South-Western/South-Western Slide Slide
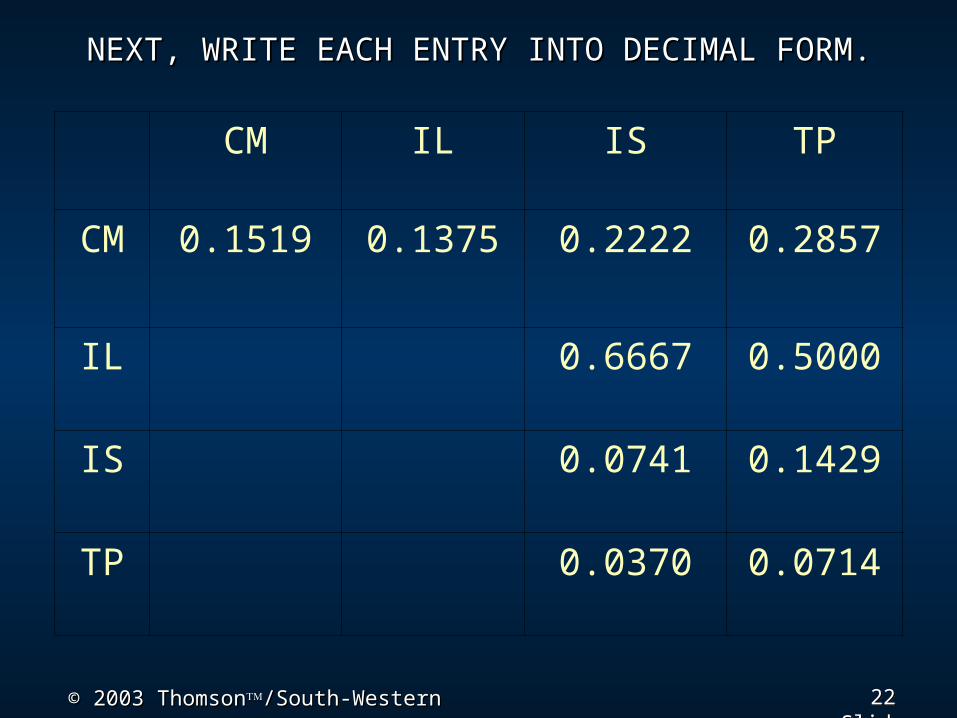
NEXT, WRITE EACH ENTRY INTO DECIMAL FORM.NEXT, WRITE EACH ENTRY INTO DECIMAL FORM.
CM IL IS TP
CM 0.1519 0.1375 0.2222 0.2857
IL 0.6667 0.5000
IS 0.0741 0.1429
TP 0.0370 0.0714
23 23© 2003 Thomson© 2003 Thomson/South-Western/South-Western Slide Slide
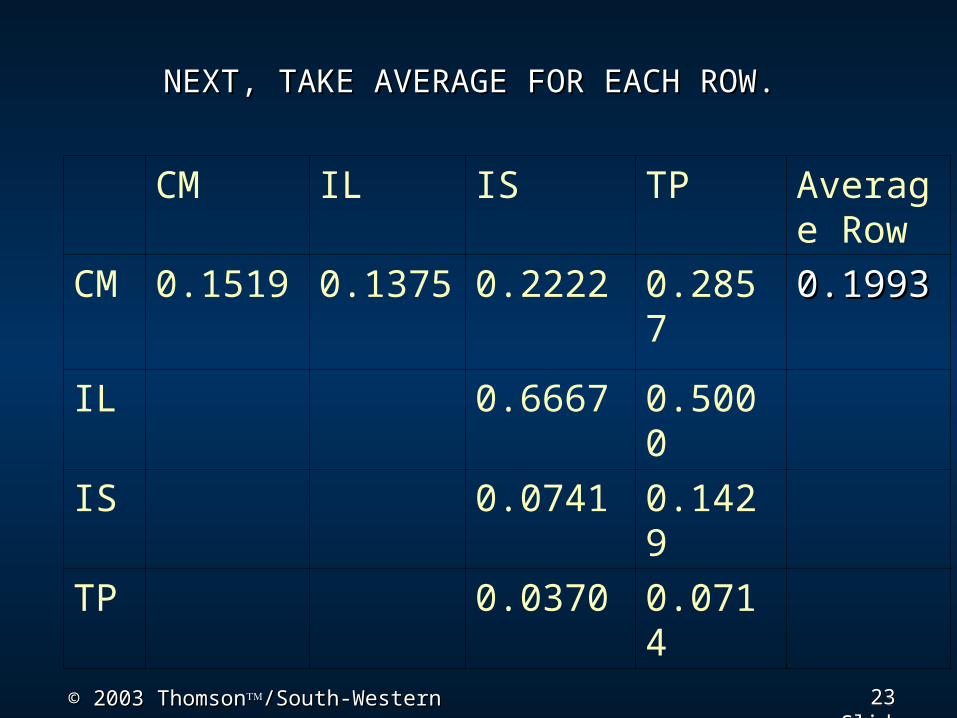
CM IL IS TP Average Row
CM 0.1519 0.1375 0.2222 0.2857 0.19930.1993
IL 0.6667 0.5000
IS 0.0741 0.1429
TP 0.0370 0.0714
NEXT, TAKE AVERAGE FOR EACH ROW. NEXT, TAKE AVERAGE FOR EACH ROW.
24 24© 2003 Thomson© 2003 Thomson/South-Western/South-Western Slide Slide
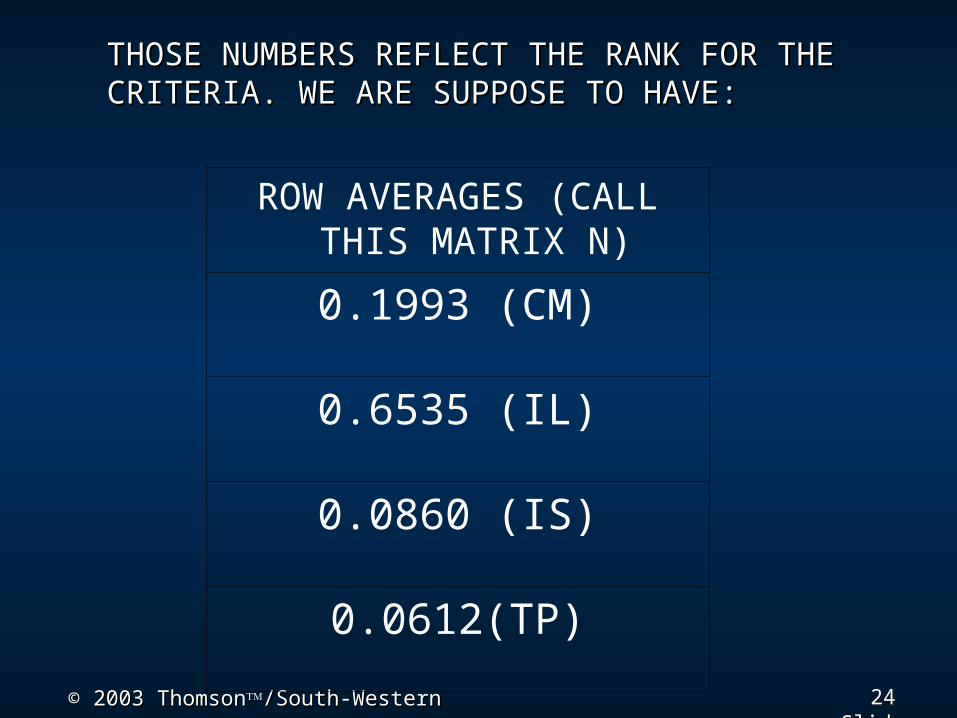
THOSE NUMBERS REFLECT THE RANK FOR THE THOSE NUMBERS REFLECT THE RANK FOR THE CRITERIA. WE ARE SUPPOSE TO HAVE:CRITERIA. WE ARE SUPPOSE TO HAVE:
ROW AVERAGES (CALL THIS MATRIX N)
0.1993 (CM)
0.6535 (IL)
0.0860 (IS)
0.0612(TP)
25 25© 2003 Thomson© 2003 Thomson/South-Western/South-Western Slide Slide
0612.0
0860.0
6535.0
1993.0
2243.01360.06583.03803.0
6196.06850.00598.01185.0
1561.01790.02819.05012.0
NOW WE ARE READY TO DEVELOP AN OVERALL NOW WE ARE READY TO DEVELOP AN OVERALL RANKING. WHAT WE HAVE TO DO IS TO MULTIPLY RANKING. WHAT WE HAVE TO DO IS TO MULTIPLY MATRIX M AND N. MATRIX M AND N.
26 26© 2003 Thomson© 2003 Thomson/South-Western/South-Western Slide Slide
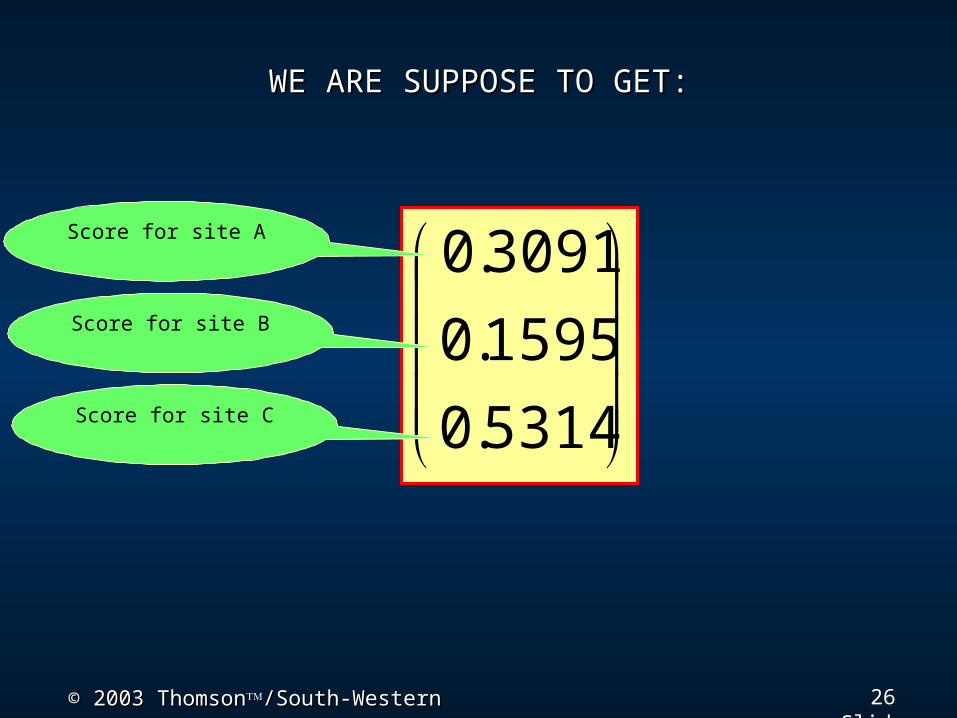
WE ARE SUPPOSE TO GET:WE ARE SUPPOSE TO GET:
5314.0
1595.0
3091.0Score for site A
Score for site B
Score for site C
27 27© 2003 Thomson© 2003 Thomson/South-Western/South-Western Slide Slide
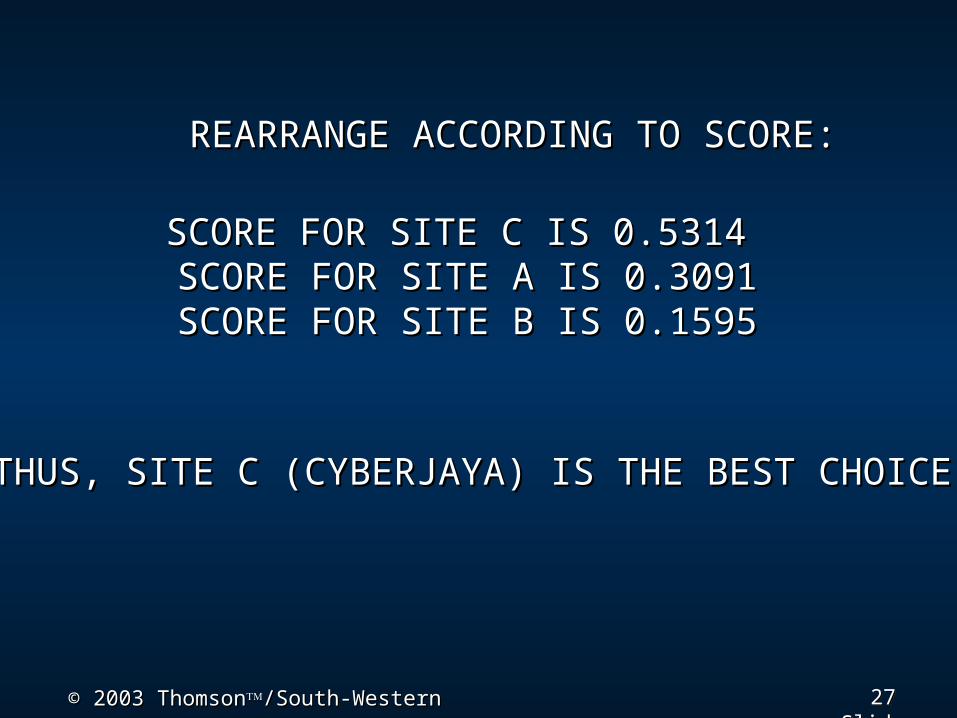
SCORE FOR SITE C IS 0.5314 SCORE FOR SITE C IS 0.5314 SCORE FOR SITE A IS 0.3091SCORE FOR SITE A IS 0.3091SCORE FOR SITE B IS 0.1595SCORE FOR SITE B IS 0.1595
THUS, SITE C (CYBERJAYA) IS THE BEST CHOICE.THUS, SITE C (CYBERJAYA) IS THE BEST CHOICE.
REARRANGE ACCORDING TO SCORE:REARRANGE ACCORDING TO SCORE:
28 28© 2003 Thomson© 2003 Thomson/South-Western/South-Western Slide Slide
Make your own summary of Make your own summary of stepssteps
29 29© 2003 Thomson© 2003 Thomson/South-Western/South-Western Slide Slide
Assignment: Use excel to solve Assignment: Use excel to solve “Petronas Site Selection “Petronas Site Selection
Problem”.Problem”.

30 30© 2003 Thomson© 2003 Thomson/South-Western/South-Western Slide Slide
Food of thought…
The man ignorant of mathematics will be increasingly limited in his grasp of the main forces of civilization.