Embed Size (px)
Citation preview

2016 ANNUAL REPORT
AND FORM 10-K

TO THE SHAREHOLDERS OF TITAN INTERNATIONAL, INC.:While the core end markets served by Titan International — from a broad perspective — are still climbing
out of a cyclical decline, there are many emerging bright spots that Titan is well-positioned to capitalize
on. By operating under the One Titan umbrella, executing on our business improvement framework (BIF),
expanding our market-leading Ag product offering featuring Low Sidewall Technology™ (LSW®) tires and
wheels, and consistently investing to make our plants more efficient and effective, we’ve definitely made
some very positive impacts to the overall health of our organization while setting the stage for significant,
global opportunity. As the markets do recover, the positive impact of our efforts will only be multiplied.
Improving our profitability at the plant level has required both investment and
consolidation during 2016 — right-sizing our production to reduce costs and excess
capacity, focusing on our core competencies, and capitalizing on new opportunities.
IN NORTH AMERICA, we’re relocating production of our mining wheels from Saltville, Virginia, in order to take advantage of
production capacity and capabilities in our flagship facility located in Quincy, Illinois. Meanwhile, our continuous improvement
focus in Quincy has consistently brought us projects that present opportunities to reduce costs and increase efficiency, including
improved process flow of assembly lines and product handling, along with improvements to our steel specifications and a
reduction in product weights to better meet customer needs. In Bryan, Ohio — our primary off-the-road (OTR) tire production
facility — we are continually striving to meet the needs of our customers by focusing on the key lines and sizes that are in
demand, thereby reducing lead times for our loyal customers and growing sales. At the same time, our OTR tire engineering
team is consistently making improvements such as moving from a dual-bead to single-bead construction and improving the
curing process — resulting in reduced production costs and improved durability: a win-win for Titan and our customers.
In Freeport, Illinois — our large agricultural tire production facility — we’ve made numerous machine upgrades, including
modifications to our first-stage building equipment that improve efficiency and product quality, leading to the plant doubling
its income as a percent of sales during 2016. In Des Moines, Iowa — our large agricultural and light industrial tire production
facility — we’ve seen success by implementing root cause corrective action processes that have resulted in a 35 percent
reduction of cured scrap, year over year, as well as a 23 percent reduction in warranty claims on our core group of tires.
IN THE PLANTS
2016 ANNUAL REPORT2EXECUTIVE SUMMARY
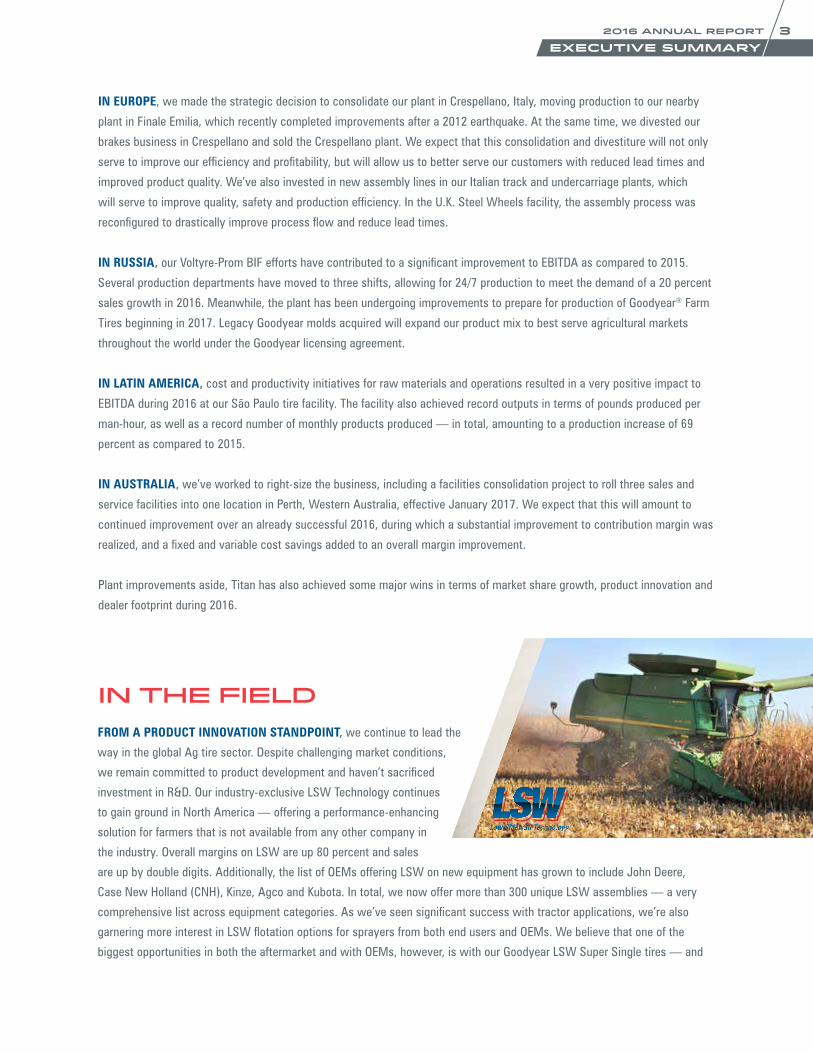
IN EUROPE, we made the strategic decision to consolidate our plant in Crespellano, Italy, moving production to our nearby
plant in Finale Emilia, which recently completed improvements after a 2012 earthquake. At the same time, we divested our
brakes business in Crespellano and sold the Crespellano plant. We expect that this consolidation and divestiture will not only
serve to improve our efficiency and profitability, but will allow us to better serve our customers with reduced lead times and
improved product quality. We’ve also invested in new assembly lines in our Italian track and undercarriage plants, which
will serve to improve quality, safety and production efficiency. In the U.K. Steel Wheels facility, the assembly process was
reconfigured to drastically improve process flow and reduce lead times.
IN RUSSIA, our Voltyre-Prom BIF efforts have contributed to a significant improvement to EBITDA as compared to 2015.
Several production departments have moved to three shifts, allowing for 24/7 production to meet the demand of a 20 percent
sales growth in 2016. Meanwhile, the plant has been undergoing improvements to prepare for production of Goodyear® Farm
Tires beginning in 2017. Legacy Goodyear molds acquired will expand our product mix to best serve agricultural markets
throughout the world under the Goodyear licensing agreement.
IN LATIN AMERICA, cost and productivity initiatives for raw materials and operations resulted in a very positive impact to
EBITDA during 2016 at our São Paulo tire facility. The facility also achieved record outputs in terms of pounds produced per
man-hour, as well as a record number of monthly products produced — in total, amounting to a production increase of 69
percent as compared to 2015.
IN AUSTRALIA, we’ve worked to right-size the business, including a facilities consolidation project to roll three sales and
service facilities into one location in Perth, Western Australia, effective January 2017. We expect that this will amount to
continued improvement over an already successful 2016, during which a substantial improvement to contribution margin was
realized, and a fixed and variable cost savings added to an overall margin improvement.
Plant improvements aside, Titan has also achieved some major wins in terms of market share growth, product innovation and
dealer footprint during 2016.
FROM A PRODUCT INNOVATION STANDPOINT, we continue to lead the
way in the global Ag tire sector. Despite challenging market conditions,
we remain committed to product development and haven’t sacrificed
investment in R&D. Our industry-exclusive LSW Technology continues
to gain ground in North America — offering a performance-enhancing
solution for farmers that is not available from any other company in
the industry. Overall margins on LSW are up 80 percent and sales
are up by double digits. Additionally, the list of OEMs offering LSW on new equipment has grown to include John Deere,
Case New Holland (CNH), Kinze, Agco and Kubota. In total, we now offer more than 300 unique LSW assemblies — a very
comprehensive list across equipment categories. As we’ve seen significant success with tractor applications, we’re also
garnering more interest in LSW flotation options for sprayers from both end users and OEMs. We believe that one of the
biggest opportunities in both the aftermarket and with OEMs, however, is with our Goodyear LSW Super Single tires — and
IN THE FIELD
2016 ANNUAL REPORT 3EXECUTIVE SUMMARY

we made major headway in proving the concept’s viability over traditional dual tire configurations this year. A planting trial
conducted by a customer in Sikeston, Missouri, put Goodyear LSW Super Single tires up against an identical tractor configured
with conventional dual competitor tires. The corn test plot planted with Goodyear LSW Super Single tires proved to yield an
additional five bushels per acre as compared to the plot planted with competitor dual tires. These results back up the very
positive feedback we’ve received in the aftermarket, while also sparking additional dialogue and interest from OEMs.
LSW is also making significant headway in Brazil, where we’re offering a “try and buy” program to select large farms throughout
the country. Thus far, the reaction has been strong in applications ranging from rice, sugar cane, corn and soybeans, to tillage
and soil preparation. In addition to testing LSWs, our operations in Brazil have introduced a number of new designs for sugar
cane applications, pivot irrigation, sprayers, tractors, harvesters and implements – in total resulting in an estimated 8,500 new
tire sales, while new product introductions for consumer and OTR applications resulted in 5,500 new tire sales.
We also initiated an aggressive product launch schedule in Russia and in our undercarriage business. In Russia, we introduced
17 new agriculture and industrial tires between Q4 2015 and Q1 2016 — 30 percent of which were Titan-branded tires,
amounting to 4 percent of total sales of our Russian-produced products. From a tracks/undercarriage perspective, we introduced
several new products and technologies, most notably TrackAdvice — an inspection and data collection system for monitoring
customer undercarriage wear conditions.
FROM A MARKET SHARE STANDPOINT, Titan continues to perform exceptionally well in compact and utility tractors during a
time when those size classes are seemingly immune to down market conditions. Major wins occurred in 2016 with some of the
leading OEMs in the sector, including the achievement of 100 percent market share with certain models and increased market
share with others. We also saw an increase in our Brazilian OEM market share and aftermarket share that has now positioned
Titan Brazil as the number one domestic Ag tire producer. In addition, our exports from Brazil rose by 65 percent in 2016 in
reaction to significant sales volume growth throughout Latin America, including 200 percent sales volume growth in Mexico, as
well as 80 percent growth in Argentina and 20 percent growth in Peru and Chile. Our undercarriage business captured additional
market share with OEMs in Italy, Holland, North America, China and India, while also increasing aftermarket share in Russia,
Indonesia, Australia and Brazil.
FROM A DEALER STANDPOINT, we made significant progress, particularly in North America, Latin America and Europe. In the
U.S. and Canada, we rolled out a new associate dealer program, which gives us direct contact with more than 200 tire dealers
that we didn’t have before. We expect this number to grow to around 300 by the end of 2017. In Latin America, we added 25
new dealers during 2016 and supported the development and growth of several branches located in areas of heavy agricultural
activity. This past year also proved to be incredibly successful in our efforts to reintroduce Goodyear Farm Tires into countries
under the expanded licensing agreement. As of December 31, 2016, Goodyear had dealer representation in 15 additional
countries as compared to a year prior.
The corn test plot planted with Goodyear LSW Super Single tires
proved to yield an additional five bushels per acre as compared to
the plot planted with competitor dual tires.
2016 ANNUAL REPORT4EXECUTIVE SUMMARY

During 2017, we expect to not only build upon the improvements of 2016, but also
start realizing additional benefits from our efforts in 2016. In North America, we
recently underwent a complete product and pricing analysis on our Ag tire lineup,
which identified several key opportunities for market share gain. While we
remain committed to furthering adoption of our premium LSW lines, we also see
significant opportunity in building out key standard sizes. We have prioritized
our product development timeline to be able to capture additional market
share with these sizes. Because we have the luxury of offering two lines —
Titan and Goodyear — at two different price points, we are able to be more marketable to more end users than many of our
competitors. In 2017, we’ll continue to focus on our Ag tire pricing and product portfolio being well-positioned in the market,
while conducting a similar product and pricing analysis for OTR tires, which is expected to yield valuable insight into sales
growth opportunities.
As we enter the fifth year of an agricultural downturn in the U.S., and new equipment sales remain sluggish, we are also
entering a key tire replacement cycle that we believe will likely have a positive effect on our aftermarket sales in 2017.
From a production standpoint, we have several major milestones ahead of us. The São Paulo plant is expected to be tooled
and ready to begin producing LSW tires during 2017. Government approval has already been granted to begin importing wheel
manufacturing equipment for installation in São Paulo.
Perhaps the biggest opportunity ahead of us in 2017, however, is our ability to begin producing Goodyear Farm Tires in Russia.
Although we’ve made progress, adding a Goodyear dealer presence in 15 new countries in 2016, we’ve only scratched the
surface of the market opportunity. Whereas we’re currently importing from the U.S., and limited to only a subset of sizes
applicable to the foreign markets — once production begins in Russia, we’ll be positioned appropriately with the right product
mix. With our already strong sales network on the wheel side, we believe we are primed to take full advantage of our ability to
sell into more than 125 new countries under the expanded licensing agreement.
A “right-sized” production network, new production capabilities, an expanded dealer footprint, new pricing initiatives, a
continued focus on research and development, and a host of unmatched product innovations — these are all the reasons to
be excited about where we’ve been in 2016 and where we are heading in 2017.
A special committee of Titan’s Board of Directors (Special Committee) was formed for the purpose of evaluating a potential
sale of our undercarriage business, Italtractor ITM S.p.A. (ITM). We engaged Goldman Sachs to serve as a financial advisor
in connection with this potential sale. As the sales process continued during 2016, ITM grew its revenue and EBITDA, as
compared to 2015. These improving fundamentals within ITM’s business, as well as the Board of Directors’ confidence in the
ongoing business model, resulted in our decision to end the formal sales process for ITM. The Special Committee, with the
recommendation of Goldman Sachs, determined that selling ITM was not in the best interest of Titan and its shareholders at
this time.
IN THE COMING YEAR
UNDERCARRIAGE UPDATE
PAUL G. REITZ PRESIDENT AND CEO
MAURICE M. TAYLOR JR. CHAIRMAN
2016 ANNUAL REPORT 5EXECUTIVE SUMMARY

EXECUTIVE SUMMARY
TITAN INTERNATIONALTitan is a global leader in off-highway wheels, tires and undercarriages, with roots tracing back more than 120 years to the
Electric Wheel Company in Quincy, Illinois. As the only manufacturer with the ability to design, test and manufacture wheels,
tires, tracks and undercarriage components for agriculture, construction, forestry and mining, Titan has a unique, competitive
advantage as a complete solutions provider. With a network of dealers and distribution facilities all over the world, Titan is a
global brand that original equipment manufacturers and end users can count on for durable products and quality service.
TITAN
MICHELIN
BRIDGESTONE
GKN
TIRES RECLAMATIONSERVICE CENTERSUNDERCARRIAGEWHEELS
2016 HIGHLIGHTS
COMPETITIVE ADVANTAGES
NET SALES (2012-2016) AMOUNTS IN MILLIONS
AGRICULTURE EARTHMOVING / CONSTRUCTION
CONSUMER
2,250
2,000
1,750
1,500
1,250
1,0002012 2013 2014 2015 2016
$1,821
$2,164
$1,896
$1,395$1,265
46% 41% 13%
2016 ANNUAL REPORT6EXECUTIVE SUMMARY
EXECUTIVE SUMMARY
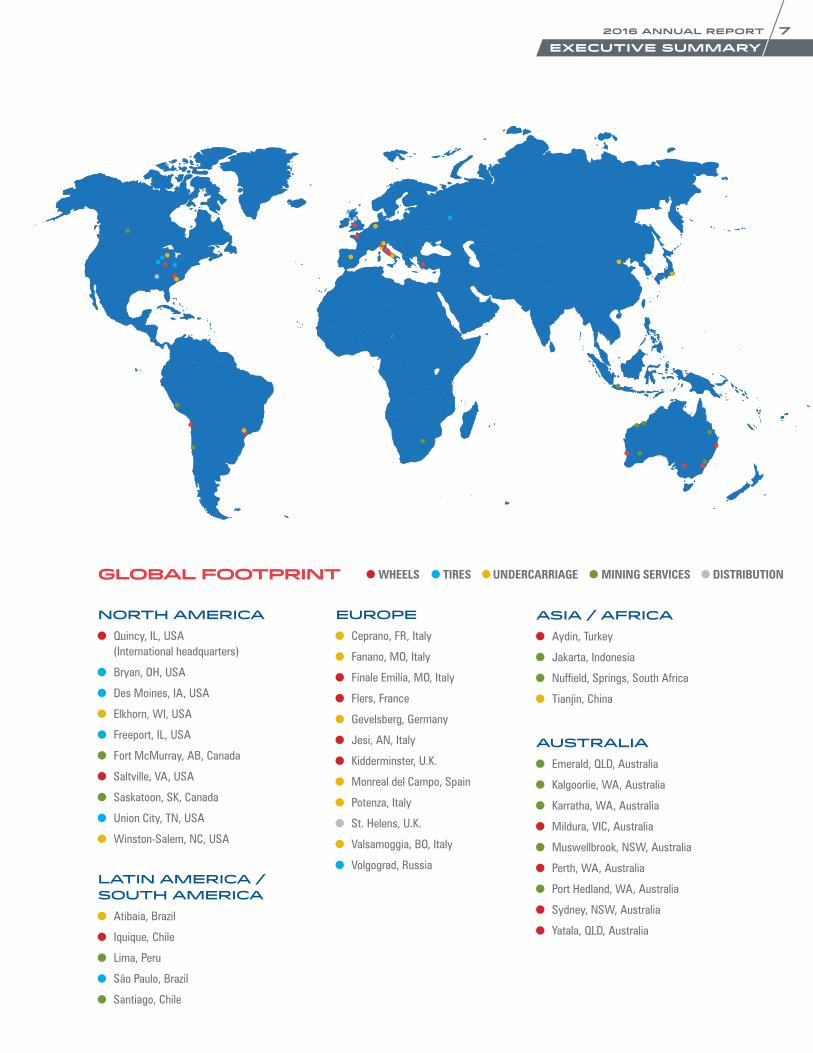
NORTH AMERICA
Quincy, IL, USA (International headquarters)
Bryan, OH, USA
Des Moines, IA, USA
Elkhorn, WI, USA
Freeport, IL, USA
Fort McMurray, AB, Canada
Saltville, VA, USA
Saskatoon, SK, Canada
Union City, TN, USA
Winston-Salem, NC, USA
EUROPE
Ceprano, FR, Italy
Fanano, MO, Italy
Finale Emilia, MO, Italy
Flers, France
Gevelsberg, Germany
Jesi, AN, Italy
Kidderminster, U.K.
Monreal del Campo, Spain
Potenza, Italy
St. Helens, U.K.
Valsamoggia, BO, Italy
Volgograd, RussiaLATIN AMERICA / SOUTH AMERICA
Atibaia, Brazil
Iquique, Chile
Lima, Peru
São Paulo, Brazil
Santiago, Chile
AUSTRALIA Emerald, QLD, Australia
Kalgoorlie, WA, Australia
Karratha, WA, Australia
Mildura, VIC, Australia
Muswellbrook, NSW, Australia
Perth, WA, Australia
Port Hedland, WA, Australia
Sydney, NSW, Australia
Yatala, QLD, Australia
ASIA / AFRICA Aydin, Turkey
Jakarta, Indonesia
Nuffield, Springs, South Africa
Tianjin, China
GLOBAL FOOTPRINT WHEELS TIRES UNDERCARRIAGE MINING SERVICES DISTRIBUTION
2016 ANNUAL REPORT 7EXECUTIVE SUMMARY

A G R I C U LT U R E
A G R I C U LT U R E
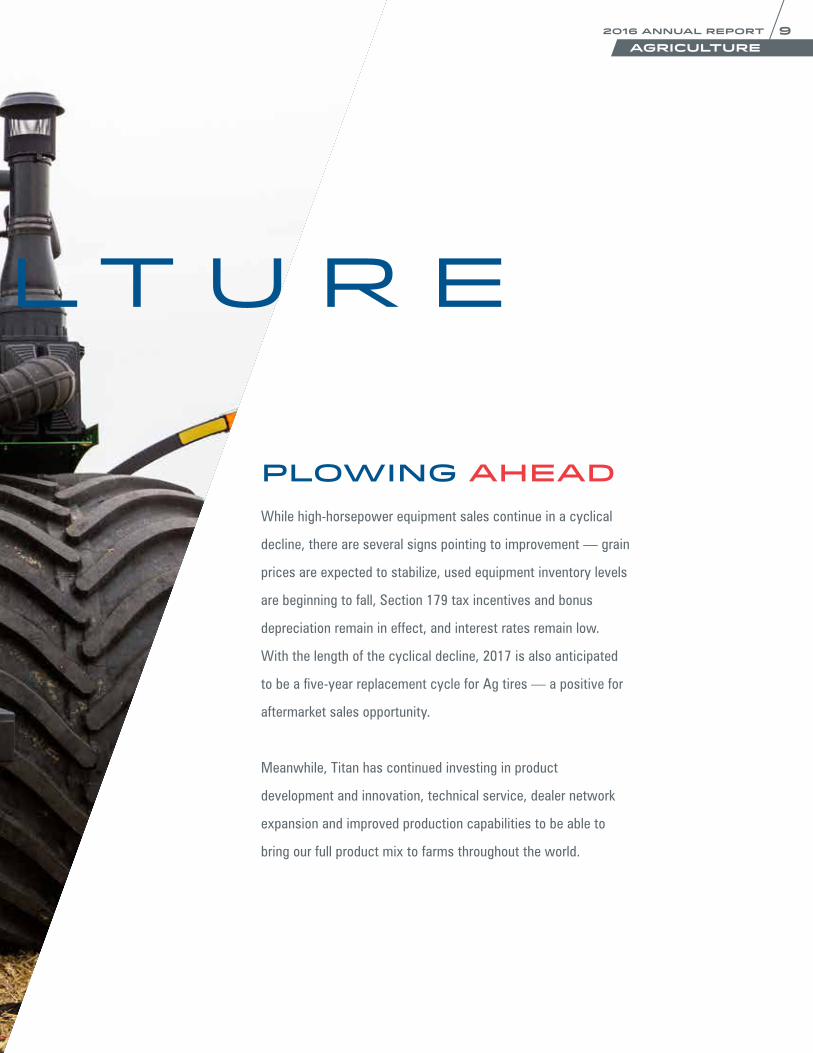
PLOWING AHEADWhile high-horsepower equipment sales continue in a cyclical
decline, there are several signs pointing to improvement — grain
prices are expected to stabilize, used equipment inventory levels
are beginning to fall, Section 179 tax incentives and bonus
depreciation remain in effect, and interest rates remain low.
With the length of the cyclical decline, 2017 is also anticipated
to be a five-year replacement cycle for Ag tires — a positive for
aftermarket sales opportunity.
Meanwhile, Titan has continued investing in product
development and innovation, technical service, dealer network
expansion and improved production capabilities to be able to
bring our full product mix to farms throughout the world.
2016 ANNUAL REPORT 9AGRICULTURE
1,100
1,000
900
800
700
600
5002012 2013 2014 2015 2016
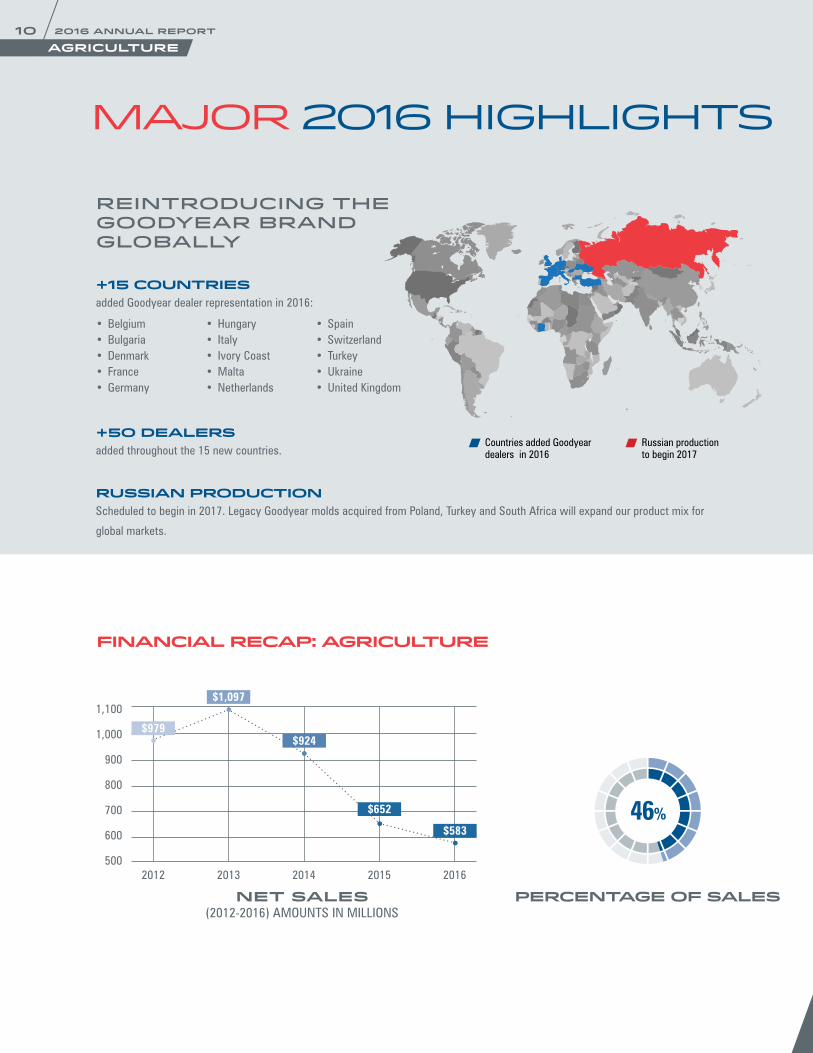
$979
$1,097
$924
$652
$583
FINANCIAL RECAP: AGRICULTURE
added Goodyear dealer representation in 2016:
added throughout the 15 new countries.
Scheduled to begin in 2017. Legacy Goodyear molds acquired from Poland, Turkey and South Africa will expand our product mix for
global markets.
• Belgium• Bulgaria• Denmark• France• Germany
• Hungary• Italy• Ivory Coast• Malta• Netherlands
• Spain• Switzerland• Turkey• Ukraine• United Kingdom
REINTRODUCING THE GOODYEAR BRAND GLOBALLY
Russian production to begin 2017
Countries added Goodyear dealers in 2016
MAJOR 2016 HIGHLIGHTS
NET SALES (2012-2016) AMOUNTS IN MILLIONS
PERCENTAGE OF SALES
+15 COUNTRIES
+50 DEALERS
RUSSIAN PRODUCTION
46%
2016 ANNUAL REPORT10AGRICULTURE
40%
2X
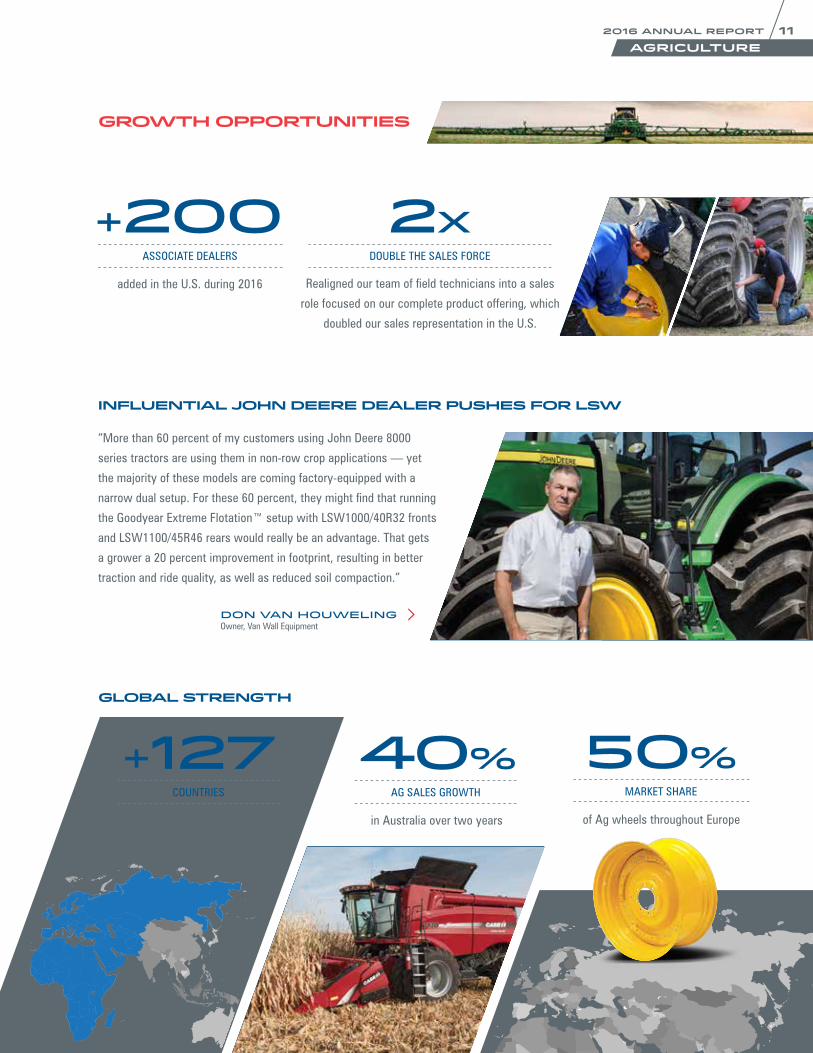
+127 50%
Realigned our team of field technicians into a sales
role focused on our complete product offering, which
doubled our sales representation in the U.S.
added under 2015 Goodyear
licensing agreement
in Australia over two years of Ag wheels throughout Europe
INFLUENTIAL JOHN DEERE DEALER PUSHES FOR LSW
AG SALES GROWTH
DOUBLE THE SALES FORCE
COUNTRIES MARKET SHARE
GROWTH OPPORTUNITIES
GLOBAL STRENGTH
+200added in the U.S. during 2016
ASSOCIATE DEALERS
“More than 60 percent of my customers using John Deere 8000
series tractors are using them in non-row crop applications — yet
the majority of these models are coming factory-equipped with a
narrow dual setup. For these 60 percent, they might find that running
the Goodyear Extreme Flotation™ setup with LSW1000/40R32 fronts
and LSW1100/45R46 rears would really be an advantage. That gets
a grower a 20 percent improvement in footprint, resulting in better
traction and ride quality, as well as reduced soil compaction.”
Don Van HouwelingOwner, Van Wall Equipment
2016 ANNUAL REPORT 11AGRICULTURE

THE RESULTS
With agronomic oversight provided by Wheat Tech Agronomy, the
Goodyear LSW tires proved to have a significant advantage. Average tire depth in corn planting with the LSWs was
1.58 inches versus 2.55 inches with the standard competitor duals. This reduced soil compaction has a significant
impact on yield and profitability.
CORN PLANTED WITH LSW-EQUIPPED NEW HOLLAND TRACTOR
Mark Stallings — a Missouri grower and owner of Delta New Holland — conducted a planting trial putting Goodyear LSW
Super Single tires up against standard dual tires.
THE TEST
Two fields with comparable historical data were chosen to plant
Pioneer 2089YHR seed corn — each planted with identical New
Holland T-8 255 hp tractors and 16-row Kinze 3600 planters.
One tractor was outfitted with competitor 380/80R38 dual fronts
and 480/80R50 dual rears. The other tractor was outfitted with
Goodyear LSW1000/40R32 fronts and LSW1100/45R46 rears.
+5 bushels/acre advantage+$16/acre profit advantage+$24,000 profit per 1,500 acres**
PRODUCT INNOVATION
FIELD TESTING SHOWS INCREASED YIELD WITH LSW
300+
LSW
OEMS
now offered in LSW.
Nearly 50 LSW-equipped machines are
running throughout the country. LSW
production expected to begin 2017.
John Deere and Case New Holland (CNH) now offer
LSW on select models.
TOTAL ASSEMBLIES
ENTERS BRAZIL
ON BOARD
70%
Among large growers (2,000+ acres), 21% say
they are “very likely” to purchase LSW and 49%
say they are “somewhat likely” to purchase.*
*December 2016 AgWeb survey with 463 grower respondents. **Calculation based on corn prices in October 2016.
OF FARMERS LIKELY TO PURCHASE
LSW GAINS TRACTION
2016 ANNUAL REPORT12AGRICULTURE
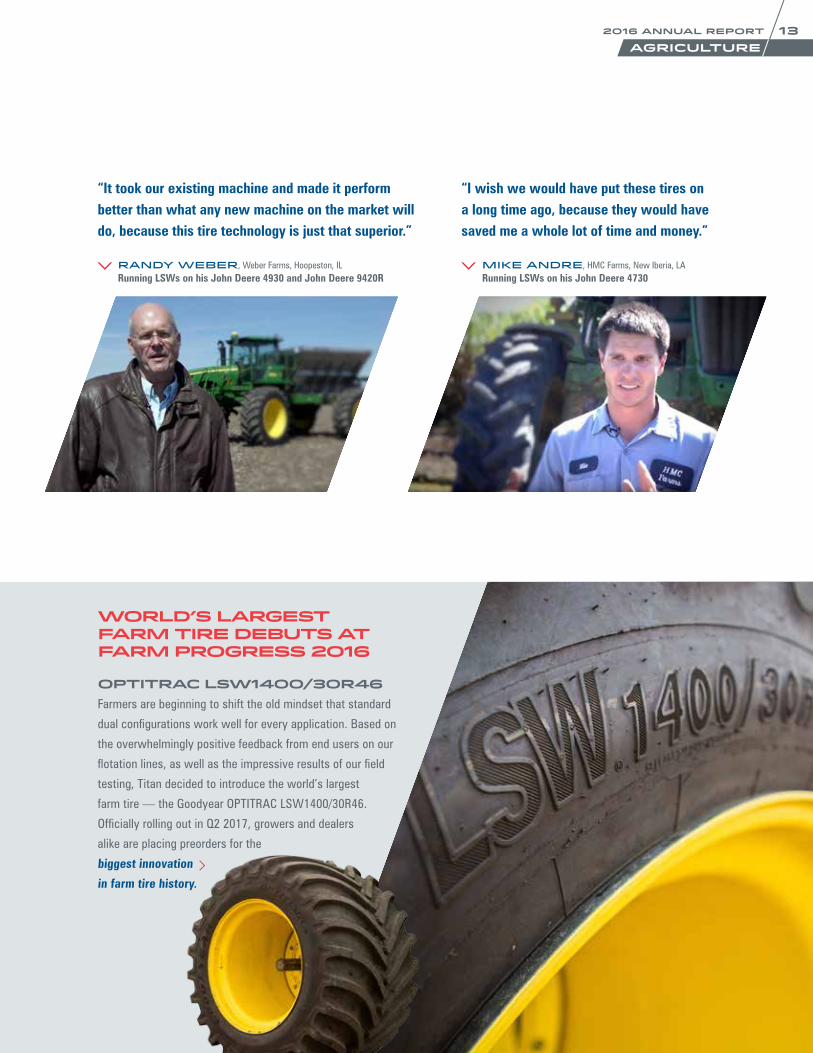
“It took our existing machine and made it perform better than what any new machine on the market will do, because this tire technology is just that superior.”
“I wish we would have put these tires on a long time ago, because they would have saved me a whole lot of time and money.”
OPTITRAC LSW1400/30R46Farmers are beginning to shift the old mindset that standard
dual configurations work well for every application. Based on
the overwhelmingly positive feedback from end users on our
flotation lines, as well as the impressive results of our field
testing, Titan decided to introduce the world’s largest
farm tire — the Goodyear OPTITRAC LSW1400/30R46.
Officially rolling out in Q2 2017, growers and dealers
alike are placing preorders for the
biggest innovation
in farm tire history.
WORLD’S LARGEST FARM TIRE DEBUTS AT FARM PROGRESS 2016
Randy Weber, Weber Farms, Hoopeston, ILRunning LSWs on his John Deere 4930 and John Deere 9420R
Mike Andre, HMC Farms, New Iberia, LARunning LSWs on his John Deere 4730
2016 ANNUAL REPORT 13AGRICULTURE

LSWs AT WORKOur LSW tires are proven performers in the field. No matter the color you run or the application you’re running them
in, we’re seeing and hearing from end users on our Facebook page and through our field technicians, and the results
are in: LSW makes every piece of equipment perform better.
THE RED, THE GREEN, AND EVERYTHING IN BETWEEN
2016 ANNUAL REPORT14AGRICULTURE
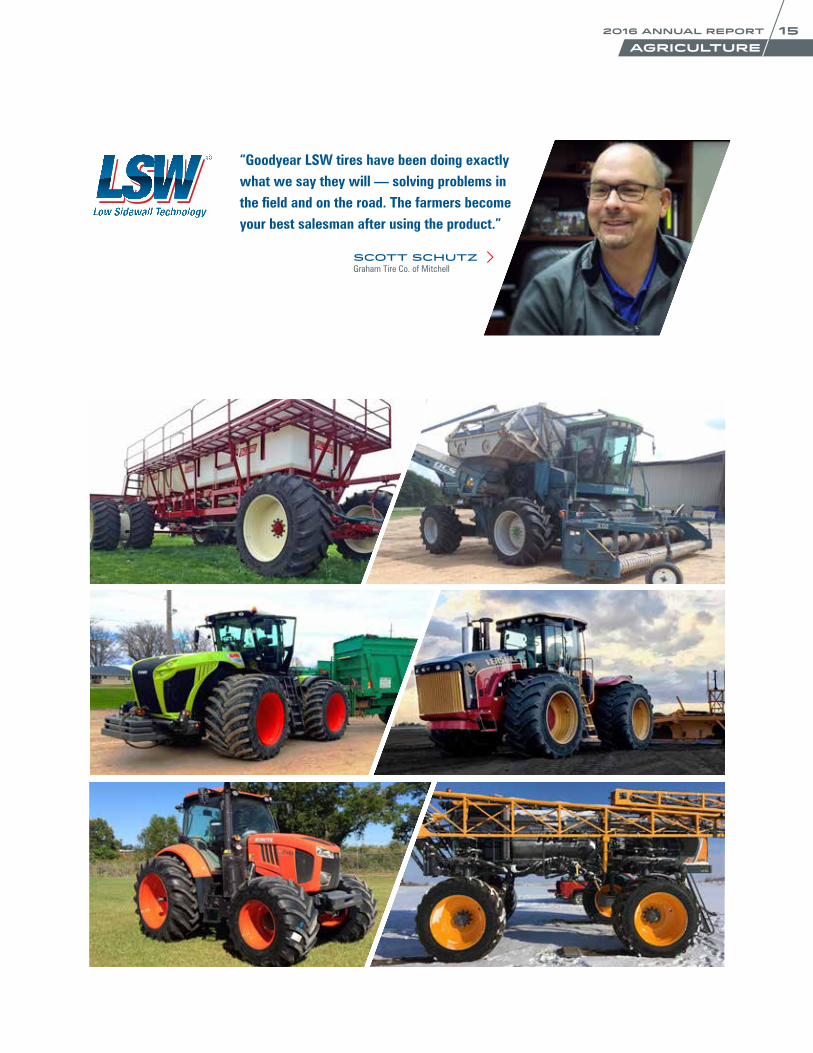
“Goodyear LSW tires have been doing exactly what we say they will — solving problems in the field and on the road. The farmers become your best salesman after using the product.”
scott schutzGraham Tire Co. of Mitchell
2016 ANNUAL REPORT 15AGRICULTURE

OFF-THE-ROAD (OTR)EARTHMOVING / CONSTRUCTION / MINING

OFF-THE-ROAD (OTR)EARTHMOVING / CONSTRUCTION / MINING
BUILDING A SOLID FOUNDATIONChallenges remain for OTR — particularly in the mining segment,
which is still feeling the effects of lower commodity prices and
stagnant equipment sales. Australia is the exception, where Titan
benefited from modest market improvements. Large infrastructure
investment has been relatively stagnant in the U.S.; however,
private investment in residential and non-residential construction
has been strong. New home construction has been on a steady
rise since 2012, which has also had a positive impact on U.S.
lumber production — making forestry a bright spot for Titan.
As Titan navigates through the continued recovery of OTR
markets — we’ve focused our efforts on improving our existing
product lines, producing and selling more of our tried-and-true
products and right-sizing the production and distribution networks
to better meet the needs of our customers.
2016 ANNUAL REPORT 17OFF-THE-ROAD

March 29, 2016, was a groundbreaking day in more
ways than one. The ribbon cutting at TTRC set in
motion the world’s first completely sustainable
recycling solution for giant OTR tires — effectively
turning waste tires into reusable commodities.
“The number of used tires we generate is about 1,200 per year. Not only that, but the number of tires that we’ve stockpiled over the years — we were looking for ways to be able to recycle them, but had not been able to keep up with the sheer demand. We congratulate Titan and look forward to a long and successful partnership.”
Derrick Trottier, Director of Reliability Engineering Extraction, Suncor Energy
GRAND OPENING: TITAN TIRE RECLAMATION CORP (TTRC)
MAJOR 2016 HIGHLIGHT
41%
900
800
700
600
5002012 2013 2014 2015 2016
$573
$808
$685
$567$524
FINANCIAL RECAP: OFF-THE-ROAD
NET SALES (2012-2016) AMOUNTS IN MILLIONS
PERCENTAGE OF SALES
2016 ANNUAL REPORT18OFF-THE-ROAD

GROWTH OPPORTUNITIES
Titan has been well-positioned to capitalize on rebounding mining activity in Australia — both from a product and service standpoint.
As a complete solutions provider, Titan is uniquely able to meet the
evolving wheel/tire needs of forestry equipment manufacturers.
Titan’s dedication to improving product quality
has paid off in the growing forestry segment.
While several key competitors have experienced
quality problems, Goodyear has become the brand
of choice for many forestry professionals.
EXPANDED SERVICES
Titan now offers the support
of mine-based servicemen and
engineers to manage customer
tire-fitting bays, and assist with
burgeoning workloads, fleet
commissions and demobilizations.
INNOVATIVE FORESTRY WHEEL
As log skidders are being designed with increased horsepower, their
planetary axles have grown in size, requiring a unique wheel design to
allow the axle to fit inside the rim of a standard 32-inch tire. Only Titan
was able to meet this unique need for John Deere.
WHEEL PROVIDES SOLUTION FOR OEM
Titan engineered a 57-inch wheel solution
to meet the design requirements for
Komatsu 830E haul trucks — an innovation
that resulted in more than $2 million in
additional revenue from one larger mining
customer alone.
OPPORTUNITY IN LSW
The increased horsepower and planetary axles of skidders make LSW
a natural fit for forestry — allowing a larger rim to fit over the axles
without increasing tire size, thereby avoiding contact with the gears
and keeping a low center of gravity for the equipment. Titan is currently
building prototypes for a tube-type, bias LSW forestry tire.
AUSTRALIAN MINING
WHEEL / TIRE INNOVATIONS
THE PREMIUM FORESTRY BRAND
“In my opinion, I think Goodyear is the best
forestry tire on the market.”
Justin Justice, Justice Enterprises
2016 ANNUAL REPORT 19OFF-THE-ROAD
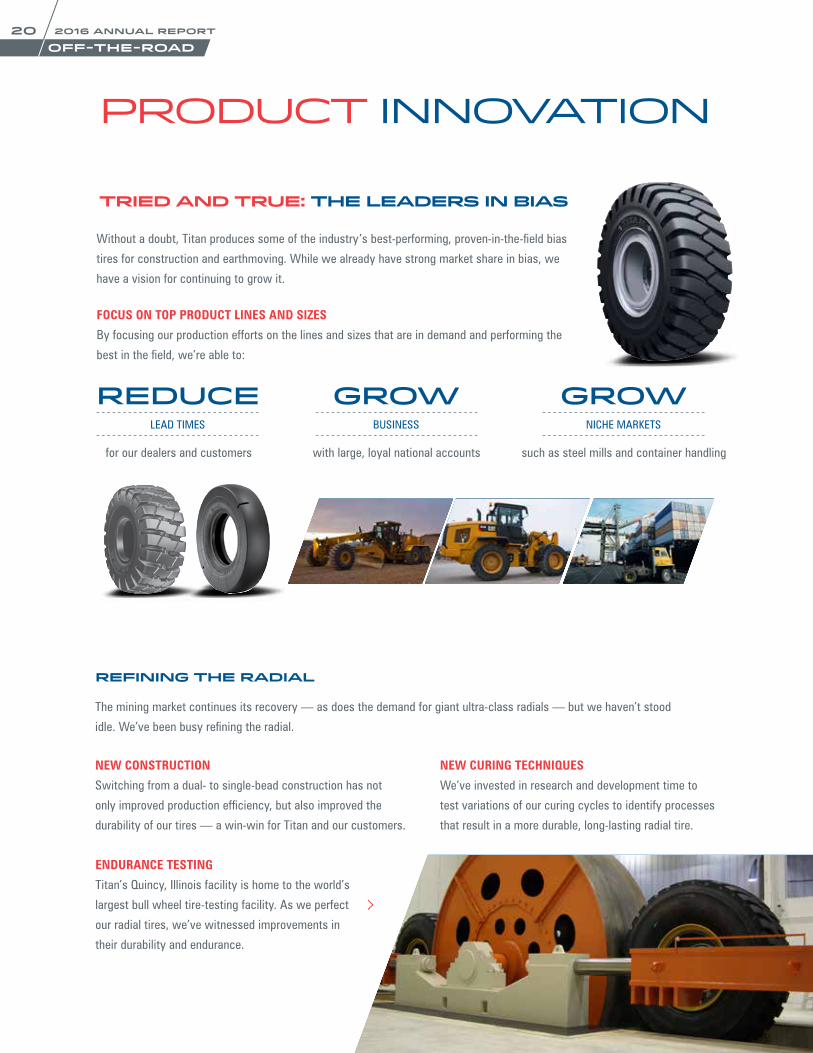
The mining market continues its recovery — as does the demand for giant ultra-class radials — but we haven’t stood
idle. We’ve been busy refining the radial.
Without a doubt, Titan produces some of the industry’s best-performing, proven-in-the-field bias
tires for construction and earthmoving. While we already have strong market share in bias, we
have a vision for continuing to grow it.
NEW CONSTRUCTION
Switching from a dual- to single-bead construction has not
only improved production efficiency, but also improved the
durability of our tires — a win-win for Titan and our customers.
FOCUS ON TOP PRODUCT LINES AND SIZES
By focusing our production efforts on the lines and sizes that are in demand and performing the
best in the field, we’re able to:
NEW CURING TECHNIQUES
We’ve invested in research and development time to
test variations of our curing cycles to identify processes
that result in a more durable, long-lasting radial tire.
ENDURANCE TESTING
Titan’s Quincy, Illinois facility is home to the world’s
largest bull wheel tire-testing facility. As we perfect
our radial tires, we’ve witnessed improvements in
their durability and endurance.
PRODUCT INNOVATION
REFINING THE RADIAL
REDUCE GROW GROW
for our dealers and customers with large, loyal national accounts such as steel mills and container handling
LEAD TIMES BUSINESS NICHE MARKETS
TRIED AND TRUE: THE LEADERS IN BIAS
2016 ANNUAL REPORT20OFF-THE-ROAD
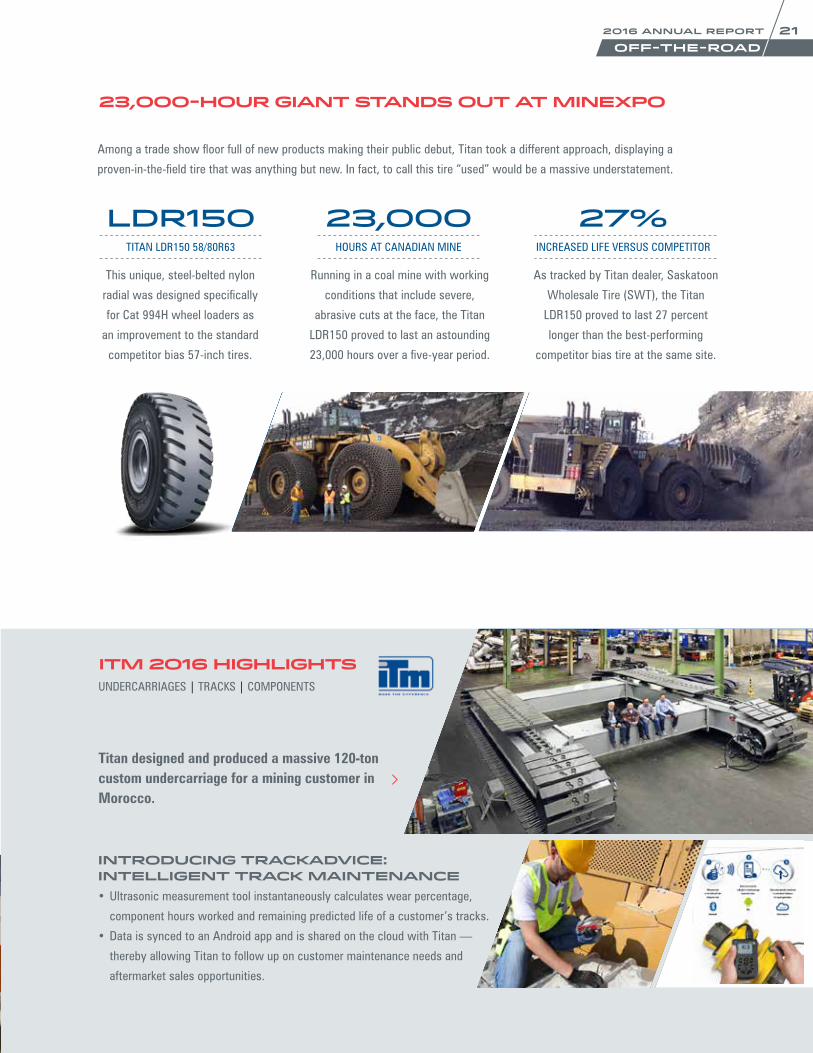
Among a trade show floor full of new products making their public debut, Titan took a different approach, displaying a
proven-in-the-field tire that was anything but new. In fact, to call this tire “used” would be a massive understatement.
Titan designed and produced a massive 120-ton custom undercarriage for a mining customer in Morocco.
ITM 2016 HIGHLIGHTSUNDERCARRIAGES | TRACKS | COMPONENTS
LDR150 23,000 27%
This unique, steel-belted nylon
radial was designed specifically
for Cat 994H wheel loaders as
an improvement to the standard
competitor bias 57-inch tires.
Running in a coal mine with working
conditions that include severe,
abrasive cuts at the face, the Titan
LDR150 proved to last an astounding
23,000 hours over a five-year period.
As tracked by Titan dealer, Saskatoon
Wholesale Tire (SWT), the Titan
LDR150 proved to last 27 percent
longer than the best-performing
competitor bias tire at the same site.
TITAN LDR150 58/80R63 HOURS AT CANADIAN MINE INCREASED LIFE VERSUS COMPETITOR
23,000-HOUR GIANT STANDS OUT AT MINEXPO
INTRODUCING TRACKADVICE: INTELLIGENT TRACK MAINTENANCE • Ultrasonic measurement tool instantaneously calculates wear percentage,
component hours worked and remaining predicted life of a customer’s tracks.
• Data is synced to an Android app and is shared on the cloud with Titan —
thereby allowing Titan to follow up on customer maintenance needs and
aftermarket sales opportunities.
2016 ANNUAL REPORT 21OFF-THE-ROAD

C O N S U M E R
C O N S U M E R
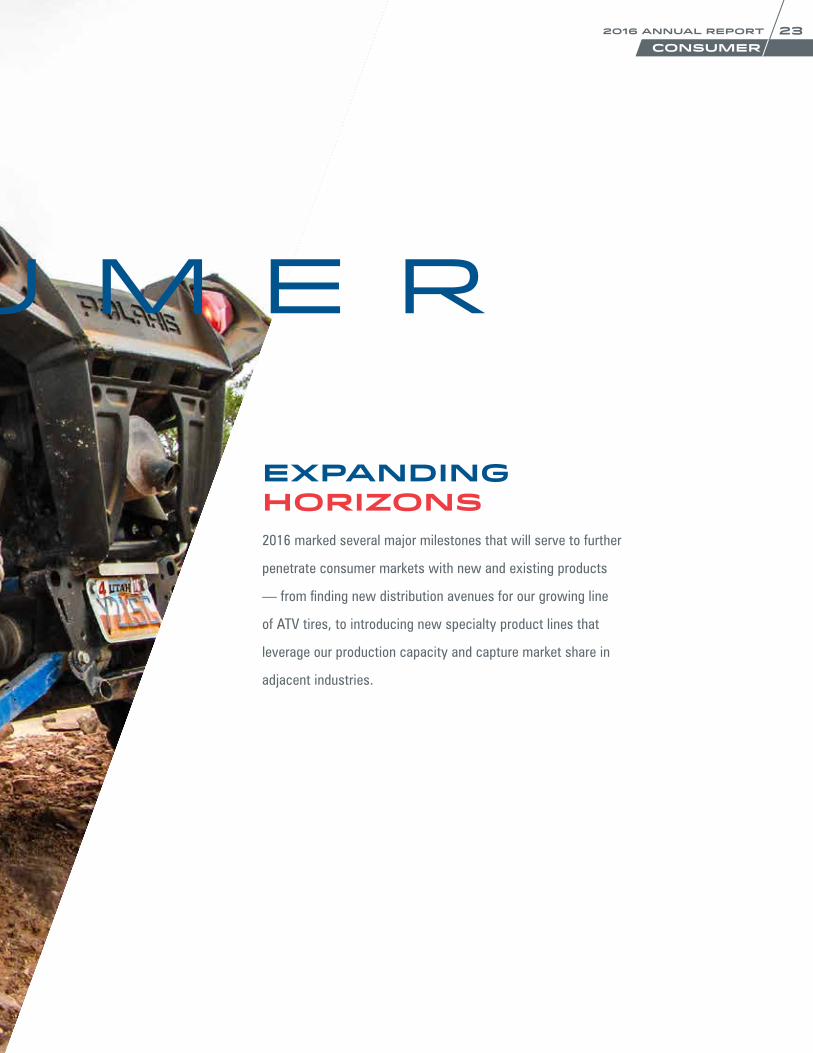
EXPANDING HORIZONS2016 marked several major milestones that will serve to further
penetrate consumer markets with new and existing products
— from finding new distribution avenues for our growing line
of ATV tires, to introducing new specialty product lines that
leverage our production capacity and capture market share in
adjacent industries.
2016 ANNUAL REPORT 23CONSUMER

TITAN LAUNCHES SPECIALTY PRODUCTS DIVISION
Officially launched in June 2016, Titan’s specialty rubber products division produces high-quality, American-made mud flaps,
cattle mats and stall mats out of the Union City, Tennessee facility. In its first year, significant progress has already been made.
ATV / UTV: NEW PRODUCTS, NEW DISTRIBUTION
MUD FLAPS CATTLE AND STALL MATS
COMING IN 2017
• Swine Mats now being produced, distribution network to be built in 2017
• Equestrian product line to be introduced
• Product development for new applications including wheelchair ramps,
truck beds and more
GOODYEAR RAWHIDE GRIP
Aggressive tread for unbeatable traction
• Two new sizes for larger ATVs added in 2016
• 20 total sizes now available in Rawhide design
TITANATV.COM
Direct-to-consumer tire sales
• More than 100 styles and sizes with competitive retail pricing
• Shipped to 48 states, direct from our Freeport, Illinois facility
TITAN T-HAWK
Rugged, military-inspired design
• Two new sizes for all-seasons performance
• Excellent choice for long-lasting roadability
13%
350
300
250
200
150
1002012 2013 2014 2015 2016
$269 $259 $287
$176$158
FINANCIAL RECAP: CONSUMER
NET SALES (2012-2016) AMOUNTS IN MILLIONS
PERCENTAGE OF SALES
2016 ANNUAL REPORT24CONSUMER

UNITED STATESSECURITIES AND EXCHANGE COMMISSION
Washington, D.C. 20549
FORM 10-K
þ ANNUAL REPORT PURSUANT TO SECTION 13 OR 15(d) OF THE SECURITIES EXCHANGE ACT OF 1934For the fiscal year ended December 31, 2016
or
o TRANSITION REPORT PURSUANT TO SECTION 13 OR 15(d) OF THE SECURITIES EXCHANGE ACT OF 1934
Commission file number 1-12936
TITAN INTERNATIONAL, INC.(Exact name of registrant as specified in its charter)
Delaware 36-3228472
(State or other jurisdiction of incorporation or organization) (I.R.S. Employer Identification No.)2701 Spruce Street, Quincy, IL 62301(Address of principal executive offices)
(217) 228-6011(Registrant’s telephone number, including area code)
Securities registered pursuant to Section 12(b) of the Act:
Title of each class Name of each exchange on which registeredCommon stock, $0.0001 par value New York Stock Exchange (Symbol: TWI)
Securities registered pursuant to Section 12(g) of the Act: None
Indicate by check mark if the registrant is a well-known seasoned issuer, as defined by Rule 405 of the Securities Act. Yes o No þIndicate by check mark if the registrant is not required to file reports pursuant to Section 13 or Section 15(d) of the Act. Yes o No þIndicate by check mark whether the registrant (1) has filed all reports required to be filed by Section 13 or 15(d) of the Securities Exchange Act of1934 during the preceding 12 months (or such shorter period that the registrant was required to file such reports) and (2) has been subject to suchfiling requirements for the past 90 days. Yes þ No oIndicate by check mark whether the registrant has submitted electronically and posted on its corporate Web site, if any, every Interactive Data Filerequired to be submitted and posted pursuant to Rule 405 of Regulation S-T during the preceding 12 months (or for such shorter period that theregistrant was required to submit and post such files). Yes þ No oIndicate by check mark if disclosure of delinquent filers pursuant to Item 405 of Regulation S-K is not contained herein, and will not be contained, tothe best of registrant's knowledge, in definitive proxy or information statements incorporated by reference in Part III of this Form 10-K or anyamendment to this Form 10-K. þIndicate by check mark whether the registrant is a large accelerated filer, an accelerated filer, a non-accelerated filer, or a smaller reportingcompany. See the definitions of “large accelerated filer,” “accelerated filer,” and “smaller reporting company” in Rule 12b-2 of the Exchange Act.
Large accelerated filer o Accelerated filer þNon-accelerated filer o (Do not check if a smaller reporting company) Smaller reporting company o
Indicate by check mark whether the registrant is a shell company (as defined in Rule 12b-2 of the Act). Yes o No þThe aggregate market value of the shares of common stock of the registrant held by non-affiliates was approximately $268 million based upon thelast reported sale price of the common stock on the New York Stock Exchange on June 30, 2016.Indicate the number of shares of Titan International, Inc. outstanding: 59,643,711 shares of common stock, $0.0001 par value, as of February 28,2017
DOCUMENTS INCORPORATED BY REFERENCEPortions of the registrant’s definitive proxy statement for the annual meeting of stockholders, to be held on June 14, 2017, are incorporated byreference into Part III of this Form 10-K.
TITAN INTERNATIONAL, INC.Index to Annual Report on Form 10-K
Part I. Page
Item 1. Business 3
Item 1A. Risk Factors 11
Item 1B. Unresolved Staff Comments 15
Item 2. Properties 15
Item 3. Legal Proceedings 17
Item 4. Mine Safety Disclosures 17
Part II.
Item 5. Market for Registrant’s Common Equity, Related Stockholder Matters and IssuerPurchases of Equity Securities 18
Item 6. Selected Financial Data 20
Item 7. Management’s Discussion and Analysis of Financial Condition and Results of Operations 21
Item 7A. Quantitative and Qualitative Disclosures about Market Risk 40
Item 8. Financial Statements and Supplementary Data 40
Item 9. Changes in and Disagreements with Accountants on Accounting and Financial Disclosure 40
Item 9A. Controls and Procedures 40
Item 9B. Other Information 42
Part III.
Item 10. Directors, Executive Officers and Corporate Governance 43
Item 11. Executive Compensation 43
Item 12. Security Ownership of Certain Beneficial Owners and Management and RelatedStockholder Matters 44
Item 13. Certain Relationships, Related Transactions, and Director Independence 44
Item 14. Principal Accounting Fees and Services 44
Part IV.
Item 15. Exhibits and Financial Statement Schedules 45
Signatures 46
Exhibit Index 47
2
PART I
3
ITEM 1 – BUSINESS
This Annual Report on Form 10-K contains forward-looking statements that are subject to risks and uncertainties. Forward-looking statements give current expectations and projections relating to financial condition, results of operations, plans,objectives, future performance, and business. All forward-looking statements are subject to risks and uncertainties that maycause actual results to differ materially from expectations. Important factors that could cause actual results to differ materiallyfrom expectations, or cautionary statements, and other important information about forward-looking statements are disclosedunder Item 1A, “Risk Factors” and Item 7, “Management’s Discussion and Analysis of Financial Condition and Results ofOperations – Forward-Looking Statements” in this Annual Report on Form 10-K.
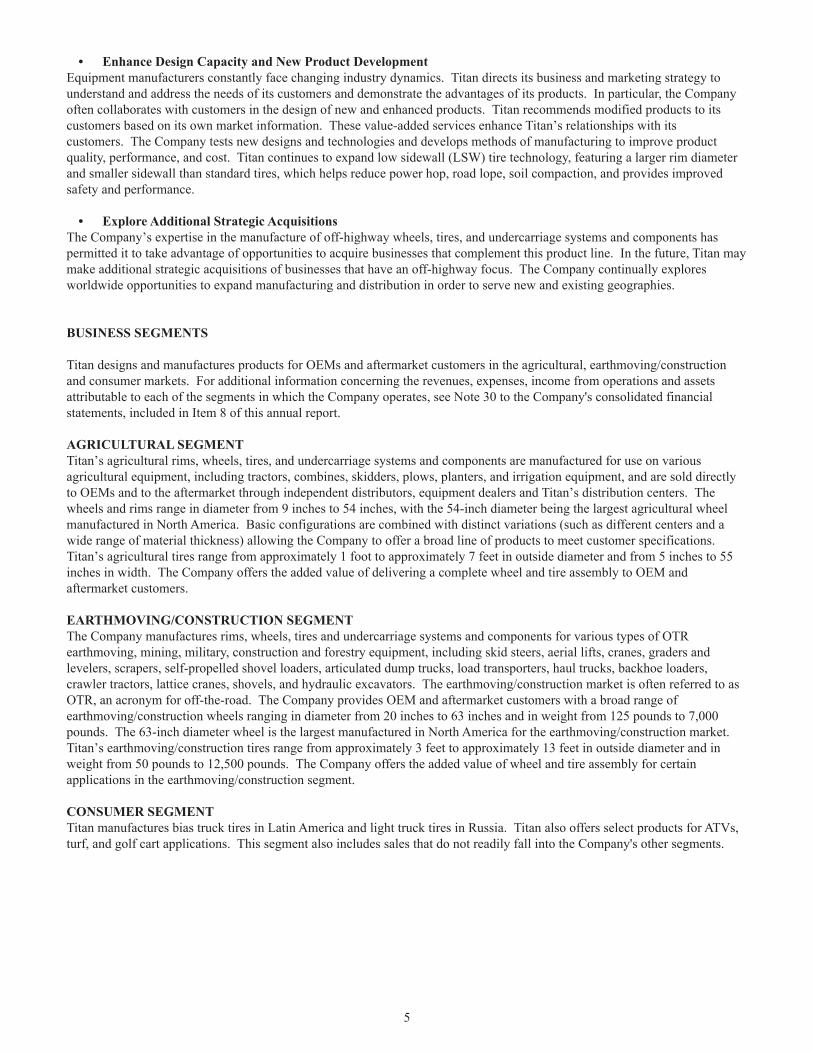
INTRODUCTIONTitan International, Inc., together with its subsidiaries (Titan or the Company), is a global wheel, tire, and undercarriageindustrial manufacturer and supplier servicing customers across its target markets. As a leading manufacturer in the off-highway industry, Titan produces a broad range of products to meet the specifications of original equipment manufacturers(OEMs) and aftermarket customers in the agricultural, earthmoving/construction, and consumer markets. As a manufacturer ofboth wheels and tires, the Company is uniquely positioned to offer customers added value through complete wheel and tireassemblies. Titan's agricultural products include rims, wheels, tires, and undercarriage systems and components manufacturedfor use on various agricultural equipment. Titan’s earthmoving/construction products include rims, wheels, tires, andundercarriage systems and components for various types of off-the-road (OTR) earthmoving, mining, military, construction,and forestry equipment. The Company's consumer products include, but are not limited to, bias truck tires in Latin Americaand light truck tires in Russia, as well as products for all-terrain vehicles (ATVs), turf, and golf cart applications.
As one of the few companies dedicated to off-highway wheels, tires and assemblies, Titan’s engineering and manufacturingresources are focused on designing quality products that address the needs of our customers and end-users across the marketsthat Titan serves. Titan’s team of experienced engineers continuously work on new and improved engineered solutions thatevolve with today’s applications for the off-highway wheel, tire, and assembly markets.
• HistoryThe Company traces its roots to the Electric Wheel Company in Quincy, Illinois, which was founded in 1890. Titan wasincorporated in 1983. The Company has grown through six major acquisitions in recent years. In 2005, Titan Tire Corporation,a subsidiary of the Company, acquired The Goodyear Tire & Rubber Company’s North American farm tire assets. In 2006,Titan Tire Corporation of Bryan, another subsidiary of the Company, acquired the OTR tire assets of Continental Tire NorthAmerica, Inc. In 2011, the Company acquired The Goodyear Tire & Rubber Company's Latin American farm tire business. InAugust 2012, the Company purchased a 56% controlling interest in Planet Corporation Group, now known as Titan National(Australia) Holdings PTY LTD (TNAH). In October 2012, the Company completed its acquisition of Titan Europe. Throughseparate acquisitions in October 2013 and the first half of 2014, the Company, in partnership with One Equity Partners (OEP)and the Russian Direct Investment Fund (RDIF), acquired all of the equity interests in Voltyre-Prom, a leading producer ofagricultural and industrial tires in Volgograd, Russia. These acquisitions have allowed Titan to expand its global footprint andenhance product offerings in the Company’s target markets.
• Market SegmentsIn 2016, Titan’s agricultural segment sales represented 46% of net sales, the earthmoving/construction segment represented41% of net sales, and the consumer segment represented 13% of net sales. COMPETITIVE STRENGTHSTitan’s strong market position in the off-highway wheel, tire, and undercarriage market and its long-term core customerrelationships contribute to the Company’s competitive strengths. Titan produces both wheels and tires which allows theCompany to provide a one-stop solution for its customers' wheel and tire assembly needs. These strengths, along with Titan’sdedication to the off-highway equipment market, continue to drive the Company forward.

• Strong Market PositionAs a result of Titan’s offering of a broad range of specialized wheels, tires, assemblies, and undercarriage systems andcomponents, Titan is a leader in the global off-highway market. Through an extensive dealer network and sales force, theCompany is able to reach an increasing number of aftermarket and OEM customers and build Titan’s image and brandrecognition. The Company’s acquisition of the Goodyear Farm Tire brand in North America and Latin America contributes tooverall visibility and customer confidence, and through the 2012 acquisition of Titan Europe, Titan has a strong presence inEurope. The 2013 acquisition of Voltyre-Prom expanded Titan's footprint into the Commonwealth of Independent States (CIS)region. Years of product design and engineering experience have enabled Titan to improve existing products and develop newones, such as Low Sidewall (LSW®), that have been well received in the marketplace. Titan believes it has benefited fromsignificant barriers to entry, such as the substantial investment necessary to replicate the Company’s manufacturing equipmentand numerous tools, dies and molds, many of which are used in custom processes.
• Wheel and Tire Manufacturing CapabilitiesThe Company’s position as a manufacturer of both wheels and tires allows Titan to mount and deliver one of the largestselections of off-highway assemblies in North America. Titan offers this value-added service of one-stop shopping for wheeland tire assemblies for the agricultural, earthmoving/construction, and consumer segments. Both standard and LSW assembliesare delivered as a single, complete unit based on each customer’s unique requirements.
• Long-Term Core Customer RelationshipsThe Company’s top customers, including global leaders in agricultural and construction equipment manufacturing, have beenpurchasing products from Titan or its predecessors for many years. Customers including AGCO Corporation, Caterpillar Inc.,CNH Global N.V., Deere & Company, Kubota Corporation, and Liebherr have helped sustain Titan’s leadership in wheel, tireand assembly innovation.
BUSINESS STRATEGYTitan’s business strategy is to increase its presence in the segments it serves through its one-stop solutions, including LSWtechnology. The Company continues to seek global expansion of this complete wheel and tire assembly product offering withinthe geographies it competes. This may be through strategic worldwide acquisitions or through expanded manufacturingcapabilities in regions where the Company lacks either the wheel or the tire production. In addition, Titan continues to improveoperating efficiencies and gain additional synergies.
• Low Sidewall (LSW) TechnologyThe Company has developed a low sidewall (LSW) tire technology, featuring a larger rim diameter and a smaller sidewall thanstandard tires. As a cornerstone of the Company's strategy, Titan continues to expand the LSW product offering in both theagricultural and construction segments. Titan’s capabilities as both a wheel and tire manufacturer allow the Company to drivefurther adoption within these markets. Titan seeks to be at the forefront of off-road equipment advancement through theinnovation of its LSW solution with the goal that it will become the industry standard.
The Company pursues an adoption strategy whereby LSW assemblies are placed with certain end users in order to demonstratethe superior performance of this innovative solution. With LSW, these end users experience reduced power hop, road lope, soilcompaction, and fuel consumption as well as improved safety and performance. Both power hop and road lope can disturb rideand impede equipment performance. Low sidewall technology has been widely adopted within the automotive industry formany years. The benefits translate to Titan's markets through superior comfort, ride and fuel economy.
• Increase Aftermarket Tire BusinessThe Company has concentrated on increasing its presence in the tire aftermarket, which historically has tended to be somewhatless cyclical than the OEM market. The aftermarket also offers the potential for higher profit margins and is a larger market inmost cases.
• Improve Operating EfficienciesThe Company constantly works to improve the operating efficiency of its assets and manufacturing facilities. Titan integrateseach facility’s strengths, which may include transferring equipment and business to the facilities that are best equipped tohandle the work. This provides capability to increase utilization and spread operating costs over a greater volume ofproducts. Titan is also continuing a comprehensive program to refurbish, modernize, and enhance the technology of itsmanufacturing equipment.
4
• Enhance Design Capacity and New Product DevelopmentEquipment manufacturers constantly face changing industry dynamics. Titan directs its business and marketing strategy tounderstand and address the needs of its customers and demonstrate the advantages of its products. In particular, the Companyoften collaborates with customers in the design of new and enhanced products. Titan recommends modified products to itscustomers based on its own market information. These value-added services enhance Titan’s relationships with itscustomers. The Company tests new designs and technologies and develops methods of manufacturing to improve productquality, performance, and cost. Titan continues to expand low sidewall (LSW) tire technology, featuring a larger rim diameterand smaller sidewall than standard tires, which helps reduce power hop, road lope, soil compaction, and provides improvedsafety and performance.
• Explore Additional Strategic AcquisitionsThe Company’s expertise in the manufacture of off-highway wheels, tires, and undercarriage systems and components haspermitted it to take advantage of opportunities to acquire businesses that complement this product line. In the future, Titan maymake additional strategic acquisitions of businesses that have an off-highway focus. The Company continually exploresworldwide opportunities to expand manufacturing and distribution in order to serve new and existing geographies.
BUSINESS SEGMENTS
Titan designs and manufactures products for OEMs and aftermarket customers in the agricultural, earthmoving/constructionand consumer markets. For additional information concerning the revenues, expenses, income from operations and assetsattributable to each of the segments in which the Company operates, see Note 30 to the Company's consolidated financialstatements, included in Item 8 of this annual report.
AGRICULTURAL SEGMENTTitan’s agricultural rims, wheels, tires, and undercarriage systems and components are manufactured for use on variousagricultural equipment, including tractors, combines, skidders, plows, planters, and irrigation equipment, and are sold directlyto OEMs and to the aftermarket through independent distributors, equipment dealers and Titan’s distribution centers. Thewheels and rims range in diameter from 9 inches to 54 inches, with the 54-inch diameter being the largest agricultural wheelmanufactured in North America. Basic configurations are combined with distinct variations (such as different centers and awide range of material thickness) allowing the Company to offer a broad line of products to meet customer specifications.Titan’s agricultural tires range from approximately 1 foot to approximately 7 feet in outside diameter and from 5 inches to 55inches in width. The Company offers the added value of delivering a complete wheel and tire assembly to OEM andaftermarket customers.
EARTHMOVING/CONSTRUCTION SEGMENTThe Company manufactures rims, wheels, tires and undercarriage systems and components for various types of OTRearthmoving, mining, military, construction and forestry equipment, including skid steers, aerial lifts, cranes, graders andlevelers, scrapers, self-propelled shovel loaders, articulated dump trucks, load transporters, haul trucks, backhoe loaders,crawler tractors, lattice cranes, shovels, and hydraulic excavators. The earthmoving/construction market is often referred to asOTR, an acronym for off-the-road. The Company provides OEM and aftermarket customers with a broad range ofearthmoving/construction wheels ranging in diameter from 20 inches to 63 inches and in weight from 125 pounds to 7,000pounds. The 63-inch diameter wheel is the largest manufactured in North America for the earthmoving/construction market.Titan’s earthmoving/construction tires range from approximately 3 feet to approximately 13 feet in outside diameter and inweight from 50 pounds to 12,500 pounds. The Company offers the added value of wheel and tire assembly for certainapplications in the earthmoving/construction segment.
CONSUMER SEGMENTTitan manufactures bias truck tires in Latin America and light truck tires in Russia. Titan also offers select products for ATVs,turf, and golf cart applications. This segment also includes sales that do not readily fall into the Company's other segments.
5
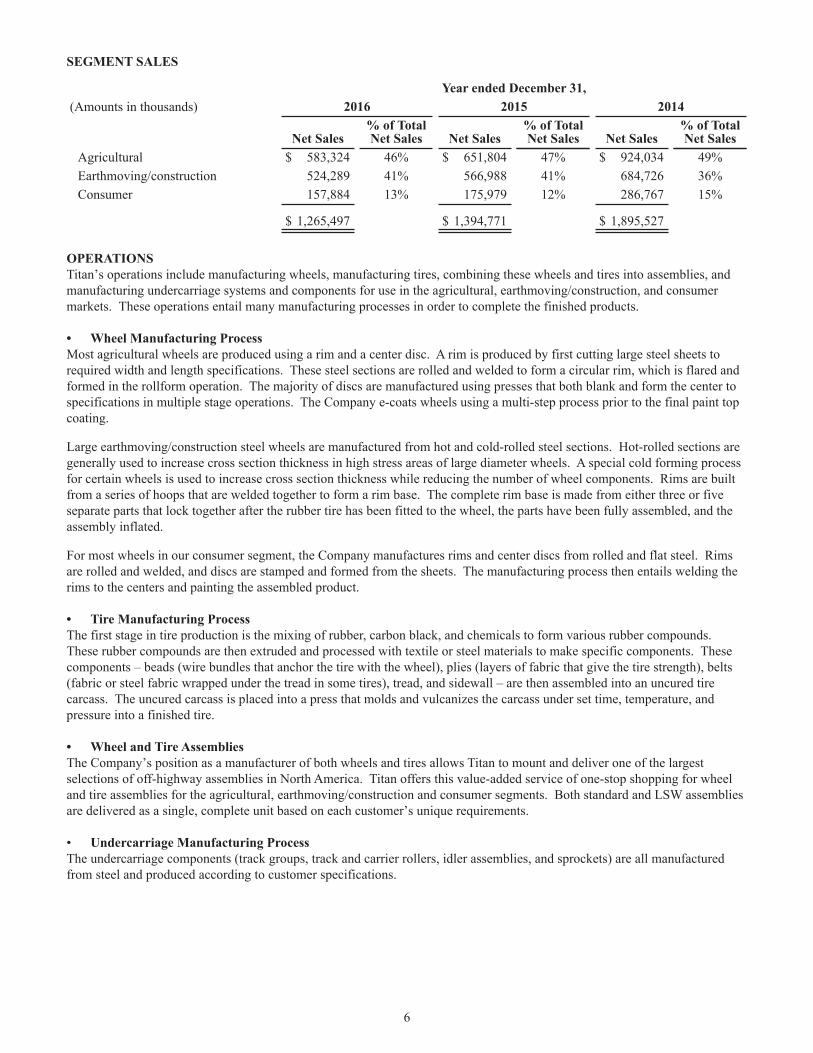
SEGMENT SALES
Year ended December 31,(Amounts in thousands) 2016 2015 2014
Net Sales% of TotalNet Sales Net Sales
% of TotalNet Sales Net Sales
% of TotalNet Sales
Agricultural $ 583,324 46% $ 651,804 47% $ 924,034 49%Earthmoving/construction 524,289 41% 566,988 41% 684,726 36%Consumer 157,884 13% 175,979 12% 286,767 15%
$ 1,265,497 $ 1,394,771 $ 1,895,527
OPERATIONSTitan’s operations include manufacturing wheels, manufacturing tires, combining these wheels and tires into assemblies, andmanufacturing undercarriage systems and components for use in the agricultural, earthmoving/construction, and consumermarkets. These operations entail many manufacturing processes in order to complete the finished products.
• Wheel Manufacturing ProcessMost agricultural wheels are produced using a rim and a center disc. A rim is produced by first cutting large steel sheets torequired width and length specifications. These steel sections are rolled and welded to form a circular rim, which is flared andformed in the rollform operation. The majority of discs are manufactured using presses that both blank and form the center tospecifications in multiple stage operations. The Company e-coats wheels using a multi-step process prior to the final paint topcoating. Large earthmoving/construction steel wheels are manufactured from hot and cold-rolled steel sections. Hot-rolled sections aregenerally used to increase cross section thickness in high stress areas of large diameter wheels. A special cold forming processfor certain wheels is used to increase cross section thickness while reducing the number of wheel components. Rims are builtfrom a series of hoops that are welded together to form a rim base. The complete rim base is made from either three or fiveseparate parts that lock together after the rubber tire has been fitted to the wheel, the parts have been fully assembled, and theassembly inflated. For most wheels in our consumer segment, the Company manufactures rims and center discs from rolled and flat steel. Rimsare rolled and welded, and discs are stamped and formed from the sheets. The manufacturing process then entails welding therims to the centers and painting the assembled product.
• Tire Manufacturing ProcessThe first stage in tire production is the mixing of rubber, carbon black, and chemicals to form various rubber compounds.These rubber compounds are then extruded and processed with textile or steel materials to make specific components. Thesecomponents – beads (wire bundles that anchor the tire with the wheel), plies (layers of fabric that give the tire strength), belts(fabric or steel fabric wrapped under the tread in some tires), tread, and sidewall – are then assembled into an uncured tirecarcass. The uncured carcass is placed into a press that molds and vulcanizes the carcass under set time, temperature, andpressure into a finished tire.
• Wheel and Tire AssembliesThe Company’s position as a manufacturer of both wheels and tires allows Titan to mount and deliver one of the largestselections of off-highway assemblies in North America. Titan offers this value-added service of one-stop shopping for wheeland tire assemblies for the agricultural, earthmoving/construction and consumer segments. Both standard and LSW assembliesare delivered as a single, complete unit based on each customer’s unique requirements.
• Undercarriage Manufacturing ProcessThe undercarriage components (track groups, track and carrier rollers, idler assemblies, and sprockets) are all manufacturedfrom steel and produced according to customer specifications.
6
All of the track groups produced by the Company are built from four major parts: shoes, right and left hand links, pins, andbushings. Shoes are manufactured from steel cast in the Company foundry or obtained from different shapes of hot rolledprofiles (depending on application), sheared to length, and then heat treated for high wear bending and breaking resistance.Right and left hand links are hot forged, trimmed, mass heat treated, machined and finally induction hardened on rail surfacefor optimal wear and fatigue resistance. Pins are made from round bars that are cut, machined, heat treated, and surfacefinished. Bushings are generally cold extruded, machined, mass heat treated, and finally carburized or induction hardened forwear resistance and optimal toughness. The lifetime lubricated and maintenance free track and carrier rollers are assembled with two major components: single ordouble flange roller shells (typically hot forged in halves, deep hardened, friction or arc welded, and finish machined withmetallurgical characteristics depending upon size and application) and shafts (generally cut from bars or forged, mass heattreated, rough machined, induction hardened, and ground). The idler assemblies are also lifetime lubricated, for virtually no maintenance. They are offered with cast (single web orhollow design) or fabricated shells, depending on size and application, and feature induction-hardened tread surfaces foroptimal wear resistance. The sprockets, designed to transfer the machine driving loads from the final drive to the track, are produced cast or forged inseveral geometric options, depending upon size and application. They are also heat treated for wear resistance and crackingresistance. The undercarriage systems, custom designed and produced by the Company, consist of a structured steel fabricated frame, allthe undercarriage components mentioned above (track groups, track and carrier rollers, idler assemblies, and sprockets) and afinal drive. They are completely assembled in house, for consistent quality.
• Quality ControlThe Company is ISO certified at all four main domestic manufacturing facilities located in Bryan, Ohio; Des Moines, Iowa;Freeport, Illinois; and Quincy, Illinois, as well as the majority of the foreign manufacturing facilities. The ISO series is a set ofrelated and internationally recognized standards of management and quality assurance. The standards specify guidelines forestablishing, documenting, and maintaining a system to ensure quality. The ISO certifications are a testament to Titan’sdedication to providing quality products for its customers.
RAW MATERIALSSteel and rubber are the primary raw materials used by the Company in all segments. To ensure a consistent steel supply, Titanpurchases raw steel from key steel mills and maintains relationships with steel processors for steel preparation. The Companyis not dependent on any single producer for its steel supply; however, some components do have limited suppliers. Rubber andother raw materials for tire manufacture represent some of the Company’s largest commodity expenses. Titan buys rubber inmarkets where there are usually several sources of supply. In addition to the development of key domestic suppliers, theCompany’s strategic procurement plan includes international steel and rubber suppliers to assure competitive price and qualityin the global marketplace. As is customary in the industry, the Company does not have long-term contracts for the purchase ofsteel or rubber and, therefore, purchases are subject to price fluctuations. Titan has developed a procurement strategy andpractice designed to mitigate price risk and lower cost.
CAPITAL EXPENDITURESCapital expenditures for 2016, 2015, and 2014 were $41.9 million, $48.4 million, and $58.4 million, respectively. The capitalexpenditures in each year were used primarily for expanding capabilities, updating manufacturing equipment, and for furtherautomation at the Company’s facilities.
PATENTS, TRADEMARKS AND ROYALTIESThe Company owns various patents and trademarks and continues to apply for patent protection for new products. Due to thedifficult nature of predicting the interpretation of patent laws, the Company cannot anticipate or predict any material adverseeffect on its operations, cash flows, or financial condition as a result of associated liabilities created under such patentinterpretations should the Company be unable to protect its patents or be found to be infringing others' patents.
7
The Company has trademark license agreements with The Goodyear Tire & Rubber Company to manufacture and sell certainfarm tires under the Goodyear name. These agreements cover sales in North America, Latin America, Europe, the Middle East,Africa, Russia, and other Commonwealth of Independent States countries. The North American and Latin American farm tireroyalties were prepaid through March 2018 as a part of the 2011 Goodyear Latin American farm tire acquisition. The Companyalso has a trademark license agreement with Goodyear to manufacture and sell certain non-farm tire products in Latin Americaunder the Goodyear name.
MARKETING AND DISTRIBUTIONThe Company employs an internal sales force and utilizes several manufacturing representative firms for sales in North America,Europe, Latin America, the CIS region, and other worldwide locations. Sales representatives are primarily organized withingeographic regions.
Titan distributes wheels, tires, assemblies, and undercarriage systems directly to OEMs. The distribution of aftermarket tiresoccurs primarily through a network of independent and OEM-affiliated dealers.
SEASONALITYAgricultural equipment sales are seasonal by nature. Farmers generally order equipment to be delivered before the growingseason. Shipments to OEMs in the U.S. and Europe usually peak during the Company’s first and second quarters for the springplanting period, while shipments in Latin America usually peak during the Company's second and third quarters for the fallplanting period. Earthmoving/construction and consumer segments historically tend to experience higher demand in the firstand second quarters. These segments are affected by mining, building, and economic conditions.
RESEARCH, DEVELOPMENT AND ENGINEERINGThe Company’s research, development and engineering staff tests original designs and technologies and develops newmanufacturing methods to improve product performance. These services enhance the Company’s relationships with itscustomers. Titan's advantage as both a wheel and tire manufacturer allow the Company to design, test, and bring to marketinnovative solutions to meet the specific needs of its customers. For example, Titan has also developed a low sidewall (LSW)tire technology, featuring a larger rim diameter and a smaller sidewall than standard tires, which helps reduce power hop, roadlope, soil compaction, and provides improved safety and performance. Research and development (R&D) expenses areexpensed as incurred. R&D costs were $10.0 million, $11.2 million, and $14.0 million for the years ending December 31,2016, 2015, and 2014, respectively.
CUSTOMERSTitan’s 10 largest customers accounted for 34% of net sales for the year ended December 31, 2016, and 31% for the year endedDecember 31, 2015. Net sales to Deere & Company in Titan’s agricultural, earthmoving/construction and consumer segmentscombined represented 9% and 10% of the Company’s consolidated revenues for the years ended December 31, 2016 and 2015,respectively. No other customer accounted for more than 7% of the Company’s net sales in 2016 or 2015. Managementbelieves the Company is not dependent on any single customer; however, certain products are dependent on a fewcustomers. While the loss of any substantial customer could impact Titan’s business, the Company believes that its diverseproduct mix and customer base should minimize a longer-term impact caused by any such loss.
ORDER BACKLOGTitan estimates that, at January 31, 2017, it had $240 million in orders believed to be firm compared to $203 million atJanuary 31, 2016. The January 31, 2017, order amount included $81 million in the agricultural segment, $152 million in theearthmoving/construction segment, and $7 million in the consumer segment. The January 31, 2016, order amount included $76million in the agricultural segment, $118 million in the earthmoving/construction segment, and $9 million in the consumersegment. The Company believes the above orders at January 31, 2017 will be filled during the current year. The Companydoes not believe that its backlog is material to, or a significant factor in, evaluating and understanding any of its businesssegments or its businesses considered as a whole.
INTERNATIONAL OPERATIONSThe Company operates a manufacturing facility in Sao Paulo, Brazil. The Latin American operations recorded 14% and 12%of the Company's sales for the years ended December 31, 2016 and 2015, respectively.
The Titan Europe operations, which sells to OEM and aftermarket customers, accounted for 33% and 31% of the Company'ssales for the years ended December 31, 2016 and 2015, respectively.
8
The Company operates a manufacturing facility in Volgograd, Russia, expanding its presence to the CIS region. The Voltyre-Prom operations accounted for 7% and 5% of the Company's sales for the years ended December 31, 2016 and 2015,respectively.
EMPLOYEESAt December 31, 2016, the Company employed approximately 6,100 people worldwide, including approximately 4,200 locatedoutside the United States.
The collective bargaining agreements at each of the Company's Bryan, Ohio; Freeport, Illinois; and Des Moines, Iowafacilities, which collectively account for approximately 40% of the Company’s U.S. employees at December 31, 2016, wereoriginally scheduled to expire in November 2016, were extended until January 2017 and have since expired. Union employeesat these facilities, which represent all of the Company's union employees in the U.S., have been working without a collectivebargaining agreement while the Company and the United Steelworkers (USW) continue negotiations toward a new contract.
Outside the United States, the Company enters into employment agreements in those countries in which such relationships aremandatory or customary. The provisions of these agreements correspond in each case with the required or customary terms inthe subject jurisdiction.
ENVIRONMENTAL LAWS AND REGULATIONSIn the ordinary course of business, similar to other industrial companies, Titan is subject to extensive and evolving federal,state, and local environmental laws and regulations, and has made provisions for the estimated financial impact of potentialenvironmental cleanup. The Company’s policy is to accrue environmental cleanup-related costs of a non-capital nature whenthose costs are believed to be probable and can be reasonably estimated. Expenditures that extend the life of the relatedproperty, or mitigate or prevent future environmental contamination, are capitalized. The Company does not currentlyanticipate any material capital expenditures for environmental control facilities. The quantification of environmental exposuresrequires an assessment of many factors, including changing laws and regulations, advances in environmental technologies, thequality of information available related to specific sites, the assessment stage of the site investigation, preliminary findings, andthe length of time involved in remediation or settlement. Due to the difficult nature of predicting future environmental costs,the Company cannot anticipate or predict the material adverse effect on its operations, cash flows, or financial condition as aresult of efforts to comply with, or its liabilities under, environmental laws.
As of December 31, 2016, two of Titan’s subsidiaries were involved in litigation concerning environmental laws andregulations: In October 2010, the United States of America, on behalf of the Environmental Protection Agency (EPA), filed a complaintagainst Dico, Inc. (Dico) and Titan Tire Corporation (Titan Tire) in the U.S. District Court for the Southern District of Iowa,wherein the EPA sought civil penalties, punitive damages and response costs against Dico and Titan Tire pursuant to theComprehensive Environmental Response, Compensation, and Liability Act of 1980 (CERCLA). In June 2015, Titan Tire and Dico, Inc. appealed the U.S. District Court’s order granting the EPA’s motion for summaryjudgment that found Dico and Titan Tire liable for civil penalties and response costs for violating CERCLA and Dico liable forcivil penalties and punitive damages for violating an EPA Administrative Order. In December 2015, the United States Court of Appeals reversed the District Court’s summary judgment order with respect to“arranger” liability for Titan Tire and Dico under CERCLA and the imposition of punitive damages against Dico for violatingthe EPA Administrative Order, but affirmed the summary judgment order imposing civil penalties in the amount of $1.62million against Dico for violating the EPA Administrative Order violation. The case has been remanded to the District Court for trial expected to commence in March 2017 on the issues of “arranger”liability under CERCLA as to Titan Tire and Dico and whether punitive damages should be imposed upon Dico for allegedviolations of the EPA Administrative Order.
COMPETITIONThe Company competes with several domestic and international companies, some of which are larger and have greaterfinancial and marketing resources than Titan. The Company believes it is a primary source of steel wheels and rims to themajority of its North American customers. Major competitors in the off-highway wheel market include GKN Wheels, Ltd.,Trelleborg Group, and Topy Industries, Ltd. Significant competitors in the off-highway tire market include Alliance TireCompany Ltd., Balkrishna Industries Limited (BKT), Bridgestone/Firestone, Michelin, Mitas a.s., and Pirelli. Significantcompetitors in the undercarriage market include Berco and Caterpillar.
9
The Company competes primarily on the basis of price, quality, customer service, design capability, and delivery time. TheCompany's position of manufacturing both the wheel and the tire allows us to provide innovative assembly solutions for ourcustomers, creating a competitive advantage in the marketplace. The Company’s ability to compete with internationalcompetitors may be adversely affected by currency fluctuations. Titan owns the molds and dies used to produce its wheels andtires. However, certain of the Company’s OEM customers could elect to manufacture the Company’s products to meet theirrequirements or to otherwise compete with the Company. There can be no assurance that the Company will not be adverselyaffected by increased competition in the markets in which it operates, or that competitors will not develop products that aremore effective, less expensive, or otherwise render certain of Titan’s products less competitive. From time to time, certain ofthe Company’s competitors have reduced their prices in particular product categories, which has prompted Titan to reduceprices as well. There can be no assurance that competitors of the Company will not further reduce prices in the future or thatany such reductions would not have a material adverse effect on the Company.
NEW YORK STOCK EXCHANGE CERTIFICATIONThe Company submitted to the New York Stock Exchange during fiscal 2016 the Annual CEO Certification required by Section303A.12(a) of the New York Stock Exchange Listed Company Manual.
AVAILABLE INFORMATIONThe Company’s annual report on Form 10-K, quarterly reports on Form 10-Q, current reports on Form 8-K, and anyamendments to those reports are made available, without charge, through the Company’s website located at www.titan-intl.comas soon as reasonably practicable after they are filed with the Securities and Exchange Commission (SEC). You can also obtaincopies of these materials by visiting the SEC’s Public Reference Room at 100 F Street, NE, Washington, D.C. 20549, by callingthe SEC at 800-SEC-0330, or by accessing the SEC’s website at www.SEC.gov. The following documents are also posted onthe Company’s website:
• Corporate Governance Policy
• Business Conduct Policy
• Audit Committee Charter
• Compensation Committee Charter
• Nominating Committee Charter
• Corporate Governance Committee Charter
Printed copies of these documents are available, without charge, by writing to: Titan International, Inc.,c/o Corporate Secretary, 2701 Spruce Street, Quincy, IL 62301.
The information on, or that may be accessed through, the aforementioned websites is not incorporated into this filing andshould not be considered a part of this filing.
10
ITEM 1A – RISK FACTORS
The Company is subject to various risks and uncertainties, including those described below, relating to or arising out of thenature of its business and general business, economic, financing, legal, and other factors or conditions that may affect theCompany. Realization of any of the following risks could have a material adverse effect on Titan’s business, financialcondition, cash flows, and results of operations and, in turn, the value of Titan securities. In addition, other risks not presentlyknown or that the Company currently believes to be immaterial may also adversely affect Titan's business, financial conditionand results of operations, perhaps materially. The risks discussed below also include forward-looking statements, and actualresults and events may differ substantially from those discussed or highlighted in these forward-looking statements. Beforemaking an investment decision with respect to any of Titan securities, you should carefully consider the following risks anduncertainties described below and elsewhere in this annual report.
• The Company is exposed to price fluctuations of key commodities.The Company uses various raw materials, most significantly steel and rubber, in manufacturing products across all ofits market segments. The Company does not generally enter into long-term commodity contracts and does not usederivative commodity instruments to hedge exposures to commodity market price fluctuations. Therefore, theCompany is exposed to price fluctuations of key commodities. Although the Company attempts to pass on certainmaterial price increases to its customers, there is no assurance that the Company will be able to do so in thefuture. Any increase in the price of steel and rubber that is not passed on to customers could have a material adverseeffect on Titan’s results of operations.
• The Company relies on a limited number of suppliers.
The Company currently relies on a limited number of suppliers for certain key commodities, which consist primarilyof steel and rubber, in the manufacturing of Titan products. If the Company's suppliers are unable to provide rawmaterials to Titan in a timely manner, or are unable to meet quality, quantity, or cost requirements, the Company maynot in all cases be able to promptly obtain substitute sources. Any extended delay in receiving critical materials couldimpair Titan's ability to deliver products to its customers. The loss of key suppliers, the inability to establishrelationships with replacement suppliers, or the inability of Titan's suppliers to meet price, quality, quantity, anddelivery requirements could have a significant adverse impact on the Company’s results of operations.
• The Company’s revolving credit facility and other debt obligations contain covenants that could limit how theCompany conducts its business.The Company’s revolving credit facility and other debt obligations contain covenants and restrictions. Thesecovenants and restrictions could limit Titan’s ability to respond to market conditions, to provide for unanticipatedcapital investments, to raise additional debt or equity capital, to pay dividends, or to take advantage of businessopportunities, including future acquisitions. Titan’s ability to comply with the covenants may be affected by eventsbeyond its control, including prevailing economic, financial, and industry conditions.
• The Company operates in cyclical industries and is subject to numerous changes in the economy.
The Company's sales are substantially dependent on three major industries: agricultural equipment, earthmoving/construction equipment, and consumer products. The business activity levels in these industries are subject to specificindustry and general economic cycles. Any downturn in these industries or the general economy could have a materialadverse effect on Titan’s business.
The agricultural equipment industry is affected by crop prices, farm income and farmland values, weather, exportmarkets, and government policies. The earthmoving/construction industry is affected by the levels of government andprivate construction spending and replacement demand. The mining industry, which is within the earthmoving/construction industry, is affected by raw material commodity prices. The consumer products industry is affected byconsumer disposable income, weather, competitive pricing, energy prices, and consumer attitudes. In addition, theperformance of these industries is sensitive to interest rate and foreign exchange rate changes and varies with theoverall level of economic activity.
• The Company’s revenues are seasonal in nature due to Titan’s dependence on seasonal industries.The agricultural, earthmoving/construction, and recreational industries are seasonal, with typically lower sales duringthe second half of the year. This seasonality in demand has resulted in fluctuations in the Company’s revenues andoperating results. Because much of Titan’s overhead expenses are fixed, seasonal trends can cause volatility in profitmargins and financial condition when comparing results from consecutive quarters.
11

• The Company’s customer base is relatively concentrated.The Company’s ten largest customers, which are primarily original equipment manufacturers (OEMs), accounted for34% of Titan’s net sales for 2016. Net sales to Deere & Company represented 9% of total 2016 net sales. No othercustomer accounted for more than 7% of net sales in 2016. Titan’s business could be adversely affected if one of itslarger customers reduces, or otherwise eliminates in full, its purchases from Titan due to work stoppages or slow-downs, financial difficulties, as a result of termination provisions, competitive pricing, or other reasons. There is alsocontinuing pressure from the OEMs to reduce costs, including the cost of products and services purchased fromoutside suppliers such as Titan, and the risk of OEMs developing in-house tire and wheel capabilities. There can be noassurance that Titan will be able to maintain its relationships with its current customers, including its most significantcustomers. Any failure to maintain the Company’s relationship with any of its leading customers could have anadverse effect on results of operations.
• The Company may be adversely affected by changes in government regulations and policies.Domestic and foreign political developments and government regulations and policies directly affect the agricultural,earthmoving/construction, and consumer products industries in the United States and abroad. Regulations and policiesin the agricultural industry include those encouraging farm acreage reduction in the United States and granting ethanolsubsidies. Regulations and policies relating to the earthmoving/construction industry include the construction of roads,bridges, and other items of infrastructure. The modification of existing laws, regulations, or policies, or the adoption ofnew laws, regulations, or policies could have an adverse effect on any one or more of these industries and, therefore,on Titan’s business.
• The Company is subject to corporate governance requirements, and costs related to compliance with, or failure
to comply with, existing and future requirements could adversely affect Titan’s business.The Company is subject to corporate governance requirements under the Sarbanes-Oxley Act of 2002, as well as rulesand regulations of the Securities and Exchange Commission (SEC), the Public Company Accounting Oversight Board(PCAOB), and the New York Stock Exchange (NYSE). These laws, rules, and regulations continue to evolve and maybecome increasingly restrictive. Failure to comply with these laws, rules, and regulations may have a material adverseeffect on Titan’s reputation, financial condition, and the value of the Company’s securities.
• The Company faces substantial competition from domestic and international companies.
The Company competes with several domestic and international competitors, some of which are larger and havegreater financial and marketing resources than Titan. The Company competes primarily on the basis of price, quality,customer service, design capability, and delivery time. The Company’s ability to compete with internationalcompetitors may be adversely affected by currency fluctuations. In addition, certain OEM customers could elect tomanufacture certain products to meet their own requirements or to otherwise compete with Titan. The success of theCompany's business depends in large part on its ability to provide comprehensive wheel and tire assemblies to itscustomers. The development or enhancement by Titan's competitors of similar capabilities could adversely affect itsbusiness.
There can be no assurance that Titan’s businesses will not be adversely affected by increased competition in theCompany’s markets, or that competitors will not develop products that are more effective or less expensive than Titanproducts or which could render certain products less competitive. From time to time certain competitors have reducedprices in particular product categories, which has caused Titan to reduce prices. There can be no assurance that in thefuture Titan’s competitors will not further reduce prices, or that any such reductions would not have a material adverseeffect on Titan’s business.
• The Company may be affected by unfair trade.Titan faces intense competition from producers both in the United States and around the world, some of which mayengage in unfair trade practices. In early January 2016, Titan, along with the United Steel, Paper and Forestry,Rubber, Manufacturing, Energy, Allied Industrial and Service Worker International Union, AFL-CIO, CLC ofPittsburgh, Pennsylvania, filed petitions with the U.S. Department of Commerce (DOC) and the U.S. InternationalTrade Commission (ITC) alleging that imported off-the-road tires from India and Sri Lanka and wheel and tireassemblies from China were being dumped and/or subsidized and were a cause of material injury to the domesticindustry. See “Item 3 - Legal Proceedings” for further details regarding these proceedings. Unfair trade may have amaterial adverse effect on Titan's business.
12
• The Company could be negatively impacted if Titan fails to maintain satisfactory labor relations.The Company was previously party to three collective bargaining agreements with separate locals of the USW andcovering certain of its employees in Des Moines, Iowa, Freeport, Illinois, and Bryan, Ohio. Each of the threecollective bargaining agreements covering its employees in the U.S., which were originally scheduled to expire inNovember 2016, was extended until January 2017 and each agreement has since expired. Notwithstanding theexpiration of the three agreements, and in keeping with its obligations under Federal labor law, Titan is presently innegotiations with the USW. If Titan is unable to negotiate new collective bargaining agreements that are satisfactoryto the Company, the employees covered thereby could engage in strikes, or the Company may otherwise experiencework slowdowns or be subject to other labor actions. Any such actions, and any other labor disputes with theCompany's employees domestically or internationally, could materially disrupt its operations. New collectivebargaining agreements may impose significant additional costs on Titan, which could adversely affect its financialcondition and results of operations.
• Unfavorable outcomes of legal proceedings could adversely affect results of operations.The Company is a party to routine legal proceedings arising out of the normal course of business. Due to the difficultnature of predicting unresolved and future legal claims, the Company cannot anticipate or predict any material adverseeffect on its consolidated financial condition, results of operations, or cash flows as a result of efforts to comply with,or its liabilities pertaining to, legal judgments. Any adverse outcome in any litigation involving Titan or any of itssubsidiaries could negatively affect the Company's business, reputation, and financial condition.
• Acquisitions/divestitures may require significant resources and/or result in significant losses, costs, or liabilities.
Any future acquisitions or divestitures will depend on the ability to identify suitable candidates, to negotiateacceptable terms, and to finance acquisitions. Titan will also face competition for suitable acquisition candidates,which may increase costs. In addition, acquisitions and divestitures require significant managerial attention, whichmay be diverted from current operations. Furthermore, acquisitions and divestitures of businesses or facilities entail anumber of additional risks, including:
- problems with effective integration or separation of operations, including challenges in implementing uniformstandards, controls, procedures, and policies throughout an acquired business;
- potential disruption of the Company's ongoing business and the distraction of management from its day-to-dayoperations;
- the inability to maintain key pre-acquisition customer, supplier, and employee relationships;
- the potential that expected benefits or synergies are not realized and operating costs increase; and
- exposure to unanticipated liabilities.
International acquisitions or divestitures may be more complex and time consuming. Also, international acquisitionsand divestitures may include a number of additional risks, including the integration of acquisitions or separation ofdivestitures operating under differing laws and regulations.
Subject to the terms of its existing indebtedness, the Company may finance future acquisitions with cash fromoperations, additional indebtedness, and/or by issuing additional equity securities. These commitments may impairthe operation of Titan’s businesses. In addition, the Company could face financial risks associated with incurringadditional indebtedness, such as reducing liquidity and access to financing markets and increasing the amount of cashflow required to service such indebtedness.
• The Company has international operations and purchases raw material from foreign suppliers. The Company had total aggregate sales outside the United States of approximately $707.2 million, $750.2 million and$1,028.0 million, for the years ended December 31, 2016, 2015 and 2014, respectively. Sales outside the UnitedStates have become a significant proportion of total sales, accounting for 56%, 54% and 54% for the years endingDecember 31, 2016, 2015 and 2014, respectively. Sales from these international operations are expected to continueto represent a similar portion of total sales.
13

International Operations and Sales – International operations and sales are subject to a number of special risks,including, but not limited to, risks with respect to currency exchange rates, economic and political destabilization,other disruption of markets, and restrictive actions by foreign governments (such as restrictions on transfer of funds,export duties, and quotas and foreign customs). Other risks include changes in foreign laws regarding trade andinvestment; difficulties in obtaining distribution and support; nationalization; reforms of United States laws andpolicies affecting trade, foreign investment, and loans; and changes in foreign tax and other laws. There may also berestrictions on the Company's ability to repatriate earnings and investments from international operations. There canbe no assurance that one or a combination of these factors will not have a material adverse effect on the Company’sability to increase or maintain its foreign sales.
Foreign Suppliers – The Company purchases raw materials from foreign suppliers. The production costs, profitmargins, and competitive position of the Company are affected by the strength of the currencies in countries whereTitan purchases goods, relative to the strength of the currencies in countries where the products are sold. TheCompany’s results of operations, cash flows, and financial position may be affected by fluctuations in foreigncurrencies.
• The Company is subject to anti-corruption laws and regulations.The Company has international operations and must comply with anti-corruption laws and regulations including theU.S. Foreign Corrupt Practices Act (FCPA). These anti-bribery laws generally prohibit companies and theirintermediaries from making improper payments or providing anything of value for the purpose of obtaining orretaining business. The FCPA prohibits these payments regardless of local customs and practices. Violations of theselaws could adversely affect the Company's business.
• The Company may be subject to product liability and warranty claims.
The Company warrants its products to be free of certain defects and, accordingly, may be subject to product liability orproduct warranty claims in the ordinary course of business. Losses may result or be alleged to result from defects inTitan products, which could subject the Company to claims for damages, including consequential damages. There canbe no assurance that Company insurance will be adequate for liabilities actually incurred or that adequate insurancewill be available on terms acceptable to the Company. Any claims relating to defective products that result in liabilityexceeding Titan’s insurance coverage could have a material adverse effect on financial condition and results ofoperations. Further, claims of defects could result in negative publicity against Titan, which could adversely affect theCompany’s business.
• The Company has incurred, and may incur in the future, net losses.The Company reported loss before income taxes of $32.9 million, $52.0 million, and $152.2 million for the yearsended December 31, 2016, 2015, and 2014, respectively, and may incur losses in the future. There is no guarantee theCompany will be profitable in the future. Any failure by Titan to obtain or sustain profitability could cause the priceof Titan common stock to decline significantly.
• The Company may be adversely affected by a disruption in, or failure of, information technology systems.The Company relies upon information technology systems, some of which are managed by third parties, to process,transmit, and store electronic information. Technology systems are used in a variety of business processes andactivities, including purchasing, manufacturing, distribution, invoicing, and financial reporting. The Company utilizessecurity measures and business continuity plans to prevent, detect, and remediate damage from computer viruses,natural disasters, unauthorized access, utility failures, and other similar disruptions. Despite these measures, a securitybreach or information technology system failure may disrupt and adversely affect the Company's operations. Asignificant theft, loss, or fraudulent use of customer or employee information could adversely impact the Company'sreputation and could result in significant costs, fines, and litigation.
• The Company is subject to risks associated with climate change regulations.
Governmental regulatory bodies in the United States and other countries have adopted, or are contemplatingintroducing regulatory changes in response to the potential impacts of climate change. Laws and regulations regardingclimate change and energy usage may impact the Company directly through higher costs for energy and rawmaterials. The Company’s customers may also be affected by climate change regulations that may impact futurepurchases of the Company's products. Physical climate change may potentially have a large impact on the Company’stwo largest industry segments, agriculture and earthmoving/construction. The potential impacts of climate change andclimate change regulations are highly uncertain at this time, and the Company cannot anticipate or predict any materialadverse effect on its consolidated financial condition, results of operations, or cash flows as a result of climate changeand climate change regulations.
14
• The Company is subject to risks associated with environmental laws and regulations.The Company’s operations are subject to federal, state, local, and foreign laws and regulations governing, among otherthings, emissions to air, discharge to waters, and the generation, handling, storage, transportation, treatment, anddisposal of waste and other materials. The Company’s operations entail risks in these areas, and there can be noassurance that Titan will not incur material costs or liabilities. In addition, potentially significant expenditures couldbe required in order to comply with evolving environmental and health and safety laws, regulations or requirementsthat may be adopted or imposed in the future. Titan’s customers may also be affected by environmental laws andregulations that may impact future purchases of the Company's products.
• The Company is subject to foreign currency translation risk.The Company continues to expand globally and now operates in many worldwide locations and transacts business inmany foreign currencies. Titan's financial statements are reported in U.S. dollars with financial statements ofinternational subsidiaries being initially recorded in foreign currencies and translated into U.S. dollars. Largefluctuations in currency exchange rates between the U.S. dollar and other world currencies may materially adverselyaffect the Company's financial condition, results of operations, and liquidity.
• The Company may incur additional tax expense or tax exposure.The Company is subject to income taxes in the United States and numerous foreign jurisdictions, and has domesticand international tax liabilities which are dependent upon the distribution of income among these differentjurisdictions. Titan's income tax provision and cash tax liability in the future could be adversely affected by numerousfactors, including income before taxes being lower than anticipated in countries with lower statutory tax rates andhigher than anticipated in countries with higher statutory tax rates, changes in the valuation of deferred tax assets andliabilities, and changes in tax laws and regulations.
• The Company is subject to risks associated with uncertainties related to social, political, and economic conditionsin Russia and Brazil.Geopolitical and economic uncertainties relating to Russia and Brazil have and could continue to have a negativeimpact on the Company's sales and results of operations at the Company's Russian and Brazilian operations.
• The Company is subject to risks associated with failure to maintain adequate disclosure controls and internalcontrols over financial reporting.The Company has previously disclosed a material weakness in its internal controls over financial reporting. Failure tomaintain adequate financial and management processes and controls could affect the accuracy and timing of theCompany’s financial reporting. Testing and maintaining internal control over financial reporting involves significantcosts and could divert management’s attention from other matters that are important to Titan's business. If theCompany’s management is unable to certify the effectiveness of its internal controls, its independent registered publicaccounting firm cannot render an opinion on the effectiveness of its internal control over financial reporting, which,together with any identified material weaknesses or significant deficiencies in the Company’s internal controls, couldsubject the Company to regulatory scrutiny and a loss of public confidence. In addition, if the Company does notmaintain adequate financial and management personnel, processes, and controls, it may not be able to accuratelyreport its financial performance on a timely basis, which could have a material adverse effect on the confidence in itsfinancial reporting, its credibility in the marketplace and the trading price of Titan's common stock.
• The Company is not insured against all potential losses and could be harmed by natural disasters, catastrophes,or sabotage.The Company's business activities involve substantial investments in manufacturing facilities and products areproduced at a limited number of locations. These facilities could be materially damaged, including as a result ofnatural disasters, such as floods, tornadoes, hurricanes, and earthquakes or by sabotage. The Company could incuruninsured losses and liabilities arising from such events, as well as damage to its reputation, and/or suffer materiallosses in operational capacity and efficiency, which could have a material adverse impact on Titan's business, financialcondition and results of operations.
15
ITEM 1B – UNRESOLVED STAFF COMMENTS
Not applicable.
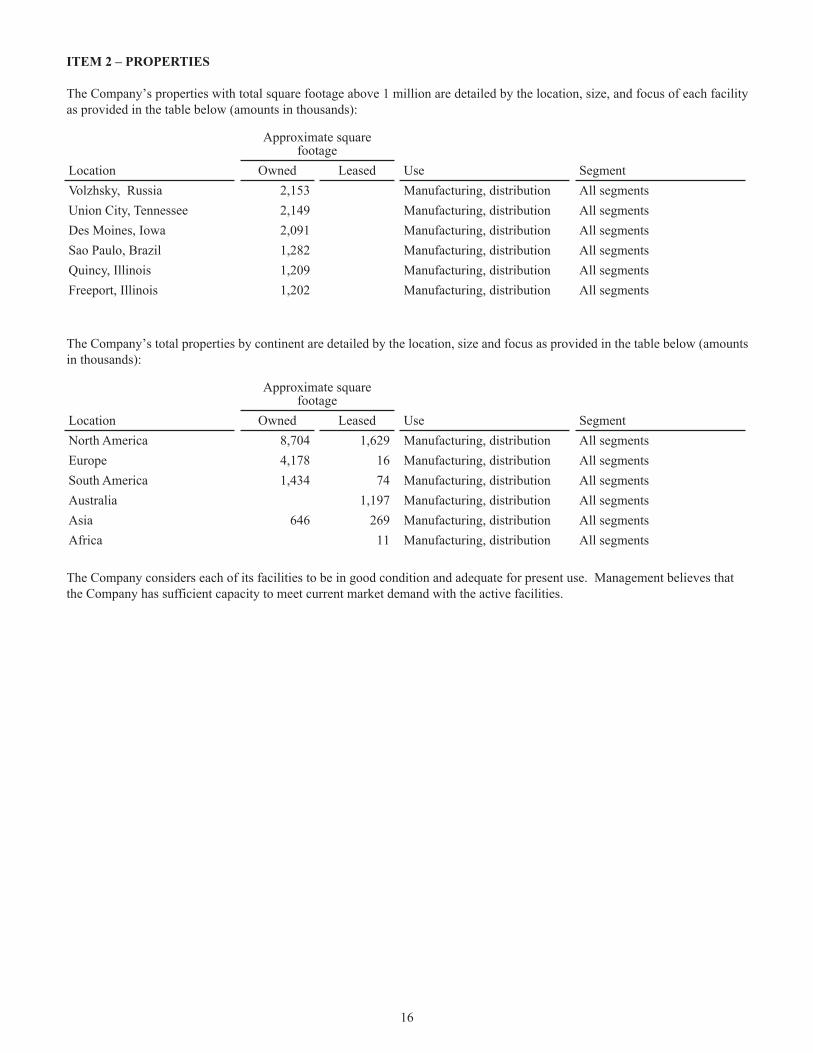
ITEM 2 – PROPERTIES
The Company’s properties with total square footage above 1 million are detailed by the location, size, and focus of each facilityas provided in the table below (amounts in thousands):
Approximate squarefootage
Location Owned Leased Use SegmentVolzhsky, Russia 2,153 Manufacturing, distribution All segmentsUnion City, Tennessee 2,149 Manufacturing, distribution All segmentsDes Moines, Iowa 2,091 Manufacturing, distribution All segmentsSao Paulo, Brazil 1,282 Manufacturing, distribution All segmentsQuincy, Illinois 1,209 Manufacturing, distribution All segmentsFreeport, Illinois 1,202 Manufacturing, distribution All segments
The Company’s total properties by continent are detailed by the location, size and focus as provided in the table below (amountsin thousands):
Approximate squarefootage
Location Owned Leased Use SegmentNorth America 8,704 1,629 Manufacturing, distribution All segmentsEurope 4,178 16 Manufacturing, distribution All segmentsSouth America 1,434 74 Manufacturing, distribution All segmentsAustralia 1,197 Manufacturing, distribution All segmentsAsia 646 269 Manufacturing, distribution All segmentsAfrica 11 Manufacturing, distribution All segments
The Company considers each of its facilities to be in good condition and adequate for present use. Management believes thatthe Company has sufficient capacity to meet current market demand with the active facilities.
16

ITEM 3 – LEGAL PROCEEDINGS
The Company is a party to routine legal proceedings arising out of the normal course of business. Although it is not possible topredict with certainty the outcome of these unresolved legal actions or the range of possible loss, the Company believes at thistime that none of these actions, individually or in the aggregate, will have a material adverse effect on the consolidatedfinancial condition, results of operations, or cash flows of the Company. However, due to the difficult nature of predictingunresolved and future legal claims, the Company cannot anticipate or predict the material adverse effect on its consolidatedfinancial condition, results of operations, or cash flows as a result of efforts to comply with, or its liabilities pertaining to, legaljudgments.
Presently, Titan is engaged in the following material legal proceeding:
In early January 2016, Titan, along with the United Steel, Paper and Forestry, Rubber, Manufacturing, Energy, Allied Industrialand Service Worker International Union, AFL-CIO, CLC of Pittsburgh, Pennsylvania, filed petitions with the DOC and the ITCalleging that imported off-the-road tires from India and Sri Lanka and wheel and tire assemblies from China were beingdumped and/or subsidized and were a cause of material injury to the domestic industry. Both the DOC and the ITC initiatedinvestigations against India and Sri Lanka, but the ITC did not recommend pursuing the investigation into wheel and tireassemblies from China. On January 4, 2017, the DOC made a final affirmative determination in both the Indian and Sri Lankancountervailing duty cases, and subsequently made an amended affirmative final determination of dumping on imports fromIndia for all but one company. Also on January 4, 2017, the ITC conducted the final injury hearing on Titan and the UnitedSteel Workers’ petitions. In February 2017, the ITC determined, by unanimous vote, that the domestic industry producingcertain off-the-road tires was materially injured by reason of subsidized imports from India and Sri Lanka and "dumped"imports from India. On March 9, 2017, countervailing duty orders on imports of off-the-road tires from India and Sri Lankaand an anti-dumping duty order on such tires from India (with the exception of imports from one company) were published inthe Federal Register by DOC. Following the ITC's February 28, 2017, determination, importers of products covered by theDOC's countervailing duty orders and antidumping order are required to post cash deposits equal to the countervailing dutyamounts identified in the orders.
Two of Titan’s subsidiaries, Dico, Inc. and Titan Tire Corporation, are currently involved in litigation concerning environmentallaws and regulations. See "Environmental Laws and Regulations" in Item 1 for additional information.
17
ITEM 4 – MINE SAFETY DISCLOSURES
Not applicable.

PART II
18
ITEM 5 – MARKET FOR REGISTRANT’S COMMON EQUITY, RELATED STOCKHOLDER MATTERS ANDISSUER PURCHASES OF EQUITY SECURITIES
The Company’s common stock is traded on the New York Stock Exchange (NYSE) under the symbol TWI. As of February 15,2017, there were approximately 400 holders of record of Titan common stock. The following table sets forth the high and lowsales prices per share of common stock as reported on the NYSE, as well as information concerning per share dividendsdeclared for the periods indicated.
2016 High LowDividendsDeclared
First quarter $ 6.32 $ 2.50 $ 0.005Second quarter 7.50 4.80 0.005Third quarter 10.19 5.97 0.005Fourth quarter 12.14 8.82 0.0052015First quarter $ 10.79 $ 8.77 $ 0.005Second quarter 12.50 9.00 0.005Third quarter 10.85 6.34 0.005Fourth quarter 7.91 3.53 0.005

PERFORMANCE COMPARISON GRAPHThe performance graph below compares cumulative total return on the Company’s common stock over the past five yearsagainst the cumulative total return of the Standard & Poor’s 600 Agricultural & Farm Machinery Index, and against theStandard & Poor’s 500 Stock Index. The graph depicts the value on December 31, 2016, of a $100 investment made onDecember 31, 2011, in Company common stock and each of the other two indices, with all dividends reinvested. The stockprice performance reflected below is based on historical results and is not necessarily indicative of future stock priceperformance.
The performance graph is not deemed to be “soliciting material” or to be “filed” with the SEC for the purposes of Section 18of the Securities Exchange Act of 1934, or otherwise subject to the liabilities under that Section, and shall not be deemed to beincorporated by reference into any filing of Titan under the Securities Act of 1933 or the Securities Exchange Act of 1934.
Titan International, Inc. S&P 500 Index
S&P 600 Agricultural & Farm Machinery Index
COMPARISON OF CUMULATIVE FIVE YEAR TOTAL RETURN
250
200
150
100
50
0
Dec-11 Dec-12 Dec-13 Dec-14 Dec-15 Dec-16
Fiscal Year Ended December 31,2011 2012 2013 2014 2015 2016
Titan International, Inc. $ 100.00 $ 111.72 $ 92.59 $ 54.82 $ 20.38 $ 58.14S&P 500 Index 100.00 116.00 153.57 174.60 177.01 198.18S&P 600 Agricultural & FarmMachinery Index (a) 100.00 140.54 175.81 163.61 154.41 211.59(a) The S&P 600 Agricultural & Farm Machinery index was created March 2014. The index data above reflects the old S&P 600 Construction & FarmMachinery & Heavy Trucks index from 12/31/11 - 2/28/14 and the new S&P 600 Agricultural & Farm Machinery index from 3/31/14 - forward.
19
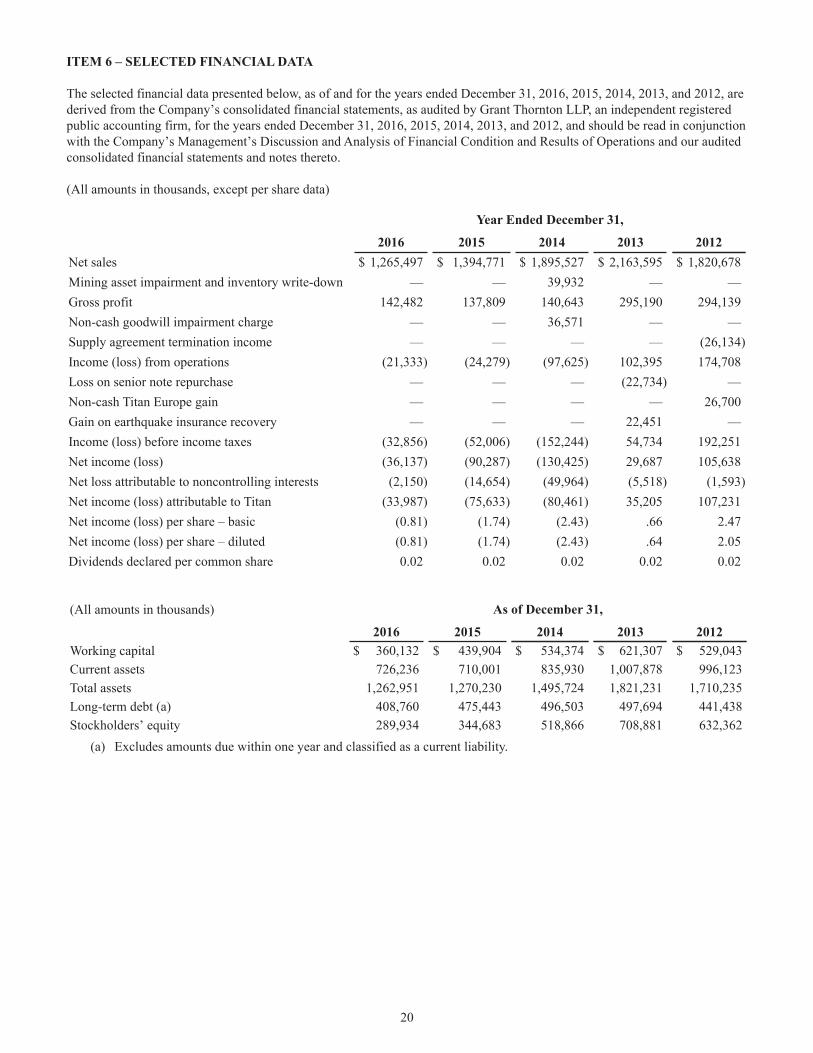
ITEM 6 – SELECTED FINANCIAL DATA
The selected financial data presented below, as of and for the years ended December 31, 2016, 2015, 2014, 2013, and 2012, arederived from the Company’s consolidated financial statements, as audited by Grant Thornton LLP, an independent registeredpublic accounting firm, for the years ended December 31, 2016, 2015, 2014, 2013, and 2012, and should be read in conjunctionwith the Company’s Management’s Discussion and Analysis of Financial Condition and Results of Operations and our auditedconsolidated financial statements and notes thereto.
(All amounts in thousands, except per share data)
Year Ended December 31,
2016 2015 2014 2013 2012Net sales $ 1,265,497 $ 1,394,771 $ 1,895,527 $ 2,163,595 $ 1,820,678Mining asset impairment and inventory write-down — — 39,932 — —Gross profit 142,482 137,809 140,643 295,190 294,139Non-cash goodwill impairment charge — — 36,571 — —Supply agreement termination income — — — — (26,134)Income (loss) from operations (21,333) (24,279) (97,625) 102,395 174,708Loss on senior note repurchase — — — (22,734) —Non-cash Titan Europe gain — — — — 26,700Gain on earthquake insurance recovery — — — 22,451 —Income (loss) before income taxes (32,856) (52,006) (152,244) 54,734 192,251Net income (loss) (36,137) (90,287) (130,425) 29,687 105,638Net loss attributable to noncontrolling interests (2,150) (14,654) (49,964) (5,518) (1,593)Net income (loss) attributable to Titan (33,987) (75,633) (80,461) 35,205 107,231Net income (loss) per share – basic (0.81) (1.74) (2.43) .66 2.47Net income (loss) per share – diluted (0.81) (1.74) (2.43) .64 2.05Dividends declared per common share 0.02 0.02 0.02 0.02 0.02
(All amounts in thousands) As of December 31,
2016 2015 2014 2013 2012Working capital $ 360,132 $ 439,904 $ 534,374 $ 621,307 $ 529,043Current assets 726,236 710,001 835,930 1,007,878 996,123Total assets 1,262,951 1,270,230 1,495,724 1,821,231 1,710,235Long-term debt (a) 408,760 475,443 496,503 497,694 441,438Stockholders’ equity 289,934 344,683 518,866 708,881 632,362
(a) Excludes amounts due within one year and classified as a current liability.
20
ITEM 7 – MANAGEMENT’S DISCUSSION AND ANALYSIS OF FINANCIAL CONDITION AND RESULTS OFOPERATIONS
MANAGEMENT’S DISCUSSION AND ANALYSISManagement’s discussion and analysis of financial condition and results of operations (MD&A) is designed to provide a readerof these financial statements with a narrative from the perspective of the management of Titan International, Inc. (together withits subsidiaries, Titan, or the Company) on Titan’s financial condition, results of operations, liquidity, and other factors whichmay affect the Company’s future results.
21
FORWARD-LOOKING STATEMENTSThis Form 10-K contains forward-looking statements, which are covered by the "Safe Harbor for Forward-LookingStatements" provided by the Private Securities Litigation Reform Act of 1995. You can identify these statements by the fact thatthey do not relate strictly to historical or current facts. We have tried to identify forward-looking statements in this report byusing words such as “anticipates,” “estimates,” “expects,” “intends,” “plans,” and “believes,” and similar expressions or futureor conditional verbs such as “will,” “should,” “would,” “may,” and “could.” These forward-looking statements include amongother items:
• The Company's financial performance;
• Anticipated trends in the Company’s business;
• Expectations with respect to the end-user markets into which the Company sells its products (including agricultural equipment,earthmoving/construction equipment, and consumer products);
• Future expenditures for capital projects;
• The Company’s ability to continue to control costs and maintain quality;
• Ability to meet conditions of loan agreements;
• The Company’s business strategies, including its intention to introduce new products;
• Expectations concerning the performance and success of the Company’s existing and new products; and
• The Company’s intention to consider and pursue acquisition and divestiture opportunities.
Readers of this Form 10-K should understand that these forward-looking statements are based on the Company’s currentexpectations and assumptions about future events and are subject to a number of risks, uncertainties, and changes incircumstances that are difficult to predict, including those in Item 1A, Part I of this report, “Risk Factors,” certain of which arebeyond the Company’s control.
Actual results could differ materially from these forward-looking statements as a result of certain factors, including:
• The effect of a recession on the Company and its customers and suppliers;
• Changes in the Company’s end-user markets into which the Company sells its products as a result of world economic orregulatory influences or otherwise;
• Changes in the marketplace, including new products and pricing changes by the Company’s competitors;
• Ability to maintain satisfactory labor relations;
• Unfavorable outcomes of legal proceedings;
• Availability and price of raw materials;
• Levels of operating efficiencies;
• The effects of the Company's indebtedness and its compliance with the terms thereof;
• Changes in the interest rate environment and their effects on the Company's outstanding indebtedness;
• Unfavorable product liability and warranty claims;
• Actions of domestic and foreign governments;
• Geopolitical and economic uncertainties relating to Russia and Brazil;
• Risks associated with acquisitions, including difficulty in integrating operations and personnel, disruption of ongoing business,and increased expenses:
• Results of investments;
• The effects of previously announced processes to explore various strategic transactions, including potential dispositions;
• Fluctuations in currency translations;
• Climate change and related laws and regulations;
• Risks associated with environmental laws and regulations; and
• Risks related to financial reporting, internal controls, tax accounting, and information systems.
Any changes in such factors could lead to significantly different results. Any assumptions that are inaccurate or do not prove tobe correct could have a material adverse effect on the Company’s ability to achieve the results as indicated in forward-lookingstatements. Forward-looking statements speak only as of the date of this report. The Company undertakes no obligation topublicly update or revise any forward-looking statements, whether as a result of new information, future events, orotherwise. In light of these risks and uncertainties, there can be no assurance that the forward-looking information andassumptions contained in this document will in fact transpire. You should not place undue reliance on the forward-lookingstatements included in this report or that may be made elsewhere from time to time by the Company, or on its behalf. Allforward-looking statements attributable to Titan are expressly qualified by these cautionary statements.
22
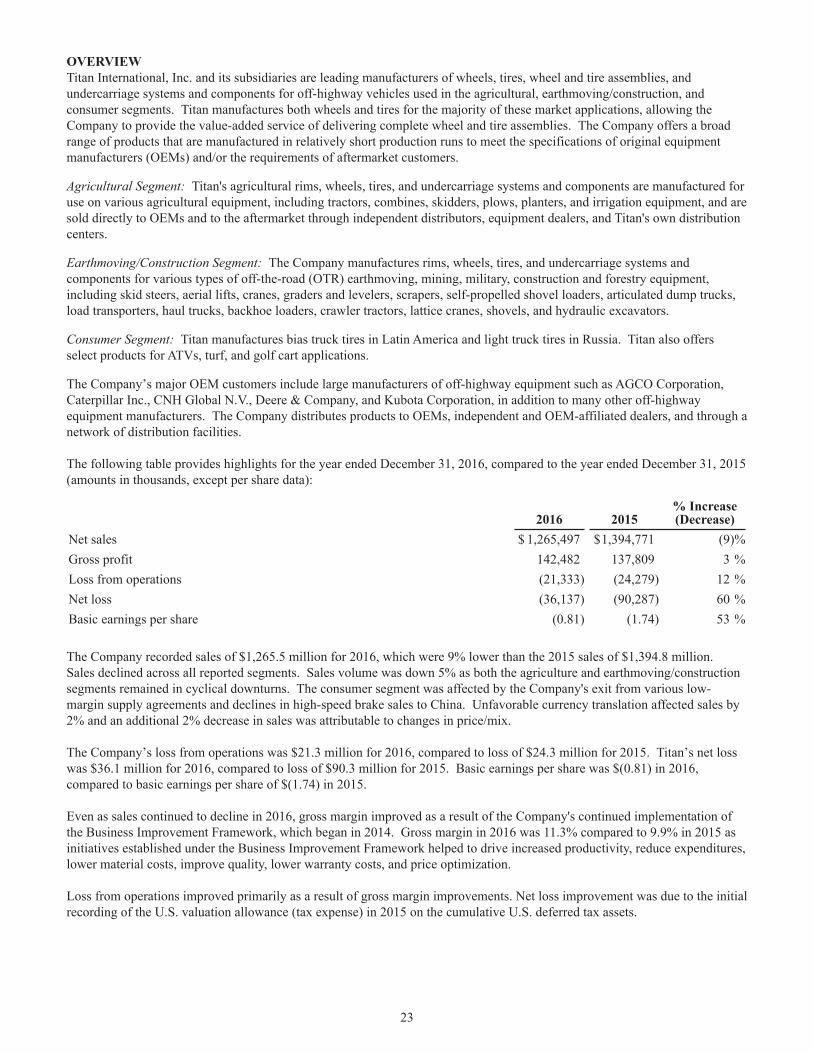
OVERVIEWTitan International, Inc. and its subsidiaries are leading manufacturers of wheels, tires, wheel and tire assemblies, andundercarriage systems and components for off-highway vehicles used in the agricultural, earthmoving/construction, andconsumer segments. Titan manufactures both wheels and tires for the majority of these market applications, allowing theCompany to provide the value-added service of delivering complete wheel and tire assemblies. The Company offers a broadrange of products that are manufactured in relatively short production runs to meet the specifications of original equipmentmanufacturers (OEMs) and/or the requirements of aftermarket customers. Agricultural Segment: Titan's agricultural rims, wheels, tires, and undercarriage systems and components are manufactured foruse on various agricultural equipment, including tractors, combines, skidders, plows, planters, and irrigation equipment, and aresold directly to OEMs and to the aftermarket through independent distributors, equipment dealers, and Titan's own distributioncenters. Earthmoving/Construction Segment: The Company manufactures rims, wheels, tires, and undercarriage systems andcomponents for various types of off-the-road (OTR) earthmoving, mining, military, construction and forestry equipment,including skid steers, aerial lifts, cranes, graders and levelers, scrapers, self-propelled shovel loaders, articulated dump trucks,load transporters, haul trucks, backhoe loaders, crawler tractors, lattice cranes, shovels, and hydraulic excavators. Consumer Segment: Titan manufactures bias truck tires in Latin America and light truck tires in Russia. Titan also offersselect products for ATVs, turf, and golf cart applications. The Company’s major OEM customers include large manufacturers of off-highway equipment such as AGCO Corporation,Caterpillar Inc., CNH Global N.V., Deere & Company, and Kubota Corporation, in addition to many other off-highwayequipment manufacturers. The Company distributes products to OEMs, independent and OEM-affiliated dealers, and through anetwork of distribution facilities.
The following table provides highlights for the year ended December 31, 2016, compared to the year ended December 31, 2015(amounts in thousands, except per share data):
2016 2015% Increase(Decrease)
Net sales $ 1,265,497 $1,394,771 (9)%Gross profit 142,482 137,809 3 %Loss from operations (21,333) (24,279) 12 %Net loss (36,137) (90,287) 60 %Basic earnings per share (0.81) (1.74) 53 %
The Company recorded sales of $1,265.5 million for 2016, which were 9% lower than the 2015 sales of $1,394.8 million.Sales declined across all reported segments. Sales volume was down 5% as both the agriculture and earthmoving/constructionsegments remained in cyclical downturns. The consumer segment was affected by the Company's exit from various low-margin supply agreements and declines in high-speed brake sales to China. Unfavorable currency translation affected sales by2% and an additional 2% decrease in sales was attributable to changes in price/mix.
The Company’s loss from operations was $21.3 million for 2016, compared to loss of $24.3 million for 2015. Titan’s net losswas $36.1 million for 2016, compared to loss of $90.3 million for 2015. Basic earnings per share was $(0.81) in 2016,compared to basic earnings per share of $(1.74) in 2015.
Even as sales continued to decline in 2016, gross margin improved as a result of the Company's continued implementation ofthe Business Improvement Framework, which began in 2014. Gross margin in 2016 was 11.3% compared to 9.9% in 2015 asinitiatives established under the Business Improvement Framework helped to drive increased productivity, reduce expenditures,lower material costs, improve quality, lower warranty costs, and price optimization.
Loss from operations improved primarily as a result of gross margin improvements. Net loss improvement was due to the initialrecording of the U.S. valuation allowance (tax expense) in 2015 on the cumulative U.S. deferred tax assets.
23
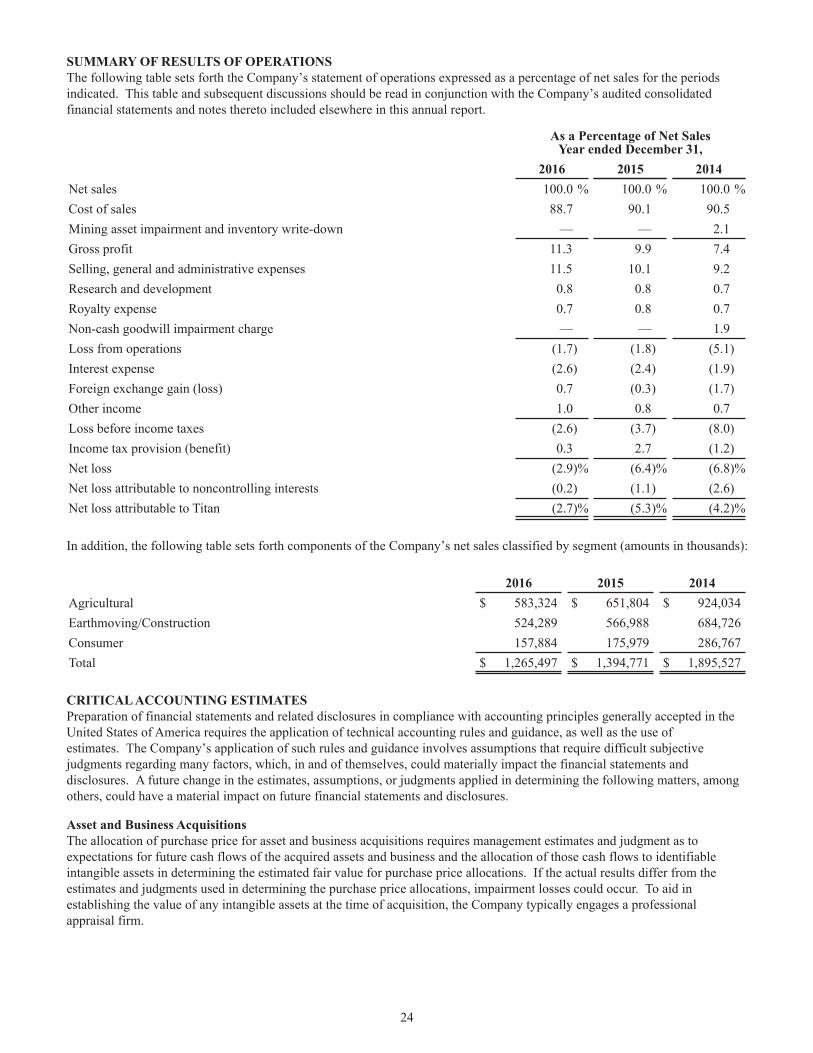
SUMMARY OF RESULTS OF OPERATIONSThe following table sets forth the Company’s statement of operations expressed as a percentage of net sales for the periodsindicated. This table and subsequent discussions should be read in conjunction with the Company’s audited consolidatedfinancial statements and notes thereto included elsewhere in this annual report.
As a Percentage of Net SalesYear ended December 31,
2016 2015 2014Net sales 100.0 % 100.0 % 100.0 %Cost of sales 88.7 90.1 90.5Mining asset impairment and inventory write-down — — 2.1Gross profit 11.3 9.9 7.4Selling, general and administrative expenses 11.5 10.1 9.2Research and development 0.8 0.8 0.7Royalty expense 0.7 0.8 0.7Non-cash goodwill impairment charge — — 1.9Loss from operations (1.7) (1.8) (5.1)Interest expense (2.6) (2.4) (1.9)Foreign exchange gain (loss) 0.7 (0.3) (1.7)Other income 1.0 0.8 0.7Loss before income taxes (2.6) (3.7) (8.0)Income tax provision (benefit) 0.3 2.7 (1.2)Net loss (2.9)% (6.4)% (6.8)%Net loss attributable to noncontrolling interests (0.2) (1.1) (2.6)Net loss attributable to Titan (2.7)% (5.3)% (4.2)% In addition, the following table sets forth components of the Company’s net sales classified by segment (amounts in thousands):
2016 2015 2014Agricultural $ 583,324 $ 651,804 $ 924,034Earthmoving/Construction 524,289 566,988 684,726Consumer 157,884 175,979 286,767Total $ 1,265,497 $ 1,394,771 $ 1,895,527 CRITICAL ACCOUNTING ESTIMATESPreparation of financial statements and related disclosures in compliance with accounting principles generally accepted in theUnited States of America requires the application of technical accounting rules and guidance, as well as the use ofestimates. The Company’s application of such rules and guidance involves assumptions that require difficult subjectivejudgments regarding many factors, which, in and of themselves, could materially impact the financial statements anddisclosures. A future change in the estimates, assumptions, or judgments applied in determining the following matters, amongothers, could have a material impact on future financial statements and disclosures. Asset and Business AcquisitionsThe allocation of purchase price for asset and business acquisitions requires management estimates and judgment as toexpectations for future cash flows of the acquired assets and business and the allocation of those cash flows to identifiableintangible assets in determining the estimated fair value for purchase price allocations. If the actual results differ from theestimates and judgments used in determining the purchase price allocations, impairment losses could occur. To aid inestablishing the value of any intangible assets at the time of acquisition, the Company typically engages a professionalappraisal firm.
24
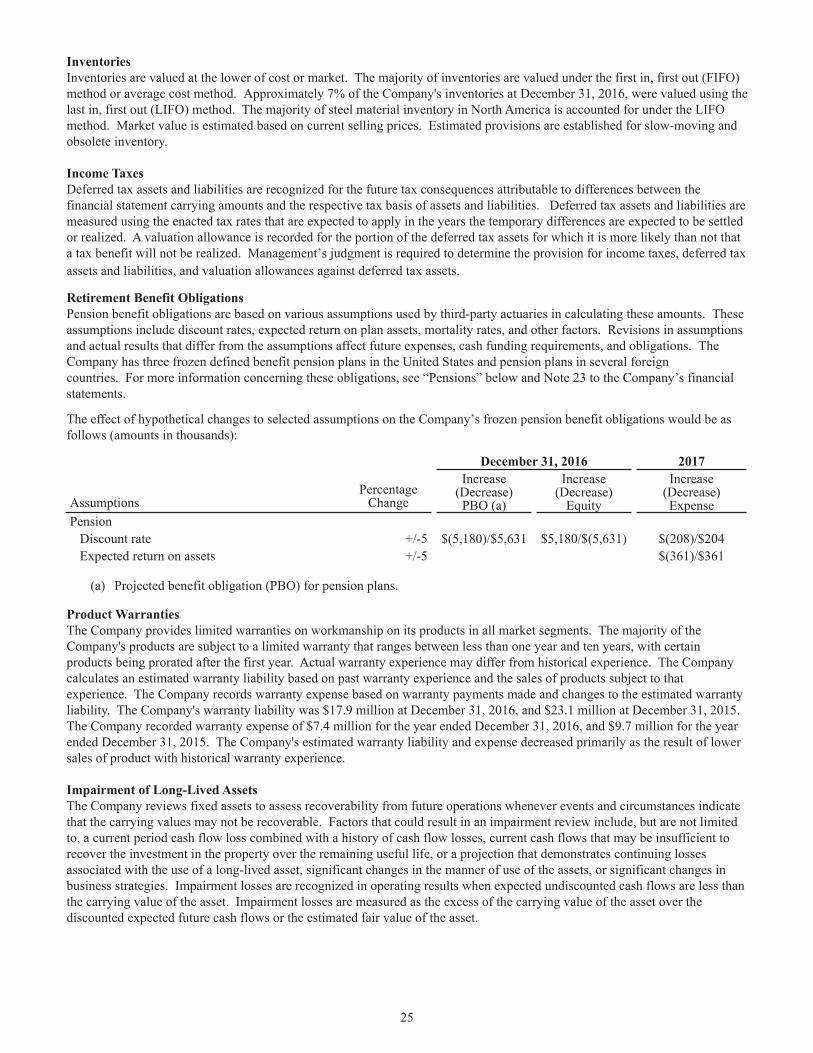
InventoriesInventories are valued at the lower of cost or market. The majority of inventories are valued under the first in, first out (FIFO)method or average cost method. Approximately 7% of the Company's inventories at December 31, 2016, were valued using thelast in, first out (LIFO) method. The majority of steel material inventory in North America is accounted for under the LIFOmethod. Market value is estimated based on current selling prices. Estimated provisions are established for slow-moving andobsolete inventory.
Income TaxesDeferred tax assets and liabilities are recognized for the future tax consequences attributable to differences between thefinancial statement carrying amounts and the respective tax basis of assets and liabilities. Deferred tax assets and liabilities aremeasured using the enacted tax rates that are expected to apply in the years the temporary differences are expected to be settledor realized. A valuation allowance is recorded for the portion of the deferred tax assets for which it is more likely than not thata tax benefit will not be realized. Management’s judgment is required to determine the provision for income taxes, deferred taxassets and liabilities, and valuation allowances against deferred tax assets.
Retirement Benefit ObligationsPension benefit obligations are based on various assumptions used by third-party actuaries in calculating these amounts. Theseassumptions include discount rates, expected return on plan assets, mortality rates, and other factors. Revisions in assumptionsand actual results that differ from the assumptions affect future expenses, cash funding requirements, and obligations. TheCompany has three frozen defined benefit pension plans in the United States and pension plans in several foreigncountries. For more information concerning these obligations, see “Pensions” below and Note 23 to the Company’s financialstatements.
The effect of hypothetical changes to selected assumptions on the Company’s frozen pension benefit obligations would be asfollows (amounts in thousands):
December 31, 2016 2017
AssumptionsPercentage
Change
Increase(Decrease)
PBO (a)
Increase(Decrease)
Equity
Increase(Decrease)Expense
Pension Discount rate +/-5 $(5,180)/$5,631 $5,180/$(5,631) $(208)/$204 Expected return on assets +/-5 $(361)/$361
(a) Projected benefit obligation (PBO) for pension plans. Product WarrantiesThe Company provides limited warranties on workmanship on its products in all market segments. The majority of theCompany's products are subject to a limited warranty that ranges between less than one year and ten years, with certainproducts being prorated after the first year. Actual warranty experience may differ from historical experience. The Companycalculates an estimated warranty liability based on past warranty experience and the sales of products subject to thatexperience. The Company records warranty expense based on warranty payments made and changes to the estimated warrantyliability. The Company's warranty liability was $17.9 million at December 31, 2016, and $23.1 million at December 31, 2015.The Company recorded warranty expense of $7.4 million for the year ended December 31, 2016, and $9.7 million for the yearended December 31, 2015. The Company's estimated warranty liability and expense decreased primarily as the result of lowersales of product with historical warranty experience.
Impairment of Long-Lived AssetsThe Company reviews fixed assets to assess recoverability from future operations whenever events and circumstances indicatethat the carrying values may not be recoverable. Factors that could result in an impairment review include, but are not limitedto, a current period cash flow loss combined with a history of cash flow losses, current cash flows that may be insufficient torecover the investment in the property over the remaining useful life, or a projection that demonstrates continuing lossesassociated with the use of a long-lived asset, significant changes in the manner of use of the assets, or significant changes inbusiness strategies. Impairment losses are recognized in operating results when expected undiscounted cash flows are less thanthe carrying value of the asset. Impairment losses are measured as the excess of the carrying value of the asset over thediscounted expected future cash flows or the estimated fair value of the asset.
25
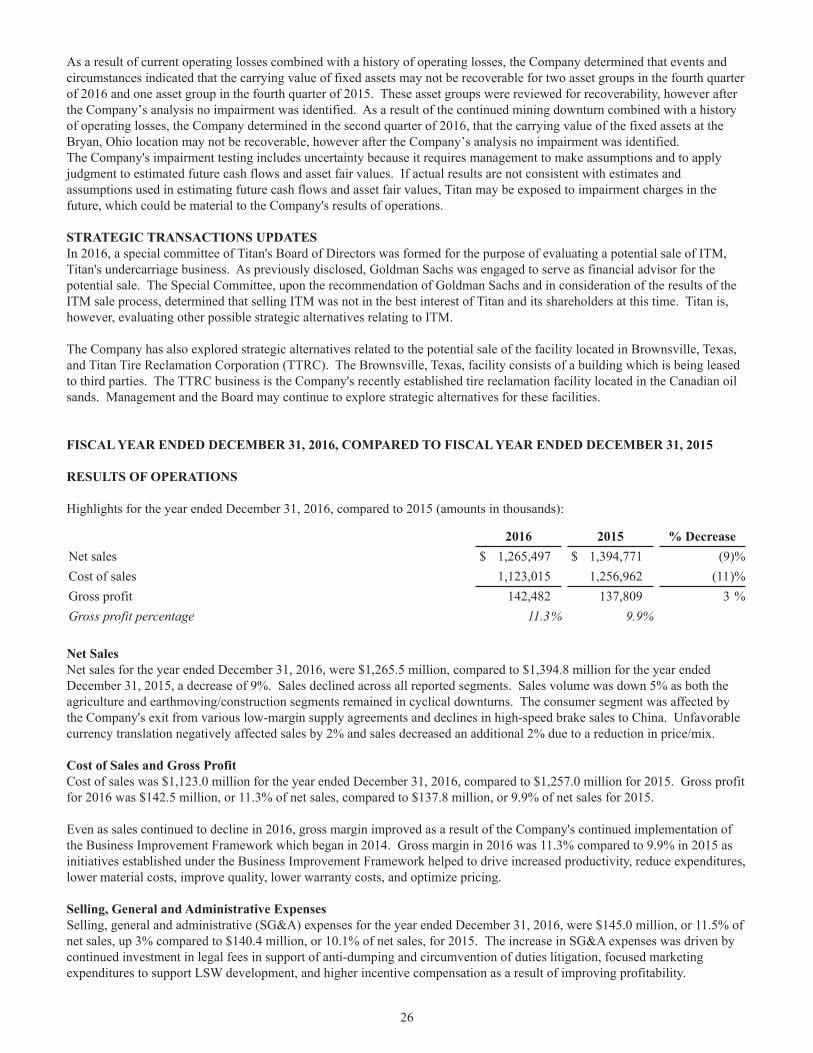
As a result of current operating losses combined with a history of operating losses, the Company determined that events andcircumstances indicated that the carrying value of fixed assets may not be recoverable for two asset groups in the fourth quarterof 2016 and one asset group in the fourth quarter of 2015. These asset groups were reviewed for recoverability, however afterthe Company’s analysis no impairment was identified. As a result of the continued mining downturn combined with a historyof operating losses, the Company determined in the second quarter of 2016, that the carrying value of the fixed assets at theBryan, Ohio location may not be recoverable, however after the Company’s analysis no impairment was identified. The Company's impairment testing includes uncertainty because it requires management to make assumptions and to applyjudgment to estimated future cash flows and asset fair values. If actual results are not consistent with estimates andassumptions used in estimating future cash flows and asset fair values, Titan may be exposed to impairment charges in thefuture, which could be material to the Company's results of operations.
STRATEGIC TRANSACTIONS UPDATESIn 2016, a special committee of Titan's Board of Directors was formed for the purpose of evaluating a potential sale of ITM,Titan's undercarriage business. As previously disclosed, Goldman Sachs was engaged to serve as financial advisor for thepotential sale. The Special Committee, upon the recommendation of Goldman Sachs and in consideration of the results of theITM sale process, determined that selling ITM was not in the best interest of Titan and its shareholders at this time. Titan is,however, evaluating other possible strategic alternatives relating to ITM.
The Company has also explored strategic alternatives related to the potential sale of the facility located in Brownsville, Texas,and Titan Tire Reclamation Corporation (TTRC). The Brownsville, Texas, facility consists of a building which is being leasedto third parties. The TTRC business is the Company's recently established tire reclamation facility located in the Canadian oilsands. Management and the Board may continue to explore strategic alternatives for these facilities.
FISCAL YEAR ENDED DECEMBER 31, 2016, COMPARED TO FISCAL YEAR ENDED DECEMBER 31, 2015
RESULTS OF OPERATIONS Highlights for the year ended December 31, 2016, compared to 2015 (amounts in thousands):
2016 2015 % DecreaseNet sales $ 1,265,497 $ 1,394,771 (9)%Cost of sales 1,123,015 1,256,962 (11)%Gross profit 142,482 137,809 3 %Gross profit percentage 11.3% 9.9%
Net SalesNet sales for the year ended December 31, 2016, were $1,265.5 million, compared to $1,394.8 million for the year endedDecember 31, 2015, a decrease of 9%. Sales declined across all reported segments. Sales volume was down 5% as both theagriculture and earthmoving/construction segments remained in cyclical downturns. The consumer segment was affected bythe Company's exit from various low-margin supply agreements and declines in high-speed brake sales to China. Unfavorablecurrency translation negatively affected sales by 2% and sales decreased an additional 2% due to a reduction in price/mix.
Cost of Sales and Gross ProfitCost of sales was $1,123.0 million for the year ended December 31, 2016, compared to $1,257.0 million for 2015. Gross profitfor 2016 was $142.5 million, or 11.3% of net sales, compared to $137.8 million, or 9.9% of net sales for 2015.
Even as sales continued to decline in 2016, gross margin improved as a result of the Company's continued implementation ofthe Business Improvement Framework which began in 2014. Gross margin in 2016 was 11.3% compared to 9.9% in 2015 asinitiatives established under the Business Improvement Framework helped to drive increased productivity, reduce expenditures,lower material costs, improve quality, lower warranty costs, and optimize pricing.
Selling, General and Administrative ExpensesSelling, general and administrative (SG&A) expenses for the year ended December 31, 2016, were $145.0 million, or 11.5% ofnet sales, up 3% compared to $140.4 million, or 10.1% of net sales, for 2015. The increase in SG&A expenses was driven bycontinued investment in legal fees in support of anti-dumping and circumvention of duties litigation, focused marketingexpenditures to support LSW development, and higher incentive compensation as a result of improving profitability.
26
Research and Development ExpensesResearch and development (R&D) expenses for the year ended December 31, 2016, were $10.0 million, or 0.8% of net sales,down 10% compared to $11.2 million, or 0.8% of net sales, for 2015.
Royalty ExpenseThe Company has trademark license agreements with The Goodyear Tire & Rubber Company to manufacture and sell certainfarm tires under the Goodyear name. These agreements cover sales in North America, Latin America, Europe, the Middle East,Africa, Russia, and other Commonwealth of Independent States countries. Royalties attributable to sales of farm tires in NorthAmerica and Latin America were prepaid through March 2018 as a part of the 2011 Goodyear Latin American farm tireacquisition. The Company also has a trademark license agreement with Goodyear to manufacture and sell certain non-farm tireproducts in Latin America. Royalty expenses for the year ended December 31, 2016, were $8.9 million compared to $10.5million for 2015.
Loss from OperationsLoss from operations for the year ended December 31, 2016, was $21.3 million, or 1.7% of net sales, compared to loss of $24.3million, or 1.8% of net sales, for 2015. This improvement was the net result of the items previously discussed.Interest ExpenseInterest expense for 2016 was $32.5 million, compared to $34.0 million for 2015.
Foreign Exchange Gain (Loss)Foreign currency gain was $8.6 million for the year ended December 31, 2016, compared to a loss of $4.8 million for the yearended December 31, 2015. Foreign currency gain in 2016 and loss in 2015 primarily reflect the translation of intercompanyloans at certain foreign subsidiaries denominated in currencies other than their functional currencies. Since such loans areexpected to be settled in cash at some point in the future, these loans are adjusted each reporting period to reflect the currentexchange rates. The strength of the U.S. dollar was mixed in 2016 across currencies in which Titan operates while it waspredominately strong in 2015. The Company uses derivative financial instruments on such intercompany loans as well as otheractions taken to reduce foreign exchange exposures.
Other IncomeOther income was $12.5 million for the year ended December 31, 2016, as compared to other income of $11.1 million for2015. The major items included in 2016 were: (i) interest income of $3.2 million; (ii) Wheels India Limited equity income of$3.0 million; (iii) gain on sale of assets of $2.3 million; (iv) building rental income of $2.1 million; and (v) discountamortization on prepaid royalty of $1.5 million.
The major items included in 2015 were: (i) interest income of $2.7 million; (ii) gain on sale of assets of $2.4 million; (iii)discount amortization on prepaid royalty of $2.0 million; and (iv) Wheels India Limited equity income of $1.8 million.
Provision for Income TaxesThe Company recorded tax expense for income taxes of $3.3 million in 2016, compared to income tax expense of $38.3 millionin 2015. The Company's effective tax rate was (10)% in 2016 and (74)% in 2015. The Company’s 2016 income tax expenseand rate differ from the amount of income tax determined by applying the U.S. Federal income tax rate to pre-tax incomeprimarily as a result of an increase in the valuation allowance against deferred tax assets partially offset by tax rates in foreignjurisdictions where the statutory rate is less than 35%. The Company's 2015 income tax expense and rate differ from theamount of income tax determined by applying the U.S. Federal income tax rate to pre-tax income primarily as a result of aforeign exchange loss upon the outbound transfer of Brazil assets for U.S. tax purposes (check the box election) offset by anincrease in the valuation allowance against deferred tax assets. Net LossNet loss for the year ended December 31, 2016, was $36.1 million, compared to net loss of $90.3 million for 2015. Basicearnings per share was $(0.81) for the year ended December 31, 2016, as compared to $(1.74) for 2015. Diluted earnings pershare was $(0.81) for the year ended December 31, 2016, as compared to $(1.74) for 2015. The Company's net loss andearnings per share were improved due to the items previously discussed.
27
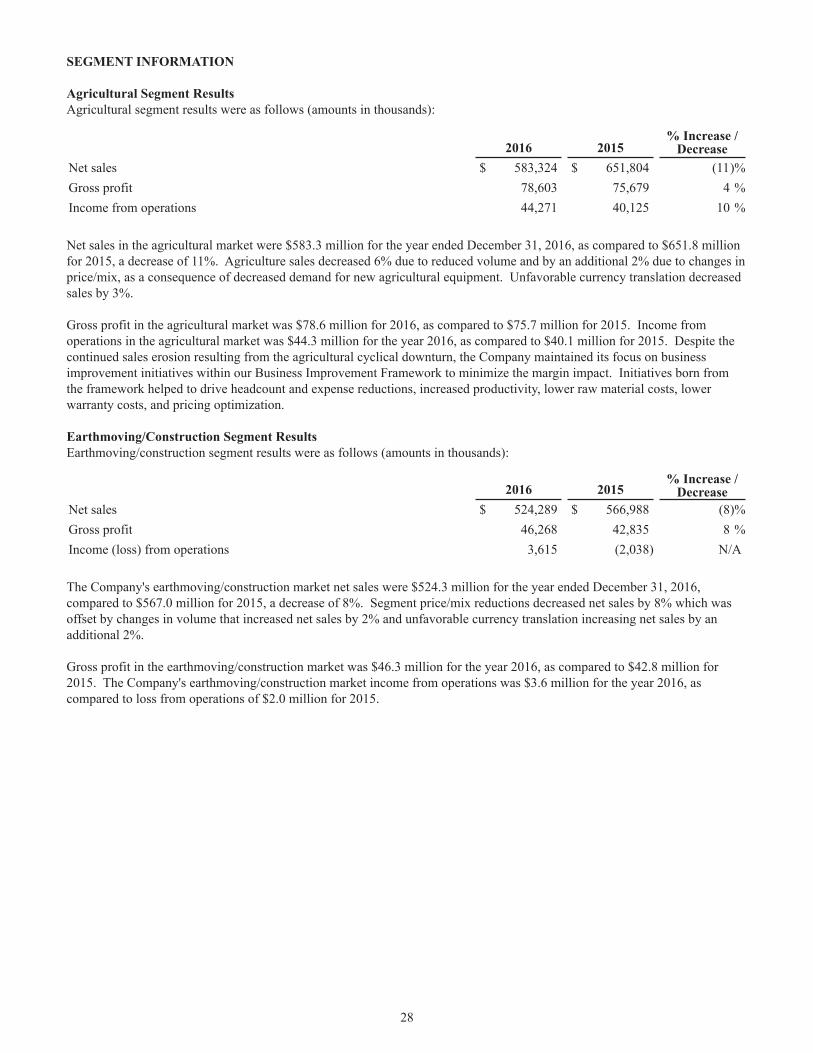
SEGMENT INFORMATION
Agricultural Segment ResultsAgricultural segment results were as follows (amounts in thousands):
2016 2015% Increase /
DecreaseNet sales $ 583,324 $ 651,804 (11)%Gross profit 78,603 75,679 4 %Income from operations 44,271 40,125 10 %
Net sales in the agricultural market were $583.3 million for the year ended December 31, 2016, as compared to $651.8 millionfor 2015, a decrease of 11%. Agriculture sales decreased 6% due to reduced volume and by an additional 2% due to changes inprice/mix, as a consequence of decreased demand for new agricultural equipment. Unfavorable currency translation decreasedsales by 3%.
Gross profit in the agricultural market was $78.6 million for 2016, as compared to $75.7 million for 2015. Income fromoperations in the agricultural market was $44.3 million for the year 2016, as compared to $40.1 million for 2015. Despite thecontinued sales erosion resulting from the agricultural cyclical downturn, the Company maintained its focus on businessimprovement initiatives within our Business Improvement Framework to minimize the margin impact. Initiatives born fromthe framework helped to drive headcount and expense reductions, increased productivity, lower raw material costs, lowerwarranty costs, and pricing optimization. Earthmoving/Construction Segment ResultsEarthmoving/construction segment results were as follows (amounts in thousands):
2016 2015% Increase /
DecreaseNet sales $ 524,289 $ 566,988 (8)%Gross profit 46,268 42,835 8 %Income (loss) from operations 3,615 (2,038) N/A
The Company's earthmoving/construction market net sales were $524.3 million for the year ended December 31, 2016,compared to $567.0 million for 2015, a decrease of 8%. Segment price/mix reductions decreased net sales by 8% which wasoffset by changes in volume that increased net sales by 2% and unfavorable currency translation increasing net sales by anadditional 2%.
Gross profit in the earthmoving/construction market was $46.3 million for the year 2016, as compared to $42.8 million for2015. The Company's earthmoving/construction market income from operations was $3.6 million for the year 2016, ascompared to loss from operations of $2.0 million for 2015.
28

Consumer Segment ResultsConsumer segment results were as follows (amounts in thousands):
2016 2015 % DecreaseNet sales $ 157,884 $ 175,979 (10)%Gross profit 17,611 19,295 (9)%Income from operations 2,879 4,689 (39)%
Consumer market net sales were $157.9 million for the year ended December 31, 2016, compared to $176.0 million for 2015, adecrease of 10%. The decrease in consumer segment sales was primarily driven by declines in high-speed brake sales to Chinaand lower sales related to supplier agreements in Brazil.
Gross profit from the consumer market was $17.6 million for the year 2016, or 11.2% of net sales, compared to $19.3 million,or 11.0% of net sales for 2015. Consumer market income from operations was $2.9 million for the year 2016, as compared to$4.7 million for 2015. Although sales were lower in 2016 versus 2015, the Company was successful in reducing costs relatedto the production of consumer segment products.
Segment Summary (Amounts in thousands)
2016 AgriculturalEarthmoving/Construction Consumer
Corporate/Unallocated Expenses
Consolidated Totals
Net sales $ 583,324 $ 524,289 $ 157,884 $ — $ 1,265,497Gross profit 78,603 46,268 17,611 — 142,482Income (loss) from operations 44,271 3,615 2,879 (72,098) (21,333)2015Net sales $ 651,804 566,988 $ 175,979 $ — $ 1,394,771Gross profit 75,679 42,835 19,295 — 137,809Income (loss) from operations 40,125 (2,038) 4,689 (67,055) (24,279)
Corporate & Unallocated ExpensesIncome from operations on a segment basis does not include corporate expenses totaling $72.1 million for the year endedDecember 31, 2016, up 7% compared to $67.1 million for 2015. Corporate expenses were composed of selling and marketingexpenses of approximately $28 million for each of the years ended December 31, 2016 and 2015; and administrative expensesof approximately $44 million and $36 million for the years ended December 31, 2016 and 2015, respectively.
29

FISCAL YEAR ENDED DECEMBER 31, 2015, COMPARED TO FISCAL YEAR ENDED DECEMBER 31, 2014
RESULTS OF OPERATIONS Highlights for the year ended December 31, 2015, compared to 2014 (amounts in thousands):
2015 2014 % DecreaseNet sales $ 1,394,771 $ 1,895,527 (26)%Cost of sales 1,256,962 1,714,952 (27)%Mining asset impairment and inventory write-down — 39,932 n/aGross profit 137,809 140,643 (2)%Gross profit percentage 9.9% 7.4%
Net SalesNet sales for the year ended December 31, 2015, were $1,394.8 million, compared to $1,895.5 million for the year endedDecember 31, 2014, a decrease of 26%. Sales declined across all reported segments. Sales volume was down 11% as both theagriculture and earthmoving/construction segments remained in cyclical downturns. The consumer segment was affected bythe Company's exit from various low-margin supply agreements and economic stress in Brazil. Unfavorable currencytranslation affected sales by 10% and a reduction in price/mix of 5% further eroded sales due to competitive pricing and lowerraw material costs passed along to customers.
Cost of Sales, Mining Asset Impairment, Mining Inventory Write-down, and Gross ProfitCost of sales was $1,257.0 million for the year ended December 31, 2015, compared to $1,715.0 million for 2014. Gross profitfor the year 2015 was $137.8 million, or 9.9% of net sales, compared to $140.6 million, or 7.4% of net sales, for 2014. In thesecond quarter of 2014, the Company recorded an asset impairment of $23.2 million on machinery, equipment, and molds usedto produce giant mining tires. In addition, the Company recorded inventory write-downs of $16.7 million in 2014 to adjust thevalue of mining product inventory to estimated market value. After adjusting for the aforementioned impairments and write-downs, gross profit for 2014 was $180.5 million, or 9.5% of net sales.
Even as sales declined in 2015, adjusted gross margin improved as the Company continued to reap benefits from the BusinessImprovement Framework, which began in 2014. After adjusting for the aforementioned impairments and write-downs, grossmargin in 2014 was 9.5%. Gross margin in 2015 was 9.9% as initiatives born from the framework helped to drive increasedproductivity, expenditure rationalization, lower material costs, improved quality, lower warranty costs, and pricingoptimization.
Selling, General and Administrative ExpensesSelling, general and administrative (SG&A) expenses were $140.4 million, or 10.1% of net sales, for the year endedDecember 31, 2015, compared to $173.6 million, or 9.2% of net sales, for 2014. The decrease in SG&A expenses was drivenfrom our Business Improvement Framework and currency.
Research and Development ExpensesResearch and development (R&D) expenses were $11.2 million, or 0.8% of net sales, for the year ended December 31, 2015,compared to $14.0 million, or 0.7% of net sales, for 2014.
Royalty ExpenseThe Company has a trademark license agreement with The Goodyear Tire & Rubber Company to manufacture and sell certaintires in North America and Latin America under the Goodyear name. The North American and Latin American farm tireroyalties were prepaid through March 2018 as a part of the 2011 Goodyear Latin American farm tire acquisition. In May 2012,the Company and Goodyear entered into an agreement under which Titan will sell certain non-farm tire products directly tothird party customers and pay a royalty to Goodyear. Royalty expenses were $10.5 million for the year ended December 31,2015, as compared to $14.1 million for 2014.
30
Non-cash Goodwill Impairment ChargeIn the fourth quarter of 2014, the Company recorded a non-cash charge for the impairment of goodwill of $36.6 million on botha pre-tax and after-tax basis. The charge included $11.4 million of earthmoving/construction goodwill related to the acquisitionof Titan Australia; $9.6 million of agricultural goodwill related to the acquisition of the Latin America farm tire business; and$15.6 million of goodwill related to the acquisition of Voltyre-Prom. The Voltyre-Prom goodwill included $11.0 million in theagricultural segment, $2.6 million in the earthmoving/construction segment, and $2.0 million in the consumer segment.
The key factor leading to the impairment of the Australian goodwill was the continued downturn in the mining industry.During 2014, the price of iron ore declined over 40%. The extended downturn led to changes in assumptions regarding futurecash flows which culminated in the goodwill impairment. The key factors leading to the impairment of the Voltyre-Promgoodwill were the changes in the political and economic factors which occurred in Russia during 2014. The changes, includingdevaluation of the Russian ruble and increases in interest rates, accelerated in the fourth quarter of 2014, which led to changesin assumptions regarding future cash flows, which resulted in goodwill impairment. The key factors leading to the impairmentof the Latin American goodwill were a softening of the agricultural tire market and the Brazilian economy as a whole. Theslowdown, which began in the third quarter, accelerated in the fourth quarter. As a result of the slowdown, there wascompetitive pricing pressure impacting both sales and profits. These changes led to changes in assumptions regarding futurecash flows, which resulted in goodwill impairment.
Loss from OperationsLoss from operations for the year ended December 31, 2015, was $24.3 million, or (1.8)% of net sales, compared to loss of$97.6 million, or (5.1)% of net sales, for 2014. This decrease was the net result of the items previously discussed.
Interest ExpenseInterest expense for the year 2015 was $34.0 million, compared to $36.6 million for 2014. The Company’s interest expense for2015 decreased from the previous year primarily from decreased debt balances at Titan Europe.
Foreign Exchange LossForeign currency loss was $4.8 million and $31.7 million for the years ended December 31, 2015 and 2014, respectively.Foreign currency losses in 2015 and 2014 primarily reflect the translation of intercompany loans at certain foreign subsidiariesdenominated in currencies other than their functional currencies. Since such loans are expected to be settled in cash at somepoint in the future, these loans are adjusted each reporting period to reflect the current exchange rates. During 2014, thetranslation of these intercompany loan balances was significant due to the relative strength of the U.S. dollar in relation to thefunctional currencies of the loans. Although the U.S. dollar remained strong throughout 2015, foreign currency losses wereminimized through offsetting gains relating to derivative financial instruments on such intercompany loans as well as otheractions taken to reduce exposures.
The Company's investment in Wheels India Limited decreased from 41.7% to 34.2% during the first quarter of 2014 due to anequity offering by Wheels India Limited.
Other IncomeOther income was $11.1 million for the year ended December 31, 2015, compared to other income of $13.7 million for2014. The major items included in 2015 were: (i) interest income of $2.7 million; (ii) gain on sale of assets of $2.4 million;(iii) discount amortization on prepaid royalty of $2.0 million; and (iv) Wheels India Limited equity income of $1.8 million.
The major items included in 2014 were: (i) gain on sale of assets of $3.4 million; (ii) interest income of $3.0 million; (iii)discount amortization on prepaid royalty of $2.7 million; and (iv) Wheels India Limited equity income of $2.1 million.
Provision (Benefit) for Income TaxesThe Company recorded tax expense for income taxes of $38.3 million in 2015, compared to income tax benefit of $21.8 millionin 2014. The Company's effective tax rate was (74)% in 2015 and 14% in 2014. The Company's 2015 income tax expense andrate differ from the amount of income tax determined by applying the U.S. Federal income tax rate to pre-tax income primarilyas a result of a foreign exchange loss upon the outbound transfer of Brazil assets for U.S. tax purposes (check the box election)offset by an increase in the valuation allowance against deferred tax assets. The Company's 2014 income tax expense and ratediffer from the amount of income tax determined by applying the U.S. Federal income tax rate to pre-tax income primarily as aresult of non-deductible goodwill and the recording of a valuation allowance. Other items contributing to the rate difference arestate income tax expense, debt forgiveness, foreign earnings, and non-deductible expenses.
31

Net LossNet loss for the year ended December 31, 2015, was $90.3 million, compared to net loss of $130.4 million for 2014. Basicearnings per share was $(1.74) for the year ended December 31, 2015, compared to $(2.43) for 2014. Diluted earnings pershare was $(1.74) for the year ended December 31, 2015, compared to $(2.43) for 2014. The Company's net income andearnings per share were higher due to the items previously discussed.
SEGMENT INFORMATION
Agricultural Segment ResultsAgricultural segment results were as follows (amounts in thousands):
2015 2014 % DecreaseNet sales $ 651,804 $ 924,034 (29)%Gross profit 75,679 109,547 (31)%Income from operations 40,125 45,724 (12)%
Net sales in the agricultural market were $651.8 million for the year ended December 31, 2015, compared to $924.0 million for2014, a decrease of 29%. Agriculture sales experienced reductions in volume of 17% and price/mix of 4% as a consequence ofdecreased demand for high horsepower agricultural equipment. Unfavorable currency translation decreased sales by 8%.
Gross profit in the agricultural market was $75.7 million for the year 2015, compared to $109.5 million for 2014. Income fromoperations in the agricultural market was $40.1 million for the year 2015, compared to $45.7 million for 2014. In response tolower demand from customers, the Company extended production shut-downs, reducing manufacturing output whichnegatively impacted production leverage and gross profit. Despite the large overall sales erosion resulting from the agriculturalcyclical downturn, the Business Improvement Framework instituted in 2014 has helped to soften the margin impact. Initiativesborn from the framework helped to drive headcount reductions, expenditure rationalization, increased productivity, lower rawmaterial costs, lower warranty costs, and pricing optimization. Earthmoving/Construction Segment ResultsEarthmoving/construction segment results were as follows (amounts in thousands):
2015 2014% Increase /
DecreaseNet sales $ 566,988 $ 684,726 (17)%Gross profit 42,835 1,656 2,487 %Loss from operations (2,038) (69,687) (97)%
The Company's earthmoving/construction market net sales were $567.0 million for the year ended December 31, 2015,compared to $684.7 million for 2014, a decrease of 17%. Segment sales experienced unfavorable currency translation resultingin a decrease of 11%. The major volume drops that were seen in 2014 have leveled out with only a 1% sales volume decreasefor 2015. Price/mix reductions of 5% make up the remainder of the total sales decrease.
Gross profit in the earthmoving/construction market was $42.8 million for the year 2015, compared to $1.7 million for 2014.The Company's earthmoving/construction market loss from operations was $2.0 million for the year 2015, compared to lossfrom operations of $69.7 million for 2014. In the second quarter of 2014, the Company recorded an asset impairment of $23.2million on machinery, equipment, and molds used to produce giant mining tires. In addition, the Company recorded inventorywrite-downs of $16.7 million to adjust the value of mining product inventory to estimated market value. When adjusted toremove these items, the gross profit in 2014 would have been $32.3 million and loss from operations for 2014 would have been$40.7 million.
32

Consumer Segment ResultsConsumer segment results were as follows (amounts in thousands):
2015 2014 % DecreaseNet sales $ 175,979 $ 286,767 (39)%Gross profit 19,295 29,440 (34)%Income (loss) from operations 4,689 (1,241) N/A
Consumer market net sales were $176.0 million for the year ended December 31, 2015, compared to $286.8 million for 2014, adecrease of 38%. Unfavorable currency translation accounted for $47.0 million of this decline. The Company's exit fromseveral low-margin supply agreements contributed an additional $25.9 million. The economic stress in Brazil had a negativeimpact on sales volume of $17.1 million. Lower prices from competitive pressures and lower raw material costs accounted forthe remaining declines.
Gross profit from the consumer market was $19.3 million in 2015, or 11.0% of net sales, compared to $29.4 million, or 10.3%of net sales in 2014. Consumer market income from operations was $4.7 million for the year 2015, as compared to loss of $1.2million for 2014. Although sales were lower in 2015 versus 2014, the Company was successful in reducing costs related to theproduction of consumer segment products.
Segment Summary (amounts in thousands)
2015 AgriculturalEarthmoving/Construction Consumer
Corporate /Unallocated Expenses
Consolidated Totals
Net sales $ 651,804 566,988 $ 175,979 $ — $ 1,394,771Gross profit 75,679 42,835 19,295 — 137,809Income (loss) from operations 40,125 (2,038) 4,689 (67,055) (24,279)2014Net sales $ 924,034 684,726 $ 286,767 $ — $ 1,895,527Gross profit 109,547 1,656 29,440 — 140,643Income (loss) from operations 45,724 (69,687) (1,241) (72,421) (97,625)
Corporate & Unallocated ExpensesIncome from operations on a segment basis does not include corporate expenses totaling $67.0 million for the year endedDecember 31, 2015, compared to $72.4 million for 2014. Corporate expenses were composed of selling and marketingexpenses of approximately $28 million and $33 million for the years ended December 31, 2015 and 2014, respectively; andadministrative expenses of approximately $36 million and $39 million for the years ended December 31, 2015 and 2014,respectively.
33
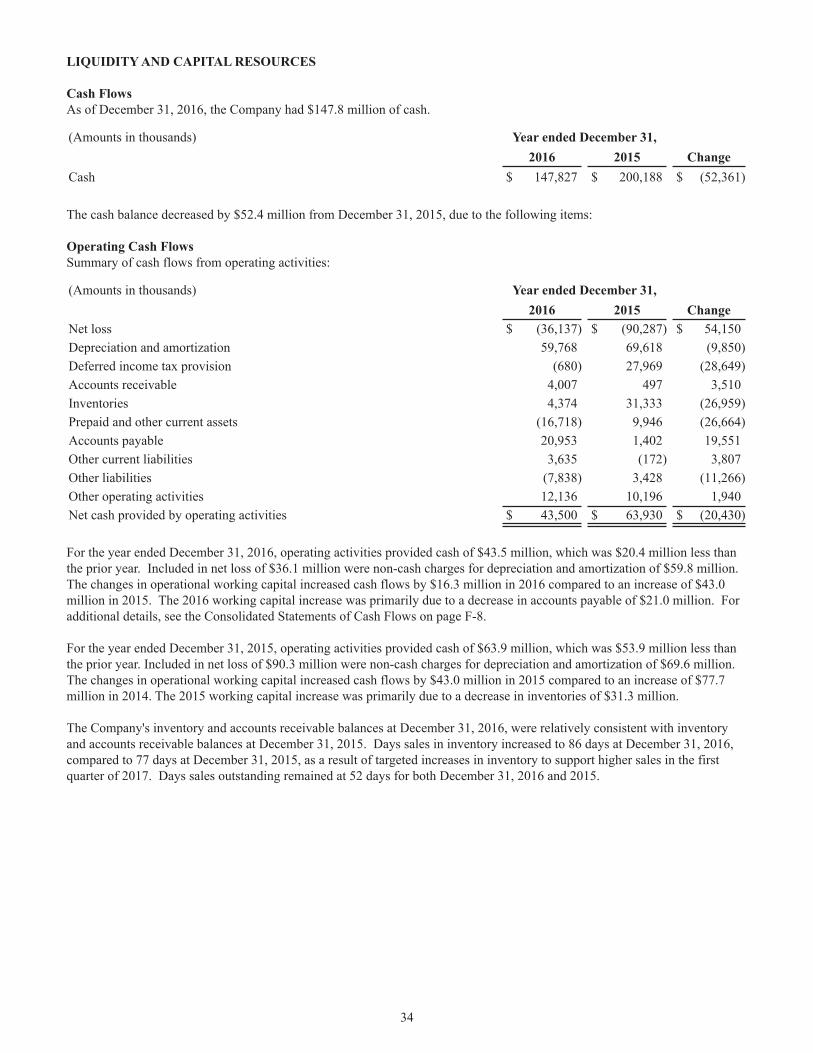
LIQUIDITY AND CAPITAL RESOURCES
Cash FlowsAs of December 31, 2016, the Company had $147.8 million of cash.
(Amounts in thousands) Year ended December 31,2016 2015 Change
Cash $ 147,827 $ 200,188 $ (52,361)
The cash balance decreased by $52.4 million from December 31, 2015, due to the following items:
Operating Cash FlowsSummary of cash flows from operating activities:
(Amounts in thousands) Year ended December 31,2016 2015 Change
Net loss $ (36,137) $ (90,287) $ 54,150Depreciation and amortization 59,768 69,618 (9,850)Deferred income tax provision (680) 27,969 (28,649)Accounts receivable 4,007 497 3,510Inventories 4,374 31,333 (26,959)Prepaid and other current assets (16,718) 9,946 (26,664)Accounts payable 20,953 1,402 19,551Other current liabilities 3,635 (172) 3,807Other liabilities (7,838) 3,428 (11,266)Other operating activities 12,136 10,196 1,940Net cash provided by operating activities $ 43,500 $ 63,930 $ (20,430) For the year ended December 31, 2016, operating activities provided cash of $43.5 million, which was $20.4 million less thanthe prior year. Included in net loss of $36.1 million were non-cash charges for depreciation and amortization of $59.8 million.The changes in operational working capital increased cash flows by $16.3 million in 2016 compared to an increase of $43.0million in 2015. The 2016 working capital increase was primarily due to a decrease in accounts payable of $21.0 million. Foradditional details, see the Consolidated Statements of Cash Flows on page F-8.
For the year ended December 31, 2015, operating activities provided cash of $63.9 million, which was $53.9 million less thanthe prior year. Included in net loss of $90.3 million were non-cash charges for depreciation and amortization of $69.6 million.The changes in operational working capital increased cash flows by $43.0 million in 2015 compared to an increase of $77.7million in 2014. The 2015 working capital increase was primarily due to a decrease in inventories of $31.3 million.
The Company's inventory and accounts receivable balances at December 31, 2016, were relatively consistent with inventoryand accounts receivable balances at December 31, 2015. Days sales in inventory increased to 86 days at December 31, 2016,compared to 77 days at December 31, 2015, as a result of targeted increases in inventory to support higher sales in the firstquarter of 2017. Days sales outstanding remained at 52 days for both December 31, 2016 and 2015.
34

Investing Cash FlowsSummary of cash flows from investing activities:
(Amounts in thousands) Year ended December 31,2016 2015 Change
Capital expenditures $ (41,948) $ (48,429) $ 6,481Certificates of deposit (50,000) — (50,000)Other investing activities 2,222 (1,508) 3,730Cash used for investing activities $ (89,726) $ (49,937) $ (39,789)
Net cash used for investing activities was $89.7 million in 2016, compared to $49.9 million in 2015. In 2016, the Companyinvested in certificates of deposit using cash. At December 31, 2016, the Company had $50.0 million in certificates of depositwith a greater than three month original term. The Company invested a total of $41.9 million in capital expenditures in 2016,compared to $48.4 million in 2015. Capital expenditures represent various equipment purchases and improvements to enhanceproduction capabilities of Titan’s existing business and maintain existing equipment.
Financing Cash FlowsSummary of cash flows from financing activities:
(Amounts in thousands) Year ended December 31,2016 2015 Change
Proceeds from borrowings $ 17,285 $ 5,727 $ 11,558Proceeds from exercise of stock options — 145 (145)Payment on debt (22,634) (5,521) (17,113)Dividends paid (1,081) (1,077) (4)Cash used for financing activities $ (6,430) $ (726) $ (5,704)
Net cash used for financing activities was $6.4 million in 2016. This cash was primarily used for payment on debt of $22.6 millionpartially offset by borrowings of $17.3 million.
Net cash used for financing activities was $0.7 million in 2015. This cash was primarily used for payment of quarterlydividends of $1.1 million. Payments of debt and debt borrowing for 2015 had little net impact on cash from financing activities.
Financing cash flows decreased by $5.7 million when comparing 2016 to 2015. The changes from year to year are primarilythe result of activity related to debt borrowings and payments.
Debt RestrictionsThe Company’s senior secured notes and revolving credit facility (credit facility) contain various restrictions, including:
• Limits on dividends and repurchases of the Company’s stock.
• Restrictions on the ability of the Company to make additional borrowings, or to consolidate, merge, or otherwisefundamentally change the ownership of the Company.
• Limitations on investments, dispositions of assets, and guarantees of indebtedness.
• Other customary affirmative and negative covenants.
These restrictions could limit the Company’s ability to respond to market conditions, to provide for unanticipated capitalinvestments, to raise additional debt or equity capital, to pay dividends, or to take advantage of business opportunities,including future acquisitions or dispositions.
Other IssuesThe Company’s business is subject to seasonal variations in sales that affect inventory levels and accounts receivablebalances. Historically, Titan tends to have higher production levels in the first and second quarters.
35

LIQUIDITY OUTLOOKAt December 31, 2016, the Company had $147.8 million of cash and cash equivalents and $50.0 million invested in certificatesof deposit with an original maturity of greater than three months and less than six months. At December 31, 2016, there wereno outstanding borrowings on the Company's $150 million revolving credit facility. Titan’s availability under this domesticfacility may be less than $150 million as a result of outstanding letters of credit and eligible accounts receivable and inventorybalances at certain of its domestic subsidiaries. At December 31, 2016, an outstanding letter of credit totaled $11.6 million andthe remaining amount available under the revolving credit facility was $33.1 million based upon eligible accounts receivableand inventory balances. The cash and cash equivalents balance of $147.8 million includes $61.1 million held in foreigncountries. The Company's current plans do not demonstrate a need to repatriate the foreign amounts to fund U.S. operations.However, if foreign funds were needed for U.S. operations, the Company would be required to accrue taxes to repatriate thefunds. Currently the Company anticipates that it would utilize net operating loss carry forwards to reduce any U.S. cash taxliability associated with such repatriation. Titan expects to contribute approximately $3 million to its defined benefit pensionplans during 2017.
The Company's 5.625% convertible senior subordinated notes, of which $60.2 million were outstanding at December 31, 2016,were scheduled to mature on January 15, 2017. In January 2017, the Company converted 97.1% of the principal balance ofthese convertible notes into shares of Titan common stock. Prior to maturity, $60.2 million in aggregate principal amount of theconvertible notes was outstanding, of which holders of $58.5 million in aggregate principal amount of such notes, or 97.1%,converted their notes into shares of Titan common stock pursuant to the terms of the indenture governing the notes. The $58.5million in principal amount of converted Notes were converted into 5,462,264 shares of Titan common stock, representingapproximately 10% of Titan’s outstanding common stock prior to conversion. Each $1,000 principal amount of the convertiblenotes was convertible into 93.436 shares of Titan common stock. The remaining $1.7 million principal amount of theconvertible notes not converted was paid in cash.
On February 17, 2017, the Company entered into a credit and security agreement with respect to a new $75 million revolvingcredit facility (credit facility) with agent BMO Harris Bank N.A. and other financial institutions party thereto. The new creditfacility is collateralized by accounts receivable and inventory of certain of the Company’s domestic subsidiaries and includes amaturity of the earlier of five years or six months prior to maturity of the Company’s 6.875% senior secured notes due inOctober 2020. This credit facility replaces the Company’s $150 million revolving credit facility which was previouslyscheduled to terminate in December 2017.
Capital expenditures for 2017 are forecasted to be approximately $35 million. Cash payments for interest are currentlyforecasted to be approximately $30 million in 2017 based on the Company's year-end 2016 debt balances and debt maturities.These capital expenditures are anticipated to be used primarily to enhance the Company’s existing facilities and manufacturingcapabilities and drive productivity gains.
In the future, Titan may seek to grow by making acquisitions which will depend on the ability to identify suitable acquisitioncandidates, to negotiate acceptable terms for their acquisition, and to finance those acquisitions.
Subject to the terms of the agreements governing Titan's outstanding indebtedness, the Company may finance futureacquisitions with cash on hand, cash from operations, additional indebtedness, issuing additional equity securities, anddivestitures.
Cash on hand, anticipated internal cash flows from operations, and utilization of remaining available borrowings are expectedto provide sufficient liquidity for working capital needs, debt maturities, capital expenditures, and potential acquisitions.Potential divestitures are also a means to provide for future liquidity needs.
INFLATIONThe Company is subject to the effect of price fluctuations. While the cost outlook for commodities used in the Company’sproduction is not certain, management believes it can manage inflationary pressures reflected in the prices of the raw materialsthat the Company uses in its products by introducing appropriate sales price adjustments and through contract provisions withOEMs. However, these price adjustments may lag the inflationary pressures.
36

CONTRACTUAL OBLIGATIONSThe Company’s contractual obligations at December 31, 2016, consisted of the following (amounts in thousands):
Payments due by period
Contractual Obligations TotalLess than
1 year 1-3 years 3-5 yearsMore than
5 years6.875% senior secured notes due 2020 $ 400,000 $ — $ — $ 400,000 $ —5.625% convertible senior subordinated notes (a) 60,161 60,161 — — —Other debt 50,172 37,264 12,520 388 —Interest expense (b) 112,223 30,378 58,453 23,392 —Operating leases 14,907 4,451 6,134 3,235 1,087Capital leases 902 518 368 16 —Purchase obligations 37,771 34,516 3,255 — —Other long-term liabilities (c) 35,800 3,400 16,500 15,900 —Total $ 711,936 $ 170,688 $ 97,230 $ 442,931 $ 1,087
(a) The 5.625% convertible senior subordinated notes were converted in January 2017. See Note 33 for additionalinformation.
(b) Interest expense is estimated based on the Company’s year-end 2016 debt balances, maturities, and interest rates. Theestimates assume no credit facility borrowings. The Company’s actual debt balances and interest rates may fluctuatein the future; therefore, actual interest payments may vary from those payments detailed in the above table.
(c) Other long-term liabilities represent the Company’s estimated funding requirements for defined benefit pension plans.The Company’s liability for pensions is based on a number of assumptions, including discount rates, rates of return oninvestments, mortality rates, and other factors. Certain of these assumptions are determined with the assistance ofoutside actuaries. Assumptions are based on past experience and anticipated future trends and are subject to a numberof risks and uncertainties and may lead to significantly different pension liability funding requirements.
OFF-BALANCE SHEET ARRANGEMENTSAs of December 31, 2016, the Company did not have any off-balance sheet arrangements (as defined in Item 303(a)(4) ofRegulation S-K).
MARKET RISK SENSITIVE INSTRUMENTS
Exchange Rate SensitivityThe Company is exposed to fluctuations in the Australian dollar, Brazilian real, British pound, euro, Russian ruble and otherworld currencies. The Company uses financial derivatives to mitigate its exposure to volatility in foreign currency exchangerates. The Company’s net investment in foreign entities translated into U.S. dollars was $344.6 million at December 31, 2016,and $291.4 million at December 31, 2015. The hypothetical potential loss in value of the Company’s net investment in foreignentities resulting from a 10% adverse change in foreign currency exchange rates at December 31, 2016, would have beenapproximately $34.5 million.
Commodity Price SensitivityThe Company does not generally enter into long-term commodity pricing contracts and does not use derivative commodityinstruments to hedge its exposures to commodity market price fluctuations. Therefore, the Company is exposed to pricefluctuations of its key commodities, which consist primarily of steel, natural rubber, synthetic rubber, and carbon black. TheCompany attempts to pass on certain material price increases and decreases to its customers, depending on market conditions. Interest Rate SensitivityThe Company has a $150 million credit facility that has a variable interest rate. As of December 31, 2016, the amountavailable was $33.1 million based on current accounts receivable and inventory values at certain domestic facilities. If thecredit facility were fully drawn to available funds, a change in the interest rate of 100 basis points, or 1%, would have changedthe Company’s interest expense by approximately $0.3 million. At December 31, 2016, there were no borrowings under thecredit facility.
37

MARKET CONDITIONSIn 2016 Titan experienced lower sales when compared to 2015. The lower sales levels were primarily the result of decreaseddemand for high horsepower equipment used in the agricultural market, which remains in a cyclical downturn, and lowerdemand for heavy equipment used in the earthmoving/construction market, which remains depressed due to low commodityprices. Unfavorable currency translation also contributed to the decline in sales.
Energy, raw material, and petroleum-based product costs have been volatile and may negatively impact the Company’smargins. Many of Titan’s overhead expenses are fixed; therefore, lower seasonal trends may cause negative fluctuations inquarterly profit margins and affect the financial condition of the Company.
AGRICULTURAL MARKET OUTLOOKAgricultural market sales were lower in 2016 when compared to 2015 due to decreased demand for high horsepower equipmentused in the agricultural market. Farm net income declined in 2016 for the third straight year due to lower grain prices. Farmnet income is generally expected to be flat in 2017. Declining income levels have reduced demand for large farm equipment.More specifically, large equipment sales have deteriorated significantly since 2013 after a robust cycle in prior years. The mixshift to lower horsepower tractors has had a negative impact on revenue and margin performance. This trend is expected tobottom out sometime in 2017. Most major OEMs are forecasting 2017 agricultural equipment sales to be essentially flat with2016 within most regions. North American used equipment levels remain relatively high with some decreases recently frompeak levels. Excess used equipment inventory and values can also negatively impact the new equipment market. Manyvariables, including weather, grain prices, export markets, currency, and government policies and subsidies can greatlyinfluence the overall health of the agricultural economy. EARTHMOVING/CONSTRUCTION MARKET OUTLOOKEarthmoving/construction market sales were lower in 2016 when compared to 2015 due to unfavorable currency translationand weak market conditions. Demand for larger products used in the mining industry is expected to improve slightly in 2017,with demand for our products in this market expected to improve nominally as compared to 2016. Demand for small andmedium sized earthmoving/construction equipment used in the housing and commercial construction sectors is expected to beflat or up slightly. The earthmoving/construction segment is affected by many variables, including commodity prices, roadconstruction, infrastructure, government appropriations, housing starts, and other macroeconomic drivers.
CONSUMER MARKET OUTLOOKConsumer market sales were lower in 2016 when compared to 2015. Sales in the consumer market decreased primarily as theresult of unfavorable currency translation, the Company's exit of several supply agreements, and price/mix from competitivepressures. The consumer market is expected to remain highly competitive in 2017. The consumer segment is affected by manyvariables including consumer spending, interest rates, government policies, and other macroeconomic drivers.
PENSIONSThe Company has three frozen defined benefit pension plans covering certain employees or former employees of three U.S.subsidiaries. The Company also has pension plans covering certain employees of several foreign subsidiaries. These plans aredescribed in Note 23 of the Company’s Notes to Consolidated Financial Statements.
The Company’s recorded liability for pensions is based on a number of assumptions, including discount rates, rates of return oninvestments, mortality rates, and other factors. Certain of these assumptions are determined by the Company with theassistance of outside actuaries. Assumptions are based on past experience and anticipated future trends. These assumptions arereviewed on a regular basis and revised when appropriate. Revisions in assumptions and actual results that differ from theassumptions affect future expenses, cash funding requirements, and the carrying value of the related obligations. During theyear ended December 31, 2016, the Company contributed cash funds of $2.4 million to the pension plans. Titan expects tocontribute approximately $3 million to these pension plans during 2017.
Titan’s projected benefit obligation at December 31, 2016, was $113.1 million, as compared to $115.6 million at December 31,2015. The Company’s defined benefit pension plans were underfunded by $35.8 million at December 31, 2016. During 2016,the Company recorded net periodic pension expense of $2.9 million. Accumulated other comprehensive loss recorded fordefined benefit pension plans, net of tax, was $25.7 million and $26.7 million at December 31, 2016 and 2015,respectively. Other comprehensive income (loss) is recorded as a direct charge to stockholders’ equity and does not affect netincome. Titan will be required to record net periodic pension cost in the future; these costs may fluctuate based upon revisedassumptions and could negatively affect the Company’s financial position, cash flows, and results of operations.
38
Recently Issued Accounting StandardsIn May 2014, the Financial Accounting Standards Board (FASB) issued Accounting Standards Update (ASU) No. 2014-09,"Revenue from Contracts with Customers (Topic 606)." This update supersedes the revenue recognition requirements in Topic605, Revenue Recognition. The core principle of this guidance is that an entity should recognize revenue to depict the transferof promised goods or services to customers in an amount that reflects the consideration to which the entity expects to beentitled in exchange for those goods or services. This guidance also requires disclosure about the nature, timing, anduncertainty of revenue and cash flows arising from contracts with customers. The amendments in this update were deferred byASU No. 2015-14, "Revenue form Contracts with Customers (Topic 606) Deferral of Effective Date," and are now effective forannual reporting periods beginning after December 15, 2017, including interim reporting periods within that reporting period.The Company is in the process of comparing its current revenue recognition policies to the requirements of ASU No. 2014-09.For the majority of Titan’s revenue arrangements, no significant impacts are expected as these transactions are not accountedfor under industry-specific guidance that will be superseded by ASU No. 2014-09 and generally consist of a single performanceobligation to transfer promised goods or services. While the Company has not identified any material differences in the amountand timing of revenue recognition related to ASU No. 2014-09, the evaluation is not complete and Titan has not concluded onthe overall impacts of adopting ASU No. 2014-09. The guidance provides for adoption either retrospectively to each priorreporting period or as a cumulative-effect adjustment as of the date of adoption. The Company plans to make a determinationas to its method of adoption once it more fully completes its evaluation of the impacts of the standard on its revenuerecognition and it is better able to evaluate the cost-benefit of each method. The Company believes it is following anappropriate timeline to allow for proper recognition, presentation, and disclosure upon adoption in the year beginning onJanuary 1, 2018.
In April 2016, the FASB issued ASU No. 2016-10, "Identifying Performance Obligations and Licensing." This ASU clarifiesthe following aspects of Topic 606: identifying performance obligations and the licensing implementation guidance. In May2016, the FASB issued ASU No. 2016-12, "Narrow-Scope Improvements and Practical Expedients." This ASU affects onlynarrow aspects of Topic 606 related to assessing the collectability criterion; presentation of sales tax; noncash consideration;and contract modifications and completed contracts at transition. The amendments in these updates affect the guidance in ASUNo. 2014-09, and the effective dates are the same as those for ASU No. 2014-09.
In December 2016, the FASB issued ASU No. 2016-20, "Technical Corrections and Improvements to Topic 606, Revenue fromContracts with Customers." The amendments in this update affect narrow aspects of the guidance issued in ASU No. 2014-09,and the effective dates are the same as those for ASU No. 2014-09.
In July 2015, the FASB issued ASU No. 2015-11, "Simplifying the Measurement of Inventory." This update provides that anentity should measure inventory within the scope of the update at the lower of cost or net realizable value. Net realizable valueis the estimated selling prices in the ordinary course of business, less reasonably predictable costs of completion, disposal, andtransportation. The amendments in this update are effective for financial statements issued for fiscal years beginning afterDecember 15, 2016, including interim periods within those fiscal years. The Company is currently assessing the impact thatadopting this new accounting guidance will have on the Company's consolidated financial statements.
In January 2016, the FASB issued ASU No. 2016-01, "Recognition and Measurement of Financial Assets and FinancialLiabilities." This update addresses certain aspects of recognition, measurement, presentation, and disclosure of financialinstruments. This guidance is effective for fiscal years beginning after December 15, 2017, including interim periods withinthose fiscal years. The Company is currently assessing the impact that adopting this new accounting guidance will have on theCompany's consolidated financial statements.
In February 2016, the FASB issued ASU No. 2016-02, "Leases (Topic 842)." This update was issued to increase transparencyand comparability among organizations by recognizing lease assets and lease liabilities on the balance sheet and disclosing keyinformation about leasing arrangements. The amendments in this update are effective for fiscal years beginning afterDecember 15, 2018, including interim periods within those fiscal years. The Company is currently assessing the impact thatadopting this new accounting guidance will have on the Company's consolidated financial statements.
In March 2016, the FASB issued ASU No. 2016-07, "Simplifying the Transition to Equity Method of Accounting." This updateeliminates the requirement to retroactively adopt the equity method of accounting when an investment qualifies for use of theequity method as a result of the increase in the level of ownership. The amendments in this update are effective for fiscal years,including interim periods within those years, beginning after December 15, 2016. Early application is permitted. The adoptionof this guidance is not expected to have a material effect on the Company's consolidated financial statements.
39

In March 2016, the FASB issued ASU No. 2016-09, "Improvements to Employee Share-Based Payment Accounting." Thisupdate involves several aspects of the accounting for share-based payment transactions, including the income taxconsequences, classification of awards as either equity or liabilities, and classification on the statement of cash flows. Theamendments in this update are effective for annual periods beginning after December 15, 2016, and interim periods withinthose annual periods. Early adoption is permitted in any interim or annual period. The adoption of this guidance is notexpected to have a material effect on the Company's consolidated financial statements.
In August 2016, the FASB issued ASU No. 2016-15, "Classification of Certain Cash Receipts and Cash Payments." Thisupdate addresses eight specific cash flow issues with the objective of reducing the existing diversity in practice. Theamendments in this update are effective for fiscal years beginning after December 15, 2017, and interim periods within thosefiscal years. Early adoption is permitted in any interim or annual period. The adoption of this guidance is not expected to havea material effect on the Company's consolidated financial statements.
In October 2016, the FASB issued ASU No. 2016-16, "Intra-Entity Transfers of Assets other than Inventory." This updaterequires the recognition of income tax consequences of an intra-entity transfer of an asset other than inventory when thetransfer occurs. The amendments in this update are effective for fiscal years beginning after December 15, 2017, includinginterim reporting periods within those annual reporting periods. The Company is currently assessing the impact that adoptingthis new accounting guidance will have on the Company's consolidated financial statements.
In January 2017, the FASB issued ASU No. 2017-01, "Clarifying the Definition of a Business." The amendments in this updateprovide a screen to determine when a set of assets and activities is not a business. The screen requires that when substantiallyall of the fair value of the gross assets acquired (or disposed of) is concentrated in a single identifiable asset or a group ofsimilar identifiable assets, the set is not a business. The amendments in this update are effective for fiscal years beginning afterDecember 15, 2017, including interim reporting periods within those annual reporting periods. The Company is currentlyassessing the impact that adopting this new accounting guidance will have on the Company's consolidated financial statements.
40
ITEM 7A – QUANTITATIVE AND QUALITATIVE DISCLOSURES ABOUT MARKET RISK
Reference is made to Item 7, Part II of this report.
ITEM 8 – FINANCIAL STATEMENTS AND SUPPLEMENTARY DATA
Reference is made to Item 15, Part IV of this report, “Exhibits and Financial Statement Schedules.”
ITEM 9 – CHANGES IN AND DISAGREEMENTS WITH ACCOUNTANTS ON ACCOUNTING AND FINANCIALDISCLOSURE
Not applicable.
ITEM 9A – CONTROLS AND PROCEDURES
Evaluation of Disclosure Controls and ProceduresTitan management, including the Chief Executive Officer and Chief Financial Officer, evaluated the effectiveness of the designand operation of the Company's disclosure controls and procedures (as defined under Rules 13a-15(e) and 15d-15(e)promulgated under the Securities Exchange Act of 1934, as amended) as of the December 31, 2016. Based on that evaluation,the Chief Executive Officer and Chief Financial Officer concluded that, as of December 31, 2016, Titan's disclosure controlsand procedures were effective to provide reasonable assurance that information required to be disclosed by Titan in the reportsthat it files or submits under the Exchange Act is recorded, processed, summarized, and reported accurately and within the timeframes specified in the SEC's rules and forms and accumulated and communicated to Titan management, including the ChiefExecutive Officer and the Chief Financial Officer, as appropriate to allow timely decisions regarding required disclosure.
Changes in Internal Control over Financial ReportingAs previously disclosed under “Item 9A - Controls and Procedures” in the Company’s Annual Report on Form 10-K for theyear ended December 31, 2015, the Company concluded that Titan’s internal control over financial reporting was not effectiveas of December 31, 2015, based on the material weakness identified. The material weakness was defined in Titan’s AnnualReport on Form 10-K for the year ended December 31, 2015, as follows:
“Titan has experienced significant business changes over the past three years, including rapid global growth from a U.S. basedcompany to a large, multinational organization, operating in more than 16 countries, resulting in unique and discrete complexaccounting matters. This growth has introduced a significant increase in the complexity of Titan’s accounting and reportinginfrastructure for collecting and analyzing financial information. Additionally, Titan has been experiencing an economic andmarket downturn, adding to the complexity of assessing goodwill and fixed asset impairments, valuation of inventory and othercomplex accounting transactions from a global perspective. Titan’s current accounting and reporting infrastructure does notpossess the proper resources, processes and systems to effectively address the complex accounting transactions, resulting fromits recent international growth and economic/market decline.”
Management’s Remediation ActivitiesDuring 2016, management invested significant time and effort to remediate the material weakness. Specifically, the followingremediation actions were taken and completed:
• People - Titan enhanced its accounting and reporting infrastructure by augmenting the team with professionals whopossess the commensurate accounting skill sets.
• Processes - Titan strengthened its control environment and overall business processes to mitigate risk and providereasonable assurance of materially accurate financial statement reporting, including increased levels of managementreview and updated financial policies.
• Systems - Titan augmented its current system infrastructure to provide reasonable assurance that accurate, timely datais reported.
Other than the changes disclosed above, there were no changes in internal control over financial reporting (as defined by Rules13a-15 and 15d-15) that occurred during the fourth quarter ended December 31, 2016, that have materially affected, or arelikely to materially affect, the Company's internal control over financial reporting.
Management's Report on Internal Control Over Financial ReportingTitan management is responsible for establishing and maintaining adequate internal control over financial reporting, as definedin Rules 13a-15(f) and 15d-15(f) under the Securities Exchange Act of 1934. The Company's internal control over financialreporting is designed to provide reasonable assurance regarding the reliability of financial reporting and the preparation offinancial statements for external purposes in accordance with generally accepted accounting principles in the United States.Internal control over financial reporting includes those policies, procedures and activities that:
• pertain to the maintenance of records that, in reasonable detail, accurately and fairly reflect the transactions anddispositions of assets of the Company;
• provide reasonable assurance that transactions are recorded as necessary to permit preparation of financial statementsin accordance with generally accepted accounting principles, and that receipts and expenditures of the Company arebeing made only in accordance with authorizations of management and directors of the Company; and
• provide reasonable assurance regarding prevention or timely detection of unauthorized acquisition, use, or dispositionof the Company's assets that could have a material effect on the financial statements.
Titan management, including the Chief Executive Officer and Chief Financial Officer, assessed the effectiveness of theCompany's internal control over financial reporting as of December 31, 2016. In making this assessment, management used thecriteria set forth by the Committee of Sponsoring Organizations of the Treadway Commission (COSO) in the "Internal Control-Integrated Framework (2013)." Based on this assessment, management concluded that the Company maintained effectiveinternal control over financial reporting as of December 31, 2016.
The effectiveness of Titan's internal control over financial reporting as of December 31, 2016, has been audited by GrantThornton LLP, an independent registered public accounting firm, as stated in their report within this Form 10-K.
41

Inherent Limitations on the Effectiveness of ControlsBecause of its inherent limitations, the Company's disclosure controls and procedures or internal control over financialreporting may not prevent or detect all misstatements or fraud. A control system, no matter how well conceived and operated,can provide only reasonable, not absolute, assurance that the objectives of the control system are met. Further, the design of acontrol system must reflect the fact that there are resource constraints, and the benefits of controls must be considered relativeto their costs. Due to the inherent limitations in a cost-effective control system, no evaluation of controls can provide absoluteassurance that misstatements due to error or fraud will not occur or that all control issues and instances of fraud, if any, withinthe Company have been detected.
These inherent limitations include the realities that judgments in decision-making can be faulty and that breakdowns can occurdue to simple error or mistake. Controls can also be circumvented by the individual acts of some persons, by collusion of twoor more people, or by management override of the controls. Also, projections of any evaluation of effectiveness to futureperiods are subject to the risk that controls may become inadequate because of changes in conditions, or that the degree ofcompliance with the policies or procedures may deteriorate.
42
ITEM 9B – OTHER INFORMATION
Not applicable.

PART III
43
ITEM 10 – DIRECTORS, EXECUTIVE OFFICERS, AND CORPORATE GOVERNANCE
DirectorsThe information required by this item regarding the Company’s directors is incorporated by reference to the Company’s 2017Proxy Statement under the captions “Election of Directors,” “Directors Continuing in Office,” “Committees and Meetings ofthe Board of Directors” and “Corporate Governance.”
Executive Officers and ChairmanThe names, ages, and positions of all executive officers and of the Chairman of the Company are listed below, followed by abrief account of their business experience during the past five years. Officers are normally appointed annually by the Board ofDirectors at a meeting immediately following the Annual Meeting of Stockholders. There is no arrangement or understandingbetween any officer and any other person pursuant to which an officer was selected.
Maurice M. Taylor Jr., 72, was Chief Executive Officer and has been a Director of the Company since 1990, when Titan wasacquired in a management-led buyout by investors, including Mr. Taylor. Mr. Taylor served as President of the Company from1990 to 2005 and was appointed Chairman in 2005. In December of 2016, Mr. Taylor retired as Chief Executive Officer. Mr.Taylor will continue as Chairman.
Paul G. Reitz, 44, joined the Company in July 2010 as Chief Financial Officer. Mr. Reitz was appointed President in February2014. In December 2016, Mr. Reitz was appointed President and Chief Executive Officer.
James M. Froisland, 66, joined the Company in December 2016 as Chief Financial Officer. Mr. Froisland served as theCompany's Interim Chief Financial Officer since May 2016. Prior to joining Titan, Mr. Froisland was an independentconsultant, providing consulting and advisory services concerning strategy, capital structure, valuations, informationtechnology, and served in Interim Chief Financial Officer roles from 2012 to 2016. He was Interim Chief Financial Officer ofInfuSystem Holdings, Inc., a NYSE listed provider of infusion pumps and related services to hospitals, oncology practices, andother alternative site healthcare providers from 2010 to 2012. Mr. Froisland served as a director of Westell Technologies, Inc.from 2009 to 2014.
Michael G. Troyanovich, 59, joined the Company in August 2011 as Assistant General Counsel. Mr. Troyanovich wasappointed Secretary in December 2012, and General Counsel in June 2013.
Section 16(a) Beneficial Ownership Reporting ComplianceThe information required by this item regarding beneficial ownership reporting compliance is incorporated by reference to theCompany’s 2017 Proxy Statement under the caption “Section 16(a) Beneficial Ownership Reporting Compliance.”
Business Conduct PolicyThe Company adopted a business conduct policy, which is applicable to directors, officers and employees. The Company hasalso adopted corporate governance guidelines. The business conduct policy and corporate governance guidelines are availableunder the investor information category of the Company’s website, www.titan-intl.com. The Company intends to satisfydisclosure requirements regarding amendments to or waivers from its business conduct policy by posting such information onits website. Printed copies of the business conduct policy and corporate governance guidelines are available, without charge,by writing to: Titan International, Inc., c/o Corporate Secretary, 2701 Spruce Street, Quincy, IL 62301.
ITEM 11 – EXECUTIVE COMPENSATION
The information required by this item is incorporated by reference to the Company’s 2017 Proxy Statement under the caption“Compensation of Executive Officers.”

44
ITEM 12– SECURITY OWNERSHIP OF CERTAIN BENEFICIAL OWNERS AND MANAGEMENT ANDRELATED STOCKHOLDER MATTERS
Except for the information concerning equity compensation plans, the information required by this item is incorporated byreference to the Company’s 2017 Proxy Statement under the caption “Security Ownership of Certain Beneficial Owners andManagement.”
The following table provides information about shares of Titan common stock authorized for issuance under Titan’s equitycompensation plans, as of December 31, 2016:
Equity Compensation Plan Information
(i)Number of securities
to be issued uponexercise of outstandingoptions, warrants and
rights
(ii) Weighted-averageexercise price of
outstanding options,warrants and rights
(iii) Number of securities
remaining available forfuture issuance underequity compensation
plans (excludingsecurities reflected in
column (i))Equity compensation plans approved bysecurity holders 807,520 (a) 18.13 2,078,112Equity compensation plans not approvedby security holders — — —Total 807,520 18.13 2,078,112
(a) Amount includes outstanding stock options under the Company’s 2005 Equity Incentive Plan.
For additional information regarding the Company’s equity compensation plans, please see Note 24 of the Company’s Notes toConsolidated Financial Statements.
ITEM 13 – CERTAIN RELATIONSHIPS AND RELATED TRANSACTIONS AND DIRECTOR INDEPENDENCE
The information required by this item is incorporated by reference to the Company’s 2017 Proxy Statement under the captions“Related Party Transactions” and “Corporate Governance” and also appears in Note 29 of the Company’s Notes toConsolidated Financial Statements.
ITEM 14 – PRINCIPAL ACCOUNTING FEES AND SERVICES
The information required by this item is incorporated by reference to the Company’s 2017 Proxy Statement under the caption“Audit and Other Fees.”

PART IV
45
ITEM 15 – EXHIBITS AND FINANCIAL STATEMENT SCHEDULES
(a) 1. Financial Statements
Management’s Responsibility for Financial Statements F-1
Reports of Independent Registered Public Accounting Firm F-2
Consolidated Statements of Operations for the years ended December 31, 2016, 2015and 2014 F-4
Consolidated Statements of Comprehensive Income (Loss) for the years endedDecember 31, 2016, 2015 and 2014 F-5
Consolidated Balance Sheets at December 31, 2016 and 2015 F-6
Consolidated Statements of Changes in Equity for the years ended December 31, 2014,2015 and 2016 F-7
Consolidated Statements of Cash Flows for the years ended December 31, 2016, 2015and 2014 F-8
Notes to Consolidated Financial Statements F-9
2. Financial Statement Schedule
Schedule II – Valuation and Qualifying Accounts
3. Exhibits
The accompanying Exhibit Index is incorporated herein by reference.
SIGNATURES
Pursuant to the requirements of Sections 13 or 15(d) of the Securities Exchange Act of 1934, the registrant has duly caused thisReport to be signed on its behalf by the undersigned, thereunto duly authorized.
TITAN INTERNATIONAL, INC.(Registrant)
Date: March 14, 2017 By: /s/ PAUL G. REITZPaul G. ReitzPresident and Chief Executive Officer
Pursuant to the requirements of the Securities Exchange Act of 1934, this Report has been signed below by the followingpersons on behalf of the registrant and in the capacities indicated on March 14, 2017.
Signatures Capacity
/s/ PAUL G. REITZ President and Chief Executive OfficerPaul G. Reitz (Principal Executive Officer)
/s/ JAMES M. FROISLAND Chief Financial OfficerJames M Froisland (Principal Financial Officer)
/s/ CHRIS BOHNERT Chief Accounting OfficerChris Bohnert (Principal Accounting Officer)
/s/ MAURICE M. TAYLOR JR. ChairmanMaurice M. Taylor Jr.
/s/ RICHARD M. CASHIN JR. DirectorRichard M. Cashin Jr.
/s/ GARY L. COWGER DirectorGary L. Cowger
/s/ ALBERT J. FEBBO DirectorAlbert J. Febbo
/s/ PETER MCNITT DirectorPeter McNitt
/s/ DR. MARK RACHESKY DirectorDr. Mark Rachesky
/s/ ANTHONY L. SOAVE DirectorAnthony L. Soave
46
TITAN INTERNATIONAL, INC.Exhibit Index
Annual Report on Form 10-K
Exhibit No. DESCRIPTION3.1 (a) Titan International, Inc. Amended and Restated Certificate of Incorporation3.2 (a) Bylaws of the Company4.1 (b) Indenture between the Company and U.S. Bank National Association dated December 21, 20094.2 (c) Indenture between the Company and U.S. Bank National Association dated October 7, 201310.1 (a) First Supplemental Indenture dated as of June 26, 2015 to the Indenture dated as of December 21, 2009
between Titan International, Inc., U.S. Bank National Association, as Trustee, and the Subsidiary Guarantorsparty thereto, relating to the 5.625% Convertible Senior Subordinated Notes due 2017
10.2 (d) 2005 Equity Incentive Plan as Amended10.3 (e) Annual Incentive Compensation Plan10.4 (f) Paul G. Reitz Employment Agreement10.5 (g) Paul G. Reitz Employment Agreement Amendment10.6 (h) James M. Froisland Employment Agreement10.7 (f) Michael G. Troyanovich Employment Agreement10.8 (e) Trademark License Agreement with The Goodyear Tire & Rubber Company **10.9 (i) Second Amended and Restated Credit Agreement among the Company and Bank of America, N.A. dated as
of December 21, 201210.10 (j) Agreement, dated as of February 26, 2016, by and among the Company and MHR Institutional Partners III
LP, MHR Capital Partners Master Account LP, MHR Capital Partners (100) LP, MHR Institutional AdvisorsIII LLC, MHR Advisors LLC, MHRC LLC, MHR Fund Management LLC, MHR Holdings LLC and MarkH. Rachesky
10.11 (k) Audit Committee Observer Agreement, dated as of September 29, 201610.12* Credit and Security Agreement with agent BMO Harris Bank N. A., dated as of February 17, 201721* Subsidiaries of the Registrant31.1* Certification of Principal Executive Officer pursuant to Section 302 of the Sarbanes-Oxley Act of 200231.2* Certification of Principal Financial Officer pursuant to Section 302 of the Sarbanes-Oxley Act of 200232* Certification pursuant to Section 906 of the Sarbanes-Oxley Act of 2002 * Filed herewith** Confidential treatment has been requested with respect to certain portions of this exhibit. Omitted portions have been filedseparately with the Securities and Exchange Commission. (a) Incorporated by reference to the same numbered exhibit contained in the Company’s Current Report on Form 8-K filed on
June 29, 2015 (No. 1-12936).(b) Incorporated by reference to the same numbered exhibit contained in the Company’s Current Report on Form 8-K filed on
December 21, 2009 (No. 1-12936).(c) Incorporated by reference to the same numbered exhibit contained in the Company’s Current Report on Form 8-K filed on
October 7, 2013. (No. 1-12936).(d) Incorporated by reference to Appendix A of the Company’s Definitive Proxy Statement filed on March 28, 2011.(e) Incorporated by reference to the same numbered exhibit contained in the Company's Form 10-Q for the quarterly period
ended March 31, 2016 (No. 1-12936).(f) Incorporated by reference to the same numbered exhibit contained in the Company's Current Report on Form 8-K filed on
December 23, 2015 (No. 1-12936).(g) Incorporated by reference to the same numbered exhibit contained in the Company's Current Report on Form 8-K filed on
December 9, 2016 (No. 1-12936).(h) Incorporated by reference to the same numbered exhibit contained in the Company's Current Report on Form 8-K filed on
December 7, 2016 (No. 1-12936).(i) Incorporated by reference to the same numbered exhibit contained in the Company's Form 10-Q for the quarterly period
ended June 30, 2013 (No. 1-12936).(j) Incorporated by reference to the same numbered exhibit contained in the Company's Current Report on Form 8-K filed on
February 29, 2016 (No. 1-12936).(k) Incorporated by reference to the same numbered exhibit contained in the Company's Current Report on Form 8-K filed on
October 3, 2016 (No. 1-12936).
47
Management’s Responsibility for Financial Statements
Management is responsible for the preparation of the Company’s consolidated financial statements included in this annualreport on Form 10-K. Management believes that the consolidated financial statements fairly reflect the Company’s financialtransactions and the financial statements reasonably present the Company’s financial position and results of operations inconformity with accounting principles generally accepted in the United States of America.
The Board of Directors of the Company has an Audit Committee comprised entirely of outside directors who are independentof management. The Committee meets periodically with management, the internal auditors, and the independent registeredpublic accounting firm to review accounting control, auditing, and financial reporting matters. The Audit Committee isresponsible for the appointment of the independent registered public accounting firm and approval of their fees.
The independent registered public accounting firm audits the Company’s consolidated financial statements in accordance withthe standards of the Public Company Accounting Oversight Board (United States). The consolidated financial statements as ofDecember 31, 2016, have been audited by Grant Thornton LLP, an independent registered public accounting firm, as stated intheir report, which is included herein.
F- 1

Report of Independent Registered Public Accounting Firm
Board of Directors andShareholders of Titan International, Inc.
We have audited the accompanying consolidated balance sheets of Titan International, Inc. (a Delaware corporation) and subsidiaries (together,the “Company”) as of December 31, 2016 and 2015, and the related consolidated statements of operations, comprehensive income (loss),changes in equity, and cash flows for each of the three years in the period ended December 31, 2016. Our audits of the basic consolidatedfinancial statements included the financial statement schedule listed in the index appearing under Item 15(a)(2). These financial statementsand financial statement schedule are the responsibility of the Company’s management. Our responsibility is to express an opinion on thesefinancial statements and financial statement schedule based on our audits.
We conducted our audits in accordance with the standards of the Public Company Accounting Oversight Board (United States). Those standardsrequire that we plan and perform the audit to obtain reasonable assurance about whether the financial statements are free of material misstatement.An audit includes examining, on a test basis, evidence supporting the amounts and disclosures in the financial statements. An audit also includesassessing the accounting principles used and significant estimates made by management, as well as evaluating the overall financial statementpresentation. We believe that our audits provide a reasonable basis for our opinion.
In our opinion, the consolidated financial statements referred to above present fairly, in all material respects, the financial position of TitanInternational, Inc. and subsidiaries as of December 31, 2016 and 2015, and the results of their operations and their cash flows for each of thethree years in the period ended December 31, 2016, in conformity with accounting principles generally accepted in the United States of America.Also in our opinion, the related financial statement schedule, when considered in relation to the basic consolidated financial statements takenas a whole, presents fairly, in all material respects, the information set forth therein.
As discussed in Note 1 to the consolidated financial statements, the Company adopted new accounting guidance in 2016, related to thepresentation of debt issuance costs.
We also have audited, in accordance with the standards of the Public Company Accounting Oversight Board (United States), the Company’sinternal control over financial reporting as of December 31, 2016, based on criteria established in the 2013 Internal Control-Integrated Frameworkissued by the Committee of Sponsoring Organizations of the Treadway Commission (COSO), and our report dated March 14, 2017 expressedan unqualified opinion.
/s/ Grant Thornton LLPChicago, IllinoisMarch 14, 2017
F- 2

Report of Independent Registered Public Accounting Firm
Board of Directors andShareholders of Titan International, Inc.
We have audited the internal control over financial reporting of Titan International, Inc. (a Delaware corporation) and subsidiaries (together,the “Company”) as of December 31, 2016, based on criteria established in the 2013 Internal Control-Integrated Framework issued by theCommittee of Sponsoring Organizations of the Treadway Commission (COSO). The Company’s management is responsible for maintainingeffective internal control over financial reporting and for its assessment of the effectiveness of internal control over financial reporting, includedin the accompanying Management’s Report on Internal Control Over Financial Reporting (Management’s Report). Our responsibility is toexpress an opinion on the Company’s internal control over financial reporting based on our audit.
We conducted our audit in accordance with the standards of the Public Company Accounting Oversight Board (United States). Those standardsrequire that we plan and perform the audit to obtain reasonable assurance about whether effective internal control over financial reporting wasmaintained in all material respects. Our audit included obtaining an understanding of internal control over financial reporting, assessing therisk that a material weakness exists, testing and evaluating the design and operating effectiveness of internal control based on the assessed risk,and performing such other procedures as we considered necessary in the circumstances. We believe that our audit provides a reasonable basisfor our opinion.
A company’s internal control over financial reporting is a process designed to provide reasonable assurance regarding the reliability of financialreporting and the preparation of financial statements for external purposes in accordance with generally accepted accounting principles. Acompany’s internal control over financial reporting includes those policies and procedures that (1) pertain to the maintenance of records that,in reasonable detail, accurately and fairly reflect the transactions and dispositions of the assets of the company; (2) provide reasonable assurancethat transactions are recorded as necessary to permit preparation of financial statements in accordance with generally accepted accountingprinciples, and that receipts and expenditures of the company are being made only in accordance with authorizations of management anddirectors of the company; and (3) provide reasonable assurance regarding prevention or timely detection of unauthorized acquisition, use, ordisposition of the company’s assets that could have a material effect on the financial statements.
Because of its inherent limitations, internal control over financial reporting may not prevent or detect misstatements. Also, projections of anyevaluation of effectiveness to future periods are subject to the risk that controls may become inadequate because of changes in conditions, orthat the degree of compliance with the policies or procedures may deteriorate.
In our opinion, the Company maintained, in all material respects, effective internal control over financial reporting as of December 31, 2016,based on criteria established in the 2013 Internal Control-Integrated Framework issued by COSO.
We also have audited, in accordance with the standards of the Public Company Accounting Oversight Board (United States), the consolidatedfinancial statements of the Company as of and for the year ended December 31, 2016, and our report dated March 14, 2017 expressed anunqualified opinion on those financial statements.
/s/ Grant Thornton LLPChicago, IllinoisMarch 14, 2017
F- 3
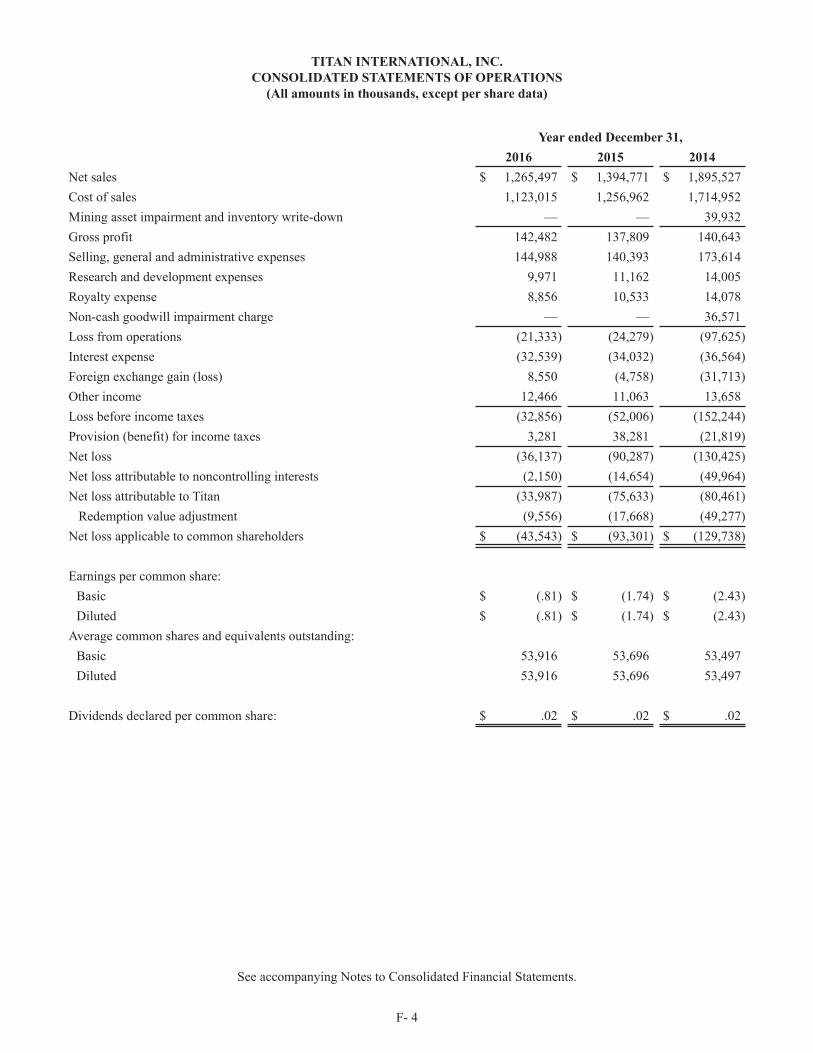
TITAN INTERNATIONAL, INC.CONSOLIDATED STATEMENTS OF OPERATIONS
(All amounts in thousands, except per share data)
Year ended December 31,2016 2015 2014
Net sales $ 1,265,497 $ 1,394,771 $ 1,895,527Cost of sales 1,123,015 1,256,962 1,714,952Mining asset impairment and inventory write-down — — 39,932Gross profit 142,482 137,809 140,643Selling, general and administrative expenses 144,988 140,393 173,614Research and development expenses 9,971 11,162 14,005Royalty expense 8,856 10,533 14,078Non-cash goodwill impairment charge — — 36,571Loss from operations (21,333) (24,279) (97,625)Interest expense (32,539) (34,032) (36,564)Foreign exchange gain (loss) 8,550 (4,758) (31,713)Other income 12,466 11,063 13,658Loss before income taxes (32,856) (52,006) (152,244)Provision (benefit) for income taxes 3,281 38,281 (21,819)Net loss (36,137) (90,287) (130,425)Net loss attributable to noncontrolling interests (2,150) (14,654) (49,964)Net loss attributable to Titan (33,987) (75,633) (80,461) Redemption value adjustment (9,556) (17,668) (49,277)Net loss applicable to common shareholders $ (43,543) $ (93,301) $ (129,738)
Earnings per common share:Basic $ (.81) $ (1.74) $ (2.43)Diluted $ (.81) $ (1.74) $ (2.43)
Average common shares and equivalents outstanding:Basic 53,916 53,696 53,497Diluted 53,916 53,696 53,497
Dividends declared per common share: $ .02 $ .02 $ .02
See accompanying Notes to Consolidated Financial Statements.
F- 4

TITAN INTERNATIONAL, INC.CONSOLIDATED STATEMENTS OF COMPREHENSIVE INCOME (LOSS)
(All amounts in thousands)
Year ended December 31,2016 2015 2014
Net loss $ (36,137) (90,287) $ (130,425)Currency translation adjustment 5,857 (79,196) (63,424)Pension liability adjustments, net of tax of $215, $(439), and $3,035,respectively 1,071 (662) (5,129)
Comprehensive loss (29,209) (170,145) (198,978)Net comprehensive income (loss) attributable to redeemable andnoncontrolling interests 5,305 (19,391) (68,856)
Comprehensive loss attributable to Titan $ (34,514) $ (150,754) $ (130,122)
See accompanying Notes to Consolidated Financial Statements.
F- 5
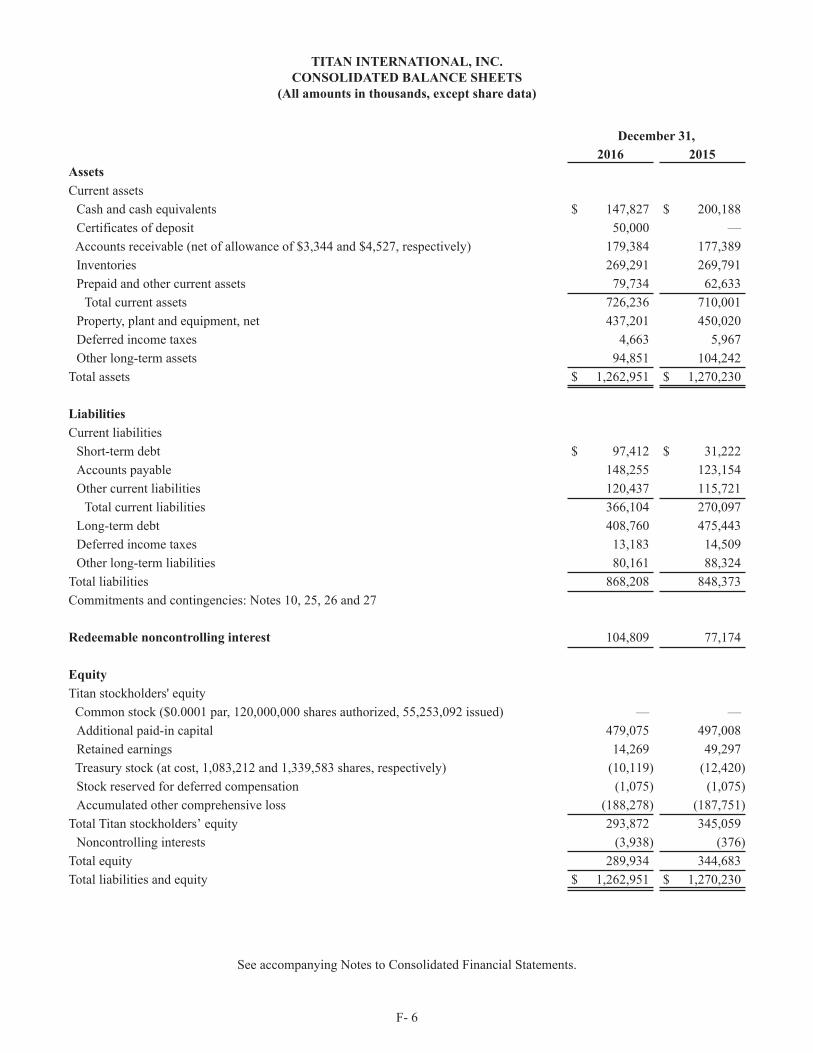
TITAN INTERNATIONAL, INC.CONSOLIDATED BALANCE SHEETS
(All amounts in thousands, except share data)
December 31,2016 2015
AssetsCurrent assets
Cash and cash equivalents $ 147,827 $ 200,188Certificates of deposit 50,000 —
Accounts receivable (net of allowance of $3,344 and $4,527, respectively) 179,384 177,389Inventories 269,291 269,791Prepaid and other current assets 79,734 62,633
Total current assets 726,236 710,001Property, plant and equipment, net 437,201 450,020Deferred income taxes 4,663 5,967Other long-term assets 94,851 104,242
Total assets $ 1,262,951 $ 1,270,230
LiabilitiesCurrent liabilities
Short-term debt $ 97,412 $ 31,222Accounts payable 148,255 123,154Other current liabilities 120,437 115,721
Total current liabilities 366,104 270,097Long-term debt 408,760 475,443Deferred income taxes 13,183 14,509Other long-term liabilities 80,161 88,324
Total liabilities 868,208 848,373Commitments and contingencies: Notes 10, 25, 26 and 27
Redeemable noncontrolling interest 104,809 77,174
EquityTitan stockholders' equity Common stock ($0.0001 par, 120,000,000 shares authorized, 55,253,092 issued) — —
Additional paid-in capital 479,075 497,008Retained earnings 14,269 49,297
Treasury stock (at cost, 1,083,212 and 1,339,583 shares, respectively) (10,119) (12,420)Stock reserved for deferred compensation (1,075) (1,075)Accumulated other comprehensive loss (188,278) (187,751)
Total Titan stockholders’ equity 293,872 345,059Noncontrolling interests (3,938) (376)
Total equity 289,934 344,683Total liabilities and equity $ 1,262,951 $ 1,270,230
See accompanying Notes to Consolidated Financial Statements.
F- 6

TITAN INTERNATIONAL, INC.CONSOLIDATED STATEMENTS OF CHANGES IN EQUITY
(All amounts in thousands, except share data)
Numberof
commonshares
CommonStock
Additionalpaid-incapital
Retainedearnings
Treasurystock
Stock reserved for
deferredcompensation
Accumulated other
comprehensiveincome (loss)
TotalTitan
Equity
Non-controlling
interestTotal
Equity
Balance January 1, 2014 53,560,872 — 558,637 207,541 (15,586) (1,075) (61,794) 687,723 21,158 708,881Net income * (80,461) (80,461) (12,320) (92,781)CTA, net of tax * (44,554) (44,554) (1,467) (46,021)Pension liabilityadjustments, net of tax (5,129) (5,129) (5,129)Dividends declared (1,073) (1,073) (1,073)Restricted stock awardsvesting 139,250 (1,250) 1,250 — —Exercise of stock options 8,971 60 81 141 141Acquisition of additionalinterest — (49) (1,153) (1,202) — (1,202)Redemption ValueAdjustment (49,277) (49,277) — (49,277)Stock-based compensation 5,360 5,360 5,360Tax benefit related tostock-based compensation (672) (672) (672)Issuance of treasury stockunder 401(k) plan 39,935 281 358 639 639Balance December 31,2014 53,749,028 — 513,090 126,007 (13,897) (1,075) (112,630) 511,495 7,371 518,866Net loss * (75,633) (75,633) (7,640) (83,273)CTA, net of tax * (74,459) (74,459) (65) (74,524)Pension liabilityadjustments, net of tax (662) (662) (662)Dividends declared (1,077) (1,077) (1,077)Restricted stock awardsvesting 86,500 (777) 777 — —Exercise of stock options 12,500 33 112 145 145Dissolution of subsidiary — (42) (42)Redemption valueadjustment (17,668) (17,668) (17,668)Stock-based compensation 2,335 2,335 2,335Issuance of treasury stockunder 401(k) plan 65,481 (5) 588 583 583Balance December 31,2015 53,913,509 — 497,008 49,297 (12,420) (1,075) (187,751) 345,059 (376) 344,683Net loss * (33,987) (33,987) (4,346) (38,333)CTA, net of tax * 1,893 1,893 119 2,012Pension liabilityadjustments, net of tax 1,071 1,071 1,071Dividends declared (1,081) (1,081) (1,081)Restricted stock awards 162,880 (1,463) 1,463 — —Acquisition of additionalinterest (8,548) 40 (3,491) (11,999) (40) (12,039)Redemption valueadjustment (9,556) (9,556) — (9,556)Stock-based compensation 1,954 1,954 1,954VIE consolidation anddistributions — 705 705Issuance of treasury stockunder 401(k) plan 93,491 (320) 838 518 518Balance December 31,2016 54,169,880 $ — $ 479,075 $ 14,269 $ (10,119) $ (1,075) $ (188,278) $ 293,872 $ (3,938) $ 289,934
* Net income (loss) excludes income (loss) attributable to redeemable noncontrolling interest of $(37,644), $(7,014), and $2,196 for 2014,2015, and 2016, respectively. CTA excludes $(17,403), $(4,672), and $3,844 for 2014, 2015, and 2016, respectively.
See accompanying Notes to Consolidated Financial Statements.
F- 7

TITAN INTERNATIONAL, INC.CONSOLIDATED STATEMENTS OF CASH FLOWS
(All amounts in thousands)
Year ended December 31,Cash flows from operating activities: 2016 2015 2014
Net loss $ (36,137) $ (90,287) $ (130,425)Adjustments to reconcile net loss to net cash provided by operating activities: Depreciation and amortization 59,768 69,618 88,704Mining asset impairment — — 23,242Mining inventory write-down — — 16,690Deferred income tax provision (680) 27,969 (24,800)Non-cash goodwill impairment charge — — 36,571Stock-based compensation 1,993 2,335 5,360Excess tax benefit from stock-based compensation — — 672Issuance of treasury stock under 401(k) plan 518 583 639Foreign currency translation loss 9,734 12,058 8,829(Increase) decrease in assets:Accounts receivable 4,007 497 54,686Inventories 4,374 31,333 20,933Prepaid and other current assets (16,718) 9,946 30,324Other long-term assets (109) (4,780) (1,145)Increase (decrease) in liabilities:Accounts payable 20,953 1,402 (26,135)Other current liabilities 3,635 (172) (2,089)Other liabilities (7,838) 3,428 15,764
Net cash provided by operating activities 43,500 63,930 117,820Cash flows from investing activities:
Capital expenditures (41,948) (48,429) (58,439)Acquisitions, net of cash acquired — — (13,395)Certificates of deposit (50,000) — —Decrease in restricted cash deposits — — 14,268Other 2,222 (1,508) 1,296
Net cash used for investing activities (89,726) (49,937) (56,270)Cash flows from financing activities:
Proceeds from borrowings 17,285 5,727 15,708Payment on debt (22,634) (5,521) (60,345)Proceeds from exercise of stock options — 145 141Excess tax benefit from stock-based compensation — — (672)Payment of financing fees — — (33)Dividends paid (1,081) (1,077) (1,073)
Net cash used for financing activities (6,430) (726) (46,274)Effect of exchange rate changes on cash 295 (14,530) (3,185)Net increase (decrease) in cash and cash equivalents (52,361) (1,263) 12,091Cash and cash equivalents, beginning of year 200,188 201,451 189,360Cash and cash equivalents, end of year $ 147,827 $ 200,188 $ 201,451
Supplemental information:Interest paid $ 34,380 $ 34,072 $ 34,014Income taxes paid, net of refunds received $ 5,463 $ (195) $ (25,588)
See accompanying Notes to Consolidated Financial Statements.
F- 8

TITAN INTERNATIONAL, INC.NOTES TO CONSOLIDATED FINANCIAL STATEMENTS
F- 9
1. DESCRIPTION OF BUSINESS AND SIGNIFICANT ACCOUNTING POLICIES
BusinessTitan International, Inc. and its subsidiaries (Titan or the Company) are leading manufacturers of wheels, tires, andundercarriage systems and components for off-highway vehicles used in the agricultural, earthmoving/construction, andconsumer segments. Titan manufactures both wheels and tires for the majority of these market applications, allowing theCompany to provide the value-added service of delivering complete wheel and tire assemblies. The Company offers a broadrange of products that are manufactured to meet the specifications of original equipment manufacturers (OEMs) and/or therequirements of aftermarket customers.
Principles of consolidationThe consolidated financial statements include the accounts of all majority-owned subsidiaries and variable interest entities inwhich Titan is the primary beneficiary. Investments in companies in which Titan does not own a majority interest and Titan hasthe ability to exercise significant influence over operating and financial policies are accounted for using the equity method.Investments in other companies are carried at cost. All significant intercompany accounts and transactions have beeneliminated. The Company consolidates the Voltyre-Prom subsidiary for which it acts as operating partner. See Note 13 foradditional information.
Cash and cash equivalentsThe Company considers short-term debt securities with an original maturity of three months or less to be cash equivalents. Thecash in the Company's U.S. banks is not fully insured by the Federal Deposit Insurance Corporation. The Company had $61.1million and $57.8 million of cash in foreign bank accounts at December 31, 2016 and 2015, respectively. The Company's cashin its foreign bank accounts is not fully insured.
Certificates of depositThe certificates of deposit financial line item includes certificates of deposit with an original maturity of more than threemonths but less than one year.
Accounts receivable and allowance for doubtful accountsThe Company carries its accounts receivable at their face amounts less an allowance for doubtful accounts. An allowance foruncollectible receivables is recorded based upon known bad debt risks and past loss history. Actual collection experience maydiffer from the current estimate of net receivables.
InventoriesInventories are valued at the lower of cost or market. The majority of the Company's inventories were valued under the first in,first out (FIFO) method or average cost method. Approximately 7% and 8% of the Company's inventories at December 31,2016 and 2015, respectively, were valued under the last in, first out (LIFO) method. The majority of the steel inventory inNorth America is accounted for under the LIFO method. Market value is estimated based on current selling prices. Estimatedprovisions are established for slow-moving and obsolete inventory.
Fixed assetsProperty, plant, and equipment have been recorded at cost. Depreciation is provided using the straight-line method over thefollowing estimated useful lives of the related assets:
YearsBuilding and improvements 25 - 40Machinery and equipment 7 - 20Tools, dies, and molds 2 - 9
Maintenance and repairs are expensed as incurred. When property, plant, and equipment are retired or otherwise disposed of,the related cost and accumulated depreciation are eliminated, and any gain or loss on disposition is included in theaccompanying Consolidated Statements of Operations.
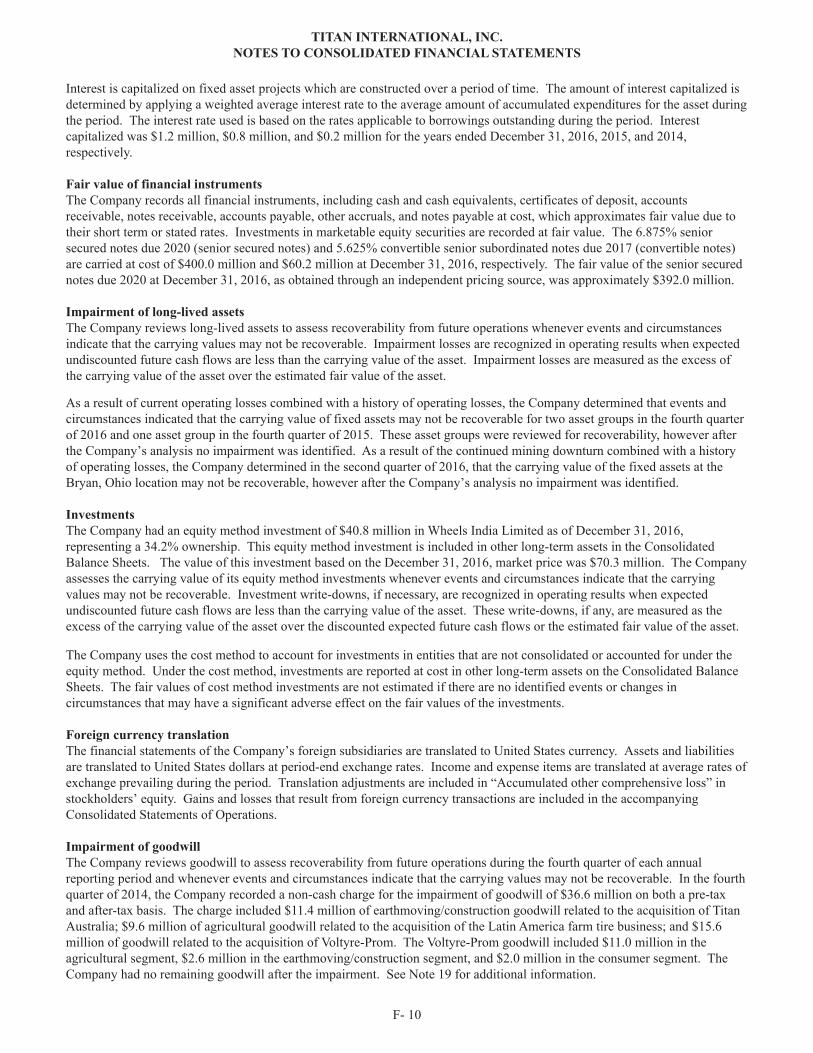
Interest is capitalized on fixed asset projects which are constructed over a period of time. The amount of interest capitalized isdetermined by applying a weighted average interest rate to the average amount of accumulated expenditures for the asset duringthe period. The interest rate used is based on the rates applicable to borrowings outstanding during the period. Interestcapitalized was $1.2 million, $0.8 million, and $0.2 million for the years ended December 31, 2016, 2015, and 2014,respectively. Fair value of financial instrumentsThe Company records all financial instruments, including cash and cash equivalents, certificates of deposit, accountsreceivable, notes receivable, accounts payable, other accruals, and notes payable at cost, which approximates fair value due totheir short term or stated rates. Investments in marketable equity securities are recorded at fair value. The 6.875% seniorsecured notes due 2020 (senior secured notes) and 5.625% convertible senior subordinated notes due 2017 (convertible notes)are carried at cost of $400.0 million and $60.2 million at December 31, 2016, respectively. The fair value of the senior securednotes due 2020 at December 31, 2016, as obtained through an independent pricing source, was approximately $392.0 million. Impairment of long-lived assetsThe Company reviews long-lived assets to assess recoverability from future operations whenever events and circumstancesindicate that the carrying values may not be recoverable. Impairment losses are recognized in operating results when expectedundiscounted future cash flows are less than the carrying value of the asset. Impairment losses are measured as the excess ofthe carrying value of the asset over the estimated fair value of the asset.
As a result of current operating losses combined with a history of operating losses, the Company determined that events andcircumstances indicated that the carrying value of fixed assets may not be recoverable for two asset groups in the fourth quarterof 2016 and one asset group in the fourth quarter of 2015. These asset groups were reviewed for recoverability, however afterthe Company’s analysis no impairment was identified. As a result of the continued mining downturn combined with a historyof operating losses, the Company determined in the second quarter of 2016, that the carrying value of the fixed assets at theBryan, Ohio location may not be recoverable, however after the Company’s analysis no impairment was identified. InvestmentsThe Company had an equity method investment of $40.8 million in Wheels India Limited as of December 31, 2016,representing a 34.2% ownership. This equity method investment is included in other long-term assets in the ConsolidatedBalance Sheets. The value of this investment based on the December 31, 2016, market price was $70.3 million. The Companyassesses the carrying value of its equity method investments whenever events and circumstances indicate that the carryingvalues may not be recoverable. Investment write-downs, if necessary, are recognized in operating results when expectedundiscounted future cash flows are less than the carrying value of the asset. These write-downs, if any, are measured as theexcess of the carrying value of the asset over the discounted expected future cash flows or the estimated fair value of the asset. The Company uses the cost method to account for investments in entities that are not consolidated or accounted for under theequity method. Under the cost method, investments are reported at cost in other long-term assets on the Consolidated BalanceSheets. The fair values of cost method investments are not estimated if there are no identified events or changes incircumstances that may have a significant adverse effect on the fair values of the investments. Foreign currency translationThe financial statements of the Company’s foreign subsidiaries are translated to United States currency. Assets and liabilitiesare translated to United States dollars at period-end exchange rates. Income and expense items are translated at average rates ofexchange prevailing during the period. Translation adjustments are included in “Accumulated other comprehensive loss” instockholders’ equity. Gains and losses that result from foreign currency transactions are included in the accompanyingConsolidated Statements of Operations. Impairment of goodwillThe Company reviews goodwill to assess recoverability from future operations during the fourth quarter of each annualreporting period and whenever events and circumstances indicate that the carrying values may not be recoverable. In the fourthquarter of 2014, the Company recorded a non-cash charge for the impairment of goodwill of $36.6 million on both a pre-taxand after-tax basis. The charge included $11.4 million of earthmoving/construction goodwill related to the acquisition of TitanAustralia; $9.6 million of agricultural goodwill related to the acquisition of the Latin America farm tire business; and $15.6million of goodwill related to the acquisition of Voltyre-Prom. The Voltyre-Prom goodwill included $11.0 million in theagricultural segment, $2.6 million in the earthmoving/construction segment, and $2.0 million in the consumer segment. TheCompany had no remaining goodwill after the impairment. See Note 19 for additional information.
TITAN INTERNATIONAL, INC.NOTES TO CONSOLIDATED FINANCIAL STATEMENTS
F- 10

Revenue recognitionThe Company records sales revenue when products are shipped to customers and both title and the risks and rewards ofownership are transferred. Provisions are established for sales returns and uncollectible accounts based on historicalexperience. Should trends change, adjustments would be necessary to the estimated provisions.
Cost of salesCost of sales is comprised primarily of direct materials and supplies consumed in the manufacturing of the Company’sproducts, as well as manufacturing labor, depreciation expense, and overhead expense necessary to acquire and convert thepurchased materials and supplies into a finished product. Cost of sales also includes all purchasing, receiving, inspection,internal transfers, and related distribution costs.
Selling, general, and administrative expenseSelling, general, and administrative (SG&A) expense is comprised primarily of sales commissions, marketing expense, selling,and administrative wages, information system costs, legal fees, bank charges, professional fees, depreciation and amortizationexpense on non-manufacturing assets, and other administrative items. Research and development expenseResearch and development (R&D) expenses are expensed as incurred. R&D costs were $10.0 million, $11.2 million, and $14.0million for the years ended December 31, 2016, 2015, and 2014, respectively.
AdvertisingAdvertising expenses are included in SG&A expense and are expensed as incurred. Advertising costs were approximately $4.8million for the year ended December 31, 2016, and approximately $3.8 million and $4.9 million for the years ended December31, 2015 and 2014, respectively.
Warranty costsThe Company provides limited warranties on workmanship on its products in all market segments. The provision for estimatedwarranty costs is made in the period when such costs become probable and is based on past warranty experience. See Note 9for additional information.
Income taxesDeferred income tax provisions are determined using the liability method to recognize deferred tax assets and liabilities. Thismethod is based upon differences between the financial statement carrying amounts and the respective tax basis of assets andliabilities using enacted tax rates that are expected to apply in the years the temporary differences are expected to be settled orrealized. Valuation allowances are recorded where it is considered more likely than not that some portion or all of the deferredtax assets will not be realized. Tax benefits are recognized only for tax positions that are more likely than not to be sustainedupon examination by tax authorities. Earnings per shareBasic earnings per share (EPS) is computed by dividing consolidated net earnings applicable to common shareholders by theweighted average number of common shares outstanding. Diluted EPS is computed by dividing adjusted consolidated netearnings applicable to common shareholders by the sum of the weighted average number of common shares outstanding and theweighted average number of potential common shares outstanding. Potential common shares consist of outstanding optionsunder the Company’s stock compensation plans and shares issuable upon conversion of the Company’s convertible notes. Environmental liabilitiesEnvironmental expenditures that relate to current operations are expensed or capitalized as appropriate. Expenditures that relateto an existing condition caused by past operations and that do not contribute to current or future revenue are expensed.Liabilities are recorded when environmental assessments and/or remedial efforts are probable and can be reasonably estimated. Stock-based compensationThe Company has one stock-based compensation plan, which is described in Note 24. Compensation expense for stock-basedcompensation is recognized over the requisite service period at the estimated fair value of the award at the grant date. TheCompany granted 60,000; 60,000; and 59,000 stock options in 2016, 2015, and 2014, respectively. The Company granted123,500 and 10,000 restricted stock awards in 2015 and 2014, respectively. The Company did not grant any restricted stockawards in 2016.
TITAN INTERNATIONAL, INC.NOTES TO CONSOLIDATED FINANCIAL STATEMENTS
F- 11

Use of estimatesThe policies utilized by the Company in the preparation of the financial statements conform to accounting principles generallyaccepted in the United States of America and require management to make estimates, assumptions, and judgments that affectthe reported amount of assets and liabilities, and disclosure of contingent assets and liabilities, at the date of the financialstatements and the reported amounts of revenues and expenses during the reporting period. Actual amounts could differ fromthese estimates and assumptions.
Changes in Accounting PrincipleThe Company adopted Accounting Standards Update (ASU) No. 2015-03, "Simplifying the Presentation of Debt IssuanceCosts" effective for the year ended December 31, 2016. This update amended existing guidance to require that debt issuancecosts related to a recognized debt liability be presented in the balance sheet as a direct deduction from the carrying amount ofthat debt liability, consistent with debt discounts. As a result of adopting this update, $5 million of debt issuance cost wasreclassified from other long-term assets to long-term debt as of December 31, 2015.
Recently Issued Accounting StandardsIn May 2014, the Financial Accounting Standards Board (FASB) issued ASU No. 2014-09, "Revenue from Contracts withCustomers (Topic 606)." This update supersedes the revenue recognition requirements in Topic 605, Revenue Recognition. Thecore principle of this guidance is that an entity should recognize revenue to depict the transfer of promised goods or services tocustomers in an amount that reflects the consideration to which the entity expects to be entitled in exchange for those goods orservices. This guidance also requires disclosure about the nature, timing, and uncertainty of revenue and cash flows arisingfrom contracts with customers. The amendments in this update were deferred by ASU No. 2015-14, "Revenue form Contractswith Customers (Topic 606) Deferral of Effective Date," and are now effective for annual reporting periods beginning afterDecember 15, 2017, including interim reporting periods within that reporting period. The Company is in the process ofcomparing its current revenue recognition policies to the requirements of ASU No. 2014-09. For the majority of Titan’srevenue arrangements, no significant impacts are expected as these transactions are not accounted for under industry-specificguidance that will be superseded by ASU No. 2014-09 and generally consist of a single performance obligation to transferpromised goods or services. While the Company has not identified any material differences in the amount and timing ofrevenue recognition related to ASU No. 2014-09, the evaluation is not complete and Titan has not concluded on the overallimpacts of adopting ASU No. 2014-09. The guidance provides for adoption either retrospectively to each prior reporting periodor as a cumulative-effect adjustment as of the date of adoption. The Company plans to make a determination as to its method ofadoption once it more fully completes its evaluation of the impacts of the standard on its revenue recognition and it is betterable to evaluate the cost-benefit of each method. The Company believes it is following an appropriate timeline to allow forproper recognition, presentation, and disclosure upon adoption in the year beginning on January 1, 2018.
In April 2016, the FASB issued ASU No. 2016-10, "Identifying Performance Obligations and Licensing." This ASU clarifiesthe following aspects of Topic 606: identifying performance obligations and the licensing implementation guidance. In May2016, the FASB issued ASU No. 2016-12, "Narrow-Scope Improvements and Practical Expedients." This ASU affects onlynarrow aspects of Topic 606 related to assessing the collectability criterion; presentation of sales tax; noncash consideration;and contract modifications and completed contracts at transition. The amendments in these updates affect the guidance in ASUNo. 2014-09, and the effective dates are the same as those for ASU No. 2014-09.
In December 2016, the FASB issued ASU No. 2016-20, "Technical Corrections and Improvements to Topic 606, Revenue fromContracts with Customers." The amendments in this update affect narrow aspects of the guidance issued in ASU No. 2014-09,and the effective dates are the same as those for ASU No. 2014-09.
In July 2015, the FASB issued ASU No. 2015-11, "Simplifying the Measurement of Inventory." This update provides that anentity should measure inventory within the scope of the update at the lower of cost or net realizable value. Net realizable valueis the estimated selling prices in the ordinary course of business, less reasonably predictable costs of completion, disposal, andtransportation. The amendments in this update are effective for financial statements issued for fiscal years beginning afterDecember 15, 2016, including interim periods within those fiscal years. The Company is currently assessing the impact thatadopting this new accounting guidance will have on the Company's consolidated financial statements.
In January 2016, the FASB issued ASU No. 2016-01, "Recognition and Measurement of Financial Assets and FinancialLiabilities." This update addresses certain aspects of recognition, measurement, presentation, and disclosure of financialinstruments. This guidance is effective for fiscal years beginning after December 15, 2017, including interim periods withinthose fiscal years. The Company is currently assessing the impact that adopting this new accounting guidance will have on theCompany's consolidated financial statements.
TITAN INTERNATIONAL, INC.NOTES TO CONSOLIDATED FINANCIAL STATEMENTS
F- 12
In February 2016, the FASB issued ASU No. 2016-02, "Leases (Topic 842)." This update was issued to increase transparencyand comparability among organizations by recognizing lease assets and lease liabilities on the balance sheet and disclosing keyinformation about leasing arrangements. The amendments in this update are effective for fiscal years beginning after December15, 2018, including interim periods within those fiscal years. The Company is currently assessing the impact that adopting thisnew accounting guidance will have on the Company's consolidated financial statements.
In March 2016, the FASB issued ASU No. 2016-07, "Simplifying the Transition to Equity Method of Accounting." This updateeliminates the requirement to retroactively adopt the equity method of accounting when an investment qualifies for use of theequity method as a result of the increase in the level of ownership. The amendments in this update are effective for fiscal years,including interim periods within those years, beginning after December 15, 2016. Early application is permitted. The adoptionof this guidance is not expected to have a material effect on the Company's consolidated financial statements.
In March 2016, the FASB issued ASU No. 2016-09, "Improvements to Employee Share-Based Payment Accounting." Thisupdate involves several aspects of the accounting for share-based payment transactions, including the income tax consequences,classification of awards as either equity or liabilities, and classification on the statement of cash flows. The amendments in thisupdate are effective for annual periods beginning after December 15, 2016, and interim periods within those annual periods.Early adoption is permitted in any interim or annual period. The adoption of this guidance is not expected to have a materialeffect on the Company's consolidated financial statements.
In August 2016, the FASB issued ASU No. 2016-15, "Classification of Certain Cash Receipts and Cash Payments." Thisupdate addresses eight specific cash flow issues with the objective of reducing the existing diversity in practice. Theamendments in this update are effective for fiscal years beginning after December 15, 2017, and interim periods within thosefiscal years. Early adoption is permitted in any interim or annual period. The adoption of this guidance is not expected to havea material effect on the Company's consolidated financial statements.
In October 2016, the FASB issued ASU No. 2016-16, "Intra-Entity Transfers of Assets other than Inventory." This updaterequires the recognition of income tax consequences of an intra-entity transfer of an asset other than inventory when the transferoccurs. The amendments in this update are effective for fiscal years beginning after December 15, 2017, including interimreporting periods within those annual reporting periods. The Company is currently assessing the impact that adopting this newaccounting guidance will have on the Company's consolidated financial statements.
In January 2017, the FASB issued ASU No. 2017-01, "Clarifying the Definition of a Business." The amendments in this updateprovide a screen to determine when a set of assets and activities is not a business. The screen requires that when substantiallyall of the fair value of the gross assets acquired (or disposed of) is concentrated in a single identifiable asset or a group ofsimilar identifiable assets, the set is not a business. The amendments in this update are effective for fiscal years beginning afterDecember 15, 2017, including interim reporting periods within those annual reporting periods. The Company is currentlyassessing the impact that adopting this new accounting guidance will have on the Company's consolidated financial statements.
ReclassificationThe Company implemented new technology resources which has allowed more accurate segregation of sales and profit bysegment in 2016. The segment information included in the Company's consolidated financial statements for 2015 and 2014 hasbeen updated to be consistent. As a result of the reclassification, the 2015 segment sales for the agricultural segment decreasedby $71.9 million, earthmoving/construction increased $61.1 million, and consumer increased by $10.8 million. The 2014reclassification decreased segment sales for the agricultural segment by $92.8 million, increased earthmoving/construction by$74.1 million, and increased consumer by $18.7 million.
TITAN INTERNATIONAL, INC.NOTES TO CONSOLIDATED FINANCIAL STATEMENTS
F- 13

2. ACCOUNTS RECEIVABLE
Accounts receivable at December 31, 2016 and 2015, consisted of the following (amounts in thousands):
2016 2015Accounts receivable $ 182,728 $ 181,916Allowance for doubtful accounts (3,344) (4,527)Accounts receivable, net $ 179,384 $ 177,389
Accounts receivable are reduced by an allowance for doubtful accounts which is based on known risks and historical losses.
TITAN INTERNATIONAL, INC.NOTES TO CONSOLIDATED FINANCIAL STATEMENTS
F- 14
3. INVENTORIES
Inventories at December 31, 2016 and 2015, consisted of the following (amounts in thousands):
2016 2015Raw material $ 76,380 $ 85,490Work-in-process 32,395 31,866Finished goods 163,461 158,997
272,236 276,353Adjustment to LIFO basis (2,945) (6,562)
$ 269,291 $ 269,791 If the Company had liquidated the balance of the LIFO basis inventory on December 31, 2016 or 2015, it would have incurred atax charge of $1.1 million or $2.5 million, respectively.
4. PREPAID AND OTHER CURRENT ASSETS
Prepaid and other current assets at December 31, 2016 and 2015, consisted of the following (amounts in thousands):
2016 2015Factory supplies $ 25,177 $ 26,804Assets held for sale 8,843 2,522Prepaid expense 8,320 5,660Prepaid taxes 7,360 5,469Prepaid royalty 6,973 5,863Value added tax 6,258 5,099Prepaid insurance 3,124 3,570Deposits 2,640 842Volume rebate 1,430 —Derivative financial instruments 988 66Duty receivable 899 3,166Other 7,722 3,572
$ 79,734 $ 62,633
The assets held for sale at December 31, 2016, include $7.3 million for a building in Italy, for which the sale is expected to becompleted in the second quarter of 2017.

5. PROPERTY, PLANT, AND EQUIPMENT
Property, plant, and equipment at December 31, 2016 and 2015, consisted of the following (amounts in thousands):
2016 2015Land and improvements $ 43,871 $ 46,776Buildings and improvements 239,036 241,666Machinery and equipment 573,717 540,549Tools, dies, and molds 106,695 102,723Construction-in-process 43,080 36,500
1,006,399 968,214Less accumulated depreciation (569,198) (518,194)
$ 437,201 $ 450,020 Depreciation, including depreciation on capital leases, related to property, plant, and equipment for the years 2016, 2015, and2014 totaled $55.8 million, $64.5 million, and $82.7 million, respectively.
Capital leases included in property, plant, and equipment at December 31, 2016 and 2015, consisted of the following (amountsin thousands):
2016 2015Buildings and improvements $ 3,565 $ 3,694Less accumulated amortization (1,923) (1,847)
$ 1,642 $ 1,847
Machinery and equipment $ 31,331 $ 32,992Less accumulated amortization (26,502) (26,298)
$ 4,829 $ 6,694
TITAN INTERNATIONAL, INC.NOTES TO CONSOLIDATED FINANCIAL STATEMENTS
F- 15
6. OTHER LONG-TERM ASSETS
Other long-term assets at December 31, 2016 and 2015, consisted of the following (amounts in thousands):
2016 2015Investment in Wheels India Limited $ 40,766 $ 42,555Amortizable intangibles 16,401 17,798Investments for deferred compensation 9,668 9,480Notes receivable 6,000 6,000Income tax receivable 5,668 4,854Prepaid software 3,807 3,883Other equity investments 3,149 3,576Prepaid royalty 1,702 9,062Deferred financing costs 273 554Other 7,417 6,480
$ 94,851 $ 104,242
The investments for deferred compensation are being treated as trading securities.
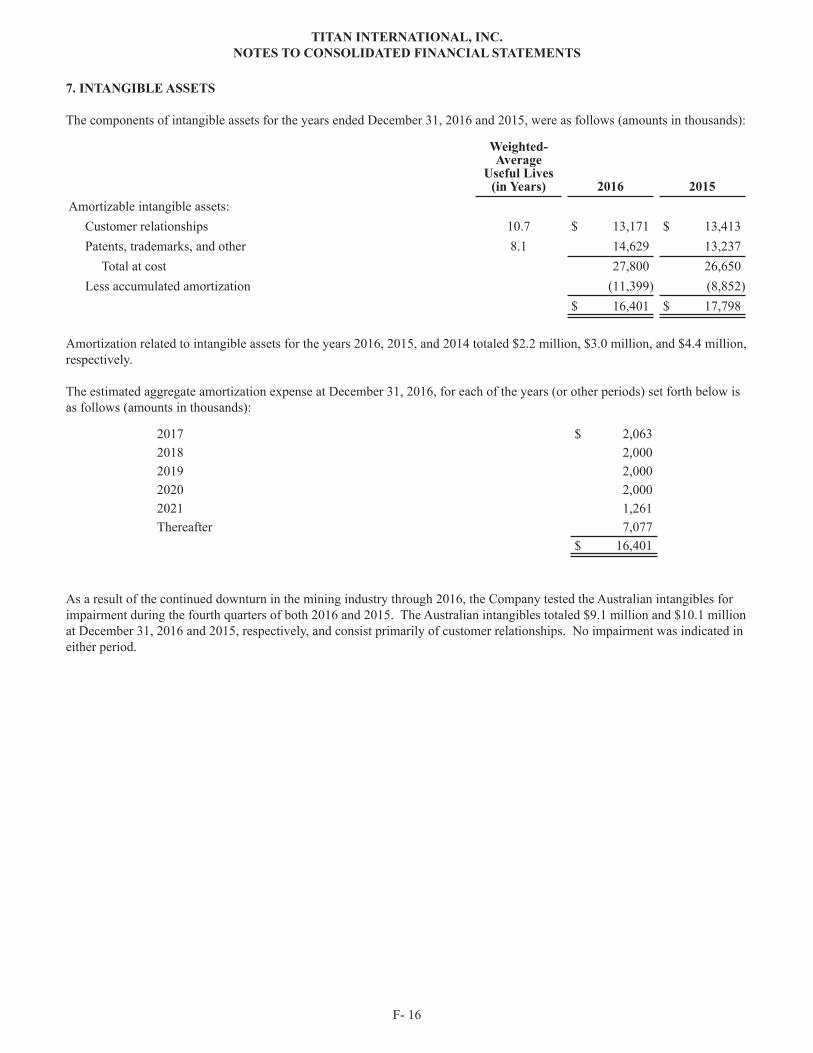
7. INTANGIBLE ASSETS
The components of intangible assets for the years ended December 31, 2016 and 2015, were as follows (amounts in thousands):
Weighted-Average
Useful Lives(in Years) 2016 2015
Amortizable intangible assets: Customer relationships 10.7 $ 13,171 $ 13,413 Patents, trademarks, and other 8.1 14,629 13,237 Total at cost 27,800 26,650 Less accumulated amortization (11,399) (8,852)
$ 16,401 $ 17,798
Amortization related to intangible assets for the years 2016, 2015, and 2014 totaled $2.2 million, $3.0 million, and $4.4 million,respectively.
The estimated aggregate amortization expense at December 31, 2016, for each of the years (or other periods) set forth below isas follows (amounts in thousands):
2017 $ 2,0632018 2,0002019 2,0002020 2,0002021 1,261Thereafter 7,077
$ 16,401
As a result of the continued downturn in the mining industry through 2016, the Company tested the Australian intangibles forimpairment during the fourth quarters of both 2016 and 2015. The Australian intangibles totaled $9.1 million and $10.1 millionat December 31, 2016 and 2015, respectively, and consist primarily of customer relationships. No impairment was indicated ineither period.
TITAN INTERNATIONAL, INC.NOTES TO CONSOLIDATED FINANCIAL STATEMENTS
F- 16
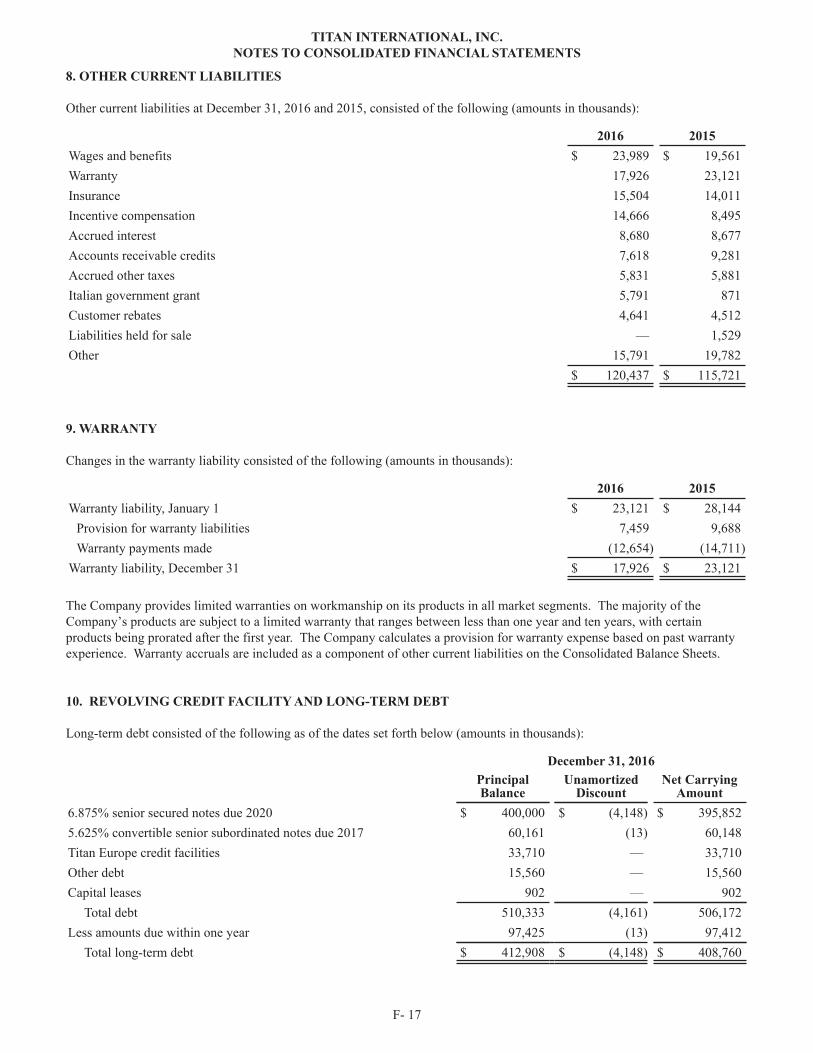
8. OTHER CURRENT LIABILITIES
Other current liabilities at December 31, 2016 and 2015, consisted of the following (amounts in thousands):
2016 2015Wages and benefits $ 23,989 $ 19,561Warranty 17,926 23,121Insurance 15,504 14,011Incentive compensation 14,666 8,495Accrued interest 8,680 8,677Accounts receivable credits 7,618 9,281Accrued other taxes 5,831 5,881Italian government grant 5,791 871Customer rebates 4,641 4,512Liabilities held for sale — 1,529Other 15,791 19,782
$ 120,437 $ 115,721
TITAN INTERNATIONAL, INC.NOTES TO CONSOLIDATED FINANCIAL STATEMENTS
F- 17
9. WARRANTY
Changes in the warranty liability consisted of the following (amounts in thousands):
2016 2015Warranty liability, January 1 $ 23,121 $ 28,144
Provision for warranty liabilities 7,459 9,688Warranty payments made (12,654) (14,711)
Warranty liability, December 31 $ 17,926 $ 23,121
The Company provides limited warranties on workmanship on its products in all market segments. The majority of theCompany’s products are subject to a limited warranty that ranges between less than one year and ten years, with certainproducts being prorated after the first year. The Company calculates a provision for warranty expense based on past warrantyexperience. Warranty accruals are included as a component of other current liabilities on the Consolidated Balance Sheets.
10. REVOLVING CREDIT FACILITY AND LONG-TERM DEBT
Long-term debt consisted of the following as of the dates set forth below (amounts in thousands):
December 31, 2016PrincipalBalance
UnamortizedDiscount
Net CarryingAmount
6.875% senior secured notes due 2020 $ 400,000 $ (4,148) $ 395,8525.625% convertible senior subordinated notes due 2017 60,161 (13) 60,148Titan Europe credit facilities 33,710 — 33,710Other debt 15,560 — 15,560Capital leases 902 — 902 Total debt 510,333 (4,161) 506,172Less amounts due within one year 97,425 (13) 97,412 Total long-term debt $ 412,908 $ (4,148) $ 408,760
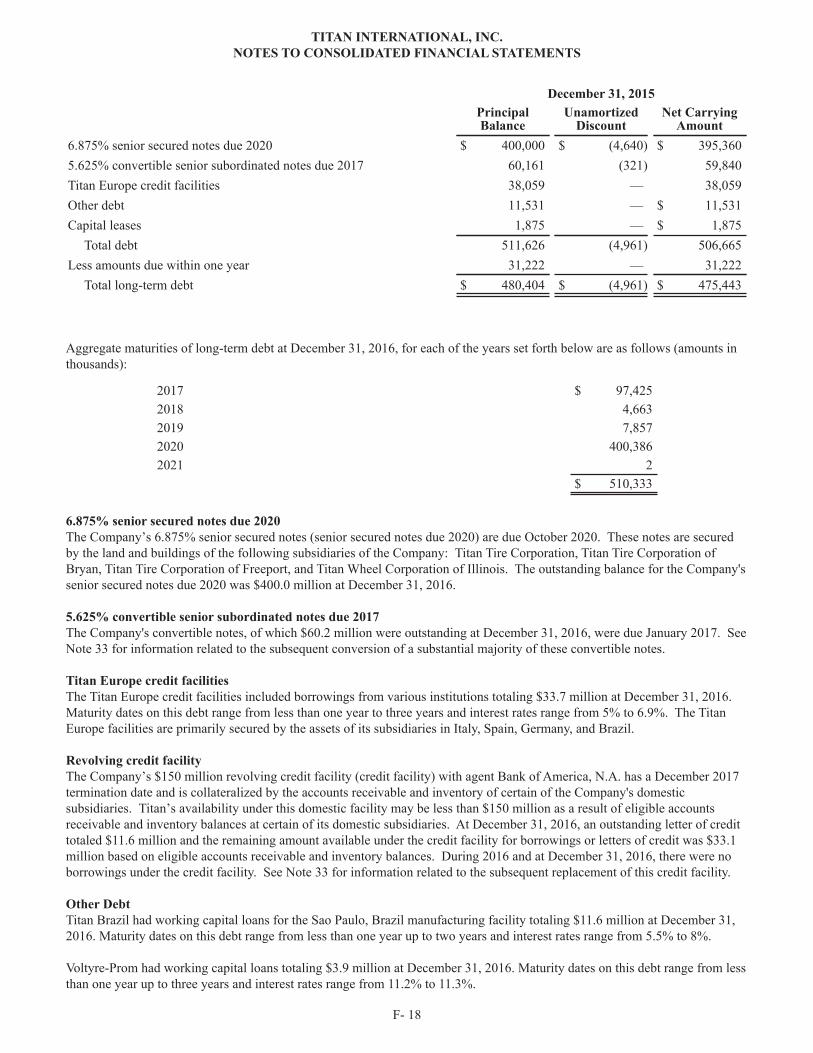
December 31, 2015PrincipalBalance
UnamortizedDiscount
Net CarryingAmount
6.875% senior secured notes due 2020 $ 400,000 $ (4,640) $ 395,3605.625% convertible senior subordinated notes due 2017 60,161 (321) 59,840Titan Europe credit facilities 38,059 — 38,059Other debt 11,531 — $ 11,531Capital leases 1,875 — $ 1,875 Total debt 511,626 (4,961) 506,665Less amounts due within one year 31,222 — 31,222 Total long-term debt $ 480,404 $ (4,961) $ 475,443
Aggregate maturities of long-term debt at December 31, 2016, for each of the years set forth below are as follows (amounts inthousands):
2017 $ 97,4252018 4,6632019 7,8572020 400,3862021 2
$ 510,333
6.875% senior secured notes due 2020The Company’s 6.875% senior secured notes (senior secured notes due 2020) are due October 2020. These notes are securedby the land and buildings of the following subsidiaries of the Company: Titan Tire Corporation, Titan Tire Corporation ofBryan, Titan Tire Corporation of Freeport, and Titan Wheel Corporation of Illinois. The outstanding balance for the Company'ssenior secured notes due 2020 was $400.0 million at December 31, 2016.
5.625% convertible senior subordinated notes due 2017The Company's convertible notes, of which $60.2 million were outstanding at December 31, 2016, were due January 2017. SeeNote 33 for information related to the subsequent conversion of a substantial majority of these convertible notes.
Titan Europe credit facilitiesThe Titan Europe credit facilities included borrowings from various institutions totaling $33.7 million at December 31, 2016.Maturity dates on this debt range from less than one year to three years and interest rates range from 5% to 6.9%. The TitanEurope facilities are primarily secured by the assets of its subsidiaries in Italy, Spain, Germany, and Brazil.
Revolving credit facilityThe Company’s $150 million revolving credit facility (credit facility) with agent Bank of America, N.A. has a December 2017termination date and is collateralized by the accounts receivable and inventory of certain of the Company's domesticsubsidiaries. Titan’s availability under this domestic facility may be less than $150 million as a result of eligible accountsreceivable and inventory balances at certain of its domestic subsidiaries. At December 31, 2016, an outstanding letter of credittotaled $11.6 million and the remaining amount available under the credit facility for borrowings or letters of credit was $33.1million based on eligible accounts receivable and inventory balances. During 2016 and at December 31, 2016, there were noborrowings under the credit facility. See Note 33 for information related to the subsequent replacement of this credit facility.
Other DebtTitan Brazil had working capital loans for the Sao Paulo, Brazil manufacturing facility totaling $11.6 million at December 31,2016. Maturity dates on this debt range from less than one year up to two years and interest rates range from 5.5% to 8%.
Voltyre-Prom had working capital loans totaling $3.9 million at December 31, 2016. Maturity dates on this debt range from lessthan one year up to three years and interest rates range from 11.2% to 11.3%.
TITAN INTERNATIONAL, INC.NOTES TO CONSOLIDATED FINANCIAL STATEMENTS
F- 18
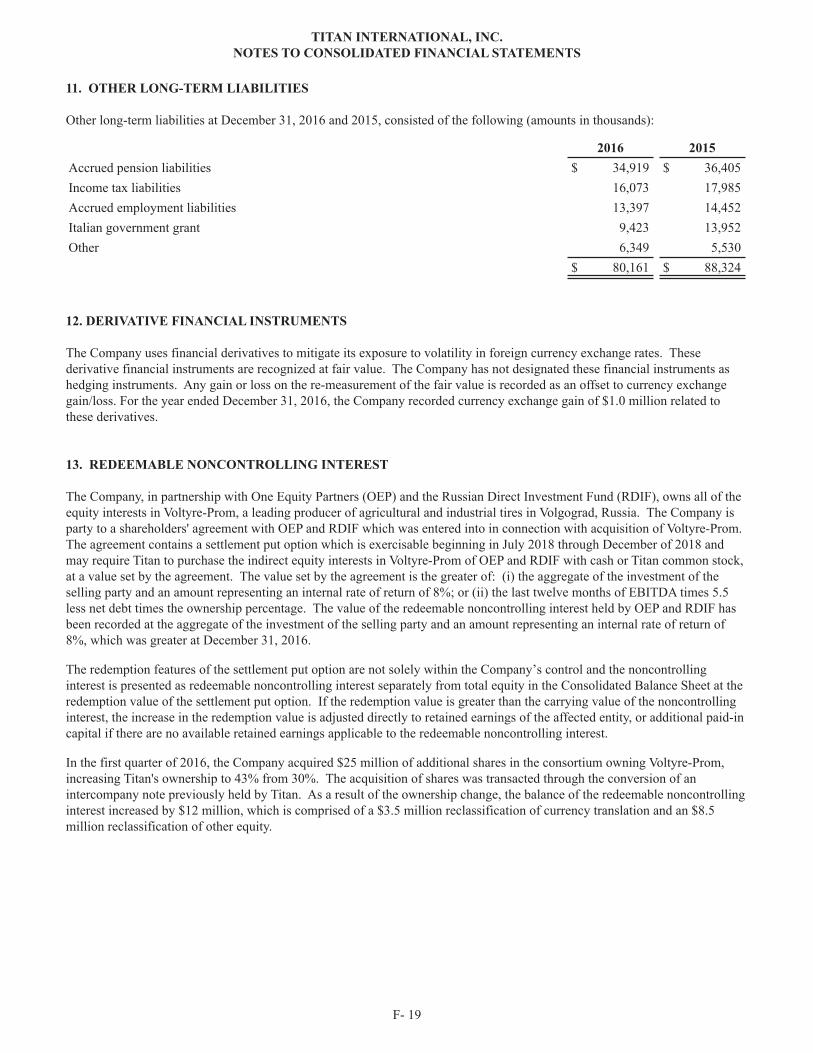
11. OTHER LONG-TERM LIABILITIES
Other long-term liabilities at December 31, 2016 and 2015, consisted of the following (amounts in thousands):
2016 2015Accrued pension liabilities $ 34,919 $ 36,405Income tax liabilities 16,073 17,985Accrued employment liabilities 13,397 14,452Italian government grant 9,423 13,952Other 6,349 5,530
$ 80,161 $ 88,324
TITAN INTERNATIONAL, INC.NOTES TO CONSOLIDATED FINANCIAL STATEMENTS
F- 19
12. DERIVATIVE FINANCIAL INSTRUMENTS
The Company uses financial derivatives to mitigate its exposure to volatility in foreign currency exchange rates. Thesederivative financial instruments are recognized at fair value. The Company has not designated these financial instruments ashedging instruments. Any gain or loss on the re-measurement of the fair value is recorded as an offset to currency exchangegain/loss. For the year ended December 31, 2016, the Company recorded currency exchange gain of $1.0 million related tothese derivatives.
13. REDEEMABLE NONCONTROLLING INTEREST
The Company, in partnership with One Equity Partners (OEP) and the Russian Direct Investment Fund (RDIF), owns all of theequity interests in Voltyre-Prom, a leading producer of agricultural and industrial tires in Volgograd, Russia. The Company isparty to a shareholders' agreement with OEP and RDIF which was entered into in connection with acquisition of Voltyre-Prom.The agreement contains a settlement put option which is exercisable beginning in July 2018 through December of 2018 andmay require Titan to purchase the indirect equity interests in Voltyre-Prom of OEP and RDIF with cash or Titan common stock,at a value set by the agreement. The value set by the agreement is the greater of: (i) the aggregate of the investment of theselling party and an amount representing an internal rate of return of 8%; or (ii) the last twelve months of EBITDA times 5.5less net debt times the ownership percentage. The value of the redeemable noncontrolling interest held by OEP and RDIF hasbeen recorded at the aggregate of the investment of the selling party and an amount representing an internal rate of return of8%, which was greater at December 31, 2016.
The redemption features of the settlement put option are not solely within the Company’s control and the noncontrollinginterest is presented as redeemable noncontrolling interest separately from total equity in the Consolidated Balance Sheet at theredemption value of the settlement put option. If the redemption value is greater than the carrying value of the noncontrollinginterest, the increase in the redemption value is adjusted directly to retained earnings of the affected entity, or additional paid-incapital if there are no available retained earnings applicable to the redeemable noncontrolling interest.
In the first quarter of 2016, the Company acquired $25 million of additional shares in the consortium owning Voltyre-Prom,increasing Titan's ownership to 43% from 30%. The acquisition of shares was transacted through the conversion of anintercompany note previously held by Titan. As a result of the ownership change, the balance of the redeemable noncontrollinginterest increased by $12 million, which is comprised of a $3.5 million reclassification of currency translation and an $8.5million reclassification of other equity.
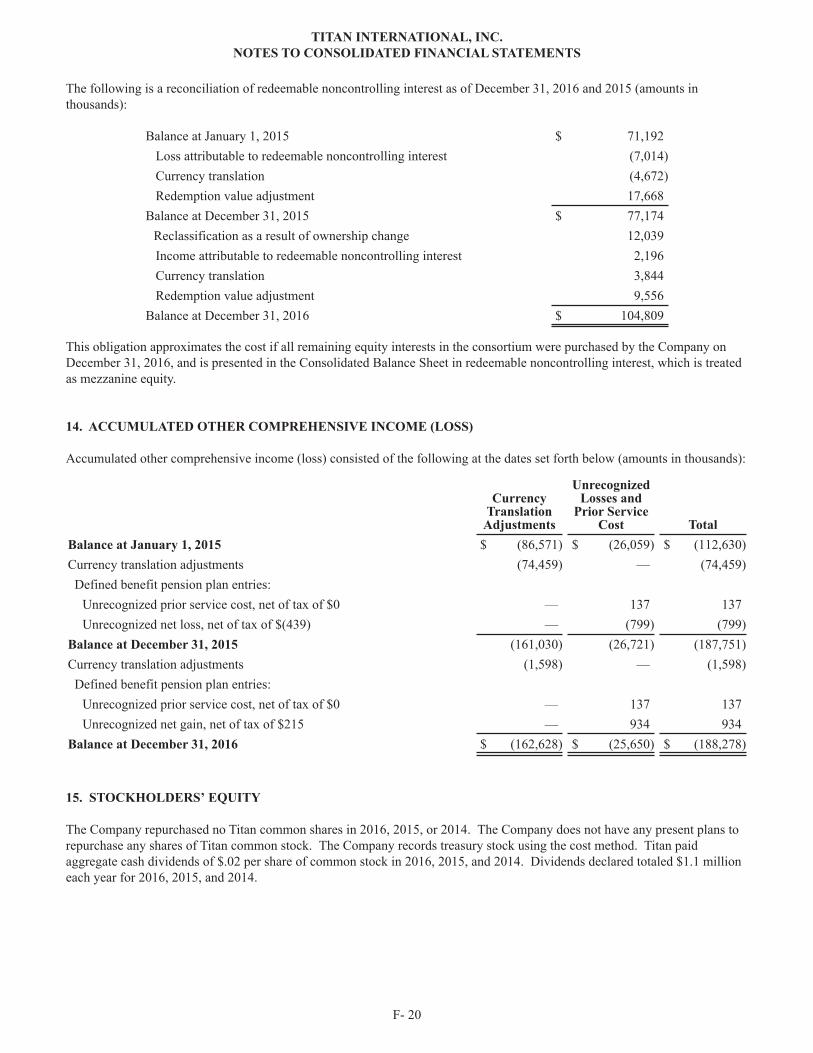
The following is a reconciliation of redeemable noncontrolling interest as of December 31, 2016 and 2015 (amounts inthousands):
Balance at January 1, 2015 $ 71,192 Loss attributable to redeemable noncontrolling interest (7,014) Currency translation (4,672) Redemption value adjustment 17,668Balance at December 31, 2015 $ 77,174
Reclassification as a result of ownership change 12,039 Income attributable to redeemable noncontrolling interest 2,196 Currency translation 3,844 Redemption value adjustment 9,556Balance at December 31, 2016 $ 104,809
This obligation approximates the cost if all remaining equity interests in the consortium were purchased by the Company onDecember 31, 2016, and is presented in the Consolidated Balance Sheet in redeemable noncontrolling interest, which is treatedas mezzanine equity.
TITAN INTERNATIONAL, INC.NOTES TO CONSOLIDATED FINANCIAL STATEMENTS
F- 20
14. ACCUMULATED OTHER COMPREHENSIVE INCOME (LOSS)
Accumulated other comprehensive income (loss) consisted of the following at the dates set forth below (amounts in thousands):
CurrencyTranslation
Adjustments
UnrecognizedLosses and
Prior ServiceCost
TotalBalance at January 1, 2015 $ (86,571) $ (26,059) $ (112,630)Currency translation adjustments (74,459) — (74,459) Defined benefit pension plan entries:
Unrecognized prior service cost, net of tax of $0 — 137 137 Unrecognized net loss, net of tax of $(439) — (799) (799)
Balance at December 31, 2015 (161,030) (26,721) (187,751)Currency translation adjustments (1,598) — (1,598) Defined benefit pension plan entries:
Unrecognized prior service cost, net of tax of $0 — 137 137 Unrecognized net gain, net of tax of $215 — 934 934
Balance at December 31, 2016 $ (162,628) $ (25,650) $ (188,278)
15. STOCKHOLDERS’ EQUITY
The Company repurchased no Titan common shares in 2016, 2015, or 2014. The Company does not have any present plans torepurchase any shares of Titan common stock. The Company records treasury stock using the cost method. Titan paidaggregate cash dividends of $.02 per share of common stock in 2016, 2015, and 2014. Dividends declared totaled $1.1 millioneach year for 2016, 2015, and 2014.

16. FAIR VALUE MEASUREMENTS
Accounting standards for fair value measurements establish a three-tier fair value hierarchy, which prioritizes the inputs used inmeasuring fair value. These tiers are defined as:
Level 1 – Quoted prices in active markets for identical instruments.
Level 2 – Inputs other than quoted prices in active markets that are either directly or indirectly observable.
Level 3 – Unobservable inputs for which little or no market data exists, therefore requiring an entity to develop its ownassumptions.
Assets and liabilities measured at fair value on a recurring basis consisted of the following at the dates set forth below (amountsin thousands):
December 31, 2016 December 31, 2015Total Level 1 Level 2 Level 3 Total Level 1 Level 2 Level 3
Investments for deferredcompensation $ 9,668 $ 9,668 $ — $ — $ 9,480 $ 9,480 $ — $ —Derivative financialinstruments asset 988 — 988 — 66 — 66 —Preferred stock 181 — — 181 250 — — 250Derivative financialinstruments liability — — — — (8) — (8) —
Total $ 10,837 $ 9,668 $ 988 $ 181 $ 9,788 $ 9,480 $ 58 $ 250
The following table presents the changes during the periods presented in Titan's Level 3 investments that are measured at fairvalue on a recurring basis (amounts in thousands):
Preferredstock
Balance at December 31, 2014 $ 250 Total realized and unrealized gains and losses —Balance at December 31, 2015 250 Total unrealized losses (69)Balance as of December 31, 2016 $ 181
The preferred stock was valued based on the book value of the common stock into which it can be converted.
TITAN INTERNATIONAL, INC.NOTES TO CONSOLIDATED FINANCIAL STATEMENTS
F- 21
17. VARIABLE INTEREST ENTITIES
The Company holds a variable interest in three joint ventures for which the Company is the primary beneficiary. Two of thejoint ventures operate distribution facilities which primarily distribute mining products. Titan is the 50% owner of one of thesedistribution facilities, which is located in Canada, and the 40% owner of the other such facility, which is located in Australia.The Company’s variable interest in these joint ventures relates to sales of Titan product to these entities, consigned inventoryand working capital loans. Titan has intercompany notes and receivables used for operations of $1.8 million with the Canadianentity and $0.8 million with the Australian entity. The third joint venture is the consortium which owns Voltyre-Prom. Titanowns 43% of the consortium owning Voltyre-Prom, which is subject to a shareholder agreement containing a settlement putoption which may require Titan to purchase the remaining equity interests in the consortium. See Note 13 for additionalinformation.

The Company also holds a variable interest in five other entities for which Titan is the primary beneficiary. Each of theseentities provides specific manufacturing related services at the Company's Tennessee facility. Titan's variable interest in theseentities relates to financial support to the entities through providing many of the assets used by these entities in their business.The Company owns no equity in these entities. Based on a review of applicable guidance, these entities were consolidatedbeginning in 2016. As a result of the consolidation, financial statements as of, and for the year ended December 31, 2016 wereaffected as follows: sales increased by $0.5 million, net income increased by $0.7 million, total assets increased by $1.4million, and noncontrolling interests increased by $1.4 million.
As the primary beneficiary of these variable interest entities (VIEs), the VIEs’ assets, liabilities, and results of operations areincluded in the Company’s consolidated financial statements as of, and for the year ended, December 31, 2016. The otherequity holders’ interests are reflected in “Net loss attributable to noncontrolling interests” in the Consolidated CondensedStatements of Operations and “Noncontrolling interests” in the Consolidated Condensed Balance Sheets.
The following table summarizes the carrying amount of the VIEs’ assets and liabilities included in the Company’s ConsolidatedCondensed Balance Sheets at December 31, 2016 and 2015 (amounts in thousands):
2016 2015Cash and cash equivalents $ 9,396 $ 9,245Inventory 11,445 7,993Other current assets 23,301 13,763Property, plant, and equipment, net 30,448 25,181Other noncurrent assets 4,955 5,179 Total assets $ 79,545 $ 61,361
Current liabilities 22,068 12,850Noncurrent liabilities 5,350 2,865 Total liabilities $ 27,418 $ 15,715
All assets in the above table can only be used to settle obligations of the consolidated VIE. Liabilities are nonrecourseobligations. Amounts presented in the table above are adjusted for intercompany eliminations.
The Company holds a variable interest in certain VIEs which are not consolidated because Titan is not the primary beneficiary.The Company's involvement with these entities is in the form of direct equity interests and prepayments and purchases ofmaterials. The maximum exposure to loss represents the loss of assets recognized by Titan relating to non-consolidated entitiesand amounts due to the non-consolidated assets. The assets and liabilities recognized in Titan's Consolidated Balance Sheetsrelated to Titan's interest in these non-consolidated VIEs and the Company's maximum exposure to loss relating to non-consolidated VIEs were as follows at December 31, 2016 and 2015 (amounts in thousands):
2016 2015Investments $ 4,738 $ 3,576Other current assets 1,039 — Total VIE assets 5,777 3,576Accounts payable 932 — Maximum exposure to loss $ 6,709 $ 3,576
TITAN INTERNATIONAL, INC.NOTES TO CONSOLIDATED FINANCIAL STATEMENTS
F- 22
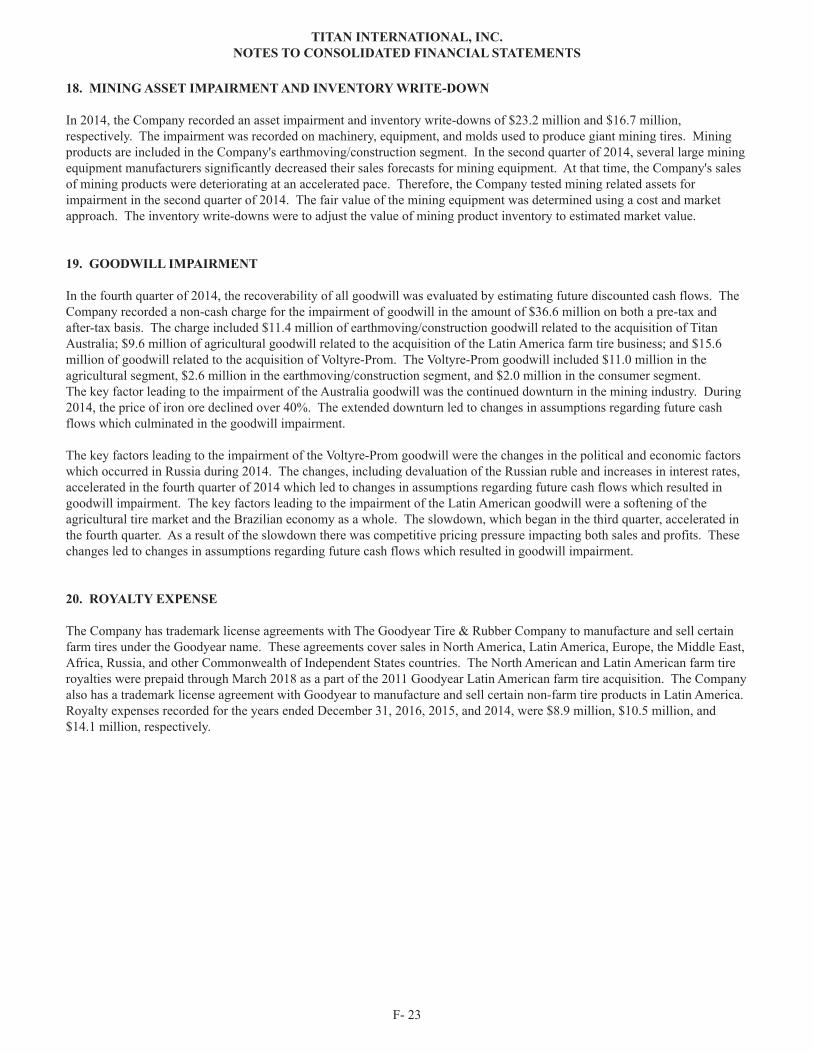
18. MINING ASSET IMPAIRMENT AND INVENTORY WRITE-DOWN
In 2014, the Company recorded an asset impairment and inventory write-downs of $23.2 million and $16.7 million,respectively. The impairment was recorded on machinery, equipment, and molds used to produce giant mining tires. Miningproducts are included in the Company's earthmoving/construction segment. In the second quarter of 2014, several large miningequipment manufacturers significantly decreased their sales forecasts for mining equipment. At that time, the Company's salesof mining products were deteriorating at an accelerated pace. Therefore, the Company tested mining related assets forimpairment in the second quarter of 2014. The fair value of the mining equipment was determined using a cost and marketapproach. The inventory write-downs were to adjust the value of mining product inventory to estimated market value.
TITAN INTERNATIONAL, INC.NOTES TO CONSOLIDATED FINANCIAL STATEMENTS
F- 23
19. GOODWILL IMPAIRMENT
In the fourth quarter of 2014, the recoverability of all goodwill was evaluated by estimating future discounted cash flows. TheCompany recorded a non-cash charge for the impairment of goodwill in the amount of $36.6 million on both a pre-tax andafter-tax basis. The charge included $11.4 million of earthmoving/construction goodwill related to the acquisition of TitanAustralia; $9.6 million of agricultural goodwill related to the acquisition of the Latin America farm tire business; and $15.6million of goodwill related to the acquisition of Voltyre-Prom. The Voltyre-Prom goodwill included $11.0 million in theagricultural segment, $2.6 million in the earthmoving/construction segment, and $2.0 million in the consumer segment.The key factor leading to the impairment of the Australia goodwill was the continued downturn in the mining industry. During2014, the price of iron ore declined over 40%. The extended downturn led to changes in assumptions regarding future cashflows which culminated in the goodwill impairment.
The key factors leading to the impairment of the Voltyre-Prom goodwill were the changes in the political and economic factorswhich occurred in Russia during 2014. The changes, including devaluation of the Russian ruble and increases in interest rates,accelerated in the fourth quarter of 2014 which led to changes in assumptions regarding future cash flows which resulted ingoodwill impairment. The key factors leading to the impairment of the Latin American goodwill were a softening of theagricultural tire market and the Brazilian economy as a whole. The slowdown, which began in the third quarter, accelerated inthe fourth quarter. As a result of the slowdown there was competitive pricing pressure impacting both sales and profits. Thesechanges led to changes in assumptions regarding future cash flows which resulted in goodwill impairment.
20. ROYALTY EXPENSE
The Company has trademark license agreements with The Goodyear Tire & Rubber Company to manufacture and sell certainfarm tires under the Goodyear name. These agreements cover sales in North America, Latin America, Europe, the Middle East,Africa, Russia, and other Commonwealth of Independent States countries. The North American and Latin American farm tireroyalties were prepaid through March 2018 as a part of the 2011 Goodyear Latin American farm tire acquisition. The Companyalso has a trademark license agreement with Goodyear to manufacture and sell certain non-farm tire products in Latin America.Royalty expenses recorded for the years ended December 31, 2016, 2015, and 2014, were $8.9 million, $10.5 million, and$14.1 million, respectively.

21. OTHER INCOME (EXPENSE)
Other income (expense) consisted of the following for the years set forth below (amounts in thousands):
2016 2015 2014Interest income $ 3,206 $ 2,667 $ 3,038Wheels India Limited equity income 3,016 1,790 2,108Gain on sale of assets 2,342 2,418 3,438Building rental income 2,109 936 903Discount amortization on prepaid royalty 1,491 1,956 2,712Investment gain (loss) related to contractual obligation investments 190 (361) 1,116Other income 112 1,657 343
$ 12,466 $ 11,063 $ 13,658
TITAN INTERNATIONAL, INC.NOTES TO CONSOLIDATED FINANCIAL STATEMENTS
F- 24
22. INCOME TAXES
Income (loss) before income taxes, consisted of the following for the years set forth below (amounts in thousands):
2016 2015 2014Domestic $ (52,716) $ (31,810) $ (47,730)Foreign 19,860 (20,196) (104,514)
$ (32,856) $ (52,006) $ (152,244)
The income tax provision (benefit) was as follows for the years set forth below (amounts in thousands):
2016 2015 2014Current
Federal $ (2,040) $ 3,143 $ (2,753)State (62) 55 258Foreign 6,063 7,114 5,476
3,961 10,312 2,981Deferred
Federal — 28,283 (11,670)State — 3,599 (1,205)Foreign (680) (3,913) (11,925)
(680) 27,969 (24,800)Income tax provision (benefit) $ 3,281 $ 38,281 $ (21,819)
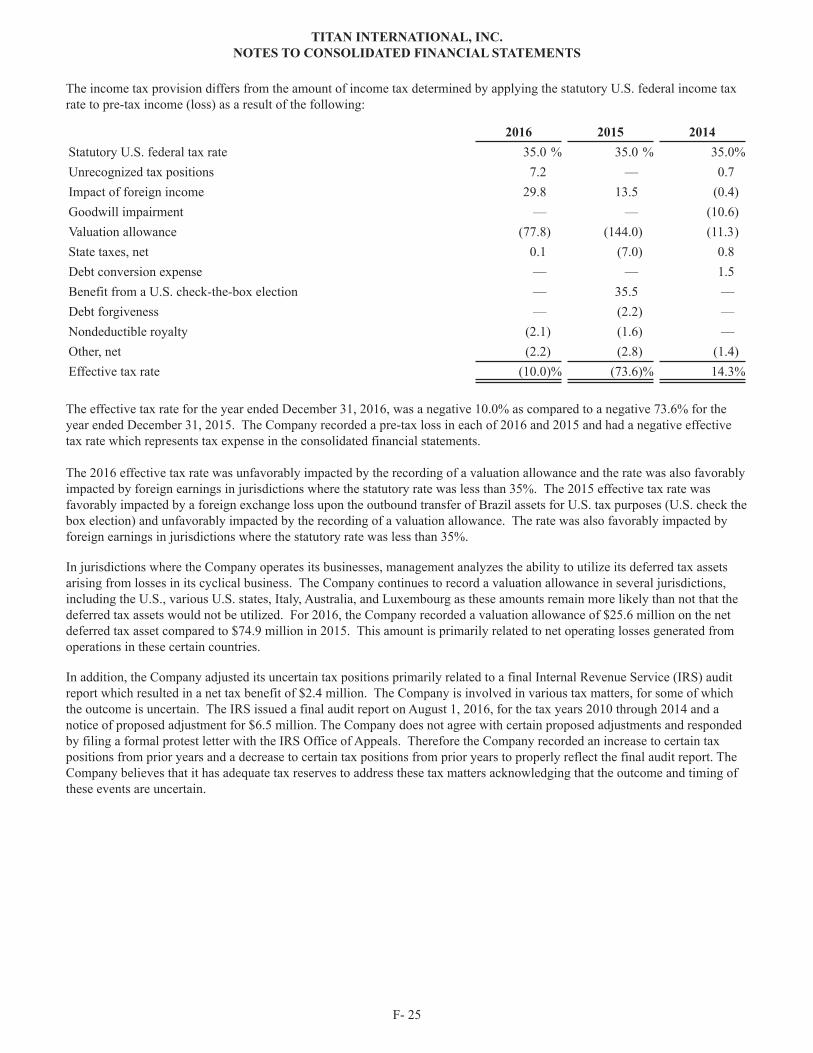
The income tax provision differs from the amount of income tax determined by applying the statutory U.S. federal income taxrate to pre-tax income (loss) as a result of the following:
2016 2015 2014Statutory U.S. federal tax rate 35.0 % 35.0 % 35.0%Unrecognized tax positions 7.2 — 0.7Impact of foreign income 29.8 13.5 (0.4)Goodwill impairment — — (10.6)Valuation allowance (77.8) (144.0) (11.3)State taxes, net 0.1 (7.0) 0.8Debt conversion expense — — 1.5Benefit from a U.S. check-the-box election — 35.5 —Debt forgiveness — (2.2) —Nondeductible royalty (2.1) (1.6) —Other, net (2.2) (2.8) (1.4)Effective tax rate (10.0)% (73.6)% 14.3%
The effective tax rate for the year ended December 31, 2016, was a negative 10.0% as compared to a negative 73.6% for theyear ended December 31, 2015. The Company recorded a pre-tax loss in each of 2016 and 2015 and had a negative effectivetax rate which represents tax expense in the consolidated financial statements.
The 2016 effective tax rate was unfavorably impacted by the recording of a valuation allowance and the rate was also favorablyimpacted by foreign earnings in jurisdictions where the statutory rate was less than 35%. The 2015 effective tax rate wasfavorably impacted by a foreign exchange loss upon the outbound transfer of Brazil assets for U.S. tax purposes (U.S. check thebox election) and unfavorably impacted by the recording of a valuation allowance. The rate was also favorably impacted byforeign earnings in jurisdictions where the statutory rate was less than 35%. In jurisdictions where the Company operates its businesses, management analyzes the ability to utilize its deferred tax assetsarising from losses in its cyclical business. The Company continues to record a valuation allowance in several jurisdictions,including the U.S., various U.S. states, Italy, Australia, and Luxembourg as these amounts remain more likely than not that thedeferred tax assets would not be utilized. For 2016, the Company recorded a valuation allowance of $25.6 million on the netdeferred tax asset compared to $74.9 million in 2015. This amount is primarily related to net operating losses generated fromoperations in these certain countries. In addition, the Company adjusted its uncertain tax positions primarily related to a final Internal Revenue Service (IRS) auditreport which resulted in a net tax benefit of $2.4 million. The Company is involved in various tax matters, for some of whichthe outcome is uncertain. The IRS issued a final audit report on August 1, 2016, for the tax years 2010 through 2014 and anotice of proposed adjustment for $6.5 million. The Company does not agree with certain proposed adjustments and respondedby filing a formal protest letter with the IRS Office of Appeals. Therefore the Company recorded an increase to certain taxpositions from prior years and a decrease to certain tax positions from prior years to properly reflect the final audit report. TheCompany believes that it has adequate tax reserves to address these tax matters acknowledging that the outcome and timing ofthese events are uncertain.
TITAN INTERNATIONAL, INC.NOTES TO CONSOLIDATED FINANCIAL STATEMENTS
F- 25
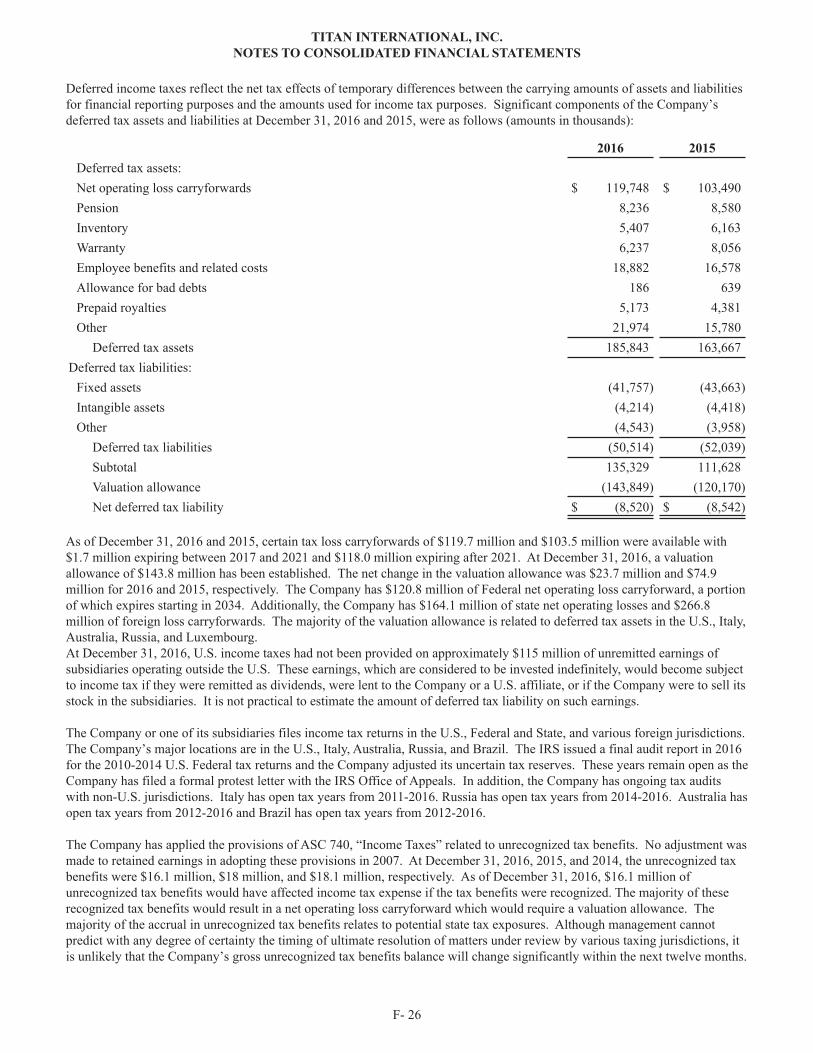
Deferred income taxes reflect the net tax effects of temporary differences between the carrying amounts of assets and liabilitiesfor financial reporting purposes and the amounts used for income tax purposes. Significant components of the Company’sdeferred tax assets and liabilities at December 31, 2016 and 2015, were as follows (amounts in thousands):
2016 2015Deferred tax assets:Net operating loss carryforwards $ 119,748 $ 103,490Pension 8,236 8,580Inventory 5,407 6,163Warranty 6,237 8,056Employee benefits and related costs 18,882 16,578Allowance for bad debts 186 639Prepaid royalties 5,173 4,381Other 21,974 15,780
Deferred tax assets 185,843 163,667Deferred tax liabilities:
Fixed assets (41,757) (43,663)Intangible assets (4,214) (4,418)Other (4,543) (3,958)
Deferred tax liabilities (50,514) (52,039)Subtotal 135,329 111,628Valuation allowance (143,849) (120,170)Net deferred tax liability $ (8,520) $ (8,542)
As of December 31, 2016 and 2015, certain tax loss carryforwards of $119.7 million and $103.5 million were available with$1.7 million expiring between 2017 and 2021 and $118.0 million expiring after 2021. At December 31, 2016, a valuationallowance of $143.8 million has been established. The net change in the valuation allowance was $23.7 million and $74.9million for 2016 and 2015, respectively. The Company has $120.8 million of Federal net operating loss carryforward, a portionof which expires starting in 2034. Additionally, the Company has $164.1 million of state net operating losses and $266.8million of foreign loss carryforwards. The majority of the valuation allowance is related to deferred tax assets in the U.S., Italy,Australia, Russia, and Luxembourg. At December 31, 2016, U.S. income taxes had not been provided on approximately $115 million of unremitted earnings ofsubsidiaries operating outside the U.S. These earnings, which are considered to be invested indefinitely, would become subjectto income tax if they were remitted as dividends, were lent to the Company or a U.S. affiliate, or if the Company were to sell itsstock in the subsidiaries. It is not practical to estimate the amount of deferred tax liability on such earnings.
The Company or one of its subsidiaries files income tax returns in the U.S., Federal and State, and various foreign jurisdictions.The Company’s major locations are in the U.S., Italy, Australia, Russia, and Brazil. The IRS issued a final audit report in 2016for the 2010-2014 U.S. Federal tax returns and the Company adjusted its uncertain tax reserves. These years remain open as theCompany has filed a formal protest letter with the IRS Office of Appeals. In addition, the Company has ongoing tax auditswith non-U.S. jurisdictions. Italy has open tax years from 2011-2016. Russia has open tax years from 2014-2016. Australia hasopen tax years from 2012-2016 and Brazil has open tax years from 2012-2016.
The Company has applied the provisions of ASC 740, “Income Taxes” related to unrecognized tax benefits. No adjustment wasmade to retained earnings in adopting these provisions in 2007. At December 31, 2016, 2015, and 2014, the unrecognized taxbenefits were $16.1 million, $18 million, and $18.1 million, respectively. As of December 31, 2016, $16.1 million ofunrecognized tax benefits would have affected income tax expense if the tax benefits were recognized. The majority of theserecognized tax benefits would result in a net operating loss carryforward which would require a valuation allowance. Themajority of the accrual in unrecognized tax benefits relates to potential state tax exposures. Although management cannotpredict with any degree of certainty the timing of ultimate resolution of matters under review by various taxing jurisdictions, itis unlikely that the Company’s gross unrecognized tax benefits balance will change significantly within the next twelve months.
TITAN INTERNATIONAL, INC.NOTES TO CONSOLIDATED FINANCIAL STATEMENTS
F- 26
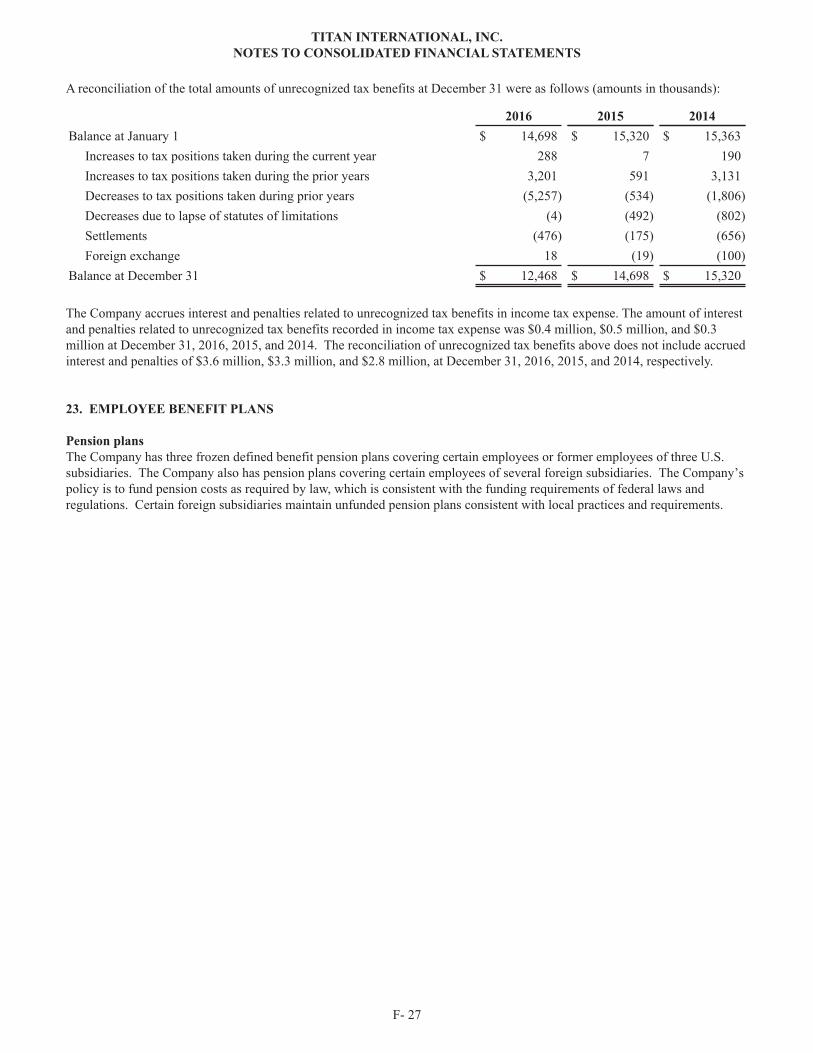
A reconciliation of the total amounts of unrecognized tax benefits at December 31 were as follows (amounts in thousands):
2016 2015 2014Balance at January 1 $ 14,698 $ 15,320 $ 15,363 Increases to tax positions taken during the current year 288 7 190 Increases to tax positions taken during the prior years 3,201 591 3,131 Decreases to tax positions taken during prior years (5,257) (534) (1,806) Decreases due to lapse of statutes of limitations (4) (492) (802) Settlements (476) (175) (656) Foreign exchange 18 (19) (100)Balance at December 31 $ 12,468 $ 14,698 $ 15,320
The Company accrues interest and penalties related to unrecognized tax benefits in income tax expense. The amount of interestand penalties related to unrecognized tax benefits recorded in income tax expense was $0.4 million, $0.5 million, and $0.3million at December 31, 2016, 2015, and 2014. The reconciliation of unrecognized tax benefits above does not include accruedinterest and penalties of $3.6 million, $3.3 million, and $2.8 million, at December 31, 2016, 2015, and 2014, respectively.
TITAN INTERNATIONAL, INC.NOTES TO CONSOLIDATED FINANCIAL STATEMENTS
F- 27
23. EMPLOYEE BENEFIT PLANS
Pension plansThe Company has three frozen defined benefit pension plans covering certain employees or former employees of three U.S.subsidiaries. The Company also has pension plans covering certain employees of several foreign subsidiaries. The Company’spolicy is to fund pension costs as required by law, which is consistent with the funding requirements of federal laws andregulations. Certain foreign subsidiaries maintain unfunded pension plans consistent with local practices and requirements.
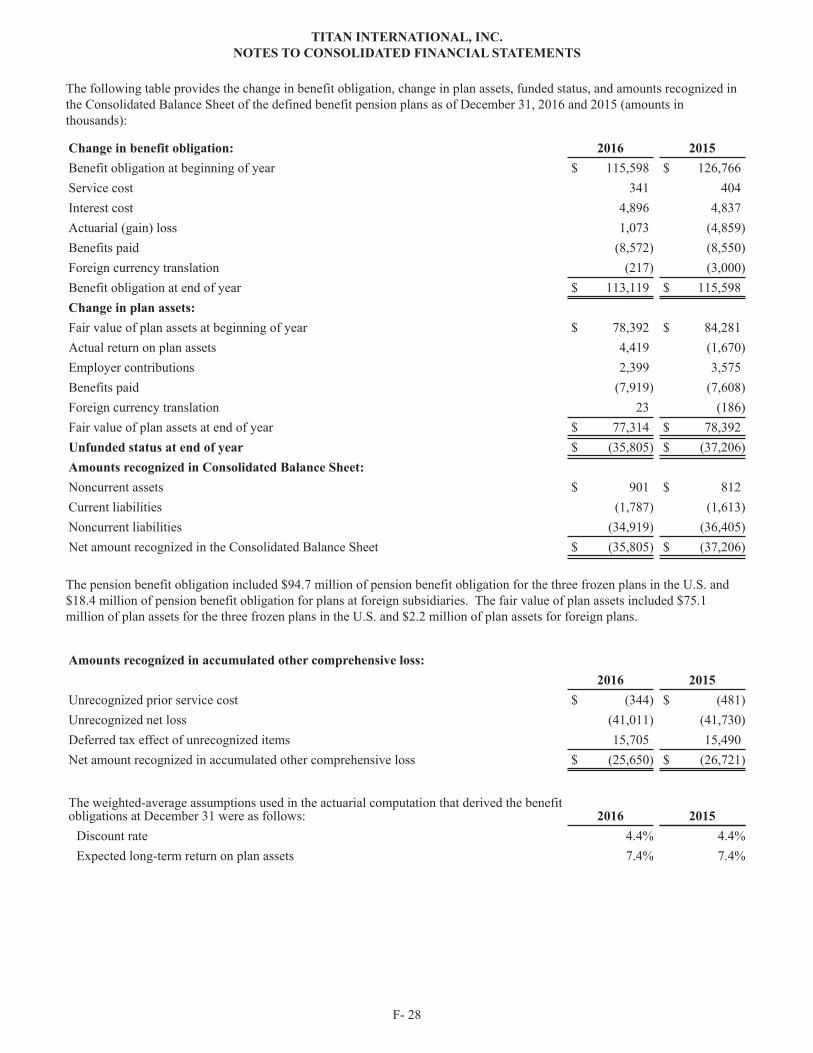
The following table provides the change in benefit obligation, change in plan assets, funded status, and amounts recognized inthe Consolidated Balance Sheet of the defined benefit pension plans as of December 31, 2016 and 2015 (amounts inthousands):
Change in benefit obligation: 2016 2015Benefit obligation at beginning of year $ 115,598 $ 126,766Service cost 341 404Interest cost 4,896 4,837Actuarial (gain) loss 1,073 (4,859)Benefits paid (8,572) (8,550)Foreign currency translation (217) (3,000)Benefit obligation at end of year $ 113,119 $ 115,598Change in plan assets:Fair value of plan assets at beginning of year $ 78,392 $ 84,281Actual return on plan assets 4,419 (1,670)Employer contributions 2,399 3,575Benefits paid (7,919) (7,608)Foreign currency translation 23 (186)Fair value of plan assets at end of year $ 77,314 $ 78,392Unfunded status at end of year $ (35,805) $ (37,206)Amounts recognized in Consolidated Balance Sheet:Noncurrent assets $ 901 $ 812Current liabilities (1,787) (1,613)Noncurrent liabilities (34,919) (36,405)Net amount recognized in the Consolidated Balance Sheet $ (35,805) $ (37,206)
The pension benefit obligation included $94.7 million of pension benefit obligation for the three frozen plans in the U.S. and$18.4 million of pension benefit obligation for plans at foreign subsidiaries. The fair value of plan assets included $75.1million of plan assets for the three frozen plans in the U.S. and $2.2 million of plan assets for foreign plans.
Amounts recognized in accumulated other comprehensive loss:2016 2015
Unrecognized prior service cost $ (344) $ (481)Unrecognized net loss (41,011) (41,730)Deferred tax effect of unrecognized items 15,705 15,490Net amount recognized in accumulated other comprehensive loss $ (25,650) $ (26,721)
The weighted-average assumptions used in the actuarial computation that derived the benefitobligations at December 31 were as follows: 2016 2015
Discount rate 4.4% 4.4%Expected long-term return on plan assets 7.4% 7.4%
TITAN INTERNATIONAL, INC.NOTES TO CONSOLIDATED FINANCIAL STATEMENTS
F- 28
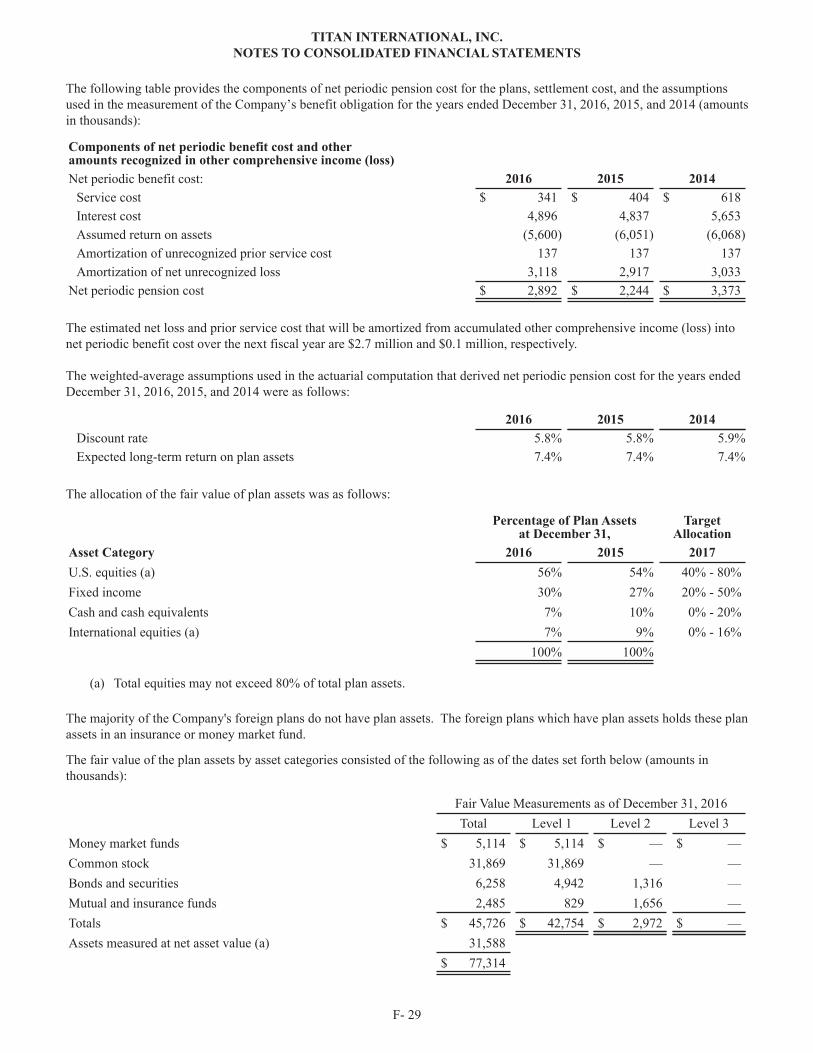
The following table provides the components of net periodic pension cost for the plans, settlement cost, and the assumptionsused in the measurement of the Company’s benefit obligation for the years ended December 31, 2016, 2015, and 2014 (amountsin thousands):
Components of net periodic benefit cost and otheramounts recognized in other comprehensive income (loss)Net periodic benefit cost: 2016 2015 2014
Service cost $ 341 $ 404 $ 618Interest cost 4,896 4,837 5,653Assumed return on assets (5,600) (6,051) (6,068)Amortization of unrecognized prior service cost 137 137 137Amortization of net unrecognized loss 3,118 2,917 3,033
Net periodic pension cost $ 2,892 $ 2,244 $ 3,373
The estimated net loss and prior service cost that will be amortized from accumulated other comprehensive income (loss) intonet periodic benefit cost over the next fiscal year are $2.7 million and $0.1 million, respectively.
The weighted-average assumptions used in the actuarial computation that derived net periodic pension cost for the years endedDecember 31, 2016, 2015, and 2014 were as follows:
2016 2015 2014Discount rate 5.8% 5.8% 5.9%Expected long-term return on plan assets 7.4% 7.4% 7.4%
The allocation of the fair value of plan assets was as follows:
Percentage of Plan Assetsat December 31,
TargetAllocation
Asset Category 2016 2015 2017U.S. equities (a) 56% 54% 40% - 80%Fixed income 30% 27% 20% - 50%Cash and cash equivalents 7% 10% 0% - 20%International equities (a) 7% 9% 0% - 16%
100% 100%
(a) Total equities may not exceed 80% of total plan assets.
The majority of the Company's foreign plans do not have plan assets. The foreign plans which have plan assets holds these planassets in an insurance or money market fund.
The fair value of the plan assets by asset categories consisted of the following as of the dates set forth below (amounts inthousands):
Fair Value Measurements as of December 31, 2016Total Level 1 Level 2 Level 3
Money market funds $ 5,114 $ 5,114 $ — $ —Common stock 31,869 31,869 — —Bonds and securities 6,258 4,942 1,316 —Mutual and insurance funds 2,485 829 1,656 —Totals $ 45,726 $ 42,754 $ 2,972 $ —Assets measured at net asset value (a) 31,588
$ 77,314
TITAN INTERNATIONAL, INC.NOTES TO CONSOLIDATED FINANCIAL STATEMENTS
F- 29
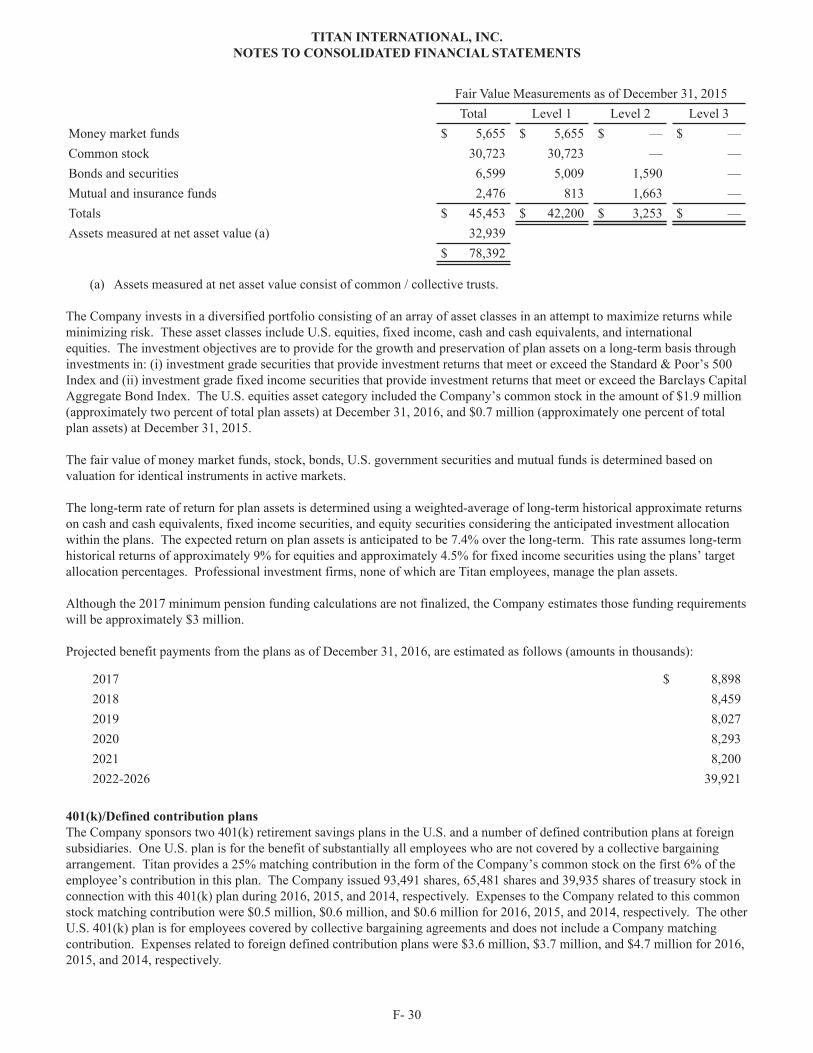
Fair Value Measurements as of December 31, 2015Total Level 1 Level 2 Level 3
Money market funds $ 5,655 $ 5,655 $ — $ —Common stock 30,723 30,723 — —Bonds and securities 6,599 5,009 1,590 —Mutual and insurance funds 2,476 813 1,663 —Totals $ 45,453 $ 42,200 $ 3,253 $ —Assets measured at net asset value (a) 32,939
$ 78,392
(a) Assets measured at net asset value consist of common / collective trusts. The Company invests in a diversified portfolio consisting of an array of asset classes in an attempt to maximize returns whileminimizing risk. These asset classes include U.S. equities, fixed income, cash and cash equivalents, and internationalequities. The investment objectives are to provide for the growth and preservation of plan assets on a long-term basis throughinvestments in: (i) investment grade securities that provide investment returns that meet or exceed the Standard & Poor’s 500Index and (ii) investment grade fixed income securities that provide investment returns that meet or exceed the Barclays CapitalAggregate Bond Index. The U.S. equities asset category included the Company’s common stock in the amount of $1.9 million(approximately two percent of total plan assets) at December 31, 2016, and $0.7 million (approximately one percent of totalplan assets) at December 31, 2015.
The fair value of money market funds, stock, bonds, U.S. government securities and mutual funds is determined based onvaluation for identical instruments in active markets.
The long-term rate of return for plan assets is determined using a weighted-average of long-term historical approximate returnson cash and cash equivalents, fixed income securities, and equity securities considering the anticipated investment allocationwithin the plans. The expected return on plan assets is anticipated to be 7.4% over the long-term. This rate assumes long-termhistorical returns of approximately 9% for equities and approximately 4.5% for fixed income securities using the plans’ targetallocation percentages. Professional investment firms, none of which are Titan employees, manage the plan assets.
Although the 2017 minimum pension funding calculations are not finalized, the Company estimates those funding requirementswill be approximately $3 million.
Projected benefit payments from the plans as of December 31, 2016, are estimated as follows (amounts in thousands):
2017 $ 8,8982018 8,4592019 8,0272020 8,2932021 8,2002022-2026 39,921
401(k)/Defined contribution plansThe Company sponsors two 401(k) retirement savings plans in the U.S. and a number of defined contribution plans at foreignsubsidiaries. One U.S. plan is for the benefit of substantially all employees who are not covered by a collective bargainingarrangement. Titan provides a 25% matching contribution in the form of the Company’s common stock on the first 6% of theemployee’s contribution in this plan. The Company issued 93,491 shares, 65,481 shares and 39,935 shares of treasury stock inconnection with this 401(k) plan during 2016, 2015, and 2014, respectively. Expenses to the Company related to this commonstock matching contribution were $0.5 million, $0.6 million, and $0.6 million for 2016, 2015, and 2014, respectively. The otherU.S. 401(k) plan is for employees covered by collective bargaining agreements and does not include a Company matchingcontribution. Expenses related to foreign defined contribution plans were $3.6 million, $3.7 million, and $4.7 million for 2016,2015, and 2014, respectively.
TITAN INTERNATIONAL, INC.NOTES TO CONSOLIDATED FINANCIAL STATEMENTS
F- 30
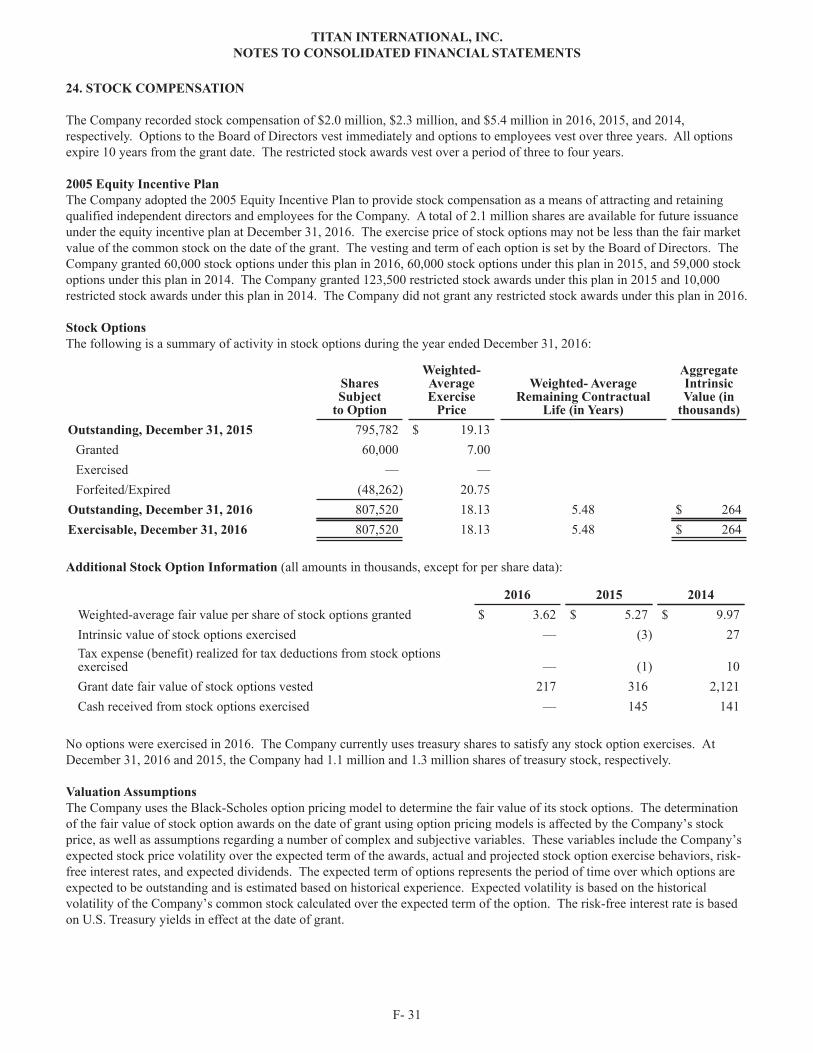
24. STOCK COMPENSATION
The Company recorded stock compensation of $2.0 million, $2.3 million, and $5.4 million in 2016, 2015, and 2014,respectively. Options to the Board of Directors vest immediately and options to employees vest over three years. All optionsexpire 10 years from the grant date. The restricted stock awards vest over a period of three to four years.
2005 Equity Incentive PlanThe Company adopted the 2005 Equity Incentive Plan to provide stock compensation as a means of attracting and retainingqualified independent directors and employees for the Company. A total of 2.1 million shares are available for future issuanceunder the equity incentive plan at December 31, 2016. The exercise price of stock options may not be less than the fair marketvalue of the common stock on the date of the grant. The vesting and term of each option is set by the Board of Directors. TheCompany granted 60,000 stock options under this plan in 2016, 60,000 stock options under this plan in 2015, and 59,000 stockoptions under this plan in 2014. The Company granted 123,500 restricted stock awards under this plan in 2015 and 10,000restricted stock awards under this plan in 2014. The Company did not grant any restricted stock awards under this plan in 2016.
Stock OptionsThe following is a summary of activity in stock options during the year ended December 31, 2016:
SharesSubject
to Option
Weighted-AverageExercise
Price
Weighted- AverageRemaining Contractual
Life (in Years)
AggregateIntrinsicValue (in
thousands)Outstanding, December 31, 2015 795,782 $ 19.13
Granted 60,000 7.00Exercised — —Forfeited/Expired (48,262) 20.75
Outstanding, December 31, 2016 807,520 18.13 5.48 $ 264Exercisable, December 31, 2016 807,520 18.13 5.48 $ 264 Additional Stock Option Information (all amounts in thousands, except for per share data):
2016 2015 2014Weighted-average fair value per share of stock options granted $ 3.62 $ 5.27 $ 9.97Intrinsic value of stock options exercised — (3) 27Tax expense (benefit) realized for tax deductions from stock optionsexercised — (1) 10Grant date fair value of stock options vested 217 316 2,121Cash received from stock options exercised — 145 141
No options were exercised in 2016. The Company currently uses treasury shares to satisfy any stock option exercises. AtDecember 31, 2016 and 2015, the Company had 1.1 million and 1.3 million shares of treasury stock, respectively.
Valuation AssumptionsThe Company uses the Black-Scholes option pricing model to determine the fair value of its stock options. The determinationof the fair value of stock option awards on the date of grant using option pricing models is affected by the Company’s stockprice, as well as assumptions regarding a number of complex and subjective variables. These variables include the Company’sexpected stock price volatility over the expected term of the awards, actual and projected stock option exercise behaviors, risk-free interest rates, and expected dividends. The expected term of options represents the period of time over which options areexpected to be outstanding and is estimated based on historical experience. Expected volatility is based on the historicalvolatility of the Company’s common stock calculated over the expected term of the option. The risk-free interest rate is basedon U.S. Treasury yields in effect at the date of grant.
TITAN INTERNATIONAL, INC.NOTES TO CONSOLIDATED FINANCIAL STATEMENTS
F- 31

Weighted average assumptions used for stock options issued in 2016, 2015, and 2014:
2016 2015 2014Expected life (in years) 6.0 6.0 6.0Expected volatility 53.3% 49.4% 67.8%Expected dividends 0.1% 0.1% 0.1%Risk-free interest rate 1.33% 1.78% 1.8%
Restricted Stock
Shares
Weighted AverageGrant Date Fair
ValueUnvested at December 31, 2015 338,875 16.22 Granted — — Vested (159,130) 18.08 Forfeited/Expired (26,175) 12.49Unvested at December 31, 2016 153,570 14.92
Pre-tax unrecognized compensation expense for unvested restricted stock was $1.2 million at December 31, 2016, and will berecognized as an expense over a weighted-average period of 1.2 years.
The fair value of restricted stock vested, based on the stock's fair value on the vesting date, was $1.6 million, $0.4 million, and$1.4 million for the years ended December 31, 2016, 2015, and 2014, respectively.
TITAN INTERNATIONAL, INC.NOTES TO CONSOLIDATED FINANCIAL STATEMENTS
F- 32
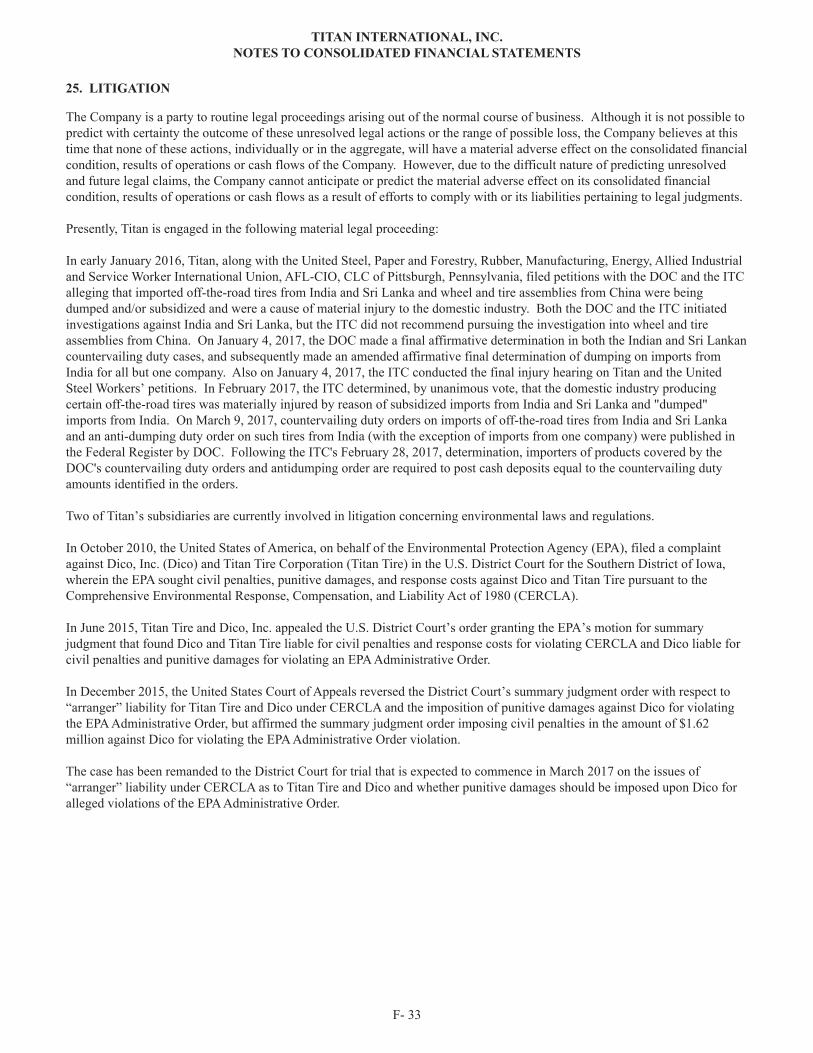
25. LITIGATION The Company is a party to routine legal proceedings arising out of the normal course of business. Although it is not possible topredict with certainty the outcome of these unresolved legal actions or the range of possible loss, the Company believes at thistime that none of these actions, individually or in the aggregate, will have a material adverse effect on the consolidated financialcondition, results of operations or cash flows of the Company. However, due to the difficult nature of predicting unresolvedand future legal claims, the Company cannot anticipate or predict the material adverse effect on its consolidated financialcondition, results of operations or cash flows as a result of efforts to comply with or its liabilities pertaining to legal judgments.
Presently, Titan is engaged in the following material legal proceeding:
In early January 2016, Titan, along with the United Steel, Paper and Forestry, Rubber, Manufacturing, Energy, Allied Industrialand Service Worker International Union, AFL-CIO, CLC of Pittsburgh, Pennsylvania, filed petitions with the DOC and the ITCalleging that imported off-the-road tires from India and Sri Lanka and wheel and tire assemblies from China were beingdumped and/or subsidized and were a cause of material injury to the domestic industry. Both the DOC and the ITC initiatedinvestigations against India and Sri Lanka, but the ITC did not recommend pursuing the investigation into wheel and tireassemblies from China. On January 4, 2017, the DOC made a final affirmative determination in both the Indian and Sri Lankancountervailing duty cases, and subsequently made an amended affirmative final determination of dumping on imports fromIndia for all but one company. Also on January 4, 2017, the ITC conducted the final injury hearing on Titan and the UnitedSteel Workers’ petitions. In February 2017, the ITC determined, by unanimous vote, that the domestic industry producingcertain off-the-road tires was materially injured by reason of subsidized imports from India and Sri Lanka and "dumped"imports from India. On March 9, 2017, countervailing duty orders on imports of off-the-road tires from India and Sri Lankaand an anti-dumping duty order on such tires from India (with the exception of imports from one company) were published inthe Federal Register by DOC. Following the ITC's February 28, 2017, determination, importers of products covered by theDOC's countervailing duty orders and antidumping order are required to post cash deposits equal to the countervailing dutyamounts identified in the orders.
Two of Titan’s subsidiaries are currently involved in litigation concerning environmental laws and regulations.
In October 2010, the United States of America, on behalf of the Environmental Protection Agency (EPA), filed a complaintagainst Dico, Inc. (Dico) and Titan Tire Corporation (Titan Tire) in the U.S. District Court for the Southern District of Iowa,wherein the EPA sought civil penalties, punitive damages, and response costs against Dico and Titan Tire pursuant to theComprehensive Environmental Response, Compensation, and Liability Act of 1980 (CERCLA).
In June 2015, Titan Tire and Dico, Inc. appealed the U.S. District Court’s order granting the EPA’s motion for summaryjudgment that found Dico and Titan Tire liable for civil penalties and response costs for violating CERCLA and Dico liable forcivil penalties and punitive damages for violating an EPA Administrative Order.
In December 2015, the United States Court of Appeals reversed the District Court’s summary judgment order with respect to“arranger” liability for Titan Tire and Dico under CERCLA and the imposition of punitive damages against Dico for violatingthe EPA Administrative Order, but affirmed the summary judgment order imposing civil penalties in the amount of $1.62million against Dico for violating the EPA Administrative Order violation.
The case has been remanded to the District Court for trial that is expected to commence in March 2017 on the issues of“arranger” liability under CERCLA as to Titan Tire and Dico and whether punitive damages should be imposed upon Dico foralleged violations of the EPA Administrative Order.
TITAN INTERNATIONAL, INC.NOTES TO CONSOLIDATED FINANCIAL STATEMENTS
F- 33
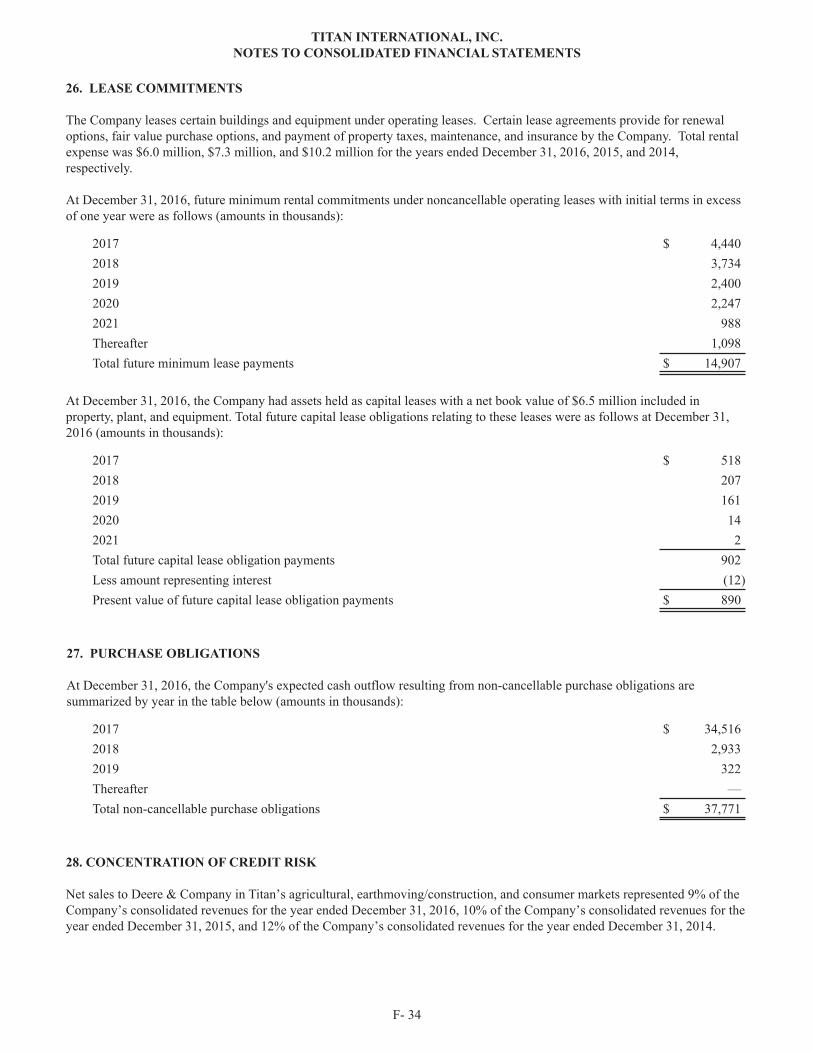
26. LEASE COMMITMENTS
The Company leases certain buildings and equipment under operating leases. Certain lease agreements provide for renewaloptions, fair value purchase options, and payment of property taxes, maintenance, and insurance by the Company. Total rentalexpense was $6.0 million, $7.3 million, and $10.2 million for the years ended December 31, 2016, 2015, and 2014,respectively.
At December 31, 2016, future minimum rental commitments under noncancellable operating leases with initial terms in excessof one year were as follows (amounts in thousands):
2017 $ 4,4402018 3,7342019 2,4002020 2,2472021 988Thereafter 1,098Total future minimum lease payments $ 14,907
At December 31, 2016, the Company had assets held as capital leases with a net book value of $6.5 million included inproperty, plant, and equipment. Total future capital lease obligations relating to these leases were as follows at December 31,2016 (amounts in thousands):
2017 $ 5182018 2072019 1612020 142021 2Total future capital lease obligation payments 902Less amount representing interest (12)Present value of future capital lease obligation payments $ 890
TITAN INTERNATIONAL, INC.NOTES TO CONSOLIDATED FINANCIAL STATEMENTS
F- 34
27. PURCHASE OBLIGATIONS
At December 31, 2016, the Company's expected cash outflow resulting from non-cancellable purchase obligations aresummarized by year in the table below (amounts in thousands):
2017 $ 34,5162018 2,9332019 322Thereafter —Total non-cancellable purchase obligations $ 37,771
28. CONCENTRATION OF CREDIT RISK
Net sales to Deere & Company in Titan’s agricultural, earthmoving/construction, and consumer markets represented 9% of theCompany’s consolidated revenues for the year ended December 31, 2016, 10% of the Company’s consolidated revenues for theyear ended December 31, 2015, and 12% of the Company’s consolidated revenues for the year ended December 31, 2014.
29. RELATED PARTY TRANSACTIONS
The Company sells products and pays commissions to companies controlled by persons related to the Chairman of theCompany, Mr. Maurice Taylor. The related party is Mr. Fred Taylor, who is Mr. Maurice Taylor’s brother. The companieswhich Mr. Fred Taylor is associated with that do business with Titan include the following: Blackstone OTR, LLC; FBTEnterprises; Green Carbon, INC; Silverstone, Inc.; and OTR Wheel Engineering. During 2016, 2015, and 2014, sales of Titanproduct to these companies were approximately $0.9 million, $1.7 million, and $2.6 million, respectively. Titan had tradereceivables due from these companies of approximately $0.1 million at December 31, 2016, and approximately $0.2 million atDecember 31, 2015. On other sales referred to Titan from these manufacturing representative companies, commissions wereapproximately $1.8 million, $2.0 million, and $2.4 million during 2016, 2015, and 2014, respectively. Titan had purchasesfrom these companies of approximately $0.7 million, $4.7 million, and $9.9 million during 2016, 2015, and 2014, respectively.
In July 2013, the Company entered into a Shareholders’ Agreement between OEP and RDIF to acquire Voltyre-Prom, a leadingproducer of agricultural and industrial tires located in Volgograd, Russia. Mr. Richard M. Cashin Jr., a director of the Company,is the President of OEP, which owns 21.4% of the joint venture. The Shareholder’s agreement contains a settlement put optionwhich may require the Company to purchase equity interests in the joint venture from OEP and RDIF at a value set by theagreement. See Note 13 for additional information.
The Company has a 34.2% equity stake in Wheels India Limited, a company incorporated in India and listed on the NationalStock Exchange in India. The Company had trade payables due to Wheels India Limited of approximately $0.1 million atDecember 31, 2016, and approximately $0.0 million at December 31, 2015.
The Company has a 19.5% equity stake in Titan-Yuxiang Wheel (Liuzhou) Co., Ltd, a company incorporated in China. TheCompany had trade payables due to Titan-Yuxiang Wheel (Liuzhou) Co., Ltd of approximately $0.9 million at December 31,2016.
The Company has a 49.0% equity stake in Central Iowa Training and Enrichment Center, LLC, a commercial building locatedin Boone, IA.
TITAN INTERNATIONAL, INC.NOTES TO CONSOLIDATED FINANCIAL STATEMENTS
F- 35
30. SEGMENT AND GEOGRAPHICAL INFORMATION
The Company has aggregated its operating units into reportable segments based on its three customer markets: agricultural,earthmoving/construction, and consumer. These segments are based on the information used by the chief executive officer tomake certain operating decisions, allocate portions of capital expenditures and assess segment performance. The accountingpolicies of the segments are the same as those described in Note 1, “Description of Business and Significant AccountingPolicies.” Segment external revenues, expenses, and income from operations are determined on the basis of the results ofoperations of operating units of manufacturing facilities. Segment assets are generally determined on the basis of the tangibleassets located at such operating units’ manufacturing facilities and the intangible assets associated with the acquisitions of suchoperating units. However, certain operating units’ goodwill and property, plant, and equipment balances are carried at thecorporate level.
Titan is organized primarily on the basis of products being included in three marketing segments, with each reportable segmentincluding wheels, tires, wheel/tire assemblies, and undercarriage systems and components.

The table below presents information about certain operating results of segments as reviewed by the chief operating decisionmaker of the Company as of and for the years ended December 31, 2016, 2015, and 2014 (amounts in thousands):
2016 2015 2014Revenues from external customers
Agricultural $ 583,324 $ 651,804 $ 924,034Earthmoving/construction 524,289 566,988 684,726Consumer 157,884 175,979 286,767
$ 1,265,497 $ 1,394,771 $ 1,895,527Gross profit
Agricultural $ 78,603 $ 75,679 $ 109,547Earthmoving/construction 46,268 42,835 1,656Consumer 17,611 19,295 29,440
$ 142,482 $ 137,809 $ 140,643Income (loss) from operations
Agricultural $ 44,271 $ 40,125 $ 45,724Earthmoving/construction 3,615 (2,038) (69,687)Consumer 2,879 4,689 (1,241)Corporate & Unallocated (72,098) (67,055) (72,421)
Loss from operations (21,333) (24,279) (97,625)
Interest expense (32,539) (34,032) (36,564)Foreign exchange gain (loss) 8,550 (4,758) (31,713)
Other income, net 12,466 11,063 13,658Loss before income taxes $ (32,856) $ (52,006) $ (152,244)
Capital expendituresAgricultural $ 16,260 $ 14,819 $ 20,457Earthmoving/construction 22,028 18,116 18,198Consumer 2,483 3,061 7,239Corporate & Unallocated 1,177 12,433 12,545
$ 41,948 $ 48,429 $ 58,439
Depreciation & amortizationAgricultural $ 27,888 $ 32,274 $ 43,336Earthmoving/construction 20,566 24,124 31,023Consumer 6,145 7,469 8,960Corporate & Unallocated 5,169 5,751 5,385
$ 59,768 $ 69,618 $ 88,704
Total assetsAgricultural $ 436,904 $ 426,498 $ 491,066Earthmoving/construction 443,479 432,616 533,267Consumer 140,216 137,227 167,980Corporate & Unallocated (a) 242,352 273,889 303,411
$ 1,262,951 $ 1,270,230 $ 1,495,724(a) Unallocated assets included cash of approximately $96 million, $143 million, and $133 million at year-end 2016, 2015, and2014, respectively. Unallocated assets included certificates of deposit of $50 million in 2016.
TITAN INTERNATIONAL, INC.NOTES TO CONSOLIDATED FINANCIAL STATEMENTS
F- 36

The table below presents information by geographic area. Revenues from external customers were determined based on thelocation of the selling subsidiary. Geographic information as of and for the years ended December 31, 2016, 2015, and 2014was as follows (amounts in thousands):
2016 2015 2014Net Sales
United States $ 558,278 $ 702,855 $ 957,306Europe 354,117 369,280 454,568Latin America 248,019 236,281 376,987Other international 105,083 86,355 106,666
$ 1,265,497 $ 1,394,771 $ 1,895,527Long-Lived Assets
United States $ 171,587 $ 189,993 $ 227,906Europe 156,505 167,829 191,627Latin America 68,187 59,671 91,867Other international 40,922 32,527 16,014
$ 437,201 $ 450,020 $ 527,414
TITAN INTERNATIONAL, INC.NOTES TO CONSOLIDATED FINANCIAL STATEMENTS
F- 37
31. EARNINGS PER SHARE
Earnings per share for 2016, 2015, and 2014 were (amounts in thousands, except per share data):
2016 2015 2014Net loss attributable to Titan $ (33,987) $ (75,633) $ (80,461) Redemption value adjustment (9,556) (17,668) (49,277)Net loss applicable to common shareholders $ (43,543) $ (93,301) $ (129,738)Determination of Shares: Weighted average shares outstanding (basic) 53,916 53,696 53,497Earnings per share: Basic and Diluted $ (0.81) $ (1.74) $ (2.43)
The effect of stock options/trusts and convertible notes has been excluded for 2016, 2015, and 2014, as the effect would havebeen antidilutive. The weighted average share amount excluded for stock options/trusts was 0.3 million, 0.2 million, and 0.2million for 2016, 2015, and 2014, respectively. The effect of convertible notes has been excluded for 2016, 2015, and 2014, asthe effect would have been antidilutive. The weighted average share amount excluded for convertible notes was 5.6 millioneach year for 2016, 2015, and 2014.
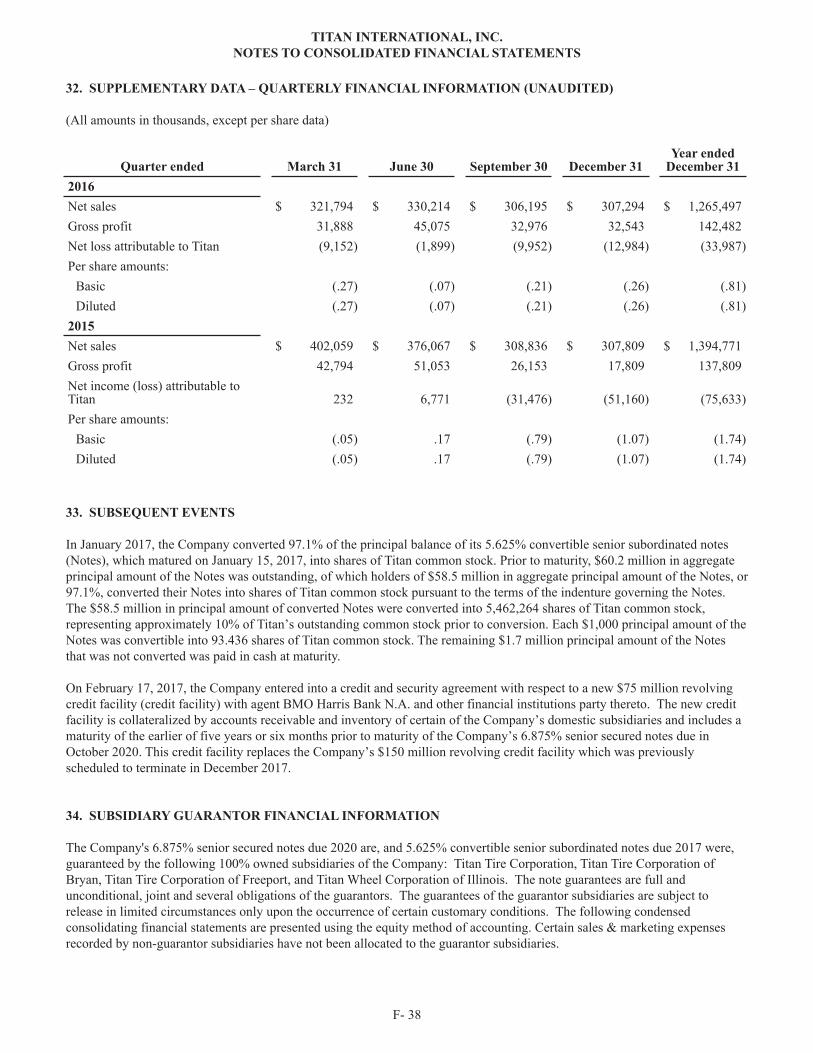
32. SUPPLEMENTARY DATA – QUARTERLY FINANCIAL INFORMATION (UNAUDITED)
(All amounts in thousands, except per share data)
Quarter ended March 31 June 30 September 30 December 31
Year endedDecember 31
2016Net sales $ 321,794 $ 330,214 $ 306,195 $ 307,294 $ 1,265,497Gross profit 31,888 45,075 32,976 32,543 142,482Net loss attributable to Titan (9,152) (1,899) (9,952) (12,984) (33,987)Per share amounts:
Basic (.27) (.07) (.21) (.26) (.81)Diluted (.27) (.07) (.21) (.26) (.81)
2015Net sales $ 402,059 $ 376,067 $ 308,836 $ 307,809 $ 1,394,771Gross profit 42,794 51,053 26,153 17,809 137,809Net income (loss) attributable toTitan 232 6,771 (31,476) (51,160) (75,633)Per share amounts:
Basic (.05) .17 (.79) (1.07) (1.74)Diluted (.05) .17 (.79) (1.07) (1.74)
TITAN INTERNATIONAL, INC.NOTES TO CONSOLIDATED FINANCIAL STATEMENTS
F- 38
33. SUBSEQUENT EVENTS
In January 2017, the Company converted 97.1% of the principal balance of its 5.625% convertible senior subordinated notes(Notes), which matured on January 15, 2017, into shares of Titan common stock. Prior to maturity, $60.2 million in aggregateprincipal amount of the Notes was outstanding, of which holders of $58.5 million in aggregate principal amount of the Notes, or97.1%, converted their Notes into shares of Titan common stock pursuant to the terms of the indenture governing the Notes.The $58.5 million in principal amount of converted Notes were converted into 5,462,264 shares of Titan common stock,representing approximately 10% of Titan’s outstanding common stock prior to conversion. Each $1,000 principal amount of theNotes was convertible into 93.436 shares of Titan common stock. The remaining $1.7 million principal amount of the Notesthat was not converted was paid in cash at maturity.
On February 17, 2017, the Company entered into a credit and security agreement with respect to a new $75 million revolvingcredit facility (credit facility) with agent BMO Harris Bank N.A. and other financial institutions party thereto. The new creditfacility is collateralized by accounts receivable and inventory of certain of the Company’s domestic subsidiaries and includes amaturity of the earlier of five years or six months prior to maturity of the Company’s 6.875% senior secured notes due inOctober 2020. This credit facility replaces the Company’s $150 million revolving credit facility which was previouslyscheduled to terminate in December 2017.
34. SUBSIDIARY GUARANTOR FINANCIAL INFORMATION
The Company's 6.875% senior secured notes due 2020 are, and 5.625% convertible senior subordinated notes due 2017 were,guaranteed by the following 100% owned subsidiaries of the Company: Titan Tire Corporation, Titan Tire Corporation ofBryan, Titan Tire Corporation of Freeport, and Titan Wheel Corporation of Illinois. The note guarantees are full andunconditional, joint and several obligations of the guarantors. The guarantees of the guarantor subsidiaries are subject torelease in limited circumstances only upon the occurrence of certain customary conditions. The following condensedconsolidating financial statements are presented using the equity method of accounting. Certain sales & marketing expensesrecorded by non-guarantor subsidiaries have not been allocated to the guarantor subsidiaries.

(Amounts in thousands)Consolidating Condensed Statements of Operations
Year Ended December 31, 2016Titan
Intl., Inc.(Parent)
GuarantorSubsidiaries
Non-Guarantor
Subsidiaries Eliminations ConsolidatedNet sales $ — $ 498,390 $ 767,107 $ — $ 1,265,497Cost of sales 759 429,087 693,169 — 1,123,015Gross profit (loss) (759) 69,303 73,938 — 142,482Selling, general, and administrative expenses 11,394 66,815 66,779 — 144,988Research and development expenses — 2,876 7,095 — 9,971Royalty expense 667 4,866 3,323 — 8,856Loss from operations (12,820) (5,254) (3,259) — (21,333)Interest expense (32,208) — (331) — (32,539)Intercompany interest income (expense) 1,781 3,525 (5,306) — —Foreign exchange gain — 298 8,252 — 8,550Other income 2,503 180 9,783 — 12,466Income (loss) before income taxes (40,744) (1,251) 9,139 — (32,856)Provision (benefit) for income taxes (64) 30 3,315 — 3,281Equity in earnings of subsidiaries 4,542 — (10,307) 5,765 —Net income (loss) (36,138) (1,281) (4,483) 5,765 (36,137)Net loss noncontrolling interests — — (2,150) — (2,150)Net income (loss) attributable to Titan $ (36,138) $ (1,281) $ (2,333) $ 5,765 $ (33,987)
(Amounts in thousands)Consolidating Condensed Statements of Operations
Year Ended December 31, 2015Titan
Intl., Inc.(Parent)
GuarantorSubsidiaries
Non-Guarantor
Subsidiaries Eliminations ConsolidatedNet sales $ — $ 640,785 $ 753,986 $ — $ 1,394,771Cost of sales 2,826 558,363 695,773 — 1,256,962Gross profit (loss) (2,826) 82,422 58,213 — 137,809Selling, general, and administrative expenses 7,513 69,686 63,194 — 140,393Research and development expenses — 3,505 7,657 — 11,162Royalty expense — 6,711 3,822 — 10,533Income (loss) from operations (10,339) 2,520 (16,460) — (24,279)Interest expense (32,291) — (1,741) — (34,032)Intercompany interest income (expense) 825 2,361 (3,186) — —Foreign exchange gain (loss) 4,296 (462) (8,592) — (4,758)Other income 2,327 2,572 6,164 — 11,063Income (loss) before income taxes (35,182) 6,991 (23,815) — (52,006)Provision for income taxes 34,341 2,007 1,933 — 38,281Equity in earnings of subsidiaries (20,764) — (5,755) 26,519 —Net income (loss) (90,287) 4,984 (31,503) 26,519 (90,287)Net loss noncontrolling interests — — (14,654) — (14,654)Net income (loss) attributable to Titan $ (90,287) $ 4,984 $ (16,849) $ 26,519 $ (75,633)
TITAN INTERNATIONAL, INC.NOTES TO CONSOLIDATED FINANCIAL STATEMENTS
F- 39

(Amounts in thousands)Consolidating Condensed Statements of Operations
Year Ended December 31, 2014Titan
Intl., Inc.(Parent)
GuarantorSubsidiaries
Non-Guarantor
Subsidiaries Eliminations ConsolidatedNet sales $ — $ 879,982 $ 1,015,545 $ — $ 1,895,527Cost of sales 927 800,310 953,647 — 1,754,884Gross profit (loss) (927) 79,672 61,898 — 140,643Selling, general, and administrative expenses 12,887 71,548 89,179 — 173,614Research and development expenses 72 5,309 8,624 — 14,005Royalty expense — 7,620 6,458 — 14,078Noncash goodwill impairment charge — — 36,571 — 36,571Loss from operations (13,886) (4,805) (78,934) — (97,625)Interest expense (32,783) — (3,781) — (36,564)Intercompany interest income (expense) 6,416 2,346 (8,762) — —Foreign exchange gain (loss) 1,056 13 (32,782) — (31,713)Other income 3,202 1 10,455 — 13,658Loss before income taxes (35,995) (2,445) (113,804) — (152,244)Benefit for income taxes (12,765) (374) (8,680) — (21,819)Equity in earnings of subsidiaries (107,195) — (26,213) 133,408 —Net income (loss) (130,425) (2,071) (131,337) 133,408 (130,425)Net loss noncontrolling interests — — (49,964) — (49,964)Net income (loss) attributable to Titan $ (130,425) $ (2,071) $ (81,373) $ 133,408 $ (80,461)
TITAN INTERNATIONAL, INC.NOTES TO CONSOLIDATED FINANCIAL STATEMENTS
F- 40

(Amounts in thousands)Consolidating Condensed Statements of Comprehensive Income (Loss)
For the Year Ended December 31, 2016Titan
Intl., Inc.(Parent)
GuarantorSubsidiaries
Non-Guarantor
Subsidiaries Eliminations ConsolidatedNet income (loss) $ (36,138) $ (1,281) $ (4,483) $ 5,765 $ (36,137)Currency translation adjustment, net 5,857 — 5,857 (5,857) 5,857Pension liability adjustments, net of tax 1,071 1,680 (609) (1,071) 1,071Comprehensive income (loss) (29,210) 399 765 (1,163) (29,209)Net comprehensive income attributable tononcontrolling interests — — 5,305 — 5,305Comprehensive income (loss) attributable toTitan $ (29,210) $ 399 $ (4,540) $ (1,163) $ (34,514)
(Amounts in thousands)Consolidating Condensed Statements of Comprehensive Income (Loss)
For the Year Ended December 31, 2015Titan
Intl., Inc.(Parent)
GuarantorSubsidiaries
Non-Guarantor
Subsidiaries Eliminations ConsolidatedNet income (loss) $ (90,287) $ 4,984 $ (31,503) $ 26,519 $ (90,287)Currency translation adjustment, net (79,196) — (79,196) 79,196 (79,196)Pension liability adjustments, net of tax (662) (1,557) 895 662 (662)Comprehensive income (loss) (170,145) 3,427 (109,804) 106,377 (170,145)Net comprehensive loss attributable tononcontrolling interests — — (19,391) — (19,391)Comprehensive income (loss) attributable toTitan $ (170,145) $ 3,427 $ (90,413) $ 106,377 $ (150,754)
(Amounts in thousands)Consolidating Condensed Statements of Comprehensive Income (Loss)
For the Year Ended December 31, 2014Titan
Intl., Inc.(Parent)
GuarantorSubsidiaries
Non-Guarantor
Subsidiaries Eliminations ConsolidatedNet income (loss) $ (130,425) $ (2,071) $ (131,337) $ 133,408 $ (130,425)Currency translation adjustment, net (63,424) — (63,424) 63,424 (63,424)Pension liability adjustments, net of tax (5,129) (4,557) (572) 5,129 (5,129)Comprehensive income (loss) (198,978) (6,628) (195,333) 201,961 (198,978)Net comprehensive loss attributable tononcontrolling interests — — (68,856) — (68,856)Comprehensive income (loss) attributable toTitan $ (198,978) $ (6,628) $ (126,477) $ 201,961 $ (130,122)
TITAN INTERNATIONAL, INC.NOTES TO CONSOLIDATED FINANCIAL STATEMENTS
F- 41
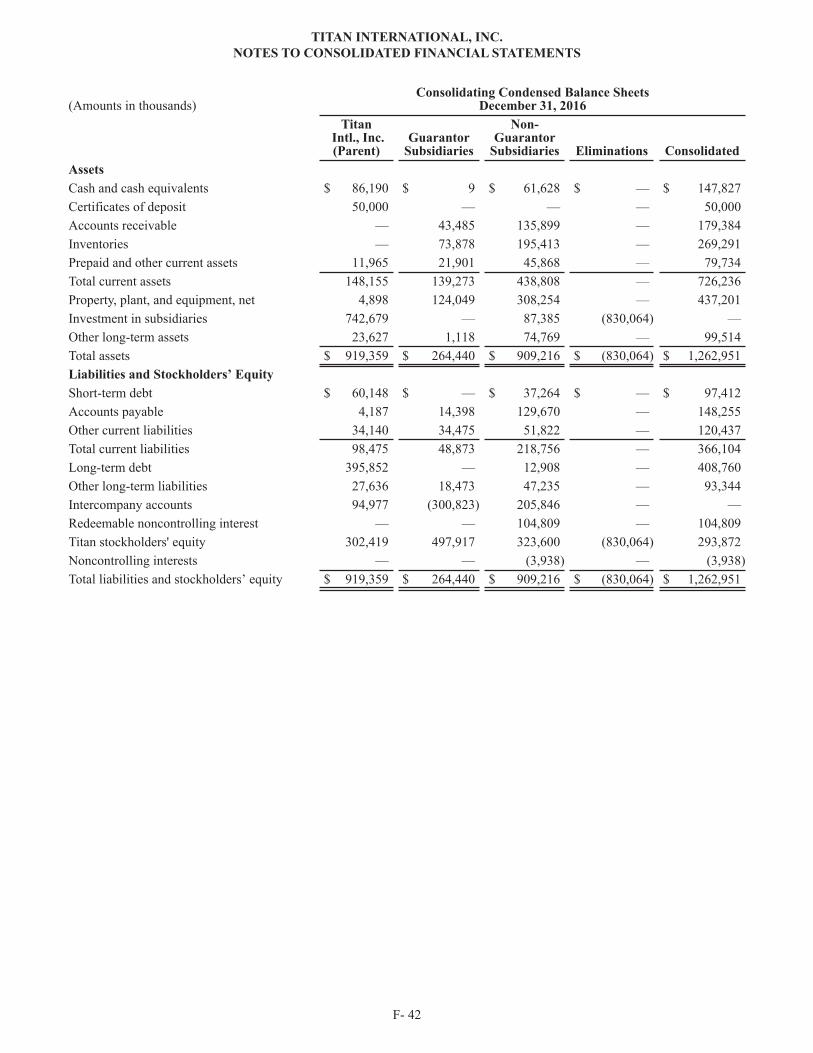
(Amounts in thousands)Consolidating Condensed Balance Sheets
December 31, 2016Titan
Intl., Inc.(Parent)
GuarantorSubsidiaries
Non-Guarantor
Subsidiaries Eliminations ConsolidatedAssetsCash and cash equivalents $ 86,190 $ 9 $ 61,628 $ — $ 147,827Certificates of deposit 50,000 — — — 50,000Accounts receivable — 43,485 135,899 — 179,384Inventories — 73,878 195,413 — 269,291Prepaid and other current assets 11,965 21,901 45,868 — 79,734Total current assets 148,155 139,273 438,808 — 726,236Property, plant, and equipment, net 4,898 124,049 308,254 — 437,201Investment in subsidiaries 742,679 — 87,385 (830,064) —Other long-term assets 23,627 1,118 74,769 — 99,514Total assets $ 919,359 $ 264,440 $ 909,216 $ (830,064) $ 1,262,951Liabilities and Stockholders’ EquityShort-term debt $ 60,148 $ — $ 37,264 $ — $ 97,412Accounts payable 4,187 14,398 129,670 — 148,255Other current liabilities 34,140 34,475 51,822 — 120,437Total current liabilities 98,475 48,873 218,756 — 366,104Long-term debt 395,852 — 12,908 — 408,760Other long-term liabilities 27,636 18,473 47,235 — 93,344Intercompany accounts 94,977 (300,823) 205,846 — —Redeemable noncontrolling interest — — 104,809 — 104,809Titan stockholders' equity 302,419 497,917 323,600 (830,064) 293,872Noncontrolling interests — — (3,938) — (3,938)Total liabilities and stockholders’ equity $ 919,359 $ 264,440 $ 909,216 $ (830,064) $ 1,262,951
TITAN INTERNATIONAL, INC.NOTES TO CONSOLIDATED FINANCIAL STATEMENTS
F- 42
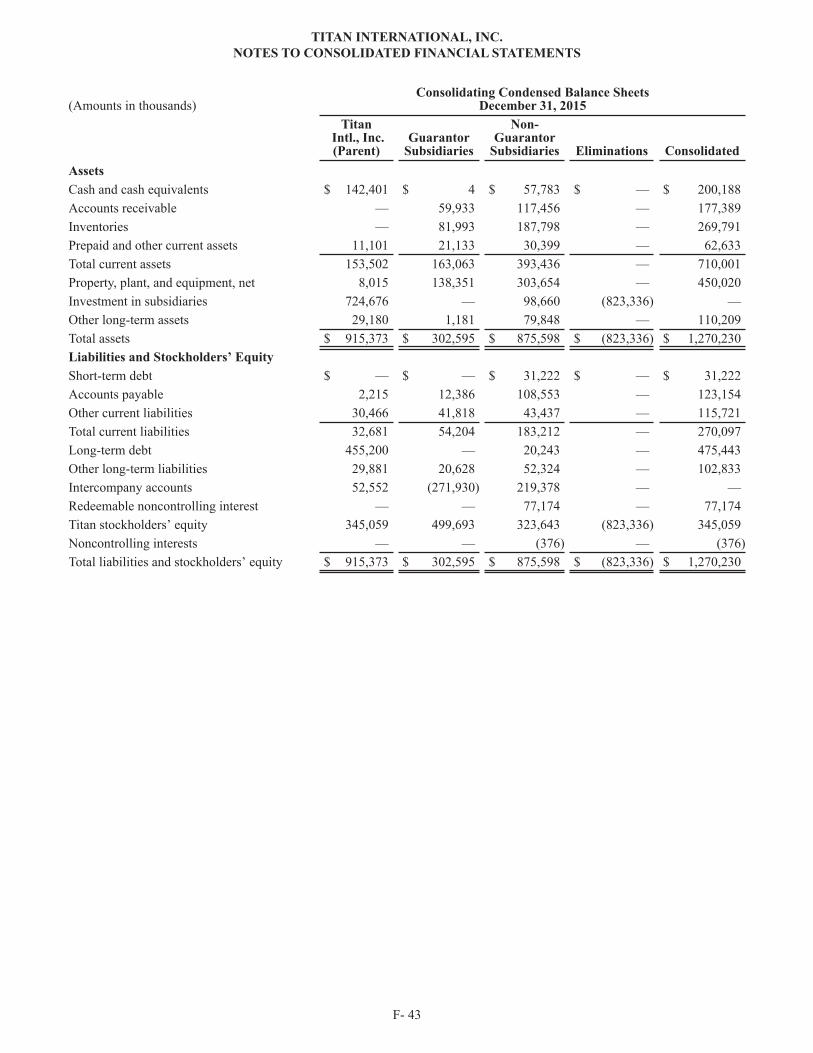
(Amounts in thousands)Consolidating Condensed Balance Sheets
December 31, 2015Titan
Intl., Inc.(Parent)
GuarantorSubsidiaries
Non-Guarantor
Subsidiaries Eliminations ConsolidatedAssetsCash and cash equivalents $ 142,401 $ 4 $ 57,783 $ — $ 200,188Accounts receivable — 59,933 117,456 — 177,389Inventories — 81,993 187,798 — 269,791Prepaid and other current assets 11,101 21,133 30,399 — 62,633Total current assets 153,502 163,063 393,436 — 710,001Property, plant, and equipment, net 8,015 138,351 303,654 — 450,020Investment in subsidiaries 724,676 — 98,660 (823,336) —Other long-term assets 29,180 1,181 79,848 — 110,209Total assets $ 915,373 $ 302,595 $ 875,598 $ (823,336) $ 1,270,230Liabilities and Stockholders’ EquityShort-term debt $ — $ — $ 31,222 $ — $ 31,222Accounts payable 2,215 12,386 108,553 — 123,154Other current liabilities 30,466 41,818 43,437 — 115,721Total current liabilities 32,681 54,204 183,212 — 270,097Long-term debt 455,200 — 20,243 — 475,443Other long-term liabilities 29,881 20,628 52,324 — 102,833Intercompany accounts 52,552 (271,930) 219,378 — —Redeemable noncontrolling interest — — 77,174 — 77,174Titan stockholders’ equity 345,059 499,693 323,643 (823,336) 345,059Noncontrolling interests — — (376) — (376)Total liabilities and stockholders’ equity $ 915,373 $ 302,595 $ 875,598 $ (823,336) $ 1,270,230
TITAN INTERNATIONAL, INC.NOTES TO CONSOLIDATED FINANCIAL STATEMENTS
F- 43
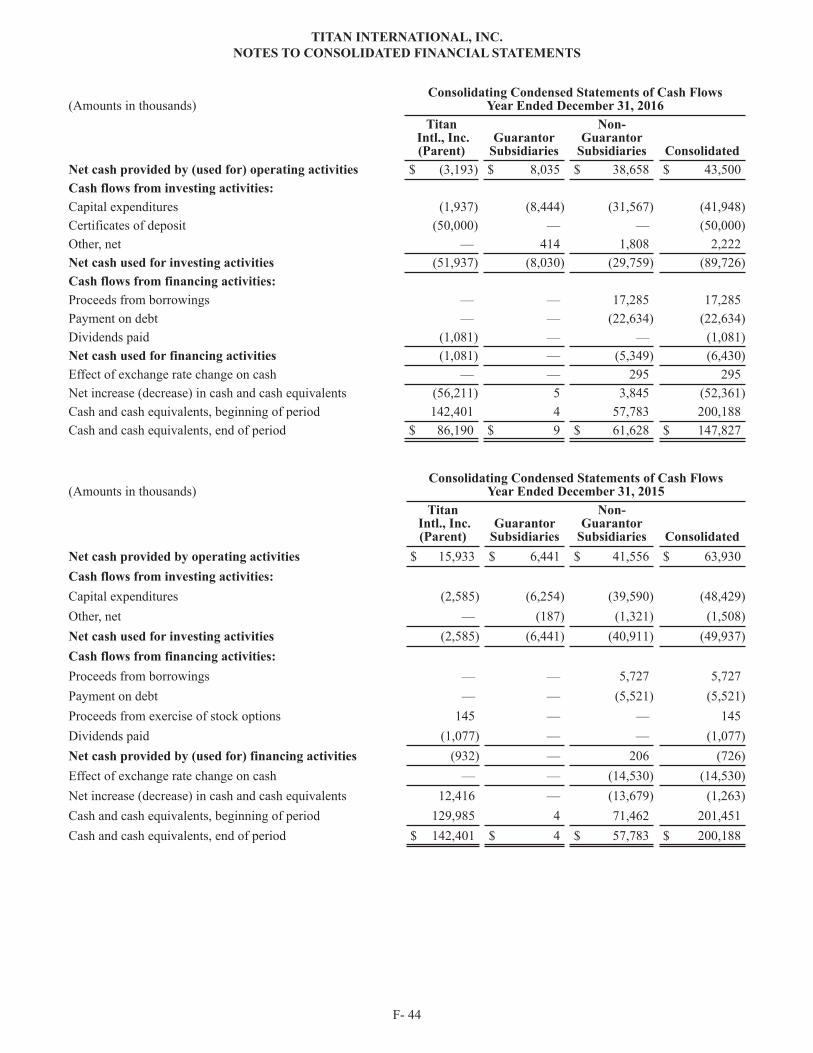
(Amounts in thousands)Consolidating Condensed Statements of Cash Flows
Year Ended December 31, 2016Titan
Intl., Inc.(Parent)
GuarantorSubsidiaries
Non-Guarantor
Subsidiaries ConsolidatedNet cash provided by (used for) operating activities $ (3,193) $ 8,035 $ 38,658 $ 43,500Cash flows from investing activities:Capital expenditures (1,937) (8,444) (31,567) (41,948)Certificates of deposit (50,000) — — (50,000)Other, net — 414 1,808 2,222Net cash used for investing activities (51,937) (8,030) (29,759) (89,726)Cash flows from financing activities:Proceeds from borrowings — — 17,285 17,285Payment on debt — — (22,634) (22,634)Dividends paid (1,081) — — (1,081)Net cash used for financing activities (1,081) — (5,349) (6,430)Effect of exchange rate change on cash — — 295 295Net increase (decrease) in cash and cash equivalents (56,211) 5 3,845 (52,361)Cash and cash equivalents, beginning of period 142,401 4 57,783 200,188Cash and cash equivalents, end of period $ 86,190 $ 9 $ 61,628 $ 147,827
(Amounts in thousands)Consolidating Condensed Statements of Cash Flows
Year Ended December 31, 2015Titan
Intl., Inc.(Parent)
GuarantorSubsidiaries
Non-Guarantor
Subsidiaries ConsolidatedNet cash provided by operating activities $ 15,933 $ 6,441 $ 41,556 $ 63,930Cash flows from investing activities:Capital expenditures (2,585) (6,254) (39,590) (48,429)Other, net — (187) (1,321) (1,508)Net cash used for investing activities (2,585) (6,441) (40,911) (49,937)Cash flows from financing activities:Proceeds from borrowings — — 5,727 5,727Payment on debt — — (5,521) (5,521)Proceeds from exercise of stock options 145 — — 145Dividends paid (1,077) — — (1,077)Net cash provided by (used for) financing activities (932) — 206 (726)Effect of exchange rate change on cash — — (14,530) (14,530)Net increase (decrease) in cash and cash equivalents 12,416 — (13,679) (1,263)Cash and cash equivalents, beginning of period 129,985 4 71,462 201,451Cash and cash equivalents, end of period $ 142,401 $ 4 $ 57,783 $ 200,188
TITAN INTERNATIONAL, INC.NOTES TO CONSOLIDATED FINANCIAL STATEMENTS
F- 44
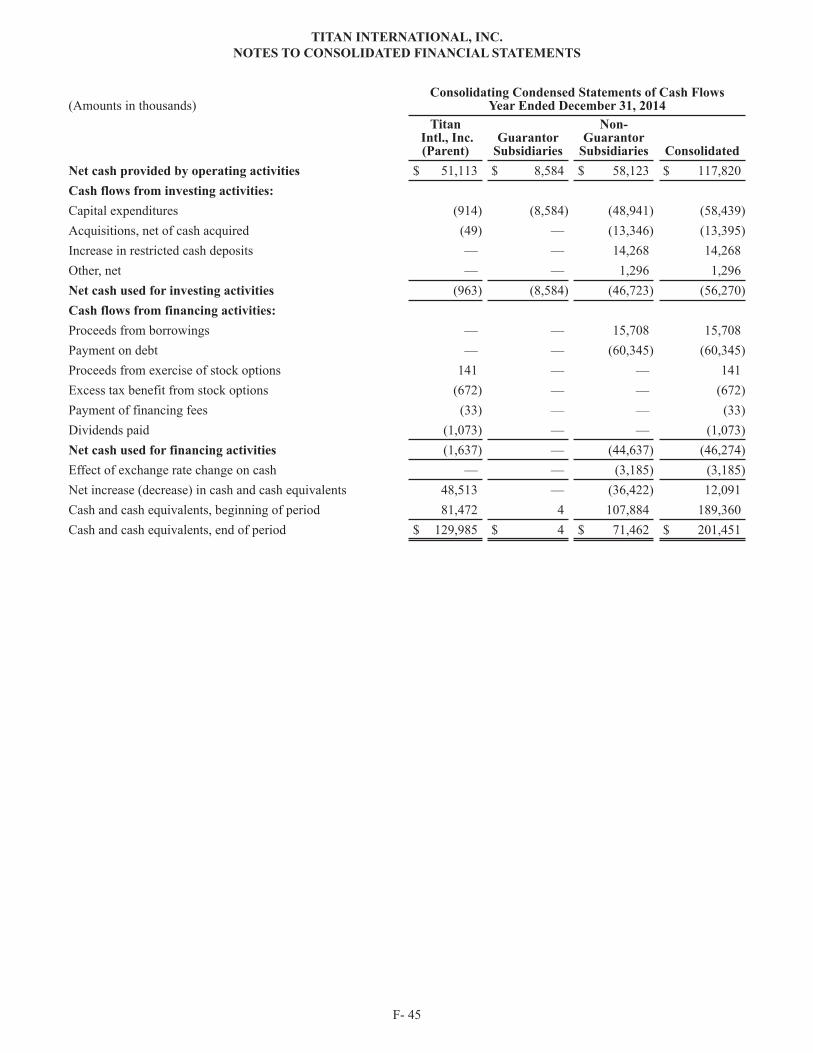
(Amounts in thousands)Consolidating Condensed Statements of Cash Flows
Year Ended December 31, 2014Titan
Intl., Inc.(Parent)
GuarantorSubsidiaries
Non-Guarantor
Subsidiaries ConsolidatedNet cash provided by operating activities $ 51,113 $ 8,584 $ 58,123 $ 117,820Cash flows from investing activities:Capital expenditures (914) (8,584) (48,941) (58,439)Acquisitions, net of cash acquired (49) — (13,346) (13,395)Increase in restricted cash deposits — — 14,268 14,268Other, net — — 1,296 1,296Net cash used for investing activities (963) (8,584) (46,723) (56,270)Cash flows from financing activities:Proceeds from borrowings — — 15,708 15,708Payment on debt — — (60,345) (60,345)Proceeds from exercise of stock options 141 — — 141Excess tax benefit from stock options (672) — — (672)Payment of financing fees (33) — — (33)Dividends paid (1,073) — — (1,073)Net cash used for financing activities (1,637) — (44,637) (46,274)Effect of exchange rate change on cash — — (3,185) (3,185)Net increase (decrease) in cash and cash equivalents 48,513 — (36,422) 12,091Cash and cash equivalents, beginning of period 81,472 4 107,884 189,360Cash and cash equivalents, end of period $ 129,985 $ 4 $ 71,462 $ 201,451
TITAN INTERNATIONAL, INC.NOTES TO CONSOLIDATED FINANCIAL STATEMENTS
F- 45
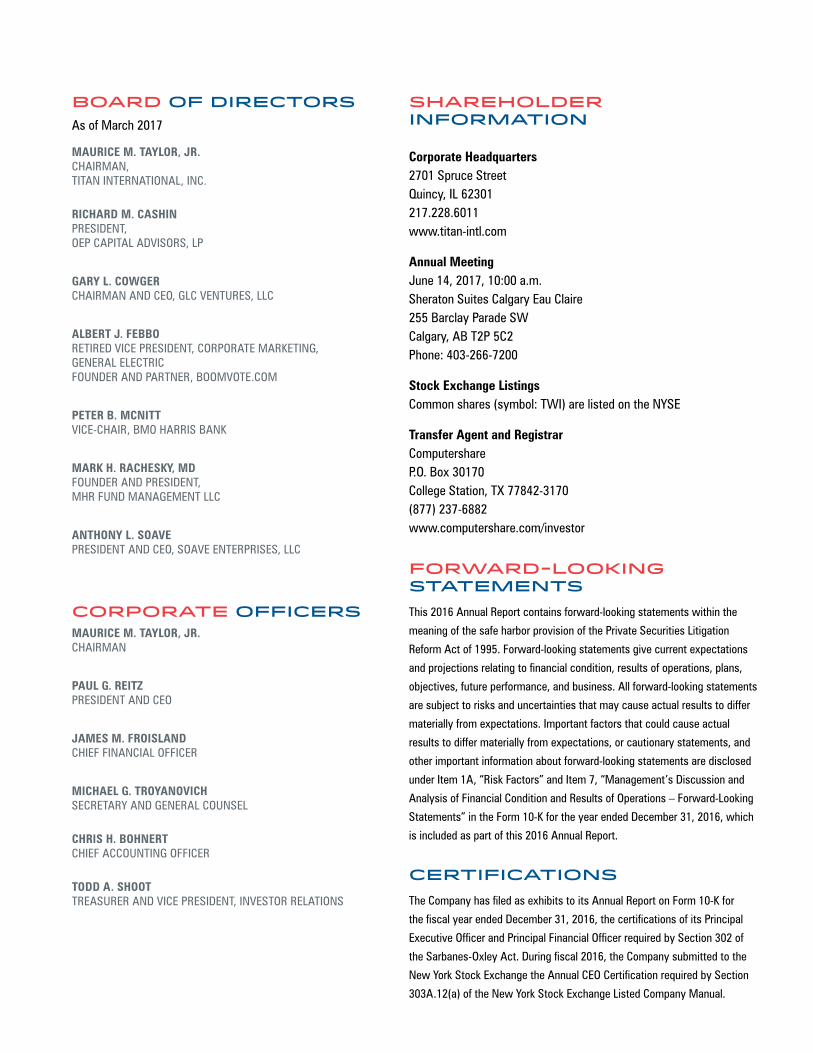
BOARD OF DIRECTORS As of March 2017
MAURICE M. TAYLOR, JR.CHAIRMAN,TITAN INTERNATIONAL, INC.
RICHARD M. CASHINPRESIDENT, OEP CAPITAL ADVISORS, LP
GARY L. COWGERCHAIRMAN AND CEO, GLC VENTURES, LLC
ALBERT J. FEBBORETIRED VICE PRESIDENT, CORPORATE MARKETING, GENERAL ELECTRIC FOUNDER AND PARTNER, BOOMVOTE.COM
PETER B. MCNITTVICE-CHAIR, BMO HARRIS BANK
MARK H. RACHESKY, MDFOUNDER AND PRESIDENT, MHR FUND MANAGEMENT LLC
ANTHONY L. SOAVEPRESIDENT AND CEO, SOAVE ENTERPRISES, LLC
CORPORATE OFFICERSMAURICE M. TAYLOR, JR.CHAIRMAN
PAUL G. REITZPRESIDENT AND CEO
JAMES M. FROISLANDCHIEF FINANCIAL OFFICER
MICHAEL G. TROYANOVICHSECRETARY AND GENERAL COUNSEL
CHRIS H. BOHNERTCHIEF ACCOUNTING OFFICER
TODD A. SHOOTTREASURER AND VICE PRESIDENT, INVESTOR RELATIONS
SHAREHOLDER INFORMATION
Corporate Headquarters2701 Spruce StreetQuincy, IL 62301217.228.6011www.titan-intl.com
Annual MeetingJune 14, 2017, 10:00 a.m. Sheraton Suites Calgary Eau Claire 255 Barclay Parade SW Calgary, AB T2P 5C2 Phone: 403-266-7200
Stock Exchange ListingsCommon shares (symbol: TWI) are listed on the NYSE
Transfer Agent and RegistrarComputershareP.O. Box 30170College Station, TX 77842-3170(877) 237-6882www.computershare.com/investor
FORWARD-LOOKING STATEMENTSThis 2016 Annual Report contains forward-looking statements within the
meaning of the safe harbor provision of the Private Securities Litigation
Reform Act of 1995. Forward-looking statements give current expectations
and projections relating to financial condition, results of operations, plans,
objectives, future performance, and business. All forward-looking statements
are subject to risks and uncertainties that may cause actual results to differ
materially from expectations. Important factors that could cause actual
results to differ materially from expectations, or cautionary statements, and
other important information about forward-looking statements are disclosed
under Item 1A, “Risk Factors” and Item 7, “Management’s Discussion and
Analysis of Financial Condition and Results of Operations – Forward-Looking
Statements” in the Form 10-K for the year ended December 31, 2016, which
is included as part of this 2016 Annual Report.
CERTIFICATIONSThe Company has filed as exhibits to its Annual Report on Form 10-K for
the fiscal year ended December 31, 2016, the certifications of its Principal
Executive Officer and Principal Financial Officer required by Section 302 of
the Sarbanes-Oxley Act. During fiscal 2016, the Company submitted to the
New York Stock Exchange the Annual CEO Certification required by Section
303A.12(a) of the New York Stock Exchange Listed Company Manual.