Embed Size (px)
Citation preview

November 2016
2016 Director Compensation Report

i© 2016 FW Cook
2016 DIRECTOR COMPENSATION REPORT
Table of ContentsExecutive Summary 1
Overview and Methodology 3
Total Board Compensation 5
Board Cash Compensation 7
Equity Award Types 10
Equity Award Denomination 11
Equity Compensation Values 12
Committee Member Compensation 13
Committee Chair Compensation 14
Non-Executive Board Chair and Lead Director Compensation 15
Stock Ownership Guidelines and Retention Requirements 17
Compensation Deferrals 18
Shareholder-Approved Limits on Annual Director Compensation 19
List of Companies Surveyed 21
FW Cook Company Information 24

1© 2016 FW Cook
EXECUTIVE SUMMARYFW Cook’s 2016 Director Compensation Report studies non-employee director compensation at 300 companies of various sizes and industries to analyze market practices in pay levels and program structure.
In terms of pay levels, total compensation increased by 1.3% at the median of the total sample versus last year’s study, which reflects an apparent stabilization of director pay among large- and mid-cap companies in particular. Large-cap companies in our study pay directors $260,000 at the median and $300,000 at the 75th percentile, unchanged from last year. The mid-cap median of $200,000 reflects only a 1.1% increase from last year, while the small-cap median of roughly $145,000 reflects a larger increase of 6.0%. Technology continues to be the highest-paying sector in our study, and Financial Services the lowest, consistent with recent years.
In terms of program structure, design trends observed in recent years continue. In line with the trend toward simplification, meeting fees continue to be eliminated in director pay programs but are still used by a minority of companies. This is often, but not always, accompanied by the introduction of retainers for committee member service, indicating that companies have different perspectives on the need to differentiate compensation based on committee service. Companies continue to shift away from fixed-share equity award guidelines to mitigate volatility in reported director pay and P&L expense. The small minority of companies still providing stock options continues to shrink, as the high risk-and-reward profile of stock options is viewed as incongruous with the director role, whereas full-value stock provides more consistent pay and direct shareholder alignment.
In terms of governance, director stock ownership guidelines continue to increase in prevalence, particularly among mid- and small-cap companies who are following the trend initially embraced by large companies. Mandatory stock deferral/retention requirements are modestly increasing in prevalence, primarily in the form of equity awards that, by their terms, do not settle until after retirement from the board. These awards are utilized by 15% of companies granting equity annually versus 10% last year; prevalence is highest among large-cap companies.
In response to recent shareholder lawsuits regarding the reasonableness of director pay, an increasing number of companies have been adding annual limits on director compensation to shareholder-approved equity plans to mitigate the risk of litigation. Roughly one-third of companies in this study have such limits, and we expect this percentage to grow, as many companies are waiting to implement this feature until they bring the applicable plan to shareholders for normal-course re-approval. To enhance protection, these limits are increasingly covering total pay rather than just equity; among the sample, 30% of limits proposed in 2016 cover total pay, versus just 4% of limits proposed prior to 2016. Among the companies in this study, limits on total pay typically reflect a multiple of two to three times annual total pay. Despite this emerging trend, most companies utilizing limits cover only equity compensation per director.
The following chart summarizes total non-employee director pay levels and market capitalizations of the 300 companies in our study (100 companies in each size grouping):
Small-Cap Mid-Cap Large-Cap
Median Values (Less than $1B) ($1B - $5B) (Greater than $5B)
Total Compensation - 2016 Study $144,625 $200,000 $260,000
Total Compensation - 2015 Study $136,401 $197,750 $259,583
Year-Over-Year Compensation Change 6.0% 1.1% 0.2%
Market Capitalization ($M) - 2016 Study $474 $2,464 $15,815
Market Capitalization ($M) - 2015 Study $457 $2,567 $17,517
Year-Over-Year Market Cap. Change 3.8% -4.0% -9.7%
2© 2016 FW Cook
EXECUTIVE SUMMARY
Cash vs. Equity
Cash Compensation for Board Service
Equity Compensation for Board Service
Committee Compensation
Non-Executive Board Chairs and Lead Directors
Compensation Deferrals
Annual Limits on Director Compensation
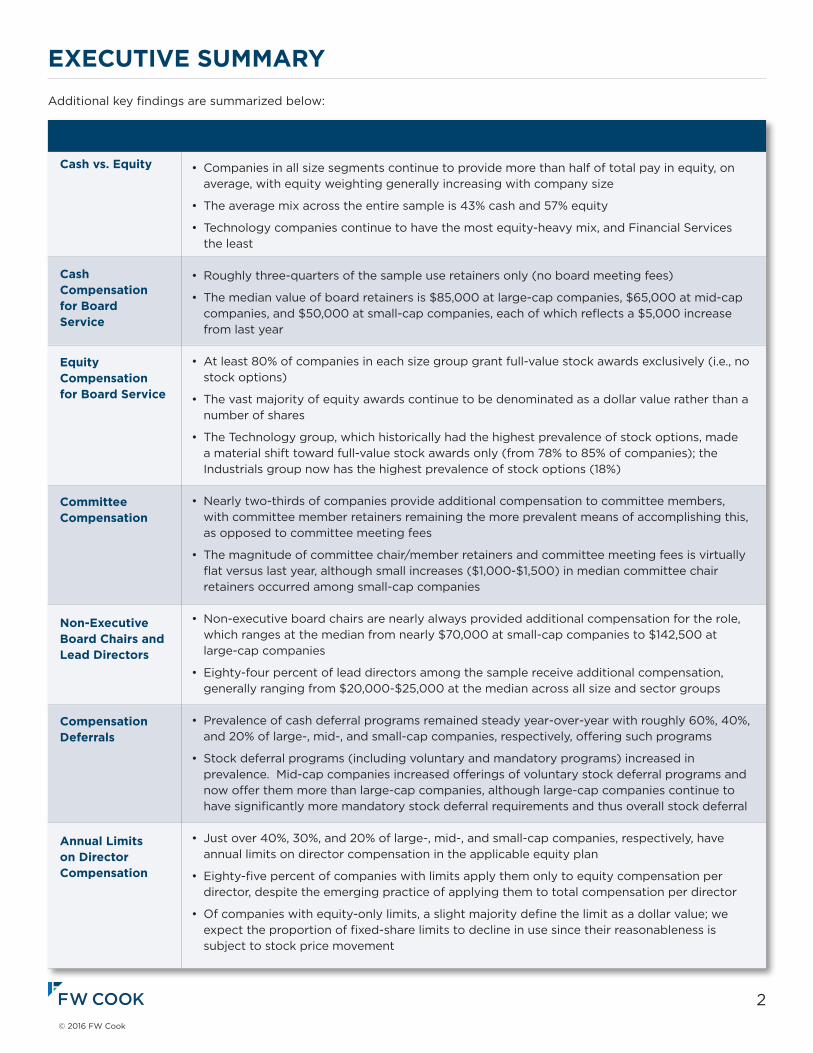
• Companiesinallsizesegmentscontinuetoprovidemorethanhalfoftotalpayinequity,onaverage, with equity weighting generally increasing with company size
• Theaveragemixacrosstheentiresampleis43%cashand57%equity
• Technologycompaniescontinuetohavethemostequity-heavymix,andFinancialServicesthe least
• Roughlythree-quartersofthesampleuseretainersonly(noboardmeetingfees)
• Themedianvalueofboardretainersis$85,000atlarge-capcompanies,$65,000atmid-capcompanies, and $50,000 at small-cap companies, each of which reflects a $5,000 increase from last year
• Atleast80%ofcompaniesineachsizegroupgrantfull-valuestockawardsexclusively(i.e.,nostock options)
• Thevastmajorityofequityawardscontinuetobedenominatedasadollarvalueratherthananumber of shares
• TheTechnologygroup,whichhistoricallyhadthehighestprevalenceofstockoptions,madea material shift toward full-value stock awards only (from 78% to 85% of companies); the Industrials group now has the highest prevalence of stock options (18%)
• Nearlytwo-thirdsofcompaniesprovideadditionalcompensationtocommitteemembers,with committee member retainers remaining the more prevalent means of accomplishing this, as opposed to committee meeting fees
• Themagnitudeofcommitteechair/memberretainersandcommitteemeetingfeesisvirtuallyflat versus last year, although small increases ($1,000-$1,500) in median committee chair retainers occurred among small-cap companies
• Non-executiveboardchairsarenearlyalwaysprovidedadditionalcompensationfortherole,which ranges at the median from nearly $70,000 at small-cap companies to $142,500 at large-cap companies
• Eighty-fourpercentofleaddirectorsamongthesamplereceiveadditionalcompensation,generally ranging from $20,000-$25,000 at the median across all size and sector groups
• Prevalenceofcashdeferralprogramsremainedsteadyyear-over-yearwithroughly60%,40%,and 20% of large-, mid-, and small-cap companies, respectively, offering such programs
• Stockdeferralprograms(includingvoluntaryandmandatoryprograms)increasedinprevalence. Mid-cap companies increased offerings of voluntary stock deferral programs and now offer them more than large-cap companies, although large-cap companies continue to have significantly more mandatory stock deferral requirements and thus overall stock deferral
• Justover40%,30%,and20%oflarge-,mid-,andsmall-capcompanies,respectively,haveannual limits on director compensation in the applicable equity plan
• Eighty-fivepercentofcompanieswithlimitsapplythemonlytoequitycompensationperdirector, despite the emerging practice of applying them to total compensation per director
• Ofcompanieswithequity-onlylimits,aslightmajoritydefinethelimitasadollarvalue;weexpect the proportion of fixed-share limits to decline in use since their reasonableness is subject to stock price movement
Additional key findings are summarized below:

3© 2016 FW Cook
OVERVIEW AND METHODOLOGY
Research SampleThis study is based on a sample of 300 U.S. public companies equally divided among small-, mid-, and large-cap size segments (100 companies in each) and further classified into five sectors: Energy, Financial Services*, Industrials, Retail, and Technology (60 companies in each) based on Standard & Poor’s Global Industry Classification Standard (“GICS”) codes. Approximately 93% of this year’s sample companies were constituents of last year’s sample, allowing for meaningful year-over-year comparisons. For a complete list of the companies included in this study, refer to the List of Companies Surveyed at the end of the report.
Market capitalization and trailing 12-month revenue as of April 30, 2016 are summarized below:
Market Capitalization ($M) Trailing 12-Month Revenue ($M)
Size 25th Percentile Median 75th Percentile 25th Percentile Median 75th Percentile
Small-Cap $289 $474 $634 $205 $584 $1,067
Mid-Cap $1,557 $2,464 $3,343 $966 $2,036 $3,849
Large-Cap $8,335 $15,815 $32,942 $4,830 $10,820 $26,660
Sector 25th Percentile Median 75th Percentile 25th Percentile Median 75th Percentile
Energy $613 $2,789 $10,588 $693 $2,094 $8,632
Financial Services $816 $2,434 $8,428 $331 $710 $3,065
Industrials $703 $2,708 $7,771 $1,072 $3,202 $7,438
Retail $643 $2,085 $8,243 $1,664 $4,100 $12,094
Technology $597 $2,195 $6,987 $378 $1,512 $3,353
Director compensation program details were sourced from companies’ proxy statements and/or annual reports, generally filed with the Securities and Exchange Commission (“SEC”) in the one-year period ending May 31, 2016.
* Effective August 31, 2016, S&P and Morgan Stanley Capital International (“MSCI”) created a new headline-level Real Estate sector in the GICS framework and reclassified many REITs and other real estate companies into this new sector, which had previously been categorized under the Financials sector. This study’s research sample was established prior to the reclassification; thus, this study’s Financial Services sample includes 12 companies (out of 60) that are now classified in the Real Estate sector.

4© 2016 FW Cook
OVERVIEW AND METHODOLOGY
MethodologyThe study analyzes compensation for board and committee service (with the latter focused on the three most common standing committees of the board: audit, compensation, and nominating/governance). The specific pay components presented in this study include:
• Annual cash retainers and meeting fees for board service
• Equity compensation, in the form of stock options or full-value stock awards (i.e., restricted shares/units, deferred
stock units, and fully vested stock)
• Annual cash retainers and meeting fees for committee member and chair service
• Additional compensation for serving as a non-executive chair or lead director
The report also presents our findings on the prevalence of stock ownership guidelines and compensation deferral provisions, as well as the prevalence, design, and magnitude of shareholder-approved limits on annual compensation per director.
The following assumptions were used to facilitate comparisons:
• Each director attends nine board meetings annually (consistent with last year’s study)
• Each director is a member of one committee and attends six committee meetings per year (consistent with last
year’s study)
• If denominated as a number of shares (rather than as a fixed-dollar value), then equity compensation is valued using
closing stock prices as of April 30, 2016
• All equity compensation is annualized over a five-year period (e.g., if a company makes a “larger than normal” equity
grant upon initial election to the board followed by smaller annual grants, then our analysis includes the five-year
average value of the initial grant and the four subsequent annual grants)
• Stock options are valued using each individual company’s publicly disclosed Accounting Standards Codification
(“ASC”) Topic 718 assumptions to align option values used in this study with their accounting costs, assuming an
April 30, 2016 grant date

5© 2016 FW Cook
TOTAL BOARD COMPENSATION
Total Compensation – Pay LevelsTotal director compensation levels are most heavily influenced by company size. At the median, large-cap companies provide total pay of $260,000 per director versus $200,000 at mid-cap companies and $145,000 at small-cap companies. These figures reflect year-over-year increases of 0.2% for large-cap, 1.1% for mid-cap, and 6.0% for small-cap companies, which appears to indicate plateauing of director compensation among larger companies while smaller companies continue to make modest increases. Across each size category, the 25th percentile grew 3% to 4%, while the 75th percentile either stayed flat (large-cap) or grew around 1% (mid- and small-cap).
When segmented by sector, Technology provides the highest median total pay of $238,000, followed by Energy at $210,000, Retail and Industrials essentially equal at $197,000/$198,000, and Financial Services at $149,000.
2016:
75th Percentile $174 $229 $300
Median $145 $200 $260
25th Percentile $105 $166 $226
75th Percentile $284 $212 $243 $225 $307
Median $210 $149 $198 $197 $238
25th Percentile $172 $97 $145 $149 $176
2015 2016 2015 2016 2015 2016
Small-Cap Mid-Cap Large-Cap
Total Compensation By Size($000)
Total Compensation By Sector($000)
Energy Financial Industrials Retail Technology Services
$210
$149
$198
$238
$238
$0
$50
$100
$150
$200
$250
$300
$0
$50
$100
$150
$200
$250
$300
$136 $145
$198 $200
$260 $260
$197

6© 2016 FW Cook
TOTAL COMPENSATION – CASH VS. EQUITYCompensation for board service typically consists of both cash and equity. The charts below illustrate average pay mix across company size and sector, with findings essentially unchanged year-over-year except for the continued decline in the use of stock options to deliver equity compensation across size and sector categories.
All three size segments provide more than half of compensation in equity, with equity weighting increasing with company size and total pay. Cash/equity mix has not materially changed from last year.
Consistent with the size group comparisons, the higher-paying sectors tend to place a greater weighting on equity, which is most heavily utilized among Technology companies (over two-thirds of total compensation) and least heavily utilized among Financial Services companies (less than half of total compensation), on average.
Large-Cap
Mid-Cap
Small-Cap
Technology
Retail
Industrials
Financial Services
Energy
Cash vs. Equity By Size
Cash vs. Equity By Sector
Average Cash/Equity Composition
Cash Full-Value Stock Awards Stock Options
Average Cash/Equity Composition
Cash Full-Value Stock Awards Stock Options
43% 56% 1%
53% 46% 1%
45% 47% 8%
42% 54% 4%
30% 62% 8%
47% 49% 4%
42% 52% 6%
38% 59% 3%Large-Cap
Mid-Cap
Small-Cap
Technology
Retail
Industrials
Financial Services
Energy
Cash vs. Equity By Size
Cash vs. Equity By Sector
Average Cash/Equity Composition
Cash Full-Value Stock Awards Stock Options
Average Cash/Equity Composition
Cash Full-Value Stock Awards Stock Options
43% 56% 1%
53% 46% 1%
45% 47% 8%
42% 54% 4%
30% 62% 8%
47% 49% 4%
42% 52% 6%
38% 59% 3%
Percentage Equity 2015 2016
53% 53%
56% 58%
64% 62%

7© 2016 FW Cook
BOARD CASH COMPENSATION
Cash Compensation Pay StructureCash compensation for board service is typically provided through an annual board retainer, board meeting fees, or a combination of both. Companies across all sizes and sectors generally continue to trend to retainer-only programs. Out of the total sample, 74% use retainers only, compared to 70% observed last year. Many companies have eliminated board meeting fees to simplify administration and communicate that attendance is expected; however, to anticipate years with abnormally high meeting activity, some companies simply institute pre-set thresholds requiring a specific number of meetings to occur before per-meeting fees are paid (see page 9 for more discussion).
Retainer-only structures continue to be majority practice regardless of size and industry.
Large-Cap
Mid-Cap
Small-Cap
Technology
Retail
Industrials
Financial Services
Energy
Board Cash Structure By Size
Board Cash Structure By Sector
Retainers Only Meeting Fees Only
Retainers & Meeting Fees No Cash (Equity Only)
Retainers Only Meeting Fees Only
Retainers & Meeting Fees No Cash (Equity Only)
63% 37%
68% 30% 2%
79% 18%3%
77% 20% 3%
84% 13% 3%
68% 30% 2%
73% 24%2% 1%
81% 17% 2%
Percentage of Companies with Retainers only
2015 2016
60% 68%
70% 73%
80% 81%

8© 2016 FW Cook
BOARD CASH COMPENSATION
Board Cash RetainersBoard retainers are generally correlated with company size and have exhibited modest year-over-year increases, which is likely partly attributable to the sustained shift toward retainer-only board pay structures (i.e. retainers increase to offset lack of meeting fees). The median retainer is $85,000 at large-cap, $65,000 at mid-cap, and $50,000 at small-cap companies, which reflect increases of 6.3%, 8.3%, and 11.1%, respectively, from last year.
Retainers tend to be highest at Energy ($75,000) and Industrials ($67,500) companies, while other industries have a median retainer at or near $60,000.
2016:
75th Percentile $60,000 $80,000 $101,250
Median $50,000 $65,000 $85,000
25th Percentile $35,000 $54,250 $60,000
75th Percentile $100,000 $80,000 $96,250 $76,250 $67,500
Median $75,000 $61,250 $67,500 $60,000 $60,000
25th Percentile $53,500 $40,000 $50,000 $50,000 $43,750
2015 2016 2015 2016 2015 2016
Small-Cap Mid-Cap Large-Cap
Board Cash Retainers By Size
Board Cash Retainers By Sector
Energy Financial Industrials Retail Technology Services
$0
$20,000
$40,000
$60,000
$80,000
$100,000
0
$20,000
$40,000
$60,000
$80,000
$100,000
$75,000
$61,250$67,500
$60,000$60,000
$45,000 $50,000$60,000 $65,000
$80,000 $85,000

9© 2016 FW Cook
BOARD CASH COMPENSATION
Board Meeting FeesPrevalence of board meeting fees continues to fall significantly among small-cap companies, whereas declines are more modest among large- and mid-cap companies. Of the total sample, 24% use board meeting fees versus 28% last year. Smaller companies are still more likely to pay board meeting fees despite the significant year-over-year drop. The magnitude of board meeting fees, on the other hand, increases with company size.
Board meeting fees typically range from $1,500 to $2,500 per meeting regardless of size or sector. Energy companies utilize board meeting fees the most, while Technology companies utilize them the least.
* Prevalence statistics reflect companies that pay a fee starting with the first meeting in a year; across the entire sample, an additional 5% of companies (4% last year) provide a fee starting after a pre-set minimum number of meetings per year
Board Meeting Fees By Size
Prevalence* 25th Percentile Median 75th Percentile
Small-Cap 30% $1,000 $1,500 $2,000
Mid-Cap 26% $1,500 $1,500 $2,375
Large-Cap 17% $1,500 $2,000 $2,500
Prior Year Meeting Fee Prevalence*
37%
29%
18%
Board Meeting Fees By Sector
Prevalence* 25th Percentile Median 75th Percentile
Energy 37% $1,500 $1,500 $2,000
Financial Services 30% $1,050 $1,500 $1,500
Industrials 22% $1,500 $2,000 $2,500
Retail 20% $1,500 $2,000 $2,500
Technology 13% $1,850 $2,250 $2,625
Prior Year Meeting Fee Prevalence*
35%
37%
28%
22%
18%

10© 2016 FW Cook
EQUITY AWARD TYPESFull-value stock awards (i.e., restricted stock/units, deferred stock units, or fully vested stock) remain the most prevalent equity grant type in director compensation programs across all company sizes and sectors.
Use of full-value-only equity programs increased year-over-year among small-cap companies while staying flat for large- and mid-cap companies. Option-only programs declined in prevalence at large- and small-cap companies versus last year.
Option-only programs declined in prevalence across all sectors since last year. Technology companies, which exhibited a material year-over-year shift toward full-value-only programs (78% to 85%), are no longer the heaviest users of stock options (now Industrials).
Prior Year Full- Value Only Use
80%
83%
90%Large-Cap
Mid-Cap
Small-Cap
Technology
Retail
Industrials
Financial Services
Energy
Equity Award Types By Size
Equity Award Types By Sector
94% 3%
83% 10%
77% 5% 5%
91% 3% 3%
85% 3%
3%
7%
13%
3%
12%
84% 8% 5%
83% 8% 6%
90% 7%
3%
3%
1% 2%
Full-Value Stock Only Full-Value & Options
Options Only No Equity
Full-Value Stock Only Full-Value & Options
Options Only No Equity
Large-Cap
Mid-Cap
Small-Cap
Technology
Retail
Industrials
Financial Services
Energy
Equity Award Types By Size
Equity Award Types By Sector
94% 3%
83% 10%
77% 5% 5%
91% 3% 3%
85% 3%
3%
7%
13%
3%
12%
84% 8% 5%
83% 8% 6%
90% 7%
3%
3%
1% 2%
Full-Value Stock Only Full-Value & Options
Options Only No Equity
Full-Value Stock Only Full-Value & Options
Options Only No Equity

11© 2016 FW Cook
EQUITY AWARD DENOMINATIONCompanies continue to define annual equity awards primarily as a fixed-dollar value rather than as a fixed number of shares, which is consistent across size and sector groups. Dollar-denominated awards provide the same proxy-disclosed grant value on an annual basis despite stock price movement.
The share-denominated approach is used more commonly for stock options than for full-value stock awards, although the approach is still a minority practice for stock options overall. Share-denomination of stock options has declined significantly across most size and sector groups, although it remains a majority practice among mid-cap companies and Financial Services companies providing option awards.
* Some companies grant both full-value stock awards and options, so percentages add to greater than 100%
Equity Award Denomination By Sector: Percentage of Companies
Full-Value Stock (Used by 93% of Companies)* Options (Used by 12% of Companies)*
Dollar Value Number of Shares Dollar Value Number of Shares
Energy 90% 10% 50% 50%
Financial Services 83% 17% 25% 75%
Industrials 89% 11% 55% 45%
Retail 88% 12% 100% 0%
Technology 90% 10% 56% 44%
Equity Award Denomination By Size: Percentage of Companies
Full-Value Stock (Used by 93% of Companies)* Options (Used by 12% of Companies)*
Dollar Value Number of Shares Dollar Value Number of Shares
Small-Cap 83% 17% 64% 36%
Mid-Cap 87% 13% 27% 73%
Large-Cap 94% 6% 88% 12%

12© 2016 FW Cook
EQUITY COMPENSATION VALUESMedian annual equity compensation values exhibited healthy year-over-year increases among mid- and small-cap companies (+11.4% and +7.6%, respectively) while growing only slightly among large-cap companies (+1.3%). The effect of these increases on total compensation is mitigated by simultaneous declines in the use of meeting fees and larger-than-normal initial equity awards. Compared to cash, equity compensation is more highly variable with company size and is thus the primary contributor to the overall differential in total pay among differently sized companies.
Median equity compensation continues to be highest among Technology companies and lowest among Financial Services companies. Equity compensation positioning mirrors total compensation positioning among the sectors since equity constitutes more than half of total compensation for each industry other than Financial Services.
2016:
75th Percentile $100,000 $150,000 $207,500
Median $75,000 $122,500 $152,000
25th Percentile $50,000 $96,250 $130,000
75th Percentile $178,750 $131,500 $135,000 $140,000 $212,500
Median $132,500 $75,500 $115,000 $110,000 $160,831
25th Percentile $100,000 $46,250 $80,325 $82,500 $116,250
2015 2016 2015 2016 2015 2016
Small-Cap Mid-Cap Large-Cap
Equity Compensation Value By Size
Equity Compensation Value By Sector
Energy Financial Industrials Retail Technology Services
$0
$50,000
$100,000
$150,000
$200,000
$250,000
$0
$50,000
$100,000
$150,000
$200,000
$250,000
$69,680 $75,000
$110,000$122,500
$150,000 $152,000
$132,500
$75,500$115,000
$110,000
$160,831

13© 2016 FW Cook
COMMITTEE MEMBER COMPENSATIONCommittee service can be compensated through additional retainers paid in cash (or, more rarely, equity) or meeting fees. Nearly two-thirds of companies provide additional compensation to directors for serving as a regular member of a board committee, particularly mid- and small-cap companies. The decrease in use of committee meeting fees slightly outpaces the increase in the use of committee member retainers, highlighting that some companies eliminating meeting fees are comfortable forgoing committee-specific compensation in its entirety. Small-cap companies noticeably shifted away from committee meeting fees toward committee member retainers compared to last year, while relatively minor changes occurred among mid- and large-cap companies.
Committee service compensation is relatively invariable by size or sector but generally increases with company size; within a tight range, Retail companies provide the highest levels among the sample, while Financial Services companies provide the lowest. Prevalence and values of committee retainers are typically highest for the audit committee and lowest for the nominating/governance committee, while meeting fees are typically identical for all three committees. Median committee member retainers were flat for the audit and compensation committees but increased for the nominating/governance committee, from $5,000 to $6,000. Median committee meeting fees are flat year-over-year.
For companies that provide committee member compensation, member retainers are favored by Technology, Retail, and Industrials companies, while meeting fees are favored by Energy and Financial Services companies. Modest decreases in committee meeting fee prevalence occurred among Financial Services, Industrials, and Technology companies versus last year. Committee member retainer prevalence increased slightly year-over-year for Financial Services, Industrials, and Technology companies, but decreased slightly for the other two sectors.
* Reflects companies that pay a fee starting with the first meeting in a year; across the entire sample, an additional 4% of companies (same as prior year) provide a fee starting after a pre-set minimum number of meetings per year
Committee Member Retainers Committee Meeting Fees*
Nominating Nominating & & Audit Compensation Governance Audit Compensation Governance
Total Prevalence (2016) 41% 36% 35% 27% 26% 24%
Total Prevalence (2015) 39% 36% 34% 30% 30% 28%
Size (2016)
Small-Cap 39% 38% 39% 33% 31% 31%
Mid-Cap 43% 39% 38% 26% 25% 22%
Large-Cap 41% 29% 28% 21% 21% 20%
Sector (2016)
Energy 22% 19% 21% 38% 39% 34%
Financial Services 33% 22% 21% 42% 39% 40%
Industrials 37% 27% 25% 20% 20% 19%
Retail 38% 35% 35% 18% 18% 18%
Technology 75% 73% 69% 15% 13% 14%
Pay Levels (All Companies 2016)
75th Percentile $15,000 $10,000 $10,000 $2,000 $2,000 $2,000
Median $10,000 $8,000 $6,000 $1,500 $1,500 $1,500
25th Percentile $9,875 $6,000 $5,000 $1,000 $1,000 $1,000

14© 2016 FW Cook
COMMITTEE CHAIR COMPENSATIONConsistent with prior years, nearly all companies provide additional compensation to committee chairs to recognize the substantial time required to lead a committee. Similar to committee member retainers, committee chair retainers tend to be highest for the audit committee and lowest for the nominating/governance committee, illustrating primarily the different time commitment expectations between committees. Similar to last year, 29% of companies providing chair retainers to both the audit and compensation committee provide the same amount, highlighting the increased importance and complexity of the compensation committee chair role. Eleven percent of companies providing chair retainers to all three committees provide the same level of retainer rather than differentiating.
The table below shows the prevalence and magnitude of retainers paid to directors who chair the audit, compensation, and nominating/governance committees. The values include any committee member retainers provided. The vast majority of companies use cash for their chair retainers, although a small minority (7% of companies providing chair retainers) use equity either solely or in combination with cash.
Year-over-year, increases of $1,000 to $1,500 occurred for median committee chair retainers at small-cap companies. Median chair retainers for large- and mid-cap companies changed immaterially or not at all.
Retail companies tend to provide the highest committee chair retainers, followed by Technology companies. There is little differentiation in chair retainer amounts among the other three sectors.
Less than 1% of companies in the research sample provide a higher meeting fee to committee chairs than to regular committee members (in lieu of, or in addition to, incremental cash or equity retainers).
Committee Chair Retainers (Inclusive of Any Member Retainers)
Audit Compensation Nominating & Governance
Percentile 25th Median 75th 25th Median 75th 25th Median 75th
Size
Small-Cap $12,000 $16,000 $25,000 $10,000 $11,400 $15,000 $6,750 $10,000 $10,000
Mid-Cap $15,000 $20,000 $30,000 $14,625 $15,000 $20,000 $10,000 $12,500 $15,000
Large-Cap $20,000 $25,000 $30,000 $15,000 $20,000 $25,000 $10,000 $15,000 $20,000
Sector
Energy $15,000 $20,000 $24,375 $12,375 $15,000 $20,000 $10,000 $10,000 $15,000
Financial Services $15,000 $20,000 $25,000 $10,000 $15,000 $20,000 $7,500 $10,000 $15,000
Industrials $15,000 $20,000 $25,000 $10,000 $15,000 $20,000 $7,500 $10,000 $15,000
Retail $20,000 $25,000 $30,000 $12,250 $20,000 $25,000 $10,000 $15,000 $16,375
Technology $20,000 $25,000 $30,000 $15,000 $16,500 $21,250 $10,000 $12,500 $15,000
All Companies 2016 $15,000 $20,000 $26,500 $10,000 $15,000 $20,000 $9,000 $10,000 $15,000
Prevalence 96% 95% 92%

15© 2016 FW Cook
NON-EXECUTIVE BOARD CHAIR AND LEAD DIRECTOR COMPENSATION
Non-Executive Board Chair RetainerThere were 129 non-executive board chairs identified in this year’s study, 124 (96%) of which are provided additional compensation over regular board members. Incremental compensation for non-executive chairs is provided in cash, equity, or a combination of both. The below values are calculated based on only the companies that provide additional compensation to their non-executive board chair. Such additional retainers are highly differentiated based on responsibility, incumbent background (e.g., former CEO), and board structure, among other factors.
Energy and Retail companies provide the greatest additional compensation for non-executive board chair service, while Technology companies provide the least.
Small-Cap Mid-Cap Large-Cap
Non-Executive Board Chair Retainers By Size
Non-Executive Board Chair Retainers By Sector
Energy Financial Industrials Retail Technology Services
$0
$50,000
$100,000
$150,000
$200,000
$0
$50,000
$100,000
$150,000
$200,000
$125,000
$88,500 $100,000$125,000
$75,000
$68,985
$120,000
$142,500
# of Occurrences 51 37 36
75th Percentile $125,000 $160,000 $200,000
Median $68,985 $120,000 $142,500
25th Percentile $40,000 $75,000 $95,000
# of Occurrences 25 20 27 20 32
75th Percentile $160,000 $192,500 $160,000 $200,000 $106,250
Median $125,000 $88,500 $100,000 $125,000 $75,000
25th Percentile $82,000 $36,249 $62,500 $86,250 $50,000

16© 2016 FW Cook
Lead Director RetainerOf the 164 lead directors in this year’s study, 138 (84%) receive additional compensation for their service. Lead director retainers are much less differentiated than other elements of director compensation, with a median value of $25,000 for most size and sector groups. The small-cap and Technology groups are the exceptions, with median values of $18,125 and $20,000, respectively.
NON-EXECUTIVE BOARD CHAIR AND LEAD DIRECTOR COMPENSATION
# of Occurrences 32 45 61
75th Percentile $23,125 $25,000 $35,000
Median $18,125 $25,000 $25,000
25th Percentile $10,000 $18,000 $25,000
# of Occurrences 24 34 28 28 24
75th Percentile $26,250 $25,000 $25,000 $36,250 $31,250
Median $25,000 $25,000 $25,000 $25,000 $20,000
25th Percentile $20,000 $15,000 $20,000 $20,000 $17,813
Small-Cap Mid-Cap Large-Cap
Lead Director Retainers By Size
Lead Director Retainers By Sector
Energy Financial Industrials Retail Technology Services
$0
$10,000
$20,000
$30,000
$40,000
$0
$10,000
$20,000
$30,000
$40,000
$18,125
$25,000 $25,000
$25,000
$25,000 $25,000 $25,000$20,000
Small-Cap Mid-Cap Large-Cap
Lead Director Retainers By Size
Lead Director Retainers By Sector
Energy Financial Industrials Retail Technology Services
$0
$10,000
$20,000
$30,000
$40,000
$0
$10,000
$20,000
$30,000
$40,000
$18,125
$25,000 $25,000
$25,000
$25,000 $25,000 $25,000$20,000

17© 2016 FW Cook
STOCK OWNERSHIP GUIDELINES AND RETENTION REQUIREMENTSDirector stock ownership guidelines are in place at a majority of companies, particularly at large-cap companies where they have been nearly ubiquitous for many years. Companies that lack formal guidelines may instead grant equity that mandatorily settles after retirement from the board (often observed at large-cap companies). Director stock ownership guideline prevalence increased year-over-year for small- and mid-cap companies.
Policies typically take one of three forms: (1) a multiple of a director’s cash board retainer (usually five times for large- and mid-cap companies, and three times for small-cap companies), a dollar value, or a number of shares, (2) required retention of a percentage of “net shares” acquired, or (3) a combination of these two approaches.
Stock retention requirements are still a minority practice but increasingly prevalent, especially among large-cap companies where they typically take the form of equity awards that only settle after retirement from the board; for small- and mid-cap companies, the requirement is more often part of the stock ownership guidelines and provides for mandatory retention until a required ownership level is achieved. A retention ratio of 100% of net shares is the most common, although smaller ratios become more common as company size decreases.
* Combination means the use of a retention requirement in addition to a required ownership level** Calculated out of companies disclosing retention requirements
Stock Retention Requirements
Small-Cap Mid-Cap Large-Cap Overall
Prevalence 31% 26% 45% 34%
Length Of Retention**
Until Retirement 37% 27% 69% 48%
Until Ownership Guideline Met 60% 58% 27% 45%
Fixed Years 3% 15% 4% 7%
Vehicle for Requirement**
Stock Ownership Guideline 68% 65% 36% 53%
Equity Award Feature 32% 31% 58% 43%
Both 0% 4% 6% 4%
Retention Ratio**
100% 52% 65% 78% 67%
75% 10% 8% 2% 6%
50% 35% 23% 18% 25%
Other 3% 4% 2% 2%
Large-Cap Small-CapMid-Cap
Retention Requirement
Only 3%
Combination*16%
Ownership Guidelines Only 72%
None 9%
Retention Requirement
Only 2%
Combination*16%
Ownership Guidelines Only 65%
None 17%
Retention Requirement
Only 4%
Combination*17%
Ownership Guidelines Only 49%
None 30%

18© 2016 FW Cook
COMPENSATION DEFERRALSOf sample companies that pay cash retainers/fees, 42% provide for some form of voluntary cash deferral (unchanged from last year); 29% provide for “cash-to-cash” deferral by which cash may be deferred into alternative investments such as those under a company’s employee 401(k) plan, and the same percentage allow directors to defer cash into a company stock unit account (many companies provide both). Such deferrals are typically distributed after retirement from the board.
Of sample companies that award equity annually, 36% provide for deferral of equity grants beyond the vesting period (“stock-to-stock” deferral); 21% allow this on a voluntary basis, while the remaining 15% grant equity that is mandatorily deferred until retirement from the board. Versus last year, prevalence of voluntary stock-to-stock deferral increased among mid-cap companies, and prevalence of mandatory stock-to-stock deferral increased among all size groups.
Cash* Stock Cash* Stock Cash* Stock
Small-Cap Mid-Cap Large-Cap
Prevalence of Cash and Stock Deferral Programs By Size
Elective Mandatory
22%
42%
16%9%7%
39%7%
32%
50%
28%
22%
62%
* Includes companies that permit deferral of either cash- to- cash, cash- to- stock, or both

19© 2016 FW Cook
SHAREHOLDER-APPROVED LIMITS ON ANNUAL DIRECTOR COMPENSATION In the wake of recent shareholder litigation surrounding director pay, companies are taking steps to protect themselves against such lawsuits which, even if winnable, may prove costly and thus easier to settle than to litigate. One such step is to include “meaningful” limits on annual compensation per director in shareholder-approved equity plans. Such limits can apply to equity (expressed as a dollar value or number of shares/options) or to total compensation (cash and equity); the latter is preferable and is viewed as providing more complete protection against a potential lawsuit, since case law does not seem to distinguish between cash and equity.
We examined the research sample to understand the prevalence and magnitude of annual per-director pay limits. While equity-only limits are currently more common, total pay limits are growing in use. Equity limits are more commonly expressed in dollars than a number of shares; we expect the latter approach to decline over time since fixed-share limits do not restrict grant value (thus may not provide meaningful defense against a potential lawsuit) and are not consistent with the common practice of value-denominated equity grants for directors. Some companies raise or nullify the limit in special cases, such as a director’s first year of service or if a director serves as the board chair or lead director (none of these exceptions is used by more than 10% of companies with limits). Additionally, a few companies have separate limits for each award type under the plan.
* Calculated out of companies disclosing limits** Calculated out of companies with equity-only limits
Annual Limits on Non-Employee Director Compensation
Small-Cap Mid-Cap Large-Cap Overall
Prevalence 22% 32% 42% 32%
Limit Scope Mix*
Total Compensation 5% 22% 14% 15%
Equity Only 95% 78% 86% 85%
Equity Limit Type Mix**
Dollar-Denominated 67% 44% 56% 55%
Share-Denominated 24% 52% 44% 41%
Both 9% 4% 0% 4%

20© 2016 FW Cook
SHAREHOLDER-APPROVED LIMITS ON ANNUAL DIRECTOR COMPENSATION Among the sample, most limits on total pay are between $400K and $600K and typically equate to a multiple of two to three times total pay. Dollar-denominated equity-only limits tend to have similar or slightly smaller values; however, as a multiple of annual equity award value, they are more generous than total pay limits as a multiple of total pay. Share-denominated equity-only limits are larger and more variable, both in terms of dollar value and as a multiple of annual equity award value, which may be attributable to stock price growth since limit establishment or the desire to provide a buffer against stock price decline, among other factors. Such limits have been valued using April 30, 2016 closing stock prices and latest ASC Topic 718 option valuation assumptions.
* For total compensation limits, reflects multiple of total pay; for equity-only limits, reflects multiple of annual equity award value
Total Compensation Limit Dollar-Denominated Equity Limit Share-Denominated Equity Limit
Percentile 25th Median 75th 25th Median 75th 25th Median 75th
Dollar Value of Limit
Small-Cap Insufficient Data $300,000 $350,000 $500,000 $508,750 $602,148 $773,571
Mid-Cap $400,000 $400,000 $550,000 $450,000 $500,000 $550,000 $782,500 $1,591,500 $1,810,200
Large-Cap $600,000 $600,000 $712,500 $387,500 $500,000 $675,000 $639,030 $1,837,125 $3,039,000
Limit Multiple*
Small-Cap Insufficient Data 3.9x 4.6x 5.0x 6.4x 9.3x 20.1x
Mid-Cap 1.9x 2.2x 2.8x 2.6x 3.1x 3.8x 6.3x 12.9x 20.7x
Large-Cap 2.0x 2.3x 2.8x 2.8x 3.3x 4.6x 3.8x 12.2x 16.7x

21© 2016 FW Cook
LIST OF COMPANIES SURVEYED1-800-Flowers.com3MAbercrombie & FitchAdobe SystemsAdvance Auto PartsAlamo GroupAllstateAlon USA PartnersAmazon.comAmerican Midstream PartnersAmkor TechnologyAnadarko PetroleumAnalog DevicesApacheApartment Investment & ManagementApplied Micro CircuitsArmstrong World IndustriesAtlas Air Worldwide HoldingsAutoZoneAxcelis TechnologiesBaker HughesBanc of CaliforniaBarnes & NobleBasic Energy ServicesBazaarvoiceBB&TBeacon Roofing SupplyBed Bath & BeyondBeldenBGC PartnersBig 5 Sporting GoodsBig LotsBristow GroupBrown & BrownBuild-A-Bear WorkshopBurlington StoresCACabela’sCadence Design SystemsCaleresCallon PetroleumCarrizo Oil & GasCascade BancorpCass Information SystemsCathay General BancorpCBIZChesapeake EnergyChevronChildren’s PlaceCincinnati Financial
Citrix SystemsClayton Williams EnergyCNO Financial GroupCognexCognizant Technology SolutionsColfaxComericacomScoreConnsConocoPhillipsContainer Store GroupCore-Mark HoldingCorEnergy Infrastructure TrustCowen GroupCreeCSG Systems InternationalCTSCumminsDatalinkDCP Midstream PartnersDeere & Co.Delek US HoldingsDevon EnergyDick’s Sporting GoodsDillard’sDollar GeneralDonegal GroupDouglas DynamicsDoverDST SystemsDuke RealtyEarthLink HoldingsEllington FinancialEMCOREEncanaEnergenEnnisEnPro IndustriesEra GroupEXCO ResourcesExpeditors International of WashingtonExpressExterranExxon MobilF5 NetworksFairchild Semiconductor InternationalFBL Financial GroupFBR & Co.Finish LineFirst Bancorp

22© 2016 FW Cook
LIST OF COMPANIES SURVEYEDFirst Defiance FinancialFirstMeritFluorFoot LockerFox Chase BancorpFrancesca’s HoldingsFred’sFreightCar AmericaFuelCell EnergyGAMCO InvestorsGameStopGeneral DynamicsGeneral ElectricGenesis EnergyGerman American BancorpGibraltar IndustriesGlobal PartnersGNC HoldingsGreen DotGreen PlainsGriffonGuaranty BancorpGuess?Gulfmark OffshoreGulfport EnergyHalliburtonHartford Financial Services GroupHaverty Furniture CompaniesHealthcare Realty TrustHeartland Financial USAHelix Energy Solutions GroupHessHFFHome DepotHSNHub GroupIngram MicroIntelIntuitInvescoIron MountainItronJ.C.PenneyJabilCircuitJacobsEngineeringGroupJiveSoftwareJoyGlobalJuniperNetworksKCG HoldingsKelly ServicesKirkland’sKLA-Tencor
Kohl’sKorn/Ferry InternationalLam ResearchLaredo PetroleumLaSalle Hotel PropertiesLayne ChristensenLB FosterLife StorageLincoln NationalLockheed MartinLowe’s CompaniesMack-Cali RealtyMacy’sMarathon OilMarathon PetroleumMarinemaxMatrix ServiceMAXIMUSMentor GraphicsMetLifeMGIC InvestmentMicron TechnologyMorgan StanleyMurphy OilNational Oilwell VarcoNatural Gas Services GroupNCRNetAppNetflixNetSuiteNoble EnergyNordstromNorthern Oil & GasNorthrop GrummanOffice DepotONEOK PartnersOracleOverstock.comOxford IndustriesParker DrillingPBF EnergyPC ConnectionPDC EnergyPenske Automotive GroupPGTPHIPier 1 ImportsPiperJaffrayCompaniesPlug PowerPreformed Line ProductsPriceline GroupPrincipal Financial Group

23© 2016 FW Cook
LIST OF COMPANIES SURVEYEDQ2 HoldingsQEP ResourcesQuanta ServicesQuantumR.R. Donnelley & SonsRadiant LogisticsRealPageRed HatRegal BeloitRent-A-CenterResources ConnectionRestoration Hardware HoldingsRockwell CollinsRollinsRosetta StoneRoss StoresRowan CompaniesRyder SystemSally Beauty HoldingsSEACOR HoldingsSears HoldingsSemGroupShoe CarnivalSigma DesignsSilver Bay Realty TrustSilver Spring NetworksSirius XM HoldingsSkyWestSM EnergySonus NetworksSpectra EnergySpirit AirlinesSPXStage StoresStamps.comStanley Black & DeckerStaplesStein MartSun BancorpSuperior Energy ServicesSykes EnterprisesT. Rowe Price GroupTake-Two Interactive SoftwareTalmer BancorpTanger Factory Outlet CentersTangoeTarga ResourcesTarget
TCF FinancialTD Ameritrade HoldingTeleTech HoldingsTennantTesoroTetra TechTETRA TechnologiesTextronTile Shop HoldingsTJXCompaniesTompkins FinancialToroTransoceanTravelers CompaniesTrimbleTriumph GroupTTM TechnologiesTuesday MorningU.S. BancorpUnited Financial BancorpUnited OnlineUnited Parcel ServiceUnited RentalsUSGValero EnergyViadViavi SolutionsVirtu FinancialVornado Realty TrustWaste ConnectionsWaste ManagementWatscoWebMD HealthWebster FinancialWells Fargo & Co.WesBancoWESCO InternationalWestern DigitalWestern RefiningWillbros GroupWilliams-SonomaWilshire BancorpWoodwardWorkivaWorld Fuel ServicesWPX EnergyXylemZions Bancorporation

24© 2016 FW Cook
FW COOK COMPANY INFORMATIONFW Cook is an independent consulting firm specializing in executive and director compensation and related corporate governance matters. Formed in 1973, our firm has served more than 3,000 organizations in a wide variety of industries from our offices in New York, Chicago, Los Angeles, San Francisco, Atlanta, Houston and Boston. We currently serve as the independent advisor to the compensation committees at a substantial number of the most prominent companies in the U.S.
Our office locations:
Web Site: www.fwcook.com
This report was authored by Eric Graves and Thomas Kohn in our New York office, with assistance from Eric Winikoff in our Los Angeles office. Questions and comments should be directed to Mr. Graves at (212) 299-3719 or [email protected] or to Mr. Kohn at (212) 294-0110 or [email protected].
New York685 Third Avenue28th FloorNew York, NY 10017212-986-6330
Chicago190 LaSalle StreetSuite 2120Chicago, IL 60603312-332-0910
Los Angeles11100 Santa Monica Blvd. Suite 300Los Angeles, CA 90025310-277-5070
San Francisco135 Main StreetSuite 1750San Francisco, CA 94105415-659-0201
AtlantaOne Securities Centre3490 Piedmont Road NE Suite 550Atlanta, GA 30305404-439-1001
HoustonTwo Allen Center1200 Smith StreetSuite 1100Houston, TX 77002713-427-8300
Boston34 Washington StreetSuite 230Wellesley Hills, MA 02481781-591-3400