Embed Size (px)
Citation preview

Beer statistics2016 edition
The Brewers of Europe

Beer statistics2016 edition
The Brewers of Europe
November 2016
ISBN 978-2-9601382-7-6EAN 9782960138276


Beer Statistics | 2016 editionPage 3
Foreword by President of The Brewers of Europe ..........................p. 4
Beer production 2015 ....................................................................p. 6Beer production 2010 - 2015 ........................................................p. 7Beer consumption 2015 ................................................................p. 8Beer consumption 2010 - 2015 .....................................................p. 9Beer consumption per capita 2015 ...............................................p.10 Beer consumption per capita 2010 - 2015 ...................................p.11On-trade / off-trade 2015 .............................................................p.12On-trade / off-trade 2010 - 2015 ..................................................p.13Total imports 2015 ........................................................................p.14Imports 2010 - 2012 ....................................................................p.15Imports 2013 - 2015 ....................................................................p.16Total exports 2015 ........................................................................p.17Exports 2010 - 2012 ....................................................................p.18Exports 2013 - 2015 ....................................................................p.19Number of active breweries 2015 .................................................p.20Number of active breweries 2010 - 2015 ......................................p.21Microbreweries 2015 ....................................................................p.22Microbreweries 2010 - 2015 .........................................................p.23Number of active brewing companies 2015 ..................................p.24Number of active brewing companies 2010 - 2015.......................p.25Direct employment 2015 ..............................................................p.26Direct employment 2010 - 2015 ...................................................p.27Excise duty revenues 2010 - 2015 ................................................p.28
Glossary .......................................................................................p.29
Methodology ................................................................................p.31Acknowledgements ......................................................................p.31Disclaimer .....................................................................................p.32
1 TABLE OF CONTENTS

Page 4Beer Statistics | 2016 edition
Dear Reader,
In our last report The Brewers of Europe was confident enough to
announce that “Beer is back”. In this publication of the latest statistics
on Europe’s brewing sector, we can confirm that 2014 was indeed no
false dawn and that the renaissance has continued. Whilst still a fair way
off the levels of pre-2008, when the global economic downturn hit, both
production and consumption of beer in Europe have continued to grow,
up again a further percentage point. More than 36 billion litres of beer
were consumed across the European Union in 2015.
And we can see clearly from the raw statistics from where some of
that growth and confidence is coming. The European Union now
counts around 7,500 active breweries, almost twice the number of
2010. The footprint of Europe’s brewing sector is growing both through
the sustainable investments of Europe’s brewing leaders globally and
through exports by the smaller and medium-sized brewers in Europe.
Out of the top ten agri-food export sectors, beer is currently Europe’s
fastest growing in trade value terms.
This cohabitation of brewers large, medium and small in Europe is what
helps make the beer sector such a fascinating example of European
enterprise, with The Brewers of Europe in a unique position to unite,
represent and promote their common interests under one roof.
And beer’s deeply embedded place in Europe’s heart - its culture,
society and economy - means this upturn in fortunes for European beer
can benefit not just brewers but the whole of the EU.
The diversity of flavours, styles and strengths is delivering choice for
Europeans in an increasing variety of occasions, with more and more
beers also voluntarily providing ingredients and nutrition facts that allow
consumers to take informed decisions. The value chain from grain to
glass creates 2.3 million beer-inspired jobs in the EU. Whilst the brewers
are delivering value added across the economy and over 40 billion Euros
in tax revenues to EU governments every year.
Pavlos PhotiadesPresident of
The Brewers of Europe
2 FOREWORDBy President of The Brewers of Europe

Beer Statistics | 2016 editionPage 5
A prosperous brewing sector therefore doesn’t just give Europe’s
growing number of brewers cause to rejoice, but should also act as a
rallying cry for the whole of the continent. With the right support from
policy makers, the beer sector can continue to help grow the European
economy, all whilst ensuring beer be promoted and consumed
responsibly.
Cheers!
Pavlos Photiades
President of The Brewers of Europe

Beer Statistics | 2016 edition Page 6
3 BEER PRODUCTION 2015(in 1,000 hl)
0 20000 40000 60000 80000 100000
Malta
Luxembourg
Cyprus
Latvia
Estonia
Slovenia
Norway
Slovakia
Lithuania
Croatia
Switzerland
Greece
Finland
Sweden
Bulgaria
Hungary
Denmark
Portugal
Ireland
Austria
Turkey
Italy
Romania
Czech Republic
Belgium
France
Netherlands
Spain
Poland
United Kingdom
Germany 95,623
44,039
40,890
34,960
24,012
20,300
19,811
19,530
15,950
14,015
9,819
9,023
7,755
6,465
5,970
5,965
4,960
4,689
3,970
3,820
3,438
3,379
3,108
2,434
2,308
2,029
1,398
856
341
287
154

Beer Statistics | 2016 editionPage 7
Country 2010 2011 2012 2013 2014 2015
Austria 8,670 8,917 8,924 9,045 9,001 9,023
Belgium 18,122 18,571 18,751 18,138 18,207 19,811
Bulgaria 4,800 4,820 4,992 5,112 4,890 4,960
Croatia 3,438 3,738 3,634 3,408 3,405 3,379
Cyprus 340 314 329 322 318 341
Czech Republic 17,550 18,043 18,692 18,690 19,129 19,530
Denmark 6,335 6,590 6,080 6,166 6,110 5,970
Estonia 1,312 1,360 1,433 1,465 1,608 1,398
Finland 4,235 4,220 4,030 4,020 4,010 3,970
France 16,290 17,100 17,600 18,300 19,850 20,300
Germany 95,683 95,545 94,618 94,365 95,274 95,623
Greece 3,940 3,700 3,745 3,750 3,700 3,820
Hungary 6,295 6,249 6,312 6,181 6,239 5,965
Ireland 8,249 8,514 8,195 8,008 7,288 7,755
Italy 12,814 13,410 13,293 13,256 13,521 14,015
Latvia 1,455 1,529 1,405 1,467 968 856
Lithuania 2,925 2,922 2,841 2,886 3,172 3,108
Luxembourg 310 302 292 281 271 287
Malta 130 127 135 138 146 154
Netherlands 24,218 23,644 24,271 23,636 23,726 24,012
Poland 36,647 38,067 39,294 40,001 40,075 40,890
Portugal 8,312 8,299 7,986 7,323 7,290 6,465
Romania 16,920 16,900 18,000 16,110 14,750 15,950
Slovakia 3,112 3,123 3,206 2,883 2,648 2,434
Slovenia* 1,902 1,984 1,819 2,011 2,098 2,029
Spain 33,375 33,573 33,031 32,692 33,620 34,960
Sweden 4,788 4,845 4,711 4,755 4,643 4,689
United Kingdom 44,997 46,605 44,239 44,186 44,336 44,039
Total EU 28 387,164 393,012 391,858 388,595 390,293 395,733
Norway 2,436 2,349 2,304 2,339 2,270 2,308
Switzerland 3,539 3,546 3,515 3,370 3,432 3,438
Turkey 10,279 10,164 11,013 9,809 10,252 9,819
Total All 403,418 409,071 408,690 404,113 406,247 411,298
*Slovenia data does not cover craft brewer production which represents less than 1% of the market.Source: National brewers’ associations
3 BEER PRODUCTION 2010 - 2015(in 1,000 hl)

Beer Statistics | 2016 edition Page 8
4
0 20000 40000 60000 80000 100000
Malta
Luxembourg
Cyprus
Estonia
Latvia
Slovenia
Norway
Lithuania
Croatia
Denmark
Greece
Slovakia
Finland
Ireland
Sweden
Switzerland
Portugal
Bulgaria
Hungary
Belgium
Austria
Turkey
Netherlands
Czech Republic
Romania
Italy
France
Spain
Poland
United Kingdom
Germany 86,018
43,762
37,706
37,333
20,600
18,726
15,800
15,703
11,531
9,082
8,975
7,951
6,541
5,300
4,741
4,624
4,620
4,414
4,209
3,959
3,825
3,430
3,322
2,680
2,554
1,583
1,523
900
457
300
218
BEER CONSUMPTION 2015(in 1,000 hl)

Beer Statistics | 2016 editionPage 9
Country 2010 2011 2012 2013 2014 2015
Austria 8,878 9,105 9,110 9,005 8,885 8,975
Belgium 8,439 8,574 8,228 8,092 8,095 7,951
Bulgaria 4,891 5,100 5,404 5,462 5,230 5,300
Croatia 3,321 3,547 3,411 3,286 3,414 3,322
Cyprus 519 456 471 480 425 457
Czech Republic 15,570 15,503 15,960 15,798 15,768 15,703
Denmark 3,586 3,654 3,437 3,530 3,650 3,430
Estonia 1,063 1,020 1,010 1,020 931 900
Finland 4,443 4,551 4,286 4,337 4,244 4,209
France 19,730 20,000 19,941 19,421 19,956 20,600
Germany 87,872 87,655 86,279 85,888 86,512 86,018
Greece 4,092 4,092 3,945 3,916 3,845 3,825
Hungary 6,100 6,249 5,958 5,704 5,793 6,541
Ireland 4,814 4,721 4,677 4,328 4,481 4,414
Italy 17,249 17,715 17,458 17,544 17,755 18,726
Latvia 1,492 1,626 1,543 1,545 1,555 1,523
Lithuania 2,925 2,932 2,830 2,760 2,784 2,680
Luxembourg 317 325 319 316 308 300
Malta 196 189 199 202 211 218
Netherlands 11,956 11,974 12,122 11,721 11,326 11,531
Poland 34,484 36,236 37,803 37,388 37,644 37,706
Portugal 5,900 5,320 4,927 4,937 4,764 4,741
Romania 17,000 17,000 18,201 16,300 14,900 15,800
Slovakia 3,609 3,997 4,141 3,874 3,720 3,959
Slovenia 1,663 1,672 1,520 1,562 1,615 1,583
Spain 35,199 35,231 35,108 35,212 36,322 37,333
Sweden 4,720 4,796 4,660 4,713 4,636 4,620
United Kingdom 45,873 44,844 42,962 42,422 43,752 43,762
Total EU 28 355,901 358,084 355,910 350,763 352,521 356,127
Norway 2,750 2,526 2,446 2,471 2,525 2,554
Switzerland 4,526 4,626 4,623 4,595 4,657 4,624
Turkey 9,215 9,149 9,988 9,047 9,680 9,082
Total All 372,392 374,385 372,966 366,876 369,383 372,387
Source: National brewers’ associations
4 BEER CONSUMPTION 2010 - 2015(in 1,000 hl)

Beer Statistics | 2016 edition Page 10
5 BEER CONSUMPTIONPER CAPITA 2015(in litres)
0 30 60 90 120 150
Turkey
Italy
France
Greece
Portugal
Sweden
Spain
Norway
Malta
Cyprus
Switzerland
Hungary
Denmark
United Kingdom
Netherlands
Estonia
Belgium
Slovakia
Bulgaria
Slovenia
Finland
Croatia
Latvia
Ireland
Romania
Luxembourg
Lithuania
Poland
Austria
Germany
Czech Republic 143
106
105
98
92
80
80
80
78
77
77
77
74
73
71
71
68
67
60
59
55
54
50
49
47
47
46
35
31
31
N/A

Beer Statistics | 2016 editionPage 11
Country 2010 2011 2012 2013 2014 2015
Austria 106 108 108 106 104 105
Belgium 78 78 74 72 72 71
Bulgaria 67 69 73 74 72 74
Croatia 74 86 78 76 80 77
Cyprus 52 51 55 55 49 54
Czech Republic 143 142 147 144 144 143
Denmark 69 68 64 64 65 60
Estonia 78 72 72 73 73 71
Finland 83 85 79 80 78 77
France 31 31 31 30 30 31
Germany 107 107 108 107 107 106
Greece 36 35 35 35 35 35
Hungary 61 60 60 60 59 59
Ireland 90 86 86 79 81 80
Italy 29 30 29 29 29 31
Latvia 70 74 76 78 78 78
Lithuania 90 96 96 93 95 92
Luxembourg 85 85 83 83 83 80
Malta 47 45 48 40 48 50
Netherlands 72 72 72 70 68 68
Poland 91 95 98 96 98 98
Portugal 56 53 49 49 46 46
Romania 87 84 90 81 74 80
Slovakia 72 74 76 72 69 73
Slovenia 82 81 74 75 78 77
Spain* 48 48 48 46 N/A 47
Sweden 50 51 50 50 48 47
United Kingdom 69 67 67 66 68 67
Norway 53 51 49 49 49 49
Switzerland 57 58 57 56 56 55
Turkey 12 12 13 12 13 N/A
Rounded to the nearest litre*The Spanish info is provided by the Ministry of AgricultureSource: National brewers’ associations
5BEER CONSUMPTIONPER CAPITA 2010 - 2015(in litres)

Beer Statistics | 2016 edition Page 12
6 ON-TRADE / OFF-TRADE 2015(in %)
0 20 40 60 80 100
Estonia
Lithuania
Latvia
Poland
Finland
Romania
Germany
France
Sweden
Norway
Bulgaria
Denmark
Turkey
Austria
Netherlands
Hungary
Slovakia
Slovenia
Czech Republic
Croatia
Italy
Cyprus
Switzerland
Belgium
United Kingdom
Luxembourg
Greece
Malta
Portugal
Spain
Ireland 67 33
64 36
63 37
60 40
57 43
49 51
49 51
44 56
44 56
42 58
42 58
40 60
40 60
40 60
37 63
35 65
35 65
28 72
24 76
23 77
22 78
21 79
21 79
20 80
19 81
16 84
15 85
15 85
10 90
9 91
8 92
On-trade Off-trade

Beer Statistics | 2016 editionPage 13
2010 2011 2012 2013 2014 2015
Country On-trade
Off-trade
On-trade
Off-trade
On-trade
Off-trade
On-trade
Off-trade
On-trade
Off-trade
On-trade
Off-trade
Austria 33 67 33 67 32 68 32 68 29 71 28 72
Belgium 48 52 46 54 46 54 45 55 45 55 44 56
Bulgaria 26 74 26 74 25 75 23 77 20 80 22 78
Croatia 36 64 37 63 35 65 36 64 39 61 40 60
Cyprus 48 52 45 55 42 58 40 60 42 58 42 58
Czech Republic 48 52 48 52 43 57 41 59 41 59 40 60
Denmark 23 77 23 77 25 75 25 75 25 75 23 77
Estonia 9 91 N/A N/A 9 91 9 91 9 91 8 92
Finland 16 84 15 85 15 85 15 85 15 85 15 85
France 24 76 22 78 23 77 21 79 20 80 20 80
Germany 22 78 20 80 19 81 19 81 19 81 19 81
Greece 62 38 60 40 56 44 56 44 55 45 57 43
Hungary 38 62 38 62 38 62 35 65 35 65 35 65
Ireland 66 34 65 36 61 39 64 36 64 36 67 33
Italy 43 57 42 58 41 59 40 60 43 57 42 58
Latvia 6 94 8 92 8 92 9 91 10 90 10 90
Lithuania 9 91 9 91 8 92 8 92 10 90 9 91
Luxembourg 55 45 55 45 52 48 52 48 51 49 49 51
Malta 60 40 64 36 62 38 60 40 60 40 60 40
Netherlands 27 73 26 74 27 73 25 75 35 65 35 65
Poland 15 85 13 87 10 90 10 90 15 85 15 85
Portugal 69 31 69 31 68 33 63 37 64 36 63 37
Romania 28 72 25 75 22 78 19 81 18 82 16 84
Slovakia 40 60 40 60 40 60 40 60 34 66 37 63
Slovenia 40 60 40 60 40 60 40 60 40 60 40 60
Spain* 66 34 65 35 63 37 62 38 63 37 64 36
Sweden 19 81 19 81 20 80 20 80 20 80 21 79
United Kingdom 52 48 52 48 53 47 51 49 50 50 49 51
Norway 25 75 25 75 25 75 24 76 21 79 21 79
Switzerland 48 52 50 50 50 50 47 53 46 54 44 56
Turkey 23 77 26 74 26 74 24 76 24 76 24 76
Source: National brewers’ associations*Spanish data as available at the Ministry of Agriculture (consumption panels)
6 ON-TRADE / OFF-TRADE 2010 - 2015(in %)

Beer Statistics | 2016 edition Page 14
7 TOTAL IMPORTS 2015 (intra-EU and extra-EU in 1,000 hl)
0 2000 4000 6000 8000 10000
Turkey
Malta
Cyprus
Portugal
Norway
Luxembourg
Estonia
Czech Republic
Romania
Slovenia
Greece
Finland
Lithuania
Sweden
Bulgaria
Hungary
Denmark
Austria
Croatia
Poland
Latvia
Belgium
Switzerland
Ireland
Slovakia
Netherlands
Spain
Germany
Italy
France
United Kingdom 9,035
7,145
6,987
6,499
4,628
1,652
1,626
1,208
1,186
1,164
785
717
700
665
605
572
538
487
480
478
443
401
350
312
281
274
254
160
115
70
N/A

Beer Statistics | 2016 editionPage 15
7 IMPORTS 2010 - 2012 (in 1,000 hl)
2010 2011 2012
Country Intra-EU Extra-EU Intra-EU Extra-EU Intra-EU Extra-EU
Austria 569 46 615 59 589 91
Belgium 727 198 897 197 992 171
Bulgaria 157 40 255 41 342 82
Croatia 282 119 454 116 347 91
Cyprus 169 9 133 9 132 10
Czech Republic 999 1 583 1 511 1
Denmark 373 348 296
Estonia 367 41 343 53 378 43
Finland 584 38 546 27 477 31
France 6,832 6,680 207 7,227 206
Germany 7,334 151 7,591 103 7,186 93
Greece 527 101 611 90 548 107
Hungary 819 46 847 83 848 99
Ireland 854 2,607 1,605
Italy 6,088 237 6,150 215 5,905 250
Latvia 275 114 366 85 416 65
Lithuania 354 161 422 239 453 265
Luxembourg 185 189 192
Malta 67 4 56 5 62 2
Netherlands 2,327 2,437 2,759
Poland 276 43 419 18 608 29
Portugal 269 10 252 8 296 8
Romania 227 3 320 12 408 20
Slovakia 912 0 1,025 1 1,101 6
Slovenia 261 10 224 10 243 10
Spain 2,507 220 2,487 158 3,130 186
Sweden 459 467 477
United Kingdom 6,945 1,110 7,797 933 8,305 751
Total EU 28 44,447 47,793 48,451
Norway N/A 256 22 216 17
Switzerland 988 1,080 1,108
Turkey 14 43 32
Total All ≈ 45,727 49,194 49,824
Source: National brewers’ associations

Beer Statistics | 2016 edition Page 16
7 IMPORTS 2013 - 2015 (in 1,000 hl)
2013 2014 2015
Country Intra-EU Extra-EU Intra-EU Extra-EU Intra-EU Extra-EU
Austria 535 84 590 65 584 81
Belgium 984 44 1,001 110 1,006 158
Bulgaria 355 73 367 99 393 145
Croatia 352 87 547 141 563 137
Cyprus 147 11 107 9 108 7
Czech Republic 493 5 286 5 309 3
Denmark 373 42 474 605
Estonia 391 307 281
Finland 491 39 391 34 442 36
France 5,984 212 6,526 237 6,900 245
Germany 6,213 93 6,571 101 6,368 131
Greece 494 81 406 34 351 92
Hungary 206 343 572
Ireland 1,264 1,344 1,208
Italy 5,998 217 5,996 233 6,690 297
Latvia 443 78 801 N/A 785 N/A
Lithuania 460 275 650 480
Luxembourg 180 180 274
Malta 62 2 60 6 63 7
Netherlands 2,058 1,647 1,652
Poland 542 737 30 594 123
Portugal 133 0 182 0 160 0
Romania 522 17 430 20 325 25
Slovakia 1,157 1,272 1,626
Slovenia 250 10 337 12 401 0
Spain 3,742 145 4,305 151 4,473 155
Sweden 502 495 487
United Kingdom 8,181 627 7,824 679 8,151 884
Total EU 28 44,654 ≈ 46,220 ≈ 48,455
Norway 213 19 234 19 235 19
Switzerland 1,174 51 1,172 53 1,122 64
Turkey 29 48 N/A
Total All 46,140 ≈ 47,746 ≈ 49,943
Source: National brewers’ associations
Beer Statistics | 2016 editionPage 17
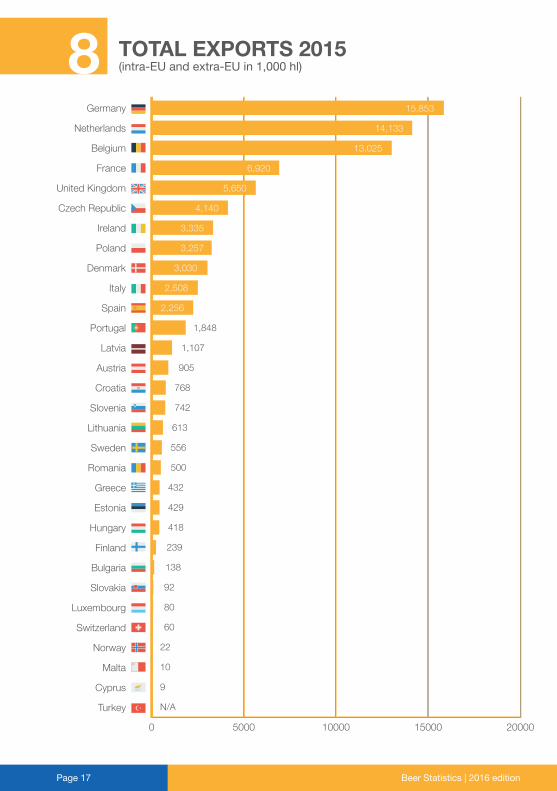
8 TOTAL EXPORTS 2015(intra-EU and extra-EU in 1,000 hl)
0 5000 10000 15000 20000
Turkey
Cyprus
Malta
Norway
Switzerland
Luxembourg
Slovakia
Bulgaria
Finland
Hungary
Estonia
Greece
Romania
Sweden
Lithuania
Slovenia
Croatia
Austria
Latvia
Portugal
Spain
Italy
Denmark
Poland
Ireland
Czech Republic
United Kingdom
France
Belgium
Netherlands
Germany 15,853
14,133
13,025
6,920
5,650
4,140
3,335
3,257
3,030
2,508
2,256
1,848
1,107
905
768
742
613
556
500
432
429
418
239
138
92
80
60
22
10
9
N/A
Beer Statistics | 2016 edition Page 18
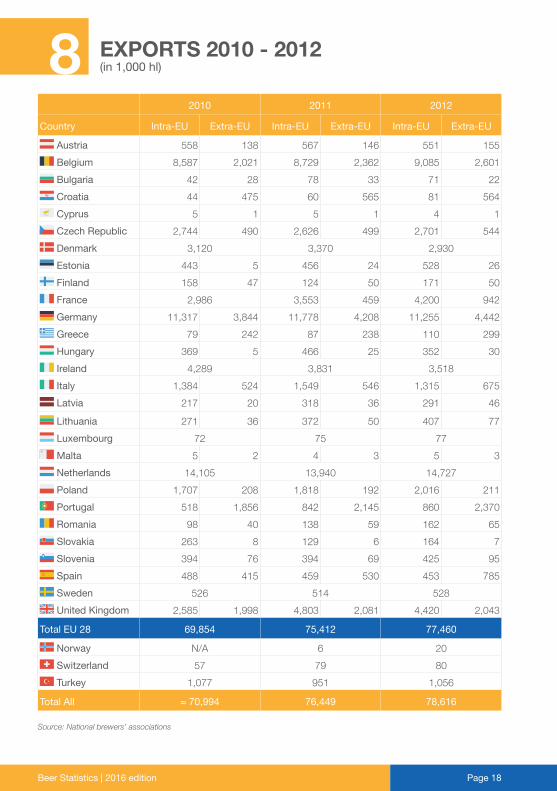
8 EXPORTS 2010 - 2012(in 1,000 hl)
2010 2011 2012
Country Intra-EU Extra-EU Intra-EU Extra-EU Intra-EU Extra-EU
Austria 558 138 567 146 551 155
Belgium 8,587 2,021 8,729 2,362 9,085 2,601
Bulgaria 42 28 78 33 71 22
Croatia 44 475 60 565 81 564
Cyprus 5 1 5 1 4 1
Czech Republic 2,744 490 2,626 499 2,701 544
Denmark 3,120 3,370 2,930
Estonia 443 5 456 24 528 26
Finland 158 47 124 50 171 50
France 2,986 3,553 459 4,200 942
Germany 11,317 3,844 11,778 4,208 11,255 4,442
Greece 79 242 87 238 110 299
Hungary 369 5 466 25 352 30
Ireland 4,289 3,831 3,518
Italy 1,384 524 1,549 546 1,315 675
Latvia 217 20 318 36 291 46
Lithuania 271 36 372 50 407 77
Luxembourg 72 75 77
Malta 5 2 4 3 5 3
Netherlands 14,105 13,940 14,727
Poland 1,707 208 1,818 192 2,016 211
Portugal 518 1,856 842 2,145 860 2,370
Romania 98 40 138 59 162 65
Slovakia 263 8 129 6 164 7
Slovenia 394 76 394 69 425 95
Spain 488 415 459 530 453 785
Sweden 526 514 528
United Kingdom 2,585 1,998 4,803 2,081 4,420 2,043
Total EU 28 69,854 75,412 77,460
Norway N/A 6 20
Switzerland 57 79 80
Turkey 1,077 951 1,056
Total All ≈ 70,994 76,449 78,616
Source: National brewers’ associations

Beer Statistics | 2016 editionPage 19
2013 2014 2015
Country Intra-EU Extra-EU Intra-EU Extra-EU Intra-EU Extra-EU
Austria 578 245 744 144 762 143
Belgium 8,247 2,827 7,906 3,316 8,891 4,134
Bulgaria 51 27 50 70 84 54
Croatia 54 501 140 539 163 605
Cyprus 5 2 5 2 6 3
Czech Republic 2,783 609 3,026 626 3,547 593
Denmark 2,646 373 3,040 3,030
Estonia 495 601 429
Finland 144 47 157 36 211 28
France 4,441 662 5,930 769 6,100 820
Germany 10,342 4,749 10,121 5,318 9,692 6,161
Greece 148 215 67 162 125 307
Hungary 480 446 418
Ireland 3,988 2,807 3,335
Italy 1,290 602 1,671 474 1,851 657
Latvia 363 68 181 26 735 372
Lithuania 430 80 653 613
Luxembourg 65 63 80
Malta 5 3 12 5 1 9
Netherlands 3,656 10,526 3,364 10,594 2,687 11,446
Poland 2,541 2,571 261 2,924 333
Portugal 809 1,699 776 1,848 871 977
Romania 277 121 253 47 378 122
Slovakia 290 200 92
Slovenia 560 160 656 168 577 165
Spain 495 871 726 1,028 966 1,290
Sweden 500 44 499 55 500 56
United Kingdom 4,479 2,080 3,399 1,843 3,570 2,080
Total EU 28 76,673 77,395 82,983
Norway 15 16 22
Switzerland 52 1 59 4 50 10
Turkey 1,048 868 N/A
Total All 77,789 78,342 ≈ 83,943
Source: National brewers’ associations
8 EXPORTS 2013 - 2015(in 1,000 hl)

Beer Statistics | 2016 edition Page 20
9 NUMBER OF ACTIVE BREWERIES2015
64 60 59 55 50 37 30 28 20 18 7 6 4 2
Less than 100
From 100 to 500
From 501 to 1,000
From 1,001 to 1,500
From 1,501 to 2,000
N/A
1,880 1,388 793 688 623 427 390 320 219 214 199 150 120 101 75 64

Beer Statistics | 2016 editionPage 21
Country 2010 2011 2012 2013 2014 2015
Austria 172 170 173 194 198 214
Belgium 135 123 150 160 168 199
Bulgaria 8 13 13 13 16 18
Croatia 7 7 6 6 6 6
Cyprus 2 2 2 2 4 4
Czech Republic 151 191 213 308 338 390
Denmark N/A 150 150 150 150 150
Estonia 6 6 7 10 15 20
Finland 25 25 30 43 49 59
France 387 442 503 580 663 793
Germany 1,333 1,347 1,340 1,349 1,352 1,388
Greece 11 17 18 20 20 28
Hungary N/A 24 50 50 50 50
Ireland 26 26 26 30 50 64
Italy 308 350 421 509 599 688
Latvia 15 16 16 25 29 37
Lithuania 41 73 73 73 75 75
Luxembourg 7 7 7 7 7 7
Malta 1 1 1 1 1 2
Netherlands N/A 125 165 N/A 263 320
Poland 103 117 132 155 133 150
Portugal 7 7 9 18 35 64
Romania 18 17 17 18 22 30
Slovakia 19 25 30 38 44 60
Slovenia 22 N/A N/A 30 51 55
Spain 65 88 132 221 332 427
Sweden 39 54 75 105 154 219
United Kingdom 828 948 1,300 1,490 1,700 1,880
Total EU 28 ≈ 4,035 ≈ 4,396 ≈ 5,087 ≈ 5,819 6,524 7,397
Norway 30 34 41 52 75 101
Switzerland 328 360 375 409 483 623
Turkey 11 11 11 12 9 N/A
Total All ≈ 4,404 ≈ 4,801 ≈ 5,514 ≈ 6,292 7,091 ≈ 8,130
Source: National brewers’ associations
9 NUMBER OF ACTIVE BREWERIES2010 - 2015

Beer Statistics | 2016 edition Page 22
10 MICROBREWERIES2015
34 32 17 15 15 6 3 2 1
Less than 100
From 101 to 500
From 501 to 1,000
From 1,001 to 1,500
More than 1,500
N/A
1,828 717 690 573 540 409 214 202 114 100 91 60 50 46 45 41

Beer Statistics | 2016 editionPage 23
Country 2010 2011 2012 2013 2014 2015
Austria 101 97 92 109 109 114
Belgium N/A N/A N/A N/A N/A N/A
Bulgaria 4 5 5 5 6 6
Croatia N/A N/A N/A N/A N/A N/A
Cyprus N/A 0 0 0 2 2
Czech Republic 65 90 20 207 238 202
Denmark N/A N/A N/A 100 100 100
Estonia 3 3 4 7 12 17
Finland 22 22 27 22 25 41
France 322 373 433 504 566 690
Germany 646 659 665 668 677 717
Greece N/A 7 8 9 10 15
Hungary N/A 20 46 46 46 46
Ireland N/A N/A N/A N/A N/A N/A
Italy 294 336 407 491 505 540
Latvia N/A N/A N/A 20 26 34
Lithuania N/A N/A N/A 30 32 32
Luxembourg 4 4 2 2 3 3
Malta 0 0 0 0 0 1
Netherlands N/A N/A N/A N/A N/A N/A
Poland 55 N/A 50 N/A N/A N/A
Portugal 0 1 3 12 30 60
Romania 0 2 2 3 7 15
Slovakia 14 20 26 33 39 45
Slovenia 20 20 28 28 49 50
Spain* 46 70 114 203 314 409
Sweden 34 49 70 100 149 214
United Kingdom* 778 898 1,252 1,442 1,648 1,828
Norway 21 26 33 43 65 91
Switzerland 280 313 328 363 440 573
Turkey 5 5 5 3 0 N/A
* Spanish data cover all microbreweries irrespective of their volume of production* UK data cover all breweries with a production up to 60,000 HL per year and which receive “small brewer relief” in the UKSource: National brewers’ associations
10 MICROBREWERIES2010 - 2015

Beer Statistics | 2016 edition Page 24
11 NUMBER OF ACTIVEBREWING COMPANIES 2015
55 54 50 37 25 25 20 16 7 6 4 2
Less than 100
From 100 to 500
From 501 to 1,000
From 1,001 to 1,500
More than 1,500
N/A
1,866 790 682 623 415 374 315 219 205 138 120 96 73 64 64 60

Beer Statistics | 2016 editionPage 25
Country 2010 2011 2012 2013 2014 2015
Austria 163 161 164 185 189 205
Belgium N/A N/A 60 N/A N/A N/A
Bulgaria 10 11 11 11 14 16
Croatia 7 7 6 6 6 6
Cyprus 2 2 2 2 4 4
Czech Republic 135 177 197 289 322 374
Denmark 120 120 120 120 120 120
Estonia 6 6 7 10 15 20
Finland 25 25 30 43 49 54
France 385 440 501 577 660 790
Germany N/A N/A N/A N/A N/A N/A
Greece 9 15 16 18 18 25
Hungary N/A 24 50 50 50 50
Ireland 24 24 24 30 50 64
Italy 302 344 415 503 593 682
Latvia 15 16 16 25 29 37
Lithuania 42 73 73 71 73 73
Luxembourg 7 7 6 6 7 7
Malta 1 1 1 1 1 2
Netherlands N/A 120 160 185 258 315
Poland 69 N/A 87 N/A N/A 138
Portugal 6 7 9 17 35 64
Romania 13 12 12 12 16 25
Slovakia 19 25 30 38 44 60
Slovenia 22 22 30 30 50 55
Spain 52 76 120 209 320 415
Sweden 39 54 75 105 154 219
United Kingdom 817 937 1,291 1,481 1,689 1,866
Norway 27 30 37 47 70 96
Switzerland 325 358 373 407 483 623
Turkey 7 7 7 8 10 N/A
Source: National brewers’ associations
11 NUMBER OF ACTIVEBREWING COMPANIES 2010 - 2015

Beer Statistics | 2016 edition Page 26
12 DIRECT EMPLOYMENT2015
Less than 500
500 to 999
1,000 to 2,499
2,500 to 5,000
Greater than 5,000
N/A
26,861 14,500 10,000 6,100 6,100 5,900 5,500 5,350 4,700 4,300 4,100 3,800 3,500 2,800 2,400 2,300
2,000 2,000 1,900 1,700 1,700 1,500 1,480 1,400 1,346 900 700 600 500 125

Beer Statistics | 2016 editionPage 27
Country 2010 2011 2012 2013 2014 2015
Austria 3,900 3,800 3,800 3,800 3,800 3,800
Belgium 5,100 5,000 4,500 4,500 4,500 4,700
Bulgaria 2,800 2,900 2,500 2,500 2,500 2,400
Croatia 1,600 1,600 1,600 1,600 1,500 1,500
Cyprus 800 700 600 600 600 600
Czech Republic 7,000 6,800 7,000 5,800 5,900 6,100
Denmark 3,900 N/A 3,500 3,500 3,500 3,500
Estonia 600 700 700 700 800 900
Finland 2,300 2,300 2,100 2,000 1,900 1,700
France 3,700 3,600 3,900 4,000 4,100 4,300
Germany 27,600 27,400 26,900 26,800 26,800 26,861
Greece 1,900 1,900 1,900 1,900 1,900 2,000
Hungary 2,000 1,700 1,600 1,700 1,700 1,700
Ireland 1,400 1,600 1,500 2,000 2,000 2,000
Italy 4,000 4,500 4,700 4,800 5,000 5,350
Latvia 1,100 N/A 1,100 1,200 1,300 1,400
Lithuania 2,000 2,000 2,000 2,000 2,300 2,300
Luxembourg N/A 130 130 130 130 125
Malta 500 300 400 400 400 500
Netherlands 6,800 6,800 6,300 6,000 6,100 6,100
Poland 15,000 N/A 16,000 16,000 16,000 10,000*
Portugal 1,500 1,500 1,400 1,500 2,100 1,900
Romania 4,200 5,900 5,900 5,700 5,400 5,500
Slovakia 1,800 1,700 1,700 1,600 1,500 1,480
Slovenia 700 700 700 700 700 700
Spain 6,800 6,000 6,000 5,600 5,600 5,900
Sweden 4,000 4,000 4,100 4,000 4,000 4,100
United Kingdom 15,100 14,000 12,800 13,300 13,900 14,500
Total EU 28 ≈ 128,230 ≈ 127,830 125,330 124,330 125,930 121,916*
Norway 2,600 2,500 2,200 1,400 1,375 1,346
Switzerland 2,300 2,800 2,800 2,800 2,800 2,800
Turkey 2,400 2,300 2,400 2,800 2,400 N/A
Total All ≈ 135,530 ≈ 135,430 132,730 131,330 132,505 ≈ 128,462*
*Poland 2015 data only cover full time positionsRounded to units of 100Source: National brewers’ associations
12 DIRECT EMPLOYMENT2010 - 2015

Beer Statistics | 2016 edition Page 28
Country 2010 2011 2012 2013 2014 2015
Austria 197.60 190.00 191.30 193.10 195.20 195.20
Belgium 187.76 183.78 180.80 183.36 196.46 194.00
Bulgaria 38.33 39.35 41.15 40.23 38.05 39.56
Croatia 91.00 N/A 88.00 79.52 77.94 189.00
Cyprus 11.06 10.81 10.88 13.51 12.23 12.35
Czech Republic 163.48 178.93 182.55 179.08 166.88 170.04
Denmark 121.00 118.59 138.73 131.40 125.19 121.35
Estonia 35.18 36.98 38.97 42.03 43.06 48.38
Finland 528.10 530.23 581.23 574.90 609.99 608.00
France 304.24 295.25 307.83 670.33 863.63 830.00
Germany 711.63 702.26 697.00 672.67 679.38 676.00
Greece 116.77 115.45 110.24 112.96 107.44 105.84
Hungary 139.21 140.74 130.17 147.47 146.48 142.88
Ireland 320.11 307.30 308.00 358.01 424.84 417.28
Italy 439.00 462.73 428.00 482.00 536.00 619.00
Latvia 25.22 26.35 25.88 24.36 25.14 27.20
Lithuania 43.54 46.60 46.15 41.71 50.98 52.67
Luxembourg 3.70 3.71 3.85 3.75 3.80 3.70
Malta 1.16 2.29 2.29 2.30 3.15 2.83
Netherlands 387.98 381.97 387.00 405.91 443.73 451.00
Poland 803.88 765.07 878.90 841.23 828.26 840.09
Portugal 76.15 73.09 65.78 71.30 69.27 70.80
Romania 130.65 133.92 141.67 154.00 149.59 157.65
Slovakia 55.83 54.83 56.08 55.73 55.46 57.13
Slovenia 70.17 74.28 72.80 75.77 80.80 85.50
Spain 304.80 305.52 307.91 304.65 311.93 315.83
Sweden 339.00 338.01 374.00 375.90 370.53 424.77
United Kingdom 3,670.63 3,973.02 4,229.73 3,976.16 4,308.97 4,449.26
Norway 570.00 N/A 600.00 597.96 583.50 N/A
Switzerland 94.00 N/A 93.00 93.00 93.00 100.00
Turkey 824.00 N/A 1,295.00 0.00 0.00 1,390.00
Where required, excise duties have been converted to Euros, according to the 1 January exchange rate of each year, as used in the European Commission’s (DG Taxud) database.For information in local currency, please consult the same database.
13 EXCISE DUTY REVENUES(in million Euros)

Beer Statistics | 2016 editionPage 29
14Beer production:Beer produced within a given country.
Beer consumption:Beer consumed within a given country.
Beer consumption per capita:Consumption per head in a given country.
Brewery:A plant or an establishment for beer production.
Brewing company:A company which produces and / or sells beer, operating one or more breweries. These companies may also be involved in activities other than brewing beer, such as the production of soft drinks and bottled mineral water.
Direct employment:Employment directly by the brewing companies.
Excise duty revenue related to beer:Government revenues generated from excise duties on the sale of beer.
Export - Extra-EU:Extra-EU exports of goods are goods which leave the territory of the European Union for a third country after being placed under the customs procedure for exports (for definitive export) or outward processing (goods for working, further processing) or repair or following inward processing.
Export - Intra-EU:Intra-EU exports of goods are goods which leave a Member State of the EU for another Member State for definitive export, outward processing or repair or following inward processing.
Hectolitre (hl):A hectolitre is a metric unit of volume or capacity where one hectolitre equals 100 litres.
GLOSSARY

Beer Statistics | 2016 edition Page 30
15Import - Extra-EU:Extra-EU imports of goods are goods which enter the territory of the European Union from a third country and are placed under the customs procedure for free circulation within the EU (as a general rule goods intended for consumption), inward processing or processing under customs control (goods for working, processing or repair) immediately or after bonded warehousing.
Import - Intra-EU:Intra-EU imports of goods are goods which enter a Member State of the EU from another Member State for definitive import (as a general rule goods intended for consumption), inward processing or processing under customs control (goods for working, processing or repair) immediately or after bonded warehousing.
Microbrewery:A brewery with yearly production up to 1,000 hectolitres.
Off-trade sector:Beer sales through wholesale and retail (shops, supermarkets and other outlets).
On-trade sector:Beer sales through (licensed) pubs, clubs, bars, restaurants, etc., also called the hospitality sector.

Beer Statistics | 2016 editionPage 31
The data for the 2016 edition were mainly collated via the national brewers’ associations through surveys carried out by The Brewers of Europe from 2010 until 2016.
With the received data the corresponding tables and charts have been prepared and verified with the interlocutors from different countries. Therefore, unless indicated otherwise in this or previous editions, all data comes from national brewers associations.
When data was not available through national associations other sources were used to complete as much as possible the tables. The sources used for this edition include:
• National brewers’ associations data• Eurostat
Figures contained in some tables may have been rounded and also corrected from previous editions of this publication.
The Brewers of Europe Secretariat would like to thank all those from national brewers associations who contributed to this brochure.
We thank 2B.COM sprl for the document’s design and support.
15
16
METHODOLOGY
ACKNOWLEDGEMENTS

Beer Statistics | 2016 edition Page 32
The information and data contained in this document are those provided by national associations unless stated otherwise. Where possible The Brewers of Europe Secretariat ensured the accuracy of the figures with those submitted by the national associations and those coming from other sources.
The Brewers of Europe does not take any responsibility for omissions, mistakes or errors appearing in this brochure which do not come from its own activities.
The Brewers of Europe Secretariat
Beer statistics 2016 edition
November 2016
ISBN 978-2-9601382-7-6EAN 9782960138276
17 DISCLAIMER


Rue Caroly 23 - 25 B - 1050 Brussels Belgium
Phone: +32 2 5511810 [email protected] www.brewersofeurope.org
The Brewers of Europe