Embed Size (px)
Citation preview
2016 National Post-Consumer Plastic Bag & Film Recycling Report
FEBRUARY 2018Prepared by More Recycling for the American Chemistry Council
MORE RECYCLING • P.O. BOX 358 • SONOMA CA 95476 • 844.687.4757 MoreRecycling.com
2016 National Post-consumer Plastic Bag & Film Recycling Report 2
TABLE OF CONTENTS
Introduction 3
Executive Summary 4
Methodology 5
Data Gaps & Assumptions 6
Findings 9
Discussion 13
Recommendations 14
Additional Information 16
Disclaimer 17
2016 National Post-consumer Plastic Bag & Film Recycling Report 3
INTRODUCTION
This 2016 National Post-consumer Plastic Bag and Film Recycling Report is the 12th annual report on the amount of plastic bags and film recovered in the United States (U.S.) for recycling. This research was conducted and the report finalized by More Recycling (MORE) for the Plastics Division of the American Chemistry Council (ACC)1. Throughout this report, plastic bags, wrap and film are generally referred to as “film,” which is defined as thin, flexible sheets of plastic. The majority of plastic films are made from polyethylene (PE) resins, such as high-density polyeth-ylene (HDPE), low density polyethylene (LDPE), and linear low density polyethylene (LLDPE), and those are the predominant forms included in this report.
1 The Environmental Protection Agency (EPA) defines “post-consumer” as a material or a finished product that has served its intended use that is then diverted or recovered before it is disposed. It is the material consumers and businesses recycle; it does not include manufacturing waste, which is commonly reused in the original manufacturing process. The EPA defines “pre-consumer” as material that is recycled before it is used by a consumer (EPA Home; Pacific Southwest. Waste. Solid Waste. Reduce, Reuse, Recycle, Buy Recycled, Oct. 15, 2015. <http://www3.epa.gov/region9/waste/solid/reduce.html#br4>). This study uses EPA’s definition throughout this report, wherein “post-consumer” refers to plastics that have been previously used for their intended purpose by consumers and businesses. Commercial materials that have met their intended use are often recovered outside of curbside or drop-off collection programs and include items such as totes, pallets, crates, and other commercial packaging. This report does not cover the recycling of post-industrial (pre-consumer) materials. An example of post-industrial material is scrap or trimmings that are generated in manufac-turing and converting processes.
2016 National Post-consumer Plastic Bag & Film Recycling Report 4
EXECUTIVE SUMMARY
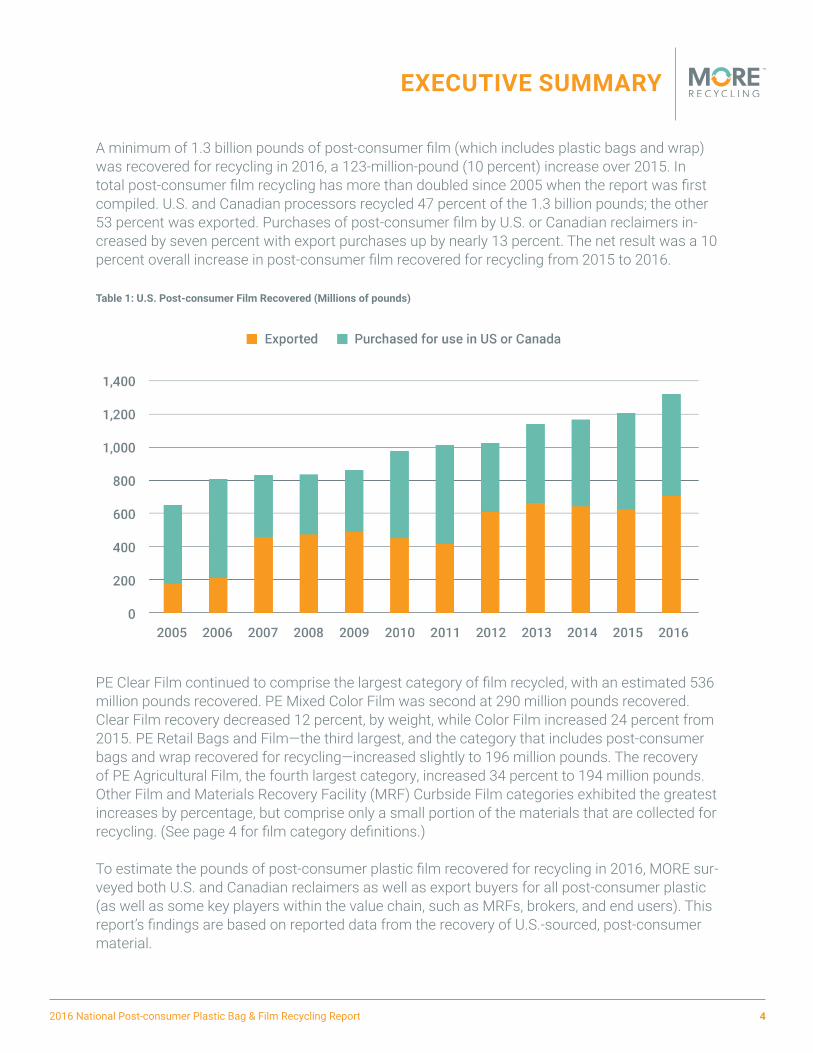
A minimum of 1.3 billion pounds of post-consumer film (which includes plastic bags and wrap) was recovered for recycling in 2016, a 123-million-pound (10 percent) increase over 2015. In total post-consumer film recycling has more than doubled since 2005 when the report was first compiled. U.S. and Canadian processors recycled 47 percent of the 1.3 billion pounds; the other 53 percent was exported. Purchases of post-consumer film by U.S. or Canadian reclaimers in-creased by seven percent with export purchases up by nearly 13 percent. The net result was a 10 percent overall increase in post-consumer film recovered for recycling from 2015 to 2016.
Table 1: U.S. Post-consumer Film Recovered (Millions of pounds)
PE Clear Film continued to comprise the largest category of film recycled, with an estimated 536 million pounds recovered. PE Mixed Color Film was second at 290 million pounds recovered. Clear Film recovery decreased 12 percent, by weight, while Color Film increased 24 percent from 2015. PE Retail Bags and Film—the third largest, and the category that includes post-consumer bags and wrap recovered for recycling—increased slightly to 196 million pounds. The recovery of PE Agricultural Film, the fourth largest category, increased 34 percent to 194 million pounds. Other Film and Materials Recovery Facility (MRF) Curbside Film categories exhibited the greatest increases by percentage, but comprise only a small portion of the materials that are collected for recycling. (See page 4 for film category definitions.)
To estimate the pounds of post-consumer plastic film recovered for recycling in 2016, MORE sur-veyed both U.S. and Canadian reclaimers as well as export buyers for all post-consumer plastic (as well as some key players within the value chain, such as MRFs, brokers, and end users). This report’s findings are based on reported data from the recovery of U.S.-sourced, post-consumer material.
2016 National Post-consumer Plastic Bag & Film Recycling Report 5
METHODOLOGY
Data on recovered post-consumer plastic film is collected through a voluntary, annual plastic recycling survey that also gathers data on plastic bottles, non-bottle rigid plastics and other plastics.
DATA COLLECTION AND ANALYSIS
MORE continually updates a proprietary database of plastic exporters, processors, reclaimers, and key brokers to help ensure that the survey reaches the key plastic scrap buyers from North America.2
MORE uses a custom-designed, web-based survey system to gather data. Although the overall methodology has not changed since the first report, MORE continually seeks ways to improve the completeness and timeliness of survey response. These changes allow for better material flow tracking and assist with avoidance of double counting.
The survey is distributed by sending an email with a unique link to each survey contact, including both U.S. and Canadian reclaimers, export buyers for all post-consumer plastic, as well as some key players within the value chain, such as MRFs, brokers, and end users.. After an appropriate amount of response time has passed, MORE employees send follow-up emails and make tele-phone calls to retrieve data. The data are entered in an online survey tool, either directly by the company being surveyed, or by MORE staff in conjunction with the relevant company. Incoming data are reviewed for accuracy, and follow-up calls are made as needed.
After data collection is complete, the data are compiled and categorized based on the detail reported.3
2 Through MORE’s project work in the industry and the websites it manages—PlasticsMarkets.org, RecycleMorePlastic.org and direc-tories on PlasticFilmRecycling.org—MORE regularly engages with companies and new contacts in this sector. MORE also identifies potential buyers through published market databases and conversations with suppliers, such as materials recovery facilities (MRFs) and reclaimers.
3 MORE conducts the survey and takes steps to maintain the confidentiality of individual responses; no individual company data are released, nor any specific data that do not have at least three companies reporting.
THE FOLLOWING STEPS ARE TAKEN TO PREPARE THE REPORT • MORE continually updates its markets database to include current exporters, reclaimers, and other handlers of plastic scrap;• MORE conducts an electronic survey of market participants in plastic recycling to collect data; and• MORE undertakes a follow-up step for survey-collected data, to help check the accuracy of the data through follow-up calls, conversations with industry contacts, and reviews of other sources of recycling industry information.
2016 National Post-consumer Plastic Bag & Film Recycling Report 6
METHODOLOGY
PARTICIPATING TRADE ASSOCIATIONSThe following Trade Associations were integral to this study: • Association of Plastic Recyclers (APR) • EPS Industry Alliance (EPS-IA)• Sustainable Packaging Coalition (SPC) • Western Plastics Association (WPA)• American Chemistry Council (ACC) • Institute of Scrap Recycling Industries (ISRI)• Canadian Plastics Association (CPIA) • Vinyl Institute (VI)
The final data totals are reviewed and analyzed; then, they are reported with as much detail as possible without compromising confidentiality. In order to determine trends and identify anom-alies that may require further vetting, the analysis includes year-to-year comparisons of totals, material categories, and trends among export and reclaimers. This quality control, which often requires follow-up with survey responders, is essential to determining if there has been an actual shift or just an entry error. Clarification may also be needed to determine whether reported material can be counted as post-consumer commercial or if it is, in fact, industrial scrap. Describing how the data are collected, and what is and is not included in the survey, provides readers of this report with the transparency needed to cross-reference the results with other recycling data.
FILM CATEGORIESThe 2016 survey used the following material categories: • PE Clear Film (formerly Commercial Clear Film) - Clear, clean polyethylene (PE) film from commercial sources, including stretch wrap and poly bags.• PE Mixed Color Film (formerly Commercial Mixed Color Film) - Mixed color PE film from commercial sources, including stretch wrap; no post-consumer bags.• PE Retail Bag and Film (formerly Mixed Film) - Mixed color, clean PE film, including stretch wrap and retail collected post-consumer bags, sacks, and wraps.• MRF Curbside Film (formerly Curbside Film) - Post-consumer PE Mixed film collected curbside and • PE Agricultural Film (formerly Agricultural Film) - Includes clean and dirty agricultural film. Dirty agricultural film has been in contact with the ground and may include up to 50 percent contamination (e.g., mulch film). Clean agricultural film has been used in applications that do not involve contact with the ground and may include up to 10 percent contamination (e.g., greenhouse film). • Other Film - A “catch-all” for film that does not fit in any of the categories above; includes PE film not described above, as well as non-PE film such as polypropylene (PP) and polyvinyl chloride (PVC).
2016 National Post-consumer Plastic Bag & Film Recycling Report 7
DATA GAPS AND ASSUMPTIONS
Participation in the survey is voluntary and the reported data are based on the responses received. Many companies have limited resources to put towards participation in the survey, and some companies may choose not to respond due to their confidentiality policies. Therefore, because there is not 100 percent participation, the presented totals represent the minimum amount of plastic film recovered for recycling and sold on the marketplace. Only data provided by North American reclaimers and exporters selling directly overseas, are included in the reported totals, unless we determine that data is missing in areas where substantive information from other reliable sources is available. Only U.S. and Canadian reclaimers currently respond to the survey. Data provided by brokers and material recovery facilities (MRFs) are primarily used as a reference to better understand the flow of material, but MORE may include data from these sources if enough information is provided that would enable us to attribute material sold to a reclaimer or direct exporter that had not responded to the survey.
Again, since participation in the survey is voluntary, MORE sometimes receives responses from existing companies that did not previously respond. Increases in year-to-year recovery rates are often a combination of increased collection, along with material that was recycled in previous years, but not reported. When MORE can ascertain the nature of an increase (or decrease), the reasoning is indicated; however, it can be difficult to make a solid determination in any given year, depending on the depth of information MORE receives from plastic handling companies from previous years, and while taking into account the need to protect confidentiality.
MORE tracks exporters’ purchasing of plastic film through a number of industry resources. Except for the largest exporters, players in the export market come and go, and may change the type or mix of materials that they purchase. When final efforts to track down survey non-responders was underway in mid- to late 2017, there were growing concerns about when China’s policy restricting the import of scrap materials would take effect. As a result, exporters were far less responsive to calls about their buying history or follow-up survey inquiries. Based on knowledge gleaned from industry resources, there are at least two large exporters that may have purchased post-consumer film that did not respond to the 2016 survey.
In addition to the potential impact of non-responders, changes in how responders report pounds in the survey categories has an impact on the totals reported year over year. There is some play between responders reporting pounds in PE Retail Bag and Film and PE Mixed Color. Also, responders tend to lump a mixture of film categories in Other Film rather than break out their purchased volumes into the individual PE film categories. The total volumes reported in the Other Film category in this report are likely indicative of this. Determining the amount of post-consumer bags and wrap recovered for recycling is not straightforward. Most retailers combine consumer-returned bags and wrap with film for trans-port to markets that can reclaim a mixture of polyethylene film. These bales are reported by re-
2016 National Post-consumer Plastic Bag & Film Recycling Report 8
DATA GAPS AND ASSUMPTIONS
claimers and exporters in the PE Retail Bags and Film category. MORE estimates the recovery of post-consumer bags and wrap from consumers by adding a percentage of the PE Retail Bags and Film total to the total MRF Curbside Film. The percentage used is based on percentages reported by reclaimers and their market share and is explained in more detail in the “Findings, Post-con-sumer Bags and Wrap Recycling” section below (page 10).
2016 National Post-consumer Plastic Bag & Film Recycling Report 9
FINDINGS
FILM RECYCLED
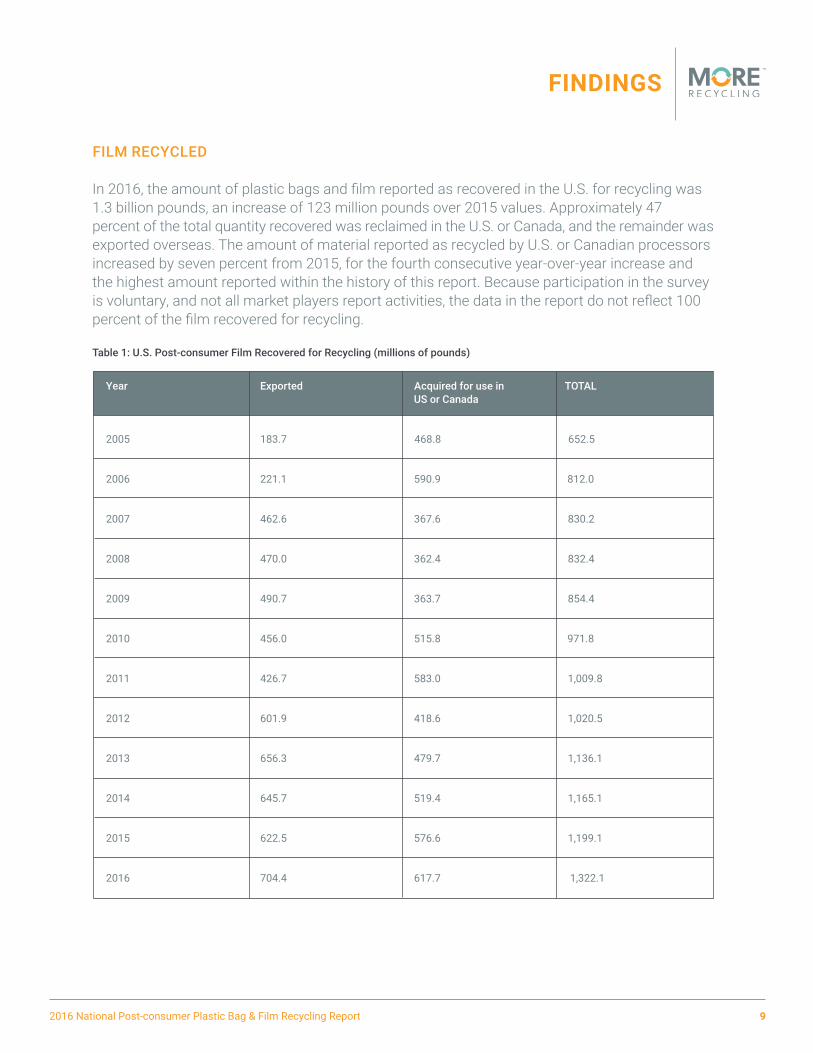
In 2016, the amount of plastic bags and film reported as recovered in the U.S. for recycling was 1.3 billion pounds, an increase of 123 million pounds over 2015 values. Approximately 47 percent of the total quantity recovered was reclaimed in the U.S. or Canada, and the remainder was exported overseas. The amount of material reported as recycled by U.S. or Canadian processors increased by seven percent from 2015, for the fourth consecutive year-over-year increase and the highest amount reported within the history of this report. Because participation in the survey is voluntary, and not all market players report activities, the data in the report do not reflect 100 percent of the film recovered for recycling.
Table 1: U.S. Post-consumer Film Recovered for Recycling (millions of pounds)
Year Exported Acquired for use in TOTAL US or Canada
2005 183.7 468.8 652.5
2006 221.1 590.9 812.0
2007 462.6 367.6 830.2
2008 470.0 362.4 832.4
2009 490.7 363.7 854.4
2010 456.0 515.8 971.8
2011 426.7 583.0 1,009.8
2012 601.9 418.6 1,020.5
2013 656.3 479.7 1,136.1
2014 645.7 519.4 1,165.1
2015 622.5 576.6 1,199.1
2016 704.4 617.7 1,322.1
2016 National Post-consumer Plastic Bag & Film Recycling Report 10
FINDINGS
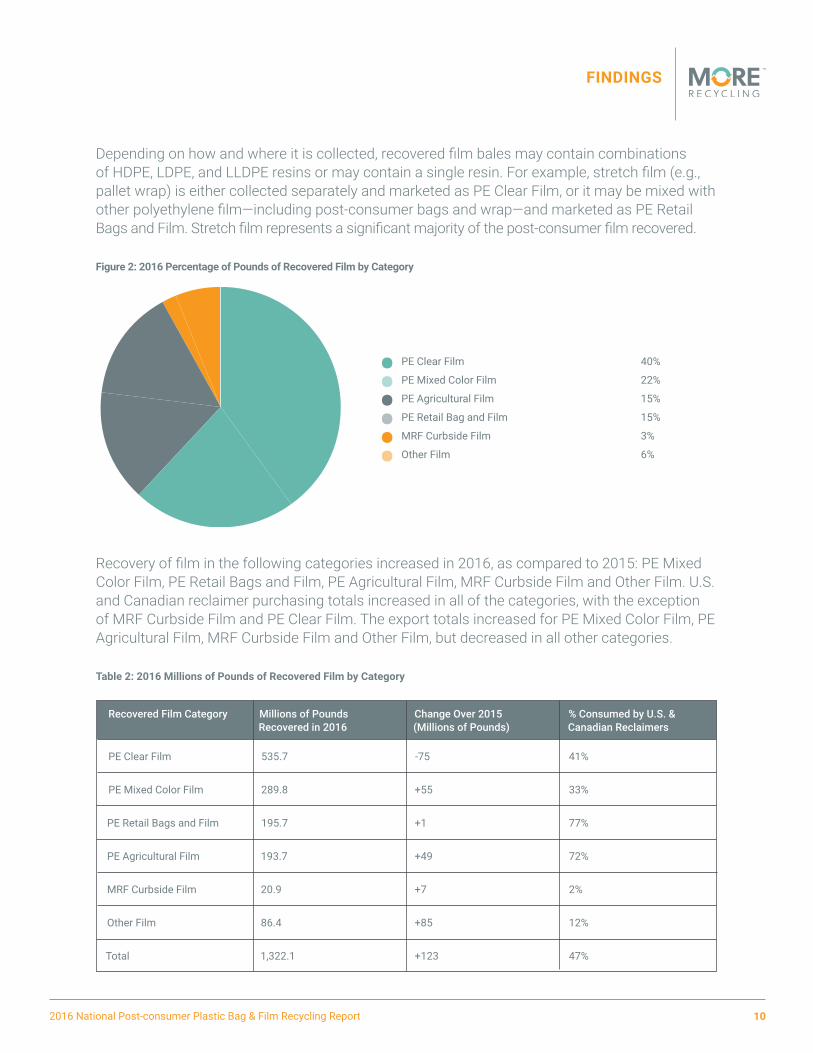
Depending on how and where it is collected, recovered film bales may contain combinations of HDPE, LDPE, and LLDPE resins or may contain a single resin. For example, stretch film (e.g., pallet wrap) is either collected separately and marketed as PE Clear Film, or it may be mixed with other polyethylene film—including post-consumer bags and wrap—and marketed as PE Retail Bags and Film. Stretch film represents a significant majority of the post-consumer film recovered.
Figure 2: 2016 Percentage of Pounds of Recovered Film by Category
Recovery of film in the following categories increased in 2016, as compared to 2015: PE Mixed Color Film, PE Retail Bags and Film, PE Agricultural Film, MRF Curbside Film and Other Film. U.S. and Canadian reclaimer purchasing totals increased in all of the categories, with the exception of MRF Curbside Film and PE Clear Film. The export totals increased for PE Mixed Color Film, PE Agricultural Film, MRF Curbside Film and Other Film, but decreased in all other categories.
Table 2: 2016 Millions of Pounds of Recovered Film by Category
Recovered Film Category Millions of Pounds Change Over 2015 % Consumed by U.S. & Recovered in 2016 (Millions of Pounds) Canadian Reclaimers
PE Clear Film 535.7 -75 41%
PE Mixed Color Film 289.8 +55 33%
PE Retail Bags and Film 195.7 +1 77%
PE Agricultural Film 193.7 +49 72%
MRF Curbside Film 20.9 +7 2%
Other Film 86.4 +85 12%
Total 1,322.1 +123 47%
PE Clear Film 40%
PE Mixed Color Film 22%
PE Agricultural Film 15%
PE Retail Bag and Film 15%
MRF Curbside Film 3%
Other Film 6%
••••••
2016 National Post-consumer Plastic Bag & Film Recycling Report 11
FINDINGS
POST-CONSUMER BAGS AND WRAP RECYCLING
Plastic bags and wrap are commonly commingled with stretch film wrap and other retailer-generated scrap film for efficient collection at retail locations; therefore, “bag only” bales, containing only bags and wrap, are rare. Thus, as indicated in the Data Gaps and Assumptions section, the total amount of recovered post-consumer bags and packaging is defined in this study as the com-bined total of MRF Curbside Film with a specific percentage of the PE Retail Bags and Film bale.
Using the available data, MORE estimates that 132 million pounds of post-consumer bags and wrap were recovered for recycling in 2016, which is a six percent increase from 2015. A private national bale audit in the retail sector provided the percentage of bags in PE Retail Bags and Film bales from 2012-2016.4 The bale audit study was conducted by members of the Flexible Film Recycling Group (FFRG), which represents more than half of the U.S. reclamation capacity for post-consumer film.5 Based on the findings of the bale audit study, this report assumes that 57 percent of PE Retail Bags and Film bales are bags and wrap. Given the historical variability in percentages, this is a rough estimate of consumer-returned bags and wrap recovered for recycling, and it is also a conservative estimate. To further detail the make-up of the 57 percent, retail bags (grocery or carryout) comprise approximately 20-25 percent, consumer-returned packaging wrap and other bags comprise approximately 35-40 percent, and stretch wrap accounts for most of the remainder.
DOMESTIC CAPACITY AND END MARKETS
MORE estimates that in 2016 there was approximately 1 billion pounds of plastic film reclama-tion capacity in the U.S., which includes total capacity to wash or process unwashed material di-rectly into regrind, agglomerate, pellets, or end products.6 The utilization rate was approximately 59 percent in 2016, which is a 10 percent decrease from 2015.7 The approximately 130-million-pound increase in estimated capacity is due to additional informa-tion provided by survey responders in 2016 compared to 2015, as well as to several companies reporting increases in capacity. The overall utilization rate decreased because the increase in reclamation capacity was more significant than the increase in reclaimer purchases for 2016. If companies omit their capacity data, MORE uses the pounds purchased for recycling as an esti-mate of their respective capacities.
4 Prior to the 2012 Report, MORE used an average of the percentages of bags in PE Retail Bags and Film bales reported by reclaimers. 5 In addition to the private bale audit study, the FFRG conducted bag audits on material recovered during Wrap Recycling Action Program’s (WRAP) educational campaigns in WI, WA, and CT to assess the impacts of specific signage and education at the retail level on the quality and volume of recovered film. More information about WRAP reports, including bag audits, is available on PlasticFilmRecycling.org (see the Recommendations section for information about WRAP).
6 Capacity for processing post-consumer film often overlaps with capacity to process post-industrial film and in some cases bottles and non-bottle rigid plastics. The annual United States National Post-consumer Plastic Bottle Recycling Report and the annual National Post-consumer Non-bottle Rigid Plastic Recycling Report likely report some capacity that is also reported here. Thus, adding the non-bottle rigid, bottle, and film capacities from this report and the others could result in some double counting.
7 Utilization, or the rate at which potential production levels are being met, can be determined by dividing the total pounds reported as acquired for recycling by the estimated capacity.

2016 National Post-consumer Plastic Bag & Film Recycling Report 12
FINDINGS
Most of the U.S. film processing capacity is for clean polyethylene film, which can be used to make a new product without washing, or for single-resin film (e.g., LDPE only). The primary domestic end uses for plastic film include composite lumber, film and sheet, and “other” uses, which may include products such as crates. Composite lumber remains the dominant domestic end use market for post-consumer film. The survey asked responders to characterize the 2016 market as compared to previous years. Significant comments included responders’ struggle to compete with off-spec virgin resin and the reduced demand for their products; it was also noted, however, that the supply of baled material had remained steady.
NOTE: THE REMAINING SECTIONS OF THIS REPORT PRESENT DISCUSSION AND RECOMMENDATIONS THAT
REFLECT MORE RECYCLING’S EXPERTISE AND INDUSTRY KNOWLEDGE.
Film/Sheet37%
Lumber43%
Other20%
Figure 3: Reclaimed U.S. Post-consumer Film: 2016 End Uses
2016 National Post-consumer Plastic Bag & Film Recycling Report 13
DISCUSSION
More Recycling tracks the plastic film recycling market throughout the calendar year. Pricing was fairly steady for all scrap film commodities throughout 2016. Export buyers paid slightly more than domestic reclaimers for PE Clear Film, while domestic reclaimers paid more, on average, for PE Retail Bag and Film than exporters. More MRF Curbside Film was collected for recycling in 2016, as compared to 2015, but it makes up less than two percent of the total film collected for recycling, with 80 percent of that two percent going to export markets. Most of the film reported in Other Film was described as PE, not PP or PVC, as has been the case in previous years. It’s possible that the drop in PE Clear Film is due to volumes reported in Other Film that should have been reported in specific categories such as PE Clear, however it’s also possible that the drop is due to missing export volumes (i.e., those from non-responders) since there was demand for Clear Film from export markets in 2016.
Overall, plastic film recycling increased for the 12th year in a row, with this growth largely due to demand from export markets, certainly for the past five years. The fundamental challenges outlined in the 2015 Report persist. With 53 percent of the collected material going to export markets and most of the domestic reclamation capacity focused on PE Clear Film or single resin material, the United States is not well-positioned to process all of the material that gets collected, especially MRF Curbside Film and PE Retail Bag and Film. While capacity to process commer-cially generated film (e.g., PE Clear Film) has grown to meet recycled content requirements in products such as trash bags or carry out bags, we have seen little market development for PE Retail Bag and Film or MRF Curbside Film. As China enacts policies to improve its environment through stricter quality requirements for incoming scrap materials, there is an increased need to enhance domestic demand and non-economic incentives for using postconsumer resin (PCR) such as recycled content requirements or carbon dioxide emissions savings.
2016 National Post-consumer Plastic Bag & Film Recycling Report 14
RECOMMENDATIONS
Two primary issues must be addressed for continued growth in film recycling:
• Reclaimers are struggling to compete with virgin resin, including off-spec, which is dampening
the market demand for PCR film, which in turn provides disincentive for improving collection the
infrastructure.
• There is widespread lack of awareness of how to recycle film. Most people have not yet been
educated about what film can be recycled, or that it can and should be recycled at participating drop
off locations. With lack of awareness the quality of the film recycling stream and curbside recycling
stream suffer as consumers include bags and wrap in their curbside mix.
MARKET DEVELOPMENT & INFRASTRUCTURE EXPANSION
In late 2017 More Recycling, released the “End Market Demand for Recycled Plastic” study. The research, funded by the American Chemistry Council, the Association of Plastic Recyclers, and the Sustainable Packaging Coalition, documented domestic demand for polyethylene post-consumer resin (PCR). Specifically, the report found that, in 2015, converters had the capacity to process only 76 percent of the PE PCR collected for recycling for recycling in the U.S. The economic competitiveness virgin resin affects the value of PCR. When PCR fails to offer an economic advantage over virgin, demand for PCR fades unless other environmental benefits are a priority, as mentioned above. Lifecycle studies and EPA tools indicate that PCR has a lower carbon footprint than virgin resin. MORE recommends policies that recognize a product’s overall impact on greenhouse gas savings. If a product can be made with PCR without sacrificing performance, then it should have greater market attractiveness.
Once PE PCR is more highly valued in the marketplace, we will likely see the necessary steps taken to close the gaps in collection for film, particularly film collected in the commercial sector. Nearly every business generates film—often clean, clear polyethylene and in greater amounts than film generated in households—but since commercial collection programs generally commingle recyclables, film is left to the trash stream. The value of the collected film must be greater than the cost to collect, handle, and ship material to be processed into new products. Expanding the film collection network is dependent on new end use markets that drive demand and therefore also drive collection programs that meet market specifications.
2016 National Post-consumer Plastic Bag & Film Recycling Report 15
RECOMMENDATIONS
HARMONIZATION OF RECYCLING EDUCATION & DESIGN FOR RECYCLING
Plasticfilmrecycling.org has been available to the public for more than 10 years; the website receives more than hundred thousand hits each year. Site visitors seem eager for more infor-mation, and yet a large portion of society remains unaware of the fact that they can and should recycle a long list of household bags and wraps—beyond the carry-out bag. Moving forward we recommend aligned messaging from the recycling industry on how best to handle film and recy-clables in general.
The Wrap Recycling Action Program (WRAP) is a national public outreach initiative, created by the Flexible Film Recycling Group in 2013, to increase film recycling by engaging key stakeholders to improve education and to activate collection networks. WRAP case studies demonstrate that broader adoption of WRAP signage among retailers, and wide use of the How2Recycle label among brand owners, helps to significantly increase recycling of plastic bags and wraps.8 While WRAP has proven that education can lead to increased consumer participation and improved quality, the impact is limited to the geographic regions that have had focused and sustained education and engagement by partnering retailers, brand companies, and local governments.
Improving the quality of the recycling stream remains a top priority for recycling programs such as WRAP, but moving forward, emphasis will likely shift to buying recycled. Quality is the result of the original design of the product or package, as well as the handling and sorting practices for that package once the product has been used. With key tools like the APR Design Guide® for Plastics Recyclability and the How2Recycle label working in partnership, there has been positive movement in designing for recycling.9 However, with demand challenges for PCR, we recommend that future design goals strive for recyclability plus recycled content.
8 Free signage and other educational materials are available at PlasticFilmRecycling.org 9 The APR Design Guide for Plastics Recyclability, http://www.plasticsrecycling.org/apr-design-guide/apr-design-guide-home ; How-2Recycle label - www.how2recycle.info
2016 National Post-consumer Plastic Bag & Film Recycling Report 16
ADDITIONAL INFORMATION
The Plastics Division of the American Chemistry Council, which provided funding to More Recycling (MORE) to prepare this report, provides resources to assist communities, businesses and others to increase awareness and education about the recycling of plastic bottles, containers, bags, and film. MORE, formerly known as Moore Recycling Associates, is a recognized expert in the field of plastics recycling and has been conducting recycling studies for over 27 years. This work has been conducted and evaluated in an objective manner by persons qualified to do so, using procedures generally accepted in the profession. Visit www.PlasticFilmRecycling.org for updates on WRAP programs, including results from cam-paigns. MORE provides technical support for WRAP, which is primarily funded by ACC’s Flexible Film Recycling Group. Also visit www.PlasticsMarkets.org, which is maintained by MORE Recycling, for information about additional markets and handling guidelines. This report and others on plastic recycling can be found at www.MoreRecycling.com.
2016 National Post-consumer Plastic Bag & Film Recycling Report 17
DISCLAIMER
The 2016 National Report on Post-consumer Plastic Bag and Film Recycling was prepared to provide information to parties interested in the recycling of plastics, and in particular, plastic bags and film. While provided in good faith, this report is not designed or intended to define or create legal rights or obligations. ACC does not make any warranty or representation, either express or implied, with respect to the accuracy or completeness of the information contained in this report; nor does ACC assume any liability of any kind whatsoever resulting from the use of, or reliance upon, any information, conclusion, or options contained herein. This work is protected by copyright. The ACC, which sponsored the report and is the owner of the copyright, hereby grants a nonexclusive royalty-free license to reproduce and distribute this work, subject to the following limitations: (1) the work must be reproduced in its entirety, without alterations; and (2) copies of the work may not be sold.
Copyright © American Chemistry Council 2018.