Embed Size (px)
Citation preview

#Obsepub2016 Report17th Edition – January 2017

2
We interviewed 29 actors for the report

1. Digital market evolution
2. Display advancing at varying speeds
A. Formats: strong growth in video
B. Formats: a hard year for classic display
C. Programmatic now dominating display
3. Mobile continuing to pick up, thanks to social and search
4. Search and other levers
5. Trends and outlooks
3
Contents

4
01
DIGITAL MARKET
EVOLUTION

2 7913 047 3 216
3 453
2013 2014** 2015** 2016
* Growth observed on the old perimeter ** New perimetersThe perimeter included the following segments: search engines, display, local searches, referrals, direct e-mail, shopbots and mobile.Calculation of the total online market accounted for channel deduplication. Sources: PwC analysis, SRI, UDECAM
+3%+4%*
+6%
+7%
5
Annual evolution of the digital advertising market in France(in €M)
Continued overall growth for the digital market

27,8% 27,6%
21,7%
10,0%
6,7% 6,2%
TV Digital Presse Affichage Annuaire Radio
2015 2016
6
Confirmation of digital's overtaking of TV in the 1st half of the year
Annual evolution of the advertising market in France
(as a share of media spending*)
Sources: SRI-IREP figures for 2015 and Q1 + Q2 + Q3 2016* Media: TV, radio, press, display, digital and directory
28,1%29,6%
20,2%
10,5%
5,4% 6,1%
TV Digital Presse Affichage Annuaire Radio
44,1%
46,8%
2015 2016
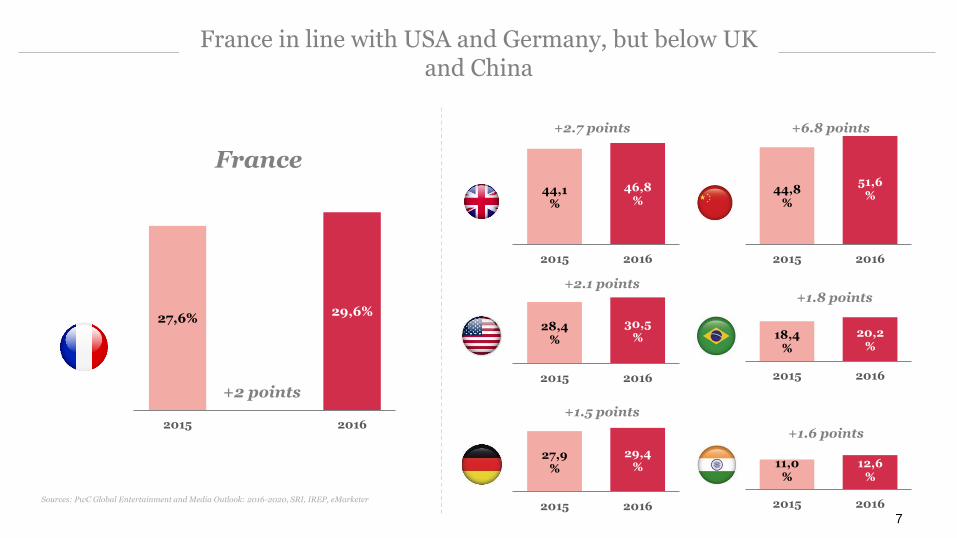
27,6%29,6%
2015 2016
Sources: PwC Global Entertainment and Media Outlook: 2016-2020, SRI, IREP, eMarketer
+2.1 points
+2.7 points
France
+2 points
7
+1.5 points
France in line with USA and Germany, but below UK and China
44,8%
51,6%
2015 2016
+6.8 points
28,4%
30,5%
2015 2016
27,9%
29,4%
2015 2016
+1.8 points
18,4%
20,2%
2015 2016
+1.6 points
11,0%
12,6%
2015 2016

434 447
2015 2016
1 0511 204
2015 2016
1 815 1 893
2015 2016
* Here, display includes all formats, all devices and all marketing methods** Referrals, direct e-mail and shopbots. Search and display include local advertisingSources: PwC analysis, SRI, UDECAM
Digital media mix in France (in €M)
Search Display* Other levers**
Share of digital 55% 35% 10%
8
Growth mainly generated by display
+4.3% +14.5%
+3.2%
56% 33% 11%

A market on the rise, confirming its
primary growth levers...
9
Global growth of the market, masking heightened divides between players
... but with inequalities in the
distribution of that growth picking up
steam

10
02
DISPLAY ADVANCING AT
VARYING SPEEDS

11
A year full of change and new awareness for the display market
Experience: responses to increasing numbers of ad
blockers
Visibility now a strategic KPI Transparency continuing to rise

12
Social networks* responsible for all of the growth in display
Sources: PwC analysis, SRI and UDECAM statements, public information
279453
772
750
20162015
Outside social networks
Social networks*
62%
Annual evolution of the digital display market in France (in €M)
38%
2016 share
+62%
-3%
1 204
1 051
+62%growth in social in France in 2016, compared with 2015
Owned: a corporate page or account on a social network
Earned: the brand's influencers and intermediaries on social networks
EXCLUDING
(vs 73% in 2015)
(vs 27% in 2015)
* Social networks, including all formats, all devices and all marketing methods (excluding YouTube)

13
2A
FORMATS:
STRONG GROWTH
IN VIDEO

131
417
656
119
309
623
Display spending in France, by format (in €M)
14
35%
54%
2016 share
For display, video maintained strong growth in 2016
** Classic display includes banner formats, suggestion modules & content links, for all marketing methods and all devicesSources: PwC analysis, SRI and UDECAM statements, Médiamétrie, public information
+5%
+10%
+35%Video
Classic**
SOs
2016
2015
11%
(vs 59% in 2015)
(vs 29% in 2015)
(vs 11% in 2015)
* Display includes all formats (video, classic and special operations), all marketing methods (programmaticand non-programmatic) and all devices (mobile, desktop and IPTV)

15
Social networks carrying a large proportion of video growth
* All devices and all marketing methods;YouTube is not counted as a social networkSources: PwC analysis, SRI and UDECAM statements
26
117
283
300
20162015
Evolution of video* spending
(in €M)
+351%
+6%
417
30972%
28%
2016 share
(vs 92% in 2015)
(vs 8% in 2015)
Outside social networks
Social networks

70
150
239
267
20162015
16
Instream still the #1 video* format, with outstream rising significantly on social networks
Sources: PwC analysis, SRI and UDECAM statements, Médiamétrie, public information* All devices and all marketing methods
Instream video
Outstream video
64%
Evolution of instream vs outstream video* spending (in €M)
36%
2016 share
115%
+12%
417
309
Evolution of outstream video* spending, social network share (in €M)
30
11340
37
20162015
Outside social networks
Social networks
25%
75%
2016 share
275%
-7%
150
70
(vs 77% in 2015)
(vs 23% in 2015)
(vs 57% in 2015)
(vs 43% in 2015)

17
Strong growth continues for IPTV
Sources: PwC analysis, SRI and UDECAM statements, Médiamétrie, public information
2015* 2016
3045
+47%
Evolution of IPTV display spending in France
(in €M)

18
2B
FORMATS:
A HARD YEAR FOR CLASSIC
DISPLAY

19
Opposite evolutions withinclassic display*
* Classic display includes banner formats, suggestion modules & content links, for all marketing methods and all devicesSources: PwC analysis, SRI and UDECAM statements, Médiamétrie, public information
253336
370319
20162015
Outside social networks
Social networks
49%
51%
2016 share
+33%
-14%
656623 +5%
€47.6M
In 2016, suggestion modules pursued their growth
7.3% of classic display
+18% growth vs 2015
20
2C
PROGRAMMATIC NOW
DOMINATING DISPLAY

21
Definition used by the Observatory
Definition ofprogrammatic
? Inventory sold by automatically connecting buyers and sellers. It includes all automated sales models: guaranteed or not, fixed price or RTB, private
marketplaces or open auctions, self-serve platforms or trading desks.
Social network sales are also considered programmatic sales.
Sources: PwC
* All devices and all formats** Growth observed on the old perimeterSources: PwC analysis, SRI and UDECAM statements*** New perimeters
22
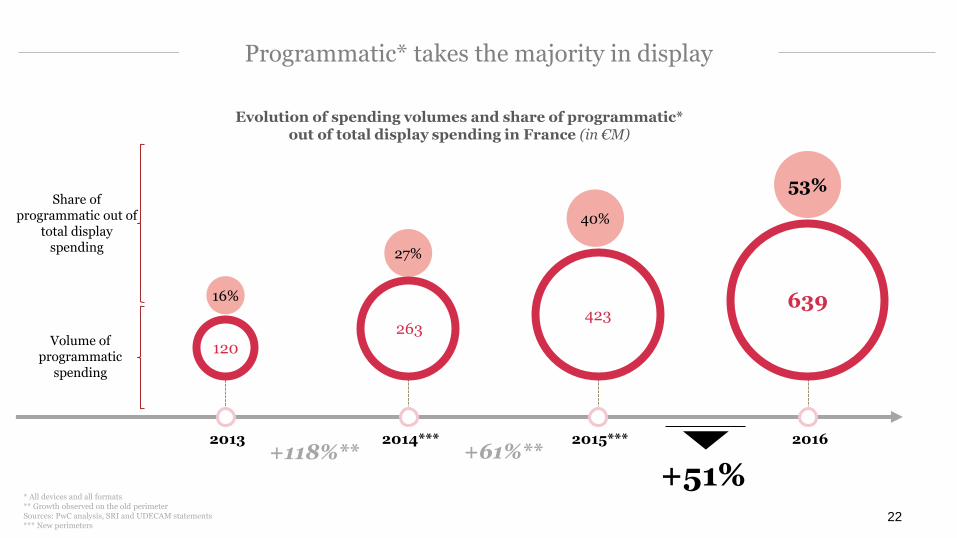
Programmatic* takes the majority in display
+51%
2013
16%
Volume of programmatic
spending
Share of programmatic out of
total display spending 27%
2014***
40%
2015***
53%
2016
Evolution of spending volumes and share of programmatic* out of total display spending in France (in €M)
120
263423
639
+61%**+118%**

23
Social networks generating most programmatic* growth
* All devices and all formatsSources: PwC analysis, SRI and UDECAM statements, public information
279
453
144
186
20162015
Evolution of programmatic* spending (in €M)
+29%
639
423
Outside social networks
Social networks
+62%
71%
29%
2016 share
(vs 66% in 2015)
(vs 34% in 2015)
Programmatic spending out of total display,
excluding social networks
= 30%

Sources: PwC analysis, SRI and UDECAM statements, public information
Mobile also contributing to programmatic growth
6076
84
110
20162015
Programmatic desktop
Programmatic mobile
59%
Evolution of programmatic spending, excluding social networks*, by device (in €M)
41%
2016 share
25%
+32%
186
144
81% of programmatic
mobile spending generated by social networks
25
Programmatic trends
Programmatic premium is growing stronger
Private deals are continuing to rise
Spending is becoming algorithmic
Technical solutions based on
machine-learning algorithms are
emerging, to automate the
optimization of programmatic
campaigns.
Private deals are capturing
advertising on the lookout for
inventory volume, price and
quality guarantees.
Sharp rise in videos deals and in
deals incorporating data. Gradual
extension to premium inventories.

Breakdown of display, by format (in €M)
Breakdown of display,
by device (in €M)
26
Mixed trends on the digital display market in France
63953%
56547%
Displayprogrammatique
Display nonprogrammatique
Breakdown of display, by buying method (in €M)
41735%
65654%
13111%
Display vidéo
Classique
OPS
44437%
71659%
454%
Display Mobile
Desktop
IPTV
Programmatic +51%
Video+35%
Mobile+60%
Sources: PwC analysis, SRI and UDECAM statements, public information
Excl. social +29%
Excl. social +6%
Excl. social +30%

27
03
MOBILE CONTINUING TO PICK
UP, THANKS TO SOCIAL AND
SEARCH

Display€277M
Search*€456M
Evolution of mobile spending on search* and display (in €M)
Display€444M
* SEMSources: PwC analysis, SRI and UDECAM statements, public information
2013 2014 2015 2016
+72%
229460
Search*€821M
+59%+77%**
35%
65%
1 264Share of mobile spending
(as a %)
28
2015-2016 growth (as a %)
+60%
+80%
Growth in mobile continuingto pick up in 2016
733

Split between display and search* spending, by device (in €M)
Inclusion of desktop and mobile (smartphones and tablets) for search and display, excluding IPTV * SEM; ** Médiamétrie, eStat'Web, December 2016; *** IAB Internet Advertising Revenue Report, HY 2016, November 2016& IAB UK, H1 2016 Digital Adspend Results, October 2016Sources: PwC analysis, SRI and UDECAM statements
29
Mobile share finally approaching desktop share
9%17%
26%
41%
91%83%
74%
59%
3 0532 8362 6832 424
2013 2014 2015 2016
66.5%**of connections are now
made via mobile
33.5%**of connections are made
from a desktop environment
Uses
43%***
51%***

Sources: PwC analysis, SRI and UDECAM statements, public information
30
Social, which is "natively mobile," accounts for most mobile display spending
202346
77
107
20162015
Evolution of ad spending on social networks, by device (in €M)
+71%
+39%
453
279
Share of mobile in social network spending in 2016 (as a %)
76%
24%
Desktop
Mobile
Desktop
Mobile

Sources: PwC analysis, SRI and UDECAM statements, public information
31
Mobile share of video display spending up slightly
111158
30
45
167
215
20162015
Evolution of ad spending on video display (in €M)
+42%
+28%
417
309
Desktop
Mobile
51%
38%
2016 share
IPTV
+47%11%
(vs 54% in 2015)
(vs 36% in 2015)
(vs 10% in 2015)

32
04
SEARCH AND OTHER LEVERS

1 375
517
Repartition search National/Local (2016, m€)
33
1 072821
Repartition search Desktop/Mobile (2016, m€)
1 893
Search (2016, m€)
National Actors, 73%
Local Actors, 27%
Desktop, 57%
Mobile, 43%
Sources: PwC analysis, SRI and UDECAM statements, public information
Search market in 2016
+4.3%

Referrals – €226M
34
€447M +3.2%Other levers
Unequal growth in other levers
Shopbots – €85M* Direct E-mail - €136M
Sources: PwC analysis, SRI, UDECAM, CPA * The current perimeter, focused on shopbots and travel comparison
websites, does not include the other sectors (banking & insurance, energy,
automobile, telecoms, etc.)

35
05
KEY TRENDS

36
Search and social networks account for a predominant share of the market, primarily captured by two actors...
68%
32%
Share of search + social networks in the total digital market, 2016 (€M)
Rest of market
Search + social networks
Share of search + social networks in the mobile* market, 2016 (€M)
92%
8%
* Mobile (smartphone and tablet) search + display marketSources: PwC analysis, SRI and UDECAM statements, public information
Rest of mobile market
Search + mobile social networks

37
... and capture a major proportion of the market's growth, at almost equivalent market share
Share of ad spending, 2016 (in €M)
Contribution to growth, 2016 (in €M)
Sources: PwC analysis, SRI, UDECAM, CPA* Source: Médiamétrie, Global Internet, October 2016
Deduplicated audience volume,2016 (in millions of UV*)
44.1M42.9M
95.8% of French users
98% of French users
68%
22% 10%
Search + social networks
Display, excluding social networks
Other levers
106%
3%
+3%
+12%
-3%
+86%
-9%

Contacts
Matthieu AubussonPartner, Experience [email protected]
Sébastien Leroyer Senior Manager, Experience [email protected]
Françoise ChambreExecutive [email protected]
Hélène ChartierPresident [email protected]
Myriam de Chassey Waquet Communications [email protected]
38