Embed Size (px)
Citation preview

Community Health Needs Assessment
Prepared for
VALLEY HEALTH SYSTEM Shenandoah Memorial Hospital (In collaboration with Virginia Department of Health Lord Fairfax Health District)

A-2
Shenandoah Memorial Hospital
Community Health Needs Assessment
TABLE OF CONTENTS
TABLE OF CONTENTS ............................................................................................................................................ 2
EXECUTIVE SUMMARY ......................................................................................................................................... 4 INTRODUCTION .......................................................................................................................................................... 4 METHODOLOGICAL SUMMARY .................................................................................................................................. 5 DEFINITION OF THE COMMUNITY ............................................................................................................................... 6 PRIORITIZED DESCRIPTION OF COMMUNITY HEALTH NEEDS ..................................................................................... 7
CHNA DATA AND ANALYSIS .............................................................................................................................. 12
METHODOLOGY .................................................................................................................................................... 13 DATA SOURCES AND ANALYTIC METHODS .............................................................................................................. 13 PRIORITIZATION PROCESS AND CRITERIA ................................................................................................................ 13 INFORMATION GAPS ................................................................................................................................................. 13 COLLABORATING ORGANIZATIONS .......................................................................................................................... 14
DEFINITION OF COMMUNITY ASSESSED ...................................................................................................... 15
SECONDARY DATA ASSESSMENT .................................................................................................................... 18 DEMOGRAPHICS ....................................................................................................................................................... 18 ECONOMIC INDICATORS ........................................................................................................................................... 26
1. People in Poverty ....................................................................................................................................... 26 2. Household Income ..................................................................................................................................... 28 3. Unemployment Rates ................................................................................................................................. 30 4. Crime ......................................................................................................................................................... 31 5. Eligibility for the National School Lunch Program ................................................................................... 32 6. Insurance Status......................................................................................................................................... 34 7. Changing Health Care ............................................................................................................................... 35
LOCAL HEALTH STATUS AND ACCESS INDICATORS ................................................................................................. 37 1. County Health Rankings ............................................................................................................................ 37 2. Virginia Department of Health .................................................................................................................. 45 3. Behavioral Risk Factor Surveillance System ............................................................................................. 54
AMBULATORY CARE SENSITIVE CONDITIONS .......................................................................................................... 56 1. County-Level Analysis ............................................................................................................................... 57 2. ZIP Code-Level Analysis ........................................................................................................................... 58 3. Hospital-Level Analysis ............................................................................................................................. 59
COMMUNITY NEED INDEX™ AND FOOD DESERTS ................................................................................................... 61 1. Dignity Health Community Need Index ..................................................................................................... 61 2. Food Deserts (Lack of Access to Nutritious and Affordable Food) ........................................................... 63
OVERVIEW OF THE HEALTH AND SOCIAL SERVICES LANDSCAPE ............................................................................. 64 1. Medically Underserved Areas and Populations ........................................................................................ 64 2. Health Professional Shortage Areas .......................................................................................................... 66 3. Description of Other Facilities and Resources within the Community ...................................................... 67
FINDINGS OF OTHER RECENT COMMUNITY HEALTH NEEDS ASSESSMENTS............................................................. 71 1. Coors Healthcare Solutions, 2016 ............................................................................................................. 71 2. Homelessness and Medical Vulnerability - Point in Time Survey – 2016 (data from 2015) ..................... 71 3. United Way of the Northern Shenandoah Valley, Community Needs Update 2014-2017 ......................... 72 4. United Way of the Northern Shenandoah Valley, Mental Health Report 2014 ......................................... 73 5. Page Alliance for Community Action, 2015-2016 ..................................................................................... 73 6. Shenandoah County Coalition, 2013-2014 ................................................................................................ 74 7. Warren Coalition, 2014-2015 .................................................................................................................... 74 8. Lord Fairfax Health District, 2014 ............................................................................................................ 74
A-3
Shenandoah Memorial Hospital
Community Health Needs Assessment
PRIMARY DATA ASSESSMENT ...................................................................................................................... 76 COMMUNITY SURVEY FINDINGS .............................................................................................................................. 76
1. Respondent Characteristics ....................................................................................................................... 76 2. Access Issues .............................................................................................................................................. 82 3. Health Issues .............................................................................................................................................. 87 4. Health Behaviors ....................................................................................................................................... 89
SUMMARY OF INTERVIEW FINDINGS, 2016 .............................................................................................................. 91 INDIVIDUALS PROVIDING COMMUNITY INPUT ......................................................................................................... 94
5. Public Health Experts ................................................................................................................................ 94 6. Health or Other Departments or Agencies ................................................................................................ 96 7. Community Leaders and Representatives .................................................................................................. 97 8. Persons Representing the Broad Interests of the Community .................................................................. 100
SOURCES ................................................................................................................................................................ 103

A-4
Shenandoah Memorial Hospital
Community Health Needs Assessment
EXECUTIVE SUMMARY
Introduction
This community health needs assessment
(CHNA) was conducted by Shenandoah
Memorial Hospital (SMH or the hospital) to
identify community health needs and to
inform the subsequent development of an
implementation strategy to address identified
priority needs. The hospital’s assessment of
community health needs also responds to
community benefit regulatory requirements.
Federal regulations require that tax-exempt
hospital facilities conduct a CHNA every
three years and develop an implementation
strategy that addresses priority community
health needs. Tax-exempt hospitals also are
required to report information about
community benefits they provide on IRS
Form 990, Schedule H. As specified in the
instructions to IRS Form 990, Schedule H,
community benefits are programs or activities
that provide treatment and/or promote health
and healing as a response to identified
community needs.
Community benefit activities and programs
seek to achieve several objectives, including:
improving access to health services,
enhancing public health,
advancing increased general
knowledge, and
relief of a government burden to
improve health.1
1 Instructions for IRS form 990 Schedule H, 2015.
To be reported, community need for the
activity or program must be established.
Needs can be established by conducting a
community health needs assessment.
The 2010 Patient Protection and Affordable
Care Act (PPACA) requires each tax-exempt
hospital to “conduct a [CHNA] every three
years and adopt an implementation strategy to
meet the community health needs identified
through such assessment.”
CHNAs seek to identify priority health status
and access issues for particular geographic
areas and populations by focusing on the
following questions:
Who in the community is most
vulnerable in terms of health status or
access to care?
What are the unique health status
and/or access needs for these
populations?
Where do these people live in the
community?
Why are these problems present?
The question of how the organization can best
use its limited charitable resources to address
priority needs will be the subject of the
hospital’s separate implementation strategy.

A-5
Shenandoah Memorial Hospital
Community Health Needs Assessment
Methodological Summary
Community health needs were identified by
collecting and analyzing data and information
from multiple sources. Statistics for numerous
health status, health care access, and related
indicators were analyzed, including
comparisons to benchmarks where possible.
The principal findings of recent health
assessments conducted by other organizations
were reviewed, as well.
Input from persons representing the broad
interests of the community, including
individuals with special knowledge of or
expertise in public health, was taken into
account via interviews and community
response sessions for Valley Health’s
Southern service area. Valley Health System
conducted 19 group interviews based upon
sectors to include representatives from SMH’s
community, and a community health survey
with 719 respondents.
Valley Health System applied a ranking
methodology to help prioritize the community
health needs identified, incorporating both
quantitative and qualitative data throughout.
Scores for the severity and scope of identified
health needs were assigned and calculated
using weighted averages taking into account
multiple data sources. Major themes
discussed in the community response sessions
were compared to the scored health issues to
aid in identifying the prioritized list of health
needs.
No information gaps have affected the
hospital’s ability to reach reasonable
conclusions regarding priority community
health needs.
SMH collaborated with the other Valley
Health hospitals for this assessment:
Hampshire Memorial Hospital, Page
Memorial Hospital, War Memorial Hospital,
Warren Memorial Hospital, and Winchester
Medical Center.

A-6
Shenandoah Memorial Hospital
Community Health Needs Assessment
Definition of the Community
Shenandoah Community by the Numbers
Community includes 3 counties in Virginia (Page, Shenandoah, and Warren)
Total population in 2015: 104,776
Projected population change between 2015 and 2020: 7.2%
89.6% of inpatient discharges and 87.4% of emergency department visits originated from the community
Demographics:
7.7% of population are 65+
93.5% are White in 2014, with projected growth in non-White populations

A-7
Shenandoah Memorial Hospital
Community Health Needs Assessment
Prioritized Description of Community Health Needs
The CHNA identified and prioritized several community health needs using the data sources,
analytic methods, and prioritization process and criteria described in the Methodology section.
These needs are listed below in priority order and described on the following pages, with
examples of the data supporting the determination of each health need as a priority. Further detail
regarding supporting data, including sources, can be found in the CHNA Data and Analysis
section of this report.
Prioritized Health Needs
1. Access to Primary and Preventive Care
2. Physical Activity, Nutrition, and Obesity-related Chronic Diseases
3. Financial Hardship and Basic Needs Insecurity
4. Mental and Behavioral Health
5. Substance Abuse and Tobacco Smoking
6. Maternal and Child Health
To provide insight into trends, a comparison to findings from SMH’s August 2013 CHNA is
included below the description and key findings of each priority need, and outlined below.
1. Access to Primary and Preventive Care
Access to primary and preventive health care services through a doctor’s office, clinic or other
appropriate provider is an important element of a community’s health care system, and is vital
for helping the community’s residents to be healthy. The ability to access care is influenced by
many factors, including insurance coverage and the ability to afford services, the availability and
location of health care providers, understanding where to find services when needed, and reliable
personal or public transportation.
Key Findings
The SMH community is experiencing lower ratio rates when it comes to the number of
primary care physicians per 100,000 populations, number of dentists available within the
region, and the largest need is mental health providers. The SMH community is below the
Virginia ratio in all counties for these types of providers, according to the County Health
Ranking report. In the SMH community, Page County is a Medically Underserved Area.
Page, Shenandoah, and Warren Counties are Health Professional Shortage Areas for
dental, and primary care.

A-8
Shenandoah Memorial Hospital
Community Health Needs Assessment
All three counties in the service area ranked in the bottom half of Virginia on “access to
care” in the County Health Rankings. The 2016 County Health Rankings measures have
changed slightly for the Access to Care indicator to include the ratio of population to
mental health providers.
Page (15.3 percent) and Shenandoah (13.3 percent) Counties have higher percentages of
uninsured residents than Virginia (12.1), according to the U.S. Census. Page County has a
higher percentage (15.3 percent) of uninsured residents than the U.S. average of 14.2
percent.
Concerns about access to care was the most frequently mentioned factor contributing to
poor health in key informant interviews.
Lack of accessible or reliable transportation to health care and a lack of providers who
accept new Medicaid and Medicare patients was the most frequently mentioned access to
care issues in interviews, especially for low-income individuals and senior citizens.
Comparison to August 2013 CHNA: Access to affordable health care was one of the priority
issues identified in SMH’s August 2013 CHNA, for reasons including: a lack of providers
relative to the population; affordability and uninsurance; and the challenges of unemployment
and low income.
2. Physical Activity, Nutrition, and Obesity-related Chronic Diseases
A lack of physical activity and poor nutrition contribute to higher instances of obesity. Obesity
can also lead to a wide range of health problems and chronic diseases including high cholesterol,
hypertension, diabetes, heart disease, stroke, and some cancers. Nationally, the increase in both
the prevalence of, and associated chronic diseases is well-documented, and has negative
consequences for individuals and society. Low-income and poverty often contributes to poor
nutrition and hunger.
Key Findings
SMH’s community contains 4 census tracts identified as food deserts. There are three
census tracts designated as food deserts in Warren County, and one designation in
Shenandoah County. Food deserts are defined as low-income areas more than one mile
from a supermarket or large grocery store in urban areas and more than 10 miles from a
supermarket or large grocery store in rural areas.
Twenty-six schools in the SMH community were eligible for Title 1 funds. In Page
County 51.2 percent students were eligible for free and reduced-price lunches, indicating
risks of poor nutrition and hunger.
Commenting on the contributing factors to poor health status, interview participants
mentioned nutrition and diet, low physical activity and exercise, and food insecurity.
Many commented on both the lack of affordable, healthy food choices in some parts of
the community.

A-9
Shenandoah Memorial Hospital
Community Health Needs Assessment
Page showed a higher rate of limited access to exercise opportunities that the other two
counties that represent the SMH community as reported by County Health Rankings.
Access to exercise opportunities for Page and Warren Counties were lower than both the
Virginia and US averages.
Comparison to August 2013 CHNA: Physical activity, nutrition, and obesity-related chronic
diseases were one of the top health priority areas identified in SMH’s August 2013 CHNA.
Participants in key informant interviews in 2013 reported obesity and overweight was the fourth
most frequently mentioned health status issue as being important to the community, and diabetes
was the most frequently mentioned chronic disease.
3. Financial Hardship and Basic Needs Insecurity
Income levels, employment and economic self-sufficiency correlate with the prevalence of a
range of health problems and factors contributing to poor health. People with lower income or
who are unemployed/underemployed are less likely to have health insurance or the ability to
afford out of pocket health care expenses. Lower income is associated with increased difficulties
securing reliable transportation, which impacts access to medical care, and the ability to purchase
an adequate quantity of healthy food on a regular basis. For these and other reasons, the
assessment identified financial hardship and basic needs insecurity as a priority health need in
the community.
Key Findings
The highest portion of households with income under $25,000 in 2014 was located in
Page County (26.8%).
Within the SMH Community unemployment rates have increased in Page and Warren
Counties for 2014.
Interviewees identified low income, housing, and poverty as the top issues believed to be
contributing to poor health status and access to care difficulties. Other income-related
factors noted to be contributing to poor health include difficulty with transportation to
medical appointments, and homelessness.
Low income and financial challenges were reported in the survey. For survey respondents
who reported not being able to always get the care they needed, affordability and lack of
insurance coverage were the most frequently mentioned reasons, especially for the senior
population.
Comparison to August 2013 CHNA: Financial hardship and basic needs insecurity was not one
of the top health priority areas identified in SMH’s August 2013 CHNA, but that assessment did
note several financial hardship measures relevant to health. The study reported that the
community has experienced a 25 percent increase since 2013 in the percentage of households
with incomes under $25,000.

A-10
Shenandoah Memorial Hospital
Community Health Needs Assessment
4. Mental and Behavioral Health
Mental and behavioral health includes both mental health conditions (e.g., depression, autism, bi-
polar) and behavioral problems (e.g., bullying, suicidal behavior). Poor mental and behavioral
health causes suffering for both those afflicted and the people around them. It can negatively
impact children’s ability to learn in school, and adults’ ability to be productive in the workplace
and the ability to provide a stable and nurturing environment for their families. Poor mental or
behavioral health frequently contributes to or exacerbates problems with physical health and
illness.
Key Findings
The SMH community contains eight medically underserved areas and three medically
underserved populations.
Areas and populations in the SMH community are designated as Health Profession
Shortage Areas (HPSA). Page and Shenandoah Counties reported shortages for mental
health access and are designated as a Medically Underserved Area and a Medically
Underserved Population.
Mental and behavioral health was the second most frequently mentioned health status
issue. Interviewees generally reported that the community’s mental health needs have
grown, while the mental health service capacity has not.
A main concern mentioned by key informants was connecting patients with services
needed. Wait times are very long for patients to see a clinician.
Comparison to August 2013 CHNA: Mental health care was one of the priority issues identified
in SMH’s August 2013 CHNA, for reasons including: the presence of mental health HPSAs;
unfavorable suicide rates compared to the Commonwealth’s average; a lack of treatment options;
and the identification of substance abuse and mental health as the second highest ranking health
priority in community response sessions.
5. Substance Abuse and Tobacco Smoking
Substance abuse includes the use of: illicit substances (e.g., cocaine, heroin, methamphetamine,
and marijuana); misuse of legal over-the-counter and prescription medications; and abuse of
alcohol. Substance abuse affects not the individual substance abusers, but those around them;
negatively impacting health, safety and risky behaviors, including violence and crime, adult
productivity, student ability to learn, and families’ ability to function. Tobacco smoking is well-
documented to be a risk factor for various forms of cancer, heart disease and other ailments, and
to pose health risks for those exposed to secondhand smoke.
Key Findings
Rates of adult tobacco use in the SMH community, were in the top 49% of counties in the
state. Smoking across the community averaged 18 percent as compared to state average

A-11
Shenandoah Memorial Hospital
Community Health Needs Assessment
of 20 percent. Smoking in cars while children are present was a significant concern for
the SMH community. Virginia is passing a new law to cut down on second hand smoke
for adults with children car passengers.
Substance abuse was a major concern and mentioned frequently by key informant
interview participants. It was portrayed as a growing and serious issue.
Key informant interview participants noted that substance abusers are often classified as
offenders, instead of individuals needing treatment with limited available options.
Comparison to August 2013 CHNA: Substance abuse was one of the second most frequently
mentioned health status issue by interview participants, and was portrayed as both growing and
serious. Abuse of over-the-counter medications by youth was mentioned as well as increased use
of prescription pain medications.
6. Maternal and Child Health
Maternal and child health indicators, including teen pregnancy and infant mortality, should be
considered when evaluating the health of a community. The rate of teen pregnancy is an
important health statistic in any community for reasons that include: concerns for the health of
the mother and child, the financial and emotional ability of the mother to care for the child, and
the ability of the mother to complete her secondary education and earn a living. Teen pregnancy
also stresses the educational system and the families of teen mothers. Infant mortality can be a
sign of deficits in access to care, health education, personal resources, and the physical
environment.
Key Findings
The teen birth rates in Page, Shenandoah and Warren Counties were higher than the
Virginia state average of 27 percent.
Key informant interviews mentioned the need to promote health screenings among
women 40-50 years old.
Limited access to prenatal care was mentioned in key informant interviews.
Comparison to August 2013 CHNA: Maternal and child health was not a top need for the
Shenandoah Memorial Hospital’s August 2013 CHNA.

A-12
Shenandoah Memorial Hospital
Community Health Needs Assessment
CHNA DATA AND ANALYSIS

A-13
Shenandoah Memorial Hospital
Community Health Needs Assessment
METHODOLOGY
Data Sources and Analytic Methods
Community health needs were identified by collecting and analyzing data and information from
multiple quantitative and qualitative sources. Considering information from a variety of sources
is important when assessing community health needs, to ensure the assessment captures a wide
range of facts and perspectives and assists in identifying the highest-priority health needs.
Statistics for health status, health care access, and related indicators were analyzed and included
data from local, state, and federal public agencies, community service organizations in the SMH
community, and Valley Health. Comparisons to benchmarks were made where possible. Details
from this quantitative data are presented in the report’s body, followed by a review of the
principal findings of recent health assessments conducted by other organizations in the
community.
Input from persons representing the broad interests of the community was collected through: 18
group interviews with 80 key informants (in March 2016); a community health survey with
1,990 respondents; and four “community response sessions” with 39 additional community
stakeholders in May 2016, where preliminary findings were discussed. Interviews and
community response sessions included: individuals with special knowledge of, or expertise in,
public health; local and state health agencies with current data or information about the health
needs of the community; and leaders, representing the medically underserved, low-income, and
minority populations, and populations with chronic disease needs. Feedback from community
response session participants helped validate findings and prioritize identified health needs.
Prioritization Process and Criteria
Valley Health System applied a ranking methodology to prioritize the community health needs
identified by the assessment, incorporating both quantitative and qualitative data throughout.
Scores were calculated for each data category (secondary data, previous assessments, survey, and
interviews) based on the number of sources measuring each health issue, severity of the issue as
measured by the data and as indicated by community input. Scores were averaged and assigned a
weight for each data category: 40 percent, 10 percent, 10 percent, and 40 percent, respectively.
All identified health issues were assigned scores for severity and scope. Major themes discussed
by participants in the community response sessions were compared to the scored health issues.
Information Gaps
No information gaps have affected the hospital’s ability to reach reasonable conclusions
regarding priority community health needs.

A-14
Shenandoah Memorial Hospital
Community Health Needs Assessment
Collaborating Organizations
SMH collaborated with the other Valley Health hospitals for this assessment: Hampshire
Memorial Hospital, Page Memorial Hospital, War Memorial Hospital, Warren Memorial
Hospital, and Winchester Medical Center.
Valley Health System’s internal project team included Mark H. Merrill, president and CEO,
Valley Health System; N. Travis Clark, president of Page Memorial Hospital and Shenandoah
Memorial Hospital; Carol Koenecke-Grant, vice president of Strategic Services; Chris Rucker,
vice president of Community Health and Wellness and president of Valley Regional Enterprises;
Kathleen Devlin Culver, manager, Corporate Communications; Michael Wade, program
manager; and Mary Zufall, coordinator, Community Health.
The Valley Health System Community Health Needs Assessment (CHNA) Steering Committee
was developed to provide insight regarding the needs of the communities participating in the
2016 CHNA. The Steering Committee guides the process to ensure alignment with
organizational mission and vision and support of legislative mandates regarding CHNA
reporting. Members of the committee make sure those components of the CHNA are being
adequately compiled and addressed and that the project is completed with prioritized health
needs.
Valley Health System’s Community Health Needs Assessment steering committee included:
David Cooper, GIS manager, Northern Shenandoah Valley Regional Commission
Charles Devine, M.D., health director, Winchester Health Department
Sharen Gromling, executive director, Our Health, Inc.
Stefan Lawson, executive director, Free Medical Clinic of the Northern Shenandoah Valley
Mark Y. Lineburg, Ed.D. superintendent, Winchester Public Schools
Tracey Mitchell, manager, Wellness Services, Valley Health Wellness Center
Nadine Pottinga, president/CEO, United Way of Northern Shenandoah Valley
Faith Power, member, Valley Health System Board of Trustees
Kevin Sanzenbacher, chief of Police, City of Winchester
Karen Schultz, Ph.D., director & professor, Center for Public Service and Scholarship,
Shenandoah University
David T. Sovine, Ed.D. superintendent, Frederick County Public Schools
Frank Subasic, member, Valley Health System Board of Trustee
Shannon Urum, prevention specialist, Northwestern Community Services Board
SMH collaborated with a variety of individuals through its workgroups that focus on access to
primary care; health, outreach, and prevention; mental health and substance abuse; family
developmental and social health; and the local environment and social work.
Additionally, lists of the interviewees and community response session participants are provided
in Exhibits 66 through 69 of the report.

A-15
Shenandoah Memorial Hospital
Community Health Needs Assessment
DEFINITION OF COMMUNITY ASSESSED
SMH’s community is comprised of three counties (22 ZIP codes) in Virginia. The hospital’s
primary service area (PSA) includes Shenandoah County. The secondary service area (SSA) is
composed of Page, and Warren Counties (Exhibit 1). The hospital is located in Woodstock,
Virginia.
In 2015, the SMH community was estimated to have a population of 104,776 persons.
Approximately 40.3 percent of the population resided in the primary service area (Exhibit 1).
Exhibit 1: Community Population, 2015
County Total Population Percent of Total Population
PSA 42,228 40.3%
Shenandoah County, VA 42,228 40.3%
SSA 62,548 59.7%
Page County, VA 23,719 22.6%
Warren County, VA 38,829 37.1%
Total 104,776 100.0%

A-16
Shenandoah Memorial Hospital
Community Health Needs Assessment
This community definition was validated based on the geographic origins of SMH inpatients and
emergency department encounters (Exhibit 2).
Exhibit 2: Inpatient and Emergency Department Discharges, 2015
County
Number of Inpatient
Discharges
Percent of Total
Inpatient Discharges
Number of ED
Discharges
Percent of ED
discharges
PSA 1,268 82.9% 14,663 85.2%
Shenandoah 1,268 82.9% 14,663 85.2%
SSA 103 6.7% 379 2.2%
Page 59 3.9% 150 0.9%
Warren 44 2.9% 229 1.3%
PSA and SSA Total 1,371 89.6% 15,042 87.4%
Other areas 159 10.4% 2,161 12.6%
Total Discharges 1,530 100.0% 17,203 100.0%
Source: Valley Health, 2015
In 2015, the SMH community collectively accounted for 89.6 percent of the hospital’s inpatients
and emergency department discharges. The majority (82.9 percent) of the hospital’s inpatients
originated from the primary service area. Approximately 85.2 percent of emergency department
visits originated from Shenandoah County (Exhibit 2).

A-17
Shenandoah Memorial Hospital
Community Health Needs Assessment
Exhibit 3: Shenandoah Memorial Hospital Community: 3 counties comprise SMH’s primary
and secondary service areas.
Source: Northern Shenandoah Valley Regional Commission

A-18
Shenandoah Memorial Hospital
Community Health Needs Assessment
SECONDARY DATA ASSESSMENT
This section presents secondary data regarding health needs in SMH’s community.
Demographics
Population characteristics and changes play a role in influencing the health issues of and services
needed by communities (Exhibit 4).
Exhibit 4: Percent Change in Population by County, 2015-2020
2015 County Total Population Total Population
estimates 2020
Percent Change in
Population 2015-2020
PSA 42,228 45,829 8.5%
Shenandoah County, VA 42,228 45,829 8.5%
SSA 62,548 66,850 6.9%
Page County, VA 23,719 24,994 5.4%
Warren County, VA 38,829 41,856 7.8%
Total 104,776 112,679 7.5% Source: Projections: Weldon Cooper for Public Service, VA; Projections: WVU Bureau of Business and Economic Research
Overall, the population living in the SMH community is expected to increase by 7.5 percent
between 2015 and 2020 (Exhibit 4). The Commonwealth of Virginia is expected to increase by
8.5 percent2 between 2015 and 2020.
3
2 The Weldon Cooper Center for Public Service, University of Virginia. (2015). Retrieved from: www.coopercenter.org/demographics 3 The Weldon Cooper Center for Public Service, University of Virginia. (2015). Retrieved from: www.coopercenter.org/demographics

A-19
Shenandoah Memorial Hospital
Community Health Needs Assessment
Exhibit 5: Population Change by County and ZIP Code, 2015-2020
Source: Northern Shenandoah Valley Regional Commission
Shenandoah and Warren Counties are expected to grow faster than the SMH community as a
whole (approximately 8.5 and 7.8 percent respectively), while Page County is expected to grow
5.4 percent (Exhibits 4 and 5).

A-20
Shenandoah Memorial Hospital
Community Health Needs Assessment
Exhibit 6: Percent Change in Population by Age/Sex Cohort, 2013-2014
Age/Sex Total
Population Population 2013 Population 2014 % Change % of total
Female 0-19 9,602 12,567 30.9% 12.0%
Male 0-19 12,879 12,811 -0.5% 12.2%
Female 20-44 15,263 15,270 0.0% 14.6%
Male 20-44 15,395 15,379 -0.1% 14.7%
Female 45-64 15,409 15,381 -0.2% 14.7%
Male 45-64 15,080 15,218 0.9% 14.5%
Female 65+ 9,623 9,953 3.4% 9.5%
Male 65+ 7,795 8,013 2.8% 7.7%
Total 101,046 104,592 3.5% 100.0% Source: US Census Data 2014
The number of residents aged birth to 19 years has increased by 12.9 percent since 2013, while
the 65+ age cohort increased 3.1 percent since 2013.

A-21
Shenandoah Memorial Hospital
Community Health Needs Assessment
Exhibit 7: Percent of Population Aged 65+ by County and ZIP Code, 2014
Source: Northern Shenandoah Valley Regional Commission
At 25.4 percent, Page, Shenandoah, and Warren Counties have the highest percentage of people
aged 65 and over. The ZIP codes with the highest percentage of people aged 65 and over are
22630 (Front Royal, 5.8 percent) in Warren County and 22835 (Luray, 3.2 percent) in Page
County (Exhibit 7).

A-22
Shenandoah Memorial Hospital
Community Health Needs Assessment
Exhibit 8: Distribution of Population by Race, 2014-2019
Race Page, VA Shenandoah, VA Warren, VA Total 2014 % from Total
2014
American Indian and
Alaska Native 36 40 72 148
0.1%
Asian 121 225 377 723 0.7%
Black or African
American 389 921 1,446 2,756
2.6%
Native Hawaiian/Pacific
Islander 0 0 23 23
0.0%
Some other Race 40 505 106 651 0.6%
Two or more Races 403 800 1,251 2,454 2.3%
White 22,916 40,054 34,867 9,7837 93.5%
Total 23,905 42,545 38,142 104,592 100.00% Source: US Census Data 2014
Source: Crimson – Percent change in population 2014-2019
About 93.5 percent of the community’s population is White. Non-White populations are
expected to grow 9.2 percent of the total population from 2014 to 2019 (Exhibit 8).
Exhibit 9: Distribution of the Population by Ethnicity, 2014
Ethnicity Page, VA Shenandoah, VA Warren, VA Total 2014 % from Total
2014
Hispanic or Latino 413 2,768 1,437 4,618 4.4%
Not Hispanic or Latino 23,492 39,777 36,705 99,974 95.6%
Total 23905 42545 38142 104592 100.00%
Source: US Census Data 2014
According to the U.S. Census Data, the Hispanic or Latino population decreased slightly
between 2013 and 2014 to 4.4 percent down from 4.6 percent from previously assessed year
(Exhibit 9).

A-23
Shenandoah Memorial Hospital
Community Health Needs Assessment
Exhibits 10, and 11 illustrate the locations in the community where the percentage of the
population that is Black, and Hispanic or Latino is highest. The percentage of Black residents is
highest in ZIP code 22627 (Flint Hill) in Rappahannock County. The percentage of Hispanic or
Latino residents is highest in ZIP code 22842 (Mount Jackson) in Shenandoah County.
Exhibit 10: Percent of Population – Black, 2014
Source: Northern Shenandoah Valley Regional Commission
Page, Shenandoah and Warren Counties all have areas with high
percentages of Black residents.

A-24
Shenandoah Memorial Hospital
Community Health Needs Assessment
Exhibit 11: Percent of Population – Hispanic or Latino, 2014
Source: Northern Shenandoah Valley Regional Commission
Shenandoah and Warren Counties have the highest number of Hispanic or Latino residents.

A-25
Shenandoah Memorial Hospital
Community Health Needs Assessment
Exhibit 12: Other Demographic Indicators, 2014
County
Population age 25 + without
a high school diploma, 2014
Population % + who are
linguistically isolated , 2014
PSA
Shenandoah, VA 16.0% 3.1%
SSA
Page, VA 24.5% 0.6%
Warren, VA 14.3% 1.7%
Virginia 12.1% 5.60%
US 13.6% 8.60% Source: U.S. Census Bureau, ACS 5 year estimates, 2014.
Key findings include:
All counties in the SMH community had a higher percentage than the state average of
residents aged 25 and older who did not graduate high school. At nearly 25 percent, Page
County had the highest percentage of non-graduates.
In Shenandoah County, 3.1 percent of the community residents were linguistically
isolated. Linguistic isolation is defined as the population aged five and older who speak a
language other than English and speak English less than “very well.”

A-26
Shenandoah Memorial Hospital
Community Health Needs Assessment
Economic Indicators
The following types of economic indicators with implications for health were assessed: (1)
people in poverty; (2) household income; (3) unemployment rate; (4) crime; (5) utilization of
government assistance programs; (6) insurance status; and (7) Virginia, West Virginia, and local
budget adjustments.
1. People in Poverty
Many health needs are associated with poverty. In 2014 approximately 15.6 percent of people in
the U.S. and 11.5 percent of people in Virginia lived in poverty (Exhibit 13).
Exhibit 13: Percent of People in Poverty, 2014
Source: U.S. Census Bureau, ACS estimates, 2014. Retrieved from:
http://factfinder.census.gov/faces/tableservices/jsf/pages/productview.xhtml?pid=ACS_14_5YR_DP03&prodType=table
The vertical line signifies the poverty rate in Virginia.
Page and Shenandoah Counties reported poverty rates higher than the Virginia average. The
averages for these two counties have remained above the state average since last CHNA
reporting period in 2013. (Exhibit 13).
17.2
12.8
9.9
11.5
[VALUE]
0 5 10 15 20
Page, VA
Shenandoah, VA
Warren, VA
VA
USA
Poverty Level 2014
Poverty Level 2014

A-27
Shenandoah Memorial Hospital
Community Health Needs Assessment
Exhibit 14: Percent of People in Poverty by Race/Ethnicity, Virginia Counties, 2014
Source: U.S. Census Bureau, ACS estimates, 2014. Retrieved from: http://factfinder.census.gov/faces/tableservices/jsf/pages/productview.xhtml?pid=ACS_14_5YR_DP03&prodType=table Data were not available by all races for Rappahannock County.
County Poverty level 2014
White Black Hispanic or Latino
Page, VA 16.6% 25.2% 33.5%
Shenandoah, VA 12.4% 23.6% 35.6%
Warren, VA 9.4% 22.1% 13.9%
Virginia 9.2% 20.1% 15.8%
US 12.8% 27.3% 24.8%
The Black and Hispanic or Latino populations reported higher poverty rates in 2014 than the
White population. The poverty rates for the Black and Hispanic or Latino populations were
higher than the Virginia average in many counties. Page County had the highest poverty rate for
the White population among the three counties within the SMH community. Shenandoah County
reported the highest poverty rates for the Hispanic or Latino population (Exhibit 14).
0.0%
5.0%
10.0%
15.0%
20.0%
25.0%
30.0%
35.0%
40.0%
Page, VA Shenandoah, VA Warren, VA Virginia US
Poverty level 2014 White Poverty level 2014 Black Poverty level 2014 Hispanic or Latino

A-28
Shenandoah Memorial Hospital
Community Health Needs Assessment
2. Household Income
The Federal Poverty Level (FPL) is used by many public and private agencies to assess
household needs for low-income assistance programs. In the SMH community in 2014, 12 of the
14 counties including Winchester City were above the state average for percent of households
with below $25,000, an approximation of the federal poverty level (FPL) for a family of four.
Exhibit 15 indicates the percent of lower-income households in the community.
Exhibit 15: Percent Lower-Income Households by County, 2014
County Average Family Income
2014
Percent of Families4
Less Than $25,000 in
2014
Percent of
Households5 Less than
$25,000 in 2014
PSA
Shenandoah, VA $56,330.00 15.1% 23.8%
SSA
Page, VA $49,727.00 19.3% 26.8%
Warren, VA $71,629.00 11.4% 19.3%
Virginia $77,939.00 11.9% 18.2%
US $65,443.00 15.9% 23.2% Source: U.S. Census Bureau, ACS estimates, 2014. Retrieved from: http://factfinder.census.gov/faces/tableservices/jsf/pages/productview.xhtml?pid=ACS_14_5YR_DP03&prodType=table#
Page and Shenandoah Counties reported percentages of households with income less than
$25,000 greater than both the Virginia and U.S. percentages of 18.2 and 23.2 (Exhibit 15).
4 A family consists of a householder and one or more other people living in the same household who are related to the householder by birth, marriage, or adoption. All
people in a household who are related to the householder are regarded as members of his or her family. 5 A household includes all the people who occupy a housing unit. A housing unit is a house, an apartment, a mobile home, a group of rooms, or a single room that is
occupied as separate living quarters. The occupants may be a single family, one person living alone, two or more families living together, or any other group of related
or unrelated people who share living arrangements.

A-29
Shenandoah Memorial Hospital
Community Health Needs Assessment
Exhibit 16: Percent of Households with Incomes under $25,000 by County and ZIP Code,
2014
Source: Northern Shenandoah Valley Regional Commission
The highest proportions of households with incomes under $25,000 in 2014 were located in Page
and Shenandoah Counties (Exhibit 16).

A-30
Shenandoah Memorial Hospital
Community Health Needs Assessment
3. Unemployment Rates
Exhibit 17: Unemployment Rates, Virginia Counties, 2013 (in red) and 2014 (in blue)
Source: US Census Bureau. Retrieved from:
http://factfinder.census.gov/faces/tableservices/jsf/pages/productview.xhtml?pid=ACS_14_5YR_DP03&prodType=table
County Unemployment
rates 2013 Unemployment
rates 2014
Page, VA 9.3% 11.0%
Shenandoah, VA 5.8% 5.7%
Warren, VA 5.4% 7.8%
Virginia 5.2% 6.9%
US 7.6% 9.2% Source: US Census Bureau. Retrieved from:
http://factfinder.census.gov/faces/tableservices/jsf/pages/productview.xhtml?pid=ACS_14_5YR_DP03&prodType=table
Page County reported the highest unemployment rate in the SMH community (Exhibit 17). The
unemployment rate for Page County increased by 1.7 percent from previous year, and is higher
than Virginia and US averages.
11.0%
5.7%
7.8%
6.9%
9.2%
9.3%
5.8%
5.4%
5.2%
7.6%
0.0% 2.0% 4.0% 6.0% 8.0% 10.0% 12.0%
Page, Va
Shenandoah, VA
Warren, VA
Virginia
US
Unemployement rates 2013 Unemployement rates 2014
A-31 Shenandoah Memorial Hospital
Community Health Needs Assessment
4. Crime
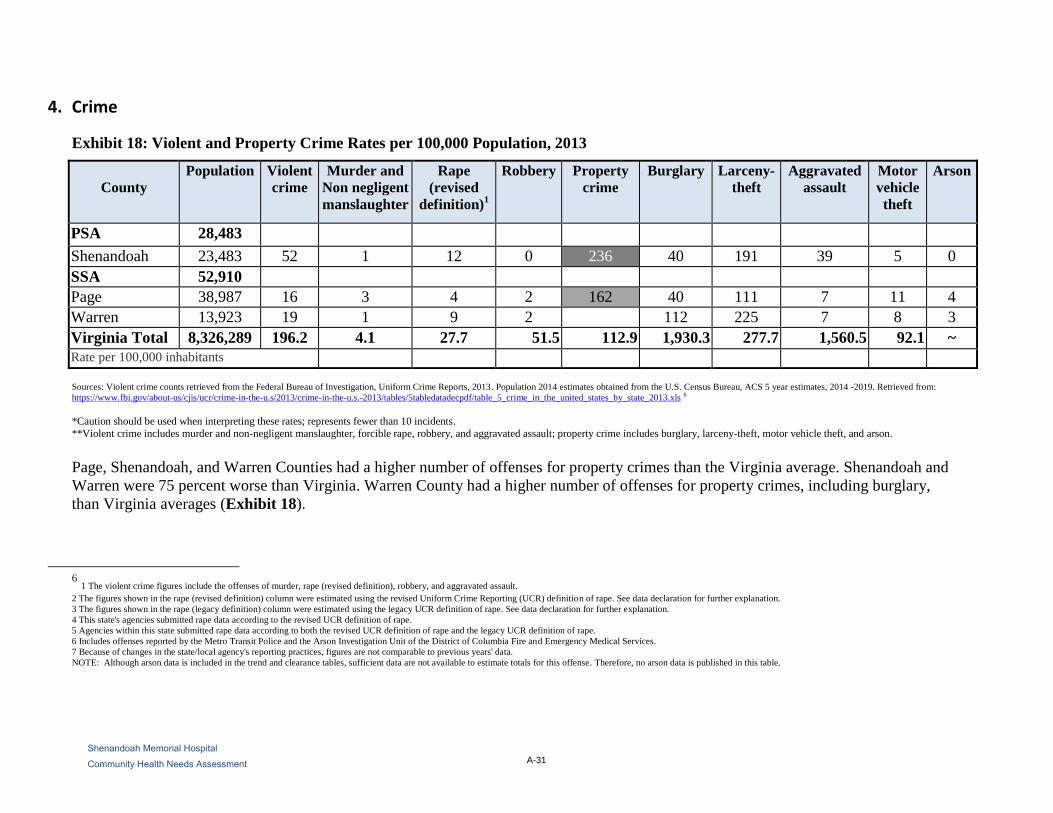
Exhibit 18: Violent and Property Crime Rates per 100,000 Population, 2013
County
Population Violent
crime
Murder and
Non negligent
manslaughter
Rape
(revised
definition)1
Robbery Property
crime
Burglary Larceny-
theft
Aggravated
assault
Motor
vehicle
theft
Arson
PSA 28,483
Shenandoah 23,483 52 1 12 0 236 40 191 39 5 0
SSA 52,910
Page 38,987 16 3 4 2 162 40 111 7 11 4
Warren 13,923 19 1 9 2 345 112 225 7 8 3
Virginia Total 8,326,289 196.2 4.1 27.7 51.5 112.9 1,930.3 277.7 1,560.5 92.1 ~
Rate per 100,000 inhabitants
Sources: Violent crime counts retrieved from the Federal Bureau of Investigation, Uniform Crime Reports, 2013. Population 2014 estimates obtained from the U.S. Census Bureau, ACS 5 year estimates, 2014 -2019. Retrieved from:
https://www.fbi.gov/about-us/cjis/ucr/crime-in-the-u.s/2013/crime-in-the-u.s.-2013/tables/5tabledatadecpdf/table_5_crime_in_the_united_states_by_state_2013.xls 6
*Caution should be used when interpreting these rates; represents fewer than 10 incidents.
**Violent crime includes murder and non-negligent manslaughter, forcible rape, robbery, and aggravated assault; property crime includes burglary, larceny-theft, motor vehicle theft, and arson.
Page, Shenandoah, and Warren Counties had a higher number of offenses for property crimes than the Virginia average. Shenandoah and
Warren were 75 percent worse than Virginia. Warren County had a higher number of offenses for property crimes, including burglary,
than Virginia averages (Exhibit 18).
6 1 The violent crime figures include the offenses of murder, rape (revised definition), robbery, and aggravated assault.
2 The figures shown in the rape (revised definition) column were estimated using the revised Uniform Crime Reporting (UCR) definition of rape. See data declaration for further explanation.
3 The figures shown in the rape (legacy definition) column were estimated using the legacy UCR definition of rape. See data declaration for further explanation.
4 This state's agencies submitted rape data according to the revised UCR definition of rape.
5 Agencies within this state submitted rape data according to both the revised UCR definition of rape and the legacy UCR definition of rape.
6 Includes offenses reported by the Metro Transit Police and the Arson Investigation Unit of the District of Columbia Fire and Emergency Medical Services.
7 Because of changes in the state/local agency's reporting practices, figures are not comparable to previous years' data.
NOTE: Although arson data is included in the trend and clearance tables, sufficient data are not available to estimate totals for this offense. Therefore, no arson data is published in this table.

A-32 Shenandoah Memorial Hospital
Community Health Needs Assessment
5. Eligibility for the National School Lunch Program
Schools participating in the National School Lunch Program are eligible to receive financial
assistance from the United States Department of Agriculture (USDA) to provide free or reduced-
price meals to low-income students. Schools with 40 percent or more of their student bodies
receiving this assistance are eligible for school-wide Title I funding, designed to ensure that
students meet grade-level proficiency standards (Exhibit 20).
Exhibit 19: Public School Students Eligible for Free or Reduced-Price Lunches, School
Year 2014 - 2015
Source: Northern Shenandoah Valley Regional Commission
In the SMH community, there were 26 schools eligible for Title 1 funds. ZIP code 22851
(Stanley) located in Page County had the highest number of students eligible for free or reduced
lunches (Exhibit 19).

A-33 Shenandoah Memorial Hospital
Community Health Needs Assessment
Exhibit 20: Virginia Department of Education, Office of School Nutrition Programs (SNP)
School Year 2014-2015
National School Lunch Program (NSLP) Free and Reduced Price Eligibility Report.
County
Number
of
Students
Free
Eligible Free %
Reduced
Lunch
Eligible
Reduce
Lunch
%
Total
Free /
Reduced
Total %
Free /
Reduced
Lunch
069-Page County
Public Schools 3,477 1,446 41.59% 334 9.61% 1,780 51.2%
085-Shenandoah
County Public
Schools
6,222 2,252 36.19% 432 6.94% 2,684 43.1%
093-Warren
County Public
Schools
5,365 1,877 34.99% 332 6.19% 2,209 41.2%
Source: Virginia Department of Education, Office of School of Nutrition Programs (SNP) Retrieved from: http://doe.virginia.gov/support/nutrition/statistics/index.shtml7
In the SMH community, there were 26 schools that were eligible for Title 1 funds (Exhibit 20).
7 School Year (SY) 2013 Free and Reduced Price eligibility statistics for the National School Lunch Program (NSLP) are provided in this report
for all public schools within the divisions that participate in USDA's National School Lunch Program (NSLP).
All Virginia public elementary and middle school participate in the NSLP, however, some high school do not participate in USDA's NSLP and
therefore do not report eligibility data (see School Notes, Note 1).
NSLP School Nutrition Program Membership (SNP Membership) and Free and Reduced Price Eligibility statistics are reported for each school
based on data reported by the school divisions to VDOE, Office of School Nutrition Programs as of October 31, 2014.

A-34 Shenandoah Memorial Hospital
Community Health Needs Assessment
6. Insurance Status
Exhibit 21: Uninsured Population, Virginia Counties/Cities, 2014
Source: U.S. Census Bureau 2014. Retrieved from:
http://factfinder.census.gov/faces/tableservices/jsf/pages/productview.xhtml?pid=ACS_14_5YR_DP03&prodType=table .
Exhibit 21 demonstrates that Page, and Shenandoah Counties, have uninsurance rates higher
than the Virginia and national averages.
11.0%
5.7%
7.8%
6.9%
9.2%
Page, VA
Shenandoah, VA
Warren, VA
Virginia
US
Unemployement rates 2014
County Uninsured Population 2014
Page, VA 15.3%
Shenandoah, VA 13.3%
Warren, VA 12.6%
Virginia 12.1%
US 14.2%

A-35 Shenandoah Memorial Hospital
Community Health Needs Assessment
7. Changing Health Care
Affordable Care Act
The Patient Protection and Affordable Care Act (Affordable Care Act) was enacted March 23,
2010. The Affordable Care Act actually refers to two separate pieces of legislation — the Patient
Protection and Affordable Care Act (P.L. 111-148) and the Health Care and Education
Reconciliation Act of 2010 (P.L. 111-152) —that, together expand Medicaid coverage to
millions of low-income Americans and makes numerous improvements to both Medicaid and the
Children’s Health Insurance Program (CHIP).
After the new law was enacted in March 2010, CMS worked with state partners to identify key
implementation priorities and provide the guidance needed to prepare for the significant changes
to Medicaid and CHIP that took effect on January 1, 2014. In particular, CMS provided several
forms of guidance and federal support for state efforts to develop new or upgrade existing
eligibility systems.
In March 2012, CMS released two final rules defining the eligibility and enrollment policies
needed to achieve a seamless system of coverage for individuals who became eligible for
Medicaid in 2014, as well as eligibility and enrollment for the new Affordable Insurance
Exchanges. The final rules establish the framework for States’ implementation of the eligibility
expansion going forward.
Medicaid Expansion
Virginia’s Medicaid program provides payment for health care for people in particular
categories. Currently, Medicaid in Virginia typically covers: pregnant women with household
incomes up to 133% of the Federal Poverty Level (FPL), children (up to age 18) up to 133% of
FPL, older adults up to 80% of FPL, some people with disabilities up to 80% of FPL, and parents
up to 24% of FPL. The percent of 133% of FPL translates to $14,856 per year for individuals or
$30,657 per year for families of four.
In June 2012, the U.S. Supreme Court upheld the constitutionality of all the major
provisions of the Patient Protection and Affordable Care Act (ACA), but provided the
states the option of whether or not to expand Medicaid eligibility up to 133% (plus a 5%
income disregard) of federal poverty. Virginia chose not to participate in the Medicaid
expansion.
Costs of the expansion are 100% federally funded for 2014 through 2016, decreasing
incrementally to 90% for 2020 and subsequent years for all newly eligible enrollees.
After 2016, the state share increases gradually, and is capped at 10% by 2020.
The federal match for children/pregnant women would increase from 65% to 87%
between 2015 and 2019.

A-36 Shenandoah Memorial Hospital
Community Health Needs Assessment
When the health care law was passed, it required states to provide Medicaid coverage for
all adults 18 to 65 with incomes up to 133% (effectively 138%) of the federal poverty
level, regardless of their age, family status, or health.
The law also provides premium tax credits for people with incomes between 100% and
400% of the federal poverty level to buy private insurance plans in the Health Insurance
Marketplace.

A-37 Shenandoah Memorial Hospital
Community Health Needs Assessment
Local Health Status and Access Indicators
This section examines health status and access to care data for the SMH community from several
sources. The data include: (1) County Health Rankings; (2) Virginia Department of Health; and
(3) Behavioral Risk Factor Surveillance System. Indicators also were compared to Healthy
People 2020 goals.
1. County Health Rankings
County Health Rankings, a collaboration between the Robert Wood Johnson Foundation and the
University of Wisconsin Population Health Institute, examines a variety of health status
indicators and ranks each County within each Commonwealth or state in terms of “health
factors” and “health outcomes.” These health outcomes and factors are composite measures
based on several variables grouped into the following categories: health behaviors, clinical care,8
social and economic factors, and physical environment.9 County Health Rankings is updated
annually. County Health Rankings 2013 relies on data from 2004 to 2012, with most data
originating in 2007 to 2011.
Exhibit 22 illustrates each county ranking for each composite category in 2016. Rankings
indicate how each county in Virginia ranked compared to the 134 counties in the
Commonwealth. A rank of 1 indicates the best county in the state. Indicators are shaded based on
the county’s percentile for the state or Commonwealth ranking. For example, Page County
compared unfavorably to other Virginia counties for Quality of Care; with a rank of 125 out of
134 counties and placing in the bottom quartile of all Virginia counties.
8 A composite measure of Access to Care, which examines the percent of the population without health insurance and ratio of population to
primary care physicians, and Quality of Care, which examines the hospitalization rate for ambulatory care sensitive conditions, whether
diabetic Medicare patients are receiving HbA1C screening, and percent of chronically ill Medicare enrollees in hospice care in the last 8 months of life.
9 A composite measure that examines Environmental Quality, which measures the number of air pollution-particulate matter days and air
pollution-ozone days, and Built Environment, which measures access to healthy foods and recreational facilities and the percent of restaurants that are for fast food.

A-38 Shenandoah Memorial Hospital
Community Health Needs Assessment
Exhibit 22: County Rank among 134 Virginia Counties, 2016
Indicator Category Page Shenandoah Warren Winchester City
Health Outcomes 66 33 37 82
Mortality 89 34 56 90
Morbidity 45 38 26 72
Health Factors 101 44 57 62
Health Behaviors (30%) 62 23 48 75
Clinical Care (20%) 125 120 110 41
Social & Economic Factors (40%) 95 44 48 62
Physical Environment (10%) 121 74 71 85
Source: County Health Rankings, 2016
Key
Top 50th percentile of VA counties (Better)
25th to 49th percentile of VA counties
Bottom 25th percentile of VA counties (Worse)
Physical Environment Metrics have changed from 2013 - Built Environment has changed to Housing and Transit; Environmental Quality has changed to Air and Water Quality Ranking.
After we compute composite scores we sort them from lowest to highest within each state. The lowest score (best health) gets a rank of #1 for that state and the highest score (worst health) gets whatever
rank corresponds to the number of units we rank in that state. It is important to note that we do not suggest that the rankings themselves represent statistically significant differences from county to
county. That is, the top ranked county in a state (#1) is not necessarily significantly healthier than the second ranked county (#2). See the next section about quartiles for more information.
Quartiles -To de-emphasize the differences between individual county ranks, we also group counties into quartiles according to their Health Outcomes and Health Factors ranks separately. For each set
of ranks there are four quartiles that divide up all the units within the state into the top 25%, the second from top 25%, the second from bottom 25%, and the bottom 25%. The top 25% are the healthiest counties with the best ranks, the bottom 25% are the least healthy counties with the worst ranks, and the other two quartiles are in between. We provide color-coded maps of the Health Outcomes and
Health Factors summary scores by quartile to see the distribution of ranks within each state

A-39
Shenandoah Memorial Hospital
Community Health Needs Assessment
Exhibit 22 provides data for each underlying indicator of the composite categories in the County
Health Rankings.10
The County Health Rankings methodology provides a comparison of
counties within a state or Commonwealth to one another. It also is important to analyze how
these same indicators compare to the national average. Cells in the tables below (Exhibits 23A-
E) are shaded if the indicator for a county in the SMH community exceeded the national average
for that indicator by more than ten percent.
SMH community counties frequently ranked in the bottom half of for access to care,11
quality of
care,12
environmental quality13
and physical environment.14
(Exhibit 22).
10 County Health Rankings provides details about what each indicator measures, how it is defined, and data sources at
http://www.countyhealthrankings.org/sites/default/files/resources/2013Measures_datasources_years.pdf 11 The percent of the population without health insurance and ratio of population to primary care physicians. New measure for 2016 to include
ratio of population to mental health providers. 12 Hospitalization rate for ambulatory care sensitive conditions, whether diabetic Medicare patients are receiving HbA1C screening, and percent
of chronically ill Medicare enrollees in hospice care in the last 8 months of life. 13 Includes education, employment, income, family and social support, and community safety. 14 Housing and transit focus areas (driving alone to work, long driving commutes, and severe housing problems)

A-40
Shenandoah Memorial Hospital
Community Health Needs Assessment
Exhibit 23A: County Data Compared to U.S. Average, Virginia Counties, 2016
2016 Page Shenandoah Warren US Median Virginia
Health Outcomes
Premature Death
(Years of Potential Life
Lost Rate)
8652 6161 7326 7,700 6,147
Poor or Fair Health
(Percent Fair/Poor) 16% 14% 13% 16% 17%
Poor Physical Health Days
(Physically Unhealthy
Days)
3.6 3.4 3.2 3.7 3.5
Poor Mental Health Days
(Mentally Unhealthy Days) 3.5 3.2 3.1 3.7 3.3
Low Birthweight
(Percent LBW) 6% 7% 7% 8% 8%
Source: County Health Rankings, 2016
Key
Unreliable or missing data ~ Ranging from better than U.S. median up
to 10% worse than U.S. median
10%-49% worse than U.S median
49-74% worse than U.S. median
>75% worse than U.S. median

A-41
Shenandoah Memorial Hospital
Community Health Needs Assessment
Exhibit 23B: County Data Compared to U.S. Average, Virginia Counties, 2016
2016 Page Shenandoah Warren US Median Virginia
Health Behaviors
Adult Smoking (Percent
Smokers) 19% 17% 18% 18% 20%
Adult Obesity (Percent
Obese) 30% 26% 28% 31% 27%
Food Environment
Index 8.1 8.6 8.8 7.2 8.3
Physical Inactivity
(Percent Physically
Inactive)
25% 21% 20% 28% 22%
Access to Exercise
Opportunities (Percent
with Access)
81% 62% 82% 62% 81%
Excessive Drinking
(Percent) 15% 16% 18% 17% 17%
Alcohol-impaired
Driving Deaths
(Percent)
21% 29% 29% 31% 31%
Sexually Transmitted
Infections (Chlamydia
Rate)
297 146 376 288 407
Teen Births 39 38 30 40 27 Source: County Health Rankings, 2016.
Key
Unreliable or missing data ~ Ranging from better than U.S. median up
to 10% worse than U.S. median
10%-49% worse than U.S median
50-74% worse than U.S. median
>75% worse than U.S. median

A-42
Shenandoah Memorial Hospital
Community Health Needs Assessment
Exhibit 23C: County Data Compared to U.S. Average, Virginia Counties, 2016
2016 Page Shenandoah Warren US Median Virginia
Clinical Care
Uninsured (Percent) 17% 17% 19% 17% 14%
Primary Care Physicians
(Ratio) 2166:1 2134:1 1759:1 1,990:1 1329:1
Dentists (Ratio) 5962:1 3309:1 4873:1 2,590:1 1570:1
Mental Health Providers
(Ratio) 3975:1 2049:1 1114:1 1,060:1 685:1
Preventable Hospital
Stays (Rate) 82 75 85 60 49
Diabetic Monitoring
(% Receiving HbA1c) 88% 85% 90% 85% 87%
Mammography Screening
(Percent) 53% 62% 57% 61% 63%
Source: County Health Rankings, 2016.
Key
Unreliable or missing data ~ Ranging from better than U.S. median up
to 10% worse than U.S. median
10%-49% worse than U.S median
50-74% worse than U.S. median
>75% worse than U.S. median

A-43
Shenandoah Memorial Hospital
Community Health Needs Assessment
Exhibit 23D: County Data Compared to U.S. Average, Virginia Counties, 2016
2016 Page Shenandoah Warren US Median Virginia
Social and Economic Factors
High School
Graduation
(Graduation Rate)
95% 91% 88% 89% 85%
Some College
(Completion Rate) 42.3% 46.8% 50.2% 56% 69%
Unemployment
(Rate) 8.1% 5.0% 5.5% 6.0% 5.2%
Children in Poverty
(Percent in Poverty) 24% 18% 16% 23% 16%
Income Inequality
(Ratio) 4.4 4.0 4.4 4.4 4.8
Children in single-
parent households 36% 32% 29% 32% 30%
Social Associations
(Association Rate) 10.5 15.7 15 13.0 11.3
Violent Crime (Rate) 103 94 102 199 200
Injury Deaths (Rate) 78 64 64 74 52
Source: County Health Rankings, 2016.
Key
Unreliable or missing data ~ Ranging from better than U.S. median up
to 10% worse than U.S. median
10%-49% worse than U.S median
50-74% worse than U.S. median
>75% worse than U.S. median

A-44
Shenandoah Memorial Hospital
Community Health Needs Assessment
Exhibit 23E: County Data Compared to U.S. Average, Virginia Counties, 2016
2016 Page Shenandoah Warren US Median Virginia
Physical Environment
Air Pollution -
Particulate Matter
(Average Daily PM2.5)
12.9 12.9 12.9 11.9 12.7
Drinking Water
Violations
(Presence of Violations)
Yes No No N/A N/A
Severe Housing
Problems (Percent) 14% 14% 16% 14% 15%
Driving Alone to Work
(Percent Driving Alone) 81% 81% 75% 80% 77%
Long Commute-Driving
Alone
(Percent)
38% 38% 57% 29% 38%
Source: County Health Rankings, 2016.
Key
Unreliable or missing data ~ Ranging from better than U.S. median up
to 10% worse than U.S. median
10%-49% worse than U.S median
50-74% worse than U.S. median
>75% worse than U.S. median
Page County’s population exposed to unsafe (safety violation) water in the past year was slightly
higher than Virginia’s average rate at 12.7. Cells in the tables above are shaded if the indicator
for the county in the SMH community exceeded the national average for that indicator by more
than 10 percent (Exhibit 23E).

A-45
Shenandoah Memorial Hospital
Community Health Needs Assessment
2. Virginia Department of Health
The Virginia Department of Health (VDH) maintains a data warehouse that includes indicators
regarding a number of health issues. In Exhibits 24 through 31, cells in the tables below are
shaded if the mortality rate for a County or health district in the SMH community exceeded the
Virginia average for that condition by more than ten percent. In some cases, data from VDH is
presented by health district.
The Lord Fairfax Health District is composed of Clarke, Frederick, Page, Shenandoah, and
Warren Counties, and Winchester City. The Rappahannock/Rapidan Health District includes
Rappahannock County from the SMH community, as well as Culpeper, Fauquier, Madison, and
Orange Counties. Supplemental cancer incidence data were gathered from the Centers for
Disease Control and Prevention.

A-46
Shenandoah Memorial Hospital
Community Health Needs Assessment
Exhibit 24: Leading Causes of Death by County, 2013
Page Shenandoah Warren Virginia US
Total Deaths All Ages 273 457 330 62,309 2,596,993
Total Deaths Rate 829 721.2 799.1 720.1 821.5
Malignant Neoplasms (Cancer) Rate 185 178.7 190.1 161.3 185.0
Diseases of Heart Rate 172.7 135.8 188.7 155.9 193.3
Cerebrovascular Disease Rate 45.5 38.9 34.6 38.5 40.8
Chronic Lower Respiratory Disease
Rate 42.3 45.7 50.7 37.2 47.2
Unintentional Injury Rate 55 42.4 41.6 33 41.3
Alzheimer's Disease Rate 46 13.2 8 19.6 26.8
Diabetes Mellitus Rate 10.1 20.7 10.9 18.3 23.9
Nephritis and Nephrosis Rate 14.4 14.4 17 18 14.9
Septicemia Rate 16.8 18.7 18.1 17.7 12.1
Influenza and Pneumonia Rate 31.1 23.7 12.5 16.8 18.0
Suicide Rate 16 14.2 17.5 12.2 13.0
Chronic Liver Disease Rate 11.8 12.5 5.3 8.9 11.5
Primary Hypertension & Renal
Disease Rate 10.6 6.8 9.2 7.2 9.7
Source: Virginia Department of Health, 2013. Retrieved from: https://www.vdh.virginia.gov/healthstats/stats.htm
Rates are per 100,000 population.
According to VDH, Page County compared unfavorably to Virginia on
seven indicators, with two indicators more than 75 percent worse than
the Virginia average. Mortality due to influenza and pneumonia was
greater than the Commonwealth average for four of the seven counties
for which there was reliable data (Exhibit 24).
Key Rates unreliable due to small sample size ~
Ranging from better than VA up to 10% worse than VA
10-50% worse than VA
50-75% worse than VA
> 75% worse than VA

A-47
Shenandoah Memorial Hospital
Community Health Needs Assessment
Exhibit 25: Selected Causes of Death by Health District and County, 2013
Health District
Death
from All
Causes
Cancer
All
Diseases of
the Heart
Cerebro-
Vascular
Chronic
Lower
Respiratory
Diseases
Page 15.1% 14.7% 10.8% 18.2% 13.7%
Shenandoah 0.2% 10.8% -12.9% 1.0% 22.8%
Warren 11.0% 17.9% 21.0% -10.1% 36.3%
Lord Fairfax 5.3% 15.7% -5.2% 0.5% 9.9%
Rappahannock
/Rapidan 2.9% -7.3% -7.1% 16.9% 14.5%
Source: Virginia Department of Health, 2011. Rates are per 100,000 population
Key Rates unreliable due to small sample size ~
Ranging from better than VA up to 10% worse than VA
11-49% worse than VA
50-74% worse than VA
> 75% worse than VA
The Lord Fairfax District reported cancer mortality rates more than 15.7 percent worse than
Virginia averages. Other populations in the Rappahannock/Rapidan Health District experienced
cerebrovascular disease-related mortality rates more than 16.9 percent worse than
Commonwealth averages. Page, Shenandoah, and Warren Counties experienced cancer rates
more than 10 percent worse than Virginia’s averages. (Exhibit 25).

A-48
Shenandoah Memorial Hospital
Community Health Needs Assessment
Exhibit 26: Injury-Related Mortality by Health District and County, 2013
Health District / County Unintentional
Injury
Motor Vehicle
Death Rate Suicide
Page 55 0.06 16
Shenandoah 42.4 0.21 14.2
Warren 41.6 0.21 17.5
Lord Fairfax 42.7 ~ 14.8
Rappahannock /Rapidan 45.7 ~ 14.6
Virginia 33 0.92 12.2 Source: Virginia Department of Health, 2013. Rates are per 100,000 population, are not age-adjusted, and were calculated by VHS.
Key Rates unreliable due to small sample size ~
Ranging from better than VA up to 10% worse than VA
11-49% worse than VA
50-74% worse than VA
> 75% worse than VA
Page County residents in the Lord Fairfax Health District experienced unintentional-injury
related mortality at a higher rate than the Virginia average for that cohort. The overall
populations of the Lord Fairfax and Rappahannock/Rapidan Health Districts reported higher
rates of mortality related to unintentional injury, motor vehicle injury, and suicide than
Commonwealth averages (Exhibit 26).
LORD FAIRFAX DISTRICT (Includes Clarke, Frederick, Page, Rappahannock, Shenandoah, Warren counties, Winchester city)
A-49
Shenandoah Memorial Hospital
Community Health Needs Assessment
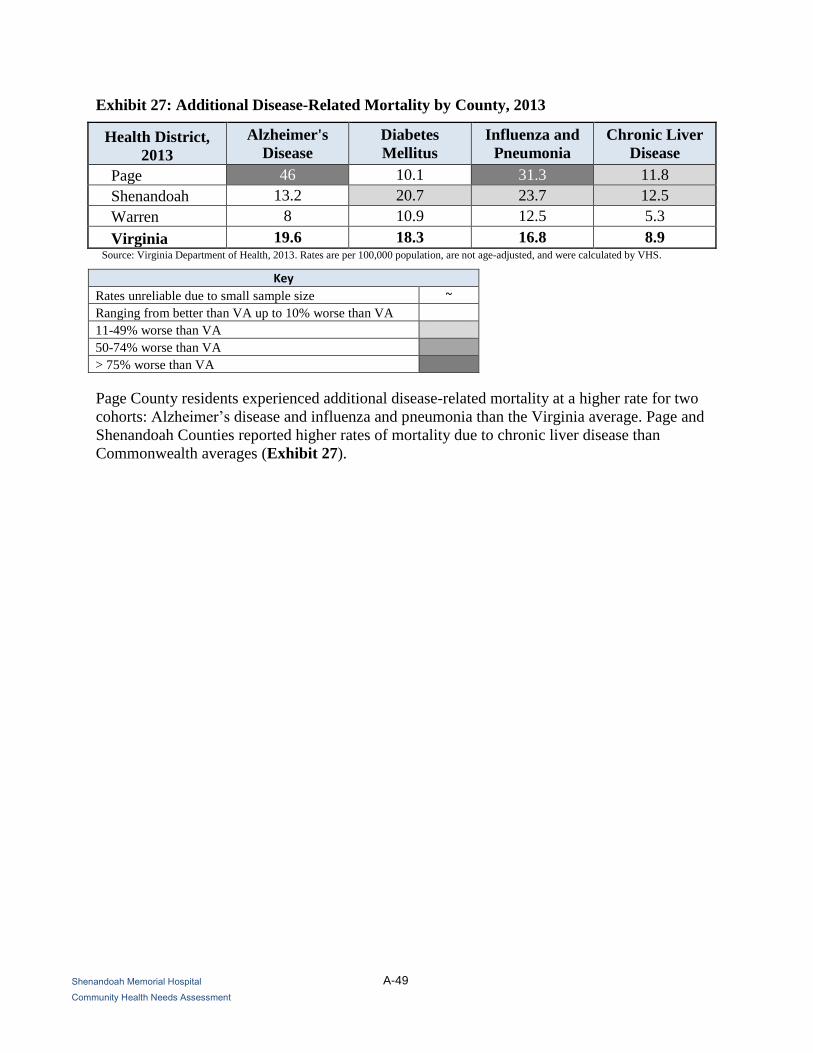
Exhibit 27: Additional Disease-Related Mortality by County, 2013
Health District,
2013
Alzheimer's
Disease
Diabetes
Mellitus
Influenza and
Pneumonia
Chronic Liver
Disease
Page 46 10.1 31.3 11.8
Shenandoah 13.2 20.7 23.7 12.5
Warren 8 10.9 12.5 5.3
Virginia 19.6 18.3 16.8 8.9 Source: Virginia Department of Health, 2013. Rates are per 100,000 population, are not age-adjusted, and were calculated by VHS.
Key Rates unreliable due to small sample size ~
Ranging from better than VA up to 10% worse than VA
11-49% worse than VA
50-74% worse than VA
> 75% worse than VA
Page County residents experienced additional disease-related mortality at a higher rate for two
cohorts: Alzheimer’s disease and influenza and pneumonia than the Virginia average. Page and
Shenandoah Counties reported higher rates of mortality due to chronic liver disease than
Commonwealth averages (Exhibit 27).

A-50
Shenandoah Memorial Hospital
Community Health Needs Assessment
Exhibit 28: Cancer Mortality Rates by Health District and Race, 2012
Health District and
Race
All
Cancers Colorectal
Lung and
Bronchus Breast Cervical Prostate
Lord Fairfax (Includes Clarke, Frederick, Page, Rappahannock, Shenandoah, Warren counties, Winchester city)
White 189.8 14.4 57.8 26.2 ~ 20.4
Black 236.4 ~ 82.3 ~ ~ ~
Total (All Races) 190.5 14.7 58.3 26.4 ~ 21.4
Rappahannock /Rapidan (Includes Culpeper, Fauquier, Madison, Orange, Rappahannock )
White 171.4 15.4 49.8 19.6 ~ 19.0
Black 223.2 ~ 49.4 ~ ~ ~
Total (All Races) 176.8 16.0 49.6 20.7 ~ 19.7
Virginia
White 168.2 14.0 48.8 21.3 1.7 18.9
Black 203.7 20.8 51.4 31.5 2.9 46.2
Total (All Races) 171.2 14.9 48.2 22.7 1.9 22.4 Source: Virginia Department of Health, 2012. Rates were calculated by VHS, are per 100,000 population, and are age-adjusted15.
Key Rates unreliable due to small sample size ~
Ranging from better than VA up to 10% worse than VA
11-49% worse than VA
50-74% worse than VA
> 75% worse than VA
Overall, the Lord Fairfax Health District reported mortality rates higher than the Virginia
average for lung and bronchus, breast, and prostate cancers. Rappahannock/Rapidan Health
District reported higher mortality rates than the Virginia average for colorectal, lung and
bronchus (Exhibit 28).
15 Number of cases 5 or less not reported due to confidentiality issues.

A-51
Shenandoah Memorial Hospital
Community Health Needs Assessment
Exhibit 29: Cancer Incidence Rates in Virginia by County, 2008-2012
Cancer
Incidence Page Shenandoah Warren Virginia US
All Cancers 430.1 407.6 428.2 429.1 453.8
Breast (Female) 108.2 126.4 115.4 124.6 123
Colorectal 34.7 27.2 41.9 38.3 41.9
Lung 67.2 67.2 76.1 63.6 63.7
Melanoma 21.4 13.1 13.1 18.3 19.9
Oral 11.7 11.8 13.5 10.4 11.3
Ovarian ~ ~ 14.9 11.8 11.8
Prostate 78.2 101.3 86.2 126.3 131.7 Source: Virginia Department of Health, 2012. Rates were calculated by VHS, are per 100,000 population, and are age-adjusted.
Key
Rates unreliable due to small sample size ~
Ranging from better than VA up to 10% worse than VA
11-49% worse than VA
50-74% worse than VA
> 75% worse than VA
Shenandoah County had a higher incident rates for Breast Cancer (Female) than the Virginia
average. Warren County had a higher incident rate for Oral Cancer than the Virginia and U.S.
average. Page, Rappahannock, and Warren Counties had rates of some cancers significantly
worse than the Virginia average. (Exhibit 29).

A-52
Shenandoah Memorial Hospital
Community Health Needs Assessment
Exhibit 30: Communicable Disease Incidence Rates by Health District, 2014
Health District / County Chlamydia Gonorrhea Lyme Disease
Page County, VA 205.7 ~ 54.6
Shenandoah County, VA 192.1 7.0 21.1
Warren County, VA 323.0 28.4 72.4
Lord Fairfax 276.6 30.3 47.4
Rappahannock/Rapidan 275.3 40.3 24.5
Virginia 432.5 99.2 16.3 Source: Virginia Department of Health, 2014. Rates are per 100,000 population.
Key Rates unreliable due to small sample size ~
Ranging from better than VA up to 10% worse than VA
11-49% worse than VA
50-74% worse than VA
> 75% worse than VA
The Lord Fairfax and Rappahannock/Rapidan Health Districts reported much lower chlamydia
and gonorrhea rates than the Virginia average, but Lyme Disease incidence exceeded the
Virginia average. Lyme Disease rates reported were 75 % higher for Page and Warren Counties
(Exhibit 30).

A-53
Winchester Medical Center
Community Health Needs Assessment
Exhibit 31: Maternal and Child Health Indicators by County and State, 2014
Indicator, 2013 Page Shenandoah Warren Virginia
Low birth weight infants 6.4 6.8 6.3 8.0
Very low birth weight infants ~ 1.3 1.3 1.6
Teen pregnancy rate 10-19 20.5 18.7 18.2 14.4
No prenatal care in first trimester 28.4 16.4 21.4 17.1
Infant mortality rate 0 4.4 2.1 6.2 Sources: Virginia Department of Health, 2014.
*Rates per 1,000 females aged 15-19 were calculated by Valley Health using U.S. Census, ACS 5-year estimates. **Rates per 1,000 live births.
Key Rates unreliable due to small sample size ~
Ranging from better than VA up to 10% worse than VA
11-49% worse than VA
50-74% worse than VA
> 75% worse than VA
Page and Winchester city reported rates of no prenatal care in the first trimester, more than 50
percent higher than the Virginia average. Shenandoah, and Warren Counties reported teen birth
rates more than 26-30 percent higher, whereas, Page County reported teen birth rates at 40
percent higher than the Commonwealth average (Exhibit 31).

A-54
Winchester Medical Center
Community Health Needs Assessment
3. Behavioral Risk Factor Surveillance System
Data collected by the Centers for Disease Control and Prevention’s (CDC) Behavioral Risk
Factor Surveillance System (BRFSS) are based on a telephone survey that gathers data on
various health indicators, risk behaviors, healthcare access, and preventive health measures. Data
is collected for the entire U.S. Analysis of BRFSS data can identify localized health issues and
trends, and enable county, state (or Commonwealth), or nation-wide comparisons.
Exhibit 32 compares various BRFSS indicators for Frederick, Page, Shenandoah, and Warren
Counties, with Virginia and U.S. averages for comparison. Indicators are shaded if an area’s
value was more than ten percent higher than the Virginia average. Data for Clarke and
Rappahannock Counties and Winchester city were not included in this analysis due to small
sample sizes.
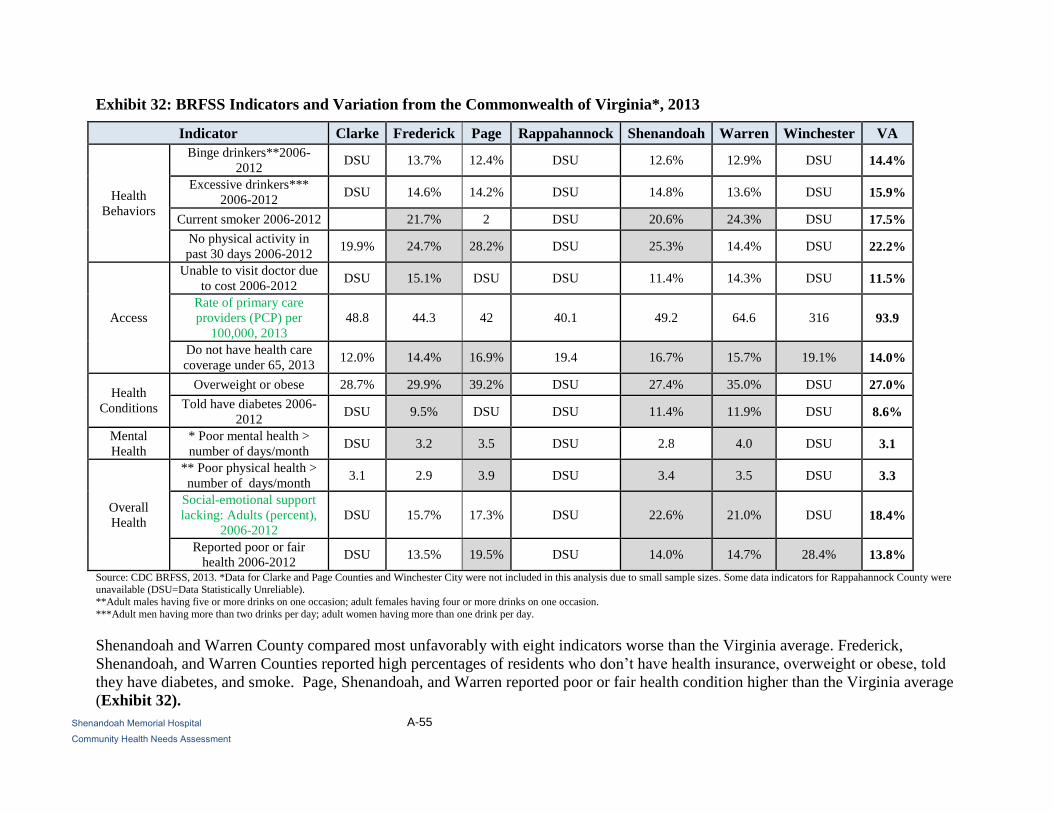
A-55
Shenandoah Memorial Hospital
Community Health Needs Assessment
Exhibit 32: BRFSS Indicators and Variation from the Commonwealth of Virginia*, 2013
Indicator Clarke Frederick Page Rappahannock Shenandoah Warren Winchester VA
Health
Behaviors
Binge drinkers**2006-
2012 DSU 13.7% 12.4% DSU 12.6% 12.9% DSU 14.4%
Excessive drinkers***
2006-2012 DSU 14.6% 14.2% DSU 14.8% 13.6% DSU 15.9%
Current smoker 2006-2012 21.7% 2 DSU 20.6% 24.3% DSU 17.5%
No physical activity in
past 30 days 2006-2012 19.9% 24.7% 28.2% DSU 25.3% 14.4% DSU 22.2%
Access
Unable to visit doctor due
to cost 2006-2012 DSU 15.1% DSU DSU 11.4% 14.3% DSU 11.5%
Rate of primary care
providers (PCP) per
100,000, 2013
48.8 44.3 42 40.1 49.2 64.6 316 93.9
Do not have health care
coverage under 65, 2013 12.0% 14.4% 16.9% 19.4 16.7% 15.7% 19.1% 14.0%
Health
Conditions
Overweight or obese 28.7% 29.9% 39.2% DSU 27.4% 35.0% DSU 27.0%
Told have diabetes 2006-
2012 DSU 9.5% DSU DSU 11.4% 11.9% DSU 8.6%
Mental
Health
* Poor mental health >
number of days/month DSU 3.2 3.5 DSU 2.8 4.0 DSU 3.1
Overall
Health
** Poor physical health >
number of days/month 3.1 2.9 3.9 DSU 3.4 3.5 DSU 3.3
Social-emotional support
lacking: Adults (percent),
2006-2012
DSU 15.7% 17.3% DSU 22.6% 21.0% DSU 18.4%
Reported poor or fair
health 2006-2012 DSU 13.5% 19.5% DSU 14.0% 14.7% 28.4% 13.8%
Source: CDC BRFSS, 2013. *Data for Clarke and Page Counties and Winchester City were not included in this analysis due to small sample sizes. Some data indicators for Rappahannock County were unavailable (DSU=Data Statistically Unreliable).
**Adult males having five or more drinks on one occasion; adult females having four or more drinks on one occasion.
***Adult men having more than two drinks per day; adult women having more than one drink per day.
Shenandoah and Warren County compared most unfavorably with eight indicators worse than the Virginia average. Frederick,
Shenandoah, and Warren Counties reported high percentages of residents who don’t have health insurance, overweight or obese, told
they have diabetes, and smoke. Page, Shenandoah, and Warren reported poor or fair health condition higher than the Virginia average
(Exhibit 32).

A-56
Shenandoah Memorial Hospital
Community Health Needs Assessment
Ambulatory Care Sensitive Conditions
This section examines the frequency of discharges for Ambulatory Care Sensitive Conditions
(ACSC) throughout the counties in SMH’s community and at the hospital.
ACSC are sixteen health “conditions for which good outpatient care can potentially prevent the
need for hospitalization or for which early intervention can prevent complications or more severe
disease.”16
As such, rates of hospitalization for these conditions can “provide insight into the
quality of the health care system outside of the hospital,” including the accessibility and
utilization of primary care, preventive care and health education. Among these conditions are:
diabetes, perforated appendixes, chronic obstructive pulmonary disease (COPD), hypertension,
congestive heart failure, dehydration, bacterial pneumonia, urinary tract infection, and asthma.
Disproportionately high rates of discharges for ACSC indicate potential problems with the
availability or accessibility of ambulatory care and preventive services and can suggest areas for
improvement in the health care system and ways to improve outcomes.
16 Agency for Healthcare Research and Quality (AHRQ) Prevention Quality Indicators, accessed online at
http://archive.ahrq.gov/data/hcup/factbk5/factbk5d.htm on June 28, 2013.

A-57
Shenandoah Memorial Hospital
Community Health Needs Assessment
1. County-Level Analysis
Exhibit 33: Discharges for ACSC by County and Payer17
, 2015
County Blue
Cross Medicaid Medicare Other Commercial Self
Total IP
ACSC
Discharges
Total
ACSC
Discharges
PSA 272 158 1,492 2 156 147 2,227 22,051
Shenandoah 272 158 1,492 2 156 147 2,227 22,051
SSA 260 177 1,236 5 177 196 2,051 33,514
Page 29 33 233 1 20 30 346 11,777
Warren 231 144 1,003 4 157 166 1,705 21,737
Total 532 335 2,728 7 333 343 4,278 55,565 Source: Valley Health System, 2015 Inpatient Data.
County Blue
Cross Medicaid Medicare Other Commercial Self
Total IP
ACSC
Discharges
PSA 12.2% 7.1% 67.0% 0.1% 7.0% 6.6% 10.1%
Shenandoah 12.2% 7.1% 67.0% 0.1% 7.0% 6.6% 10.1%
SSA 12.7% 8.6% 60.3% 0.2% 8.6% 9.6% 6.1%
Page 8.4% 9.5% 67.3% 0.3% 5.8% 8.7% 2.9%
Warren 13.5% 8.4% 58.8% 0.2% 9.2% 9.7% 7.8%
Total 12.4% 7.8% 63.8% 0.2% 7.8% 8.0% 7.7%
The table indicates that 7.7 percent of SMH community’s discharges were for ACSCs in 2015.
Medicare patients had the highest proportion of discharges for ACSCs. Self-pay patient
(typically uninsured individuals), have shown an ACSC decrease from 15.3 percent in 2013 to
6.9 percent in 2015. Shenandoah County had the highest percentage of discharges for ACSCs
(Exhibit 33).
17 Discharges from all Valley Health System hospitals.

A-58
Shenandoah Memorial Hospital
Community Health Needs Assessment
2. ZIP Code-Level Analysis
Exhibit 34: Discharges18
for ACSC by County and ZIP Code, 2015*
Source: Northern Shenandoah Valley Regional Commission, Analysis of data from Valley Health System, 2015.
The percentage of discharges that were for ACSC was highest in the following ZIP codes: 22630
in Warren County (Front Royal, 90.1%), 22835 in Page County (Luray, 64.29%) (Exhibit 34).
18 Discharges are from all Valley Health hospitals.

A-59
Shenandoah Memorial Hospital
Community Health Needs Assessment
3. Hospital-Level Analysis
Exhibit 35: ACSC Inpatient (IP) Discharges by Hospital, 2015
Entity Name
Total IP
ACSC
Discharges
Total IP
Discharges
Percent of IP ACSC
Discharges from Total
IP Discharges
Hampshire Memorial Hospital 285 464 61.4%
Page Memorial Hospital 177 751 23.6%
Shenandoah Memorial Hospital 1,210 1,555 77.8%
War Memorial Hospital 121 336 36.0%
Warren Memorial Hospital 1,316 2,217 59.4%
Winchester Medical Center 13,817 24,451 56.5%
Total 16,926 29,774 56.8%
Source: Valley Health System, 2015 Inpatient Data.
Page Memorial Hospital had the lowest percent of ACSC discharges of all hospitals in the Valley
Health System. Shenandoah Memorial Hospital had the highest percent of ACSC discharges for
2015 (Exhibit 35).

A-60
Shenandoah Memorial Hospital
Community Health Needs Assessment
Exhibit 36: Discharges for ACSC by Condition and Age, Shenandoah Memorial Hospital,
2015
Condition 18 to 39 40 to 64 65 + Total
*Heart failure 0 1 18 19
**Pneumonia 4 23 83 110
***Asthma 2 6 8 16
Urinary tract infection 1 3 12 16
****Diabetes 0 2 0 2
Dehydration 1 1 6 8
*****Hypertension 0 1 5 6
Angina 1 0 1 2
Appendix 0 0 1 1
Total 9 37 134 180
Total % 5.0% 20.6% 74.4% 100.0% Source: Valley Health System, 2015 Inpatient Data19.
The top four ACSC at SMH were: congestive heart disease, bacterial pneumonia, and urinary
tract infections in older adults and bacterial pneumonia in patients 40 to 64 years old. Patients
aged 65 years and over had the highest percentage of discharges for ACSC conditions (Exhibit
36).
19 Discharges from all Valley Health System hospitals. *Heart failure codes (428.1, I11.0, I50.21, I50.23, I50.31, I50.33, I50.9), **Pneumonia codes (J15.9, 482.9,
J18.9, J13, J18.9, J11.00, J15.6, 480.9, 481, 482, 482.1, 486, 487, J10.00, J15.7, P23.6, A40.3, J12.9), ***Asthma codes ( J45.901, J45.42, 493.92, 493.01, 493.02,
493.21, J45.902, J45.41, J45.909, J45.42, 493.92), ****Diabetes codes (648.01, E10.10, O24.410, O24.419, O24.420, O24.429, E10.11, E10.621, E10.69, E11.21,
E11.43, E11.52, E11.621, E10,69, E11.21, E11.43, E11.52, E11.621, E11.628, E11.649, E11.65, E11.69, E09.65, E10.649, E11.40, E11.51)

A-61
Shenandoah Memorial Hospital
Community Health Needs Assessment
Community Need Index™ and Food Deserts
1. Dignity Health Community Need Index
Dignity Health, a California-based hospital system, developed and has made widely available for
public use, a Community Need Index™ that measures barriers to health care access by County
and ZIP code.20
The index is based on five social and economic indicators:
The percentage of elders, children, and single parents living in poverty;
The percentage of adults over the age of 25 with limited English proficiency, and the
percentage of the population that is non-White;
The percentage of the population without a high school diploma;
The percentage of uninsured and unemployed residents; and
The percentage of the population renting houses.
The Community Need Index™ calculates a score for each ZIP code based on these indicators.
Scores range from “Lowest Need” (1.0-1.7) to “Highest Need” (4.2-5.0).
20 Accessed online at http://cni.chw-interactive.org/ on June 28, 2013.

A-62
Shenandoah Memorial Hospital
Community Health Needs Assessment
Exhibit 37: Community Need Index™ Score by County and ZIP Code
Source: Northern Shenandoah Valley Regional Commission
ZIP codes 22851, (Stanley, Page County), 22835 (Luray, Page County), 22664 (Woodstock,
Shenandoah County), and 22842 (Mount Jackson, Shenandoah County) scored just under the
“Highest Need” category (ranges from 4.2 – 5.0) (Exhibit 37). Areas of middle to high need are
located in substantial parts of Shenandoah, and Warren Counties.

A-63
Shenandoah Memorial Hospital
Community Health Needs Assessment
2. Food Deserts (Lack of Access to Nutritious and Affordable Food)
The U.S. Department of Agriculture’s Economic Research Service estimates the number of
people in each census tract that live in a “food desert,” defined as low-income areas more than
one mile from a supermarket or large grocery store in urban areas and more than 10 miles from a
supermarket or large grocery store in rural areas. Many government-led initiatives aim to
increase the availability of nutritious and affordable foods to people living in these food deserts.
Exhibit 38 illustrates the location of food deserts in the SMH community.
Exhibit 38: Food Deserts by Census Tract
Sources: Northern Shenandoah Valley Regional Commission and the Economic Research Services, U.S. Department of Agriculture, 2015.
The SMH community contains 4 census tracts identified as food deserts. There are three census
tracts designated as food deserts in Warren County and one designation in Shenandoah County
(Exhibit 38).

A-64
Shenandoah Memorial Hospital
Community Health Needs Assessment
Overview of the Health and Social Services Landscape
This section identifies geographic areas and populations in the community that may be facing
barriers accessing care due to medical underservice or a shortage of health professionals.
The section then summarizes various assets and resources available to improve and maintain the
health of the community.
1. Medically Underserved Areas and Populations
The Health Resources and Services Administration (HRSA) calculates an Index of Medical
Underservice (IMU) score for communities across the U.S. The IMU calculation is a composite
of the ratio of primary medical care physicians per 1,000 persons, the infant mortality rate, the
percentage of the population with incomes below the poverty level, and the percentage of the
population greater than age 64. IMU scores range from zero to 100, where 100 represents the
least underserved and zero represents the most underserved.21
Any area or population receiving an IMU score of 62.0 or less qualifies for Medically
Underserved Area (MUA) or Medically Underserved Population (MUP) designation. Federally
Qualified Health Centers (FQHCs) may be established to serve MUAs and MUPs. Populations
receiving MUP designation include groups within a geographic area with economic barriers or
cultural and/or linguistic access barriers to receiving primary care. When a population group
does not qualify for MUP status based on the IMU score, Public Law 99-280 allows MUP
designation if “unusual local conditions which are a barrier to access to or the availability of
personal health services exist and are documented, and if such a designation is recommended by
the chief executive officer and local officials of the state where the requested population
resides.”22
Exhibit 39 shows areas designated by HRSA as medically underserved. The SMH community
contains eight MUAs and three MUPs.
21 U.S. Health Resources and Services Administration. (n.d.) Guidelines for Medically Underserved Area and Population Designation. Retrieved
2012, from http://bhpr.hrsa.gov/shortage/muaps/index.html. 22 Ibid.

A-65
Shenandoah Memorial Hospital
Community Health Needs Assessment
Exhibit 39: Medically Underserved Areas and Populations and Health Professional
Shortage Areas, 2016
Source: Northern Shenandoah Valley Regional Commission, and Health and Human Services Administration, 2016.
Exhibit 39 shows areas designated by HRSA as medically underserved for mental, dental, and
primary care professionals.

A-66
Shenandoah Memorial Hospital
Community Health Needs Assessment
Exhibit 40: Medically Underserved Areas and Populations and Health Professional
Shortage Areas, 2016
Name HPSA Dental HPSA Mental HPSA Primary MUA or MUP
Page Yes Yes No Yes
Shenandoah Yes Yes No No
Warren Yes No No No Source: Northern Shenandoah Valley Regional Commission, and Health and Human Services Administration, 2016.
The SMH community contains one MUA and/or MUP located in Page County (Exhibit 40).
2. Health Professional Shortage Areas
A geographic area can receive a federal Health Professional Shortage Area (HPSA) designation
if a shortage of primary medical care, dental care, or mental health care professionals is found to
be present.
In addition to areas and populations that can be designated as HPSAs, a health care facility can
receive federal HPSA designation and an additional Medicare payment if it provides primary
medical care services to an area or population group identified as having inadequate access to
primary care, dental, or mental health services.
HPSAs can be: “(1) An urban or rural area (which need not conform to the geographic
boundaries of a political subdivision and which is a rational area for the delivery of health
services); (2) a population group; or (3) a public or nonprofit private medical facility.”23
Areas and populations in the SMH community are designated as HPSAs (Exhibit 39). Page
County reported shortages in all three categories for dental services, mental services, and
primary medical care and has been designated as a Medically Underserved Area and a Medically
Underserved Population (Exhibit 40). Shenandoah County reported shortages for dental
services, and mental health services, whereas, Warren County reported shortages in dental
services.
23 U.S. Health Resources and Services Administration, Bureau of Health Professionals. (n.d.). Health Professional Shortage Area Designation
Criteria. Retrieved 2015, from http://bhpr.hrsa.gov/shortage/hpsas/designationcriteria/index.html

A-67
Shenandoah Memorial Hospital
Community Health Needs Assessment
3. Description of Other Facilities and Resources within the Community
The SMH community contains a variety of resources that are available to meet the health needs
identified in this CHNA. These resources include facilities designated as HPSAs, hospitals,
FQHCs, health professionals, and other agencies and organizations.
Exhibit 41: List of Hospitals in the SMH Community
County Hospital Name
PSA
Shenandoah, VA Shenandoah Memorial Hospital
SSA
Page, VA Page Memorial Hospital
Warren, VA Warren Memorial Hospital Source: Centers for Medicare & Medicaid Services, 2016.
The community contains one acute care hospital and two critical care access hospital facilities
(Exhibit 41).
Federally Qualified Health Centers (FQHCs) were created by Congress to promote access to
ambulatory care in areas designated as “medically underserved.” These clinics receive cost-based
reimbursement for Medicare and many also receive grant funding under Section 330 of the
Public Health Service Act. FQHCs also receive a prospective payment rate for Medicaid services
based on reasonable costs.

A-68
Shenandoah Memorial Hospital
Community Health Needs Assessment
Exhibit 42: Health Professionals Rates per 100,000 Population by County
Shenandoah
Memorial
Hospital
County
Primary Care Physicians Dentists Mental Health Providers
Number
Rate
per
100,000
Number
Rate
per
100,000
Number Rate per
100,000
PSA 20 47.4 13 30.8 21 49.7
Shenandoah 20 46.9 13 30.2 21 49.0
SSA 33 52.8 12 19.2 41 65.5
Page 11 46.2 4 16.8 6 25.0
Warren 22 56.8 8 20.5 35 90.0
Virginia 6216 75.3 5303 63.7 12162 146.1
Source: Data provided by County Health Rankings, 2016.
In the SMH community, mental health provider availability is below the Commonwealth average
in all areas; dental provider availability is below average (Exhibit 42).
A number of other agencies and organizations are available in each County in the SMH
community to assist in meeting health needs. In addition to the organizations listed below, see
Exhibits 60 through 64 for a listing of community organizations represented by individuals
participating in key informant interviews and community response sessions.
Community organizations that provide services to residents with disabilities:
o Access Independence
o ARC of Northern Shenandoah Valley
o Blue Ridge Center for Therapeutic Horsemanship
o Blue Ridge Opportunities
o Deaf and Hard of Hearing Services Center, Inc.
o Disability Law Center of Virginia
o Goodwill Resource Center
o Grafton Integrated Health Network
o Northwestern Regional Educational Programs (N.R.E.P.)
o NW Works, Inc.
o SHEN-PACO Industries, Inc.
o Virginia Department for Aging and Rehabilitative Services
Community organizations that provide services for disease prevention / treatment:
o AIDS Response Effort
o Diabetes Management Program – Valley Health System

A-69
Shenandoah Memorial Hospital
Community Health Needs Assessment
Community organizations that provide services relating to domestic violence:
o Choices Council on Domestic Violence for Page County, Inc.
o Department of Social Services (Clarke, Frederick, Shenandoah Counties and
Winchester City)
o The Laurel Center Intervention for Domestic & Sexual Violence
o People Incorporated of Virginia (Woodstock, VA)
o Response, Inc. (Woodstock, VA)
Community organizations that provide free or reduced cost health care:
o Concern Hotline
o Crossroads Counseling Center
o Free Medical Clinic of Northern Shenandoah Valley
o Shenandoah Community Health Clinic/Shenandoah Community Dental Clinic
o St. Luke Community Clinic
Community organizations that provide housing support or shelter for homeless residents:
o House of Hope (Front Royal, VA)
Community organizations that provide hunger reduction services:
o C-CAP Front Royal, VA
o Compassion Cupboard (Strasburg, VA)
o Loaves and Fishes Food Pantry (Warren County)
o Lord Fairfax Area Food Bank
o Open Door Food Pantry (Mount Jackson, VA)
o The Salvation Army
Front Royal/Warren County
Community organizations that provide family planning and maternal/child health
services:
o Abba Care
o Shenandoah County Pregnancy Center

A-70
Shenandoah Memorial Hospital
Community Health Needs Assessment
Community organizations that provide services for at-risk children/families:
o Healthy Families
Northern Shenandoah Valley
Shenandoah County
Community organizations that provide veterans services:
o Patriot’s Path
Local chapters of national organizations, such as the Alzheimer’s Association, American
Cancer Association, American Heart Association, American Red Cross, Habitat for
Humanity, YMCA, and YWCA
Local places of worship that provide food or housing assistance:
o Columbia Furnace Church of the Brethren (Shenandoah County)
Local facilities (Exhibit 41)
Local first responders, including fire departments, police departments, and Emergency
Medical Services (EMS)
Local government agencies, Chambers of Commerce, and City Councils
Local and district public health departments
Local schools, colleges, and universities

A-71
Shenandoah Memorial Hospital
Community Health Needs Assessment
Findings of Other Recent Community Health Needs Assessments
Valley Health System also considered the findings of other needs assessments published since
2009. Fourteen such assessments conducted in the WMC area are referenced here, with
highlights and summary points below.
1. Coors Healthcare Solutions, 2016
Coors Healthcare Solutions produced a “Physician Strategy Assessment”24
and considered the
patient market, medical staff, and physician market to help Valley Health evaluate and plan for
the community’s medical staffing needs. Primary data included physician interviews and medical
staff interviews, while secondary data from the U.S. Census and Medical Group Management
Association (MGMA) was used.
Key findings relevant to this CHNA include:
Page County is federally designated as an underserved area.
The top 10 physician specialty shortages were in pediatrics, internal medicine,
otolaryngology, general surgery, ophthalmology, urology, obstetrics/gynecology,
gastroenterology, hematology/oncology, and allergy/immunology.
2. Homelessness and Medical Vulnerability - Point in Time Survey – 2016 (data from 2015)
The statewide 1,000 Homes for 1,000 Virginians initiative is led by the Virginia Coalition to End
Homelessness to survey/assess the 1,000 most vulnerable Virginians experiencing homelessness
who cycle between streets, emergency shelters, hospital emergency rooms, jails, and prisons.
There are eight campaigns representing thirteen counties and over 30 jurisdictions across the
Commonwealth. The initiative conducts a Point-in-Time survey that is administered on one night
to count the unsheltered homeless persons within the community. The survey is conducted
during the last ten days in January. Winchester City and Frederick County are included within
the Harrisonburg data collection campaign.
Of the thirteen communities across the Commonwealth participating in the 1,000 Homes for
1,000 Virginians initiative, twelve have conducted Registry Weeks to collect information on
vulnerability. A Vulnerability Index is used to calculate the survey results.
Key findings relevant to this CHNA include:
1,406 individuals experiencing homelessness were identified and surveyed; 45.5 percent
(640) of those surveyed were identified as medically vulnerable.
24 Coors Consulting. (2016). Physician Needs Assessment. Retrieved 2016, from Valley Health System.

A-72
Shenandoah Memorial Hospital
Community Health Needs Assessment
Average age for the total population surveyed was 44 years old. Twenty percent (333) of
the respondents are over 55 years old, 2 percent (39) are over 65 years old, and 1 percent
(15) are over 70 years old. The oldest respondent surveyed was 85 years old.
Respondents reported a total of 2,011 ER visits in the last 2 months, for an estimated cost
of $10,658,300, assuming an average of $1,325 per ER visit.
Respondents reported a total of 1,135 inpatient hospitalizations in the past year, at an
estimated annual cost of $23,835,000. This assumes an average of $21,000 per admission
for a 3-day medical stay.
Data collected from the surveys reported 22 percent of those surveyed had a heart
condition, 21 percent had asthma, 17 percent had diabetes, and 13 percent shown signs of
frostbite. Other health issues reported included emphysema, liver disease, hepatitis C,
cancer, kidney disease, HIV/AIDS, and tuberculosis.
3. United Way of the Northern Shenandoah Valley, Community Needs Update 2014-2017
The United Way completed a community health needs assessment in April 2014. The assessment
includes demographic and social trends in order to update priorities and target contributed funds
to the needs that matter the most to the people within the community. Community Impact
priorities are used as a tool for planning and as a guide for fund distribution. The United Way has
worked with many community partners to focus on mental health issues, update population data
and assess their progress, as an organization, in dealing with education, income and health
conditions.
Key findings relevant to this CHNA for education include:
Increased on-time high school graduation rates. The percentage of students in a cohort
who earned a Board of Education approved diploma within four years of entering high
school went from 87 percent in 2009 to 93 percent in 2012.
Decrease in the need for kindergarten remediation. The PALS-K is used to identify
kindergarten students who are behind in their acquisition of fundamental literacy skills.
Between the 2008-2009 and 2013-2014, the need for remedial assistance decreased from
37 percent to 31 percent for Winchester City, 16 percent to 14 percent for Shenandoah
County, 15 percent to 13 percent for Warren County, and 12 percent to 10 percent for
Clarke County. Frederick and Page Counties remained constant at 17 percent and 18
percent respectively, when compared to the previous reporting period,
Increase in college participation. The Virginia Department of Education assisted with the
creation of the Virginia Longitudinal Data System. This system tracks student success
from K-12 through college. From 2009 to 2012 reporting period, Frederick County
college participation rates increased from 64 percent to 65 percent.
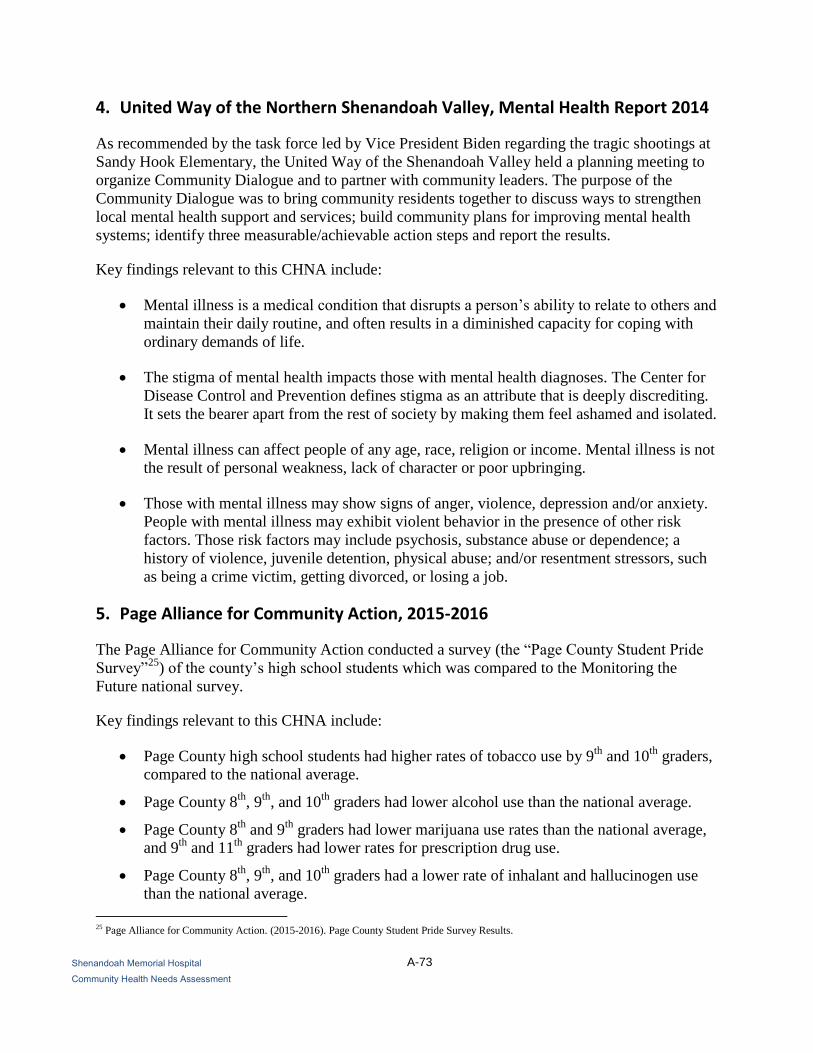
A-73
Shenandoah Memorial Hospital
Community Health Needs Assessment
4. United Way of the Northern Shenandoah Valley, Mental Health Report 2014
As recommended by the task force led by Vice President Biden regarding the tragic shootings at
Sandy Hook Elementary, the United Way of the Shenandoah Valley held a planning meeting to
organize Community Dialogue and to partner with community leaders. The purpose of the
Community Dialogue was to bring community residents together to discuss ways to strengthen
local mental health support and services; build community plans for improving mental health
systems; identify three measurable/achievable action steps and report the results.
Key findings relevant to this CHNA include:
Mental illness is a medical condition that disrupts a person’s ability to relate to others and
maintain their daily routine, and often results in a diminished capacity for coping with
ordinary demands of life.
The stigma of mental health impacts those with mental health diagnoses. The Center for
Disease Control and Prevention defines stigma as an attribute that is deeply discrediting.
It sets the bearer apart from the rest of society by making them feel ashamed and isolated.
Mental illness can affect people of any age, race, religion or income. Mental illness is not
the result of personal weakness, lack of character or poor upbringing.
Those with mental illness may show signs of anger, violence, depression and/or anxiety.
People with mental illness may exhibit violent behavior in the presence of other risk
factors. Those risk factors may include psychosis, substance abuse or dependence; a
history of violence, juvenile detention, physical abuse; and/or resentment stressors, such
as being a crime victim, getting divorced, or losing a job.
5. Page Alliance for Community Action, 2015-2016
The Page Alliance for Community Action conducted a survey (the “Page County Student Pride
Survey”25
) of the county’s high school students which was compared to the Monitoring the
Future national survey.
Key findings relevant to this CHNA include:
Page County high school students had higher rates of tobacco use by 9th
and 10th
graders,
compared to the national average.
Page County 8th
, 9th
, and 10th
graders had lower alcohol use than the national average.
Page County 8th
and 9th
graders had lower marijuana use rates than the national average,
and 9th
and 11th
graders had lower rates for prescription drug use.
Page County 8th
, 9th
, and 10th
graders had a lower rate of inhalant and hallucinogen use
than the national average.
25 Page Alliance for Community Action. (2015-2016). Page County Student Pride Survey Results.

A-74
Shenandoah Memorial Hospital
Community Health Needs Assessment
Page County 8th
, 9th
, and 10th
graders had a lower rate of ecstasy, meth, and over the
counter (OTC) drug abuse than the national averages; except 8th
graders for OTC drugs.
6. Shenandoah County Coalition, 2013-2014
The Shenandoah Coalition conducted a survey, the “Shenandoah County Student Pride Survey26
”
of the county’s high school students which was compared to the Monitoring the Future national
survey.
Key findings relevant to this CHNA include:
Shenandoah County high school students had higher rates of tobacco use by 8th
and 10th
graders, compared to the national average.
Shenandoah County 8th
graders had higher alcohol use rates than the national average.
Shenandoah County 8th
, and 10th
graders had a higher rate of prescription drug abuse than
the national average.
Shenandoah County 8th
, 10th
, and 12th
graders had a higher rate of prescription drug use
than the national averages.
7. Warren Coalition, 2014-2015
The Warren Coalition conducted a survey, the “Warren County Student Pride Survey,”27
of the
county’s high school students which was compared to the “Monitoring the Future” national
survey.
Key findings relevant to this CHNA include:
Warren County high school students had lower rates of tobacco use by 8th
, 10th
, and 12th
graders, compared to the national average.
Warren County 8th
, 10th
, and 12th
graders had lower alcohol and prescription drug abuse
rates than the national average.
Warren County 8th
, 10th
, and 12th
graders had lower rates of inhalant and hallucinogen use
than the national average.
Warren County 8th
, 10th
, and 12th
had lower rates of ecstasy, meth, and OTC drug abuse
than the national averages.
8. Lord Fairfax Health District, 2014
The Lord Fairfax Health District completed a “2014 Language Needs Assessment”28
that
analyzed the limited English proficiency of the counties in the Lord Fairfax Health District,
26 Shenandoah Coalition. (2013-2014). Shenandoah County Student Pride Survey Results. 27 Warren Coalition. (2014-2015). Warren County Student Pride Survey Results. 28 Lord Fairfax Health District. (2014). 2014 Language Needs Assessment. Retrieved 2013, from:
http://www.vdh.virginia.gov/CLAS_Act/researchresources/documents/languageprofiles/LordFairfax.pdf

A-75
Shenandoah Memorial Hospital
Community Health Needs Assessment
which include: Frederick, Clarke, Page, Shenandoah, Warren, and Winchester City. The primary
data in the report include data from the Virginia Department of Health and U.S. Census.
Key findings relevant to this CHNA include:
Winchester city had the highest number of limited English proficient persons within the
district, with 2,427 individuals, followed by Frederick County with 2,537 individuals, and
Shenandoah County with 1,265. Page County had the fewest individuals with 123
individuals with limited English proficiency (LEP).
The primary language spoken by 81percent of LEP individuals was Spanish.
There has been a 61 percent increase in the use of educational services for LEP students,
with the highest usage of services in Frederick County (over 500 students).
About 6.2 percent of all patients receiving services in the Lord Fairfax Health District
were classified as LEP students, and about five percent of all patient encounters are with
LEP patients.
A-76
Shenandoah Memorial Hospital
Community Health Needs Assessment
PRIMARY DATA ASSESSMENT
Community Survey Findings
SMH’s survey of community health consisted of questions about a range of health status and
access issues, as well as respondent demographic characteristics. The survey was made available
from January – March 2016 on Valley Health’s web site and was widely publicized at the
Community Wellness Festival, Lord Fairfax Community College, and the Mexican Consulate
event on the Our Health, Inc. campus, and via e-mail distribution lists, computer kiosks
throughout the region, partner organizations, mass mailing, newsletters, social media, and
websites. The questionnaire was available in English and Spanish, and paper copies were
available on request.
1. Respondent Characteristics
The survey questionnaire was completed by 739 residents from the SMH community. Survey
responses were received from residents of 21 of the SMH community’s 22 ZIP codes.
Shenandoah County had the highest percentage of respondents from the total surveys collected.
Residents from the Primary Service Area (PSA) accounted for 43.7 percent of respondents. The
highest percent of English surveys received were from the female population at 79.7 percent.
However, the Spanish surveys with the highest percentage received was from the male
population at 61.1 percent. The highest percentage of respondents were aged 45-55 and 55-64 for
the English surveys; however, for the Spanish surveys the respondents were 25-44 years of age.
The majority of respondents reported being married or cohabitating (63.4), employed full time
(55.5 percent), privately insured (60.6 percent), and having an undergraduate degree or higher
(48.4 percent). The majority (95.1 percent) of respondents speak English in the home. Two
percent of respondents reported that they spoke multiple languages at home, and two percent
reported speaking only Spanish at home.
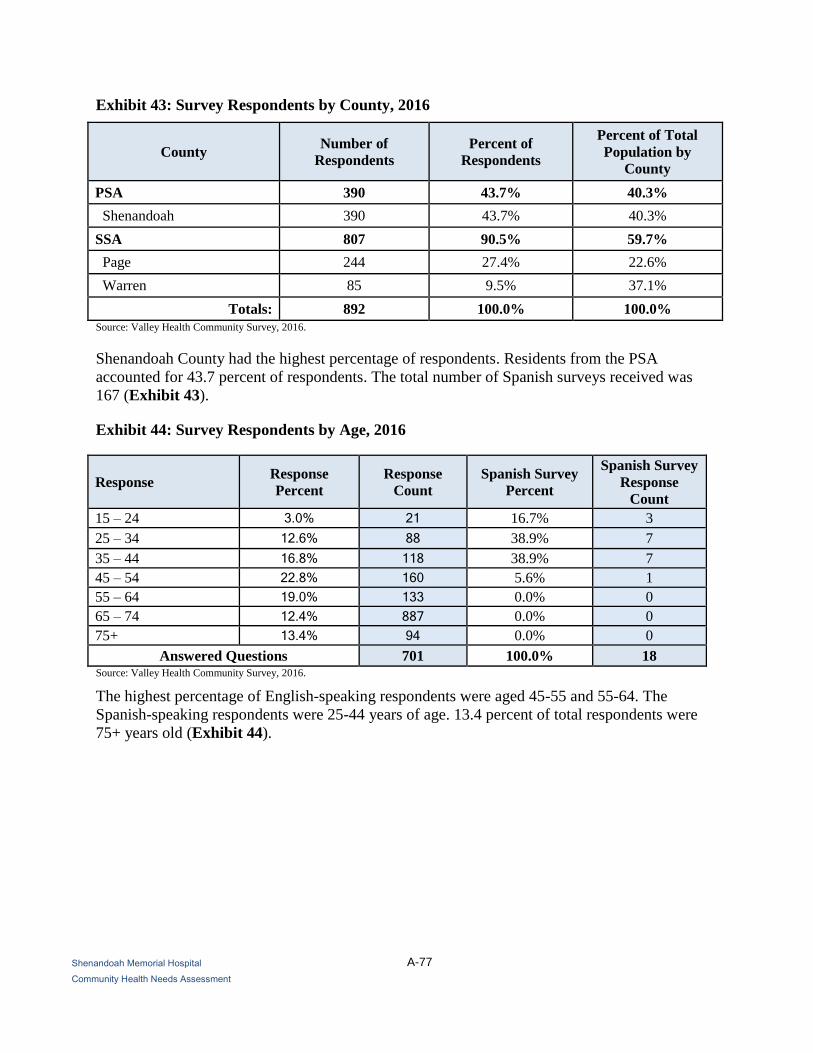
A-77
Shenandoah Memorial Hospital
Community Health Needs Assessment
Exhibit 43: Survey Respondents by County, 2016
County Number of
Respondents
Percent of
Respondents
Percent of Total
Population by
County
PSA 390 43.7% 40.3%
Shenandoah 390 43.7% 40.3%
SSA 807 90.5% 59.7%
Page 244 27.4% 22.6%
Warren 85 9.5% 37.1%
Totals: 892 100.0% 100.0%
Source: Valley Health Community Survey, 2016.
Shenandoah County had the highest percentage of respondents. Residents from the PSA
accounted for 43.7 percent of respondents. The total number of Spanish surveys received was
167 (Exhibit 43).
Exhibit 44: Survey Respondents by Age, 2016
Response Response
Percent
Response
Count
Spanish Survey
Percent
Spanish Survey
Response
Count
15 – 24 3.0% 21 16.7% 3
25 – 34 12.6% 88 38.9% 7
35 – 44 16.8% 118 38.9% 7
45 – 54 22.8% 160 5.6% 1
55 – 64 19.0% 133 0.0% 0
65 – 74 12.4% 887 0.0% 0
75+ 13.4% 94 0.0% 0
Answered Questions 701 100.0% 18 Source: Valley Health Community Survey, 2016.
The highest percentage of English-speaking respondents were aged 45-55 and 55-64. The
Spanish-speaking respondents were 25-44 years of age. 13.4 percent of total respondents were
75+ years old (Exhibit 44).

A-78
Shenandoah Memorial Hospital
Community Health Needs Assessment
Exhibit 45: Survey Respondents by Sex, 2016
Response Response
Percent
Response
Count
Spanish Survey
Percent
Spanish Survey
Response
Count
Female 79.7% 559 38.9% 7
Male 20.3% 142 61.1% 11
Answered Questions 701 100.0% 18
Source: Valley Health Community Survey, 2016.
The highest percent of English surveys received were from the female population at 79.7
percent; however, a higher percentage of males (61.1) percent completed Spanish surveys
(Exhibit 45).
Exhibit 46: Survey Respondents by Ethnicity, 2016
Response Response
Percent
Response
Count
Spanish
Survey
Percent
Spanish
Survey
Response
Count
White 93.9% 658 5.6% 1
Black or African American 0.9% 6 0.0% 0
Hispanic or Latino 1.1% 8 88.9% 16
American Indian and Alaska Native 0.1% 1 0.0% 0
Asian 0.4% 3 0.0% 0
Hawaiian Native and other Pacific
Islander 0 0.0% 0
Some other race 0.1% 1 0.0% 0
Two or more races 2.0% 14 0.0% 0
Other (please specify) 1.4% 10 5.6% 1
Answered Questions 701 100.0% 18 Source: Valley Health Community Survey, 2016.
The White population was the largest group to respond to the English survey at 93.9 percent
(Exhibit 46).

A-79
Shenandoah Memorial Hospital
Community Health Needs Assessment
Exhibit 47: Survey Respondents by Marital Status, 2016
Response Response
Percent
Response
Count
Spanish
Survey
Percent
Spanish
Survey
Response
Count
Married/co-habiting 63.2% 443 72.2% 13
Not married/single 13.4% 94 27.8% 5
Divorced 12.1% 85 0.0% 0
Widowed 11.3% 79 0.0% 0
Answered Questions 701 100.0% 18 Source: Valley Health Community Survey, 2016.
A majority of the surveys received were from married or co-habiting individuals (Exhibit 47).
Exhibit 48: Survey Respondents by Education Attainment, 2016
Answer Options Response
Percent
Response
Count
Spanish
Survey
Percent
Spanish
Survey
Response
Count
Did not complete high school 8.0% 56 44.4% 8
High school diploma or GED 21.0% 147 27.8% 5
Some college 20.3% 142 16.7% 3
College degree or higher 48.4% 339 0.0% 0
Other (please specify) 2.4% 17 11.1% 2
Answered Questions 701 100.0% 18 Source: Valley Health Community Survey, 2016.
Most of the English surveys received were from individuals who have earned a college degree or
a high school diploma. Among the Spanish survey respondents, 47.9 percent had not completed
high school and 26.7 percent of respondents had earned only a high school diploma or GED
(Exhibit 48).

A-80
Shenandoah Memorial Hospital
Community Health Needs Assessment
Exhibit 49: Survey Respondents by Income, 2016
Response Response
Percent
Response
Count
Spanish
Survey
Percent
Spanish
Survey
Response
Count
Less than $15,000 10.3% 72 50.0% 9
$15,000 - $24,999 13.4% 94 16.7% 3
$25,000 - $34,999 10.8% 76 22.2% 4
$35,000 - $49,000 14.1% 99 11.1% 2
$50,000 - $74,999 20.8% 146 0.0% 0
$75,000 - $99,999 16.9% 112 0.0% 0
Over $100,000 14.6% 102 0.0% 0
Answered Questions 701 100.0% 18 Source: Valley Health Community Survey, 2016.
Individuals from all income levels were represented among the survey results. Although
somewhat evenly distributed, the highest percentage of English survey respondents indicated
income between $50,000 – $74,999 (20.8%), 75,000 – $99,999 (16.9%). Spanish survey
respondents indicated income levels of less than $15,000 (36.4%) (Exhibit 49).
Exhibit 50: Survey Respondents by Employment Status, 2016
Response Response
Percent
Response
Count
Spanish
Survey
Percent
Spanish
Survey
Response
Count
Full time 55.1% 386 72.2% 13
Part time (one job) 6.4% 45 0.0% 0
Part time (more than one job) 1.7% 12 0.0% 0
Retired 23.4% 164 0.0% 0
Student 1.3% 9 0.0% 0
Unemployed 4.9% 34 22.2% 4
Other (please specify) 7.3% 51 5.6% 1
Answered Questions 701 100.0% 18 Source: Valley Health Community Survey, 2016.
Of the English survey respondents, 55.1 percent reported that they had a full-time job. Over 72.2
percent of the Spanish survey respondents reported that they had a full-time job (Exhibit 50).

A-81
Shenandoah Memorial Hospital
Community Health Needs Assessment
Exhibit 51: Language Spoken in Home, 2016
Response Response
Percent
Response
Count
Spanish
Survey
Percent
Spanish
Survey
Response
Count
English 97.6% 684 0.0% 0
Spanish 0.9% 6 100.0% 18
German 0.0% 0 0.0% 0
French 0.1% 1 0.0% 0
Chinese 0.3% 2 0.0% 0
Vietnamese 0.1% 1 0.0% 0
Other (please specify) 1.0% 7 0.0% 0
Answered Questions 701 100.0% 18 Source: Valley Health Community Survey, 2016.
English and Spanish are most frequently spoken in the homes of the respective survey
respondents (Exhibit 51).
Exhibit 52: Where and How Did You Receive Survey? 2016
Answer Options Response
Percent
Response
Count
Spanish
Survey
Percent
Spanish
Survey
Response
Count
Church 0.3% 2 16.7% 3
Community Event or Meeting 4.1% 29 5.6% 1
Grocery store or Shopping mall 0.4% 3 0.0% 0
Mail 19.8% 139 0.0% 0
Newspaper 0.1% 1 0.0% 0
Personal Contact 5.4% 38 0.0% 0
Social Media (Facebook) 3.3% 23 0.0% 0
Workplace 31.1% 218 0.0% 0
Other (please specify) 35.4% 248 77.8% 14
Answered Questions 701 100.0% 18 Source: Valley Health Community Survey, 2016.
Community responses were collected from various venues throughout the region. The greatest
number of Spanish surveys collected from Lord Fairfax Community College (63.0%) and the
highest percent of English surveys were in response to the direct mail campaign. (Exhibit 52).
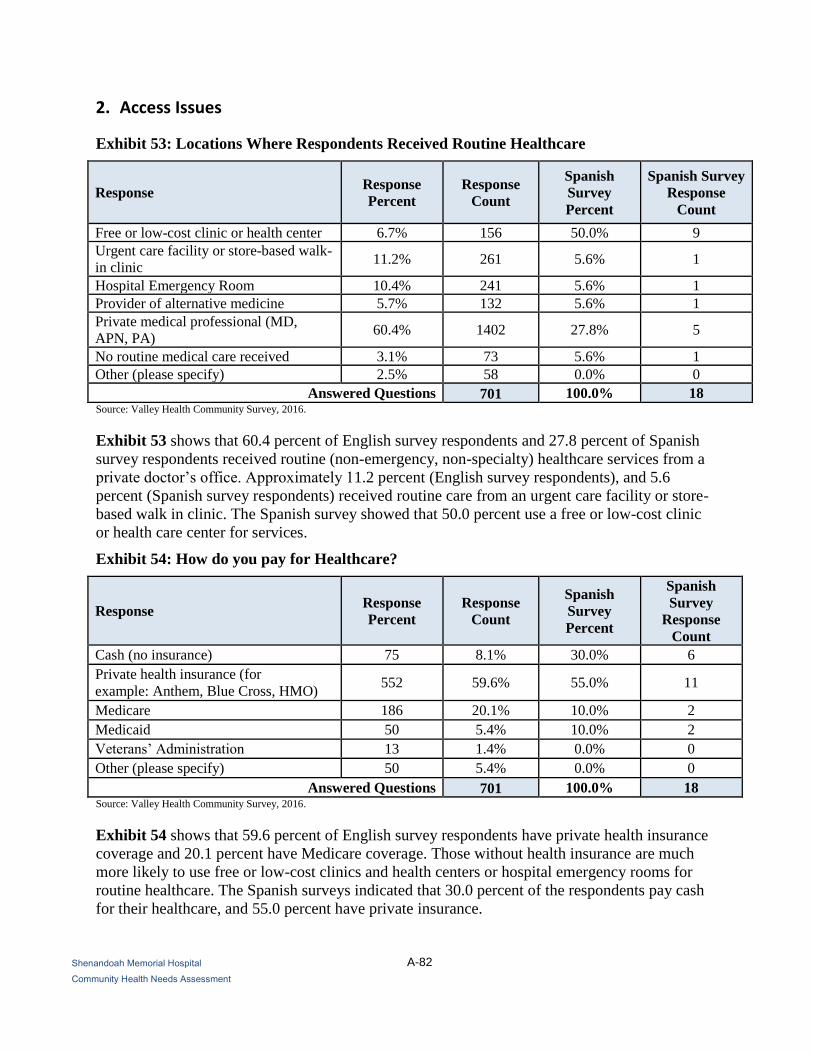
A-82
Shenandoah Memorial Hospital
Community Health Needs Assessment
2. Access Issues
Exhibit 53: Locations Where Respondents Received Routine Healthcare
Response Response
Percent
Response
Count
Spanish
Survey
Percent
Spanish Survey
Response
Count
Free or low-cost clinic or health center 6.7% 156 50.0% 9
Urgent care facility or store-based walk-
in clinic 11.2% 261 5.6% 1
Hospital Emergency Room 10.4% 241 5.6% 1
Provider of alternative medicine 5.7% 132 5.6% 1
Private medical professional (MD,
APN, PA) 60.4% 1402 27.8% 5
No routine medical care received 3.1% 73 5.6% 1
Other (please specify) 2.5% 58 0.0% 0
Answered Questions 701 100.0% 18 Source: Valley Health Community Survey, 2016.
Exhibit 53 shows that 60.4 percent of English survey respondents and 27.8 percent of Spanish
survey respondents received routine (non-emergency, non-specialty) healthcare services from a
private doctor’s office. Approximately 11.2 percent (English survey respondents), and 5.6
percent (Spanish survey respondents) received routine care from an urgent care facility or store-
based walk in clinic. The Spanish survey showed that 50.0 percent use a free or low-cost clinic
or health care center for services.
Exhibit 54: How do you pay for Healthcare?
Response Response
Percent
Response
Count
Spanish
Survey
Percent
Spanish
Survey
Response
Count
Cash (no insurance) 75 8.1% 30.0% 6
Private health insurance (for
example: Anthem, Blue Cross, HMO) 552 59.6% 55.0% 11
Medicare 186 20.1% 10.0% 2
Medicaid 50 5.4% 10.0% 2
Veterans’ Administration 13 1.4% 0.0% 0
Other (please specify) 50 5.4% 0.0% 0
Answered Questions 701 100.0% 18 Source: Valley Health Community Survey, 2016.
Exhibit 54 shows that 59.6 percent of English survey respondents have private health insurance
coverage and 20.1 percent have Medicare coverage. Those without health insurance are much
more likely to use free or low-cost clinics and health centers or hospital emergency rooms for
routine healthcare. The Spanish surveys indicated that 30.0 percent of the respondents pay cash
for their healthcare, and 55.0 percent have private insurance.

A-83
Shenandoah Memorial Hospital
Community Health Needs Assessment
Exhibit 55A: Respondent Ability to Receive Needed Care, by Type of Care (English)
Response Always Sometimes Rarely Never N/A Response
Count
Basic medical care 1479 197 48 19 17 1760
Dental care 1214 223 141 88 49 1715
Mental health care 717 176 104 120 546 1663
Medical specialty care 1032 272 107 62 202 1675
Medicine and medical
supplies 1309 217 67 32 83 1708
Routine screenings
(mammograms, laboratory
testing, age/gender
appropriate screenings)
1322 193 89 56 51 1711
Source: Valley Health Community Survey, 2016.
Response Always Sometimes Rarely Never N/A
Basic medical care 84.0% 11.1% 2.7% 1.0% 0.9%
Dental care 7.1% 1.3% 8.2% 0.5% 2.8%
Mental health care 43.1% 10.6% 6.3% 7.2% 32.8%
Medical specialty care 61.6% 16.2% 6.4% 3.7% 12.1%
Medicine and medical
supplies 76.6% 12.7% 3.9% 1.9%
4.9%
Routine screenings
(mammograms, laboratory
testing, age/gender
appropriate screenings)
77.3% 11.3% 5.2% 3.3% 3.0%
Source: Valley Health Community Survey, 2016.
Exhibit 55A suggests that most English survey respondents indicated that they “always” had the
ability to access needed care including primary care, dental care, medical specialty care,
medicine and medical supplies, and routine screenings. Of the community surveyed, 77.3 percent
reported that they have gender- and age-appropriate routine screenings.

A-84
Shenandoah Memorial Hospital
Community Health Needs Assessment
Exhibit 55B: Respondent Ability to Receive Needed Care, by Type of Care (Spanish)
Response Always Sometimes Rarely Never N/A Response
Count
Basic medical care 7 7 1 1 7 16
Dental care 5 6 3 1 5 15
Mental health care 2 1 3 5 2 11
Medical specialty care 2 0 4 4 2 10
Medicine and medical supplies 3 5 3 1 3 12
Routine screenings
(mammograms, laboratory
testing, age/gender appropriate
screenings)
2 8 3 1 2 14
Source: Valley Health Community Survey, 2016.
Response Always Sometimes Rarely Never N/A
Basic medical care 43.8% 43.8% 6.3% 6.3% 43.8%
Dental care 33.3% 40.0% 20.0% 6.7% 33.3%
Mental health care 18.2% 9.1% 27.3% 45.5% 18.2%
Medical specialty care 20.0% 0.0% 40.0% 40.0% 20.0%
Medicine and medical supplies 25.0% 41.7% 25.0% 8.3% 25.0%
Routine screenings
(mammograms, laboratory
testing, age/gender appropriate
screenings)
14.3% 57.1% 21.4% 7.1% 14.3%
Source: Valley Health Community Survey, 2016.
Exhibit 55B suggests that there is a discrepancy between the English and Spanish survey
respondent groups regarding the ability to receive needed care. Most respondents in the Spanish
community felt that they did not “always” receive basic medical care, dental care, needed mental
health care or medical specialty care. Only 43.8 percent of Spanish survey respondents indicated
that they always receive basic medical care, and 14.3 percent reported that they have had routine
screenings.

A-85
Winchester Medical Center
Community Health Needs Assessment
Exhibit 56A: Barriers to Receiving Needed Care (English)
Response No
Insurance
Can’t Get
Appointment
Can’t
Afford
it/Too
Expensive
Inconvenient
Hours
Lack of
Transportation
Lack of
Trust
Language
Barrier Other
Basic medical care 15.5% 7.7% 16.0% 4.6% 4.3% 1.7% 1.0% 6.4%
Dental care 28.2% 2.9% 32.2% 3.0% 1.9% 2.0% 0.1% 4.6%
Mental health care 14.0% 6.1% 18.0% 3.7% 1.4% 5.1% 0.3% 12.0%
Medical specialty care 13.0% 8.0% 22.0% 4.6% 2.4% 2.3% 0.4% 9.4%
Medicine and medical
supplies 14.6% 2.4% 19.7% 1.9% 1.7% 0.9% 0.7% 5.4%
Routine screenings
(mammograms, laboratory
testing, age/gender
appropriate screenings) 15.8% 3.1% 18.1% 3.6% 2.0% 2.4% 0.9% 5.7% Source: Valley Health Community Survey, 2016.
Key
Top two barriers by care type
Cost and lack of insurance were the most frequently reported barriers to care. Among those choosing “other,” most responses cited
either cost or a lack of need for services as the reason they did not access care (Exhibit 56A).

A-86
Winchester Medical Center
Community Health Needs Assessment
Exhibit 56B: Barriers to Receiving Needed Care (Spanish)
Response No
Insurance
Can’t Get
Appointment
Can’t
Afford
it/Too
Expensive
Inconvenient
Hours
Lack of
Transportation
Lack of
Trust
Language
Barrier Other
Basic medical care 16.7% 0.0% 11.1% 0.0% 0.0% 0.0% 16.7% 0.0%
Dental care 22.2% 0.0% 22.2% 0.0% 0.0% 0.0% 22.2% 0.0%
Mental health care 5.6% 0.0% 22.2% 0.0% 0.0% 0.0% 5.6% 0.0%
Medical specialty care 5.6% 0.0% 22.2% 0.0% 0.0% 0.0% 5.6% 0.0%
Medicine and medical
supplies 11.1% 0.0% 11.1% 0.0% 0.0% 0.0% 11.1% 0.0%
Routine screenings
(mammograms, laboratory
testing, age/gender
appropriate screenings)
16.7% 0.0% 11.1% 0.0% 0.0% 5.6% 16.7% 0.0%
Source: Valley Health Community Survey, 2016.
Key
Top two barriers by care type
Among Spanish survey respondents, cost, lack of insurance, and language were the most frequently reported barriers to care. Among
those choosing “other,” most responses cited either cost or a lack of need for services as the reason they did not access care (Exhibit
56B).

A-87
Winchester Medical Center
Community Health Needs Assessment
3. Health Issues
Exhibit 57A: Most Important Health Issues Identified (English)
Response Response
Percent
Response
Count
Access to healthy food is limited 4.0% 221
Asthma 0.8% 46
Alzheimer’s or dementia 2.8% 152
Affordable housing 3.1% 172
Cancer 10.9% 598
Chronic Obstructive Pulmonary Disease (COPD) 1.3% 74
Dental Health 2.2% 119
Diabetes 2.0% 111
Domestic Violence 6.7% 366
Heart disease and stroke 6.6% 362
Homelessness 2.5% 138
High blood pressure 3.4% 189
Low income/financial challenges 10.4% 570
Mental health (such as depression, bipolar, autism) 7.9% 435
Motor vehicle crash injuries 0.6% 32
Not enough exercise 5.1% 279
Poor air quality 0.6% 33
Poor dietary choices 5.5% 303
Respiratory/lung disease 1.0% 56
Sexually Transmitted Diseases (STDs) 0.9% 48
Stroke 0.8% 43
Substance abuse 13.3% 731
Suicide 0.7% 38
Teenage pregnancy 1.7% 96
Tobacco use 3.6% 198
Other (please specify) 1.4% 78
Totals 100% 5488 Source: Valley Health Community Survey, 2016.
Key
Top five most important
health issues identified
When asked to identify the top health issues in the community, English survey respondents most
often chose substance abuse, cancer, low income or financial challenges, domestic violence, and
mental health. Although not in the top five health issues identified, heart disease, poor dietary
choices, not enough exercise and access to healthy food were also frequently cited health
concerns (Exhibit 57A).

A-88
Winchester Medical Center
Community Health Needs Assessment
Exhibit 57B: Most Important Health Issues Identified (Spanish)
Response Response
Percent
Response
Count
Access to healthy food is limited 4.4% 2
Asthma 7.1% 4
Alzheimer’s or dementia 2.4% 1
Affordable housing 2.4% 1
Cancer 21.4% 10
Chronic Obstructive Pulmonary Disease (COPD) 0.0% 0
Dental Health 2.4% 2
Diabetes 11.9% 5
Domestic Violence 2.4% 1
Heart disease and stroke 9.5% 5
Homelessness 0.0% 1
High blood pressure 2.4% 1
Low income/financial challenges 4.8% 2
Mental health (such as depression, bipolar, autism) 4.8% 2
Motor vehicle crash injuries 0.0% 0
Not enough exercise 0.0% 1
Poor air quality 0.0% 0
Poor dietary choices 0.0% 0
Respiratory/lung disease 4.8% 0
Sexually Transmitted Diseases (STDs) 4.8% 1
Stroke 2.4% 0
Substance abuse 2.4% 1
Suicide 2.4% 1
Teenage pregnancy 4.8% 2
Tobacco use 4.8% 2
Other (please specify) 0.0% 0
Totals 100% 45 Source: Valley Health Community Survey, 2016.
Key
Top five most important health
issues identified
When asked to identify the top health issues in the community, Spanish survey respondents most
often indicated cancer, diabetes, low income or financial challenges, heart disease and stroke,
and asthma, followed by mental health, respiratory/lung disease, sexually transmitted diseases,
teen pregnancy (Exhibit 57B).

A-89
Winchester Medical Center
Community Health Needs Assessment
4. Health Behaviors
Exhibit 58: Most Important Risky Health Behaviors Identified
Response Response
Percent
Response
Count
Spanish
Survey
Percent
Spanish
Survey
Response
Count
Alcohol abuse 15.4% 832 23.8% 10
Being overweight 14.8% 802 11.9% 5
Dropping out of school 3.3% 181 4.8% 2
Drug abuse 24.1% 1304 23.8% 10
Lack of exercise 7.3% 396 2.4% 1
Poor eating habits 12.0% 648 9.5% 4
Not getting shots to prevent disease 2.3% 125 0.0% 0
Racism or other form of bigotry 2.7% 147 4.8% 2
Tobacco use 8.2% 443 11.9% 5
Not using birth control 2.9% 155 2.4% 1
Not using seat belts/child safety seats 2.2% 121 2.4% 1
Unsafe sex 3.9% 212 2.4% 1
Other (please specify) 0.9% 49 0.0% 0 Source: Valley Health Community Survey, 2016.
Key
Top five risky health issues
identified
When asked to identify the top risky health behaviors in the community, both English and
Spanish survey respondents most often indicated drug abuse, alcohol abuse, being overweight,
poor eating habits, and tobacco use, followed by dropping out of school, lack of exercise, unsafe
sex.
The top risky health behaviors in the SMH community as reported by Spanish survey
respondents are racism or other forms of bigotry, dropping out of school, not using birth control,
not using seat belts/child safety seats, unsafe sex, and not enough exercise (Exhibit 58).

A-90
Winchester Medical Center
Community Health Needs Assessment
Exhibit 59: Access to Fresh Fruits and Vegetables per Week
Response Response
Percent
Response
Count
Spanish
Survey
Percent
Spanish Survey
Response
Count
One time 2.9% 20 11.1% 2
Two times 6.6% 46 0.0% 0
Three times 11.6% 81 27.8% 5
Four times 8.6% 60 11.1% 2
Five or more times during the
week (5+) 67% 470 38.9% 7
I do not have regular access to
fresh fruits and vegetables 3.4% 24 11.1% 2
Source: Valley Health Community Survey, 2016.
A majority of respondents to both surveys reported that they were eating or have access to fresh
fruits and vegetables at least three or more times per week. Only 3.4 percent of the English
survey respondents reported that they do not have access to fresh fruits and vegetables. However,
11.1 percent of the Spanish survey respondents reported no regular access to fresh fruits and
vegetables (Exhibit 59).
A-91
Winchester Medical Center
Community Health Needs Assessment
Summary of Interview Findings, 2016
Valley Health System and Our Health, Inc. conducted both face-to-face informant interviews and
telephone interviews in March 2016. The interviews were designed to obtain input on health
needs from persons who represent the broad interests of the community served by WMC,
including those with special knowledge, of or expertise in, public health.
Nineteen group interviews were conducted with 80 individuals, including: persons with special
knowledge of, or expertise in, public health; health and other public departments or agencies
with data or information relevant to the health needs of the community; leaders, representatives
and members of medically underserved, low-income, and minority populations, and of
populations with chronic disease needs; and representatives of the educational and business
communities. An annotated list of individuals providing community input is included in the
following section of this report.
Interviews were conducted using a structured questionnaire. Informants were asked to discuss
community health issues and encouraged to think broadly about the social, behavioral and other
determinants of health. Interviewees were asked about issues related to health status, health care
access and services, chronic health conditions, populations with special needs, and health
disparities.
The frequency with which specific issues were mentioned and interviewees’ perceptions of the
severity (how serious or significant) and scope (how widespread) of each concern were assessed.
The following health status issues and contributing factors were reported to be of greatest
concern. The items in each list are presented in order of stated importance, although the
differences in some cases are relatively minor.
Health Status Issues
1. Drug and substance abuse: Substance abuse was the most frequently mentioned health
status issue, and was portrayed as both growing and serious throughout the region.
Heroin was mentioned most often; however, alcohol, marijuana, and methamphetamine
use were also mentioned. Interviewees reported that women who use illicit drugs and
compromise the health of their babies is of significant importance.
2. Mental and behavioral health: Mental and behavioral health was the second most
frequently mentioned health issue in the community. Interviewees reported that the
community’s mental health needs have risen, while mental health service capacity has
not. They described a wide range of mental health issues, including bullying among
youth, autism spectrum symptoms and diagnoses, depression among senior citizens, adult
and family stress and coping difficulties, lack of affordable outpatient mental health
professionals, and a lack of local inpatient treatment facilities. Interviewees also noted
frequent dual diagnoses of mental health problems and substance abuse.
3. Chronic Illness (i.e. Cholesterol, Diabetes, and Hypertension): Diabetes was the most
frequently mentioned chronic disease in the interviews, and was often paired with
discussion involving obesity or being overweight. This was true for all ages, but these
health issues were noted to be rising among children and youth. Commenting on related

A-92
Winchester Medical Center
Community Health Needs Assessment
contributing factors, interview participants mentioned nutrition and diet, low physical
activity and exercise levels, and food insecurity and hunger. Access to healthy foods was
mentioned as a barrier, including that some do not have money to purchase fresh produce.
There was widespread recognition of the toll a chronic illness has on health, its impact on
the health care system, and the importance of not only treatment but also behavioral
change in addressing the chronic disease.
4. Cancer: Cancer was mentioned frequently during the interview process. Some believe
this is due to increased awareness of caner services because of the Winchester Medical
Center Foundation’s Cancer Center Campaign promotion in the past year, and others
mentioned that it may be the result of preventative screenings.
5. Smoking and tobacco: Smoking and tobacco use was frequently mentioned in the
context of concerns about drug and substance abuse. Smoking was viewed as a
significant, long-existing health issue that has become notably worse since the launch of
electronic cigarettes (e-cigarettes).
Factors Contributing to Health Status and Access to Care
In addition to discussing health status issues and health conditions in the community, interview
participants addressed the factors or conditions they believe most contribute to poor health status.
Responses were similar to the 2013 Community Health Needs Assessment reports. A rank-
ordered list of the major contributing factors raised, some of them inter-related, is below:
1. Access to health care (physicians/specialists): Interview participants cited a wide
range of difficulties regarding access to care, including availability of providers
(physicians/specialists), cost and affordability of care, significant transportation barriers
for low-income and elderly populations, and language or cultural barriers for some
members of the community. Some interviewees mentioned that there are community
residents that do not seek medical care due to their U.S. residency status.
2. Financial insecurities and poverty: It was frequently stated that issues related to
income and financial resources, limit access to care, contribute to poor diet and nutrition,
and create stresses that negatively impact health.
3. Education/Awareness: Several interviewees mentioned that lack of education and
awareness about services were barriers to care. Factors linked generally to educational
attainment and specifically to health education were noted by interview participants as
impeding both the ability to effectively seek and manage health care, and to
adopt/practice healthy behaviors. Many noted that the community is not aware of
services available to them, and that finding services is not easily managed. It was also
mentioned that those coming out of prison have limited access to resources.
4. Poor nutrition and diet: Dietary habits and nutrition were mentioned most frequently
as major factors in obesity, diabetes, heart disease; and related conditions, and chronic
diseases. Interview participants mentioned this is due to a lack of access to affordable
healthy foods for lower income families.

A-93
Winchester Medical Center
Community Health Needs Assessment
5. Lack of physical activity and exercise: Among health behaviors that contribute to or
inhibit good health, a lack of physical activity and exercise was mentioned as a concern
for all age groups. Interview participants recognized that reasons for limited activity and
strategies to increase activity differ across the life span.
6. Affordable Housing/Assisted Living: Interview participants frequently mentioned the
need for affordable housing and assisted home care for senior citizens. Some interview
participants highlighted the particular health risks experienced by older residents in the
community. Seniors have lower incomes, transportation barriers, advanced chronic
diseases, and social isolation that can negatively impact health status.
7. Homelessness: Homelessness is a risk factor for poor health, and creates stresses and
challenges to maintaining one’s health and seeking or obtaining needed health care.

A-94
Winchester Medical Center
Community Health Needs Assessment
Individuals Providing Community Input
The CHNA took into account input from many people who represent the broad interests of the
community served by the hospital. This was done via interviews with 80 individuals and four
“community response sessions” that included 39 participants. These 119 stakeholders included
public health experts; individuals from health or other departments and agencies; leaders or
representatives of medically underserved, low-income, and minority populations; and other
individuals representing the broad interests of the community (Exhibits 60-64).
5. Public Health Experts
Individuals interviewed with special knowledge of, or expertise in, public health, some of whom
also participated in a community response session, include those in Exhibit 60:
Exhibit 60: Public Health Experts
Name Title Affiliation or
Organization
Special
Knowledge/Expertise or
Nature of Leadership Role
Interview
or Response
Session
Rhone Collins HIV/STD Counselor
Virginia Department
of Health
Lord Fairfax Health
District
Public health expertise
related to HIV/STD
prevention.
Interview
Victoria Crone
Public Health
Nutritionist
Supervisor
Virginia Department
of Health
Lord Fairfax Health
District
Public health expertise
related to encouraging proper
nutrition in WIC
participants.
Interview
Meredith Davis Epidemiologist
Virginia Department
of Health
Lord Fairfax Health
District
Expertise in the public health
needs of patients in Lord
Fairfax Health District.
Interview
Charles Devine, III, MD District Director
Virginia Department
of Health
Lord Fairfax Health
District
Expertise in the public health
needs of Lord Fairfax Health
district residents.
Both
Ann Judge Disease Prevention
Grant Coordinator
Virginia Department
of Health Lord Fairfax
Health District
Expertise in public health
needs of Lord Fairfax Health
District residents as it relates
to disease prevention.
Both
Mary Orndorff Disease Prevention
Health Coordinator
Virginia Department
of Health
Lord Fairfax Health
District
Public health expertise
related to health prevention. Interview

A-95
Winchester Medical Center
Community Health Needs Assessment
Exhibit 60: Public Health Experts (continued)
Name Title Affiliation or
Organization
Special
Knowledge/Expertise or
Nature of Leadership Role
Interview
or Response
Session
Leea Shirley Public Health Nurse
Supervisor
Virginia Department
of Health
Lord Fairfax Health
District
Expertise in the public health
needs of Lord Fairfax Health
district residents.
Interview
Stephanie Shoemaker Health Administrator Hampshire County
Health Department
Expertise in public health
needs of Hampshire County
residents
Response
Session

A-96
Winchester Medical Center
Community Health Needs Assessment
6. Health or Other Departments or Agencies
Several interviewees were from departments or agencies with current data or information
relevant to the health needs of the community (Exhibit 61). This list excludes the public health
experts identified in Exhibit 60.
Exhibit 61: Individuals from Health or Other Departments or Agencies
Name Title Affiliation or
Organization
Special
Knowledge/Expertise or
Nature of Leadership
Role
Interview
or
Response
Session
Cosby Porter-David Executive Director Good Samaritan
Free Clinic
Special knowledge
regarding health needs of
the indigent populations in
the community for
Berkeley County.
Interview
David Switzer, MD Physician Page Free Clinic
Special knowledge
regarding health needs of
the indigent populations in
the Page County
community.
Interview
Gerald Bechamps,
MD
Vice President of
Medical Affairs
Hampshire
Memorial Hospital
and War Memorial
Hospital
Special knowledge
regarding health needs of
the indigent populations in
Hampshire and Morgan
County communities.
Response
Session
Glenn Burdick, Ed.D.,
RN Executive Director
St. Luke
Community Clinic
Special knowledge
regarding health needs of
the indigent populations in
the Warren County
community.
Interview
Karen Sorensson Primary Care Nurse
Coordinator
Free Medical Clinic
of Northern
Shenandoah Valley
Special knowledge
regarding health needs of
the indigent populations in
the community.
Interview
Pam Murphy Executive Director Shenandoah County
Free Clinic
Special knowledge
regarding health needs of
the indigent populations in
the Shenandoah County
community.
Interview
Stefan Lawson Director
Free Medical Clinic
of Northern
Shenandoah Valley
Special knowledge
regarding health needs of
the indigent populations in
the community.
Interview

A-97
Winchester Medical Center
Community Health Needs Assessment
7. Community Leaders and Representatives
The following individuals were interviewed because they are leaders or representatives of
medically underserved, low-income, and/or minority populations (Exhibit 62). This list excludes
the public health experts identified in Exhibits 60.
Exhibit 62: Community Leaders and Representatives
Name Title Affiliation or
Organization
Special
Knowledge/Expertise or
Nature of Leadership Role
Interview
or Response
Session
Amy Wiley Patient Access Manager War Memorial
Hospital Morgan County
Response
Session
Carol Koenecke-Grant VP Strategic Services Valley Health System
Special knowledge regarding
marketing, communications,
strategy and business
development of the VHS
service region.
Response
Session
Cathy Weaver
Member, Page
Memorial Hospital
Board of Trustees
Community Community Response
Session
Chris Rucker
VP Community Health
and Wellness, President,
Valley Regional
Enterprises
Valley Health System
Special knowledge regarding
health needs and
transportation services.
Response
Session
David Cooper GIS Manager
Northern Shenandoah
Valley Regional
Commission
GIS Mapping Interview
David Crittenden Director of Rehab War Memorial
Hospital Morgan County
Response
Session
Diane Kerns
Member, Winchester
Medical Center Board
of Trustees
Community Community Response
Session
Eden E. Freeman City Manager City of Winchester City Government Response
Session
Ethel Showman
Member, Shenandoah
Memorial Hospital
Board of Trustees
Community Community Response
Session
Faith Power Member, Valley Health
Board of Trustees Community Community
Response
Session
Floyd Heater
VP, Valley Health
Southern Region,
President, Warren
Memorial Hospital
Valley Health System
Special knowledge of the
health needs of indigent
population in the Page,
Shenandoah, and Warren
Counties.
Response
Session
Frank Subasic
Member, War Memorial
Hospital Board of
Trustees
Community Community Response
Session

A-98
Winchester Medical Center
Community Health Needs Assessment
Exhibit 62: Community Leaders and Representatives (continued)
Name Title Affiliation or
Organization
Special
Knowledge/Expertise or
Nature of Leadership Role
Interview
or Response
Session
Grady (Skip) Philips President, Winchester
Medical Center Valley Health System
Special knowledge regarding
health needs of indigent
populations in the
community.
Response
Session
Janice Boserman PI/Quality War Memorial
Hospital Morgan County
Response
Session
Jessica Watson Director CDRC Chronic Disease
Resource Center
Special knowledge regarding
health needs of indigent
patients
Response
Session
Jill Williams Program Supervisor
Healthy Families
Northern Shenandoah
Valley
Experience providing
parenting support to at-risk
families in the community.
Interview
Julie Horak Pharmacy Manager War Memorial
Hospital Morgan County
Response
Session
Karen Schultz, PhD
Director & Professor,
Center for Public
Service and Scholarship
Shenandoah
University
Special knowledge regarding
health needs of the indigent
populations in the
community.
Response
Session
Katy Pitcock
Co-Chair and
Coordinator Community
Prenatal and Language
Access
Virginia Medical
Interpreting
Collaborative
Special knowledge of health
needs of populations that
have limited English
proficiency.
Community
Health
Survey
Kevin Sanzenbacher Chief of Police Winchester Police
Department Public safety
Response
Session
Kevin Tephabock State Vice President American Cancer
Society (ACS)
Special knowledge of
cancer-related health needs
in the community.
Response
Session
Kimberly Streett Transition Coach Care Management
Special knowledge regarding
health needs of indigent
populations in the
community for Page,
Shenandoah, and Warren
Counties.
Response
Session
Sara Schoonover-
Martin Executive Director
Healthy Families
Northern Shenandoah
Valley
Experience providing
parenting support to at-risk
families in the community.
Interview

A-99
Winchester Medical Center
Community Health Needs Assessment
Exhibit 62: Community Leaders and Representatives (continued)
Name Title Affiliation or
Organization
Special Knowledge/Expertise
or Nature of Leadership Role
Interview or
Response
Session
Shannon Urum Prevention Specialist Northwestern
Community Services
Special knowledge of
substance abuse prevention and
treatment in vulnerable
populations.
Response
Session
Sharen Gromling Executive Director Our Health, Inc.
Special knowledge regarding
health needs of the indigent
populations in the community.
Both
Travis Clark
VP, Operations, Valley
Health Southern Region
President, Shenandoah
Memorial Hospital and
Page Memorial Hospital
Valley Health System
Special knowledge regarding
health needs of indigent
populations in the community
for Page, Shenandoah, and
Warren Counties.
Response
Session

A-100
Winchester Medical Center
Community Health Needs Assessment
8. Persons Representing the Broad Interests of the Community
Exhibit 63: Other Interviewees Representing the Broad Interests of the Community
Name Title Affiliation or
Organization
Interview or Response
Session
Barry Presgraves County Administrator Local Government-
Page County Interview
Benjamin Dolewski Fitness Center Manager
Page Memorial
Hospital
Wellness & Fitness
Interview
Brittney Jones Quality & Case
Manager
AIDS Response
Effort, Inc. Response Session
Bryan Rosati Operations Manager -
Winchester
Valley Regional
Enterprise Interview
Carolyn Knowles Dispatch Manager Valley Medical
Transport Interview
Carolyn Wilson Oncology Nursing
Project Specialist
Winchester Medical
Center Interview
David Cunsolo Lead Pastor Victory Church Interview
Deborah Inaba Exercise Physiologist
Shenandoah Memorial
Hospital
Wellness & Fitness
Interview
Deena Lanham
Executive Director,
Oncology, Women &
Children Services
Winchester Medical
Center Interview
Diane Ricci Coordinator
Behavioral Health-
Senior Outpatient
Program
Response Session
Doug Pixler Director Eastern Panhandle
Transit Authority Interview
Doug Stanley County Administrator Local Government-
Warren County Interview
David Sovine, EdD Superintendent Frederick County
Public Schools Both
Mark Lineburg, EdD Superintendent Winchester City
Schools Interview
Eileen Johnston Director Hampshire County
Rural Development Interview
Elaine Bartoldson Deputy Director
Marketing
Eastern Panhandle
Transit Authority Interview
Elise Stine-Dolinar Marketing &
Development Manager United Way Response Session
Ernie Carnevale CEO Blue Ridge Hospice Interview
Jane Bauknecht Director Adult Care Center Response Session
Jeannie Coffman Faith Community Nurse Parish Nursing Response Session
Jeff Jeran Director Valley Health System
Wellness & Fitness Interview

A-101
Winchester Medical Center
Community Health Needs Assessment
Exhibit 63: Other Interviewees Representing the Broad Interests of the Community
(continued)
Name Title Affiliation or
Organization
Interview or Response
Session
John Nagley Executive Director AIDS Response
Effort, Inc. Response Session
Joyce Dunlap Breast Health Navigator Winchester Medical
Center Interview
Judy McKiernan Lead Student Support
Specialist
Frederick County
Public Schools Response Session
Judy Melton Registered Nurse II Winchester Medical
Center Response Session
Juli Ferrell Executive Director Big Brothers Big
Sisters Response Session
Karen Shipp Board Chair Faith in Action Response Session
Kelly Miller Coordinator of
Volunteer Services Blue Ridge Hospice Interview
Kim Herstritt Executive Director Literacy Volunteers Interview
Leslie Stewart Executive Director CLEAN, Inc. Interview
Lisa Zerull, PhD
Academic Liaison &
Program Manager Faith-
Based Services
Winchester Medical
Center Interview
Mallie Combs Director Hardy County Rural
Development Interview
Maricela Messner Coach Maxwell Team Response Session
Mark Grim Staff AIDS Response
Effort, Inc. Response Session
Mary Beth Pirolozzi Executive Director County United Way -
Hampshire County Interview
Mike Mitchell Sports Fitness Instructor
Warren Memorial
Hospital
Wellness & Fitness
Interview
Nadine Pottinga President/CPO
United Way of
Northern Shenandoah
Valley
Response Session
Pastor Mary Louise
Brown Pastor Faith Community Response Session
Paula Siburt Director of Resource
Development
United Way of
Northern Shenandoah
Valley
Response Session
Rebekah Schennum Chair Family Youth
Initiative Response Session
Reen Markland Clinical Coordinator,
Parish Nursing
Winchester Medical
Center Response Session
Roberta Lauder Director of Resource
Development
Shenandoah Area
Agency on Aging Response Session

A-102
Winchester Medical Center
Community Health Needs Assessment
Exhibit 64: Other Interviewees Representing the Broad Interests of the Community
Name Title Affiliation or
Organization
Interview or Response Session
Rusty Holland Executive Director Concern Hotline Response Session
Stephanie Grubb Coordinator
Behavioral Health-
Senior Outpatient
Program
Response Session
Tracy Mitchell Wellness Services
Manager Wellness Services Response Session
Trina Cox Fitness Services
Director
Hampshire Memorial
Hospital Wellness &
Fitness
Interview
Name Affiliation or
Organization
Interview or
Response Session
Cheryl Green Salvation Army Response Session
Matt Peterson Habitat for Humanity Response Session
Jane Barvir Girl Scouts Response Session
John Conrad WATTS Response Session
Diane King
Shenandoah County
Health Clinic Response Session
Cyndy Walsh
Shenandoah Education
Foundation Response Session
Becky Rollins Highland Food Pantry Response Session
Jenny Callis Highland Food Pantry Response Session
Renae Patrick
Blue Ridge Legal
Services Response Session
Jennifer Douglas
Heritage Child
Development Center Response Session
Charly Franks Faith in Action Response Session
Robert Boulter Faithworks Response Session
Pam Hayes
Dental Clinic of
Northern Shenandoah
Valley
Response Session
Lisa Gesler
Winchester Day
Preschool Response Session
Richard Kennedy
Apple Country Head
Start Response Session
Kaye Harris The Laurel Center Response Session
Jennifer Morrison Response Response Session
Bill Brent American Red Cross Response Session

A-103
Winchester Medical Center
Community Health Needs Assessment
SOURCES
111th U.S. Congress. (2010, March). Patient Protection and Affordable Care Act (PPACA).
Retrieved from https://www.medicaid.gov/affordablecareact/affordable-care-act.html
Centers for Disease Control, 2016. “Sexually Transmitted Disease Surveillance 2014”. Retrieved
2016, from http://www.cdc.gov/std/stats14/surv-2014-print.pdf.
Centers for Disease Control, 2016. “Insurance Survey 2015”. Retrieved 2016, from
http://www.cdc.gov/nchs/data/nhis/earlyrelease/insur201605.pdf
Congregational Health ReSource, LLC. (2009). Final Report: Page County (Luray).
Congregational Health ReSource, LLC. (2009). Final Report: Shenandoah County (Woodstock).
Coors Consulting. (2016). Physician Needs Assessment. Retrieved 2016, from Valley Health.
County of Fairfax, Virginia (2016). “Whitepaper of Medicaid Expansion in Virginia”,
Retrieved 2016 from.
http://www.fairfaxcounty.gov/healthreform/pdf/fairfax-county-medicaid-expansion-fact-
sheet.pdf
Dignity Health. (n.d.). Community Needs Index. Retrieved from http://cni.chw-interactive.org/
Economic Research Service (ERS), U.S. Department of Agriculture (USDA). (2010). Food
Access Research Atlas. Retrieved 2013, from http://www.ers.usda.gov/data-products/food-
access-research-atlas.aspx.
Federal Bureau of Investigation. (2014). Uniform Crime Reports: Violent and Property Crime
Offenses. Retrieved 2016, from http://www.fbi.gov/about-us/cjis/ucr/crime-in-the-
u.s/2011/crime-in-the-u.s.-2011/tables-by-title.
Health Indicator Warehouse, (2014). “Low Birth Weight Indicators”. Retrieved 2016, from
http://www.healthindicators.gov/Indicators/Low-birth-weight-deliveries-
percent_1135/Profile/ClassicData
Internal Revenue Service. (2015). Instructions for Schedule H (Form 990).
Lord Fairfax Health District. (2014). 2014 Language Needs Assessment. Retrieved 2016, from:
http://www.vdh.virginia.gov/CLAS_Act/researchresources/documents/languageprofiles/Lord
Fairfax.pdf
Morgan County Public Schools. (2013-2014). Morgan County Student Pride Survey Results.
Retrieved 2016.

A-104
Winchester Medical Center
Community Health Needs Assessment
National Pride Survey Data (2013-2014). “Grades 6-12 Pride Surveys National Summary”.
Retrieved 2016, from
http://www.pridesurveys.com/index.php/reports-on-student-behavior-perceptions-2/
Office of Epidemiology and Prevention Services. (2014). STD Surveillance Data. Retreived
2016, from http://www.dhhr.wv.gov/oeps/std-hiv-hep/stds_stis/Pages/STDSurveillance.aspx.
Office of School Nutrition Programs, Virginia Department of Education. (2015-2016). National
School Lunch Program (NSLP) Free and Reduced Price Eligibility Report. Retrieved 2016,
from http://www.doe.virginia.gov/support/nutrition/statistics/
Page Alliance for Community Action. (2014-2015). Page County Student Pride Survey Results.
Retrieved 2016.
Shenandoah Coalition in Partnership with the Family Youth Initiative. (2013-2014). Shenandoah
County Student Pride Survey Results. Retrieved 2016.
United Way of Northern Shenandoah Valley (2014-2017). “Community Needs Assessment”.
Retrieved 2016, from
http://www.unitedwaynsv.org/sites/unitedwayshenandoah.oneeach.org/files/pictures/Comm
unity%20Needs%20Update%202014-2017.pdf
United Way of Northern Shenandoah Valley (2014). “Mental Health Community Report”.
Retrieved 2016, from
http://www.unitedwaynsv.org/sites/unitedwayshenandoah.oneeach.org/files/pictures/Mental
_Health_Community_Report_FINAL_Updated3_04_14.pdf
U.S. Bureau of Labor Statistics. (2014). Unemployment Rates. Retrieved 2016, from
http://www.bls.gov/
U.S. Census Bureau. (2014). Demographic Data: ACS 2015 5-Year Estimates. Retrieved 2016,
from http://www.census.gov/
U.S. Census Bureau. (2014). Demographic Data: 2013 Population by Age & Sex. Retrieved
2016, from
http://factfinder.census.gov/faces/tableservices/jsf/pages/productview.xhtml?src=bkmk
U.S. Centers for Disease Control and Prevention. (2013). Behavioral Risk Factor Surveillance
System. Retrieved 2013, from http://www.cdc.gov/brfss/
U.S. Center for Disease Control and Prevention’s National Program of Cancer Registries Cancer
Surveillance System. (2008-2012). State Cancer Profiles: Incidence Rates Report Retrieved
2016, from http://statecancerprofiles.cancer.gov/incidencerates/index.php.
U.S. Centers for Disease Control, (2014). “West Virginia Birth Rates”. Retrieved 2016, from

A-105
Winchester Medical Center
Community Health Needs Assessment
http://www.cdc.gov/nchs/pressroom/states/WV_2014.pdf
U.S. Census Bureau. (2014). Demographic Data: Quick Facts-West Virginia. Retrieved 2016,
from http://www.census.gov/quickfacts/table/PST045215/54
U.S. Census Bureau. (2014). Demographic Data: Quick Facts-Virginia. Retrieved 2016, from
http://www.census.gov/quickfacts/table/PST045215/51
U.S. Health Resources and Services Administration. (2016). Shortage Areas. Retrieved 2016,
from https://datawarehouse.hrsa.gov/tools/analyzers/hpsafind.aspx.
University of Wisconsin Population Health Institute and Robert Wood Johnson Foundation.
(2016). County Health Rankings: Mobilizing Action Toward Community Health. Retrieved
2016, from http://www.countyhealthrankings.org/
Valley Health System. (2015). Emergency Department Data.
Valley Health System. (2015). Inpatient Discharge Data.
Virginia Department of Health (2014). Reportable Disease Surveillance Data. Retrieved 2016,
from
http://www.vdh.virginia.gov/Epidemiology/Surveillance/SurveillanceData/AnnualReports/in
dex.htm
Virginia Department of Health. (2014). Virginia Health Statistics Annual Report. Retrieved
2016, from http://www.vdh.state.va.us/HealthStats/stats.htm
Vogt Slanter Insights. West Virginia Statewide Housing Needs Assessment, April 2014.
Retrieved 2016, from
https://www.wvhdf.com/sites/default/files/Documents/2015HousingNeedsStudy.pdf.
Warren Coalition. (2014-2015). Warren County Student Pride Survey Results. Retrieved 2016.
West Virginia Department of Health and Human Resources. (2012) West Virginia Cancer
Registry 2012 Annual Report. Retrieved 2016, from
http://www.dhhr.wv.gov/oeps/cancer/Documents/WVCR%202012%20Annual%20Report_1
_8_2013.pdf.
West Virginia Department of Health and Human Resources Bureau for Public Health. STD MIS.
Retrieved 2016, from
http://www.dhhr.wv.gov/oeps/std-hiv-hep/stds_stis/Documents/STD%20By%20County.pdf
West Virginia Department of Health and Human Resources Bureau for Public Health.
Distribution of Chlamydia Cases by Public Health Districts West Virginia, 2011-2015.
Retrieved 2016, from http://www.dhhr.wv.gov/oeps/std-hiv-
hep/stds_stis/Pages/STDSurveillance.aspx.

A-106
Winchester Medical Center
Community Health Needs Assessment
West Virginia Department of Health and Human Resources Bureau for Public Health. West
Virginia TB profile Annual Report 2014. Retrieved 2016, from
http://www.dhhr.wv.gov/oeps/tuberculosis/Documents/TB%20Profile%202014%20APPRO
VED%20FINAL%20REV%2005192015.pdf
West Virginia Department of Health and Human Resources Bureau for Public Health. West
Virginia Vectorborne Disease Surveillance Report, January 1-November 9, 2015.
Retrieved 2016, from
http://www.dhhr.wv.gov/oeps/disease/Zoonosis/Mosquito/documents/arbovirus/vectorborne
-disease-report.pdf#page=3.
West Virginia Department of Health and Human Resources. (2013). 2013 West Virginia Vital
Statistics. Retrieved 2016, from
http://www.wvdhhr.org/bph/hsc/pubs/vital/2013/2013Vital.pdf.
Winchester Department of Social Services. (2015). Winchester Department of Social Services
FY 2013 Annual Report. Retrieved 2016, from
http://www.winchesterva.gov/sites/default/files/documents/social-
services/fy15_dss_annual_report-web.pdf.