Embed Size (px)
Citation preview
1
Finnair Q4 and FY 2017 result
16.2.2018Pekka Vauramo
2017 – A year of strong growth
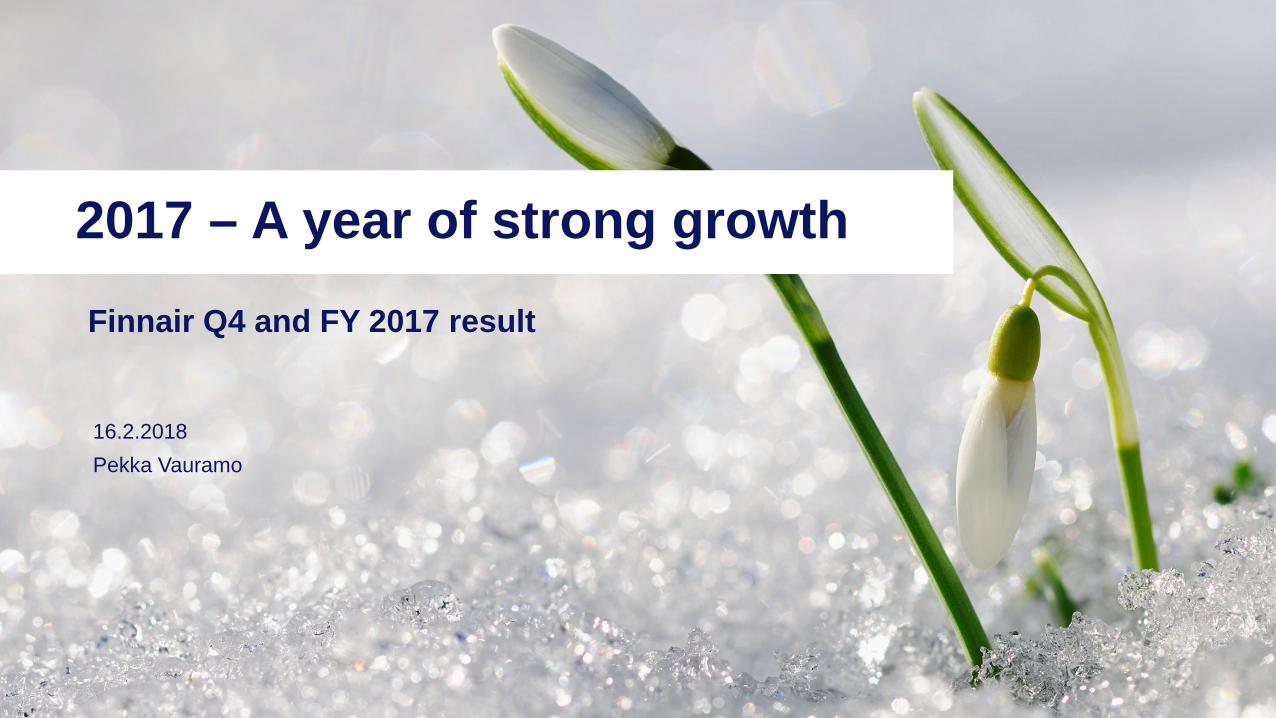
• Comparable operating result at record level, 22.9 million euro (Q4 2016: 1.6)
• Fastest growth in Finnair history, ASK +17%• Four new long-haul routes opened• Added capacity to Lapland • Passenger revenue +12%, ancillary sales
+17%• Almost 3 million passengers, up +14%• Cargo revenue up +24%• Travel services revenue up +14%,
Aurinkomatkat Suntours is the market leader
2
A record Q4 concluded a strong year 2017
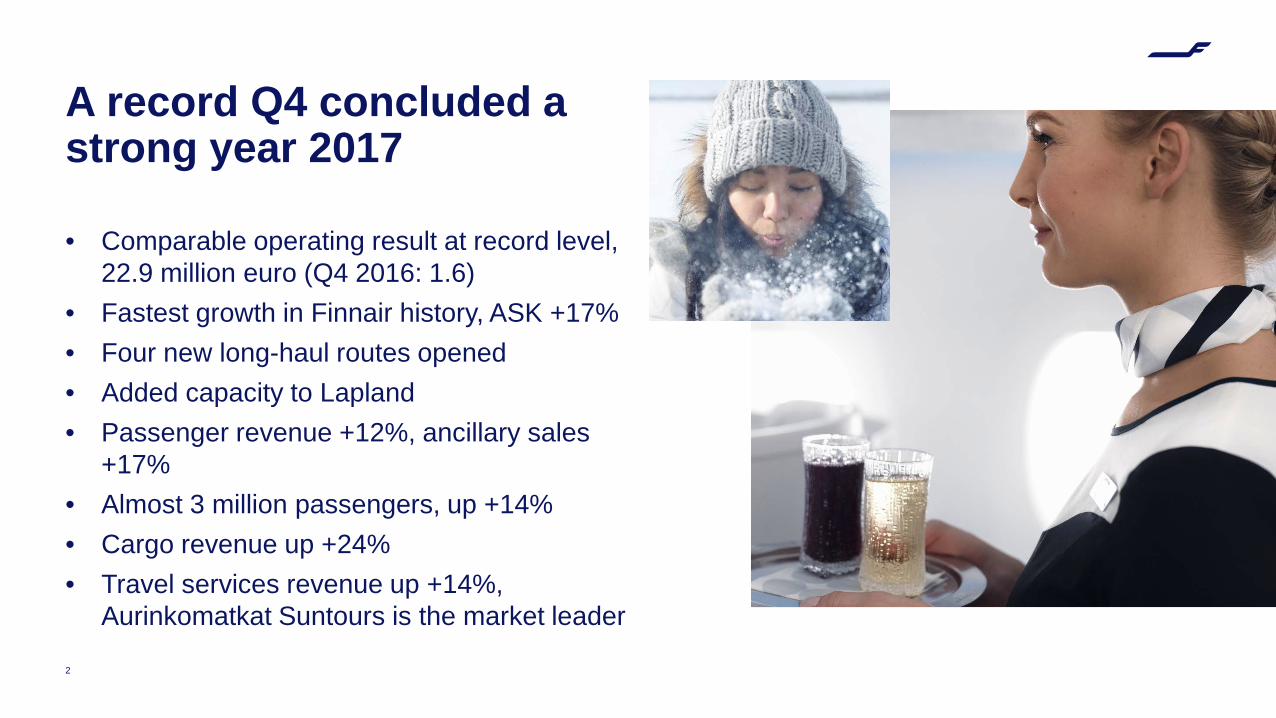
• Demand for flights between Asia and Europe increased across the Finnair network to almost every destination. Strong demand from Japan.
• Lapland was again the #1 destination for Finnair’s Chinese customers in the winter season.
• The air cargo market continued to grow, and cargo load factors and yields increased.
• Severe winter and wind condictions and overtime ban by IAU affected Finnair traffic in December.
• Industry consolidation continues in Europe.
3
Favourable market environment– also challenges towards the year end
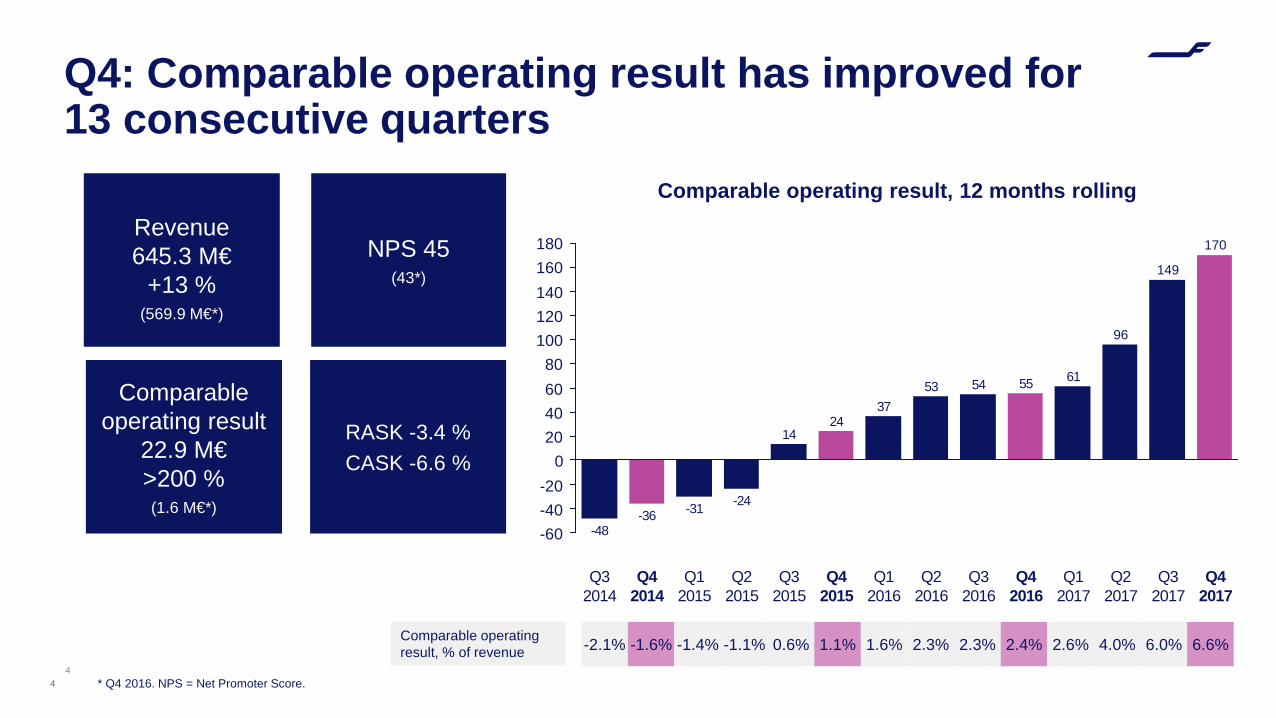
Q4: Comparable operating result has improved for 13 consecutive quarters
Comparable operating result, 12 months rolling
4
100
180
0
140
60
20
-60-40
80
-20
40
120
160
-48-36
Q3 2015
55
24
61
Q4 2016
Q1 2016
Q3 2017
149
Q2 2017
96
Q1 2017
53
Q3 2014
170
Q4 2017
Q3 2016
Q4 2014
54
Q4 2015
Q2 2015
14
-24
Q1 2015
-31
Q2 2016
37
4
Revenue645.3 M€
+13 %(569.9 M€*)
Comparable operating result
22.9 M€>200 %(1.6 M€*)
RASK -3.4 %CASK -6.6 %
NPS 45 (43*)
* Q4 2016. NPS = Net Promoter Score.
Comparable operating result, % of revenue -2.1% -1.6% -1.4% -1.1% 0.6% 1.1% 1.6% 2.3% 2.3% 2.4% 2.6% 4.0% 6.0% 6.6%
Revenue, M€
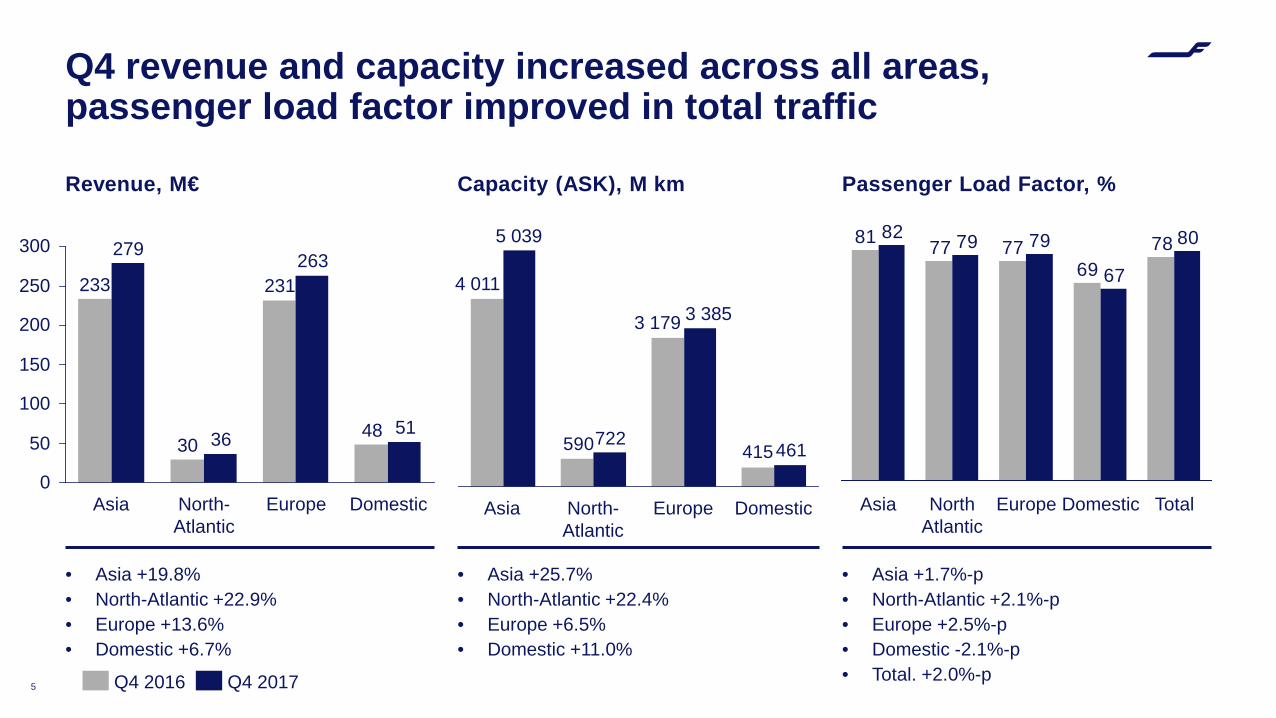
• Asia +19.8%• North-Atlantic +22.9%• Europe +13.6%• Domestic +6.7%
Passenger Load Factor, %
5
• Asia +1.7%-p• North-Atlantic +2.1%-p• Europe +2.5%-p• Domestic -2.1%-p• Total. +2.0%-p
Capacity (ASK), M km
• Asia +25.7%• North-Atlantic +22.4%• Europe +6.5%• Domestic +11.0%
415590 461722
Europe
3 3853 179
DomesticNorth-Atlantic
5 039
4 011
Asia
7869
777781 80
67
797982
Europe Domestic TotalNorth Atlantic
Asia
250
200
150
0
300
100
50 36
263
North-Atlantic
Asia
233 231
30
279
Europe Domestic
5148
Q4 2017Q4 2016
Q4 revenue and capacity increased across all areas, passenger load factor improved in total traffic
12
-36
24
55
170
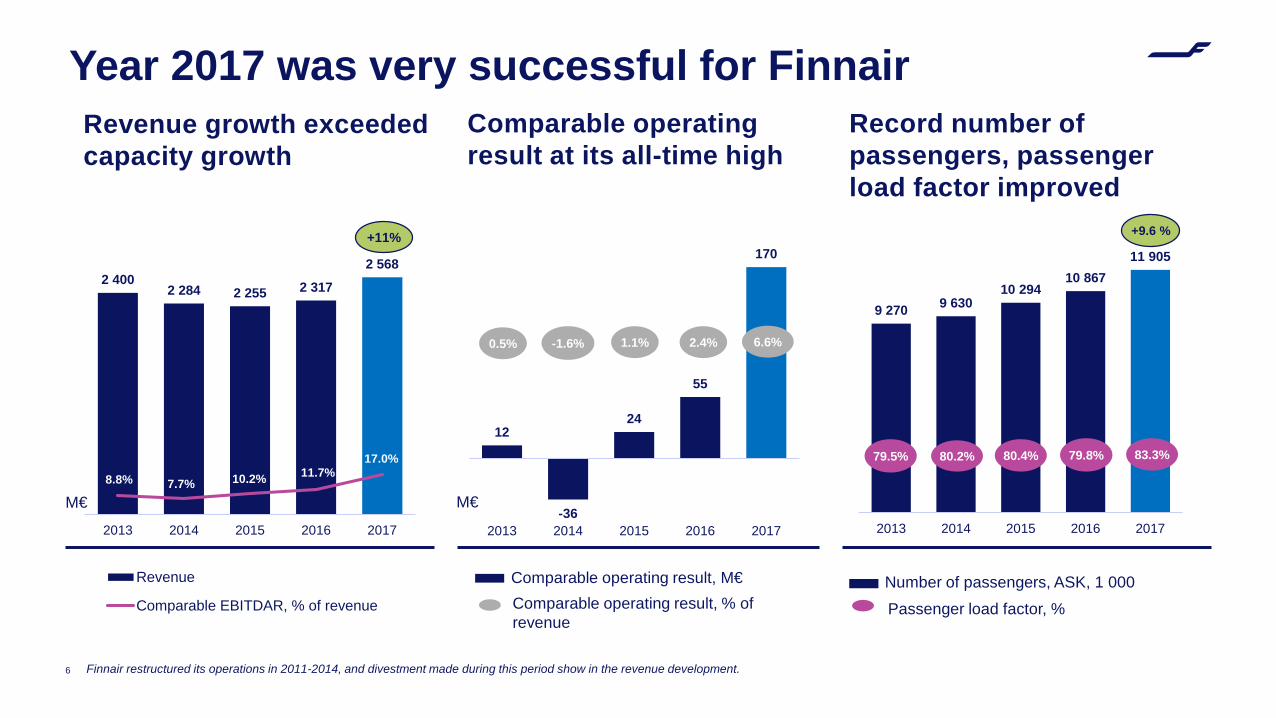
2013 2014 2015 2016 2017
Revenue growth exceeded capacity growth
Record number of passengers, passenger load factor improved
6
Year 2017 was very successful for Finnair
2 4002 284 2 255 2 317
2 568
8.8% 7.7% 10.2% 11.7%17.0%
2013 2014 2015 2016 2017
Revenue
Comparable EBITDAR, % of revenue
9 270 9 63010 294
10 86711 905
2013 2014 2015 2016 2017
Comparable operating result at its all-time high
1.1% 2.4%-1.6%0.5%
Comparable operating result, % of revenue
Finnair restructured its operations in 2011-2014, and divestment made during this period show in the revenue development.
79.8%
Passenger load factor, %
83.3%
6.6%
79.5% 80.2% 80.4%
M€ M€
+11%
Comparable operating result, M€ Number of passengers, ASK, 1 000
+9.6 %
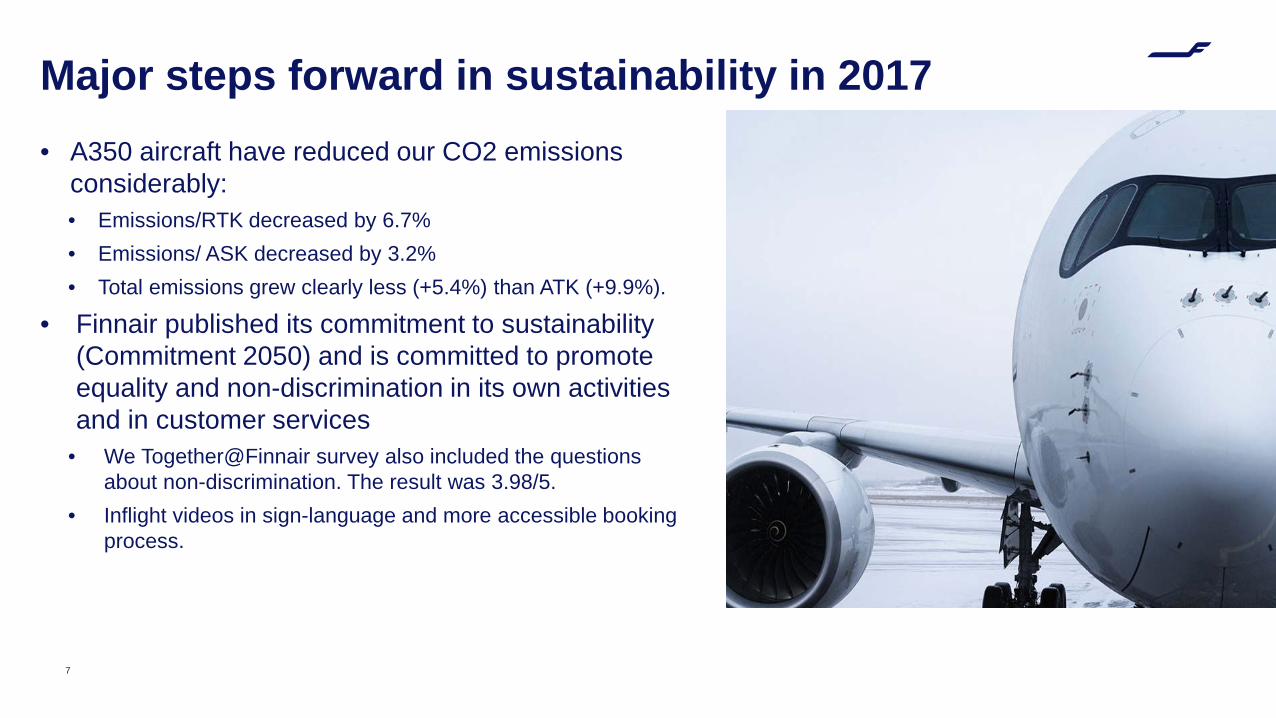
Major steps forward in sustainability in 2017• A350 aircraft have reduced our CO2 emissions
considerably: • Emissions/RTK decreased by 6.7% • Emissions/ ASK decreased by 3.2%• Total emissions grew clearly less (+5.4%) than ATK (+9.9%).
• Finnair published its commitment to sustainability (Commitment 2050) and is committed to promote equality and non-discrimination in its own activities and in customer services
• We Together@Finnair survey also included the questions about non-discrimination. The result was 3.98/5.
• Inflight videos in sign-language and more accessible booking process.
7
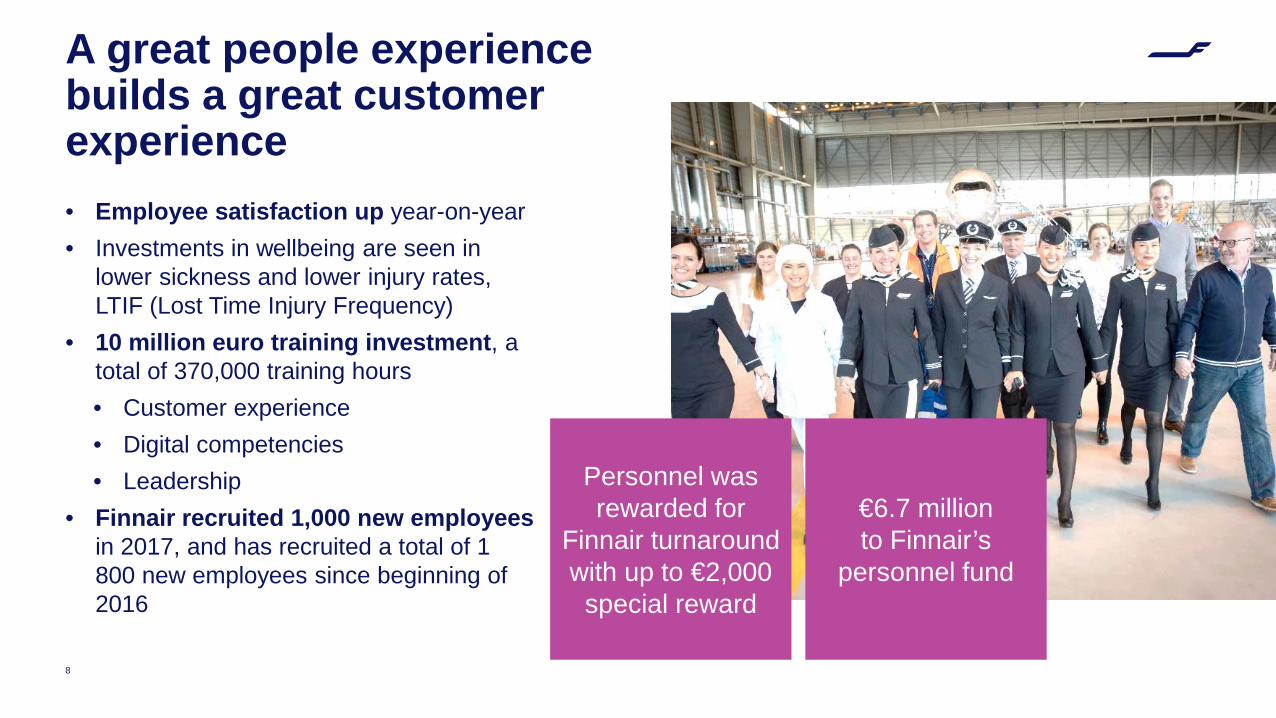
A great people experience builds a great customer experience
8
• Employee satisfaction up year-on-year• Investments in wellbeing are seen in
lower sickness and lower injury rates, LTIF (Lost Time Injury Frequency)
• 10 million euro training investment, a total of 370,000 training hours• Customer experience• Digital competencies• Leadership
• Finnair recruited 1,000 new employees in 2017, and has recruited a total of 1 800 new employees since beginning of 2016
Personnel was rewarded for
Finnair turnaround with up to €2,000
special reward
€6.7 million to Finnair’s
personnel fund
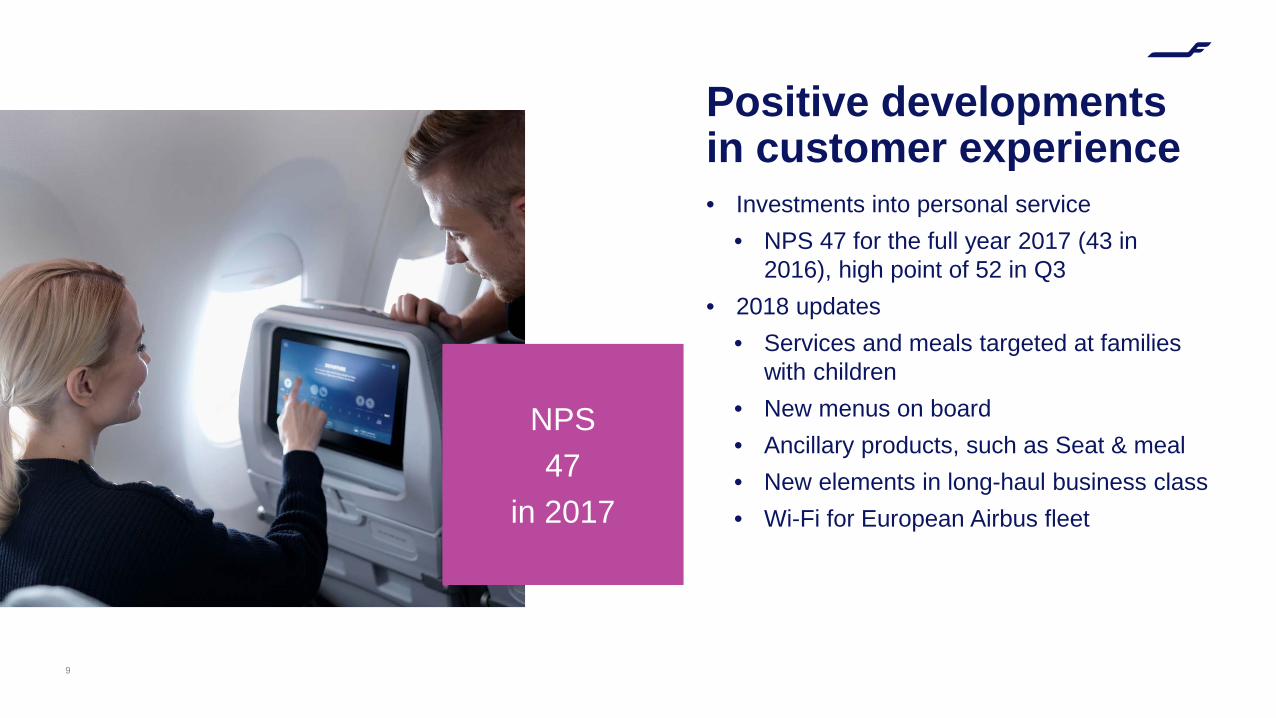
Positive developments in customer experience • Investments into personal service
• NPS 47 for the full year 2017 (43 in 2016), high point of 52 in Q3
• 2018 updates• Services and meals targeted at families
with children• New menus on board• Ancillary products, such as Seat & meal• New elements in long-haul business class• Wi-Fi for European Airbus fleet
9
NPS 47
in 2017
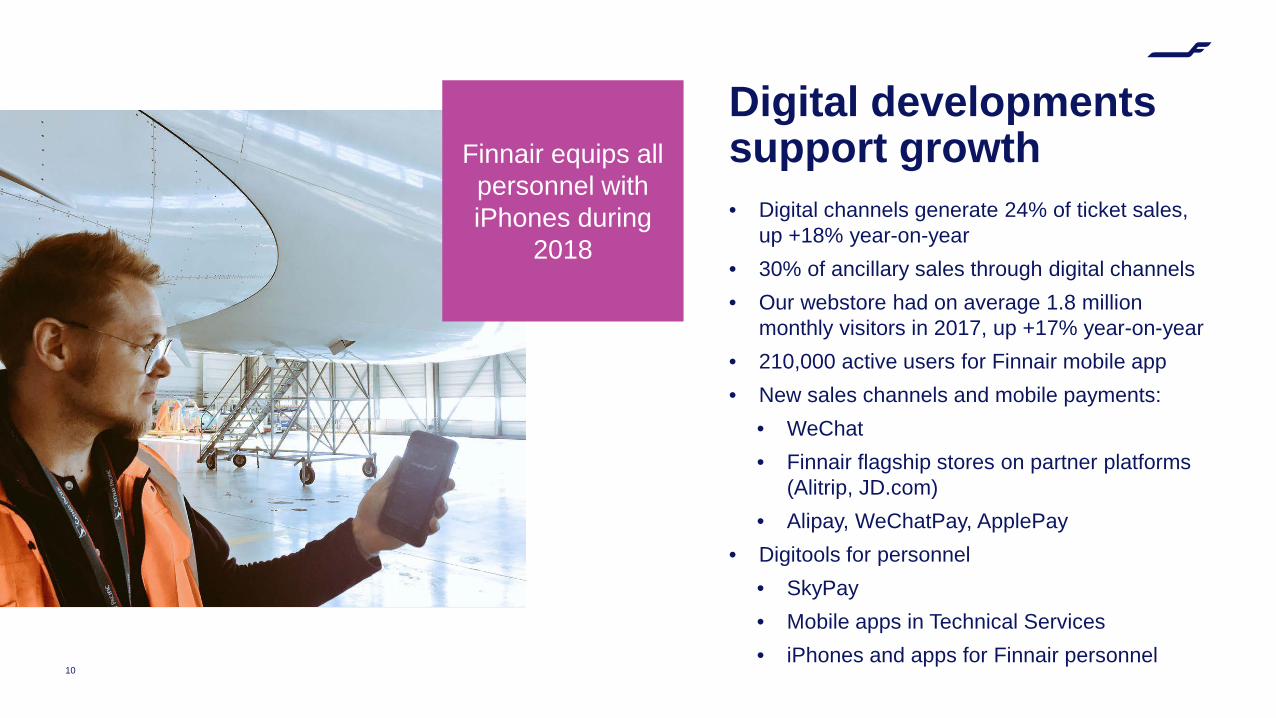
Digital developments support growth• Digital channels generate 24% of ticket sales,
up +18% year-on-year• 30% of ancillary sales through digital channels• Our webstore had on average 1.8 million
monthly visitors in 2017, up +17% year-on-year• 210,000 active users for Finnair mobile app• New sales channels and mobile payments:
• WeChat• Finnair flagship stores on partner platforms
(Alitrip, JD.com)• Alipay, WeChatPay, ApplePay
• Digitools for personnel • SkyPay• Mobile apps in Technical Services• iPhones and apps for Finnair personnel
10
Finnair equips all personnel with iPhones during
2018
11
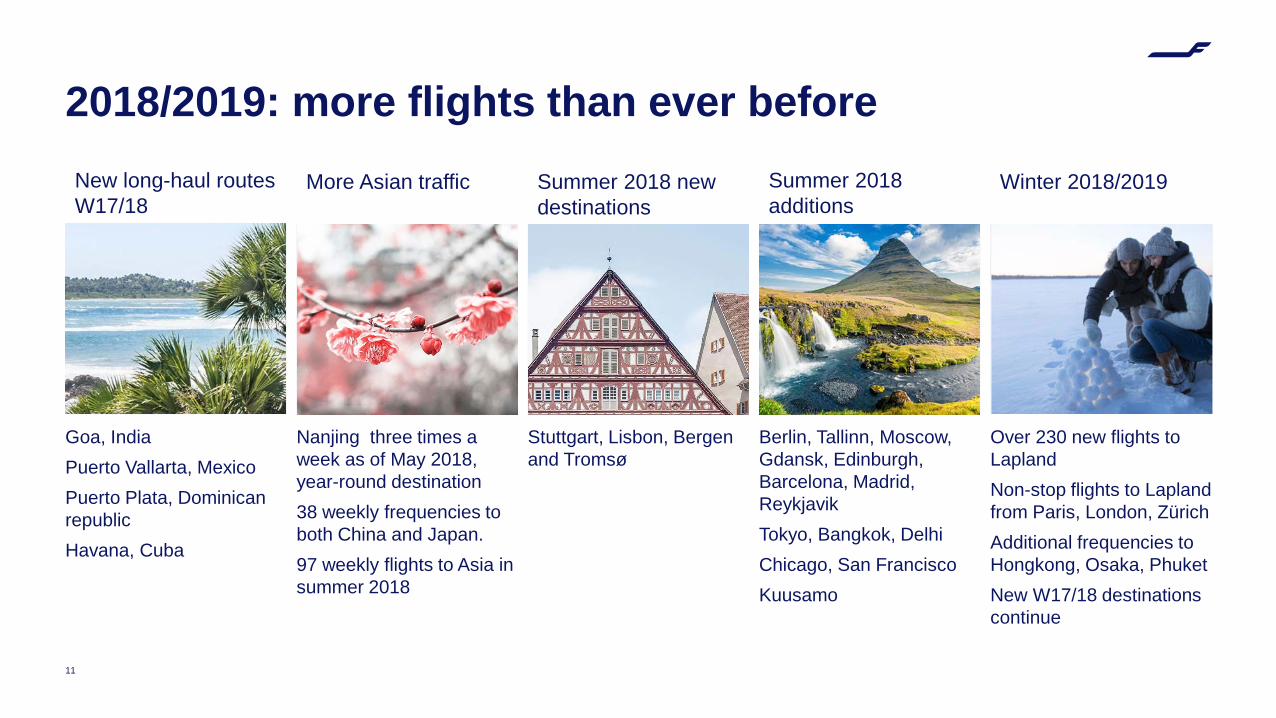
Goa, IndiaPuerto Vallarta, Mexico Puerto Plata, Dominican republicHavana, Cuba
2018/2019: more flights than ever before
Nanjing three times a week as of May 2018, year-round destination38 weekly frequencies to both China and Japan. 97 weekly flights to Asia in summer 2018
Stuttgart, Lisbon, Bergen and Tromsø
Berlin, Tallinn, Moscow, Gdansk, Edinburgh, Barcelona, Madrid, ReykjavikTokyo, Bangkok, DelhiChicago, San FranciscoKuusamo
Over 230 new flights to LaplandNon-stop flights to Lapland from Paris, London, ZürichAdditional frequencies to Hongkong, Osaka, PhuketNew W17/18 destinations continue
New long-haul routes W17/18
More Asian traffic Summer 2018 additions
Winter 2018/2019Summer 2018 new destinations
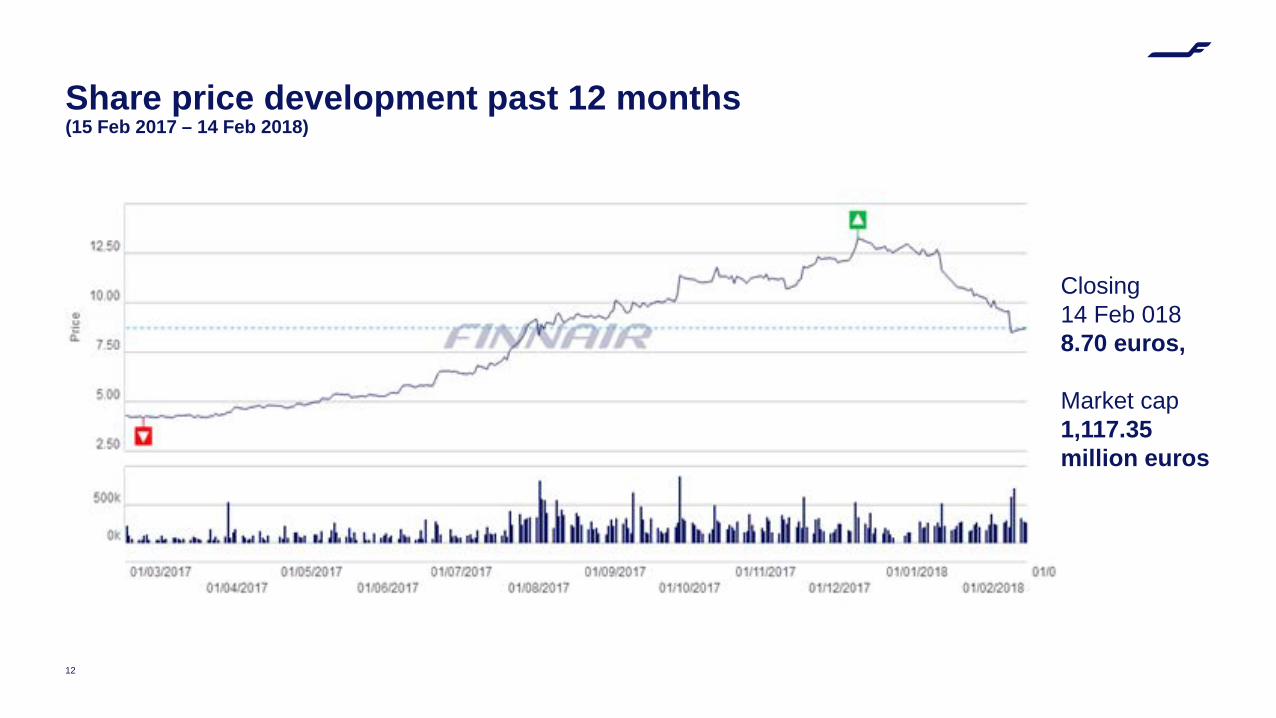
Share price development past 12 months(15 Feb 2017 – 14 Feb 2018)
12
Closing 14 Feb 0188.70 euros,
Market cap 1,117.35million euros
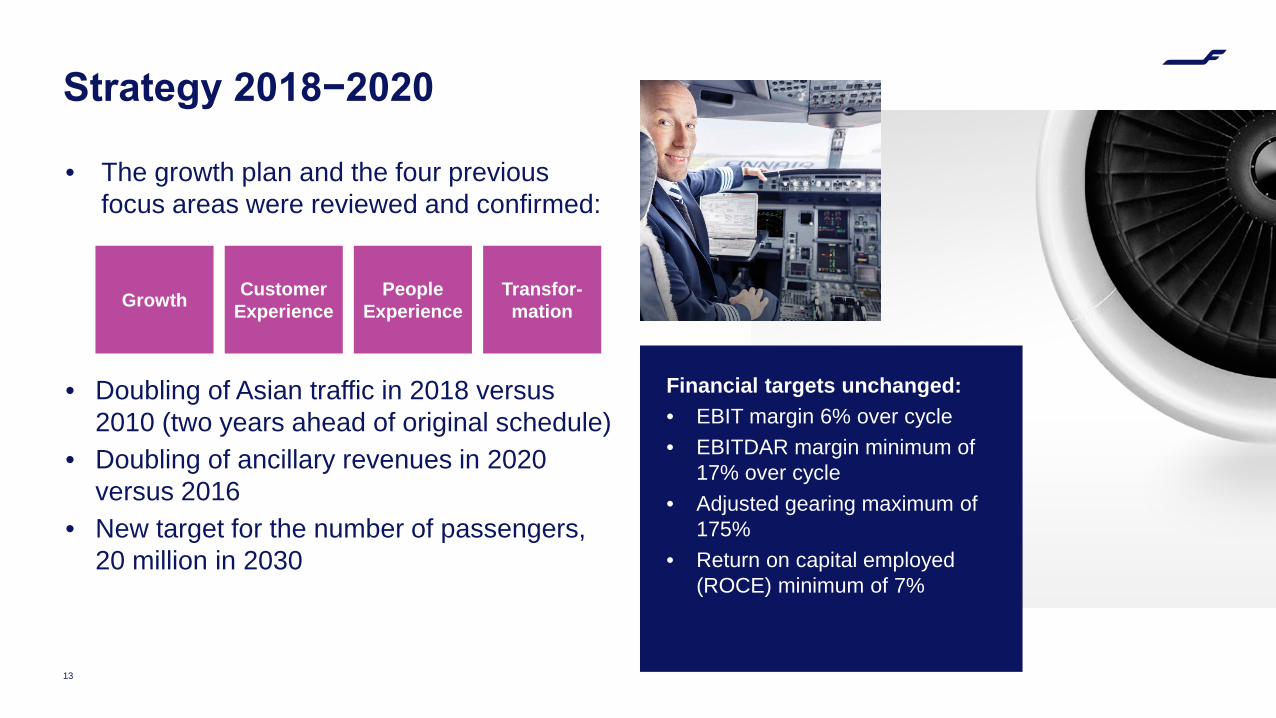
Strategy 2018−2020
• The growth plan and the four previous focus areas were reviewed and confirmed:
• Doubling of Asian traffic in 2018 versus 2010 (two years ahead of original schedule)
• Doubling of ancillary revenues in 2020 versus 2016
• New target for the number of passengers, 20 million in 2030
13
Financial targets unchanged: • EBIT margin 6% over cycle • EBITDAR margin minimum of
17% over cycle• Adjusted gearing maximum of
175% • Return on capital employed
(ROCE) minimum of 7%
Growth Customer Experience
People Experience
Transfor-mation
Dividend proposal• The Board of Directors proposes to the Annual
general Meeting that a dividend of 0.30 euros per share be distributed for 2017.
• EPS 1.23 euros in 2017 (0.55).
• Annual General Meeting 2018 will be held in Helsinki on 20 March 2018.
14
• Global airline traffic is expected to grow strongly in 2018. Finnair expects increased competition as existing and new operators increase capacity, particularly on routes linking Europe with Asia and with North America.
• Finnair plans on increasing its capacity by more than 15 per cent in 2018, with most of this growth coming in the first half of the year. Passenger volume is expected to grow broadly in line with capacity while revenue growth is expected to be slightly lower.
• In line with its disclosure policy, Finnair will issue guidance on its full year comparable operating result as part of its half-year report in July.
15
Outlook
16
FinanceCFO Pekka Vähähyyppä
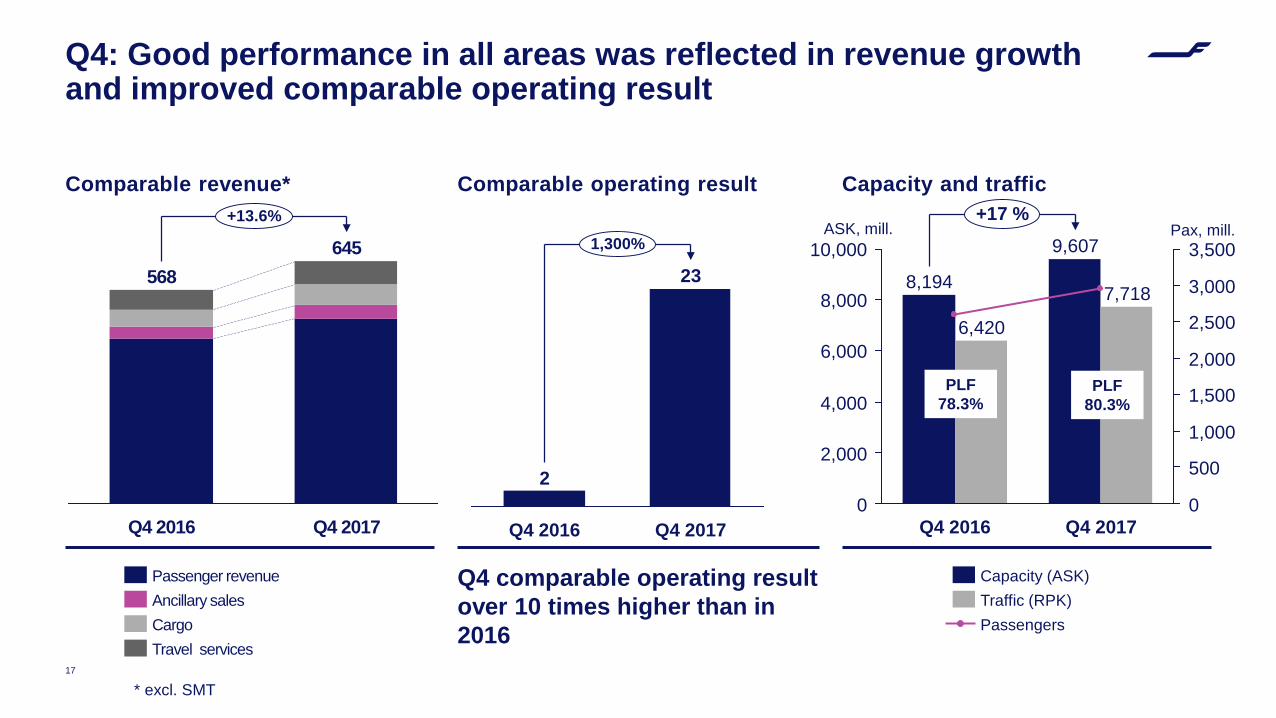
Comparable revenue*
Q4 comparable operating result over 10 times higher than in 2016
Capacity and traffic
17
Q4: Good performance in all areas was reflected in revenue growth and improved comparable operating result
Comparable operating result
568
Q4 2016
+13.6%
Q4 2017
645
Travel servicesCargoAncillary salesPassenger revenue
8,000
6,000
4,000
0
3,000
2,000
2,000
2,500
1,500
10,000 3,500
1,000
500
0
+17 %
Q4 2017
7,718
9,607
Q4 2016
8,194
6,420
Passengers
Capacity (ASK)Traffic (RPK)
Pax, mill.ASK, mill.
PLF 78.3%
PLF 80.3%
* excl. SMT
Q4 2016 Q4 2017
2
1,300%
23
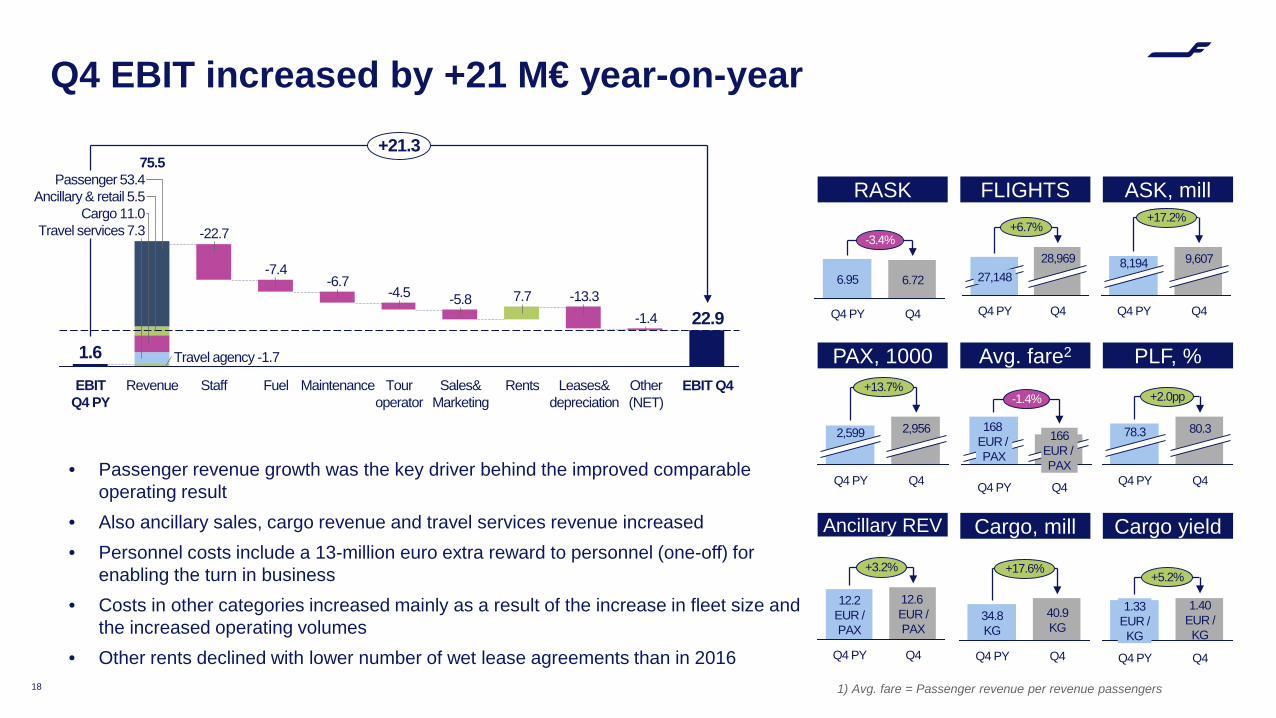
Q4 EBIT increased by +21 M€ year-on-year
• Passenger revenue growth was the key driver behind the improved comparable operating result
• Also ancillary sales, cargo revenue and travel services revenue increased• Personnel costs include a 13-million euro extra reward to personnel (one-off) for
enabling the turn in business• Costs in other categories increased mainly as a result of the increase in fleet size and
the increased operating volumes• Other rents declined with lower number of wet lease agreements than in 2016
18
-22.7
Revenue
Travel services 7.3
Ancillary & retail 5.5Passenger 53.4
EBIT Q4 PY
EBIT Q4
7.7
Tour operator
Other (NET)
-4.5-6.7
Travel agency -1.7
Staff Fuel
Cargo 11.0
Rents
-7.4
75.5
22.9
Leases&depreciation
Sales&Marketing
+21.3
-1.4-13.3-5.8
Maintenance
1.6
27,148
+6.7%
Q4Q4 PY
28,969 9,607
Q4 PY
+17.2%
8,194
Q4
2,599
+13.7%
Q4
2,956
Q4 PY
RASK
168EUR / PAX
Q4
166EUR / PAX
Q4 PY
-1.4%
Q4
+2.0pp
Q4 PY
78.3 80.3
-3.4%
6.95 6.72
Q4Q4 PY
Q4
40.9KG
+17.6%
34.8KG
Q4 PY Q4
1.40EUR /KG
Q4 PY
+5.2%
1.33EUR /KG
FLIGHTS ASK, mill
PAX, 1000 Avg. fare2 PLF, %
Ancillary REV Cargo, mill Cargo yield
12.6EUR /PAX
+3.2%
Q4Q4 PY
12.2EUR /PAX
1) Avg. fare = Passenger revenue per revenue passengers
19
Adjusted net debt
-1.600
-400
-1.800
-1.400
-600
-200
-1.200
-800
0
-1.000
Adjusted net debt
Adjusted interest-bearing liabilities
-710
-956
-737
7x aircraft leases + currency hedges Cash
983
1) HFS = Held-for-Sale, 2) I-B = Interest-bearing
348412
750
591
1,016
2,529
2,8872,825
718
92520100
656
30 Sep 2017
31 Dec 2017
385
719
11
31 Dec 2017
31 Dec 2016
857
86
981
30 Sep 2017
983
162
977
2,529
130
797
139
2,887
1,271
17
450
2,825
1,261
424
31 Dec 2016
167
1,049
413
I-B debt2Liabilities HFS1 Equity
ProvisionsOther liabilitiesTickets
FleetOther fixed assets
Assets HFS1
CashOther assets
Increase in fleet size and improved result strengthened the balance sheet
20
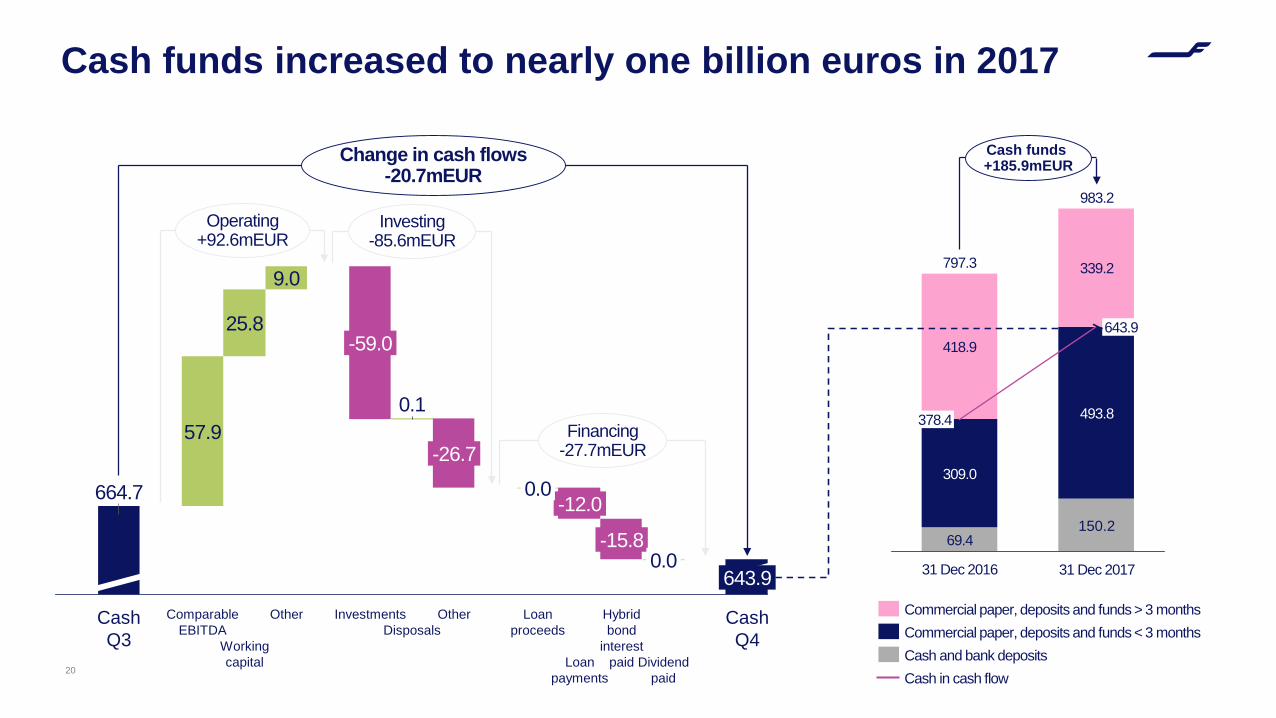
664.7
Working capital
Loan proceeds
-15.8
25.8-59.0
Change in cash flows-20.7mEUR
643.9
Dividend paid
-12.0
0.0
Hybrid bond
interest paid
Investing-85.6mEUR
Financing-27.7mEUR
Operating+92.6mEUR
Cash Q4
OtherOtherComparableEBITDA
0.157.9
Loan payments
0.0
DisposalsInvestments
9.0
Cash Q3
-26.7
Cash funds increased to nearly one billion euros in 2017
31 Dec 2016
797.3
309.0
983.2
493.8
Cash funds+185.9mEUR
31 Dec 2017
339.2
378.4
69.4
418.9643.9
150.2
Cash in cash flow
Commercial paper, deposits and funds > 3 monthsCommercial paper, deposits and funds < 3 monthsCash and bank deposits
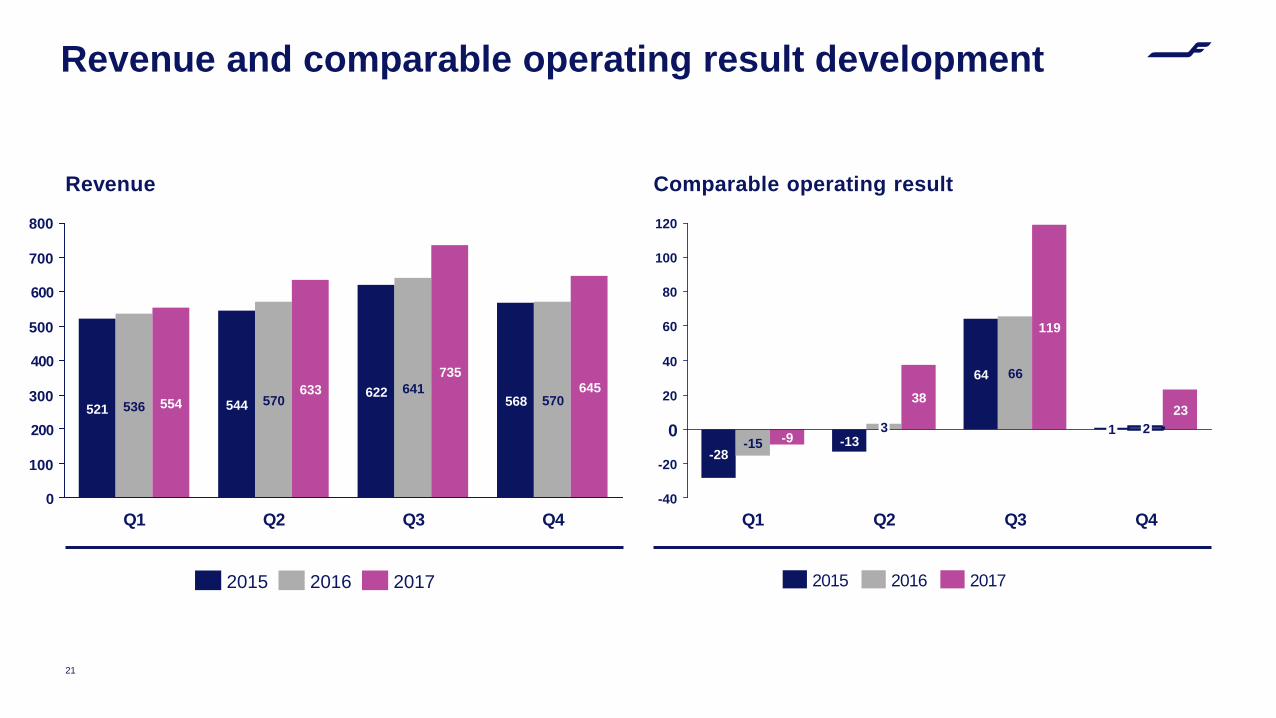
Revenue Comparable operating result
21
Revenue and comparable operating result development
0
100
700
800
500
400
300
600
200
735641
Q2
633554 570
Q1
536
Q4
645570
Q3
521 544622 568
201720162015
40
100
0
60
-20
120
20
-40
80
Q1
-9-151
Q3 Q4
2
119
6664
Q2
38
3-13
-28
23
2015 20172016
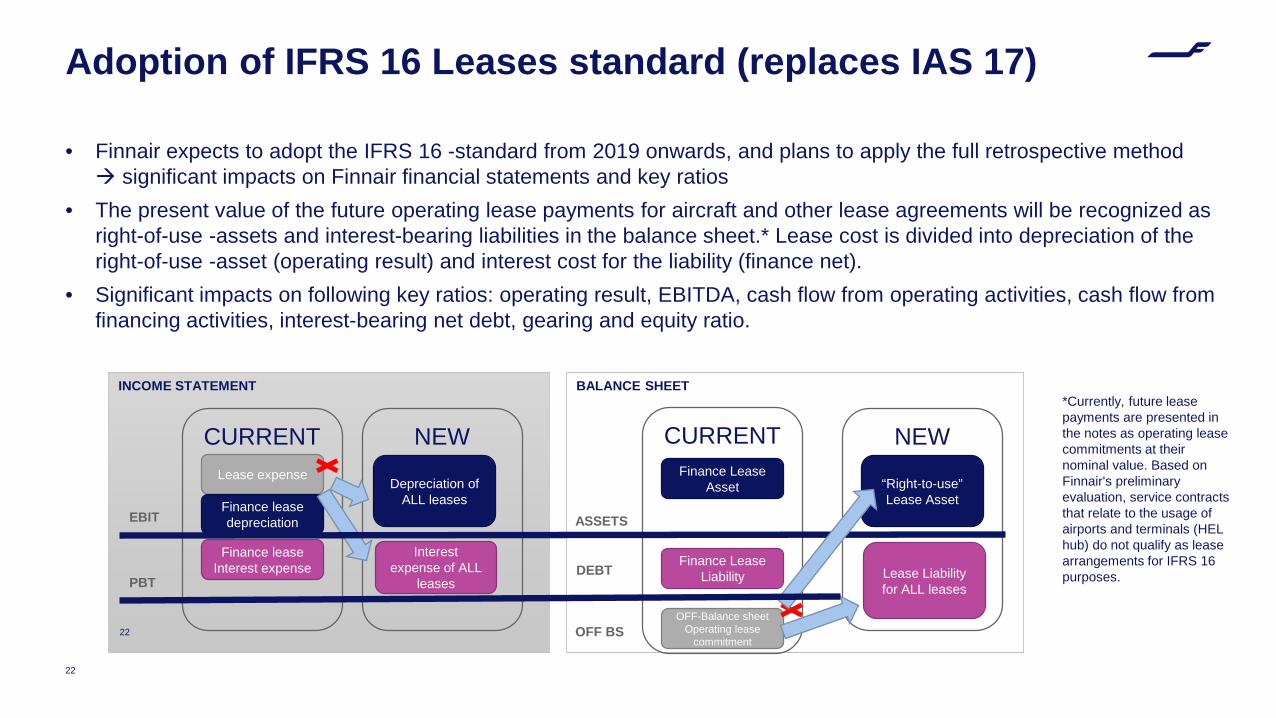
Adoption of IFRS 16 Leases standard (replaces IAS 17)
22
• Finnair expects to adopt the IFRS 16 -standard from 2019 onwards, and plans to apply the full retrospective method significant impacts on Finnair financial statements and key ratios
• The present value of the future operating lease payments for aircraft and other lease agreements will be recognized as right-of-use -assets and interest-bearing liabilities in the balance sheet.* Lease cost is divided into depreciation of the right-of-use -asset (operating result) and interest cost for the liability (finance net).
• Significant impacts on following key ratios: operating result, EBITDA, cash flow from operating activities, cash flow from financing activities, interest-bearing net debt, gearing and equity ratio.
INCOME STATEMENT
22
Lease expense Depreciation of ALL leases
Interest expense of ALL
leases
EBIT
PBT
CURRENT NEW
Finance lease depreciation
Finance lease Interest expense
BALANCE SHEET
CURRENT NEWFinance Lease
Asset
Finance Lease Liability
OFF-Balance sheet Operating lease
commitment
“Right-to-use” Lease Asset
Lease Liability for ALL leases
ASSETS
DEBT
OFF BS
*Currently, future lease payments are presented in the notes as operating lease commitments at their nominal value. Based on Finnair's preliminary evaluation, service contracts that relate to the usage of airports and terminals (HEL hub) do not qualify as lease arrangements for IFRS 16 purposes.
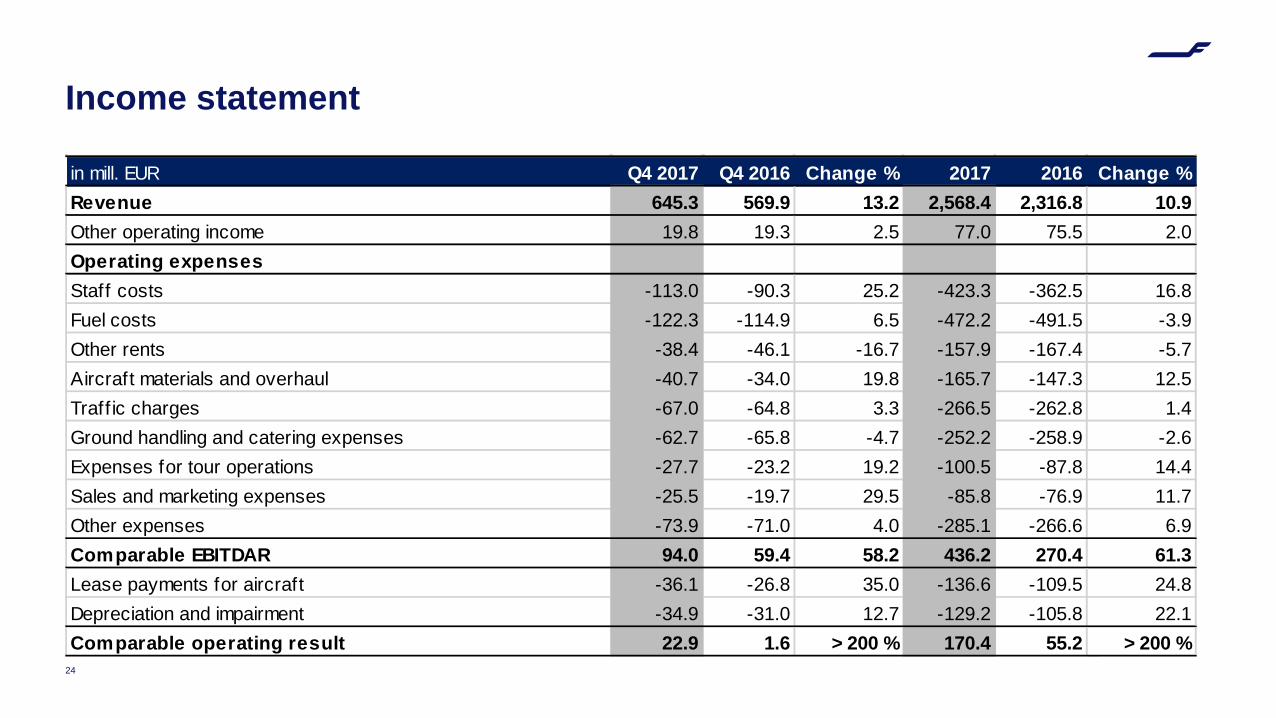
Income statement
24
in mill. EUR Q4 2017 Q4 2016 Change % 2017 2016 Change %Revenue 645.3 569.9 13.2 2,568.4 2,316.8 10.9Other operating income 19.8 19.3 2.5 77.0 75.5 2.0Operating expensesStaff costs -113.0 -90.3 25.2 -423.3 -362.5 16.8Fuel costs -122.3 -114.9 6.5 -472.2 -491.5 -3.9Other rents -38.4 -46.1 -16.7 -157.9 -167.4 -5.7Aircraft materials and overhaul -40.7 -34.0 19.8 -165.7 -147.3 12.5Traff ic charges -67.0 -64.8 3.3 -266.5 -262.8 1.4Ground handling and catering expenses -62.7 -65.8 -4.7 -252.2 -258.9 -2.6Expenses for tour operations -27.7 -23.2 19.2 -100.5 -87.8 14.4Sales and marketing expenses -25.5 -19.7 29.5 -85.8 -76.9 11.7Other expenses -73.9 -71.0 4.0 -285.1 -266.6 6.9Comparable EBITDAR 94.0 59.4 58.2 436.2 270.4 61.3Lease payments for aircraft -36.1 -26.8 35.0 -136.6 -109.5 24.8Depreciation and impairment -34.9 -31.0 12.7 -129.2 -105.8 22.1Comparable operating result 22.9 1.6 > 200 % 170.4 55.2 > 200 %
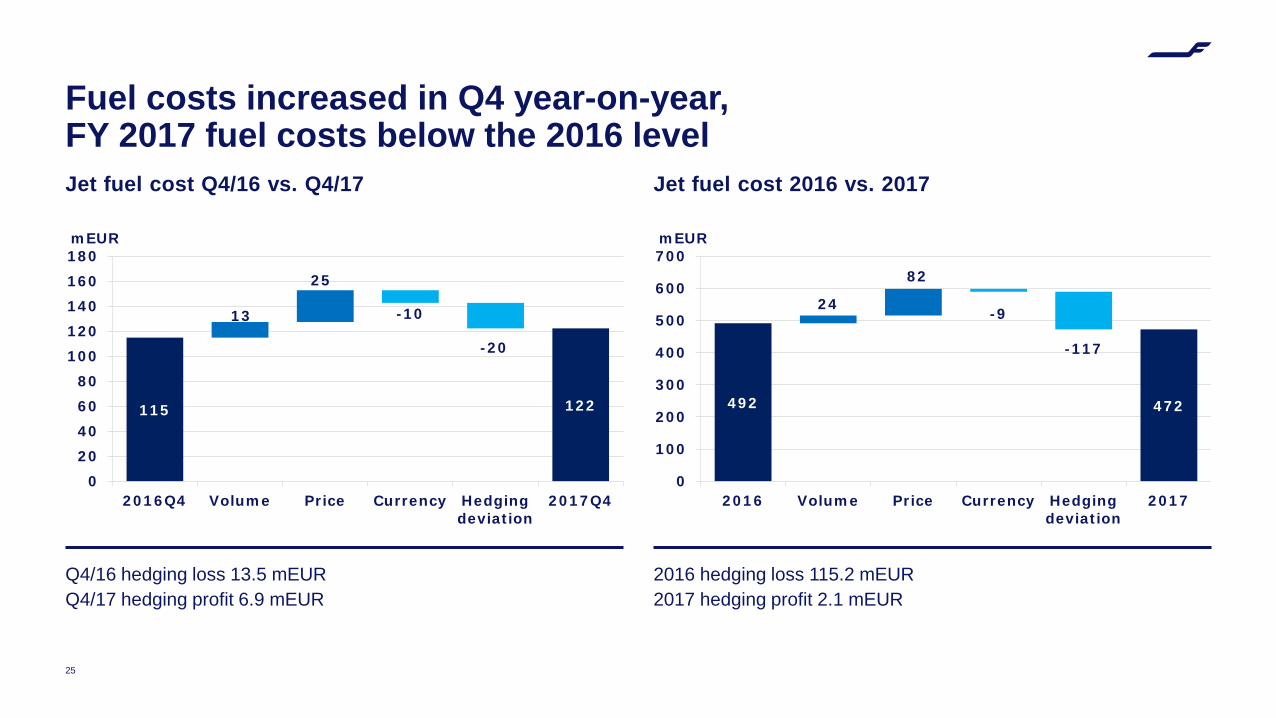
Jet fuel cost Q4/16 vs. Q4/17
Q4/16 hedging loss 13.5 mEURQ4/17 hedging profit 6.9 mEUR
Jet fuel cost 2016 vs. 2017
25
Fuel costs increased in Q4 year-on-year,FY 2017 fuel costs below the 2016 level
2016 hedging loss 115.2 mEUR2017 hedging profit 2.1 mEUR
115 122
13
-20
25
-10
020406080
100120140160180
2016Q4 Volume Price Currency Hedgingdeviation
2017Q4
mEUR
492 472
24
-117
82
-9
0
100
200
300
400
500
600
700
2016 Volume Price Currency Hedgingdeviation
2017
mEUR
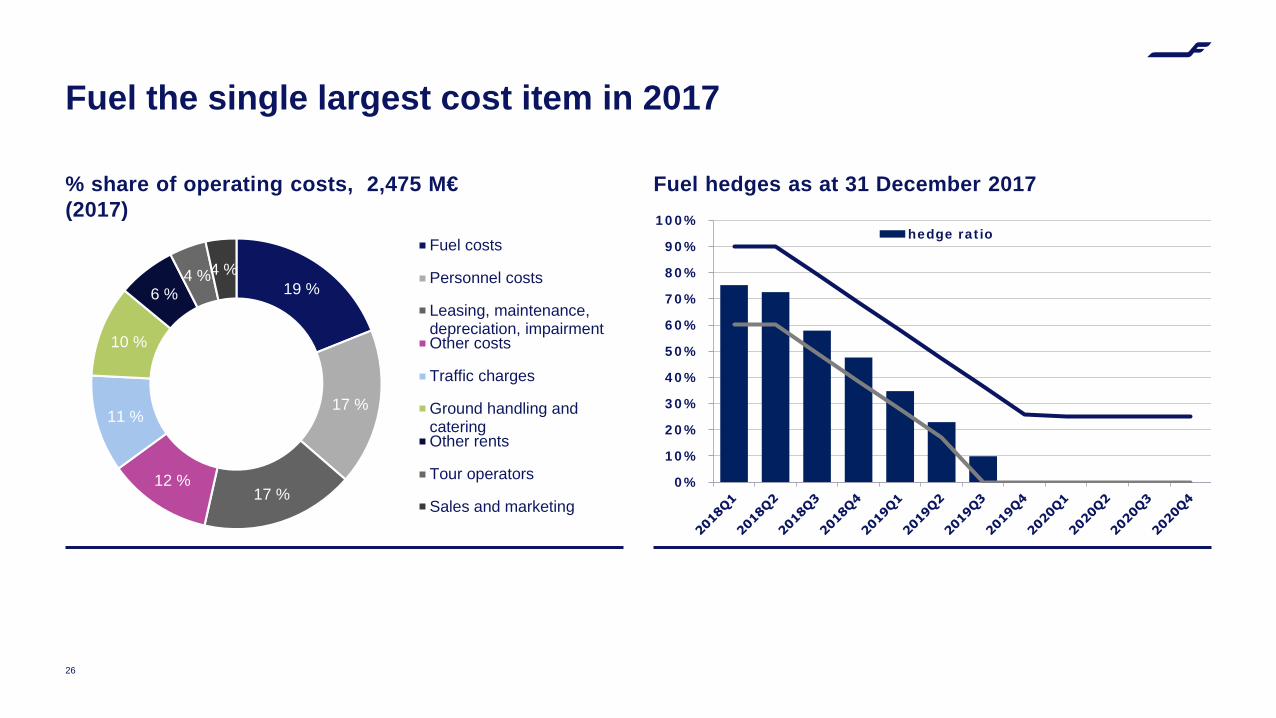
% share of operating costs, 2,475 M€ (2017)
Fuel hedges as at 31 December 2017
26
Fuel the single largest cost item in 2017
19 %
17 %
17 %12 %
11 %
10 %
6 %4 %4 %
Fuel costs
Personnel costs
Leasing, maintenance,depreciation, impairmentOther costs
Traffic charges
Ground handling andcateringOther rents
Tour operators
Sales and marketing0%
10%
20%
30%
40%
50%
60%
70%
80%
90%
100%hedge ratio
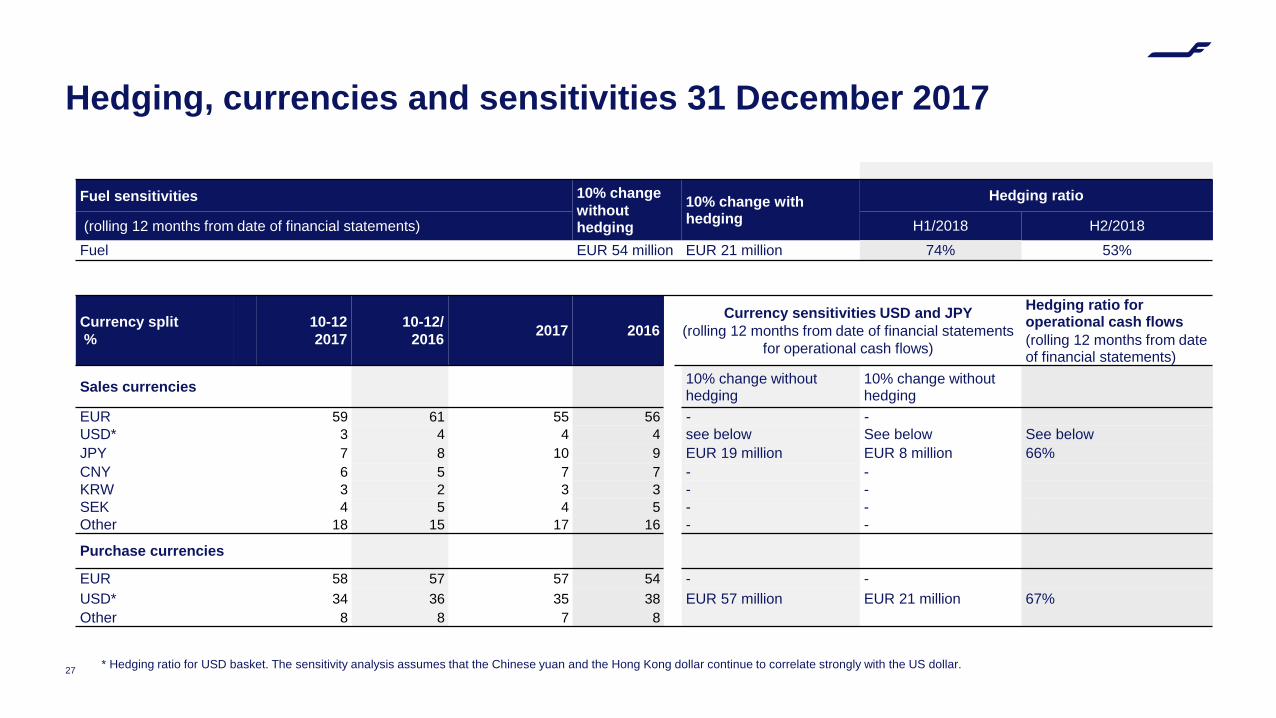
Hedging, currencies and sensitivities 31 December 2017
Fuel sensitivities 10% change without hedging
10% change with hedging
Hedging ratio
(rolling 12 months from date of financial statements) H1/2018 H2/2018Fuel EUR 54 million EUR 21 million 74% 53%
Currency split%
10-122017
10-12/2016 2017 2016
Currency sensitivities USD and JPY(rolling 12 months from date of financial statements
for operational cash flows)
Hedging ratio for operational cash flows(rolling 12 months from date of financial statements)
Sales currencies 10% change without hedging
10% change without hedging
EUR 59 61 55 56 - -USD* 3 4 4 4 see below See below See belowJPY 7 8 10 9 EUR 19 million EUR 8 million 66%CNY 6 5 7 7 - -KRW 3 2 3 3 - -SEK 4 5 4 5 - -Other 18 15 17 16 - -
Purchase currencies
EUR 58 57 57 54 - -USD* 34 36 35 38 EUR 57 million EUR 21 million 67%Other 8 8 7 8
27 * Hedging ratio for USD basket. The sensitivity analysis assumes that the Chinese yuan and the Hong Kong dollar continue to correlate strongly with the US dollar.