Embed Size (px)
Citation preview

METEOROLOGY AND MEASUREMENT DIVISION
2020 AIR MONITORING NETWORK PLAN
July 1, 2021
Michael Flagg
Katherine Hoag
Joe Lapka
Meteorology and Measurement Division
375 Beale St., Suite 600
San Francisco, CA 94105

2
This page intentionally left blank.

3
TABLE OF CONTENTS
Section Page
1. ...... INTRODUCTION ........................................................................................... 11
2. ...... OVERVIEW OF NETWORK OPERATION ............................................................ 11
2.1 ... Network Design .................................................................................... 11
2.2 ... Minimum Monitoring Requirements ....................................................... 18
2.2.1 Minimum Monitoring Requirements for Ozone .............................. 21
2.2.2 Minimum Monitoring Requirements for PM2.5 ................................ 24
2.2.3 Minimum Monitoring Requirements for PM10 ................................ 29
2.2.4 Minimum Monitoring Requirements for Collocated PM10 ................ 35
2.2.5 Minimum Monitoring Requirements for SO2 .................................. 35
2.2.6 Minimum Monitoring Requirements for NO2 ................................. 38
2.2.7 Minimum Monitoring Requirements for CO ................................... 43
2.2.8 Minimum Monitoring Requirements for Lead ................................ 45
2.3 ... Modifications Made to the Network in 2020 ............................................ 49
2.4 ... Proposed Modifications to Network in 2021–2022 ................................... 49
2.5 ... Removing a NAAQS Compliance Monitor ................................................ 51
2.6 ... Data Submission Requirement ............................................................... 52
3. ...... SPECIAL MONITORING PROGRAMS ................................................................ 53
3.1 ... NCore Program .................................................................................... 53
3.1.1 NCore Monitors .......................................................................... 55
3.2 ... PM2.5 Chemical Speciation Network ........................................................ 56
3.2.1 BAAQMD Supplemental PM2.5 Speciation Network Program ........... 57
3.3 ... Photochemical Assessment Monitoring Stations ...................................... 59
3.4 ... Toxics Program ..................................................................................... 63
3.4.1 Additional Toxics Monitoring at San Jose - Jackson ........................ 66
3.5 ... Meteorology Program ........................................................................... 66
4. ...... SITE INFORMATION DEFINITIONS .................................................................. 69
5. ...... DETAILED SITE INFORMATION ....................................................................... 74
5.1 ... Berkeley Aquatic Park (near-road) ........................................................... 74
5.2 ... Bethel Island ......................................................................................... 77
5.3 ... Concord ............................................................................................... 80
5.4 ... Crockett ............................................................................................... 83
5.5 ... Fairfield ................................................................................................ 85
5.6 ... Forest Knolls ......................................................................................... 87

4
5.7 ... Fort Cronkhite ...................................................................................... 89
5.8 ... Gilroy ................................................................................................... 91
5.9 ... Hayward .............................................................................................. 93
5.10 . Laney College (near-road) ...................................................................... 95
5.11 . Livermore ............................................................................................. 97
5.12 . Los Gatos ............................................................................................ 100
5.13 . Martinez ............................................................................................. 102
5.14 . Napa Valley College ............................................................................. 104
5.15 . Oakland East ....................................................................................... 107
5.16 . Oakland West ...................................................................................... 111
5.17 . Palo Alto Airport .................................................................................. 114
5.18 . Pittsburg ............................................................................................. 116
5.19 . Pleasanton (near-road) ......................................................................... 118
5.20 . Point Richmond ................................................................................... 120
5.21 . Redwood City ...................................................................................... 122
5.22 . Reid-Hillview Airport ............................................................................ 125
5.23 . Richmond 7th ....................................................................................... 127
5.24 . Rodeo ................................................................................................. 129
5.25 . San Carlos Airport II ............................................................................. 131
5.26 . San Francisco ....................................................................................... 133
5.27 . San Jose – Jackson ............................................................................... 136
5.28 . San Jose – Knox (near-road) .................................................................. 140
5.29 . San Martin .......................................................................................... 142
5.30 . San Pablo ............................................................................................ 144
5.31 . San Rafael ........................................................................................... 147
5.32 . San Ramon .......................................................................................... 150
5.33 . Sebastopol .......................................................................................... 152
5.34 . Vallejo ................................................................................................ 155
5.35 . Criteria Pollutant Performance Evaluation and Semi-Annual Flow Audit
Dates .................................................................................................. 158
APPENDIX A. OZONE MONITORING AGREEMENT BETWEEN BAAQMD AND
MBUAPCD ................................................................................. 162
APPENDIX B. PM10 MONITORING AGREEMENT BETWEEN BAAQMD AND MBUAPCD
.. .............................................................................................. 164
APPENDIX C. NO2 MONITORING AGREEMENT BETWEEN BAAQMD AND MBUAPCD
.. .............................................................................................. 165

5
APPENDIX D. CO, NO2, AND PM2.5 NEAR-ROAD MONITORING AGREEMENT
BETWEEN BAAQMD AND MBUAPCD ........................................... 167
APPENDIX E. OZONE MONITORING AGREEMENT BETWEEN BAAQMD AND
NSCAPCD.................................................................................. 169
APPENDIX F. EPA APPROVAL TO END MONITORING OF NOY AT THE SAN JOSE
NCORE SITE ............................................................................... 171
APPENDIX G. HAYWARD SLAMS TO SPM CORRESPONDENCE ........................... 176
APPENDIX H. INITIAL PLAN FOR PAMS REQUIRED SITES .................................... 180

6
LIST OF FIGURES
Figure Page
Figure 2-1. Map of Bay Area SLAMS and SPM Sites in 2020 ............................. 17
Figure 2-2. Core Based Statistical Areas (CBSA) for the San Francisco Bay
Area .......................................................................................... 20
Figure 2-3. Ozone Monitoring in the San Francisco Bay Area in 2020 ................ 23
Figure 2-4. PM2.5 Monitoring in the San Francisco Bay Area in 2020 .................. 25
Figure 2-5 2020 PM10 and PM2.5 Concentrations: Wildfire Events...................... 31
Figure 2-6. SO2 Monitoring in the San Francisco Bay Area in 2020 .................... 37
Figure 2-7. NO2 Monitoring in the San Francisco Bay Area in 2020 ................... 42
Figure 2-8. CO Monitoring in the San Francisco Bay Area in 2020 ..................... 44
Figure 2-9. Lead Monitoring in the San Francisco Bay Area in 2020 .................. 47
Figure 2-10 Existing and Proposed Site for Livermore Relocation ...................... 50
Figure 3-1 Map showing area of Neighborhood Scale at the San Jose NCore
Site ............................................................................................ 54
Figure 3-2 Map of the Two PAMS sites in the Livermore Valley…………………….. ...... 61
Figure 3-3 May of Air District Toxics Monitoring Sites in 2020 ......................... 64
Figure 3-4 Map of Air District Meteorological Monitoring Sites in 2020 ............ 68

7
LIST OF TABLES
Table Page
Table 2-1. Summary of Current NAAQS ........................................................ 12
Table 2-2. SLAMS Site Types and Appropriate Spatial Scales .......................... 15
Table 2-3. List of Monitoring Stations within the Air District in 2020 ................ 15
Table 2-4. 2010 Census Population and 2019 Population Estimates for Bay
Area CBSAs ................................................................................ 19
Table 2-5. Minimum Monitoring Requirements for Ozone .............................. 22
Table 2-6. Minimum Monitoring Requirements for FRM/FEM PM2.5 SLAMS ...... 26
Table 2-7. Near-Road Monitoring for PM2.5 ................................................... 27
Table 2-8. Collocated PM2.5 Monitors for the FEM Network ............................. 28
Table 2-9 2020 PM10 Concentrations Above 124 µg/m3 in Each MSA .............. 30
Table 2-10. Minimum Monitoring Requirements for SLAMS PM10 ..................... 33
Table 2-11. Collocated PM10 Monitoring in the Bay Area in 2020....................... 35
Table 2-12. Minimum Monitoring Requirements for SO2 .................................. 36
Table 2-13. NO2 Monitors at Various Spatial Scales ......................................... 41
Table 2-14. Minimum Monitoring Requirements for CO ................................... 43
Table 2-15. Source Oriented Lead Monitoring at Airports ................................ 48
Table 2-16. Collocated Source Oriented Lead Monitoring at Airports ................ 48
Table 3-1 NCore Monitors .......................................................................... 56
Table 3-2 PM2.5 Speciation Measurements at Air District Sites in 2020 ............ 58
Table 3-3 Monitoring Start Dates for PAMS Sites .......................................... 60
Table 3-4 List of Speciated Hydrocarbons Measured by GC in 2020 ................ 62

8
Table 3-5 List of Toxic Compounds Measured by the Air District in 2020 ......... 66
Table 4-1 Monitor Information Definitions and EPA Air Monitoring Siting
Criteria ....................................................................................... 69

9
DEFINITION OF TERMS
1:1 ..................................... Particulate or toxic sample schedule that is taken every day
1:3 ..................................... Particulate or toxic sample schedule that is taken every 3rd day
1:6 ..................................... Particulate or toxic sample schedule that is taken every 6th day
1:12 .................................. Particulate or toxic sample schedule that is taken every 12th day
AADT .............................. Annual Average Daily Traffic
AGL ................................. Above Ground Level
APCD ............................... Air Pollution Control District
AQMD ............................. Air Quality Management District
AQS ................................ Air Quality System; the EPA national air quality database
ARM ............................... Approved Regional Method
Air District ..................... Bay Area Air Quality Management District
BAM ............................... Beta Attenuation Monitor, a type of continuous PM2.5 monitor
BAAQMD ...................... Bay Area Air Quality Management District
BC .................................... Black Carbon
CARB .............................. California Air Resources Board
CBSA .............................. Core Based Statistical Area
CDP ................................. Census Designated Place
CFR ................................. Code of Federal Regulations
CO ................................... Carbon Monoxide
CSN ................................. Chemical Speciation Network
DRI .................................. Desert Research Institute
EPA ................................. U.S. Environmental Protection Agency
FE-AADT ....................... Fleet Equivalent Annual Average Daily Traffic
FEM ................................. Federal Equivalent Method
FRM ................................ Federal Reference Method
GC ................................... Gas Chromatograph
GCMS .............................. Gas Chromatograph Mass Spectrometer
GPS ................................. Geographic Positioning System
HAPS…… ........................ Hazardous Air Pollutants
HiVol .............................. High Volume
HPLC ................................ High Performance Liquid Chromatograph
H2S .................................. Hydrogen Sulfide
IMPROVE ...................... Interagency Monitoring of Protected Visual Environments
Maintenance Plan ..... A Plan submitted by states to EPA that outlines how the NAAQS
will be maintained for a particular region.

10
DEFINITION OF TERMS
MBUAPCD ..................... Monterey Bay Unified Air Pollution Control District
NAAQS .......................... National Ambient Air Quality Standard
NATTS ............................ National Air Toxics Trends Station
NCore ............................ National Core (Monitoring Program)
NEI .................................. National Emissions Inventory
NO .................................. Nitric Oxide
NO2 ................................. Nitrogen Dioxide
NOx ................................. Oxides of Nitrogen
NOy ................................. Total Reactive Nitrogen
NSCAPCD…… ............... Northern Sonoma County Air Pollution Control District
NSR ................................. New Source Review
O3 ..................................... Ozone
PAMS ............................. Photochemical Assessment Monitoring Stations
Pb .................................... Lead
ppb ................................. Parts per billion
PM ................................... Particulate Matter
PM2.5 ............................... Particulates less than or equal to 2.5 microns in size
PM2.5F ............................. PM2.5 measured using a filter-based sampler
PM2.5C ............................. PM2.5 measured using a continuous monitor
PM10 ................................ Particulates less than or equal to 10 microns in size
PM10C .............................. PM10 measured using a continuous monitor
PM10-2.5 .......................... PM Coarse – PM less than or equal to 10 microns and greater than
2.5 microns in size
POC ................................ Parameter Occurrence Code
PWEI ............................... Population Weighted Emissions Index
SIP ................................... State Implementation Plan – A Plan submitted by states to EPA
that outlines how the NAAQS will be met for an area
SLAMS ........................... State or Local Air Monitoring Station
SO2 .................................. Sulfur Dioxide
SPM ................................ Special Purpose Monitor
STN ................................. Speciation Trends Network
Toxics .............................. Gaseous VOC hazardous air pollutants
TSP .................................. Total Suspended Particulate
UFP ................................. Ultrafine Particulate less than or equal to 0.1 microns
VOC ................................ Volatile Organic Compound

11
1. INTRODUCTION
This annual network plan for the Bay Area Air Quality Management District summarizes
the air monitoring activities between January 1, 2020, and December 31, 2020.
Information about the monitors used at each air monitoring site pertains to the status as
of December 31, 2020. There are also siting and local area descriptions for monitoring
sites that operated in 2020 and for those that opened, or were planned to open,
between January 1 and June 30, 2021.
2. OVERVIEW OF NETWORK OPERATION
2.1 Network Design
The Bay Area Air Quality Management District (Air District) is the public agency
responsible for air quality management in the nine Bay Area counties: Alameda, Contra
Costa, Marin, Napa, San Francisco, San Mateo, Santa Clara, southwestern Solano, and
southern Sonoma. The Air District operates air monitoring sites in each of these nine
counties. The Air District began measuring air quality in the San Francisco Bay Area in
1957. In 2020, there were 33 operational air monitoring sites within the Air District.
The Air District performs air monitoring as part of several national programs required by
the Environmental Protection Agency (EPA); currently these programs include State and
Local Air Monitoring Stations (SLAMS) monitoring, the National Core (NCore) program,
the Photochemical Assessment Monitoring Stations (PAMS) program, and the PM2.5
Chemical Speciation Network (CSN). The Air District also conducts additional monitoring
to meet local needs not met by the national programs, including additional monitoring
supporting our understanding of particulate matter (PM), and additional meteorological
and air toxics monitoring. Summaries of these programs can be found later in this
report.
The population centers throughout the Bay Area represent a variety of conditions within
the air basin in terms of population size, the mix of emission sources nearby, and the
complex terrain and varied topography in the region. Because resources do not allow for
placement of monitoring sites in every city or town, EPA monitoring regulations make
general assumptions about area-wide air quality, which allow local agencies to focus
monitoring at locations that reasonably represent similar nearby areas. The SLAMS
network is specifically designed to meet the basic objectives of the Clean Air Act as
defined in the Code of Federal Regulations (CFR). This approach allows for a consistent
implementation of monitoring networks throughout the country by measuring air
quality in a few places that are representative of many other similar areas. Generally,
locations for permanent air monitoring sites are initially based on knowledge of

12
population density, local wind patterns, topography, and sources of air emissions, while
the final site selection is determined after considering logistical constraints and
analyzing available air quality data from previous monitoring or modeling studies.
The monitoring objectives of the Air District’s air monitoring network are:
• To provide air pollution data to the public in a timely manner.
• To support compliance with the California Ambient Air Quality Standards
(CAAQS) and the National Ambient Air Quality Standards (NAAQS).
• To support air pollution research studies.
A full list of CAAQS and NAAQS and the Air District’s attainment status for each
pollutant can be found at: http://www.baaqmd.gov/research-and-data/air-quality-
standards-and-attainment-status. Since the monitoring regulations in 40 CFR part 58 are
focused on implementation of the NAAQS, a summary of the standards is provided in
Table 2-1 below.
Table 2-1. Summary of Current NAAQS
Pollutant Averaging Time Level
Ozone 8-hour 0.070 ppm
PM2.5 24-hour 35 µg/m3
Annual 12.0 µg/m3
PM10 24-hour 150 µg/m3
Carbon Monoxide 1-hour 35 ppm
8-hour 9 ppm
Sulfur Dioxide 1-hour 75 ppb
Nitrogen Dioxide 1-hour 100 ppb
Lead 24-hour 0.15 µg/m3
More detailed information about the NAAQS, including past standards, can be found at:
https://www.epa.gov/criteria-air-pollutants/naaqs-table.

13
To meet its monitoring objectives, the Air District collects ambient air data at locations
with a variety of monitoring site types and spatial scales. These site types and spatial
scales, as defined in 40 CFR part 58 Appendix D, are listed below.
Site Types
Highest concentration or maximum ozone concentration: Sites expected to have the
highest concentration, even if populations are sparse in that area. High concentrations
may be found close to major sources, or further downwind if pollutants are transported
from sources located further away. Higher concentrations of some pollutants such as
ozone or secondary particulate matter are expected further downwind from the
emissions sources since time is needed for the chemical reactions in the atmosphere
that produce these secondary pollutants. Based on EPA interpretation of the regulations,
highest and maximum concentrations are determined by a monitoring site’s Design
Value, which is the metric used for comparing air quality data to the NAAQS.
Population oriented: Sites established to measure typical concentrations in areas of high
population density. In most cases, these sites are located within the largest cities in each
county.
Source impact or source oriented: Sites established to determine the impact of
significant sources or source categories on air quality. Typically, these sites are located
downwind of potential major sources of pollutants. Examples of source oriented SO2
and H2S monitors include those near the Chevron, Shell, Tesoro, Phillips 66, and Valero
refineries. Near-road sites that are located by heavily trafficked major roadways and lead
monitoring sites near general aviation airports are also examples of source-impact or
source-oriented monitoring due to their proximity to significant sources of PM, NO2, CO,
toxics, or lead.
Upwind background: Sites in areas that have no nearby significant emissions from
mobile, area, or industrial sources. At these sites, the measured concentrations reflect
the transported air quality levels from upwind areas.
General background: Sites established to determine general background concentration
levels in the absence of significant upwind sources.
Regional transport: Sites established to determine the extent of regional pollutant
transport among populated areas. The Air District shares a common boundary with six
other air districts: Monterey Bay Unified APCD, San Joaquin Valley APCD, Sacramento
Metropolitan AQMD, Yolo-Solano AQMD, Lake County AQMD, and Northern Sonoma

14
County APCD. When upwind areas have higher levels of air pollution, pollutants may be
transported into the Bay Area and contribute to higher air pollution levels we experience
due to sources within our jurisdiction. The Air District operates monitoring sites near the
borders of the Air District to measure the air pollution concentrations transported into
and out of Air District jurisdiction.
Welfare-related impacts: Sites located to measure impacts on visibility, vegetative
damage, or other welfare-based impacts.
Spatial Scales
Each site type is also associated with a spatial scale. To further clarify the relationship
between monitoring objectives, site types, and the physical location of a monitoring site,
the concept of spatial scale of representativeness was defined as the physical
dimensions surrounding an air monitoring site throughout which the actual pollutant
concentrations can be assumed to be reasonably similar.
EPA further explains that the homogeneity of the surrounding area refers to both
pollutant concentrations and nearby geography or topography, land use, or mix of
sources. For example, a neighborhood scale site would define similar concentrations
over a 0.5 – 4 km range with relatively uniform land use and nearby sources. The spatial
scale must also conform to established criteria for the distance from roadways and
traffic volume. If a monitoring site is located close to a significant source or a collection
of sources like a large roadway, the spatial scale would need to be smaller than
neighborhood scale because the concentrations over the 0.5 – 4 km range would no
longer be similar over those physical dimensions. There are different distance
requirements for each pollutant, which can be found in 40 CFR part 58 Appendix E.
Monitoring sites in the Air District network are designed to match the correct spatial
scale with the appropriate site type, air pollutant being measured, and the monitoring
objective. Descriptions of spatial scales are described below.
Microscale: Defines the concentrations in air volumes associated with area dimensions
ranging from several meters up to about 100 meters.
Middle scale: Defines the concentration typical of areas up to several city blocks in size
with dimensions ranging from about 100 meters to 0.5 kilometer.
Neighborhood scale: Defines concentrations within some extended area of the city that
has relatively uniform land use with dimensions in the 0.5 to 4.0 kilometers range. The
neighborhood and urban scales listed below have the potential to overlap in

15
applications that concern secondarily formed or homogeneously distributed air
pollutants.
Urban scale: Defines concentrations within an area of city-like dimensions, on the order
of 4 to 50 kilometers. Within a city, the geographic placement of sources may result in
there being no single site that can be said to represent air quality on an urban scale.
Regional scale: Typically defines a rural area of reasonably homogeneous geography
without large sources and extends from tens to hundreds of kilometers.
Table 2-2 lists the appropriate site type and spatial scale combinations that meet EPA
requirements for network design.
Table 2-2. SLAMS Site Types and Appropriate Spatial Scales
Site Type Appropriate Spatial Scale
Highest Concentration Micro, middle, neighborhood
Population Oriented Neighborhood, urban
Source Oriented Micro, middle, neighborhood
General Background Urban, regional
Regional Transport Urban, regional
Table 2-3 lists the stations and the pollutants measured at each site and Figure 2-1 is a
map of the monitoring sites in 2020.
Table 2-3. List of Monitoring Stations within the Air District in 2020
Site No.
Station Name Pollutants Monitored1
1 Berkeley Aquatic Park (near-road)
O3, NOx, CO, PM2.5C, Toxics, BC, UFP
2 Bethel Island O3, NOx, SO2, CO, PM102, Toxics
3 Concord O3, NOx, SO2, CO, PM10, PM2.5F, PM2.5C, Toxics
4 Crockett SO2, Toxics
5 Fairfield O3
6 Forest Knolls BC
7 Fort Cronkhite Toxics
8 Gilroy O3, PM2.5C
9 Hayward O3
10 Laney College (near-road) NOx, CO, PM2.5C, Toxics, BC, UFP

16
Site No.
Station Name Pollutants Monitored1
11 1 Livermore O3, NOx, PM2.5C, Speciated PM2.5, Toxics, BC, UFP
12 Los Gatos O3
13 Martinez SO2, Toxics
14 Napa Valley College O3, NOx, CO, PM10, PM2.5C, Toxics
15 Oakland East O3, NOx, CO, PM2.5C, Toxics
16 Oakland West O3, NOx, SO2, CO, PM2.5C, Speciated PM2.5, Toxics, BC
17 Palo Alto Airport Lead (TSP) [not operational in 2021]
18 Pittsburg Toxics, BC
19 Pleasanton (near-road) NOx, CO, PM2.5C, Toxics
20 Point Richmond H2S
21 Redwood City O3, NOx, CO, PM2.5C, Toxics, UFP
22 Reid-Hillview Airport Lead (TSP)3
23 Richmond - 7th Street SO2, H2S, Toxics
24 Rodeo H2S
25 San Carlos Airport II Lead (TSP) [not operational in 2021]
26 San Francisco O3, NOx, CO, PM10, PM2.5C, Toxics
27 San Jose – Jackson O3, NOx, NOy, SO2, CO, PM10, PM2.5F, PM2.5C, Speciated PM2.5, Toxics
28 San Jose – Knox (near-road)
NOx, CO, PM2.5C, Toxics, BC, UFP
29 San Martin O3
30 San Pablo O3, NOx, SO2, CO, PM10, PM2.5 C, Toxics, UFP
31 San Rafael O3, NOx, CO, PM10, PM2.5C, Toxics
32 San Ramon O3, NOx
33 Sebastopol O3, NOx, CO, PM2.5C, Toxics, UFP
34 Vallejo O3, NOx, SO2, CO, PM2.5C, Speciated PM2.5, Toxics
1 See pages 8 and 10 for acronym definitions. 2 PM10 at Bethel Island was discontinued in March 2020. 3 Lead (TSP) at Reid-Hillview Airport was temporarily shut down in July 2020.

17
Figure 2-1. Map of Bay Area SLAMS and SPM Sites in 2020
18
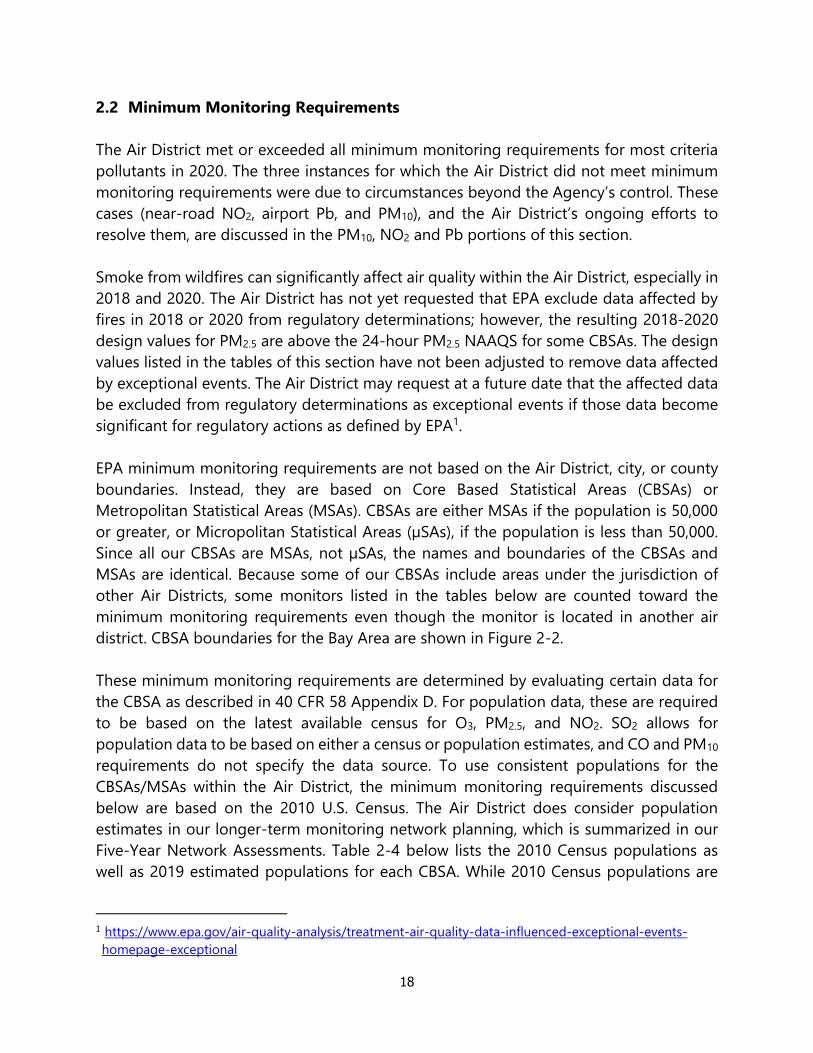
2.2 Minimum Monitoring Requirements
The Air District met or exceeded all minimum monitoring requirements for most criteria
pollutants in 2020. The three instances for which the Air District did not meet minimum
monitoring requirements were due to circumstances beyond the Agency’s control. These
cases (near-road NO2, airport Pb, and PM10), and the Air District’s ongoing efforts to
resolve them, are discussed in the PM10, NO2 and Pb portions of this section.
Smoke from wildfires can significantly affect air quality within the Air District, especially in
2018 and 2020. The Air District has not yet requested that EPA exclude data affected by
fires in 2018 or 2020 from regulatory determinations; however, the resulting 2018-2020
design values for PM2.5 are above the 24-hour PM2.5 NAAQS for some CBSAs. The design
values listed in the tables of this section have not been adjusted to remove data affected
by exceptional events. The Air District may request at a future date that the affected data
be excluded from regulatory determinations as exceptional events if those data become
significant for regulatory actions as defined by EPA1.
EPA minimum monitoring requirements are not based on the Air District, city, or county
boundaries. Instead, they are based on Core Based Statistical Areas (CBSAs) or
Metropolitan Statistical Areas (MSAs). CBSAs are either MSAs if the population is 50,000
or greater, or Micropolitan Statistical Areas (µSAs), if the population is less than 50,000.
Since all our CBSAs are MSAs, not µSAs, the names and boundaries of the CBSAs and
MSAs are identical. Because some of our CBSAs include areas under the jurisdiction of
other Air Districts, some monitors listed in the tables below are counted toward the
minimum monitoring requirements even though the monitor is located in another air
district. CBSA boundaries for the Bay Area are shown in Figure 2-2.
These minimum monitoring requirements are determined by evaluating certain data for
the CBSA as described in 40 CFR 58 Appendix D. For population data, these are required
to be based on the latest available census for O3, PM2.5, and NO2. SO2 allows for
population data to be based on either a census or population estimates, and CO and PM10
requirements do not specify the data source. To use consistent populations for the
CBSAs/MSAs within the Air District, the minimum monitoring requirements discussed
below are based on the 2010 U.S. Census. The Air District does consider population
estimates in our longer-term monitoring network planning, which is summarized in our
Five-Year Network Assessments. Table 2-4 below lists the 2010 Census populations as
well as 2019 estimated populations for each CBSA. While 2010 Census populations are
1 https://www.epa.gov/air-quality-analysis/treatment-air-quality-data-influenced-exceptional-events-
homepage-exceptional

19
used to determine official requirements, the population estimates are used to evaluate
potential future changes to these requirements, which are noted, as applicable.
Many minimum monitoring requirements are also based on the monitored level of
pollutant concentrations. The information for the highest site in a CBSA/MSA is given in
the tables below and is based on 2018-2020 data. County-level 2018-2020 design values
can be found at EPA’s Air Data website: https://www.epa.gov/outdoor-air-quality-
data/air-quality-statistics-report.
Except where otherwise noted, each monitor meets the requirements of 40 CFR part 58,
appendices A, B, C, D, and E, where applicable.
Table 2-4. 2010 Census Population and 2019 Population Estimates for Bay Area CBSAs
Core Based Statistical Area
2010 Census
Population
(April 1, 2010)
2019 Population
Estimate
(July 1, 2019)1
San Francisco-Oakland-Berkeley 4,335,391 4,731,803
San Jose-Sunnyvale-Santa Clara 1,836,911 1,990,660
Santa Rosa-Petaluma 483,878 494,336
Vallejo 413,344 447,643
Napa 136,484 137,744
1 Data source: https://www.census.gov/data/datasets/time-series/demo/popest/2010s-total-metro-and-
micro-statistical-areas.html. 2020 CBSA population data is not yet publicly available.

20
Figure 2-2. Core Based Statistical Areas (CBSA) for the San Francisco Bay Area

21
Monitoring Agreements with Yolo/Solano AQMD
The Bay Area network met all minimum monitoring requirements for all criteria pollutants
in the Vallejo–Fairfield CBSA, therefore, no interagency agreements were needed with
Yolo/Solano AQMD. The Air District will continue to assess the minimum monitoring
requirements in the Five-Year Network Assessments and work with the other Air Districts
to meet them.
Monitoring Agreements with Monterey Bay Unified APCD
The Bay Area and Monterey Air Districts share minimum monitoring requirements for the
San Jose–Sunnyvale–Santa Clara CBSA. This CBSA includes Santa Clara County (Bay Area)
and San Benito County (Monterey). Shared pollutant monitoring agreements include O3,
PM2.5, PM10, and near-road NO2, CO, and PM2.5. Within its own network, the Bay Area Air
District meets minimum monitoring requirements for O3, PM2.5, and near-road NO2, CO,
and PM2.5. PM10 is the only pollutant for which the Bay Area does not meet the minimum
requirements on its own, and therefore has a monitoring agreement with Monterey Bay
for PM10. Monterey Bay needs agreements for O3, PM2.5, and near-road NO2, CO, and
PM2.5 monitoring. Existing agreements are in Appendices A – D.
Monitoring Agreements with Northern Sonoma County APCD
The Bay Area and Northern Sonoma County Air Districts share minimum monitoring
requirements for the Santa Rosa - Petaluma MSA. Shared pollutant monitoring
agreements only include O3. On December 29, 2020, the Northern Sonoma County APCD
notified the Air District that EPA had approved the shutdown of the Healdsburg Airport
O3 monitoring site. Due to the shutdown, Northern Sonoma County APCD no longer met
minimum monitoring requirements for O3 with their own network. Both Air Districts have
entered into an interagency agreement that specifies that the agencies recognize this
shared responsibility for O3 monitoring in the Santa Rosa – Petaluma MSA and will
coordinate appropriately to ensure minimum monitoring requirements continue to be
met. See Appendix E for the current agreement.
2.2.1 Minimum Monitoring Requirements for Ozone
The number of required O3 monitors in each MSA is determined by the MSA population
and design value, as specified in Table D-2 of 40 CFR part 58 Appendix D. O3 design values
are calculated for each site according to 40 CFR part 50 Appendix U and are compared to
the 2015 8-hour O3 NAAQS to determine the attainment status of an area.

22
The 2020 Air District monitoring network for O3 (Figure 2-3) meets or surpasses the O3
minimum monitoring requirements (Table 2-5). Therefore, no monitoring agreement was
needed between the Air District and any other air district to comply with the minimum
monitoring requirement for O3. As described in Appendix E, Northern Sonoma County
APCD notified the Air District that the EPA approved the shutdown of the Healdsburg
Airport O3 monitoring site in June 2020 and therefore Northern Sonoma County APCD
and the Air District established an agreement to maintain minimum monitoring
requirements in the Santa Rosa – Petaluma MSA in December 2020.
Table 2-5. Minimum Monitoring Requirements for Ozone
MSA County or
Counties
Population
2010
Census
2020
8-hour
Design Value
(ppb)
Design Value
Site and AQS
ID
Number of SLAMS
Req
uire
d
Activ
e
Ad
ditio
nal
Need
ed
San
Francisco-
Oakland-
Berkeley
San Francisco,
San Mateo,
Alameda, Marin,
Contra Costa
4,335,391 69 Livermore
06-001- 0007 3 7 0
San Jose-
Sunnyvale-
Santa Clara
Santa Clara, San
Benito 1,836,911 66
San Martin
06-085-2006 2 6b 0
Santa Rosa-
Petaluma Sonoma 483,878 51
Sebastopol
06-097-0004 1 2c 0
Vallejo Solano 413,344 63 Vacaville
06-095-3003 2 3d 0
Napa Napa 136,484 58
Napa Valley
College
06-055-0004
0e 1 0
a Design values are calculated at each monitoring site by taking the 3-year average (2018-2020) of the 4th highest
daily maximum 8-hour concentration. The design values shown for each MSA in this table are the highest design
value of monitors in the MSA. Design values at or below the 0.070 ppm meet the 2015 8-Hour O3 NAAQS. b Two of the six monitors are not in the BAAQMD. Hollister and Pinnacles National Park sites are in the Monterey
Bay Unified APCD. The Pinnacles National Park site is part of the CASTNET program and was designated SLAMS
in 2010 by the EPA. c One of the two monitors is not in the BAAQMD. It is in Healdsburg which is in the Northern Sonoma County
APCD. BAAQMD was notified that the Healdsburg Airport O3 monitoring site was shut down in June 2020. d One of the three monitors is not in the BAAQMD. It is in Vacaville, which is in the Yolo-Solano AQMD. e The Napa-Jefferson Street site (06-055-0003) was relocated to the Napa Valley College site (06-055-0004), a
neighborhood scale site, on April 1, 2018. The site relocation was approved by EPA, and data from both sites
were combined for design value calculations.

23
Figure 2-3. Ozone Monitoring in the San Francisco Bay Area in 2020

24
Ozone Special Purpose Monitors
There are four O3 monitors (San Rafael, San Pablo, Berkeley-Aquatic Park, and Oakland
East) that are too close to a roadway to meet the siting requirements of 40 CFR part 58
Appendix E. The proximity of these sites to the roadway may bias the O3 concentrations
lower than if they were located further away from the roadway. Therefore, these monitors
are designated as special purpose monitors (SPMs) and as such are not counted towards
minimum monitoring requirements. However, these monitors continue to be
representative of population exposure in the near-road environment, and meet the
requirements of 40 CFR 58 Appendix A and are considered NAAQS comparable since they
could show a valid violation of the NAAQS.
EPA noted in their 2018 TSA that the Hayward O3 monitor also does not meet 40 CFR part
58 Appendix E siting requirements and noted that it should, therefore be classified as an
SPM. As part of the 2019 annual network plan, the Air District requested that EPA approve
the change in monitoring type of this monitor from a SLAMS to an SPM. EPA subsequently
approved the request and the Air District has classified the Hayward O3 monitor as a SPM
and will not be counted towards minimum monitoring requirements. The San Francisco-
Oakland-Berkeley CBSA continues to meet minimum monitoring requirements. See
Appendix G for the Air District’s request and EPA’s approval.
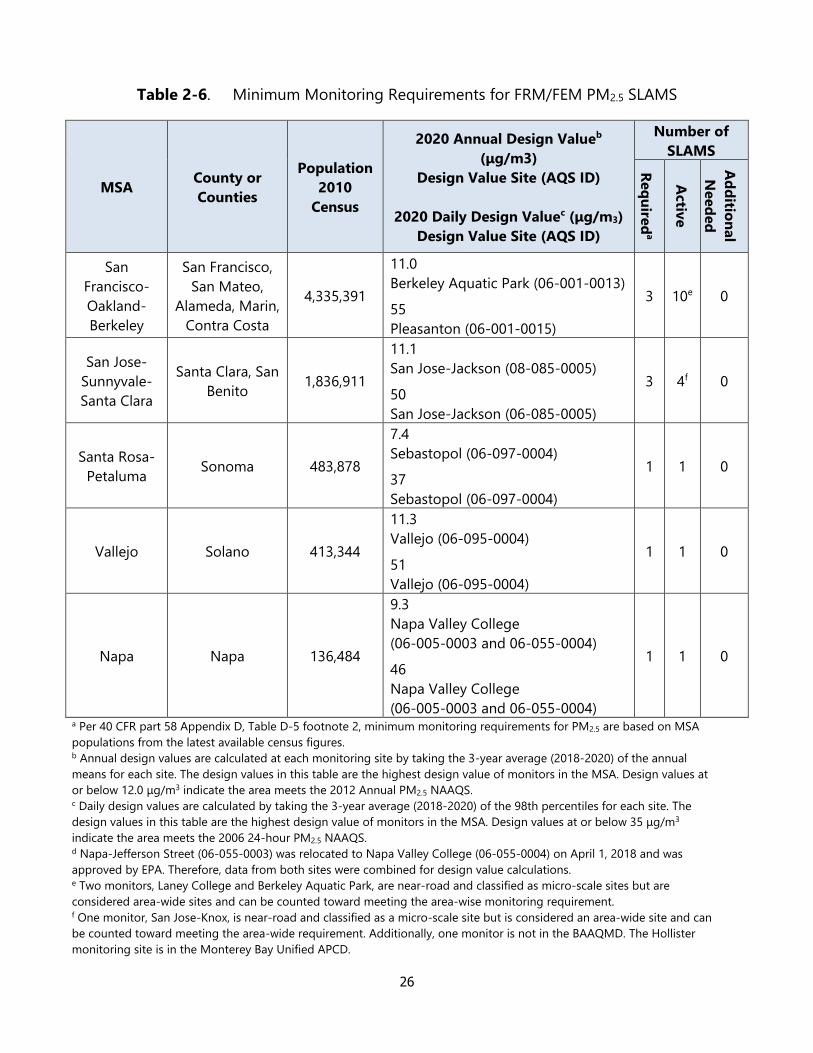
2.2.2 Minimum Monitoring Requirements for PM2.5
The number of required PM2.5 monitors in each MSA is determined by the MSA population
and design value, as specified in Table D-5 of 40 CFR part 58 Appendix D. The Air District’s
network of PM2.5 SLAMS and SPMs is shown in Figure 2-4. Table 2-5 shows that the PM2.5
minimum requirements for SLAMS monitoring were met in 2020.
In 2020, every PM2.5 monitor in the network was a Federal Reference Method (FRM) or
Federal Equivalent Method (FEM), and the primary monitor at every site was a continuous
FEM. While the near-road sites at Oakland-Laney College, Berkeley Aquatic Park,
Pleasanton, and San Jose-Knox are considered micro-scale because of their distance to
roadways, they are considered area-wide sites since they represent many similar locations
throughout their MSAs (see 40 CFR part 58 Appendix D, §4.7.1(b)). The Pleasanton site is
designated as an SPM, meets the requirements of 40 CFR part 58 Appendices A, B, C, D,
and E, but does not count towards minimum monitoring requirements.
In addition to the requirement for a minimum number of PM2.5 SLAMS, EPA requires that
a certain number of sites operate continuous PM2.5 monitors (40 CFR part 58 Appendix D,
§4.7.2). Currently, all the primary PM2.5 monitors in the Air District network are continuous

25
FEMs. Therefore, the requirement to operate continuous PM2.5 monitors equal to at least
one-half (rounding up) the number of PM2.5 SLAMS monitors is met.
The PM2.5 network design requirements and the minimum number of near-road PM2.5
monitors in the PQAO (40 CFR part 58 Appendix D, §4.7.1(b)(2)) and the QA requirements
for the collocation of PM2.5 monitors (40 CFR part 58 Appendix A, §3.2.5) are discussed
below.
Figure 2-4. PM2.5 Monitoring in the San Francisco Bay Area in 2020
26
Table 2-6. Minimum Monitoring Requirements for FRM/FEM PM2.5 SLAMS
MSA County or
Counties
Population
2010
Census
2020 Annual Design Valueb
(μg/m3)
Design Value Site (AQS ID)
2020 Daily Design Valuec (μg/m3)
Design Value Site (AQS ID)
Number of
SLAMS R
eq
uire
da
Activ
e
Ad
ditio
nal
Need
ed
San
Francisco-
Oakland-
Berkeley
San Francisco,
San Mateo,
Alameda, Marin,
Contra Costa
4,335,391
11.0
Berkeley Aquatic Park (06-001-0013)
55
Pleasanton (06-001-0015)
3 10e 0
San Jose-
Sunnyvale-
Santa Clara
Santa Clara, San
Benito 1,836,911
11.1
San Jose-Jackson (08-085-0005)
50
San Jose-Jackson (06-085-0005)
3 4f 0
Santa Rosa-
Petaluma Sonoma 483,878
7.4
Sebastopol (06-097-0004)
37
Sebastopol (06-097-0004)
1 1 0
Vallejo Solano 413,344
11.3
Vallejo (06-095-0004)
51
Vallejo (06-095-0004)
1 1 0
Napa Napa 136,484
9.3
Napa Valley College
(06-005-0003 and 06-055-0004)
46
Napa Valley College
(06-005-0003 and 06-055-0004)
1 1 0
a Per 40 CFR part 58 Appendix D, Table D-5 footnote 2, minimum monitoring requirements for PM2.5 are based on MSA
populations from the latest available census figures. b Annual design values are calculated at each monitoring site by taking the 3-year average (2018-2020) of the annual
means for each site. The design values in this table are the highest design value of monitors in the MSA. Design values at
or below 12.0 μg/m3 indicate the area meets the 2012 Annual PM2.5 NAAQS. c Daily design values are calculated by taking the 3-year average (2018-2020) of the 98th percentiles for each site. The
design values in this table are the highest design value of monitors in the MSA. Design values at or below 35 μg/m3
indicate the area meets the 2006 24-hour PM2.5 NAAQS. d Napa-Jefferson Street (06-055-0003) was relocated to Napa Valley College (06-055-0004) on April 1, 2018 and was
approved by EPA. Therefore, data from both sites were combined for design value calculations. e Two monitors, Laney College and Berkeley Aquatic Park, are near-road and classified as micro-scale sites but are
considered area-wide sites and can be counted toward meeting the area-wise monitoring requirement. f One monitor, San Jose-Knox, is near-road and classified as a micro-scale site but is considered an area-wide site and can
be counted toward meeting the area-wide requirement. Additionally, one monitor is not in the BAAQMD. The Hollister
monitoring site is in the Monterey Bay Unified APCD.

27
Near-Road PM2.5 Sites
Along with the 2012 PM2.5 NAAQS revision, EPA revised the PM2.5 network design criteria
to require at least one PM2.5 monitor at near-road sites in CBSAs with populations of 1
million or greater (40 CFR 58, Appendix D §3.7.1 (b)(2)). The minimum monitoring
requirements are met and shown in Table 2-7.
Table 2-7. Near-Road Monitoring for PM2.5
Metropolitan
Statistical
Area
County or
Counties
Population 2010
Census
Number of
Near-road PM2.5 SLAMS
Required Active
San Francisco-
Oakland-
Berkeley
San Francisco,
San Mateo,
Alameda, Marin,
Contra Costa
4,335,391 1 2a
San Jose-
Sunnyvale-
Santa Clara
Santa Clara, San
Benito 1,836,911 1 1
Santa Rosa-
Petaluma Sonoma 483,878 0 0
Vallejo Solano 413,344 0 0
Napa Napa 136,484 0 0 a The Pleasanton monitoring site meets siting for a near-road monitoring objective. However, the PM2.5
monitor at that site that is an SPM, and as such, is not counted toward fulfilling this requirement.
Area of Expected Maximum Concentration
Network design requirements for PM2.5 require sites in each MSA located in areas of
expected maximum concentrations (40 CFR part 58 Appendix D). The Air District siting for
PM2.5 considers the potential effect on air quality from many PM2.5 source types, including
stationary and area sources, roadways, residential wood burning, and agriculture. The
primary objective of these maximum concentration SLAMS is to determine compliance
with the PM2.5 NAAQS. Because the NAAQS are based on annual means or the 98th
percentile daily average PM2.5 concentrations, these sites should be located where the
annual mean or 98th percentile concentration are expected to be highest, even though
other locations may experience higher concentrations on a specific day.
EPA has determined that the current PM2.5 monitoring network in the Bay Area meets this
requirement. Air District regularly evaluates the amount and distribution of PM2.5 (direct
and precursor) source emissions through emissions inventory and modeling work for
other programs and uses this work to assess the effectiveness of the ambient monitoring
network for each 5-Year Network Assessment.

28
Regional Background and Transport Sites
Every state is required to operate at least one regional transport site and one regional
background site (40 CFR part 58 Appendix D, §4.7.3). While some of sites like Vallejo,
Livermore, and others at times measure transport between the Bay Area and the Central
Valley, or relatively clean air off the ocean, they are not considered regional background
or transport sites for the purpose of this requirement. Since these are state-wide
requirements, this requirement is met by CARB’s network. More information about
transport and background sites in California can be found CARB’s Annual Monitoring
Network Report, found at https://ww2.arb.ca.gov/our-work/programs/ambient-air-
monitoring-regulatory/annual-monitoring-network-report.
PM2.5 Filter Analysis for Other Air Districts and PQAO Responsibility
PM2.5 filter samples collected by the North Coast AQMD and Monterey Bay Unified APCD
are weighed by staff at the Air District’s laboratory. The Air District, however, is not the
Primary Quality Assurance Organization (PQAO) for these samples. Therefore, the PM2.5
concentration data are sent back to the collecting agencies for their review, data
validation, and certification. The Air District is the certifying agency for samples collected
within the Air District jurisdiction only.
Minimum Monitoring Requirements for Collocated PM2.5
In 2020, the Air District operated 17 primary PM2.5 monitors (SLAMS and SPMs); these
primary monitors were all MetOne BAM continuous FEMs (method 170). EPA requires
collocation at 15% of the sites (round up) which equates to three collocated monitors, the
first and third collocated monitors must be an FRM and the second must be the same
FEM method as the primary monitor (see 40 CFR part 58 Appendix A, §3.2.3). In 2020, the
Bay Area had three sites with collocated PM2.5 monitors, San Jose-Jackson and Concord
with FEM-primary and FRM-collocated, and Vallejo with a FEM/FEM primary/collocated
pair, as shown in Table 2-8 below.
Table 2-8. Collocated PM2.5 Monitors for the FEM Network
Method
Code
# Primary
Monitors
# Required
Collocated
Monitors
# Active
Collocated FRM
Monitors
# Active Collocated FEM
Monitors (same method as
primary)
170 17 3
2
San Jose-Jackson
and Concord
1
Vallejo

29
Historically, the San Jose-Jackson, Concord and Vallejo sites have had some of the highest
PM2.5 design values in the Bay Area, which is why these sites were selected for collocated
monitoring. The Air District installed an FRM at Concord on February 8, 2019 to meet this
requirement.
2.2.3 Minimum Monitoring Requirements for PM10
The number of required PM10 monitors in each MSA is determined by MSA population
and 24-hour maximum concentrations, as specified in Table D-4 of 40 CFR part 58
Appendix D. To meet the requirements, a monitoring agreement is needed between the
Air District and the Monterey Bay Unified APCD for the San Jose – Sunnyvale – Santa Clara
MSA. The Bay Area operates one monitor in Santa Clara County and Monterey Bay
operates one monitor in San Benito County. See Appendix B. There are no monitoring
agreements with either the Northern Sonoma APCD or the Yolo-Solano AQMD because
neither the Santa Rosa MSA nor the Vallejo MSA are required to have any PM10 monitors.
Recent wildfire events in 2020 caused elevated PM10 concentrations throughout the
region, which have triggered additional minimum monitoring requirements in four of the
five MSAs in the Bay Area. Table 2-9 shows the highest PM10 concentrations in 2020.
Generally, a historic number of wildfires throughout northern California were ignited by
lightning strikes on August 16, 2020. Many of these fires continued to burn until October
and November 2020.
Per 40 CFR part 58 Appendix D, §4.6, the appropriate number of PM10 monitors in an MSA
is dependent on population and the level of PM10 concentrations compared to specific
concentration ranges:
• Low (<124 µg/m3)
• Medium, and (>124 µg/m3 and < 186 µg/m3)
• High concentration ranges (>186 µg/m3)
As shown in Table 2-9, the highlighted values represent the concentrations that are
above the medium or high concentration ranges and that were also affected by the
2020 wildfire events and the date (m/dd). All remaining concentrations measured at
these sites are below 124 µg/m3 and are in the low concentration range for purposes of
minimum monitoring requirements.

30
Table 2-9 2020 PM10 Concentrations Above 124 µg/m3 in Each MSA
Concord
(µg/m3)
San Jose
Jackson
(µg/m3)
Hollister
(µg/m3)
Guerneville
(µg/m3)
Healdsburg
(µg/m3)
Vacaville
(µg/m3)
Napa
(µg/m3)
San
Francisco-
Oakland-
Berkeley
San Jose-Sunnyvale-
Santa Clara Santa Rosa -Petaluma Vallejo Napa
165 (9/12) 134 (9/12) 159 (8/19) 140 (9/11) 125 (9/11) 326 (8/19) 122
43 91 116 134 (9/10) 125 (10/1) 170 (9/12) 81
33 58 111 97 111 97 44
25 58 109 87 106 72 43
25 56 106 82 105 67 42
21 56 103 78 101 55 38
20 56 89 58 95 43 35
20 55 89 48 79 43 32
17 55 89 48 55 30 31
15 53 83 47 54 27 22
Figure 2-5 shows the relationship between the 2020 wildfire events and elevated PM10
and PM2.5 concentrations at the highest monitoring site in the MSA. Satellite imagery,
additional measurements, news reports, and other corroborating information suggest a
clear causal relationship between these concentrations and nearby emissions from
lightning caused wildfires. The current PM10, PM2.5, and BC networks are very robust and
existing monitoring meets the needs of the local air districts and captures the relevant
information for these types of events. It is unlikely that additional PM10 monitoring
would measure concentrations at these levels under normal, non-wildfire, conditions.

31
Figure 2-5 2020 PM10 and PM2.5 Concentrations: Wildfire Events

32
Also, the maximum concentration in 2019 at the Hollister site in the San Jose –
Sunnyvale – Santa Clara MSA was affected by a rare high-pressure event that brought
air into the basin from the San Joaquin Valley. This unusual event caused the highest
day for PM10 at that site in at least eight years. The next highest values from 2013-2019
at that site are as follows: 96 µg/m3 in 2019, 85 µg/m3 in 2013, 80 µg/m3 in 2018, and 79
µg/m3 in 2017. During 2014-2016, the site did not have any days above 50 µg/m3.
Additionally, this late October 2019 event did not have as significant an effect on Santa
Clara County, where the maximum concentration during this time was 75 µg/m3. Santa
Clara is the more populous part of the San Jose-Sunnyvale-Santa Clara MSA by far, and
existing monitoring meets the needs of the local air districts and the communities since
the Hollister site already captures the relevant information for this type of event.
The Air District will continue to work with Monterey Bay Unified APCD to assess the
adequacy of the PM10 network in the San Jose-Sunnyvale-Santa Clara CBSA as well as
address the PM10 network the San Francisco-Oakland-Berkeley, Santa Rosa-Petaluma,
and Vallejo MSA in each 5-Year Network Assessment, evaluating the need for additional
monitoring taking available resources for the construction and operation of new sites
into consideration. The Air District is committed to working with EPA, CARB, and other
local air districts to ensure that monitoring levels continue to protect public health and
safety.
PM10 Special Purpose Monitors
Special purpose PM10 monitoring at Bethel Island, Concord, and San Francisco is
conducted at a sampling frequency of 1:12. These SPM monitors meet 40 CFR Appendices
E and A and are considered NAAQS comparable since they could show a valid violation
of the NAAQS but are not counted toward meeting the minimum monitoring
requirements. The Bethel Island PM10 SPM was discontinued on March 16, 2020. See
Section 2.3
Table 2-10 and Figure 2-6 show the required PM10 monitors, the active SLAMS counted
toward those requirements, and the locations of all the PM10 SLAMS and SPMs in the
network.

33
Table 2-10. Minimum Monitoring Requirements for SLAMS PM10
MSA County or
Counties
Population
2010
Census
Highest
24-Hour
Conc.
(ug/m3)
(2020)
Highest
24-Hour Conc. Site
AQS ID
Number of SLAMS
Req
uire
d a
Activ
e
Ad
ditio
nal
Need
ed
San
Francisco-
Oakland-
Berkeley
San Francisco,
San Mateo,
Alameda,
Marin, Contra
Costa
4,335,391 165b Concord
(06-013-0002) 4-8 b 2 2
San Jose-
Sunnyvale-
Santa Clara
Santa Clara,
San Benito 1,836,911 159b Hollister
(06-069-0002) 4-8b 2c 2
Santa Rosa-
Petaluma Sonoma 483,878 140b
Guerneville
(06-097-3002) 1-2 b 3d 0
Vallejo Solano 413,344 326b Vacaville
(06-095-3001) 3-4b 1e 2
Napa Napa 136,484 122 Napa Valley College
(06-055-0004) 0 0 0
a The number of PM10 monitors required depends on the population of the MSA and the highest 24-hour PM10
concentration as described in Table D-4 of 40 CFR part 58 Appendix D. b Existing monitoring meets the needs of the local air districts and the communities, and the Air District will
continue to assess the adequacy of the PM10 networks in each 5-Year Network Assessment to determine if
events like this become more common and drive the need for additional monitoring. The Air District is
committed to working with EPA, CARB, and other local air districts to ensure that monitoring levels continue to
protect public health and safety. c One of the two monitors is not in the BAAQMD. The Hollister monitoring site is in the Monterey Bay Unified
APCD. d These monitors are not in the BAAQMD. The Healdsburg, Guerneville, and Cloverdale monitoring sites are in
the Northern Sonoma APCD. e This monitor is not in the BAAQMD. The Vacaville monitoring site is in the Yolo-Solano AQMD.

34
Figure 2-6. PM10 Monitoring in the San Francisco Bay Area in 2020

35
2.2.4 Minimum Monitoring Requirements for Collocated PM10
EPA requires a network of manual PM10 samplers to have collocated monitoring at 15%
(or at least one) of the monitoring sites within a PQAO (40 CFR part 58 Appendix D, §3.3.4).
All primary PM10 SLAMS in the Bay Area network are manual methods (method codes 063,
141, and 127). Table 2-11 summarizes the collocation of PM10 in the Bay Area during 2020.
Table 2-11. Collocated PM10 Monitoring in the Bay Area in 2020
Methods
Codes
Number of Primary
Manual SLAMS
Number of Required
Collocated Manual
SLAMS
Number of Active
Collocated Manual
SLAMS
063, 141, 127 4 1 1
(San Pablo)
Collocated PM10 monitoring was moved to San Pablo on October 17, 2016 since the site
could accommodate the logistics of collocation. It is an appropriate collocation site
because the maximum concentrations at these sites are among the highest in the network
and the concentrations are relatively consistent throughout the network.
Although the collocated sampler is only required to operate on a 1:12 schedule, the Air
District operates the sampler 1:6 throughout the year; the collocated sampling frequency
may be reevaluated in the future.
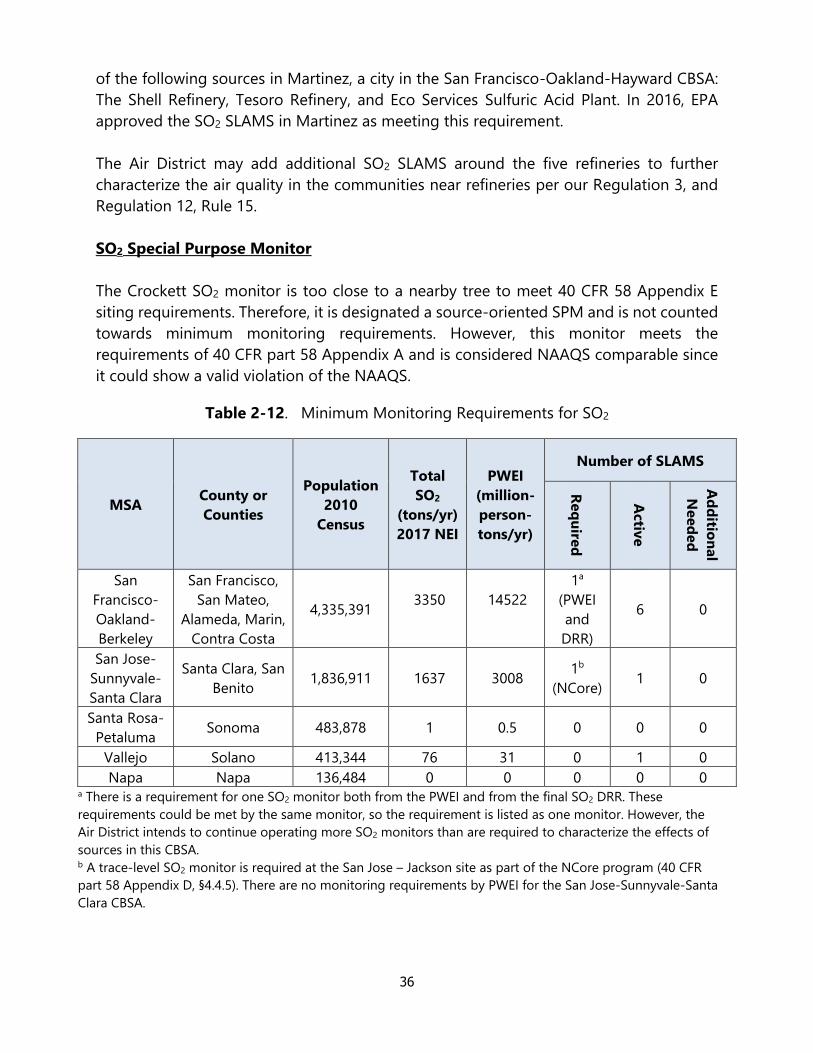
2.2.5 Minimum Monitoring Requirements for SO2
The number of required SO2 monitors in each CBSA is determined by the product of the
total amount of SO2 emissions in the CBSA and its population as specified in 40 CFR part
58 Appendix D, §4.4.2 (Table 2-12). The resulting value is defined as the Population
Weighted Emissions Index (PWEI). One SO2 monitor is required in CBSAs with PWEI values
greater than 5,000 but less than 100,000, and none when the value is less than 5,000. SO2
emissions shown in Table 2-12 are from the 2017 National Emissions Inventory (NEI).
Table 2-10 also shows that the Air District monitoring network meets or surpasses the SO2
minimum requirements for monitoring by the PWEI.
In addition to minimum monitoring requirements by the PWEI, EPA requires trace-level
SO2 monitoring at NCore sites (40 CFR part 58 Appendix D, §4.4.5), which is fulfilled by a
trace-level SO2 monitor at the San Jose – Jackson NCore site.
The Data Requirements Rule (DRR) for the 2010 1-hour SO2 NAAQS also requires
monitoring or modeling to characterize ambient SO2 concentrations near SO2 sources
that emit more than 2,000 tons per year (tpy). While there is no single source in the Bay
Area that exceeds this emission threshold, EPA required further air quality characterization
36
of the following sources in Martinez, a city in the San Francisco-Oakland-Hayward CBSA:
The Shell Refinery, Tesoro Refinery, and Eco Services Sulfuric Acid Plant. In 2016, EPA
approved the SO2 SLAMS in Martinez as meeting this requirement.
The Air District may add additional SO2 SLAMS around the five refineries to further
characterize the air quality in the communities near refineries per our Regulation 3, and
Regulation 12, Rule 15.
SO2 Special Purpose Monitor
The Crockett SO2 monitor is too close to a nearby tree to meet 40 CFR 58 Appendix E
siting requirements. Therefore, it is designated a source-oriented SPM and is not counted
towards minimum monitoring requirements. However, this monitor meets the
requirements of 40 CFR part 58 Appendix A and is considered NAAQS comparable since
it could show a valid violation of the NAAQS.
Table 2-12. Minimum Monitoring Requirements for SO2
MSA County or
Counties
Population
2010
Census
Total
SO2
(tons/yr)
2017 NEI
PWEI
(million-
person-
tons/yr)
Number of SLAMS
Req
uire
d
Activ
e
Ad
ditio
nal
Need
ed
San
Francisco-
Oakland-
Berkeley
San Francisco,
San Mateo,
Alameda, Marin,
Contra Costa
4,335,391 3350
14522
1a
(PWEI
and
DRR)
6 0
San Jose-
Sunnyvale-
Santa Clara
Santa Clara, San
Benito 1,836,911 1637 3008
1b
(NCore) 1 0
Santa Rosa-
Petaluma Sonoma 483,878 1 0.5 0 0 0
Vallejo Solano 413,344 76 31 0 1 0
Napa Napa 136,484 0 0 0 0 0 a There is a requirement for one SO2 monitor both from the PWEI and from the final SO2 DRR. These
requirements could be met by the same monitor, so the requirement is listed as one monitor. However, the
Air District intends to continue operating more SO2 monitors than are required to characterize the effects of
sources in this CBSA. b A trace-level SO2 monitor is required at the San Jose – Jackson site as part of the NCore program (40 CFR
part 58 Appendix D, §4.4.5). There are no monitoring requirements by PWEI for the San Jose-Sunnyvale-Santa
Clara CBSA.

37
Figure 2-6. SO2 Monitoring in the San Francisco Bay Area in 2020

38
2.2.6 Minimum Monitoring Requirements for NO2
On April 12, 2010, EPA revised the minimum monitoring requirements for NO2 in 40 CFR
part 58 Appendix D. The revision required the Air District to operate NO2 monitors at
neighborhood-scale or larger sites to monitor the expected highest area-wide
concentrations, and at sites within 50 meters of major freeways (near-road sites). In
addition, the rule required the EPA Regional Administrators to identify an additional 40
sites nationwide to monitor NO2 in areas with susceptible and vulnerable populations by
January 1, 2013. In implementing this requirement, EPA selected existing area-wide
SLAMS in areas with susceptible and vulnerable populations to meet this requirement.
On March 7, 2013 and December 30, 2016, EPA issued final rules revising the requirements
and implementation dates for near-road NO2 sites. The current requirements are for one
near-road NO2 monitor in CBSA’s with a population greater than 1 million, and a second
near-road NO2 monitor in CBSA’s with a population greater than 2.5 million or CBSA’s
with populations over 1 million and roadway with annual average daily traffic (AADT) over
250,000. Based on CBSA population and traffic counts, the Air District was initially required
to operate three near-road monitoring sites. In addition to the near-road monitoring
requirement, the Air District is required to monitor for area-wide NO2 concentrations at
one site in both the San Francisco-Oakland-Berkeley and the San Jose-Sunnyvale-Santa
Clara CBSAs (see Table 2-13).
As part of the NO2 network design criteria, EPA defined the most important scale for
different NO2 monitoring objectives. The most important spatial scale for near-road NO2
monitoring stations to effectively characterize the maximum expected hourly NO2
concentration due to mobile source emissions on major roadways is microscale. The most
important spatial scales for other monitoring stations characterizing maximum expected
hourly NO2 concentrations are microscale and middle scale. The most important spatial
scale for area-wide monitoring of high NO2 concentrations is neighborhood scale.
In 2020, the Air District operated ten area-wide neighborhood scale NO2 SLAMS in the
Bay Area, including six in the San Francisco-Oakland-Berkeley CBSA and one in the San
Jose-Sunnyvale-Santa Clara CBSA. One of the ten, the Oakland West site, was selected as
one of the 40 nationwide sites for monitoring NO2 in areas with susceptible and vulnerable
populations.
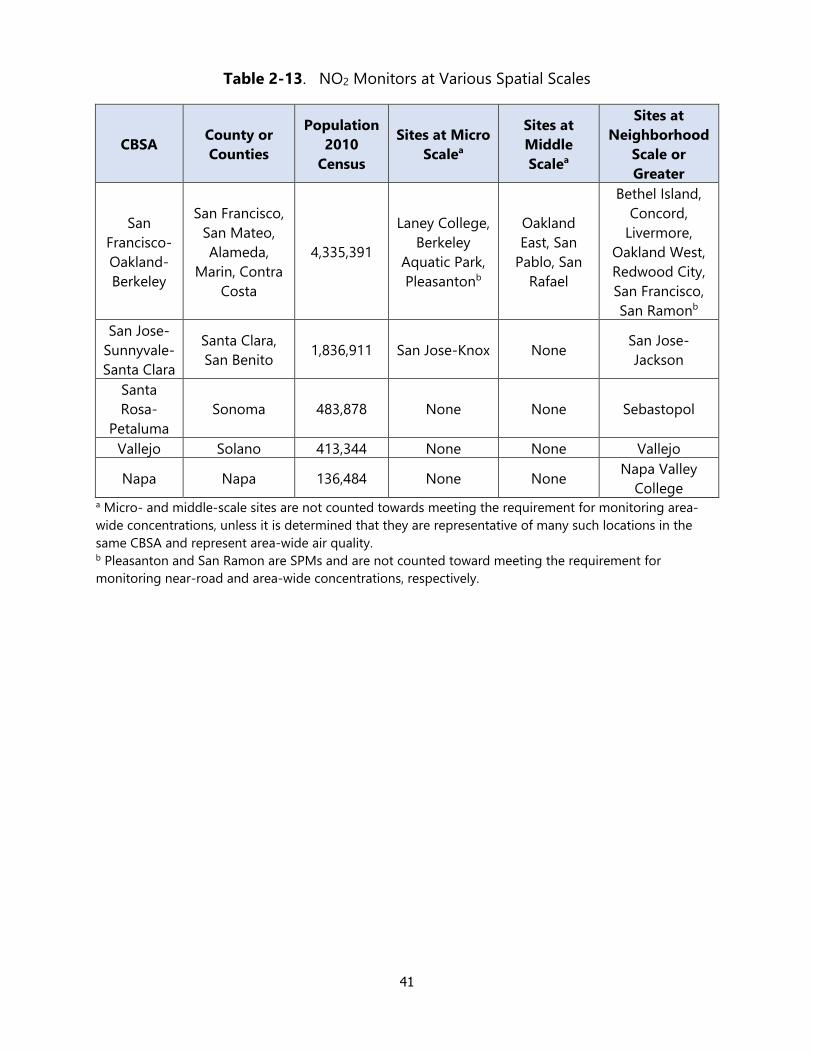
Table 2-13 shows NO2 minimum monitoring requirements by CBSA for near-road and
area-wide monitoring; Figure 2-7 is a map of the NO2 SLAMS and SPMs in the Bay Area.
Table 2-14 shows the various spatial scales of the NO2 SLAMS and SPMs in each CBSA.
NO2 monitoring at Oakland East, San Rafael, and San Pablo is middle scale based on traffic
counts and the distance between the monitors and the nearest traffic lane to the monitors.

39
Therefore, these sites, like the near-road sites, are not counted toward meeting the area-
wide requirements of 40 CFR part 58 Appendix D, §4.3.3.
In 2020, the Air District continued to meet the NO2 minimum monitoring requirements
for area-wide and Regional Administrator Required Monitoring in areas with susceptible
and vulnerable populations. The Air District also meets the near-road NO2 minimum
monitoring requirements in the San Francisco-Oakland-Berkeley CBSA with the addition
of the Berkeley Aquatic Park monitoring site.
While there have been decreases in the traffic counts in the San Jose-Sunnyvale-Santa
Clara CBSA since 2017, one road segment in the CBSA still exceeds the 250,000 AADT
threshold for a second near-road NO2 site in a CBSA. As stated in the Air District’s 2020
Network Assessment, the Air District will continue to track whether traffic amounts are
expected to remain consistently above the threshold. The existing four near road sites in
the Bay Area have higher fleet adjusted AADT, and therefore higher expected NO2
emissions than a fourth site. Therefore, given the low concentrations measured at these
existing sites, the Air District believes that the resources needed to construct and operate
a new near-road NO2 site could be deployed elsewhere with a larger benefit to public
health. The Air District will work with EPA to determine whether there are resources to
fund additions to the near-road NO2 network, or if there is discretion for a waiver given
the characterization of near road environments already occurring in the Bay Area.
NO2 Special Purpose Monitor
San Ramon is a NO2 SPM, operated as part of the Air District’s voluntary PAMS program,
and meets the requirements of 40 CFR part 58 Appendices E and A. In 2020, San Ramon
was operated year-round. Therefore, NO2 data meets the data completeness requirement
and can be compared to the NAAQS but cannot be counted towards meeting the
minimum monitoring requirements.

40
Table 2-13. Minimum Monitoring Requirements for NO2
CBSA Population
2010 Census
Maximum
AADT
(2018a)
Road Segment
for Max AADT
Near-road
Monitors
Area-wide
Monitors
Req
uire
d
Activ
e
Ad
ditio
nal
Need
ed
Req
uire
d
Activ
e
Ad
ditio
nal
Need
ed
San
Francisco-
Oakland-
Berkeley
4,335,391 291,000
Walnut Creek,
North Main St.,
Rte. 680
2 2f 0 1b 6 0
San Jose-
Sunnyvale-
Santa Clara
1,836,911 270,000 San Jose, Tully
Road, Rte. 101 2c 1d 1c 1 1 0
Santa Rosa
- Petaluma 483,878 153,000
Baker Avenue,
Rte. 101 0 0 0 0 1 0
Vallejo 413,344 232,000 Suisun Valley
Road, Rte. 80 0 0 0 0 1 0
Napa 136,484 134,000
Solano/Napa
County Line,
Rte. 80
0 0 0 0 1e 0
a Updated May 25, 2021. Maximum AADT data was taken from CalTrans estimates here: https://gisdata-
caltrans.opendata.arcgis.com/datasets/f71f49fb87b3426e9688fe66039170bc_0 b One area-wide monitor is required; additionally, the Oakland West monitoring site was selected by EPA
as one of the 40 nationwide sites for monitoring near susceptible and vulnerable populations. Since the
two requirements for this CSBA can be met by the same site, there is only one required monitor in this
CBSA. c Recent increases in traffic triggered a second required monitor in the San Jose-Sunnyvale-Santa Clara
CBSA. The Air District will continue to track whether traffic amounts are expected to remain consistently
above the threshold and will work with EPA to determine whether there are resources to fund additions to
the near-road NO2 network. d This monitor is shared with Monterey Bay Unified APCD. The monitoring agreement is in Appendix C. e NO2 at Napa is monitored at middle scale based on distance to the roadway and traffic count which cannot
be counted as an area-wide monitor. The NO2 sensor at Napa Valley College (replacement for Napa site) is
monitored at neighborhood scale. Therefore, it can be counted as an area-wide monitor. f The Pleasanton-Owens Ct. site meets siting for a near-road monitoring objective. However, the NO2
monitor at that site that is an SPM, and as such, is not counted toward fulfilling this requirement.
41
Table 2-13. NO2 Monitors at Various Spatial Scales
CBSA County or
Counties
Population
2010
Census
Sites at Micro
Scalea
Sites at
Middle
Scalea
Sites at
Neighborhood
Scale or
Greater
San
Francisco-
Oakland-
Berkeley
San Francisco,
San Mateo,
Alameda,
Marin, Contra
Costa
4,335,391
Laney College,
Berkeley
Aquatic Park,
Pleasantonb
Oakland
East, San
Pablo, San
Rafael
Bethel Island,
Concord,
Livermore,
Oakland West,
Redwood City,
San Francisco,
San Ramonb
San Jose-
Sunnyvale-
Santa Clara
Santa Clara,
San Benito 1,836,911 San Jose-Knox None
San Jose-
Jackson
Santa
Rosa-
Petaluma
Sonoma 483,878 None None Sebastopol
Vallejo Solano 413,344 None None Vallejo
Napa Napa 136,484 None None Napa Valley
College a Micro- and middle-scale sites are not counted towards meeting the requirement for monitoring area-
wide concentrations, unless it is determined that they are representative of many such locations in the
same CBSA and represent area-wide air quality. b Pleasanton and San Ramon are SPMs and are not counted toward meeting the requirement for
monitoring near-road and area-wide concentrations, respectively.

42
Figure 2-7. NO2 Monitoring in the San Francisco Bay Area in 2020
43
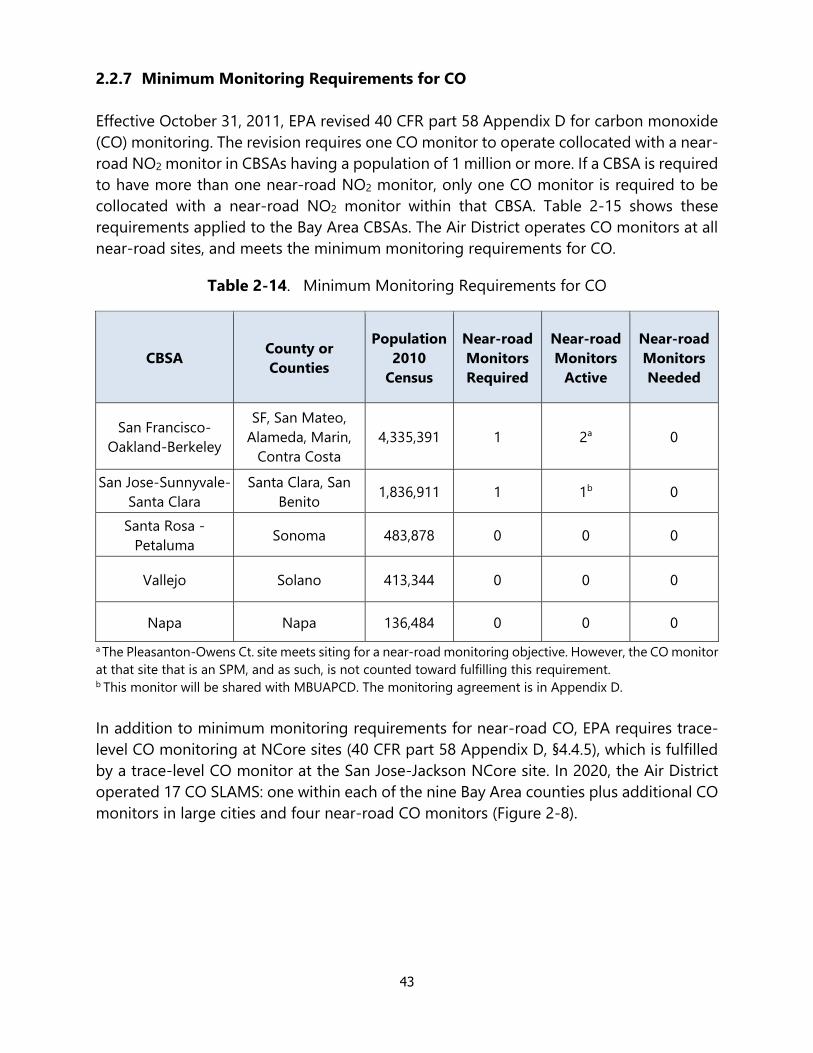
2.2.7 Minimum Monitoring Requirements for CO
Effective October 31, 2011, EPA revised 40 CFR part 58 Appendix D for carbon monoxide
(CO) monitoring. The revision requires one CO monitor to operate collocated with a near-
road NO2 monitor in CBSAs having a population of 1 million or more. If a CBSA is required
to have more than one near-road NO2 monitor, only one CO monitor is required to be
collocated with a near-road NO2 monitor within that CBSA. Table 2-15 shows these
requirements applied to the Bay Area CBSAs. The Air District operates CO monitors at all
near-road sites, and meets the minimum monitoring requirements for CO.
Table 2-14. Minimum Monitoring Requirements for CO
CBSA County or
Counties
Population
2010
Census
Near-road
Monitors
Required
Near-road
Monitors
Active
Near-road
Monitors
Needed
San Francisco-
Oakland-Berkeley
SF, San Mateo,
Alameda, Marin,
Contra Costa
4,335,391 1 2a 0
San Jose-Sunnyvale-
Santa Clara
Santa Clara, San
Benito 1,836,911 1 1b 0
Santa Rosa -
Petaluma Sonoma 483,878 0 0 0
Vallejo Solano 413,344 0 0 0
Napa Napa 136,484 0 0 0
a The Pleasanton-Owens Ct. site meets siting for a near-road monitoring objective. However, the CO monitor
at that site that is an SPM, and as such, is not counted toward fulfilling this requirement. b This monitor will be shared with MBUAPCD. The monitoring agreement is in Appendix D.
In addition to minimum monitoring requirements for near-road CO, EPA requires trace-
level CO monitoring at NCore sites (40 CFR part 58 Appendix D, §4.4.5), which is fulfilled
by a trace-level CO monitor at the San Jose-Jackson NCore site. In 2020, the Air District
operated 17 CO SLAMS: one within each of the nine Bay Area counties plus additional CO
monitors in large cities and four near-road CO monitors (Figure 2-8).

44
Figure 2-8. CO Monitoring in the San Francisco Bay Area in 2020

45
2.2.8 Minimum Monitoring Requirements for Lead
40 CFR part 58 Appendix D, §4.5(a) requires monitoring near lead sources which are
expected to or have been shown to contribute to a maximum lead concentration in
ambient air in excess of the NAAQS, taking into account the logistics and potential for
population exposure. These monitors are to be sited, considering logistics and the
potential for population oriented, where the ambient Pb concentration is expected to be
at its maximum. The applicable sources are identified by having emissions greater than
0.5 tpy for non-airport sources and greater than 1.0 tpy for airports. In the Bay Area, there
are no sources meeting this criterion according to the 2017 National Emissions Inventory
(NEI). However, 40 CFR part 58 Appendix D, §4.5(a)(iii) separately required source-oriented
monitoring near an additional 15 airports to evaluate air quality near airports with
emissions from piston engine aircraft using leaded fuel that may approach 0.50 tons per
year, including three airports in the Bay Area (Palo Alto, San Carlos, and Reid-Hillview).
One of the airport lead monitoring sites is also required to operate a collocated sampler.
40 CFR part 58 Appendix D, §4.5(a)(iii) further states that “any monitoring location that
measures a rolling 3-month average that exceeds 50 percent of the NAAQS…shall become
a required monitor according to 40 CFR 58 paragraph 4.5(c) of this appendix, and shall
continue to monitor for Pb unless a waiver is granted allowing it to stop operating as
allowed by the provisions in paragraph 4.5(a)(ii) of this appendix”.
As described below, each of the airport lead sites in the Bay Area have been either
permanently or temporarily shut down due to logistical problems beyond the District's
control that made it impossible to continue operation at their current locations. The Air
District will continue to work with EPA to determine an appropriate path forward for
airport lead monitoring.
Palo Alto Airport
The Palo Alto Airport lead monitoring site was shut down at the end of December 2014
because Santa Clara County sold the property to the city of Palo Alto. The sale triggered
FAA review of various operational plans and permits, revealing that the lead sampler
location violated FAA regulations. The Air District has been working with EPA to find a
suitable alternate location, but the Air District expects to request EPA approval of the
shutdown of the Palo Alto Airport monitoring site outside the annual network plan
process in 2021.

46
San Carlos Airport
The San Carlos Airport lead monitoring site was moved about 120 yards to the southeast
because the property owner at the original site did not renew the lease. Data collected at
the original site ended on September 13, 2013 and resumed at the new location (San
Carlos Airport II) on March 25, 2015.
As of Tuesday, April 11, 2017, the TSP-Pb monitoring at the San Carlos Airport II
monitoring site has been discontinued due to circumstances beyond the Air District’s
control. The San Carlos Airport management informed the Air District site operator on
April 11 that the Air District is no longer allowed access to the site, citing the expired lease.
The Air District has tried unsuccessfully to renegotiate the lease since November 2016.
The airport management is requiring that a shutdown provision be included in the
renewed lease. However, the Air District cannot commit to the provision, since EPA, not
the Air District, has the authority to approve the closure of the site. The Air District notified
EPA of the discontinuation on April 13, 2017. The Air District expects to request EPA
approval of the shutdown of the San Carlos Airport II monitoring site outside the annual
network plan process in 2021 considering the of the most recent 3-month averages of
lead concentrations are below 50% of the NAAQS.
Reid-Hillview Airport
The Reid-Hillview Airport lead monitor temporarily ceased operating on June 20, 2020
due to electrical hazards and the subsequent site repair. The Air District expects to request
EPA approval of the shutdown of the Reid Hillview monitoring site outside the annual
network plan process in 2021 considering the most recent 3-month averages of lead
concentrations are below 50% of the NAAQS.
Figure 2-9 shows the lead SLAMS in the San Francisco Bay Area in 2020. Minimum
monitoring requirements for source-oriented lead at airports and collocation
requirements are provided in Table 2-14 and Table 2-15.
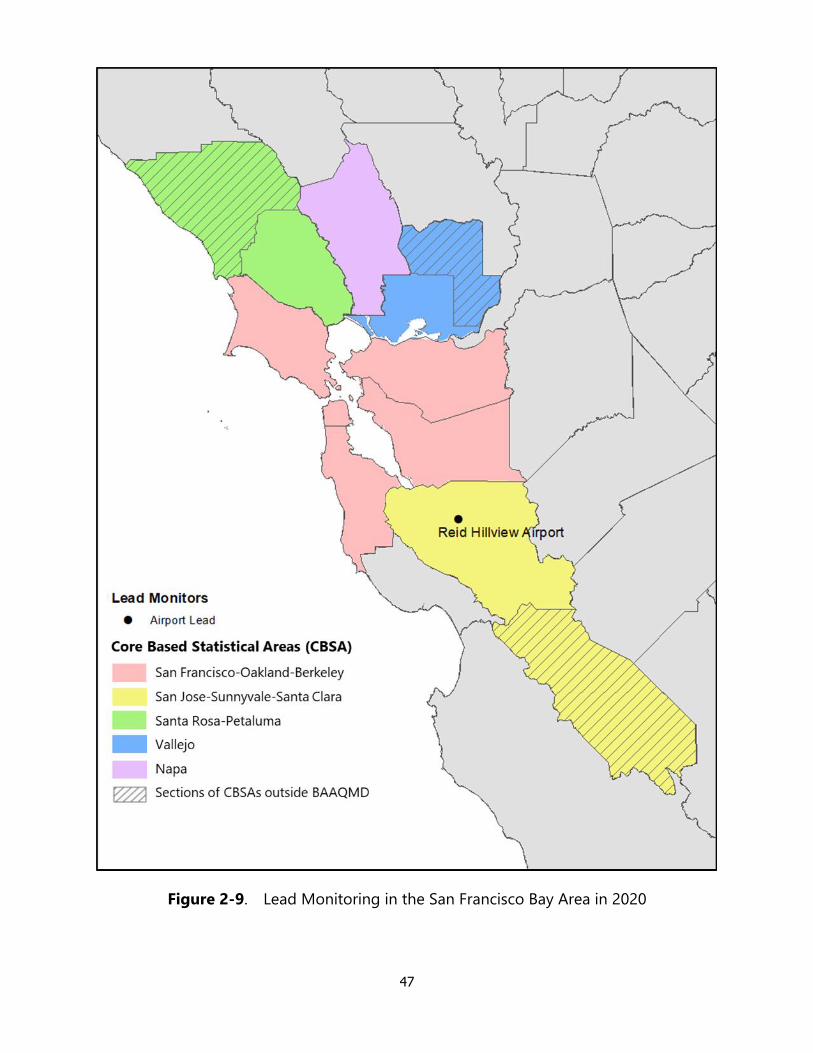
47
Figure 2-9. Lead Monitoring in the San Francisco Bay Area in 2020

48
Table 2-15. Source Oriented Lead Monitoring at Airports
Source
Name Address
Lead
Emissions
(tons/yr)
2017 NEI
Number of SLAMS
Required Active Additional
Needed
San Carlos
Airport
620 Airport Way
San Carlos 94070 0.30 1 0a 1a
Palo Alto
Airport
1925 Embarcadero Rd.
Palo Alto 94303 0.48 1 0b 1b
Reid-Hillview
Airport
2500 Cunningham Ave.
San Jose 95148 0.37 1 1c 0
a The San Carlos Airport II monitor began operation on March 25, 2015. On Tuesday, April 11, 2017, the
San Carlos Airport II monitor was shut down due to an expired lease and the inability to come to terms
with a new lease. b The Palo Alto Airport monitor was shut down in December 2014, after it was found to violate FAA
regulations and would therefore need to be relocated. EPA and the Air District have been working
together to identify a suitable location so that lead monitoring can resume at this airport, but the Air
District has decided to request approval to shutdown the monitoring site. c The Reid-Hillview Airport monitor temporarily ceased operating on June 20, 2020.
Table 2-16. Collocated Source Oriented Lead Monitoring at Airports
Source
Name Address
Lead
Emissions
(tons/yr)
2017 NEI
Collocated
Monitors
Required
Active
Monitors
Additional
Monitors
Needed
San Carlos
Airport
620 Airport Way
San Carlos 94070 0.30 1 0a 1a
a The San Carlos Airport II sampler began operation on March 25, 2015. On Tuesday, April 11, 2017, the San
Carlos Airport II monitor was shut down due to an expired lease and the inability to come to terms with a
new lease.

49
2.3 Modifications Made to the Network in 2020
Bethel Island - PM10
On March 16, 2020, the Air District closed the PM10 SPM monitor at Bethel Island in
order to consolidate Air District resources. 40 CFR 58.11 (c) states that “SPM stations do
not require approvals, but a change in the designation of a monitoring site from SLAMS
to SPM requires approval of the Regional Administrator”. EPA previously approved the
change in designation from a SLAMS to SPM in 2013. Therefore, EPA approval is not
required for the discontinuation of the PM10 SPM at Bethel Island.
Reid-Hillview – Lead
On June 20, 2020, the Air District temporarily close the Lead (TSP) monitor at the Reid-
Hillview Airport due to electrical hazards and the subsequent site repair.
2.4 Proposed Modifications to the Network in 2021–2022
Napa Valley College Relocation
On February 26, 2021, the Napa Valley Community College District notified the Air
District that due to scheduled construction of the Napa Valley College’s student housing
project, the BAAQMD air monitoring station could no longer remain at the site beyond
June 1, 2021, and the lease was being terminated. As such, in 2021 the Air District will be
seeking approval for a site relocation under 40 CFR 58.14 (c)(6), which states that sites
“may be moved to a nearby location with the same scale of representation if logistical
problems beyond the State's control make it impossible to continue operation at its
current site”. The Air District will work with EPA to find a suitable relocation site.
Community Monitoring Near Refineries
During the Regulation 12, Rule 15 rulemaking process, the Air District committed to
conducting additional monitoring in communities near refineries, funded by fees paid
by the facilities, per Regulation 3.
In 2018, the Air District conducted workshops to ask for public input on the cumulative
impacts experienced in these areas. The Air District is evaluating the information
submitted by the public, along with the most up-to-date source location, emissions,
modeling, and ambient monitoring data to determine the best monitoring locations to
further evaluate the exposure the nearby communities are experiencing and will
continue looking for places that logistically accommodate enhanced monitoring in these
communities throughout 2021 and 2022.

50
Livermore Relocation and PAMS
The Air District is required to operate a core PAMS site beginning June 2021. EPA
approved a waiver for the Air District to fulfill this requirement at the Livermore site
rather than the San Jose – Jackson site since the Livermore site is critical for the Bay Area
regional ozone modeling. PAMS measurements are planned to start in fall of 2021. See
Section 5.4 and Appendix G for additional details.
The Air District is also requesting approval for the relocation of the Livermore
monitoring site to a nearby location. The existing location will be demolished to make
way for a mixed-use development project. 40 CFR 58.14(c)(6) states that monitoring
sites “may be moved to a nearby location with the same scale of representation if
logistical problems beyond the State’s control make it impossible to continue operation
at its current site”. The proposed new location will be located 0.75 miles to the east near
Lawrence Elementary School at 2451 Portola Avenue Livermore, CA and is expected to
be at the same scale of representation; measuring similar concentrations from similar
sources. Furthermore, the relocation will not compromise data collection needed for
implementation of the NAAQS and all requirements in 40 CFR part 58 Appendices D and
E will continue to be met. Figure 2-10 shows the overlapping spatial scales of
representation (neighborhood – 4 km) for both the existing and proposed new
locations. Due to short distance from the existing location, the Air District also requests
that the new site maintain the existing AQS ID (06-001-0007). If a new AQS ID is
recommended, the Air District requests that data from the new and existing sites be
combined for purposes of design value calculations.
Figure 2-10 Existing and Proposed Site for Livermore Relocation

51
2.5 Removing a NAAQS Compliance Monitor
When the Air District proposes changes to the air monitoring network, the proposed
changes are included in the Annual Monitoring Network Plan. The Annual Monitoring
Network Plan is posted on the Air District website for 30 days for public comment on
the proposed changes. After the public comment period, the Air District reviews and
considers the comments before making a final decision on a change to air monitoring
network. The Air District submits the Annual Monitoring Network Plan with public
comments to the EPA Region 9 Regional Administrator by July 1 each year.
Before shutting down a SLAMS (State or Local Air Monitoring Station) monitor, 40 CFR
part 58.14(c) requires that the Air District obtain the Regional Administrator’s written
approval. The Regional Administrator will normally approve the shutdown of a SLAMS
monitor when any of the following situations apply:
1. Criteria pollutant monitors which have shown attainment of the national
standards during the previous five years may be removed if the probability is less
than 10% that the monitor will exceed 80% of NAAQS during the next three
years, and if the monitor is not required by an attainment or maintenance plan.
2. CO, PM10, SO2, or NO2 monitors not required by an attainment or maintenance
plan may be removed if the monitor has shown consistently lower concentrations
than another monitor for the same pollutant in the same county during the
previous five years and is expected to remain higher during the following five
years given expected implementation of control measures in the area.
3. Criteria pollutant monitors that have not violated the national standards in the
most recent five years may be removed if the State Implementation Plan (SIP)
provides a method of representing the air quality in the applicable county in the
absence of monitoring.
4. PM2.5 monitors may be removed when EPA determines that measurements are
not comparable to the relevant NAAQS because of siting issues in accordance
with 40 CFR 58.30.
5. Criteria pollutant monitors that are located upwind of an urban area to
characterize transport into the area may be removed if the monitor has not
recorded violations of the relevant NAAQS in the previous five years and the
monitor is being replaced by another monitor characterizing transport.
6. Criteria pollutant monitors not eligible for removal under any of the above
criteria may be relocated to a nearby location with the same scale of
representation if logistical problems beyond the agency’s control make it
impossible to continue operation at its current site.

52
EPA may also approve other requests for discontinuation on a case-by-case basis if
discontinuance does not compromise data collection needed for implementation of a
NAAQS and if the requirements of 40 CFR part 58 Appendix D continue to be met.
The closure of an SPM does not require approval from EPA (see 40 CFR 58.20(f)), but
changing the monitor type from SLAMS to SPM requires approval of the Regional
Administrator.
2.6 Data Submission Requirement
After all data review procedures are complete, the Air District submits monthly air
quality and associated precision and accuracy reports to the EPA AQS database within
90 days of the end of every month. By May 1 each year, the Air District submits a data
certification letter to Region 9 stating that the previous calendar year of data is
complete and correct. The certification letter for 2020 data was submitted to EPA Region
9 on April 30, 2021.

53
3. SPECIAL MONITORING PROGRAMS
3.1 NCore Program
In October 2006, EPA revised 40 CFR parts 53 and 58 to establish the National Core
multi-pollutant monitoring stations (NCore) program. These sites replace the National
Air Monitoring Station (NAMS) network that previously existed and are intended to be
long-term sites useful for a variety of applications including air quality trends analyses,
model evaluation, and tracking metropolitan area statistics at a national level. NCore
sites must measure PM2.5 particle mass using continuous and integrated/filter-based
samplers, speciated PM2.5, PM10-2.5 particle mass, O3, SO2, CO, NO/NOY, wind speed,
wind direction, relative humidity, and ambient temperature.
EPA designed the national NCore network to have a mixture of urban and rural sites. In
California, EPA required numerous sites in the state that would represent a large urban
area. Recommendations for locating NCore urban sites are found in 40 CFR part 58
Appendix D, and other EPA publications:
• Urban NCore stations are to be located at neighborhood or urban scale to
provide representative exposure levels throughout the metropolitan area
population.
• Urban NCore stations should be located where significant pollution levels exist.
• Population oriented monitoring is highly recommended.
• No biasing local pollutant emission sources should be within 500 meters at urban
stations.
• Collocation with other network programs (such as NATTS, CSN, CASTNET,
IMPROVE, NADP, PAMS) is encouraged.
• Siting of monitors at NCore sites must meet SLAMS requirements as specified in
40 CFR Part 58.
EPA and the Air District cooperatively agreed to establish a NCore site in San Jose
effective January 1, 2011. San Jose was chosen as the NCore site because it is the city
with largest population in the Bay Area with nearly one million residents based on 2010
census data. Exceedances of both the ozone and 24-hour PM2.5 national standards have
been measured in San Jose. Consequently, operating an NCore station in the San Jose
area meets the requirement of being in an urban area with significant air pollution
problems.
San Jose is located in the southern part of the Bay Area and lies within the Santa Clara
Valley. Wind patterns in the Santa Clara Valley are influenced greatly by the terrain,
resulting in a prevailing flow roughly parallel to the valley's northwest-southeast

54
orientation. During the daytime a sea breeze commonly carries pollutants from San
Francisco, San Mateo, and Alameda counties southward into the Santa Clara Valley,
while a drainage flow carrying pollutants toward the bay, in the opposite direction,
occurs during the nighttime hours.
The monitoring objective for the current San Jose – Jackson monitoring site is
population exposure and a neighborhood spatial scale and is intended to represent air
quality levels over a large area having a high population density. Consequently, the site
cannot be too close to large emission sources such as industrial sources or highways,
and the surrounding land use should be relatively uniform. Table 3-1 shows the location
of the current San Jose monitoring station, and a 4-km circle around the site
representing a neighborhood scale area.
Figure 3-1 Map showing area of Neighborhood Scale at the San Jose NCore station
The map shows that the current station is in a residential/commercial area of San Jose.
The station is located on Jackson Street, 1.6 km northwest of the downtown core. The
Air District has operated air monitoring sites at various locations near downtown San
Jose since 1968, and the current station has been in operation since 2002. The
downtown area is encircled by freeways, but the closest freeway to the air monitoring
station is 800 meters to the west-southwest, which is sufficiently distant to prevent
vehicular emissions from dominating the general air quality at the site. There are no
large point sources within 500 meters of the site. The only significant point source
emissions within a 4-km radius of the San Jose- Jackson air monitoring site are:

55
• The Norman Y. Mineta San Jose International Airport, located from 2-4 km NW of
the site, is a significant source. The airport averaged 250 commercial and 81
general aviation departures and landings per day in 2015.
• Reed & Graham, Inc. (an asphalt batch plant), located 3.7 km SSW of the site.
• Central Concrete Supply Company, Inc., located 1.9 km SSW of the site.
• San Jose State University Cogeneration Plant, located 2.6 km SSE of the site.
The station currently monitors all criteria pollutants, criteria pollutant precursors, and
toxics. In addition to the NCore network, the site is part of the EPA STN network.
Starting July 1, 2018, the San Jose Jackson air monitoring station is no longer part of
NATTS program.
3.1.1 NCore Monitors
Table 3-1 lists the NCore monitors operating at the San Jose Jackson station including
the sampling methodology, sampling frequency, and spatial scale. Because ambient
concentrations of CO and SO2 are well below the NAAQS at population-oriented sites
across the U.S., EPA requires NCore sites to use higher sensitivity instruments than
conventional instruments for these pollutants (note the use of Trace Level-Enhanced
(TLE) type instruments for CO and SO2). PM10-2.5 is measured using the difference
between measurements of a pair of Partisol-Plus Model 2025 Sequential samplers, with
one configured as a PM2.5 sampler and the other configured as a PM10 sampler.
On March 10, 2016, EPA issued a final rule revising monitoring requirements in 40 CFR
Part 58. As a result, lead monitoring at NCore sites is not required after April 27, 2016.
In March 2014, the Air District requested a waiver to discontinue NOy monitoring at San
Jose because the past three years of data showed an insignificant statistical difference
between NOx and NOy and was approved by the EPA (see Appendix E). Under this
approval, the District plans to monitor NOy at Livermore in the fall of 2021 and this site
will become the official PAMS site in the Bay Area.

56
Table 3-1 NCore Monitors
Pollutant Monitoring Method Sampling
Frequency Spatial Scale
CO (trace level) TECO 48i TLE Continuously Neighborhood
O3 TECO 49i Continuously Neighborhood
SO2 (trace level) TECO 43i TLE Continuously Neighborhood
PM2.5 – filter-based FRM Partisol-Plus 2025 w/VSCC 1:3 Neighborhood
PM2.5 – continuous FEM Met One FEM BAM 1020 Continuously Neighborhood
PM2.5 Speciation Met One SASS 1:3 Neighborhood
NOy API 200EU/NOy Continuously Neighborhood
NO (from NOy Analyzer) API 200EU/NOy Continuously Neighborhood
PM10-2.5
Partisol-Plus 2025
Sequential PM10-2.5 Air
Sampler Pair
1:3 Neighborhood
Meteorological n/aa Continuously n/a a EPA approved a waiver to use meteorological data from the San Jose Airport as official data for the
NCore site.
3.2 PM2.5 Chemical Speciation Network
In 1997, the EPA established national 24-hour and annual standards for fine particles
less than or equal to 2.5 microns in diameter, known as PM2.5, and required each state
and local agency to begin ambient monitoring using FRM samplers. EPA also
established a network of chemical speciation monitors to provide information for the
development of control strategies in implementation plans and then to track the success
of the plans. This monitoring program is known as the Chemical Speciation Network
(CSN).
Speciation monitors provide chemical composition of PM2.5, which aides in identification
of emissions sources. Some CSN sites were designated as long-term trend sites
predominately located in large urban areas. Such sites are part of the Speciation Trends
Network (STN) to study longer term trends in the chemical composition of PM2.5. Other
sites in the CSN program are known as CSN supplemental sites.
STN monitoring has the primary objective of defining concentration trends of the
elements, ions, and organic and elemental carbon components of PM2.5. In January
1999, a PM2.5 FRM sampler was installed in San Jose and the first year of data showed
exceedances of the national standard. Consequently, EPA requested that a Met One
Spiral Ambient Speciation Sampler (SASS) be installed at the San Jose monitoring site
(which was located on Fourth Street at the time) as part of the STN program because
the site is in a major urban area. The site was relocated to Jackson Street in 2002. The
57
sampler operates 24 hours, from midnight to midnight, and samples are collected on a
1:3 schedule.
In April 2005, the Clean Air Scientific Advisory Committee supported changes to the EPA
PM2.5 speciation network to improve comparability with the rural Interagency
Monitoring of Protected Visual Environments (IMPROVE) PM2.5 carbon concentration
data. The EPA process, designed to achieve this comparability, included replacing the
carbon sampling method with the IMPROVE carbon Thermal Optical Reflectance (TOR)
analysis method instead of the Thermal Optical Transmittance (TOT) method.
Additionally, the EPA also requested the manufacturer of the IMPROVE sampler, URG
Corporation, to modify the sampler to incorporate mass flow control versus fixed-orifice
flow control. This effort resulted in a new instrument called the URG-3000N Sequential
Particulate Speciation System. In the Bay Area, the Air District began operating the URG
3000 to collect PM2.5 carbon concentrations at San Jose - Jackson starting on April 1,
2009, while continuing to operate the SASS sampler to collect all the other compounds.
Filters collected by the SASS and URG-3000 samplers are later analyzed using energy-
dispersive X-ray fluorescence, ion chromatography, and thermal/optical analysis
techniques to measure metals, anions and cations, and carbon (elemental and organic)
components, respectively. The STN filters are analyzed by an EPA national contract
laboratory. The sixty-five chemical species measured are listed in Table 3-2 and can be
viewed on the EPA’s AirData website at http://www.epa.gov/airdata/ad_maps.html.
3.2.1 BAAQMD Supplemental PM2.5 Speciation Network Program
The Air District added SASS samplers to existing air monitoring sites at Vallejo and
Livermore in 2008 and at the Oakland West site in 2009. These samplers are not part of
the national CSN program but contribute to local monitoring objectives. Vallejo and
Livermore were selected for sampling because there was an interest in determining the
sources of PM2.5 on days that exceed the standard at those sites, since exceedances can
often occur on days when the air flow is from the Central Valley. These sites may have a
different PM2.5 composition than at San Jose – Jackson. Oakland West was selected
because it is downwind of the Port of Oakland, a major source of diesel particulate
matter. The Air District operates these samplers on a 1:6 schedule. Prior to 2015, DRI
provided the filters, did the analysis, and submitted the data to AQS; and the filters were
also analyzed for palladium, thallium and uranium. Starting with data collected in
January 2015, the Air District’s laboratory staff have prepared the filters and performed
the analysis.

58
Table 3-2 PM2.5 Speciation Measurements at Air District Sites in 2020
Compound Parameter
Code at San Jose
Parameter Code at
Other Sites
Method Code
at San Jose
Method Code at Other Sites
Metals
Aluminum 88104 88104 811 811
Antimony 88102 88102 811 811
Arsenic 88103 88103 811 811
Barium 88107 88107 811 811
Bromine 88109 88109 811 811
Cadmium 88110 88110 811 811
Calcium 88111 88111 811 811
Chromium 88112 88112 811 811
Cobalt 88113 88113 811 811
Copper 88114 88114 811 811
Chlorine 88115 88115 811 811
Cerium 88117 88117 811 811
Cesium 88118 88118 811 811
Indium 88131 88131 811 811
Iron 88126 88126 811 811
Lead 88128 88128 811 811
Manganese 88132 88132 811 811
Molybdenum 88134 88134 811 811
Magnesium 88140 88140 811 811
Mercury 88142 88142 811 811
Nickel 88136 88136 811 811
Phosphorous 88152 88152 811 811
Potassium 88180 88180 811 811
Rubidium 88176 88176 811 811
Selenium 88154 88154 811 811
Silicon 88165 88165 811 811
Silver 88166 88166 811 811
Sodium 88184 88184 811 811
Strontium 88168 88168 811 811
Sulfur 88169 88169 811 811
Tin 88160 88160 811 811
Titanium 88161 88161 811 811
Vanadium 88164 88164 811 811
Yttrium 88183 88183 811 811
Zinc 88167 88167 811 811
Zirconium
88185 88185 811 811
Anions and Cations

59
Compound Parameter
Code at San Jose
Parameter Code at
Other Sites
Method Code
at San Jose
Method Code at Other Sites
Ammonium Cation 88301 88301 812 812
Sodium Cation 88302 88302 812 812
Chloride Anion 88203 88203 812 812
Sulfate Anion 88403 88403 812 812
Potassium Cation 88303 88303 812 812
Nitrate Anion 88306 88306 812 812
Organic and Elemental Carbon
Total Organic Carbon (sum of the OC Fractions below)
88370 88320 838 815
Elemental Carbon Fraction 1 (carbon released at 550ºC in 10%
oxygen/90% helium gas) 88383 88329 841 814
Elemental Carbon Fraction 2 (carbon released at 700ºC in 10%
oxygen/90% helium gas) 88384 88330 841 814
Elemental Carbon Fraction 3 (carbon released at 800ºC in 10%
oxygen/90% helium gas) 88384 88331 841 814
Organic Carbon Fraction 1 (carbon released at 120ºC in helium gas)
88374 88324 841 814
Organic Carbon Fraction 2 (carbon released at 250ºC in helium gas)
88375 88325 841 814
Organic Carbon Fraction 3 (carbon released at 450ºC in helium gas)
88376 88326 841 814
Organic Carbon Fraction 4 (carbon released at 550ºC in helium gas)
88377 88327 841 814
3.3 Photochemical Assessment Monitoring Stations
This section describes the Air District’s unofficial Photochemical Assessment Monitoring
Stations (PAMS) monitoring in 2020. For a discussion of upcoming changes to the Air
District’s PAMS monitoring to meet new EPA requirements under 40 CFR part 58
Appendix D, §5(a), please see Appendix H.
The 1990 Clean Air Act Amendments required EPA to promulgate rules for the enhanced
monitoring of ozone and its precursors (NO/NO2 and VOCs) to collect information to
address the continued nonattainment of the NAAQS for ozone nationwide. Subsequent
revisions to EPA’s Air Monitoring regulations, 40 CFR part 58, required air pollution
agencies to establish PAMS in ozone nonattainment areas classified as serious, severe,
or extreme. The Bay Area is not in any of these categories but is in marginal
nonattainment of the ozone NAAQS. However, the Air District chose to voluntarily
conduct unofficial-PAMS monitoring to collect data that would improve our
understanding of ozone formation in the area, which could be used to improve air
quality forecasting and management activities. Monitoring began in 2010 (at Livermore)
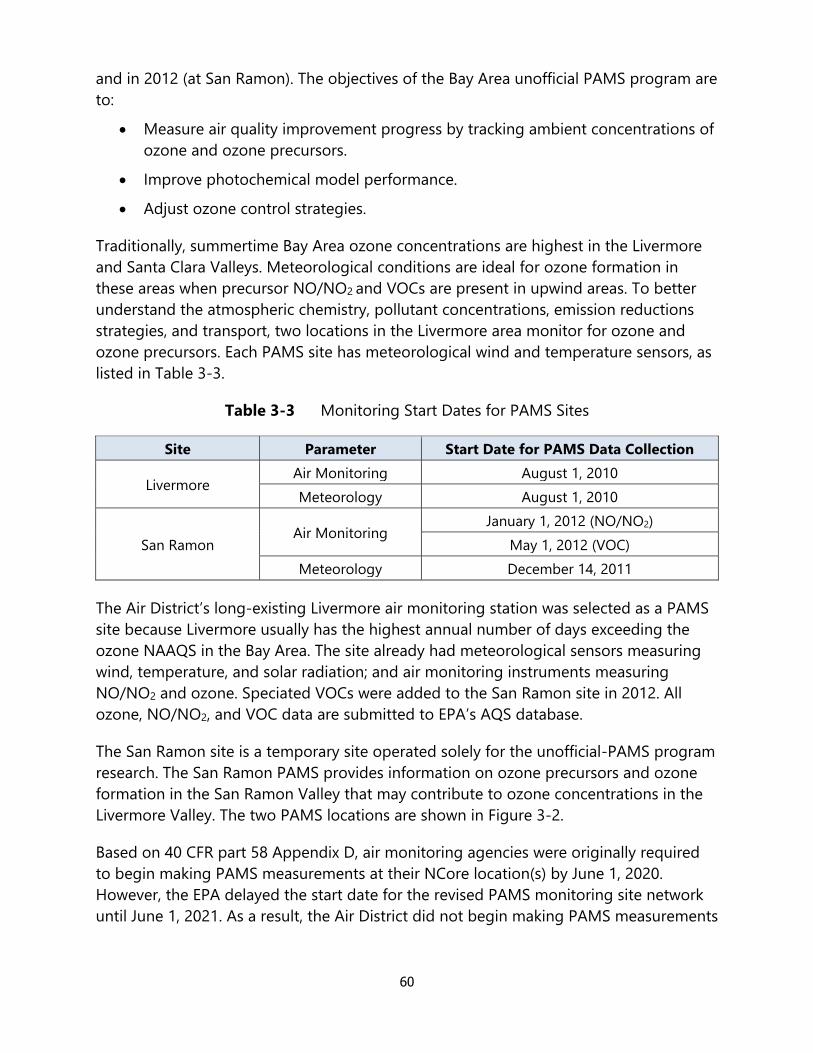
60
and in 2012 (at San Ramon). The objectives of the Bay Area unofficial PAMS program are
to:
• Measure air quality improvement progress by tracking ambient concentrations of
ozone and ozone precursors.
• Improve photochemical model performance.
• Adjust ozone control strategies.
Traditionally, summertime Bay Area ozone concentrations are highest in the Livermore
and Santa Clara Valleys. Meteorological conditions are ideal for ozone formation in
these areas when precursor NO/NO2 and VOCs are present in upwind areas. To better
understand the atmospheric chemistry, pollutant concentrations, emission reductions
strategies, and transport, two locations in the Livermore area monitor for ozone and
ozone precursors. Each PAMS site has meteorological wind and temperature sensors, as
listed in Table 3-3.
Table 3-3 Monitoring Start Dates for PAMS Sites
Site Parameter Start Date for PAMS Data Collection
Livermore Air Monitoring August 1, 2010
Meteorology August 1, 2010
San Ramon Air Monitoring
January 1, 2012 (NO/NO2)
May 1, 2012 (VOC)
Meteorology December 14, 2011
The Air District’s long-existing Livermore air monitoring station was selected as a PAMS
site because Livermore usually has the highest annual number of days exceeding the
ozone NAAQS in the Bay Area. The site already had meteorological sensors measuring
wind, temperature, and solar radiation; and air monitoring instruments measuring
NO/NO2 and ozone. Speciated VOCs were added to the San Ramon site in 2012. All
ozone, NO/NO2, and VOC data are submitted to EPA’s AQS database.
The San Ramon site is a temporary site operated solely for the unofficial-PAMS program
research. The San Ramon PAMS provides information on ozone precursors and ozone
formation in the San Ramon Valley that may contribute to ozone concentrations in the
Livermore Valley. The two PAMS locations are shown in Figure 3-2.
Based on 40 CFR part 58 Appendix D, air monitoring agencies were originally required
to begin making PAMS measurements at their NCore location(s) by June 1, 2020.
However, the EPA delayed the start date for the revised PAMS monitoring site network
until June 1, 2021. As a result, the Air District did not begin making PAMS measurements

61
at the Livermore site in 2020, and will work with EPA to begin measurements on in the
fall of 2021.
Figure 3-2 Map of the Two PAMS sites in the Livermore Valley
Prior to November 2013, EPA identified 57 ozone precursor compounds usually
measured at PAMS locations because of their significance in photochemical ozone
pollution. On November 20, 2013, EPA released a memo
(http://www.epa.gov/ttn/amtic/files/ambient/pams/targetlist.pdf) revising the
photochemical assessment monitoring station compound target list. The revisions divide
the previous list into two categories: priority compounds and optional compounds. In
addition, seven new compounds were added to the priority list, for a total of 34 priority
compounds and 29 optional compounds.
The Air District measures 56 compounds every hour using a gas chromatograph (GC)
instrument. The GC does not analyze for two compounds EPA considers important
ozone precursors: formaldehyde and acetone. The Air District determined that it is too
costly to measure these compounds on an hourly basis. In addition, the GC does not
measure the new priority compounds identified in the November 2013 EPA memo, α/β-
Pinene, 1,3 Butadiene, benzaldehyde, carbon tetrachloride, ethanol, and
tetrachloroethylene. However, the GC does measure two additional compounds not on
the EPA target list, 1-hexene and n-dodecane. Table 3-4 lists the 56 compounds
measured by the GC. The Air district operated the GC at Livermore and San Ramon from
April to November in 2020. The ozone and NO/NO2 monitors operate year-round
starting in 2019 at both sites.
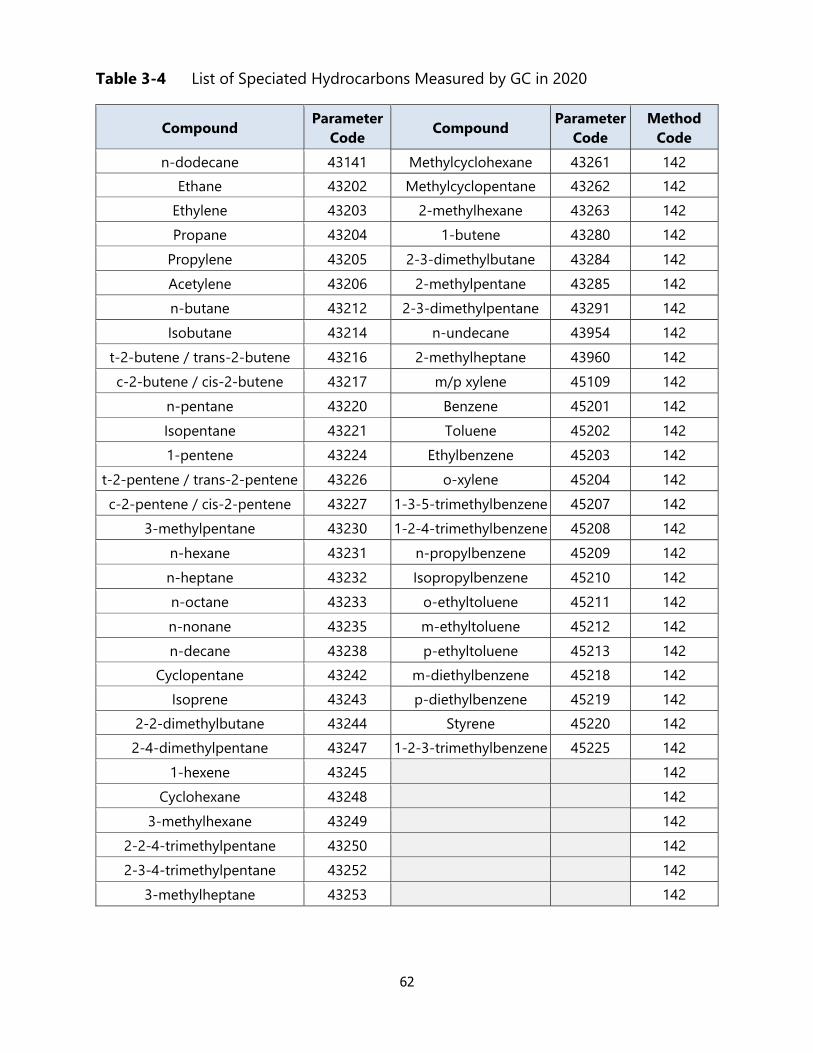
62
Table 3-4 List of Speciated Hydrocarbons Measured by GC in 2020
Compound Parameter
Code Compound
Parameter
Code
Method
Code
n-dodecane 43141 Methylcyclohexane 43261 142
Ethane 43202 Methylcyclopentane 43262 142
Ethylene 43203 2-methylhexane 43263 142
Propane 43204 1-butene 43280 142
Propylene 43205 2-3-dimethylbutane 43284 142
Acetylene 43206 2-methylpentane 43285 142
n-butane 43212 2-3-dimethylpentane 43291 142
Isobutane 43214 n-undecane 43954 142
t-2-butene / trans-2-butene 43216 2-methylheptane 43960 142
c-2-butene / cis-2-butene 43217 m/p xylene 45109 142
n-pentane 43220 Benzene 45201 142
Isopentane 43221 Toluene 45202 142
1-pentene 43224 Ethylbenzene 45203 142
t-2-pentene / trans-2-pentene 43226 o-xylene 45204 142
c-2-pentene / cis-2-pentene 43227 1-3-5-trimethylbenzene 45207 142
3-methylpentane 43230 1-2-4-trimethylbenzene 45208 142
n-hexane 43231 n-propylbenzene 45209 142
n-heptane 43232 Isopropylbenzene 45210 142
n-octane 43233 o-ethyltoluene 45211 142
n-nonane 43235 m-ethyltoluene 45212 142
n-decane 43238 p-ethyltoluene 45213 142
Cyclopentane 43242 m-diethylbenzene 45218 142
Isoprene 43243 p-diethylbenzene 45219 142
2-2-dimethylbutane 43244 Styrene 45220 142
2-4-dimethylpentane 43247 1-2-3-trimethylbenzene 45225 142
1-hexene 43245 142
Cyclohexane 43248 142
3-methylhexane 43249 142
2-2-4-trimethylpentane 43250 142
2-3-4-trimethylpentane 43252 142
3-methylheptane 43253 142

63
3.4 Toxics Program
The Clean Air Act Amendments of 1990 required EPA to set emission standards for
major sources of Hazardous Air Pollutants (HAPs). The Act also required EPA to assess
the risks to human health from HAPs. As of 2012 EPA had listed 187 compounds as
HAPs and are known to cause or are suspected of causing cancer, birth defects,
reproduction problems, and other serious illnesses. Exposure time to certain levels of
some HAPs can cause difficulty in breathing, nausea, or other illnesses and can even
cause death.
HAPs are emitted daily by industrial and chemical manufacturing processes, commercial
activities, refinery operations, gasoline marketing, and motor vehicles within the Bay
Area. Ambient concentrations vary by proximity to sources and current meteorological
conditions. The toxics monitoring program has the following objectives:
• Establishing trends and evaluating the effectiveness of HAP reduction strategies.
• Characterizing ambient concentrations in local areas.
• Providing data to support and evaluate dispersion and deposition models.
• Providing data to the scientific community to support studies to reduce
uncertainty about the relationships between ambient levels of HAPs, actual
human exposure to air toxics, and health effects from such exposures.
Figure 3-3 is a map of the 23 toxics monitoring sites operating in 2020. They are located
at existing Air District monitoring sites to measure a wide range of contaminant levels
throughout the Bay Area. The sites are generally located in major population centers or
downwind of major industrial sources such as refineries. There is also an ambient
background site at Fort Cronkhite.
Air samples are collected at Air District toxics monitoring sites for a 24-hour period on a
1:12 schedule. At San Jose - Jackson, the sampling schedule was on a 1:6 as part of the
NATTS program through August 6, 2018 and was changed to a 1:12 starting August 18,
2018 because this site is no longer part of the NATTS program. A 1:12 schedule allows
samples to be taken on a different day of the week over the course of months. This is
the same schedule EPA and CARB use for their toxics monitoring programs, thereby
allowing Bay Area toxics concentrations to be compared to concentrations measured
elsewhere across the country.
Gaseous VOC toxics are collected in 6-liter SUMMA stainless steel canisters using
Xontech 910 samplers. The sampler continuously collects an ambient air sample for 24-
hours to ensure capturing transient and intermittent toxic releases. Since 2012, samples
have been analyzed using gas chromatography mass spectrometry.
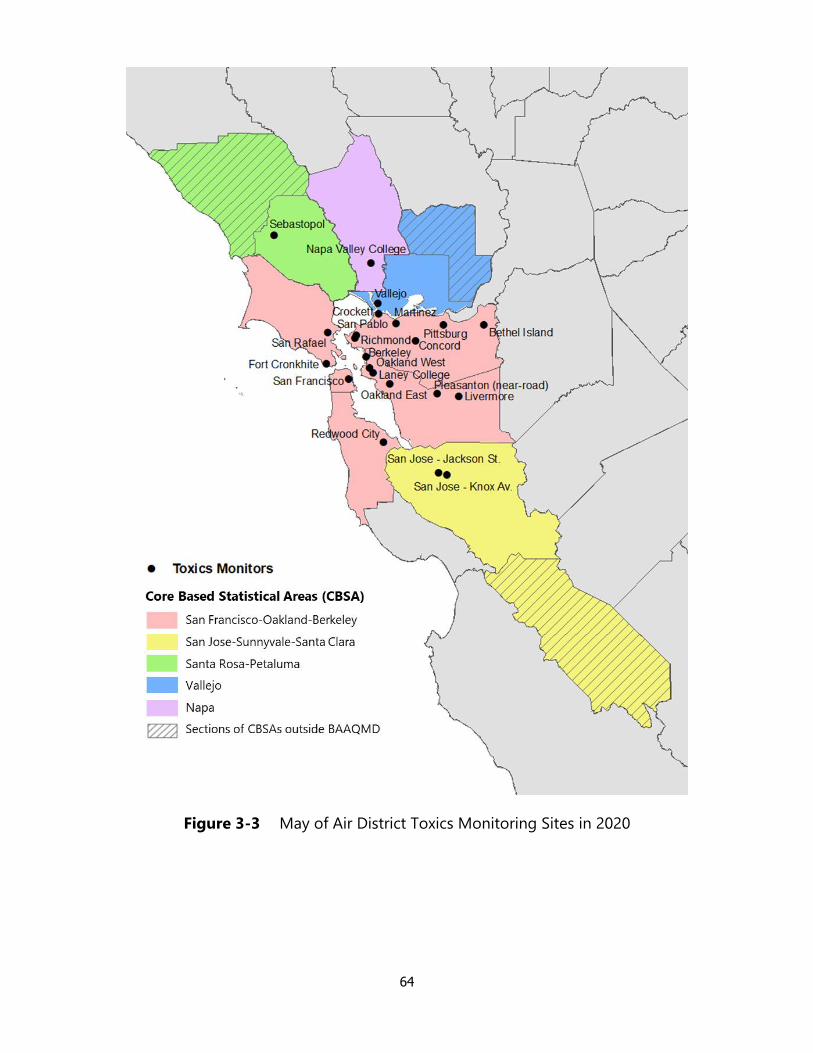
64
Figure 3-3 May of Air District Toxics Monitoring Sites in 2020

65
Both the Air District and CARB have toxics monitoring programs in the Bay Area. CARB
conducts toxics monitoring on a 1:12 schedule at two sites: San Francisco and San Jose.
CARB supplies the canisters and performs the laboratory analyses, while Air District staff
operates the CARB sampler and ships the canisters to CARB. Because the Air District also
does toxics monitoring at San Francisco and San Jose, the two sets of data allow
calculation of the measurement precision at these sites, and by extrapolation, an
estimate of the precision of the toxics measurement program.
For quality assurance purposes, once a quarter at San Francisco, an additional canister
sample is taken on a scheduled sample day using a collocated sampler. Both samples
are analyzed by the Air District laboratory, and the results allow an additional measure
of precision. Additionally, at least one canister per month is chosen at random for a
second analysis. The results are submitted to AQS for both the San Francisco collocated
sample and the randomly selected replicate analysis.
From each canister sample, the Air District laboratory analyzes for the 22 gaseous toxic
compounds shown in Table 3-5 from canister samples collected using a gas
chromatography mass spectrometry instrument. The compounds selected for analysis
were those that had high toxicity or were known to have high emissions in the Bay Area,
or a combination of the two. Another consideration was whether the current
methodology could accurately detect a compound at reasonable expense, based on
previous CARB studies. Some compounds, such as carbon tetrachloride, are measured
because their concentrations do not change much over time. This is useful because
carbon tetrachloride or other similar, stable compounds can be used for quality control
purposes. If the measurement of such a control is unusually high or low, there may be a
problem in the sampling, transport, storage, or analysis procedures.

66
Table 3-5 List of Toxic Compounds Measured by the Air District in 2020
Compound Parameter
Code Compound
Parameter
Code
Method
Code
1,3-Butadiene 43218 Ethylene dichloride 43815 210
Acetone 43551 Freon 113 43207 210
Acetonitrile 43702 m/p Xylene 45109 210
Acrylonitrile 43704 Methyl chloroform 43814 210
Benzene 45201 Methyl ethyl ketone 43552 210
Carbon tetrachloride 43804 o-Xylene 45204 210
Chloroform 43803 Tetrachloroethylene 43817 210
Dichloromethane 43802 Toluene 45202 210
Ethyl alcohol 43302 Trichloroethylene 43824 210
Ethylbenzene 45203 Trichlorofluoromethane 43811 210
Ethylene dibromide 43843 Vinyl chloride 43860 210
3.4.1 Additional Toxics Monitoring at San Jose - Jackson
In addition to the compounds listed in Table 3-5 formaldehyde and acetaldehyde are
measured at San Jose - Jackson on a 1:6 schedule through August 6, 2018 and on a 1:12
schedule starting August 18, 2018 through present. These compounds are highly
reactive and cannot be accurately measured using a canister sample. Instead, they are
collected on a chemically treated cartridge using a Xontech 924 sampler. Samples are
analyzed at the Air District laboratory using High Performance Liquid Chromatography
(HPLC).
Metals are also measured at San Jose - Jackson. In addition, summary toxics data are
available from the EPA’s AirData website at: http://www.epa.gov/airdata/.
3.5 Meteorology Program
The Air District operates a meteorological monitoring program to provide
measurements of ambient meteorological parameters to meet the objectives of many
programs within the Air District. Air District programs using meteorological data include
air quality forecasting, photochemical modeling, source modeling, and data analysis. To
obtain high quality data to be used for regulatory applications, the Air District considers
EPA recommendations for siting, instrumentation, data accuracy, and quality assurance.
The placement of meteorological stations depends on the use of the data. Sites chosen
for air quality forecasting are located in areas that show the general wind and
temperature patterns within the Air District. Photochemical modeling sites are chosen to
show boundary conditions, general conditions, and upper air meteorological conditions.

67
Source modeling sites are chosen to be representative of the source and receptor
domain to be modeled. Sites used for data analysis are usually located near high
pollution areas to determine the relationship between source areas and downwind high
concentration areas, as well as the general atmospheric conditions occurring during
pollution episodes.
Because most Air District air monitoring stations are in urban or suburban
neighborhoods where multistory buildings and trees are nearby, it is not possible to
place meteorological systems at all Air District air monitoring stations that meet EPA
meteorological siting recommendations. EPA recommends that wind speed and
direction sensors be located at a height of 10 meters or at plume height if the use is
source-oriented modeling. In addition, the distance between the sensors and any
obstruction should be at least 10 times the height of the obstruction.
In 2020, the meteorological network consisted of 19 sites. Point San Pablo is currently
being relocated due to vandalism that cut power to the station. Eight are adjacent to Air
District air monitoring sites (Bethel Island, Fairfield, Concord, San Ramon, Vallejo,
Livermore, Gilroy, and San Martin). The other air monitoring sites have obstructions to
air flow nearby, necessitating placement of the meteorological sites further away.
Additionally, to meet forecasting or photochemical modeling needs, some
meteorological sites have been placed on ridges or mountain-tops, such as at Chabot
and Livermore. Sensors used in the Air District’s meteorological network include wind
speed and direction, temperature, relative humidity, precipitation, and pressure. Figure
3-4 shows their locations.
Hourly-averaged data are made available to Air District staff and the public on the Air
District’s web page and are archived in the Meteorology and Measurement Division’s
database. Each site is visited monthly by Air District staff for a visual inspection of the
instrumentation and a technician visits the site to correct problems, if needed. Data are
also reviewed on an ongoing basis by Air District meteorologists producing daily air
quality forecasts for the Bay Area.
Data recorded at airports, oil refineries, sewage treatment plants, universities, and
private companies are included in the Meteorology and Measurement Division
meteorological database if they meet EPA recommended siting and maintenance
specifications.

68
Figure 3-4 Map of Air District Meteorological Monitoring Sites in 2020

69
4. SITE INFORMATION DEFINITIONS
Monitors that are operated to determine compliance with the NAAQS must be operated
in accordance with EPA requirements in 40 CFR part 58.
explains the monitoring terms and definitions used in the detailed site information
tables in Section 5.
Table 4-1 Monitor Information Definitions and EPA Air Monitoring Siting Criteria
Site or Monitor Information Definition of Terms
AQS ID The 9-digit code that identifies each site in the EPA’s AQS
database
GPS coordinates (decimal
degrees)
The latitude and longitude of the site from the World
Geodetic System (WGS-84) used as the reference coordinate
system for Global Positioning System (GPS).
Distance to roadways from the
gaseous probe (meters)
40 CFR Part 58 Appendix E, 6.0: specifies the distance monitors
must be from roadways to be considered neighborhood- or
urban-scale. Recommended distances are found in Table E-1
for NOx and O3, Table E-2 for CO, and Figure E-1 for PM.
Traffic count The annual average daily traffic (AADT) count.
Groundcover
40 CFR Part 58 Appendix E, 3.0: states that particulate
samplers should not be located in an unpaved area unless
there is vegetative ground cover year round, so that the
impact of wind-blown dusts will be kept to a minimum.
Statistical Area The core based statistical area (CBSA) or Metropolitan
Statistical Area (MSA) the site is located within.
Pollutant, POC
The pollutant being measured and its Parameter Occurrence
Code (POC). There may be multiple instruments measuring a
pollutant at a site. Each instrument of the same pollutant is
assigned a unique POC to differentiate it from the others in
EPA’s AQS database.
Primary/QA Collocated/Other
This row applies to parameters that have collocation
requirements as well as parameters that are combined at a site
level for design value calculations. This currently includes
PM2.5, PM10, PM10-2.5, Pb and NO2. Non-PM, Pb, and NO2
monitors are listed as “N/A”.
Parameter code The 5-digit code assigned to each pollutant in the EPA’s AQS
database.
Basic monitoring objective(s) The purpose for monitoring at that location. Choices include
public information, NAAQS comparison, and research.

70
Site or Monitor Information Definition of Terms
Site type(s)
Choices include highest concentration, population oriented,
source impact, general/background, regional transport, and
welfare-related impacts.
Monitor type(s) Choices include SLAMS, Special Purpose (SPM), Industrial,
Non-EPA Federal, Tribal, EPA and Other.
Network affiliation(s)
Some monitors are used for specific types of monitoring
networks. Examples that apply to the Bay Area include: CSN
STN, CSN Supplemental, NATTS, NCore, Near Road, and
Unofficial PAMS. The full list may be found at:
https://aqs.epa.gov/aqsweb/documents/codetables/networks.
html
Instrument manufacturer and
model
Details about the instrumentation used to measure the
pollutant.
Method code
Based on the Instrument manufacture and model, a method
code is assigned and is reported to the EPA AQS database
system. 40 CFR Part 58 Appendix C, 2.0: requires that the
monitor used must be from EPA’s current List of Designated
Reference and Equivalent Methods.
FRM/FEM/ARM/other
FRMs (Federal Reference Methods) and FEMs (Federal
Equivalent Methods) are approved by EPA for criteria pollutant
monitoring to determine compliance with the. An ARM
(Approved Regional Method) may be approved by EPA as an
alternative to and FRM or FEM, however, no ARMs are used in
the Bay Area.
Collecting Agency The agency that operates the instrument at a site, which
currently is the Air District for all BAAQMD sites in this report.
Analytical Lab The agency that weighs particulate filters or does chemical
analysis of particulate filters or air samples.
Reporting Agency The agency that uploads air monitoring data to the EPA’s AQS
database.
Spatial scale
The relative distance over which the air pollution
measurements are representative. Choices are micro, middle,
neighborhood, urban, regional, national, or global scales.
Monitor start date The date valid data collection began for that pollutant at an air
monitoring station.
Current Sampling frequency
This reflects the sampling frequency used for district monitors
in 2016. This frequency describes if the monitor is operated
continuously or intermittently. Intermittent sampling for
particulate matter (PM2.5, PM10, PM10-Pb, and TSP-Pb) and
toxics is performed by collecting a sample (filter, air canister or
other) either every day, every 3rd day, every 6th day or every
12th day (1:1, 1:3, 1:6, 1:12). Samples are subsequently

71
Site or Monitor Information Definition of Terms
analyzed for the pollutant of interest, for example, PM2.5 mass
or lead concentrations. The Air District at times elects to
operate a monitor more frequently than is required. For more
information about how the current sampling frequency
compares to the required sampling frequency, see the
sections on minimum monitoring requirements for that
pollutant.
Sampling season
The date range (season) monitors were operated during 2016.
While California has a required yearlong O3 season, EPA has
granted a waiver to the Air District so that some ozone sites in
the Bay Area are not required to run during the winter.
Probe height (meters) 40 CFR Part 58 Appendix E, 2.0: requires that probe height be
2-15 meters above ground level (AGL).
Distance from supporting
structure (meters)
40 CFR Part 58 Appendix E, 2.0: requires the probe be at least
1 meter vertically or horizontally away from any supporting
structure unless it is a roof, in which case 1 meter separation is
required.
Distance from obstructions on
roof (meters). Include
horizontal distance + vertical
height above probe for
obstructions nearby (meters).
40 CFR Part 58 Appendix E, 4.0: requires that the distance from
the obstacle to the probe or inlet must be at least twice the
height that the obstacle protrudes above the probe or inlet.
PM samplers must have a 2 meter separation from walls,
parapets and structures.
Distance from obstructions not
on roof (meters). Include
horizontal distance + vertical
height above probe for
obstructions nearby (meters).
40 CFR Part 58 Appendix E, 4.0: requires that the distance from
the obstacle to the probe or inlet must be at least twice the
height that the obstacle protrudes above the probe or inlet.
Distance from trees (meters) 40 CFR Part 58 Appendix E, 5.0: requires that probe be at least
10 meters from the nearest tree drip line.
Distance to furnace or
incinerator flue (meters)
40 CFR Part 58 Appendix E, 3.0: requires that scavenging be
minimized by keeping the probe away from furnace or
incineration flues or other minor sources of SO2 or NOx. The
separation distance should take into account the heights of
the flues, type of waste or fuel burned, and the sulfur content
of the fuel.
Distance between monitors
fulfilling a QA collocation
requirement (meters)
Collocated PM2.5, PM10, and Pb monitors must be 2-4 meters
apart for flow rates >200L/m and 1-4 meters apart for flow
rates <200 L/m (40 CFR 58, Appendix A 3.2.3.4(c), 3.3.4.1(c),
and 3.4.4.2(b)).
For low volume PM
instruments (flow rate < 200
liters/minute) is any PM
40 CFR Part 58, Appendix A 3.2.3.4(c), 3.3.4.1(c), and 3.4.4.2(b)
require that PM monitors with flow rates <200L/m have at
least a 1 meter separation.

72
Site or Monitor Information Definition of Terms
instrument within 1m of the
LoVol? If yes, please list
distance (meters) and
instruments(s).
For high volume PM
instrument (flow rate > 200
liters/minute), is any PM
instrument within 2m of the
HiVol? If yes, please list
distance (meters) and
instrument(s).
40 CFR Part 58, Appendix A 3.2.3.4(c), 3.3.4.1(c), and 3.4.4.2(b)
require that PM monitors with flow rates > 200L/m have at
least a 2 meter separation.
Unrestricted airflow (degrees)
40 CFR Part 58 Appendix E, 4.0: requires the probe or inlet to
have unrestricted airflow in an arc of at least 180 degrees. This
arc must include the predominant wind direction for the
season of greatest pollutant concentration potential.
Probe material for reactive
gases
40 CFR Part 58, Appendix E, 9.0: requires that either Pyrex
glass or FEP Teflon be used for intake sampling lines.
Residence time for reactive
gases (seconds)
40 CFR Part 58, Appendix E, 9.0: requires a residence time of
20 seconds or less for reactive gas monitors.
Will there be changes within
the next 18 months?
Describes if any changes are expected to occur to that
monitor at that station within the next 18 months.
Is it suitable for comparison
against the annual PM2.5?
40 CFR 58.30: PM2.5 data from monitors that are located are at
relatively unique micro-scale, localized hot spot, or unique
middle-scale impact sites, and do not represent area-wide
concentrations, are not eligible for comparison to the Annual
PM2.5 NAAQS (they are eligible for comparison to the 24-hour
PM2.5 NAAQS). Currently, all of the PM2.5 sites in the Bay Area
are considered to be representative of area-wide
concentrations.
Frequency of flow rate
verification for PM samplers
40 CFR Part 58, Appendix A, Sections 3.2.1, 3.3.1, 3.3.2, 3.4.1,
3.4.2: require that a one-point flow rate verification check
must be performed at least once every month for low-volume
PM samplers and quarterly for hi-volume PM samplers.
Frequency of one-point QC
check for gaseous instruments
40 CFR Part 58 Appendix A, 3.1.1: requires that QC checks be
performed at least once every two weeks.
Date of Annual Performance
Evaluation conducted in the
past calendar year for gaseous
parameters
40 CFR Part 58 Appendix A, 3.1.2: requires that SO2, CO, O3,
and NO2 monitors have annual performance evaluations.
Date of two semi-annual flow
rate audits conducted in the
40 CFR Part 58 Appendix A, Sections 3.2.2, 3.3.3, 3.4.3: require
that PM samplers have flow rate checks every six months.
73
Site or Monitor Information Definition of Terms
past calendar year for PM
monitors

74
5. DETAILED SITE INFORMATION
The tables below describe each of the monitors that were operating at air monitoring
sites in 2020. The site descriptions include siting information about the physical
properties of the site and monitors, detailed descriptions of the individual monitors at
the site and their monitoring objective, site type, and spatial scale of representativeness.
5.1 Berkeley Aquatic Park (near-road)
Site Information for Berkeley Aquatic Park
AQS ID 06-001-0013
GPS coordinates 37.864767, -122.302741
Location Trailer within 50m east of Interstate 80
Address 1 Bolivar, Berkeley CA 94710
County Alameda
Distance to road
from gaseous probe (meters)
I-80: 8
University Ave: 250
Traffic count (AADT, year)
I-80: 280,400 (2017)
University Ave: 18,800 (2017)
Traffic counts data were updated on April 1, 2020 and reflect
the latest available data.
Groundcover Gravel, grass, small plants.
Statistical Area San Francisco-Oakland-Hayward CBSA
Summary for Berkley Aquatic Park
Pollutants Measured O3, NOx, CO, PM2.5C, Toxics, BC, UFP
Spatial Scale Microscale (100 m)
Notes
The site is located 8 m downwind from the I-80 and
designated as a near-road monitoring site which are a
category of sites designed to representative of population
exposure in the near-road environment. Due to the
prevalence of areas that have large roadways adjacent to
population centers, Berkley Aquatic Park is considered to be
representative of area-wide or neighborhood scale air quality.

75
Berkeley Aquatic Park Monitor Information
Pollutant, POC O3, 1 NO2, 1 CO, 1 PM2.5, 3
Primary/QA Collocated/Other N/A Primary N/A Primary
Parameter code 44201 42602 42101 88101
Basic monitoring objective(s) Public
Information
NAAQS
comparison
NAAQS
comparison
NAAQS
comparison
Site type(s) Population
Oriented
Population
Oriented &
Source Oriented
Population
Oriented &
Source Oriented
Population
Oriented &
Source Oriented
Monitor type(s) SPM SLAMS SLAMS SLAMS
Network affiliation(s) N/A Near Road Near Road Near Road
Instrument manufacturer and model TECO 49c TECO 42i TECO 48i Met One FEM
BAM 1020
Method code 047 074 054 170
FRM/FEM/ARM/other FEM FRM FRM FEM
Collecting Agency Air District Air District Air District Air District
Analytical Lab N/A N/A N/A N/A
Reporting Agency Air District Air District Air District Air District
Spatial scale Micro Micro Micro Micro
Monitor start date 07/01/2016 07/01/2016 07/01/2016 07/01/2016
Current Sampling frequency Continuous Continuous Continuous Continuous
Sampling season 01/01 - 12/31 01/01 – 12/31 01/01 – 12/31 01/01 – 12/31
Probe height (meters) 6 6 6 5
Distance from supporting structure (meters) >1 >1 >1 >2
Distance from obstructions on roof (meters). Include
horizontal distance + vertical height above probe for
obstructions nearby (meters).
None None None None
Distance from obstructions not on roof (meters). Include
horizontal distance + vertical height above probe for
obstructions nearby (meters).
4, 0 4, 0 4, 0 5, 0.75
Distance from trees (meters) 25 25 25 25
Distance to furnace or incinerator flue (meters) None None None None
Distance between monitors fulfilling a QA collocation
requirement (meters) N/A N/A N/A N/A
For low volume PM instruments (flow rate < 200
liters/minute) is any PM instrument within 1m of the LoVol? If
yes, please list distance (meters) and instruments(s).
N/A N/A N/A N
For high volume PM instrument (flow rate > 200
liters/minute), is any PM instrument within 2m of the HiVol?
If yes, please list distance (meters) and instrument(s).
N/A N/A N/A N/A
Unrestricted airflow (degrees) 360 360 360 360
Probe material for reactive gases Teflon Teflon Teflon N/A
Residence time for reactive gases (seconds) 17 19 19 N/A
Will there be changes within the next 18 months? N N N N
Is it suitable for comparison against the annual PM2.5? N/A N/A N/A Y
Frequency of flow rate verification for PM samplers N/A N/A N/A Bi-weekly
Frequency of one-point QC check for gaseous instruments Every other day Every other day Every other day N/A
Date of Annual Performance Evaluation conducted in the past
calendar year for gaseous parameters See Table 5.35 See Table 5.35 See Table 5.35 N/A
Date of two semi-annual flow rate audits conducted in the
past calendar year for PM monitors N/A N/A N/A See Table 5.35
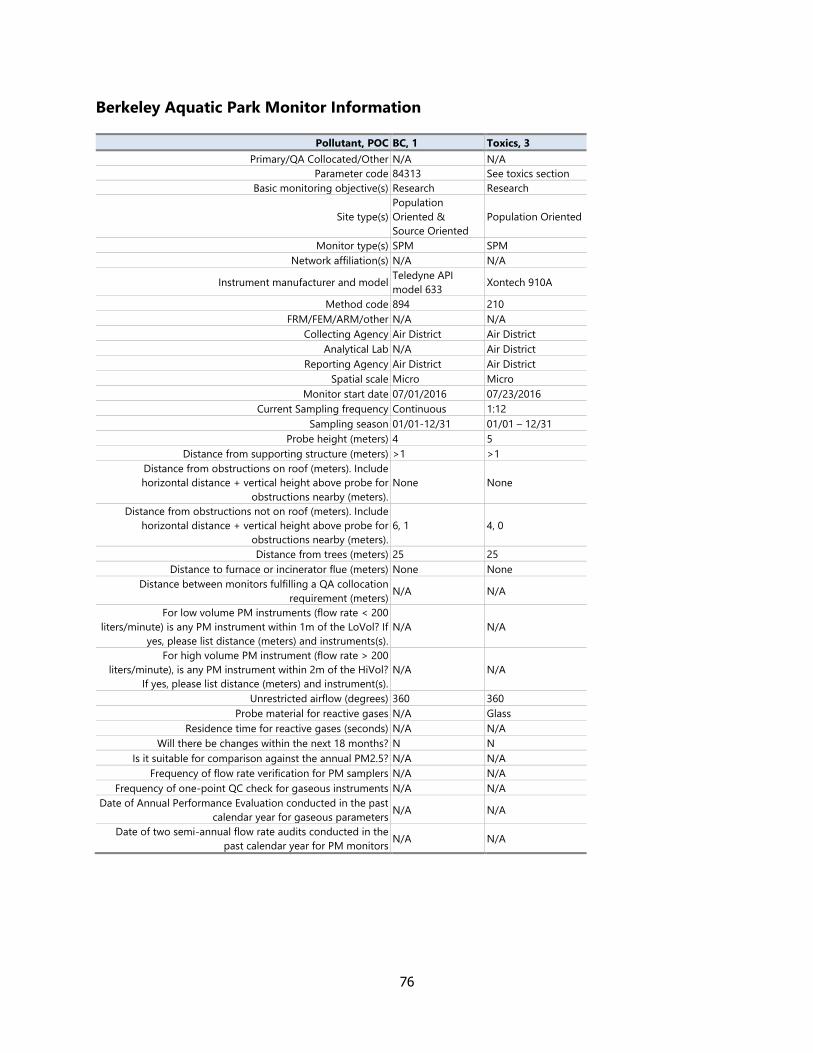
76
Berkeley Aquatic Park Monitor Information
Pollutant, POC BC, 1 Toxics, 3
Primary/QA Collocated/Other N/A N/A
Parameter code 84313 See toxics section
Basic monitoring objective(s) Research Research
Site type(s)
Population
Oriented &
Source Oriented
Population Oriented
Monitor type(s) SPM SPM
Network affiliation(s) N/A N/A
Instrument manufacturer and model Teledyne API
model 633 Xontech 910A
Method code 894 210
FRM/FEM/ARM/other N/A N/A
Collecting Agency Air District Air District
Analytical Lab N/A Air District
Reporting Agency Air District Air District
Spatial scale Micro Micro
Monitor start date 07/01/2016 07/23/2016
Current Sampling frequency Continuous 1:12
Sampling season 01/01-12/31 01/01 – 12/31
Probe height (meters) 4 5
Distance from supporting structure (meters) >1 >1
Distance from obstructions on roof (meters). Include
horizontal distance + vertical height above probe for
obstructions nearby (meters).
None None
Distance from obstructions not on roof (meters). Include
horizontal distance + vertical height above probe for
obstructions nearby (meters).
6, 1 4, 0
Distance from trees (meters) 25 25
Distance to furnace or incinerator flue (meters) None None
Distance between monitors fulfilling a QA collocation
requirement (meters) N/A N/A
For low volume PM instruments (flow rate < 200
liters/minute) is any PM instrument within 1m of the LoVol? If
yes, please list distance (meters) and instruments(s).
N/A N/A
For high volume PM instrument (flow rate > 200
liters/minute), is any PM instrument within 2m of the HiVol?
If yes, please list distance (meters) and instrument(s).
N/A N/A
Unrestricted airflow (degrees) 360 360
Probe material for reactive gases N/A Glass
Residence time for reactive gases (seconds) N/A N/A
Will there be changes within the next 18 months? N N
Is it suitable for comparison against the annual PM2.5? N/A N/A
Frequency of flow rate verification for PM samplers N/A N/A
Frequency of one-point QC check for gaseous instruments N/A N/A
Date of Annual Performance Evaluation conducted in the past
calendar year for gaseous parameters N/A N/A
Date of two semi-annual flow rate audits conducted in the
past calendar year for PM monitors N/A N/A
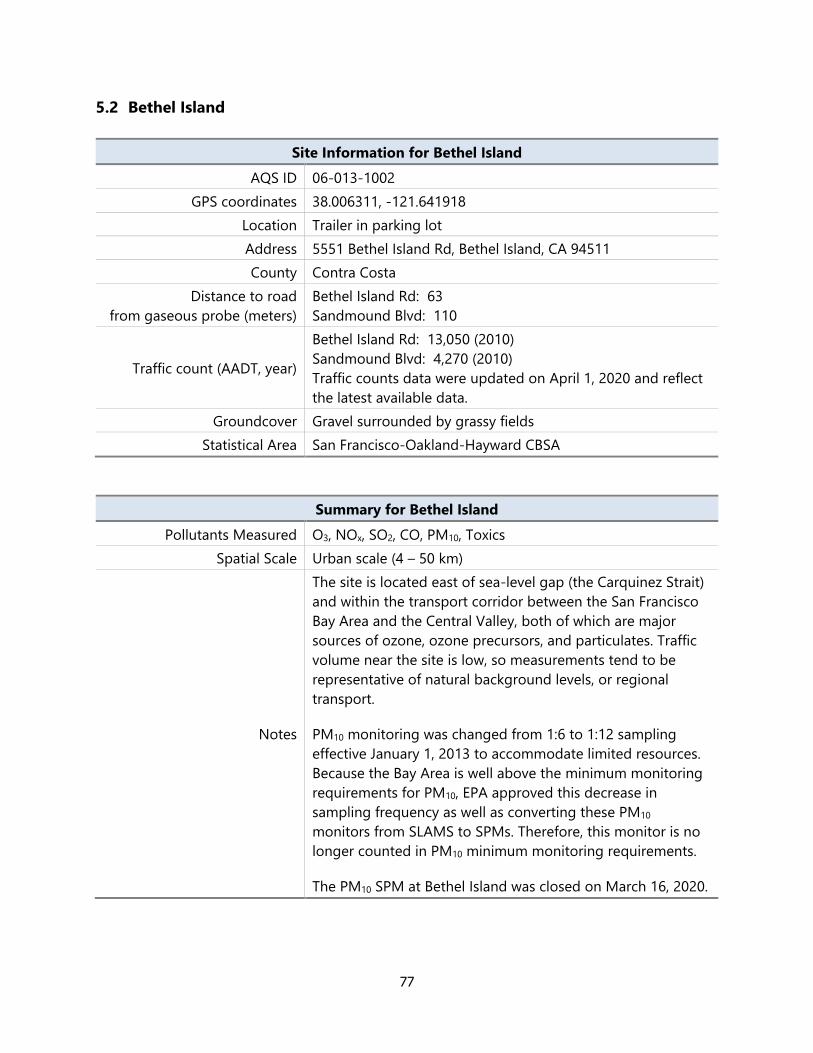
77
5.2 Bethel Island
Site Information for Bethel Island
AQS ID 06-013-1002
GPS coordinates 38.006311, -121.641918
Location Trailer in parking lot
Address 5551 Bethel Island Rd, Bethel Island, CA 94511
County Contra Costa
Distance to road
from gaseous probe (meters)
Bethel Island Rd: 63
Sandmound Blvd: 110
Traffic count (AADT, year)
Bethel Island Rd: 13,050 (2010)
Sandmound Blvd: 4,270 (2010)
Traffic counts data were updated on April 1, 2020 and reflect
the latest available data.
Groundcover Gravel surrounded by grassy fields
Statistical Area San Francisco-Oakland-Hayward CBSA
Summary for Bethel Island
Pollutants Measured O3, NOx, SO2, CO, PM10, Toxics
Spatial Scale Urban scale (4 – 50 km)
Notes
The site is located east of sea-level gap (the Carquinez Strait)
and within the transport corridor between the San Francisco
Bay Area and the Central Valley, both of which are major
sources of ozone, ozone precursors, and particulates. Traffic
volume near the site is low, so measurements tend to be
representative of natural background levels, or regional
transport.
PM10 monitoring was changed from 1:6 to 1:12 sampling
effective January 1, 2013 to accommodate limited resources.
Because the Bay Area is well above the minimum monitoring
requirements for PM10, EPA approved this decrease in
sampling frequency as well as converting these PM10
monitors from SLAMS to SPMs. Therefore, this monitor is no
longer counted in PM10 minimum monitoring requirements.
The PM10 SPM at Bethel Island was closed on March 16, 2020.

78
Bethel Island Monitor Information
Pollutant, POC O3, 1 CO, 1 NO2, 1
Primary/QA Collocated/Other N/A N/A Primary
Parameter code 44201 42101 42601 / 42602
Basic monitoring objective(s) NAAQS comparison NAAQS comparison NAAQS comparison
Site type(s) Regional Transport &
Highest Conc. General Background Regional Transport
Monitor type(s) SLAMS SLAMS SLAMS
Network affiliation(s) N/A N/A N/A
Instrument manufacturer and model TECO 49i TECO 48i TECO 42i
Method code 047 054 074
FRM/FEM/ARM/other FEM FRM FRM
Collecting Agency Air District Air District Air District
Analytical Lab N/A N/A N/A
Reporting Agency Air District Air District Air District
Spatial scale Urban Urban Urban
Monitor start date 03/01/1981 03/01/1981 03/01/1981
Current Sampling frequency Continuous Continuous Continuous
Sampling season 01/01 - 12/31 01/01 - 12/31 01/01 - 12/31
Probe height (meters) 7 7 7
Distance from supporting structure (meters) >1 >1 >1
Distance from obstructions on roof (meters). Include horizontal distance
+ vertical height above probe for obstructions nearby (meters). None None None
Distance from obstructions not on roof (meters). Include horizontal
distance + vertical height above probe for obstructions nearby (meters). None None None
Distance from trees (meters) 13 13 13
Distance to furnace or incinerator flue (meters) None None None
Distance between monitors fulfilling a QA collocation requirement
(meters) N/A N/A N/A
For low volume PM instruments (flow rate < 200 liters/minute) is any
PM instrument within 1m of the LoVol? If yes, please list distance
(meters) and instruments(s).
N/A N/A N/A
For high volume PM instrument (flow rate > 200 liters/minute), is any
PM instrument within 2m of the HiVol? If yes, please list distance
(meters) and instrument(s).
N/A N/A N/A
Unrestricted airflow (degrees) 360 360 360
Probe material for reactive gases Teflon Teflon Teflon
Residence time for reactive gases (seconds) 15 16 17
Will there be changes within the next 18 months? N N N
Is it suitable for comparison against the annual PM2.5? N/A N/A N/A
Frequency of flow rate verification for PM samplers N/A N/A N/A
Frequency of one-point QC check for gaseous instruments Every other day Every other day Every other day
Date of Annual Performance Evaluation conducted in the past calendar
year for gaseous parameters See Table 5.35 See Table 5.35 See Table 5.35
Date of two semi-annual flow rate audits conducted in the past
calendar year for PM monitors N/A N/A N/A

79
Bethel Island Monitor Information
Pollutant, POC SO2, 1 PM10, 1 Toxics, 3
Primary/QA Collocated/Other N/A Primary N/A
Parameter code 42401 81102 See toxics section
Basic monitoring objective(s) NAAQS comparison NAAQS comparison Research
Site type(s) Regional Transport Regional Transport General / Background
Monitor type(s) SLAMS SPM SPM
Network affiliation(s) N/A N/A N/A
Instrument manufacturer and model TECO 43i Andersen GUV-16HBLA Xontech 901
Method code 060 063 210
FRM/FEM/ARM/other FEM FRM N/A
Collecting Agency Air District Air District Air District
Analytical Lab N/A Air District Air District
Reporting Agency Air District Air District Air District
Spatial scale Urban Neighborhood Neighborhood
Monitor start date 03/01/1981 11/05/1986 03/27/1998
Current Sampling frequency Continuous 1:12 1:12
Sampling season 01/01 - 12/31 01/01 - 12/31 01/01 - 12/31
Probe height (meters) 7 5 6
Distance from supporting structure (meters) >1 >2 >1
Distance from obstructions on roof (meters). Include horizontal
distance + vertical height above probe for obstructions nearby
(meters).
None None None
Distance from obstructions not on roof (meters). Include
horizontal distance + vertical height above probe for
obstructions nearby (meters).
None None None
Distance from trees (meters) 13 14 13
Distance to furnace or incinerator flue (meters) None None None
Distance between monitors fulfilling a QA collocation
requirement (meters) N/A N/A N/A
For low volume PM instruments (flow rate < 200 liters/minute)
is any PM instrument within 1m of the LoVol?
If yes, please list distance (meters) and instruments(s).
N/A N/A N/A
For high volume PM instrument (flow rate > 200 liters/minute),
is any PM instrument within 2m of the HiVol? If yes, please list
distance (meters) and instrument(s).
N/A No N/A
Unrestricted airflow (degrees) 360 360 360
Probe material for reactive gases Teflon N/A Glass
Residence time for reactive gases (seconds) 16 N/A N/A
Will there be changes within the next 18 months? N N N
Is it suitable for comparison against the annual PM2.5? N/A N/A N/A
Frequency of flow rate verification for PM samplers N/A Quarterly N/A
Frequency of one-point QC check for gaseous instruments Every other day N/A N/A
Date of Annual Performance Evaluation conducted in the past
calendar year for gaseous parameters See Table 5.35 N/A N/A
Date of two semi-annual flow rate audits conducted in the past
calendar year for PM monitors N/A See Table 5.35 N/A
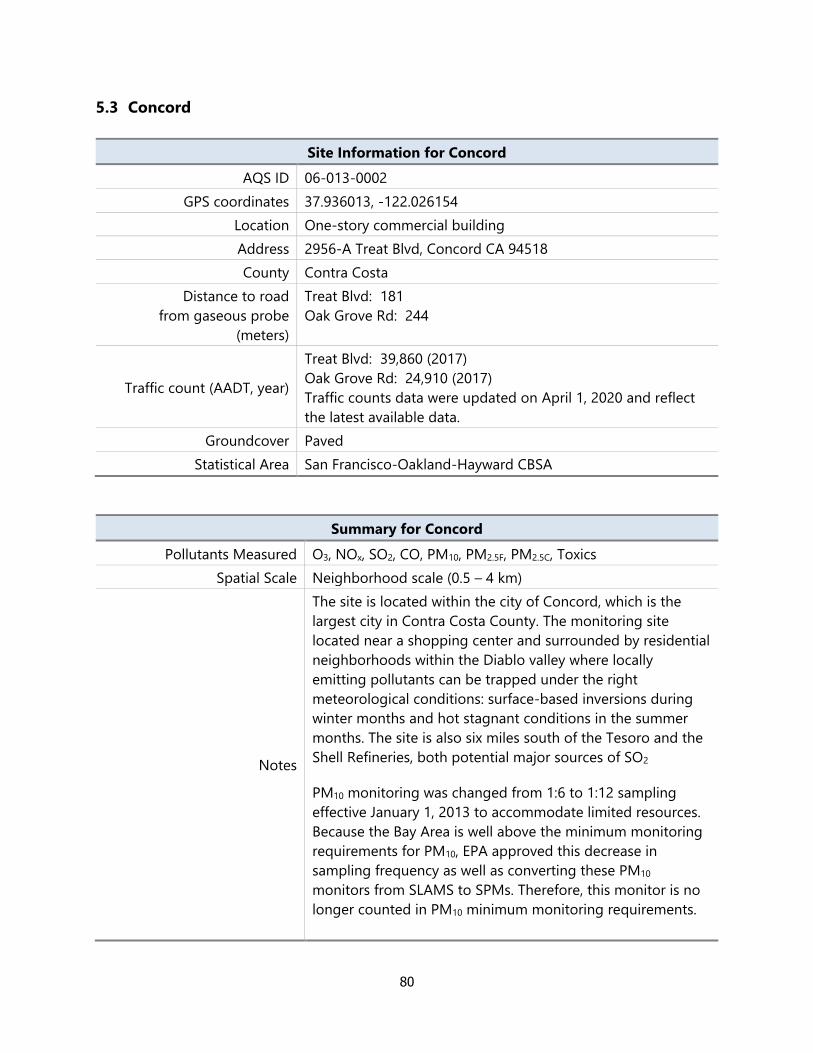
80
5.3 Concord
Site Information for Concord
AQS ID 06-013-0002
GPS coordinates 37.936013, -122.026154
Location One-story commercial building
Address 2956-A Treat Blvd, Concord CA 94518
County Contra Costa
Distance to road
from gaseous probe
(meters)
Treat Blvd: 181
Oak Grove Rd: 244
Traffic count (AADT, year)
Treat Blvd: 39,860 (2017)
Oak Grove Rd: 24,910 (2017)
Traffic counts data were updated on April 1, 2020 and reflect
the latest available data.
Groundcover Paved
Statistical Area San Francisco-Oakland-Hayward CBSA
Summary for Concord
Pollutants Measured O3, NOx, SO2, CO, PM10, PM2.5F, PM2.5C, Toxics
Spatial Scale Neighborhood scale (0.5 – 4 km)
Notes
The site is located within the city of Concord, which is the
largest city in Contra Costa County. The monitoring site
located near a shopping center and surrounded by residential
neighborhoods within the Diablo valley where locally
emitting pollutants can be trapped under the right
meteorological conditions: surface-based inversions during
winter months and hot stagnant conditions in the summer
months. The site is also six miles south of the Tesoro and the
Shell Refineries, both potential major sources of SO2
PM10 monitoring was changed from 1:6 to 1:12 sampling
effective January 1, 2013 to accommodate limited resources.
Because the Bay Area is well above the minimum monitoring
requirements for PM10, EPA approved this decrease in
sampling frequency as well as converting these PM10
monitors from SLAMS to SPMs. Therefore, this monitor is no
longer counted in PM10 minimum monitoring requirements.

81
Concord Monitor Information
Pollutant, POC O3, 1 CO, 1 NO2, 1 SO2, 1
Primary/QA Collocated/Other N/A N/A Primary N/A
Parameter code 44201 42101 42601 / 42602 42401
Basic monitoring objective(s) NAAQS
comparison
NAAQS
comparison
NAAQS
comparison
NAAQS
comparison
Site type(s) Population
Oriented
Population
Oriented
Population
Oriented
Population
Oriented &
Source Impact
Monitor type(s) SLAMS SLAMS SLAMS SLAMS
Network affiliation(s) N/A N/A N/A N/A
Instrument manufacturer and model TECO 49i TECO 48i TECO 42i TECO 43i
Method code 047 054 074 060
FRM/FEM/ARM/other FEM FRM FRM FEM
Collecting Agency Air District Air District Air District Air District
Analytical Lab N/A N/A N/A N/A
Reporting Agency Air District Air District Air District Air District
Spatial scale Neighborhood Neighborhood Neighborhood Neighborhood
Monitor start date 04/09/1980 02/21/1980 2/21/1980 02/21/1980
Current Sampling frequency Continuous Continuous Continuous Continuous
Sampling season 01/01 - 12/31 01/01 - 12/31 01/01 - 12/31 01/01 - 12/31
Probe height (meters) 9 9 9 9
Distance from supporting structure (meters) >1 >1 >1 >1
Distance from obstructions on roof (meters). Include horizontal distance + vertical height above probe for obstructions nearby
(meters). None None None None
Distance from obstructions not on roof (meters). Include horizontal distance + vertical height above probe for
obstructions nearby (meters). None None None None
Distance from trees (meters) 24 24 24 24
Distance to furnace or incinerator flue (meters) None None None None
Distance between monitors fulfilling a QA collocation
requirement (meters) N/A N/A N/A N/A
For low volume PM instruments (flow rate < 200 liters/minute) is any PM instrument within 1m of the LoVol? If yes, please list
distance (meters) and instruments(s). N/A N/A N/A N/A
For high volume PM instrument (flow rate > 200 liters/minute), is any PM instrument within 2m of the HiVol?
If yes, please list distance (meters) and instrument(s). N/A N/A N/A N/A
Unrestricted airflow (degrees) 360 360 360 360
Probe material for reactive gases Teflon Teflon Teflon Teflon
Residence time for reactive gases (seconds) 9 10 10 10
Will there be changes within the next 18 months? N N N N
Is it suitable for comparison against the annual PM2.5? N/A N/A N/A N/A
Frequency of flow rate verification for PM samplers N/A N/A N/A N/A
Frequency of one-point QC check for gaseous instruments Every other day Every other day Every other day Every other day
Date of Annual Performance Evaluation conducted in the past
calendar year for gaseous parameters See Table 5.35 See Table 5.35 See Table 5.35 See Table 5.35
Date of two semi-annual flow rate audits conducted in the past calendar year for PM monitors N/A N/A N/A N/A

82
Concord Monitor Information
Pollutant, POC PM10, 1 PM2.5, 3 Toxics, 3
Primary/QA Collocated/Other Primary Primary N/A
Parameter code 81102 88101 See toxics section
Basic monitoring objective(s) NAAQS comparison NAAQS comparison Research
Site type(s) Population Oriented Population Oriented &
Highest Conc.
Population Oriented
& Source Impact
Monitor type(s) SPM SLAMS SPM
Network affiliation(s) N/A N/A N/A
Instrument manufacturer and model Andersen
HiVol 1200 Met One BAM 1020 Xontech 901
Method code 063 170 210
FRM/FEM/ARM/other FRM FEM N/A
Collecting Agency Air District Air District Air District
Analytical Lab Air District N/A Air District
Reporting Agency Air District Air District Air District
Spatial scale Urban Urban Urban
Monitor start date 11/04/1986 1/1/2013 08/08/1989
Current Sampling frequency 1:12 Continuous 1:12
Sampling season 01/01-12/31 01/01-12/31 01/01 - 12/31
Probe height (meters) 6 6 9
Distance from supporting structure (meters) >2 >2 >1
Distance from obstructions on roof (meters). Include
horizontal distance + vertical height above probe for
obstructions nearby (meters).
None None None
Distance from obstructions not on roof (meters). Include
horizontal distance + vertical height above probe for
obstructions nearby (meters).
None None None
Distance from trees (meters) 15 22 24
Distance to furnace or incinerator flue (meters) None None None
Distance between monitors fulfilling a QA collocation
requirement (meters) N/A N/A N/A
For low volume PM instruments (flow rate < 200
liters/minute) is any PM instrument within 1m of the LoVol? If
yes, please list distance (meters) and instruments(s).
N/A No N/A
For high volume PM instrument (flow rate > 200
liters/minute), is any PM instrument within 2m of the HiVol?
If yes, please list distance (meters) and instrument(s).
No N/A N/A
Unrestricted airflow (degrees) 360 360 360
Probe material for reactive gases N/A N/A Glass
Residence time for reactive gases (seconds) N/A N/A N/A
Will there be changes within the next 18 months? N N N
Is it suitable for comparison against the annual PM2.5? N/A Y N/A
Frequency of flow rate verification for PM samplers Quarterly Bi-weekly N/A
Frequency of one-point QC check for gaseous instruments N/A N/A N/A
Date of Annual Performance Evaluation conducted in the
past calendar year for gaseous parameters N/A N/A N/A
Date of two semi-annual flow rate audits conducted in the
past calendar year for PM monitors See Table 5.35 See Table 5.35 N/A

83
5.4 Crockett
Site Information for Crockett
AQS ID 06-013-1001
GPS coordinates 38.054920, -122.233229
Location Pump house
Address End of Kendall Avenue, Crockett CA 94525
County Contra Costa
Distance to road
from gaseous probe
(meters)
San Pablo Ave: 68
Traffic count (AADT, year)
San Pablo Ave: 2,797 (2013)
Traffic counts data were updated on April 1, 2020 and reflect
the latest available data.
Groundcover Vegetative
Statistical Area San Francisco-Oakland-Hayward CBSA
Summary for Crockett
Pollutants Measured SO2, Toxics
Spatial Scale Neighborhood scale (0.5 – 4 km)
Notes
The site located is 0.9 miles downwind of the Phillips 66
Refinery where prevailing west winds can transport SO2
emissions from the refinery over the town of Crockett, a
predominately residential community.
Crockett is classified as an SPM site. EPA siting criteria require
the probe be located at least 10 meters from the drip line of
all trees within the 180-degree arc of unrestricted airflow for
source-oriented monitoring as determined by the
predominant wind direction and the direction of the refinery.
The closest tree drip line within the 180-degree arc is less
than 10 meters from the probe, which does not meet siting
criteria. The Air District has been unable to negotiate with the
local homeowner’s association for the removal of this tree.
Even though the siting criteria for a SLAMS site cannot be
met, the site is still suitable for source-oriented monitoring as
an SPM site.

84
Crockett Monitor Information
Pollutant, POC SO2, 1 Toxics, 3
Primary/QA Collocated/Other N/A N/A
Parameter code 42401 See toxics section
Basic monitoring objective(s) NAAQS comparison Research
Site type(s) Population Oriented
& Source Oriented
Population Oriented
& Source Oriented
Monitor type(s) SPM SPM
Network affiliation(s) N/A N/A
Instrument manufacturer and model TECO 43i Xontech 901
Method code 060 210
FRM/FEM/ARM/other FEM N/A
Collecting Agency Air District Air District
Analytical Lab N/A Air District
Reporting Agency Air District Air District
Spatial scale Neighborhood Neighborhood
Monitor start date 01/01/1979 06/05/1999
Current Sampling frequency Continuous 1:12
Sampling season 01/01 – 12/31 01/01 - 12/31
Probe height (meters) 6 6
Distance from supporting structure (meters) >1 >1
Distance from obstructions on roof (meters). Include
horizontal distance + vertical height above probe for
obstructions nearby (meters).
None None
Distance from obstructions not on roof (meters). Include
horizontal distance + vertical height above probe for
obstructions nearby (meters).
None None
Distance from trees (meters) 1 1
Distance to furnace or incinerator flue (meters) None None
Distance between monitors fulfilling a QA collocation
requirement (meters) N/A N/A
For low volume PM instruments (flow rate < 200
liters/minute) is any PM instrument within 1m of the LoVol? If
yes, please list distance (meters) and instruments(s).
N/A N/A
For high volume PM instrument (flow rate > 200
liters/minute), is any PM instrument within 2m of the HiVol?
If yes, please list distance (meters) and instrument(s).
N/A N/A
Unrestricted airflow (degrees) 270 270
Probe material for reactive gases Teflon Glass
Residence time for reactive gases (seconds) 11 N/A
Will there be changes within the next 18 months? N N
Is it suitable for comparison against the annual PM2.5? N/A N/A
Frequency of flow rate verification for PM samplers N/A N/A
Frequency of one-point QC check for gaseous instruments Every other day N/A
Date of Annual Performance Evaluation conducted in the past
calendar year for gaseous parameters See Table 5.35 N/A
Date of two semi-annual flow rate audits conducted in the
past calendar year for PM monitors N/A N/A

85
5.5 Fairfield
Site Information for Fairfield
AQS ID 06-095-0005
GPS coordinates 38.227066, -122.075624
Location Small trailer in open field
Address 1010 Chadbourne Rd, Fairfield, CA 94534
County Solano
Distance to road
from gaseous probe
(meters)
Cordelia Rd: 194
Chadbourne Rd: 705
Traffic count (AADT, year)
Cordelia Rd: 4,819 (2013)
Chadbourne Rd: 3,674 (2013)
Traffic counts data were updated on April 1, 2020 and reflect the
latest available data.
Groundcover Vegetative
Statistic Area Vallejo-Fairfield CBSA
Summary for Fairfield
Pollutants Measured O3
Spatial Scale Urban scale (4 - 50 km)
Notes
The site is located in the Carquinez Strait Region, the only
sea level gap between the Bay Area and the Central Valley
and located in a rural area between Fairfield and Suisun City
which has a combined population of approximately 140,000.
Prevailing westerly winds during the summer season have
the potential to transport ozone and ozone precursors
coming from the Bay Area. Occasionally easterly winds
transport ozone from the Central Valley to Fairfield.

86
Fairfield Monitor Information
Pollutant, POC O3, 1
Primary/QA Collocated/Other N/A
Parameter code 44201
Basic monitoring objective(s) NAAQS comparison
Site type(s)
Population Oriented &
Regional Transport
Monitor type(s) SLAMS
Network affiliation(s) N/A
Instrument manufacturer and model TECO 49i
Method code 047
FRM/FEM/ARM/other FEM
Collecting Agency Air District
Analytical Lab N/A
Reporting Agency Air District
Spatial scale Urban
Monitor start date 05/29/2002
Current Sampling frequency Continuous
Sampling season 01/01 - 12/31
Probe height (meters) 4
Distance from supporting structure (meters) >1
Distance from obstructions on roof (meters). Include
horizontal distance + vertical height above probe for
obstructions nearby (meters).
None
Distance from obstructions not on roof (meters). Include
horizontal distance + vertical height above probe for
obstructions nearby (meters).
None
Distance from trees (meters) >50
Distance to furnace or incinerator flue (meters) None
Distance between monitors fulfilling a QA collocation
requirement (meters) N/A
For low volume PM instruments (flow rate < 200
liters/minute) is any PM instrument within 1m of the LoVol? If
yes, please list distance (meters) and instruments(s).
N/A
For high volume PM instrument (flow rate > 200
liters/minute), is any PM instrument within 2m of the HiVol?
If yes, please list distance (meters) and instrument(s).
N/A
Unrestricted airflow (degrees) 360
Probe material for reactive gases Teflon
Residence time for reactive gases (seconds) 4
Will there be changes within the next 18 months? N
Is it suitable for comparison against the annual PM2.5? N/A
Frequency of flow rate verification for PM samplers N/A
Frequency of one-point QC check for gaseous instruments Every other day
Date of Annual Performance Evaluation conducted in the past
calendar year for gaseous parameters See Table 5.35
Date of two semi-annual flow rate audits conducted in the
past calendar year for PM monitors N/A

87
5.6 Forest Knolls
Site Information for Forest Knolls
AQS ID 06-041-2001
GPS coordinates 38.015136, -122.689531
Location Roof
Address 6 Castro Street, Forest Knolls, CA 94933
County Marin
Distance to road
from probe (meters)
Sir Francis Drake Blvd at Mountain View: 902
Sir Francis Drake Blvd at Montezuma Road: 18
Castro St: 13
Montezuma Road: 55
Traffic count (AADT, year)
Sir Francis Drake Blvd at Montezuma Road: 4,300 (est. 2019)
Castro St: <150 (est. 2019)
Montezuma Road: <500 (est. 2019)
Traffic counts data were updated on April 1, 2020 and reflect
the latest available data.
Groundcover Paved
Statistic Area San Francisco-Oakland-Hayward CBSA
Summary for Forest Knolls
Pollutants Measured BC
Spatial Scale Neighborhood scale (0.5 - 4 km)
Notes
The site is located in the San Geronimo Valley about 10
miles west to northwest of San Rafael and was deployed in
response to community interest about wood smoke in the
area and to better characterize wood smoke impacts in
sheltered valley locations where winter wood burning often
is the primary source of home heating. Lagunitas-Forest
Knolls is considered a Census Designated Place (CDP) with a
population of approximately 1,800. Wintertime
meteorological conditions are frequently conducive to
trapping wood smoke in the valley, particularly during cold
evenings with stagnant wind conditions.

88
Forest Knolls Monitor Information
Pollutant, POC BC, 1
Primary/QA Collocated/Other N/A
Parameter code 84313
Basic monitoring objective(s) Research
Site type(s) Population Oriented
Monitor type(s) SPM
Network affiliation(s) N/A
Instrument manufacturer and model Teledyne API
AE-633
Method code 894
FRM/FEM/ARM/other N/A
Collecting Agency Air District
Analytical Lab N/A
Reporting Agency Air District
Spatial scale Neighborhood
Monitor start date 01/16/2013
Current Sampling frequency Continuous
Sampling season 01/01-12/31
Probe height (meters) 5
Distance from supporting structure (meters) >1
Distance from obstructions on roof (meters). Include
horizontal distance + vertical height above probe for
obstructions nearby (meters).
None
Distance from obstructions not on roof (meters). Include
horizontal distance + vertical height above probe for
obstructions nearby (meters).
None
Distance from trees (meters) 4
Distance to furnace or incinerator flue (meters) None
Distance between monitors fulfilling a QA collocation
requirement (meters) N/A
For low volume PM instruments (flow rate < 200
liters/minute) is any PM instrument within 1m of the LoVol? If
yes, please list distance (meters) and instruments(s).
N/A
For high volume PM instrument (flow rate > 200
liters/minute), is any PM instrument within 2m of the HiVol?
If yes, please list distance (meters) and instrument(s).
N/A
Unrestricted airflow (degrees) 360
Probe material for reactive gases N/A
Residence time for reactive gases (seconds) N/A
Will there be changes within the next 18 months? N
Is it suitable for comparison against the annual PM2.5? N/A
Frequency of flow rate verification for PM samplers N/A
Frequency of one-point QC check for gaseous instruments N/A
Date of Annual Performance Evaluation conducted in the past
calendar year for gaseous parameters N/A
Date of two semi-annual flow rate audits conducted in the
past calendar year for PM monitors N/A

89
5.7 Fort Cronkhite
Site Information for Fort Cronkhite
AQS ID 06-041-0004
GPS coordinates 37.832725, -122.527658
Location At ground level behind a ranger residence
Address Building 1111, Fort Cronkhite, Sausalito CA 94965
County Marin
Distance to road
from probe (meters)
Bunker Road: 16
Traffic count (AADT, year)
Bunker Road: 1039 (2018)
Traffic counts data were updated on April 1, 2020 and reflect
the latest available data.
Groundcover Vegetative
Statistical Area San Francisco-Oakland-Hayward CBSA
Summary for Fort Cronkhite
Pollutants Measured Toxics
Spatial Scale Neighborhood scale (0.5 - 4 km)
Notes
The site is located within the Golden Gate National
Recreation Area (GGNRA) near the visitor center at Fort
Cronkhite on the north side of the Golden Gate gap which
opens into the San Francisco Bay and is not near any
significant sources of air toxics. Due to prevailing westerly
winds the site can be representative of background levels of
air toxics that are transported into the Bay Area from the
Pacific Ocean. However, under the right conditions the site
may measure contributions from anthropogenic sources
such as ships from the nearby shipping channel or local
vehicle traffic within the GGNRA.
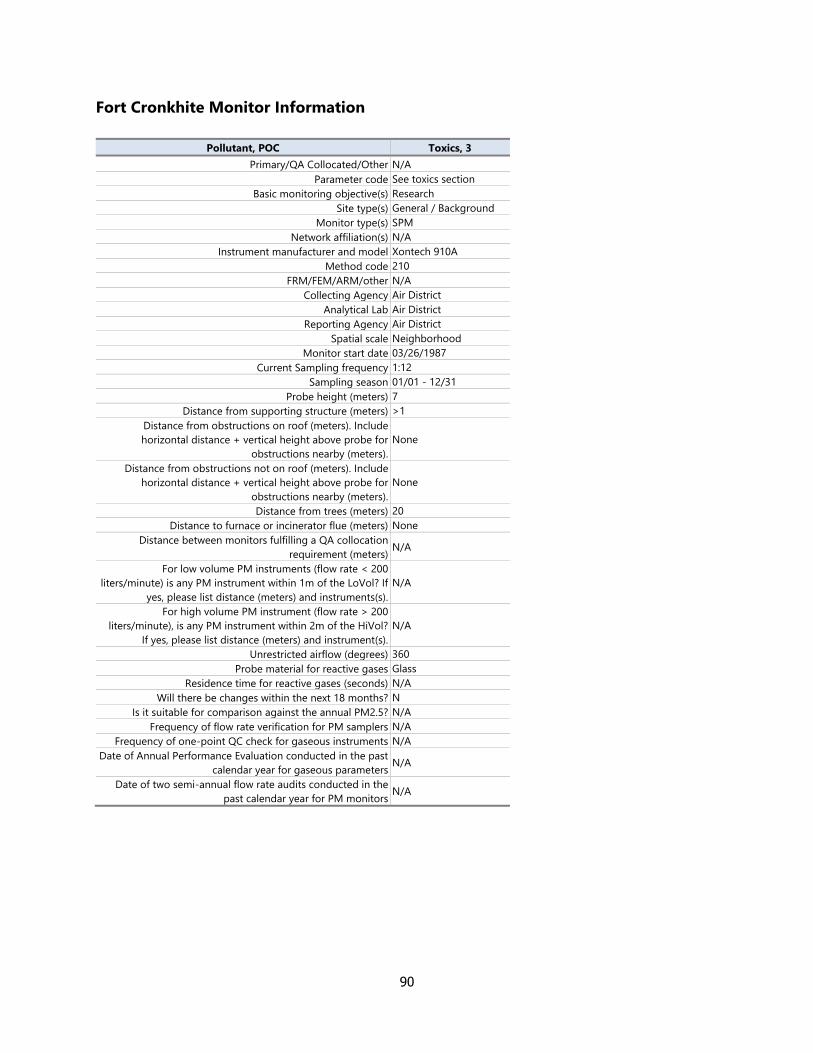
90
Fort Cronkhite Monitor Information
Pollutant, POC Toxics, 3
Primary/QA Collocated/Other N/A
Parameter code See toxics section
Basic monitoring objective(s) Research
Site type(s) General / Background
Monitor type(s) SPM
Network affiliation(s) N/A
Instrument manufacturer and model Xontech 910A
Method code 210
FRM/FEM/ARM/other N/A
Collecting Agency Air District
Analytical Lab Air District
Reporting Agency Air District
Spatial scale Neighborhood
Monitor start date 03/26/1987
Current Sampling frequency 1:12
Sampling season 01/01 - 12/31
Probe height (meters) 7
Distance from supporting structure (meters) >1
Distance from obstructions on roof (meters). Include
horizontal distance + vertical height above probe for
obstructions nearby (meters).
None
Distance from obstructions not on roof (meters). Include
horizontal distance + vertical height above probe for
obstructions nearby (meters).
None
Distance from trees (meters) 20
Distance to furnace or incinerator flue (meters) None
Distance between monitors fulfilling a QA collocation
requirement (meters) N/A
For low volume PM instruments (flow rate < 200
liters/minute) is any PM instrument within 1m of the LoVol? If
yes, please list distance (meters) and instruments(s).
N/A
For high volume PM instrument (flow rate > 200
liters/minute), is any PM instrument within 2m of the HiVol?
If yes, please list distance (meters) and instrument(s).
N/A
Unrestricted airflow (degrees) 360
Probe material for reactive gases Glass
Residence time for reactive gases (seconds) N/A
Will there be changes within the next 18 months? N
Is it suitable for comparison against the annual PM2.5? N/A
Frequency of flow rate verification for PM samplers N/A
Frequency of one-point QC check for gaseous instruments N/A
Date of Annual Performance Evaluation conducted in the past
calendar year for gaseous parameters N/A
Date of two semi-annual flow rate audits conducted in the
past calendar year for PM monitors N/A

91
5.8 Gilroy
Site Information for Gilroy
AQS ID 06-085-0002
GPS coordinates 36.999571, -121.574684
Location Next to water pump station
Address 9th and Princevalle St, Gilroy, CA 95020
County Santa Clara
Distance to road
from gaseous probe (meters)
Princevalle St: 18
9th St: 16
8th St.: 142
10th St: 185
Traffic count (AADT, year)
Princevalle St: 3,627 (2018)
9th St: 1,386 (2019)
8th St.: 2,574 (2019)
10th St: 12,700 (2008)
Traffic counts data were updated on April 1, 2020 and reflect
the latest available data.
Groundcover Paved
Statistical Area San Jose-Sunnyvale-Santa Clara CBSA
Summary for Gilroy
Pollutants Measured O3, PM2.5C
Spatial Scale Neighborhood scale (0.5 - 4 km)
Notes
The site is located in a residential area of Gilroy on the west
side of the Santa Clara Valley where prevailing northwesterly
afternoon winds carry ozone and ozone precursors from the
San Jose area. When temperatures are hot, and solar
insolation is strong, these precursors react and can form
high concentrations of ozone in the Gilroy area. Light winds
combined with surface-based inversions during the winter
months can also cause elevated particulate levels.

92
Gilroy Monitor Information
Pollutant, POC O3, 1 PM2.5, 3
Primary/QA Collocated/Other N/A Primary
Parameter code 44201 88101
Basic monitoring objective(s) NAAQS comparison NAAQS comparison
Site type(s) Population Oriented &
Regional Transport
Population Oriented&
Regional Transport
Monitor type(s) SLAMS SLAMS
Network affiliation(s) N/A N/A
Instrument manufacturer and model TECO 49i Met One FEM BAM 1020
Method code 047 170
FRM/FEM/ARM/other FEM FEM
Collecting Agency Air District Air District
Analytical Lab N/A N/A
Reporting Agency Air District Air District
Spatial scale Neighborhood Neighborhood
Monitor start date 07/01/1980 10/31/2009
Current Sampling frequency Continuous Continuous
Sampling season 01/01 - 12/31 01/01 - 12/31
Probe height (meters) 5 4
Distance from supporting structure (meters) >1 No supporting structure
/ ground level
Distance from obstructions on roof (meters). Include
horizontal distance + vertical height above probe for
obstructions nearby (meters).
None N/A
Distance from obstructions not on roof (meters). Include
horizontal distance + vertical height above probe for
obstructions nearby (meters).
N/A 1.8a
Distance from trees (meters) 26 26
Distance to furnace or incinerator flue (meters) 14 14
Distance between monitors fulfilling a QA collocation
requirement (meters) N/A N/A
For low volume PM instruments (flow rate < 200
liters/minute) is any PM instrument within 1m of the LoVol? If
yes, please list distance (meters) and instruments(s).
N/A No
For high volume PM instrument (flow rate > 200
liters/minute), is any PM instrument within 2m of the HiVol?
If yes, please list distance (meters) and instrument(s).
N/A N/A
Unrestricted airflow (degrees) 360 360
Probe material for reactive gases Teflon N/A
Residence time for reactive gases (seconds) 14 N/A
Will there be changes within the next 18 months? N N
Is it suitable for comparison against the annual PM2.5? N/A Y
Frequency of flow rate verification for PM samplers N/A Bi-weekly
Frequency of one-point QC check for gaseous instruments Every other day N/A
Date of Annual Performance Evaluation conducted in the
past calendar year for gaseous parameters See Table 5.35 N/A
Date of two semi-annual flow rate audits conducted in the
past calendar year for PM monitors N/A See Table 5.35
a The PM2.5 monitor is outdoors, ground based. The probe is 4m above ground. A nearby shelter is 1.8m away and is the eve of the
shelter is 0.12m above the probe height. This is not an obstruction because the probe is more than twice the distance that the eve
extends above the probe. The shelter has a slanted roof that peaks at a height of 3.99m. The probe is 3.9m away from the roof
peak, which is 0.99m above the probe. This is not an obstruction because the probe is more than twice the distance that the roof
peak extends above the probe.
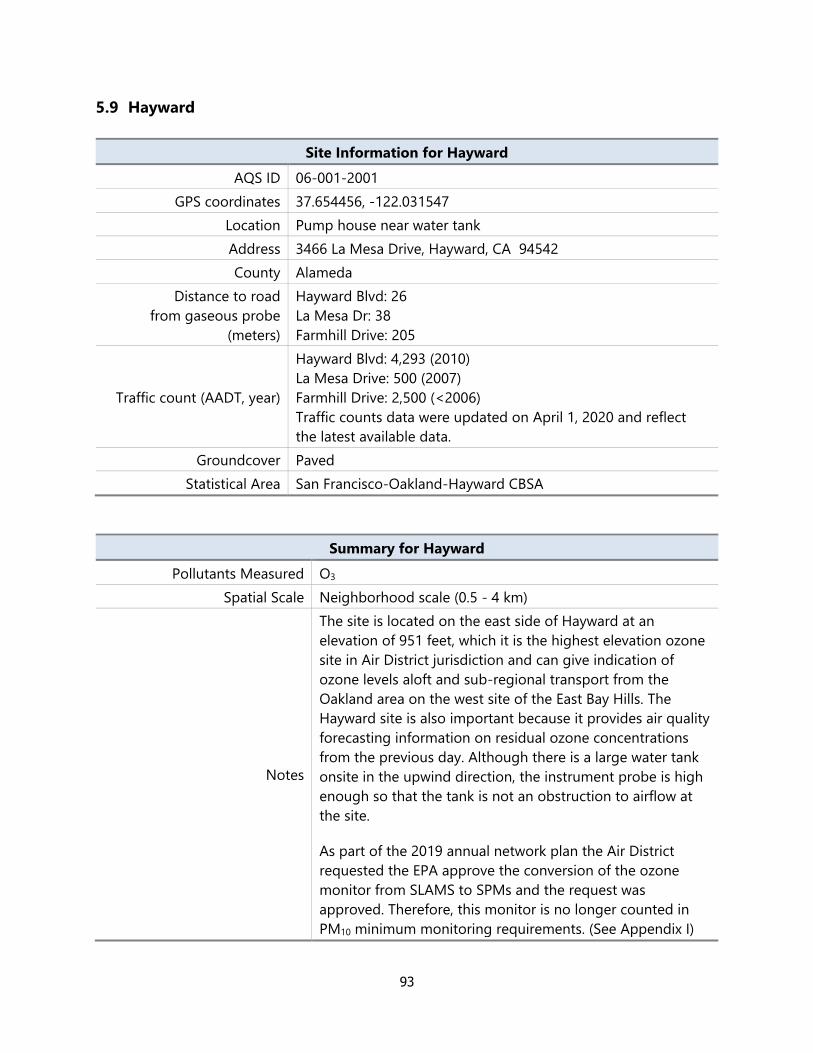
93
5.9 Hayward
Site Information for Hayward
AQS ID 06-001-2001
GPS coordinates 37.654456, -122.031547
Location Pump house near water tank
Address 3466 La Mesa Drive, Hayward, CA 94542
County Alameda
Distance to road
from gaseous probe
(meters)
Hayward Blvd: 26
La Mesa Dr: 38
Farmhill Drive: 205
Traffic count (AADT, year)
Hayward Blvd: 4,293 (2010)
La Mesa Drive: 500 (2007)
Farmhill Drive: 2,500 (<2006)
Traffic counts data were updated on April 1, 2020 and reflect
the latest available data.
Groundcover Paved
Statistical Area San Francisco-Oakland-Hayward CBSA
Summary for Hayward
Pollutants Measured O3
Spatial Scale Neighborhood scale (0.5 - 4 km)
Notes
The site is located on the east side of Hayward at an
elevation of 951 feet, which it is the highest elevation ozone
site in Air District jurisdiction and can give indication of
ozone levels aloft and sub-regional transport from the
Oakland area on the west site of the East Bay Hills. The
Hayward site is also important because it provides air quality
forecasting information on residual ozone concentrations
from the previous day. Although there is a large water tank
onsite in the upwind direction, the instrument probe is high
enough so that the tank is not an obstruction to airflow at
the site.
As part of the 2019 annual network plan the Air District
requested the EPA approve the conversion of the ozone
monitor from SLAMS to SPMs and the request was
approved. Therefore, this monitor is no longer counted in
PM10 minimum monitoring requirements. (See Appendix I)
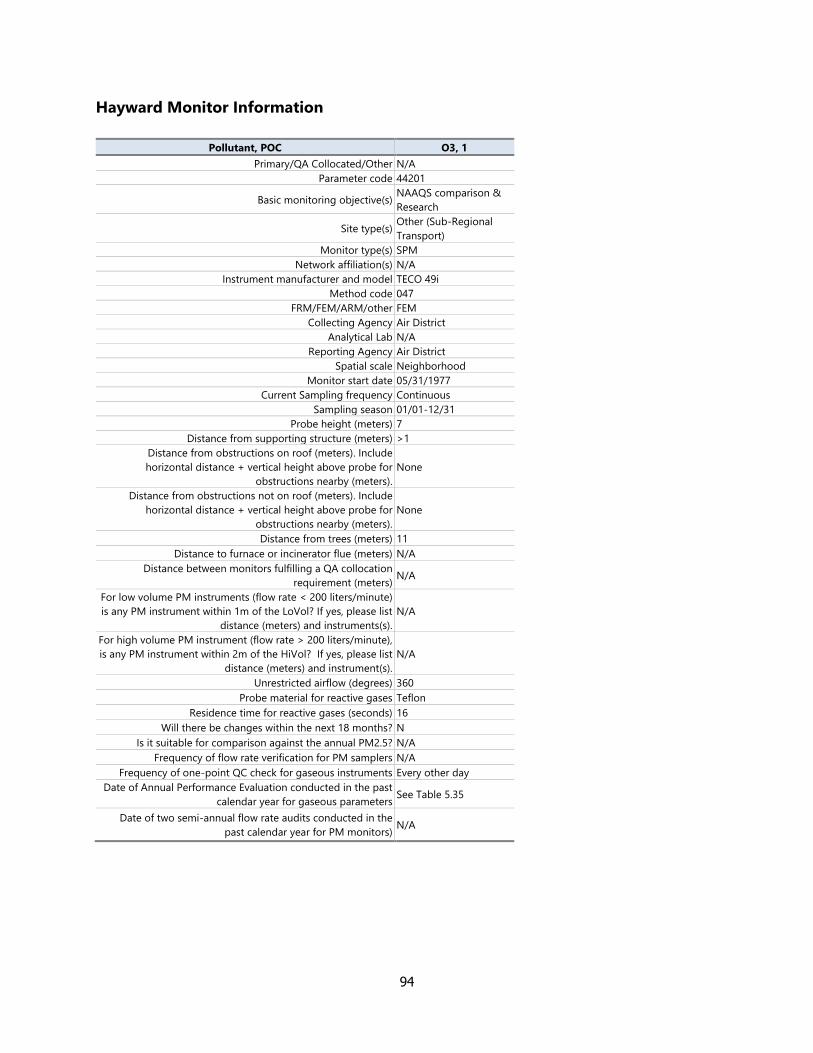
94
Hayward Monitor Information
Pollutant, POC O3, 1
Primary/QA Collocated/Other N/A
Parameter code 44201
Basic monitoring objective(s) NAAQS comparison &
Research
Site type(s) Other (Sub-Regional
Transport)
Monitor type(s) SPM
Network affiliation(s) N/A
Instrument manufacturer and model TECO 49i
Method code 047
FRM/FEM/ARM/other FEM
Collecting Agency Air District
Analytical Lab N/A
Reporting Agency Air District
Spatial scale Neighborhood
Monitor start date 05/31/1977
Current Sampling frequency Continuous
Sampling season 01/01-12/31
Probe height (meters) 7
Distance from supporting structure (meters) >1
Distance from obstructions on roof (meters). Include
horizontal distance + vertical height above probe for
obstructions nearby (meters).
None
Distance from obstructions not on roof (meters). Include
horizontal distance + vertical height above probe for
obstructions nearby (meters).
None
Distance from trees (meters) 11
Distance to furnace or incinerator flue (meters) N/A
Distance between monitors fulfilling a QA collocation
requirement (meters) N/A
For low volume PM instruments (flow rate < 200 liters/minute)
is any PM instrument within 1m of the LoVol? If yes, please list
distance (meters) and instruments(s).
N/A
For high volume PM instrument (flow rate > 200 liters/minute),
is any PM instrument within 2m of the HiVol? If yes, please list
distance (meters) and instrument(s).
N/A
Unrestricted airflow (degrees) 360
Probe material for reactive gases Teflon
Residence time for reactive gases (seconds) 16
Will there be changes within the next 18 months? N
Is it suitable for comparison against the annual PM2.5? N/A
Frequency of flow rate verification for PM samplers N/A
Frequency of one-point QC check for gaseous instruments Every other day
Date of Annual Performance Evaluation conducted in the past
calendar year for gaseous parameters See Table 5.35
Date of two semi-annual flow rate audits conducted in the
past calendar year for PM monitors) N/A

95
5.10 Laney College (near-road)
Site Information for Laney College
AQS ID 06-001-0012
GPS coordinates 37.793624, -122.263376
Location Trailer east of Interstate 880
Address Laney College 8th St. parking lot, Aisle J, Oakland, CA 94607
County Alameda
Distance to road
from gaseous probe
(meters)
I-880: 20
8th St: 116
Fallon St: 130
5th Ave: 419
Traffic count (AADT, year)
Interstate 880: 219,000 (2017)
8th St: 16,055 (2012)
Fallon St: 4,000 (2014)
5th Ave: <5,000 (2014)
Traffic counts data were updated on April 1, 2020 and reflect
the latest available data.
Groundcover Paved
Statistical Area San Francisco-Oakland-Hayward CBSA
Summary for Laney College
Pollutants Measured NOx, CO, PM2.5C, Toxics, BC, UFP
Spatial Scale Microscale (100 m)
Notes
The site is located 20 m downwind of the I-880 (along a
segment of roadway with the 2nd highest Fleet Equivalent
AADT (FE-AADT) in the Bay Area) and designated as a near-
road monitoring site which are a category of sites designed
to representative of population exposure in the near-road
environment. Due to the prevalence of areas that have large
roadways adjacent to population centers, Berkley Aquatic
Park is considered to be representative of area-wide or
neighborhood scale air quality.

96
Laney College Monitor Information Pollutant, POC NO2, 1 CO, 1 PM2.5, 3 BC, 1 Toxics, 3
Primary/QA Collocated/Other Primary N/A Primary N/A N/A
Parameter code 42601 / 42602 42101 88101 84313 See toxics
section
Basic monitoring objective(s) NAAQS
comparison
NAAQS
comparison
NAAQS
comparison
Public
Information Research
Site type(s)
Source Impact &
Population
Oriented
Source Impact &
Population
Oriented
Source Impact
&
Population
Oriented
Source Impact Population
Oriented
Monitor type(s) SLAMS SLAMS SLAMS SPM SPM
Network affiliation(s) Near Road Near Road Near Road N/A N/A
Instrument manufacturer and model TECO 42i TECO 48i Met One FEM
BAM 1020
Teledyne API
AE-633 Xontech 901
Method code 074 054 170 894 210
FRM/FEM/ARM/other FRM FRM FEM N/A N/A
Collecting Agency Air District Air District Air District Air District Air District
Analytical Lab N/A N/A N/A N/A Air District
Reporting Agency Air District Air District Air District Air District Air District
Spatial scale Micro Micro Micro Micro Micro
Monitor start date 02/01/2014 02/01/2014 02/01/2014 02/01/2014 02/04/2014
Current Sampling frequency Continuous Continuous Continuous Continuous 1:12
Sampling season 01/01 – 12/31 01/01 – 12/31 01/01 – 12/31 01/01-12/31 01/01 – 12/31
Probe height (meters) 6 6 5 5 5
Distance from supporting structure (meters) >1 >1 >2 >1 >1
Distance from obstructions on roof (meters). Include
horizontal distance + vertical height above probe for
obstructions nearby (meters).
None None None None None
Distance from obstructions not on roof (meters). Include
horizontal distance + vertical height above probe for
obstructions nearby (meters).
None None None None None
Distance from trees (meters) None None None None None
Distance to furnace or incinerator flue (meters) None None None None None
Distance between monitors fulfilling a QA collocation
requirement (meters) N/A N/A N/A N/A N/A
For low volume PM instruments (flow rate < 200
liters/minute) is any PM instrument within 1m of the LoVol?
If yes, please list distance (meters) and instruments(s).
N/A N/A No N/A N/A
For high volume PM instrument (flow rate > 200
liters/minute), is any PM instrument within 2m of the HiVol?
If yes, please list distance (meters) and instrument(s).
N/A N/A N/A N/A N/A
Unrestricted airflow (degrees) 360 360 360 360 360
Probe material for reactive gases Teflon Teflon N/A N/A Glass
Residence time for reactive gases (seconds) 16 16 N/A N/A N/A
Will there be changes within the next 18 months? N N N N N
Is it suitable for comparison against the annual PM2.5? N/A N/A Y N/A N/A
Frequency of flow rate verification for PM samplers N/A N/A Bi-weekly N/A N/A
Frequency of one-point QC check for gaseous instruments Every other day Every other day N/A N/A N/A
Dates of Annual Performance Evaluation conducted in the
past calendar year for gaseous parameters See Table 5.35 See Table 5.35 N/A N/A N/A
Date of semi-annual flow rate audits conducted in the past
calendar year for PM monitors N/A N/A See Table 5.35 N/A N/A

97
5.11 Livermore
Site Information for Livermore
AQS ID 06-001-0007
GPS coordinates 37.687526, -121.784217
Location One-story commercial building
Address 793 Rincon Avenue, Livermore, CA 94551
County Alameda
Distance to road
from gaseous probe
(meters)
Rincon Ave: 68 Pine St: 95
Interstate 580: 1,320 Portola Ave: 722
Traffic count (AADT, year)
Rincon Ave: 3,091 (2013) Portola Ave: 21,747 (2016)
Pine St: 4,263 (2013) Interstate 580: 202,000 (2016)
Traffic counts data were updated on April 1, 2020 and reflect
the latest available data.
Groundcover Paved
Statistical Area San Francisco-Oakland-Hayward CBSA
Summary for Livermore
Pollutants Measured NOx, CO, PM2.5C, Toxics, BC, UFP
Spatial Scale Neighborhood scale (0.5 - 4 km)
Notes
The site is located west of the city center in a residential
neighborhood within the Livermore Valley, an east-west
oriented inland valley between the San Francisco Bay and
the Central Valley. Livermore can have the highest ozone
levels in the Bay Area when ozone precursors are
transported from the Hayward and Niles Canyon Gaps to
the west, and from the San Ramon Valley to the north. Light
winds combined with surface-based inversions during the
winter months can also cause elevated particulate matter
levels.
Livermore is part of an unofficial PAMS program and
measures hourly speciated hydrocarbons. The EPA approved
a request to conduct PAMS monitoring at Livermore (see
Appendix F). Under this approval, NOy was discontinued at
San Jose - Jackson and will begin at Livermore in 2021.

98
Livermore Monitor Information
Pollutant, POC O3, 1 NO2, 1 PM2.5, 3
Primary/QA Collocated/Other N/A Primary Primary
Parameter code 44201 42601 / 42602 88101
Basic monitoring objective(s) NAAQS comparison NAAQS comparison &
Research NAAQS comparison
Site type(s)
Population Oriented,
Highest
Concentration
Population Oriented Population Oriented&
Highest Conc.
Monitor type(s) SLAMS SLAMS SLAMS
Network affiliation(s) Unofficial PAMS Unofficial PAMS N/A
Instrument manufacturer and model TECO 49i TECO 42i Met One FEM BAM
1020
Method code 047 074 170
FRM/FEM/ARM/other FEM FRM FEM
Collecting Agency Air District Air District Air District
Analytical Lab Air District Air District Air District
Reporting Agency Air District Air District Air District
Spatial scale Neighborhood Neighborhood Neighborhood
Monitor start date 01/01/2000 12/31/1999 03/01/2011
Current Sampling frequency Continuous Continuous Continuous
Sampling season 01/01 - 12/31 01/01 - 12/31 01/01 - 12/31
Probe height (meters) 6 6 5
Distance from supporting structure (meters) >1 >1 >2
Distance from obstructions on roof (meters). Include
horizontal distance + vertical height above probe for
obstructions nearby (meters).
None None None
Distance from obstructions not on roof (meters). Include
horizontal distance + vertical height above probe for
obstructions nearby (meters).
None None None
Distance from trees (meters) 51 51 52
Distance to furnace or incinerator flue (meters) 17 17 21
Distance between monitors fulfilling a QA collocation
requirement (meters) N/A N/A N/A
For low volume PM instruments (flow rate < 200
liters/minute) is any PM instrument within 1m of the LoVol? If
yes, please list distance (meters) and instruments(s).
N/A N/A No
For high volume PM instrument (flow rate > 200
liters/minute), is any PM instrument within 2m of the HiVol?
If yes, please list distance (meters) and instrument(s).
N/A N/A N/A
Unrestricted airflow (degrees) 360 360 360
Probe material for reactive gases Teflon Teflon N/A
Residence time for reactive gases (seconds) 13 13 N/A
Will there be changes within the next 18 months? N N N
Is it suitable for comparison against the annual PM2.5? N/A N/A Y
Frequency of flow rate verification for PM samplers N/A N/A Bi-weekly
Frequency of one-point QC check for gaseous instruments Every other day Every other day N/A
Date of Annual Performance Evaluation conducted in the past
calendar year for gaseous parameters See Table 5.35 See Table 5.35 N/A
Date of two semi-annual flow rate audits conducted in the
past calendar year for PM monitors N/A N/A See Table 5.35

99
Livermore Monitor Information
Pollutant, POC Speciated
PM2.5, 5 BC, 1 Toxics, 3
Primary/QA Collocated/Other Other N/A N/A
Parameter code
88502 (pm mass) –
many others see Section
5.5.1
84313 See toxics section
Basic monitoring objective(s) Research Research Research
Site type(s) Population Oriented Population Oriented Population Oriented
Monitor type(s) SPM SPM SPM
Network affiliation(s) N/A N/A N/A
Instrument manufacturer and model Met One SASS Teledyne API
AE-633 Xontech 901
Method code 810 894 210
FRM/FEM/ARM/other N/A N/A N/A
Collecting Agency Air District Air District Air District
Analytical Lab Air District N/A Air District
Reporting Agency N/A Air District Air District
Spatial scale Neighborhood Neighborhood Neighborhood
Monitor start date 06/11/2008 01/01/2012 01/11/2000
Current Sampling frequency 1:6 Continuous 1:12
Sampling season 01/01 - 12/31 01/01-12/31 01/01 - 12/31
Probe height (meters) 5 6 6
Distance from supporting structure (meters) >2 >1 >1
Distance from obstructions on roof (meters). Include horizontal
distance + vertical height above probe for obstructions nearby
(meters).
None None None
Distance from obstructions not on roof (meters). Include
horizontal distance + vertical height above probe for
obstructions nearby (meters).
None None None
Distance from trees (meters) 55 52 51
Distance to furnace or incinerator flue (meters) 17 17 17
Distance between monitors fulfilling a QA collocation
requirement (meters) N/A N/A N/A
For low volume PM instruments (flow rate < 200 liters/minute)
is any PM instrument within 1m of the LoVol? If yes, please list
distance (meters) and instruments(s).
N/A N/A N/A
For high volume PM instrument (flow rate > 200 liters/minute),
is any PM instrument within 2m of the HiVol? If yes, please list
distance (meters) and instrument(s).
N/A N/A N/A
Unrestricted airflow (degrees) 360 360 270
Probe material for reactive gases N/A N/A Glass
Residence time for reactive gases (seconds) N/A N/A N/A
Will there be changes within the next 18 months? N N N
Is it suitable for comparison against the annual PM2.5? N N/A N/A
Frequency of flow rate verification for PM samplers Monthly N/A N/A
Frequency of one-point QC check for gaseous instruments N/A N/A N/A
Date of Annual Performance Evaluation conducted in the past
calendar year for gaseous parameters N/A N/A N/A
Date of two semi-annual flow rate audits conducted in the past
calendar year for PM monitors See Table 5.35 N/A N/A

100
5.12 Los Gatos
Site Information for Los Gatos
AQS ID 06-085-1001
GPS coordinates 37.226862, -121.979675
Location Top of fire station’s hose drying tower
Address 306 University Ave, Los Gatos, CA 95030
County Santa Clara
Distance to road
From gaseous probe
(meters)
University Ave: 37
Bentley Ave: 27
State Route 17: 291
State Route 9: 121
Traffic count (AADT, year)
University Ave: 13,000 (2016)
Bentley Ave: 1,000 (2020)
State Route 17: 97,000 (2017)
State Route 9: 34,700 (2017)
Traffic counts data were updated on April 1, 2020 and reflect
the latest available data.
Groundcover Paved
Statistical Area San Jose-Sunnyvale-Santa Clara CBSA
Summary for Los Gatos
Pollutants Measured O3
Spatial Scale Neighborhood scale (0.5 - 4 km)
Notes
The site is located in the city of Los Gatos near the
downtown area at a fire station surrounded by residential
neighborhoods. Los Gatos is situated at the base of the
Santa Cruz Mountains where prevailing northerly winds can
transport ozone and ozone precursors from the densely
populated areas of the south bay area.

101
Los Gatos Monitor Information
Pollutant, POC O3, 1
Primary/QA Collocated/Other N/A
Parameter code 44201
Basic monitoring objective(s) NAAQS comparison
Site type(s) Population Oriented
Monitor type(s) SLAMS
Network affiliation(s) N/A
Instrument manufacturer and model TECO 49i
Method code 047
FRM/FEM/ARM/other FEM
Collecting Agency Air District
Analytical Lab N/A
Reporting Agency Air District
Spatial scale Neighborhood
Monitor start date 04/01/1972
Current Sampling frequency Continuous
Sampling season 01/01 - 12/31
Probe height (meters) 11.0
Distance from supporting structure (meters) >1
Distance from obstructions on roof (meters). Include horizontal
distance + vertical height above probe for obstructions nearby
(meters).
N/A
Distance from obstructions not on roof (meters). Include
horizontal distance + vertical height above probe for
obstructions nearby (meters).
N/A
Distance from trees (meters) 16
Distance to furnace or incinerator flue (meters) 4
Distance between monitors fulfilling a QA collocation
requirement (meters) N/A
For low volume PM instruments (flow rate < 200 liters/minute)
is any PM instrument within 1m of the LoVol?
If yes, please list distance (meters) and instruments(s).
N/A
For high volume PM instrument (flow rate > 200 liters/minute),
is any PM instrument within 2m of the HiVol? If yes, please list
distance (meters) and instrument(s).
N/A
Unrestricted airflow (degrees) 360
Probe material for reactive gases Teflon
Residence time for reactive gases (seconds) 16
Will there be changes within the next 18 months? N
Is it suitable for comparison against the annual PM2.5? N/A
Frequency of flow rate verification for PM samplers N/A
Frequency of one-point QC check for gaseous instruments Daily
Date of Annual Performance Evaluation conducted in the past
calendar year for gaseous parameters See Table 5.35
Date of two semi-annual flow rate audits conducted in the past
calendar year for PM monitors N/A

102
5.13 Martinez
Site Information for Martinez
AQS ID 06-013-2001
GPS coordinates 38.012816, -122.134467
Location Small sampling shelter next to fire station
Address 521 Jones St, Martinez, CA 94553
County Contra Costa
Distance to road
from gaseous probe
(meters)
Jones St: 22
Alhambra Ave: 19
Traffic count (AADT, year)
Jones St: 2,000 (2008)
Alhambra Ave: 25,001 (2012)
Traffic counts data were updated on April 1, 2020 reflect the
latest available data.
Groundcover Paved
Statistical Area San Francisco-Oakland-Hayward CBSA
Summary for Martinez
Pollutants Measured SO2, Toxics
Spatial Scale Neighborhood scale (0.5 - 4 km)
Notes
The site is located near downtown Martinez and is 0.5 miles
south of the Shell Refinery and 2.5 miles west of the Tesoro
Refinery. The Carquinez Strait borders the city to the north
and the prevailing winds are typically from the west, but
north and east winds can transport SO2 emissions from
these refineries to the populated areas of the city of
Martinez.

103
Martinez Monitor Information
Pollutant, POC SO2, 1 Toxics, 3
Primary/QA Collocated/Other N/A N/A
Parameter code 42401 See toxics section
Basic monitoring objective(s) NAAQS comparison Research
Site type(s) Population Oriented &
Source Impact Population Oriented
Monitor type(s) SLAMS SPM
Network affiliation(s) N/A N/A
Instrument manufacturer and model TECO 43i Xontech 901
Method code 060 210
FRM/FEM/ARM/other FEM N/A
Collecting Agency Air District Air District
Analytical Lab N/A Air District
Reporting Agency Air District Air District
Spatial scale Neighborhood Neighborhood
Monitor start date 07/02/1973 06/01/2002
Current Sampling frequency Continuous 1:12
Sampling season 01/01 - 12/31 01/01 - 12/31
Probe height (meters) 7 7
Distance from supporting structure (meters) >1 >1
Distance from obstructions on roof (meters). Include
horizontal distance + vertical height above probe for
obstructions nearby (meters).
None None
Distance from obstructions not on roof (meters). Include
horizontal distance + vertical height above probe for
obstructions nearby (meters).
None None
Distance from trees (meters) 11 11
Distance to furnace or incinerator flue (meters) None None
Distance between monitors fulfilling a QA collocation
requirement (meters) N/A N/A
For low volume PM instruments (flow rate < 200 liters/minute)
is any PM instrument within 1m of the LoVol? If yes, please list
distance (meters) and instruments(s).
N/A N/A
For high volume PM instrument (flow rate > 200 liters/minute),
is any PM instrument within 2m of the HiVol? If yes, please list
distance (meters) and instrument(s).
N/A N/A
Unrestricted airflow (degrees) 360 360
Probe material for reactive gases Teflon Glass
Residence time for reactive gases (seconds) 13 N/A
Will there be changes within the next 18 months? N N
Is it suitable for comparison against the annual PM2.5? N/A N/A
Frequency of flow rate verification for PM samplers N/A N/A
Frequency of one-point QC check for gaseous instruments Every other day N/A
Date of Annual Performance Evaluation conducted in the past
calendar year for gaseous parameters See Table 5.35 N/A
Date of two semi-annual flow rate audits conducted in the
past calendar year for PM monitors N/A N/A

104
5.14 Napa Valley College
Site Information for Napa Valley College
AQS ID 06-055-0004
GPS coordinates 38.278849, -122.275024
Location Trailer in parking lot
Address North College Parking, Napa, CA 94558
County Napa
Distance to road
from gaseous probe (meters)
Napa Valley Hwy Rt 221: 100
Imola Ave Rt 121: 200
Traffic count (AADT, year)
Napa Valley Hwy Rt 221: 36,000 (2017)
Imola Ave (Route 121): 25,400 (2017)
Traffic counts data were updated on April 1, 2020 and reflect
the latest available data
Groundcover Paved
Statistical Area Napa CBSA
Summary for Napa Valley College
Pollutants Measured O3, NOx, CO, PM10, PM2.5C, Toxics
Spatial Scale Neighborhood scale (0.5 - 4 km)
Notes
The site is located in the Napa Valley about 2 miles south of
downtown Napa in an open space near a mixed residential
and commercial neighborhood with no large industrial
sources in the immediate vicinity. In summer months, Napa
can have elevated ozone levels when central Bay Area ozone
precursors are transported north to the city. Agricultural
burning and fireplace usage during the fall and winter
months can also result in high particulate matter
concentrations.
The site was opened on April 1, 2018 as a replacement to
the Napa – Jefferson St. site. The Napa site relocation
request was approved by EPA on June 12, 2015 (see
Appendix I)

105
Napa Valley College Monitor Information
Pollutant, POC O3, 1 NO2, 1 CO, 1
Primary/QA Collocated/Other Primary Primary N/A
Parameter code 44201 42601 / 42602 42101
Basic monitoring objective(s) NAAQS
comparison
NAAQS
comparison
NAAQS
comparison
Site type(s) Population
Oriented
Population
Oriented
Population
Oriented
Monitor type(s) SLAMS SLAMS SLAMS
Network affiliation(s) N/A N/A N/A
Instrument manufacturer and model TECO 49c TECO 42i TECO 48i
Method code 047 074 054
FRM/FEM/ARM/other FEM FRM FRM
Collecting Agency Air District Air District Air District
Analytical Lab N/A N/A N/A
Reporting Agency Air District Air District Air District
Spatial scale Neighborhood Neighborhood Neighborhood
Monitor start date 04/01/2018 04/01/2018 04/01/2018
Current Sampling frequency Continuous Continuous Continuous
Sampling season 01/01 – 12/31 01/01 – 12/31 01/01 – 12/31
Probe height (meters) 5 5 5
Distance from supporting structure (meters) >1 >1 >1
Distance from obstructions on roof (meters). Include
horizontal distance + vertical height above probe for
obstructions nearby (meters).
None None None
Distance from obstructions not on roof (meters). Include
horizontal distance + vertical height above probe for
obstructions nearby (meters).
None None None
Distance from trees (meters) N/A N/A N/A
Distance to furnace or incinerator flue (meters) N/A N/A N/A
Distance between monitors fulfilling a QA collocation
requirement (meters) N/A N/A N/A
For low volume PM instruments (flow rate < 200
liters/minute) is any PM instrument within 1m of the LoVol?
If yes, please list distance (meters) and instruments(s).
N/A N/A N/A
For high volume PM instrument (flow rate > 200
liters/minute), is any PM instrument within 2m of the HiVol?
If yes, please list distance (meters) and instrument(s).
N/A N/A N/A
Unrestricted airflow (degrees) 360 360 360
Probe material for reactive gases Teflon Teflon Teflon
Residence time for reactive gases (seconds) 12 15 14
Will there be changes within the next 18 months? N N N
Is it suitable for comparison against the annual PM2.5? N/A N/A N/A
Frequency of flow rate verification for PM samplers N/A N/A N/A
Frequency of one-point QC check for gaseous instruments Every other day Every other day Every other day
Dates of Annual Performance Evaluation conducted in the
past calendar year for gaseous parameters See Table 5.35 See Table 5.35 See Table 5.35
Date of semi-annual flow rate audits conducted in the past
calendar year for PM monitors N/A N/A N/A

106
Napa Valley College Monitor Information
Pollutant, POC PM10, 1 PM2.5, 3 Toxics, 3
Primary/QA Collocated/Other Primary Primary N/A
Parameter code 81102 88101 See toxics
section
Basic monitoring objective(s) NAAQS
comparison
NAAQS
comparison Research
Site type(s) Population
Oriented
Population
Oriented &
Highest Conc.
Population
Oriented
Monitor type(s) SLAMS SLAMS SPM
Network affiliation(s) N/A N/A N/A
Instrument manufacturer and model Tisch Env. HiVol
TE-60
Met One FEM
BAM 1020 Xontech 901
Method code 141 170 210
FRM/FEM/ARM/other FRM FEM N/A
Collecting Agency Air District Air District Air District
Analytical Lab Air District N/A Air District
Reporting Agency Air District Air District Air District
Spatial scale Neighborhood Neighborhood Neighborhood
Monitor start date 09/23/2002 04/01/2018 04/01/2018
Current Sampling frequency 1:6 Continuous 1:12
Sampling season 01/01 – 12/31 01/01 – 12/31 01/01 – 12/31
Probe height (meters) 4 5 5
Distance from supporting structure (meters) >2 >2 >1
Distance from obstructions on roof (meters). Include
horizontal distance + vertical height above probe for
obstructions nearby (meters).
None None None
Distance from obstructions not on roof (meters). Include
horizontal distance + vertical height above probe for
obstructions nearby (meters).
None None None
Distance from trees (meters) N/A N/A N/A
Distance to furnace or incinerator flue (meters) N/A N/A N/A
Distance between monitors fulfilling a QA collocation
requirement (meters) N/A N/A N/A
For low volume PM instruments (flow rate < 200
liters/minute) is any PM instrument within 1m of the LoVol?
If yes, please list distance (meters) and instruments(s).
N/A N/A N/A
For high volume PM instrument (flow rate > 200
liters/minute), is any PM instrument within 2m of the HiVol?
If yes, please list distance (meters) and instrument(s).
No N/A N/A
Unrestricted airflow (degrees) 360 360 360
Probe material for reactive gases N/A N/A Glass
Residence time for reactive gases (seconds) N/A N/A N/A
Will there be changes within the next 18 months? N N N
Is it suitable for comparison against the annual PM2.5? N/A Y N/A
Frequency of flow rate verification for PM samplers Quarterly Bi-weekly N/A
Frequency of one-point QC check for gaseous instruments N/A N/A N/A
Dates of Annual Performance Evaluation conducted in the
past calendar year for gaseous parameters N/A N/A N/A
Date of semi-annual flow rate audits conducted in the past
calendar year for PM monitors See Table 5.35 See Table 5.35 N/A

107
5.15 Oakland East
Site Information for Oakland East
AQS ID 06-001-0009
GPS coordinates 37.743065, -122.169935
Location Two-story commercial building
Address 9925 International Blvd, Oakland, CA 94603
County Alameda
Distance to road
from gaseous probe (meters)
International Blvd: 19
98th St: 43
99th St: 23
Traffic count (AADT, year)
International Blvd: 21,988 (2011)
98th St: 31,340 (<2006)
99th St: 100 (2008)
Traffic counts data were updated on April 1, 2020 and
reflect the latest available data.
Groundcover Paved
Statistical Area San Francisco-Oakland-Hayward CBSA
Summary for Oakland East
Pollutants Measured O3, NOx, CO, PM2.5C, Toxics
Spatial Scale Middle scale (100 m – 500 m)
Notes
The site is located seven miles southeast of downtown
Oakland, on a commercial strip in a residential area. Oakland
is the largest city in Alameda County, with a population of
approximately 400,000 and has large emission sources
within its boundaries, such as a major maritime port, an
international airport, extensive areas of industry, and several
major freeways. These sources have the potential to emit
significant amounts of ozone precursors, particulates and
toxic compounds. Light winds combined with wood burning,
vehicular traffic, and surface-based inversions during winter
can also cause elevated particulate concentrations.
The spatial scale of representativeness for ozone and PM2.5
is middle scale based on the distance to roadways and
traffic counts. Based on an EPA Region 9 review of the
requirements, the Ozone monitor was changed from a
SLAMS to SPM. Consequently, this monitor cannot be used
108
Summary for Oakland East
toward meeting the minimum monitoring requirements for
ozone. However, the Air District considers the PM2.5
monitor to represent area-wide air quality and, therefore,
comparable to the NAAQS because the site represents many
similar locations throughout the metropolitan area.

109
Oakland East Monitor Information
Pollutant, POC O3, 1 CO, 1 NO2, 1
Primary/QA Collocated/Other N/A N/A Primary
Parameter code 44201 42101 42601 / 42602
Basic monitoring objective(s) Research NAAQS
comparison
NAAQS
comparison
Site type(s) Population
Oriented
Population
Oriented
Population
Oriented
Monitor type(s) SPM SLAMS SLAMS
Network affiliation(s) N/A N/A N/A
Instrument manufacturer and model TECO 49i TECO 48i TECO 42i
Method code 047 054 074
FRM/FEM/ARM/other FEM FRM FRM
Collecting Agency Air District Air District Air District
Analytical Lab N/A N/A N/A
Reporting Agency Air District Air District Air District
Spatial scale Middle Middle Middle
Monitor start date 11/01/2007 11/01/2007 11/01/2007
Current Sampling frequency Continuous Continuous Continuous
Sampling season 01/01 – 12/31 01/01 – 12/31 01/01 – 12/31
Probe height (meters) 10 10 10
Distance from supporting structure (meters) >1 >1 >1
Distance from obstructions on roof (meters). Include
horizontal distance + vertical height above probe for
obstructions nearby (meters).
None None None
Distance from obstructions not on roof (meters). Include
horizontal distance + vertical height above probe for
obstructions nearby (meters).
None None None
Distance from trees (meters) 21 21 21
Distance to furnace or incinerator flue (meters) 8 8 8
Distance between monitors fulfilling a QA collocation
requirement (meters) N/A N/A N/A
For low volume PM instruments (flow rate < 200
liters/minute) is any PM instrument within 1m of the LoVol? If
yes, please list distance (meters) and instruments(s).
N/A N/A N/A
For high volume PM instrument (flow rate > 200
liters/minute), is any PM instrument within 2m of the HiVol?
If yes, please list distance (meters) and instrument(s).
N/A N/A N/A
Unrestricted airflow (degrees) 360 360 360
Probe material for reactive gases Teflon Teflon Teflon
Residence time for reactive gases (seconds) 15 16 16
Will there be changes within the next 18 months? N N N
Is it suitable for comparison against the annual PM2.5? N/A N/A N/A
Frequency of flow rate verification for PM samplers N/A N/A N/A
Frequency of one-point QC check for gaseous instruments Every other day Every other day Every other day
Date of Annual Performance Evaluation conducted in the
past calendar year for gaseous parameters See Table 5.35 See Table 5.35 See Table 5.35
Date of two semi-annual flow rate audits conducted in the
past calendar year for PM monitors N/A N/A N/A

110
Oakland East Monitor Information
Pollutant, POC PM2.5, 3 Toxics, 3
Primary/QA Collocated/Other Primary N/A
Parameter code 88101 See toxics section
Basic monitoring objective(s) NAAQS comparison Research
Site type(s) Population Oriented Population Oriented
Monitor type(s) SLAMS SPM
Network affiliation(s) N/A N/A
Instrument manufacturer and model Met One FEM BAM 1020 Xontech 901
Method code 170 210
FRM/FEM/ARM/other FEM N/A
Collecting Agency Air District Air District
Analytical Lab N/A Air District
Reporting Agency Air District Air District
Spatial scale Middle Middle
Monitor start date 10/01/2009 11/01/2007
Current Sampling frequency Continuous 1:12
Sampling season 01/01 – 12/31 01/01 – 12/31
Probe height (meters) 7 9
Distance from supporting structure (meters) >2 >1
Distance from obstructions on roof (meters). Include
horizontal distance + vertical height above probe for
obstructions nearby (meters).
None None
Distance from obstructions not on roof (meters). Include
horizontal distance + vertical height above probe for
obstructions nearby (meters).
None None
Distance from trees (meters) 21 21
Distance to furnace or incinerator flue (meters) 5 8
Distance between monitors fulfilling a QA collocation
requirement (meters) N/A N/A
For low volume PM instruments (flow rate < 200
liters/minute) is any PM instrument within 1m of the LoVol? If
yes, please list distance (meters) and instruments(s).
No N/A
For high volume PM instrument (flow rate > 200
liters/minute), is any PM instrument within 2m of the HiVol?
If yes, please list distance (meters) and instrument(s).
N/A N/A
Unrestricted airflow (degrees) 360 360
Probe material for reactive gases N/A Glass
Residence time for reactive gases (seconds) N/A N/A
Will there be changes within the next 18 months? N N
Is it suitable for comparison against the annual PM2.5? Y N/A
Frequency of flow rate verification for PM samplers Bi-weekly N/A
Frequency of one-point QC check for gaseous instruments N/A N/A
Date of Annual Performance Evaluation conducted in the
past calendar year for gaseous parameters N/A N/A
Date of two semi-annual flow rate audits conducted in the
past calendar year for PM monitors See Table 5.35 N/A
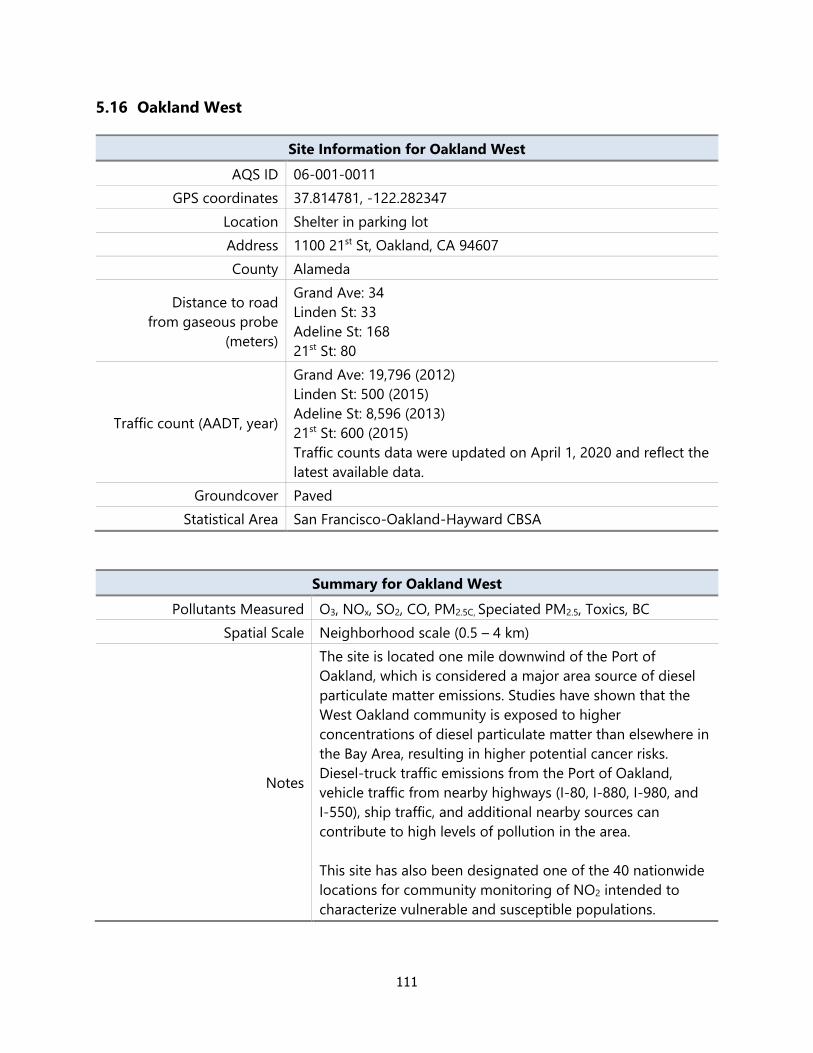
111
5.16 Oakland West
Site Information for Oakland West
AQS ID 06-001-0011
GPS coordinates 37.814781, -122.282347
Location Shelter in parking lot
Address 1100 21st St, Oakland, CA 94607
County Alameda
Distance to road
from gaseous probe
(meters)
Grand Ave: 34
Linden St: 33
Adeline St: 168
21st St: 80
Traffic count (AADT, year)
Grand Ave: 19,796 (2012)
Linden St: 500 (2015)
Adeline St: 8,596 (2013)
21st St: 600 (2015)
Traffic counts data were updated on April 1, 2020 and reflect the
latest available data.
Groundcover Paved
Statistical Area San Francisco-Oakland-Hayward CBSA
Summary for Oakland West
Pollutants Measured O3, NOx, SO2, CO, PM2.5C, Speciated PM2.5, Toxics, BC
Spatial Scale Neighborhood scale (0.5 – 4 km)
Notes
The site is located one mile downwind of the Port of
Oakland, which is considered a major area source of diesel
particulate matter emissions. Studies have shown that the
West Oakland community is exposed to higher
concentrations of diesel particulate matter than elsewhere in
the Bay Area, resulting in higher potential cancer risks.
Diesel-truck traffic emissions from the Port of Oakland,
vehicle traffic from nearby highways (I-80, I-880, I-980, and
I-550), ship traffic, and additional nearby sources can
contribute to high levels of pollution in the area.
This site has also been designated one of the 40 nationwide
locations for community monitoring of NO2 intended to
characterize vulnerable and susceptible populations.

112
Oakland West Monitor Information
Pollutant, POC O3, 1 CO, 1 NO2, 1 SO2, 1
Primary/QA Collocated/Other N/A N/A Primary N/A
Parameter code 44201 42101 42601 / 42602 42401
Basic monitoring objective(s) NAAQS
comparison
NAAQS
comparison
NAAQS
comparison
NAAQS
comparison
Site type(s) Population
Oriented
Population
Oriented
Population
Oriented
Population
Oriented
Monitor type(s) SLAMS SLAMS SLAMS SLAMS
Network affiliation(s) N/A N/A N/A N/A
Instrument manufacturer and model TECO 49i TECO 48i TECO 42i TECO 43i
Method code 047 054 074 060
FRM/FEM/ARM/other FEM FRM FRM FEM
Collecting Agency Air District Air District Air District Air District
Analytical Lab N/A N/A N/A N/A
Reporting Agency Air District Air District Air District Air District
Spatial scale Neighborhood Neighborhood Neighborhood Neighborhood
Monitor start date 12/13/2010 02/25/2009 02/25/2009 02/25/2009
Current Sampling frequency Continuous Continuous Continuous Continuous
Sampling season 01/01 – 12/31 01/01 – 12/31 01/01 – 12/31 01/01 – 12/31
Probe height (meters) 6 6 6 6
Distance from supporting structure (meters) >1 >1 >1 >1
Distance from obstructions on roof (meters). Include
horizontal distance + vertical height above probe for
obstructions nearby (meters).
None None None None
Distance from obstructions not on roof (meters). Include
horizontal distance + vertical height above probe for
obstructions nearby (meters).
None None None None
Distance from trees (meters) 40 40 40 40
Distance to furnace or incinerator flue (meters) None None None None
Distance between monitors fulfilling a QA collocation
requirement (meters) N/A N/A N/A N/A
For low volume PM instruments (flow rate < 200
liters/minute) is any PM instrument within 1m of the LoVol?
If yes, please list distance (meters) and instruments(s).
N/A N/A N/A N/A
For high volume PM instrument (flow rate > 200
liters/minute), is any PM instrument within 2m of the HiVol?
If yes, please list distance (meters) and instrument(s).
N/A N/A N/A N/A
Unrestricted airflow (degrees) 360 360 360 360
Probe material for reactive gases Teflon Teflon Teflon Teflon
Residence time for reactive gases (seconds) 12 12 13 12
Will there be changes within the next 18 months? N N N N
Is it suitable for comparison against the annual PM2.5? N/A N/A N/A N/A
Frequency of flow rate verification for PM samplers N/A N/A N/A N/A
Frequency of one-point QC check for gaseous instruments Every other day Every other day Every other day Every other day
Date of Annual Performance Evaluation conducted in the
past calendar year for gaseous parameters See Table 5.35 See Table 5.35 See Table 5.35 See Table 5.35
Date of two semi-annual flow rate audits conducted in the
past calendar year for PM monitors N/A N/A N/A N/A

113
Oakland West Monitor Information
Pollutant, POC PM2.5, 3 Speciated PM2.5, 5 BC, 1 Toxics, 3
Primary/QA Collocated/Other Primary Other N/A N/A
Parameter code 88101
88502 (pm mass) –
many others see
SASS section
84313 See toxics section
Basic monitoring objective(s) NAAQS comparison Research Research Research
Site type(s)
Population Oriented,
Highest
Concentration
Population Oriented Population Oriented Population Oriented
Monitor type(s) SLAMS SPM SPM SPM
Network affiliation(s) N/A N/A N/A N/A
Instrument manufacturer and model Met One FEM BAM
1020 Met One SASS
Teledyne API
AE-633 Xontech 910A
Method code 170 810 894 210
FRM/FEM/ARM/other FEM N/A N/A N/A
Collecting Agency Air District Air District Air District Air District
Analytical Lab N/A Air District N/A Air District
Reporting Agency Air District N/A Air District Air District
Spatial scale Neighborhood Neighborhood Neighborhood Neighborhood
Monitor start date 12/18/2012 02/12/2009 03/17/2009 03/02/2009
Current Sampling frequency Continuous 1:6 Continuous 1:12
Sampling season 01/01 – 12/31 01/01 – 12/31 01/01 – 12/31 01/01 – 12/31
Probe height (meters) 5 5 5 6
Distance from supporting structure (meters) >2 >2 >1 >1
Distance from obstructions on roof (meters). Include
horizontal distance + vertical height above probe for
obstructions nearby (meters).
None None None None
Distance from obstructions not on roof (meters). Include
horizontal distance + vertical height above probe for
obstructions nearby (meters).
None None None None
Distance from trees (meters) 40 39 40 40
Distance to furnace or incinerator flue (meters) None None None None
Distance between monitors fulfilling a QA collocation
requirement (meters) N/A N/A N/A N/A
For low volume PM instruments (flow rate < 200
liters/minute) is any PM instrument within 1m of the LoVol? If
yes, please list distance (meters) and instruments(s).
No No N/A N/A
For high volume PM instrument (flow rate > 200
liters/minute), is any PM instrument within 2m of the HiVol?
If yes, please list distance (meters) and instrument(s).
N/A N/A N/A N/A
Unrestricted airflow (degrees) 360 360 360 360
Probe material for reactive gases N/A N/A Glass Glass
Residence time for reactive gases (seconds) N/A N/A N/A N/A
Will there be changes within the next 18 months? N N N N
Is it suitable for comparison against the annual PM2.5? Y N N/A N/A
Frequency of flow rate verification for PM samplers Bi-weekly Monthly N/A N/A
Frequency of one-point QC check for gaseous instruments N/A N/A N/A N/A
Date of Annual Performance Evaluation conducted in the past
calendar year for gaseous parameters N/A N/A N/A N/A
Date of two semi-annual flow rate audits conducted in the
past calendar year for PM monitors See Table 5.35 See Table 5.35 N/A N/A

114
5.17 Palo Alto Airport
Site Information for Palo Alto Airport
AQS ID 06-085-2010
GPS coordinates 37.457621, -122.112286
Location The end of the runway in the aircraft run-up zone
Address 1925 Embarcadero Road, Palo Alto, CA 94303
County Santa Clara
Groundcover Paved
Statistical Area San Jose-Sunnyvale-Santa Clara CBSA
Summary for Palo Alto Airport
Pollutants Measured Lead (TSP) [not operational in 2021]
Spatial Scale Micro scale (100 m)
Notes
The site is located just south of the runway at the Palo Alto
Airport and was one of the 15 airports chosen by EPA for
required TSP-lead monitoring due to expected lead emissions
from piston engine aircraft utilizing this airport.
Lead monitoring at this site began on February 3, 2012 but
was extended indefinitely because monitoring results showed
that lead concentrations exceed 50% of the NAAQS in all but
one of the rolling three-month quarters since monitoring
began. Lead monitoring ended on December 19, 2014,
because Santa Clara County sold the property to the City of
Palo Alto. The sale triggered an FAA review of various
operational plans and permits, revealing that the lead sampler
location violated FAA regulations. The closure date in AQS is
December 23, 2014 (the date of the last audit). The Air District
continues to work EPA to identify a suitable alternative.

115
Palo Alto Airport Monitor Information
Pollutant, POC Lead (TSP), 3
Primary/QA Collocated/Other Primary
Parameter code 14129
Basic monitoring objective(s) NAAQS Comparison &
Research
Site type(s) Source Oriented
Monitor type(s) SLAMS
Network affiliation(s) N/A
Instrument manufacturer and model Tisch TE-HVPLUS-BL
Method code 191
FRM/FEM/ARM/other FEM
Collecting Agency Air District
Analytical Lab RTI
Reporting Agency Air District
Spatial scale Micro
Monitor start date 02/03/2012
Current Sampling frequency 1:6
Sampling season 01/01 - 12/31
Probe height (meters) 2.0
Distance from supporting structure (meters) N/A
Distance from obstructions on roof (meters). Include
horizontal distance + vertical height above probe for
obstructions nearby (meters).
None
Distance from obstructions not on roof (meters). Include
horizontal distance + vertical height above probe for
obstructions nearby (meters).
None
Distance from trees (meters) >20
Distance to furnace or incinerator flue (meters) None
Distance between monitors fulfilling a QA collocation
requirement (meters) N/A
For low volume PM instruments (flow rate < 200
liters/minute) is any PM instrument within 1m of the LoVol? If
yes, please list distance (meters) and instruments(s).
N/A
For high volume PM instrument (flow rate > 200
liters/minute), is any PM instrument within 2m of the HiVol?
If yes, please list distance (meters) and instrument(s).
No
Unrestricted airflow (degrees) 360
Probe material for reactive gases N/A
Residence time for reactive gases (seconds) N/A
Will there be changes within the next 18 months?
Yes – closed Dec 2014,
working with EPA on
alternative
Is it suitable for comparison against the annual PM2.5? N/A
Frequency of flow rate verification for PM samplers Quarterly
Frequency of one-point QC check for gaseous instruments N/A
Date of Annual Performance Evaluation conducted in the
past calendar year for gaseous parameters N/A
Date of two semi-annual flow rate audits conducted in the
past calendar year for PM monitors
Site closed Dec 2014 due to
FAA violations in siting

116
5.18 Pittsburg
Site Information for Pittsburg
AQS ID Not applicable
GPS coordinates 38.007069, -121.868056
Location Shelter
Address 1398 E Leland Rd, Pittsburg, CA, 94565
County Contra Costa
Distance to road
from gaseous probe
(meters)
E Leland Rd: 75
Loveridge Rd: 260
Traffic count (AADT, year)
E Leland Rd: 25,080 (2006)
Loveridge Rd: 23,432 (2006)
Traffic counts data were updated on April 1, 2020 and reflect
the latest available data.
Groundcover Vegetative
Statistical Area San Francisco-Oakland-Hayward CBSA
Summary for Pittsburg
Pollutants Measured Toxics, BC
Spatial Scale Neighborhood scale (0.5 – 4 km)
Notes
The site is in the urban area of Pittsburg and located along a
transport corridor between the Bay Area and the Central
Valley, which is in the vicinity/downwind of several industrial
facilities along the Carquinez Strait.
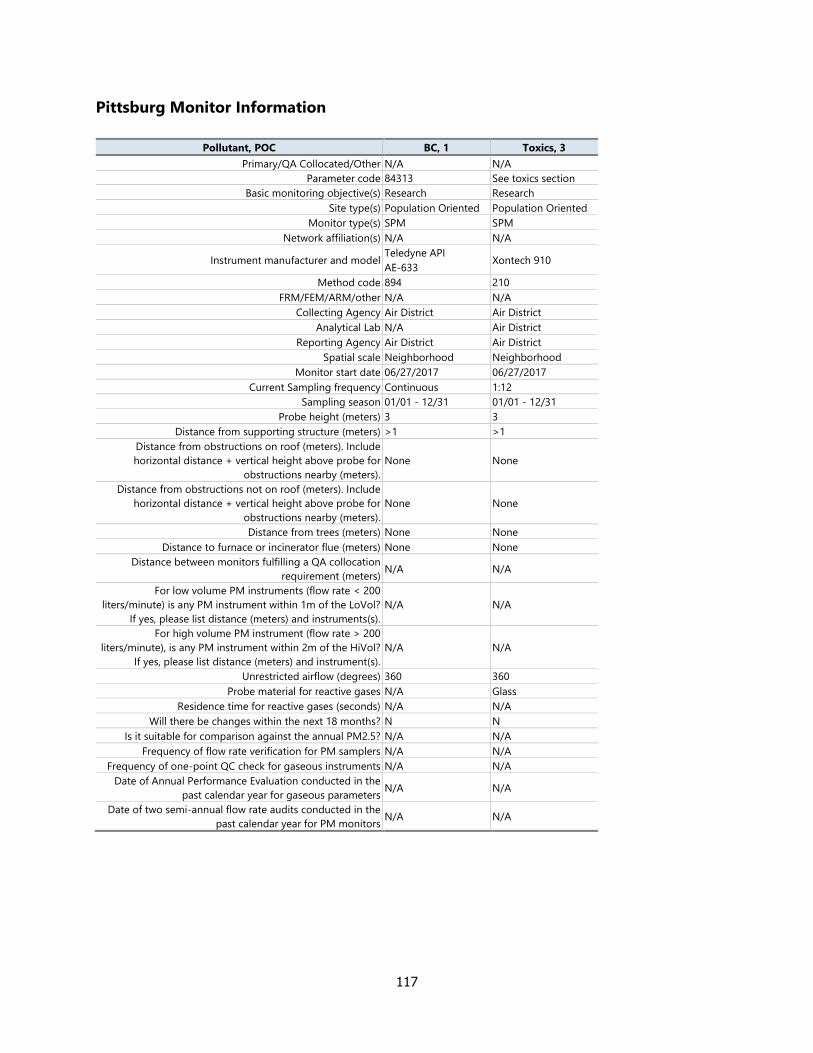
117
Pittsburg Monitor Information
Pollutant, POC BC, 1 Toxics, 3
Primary/QA Collocated/Other N/A N/A
Parameter code 84313 See toxics section
Basic monitoring objective(s) Research Research
Site type(s) Population Oriented Population Oriented
Monitor type(s) SPM SPM
Network affiliation(s) N/A N/A
Instrument manufacturer and model Teledyne API
AE-633 Xontech 910
Method code 894 210
FRM/FEM/ARM/other N/A N/A
Collecting Agency Air District Air District
Analytical Lab N/A Air District
Reporting Agency Air District Air District
Spatial scale Neighborhood Neighborhood
Monitor start date 06/27/2017 06/27/2017
Current Sampling frequency Continuous 1:12
Sampling season 01/01 - 12/31 01/01 - 12/31
Probe height (meters) 3 3
Distance from supporting structure (meters) >1 >1
Distance from obstructions on roof (meters). Include
horizontal distance + vertical height above probe for
obstructions nearby (meters).
None None
Distance from obstructions not on roof (meters). Include
horizontal distance + vertical height above probe for
obstructions nearby (meters).
None None
Distance from trees (meters) None None
Distance to furnace or incinerator flue (meters) None None
Distance between monitors fulfilling a QA collocation
requirement (meters) N/A N/A
For low volume PM instruments (flow rate < 200
liters/minute) is any PM instrument within 1m of the LoVol?
If yes, please list distance (meters) and instruments(s).
N/A N/A
For high volume PM instrument (flow rate > 200
liters/minute), is any PM instrument within 2m of the HiVol?
If yes, please list distance (meters) and instrument(s).
N/A N/A
Unrestricted airflow (degrees) 360 360
Probe material for reactive gases N/A Glass
Residence time for reactive gases (seconds) N/A N/A
Will there be changes within the next 18 months? N N
Is it suitable for comparison against the annual PM2.5? N/A N/A
Frequency of flow rate verification for PM samplers N/A N/A
Frequency of one-point QC check for gaseous instruments N/A N/A
Date of Annual Performance Evaluation conducted in the
past calendar year for gaseous parameters N/A N/A
Date of two semi-annual flow rate audits conducted in the
past calendar year for PM monitors N/A N/A

118
5.19 Pleasanton (near-road)
Site Information for Pleasanton
AQS ID 06-001-0015
GPS coordinates 37.701222, -121.903019
Location Interstate 580 near Hopyard interchange
Address Owen’s Court, Pleasanton, CA
County Alameda
Distance to road
from gaseous probe
(meters)
Owen’s Court: 53
I-580: 179
Traffic count (AADT, year)
Owen’s Court: 21,800 (2018)
I-580: 231,500 (2016)
Traffic counts data were updated on April 1, 2020 and reflect
the latest available data.
Groundcover Gravel
Statistical Area San Francisco-Oakland-Hayward CBSA
Summary for Pleasanton
Pollutants Measured NOx, CO, PM2.5C, Toxics
Spatial Scale Microscale (100 m)
Notes
The site is in a commercial area in the city of Pleasanton and
179 m downwind from the I-580 and designated as a near-
road monitoring site which are a category of sites designed
to representative of population exposure in the near-road
environment. Due to the prevalence of areas that have large
roadways adjacent to population centers, Pleasanton is
considered to be representative of area-wide or
neighborhood scale air quality.
The site began operation on April 1, 2018 and was deployed
at the request of an Air District board member.

119
Pleasanton Monitor Information
Pollutant, POC NO2, 1 CO, 1 PM2.5, 3 Toxics, 3
Primary/QA Collocated/Other Primary N/A Primary N/A
Parameter code 42601 / 42602 42101 88101 See toxics
section
Basic monitoring objective(s) Public Information Public
Information
Public
Information
Public
Information
Site type(s)
Source Impact &
Population
Oriented
Source Impact &
Population
Oriented
Source Impact
&
Population
Oriented
Population
Oriented
Monitor type(s) SPM SPM SPM SPM
Network affiliation(s) Near Road Near Road Near Road N/A
Instrument manufacturer and model TECO 42i TECO 48i Met One FEM
BAM 1020 Xontech 901
Method code 074 054 170 210
FRM/FEM/ARM/other FRM FRM FEM N/A
Collecting Agency Air District Air District Air District Air District
Analytical Lab N/A N/A N/A Air District
Reporting Agency Air District Air District Air District Air District
Spatial scale Micro Micro Micro Micro
Monitor start date 04/01/2018 04/01/2018 04/01/2018 04/01/2018
Current Sampling frequency Continuous Continuous Continuous 1:12
Sampling season 01/01 – 12/31 01/01 – 12/31 01/01 – 12/31 01/01 – 12/31
Probe height (meters) 5 5 5 5
Distance from supporting structure (meters) >1 >1 >2 >1
Distance from obstructions on roof (meters). Include
horizontal distance + vertical height above probe for
obstructions nearby (meters).
None None None None
Distance from obstructions not on roof (meters). Include
horizontal distance + vertical height above probe for
obstructions nearby (meters).
None None None None
Distance from trees (meters) None None None None
Distance to furnace or incinerator flue (meters) None None None None
Distance between monitors fulfilling a QA collocation
requirement (meters) N/A N/A N/A N/A
For low volume PM instruments (flow rate < 200
liters/minute) is any PM instrument within 1m of the LoVol?
If yes, please list distance (meters) and instruments(s).
N/A N/A No N/A
For high volume PM instrument (flow rate > 200
liters/minute), is any PM instrument within 2m of the HiVol?
If yes, please list distance (meters) and instrument(s).
N/A N/A N/A N/A
Unrestricted airflow (degrees) 360 360 360 360
Probe material for reactive gases Teflon Teflon N/A Glass
Residence time for reactive gases (seconds) 14 14 N/A N/A
Will there be changes within the next 18 months? N N N N
Is it suitable for comparison against the annual PM2.5? N/A N/A Y N/A
Frequency of flow rate verification for PM samplers N/A N/A Bi-weekly N/A
Frequency of one-point QC check for gaseous instruments Every other day Every other day N/A N/A
Dates of Annual Performance Evaluation conducted in the
past calendar year for gaseous parameters See Table 5.35 See Table 5.35 N/A N/A
Date of semi-annual flow rate audits conducted in the past
calendar year for PM monitors N/A N/A See Table 5.35 N/A

120
5.20 Point Richmond
Site Information for Point Richmond
AQS ID 06-013-0005
GPS coordinates 37.926162, -122.385561
Location Air monitoring shelter next to fire station
Address 140 W. Richmond Ave, Richmond, CA 94801
County Contra Costa
Distance to road
From gaseous probe
(meters)
Washington Ave: 25
W. Richmond Ave: 10
Park Place: 27
Interstate 580: 266
Traffic count (AADT, year)
Washington Ave: 1,587 (2017)
W. Richmond Ave: 4,405 (2006)
Park Place: 1,877 (2017)
Interstate 580: 82,000 (2017)
Traffic counts data were updated on April 1, 2020 and reflect the
latest available data.
Groundcover Paved
Statistical Area San Francisco-Oakland-Hayward CBSA
Summary for Point Richmond
Pollutants Measured H2S
Spatial Scale Neighborhood scale (0.5 – 4 km)
Notes
The site is in the downtown area of the Point Richmond
neighborhood, which is 0.2 miles downwind of the southern
fence line boundary of the Chevron refinery. Although
prevailing winds in the area are from the south-southwest,
occasional northerly winds will transport H2S emissions from
the refinery to the community. H2S gases at Chevron can be
emitted from the processing units, one mile to the north, or
the Chevron Richmond Long Wharf Complex, one mile to the
west, where crude oil and other feedstock chemicals from
tankers are unloaded.

121
Point Richmond Monitor Information
Pollutant, POC H2S, 1
Primary/QA Collocated/Other N/A
Parameter code 42402
Basic monitoring objective(s) Public Information
Site type(s) Population Oriented&
Source Impact
Monitor type(s) SPM
Network affiliation(s) N/A
Instrument manufacturer and model TECO 43i
Method code 020
FRM/FEM/ARM/other N/A
Collecting Agency Air District
Analytical Lab N/A
Reporting Agency Air District
Spatial scale Neighborhood
Monitor start date 01/01/1999
Current Sampling frequency Continuous
Sampling season 01/01 - 12/31
Probe height (meters) 3
Distance from supporting structure (meters) >1
Distance from obstructions on roof (meters). Include horizontal
distance + vertical height above probe for obstructions nearby
(meters).
N/A
Distance from obstructions not on roof (meters). Include
horizontal distance + vertical height above probe for
obstructions nearby (meters).
N/A
Distance from trees (meters) 17
Distance to furnace or incinerator flue (meters) 7
Distance between monitors fulfilling a QA collocation
requirement (meters) N/A
For low volume PM instruments (flow rate < 200 liters/minute)
is any PM instrument within 1m of the LoVol?
If yes, please list distance (meters) and instruments(s).
N/A
For high volume PM instrument (flow rate > 200 liters/minute),
is any PM instrument within 2m of the HiVol? If yes, please list
distance (meters) and instrument(s).
N/A
Unrestricted airflow (degrees) 360
Probe material for reactive gases Teflon
Residence time for reactive gases (seconds) 7
Will there be changes within the next 18 months? N
Is it suitable for comparison against the annual PM2.5? N/A
Frequency of flow rate verification for PM samplers N/A
Frequency of one-point QC check for gaseous instruments Every other week
Date of Annual Performance Evaluation conducted in the past
calendar year for gaseous parameters See Table 5.35
Date of two semi-annual flow rate audits conducted in the past
calendar year for PM monitors N/A

122
5.21 Redwood City
Site Information for Redwood City
AQS ID 06-081-1001
GPS coordinates 37.482934, -122.203500
Location One-story commercial building
Address 897 Barron Ave, Redwood City, CA 94063
County San Mateo
Distance to road
from gaseous probe (meters)
Barron Ave: 13
Bay Road: 24
Warrington Ave: 131
US Highway 101: 455
Traffic count (AADT, year)
Barron Ave: 1,100 (2020) Warrington Ave: 1,400 (2020)
Bay Road: 3,770 (2012) U.S. Highway 101: 222,600 (2017)
Traffic counts data were updated on April 1, 2020 and reflect
the latest available data.
Groundcover Paved
Statistical Area San Francisco-Oakland-Hayward CBSA
Summary for Redwood City
Pollutants Measured O3, NOx, CO, PM2.5C, Toxics, UFP
Spatial Scale Neighborhood scale (0.5 – 4 km)
Notes
The site is in a commercial/industrial zone bordered by U.S.
Highway 101 on one side and residential areas on the other
three sides. Being midway between San Francisco and San
Jose, the site is well positioned to monitor ozone precursors
and ozone moving southward across the peninsula as they
are channeled by the coastal mountains to the west.
Although the sea breeze typically keeps pollution levels low,
when winds are light, high levels of ozone precursors, ozone,
or particulates can occur due to the large number of sources
in the area. Light winds combined with wood burning,
vehicular traffic, and surface-based inversions during winter
can also cause elevated particulate concentrations.
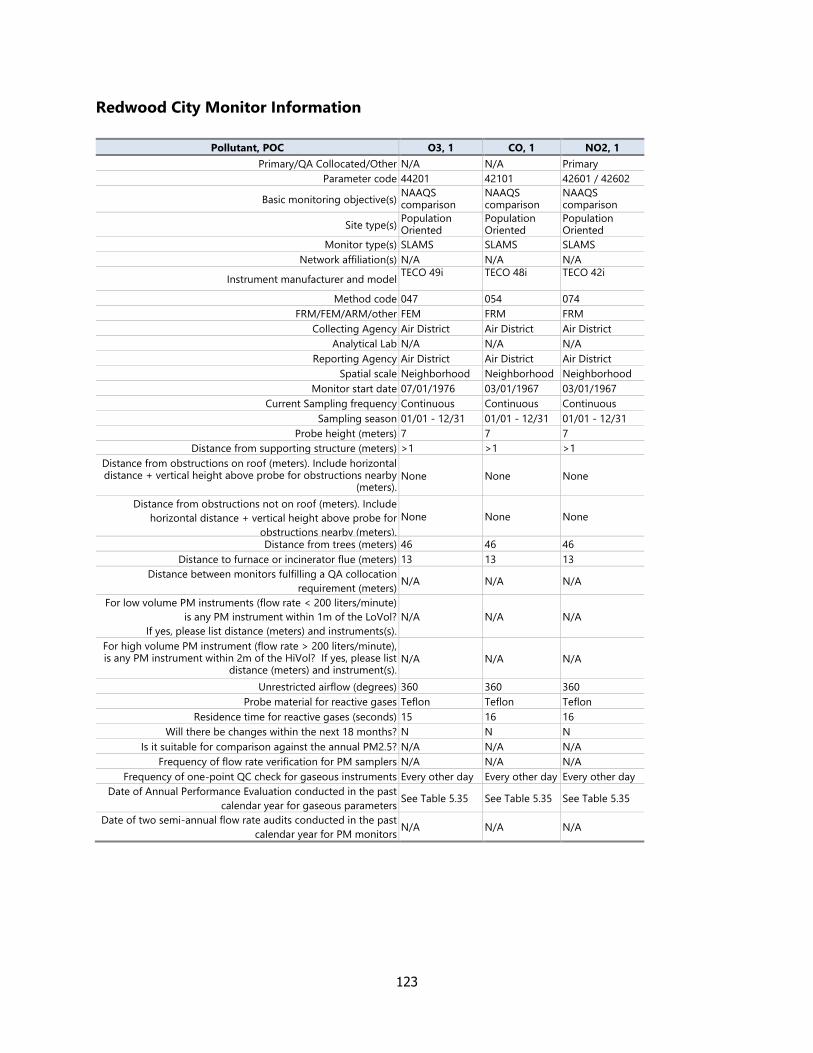
123
Redwood City Monitor Information
Pollutant, POC O3, 1 CO, 1 NO2, 1
Primary/QA Collocated/Other N/A N/A Primary
Parameter code 44201 42101 42601 / 42602
Basic monitoring objective(s) NAAQS comparison
NAAQS comparison
NAAQS comparison
Site type(s) Population Oriented
Population Oriented
Population Oriented
Monitor type(s) SLAMS SLAMS SLAMS
Network affiliation(s) N/A N/A N/A
Instrument manufacturer and model TECO 49i
TECO 48i
TECO 42i
Method code 047 054 074
FRM/FEM/ARM/other FEM FRM FRM
Collecting Agency Air District Air District Air District
Analytical Lab N/A N/A N/A
Reporting Agency Air District Air District Air District
Spatial scale Neighborhood Neighborhood Neighborhood
Monitor start date 07/01/1976 03/01/1967 03/01/1967
Current Sampling frequency Continuous Continuous Continuous
Sampling season 01/01 - 12/31 01/01 - 12/31 01/01 - 12/31
Probe height (meters) 7 7 7
Distance from supporting structure (meters) >1 >1 >1
Distance from obstructions on roof (meters). Include horizontal distance + vertical height above probe for obstructions nearby
(meters). None None None
Distance from obstructions not on roof (meters). Include
horizontal distance + vertical height above probe for
obstructions nearby (meters).
None None None
Distance from trees (meters) 46 46 46
Distance to furnace or incinerator flue (meters) 13 13 13
Distance between monitors fulfilling a QA collocation
requirement (meters) N/A N/A N/A
For low volume PM instruments (flow rate < 200 liters/minute)
is any PM instrument within 1m of the LoVol?
If yes, please list distance (meters) and instruments(s).
N/A N/A N/A
For high volume PM instrument (flow rate > 200 liters/minute), is any PM instrument within 2m of the HiVol? If yes, please list
distance (meters) and instrument(s). N/A N/A N/A
Unrestricted airflow (degrees) 360 360 360
Probe material for reactive gases Teflon Teflon Teflon
Residence time for reactive gases (seconds) 15 16 16
Will there be changes within the next 18 months? N N N
Is it suitable for comparison against the annual PM2.5? N/A N/A N/A
Frequency of flow rate verification for PM samplers N/A N/A N/A
Frequency of one-point QC check for gaseous instruments Every other day Every other day Every other day
Date of Annual Performance Evaluation conducted in the past
calendar year for gaseous parameters See Table 5.35 See Table 5.35 See Table 5.35
Date of two semi-annual flow rate audits conducted in the past
calendar year for PM monitors N/A N/A N/A

124
Redwood City Monitor Information
Pollutant, POC PM2.5, 3 Toxics, 3
Primary/QA Collocated/Other Primary N/A
Parameter code 88101 See Toxics Section
Basic monitoring objective(s) NAAQS comparison Research
Site type(s) Population Oriented Population Oriented
Monitor type(s) SLAMS SPM
Network affiliation(s) N/A N/A
Instrument manufacturer and model Met One FEM BAM 1020 Xontech 901
Method code 170 210
FRM/FEM/ARM/other FEM N/A
Collecting Agency Air District Air District
Analytical Lab N/A Air District
Reporting Agency Air District Air District
Spatial scale Neighborhood Neighborhood
Monitor start date 10/01/2009 7/11/2001
Current Sampling frequency Continuous 1:12
Sampling season 01/01 - 12/31 01/01 - 12 /31
Probe height (meters) 6 7
Distance from supporting structure (meters) >2 >2
Distance from obstructions on roof (meters). Include horizontal distance + vertical height above probe for obstructions nearby
(meters). None None
Distance from obstructions not on roof (meters). Include
horizontal distance + vertical height above probe for
obstructions nearby (meters).
None None
Distance from trees (meters) 40 10
Distance to furnace or incinerator flue (meters) 14 13
Distance between monitors fulfilling a QA collocation
requirement (meters) N/A N/A
For low volume PM instruments (flow rate < 200 liters/minute)
is any PM instrument within 1m of the LoVol?
If yes, please list distance (meters) and instruments(s).
No N/A
For high volume PM instrument (flow rate > 200 liters/minute), is any PM instrument within 2m of the HiVol? If yes, please list
distance (meters) and instrument(s). N/A N/A
Unrestricted airflow (degrees) 360 360
Probe material for reactive gases N/A Glass
Residence time for reactive gases (seconds) N/A N/A
Will there be changes within the next 18 months? N N
Is it suitable for comparison against the annual PM2.5? Y N/A
Frequency of flow rate verification for PM samplers Bi-weekly N/A
Frequency of one-point QC check for gaseous instruments N/A N/A
Date of Annual Performance Evaluation conducted in the past
calendar year for gaseous parameters N/A N/A
Date of two semi-annual flow rate audits conducted in the past
calendar year for PM monitors See Table 5.35 N/A

125
5.22 Reid-Hillview Airport
Site Information for Reid-Hillview Airport
AQS ID 06-085-2011
GPS coordinates 37.329841, -121.815438
Location The end of the runway in the aircraft run-up zone
Address 2500 Cunningham Ave., San Jose, CA 95148
County Santa Clara
Groundcover Paved
Statistical Area San Jose-Sunnyvale-Santa Clara CBSA
Summary for Reid-Hillview Airport
Pollutants Measured Lead (TSP) [not operational in 2021]
Spatial Scale Micro scale (100 m)
Notes
The site is located just south of the runway at the Reid-
Hillview and was one of the 15 airports chosen by EPA for
required TSP-lead monitoring due to expected lead
emissions from piston engine aircraft utilizing this airport.
On June 20, 2020 the Reid-Hillview Airport lead monitor
temporarily ceased operation due to electrical hazards
and the subsequent site repair.

126
Reid-Hillview Airport Monitor Information
Pollutant, POC Lead (TSP), 3
Primary/QA Collocated/Other Primary
Parameter code 14129
Basic monitoring objective(s) NAAQS Comparison & Research
Site type(s) Source Oriented
Monitor type(s) SLAMS
Network affiliation(s) N/A
Instrument manufacturer and model Tisch TE-HVPLUS-BL
Method code 191
FRM/FEM/ARM/other FEM
Collecting Agency Air District
Analytical Lab ERG
Reporting Agency Air District
Spatial scale Micro
Monitor start date 02/03/2012
Current Sampling frequency 1:6
Sampling season 01/01 - 12/31
Probe height (meters) 1.6a
Distance from supporting structure (meters) N/A
Distance from obstructions on roof (meters). Include horizontal
distance + vertical height above probe for obstructions nearby
(meters).
None
Distance from obstructions not on roof (meters). Include
horizontal distance + vertical height above probe for
obstructions nearby (meters).
None
Distance from trees (meters) > 20
Distance to furnace or incinerator flue (meters) None
Distance between monitors fulfilling a QA collocation
requirement (meters) N/A
For low volume PM instruments (flow rate < 200 liters/minute)
is any PM instrument within 1m of the LoVol?
If yes, please list distance (meters) and instruments(s).
N/A
For high volume PM instrument (flow rate > 200 liters/minute),
is any PM instrument within 2m of the HiVol? If yes, please list
distance (meters) and instrument(s).
No
Unrestricted airflow (degrees) 360
Probe material for reactive gases N/A
Residence time for reactive gases (seconds) N/A
Will there be changes within the next 18 months? N
Is it suitable for comparison against the annual PM2.5? N/A
Frequency of flow rate verification for PM samplers Quarterly
Frequency of one-point QC check for gaseous instruments N/A
Date of Annual Performance Evaluation conducted in the past
calendar year for gaseous parameters N/A
Date of two semi-annual flow rate audits conducted in the past
calendar year for PM monitors See Table 5.35
aThe probe height of the lead sampler at Reid-Hillview is set to the height of the fence standing between
the samplers and Tully Road in order to place the sampler within the area designated by EPA for
sampling. This was a requirement of the Reid-Hillview Airport and was designed to ensure that the
samplers were in unquestionable compliance with the FAA requirements in 14 CFR Part 77. Operation of
the samplers at the airport was contingent on meeting this requirement. Movement of the sampler to
achieve a probe height greater than or equal to 2 meters would result in the sampler being located off
airport property.

127
5.23 Richmond 7th
Site Information for Richmond 7th
AQS ID 06-013-0006
GPS coordinates 37.948172, -122.364852
Location Fire station
Address 1065 7th Street, Richmond, CA 94801
County Contra Costa
Distance to road
from gaseous probe
(meters)
7th St: 22
Hensley St: 30
Richmond Parkway: 200
Traffic count (AADT, year)
7th St: 3,546 (2012)
Hensley St: 3,700 (2012)
Richmond Parkway: 32,000 (2012)
Traffic counts data were updated on April 1, 2020 and reflect the
latest available data.
Groundcover Paved
Statistical Area San Francisco-Oakland-Hayward CBSA
Summary for Richmond 7th
Pollutants Measured SO2, H2S, Toxics
Spatial Scale Neighborhood scale (0.5 – 4 km)
Notes
The site is located near the eastern fence line of the Chevron
refinery in North Richmond 0.5 miles east of the refinery
boundary where public exposure to the highest H2S and SO2
concentrations are expected. Normally, monitoring is done
downwind of the prevailing wind direction. However, the
prevailing winds are from the south, and carry emissions
over San Pablo Bay. Because it is impractical to monitor over
San Pablo Bay, a monitoring site was chosen downwind of
the secondary wind direction, on the east side of the
refinery.

128
Richmond 7th Monitor Information
Pollutant, POC SO2, 1 H2S, 1 Toxics, 3
Primary/QA Collocated/Other N/A N/A N/A
Parameter code 42401 42402 See toxics section
Basic monitoring objective(s) NAAQS comparison Public information Research
Site type(s) Population Oriented
& Source Impact
Population Oriented &
Source Impact Population Oriented
Monitor type(s) SLAMS SPM SPM
Network affiliation(s) N/A N/A N/A
Instrument manufacturer and model TECO 43i TECO 43i Xontech 901
Method code 060 020 210
FRM/FEM/ARM/other FEM N/A N/A
Collecting Agency Air District Air District Air District
Analytical Lab N/A N/A Air District
Reporting Agency Air District Air District Air District
Spatial scale Neighborhood Neighborhood Neighborhood
Monitor start date 07/01/1980 01/01/1999 10/14/1992
Current Sampling frequency Continuous Continuous 1:12
Sampling season 01/01 – 12/31 01/01 – 12/31 01/01 – 12/31
Probe height (meters) 8 8 8
Distance from supporting structure (meters) >1 >1 >1
Distance from obstructions on roof (meters). Include
horizontal distance + vertical height above probe for
obstructions nearby (meters).
None None None
Distance from obstructions not on roof (meters). Include
horizontal distance + vertical height above probe for
obstructions nearby (meters).
None None None
Distance from trees (meters) 10 10 10
Distance to furnace or incinerator flue (meters) 12 12 12
Distance between monitors fulfilling a QA collocation
requirement (meters) N/A N/A N/A
For low volume PM instruments (flow rate < 200
liters/minute) is any PM instrument within 1m of the LoVol? If
yes, please list distance (meters) and instruments(s).
N/A N/A N/A
For high volume PM instrument (flow rate > 200
liters/minute), is any PM instrument within 2m of the HiVol?
If yes, please list distance (meters) and instrument(s).
N/A N/A N/A
Unrestricted airflow (degrees) 360 360 360
Probe material for reactive gases Teflon Teflon Glass
Residence time for reactive gases (seconds) 8 9 N/A
Will there be changes within the next 18 months? N N N
Is it suitable for comparison against the annual PM2.5? N/A N/A N/A
Frequency of flow rate verification for PM samplers N/A N/A N/A
Frequency of one-point QC check for gaseous instruments Every other day Every other week N/A
Date of Annual Performance Evaluation conducted in the
past calendar year for gaseous parameters See Table 5.35 See Table 5.35 N/A
Date of two semi-annual flow rate audits conducted in the
past calendar year for PM monitors N/A N/A N/A

129
5.24 Rodeo
Site Information for Rodeo
AQS ID 06-013-0007
GPS coordinates 38.034331, -122.270336
Location Single story storage area at fire station
Address 326 Third Street, Rodeo, CA 94572
County Contra Costa
Distance to road
from gaseous probe (meters)
Third St: 13
Parker St: 249
Traffic count (AADT, year)
Third St: 500 (2007)
Parker St: 9,484 (2013)
Traffic counts data were updated on April 1, 2020 and reflect
the latest available data.
Groundcover Paved
Statistical Area San Francisco-Oakland-Hayward CBSA
Summary for Rodeo
Pollutants Measured H2S
Spatial Scale Neighborhood scale (0.5 – 4 km)
Notes
The site is located in a residential area 0.6 miles southwest
of the Phillips 66 refinery on the northeastern boundary of
the town of Rodeo. Although the prevailing winds in the
area are from the southwest, northeast winds can transport
H2S emissions from the refinery to the populated areas of
the town of Rodeo.

130
Rodeo Monitor Information
Pollutant, POC H2S, 1
Primary/QA Collocated/Other N/A
Parameter code 42402
Basic monitoring objective(s) Public information
Site type(s) Population Oriented &
Source Impact
Monitor type(s) SPM
Network affiliation(s) N/A
Instrument manufacturer and model TECO 43i
Method code 020
FRM/FEM/ARM/other N/A
Collecting Agency Air District
Analytical Lab N/A
Reporting Agency Air District
Spatial scale Neighborhood
Monitor start date 04/01/2002
Current Sampling frequency Continuous
Sampling season 01/01 – 12/31
Probe height (meters) 7
Distance from supporting structure (meters) >1
Distance from obstructions on roof (meters). Include
horizontal distance + vertical height above probe for
obstructions nearby (meters).
None
Distance from obstructions not on roof (meters). Include
horizontal distance + vertical height above probe for
obstructions nearby (meters).
None
Distance from trees (meters) >50
Distance to furnace or incinerator flue (meters) 11
Distance between monitors fulfilling a QA collocation
requirement (meters) N/A
For low volume PM instruments (flow rate < 200
liters/minute) is any PM instrument within 1m of the LoVol? If
yes, please list distance (meters) and instruments(s).
N/A
For high volume PM instrument (flow rate > 200
liters/minute), is any PM instrument within 2m of the HiVol?
If yes, please list distance (meters) and instrument(s).
N/A
Unrestricted airflow (degrees) 360
Probe material for reactive gases Teflon
Residence time for reactive gases (seconds) 6
Will there be changes within the next 18 months? N
Is it suitable for comparison against the annual PM2.5? N/A
Frequency of flow rate verification for PM samplers N/A
Frequency of one-point QC check for gaseous instruments Every other week
Date of Annual Performance Evaluation conducted in the
past calendar year for gaseous parameters See Table 5.35
Date of two semi-annual flow rate audits conducted in the
past calendar year for PM monitors N/A

131
5.25 San Carlos Airport II
Site Information for San Carlos Airport II
AQS ID 06-081-2004
GPS coordinates 37.508162, -122.246305
Location The end of the runway in the aircraft run-up zone
Address 620 Airport Drive, San Carlos, CA 94070
County San Mateo
Groundcover Paved
Statistical Area San Francisco-Oakland-Hayward CBSA
Summary for San Carlos Airport II
Pollutants Measured Lead (TSP) [not operational in 2021]
Spatial Scale Micro scale (100 m)
Notes
The site is located just south of the runway at the San Carlos
Airport and was one of the 15 airports chosen by EPA for
required TSP-lead monitoring due to expected lead
emissions from piston engine aircraft utilizing this airport.
TSP-lead monitoring at the San Carlos II site (both primary
and collocated) started on March 25, 2015. The original San
Carlos Airport I site was inappropriately sited and had to be
moved because it violated FAA air space restrictions. This
new site has a different AQS site ID (06-081-2004) than the
original San Carlos Airport I site because the new site is
about 120 meters to the southeast and farther away from
the aircraft run-up area. Three-month rolling averages
during 2015 and 2016 at this site ranged from 0.016 µg/m3
to 0.025 µg/m3.
The TSP-lead monitoring at the San Carlos Airport II
monitoring site was discontinued on April 11, 2017 due to
circumstances beyond the Air District’s control. The Air
District notified EPA of the discontinuation of data collection
on April 13, 2017. The Air District will continue to work with
EPA to find a suitable alternative.

132
San Carlos Airport II Monitor Information
Pollutant, POC Lead (TSP), 3 Lead (TSP), 5
Primary/QA Collocated/Other Primary QA Collocated
Parameter code 14129 14129
Basic monitoring objective(s) NAAQS Comparison &
Research
NAAQS Comparison &
Research
Site type(s) Source Oriented Source Oriented
Monitor type(s) SLAMS SLAMS
Network affiliation(s) N/A N/A
Instrument manufacturer and model Tisch TE-HVPLUS-BL Tisch TE-HVPLUS-BL
Method code 191 191
FRM/FEM/ARM/other FEM FEM
Collecting Agency Air District Air District
Analytical Lab ERG ERG
Reporting Agency Air District Air District
Spatial scale Micro Micro
Monitor start date 03/25/2015 03/25/2015
Current Sampling frequency 1:6 1:12
Sampling season 01/01 - 12/31 01/01 - 12/31
Probe height (meters) 2.1 2.1
Distance from supporting structure (meters) N/A N/A
Distance from obstructions on roof (meters). Include
horizontal distance + vertical height above probe for
obstructions nearby (meters).
None None
Distance from obstructions not on roof (meters). Include
horizontal distance + vertical height above probe for
obstructions nearby (meters).
None None
Distance from trees (meters) >30 >30
Distance to furnace or incinerator flue (meters) None None
Distance between monitors fulfilling a QA collocation
requirement (meters) 2.8 2.8
For low volume PM instruments (flow rate < 200
liters/minute) is any PM instrument within 1m of the LoVol? If
yes, please list distance (meters) and instruments(s).
N/A N/A
For high volume PM instrument (flow rate > 200
liters/minute), is any PM instrument within 2m of the HiVol?
If yes, please list distance (meters) and instrument(s).
No No
Unrestricted airflow (degrees) 360 360
Probe material for reactive gases N/A N/A
Residence time for reactive gases (seconds) N/A N/A
Will there be changes within the next 18 months? No No
Is it suitable for comparison against the annual PM2.5? N/A N/A
Frequency of flow rate verification for PM samplers Quarterly Quarterly
Frequency of one-point QC check for gaseous instruments N/A N/A
Date of Annual Performance Evaluation conducted in the
past calendar year for gaseous parameters N/A N/A
Dates of semi-annual flow rate audits conducted in the past
calendar year for PM monitors
N/A N/A

133
5.26 San Francisco
Site Information for San Francisco
AQS ID 06-075-0005
GPS coordinates 37.765946, -122.399044
Location One-story commercial building
Address 10 Arkansas St, Suite N, San Francisco, CA 94107
County San Francisco
Distance to road
from gaseous probe (meters)
16th St: 32 Interstate 280: 300
Arkansas St: 17 U.S. Highway 101: 504
Traffic count (AADT, year)
16th St: 11,764 (2012)
Arkansas St: 1,750 (2015)
Interstate 280: 106,000 (2015)
U.S. Highway 101: 226,000 (2015)
Traffic counts data were updated on April 1, 2020 and reflect
the latest available data.
Groundcover Paved
Statistical Area San Francisco-Oakland-Hayward CBSA
Summary for San Francisco
Pollutants Measured O3, NOx, CO, PM10, PM2.5C, Toxics
Spatial Scale Neighborhood scale (0.5 – 4 km)
Notes
The site is located near the northern boundary of the
Potrero Hill neighborhood in San Francisco, which is
adjacent to light industrial activities, residential
neighborhoods and in-between two major roadways: U.S
101 and I-28. Although the westerly wind sea breeze usually
keeps pollution levels low, light wind conditions and
surface-based inversions can result in elevated
concentrations of ozone precursors and/or particulate
matter.
PM10 monitoring was changed from 1:6 to 1:12 sampling
effective January 1, 2013 to accommodate limited resources.
Because the Bay Area is well above the minimum monitoring
requirements for PM10, EPA approved this decrease in
sampling frequency as well as converting these PM10
monitors from SLAMS to SPMs. Therefore, this monitor is no
longer counted in PM10 minimum monitoring requirements.

134
San Francisco Monitor Information
Pollutant, POC O3, 1 CO, 1 NO2, 1
Primary/QA Collocated/Other N/A N/A Primary
Parameter code 44201 42101 42601 / 42602
Basic monitoring objective(s) NAAQS comparison NAAQS
comparison NAAQS comparison
Site type(s) Population
Oriented
Population
Oriented Population Oriented
Monitor type(s) SLAMS SLAMS SLAMS
Network affiliation(s) N/A N/A N/A
Instrument manufacturer and model TECO 49i TECO 48i TECO 42i
Method code 047 054 074
FRM/FEM/ARM/other FEM FRM FRM
Collecting Agency Air District Air District Air District
Analytical Lab N/A N/A N/A
Reporting Agency Air District Air District Air District
Spatial scale Neighborhood Neighborhood Neighborhood
Monitor start date 01/01/1986 01/01/1986 NO: 12/01/1985
NO2: 01/01/1986
Current Sampling frequency Continuous Continuous Continuous
Sampling season 01/01 - 12/31 01/01 - 12/31 01/01 - 12/31
Probe height (meters) 11 11 11
Distance from supporting structure (meters) >1 >1 >1
Distance from obstructions on roof (meters). Include horizontal
distance + vertical height above probe for obstructions nearby
(meters).
None None None
Distance from obstructions not on roof (meters). Include
horizontal distance + vertical height above probe for
obstructions nearby (meters).
None None None
Distance from trees (meters) 15 15 15
Distance to furnace or incinerator flue (meters) 5 5 5
Distance between monitors fulfilling a QA collocation
requirement (meters) N/A N/A N/A
For low volume PM instruments (flow rate < 200 liters/minute)
is any PM instrument within 1m of the LoVol?
If yes, please list distance (meters) and instruments(s).
N/A N/A N/A
For high volume PM instrument (flow rate > 200 liters/minute),
is any PM instrument within 2m of the HiVol? If yes, please list
distance (meters) and instrument(s).
N/A N/A N/A
Unrestricted airflow (degrees) 360 360 360
Probe material for reactive gases Teflon Teflon Teflon
Residence time for reactive gases (seconds) 13 13 14
Will there be changes within the next 18 months? N N N
Is it suitable for comparison against the annual PM2.5? N/A N/A N/A
Frequency of flow rate verification for PM samplers N/A N/A N/A
Frequency of one-point QC check for gaseous instruments Every other day Every other day Every other day
Date of Annual Performance Evaluation conducted in the past
calendar year for gaseous parameters See Table 5.35 See Table 5.35 See Table 5.35
Date of two semi-annual flow rate audits conducted in the past
calendar year for PM monitors N/A N/A N/A

135
San Francisco Monitor Information
Pollutant, POC PM10, 1 PM2.5, 3 Toxics, 3
Primary/QA Collocated/Other Primary Primary N/A
Parameter code 81102 88101 See toxics section
Basic monitoring objective(s) NAAQS comparison NAAQS comparison Research
Site type(s) Population Oriented Population Oriented Population Oriented
Monitor type(s) SPM SLAMS SPM
Network affiliation(s) N/A N/A N/A
Instrument manufacturer and model Andersen HiVol 1200 Met One FEM BAM
1020 Xontech 910A
Method code 063 170 210
FRM/FEM/ARM/other FRM FEM N/A
Collecting Agency Air District Air District Air District
Analytical Lab Air District N/A Air District
Reporting Agency Air District Air District Air District
Spatial scale Neighborhood Neighborhood Neighborhood
Monitor start date 11/16/1986 10/01/2009 01/22/1991
Current Sampling frequency 1:12 Continuous 1:12
Sampling season 01/01 - 12/31 01/01 - 12/31 01/01 - 12/31
Probe height (meters) 8 8 8
Distance from supporting structure (meters) >2 >2 >1
Distance from obstructions on roof (meters). Include horizontal
distance + vertical height above probe for obstructions nearby
(meters).
None None None
Distance from obstructions not on roof (meters). Include
horizontal distance + vertical height above probe for
obstructions nearby (meters).
None None None
Distance from trees (meters) 18 16 14
Distance to furnace or incinerator flue (meters) 7 7 4
Distance between monitors fulfilling a QA collocation
requirement (meters) N/A N/A N/A
For low volume PM instruments (flow rate < 200 liters/minute)
is any PM instrument within 1m of the LoVol? If yes, please list
distance (meters) and instruments(s).
N/A No N/A
For high volume PM instrument (flow rate > 200 liters/minute),
is any PM instrument within 2m of the HiVol? If yes, please list
distance (meters) and instrument(s).
No N/A N/A
Unrestricted airflow (degrees) 360 360 360
Probe material for reactive gases N/A N/A Glass
Residence time for reactive gases (seconds) N/A N/A N/A
Will there be changes within the next 18 months? N N N
Is it suitable for comparison against the annual PM2.5? N/A Y N/A
Frequency of flow rate verification for PM samplers Quarterly Bi-weekly N/A
Frequency of one-point QC check for gaseous instruments N/A N/A N/A
Date of Annual Performance Evaluation conducted in the past
calendar year for gaseous parameters N/A N/A N/A
Date of two semi-annual flow rate audits conducted in the past
calendar year for PM monitors See Table 5.35 See Table 5.35 N/A

136
5.27 San Jose – Jackson
Site Information for San Jose – Jackson
AQS ID 06-085-0005
GPS coordinates 37.348497, -121.894898
Location Top floor of two-story commercial building
Address 158 E. Jackson St, San Jose, CA 95112
County Santa Clara
Distance to road
from gaseous probe (meters)
Jackson St: 15
4th St: 35
Traffic count (AADT, year)
Jackson St: 5,992 (2007)
4th St: 7,300 (2014)
Traffic counts data were updated on April 1, 2020 and reflect
the latest available data.
Groundcover Paved
Statistical Area San Jose-Sunnyvale-Santa Clara CBSA
Summary for San Jose – Jackson
Pollutants Measured O3, NOx, NOy, SO2, CO, PM10, PM2.5F, PM2.5C, Speciated PM2.5,
Toxics
Spatial Scale Neighborhood scale (0.5 – 4 km)
Notes
The site is in the center of the northern Santa Clara Valley in
downtown San Jose, which is near a number of major
freeways, the San Jose International Airport, and commercial
and residential areas. Prevailing northwesterly winds can
transport ozone and ozone precursors from the central and
northern portions of the Bay Area to the Santa Clara Valley.
Light winds combined with surface-based inversions within
the valley during winter months can also cause elevated
particulate matter concentrations.
San Jose – Jackson was approved as a NCore station in 2009
and began operation on January 1, 2011. On October 11,
2019, EPA approved a request to discontinue NOy
monitoring (see Appendix F), but as part of new PAMS
requirements, the Air District plans to monitor NOy at
Livermore in starting 2021. The Air District also discontinued
monitoring for the NATTS program on July 1, 2018 (see
Section 3.2)

137
San Jose – Jackson Monitor Information
Pollutant, POC O3, 1 COa, 1 NO2, 1 SO2a, 1
Primary/QA Collocated/Other N/A N/A Primary N/A
Parameter code 44201 42101 42601 / 42602 42401
Basic monitoring objective(s)
NAAQS
comparison &
Research
NAAQS
comparison &
Research
NAAQS
comparison &
Research
NAAQS
comparison &
Research
Site type(s) Population
Oriented
Population
Oriented
Population
Oriented
Population
Oriented
Monitor type(s) SLAMS SLAMS SLAMS SLAMS
Network affiliation(s) NCore NCore N/A NCore
Instrument manufacturer and model TECO 49i TECO 48iTLE TECO 42i TECO 43iTLE
Method code 047 554 074 560
FRM/FEM/ARM/other FEM FRM FRM FEM
Collecting Agency Air District Air District Air District Air District
Analytical Lab N/A N/A N/A N/A
Reporting Agency Air District Air District Air District Air District
Spatial scale Neighborhood Neighborhood Neighborhood Neighborhood
Monitor start date 11/01/2002 11/01/2002 11/01/2002 02/10/2009
Current Sampling frequency Continuous Continuous Continuous Continuous
Sampling season 01/01 - 12/31 01/01 - 12/31 01/01 - 12/31 01/01 - 12/31
Probe height (meters) 12 12 12 12
Distance from supporting structure (meters) >1 >1 >1 >1
Distance from obstructions on roof (meters). Include
horizontal distance + vertical height above probe for
obstructions nearby (meters).
None None None None
Distance from obstructions not on roof (meters). Include
horizontal distance + vertical height above probe for
obstructions nearby (meters).
None None None None
Distance from trees (meters) >50 >50 >50 >50
Distance to furnace or incinerator flue (meters) 5 5 5 5
Distance between monitors fulfilling a QA collocation
requirement (meters) N/A N/A N/A N/A
For low volume PM instruments (flow rate < 200
liters/minute) is any PM instrument within 1m of the LoVol? If
yes, please list distance (meters) and instruments(s).
N/A N/A N/A N/A
For high volume PM instrument (flow rate > 200
liters/minute), is any PM instrument within 2m of the HiVol?
If yes, please list distance (meters) and instrument(s).
N/A N/A N/A N/A
Unrestricted airflow (degrees) 360 360 360 360
Probe material for reactive gases Teflon Teflon Teflon Teflon
Residence time for reactive gases (seconds) 13 15 14 15
Will there be changes within the next 18 months? N N N N
Is it suitable for comparison against the annual PM2.5? N/A N/A N/A N/A
Frequency of flow rate verification for PM samplers N/A N/A N/A N/A
Frequency of one-point QC check for gaseous instruments Every other day Every other day Every other day Every other day
Date of Annual Performance Evaluation conducted in the
past calendar year for gaseous parameters See Table 5.35 See Table 5.35 See Table 5.35 See Table 5.35
Date of two semi-annual flow rate audits conducted in the
past calendar year for PM monitors N/A N/A N/A N/A
a Trace level instruments required for CO and SO2 at NCore sites.

138
San Jose – Jackson Monitor Information
Pollutant, POC NOy, 2 PM10, 1 Toxics, 3
Primary/QA Collocated/Other N/A Primary N/A
Parameter code 42600 81102 See toxics section
Basic monitoring objective(s) Research NAAQS comparison Research
Site type(s) Population
Oriented Population Oriented
Population
Oriented
Monitor type(s) SLAMS SLAMS SPM
Network affiliation(s) NCore N/A N/A
Instrument manufacturer and model API 200 EU/NOy Partisol 2025 without
VSCC Xontech 924 & 901
Method code 699 127 202 & 210
FRM/FEM/ARM/other N/A FRM N/A
Collecting Agency Air District Air District Air District
Analytical Lab N/A Air District Air District
Reporting Agency Air District Air District Air District
Spatial scale Neighborhood Neighborhood Neighborhood
Monitor start date 01/13/2011 10/15/2002 10/04/2002
Current Sampling frequency Continuous 1:6 1:12
Sampling season 01/01 - 12/31 01/01 - 12/31 01/01 – 12/31
Probe height (meters) 12 9 10
Distance from supporting structure (meters) >1 >2 >1
Distance from obstructions on roof (meters). Include horizontal
distance + vertical height above probe for obstructions nearby
(meters).
None None None
Distance from obstructions not on roof (meters). Include
horizontal distance + vertical height above probe for
obstructions nearby (meters).
None None None
Distance from trees (meters) >50 >50 >50
Distance to furnace or incinerator flue (meters) 3 3 5
Distance between monitors fulfilling a QA collocation
requirement (meters) N/A N/A N/A
For low volume PM instruments (flow rate < 200 liters/minute)
is any PM instrument within 1m of the LoVol? If yes, please list
distance (meters) and instruments(s).
N/A No N/A
For high volume PM instrument (flow rate > 200 liters/minute),
is any PM instrument within 2m of the HiVol? If yes, please list
distance (meters) and instrument(s).
N/A N/A N/A
Unrestricted airflow (degrees) 360 360 360
Probe material for reactive gases Teflon N/A Glass
Residence time for reactive gases (seconds) 7 N/A N/A
Will there be changes within the next 18 months? Ya N N
Is it suitable for comparison against the annual PM2.5? N/A N/A N/A
Frequency of flow rate verification for PM samplers N/A Monthly N/A
Frequency of one-point QC check for gaseous instruments Every other day N/A N/A
Date of Annual Performance Evaluation conducted in the past
calendar year for gaseous parameters N/A N/A N/A
Date of two semi-annual flow rate audits conducted in the past
calendar year for PM monitors N/A See Table 5.35 N/A
aThe EPA approved the waiver to shut down NOy monitor as required by the NCore program (see
Appendix E). Under this approval, the Air District is planning to measure NOy at as part of the new PAMS
requirement at Livermore in 2020.

139
San Jose – Jackson Monitor Information
Pollutant, POC PM10-2.5 (PMcoarse), 1 PM2.5, 1a PM2.5, 3 Speciated PM2.5, 5
Primary/QA Collocated/Other Primary QA Collocated Primary Other
Parameter code 86101 88101 88101 88502 (pm mass) – many others see SASS section
Basic monitoring objective(s) Research NAAQS comparison
NAAQS comparison
Research
Site type(s) Population Oriented Population Oriented
Population Oriented & Highest Conc.
Population Oriented
Monitor type(s) SLAMS SLAMS SLAMS SLAMS
Network affiliation(s) NCore NCore NCore NCore, CSN STN
Instrument manufacturer and model Partisol 2025 without
VSCC
Partisol-Plus 2025
w/VSCC
Met One FEM BAM
1020 Met One SASS
Method code 176 145 170 810
FRM/FEM/ARM/other FRM FRM FEM N/A
Collecting Agency Air District Air District Air District Air District
Analytical Lab Air District Air District N/A RTI
Reporting Agency Air District Air District Air District RTI
Spatial scale Neighborhood Neighborhood Neighborhood Neighborhood
Monitor start date 1/1/2011 10/05/2002 10/01/2012 10/05/2002
Current Sampling frequency 1:3 (NCore) 1:3 (NCore) Continuous 1:3
Sampling season 01/01 - 12/31 01/01 - 12/31 01/01 - 12/31 01/01 - 12/31
Probe height (meters) 9 9 10 9
Distance from supporting structure (meters) >2 >2 >2 >2
Distance from obstructions on roof (meters). Include
horizontal distance + vertical height above probe for
obstructions nearby (meters).
None None None None
Distance from obstructions not on roof (meters). Include
horizontal distance + vertical height above probe for
obstructions nearby (meters).
None None None None
Distance from trees (meters) >50 >50 >50 >50
Distance to furnace or incinerator flue (meters) 2 2 4 3
Distance between monitors fulfilling a QA collocation
requirement (meters) N/A 4.0 4.0 N/A
For low volume PM instruments (flow rate < 200
liters/minute) is any PM instrument within 1m of the
LoVol? If yes, please list distance (meters) and
instruments(s).
N/A No No No
For high volume PM instrument (flow rate > 200
liters/minute), is any PM instrument within 2m of the
HiVol? If yes, please list distance (meters) and
instrument(s).
No N/A N/A N/A
Unrestricted airflow (degrees) 360 360 360 360
Probe material for reactive gases N/A N/A N/A N/A
Residence time for reactive gases (seconds) N/A N/A N/A N/A
Will there be changes within the next 18 months? N N N N
Is it suitable for comparison against the annual PM2.5? N/A Y Y N
Frequency of flow rate verification for PM samplers Monthly Monthly Bi-weekly Monthly
Frequency of one-point QC check for gaseous
instruments N/A N/A N/A N/A
Date of Annual Performance Evaluation conducted in
the past calendar year for gaseous parameters N/A N/A N/A N/A
Date of two semi-annual flow rate audits conducted in
the past calendar year for PM monitors See Table 5.35 See Table 5.35 See Table 5.35 See Table 5.35
a PM2.5 POC 1 was the primary sampler from October 2002 through September 2012 and was changed to be the collocated sampler after October 1, 2012 when PM2.5 POC 3 became operational as the primary monitor.

140
5.28 San Jose – Knox (near-road)
Site Information for San Jose – Knox
AQS ID 06-085-0006
GPS coordinates 37.338202, -121.849892
Location Trailer within 50m of freeway
Address 1007 Knox Ave. San Jose, CA 95122
County Santa Clara
Distance to road
from gaseous probe
(meters)
Hwy 101: 16
I-280/680: 262
Story Rd: 234
Knox Ave: 236
Traffic count (AADT, year)
Hwy 101: 283,500 (2017)
I-280/680: 211,000 (2017)
Story Rd: 20,571 (2016)
Knox Ave: 2,500 (2020)
Traffic counts data were updated on April 1, 2020 and reflect
the latest available data.
Groundcover Gravel
Statistical Area San Jose-Sunnyvale-Santa Clara CBSA
Summary for San Jose – Knox
Pollutants Measured NOx, CO, PM2.5C, Toxics, BC, UFP
Spatial Scale Microscale (100 m)
Notes
The site is 16 m downwind from US-101 (along a segment of
roadway with with highest Fleet Equivalent AADT (FE-AADT)
in Santa Clara County) and designated as a near-road
monitoring site which are a category of sites designed to
representative of population exposure in the near-road
environment. Due to the prevalence of areas that have large
roadways adjacent to population centers, San Jose – Knox is
considered to be representative of area-wide or
neighborhood scale air quality.

141
San Jose – Knox Monitor Information
Pollutant, POC NO2, 1 CO, 1 PM2.5, 3 BC, 1 Toxics, 3
Primary/QA Collocated/Other Primary N/A Primary N/A N/A
Parameter code 42601 / 42602 42101 88101 84313 See toxics
section
Basic monitoring objective(s) NAAQS
comparison
NAAQS
comparison
NAAQS
comparison
Public
Information Research
Site type(s)
Source Impact &
Population
Oriented
Source Impact &
Population
Oriented
Source Impact &
Population
Oriented
Source Impact Population
Oriented
Monitor type(s) SLAMS SLAMS SLAMS SPM SPM
Network affiliation(s) Near Road Near Road Near Road N/A N/A
Instrument manufacturer and model TECO 42i TECO 48i Met One FEM
BAM 1020
Teledyne API
AE-633 Xontech 901
Method code 074 054 170 894 210
FRM/FEM/ARM/other FRM FRM FEM N/A N/A
Collecting Agency Air District Air District Air District Air District Air District
Analytical Lab N/A N/A N/A N/A Air District
Reporting Agency Air District Air District Air District Air District Air District
Spatial scale Micro Micro Micro Micro Micro
Monitor start date 09/01/2014 09/01/2014 09/01/2014 09/01/2014 08/15/2014
Current Sampling frequency Continuous Continuous Continuous Continuous 1:12
Sampling season 01/01 – 12/31 01/01 – 12/31 01/01 – 12/31 01/01-12/31 01/01 – 12/31
Probe height (meters) 6 6 5 6 5
Distance from supporting structure (meters) >1 >1 >2 >1 >1
Distance from obstructions on roof (meters). Include horizontal
distance + vertical height above probe for obstructions nearby
(meters).
None None None None None
Distance from obstructions not on roof (meters). Include
horizontal distance + vertical height above probe for
obstructions nearby (meters).
None None None None None
Distance from trees (meters) 8a 8a 8a 8 8
Distance to furnace or incinerator flue (meters) None None None None None
Distance between monitors fulfilling a QA collocation
requirement (meters) N/A N/A N/A N/A N/A
For low volume PM instruments (flow rate < 200 liters/minute)
is any PM instrument within 1m of the LoVol? If yes, please list
distance (meters) and instruments(s).
N/A N/A No N/A N/A
For high volume PM instrument (flow rate > 200 liters/minute),
is any PM instrument within 2m of the HiVol? If yes, please list
distance (meters) and instrument(s).
N/A N/A N/A N/A N/A
Unrestricted airflow (degrees) 360 360 360 360 360
Probe material for reactive gases Teflon Teflon N/A N/A Glass
Residence time for reactive gases (seconds) 16 15 N/A N/A N/A
Will there be changes within the next 18 months? N N N N N
Is it suitable for comparison against the annual PM2.5? N/A N/A Y N/A N/A
Frequency of flow rate verification for PM samplers N/A N/A Bi-weekly N/A N/A
Frequency of one-point QC check for gaseous instruments Every other day Every other day N/A N/A N/A
Dates of Annual Performance Evaluation conducted in the past
calendar year for gaseous parameters See Table 5.35 See Table 5.35 N/A N/A N/A
Dates semi-annual flow rate audits conducted in the past
calendar year for PM monitors N/A N/A See Table 5.35 N/A N/A
a Due to siting logistics constraints and in an effort to meet the objective of characterizing near-road emissions in the
best segment in this MSA, the San Jose – Knox site was chosen even though the distance to the closest tree is less than
10 meters. Region 9 EPA was involved in the development of this site, were aware of the tree placement, and concurred
on the siting choice, approving this site as meeting the requirements for near-road monitoring

142
5.29 San Martin
Site Information for San Martin
AQS ID 06-085-2006
GPS coordinates 37.079379, -121.600031
Location Air monitoring shelter next to maintenance shed
Address 13030 Murphy Ave, San Martin, CA 95046
County Santa Clara
Distance to road
from gaseous probe
(meters)
Murphy Ave: 57
US Highway 101: 455
Monterey Rd: 561
San Martin Ave: 931
Traffic count (AADT, year)
Murphy Ave: 1,768 (2018)
US Highway 101: 128,100 (2017)
Monterey Rd: 15,054 (2018)
San Martin Ave: 7,795 (2017)
Traffic counts data were updated on April 1, 2020 and reflect
the latest available data.
Groundcover Vegetative
Statistical Area San Jose-Sunnyvale-Santa Clara CBSA
Summary for San Martin
Pollutants Measured O3
Spatial Scale Neighborhood scale (0.5 – 4 km)
Notes
The site is located at the South County Airport in an
agricultural area at the south end of the Santa Clara Valley
approximately 24 miles southeast of downtown San Jose
and 0.3 miles west of US-101. Prevailing winds can transport
ozone and ozone precursors down the valley from the
densely populated San Jose area as well as the surrounding
San Francisco Bay Area.

143
San Martin Monitor Information
Pollutant, POC O3, 1
Primary/QA Collocated/Other N/A
Parameter code 44201
Basic monitoring objective(s) NAAQS comparison
Site type(s)
Highest Conc. &
Population Oriented &
Regional Transport
Monitor type(s) SLAMS
Network affiliation(s) N/A
Instrument manufacturer and model TECO 49i
Method code 047
FRM/FEM/ARM/other FEM
Collecting Agency Air District
Analytical Lab N/A
Reporting Agency Air District
Spatial scale Neighborhood
Monitor start date 04/30/1994
Current Sampling frequency Continuous
Sampling season 01/01-12/31
Probe height (meters) 5
Distance from supporting structure (meters) >1
Distance from obstructions on roof (meters). Include horizontal
distance + vertical height above probe for obstructions nearby
(meters).
N/A
Distance from obstructions not on roof (meters). Include
horizontal distance + vertical height above probe for
obstructions nearby (meters).
N/A
Distance from trees (meters) 26
Distance to furnace or incinerator flue (meters) N/A
Distance between monitors fulfilling a QA collocation
requirement (meters) N/A
For low volume PM instruments (flow rate < 200 liters/minute)
is any PM instrument within 1m of the LoVol?
If yes, please list distance (meters) and instruments(s).
N/A
For high volume PM instrument (flow rate > 200 liters/minute),
is any PM instrument within 2m of the HiVol? If yes, please list
distance (meters) and instrument(s).
N/A
Unrestricted airflow (degrees) 360
Probe material for reactive gases Teflon
Residence time for reactive gases (seconds) 16
Will there be changes within the next 18 months? N
Is it suitable for comparison against the annual PM2.5? N/A
Frequency of flow rate verification for PM samplers N/A
Frequency of one-point QC check for gaseous instruments Every other day
Date of Annual Performance Evaluation conducted in the past
calendar year for gaseous parameters See Table 5.35
Date of two semi-annual flow rate audits conducted in the past
calendar year for PM monitors N/A

144
5.30 San Pablo
Site Information for San Pablo
AQS ID 06-013-1004
GPS coordinates 37.960400, -122.356811
Location One story commercial building
Address 1865-D Rumrill Blvd, San Pablo, CA 94806
County Contra Costa
Distance to road
from gaseous probe (meters) Rumrill Blvd: 16
Traffic count (AADT, year)
Rumrill Blvd:,15,433 (2013)
Traffic counts data were updated on April 1, 2020 and
reflect the latest available data.
Groundcover Paved
Statistical Area San Francisco-Oakland-Hayward CBSA
Summary for San Pablo
Pollutants Measured O3, NOx, SO2, CO, PM10, PM2.5 C, Toxics, UFP
Spatial Scale Middle scale (100 – 500 m)
Notes
The site is located in the most populated portion of western
Contra Costa County and is almost surrounded by the city of
Richmond. The nearby areas have heavy industry, high traffic
volume including two major freeways, and is 1.2 miles
downwind of the Chevron refinery. Light winds combined
with surface-based inversions during winter months can
cause elevated particulate matter concentrations.
The spatial scale of representativeness for ozone and PM2.5 is
middle scale based on the distance to roadways and traffic
counts. Based on an EPA Region 9 review of the
requirements, the Ozone monitor was changed from a
SLAMS to SPM. Consequently, this monitor cannot be used
toward meeting the minimum monitoring requirements for
ozone. However, the Air District considers the PM2.5 monitor
to represent area-wide air quality and, therefore,
comparable to the NAAQS because the site represents many
similar locations throughout the metropolitan area. On
October 19, 2016, a collocated PM10 monitor was added for
quality assurance purpose.

145
San Pablo Monitor Information
Pollutant, POC O3, 1 CO, 1 NO2, 1 SO2, 1
Primary/QA Collocated/Other N/A N/A Primary N/A
Parameter code 44201 42101 42601 / 42602 42401
Basic monitoring objective(s) Public
Information
NAAQS
comparison
NAAQS
comparison
NAAQS
comparison
Site type(s) Population
Oriented
Population
Oriented
Population
Oriented
Population
Oriented& Source
Impact
Monitor type(s) SPM SLAMS SLAMS SLAMS
Network affiliation(s) N/A N/A N/A N/A
Instrument manufacturer and model TECO 49i TECO 48i TECO 42i TECO 43i
Method code 047 054 074 060
FRM/FEM/ARM/other FEM FRM FRM FEM
Collecting Agency Air District Air District Air District Air District
Analytical Lab N/A N/A N/A N/A
Reporting Agency Air District Air District Air District Air District
Spatial scale Middle Middle Middle Neighborhood
Monitor start date 09/13/2002 09/13/2002 09/13/2002 09/13/2002
Current Sampling frequency Continuous Continuous Continuous Continuous
Sampling season 01/01 - 12/31 01/01 - 12/31 01/01 - 12/31 01/01 - 12/31
Probe height (meters) 9 9 9 9
Distance from supporting structure (meters) >1 >1 >1 >1 Distance from obstructions on roof (meters). Include horizontal distance + vertical height above probe for obstructions nearby
(meters). None None None None
Distance from obstructions not on roof (meters). Include horizontal distance + vertical height above probe for
obstructions nearby (meters). None None None None
Distance from trees (meters) >50 >50 >50 >50
Distance to furnace or incinerator flue (meters) 7 7 7 7
Distance between monitors fulfilling a QA collocation
requirement (meters) N/A N/A N/A N/A
For low volume PM instruments (flow rate < 200 liters/minute)
is any PM instrument within 1m of the LoVol? If yes, please list
distance (meters) and instruments(s).
N/A N/A N/A N/A
For high volume PM instrument (flow rate > 200 liters/minute),
is any PM instrument within 2m of the HiVol? If yes, please list
distance (meters) and instrument(s).
N/A N/A N/A N/A
Unrestricted airflow (degrees) 360 360 360 360
Probe material for reactive gases Teflon Teflon Teflon Teflon
Residence time for reactive gases (seconds) 9 10 10 9
Will there be changes within the next 18 months? N N N N
Is it suitable for comparison against the annual PM2.5? N/A N/A N/A N/A
Frequency of flow rate verification for PM samplers N/A N/A N/A N/A
Frequency of one-point QC check for gaseous instruments Every other day Every other day Every other day Every other day
Date of Annual Performance Evaluation conducted in the past
calendar year for gaseous parameters See Table 5.35 See Table 5.35 See Table 5.35 See Table 5.35
Date of two semi-annual flow rate audits conducted in the past
calendar year for PM monitors N/A N/A N/A N/A

146
San Pablo Monitor Information
Pollutant, POC PM10, 1 PM10, 2 PM2.5, 3 Toxics, 3
Primary/QA Collocated/Other Primary QA Collocated Primary N/A
Parameter code 81102 81102 88101 See toxics
section
Basic monitoring objective(s) NAAQS comparison NAAQS comparison NAAQS comparison Research
Site type(s) Population Oriented Population Oriented Population Oriented Population
Oriented
Monitor type(s) SLAMS SLAMS SLAMS SPM
Network affiliation(s) N/A N/A N/A N/A
Instrument manufacturer and model Tisch Env. HiVol TE-60 Tisch Env. HiVol TE-
6000
Met One FEM BAM
1020 Xontech 901
Method code 141 141 170 210
FRM/FEM/ARM/other FRM FRM FEM N/A
Collecting Agency Air District Air District Air District Air District
Analytical Lab Air District Air District Air District Air District
Reporting Agency Air District Air District Air District Air District
Spatial scale Middle Middle Middle Middle
Monitor start date 09/23/2002 10/19/2016 12/12/2012 09/05/2002
Current Sampling frequency 1:6 1:12 Continuous 1:12
Sampling season 01/01 - 12/31 01/01 - 12/31 01/01 - 12/31 01/01 - 12/31
Probe height (meters) 5 5 6 8
Distance from supporting structure (meters) >2 >2 >2 >1
Distance from obstructions on roof (meters). Include
horizontal distance + vertical height above probe for
obstructions nearby (meters).
None None None None
Distance from obstructions not on roof (meters). Include
horizontal distance + vertical height above probe for
obstructions nearby (meters).
None None None None
Distance from trees (meters) >50 >50 >50 >50
Distance to furnace or incinerator flue (meters) 8 5 6 6
Distance between monitors fulfilling a QA collocation
requirement (meters) 3 3 N/A N/A
For low volume PM instruments (flow rate < 200
liters/minute) is any PM instrument within 1m of the LoVol? If
yes, please list distance (meters) and instruments(s).
N/A N/A No N/A
For high volume PM instrument (flow rate > 200
liters/minute), is any PM instrument within 2m of the HiVol?
If yes, please list distance (meters) and instrument(s).
No No N/A N/A
Unrestricted airflow (degrees) 360 360 360 360
Probe material for reactive gases N/A N/A N/A Glass
Residence time for reactive gases (seconds) N/A N/A N/A N/A
Will there be changes within the next 18 months? N N N N
Is it suitable for comparison against the annual PM2.5? N/A N/A Y N/A
Frequency of flow rate verification for PM samplers Quarterly Quarterly Bi-weekly N/A
Frequency of one-point QC check for gaseous instruments N/A N/A N/A N/A
Date of Annual Performance Evaluation conducted in the
past calendar year for gaseous parameters N/A N/A N/A N/A
Date of two semi-annual flow rate audits conducted in the
past calendar year for PM monitors See Table 5.35 See Table 5.35 See Table 5.35 N/A

147
5.31 San Rafael
Site Information for San Rafael
AQS ID 06-041-0001
GPS coordinates 37.972310, -122.520004
Location Second floor of two-story commercial building
Address 534 4th Street, San Rafael, CA 94901
County Marin
Distance to road
from gaseous probe (meters)
4th St: 18 Irwin St: 48
US Highway 101: 112 3rd St: 124
Traffic count (AADT, year)
4th St:8,830 (2017) Irwin St: 19,859 (2017)
US Highway 101: 156,500 (2017) 3rd St: 28,142 (2017)
Traffic counts data were updated on April 1, 2020 and reflect
the latest available data.
Groundcover Paved
Statistical Area San Francisco-Oakland-Hayward CBSA
Summary for San Rafael
Pollutants Measured O3, NOx, CO, PM10, PM2.5C, Toxics
Spatial Scale Neighborhood scale (0.5 – 4 km)
Notes
The site is located is at a commercial building about a block
east of US-101 and near major highway access ramps and
0.5 miles east of the downtown San Rafael, which is the
largest city in Marin County. While afternoon westerly wind
sea breezes typically keep pollutant concentrations low, light
winds combined with wood burning, vehicular traffic, and
surfaced-based inversions during winter can cause elevated
particulate matter concentrations.
The spatial scale of representativeness for ozone and PM2.5 is
middle scale based on the distance to roadways and traffic
counts. Based on an EPA Region 9 review of the
requirements, the Ozone monitor was changed from a
SLAMS to SPM. Consequently, this monitor cannot be used
toward meeting the minimum monitoring requirements for
ozone. However, the Air District considers the PM2.5
monitor to represent area-wide air quality and, therefore,
comparable to the NAAQS because the site represents many
similar locations throughout the metropolitan area.
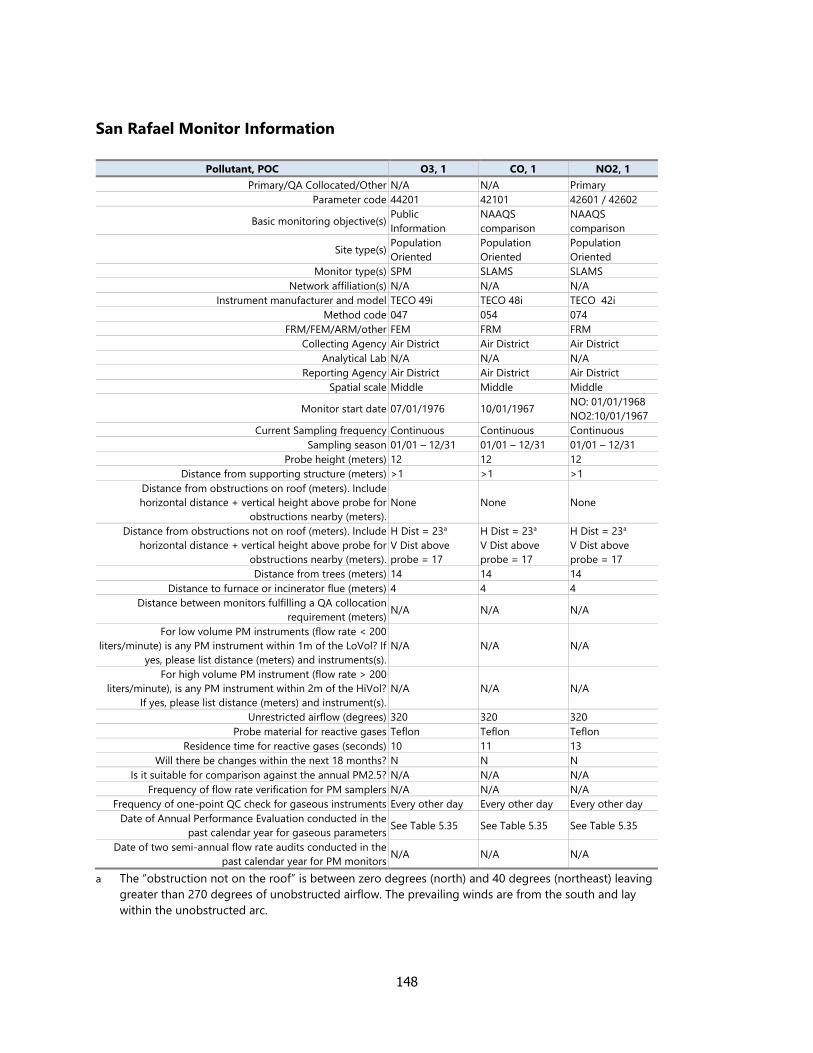
148
San Rafael Monitor Information
Pollutant, POC O3, 1 CO, 1 NO2, 1
Primary/QA Collocated/Other N/A N/A Primary
Parameter code 44201 42101 42601 / 42602
Basic monitoring objective(s) Public
Information
NAAQS
comparison
NAAQS
comparison
Site type(s) Population
Oriented
Population
Oriented
Population
Oriented
Monitor type(s) SPM SLAMS SLAMS
Network affiliation(s) N/A N/A N/A
Instrument manufacturer and model TECO 49i TECO 48i TECO 42i
Method code 047 054 074
FRM/FEM/ARM/other FEM FRM FRM
Collecting Agency Air District Air District Air District
Analytical Lab N/A N/A N/A
Reporting Agency Air District Air District Air District
Spatial scale Middle Middle Middle
Monitor start date 07/01/1976 10/01/1967 NO: 01/01/1968
NO2:10/01/1967
Current Sampling frequency Continuous Continuous Continuous
Sampling season 01/01 – 12/31 01/01 – 12/31 01/01 – 12/31
Probe height (meters) 12 12 12
Distance from supporting structure (meters) >1 >1 >1
Distance from obstructions on roof (meters). Include
horizontal distance + vertical height above probe for
obstructions nearby (meters).
None None None
Distance from obstructions not on roof (meters). Include
horizontal distance + vertical height above probe for
obstructions nearby (meters).
H Dist = 23a
V Dist above
probe = 17
H Dist = 23a
V Dist above
probe = 17
H Dist = 23a
V Dist above
probe = 17
Distance from trees (meters) 14 14 14
Distance to furnace or incinerator flue (meters) 4 4 4
Distance between monitors fulfilling a QA collocation
requirement (meters) N/A N/A N/A
For low volume PM instruments (flow rate < 200
liters/minute) is any PM instrument within 1m of the LoVol? If
yes, please list distance (meters) and instruments(s).
N/A N/A N/A
For high volume PM instrument (flow rate > 200
liters/minute), is any PM instrument within 2m of the HiVol?
If yes, please list distance (meters) and instrument(s).
N/A N/A N/A
Unrestricted airflow (degrees) 320 320 320
Probe material for reactive gases Teflon Teflon Teflon
Residence time for reactive gases (seconds) 10 11 13
Will there be changes within the next 18 months? N N N
Is it suitable for comparison against the annual PM2.5? N/A N/A N/A
Frequency of flow rate verification for PM samplers N/A N/A N/A
Frequency of one-point QC check for gaseous instruments Every other day Every other day Every other day
Date of Annual Performance Evaluation conducted in the
past calendar year for gaseous parameters See Table 5.35 See Table 5.35 See Table 5.35
Date of two semi-annual flow rate audits conducted in the
past calendar year for PM monitors N/A N/A N/A
a The “obstruction not on the roof” is between zero degrees (north) and 40 degrees (northeast) leaving
greater than 270 degrees of unobstructed airflow. The prevailing winds are from the south and lay
within the unobstructed arc.

149
San Rafael Monitor Information
Pollutant, POC PM10, 1 PM2.5, 3 Toxics, 3
Primary/QA Collocated/Other Primary Primary N/A
Parameter code 81102 88101 See toxics section
Basic monitoring objective(s) NAAQS comparison NAAQS comparison Research
Site type(s) Population Oriented Population Oriented Population
Oriented
Monitor type(s) SLAMS SLAMS SPM
Network affiliation(s) N/A N/A N/A
Instrument manufacturer and model Andersen HiVol 1200 Met One FEM BAM 1020 Xontech 901
Method code 063 170 210
FRM/FEM/ARM/other FRM FEM N/A
Collecting Agency Air District Air District Air District
Analytical Lab Air District N/A Air District
Reporting Agency Air District Air District Air District
Spatial scale Middle Middle Middle
Monitor start date 11/04/1986
10/27/2009
01/01/1985
Current Sampling frequency 1:6 Continuous 1:12
Sampling season 01/01 – 12/31 01/01 – 12/31 01/01 – 12/31
Probe height (meters) 8 9 12
Distance from supporting structure (meters) >2 >2 >1
Distance from obstructions on roof (meters). Include horizontal
distance + vertical height above probe for obstructions nearby
(meters).
None None None
Distance from obstructions not on roof (meters). Include
horizontal distance + vertical height above probe for
obstructions nearby (meters).
H Dist = 22a
V Dist above probe =
21
H Dist = 25 a
V Dist above probe = 20 None
Distance from trees (meters) 13 10 14
Distance to furnace or incinerator flue (meters) 2 3 5
Distance between monitors fulfilling a QA collocation
requirement (meters) N/A N/A N/A
For low volume PM instruments (flow rate < 200 liters/minute)
is any PM instrument within 1m of the LoVol? If yes, please list
distance (meters) and instruments(s).
N/A No N/A
For high volume PM instrument (flow rate > 200 liters/minute),
is any PM instrument within 2m of the HiVol? If yes, please list
distance (meters) and instrument(s).
No N/A N/A
Unrestricted airflow (degrees) 320 320 360
Probe material for reactive gases N/A N/A Glass
Residence time for reactive gases (seconds) N/A N/A N/A
Will there be changes within the next 18 months? N N N
Is it suitable for comparison against the annual PM2.5? N/A Y N/A
Frequency of flow rate verification for PM samplers Quarterly Bi-weekly N/A
Frequency of one-point QC check for gaseous instruments N/A N/A N/A
Date of Annual Performance Evaluation conducted in the past
calendar year for gaseous parameters N/A N/A N/A
Date of two semi-annual flow rate audits conducted in the past
calendar year for PM monitors See Table 5.35 See Table 5.35 N/A
a The “obstruction not on the roof” is between zero degrees (north) and 40 degrees (northeast) leaving
greater than 270 degrees of unobstructed airflow. The prevailing winds are from the south and lay within
the unobstructed arc.

150
5.32 San Ramon
Site Information for San Ramon
AQS ID 06-013-2007
GPS coordinates 37.743649, -121.934188
Location Top of trailer
Address 9885 Alcosta Blvd, San Ramon, CA 94582
County Contra Costa
Distance to road from
gaseous probe (meters)
Alcosta Blvd (Montevideo): 300 Pine Valley Rd: 350
Alcosta Blvd (S of Bollinger): 100 Estero Dr: 250
Traffic count (AADT, year)
Alcosta Blvd (Montevideo): 9582 (2015)
Alcosta Blvd (S. of Bollinger): 21,000 (2017)
Pine Valley Rd: 9,500 (2018)
Estero Dr: <500 (est. 2012)
Traffic counts data were updated on April 1, 2020 and reflect
the latest available data.
Groundcover Gravel
Statistical Area San Francisco-Oakland-Hayward CBSA
Summary for San Ramon
Pollutants Measured O3, NOx
Spatial Scale Neighborhood scale (0.5 – 4 km)
Notes
The site is located in the city of San Ramon along the I-680
corridor, which connects the Livermore Valley with the San
Ramon Valley and other major cities of Contra Costa County.
During summer months, localized north winds can be
channeled southward from Concord and Walnut Creek
along the I-680 corridor and pass through San Ramon
before turning eastward into the Livermore Valley
transporting ozone and ozone precursors to the area.
San Ramon is part of the unofficial PAMS program and
measures hourly speciated hydrocarbons (see Section 3.4).
While the site meets Appendix A and E and eligible for
NAAQS comparison, monitors are designated as SPMS and
are not used toward meeting the minimum monitoring
requirements. In late 2013, the Air District decided to not
operate the NOx monitor during winter months.

151
San Ramon Monitor Information
Pollutant, POC O3, 1 NO2, 1
Primary/QA Collocated/Other N/A Primary
Parameter code 44201 42601 / 42602
Basic monitoring objective(s) Research, NAAQS
comparison Research
Site type(s) Population Oriented
Population Oriented
Monitor type(s) SPM SPM
Network affiliation(s) Unofficial PAMS Unofficial PAMS
Instrument manufacturer and model TECO 49i TECO 42i
Method code 047 074
FRM/FEM/ARM/other FEM FRM
Collecting Agency Air District Air District
Analytical Lab N/A N/A
Reporting Agency Air District Air District
Spatial scale Neighborhood Neighborhood
Monitor start date 01/01/2012 01/01/2012
Current Sampling frequency Continuous Continuous
Sampling season 04/01 – 11/30
01/01-11/30 in 2013
04/01-11/30 since
2014
Probe height (meters) 6 6
Distance from supporting structure (meters) >1 >1
Distance from obstructions on roof (meters). Include horizontal
distance + vertical height above probe for obstructions nearby
(meters).
None None
Distance from obstructions not on roof (meters). Include
horizontal distance + vertical height above probe for obstructions
nearby (meters).
None None
Distance from trees (meters) 62 62
Distance to furnace or incinerator flue (meters) None None
Distance between monitors fulfilling a QA collocation
requirement (meters) N/A N/A
For low volume PM instruments (flow rate < 200 liters/minute) is
any PM instrument within 1m of the LoVol?
If yes, please list distance (meters) and instruments(s).
N/A N/A
For high volume PM instrument (flow rate > 200 liters/minute), is
any PM instrument within 2m of the HiVol? If yes, please list
distance (meters) and instrument(s).
N/A N/A
Unrestricted airflow (degrees) 360 360
Probe material for reactive gases Teflon Teflon
Residence time for reactive gases (seconds) 18 18
Will there be changes within the next 18 months? N N
Is it suitable for comparison against the annual PM2.5? N/A N/A
Frequency of flow rate verification for PM samplers N/A N/A
Frequency of one-point QC check for gaseous instruments Every other day Every other day
Date of Annual Performance Evaluation conducted in the past
calendar year for gaseous parameters See Table 5.35 See Table 5.35
Date of two semi-annual flow rate audits conducted in the past
calendar year for PM monitors N/A N/A
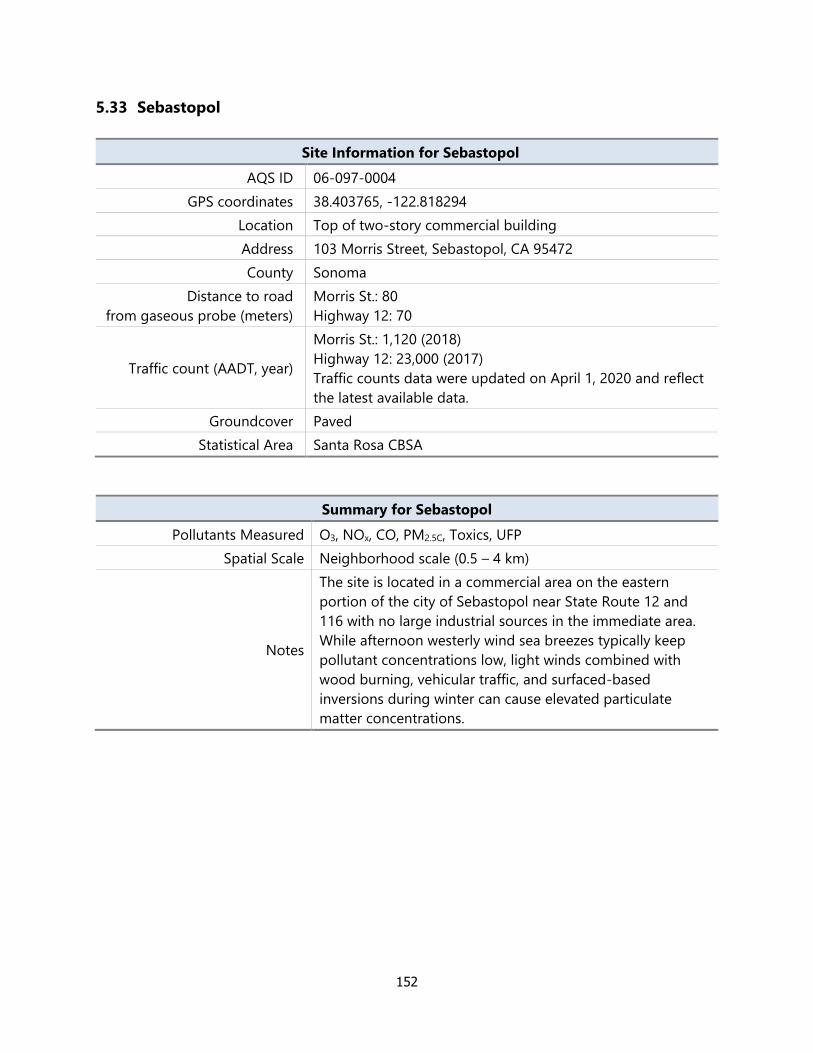
152
5.33 Sebastopol
Site Information for Sebastopol
AQS ID 06-097-0004
GPS coordinates 38.403765, -122.818294
Location Top of two-story commercial building
Address 103 Morris Street, Sebastopol, CA 95472
County Sonoma
Distance to road
from gaseous probe (meters)
Morris St.: 80
Highway 12: 70
Traffic count (AADT, year)
Morris St.: 1,120 (2018)
Highway 12: 23,000 (2017)
Traffic counts data were updated on April 1, 2020 and reflect
the latest available data.
Groundcover Paved
Statistical Area Santa Rosa CBSA
Summary for Sebastopol
Pollutants Measured O3, NOx, CO, PM2.5C, Toxics, UFP
Spatial Scale Neighborhood scale (0.5 – 4 km)
Notes
The site is located in a commercial area on the eastern
portion of the city of Sebastopol near State Route 12 and
116 with no large industrial sources in the immediate area.
While afternoon westerly wind sea breezes typically keep
pollutant concentrations low, light winds combined with
wood burning, vehicular traffic, and surfaced-based
inversions during winter can cause elevated particulate
matter concentrations.

153
Sebastopol Monitor Information
Pollutant, POC O3, 1 CO, 1 NO2, 1
Primary/QA Collocated/Other N/A N/A Primary
Parameter code 44201 42101 42601 / 42602
Basic monitoring objective(s) NAAQS
comparison
NAAQS
comparison
NAAQS
comparison
Site type(s)
Population
Oriented
Population
Oriented
Population
Oriented
Monitor type(s) SLAMS SLAMS SLAMS
Network affiliation(s) N/A N/A N/A
Instrument manufacturer and model TECO 49i TECO 48i TECO 42i
Method code 047 054 074
FRM/FEM/ARM/other FEM FRM FRM
Collecting Agency Air District Air District Air District
Analytical Lab N/A N/A N/A
Reporting Agency Air District Air District Air District
Spatial scale Neighborhood Neighborhood Neighborhood
Monitor start date 01/09/2014 01/09/2014 01/09/2014
Current Sampling frequency Continuous Continuous Continuous
Sampling season 01/01 – 12/31 01/01 – 12/31 01/01 – 12/31
Probe height (meters) 12 12 12
Distance from supporting structure (meters) >1 >1 >1
Distance from obstructions on roof (meters). Include horizontal
distance + vertical height above probe for obstructions nearby
(meters).
None None None
Distance from obstructions not on roof (meters). Include
horizontal distance + vertical height above probe for
obstructions nearby (meters).
None None None
Distance from trees (meters) 12 12 12
Distance to furnace or incinerator flue (meters) 4 4 4
Distance between monitors fulfilling a QA collocation
requirement (meters) N/A N/A N/A
For low volume PM instruments (flow rate < 200 liters/minute)
is any PM instrument within 1m of the LoVol? If yes, please list
distance (meters) and instruments(s).
N/A N/A N/A
For high volume PM instrument (flow rate > 200 liters/minute),
is any PM instrument within 2m of the HiVol? If yes, please list
distance (meters) and instrument(s).
N/A N/A N/A
Unrestricted airflow (degrees) 360 360 360
Probe material for reactive gases Teflon Teflon Teflon
Residence time for reactive gases (seconds) 10 12 13
Will there be changes within the next 18 months? N N N
Is it suitable for comparison against the annual PM2.5? N/A N/A N/A
Frequency of flow rate verification for PM samplers N/A N/A N/A
Frequency of one-point QC check for gaseous instruments Every other day Every other day Every other day
Date of Annual Performance Evaluation conducted in the past
calendar year for gaseous parameters See Table 5.35 See Table 5.35 See Table 5.35
Date of two semi-annual flow rate audits conducted in the past
calendar year for PM monitors N/A N/A N/A
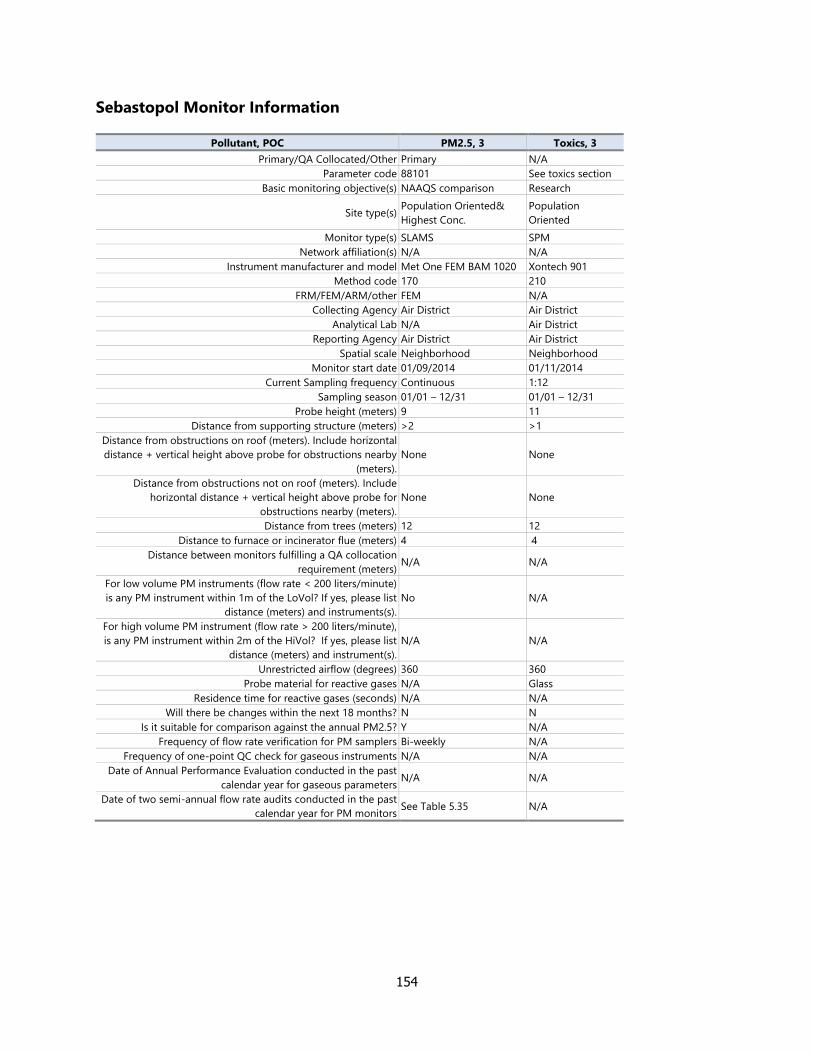
154
Sebastopol Monitor Information
Pollutant, POC PM2.5, 3 Toxics, 3
Primary/QA Collocated/Other Primary N/A
Parameter code 88101 See toxics section
Basic monitoring objective(s) NAAQS comparison Research
Site type(s) Population Oriented&
Highest Conc.
Population
Oriented
Monitor type(s) SLAMS SPM
Network affiliation(s) N/A N/A
Instrument manufacturer and model Met One FEM BAM 1020 Xontech 901
Method code 170 210
FRM/FEM/ARM/other FEM N/A
Collecting Agency Air District Air District
Analytical Lab N/A Air District
Reporting Agency Air District Air District
Spatial scale Neighborhood Neighborhood
Monitor start date 01/09/2014 01/11/2014
Current Sampling frequency Continuous 1:12
Sampling season 01/01 – 12/31 01/01 – 12/31
Probe height (meters) 9 11
Distance from supporting structure (meters) >2 >1
Distance from obstructions on roof (meters). Include horizontal
distance + vertical height above probe for obstructions nearby
(meters).
None None
Distance from obstructions not on roof (meters). Include
horizontal distance + vertical height above probe for
obstructions nearby (meters).
None None
Distance from trees (meters) 12 12
Distance to furnace or incinerator flue (meters) 4 4
Distance between monitors fulfilling a QA collocation
requirement (meters) N/A N/A
For low volume PM instruments (flow rate < 200 liters/minute)
is any PM instrument within 1m of the LoVol? If yes, please list
distance (meters) and instruments(s).
No N/A
For high volume PM instrument (flow rate > 200 liters/minute),
is any PM instrument within 2m of the HiVol? If yes, please list
distance (meters) and instrument(s).
N/A N/A
Unrestricted airflow (degrees) 360 360
Probe material for reactive gases N/A Glass
Residence time for reactive gases (seconds) N/A N/A
Will there be changes within the next 18 months? N N
Is it suitable for comparison against the annual PM2.5? Y N/A
Frequency of flow rate verification for PM samplers Bi-weekly N/A
Frequency of one-point QC check for gaseous instruments N/A N/A
Date of Annual Performance Evaluation conducted in the past
calendar year for gaseous parameters N/A N/A
Date of two semi-annual flow rate audits conducted in the past
calendar year for PM monitors See Table 5.35 N/A
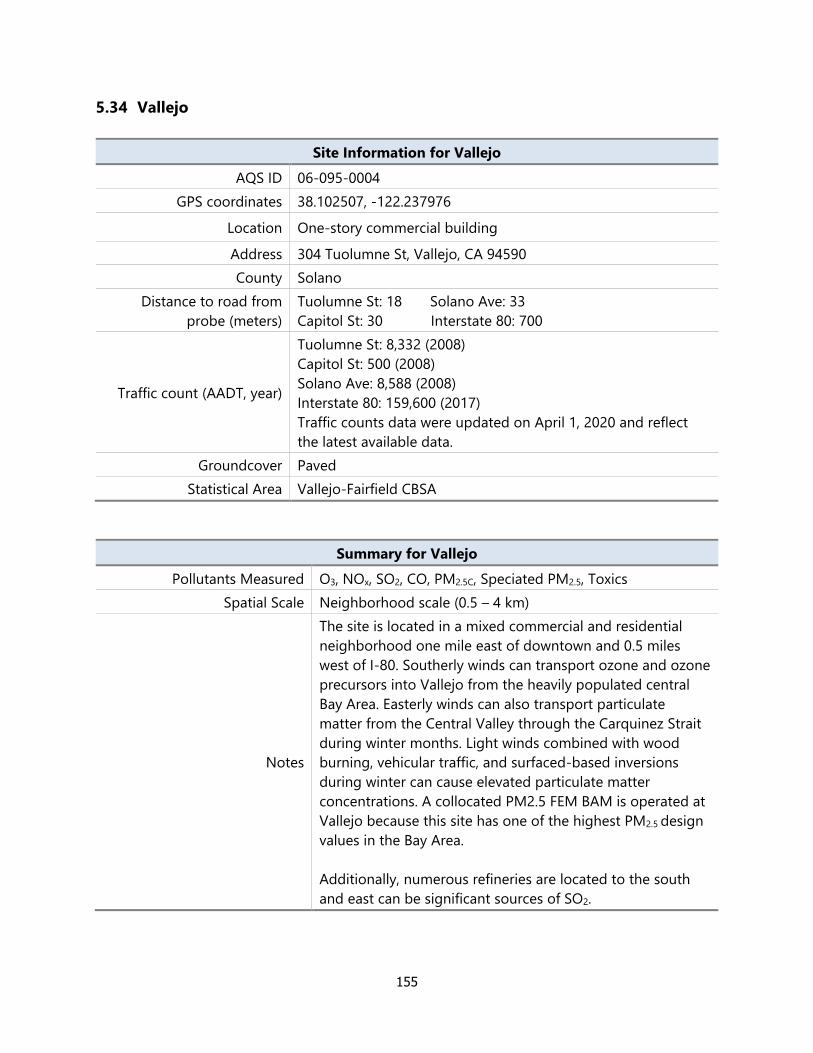
155
5.34 Vallejo
Site Information for Vallejo
AQS ID 06-095-0004
GPS coordinates 38.102507, -122.237976
Location One-story commercial building
Address 304 Tuolumne St, Vallejo, CA 94590
County Solano
Distance to road from
probe (meters)
Tuolumne St: 18 Solano Ave: 33
Capitol St: 30 Interstate 80: 700
Traffic count (AADT, year)
Tuolumne St: 8,332 (2008)
Capitol St: 500 (2008)
Solano Ave: 8,588 (2008)
Interstate 80: 159,600 (2017)
Traffic counts data were updated on April 1, 2020 and reflect
the latest available data.
Groundcover Paved
Statistical Area Vallejo-Fairfield CBSA
Summary for Vallejo
Pollutants Measured O3, NOx, SO2, CO, PM2.5C, Speciated PM2.5, Toxics
Spatial Scale Neighborhood scale (0.5 – 4 km)
Notes
The site is located in a mixed commercial and residential
neighborhood one mile east of downtown and 0.5 miles
west of I-80. Southerly winds can transport ozone and ozone
precursors into Vallejo from the heavily populated central
Bay Area. Easterly winds can also transport particulate
matter from the Central Valley through the Carquinez Strait
during winter months. Light winds combined with wood
burning, vehicular traffic, and surfaced-based inversions
during winter can cause elevated particulate matter
concentrations. A collocated PM2.5 FEM BAM is operated at
Vallejo because this site has one of the highest PM2.5 design
values in the Bay Area.
Additionally, numerous refineries are located to the south
and east can be significant sources of SO2.

156
Vallejo Monitor Information
Pollutant, POC O3, 1 CO, 1 NO2, 1 SO2, 1
Primary/QA Collocated/Other N/A N/A Primary N/A
Parameter code 44201 42101 42601 / 42602 42401
Basic monitoring objective(s) NAAQS
comparison
NAAQS
comparison
NAAQS
comparison
NAAQS
comparison
Site type(s) Population
Oriented
Population
Oriented
Population
Oriented
Population
Oriented&
Source Impact
Monitor type(s) SLAMS SLAMS SLAMS SLAMS
Network affiliation(s) N/A N/A N/A N/A
Instrument manufacturer and model TECO 49i TECO 48i TECO 42i TECO 43i
Method code 047 054 074 060
FRM/FEM/ARM/other FEM FRM FRM FEM
Collecting Agency Air District Air District Air District Air District
Analytical Lab N/A N/A N/A N/A
Reporting Agency Air District Air District Air District Air District
Spatial scale Neighborhood Neighborhood Neighborhood Neighborhood
Monitor start date 07/01/1976 07/01/1976 07/01/1976 07/01/1976
Current Sampling frequency Continuous Continuous Continuous Continuous
Sampling season 01/01 - 12/31 01/01 - 12/31 01/01 - 12/31 01/01 - 12/31
Probe height (meters) 9 9 9 9
Distance from supporting structure (meters) >1 >1 >1 >1 Distance from obstructions on roof (meters). Include horizontal distance + vertical height above probe for obstructions nearby
(meters). None None None None
Distance from obstructions not on roof (meters). Include horizontal distance + vertical height above probe for
obstructions nearby (meters). None None None None
Distance from trees (meters) >50 >50 >50 >50
Distance to furnace or incinerator flue (meters) 4 4 4 4
Distance between monitors fulfilling a QA collocation
requirement (meters) N/A N/A N/A N/A
For low volume PM instruments (flow rate < 200 liters/minute) is
any PM instrument within 1m of the LoVol? If yes, please list
distance (meters) and instruments(s).
N/A N/A N/A N/A
For high volume PM instrument (flow rate > 200 liters/minute),
is any PM instrument within 2m of the HiVol? If yes, please list
distance (meters) and instrument(s).
N/A N/A N/A N/A
Unrestricted airflow (degrees) 360 360 360 360
Probe material for reactive gases Teflon Teflon Teflon Teflon
Residence time for reactive gases (seconds) 8 10 10 10
Will there be changes within the next 18 months? N N N N
Is it suitable for comparison against the annual PM2.5? N/A N/A N/A N/A
Frequency of flow rate verification for PM samplers N/A N/A N/A N/A
Frequency of one-point QC check for gaseous instruments Every other day Every other day Every other day Every other day
Date of Annual Performance Evaluation conducted in the past
calendar year for gaseous parameters See Table 5.35 See Table 5.35 See Table 5.35 See Table 5.35
Date of two semi-annual flow rate audits conducted in the past
calendar year for PM monitors N/A N/A N/A N/A
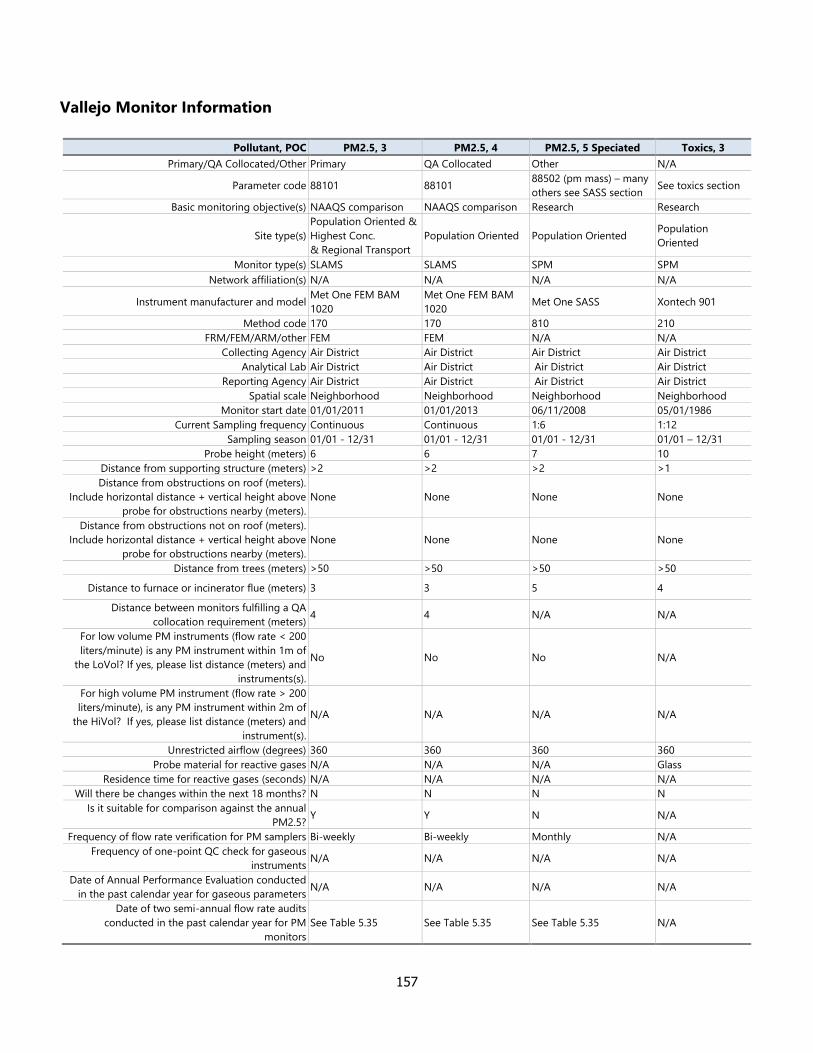
157
Vallejo Monitor Information
Pollutant, POC PM2.5, 3 PM2.5, 4 PM2.5, 5 Speciated Toxics, 3
Primary/QA Collocated/Other Primary QA Collocated Other N/A
Parameter code 88101 88101 88502 (pm mass) – many
others see SASS section See toxics section
Basic monitoring objective(s) NAAQS comparison NAAQS comparison Research Research
Site type(s)
Population Oriented &
Highest Conc.
& Regional Transport
Population Oriented Population Oriented Population
Oriented
Monitor type(s) SLAMS SLAMS SPM SPM
Network affiliation(s) N/A N/A N/A N/A
Instrument manufacturer and model Met One FEM BAM
1020
Met One FEM BAM
1020 Met One SASS Xontech 901
Method code 170 170 810 210
FRM/FEM/ARM/other FEM FEM N/A N/A
Collecting Agency Air District Air District Air District Air District
Analytical Lab Air District Air District Air District Air District
Reporting Agency Air District Air District Air District Air District
Spatial scale Neighborhood Neighborhood Neighborhood Neighborhood
Monitor start date 01/01/2011 01/01/2013 06/11/2008 05/01/1986
Current Sampling frequency Continuous Continuous 1:6 1:12
Sampling season 01/01 - 12/31 01/01 - 12/31 01/01 - 12/31 01/01 – 12/31
Probe height (meters) 6 6 7 10
Distance from supporting structure (meters) >2 >2 >2 >1
Distance from obstructions on roof (meters).
Include horizontal distance + vertical height above
probe for obstructions nearby (meters).
None None None None
Distance from obstructions not on roof (meters).
Include horizontal distance + vertical height above
probe for obstructions nearby (meters).
None None None None
Distance from trees (meters) >50 >50 >50 >50
Distance to furnace or incinerator flue (meters) 3 3 5 4
Distance between monitors fulfilling a QA
collocation requirement (meters) 4 4 N/A N/A
For low volume PM instruments (flow rate < 200
liters/minute) is any PM instrument within 1m of
the LoVol? If yes, please list distance (meters) and
instruments(s).
No No No N/A
For high volume PM instrument (flow rate > 200
liters/minute), is any PM instrument within 2m of
the HiVol? If yes, please list distance (meters) and
instrument(s).
N/A N/A N/A N/A
Unrestricted airflow (degrees) 360 360 360 360
Probe material for reactive gases N/A N/A N/A Glass
Residence time for reactive gases (seconds) N/A N/A N/A N/A
Will there be changes within the next 18 months? N N N N
Is it suitable for comparison against the annual
PM2.5? Y Y N N/A
Frequency of flow rate verification for PM samplers Bi-weekly Bi-weekly Monthly N/A
Frequency of one-point QC check for gaseous
instruments N/A N/A N/A N/A
Date of Annual Performance Evaluation conducted
in the past calendar year for gaseous parameters N/A N/A N/A N/A
Date of two semi-annual flow rate audits
conducted in the past calendar year for PM
monitors
See Table 5.35 See Table 5.35 See Table 5.35 N/A
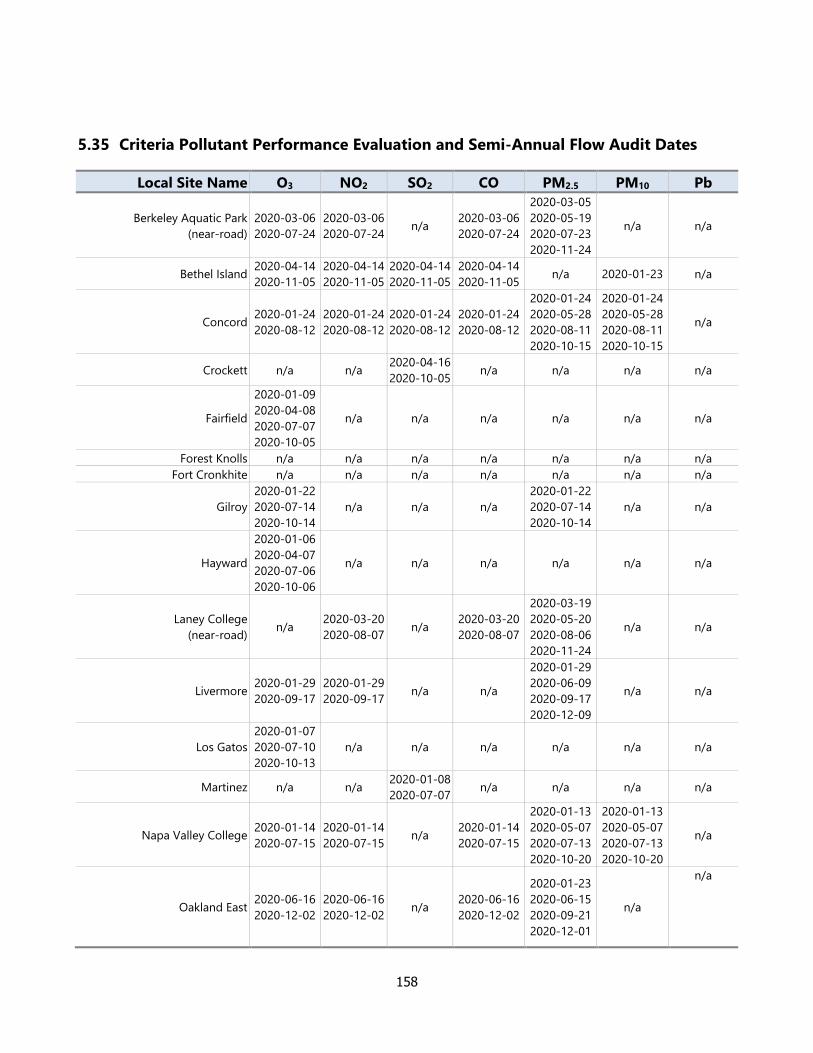
158
5.35 Criteria Pollutant Performance Evaluation and Semi-Annual Flow Audit Dates
Local Site Name O3 NO2 SO2 CO PM2.5 PM10 Pb
Berkeley Aquatic Park
(near-road)
2020-03-06
2020-07-24
2020-03-06
2020-07-24 n/a
2020-03-06
2020-07-24
2020-03-05
2020-05-19
2020-07-23
2020-11-24
n/a n/a
Bethel Island 2020-04-14
2020-11-05
2020-04-14
2020-11-05
2020-04-14
2020-11-05
2020-04-14
2020-11-05 n/a 2020-01-23 n/a
Concord 2020-01-24
2020-08-12
2020-01-24
2020-08-12
2020-01-24
2020-08-12
2020-01-24
2020-08-12
2020-01-24
2020-05-28
2020-08-11
2020-10-15
2020-01-24
2020-05-28
2020-08-11
2020-10-15
n/a
Crockett n/a n/a 2020-04-16
2020-10-05 n/a n/a n/a n/a
Fairfield
2020-01-09
2020-04-08
2020-07-07
2020-10-05
n/a n/a n/a n/a n/a n/a
Forest Knolls n/a n/a n/a n/a n/a n/a n/a
Fort Cronkhite n/a n/a n/a n/a n/a n/a n/a
Gilroy
2020-01-22
2020-07-14
2020-10-14
n/a n/a n/a
2020-01-22
2020-07-14
2020-10-14
n/a n/a
Hayward
2020-01-06
2020-04-07
2020-07-06
2020-10-06
n/a n/a n/a n/a n/a n/a
Laney College
(near-road) n/a
2020-03-20
2020-08-07 n/a
2020-03-20
2020-08-07
2020-03-19
2020-05-20
2020-08-06
2020-11-24
n/a n/a
Livermore 2020-01-29
2020-09-17
2020-01-29
2020-09-17 n/a n/a
2020-01-29
2020-06-09
2020-09-17
2020-12-09
n/a n/a
Los Gatos
2020-01-07
2020-07-10
2020-10-13
n/a n/a n/a n/a n/a n/a
Martinez n/a n/a 2020-01-08
2020-07-07 n/a n/a n/a n/a
Napa Valley College 2020-01-14
2020-07-15
2020-01-14
2020-07-15 n/a
2020-01-14
2020-07-15
2020-01-13
2020-05-07
2020-07-13
2020-10-20
2020-01-13
2020-05-07
2020-07-13
2020-10-20
n/a
Oakland East 2020-06-16
2020-12-02
2020-06-16
2020-12-02 n/a
2020-06-16
2020-12-02
2020-01-23
2020-06-15
2020-09-21
2020-12-01
n/a
n/a
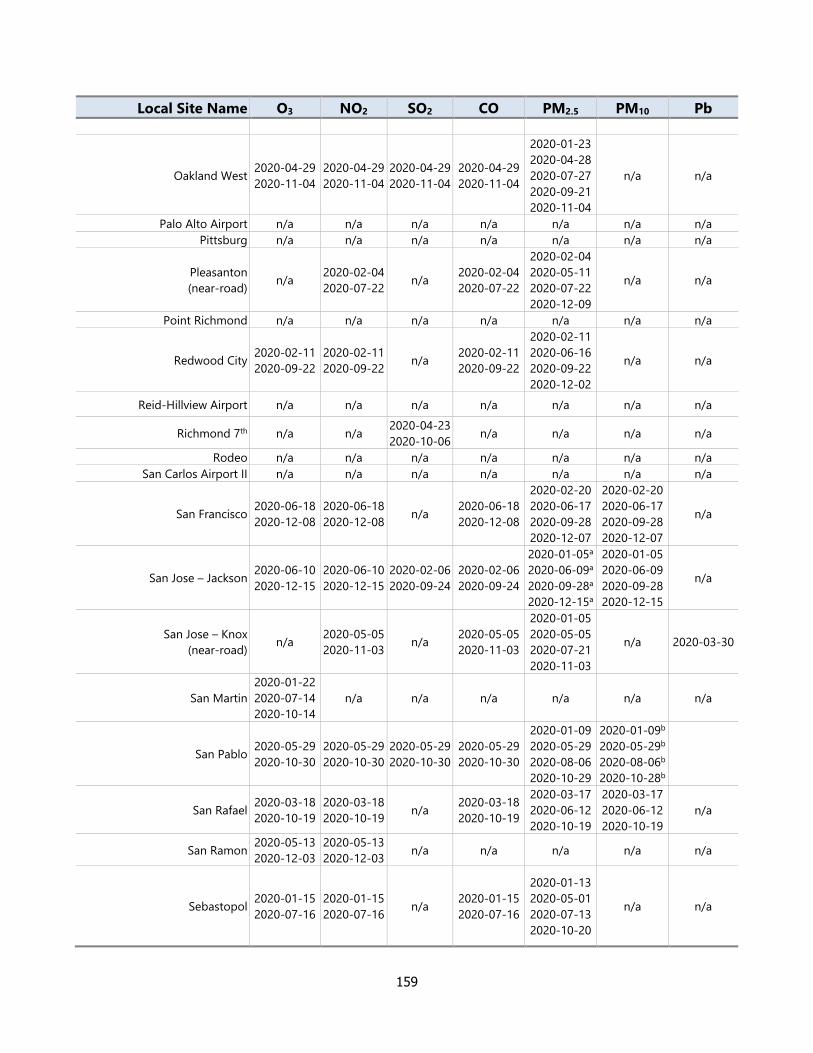
159
Local Site Name O3 NO2 SO2 CO PM2.5 PM10 Pb
Oakland West 2020-04-29
2020-11-04
2020-04-29
2020-11-04
2020-04-29
2020-11-04
2020-04-29
2020-11-04
2020-01-23
2020-04-28
2020-07-27
2020-09-21
2020-11-04
n/a n/a
Palo Alto Airport n/a n/a n/a n/a n/a n/a n/a
Pittsburg n/a n/a n/a n/a n/a n/a n/a
Pleasanton
(near-road) n/a
2020-02-04
2020-07-22 n/a
2020-02-04
2020-07-22
2020-02-04
2020-05-11
2020-07-22
2020-12-09
n/a n/a
Point Richmond n/a n/a n/a n/a n/a n/a n/a
Redwood City 2020-02-11
2020-09-22
2020-02-11
2020-09-22 n/a
2020-02-11
2020-09-22
2020-02-11
2020-06-16
2020-09-22
2020-12-02
n/a n/a
Reid-Hillview Airport n/a n/a n/a n/a n/a n/a n/a
Richmond 7th n/a n/a 2020-04-23
2020-10-06 n/a n/a n/a n/a
Rodeo n/a n/a n/a n/a n/a n/a n/a
San Carlos Airport II n/a n/a n/a n/a n/a n/a n/a
San Francisco 2020-06-18
2020-12-08
2020-06-18
2020-12-08 n/a
2020-06-18
2020-12-08
2020-02-20
2020-06-17
2020-09-28
2020-12-07
2020-02-20
2020-06-17
2020-09-28
2020-12-07
n/a
San Jose – Jackson 2020-06-10
2020-12-15
2020-06-10
2020-12-15
2020-02-06
2020-09-24
2020-02-06
2020-09-24
2020-01-05a
2020-06-09a
2020-09-28a
2020-12-15a
2020-01-05
2020-06-09
2020-09-28
2020-12-15
n/a
San Jose – Knox
(near-road) n/a
2020-05-05
2020-11-03 n/a
2020-05-05
2020-11-03
2020-01-05
2020-05-05
2020-07-21
2020-11-03
n/a 2020-03-30
San Martin
2020-01-22
2020-07-14
2020-10-14
n/a n/a n/a n/a n/a n/a
San Pablo 2020-05-29
2020-10-30
2020-05-29
2020-10-30
2020-05-29
2020-10-30
2020-05-29
2020-10-30
2020-01-09
2020-05-29
2020-08-06
2020-10-29
2020-01-09b
2020-05-29b
2020-08-06b
2020-10-28b
San Rafael 2020-03-18
2020-10-19
2020-03-18
2020-10-19 n/a
2020-03-18
2020-10-19
2020-03-17
2020-06-12
2020-10-19
2020-03-17
2020-06-12
2020-10-19
n/a
San Ramon 2020-05-13
2020-12-03
2020-05-13
2020-12-03 n/a n/a n/a n/a n/a
Sebastopol 2020-01-15
2020-07-16
2020-01-15
2020-07-16 n/a
2020-01-15
2020-07-16
2020-01-13
2020-05-01
2020-07-13
2020-10-20
n/a
n/a

160
Local Site Name O3 NO2 SO2 CO PM2.5 PM10 Pb
Vallejo 2020-06-04
2020-11-19
2020-06-04
2020-11-19
2020-06-04
2020-11-19
2020-06-04
2020-11-19
2020-01-27c
2020-06-04c
2020-08-04c
2020-11-09c
a Semi-Annual flow audits for both POC-1 and POC-3 occurred on the same dates. b Semi-Annual flow audits for both POC-1 and POC-2 occurred on the same dates.
c Semi-Annual flow audits for both POC-3 and POC-4 occurred on the same dates.

161
Appendices A through H

162
APPENDIX A. OZONE MONITORING AGREEMENT BETWEEN
BAAQMD AND MBUAPCD

163

164
APPENDIX B. PM10 MONITORING AGREEMENT BETWEEN BAAQMD
AND MBUAPCD

165
APPENDIX C. NO2 MONITORING AGREEMENT BETWEEN BAAQMD
AND MBUAPCD
166

167
APPENDIX D. CO, NO2, AND PM2.5 NEAR-ROAD MONITORING
AGREEMENT BETWEEN BAAQMD AND MBUAPCD

168

169
APPENDIX E. OZONE MONITORING AGREEMENT BETWEEN
BAAQMD AND NSCAPCD

170

171
APPENDIX F. EPA APPROVAL TO END MONITORING OF NOY AT THE
SAN JOSE NCORE SITE

172

173

174

175

176
APPENDIX G. HAYWARD SLAMS TO SPM CORRESPONDENCE
(see original request in 2019 ANP, copied below for convenience)
As noted in section 2.2.1, EPA noted in their 2018 TSA that the Hayward O3 monitor
does not meet 40 CFR 58 Appendix E siting requirements and that it should, therefore,
be classified as an SPM. The Air District is requesting that EPA approve the closure of the
Hayward ozone monitor as a SLAMS since it meets the criteria of 40 CFR 58.14 (c) and
58.14 (c) (2) which state:
(c) State, or where appropriate, local agency requests for SLAMS monitor station
discontinuation, subject to the review of the Regional Administrator, will be approved
if any of the following criteria are met and if the requirements of appendix D to this
part, if any, continue to be met. Other requests for discontinuation may also be
approved on a case-by-case basis if discontinuance does not compromise data
collection needed for implementation of a NAAQS and if the requirements of
appendix D to this part, if any, continue to be met.
…
(2) Any SLAMS monitor for CO, PM10, SO2, or NO2 which has consistently measured
lower concentrations than another monitor for the same pollutant in the same county
(or portion of a county within a distinct attainment area, nonattainment area, or
maintenance area, as applicable) during the previous five years, and which is not
specifically required by an attainment plan or maintenance plan, if control measures
scheduled to be implemented or discontinued during the next five years would apply
to the areas around both monitors and have similar effects on measured
concentrations, such that the retained monitor would remain the higher reading of
the two monitors being compared.
The figure below shows that the Hayward site has never been the maximum
concentration site for the San Francisco-Oakland-Berkeley CBSA nor for the San
Francisco Bay Area nonattainment area. More specifically, the Livermore and San Martin
sites, located in the Bay Area’s two maximum ozone areas downwind of urban
precursors, have always measured higher design values than the Hayward site.
Therefore, the discontinuation of the Hayward O3 monitor as a SLAMS does not
compromise data collection needed for implementation of the NAAQS. The Air District
intends to continue operating the Hayward ozone monitor as an SPM as resources
allow. If the SLAMS closure is approved, the Hayward O3 SPM will not be counted
towards minimum monitoring requirements in future years, however, the San Francisco-
Oakland-Berkeley CBSA will still meet minimum monitoring requirements.
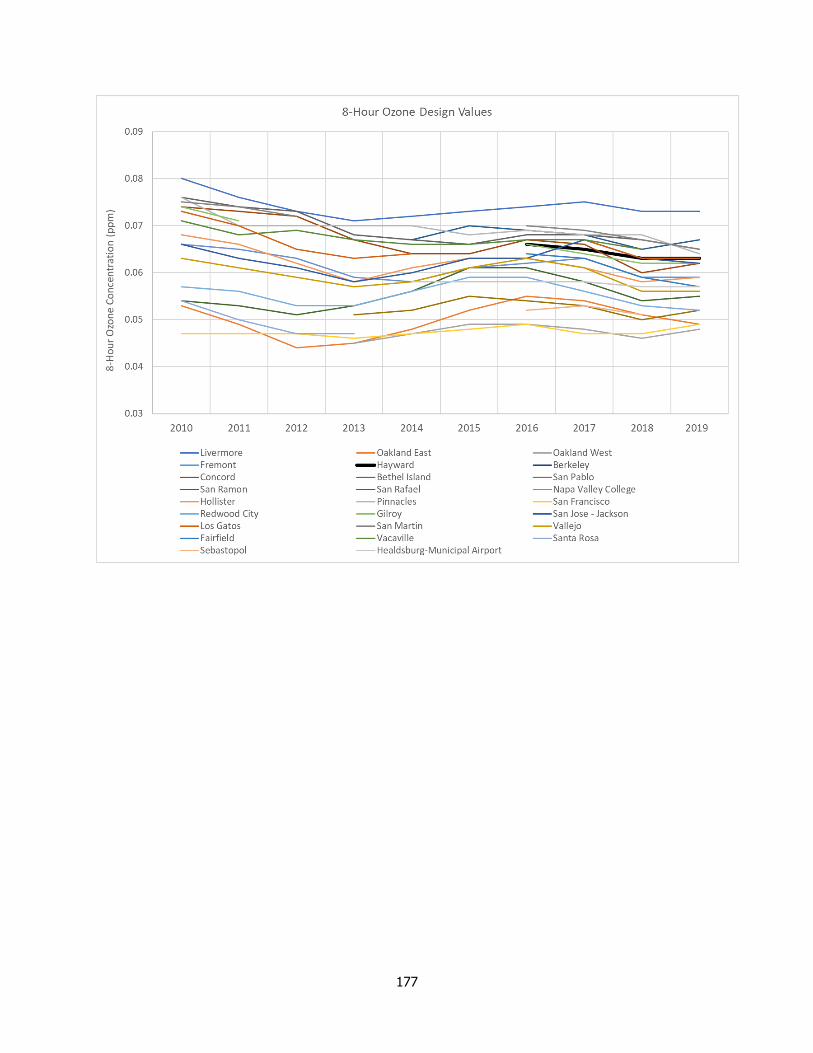
177

178

179

180
APPENDIX H. INITIAL PLAN FOR PAMS REQUIRED SITES
Air District voluntarily operated two unofficial PAMS sites (Livermore and San Ramon) as
a PAMS-like network to better understand ozone formation episodes and enhance
forecasting capabilities (see Section 5.4 for more details). While a PAMS network was
previously required for only serious, severe, or extreme ozone nonattainment areas, the
recently revised monitoring rule (80 FR 65292; October 26, 2015) requires PAMS
measurements June 1 through August 31 at NCore sites that are located in Core-Based
Statistical Areas (CBSAs) with populations of 1,000,000 or more, starting in 2019.
Based on 40 CFR part 58 Appendix D, State air monitoring agencies are required to
begin making PAMS measurements at their NCore location(s) by June 1, 2020. The EPA
is delaying the start date for the revised PAMS monitoring site network established in 40
CFR part 58, Appendix D. This final action extends the start date from June 1, 2020, to
June 1, 2021. As a result of the, delay the BAAQMD will not begin making PAMS
measurements at the Livermore (approved NCore-waiver site location) in 2020, and will
work with EPA to begin measurements in the fall of 2021.
The PAMS measurements at this site must include hourly measurements of speciated
VOCs, O3, NO, true NO2, NOy, ambient temperature, wind speed, wind direction,
atmospheric pressure, relative humidity, precipitation, mixing-height, solar radiation,
and UV radiation. In addition, three 8-hour average carbonyl samples in a day are
required on a 1 in 3 day schedule. The initial plan for implementing this requirement is
to be submitted to EPA for their approval by July 1, 2018 (40 CFR 50.10(a)(10). USEPA
has indicated that it is working on a proposed rule to extend the start date of PAMS
measurements and expects that this proposed rule change will be signed by June 1,
2019. As a result of the, delay the BAAQMD will not begin making PAMS measurements
at the Livermore (approved NCore-waiver site location) in 2020, and will work with EPA
to begin measurements on or before the final revised start date for this network.
However, EPA has requested that monitoring agencies submit the following information
by July 1, 2017.
Network Decision
The NCore site located at San Jose – Jackson will serve as the location of the
required PAMS site and will measure the following parameters described
below. An inventory of equipment used at the site(s) is provided in Attachment 2.
We request a waiver from implementing PAMS at an otherwise required NCore
site entirely, or to make PAMS measurements at alternative locations such as
existing PAMS sites or existing NATTS sites. The Air District is requesting approval
for an alternate location, the current unofficial-PAMS site in Livermore, per 40

181
CFR 58 Appendix D 5(c). Rationale for this waiver is provided in Attachment 1. An
inventory of equipment the Air District expects to use at the site is provided in
Attachment 2.
Auto GC Decision
Volatile organic compounds (VOCs) – Table H-1 includes a draft list of the
targeted VOCs not yet finalized by EPA.
We will measure hourly speciated VOC measurements with an auto-gas
chromatograph (GC). An inventory of equipment the Air District expects to use at
the site is provided in Attachment 2.
We request a waiver to allow three 8-hour samples every third day as an
alternative to daily hourly speciated VOC measurements at locations (insert
locations).
Meteorology Measurements Decision
EPA is suggesting the use of ceilometers for determining mixing height, however
other types of meteorological equipment that provide for an indication of mixing
height can be proposed.
Will measure wind direction, wind speed, temperature, humidity, atmospheric
pressure, precipitation, solar radiation, ultraviolet radiation, and mixing height.
An inventory of equipment the Air District expects to use at the site is provided in
Attachment 2.
We request a waiver to allow meteorological measurements to be obtained from
other nearby sites.
Other Required Measurements
Carbonyls – The Air District intends to meet the carbonyl sampling requirement
with continuous formaldehyde sampling if instrumentation that meets
performance specifications is identified. The Air District prefers this option due to
added value of increased temporal resolution and significant resource savings in
operational expenses and staff time. If this option is not technically feasible, the
Air District will conduct discrete cartridge sampling using a Xontech 924 or
similar instrumentation (has not yet been purchased) and the national contract
lab for analyses and data reporting. If selected, cartridge sampling will be
conducted at a frequency of three 8-hour samples on a one-in-three day basis.

182
Table H-1 lists the target carbonyls analyzed by the contract lab if the discrete
sampling option is chosen (not yet finalized by EPA).
Nitrogen Oxides – The Air District will monitor for NO and NOy (total oxides of
nitrogen) in addition to true NO2. The true NO2 is required to be measured with a
direct reading NO2 analyzer, cavity attenuated phase shift (CAPS) spectroscopy or
photolytic-converter NOx analyzer. An inventory of equipment the Air District
expects to use at the site is provided in Attachment 2.
Table H-1. PAMS Target Compound List
Priority Compounds Optional Compounds
1 1,2,3-trimethylbenzene a 19 n-hexane b 1 1,3,5-trimethylbenzene 19 m-diethlybenzene
2 1,2,4-trimethylbenzene a 20 n-pentane 2 1-pentene 20 methylcyclohexane
3 1-butene 21 o-ethyltoluene a 3 2,2-dimethylbutane 21 methylcyclopentane
4 2,2,4-trimethylpentane b 22 o-xylene a,b 4 2,3,4-trimethylpentane 22 n-decane
5 acetaldehyde b,c 23 p-ethyltoluene a 5 2,3-dimethylbutane 23 n-heptane
6 acetone c,d 24 Propane 6 2,3-dimethylpentane 24 n-nonane
7 benzene a,b 25 propylene 7 2,4-dimethylpentane 25 n-octane
8 c-2-butene 26 styrene a,b 8 2-methylheptane 26 n-propylbenzene a
9 ethane d 27 toluene a,b 9 2-methylhexane 27 n-undecane
10 ethylbenzene a,b 28 t-2-butene 10 2-methylpentane 28 p-diethylbenzene
11 Ethylene 11 3-methylheptane 29 t-2-pentene
12 formaldehyde b,c 12 3-methylhexane 30 α/β-pinene
13 Isobutane 13 3-methylpentane 31 1,3 butadiene b
14 Isopentane 14 Acetylene 32 benzaldehyde c
15 Isoprene 15 c-2-pentene 33 carbon tetrachloride b
16 m&p-xylenes a,b 16 cyclohexane 34 Ethanol
17 m-ethyltoluene a 17 cyclopentane 35 Tetrachloroethylene b
18 n-butane 18 isopropylbenzene b
Source: Revisions to the Photochemical Assessment Monitoring Stations Compound Target
List. U.S. EPA, November 20, 2013 a Important SOAP (Secondary Organic Aerosols Precursor) Compounds b HAP (Hazardous Air Pollutant) Compounds c Carbonyl compounds d Non-reactive compounds, not considered to be VOC for regulatory purposes

183
Attachment 1: PAMS Required Site Location Waiver Request and Rationale
The Bay Area Air Quality Management District (Air District) is requesting that EPA
approve a waiver to operate the required PAMS site at our current unofficial PAMS
location at Livermore (AQS ID 06-001-0007), rather than our NCore site at San Jose –
Jackson (AQS ID 06-085-0005). The Livermore site has been the design value site for the
Bay Area ozone nonattainment area since 2003-2005. As such, it is the critical site for
any required attainment modeling, and therefore it will be more useful to have
precursor and meteorological measurements at Livermore than at San Jose – Jackson.
Due to the flight path for the San Jose International Airport, meteorological
measurements are impossible to conduct at the San Jose – Jackson site, so
implementing PAMS at Livermore allows for these measurements at the same location
as the O3 and O3 precursor measurements, which is also preferable for model validation.
Finally, the Air District has conducted O3 precursor measurements at the Livermore site
since 2010, making it a better site to continue to assess trends in the concentrations of
these precursors.

184
Attachment 2: Current Equipment Plans for the PAMS Required Site
Table H-2. PAMS Target Compound List
Parameter Equipment
VOC Perkin Elmer TD300 with Clarus GC
True NO2 API T500U (CAPS)
NO/NOy API T200 EU/NOy
Carbonyls Continuous formaldehyde sampler or Xontech 924 or similar
Mixing Height Vaisala CL-51 (ceilometer)
Wind Direction, Wind
Speed
Climatronics F460 cup and vane
Ambient Temperature Campbell Scientific CS107
Relative Humidity Vaisala HMP-45
Barometric Pressure Vaisala PTB110
Solar Radiation Eppley 8-48
UV Radiation Eppley TUVR
Precipitation Texas Electronics TR-525USW (tipping bucket)

185

186