Embed Size (px)
Citation preview
Equipment Leasing & Finance U.S. Economic Outlook
2017 Q3 Update — July
Q3 2017 Equipment Leasing & Finance U.S. Economic Outlook
July 2017
i
TABLE OF CONTENTS
Summary ................................................................................................................................................. 1
Equipment & Software Investment Outlook ........................................................................................... 2
Foundation-Keybridge U.S. Equipment & Software Investment Momentum Monitor ......................................... 2
Equipment & Software Investment Annual Growth Forecast .......................................................................... 6
U.S. Capital Investment and Credit Markets ........................................................................................... 7
Recent Trends in Capital Investment ............................................................................................................ 7
Recent Trends in Credit Markets .................................................................................................................. 8
Update on Fed Policy .................................................................................................................................. 9
Overview of the U.S. Economy ............................................................................................................... 11
Recent Trends in the U.S. Economy ............................................................................................................ 11
Economic Tailwinds ................................................................................................................................... 12
Economic Headwinds ................................................................................................................................. 13
Additional Factors to Watch ........................................................................................................................ 14
Projections for Key Economic Indicators ..................................................................................................... 15
Appendix ................................................................................................................................................ 16
Quarterly Data .......................................................................................................................................... 16
Monthly Data ............................................................................................................................................ 17
About the Outlook ..................................................................................................................................... 18
About the Momentum Monitor .................................................................................................................... 18
How to Read the Momentum Monitor .......................................................................................................... 19
About Keybridge ........................................................................................................................................ 20
Q3 2017 Equipment Leasing & Finance U.S. Economic Outlook
July 2017
1
SUMMARY
Equipment & Software Investment Outlook: Equipment and software investment growth in 2017 got off to a solid start in
the first quarter and should continue to bounce back from a lackluster 2016, driven by overall improvements in business
confidence and a more positive outlook for the industrial sector. The labor market remains strong, although wage growth
continues to lag compared to prior economic recoveries. Improved global growth prospects and sustained business and
consumer confidence should help to drive economic growth through the remainder of the year, but ongoing uncertainty
regarding key federal policy initiatives present significant headwinds. The majority of equipment verticals are on an upswing
and should expand moderately this year:
• Agriculture Machinery investment may grow modestly on a year-over-year basis over the next two quarters.
• Construction Machinery investment growth should improve somewhat over the next three to six months.
• Materials Handling Equipment investment will likely improve over the next three to six months.
• All Other Industrial Equipment investment should maintain a slow growth trajectory over the next three to six months.
• Medical Equipment investment growth is likely to weaken over the next three to six months.
• Mining & Oilfield Machinery investment growth should continue a strong recovery over the next three to six months.
• Aircraft investment growth may decelerate over the next three to six months.
• Ships & Boats investment growth is expected to strengthen over the next three to six months.
• Railroad Equipment investment growth should continue to improve over the next three to six months.
• Trucks investment growth is poised for a resurgence over the next two quarters.
• Computers investment growth is set to improve over next three to six months.
• Software investment growth should remain steady over the next three to six months.
U.S. Capital Investment & Credit Markets: U.S. credit conditions are healthy, with virtually no change in supply from last
quarter and a slight weakening in credit demand for both consumers and businesses. The Federal Reserve raised interest rates
in June for the third time in 12 months and remains generally optimistic about the U.S. economy. However, weakening
inflationary pressures and a shift in the Fed’s focus toward shrinking its balance sheet make additional interest rate increases
less likely during the second half of the year.
Overview of the U.S. Economy: The U.S. economy remains on solid footing, despite a disappointing start to the year. Labor
markets are historically strong, and although consumer spending was soft in the first quarter, most economists expect spending
to improve. Business investment and manufacturing activity have been solid thus far in 2017 and should remain positive
throughout the year. Government spending may have a slight negative effect on economic growth this year, while exports may
improve due to global economic strength and a weaker dollar — provided the United States pursues pro-growth trade policies
and avoids a trade war with China. While a strong surge is unlikely, the U.S. economy continues to be on track for moderate
growth after a sluggish 2016.
Bottom Line for the Equipment Finance Sector: Equipment and software investment should remain positive
through the rest of 2017, as solid growth in Q1 — the strongest quarter in two years — provides a good jump-off
point for the year. Sustained business confidence and the ongoing recovery in the oil and mining sector should buoy
investment in several equipment verticals, despite lingering concerns related to policy uncertainty. We expect the
economy to grow 2.4% in 2017 (revised down from 2.5% in our Q2 outlook), while equipment and software
investment is projected to expand 3.6% (up from 2.8% in the Q2 outlook).
Q3 2017 Equipment Leasing & Finance U.S. Economic Outlook
July 2017
2
EQUIPMENT & SOFTWARE INVESTMENT OUTLOOK
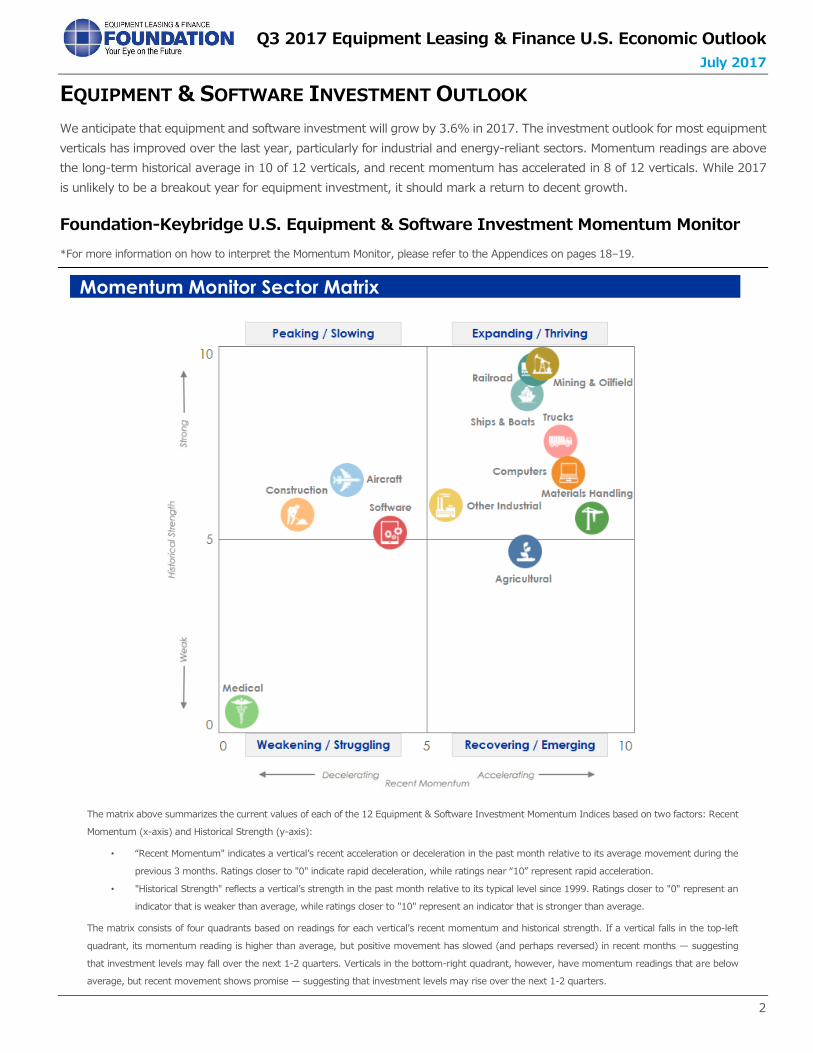
We anticipate that equipment and software investment will grow by 3.6% in 2017. The investment outlook for most equipment
verticals has improved over the last year, particularly for industrial and energy-reliant sectors. Momentum readings are above
the long-term historical average in 10 of 12 verticals, and recent momentum has accelerated in 8 of 12 verticals. While 2017
is unlikely to be a breakout year for equipment investment, it should mark a return to decent growth.
Foundation-Keybridge U.S. Equipment & Software Investment Momentum Monitor
*For more information on how to interpret the Momentum Monitor, please refer to the Appendices on pages 18–19.
Momentum Monitor Sector Matrix
The matrix above summarizes the current values of each of the 12 Equipment & Software Investment Momentum Indices based on two factors: Recent
Momentum (x-axis) and Historical Strength (y-axis):
• “Recent Momentum" indicates a vertical’s recent acceleration or deceleration in the past month relative to its average movement during the
previous 3 months. Ratings closer to "0" indicate rapid deceleration, while ratings near “10” represent rapid acceleration.
• "Historical Strength" reflects a vertical’s strength in the past month relative to its typical level since 1999. Ratings closer to "0" represent an
indicator that is weaker than average, while ratings closer to "10" represent an indicator that is stronger than average.
The matrix consists of four quadrants based on readings for each vertical’s recent momentum and historical strength. If a vertical falls in the top-left
quadrant, its momentum reading is higher than average, but positive movement has slowed (and perhaps reversed) in recent months — suggesting
that investment levels may fall over the next 1-2 quarters. Verticals in the bottom-right quadrant, however, have momentum readings that are below
average, but recent movement shows promise — suggesting that investment levels may rise over the next 1-2 quarters.
Q3 2017 Equipment Leasing & Finance U.S. Economic Outlook
July 2017
3
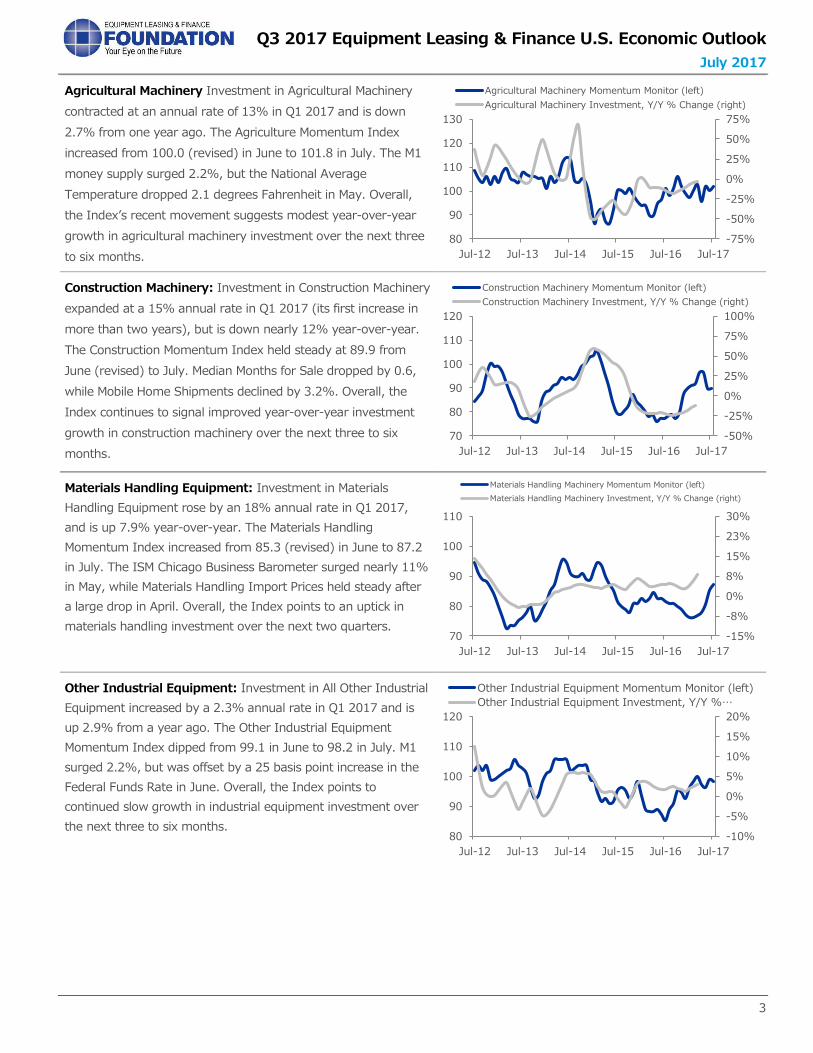
Agricultural Machinery Investment in Agricultural Machinery
contracted at an annual rate of 13% in Q1 2017 and is down
2.7% from one year ago. The Agriculture Momentum Index
increased from 100.0 (revised) in June to 101.8 in July. The M1
money supply surged 2.2%, but the National Average
Temperature dropped 2.1 degrees Fahrenheit in May. Overall,
the Index’s recent movement suggests modest year-over-year
growth in agricultural machinery investment over the next three
to six months.
Construction Machinery: Investment in Construction Machinery
expanded at a 15% annual rate in Q1 2017 (its first increase in
more than two years), but is down nearly 12% year-over-year.
The Construction Momentum Index held steady at 89.9 from
June (revised) to July. Median Months for Sale dropped by 0.6,
while Mobile Home Shipments declined by 3.2%. Overall, the
Index continues to signal improved year-over-year investment
growth in construction machinery over the next three to six
months.
Materials Handling Equipment: Investment in Materials
Handling Equipment rose by an 18% annual rate in Q1 2017,
and is up 7.9% year-over-year. The Materials Handling
Momentum Index increased from 85.3 (revised) in June to 87.2
in July. The ISM Chicago Business Barometer surged nearly 11%
in May, while Materials Handling Import Prices held steady after
a large drop in April. Overall, the Index points to an uptick in
materials handling investment over the next two quarters.
Other Industrial Equipment: Investment in All Other Industrial
Equipment increased by a 2.3% annual rate in Q1 2017 and is
up 2.9% from a year ago. The Other Industrial Equipment
Momentum Index dipped from 99.1 in June to 98.2 in July. M1
surged 2.2%, but was offset by a 25 basis point increase in the
Federal Funds Rate in June. Overall, the Index points to
continued slow growth in industrial equipment investment over
the next three to six months.
-75%
-50%
-25%
0%
25%
50%
75%
80
90
100
110
120
130
Jul-12 Jul-13 Jul-14 Jul-15 Jul-16 Jul-17
Agricultural Machinery Momentum Monitor (left)
Agricultural Machinery Investment, Y/Y % Change (right)
-50%
-25%
0%
25%
50%
75%
100%
70
80
90
100
110
120
Jul-12 Jul-13 Jul-14 Jul-15 Jul-16 Jul-17
Construction Machinery Momentum Monitor (left)
Construction Machinery Investment, Y/Y % Change (right)
-15%
-8%
0%
8%
15%
23%
30%
70
80
90
100
110
Jul-12 Jul-13 Jul-14 Jul-15 Jul-16 Jul-17
Materials Handling Machinery Momentum Monitor (left)
Materials Handling Machinery Investment, Y/Y % Change (right)
-10%
-5%
0%
5%
10%
15%
20%
80
90
100
110
120
Jul-12 Jul-13 Jul-14 Jul-15 Jul-16 Jul-17
Other Industrial Equipment Momentum Monitor (left)
Other Industrial Equipment Investment, Y/Y %…
Q3 2017 Equipment Leasing & Finance U.S. Economic Outlook
July 2017
4
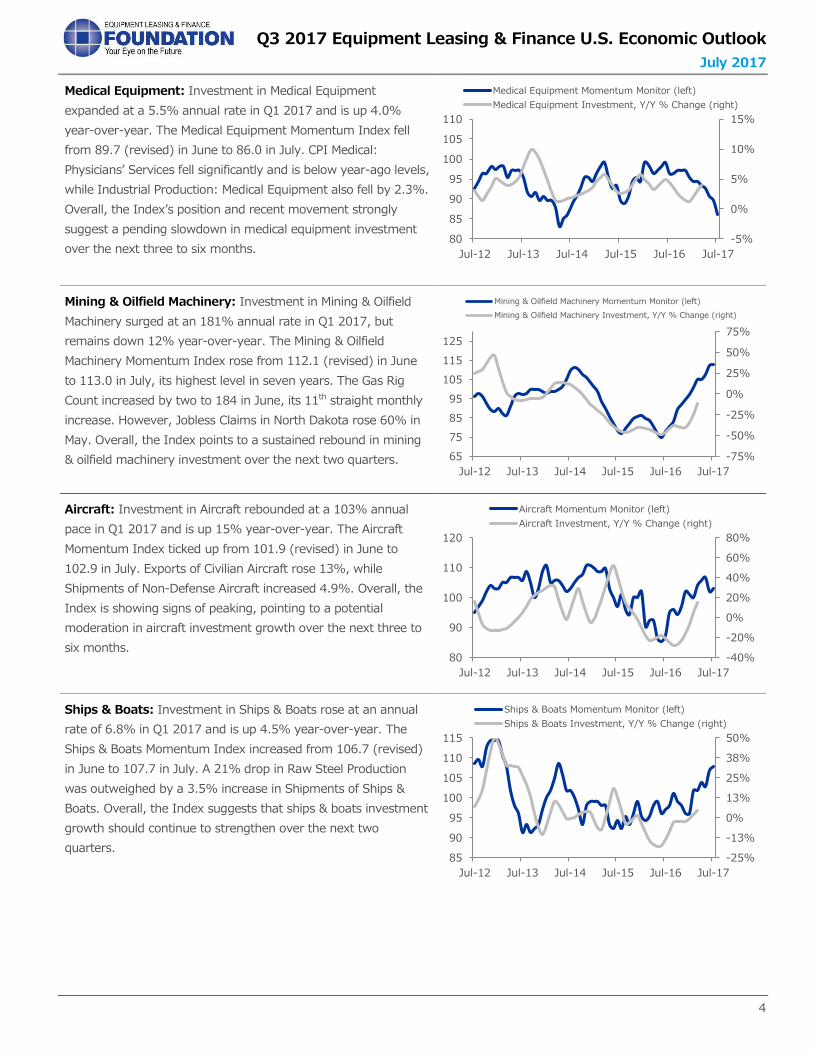
Medical Equipment: Investment in Medical Equipment
expanded at a 5.5% annual rate in Q1 2017 and is up 4.0%
year-over-year. The Medical Equipment Momentum Index fell
from 89.7 (revised) in June to 86.0 in July. CPI Medical:
Physicians’ Services fell significantly and is below year-ago levels,
while Industrial Production: Medical Equipment also fell by 2.3%.
Overall, the Index’s position and recent movement strongly
suggest a pending slowdown in medical equipment investment
over the next three to six months.
Mining & Oilfield Machinery: Investment in Mining & Oilfield
Machinery surged at an 181% annual rate in Q1 2017, but
remains down 12% year-over-year. The Mining & Oilfield
Machinery Momentum Index rose from 112.1 (revised) in June
to 113.0 in July, its highest level in seven years. The Gas Rig
Count increased by two to 184 in June, its 11th straight monthly
increase. However, Jobless Claims in North Dakota rose 60% in
May. Overall, the Index points to a sustained rebound in mining
& oilfield machinery investment over the next two quarters.
Aircraft: Investment in Aircraft rebounded at a 103% annual
pace in Q1 2017 and is up 15% year-over-year. The Aircraft
Momentum Index ticked up from 101.9 (revised) in June to
102.9 in July. Exports of Civilian Aircraft rose 13%, while
Shipments of Non-Defense Aircraft increased 4.9%. Overall, the
Index is showing signs of peaking, pointing to a potential
moderation in aircraft investment growth over the next three to
six months.
Ships & Boats: Investment in Ships & Boats rose at an annual
rate of 6.8% in Q1 2017 and is up 4.5% year-over-year. The
Ships & Boats Momentum Index increased from 106.7 (revised)
in June to 107.7 in July. A 21% drop in Raw Steel Production
was outweighed by a 3.5% increase in Shipments of Ships &
Boats. Overall, the Index suggests that ships & boats investment
growth should continue to strengthen over the next two
quarters.
-5%
0%
5%
10%
15%
80
85
90
95
100
105
110
Jul-12 Jul-13 Jul-14 Jul-15 Jul-16 Jul-17
Medical Equipment Momentum Monitor (left)
Medical Equipment Investment, Y/Y % Change (right)
-75%
-50%
-25%
0%
25%
50%
75%
65
75
85
95
105
115
125
Jul-12 Jul-13 Jul-14 Jul-15 Jul-16 Jul-17
Mining & Oilfield Machinery Momentum Monitor (left)
Mining & Oilfield Machinery Investment, Y/Y % Change (right)
-40%
-20%
0%
20%
40%
60%
80%
80
90
100
110
120
Jul-12 Jul-13 Jul-14 Jul-15 Jul-16 Jul-17
Aircraft Momentum Monitor (left)
Aircraft Investment, Y/Y % Change (right)
-25%
-13%
0%
13%
25%
38%
50%
85
90
95
100
105
110
115
Jul-12 Jul-13 Jul-14 Jul-15 Jul-16 Jul-17
Ships & Boats Momentum Monitor (left)
Ships & Boats Investment, Y/Y % Change (right)
Q3 2017 Equipment Leasing & Finance U.S. Economic Outlook
July 2017
5
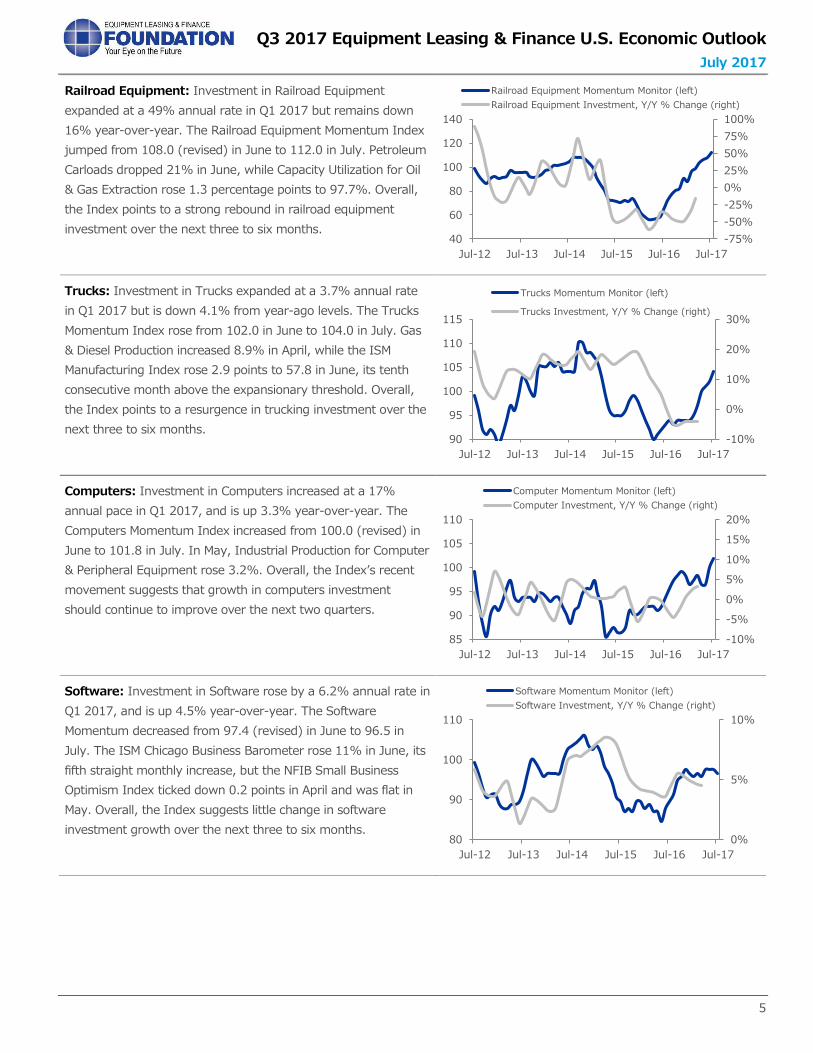
Railroad Equipment: Investment in Railroad Equipment
expanded at a 49% annual rate in Q1 2017 but remains down
16% year-over-year. The Railroad Equipment Momentum Index
jumped from 108.0 (revised) in June to 112.0 in July. Petroleum
Carloads dropped 21% in June, while Capacity Utilization for Oil
& Gas Extraction rose 1.3 percentage points to 97.7%. Overall,
the Index points to a strong rebound in railroad equipment
investment over the next three to six months.
Trucks: Investment in Trucks expanded at a 3.7% annual rate
in Q1 2017 but is down 4.1% from year-ago levels. The Trucks
Momentum Index rose from 102.0 in June to 104.0 in July. Gas
& Diesel Production increased 8.9% in April, while the ISM
Manufacturing Index rose 2.9 points to 57.8 in June, its tenth
consecutive month above the expansionary threshold. Overall,
the Index points to a resurgence in trucking investment over the
next three to six months.
Computers: Investment in Computers increased at a 17%
annual pace in Q1 2017, and is up 3.3% year-over-year. The
Computers Momentum Index increased from 100.0 (revised) in
June to 101.8 in July. In May, Industrial Production for Computer
& Peripheral Equipment rose 3.2%. Overall, the Index’s recent
movement suggests that growth in computers investment
should continue to improve over the next two quarters.
Software: Investment in Software rose by a 6.2% annual rate in
Q1 2017, and is up 4.5% year-over-year. The Software
Momentum decreased from 97.4 (revised) in June to 96.5 in
July. The ISM Chicago Business Barometer rose 11% in June, its
fifth straight monthly increase, but the NFIB Small Business
Optimism Index ticked down 0.2 points in April and was flat in
May. Overall, the Index suggests little change in software
investment growth over the next three to six months.
-75%
-50%
-25%
0%
25%
50%
75%
100%
40
60
80
100
120
140
Jul-12 Jul-13 Jul-14 Jul-15 Jul-16 Jul-17
Railroad Equipment Momentum Monitor (left)
Railroad Equipment Investment, Y/Y % Change (right)
-10%
0%
10%
20%
30%
90
95
100
105
110
115
Jul-12 Jul-13 Jul-14 Jul-15 Jul-16 Jul-17
Trucks Momentum Monitor (left)
Trucks Investment, Y/Y % Change (right)
-10%
-5%
0%
5%
10%
15%
20%
85
90
95
100
105
110
Jul-12 Jul-13 Jul-14 Jul-15 Jul-16 Jul-17
Computer Momentum Monitor (left)
Computer Investment, Y/Y % Change (right)
0%
5%
10%
80
90
100
110
Jul-12 Jul-13 Jul-14 Jul-15 Jul-16 Jul-17
Software Momentum Monitor (left)
Software Investment, Y/Y % Change (right)
Q3 2017 Equipment Leasing & Finance U.S. Economic Outlook
July 2017
6
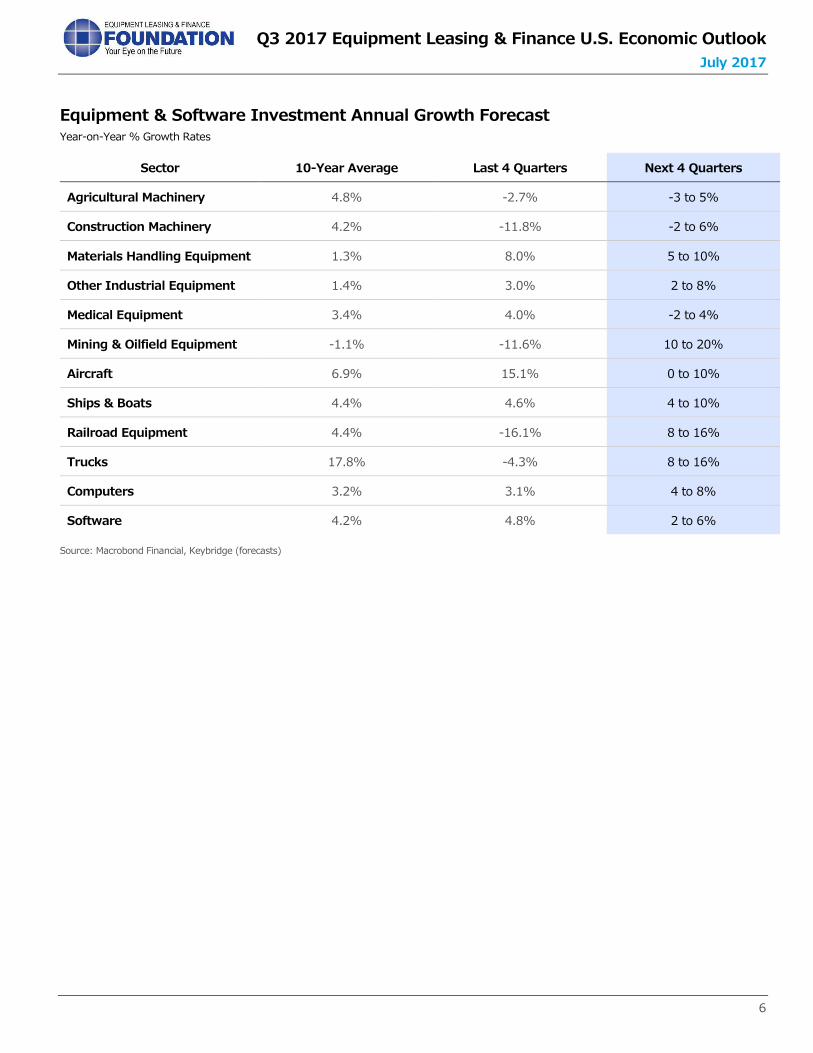
Equipment & Software Investment Annual Growth Forecast Year-on-Year % Growth Rates
Sector 10-Year Average Last 4 Quarters Next 4 Quarters
Agricultural Machinery 4.8% -2.7% -3 to 5%
Construction Machinery 4.2% -11.8% -2 to 6%
Materials Handling Equipment 1.3% 8.0% 5 to 10%
Other Industrial Equipment 1.4% 3.0% 2 to 8%
Medical Equipment 3.4% 4.0% -2 to 4%
Mining & Oilfield Equipment -1.1% -11.6% 10 to 20%
Aircraft 6.9% 15.1% 0 to 10%
Ships & Boats 4.4% 4.6% 4 to 10%
Railroad Equipment 4.4% -16.1% 8 to 16%
Trucks 17.8% -4.3% 8 to 16%
Computers 3.2% 3.1% 4 to 8%
Software 4.2% 4.8% 2 to 6%
Source: Macrobond Financial, Keybridge (forecasts)
Q3 2017 Equipment Leasing & Finance U.S. Economic Outlook
July 2017
7
U.S. CAPITAL INVESTMENT AND CREDIT MARKETS
Recent Trends in U.S. Capital Investment
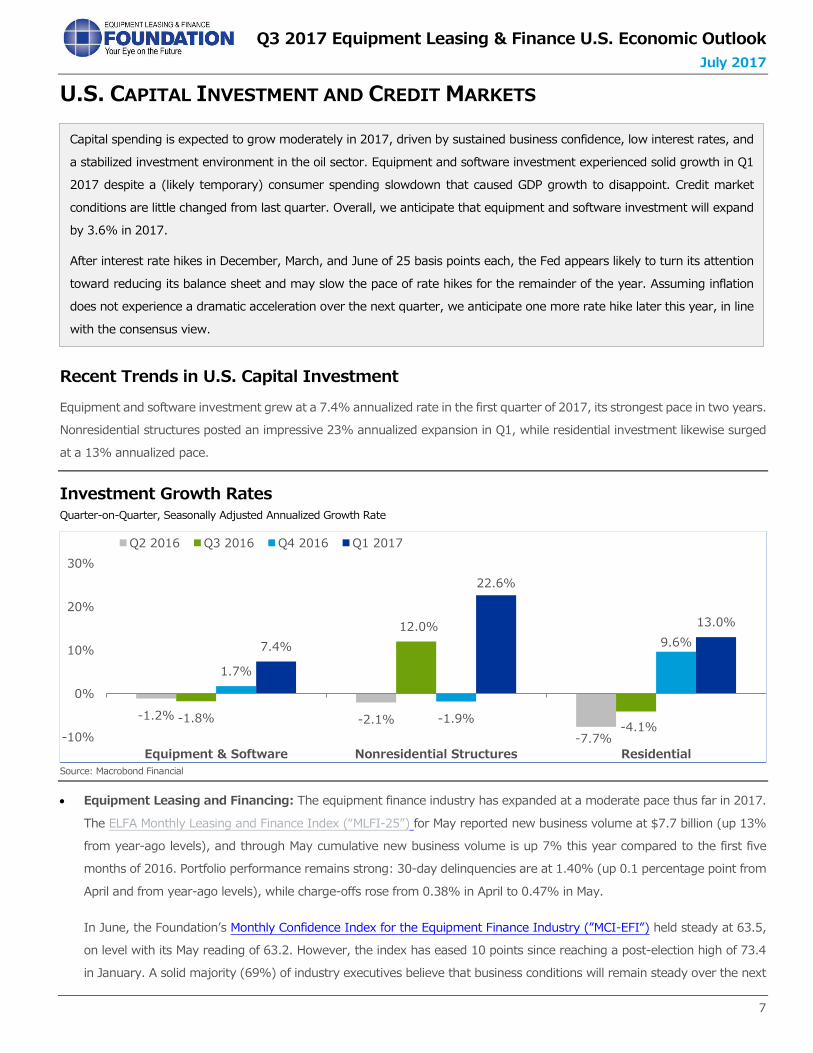
Equipment and software investment grew at a 7.4% annualized rate in the first quarter of 2017, its strongest pace in two years.
Nonresidential structures posted an impressive 23% annualized expansion in Q1, while residential investment likewise surged
at a 13% annualized pace.
Investment Growth Rates Quarter-on-Quarter, Seasonally Adjusted Annualized Growth Rate
Source: Macrobond Financial
• Equipment Leasing and Financing: The equipment finance industry has expanded at a moderate pace thus far in 2017.
The ELFA Monthly Leasing and Finance Index (“MLFI-25”) for May reported new business volume at $7.7 billion (up 13%
from year-ago levels), and through May cumulative new business volume is up 7% this year compared to the first five
months of 2016. Portfolio performance remains strong: 30-day delinquencies are at 1.40% (up 0.1 percentage point from
April and from year-ago levels), while charge-offs rose from 0.38% in April to 0.47% in May.
In June, the Foundation’s Monthly Confidence Index for the Equipment Finance Industry (”MCI-EFI”) held steady at 63.5,
on level with its May reading of 63.2. However, the index has eased 10 points since reaching a post-election high of 73.4
in January. A solid majority (69%) of industry executives believe that business conditions will remain steady over the next
-1.2% -2.1%
-7.7%
-1.8%
12.0%
-4.1%
1.7%
-1.9%
9.6%7.4%
22.6%
13.0%
-10%
0%
10%
20%
30%
Equipment & Software Nonresidential Structures Residential
Q2 2016 Q3 2016 Q4 2016 Q1 2017
Capital spending is expected to grow moderately in 2017, driven by sustained business confidence, low interest rates, and
a stabilized investment environment in the oil sector. Equipment and software investment experienced solid growth in Q1
2017 despite a (likely temporary) consumer spending slowdown that caused GDP growth to disappoint. Credit market
conditions are little changed from last quarter. Overall, we anticipate that equipment and software investment will expand
by 3.6% in 2017.
After interest rate hikes in December, March, and June of 25 basis points each, the Fed appears likely to turn its attention
toward reducing its balance sheet and may slow the pace of rate hikes for the remainder of the year. Assuming inflation
does not experience a dramatic acceleration over the next quarter, we anticipate one more rate hike later this year, in line
with the consensus view.
Q3 2017 Equipment Leasing & Finance U.S. Economic Outlook
July 2017
8
four months, while executives are far more likely to believe that business conditions will improve (31%) rather than worsen
(6.5%). Every industry executive who was surveyed rated current U.S. economic conditions as “fair” (as opposed to
“excellent” or “poor”). Industry confidence remains significantly above its 2016 average of 55.0, which likely reflects
expectations that Congress and the Administration will deliver on favorable tax and regulatory policies, along with a cyclical
upturn and generally improved outlook for capital expenditures.
Looking ahead, we expect that industry performance will improve on last year’s middling outcomes. While the U.S.
economy’s fundamentals are not drastically changed from last year, stabilized oil prices and improved business confidence
have been key drivers in the rebound in business investment during the first quarter. Coupled with underlying credit market
stability, these factors should lead to solid (though likely not spectacular) growth in new business volume in 2017.
• Equipment Verticals: Equipment investment experienced a bright first quarter of 2017. Of the 12 equipment verticals
tracked by the Foundation, 11 posted positive annualized growth (only agricultural machinery investment saw an
annualized decline of 13%). A prolonged energy sector recovery that the Foundation-Keybridge U.S. Equipment & Software
Investment Momentum Monitor began to signal last fall finally manifested in early 2017: Mining & Oilfield Machinery
investment surged 181% (annualized), while Aircraft and Railroad investment expanded 103% and 49% (annualized),
respectively. In the months ahead, we expect the energy sector investment recovery to continue, which will help to drive
positive investment growth in several equipment verticals both directly (e.g., Mining & Oilfield) and indirectly (e.g., Railroad,
Other Industrial, Materials Handling, and Trucks).
• Other Factors: Data on industrial sector health have been generally positive over the past three months, although there
are some signs of moderation. Industrial production increased 1.1% in April to 105.3 but was flat in May, while capacity
utilization dipped to 76.6% in May after a strong increase in April. Although durable goods shipments rose 1.0% in May (a
good omen for Q2 growth prospects), new orders of durable goods fell 0.8% for the second month in a row — potentially
foreshadowing softer industrial sector activity in Q3. The overall mood for the American industrial sector is cautious
optimism, as recent data may represent a blip on an otherwise modest upward trend. The U.S. dollar has weakened
noticeably in 2017, with the Fed’s Broad Dollar FX Index steadily falling from a high of 129 in late December to 121.5 in
early July 2017. All else equal, a weaker dollar should buoy U.S. exports and provide a boost to U.S. manufacturers,
although there are other downside risks with respect to U.S. trade (see “Additional Factors to Watch” section).
Recent Trends in Credit Markets
Credit market conditions have remained relatively unchanged in the first half of 2017. On balance, lending standards held
steady in the first quarter (notwithstanding a modest tightening of standards for commercial real estate loans) and financial
stress remains historically low. Credit demand softened slightly for both
consumers and businesses, and a modest downgrade in expectations
for additional rate increases from the Fed in 2017 suggests that financial
rates of return are unlikely to increase significantly in the months ahead.
• Credit Supply & Pricing: Credit supply conditions mostly held
steady in Q1 2017. According to the April Fed Loan Officer Survey,
banks’ standards on commercial and industrial (“C&I”) and
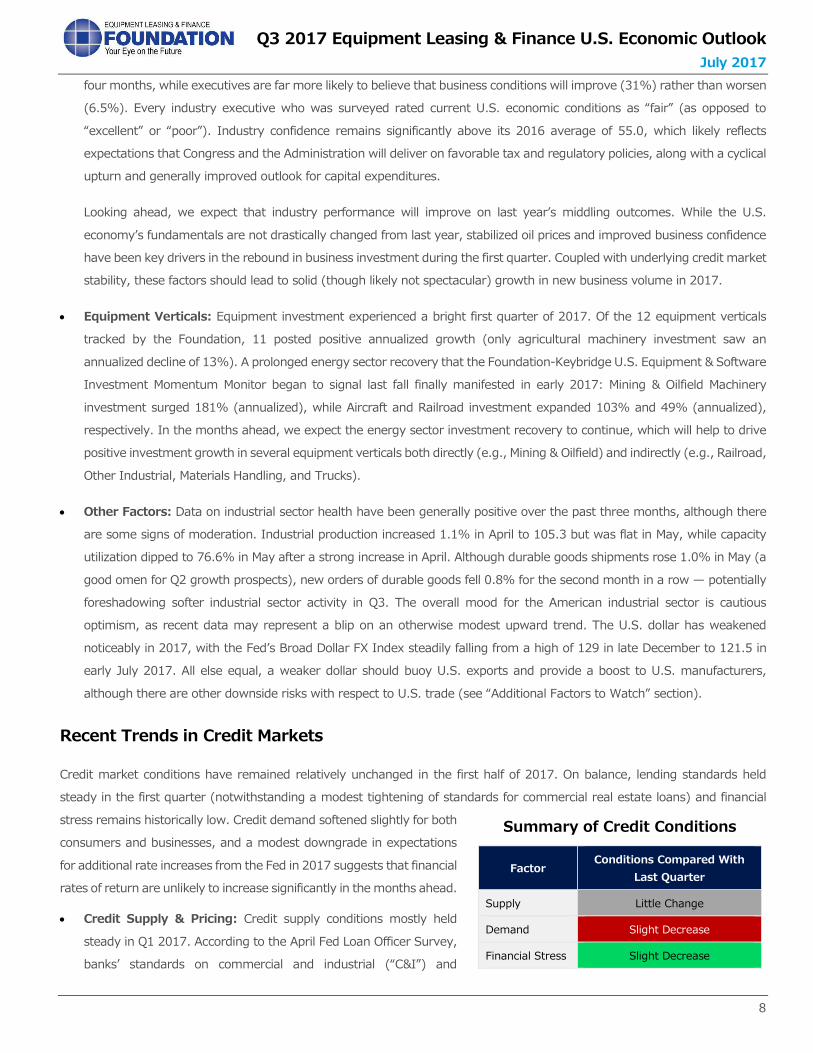
Summary of Credit Conditions
Factor Conditions Compared With
Last Quarter
Supply Little Change
Demand Slight Decrease
Financial Stress Slight Decrease
Q3 2017 Equipment Leasing & Finance U.S. Economic Outlook
July 2017
9
residential real estate loans were unchanged. However, respondents reported a net tightening of standards on commercial
real estate (“CRE”) loans, particularly for construction and land development loans and multifamily loans. Banks cited a
more uncertain outlook for CRE property prices, capitalization rates, and vacancy rates as key factors in restricting credit
supply for CRE loans. With respect to household lending, the picture is mixed: standards for auto loans tightened on net,
credit card lending standards loosened, and all other consumer loan standards were essentially unchanged.
• Credit Demand: Demand for credit weakened modestly across a variety of consumer and business loan categories in the
first quarter. Year-on-year growth in C&I loans continues to decelerate: after achieving an annual growth rate of 11% in
2015, C&I loans are currently just 2% above year-ago levels, in part due to reduced merger and acquisition financing
activity. Demand for CRE loans also fell in Q1.
Despite signs of moderation on the business investment side, business confidence indices have mostly held their gains since
the post-election surge. The National Federation of Independent Business (“NFIB”) Small Business Optimism Index is well
above its historical average and held steady at 104.5 in May, on par with readings from the prior two months and only
slightly weaker than its early 2017 peak. Business Roundtable’s CEO Economic Outlook Index was likewise nearly flat from
Q1 (93.3) to Q2 (93.9) and remains well above its historical average. One notable exception is the Thomson Reuters/PayNet
Small Business Lending Index (“SBLI”), which fell 8% in April and now stands below average levels in 2015 and 2016
(though it remains on the high end of its historical range). It remains to be seen whether elevated business confidence will
translate into increased business demand for credit, or whether lingering policy uncertainty will lead to a more cautious
approach.
Credit demand growth among consumers has also slipped in recent months, but remains healthy. The Conference Board’s
Consumer Confidence Index has declined from a historic high in March (124.9) to 118.9 in June, while the University of
Michigan Consumer Sentiment Index has eased from a high of 98.5 in January to 94.5 in June. This story is consistent with
the April Fed Loan Officer Survey’s reporting of a softening in demand for auto and credit card loans, although both
consumer outlook indices remain near historically high levels.
• Financial Stress: Financial stress has continued to decline throughout 2017. The Kansas City Financial Stress Index fell to
-0.74 in May and stands well below its historical average. Similarly, the St. Louis Financial Stress Index continues to follow
a steady downward trajectory in the second quarter, from -1.352 at the end of March to -1.505 at the end of June. The
loan delinquency rate ticked down in the first quarter from 1.58 percent to 1.54 percent, while the lease delinquency rate
declined from 1.06 percent to 0.99 percent. Overall, indicators of financial stress yield little cause for alarm.
• Other Factors: Ten-year Treasury yields eased in the second quarter, from around 2.4 percent at the end of March to a
low of 2.14 percent at the end of June, but have since risen to 2.35 percent in early July. The recent increase may reflect
a delayed response to the Fed’s mid-June decision to raise its benchmark rate, but may also have been spurred by elevated
economic sentiment in Europe (currently at a ten-year high) and signals from the European Central Bank that it may begin
to wind down its monetary stimulus efforts.
Update on Fed Policy
At its June meeting, the Federal Reserve raised its short-term benchmark interest rate by 25 basis points to between 1.00 and
1.25 percent, a signal of confidence in the broader U.S. economy as unemployment remains low. Despite this vote of confidence,
we anticipate just one more rate hike this year, a downgrade from last Outlook’s forecast. Three factors are responsible for this
Q3 2017 Equipment Leasing & Finance U.S. Economic Outlook
July 2017
10
expectations shift. First, the Fed’s plan to shrink its balance sheet later this year is likely to have the same directional effect on
the money supply as an interest rate hike. Second, GDP growth expectations for the U.S. economy have moderated, particularly
after the economy grew at an annualized pace of just 1.4% in the first quarter, and while the economy remains generally
healthy, it shows few signs of overheating. Third, inflationary pressures are subdued, eliminating some of the urgency to raise
rates.
Q3 2017 Equipment Leasing & Finance U.S. Economic Outlook
July 2017
11
OVERVIEW OF THE U.S. ECONOMY
Recent Trends in the U.S. Economy
The second half of 2017 is likely to yield an improvement on first quarter growth due to a consumer spending rebound and
positive business investment. Residential investment may soften slightly as the supply of housing struggles to keep up with
historically strong demand. The manufacturing sector
should benefit from the recent depreciation of the
U.S. dollar (which makes U.S. products more
competitive overseas), but there are significant
downside risks related to trade policy uncertainty
toward Mexico, Canada, China, and several European
trade partners. We expect no major contribution to
growth from government spending, as infrastructure
spending plans fade from the 2017 horizon; in fact,
net budget cuts on both the federal and sub-federal
levels may well detract modestly from GDP growth.
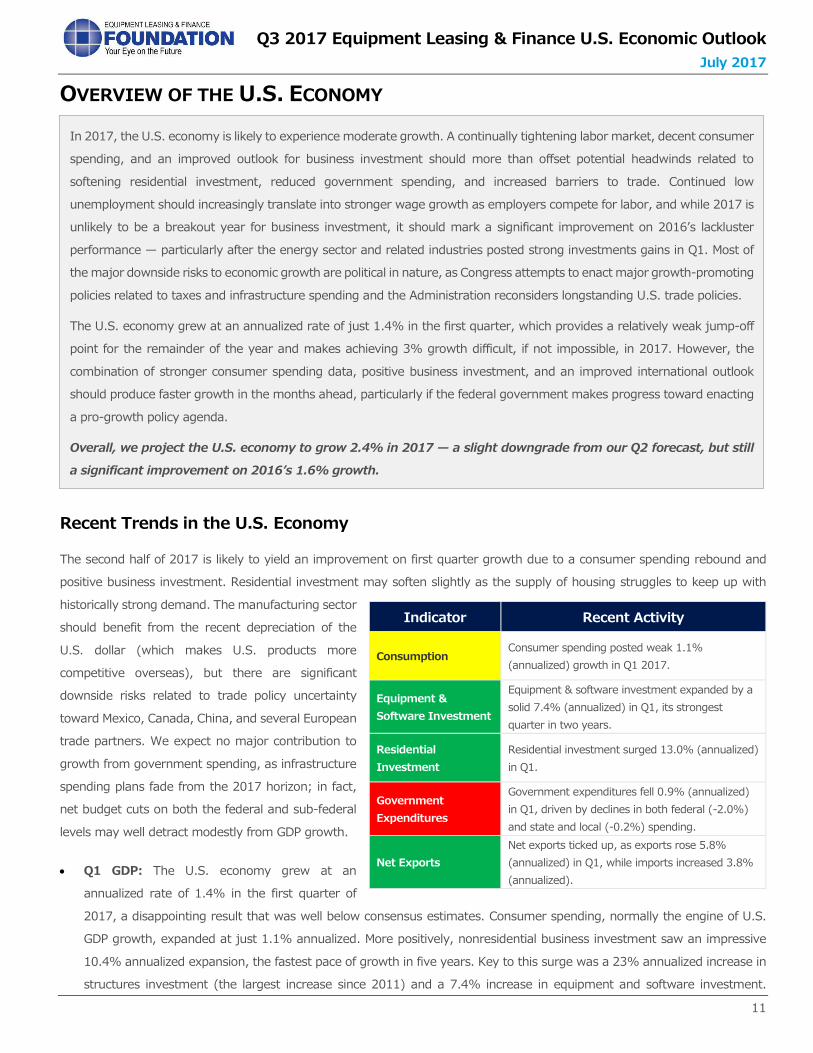
• Q1 GDP: The U.S. economy grew at an
annualized rate of 1.4% in the first quarter of
2017, a disappointing result that was well below consensus estimates. Consumer spending, normally the engine of U.S.
GDP growth, expanded at just 1.1% annualized. More positively, nonresidential business investment saw an impressive
10.4% annualized expansion, the fastest pace of growth in five years. Key to this surge was a 23% annualized increase in
structures investment (the largest increase since 2011) and a 7.4% increase in equipment and software investment.
Indicator Recent Activity
Consumption Consumer spending posted weak 1.1%
(annualized) growth in Q1 2017.
Equipment &
Software Investment
Equipment & software investment expanded by a
solid 7.4% (annualized) in Q1, its strongest
quarter in two years.
Residential
Investment
Residential investment surged 13.0% (annualized)
in Q1.
Government
Expenditures
Government expenditures fell 0.9% (annualized)
in Q1, driven by declines in both federal (-2.0%)
and state and local (-0.2%) spending.
Net Exports
Net exports ticked up, as exports rose 5.8%
(annualized) in Q1, while imports increased 3.8%
(annualized).
In 2017, the U.S. economy is likely to experience moderate growth. A continually tightening labor market, decent consumer
spending, and an improved outlook for business investment should more than offset potential headwinds related to
softening residential investment, reduced government spending, and increased barriers to trade. Continued low
unemployment should increasingly translate into stronger wage growth as employers compete for labor, and while 2017 is
unlikely to be a breakout year for business investment, it should mark a significant improvement on 2016’s lackluster
performance — particularly after the energy sector and related industries posted strong investments gains in Q1. Most of
the major downside risks to economic growth are political in nature, as Congress attempts to enact major growth-promoting
policies related to taxes and infrastructure spending and the Administration reconsiders longstanding U.S. trade policies.
The U.S. economy grew at an annualized rate of just 1.4% in the first quarter, which provides a relatively weak jump-off
point for the remainder of the year and makes achieving 3% growth difficult, if not impossible, in 2017. However, the
combination of stronger consumer spending data, positive business investment, and an improved international outlook
should produce faster growth in the months ahead, particularly if the federal government makes progress toward enacting
a pro-growth policy agenda.
Overall, we project the U.S. economy to grow 2.4% in 2017 — a slight downgrade from our Q2 forecast, but still
a significant improvement on 2016’s 1.6% growth.
Q3 2017 Equipment Leasing & Finance U.S. Economic Outlook
July 2017
12
Residential investment also posted a strong 13% annualized gain. Government spending contracted by 0.9% (largely due
to a 3.9% reduction in national defense spending), while net exports lifted GDP growth modestly.
• Inflation: Despite signs of accelerating inflation just a few months ago, inflationary pressures have moderated significantly.
Headline inflation, which had been mounting steadily due to rising oil prices, reached a peak of 2.8% in February but has
since fallen to 1.9% in May. Core inflation (which excludes volatile food and energy prices) has dipped from 2.3% in January
to 1.7% in May. A key driver of decreased inflation has been oil prices, which have fallen by roughly $10 / barrel in recent
months. Another driver is stubborn year-over-year wage growth, which has slowed to 2.5% after nearing 3% at the end
of 2016. We expect inflation to rise to around 2% or slightly higher in the second half of 2017, assuming oil prices hold at
their current level and the labor market remains strong.
• Growth Forecasts: The Economist Poll of Forecasters for June estimated 2.2% GDP growth for 2017, unchanged relative
to its May forecast. Similarly, the Federal Reserve’s June “central tendency” forecast ranged from 2.1–2.2%.
Economic Tailwinds
A strengthening global economy should help propel U.S. economic growth for the rest of the year, as a steady weakening of
the dollar allows U.S. exporters to take advantage of the increase in global demand. Businesses and consumers alike remain
upbeat.
• Sustained Business and Consumer Confidence: For the most part, measures of confidence on both the business and
consumer side have maintained their strong post-election gains, despite slowing wage growth and fading prospects for
major tax reform or infrastructure spending packages in 2017. The NFIB Small Business Optimism Index, which surged 11
points from its October (pre-election) reading to its peak in January, has since dipped only slightly, while Business
Roundtable’s CEO Economic Outlook Index experienced a similarly strong increase of 24 points between Q3 2016 and Q2
2017. These measures, which reflect expectations of a more business-friendly regulatory environment, are consistent with
higher market confidence in corporate profitability as well as the stock market’s recent performance. Meanwhile, both the
Conference Board’s Consumer Confidence Index and University of Michigan Consumer Sentiment Index have moderated
only slightly since their strong post-election surge. These record-high confidence levels appear unlikely to translate into
breakout growth in 2017, but they do indicate an underlying sense of financial security among both consumers and
businesses and provide a clear positive signal of overall economic health.
• Dollar Depreciation: The U.S. dollar strengthened considerably after the November election as measured by the Fed’s
major currencies index, but has since fallen back to pre-election levels. The dollar’s steady depreciation likely stems from
the combination of a downgrade in expectations for Fed rate hikes in 2017, fading prospects for tax reform and fiscal
stimulus, and reduced short-term political uncertainty in Europe. These effects are likely to continue exerting downward
pressure on the dollar throughout 2017, which benefits American manufacturers and promotes U.S. exports. Over the past
two years, a persistently strong U.S. dollar weighed down exports considerably, so a moderate depreciation of the dollar
should help buoy U.S. export growth — particularly when combined with strengthening global demand (see next bullet).
• Uptick in Global Growth: Early forecasts for global economic growth in 2017 reflected increased optimism about the world
economy, and those predictions appear to be panning out thus far. In its latest World Economic Outlook report released in
April, the International Monetary Fund (IMF) forecast global GDP growth at 3.5%, a slight upgrade from January’s 3.4%
estimate and significantly faster than the 3.1% global growth achieved in 2016. The upward revision stems from evidence
Q3 2017 Equipment Leasing & Finance U.S. Economic Outlook
July 2017
13
of a cyclical recovery in global manufacturing and trade that began in late 2016, with advanced economies (including the
United States) driving this trend. Likewise, the June report from the Organization for Economic Cooperation and
Development (OECD) projects that worldwide growth will reach 3.5%, up from its 3.3% forecast in November 2016. While
most developed economies are expected to experience faster growth in 2017, the story for emerging markets is mixed,
with India’s economy set to accelerate while China’s economy continues to moderate. Improved prospects for global
economic growth should provide a boost to the U.S. economy, primarily via increased demand for U.S. exports.
Economic Headwinds
Though 2017 is shaping up to be a better year for U.S. growth than 2016, continued political gridlock makes it increasingly
unlikely that Congress will agree on major pro-growth legislation, such as tax cuts or infrastructure spending. Meanwhile, low
unemployment exposes other weaknesses in the U.S. labor market.
• Diminished Prospects for Corporate Tax Reform: In late 2016 and early 2017, many political observers were optimistic
about the prospects of corporate tax reform in the wake of the Republican electoral sweep. However, in recent weeks it
has become increasingly apparent that internal divisions within the party regarding both the specific nature of reform and
the extent to which it should be deficit-neutral are more significant barriers than many believed they would be at the start
of the year. Congress’s struggle (at least thus far) to repeal and replace the Affordable Care Act (“ACA”) has pushed back
the timeline for tackling tax reform, and the House and Senate still need to agree on a budget for the 2018 fiscal year to
create the opportunity to pass tax reform under the Senate’s reconciliation process (which allows for a simple majority
vote). While the idea of lowering the U.S. corporate tax rate appears to be a clear area of agreement among all Republicans
(and some Democrats), in practice tax reform involves complex changes to the tax code that would affect various
constituent interest groups both positively and negatively — and these groups will fight to retain favorable tax provisions.
This is a key reason why successful comprehensive tax reform effort has not occurred in more than 30 years and took
three years to complete in a less politically charged environment. These obstacles do not preclude the possibility of
Congress passing a short-term tax cut, but it will be difficult to devise such a cut that avoids adding to the deficit, which
fiscal hawks oppose on principle. Moreover, Congressional leadership must navigate other issues that could take time and
draw attention away from tax reform, including legislation to fund the government after September 30th and increase the
federal debt ceiling (see “Additional Factors to Watch”). Overall, it appears unlikely that major tax reform legislation will
be signed into law before the end of the year — which means that the U.S. economy probably won’t receive a tax cut-
fueled boost in investment spending in 2017.
• Infrastructure Delays: Prospects for a comprehensive infrastructure package this calendar year have also dimmed — a
critical piece of the growth puzzle at a time when the United States is facing an infrastructure investment gap of
approximately $2 trillion over the next decade, according to the American Society of Civil Engineers. The Administration’s
$1 trillion infrastructure plan laid out a vision for addressing this gap with $200 billion in additional federal spending over
the next 10 years, complemented by an $800 billion bump in private sector and state and local infrastructure investment
over the same period. However, the President’s plan contained few details regarding potential sources of additional funding,
financing mechanisms, or spending priorities, and Congress has announced that it is in a holding pattern while it waits for
more specifics from the Administration. While a more detailed infrastructure plan is expected from the Department of
Transportation sometime this fall, many political observers do not expect any major movement on an infrastructure
spending package until 2018, and the economy is unlikely to receive a significant infrastructure-related boost this year.
Q3 2017 Equipment Leasing & Finance U.S. Economic Outlook
July 2017
14
• Declining Labor Force Participation: As the unemployment continues to fall and draws closer to 4%, there is a debate
regarding how tight the labor market really is. Traditionally, an unemployment rate near 4% is associated with full
employment and sends a strong signal to employers to increase wages to compete for talent. However, wage growth has
stalled out after peaking at 2.9% in December, leading some economists to wonder whether labor markets are perhaps
not as tight as they appear considering the declining labor force participation rate (which has fallen from 66.4% in 2007 to
62.7% today). Earlier accounts of this decline, which equates to millions of working-age men and women leaving the
workforce, focused on the growth in so-called “discouraged” workers who temporarily abandoned their job search after
prolonged unemployment. However, current data indicate that there are fewer discouraged workers now than there were
10 years ago, suggesting that other factors are responsible for the decline. Indeed, a variety of demographic and sociological
factors are likely at play, including the effects of an aging population, higher levels of disability, rising opioid addiction rates,
declining health outcomes, a chronic “skills gap,” and a mismatching of available labor by geography. The combination of
these factors has led to serious labor shortages in some industries (e.g., agriculture and construction) in certain parts of
the country, meaning that the U.S. economy is leaving a significant amount of growth on the table. The multifaceted nature
of the decline in labor force participation suggests that this trend is likely to continue and demands a series of targeted
policy responses that address as many of the underlying causes as possible.
Additional Factors to Watch
In addition to the tailwinds and headwinds described above, there are several areas of uncertainty will likely affect U.S. growth
during the second half of the year, including:
• Trade Policy: While there are reasons to be optimistic about global trade growth and U.S. exports (e.g., stronger global
economy, weaker dollar), there are also several notable downside risks that could deter trade. For example, ongoing
uncertainty regarding U.S. trade policy toward key trading partners is a real concern, and Mexican companies have taken
steps to reduce their reliance on U.S. products and diversify their inputs in response to the United States seeking to
renegotiate the North American Free Trade Agreement. It is possible that a new agreement will produce more benefits for
the U.S. economy depending on the success of the negotiations (though this is by no means guaranteed), but until an
agreement is reached, trade between the United States and Mexico may decrease. Similarly, the Administration’s recent
actions to limit U.S. imports of steel on national security grounds may benefit domestic steel manufacturers, but may also
threaten American manufacturers that rely on low-cost steel imports as inputs for finished goods. Perhaps more
importantly, these actions are also likely to trigger retaliatory measures by China — which could escalate into a trade war.
As the Trump Administration pursues its “America First” trade agenda, it will be important to monitor the response from
our trading partners.
• Imminent Budget Battles: Persistent gridlock in Washington heightens the risk of political brinksmanship on a debt ceiling
showdown late this summer and/or a government shutdown in October. Although Administration officials have pressed
Congress to raise the debt ceiling before the August recess, House and Senate leaders have thus far focused much of their
attention on moving legislation related to healthcare reform and other issues (e.g., financial markets reform and flood
insurance reform). This could result in the debt ceiling issue being sidelined until the last minute, when the stakes are
higher. As in previous Congresses, fiscal hawks are likely to use the debt ceiling as a vehicle to demand reductions in federal
spending, which will elicit strong pushback from other members (particularly Democrats). At the same time, Congressional
appropriators have fallen behind in drafting legislation to keep the government funded in FY18, and there is internal
Q3 2017 Equipment Leasing & Finance U.S. Economic Outlook
July 2017
15
disagreement among Republicans regarding how much government spending should be cut (particularly defense spending,
which many Republicans want to increase). Unless Republican leadership can bridge the divide within their own party on
these issues, they may need to seek out Democratic support to pass a funding bill — which Democrats would likely provide
only if spending limits were increased for non-defense programs as well.
Failure to pass legislation that funds the government would curtail Q4 growth and reduce the likelihood that the economy
will reach 3% growth next year, while failure to raise the debt ceiling would significantly harm the U.S. credit rating and
lead to severe negative economic consequences according to most economists. Even if these threats are successfully
navigated, the coming fight over federal spending will increase political uncertainty and may curb business investment
and/or cause market turmoil until an agreement is reached.
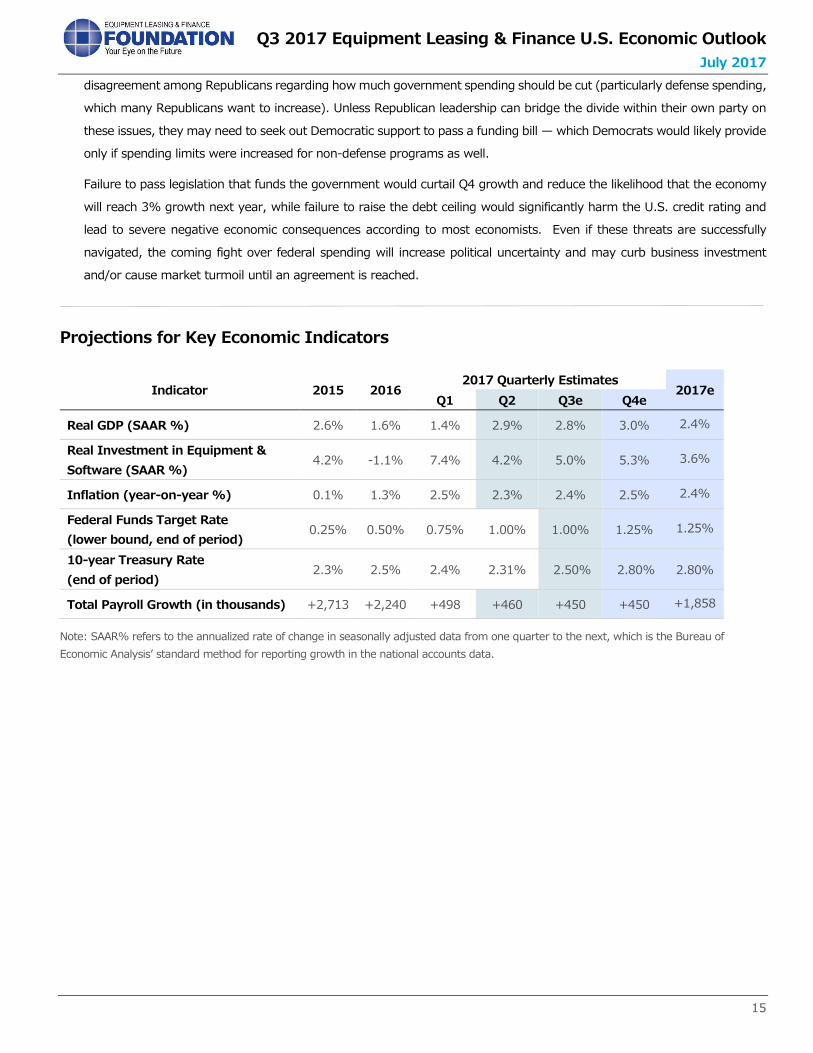
Projections for Key Economic Indicators
Indicator 2015 2016 2017 Quarterly Estimates
2017e Q1 Q2 Q3e Q4e
Real GDP (SAAR %) 2.6% 1.6% 1.4% 2.9% 2.8% 3.0% 2.4%
Real Investment in Equipment &
Software (SAAR %) 4.2% -1.1% 7.4% 4.2% 5.0% 5.3% 3.6%
Inflation (year-on-year %) 0.1% 1.3% 2.5% 2.3% 2.4% 2.5% 2.4%
Federal Funds Target Rate
(lower bound, end of period) 0.25% 0.50% 0.75% 1.00% 1.00% 1.25% 1.25%
10-year Treasury Rate
(end of period) 2.3% 2.5% 2.4% 2.31% 2.50% 2.80% 2.80%
Total Payroll Growth (in thousands) +2,713 +2,240 +498 +460 +450 +450 +1,858
Note: SAAR% refers to the annualized rate of change in seasonally adjusted data from one quarter to the next, which is the Bureau of
Economic Analysis’ standard method for reporting growth in the national accounts data.
Q3 2017 Equipment Leasing & Finance U.S. Economic Outlook
July 2017
16
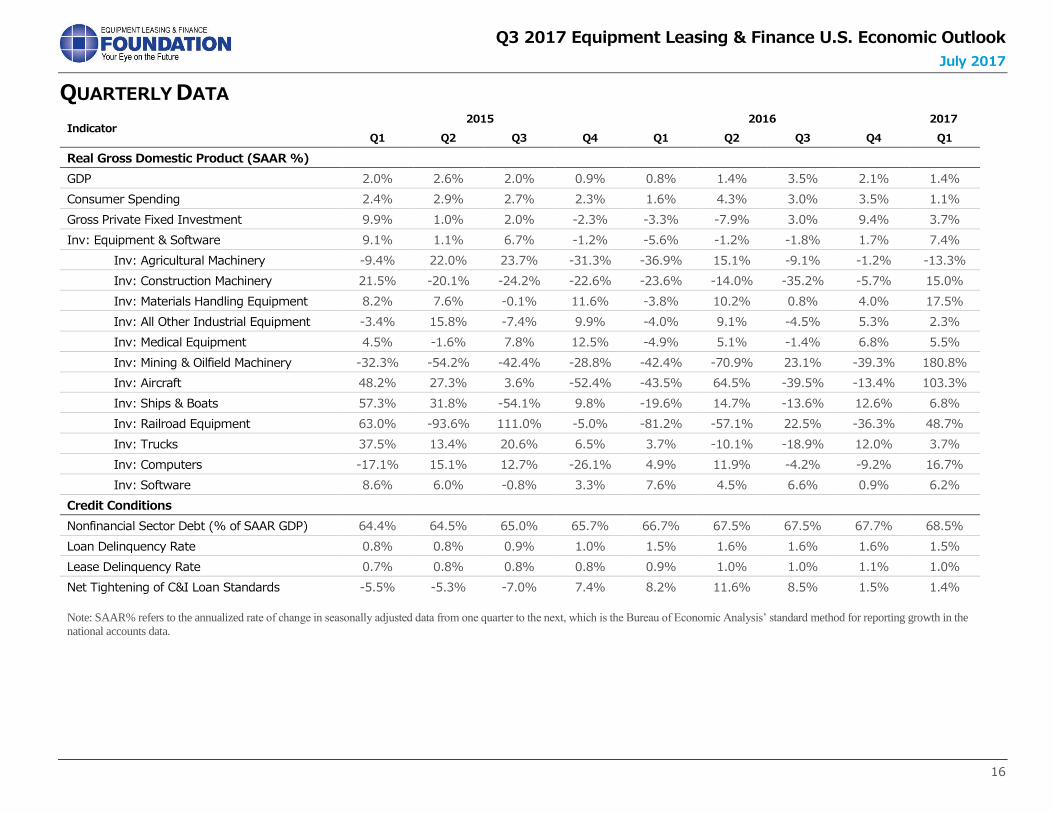
QUARTERLY DATA
Indicator 2015 2016 2017
Q1 Q2 Q3 Q4 Q1 Q2 Q3 Q4 Q1
Real Gross Domestic Product (SAAR %)
GDP 2.0% 2.6% 2.0% 0.9% 0.8% 1.4% 3.5% 2.1% 1.4%
Consumer Spending 2.4% 2.9% 2.7% 2.3% 1.6% 4.3% 3.0% 3.5% 1.1%
Gross Private Fixed Investment 9.9% 1.0% 2.0% -2.3% -3.3% -7.9% 3.0% 9.4% 3.7%
Inv: Equipment & Software 9.1% 1.1% 6.7% -1.2% -5.6% -1.2% -1.8% 1.7% 7.4%
Inv: Agricultural Machinery -9.4% 22.0% 23.7% -31.3% -36.9% 15.1% -9.1% -1.2% -13.3%
Inv: Construction Machinery 21.5% -20.1% -24.2% -22.6% -23.6% -14.0% -35.2% -5.7% 15.0%
Inv: Materials Handling Equipment 8.2% 7.6% -0.1% 11.6% -3.8% 10.2% 0.8% 4.0% 17.5%
Inv: All Other Industrial Equipment -3.4% 15.8% -7.4% 9.9% -4.0% 9.1% -4.5% 5.3% 2.3%
Inv: Medical Equipment 4.5% -1.6% 7.8% 12.5% -4.9% 5.1% -1.4% 6.8% 5.5%
Inv: Mining & Oilfield Machinery -32.3% -54.2% -42.4% -28.8% -42.4% -70.9% 23.1% -39.3% 180.8%
Inv: Aircraft 48.2% 27.3% 3.6% -52.4% -43.5% 64.5% -39.5% -13.4% 103.3%
Inv: Ships & Boats 57.3% 31.8% -54.1% 9.8% -19.6% 14.7% -13.6% 12.6% 6.8%
Inv: Railroad Equipment 63.0% -93.6% 111.0% -5.0% -81.2% -57.1% 22.5% -36.3% 48.7%
Inv: Trucks 37.5% 13.4% 20.6% 6.5% 3.7% -10.1% -18.9% 12.0% 3.7%
Inv: Computers -17.1% 15.1% 12.7% -26.1% 4.9% 11.9% -4.2% -9.2% 16.7%
Inv: Software 8.6% 6.0% -0.8% 3.3% 7.6% 4.5% 6.6% 0.9% 6.2%
Credit Conditions
Nonfinancial Sector Debt (% of SAAR GDP) 64.4% 64.5% 65.0% 65.7% 66.7% 67.5% 67.5% 67.7% 68.5%
Loan Delinquency Rate 0.8% 0.8% 0.9% 1.0% 1.5% 1.6% 1.6% 1.6% 1.5%
Lease Delinquency Rate 0.7% 0.8% 0.8% 0.8% 0.9% 1.0% 1.0% 1.1% 1.0%
Net Tightening of C&I Loan Standards -5.5% -5.3% -7.0% 7.4% 8.2% 11.6% 8.5% 1.5% 1.4%
Note: SAAR% refers to the annualized rate of change in seasonally adjusted data from one quarter to the next, which is the Bureau of Economic Analysis’ standard method for reporting growth in the
national accounts data.
Q3 2017 Equipment Leasing & Finance U.S. Economic Outlook
July 2017
17
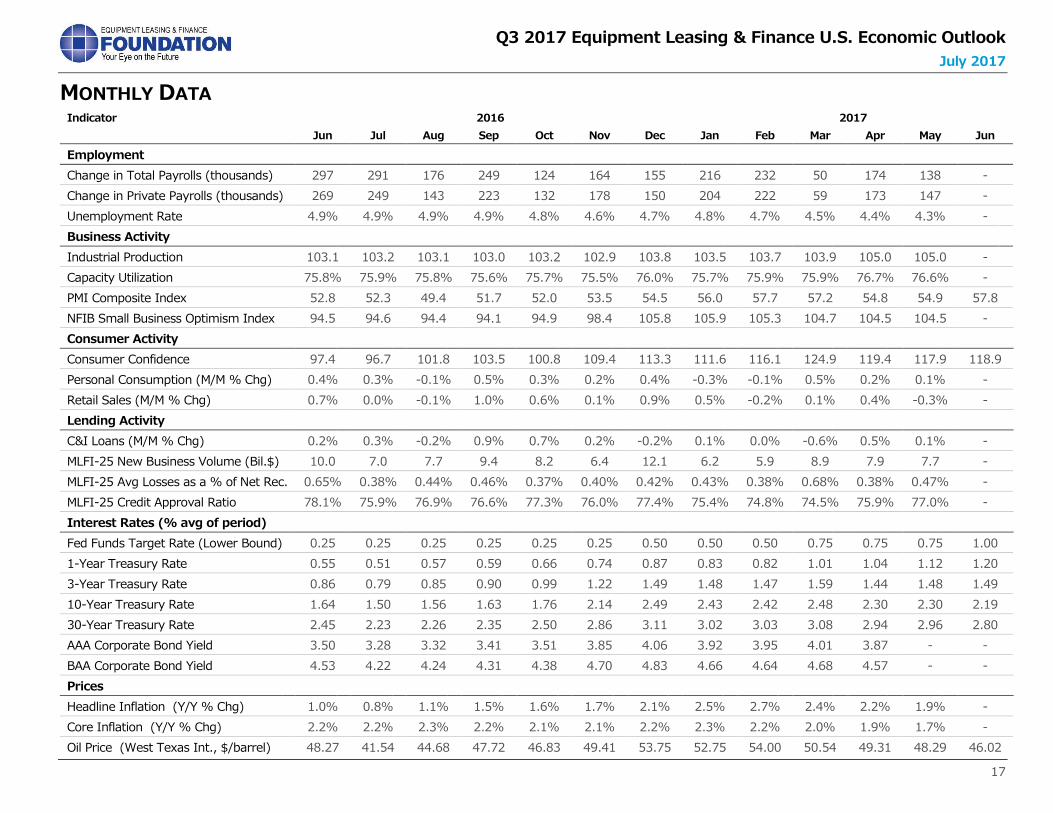
MONTHLY DATA Indicator 2016 2017
Jun Jul Aug Sep Oct Nov Dec Jan Feb Mar Apr May Jun
Employment
Change in Total Payrolls (thousands) 297 291 176 249 124 164 155 216 232 50 174 138 -
Change in Private Payrolls (thousands) 269 249 143 223 132 178 150 204 222 59 173 147 -
Unemployment Rate 4.9% 4.9% 4.9% 4.9% 4.8% 4.6% 4.7% 4.8% 4.7% 4.5% 4.4% 4.3% -
Business Activity
Industrial Production 103.1 103.2 103.1 103.0 103.2 102.9 103.8 103.5 103.7 103.9 105.0 105.0 -
Capacity Utilization 75.8% 75.9% 75.8% 75.6% 75.7% 75.5% 76.0% 75.7% 75.9% 75.9% 76.7% 76.6% -
PMI Composite Index 52.8 52.3 49.4 51.7 52.0 53.5 54.5 56.0 57.7 57.2 54.8 54.9 57.8
NFIB Small Business Optimism Index 94.5 94.6 94.4 94.1 94.9 98.4 105.8 105.9 105.3 104.7 104.5 104.5 -
Consumer Activity
Consumer Confidence 97.4 96.7 101.8 103.5 100.8 109.4 113.3 111.6 116.1 124.9 119.4 117.9 118.9
Personal Consumption (M/M % Chg) 0.4% 0.3% -0.1% 0.5% 0.3% 0.2% 0.4% -0.3% -0.1% 0.5% 0.2% 0.1% -
Retail Sales (M/M % Chg) 0.7% 0.0% -0.1% 1.0% 0.6% 0.1% 0.9% 0.5% -0.2% 0.1% 0.4% -0.3% -
Lending Activity
C&I Loans (M/M % Chg) 0.2% 0.3% -0.2% 0.9% 0.7% 0.2% -0.2% 0.1% 0.0% -0.6% 0.5% 0.1% -
MLFI-25 New Business Volume (Bil.$) 10.0 7.0 7.7 9.4 8.2 6.4 12.1 6.2 5.9 8.9 7.9 7.7 -
MLFI-25 Avg Losses as a % of Net Rec. 0.65% 0.38% 0.44% 0.46% 0.37% 0.40% 0.42% 0.43% 0.38% 0.68% 0.38% 0.47% -
MLFI-25 Credit Approval Ratio 78.1% 75.9% 76.9% 76.6% 77.3% 76.0% 77.4% 75.4% 74.8% 74.5% 75.9% 77.0% -
Interest Rates (% avg of period)
Fed Funds Target Rate (Lower Bound) 0.25 0.25 0.25 0.25 0.25 0.25 0.50 0.50 0.50 0.75 0.75 0.75 1.00
1-Year Treasury Rate 0.55 0.51 0.57 0.59 0.66 0.74 0.87 0.83 0.82 1.01 1.04 1.12 1.20
3-Year Treasury Rate 0.86 0.79 0.85 0.90 0.99 1.22 1.49 1.48 1.47 1.59 1.44 1.48 1.49
10-Year Treasury Rate 1.64 1.50 1.56 1.63 1.76 2.14 2.49 2.43 2.42 2.48 2.30 2.30 2.19
30-Year Treasury Rate 2.45 2.23 2.26 2.35 2.50 2.86 3.11 3.02 3.03 3.08 2.94 2.96 2.80
AAA Corporate Bond Yield 3.50 3.28 3.32 3.41 3.51 3.85 4.06 3.92 3.95 4.01 3.87 - -
BAA Corporate Bond Yield 4.53 4.22 4.24 4.31 4.38 4.70 4.83 4.66 4.64 4.68 4.57 - -
Prices
Headline Inflation (Y/Y % Chg) 1.0% 0.8% 1.1% 1.5% 1.6% 1.7% 2.1% 2.5% 2.7% 2.4% 2.2% 1.9% -
Core Inflation (Y/Y % Chg) 2.2% 2.2% 2.3% 2.2% 2.1% 2.1% 2.2% 2.3% 2.2% 2.0% 1.9% 1.7% -
Oil Price (West Texas Int., $/barrel) 48.27 41.54 44.68 47.72 46.83 49.41 53.75 52.75 54.00 50.54 49.31 48.29 46.02
Q3 2017 Equipment Leasing & Finance U.S. Economic Outlook
July 2017
18
ABOUT THE OUTLOOK
The Equipment Leasing & Finance Foundation (the Foundation) recognizes that with the wide variety and increasing complexity of
economic data available to the public, the best way to utilize key equipment investment data is to have it all in one place, where
business leaders can access it easily and quickly, thus assisting them in making the best business decisions.
The Foundation partnered with Keybridge LLC to produce this economic outlook, highlighting key trends in equipment investment
and placing them in the context of the broader U.S. economic climate. The outlook report also includes an analysis of domestic
capital spending as well as an evaluation of how capital spending is affected by various related and exogenous factors, both currently
and in the foreseeable future. Additionally, the outlook includes custom leading indicators for 12 equipment and software verticals.
The Foundation-Keybridge U.S. Equipment & Software Investment Momentum Monitor, described below, is published monthly.
This Q2 report is the first update to the 2016 Annual Outlook, and two more quarterly updates will follow in July and October. This
research was guided by a steering committee of dedicated industry volunteers who gave their time and expertise by providing
comments and suggestions throughout the development of the report.
ABOUT THE MOMENTUM MONITOR
Business leaders require actionable forward-looking intelligence to make strategic decisions. Accordingly, the Foundation
commissioned Keybridge LLC to develop a series of custom leading indicators for the equipment sector. The Foundation-Keybridge
Equipment & Software Investment Momentum Monitor consists of indices for 12 equipment and software investment verticals.
These indices are designed to identify turning points in their respective investment cycles with a three-to-six month lead time.
The Momentum Monitor is based on Keybridge’s extensive research which shows that not all movements in economic data are
reliable signals of future economic trends. Keybridge has operationalized its research by constructing indices, each comprised of
between 10 to 20 high-frequency indicators. These indicators undergo rigorous testing to determine the optimal thresholds at which
their short-term fluctuations are economically meaningful. In simpler terms, the Momentum Monitor sifts out the “noise” in the data
and identifies the dominant trends. As a result, each Momentum Monitor index is statistically optimized to signal turning points in
the investment cycle without giving false readings of shifts in momentum.
Q3 2017 Equipment Leasing & Finance U.S. Economic Outlook
July 2017
19
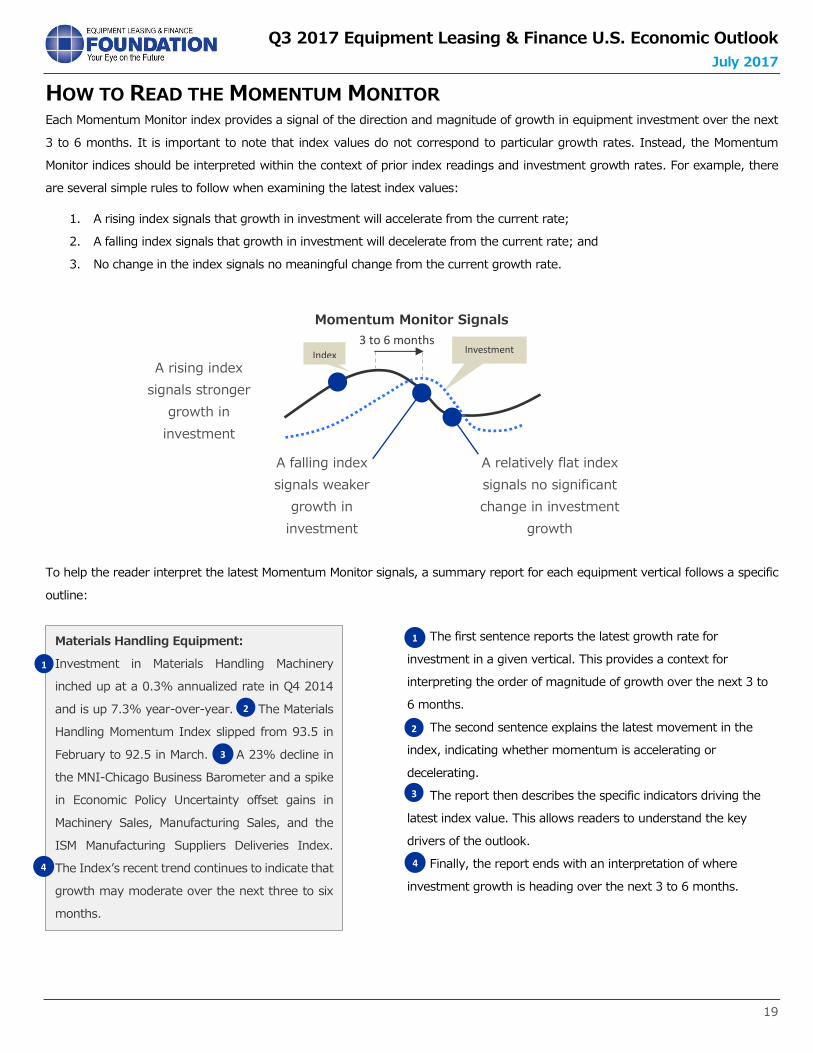
HOW TO READ THE MOMENTUM MONITOR Each Momentum Monitor index provides a signal of the direction and magnitude of growth in equipment investment over the next
3 to 6 months. It is important to note that index values do not correspond to particular growth rates. Instead, the Momentum
Monitor indices should be interpreted within the context of prior index readings and investment growth rates. For example, there
are several simple rules to follow when examining the latest index values:
1. A rising index signals that growth in investment will accelerate from the current rate;
2. A falling index signals that growth in investment will decelerate from the current rate; and
3. No change in the index signals no meaningful change from the current growth rate.
To help the reader interpret the latest Momentum Monitor signals, a summary report for each equipment vertical follows a specific
outline:
The first sentence reports the latest growth rate for
investment in a given vertical. This provides a context for
interpreting the order of magnitude of growth over the next 3 to
6 months.
The second sentence explains the latest movement in the
index, indicating whether momentum is accelerating or
decelerating.
The report then describes the specific indicators driving the
latest index value. This allows readers to understand the key
drivers of the outlook.
Finally, the report ends with an interpretation of where
investment growth is heading over the next 3 to 6 months.
1
3
4
3 to 6 months
Materials Handling Equipment:
Investment in Materials Handling Machinery
inched up at a 0.3% annualized rate in Q4 2014
and is up 7.3% year-over-year. The Materials
Handling Momentum Index slipped from 93.5 in
February to 92.5 in March. A 23% decline in
the MNI-Chicago Business Barometer and a spike
in Economic Policy Uncertainty offset gains in
Machinery Sales, Manufacturing Sales, and the
ISM Manufacturing Suppliers Deliveries Index.
The Index’s recent trend continues to indicate that
growth may moderate over the next three to six
months.
Index
1
Investment Growth Rate
A rising index
signals stronger
growth in
investment
A falling index
signals weaker
growth in
investment
A relatively flat index
signals no significant
change in investment
growth
1
2
2
3
3
4
Momentum Monitor Signals
2
Q3 2017 Equipment Leasing & Finance U.S. Economic Outlook
July 2017
20
ABOUT KEYBRIDGE
Keybridge is a public policy economics consulting firm. Keybridge provides analytical support and strategic advice to a select
clientele that includes Fortune 500 companies, global financial firms, G-7 governments, premier industry associations, and non-
profit organizations. Keybridge’s experience and expertise make it uniquely suited to assist organizations that frequently operate
at the interface of business, economics, and public policy.
Founded in 2001, Keybridge’s mission is to provide balanced, credible, and timely technical analysis and strategic insights that
inform business decisions and drive public policy debates. Our dedication to the principles of sound analysis, clear
communication, and unmatched client service guide our work and serve as the foundation of our success.
Keybridge’s senior staff is comprised of experts with distinguished academic credentials and extensive experience in the areas
of economics and public policy. On a day-to-day basis, Keybridge principals work closely with clients to develop strategy and
conduct timely analysis. For longer-term projects and highly specialized topics, the firm leverages its network of advisers —
including world-class experts in the fields of econometrics, energy, and finance — to build project teams tailored to clients’
unique needs.
Keybridge provides clients with access to a full suite of analytical services, including macroeconomic risk assessments,
econometric modeling studies, policy impact studies, qualitative policy evaluations, and survey design and analysis. For clients
requiring regular consultations, Keybridge offers on-going strategic advisory services in the areas of macroeconomic trends and
risks, international trade and finance, and energy and environmental economics. Keybridge also assembles and manages inter-
disciplinary teams of experts to conduct thought leadership projects to assist clients with building competitive advantages or
reforming policy debates through the development, sharing, and application of innovative ideas. Keybridge’s principals are
regularly asked to present research and share insights with economic, financial, and policy audiences around the world, including
corporate strategic planning committees, congressional committees, and international conferences.
The Equipment Leasing & Finance FoundationWe’re the Foundation for Your Future
Founded in 1989, the Equipment Leasing & Finance Foundation is dedicated toinspiring thoughtful innovation and contributing to the betterment of theequipment leasing and finance industry. The Foundation is a 501c3 non-profitorganization, funded through charitable individual and corporate donations.
Your Benefits Through the Foundation
• Access to industry-leading research and resources – Forward-looking Foundationstudies and other informational resources that are indispensable to equipment financeindustry participants and observers, as well as widely cited by respected businessmedia, including The Wall Street Journal, Bloomberg and Investor’s Business Daily.
• Relationship building with industry thought leaders – Participating in Foundationactivities builds your connections with other talented, successful leaders in equipmentfinance.
• A voice in creating new industry research – The Foundation welcomes yoursuggestions of research study topics that will benefit the industry and your ownbusiness.
• Opportunities to author industry-related studies and articles – Foundationresearch reports and publications, including The Journal of Equipment Lease Financing,provide opportunities to contribute to the industry’s body of knowledge.
• University and academic relations – The Foundation works closely with theacademic community to foster initiatives that drive innovation in the equipment financeindustry, including funding research grants and authorship honorariums, supporting casestudy development and teaching modules, and providing access to statistical databasesand other Foundation resources.
Your Invitation to Become a Valued Donor
The resources and benefits provided by the Foundation are exceeded only by theopportunities available to Foundation donors, and include:
• Early previews of studies – It would cost hundreds of thousands of dollars toproduce only a few of the Foundation’s various reports. Gifts of any size are welcomebut please note that a minimum donation level of $500 for individuals or $2,500 fororganizations will entitle you to receive copies of all new studies delivered in advance of wide public release.
• Recognition among peers in the equipment finance industry – Foundationconferences and events, including the Foundation Luncheon held each year at theEquipment Leasing and Finance Association’s Annual Convention, spotlight you andyour company’s role in supporting the equipment finance industry.
We invite you to invest in a strong Foundation for your business and for the equipmentfinance industry through a tax-deductible financial contribution. The Foundation is fundedthrough charitable contributions from corporations and individuals from all market sectorsbecause our research, resources and opportunities have value across the entire industry.For more information on contributing, and to see who supports us, visit https://www.leasefoundation.org/giving/
Visit the Equipment Leasing & Finance Foundation website at http://www.leasefoundation.org/ Subscribe to the Foundation Forecast e-newsletter at https://www.leasefoundation.org/news/forecast/
Insightful, In-Depth Industry ResourcesThe Foundation is your source for the most comprehensive, future-focused research andanalyses available on equipment finance industry topics that will enable your bestinformed decision-making. The following highly-regarded, widely utilized resources aremust-reads for equipment finance industry participants.
Equipment Leasing and Finance U.S. Economic OutlookThis report highlights key trends in equipment investment and places them in the contextof the broader U.S. economic climate. The report is updated quarterly throughout theyear. http://www.leasefoundation.org/research/eo/
Foundation-Keybridge Equipment & Software Investment Momentum MonitorA monthly report of indices for 12 equipment and software verticals designed to identifyturning points in their respective investment cycles with a 3 to 6-month lead time. http://www.leasefoundation.org/research/eo/mm.cfm
Industry Future Council Report Based on the deliberations of the Foundation’s Industry Future Council of leading industrylessors, analysts, and service providers on current issues, trends and future industryoutlook, the IFC Report is a guidebook for providers and arrangers of equipment financeas they undertake their own strategic planning efforts. http://www.leasefoundation.org/research/ifc/
State of the Equipment Finance Industry Report The SEFI provides a unique look at trends in the equipment finance industry over the pastyear, identifies key drivers for future growth, and explores emerging opportunities andrisks that could shape the industry over the next 3-5 years. http://www.leasefoundation.org/research/sefi/
Monthly Confidence Index for the Equipment Finance IndustryDesigned to collect leadership data, the MCI reports a qualitative assessment of both theprevailing business conditions and expectations for the future as reported by keyexecutives from the $1 trillion equipment finance sector. http://www.leasefoundation.org/research/mci/
Journal of Equipment Lease FinancingThe only scholarly periodical dedicated to equipment leasing and finance, the Journal ispublished quarterly and spotlights research, case studies, trends and practical informationthrough in-depth articles. Author guidelines are available online at https://www.leasefoundation.org/research/jelf/
Industry StudiesThrough the Foundation, industry leaders have access to the research and analyses thathelp them make wise decisions for their corporations and employees, available at ouronline library at www.store.leasefoundation.org.
Stay ConnectedFollow us: �
Twitter: @LeaseFoundation �
Facebook: Equipment Leasing & Finance Foundation
Linked In: https://www.linkedin.com/company/10989281
VOLUME 34 • NUMBER 1 • WINTER 2016
Accounting for Alternative Energy Investments
By Joseph P. Sebik
The U.S. tax code includes substantial tax incentives in the form of tax credits to promote new alternative energy projects. In December 2015 these tax credits were extended for several years. A good portion of the return on investment from these projects originates from these tax benefits, often with nominal investment risk. However, the complex financing structures and accounting for the tax credits often poses financial reporting challenges. To provide a better understanding of the complex nature of the financial reporting, here is a comprehensive look at some commonly found types of alternative energy projects and their financing and investment structures, along with the accounting for them by the investors.
The Impending Impact of Section 1071 and Creeping Consumerism on E uipment Finance
hn C. Redding, Moorari K. Shah, Kathleen C. Ryan, and Mitchell M. Grod
71 of the Dodd-Frank Act goes beyond consumer lending to regulate business c ly applies to any entity engaged in financial activity, which may include c nce the Consumer Financial Protection Bureau publishes proposed r l te 2016. Will you be ready?
JOURNAL
CONNE THE FOUND
O F E Q U I P M E N T L E A S E F I N A N C I N G