Embed Size (px)
Citation preview

2017 Guide to Test Interpretation
Indiana Department of Education
+

Copyright © 2017 by State of Indiana Department of Education (IDOE). All rights reserved. No part of this publication may be reproduced or distributed in any form or by any means, or stored in a database or retrieval system, without the prior written permission of IDOE. All brand names found in this publication are the trademarks of their respective owners.

ISTEP+ 2017 GUIDE TO TEST INTERPRETATION i
Table of Contents
Understanding Test Results .....................................................................................................1What Can You Learn from Test Results? ..........................................................................1
What Is a Criterion-Referenced Score? ............................................................................1
Item Response Theory ....................................................................................................2
Pattern Scoring ................................................................................................................2
Scale Scores ....................................................................................................................2
Vertical Scale ...................................................................................................................2
Cut Scores and Performance Levels ..............................................................................4
Academic Standards Scores ..........................................................................................4
Mean and Median Scores ................................................................................................4
Standard Deviation ..........................................................................................................5
The Testing Program for ISTEP+ ..............................................................................................6Reports for ISTEP+ ..........................................................................................................6
ISTEP+ Results Reports ...........................................................................................................8ISTEP+ OnDemand Reports ............................................................................................8
ISTEP+ Student Data File ...............................................................................................14
ISTEP+ Individual Student Report .................................................................................15
ISTEP+ Label .................................................................................................................20
Academic Standards Summary .....................................................................................21
Academic Standards Frequency Distribution ................................................................26
Applied Skills Frequency Distribution ............................................................................30
Disaggregation Summary Report ..................................................................................32
Disaggregation Data File ...............................................................................................34
Proficiency Summary Report .........................................................................................36
Proficiency Grouping Report ..........................................................................................39
Rescore Report ..............................................................................................................46
Reference ...............................................................................................................................47Glossary ........................................................................................................................47

ISTEP+ 2017 GUIDE TO TEST INTERPRETATION 1
Understanding Test Results
What Can You Learn from Test Results?Taxpayers, parents, and educators ask many questions about instructional programs as Indiana strives to build a brighter future by providing the best possible education for its young people. Questions such as the following are commonly asked:
“Are all our students attaining the skills they need to succeed?”
“What kind of individual instruction would help my child?”
ISTEP+ provides information that will help you answer such questions and will support the instructional choices you make for your students. ISTEP+ reports can quickly show you the following:
• to what extent an individual student has mastered the Indiana Academic Standards in the English/Language Arts, Mathematics, Science, and Social Studies content areas.
• to what extent the students as a group—in your classroom, school, and corporation—are attaining mastery of the Academic Standards.
• where the students in your classroom, school, or corporation stand relative to the three performance levels established by the Indiana State Board of Education. (See page 4 for more information about performance levels.)
What Is a Criterion-Referenced Score?ISTEP+ is a criterion-referenced test. It consists of items that assess a student’s performance with respect to particular criteria—in this case, to the Indiana Academic Standards established by the Indiana State Board of Education. The test does not provide norm-referenced information; that is, it does not compare the performance of Indiana students with that of students across the nation. Criterion-referenced scores indicate where a student stands in relation to the cut score, defined by educators, and based on Indiana Academic Standards. A student’s score is developed based on Item Response Theory (see page 2). The most valuable application of criterion-referenced information is to identify a student’s strengths and needs in order to plan appropriate instruction.
Criterion-referenced scores are presented by Academic Strands within each content area. Examples are presented below:
Criterion-Referenced Score Categories
Content Area English/Language Arts Mathematics
Academic Strands
3.1 Reading: Literature
3.2 Reading: Nonfiction & Media Literacy
3.1 Number Sense
3.2 Computation

ISTEP+ 2017 GUIDE TO TEST INTERPRETATION2
Item Response Theory Item Response Theory (IRT) refers to the theory underlying a family of statistical models. These statistical models analyze the data obtained from test questions, or items. For the ISTEP+ tests, two models are used. One is used for the multiple-choice items, and another is used for the open-ended items.
The two models are used in combination with test data to characterize items and generate student scale scores. Both models use the data to determine how difficult each item is and how well each item distinguishes students who do and do not have the skill being tested by the item. The multiple-choice model also describes the degree to which students can guess the correct answer to each item.
Pattern ScoringThe statistical characteristics of the items can affect a student’s total test score (scale score). This is particularly true with ISTEP+ because it is pattern scored. Using the IRT model, pattern scoring incorporates item information, such as how difficult an item is for students to formulate a correct response. In contrast, raw scoring or number-correct scoring simply notes whether the student answered the item correctly. Both pattern scores and raw scores can be considered ability scores used to represent a student’s ability level. To illustrate the differences between pattern scoring and raw scoring, consider two students, Student 1 and Student 2, who both correctly answer 20 items. Student 1 answers the 20 most difficult items, while Student 2 answers the 20 easiest. With raw scoring, both students receive the same raw (ability) score, indicating both students have the same “ability,” and the highest raw score possible is equal to the total number of items on a test. In contrast, when the pattern of the items answered correctly is taken into account—that is, when the information about the difficulty of the items (among other item characteristics) is considered— Student 1 rightly receives a higher ability score.
Scale ScoresWhen ability scores are placed on a scale different from the raw score or number-correct scale, they are called “scale scores.” The ability scores are transformed and placed onto a scale, much like taking a degree of temperature on the Celsius scale and transforming it onto the Fahrenheit scale. How hot or cold the temperature is does not change. What does change is the scale used to describe the temperature. In the same way, ability scores can be described by different scales and still maintain their meaning as an indication of ability.
Vertical ScaleThe ISTEP+ tests have been placed on yet another scale, a “vertical scale.” Instead of having a different scale for each grade, the ISTEP+ ability scores have been placed on two scales that move vertically from Grade 3 through Grade 8—one for English/Language Arts
ISTEP+ 2017 GUIDE TO TEST INTERPRETATION 3
and one for Mathematics. Without a vertical scale, one would not be able to make a direct comparison of an individual student’s performance from grade to grade within a content area. To return to the temperature example, instead of having to report the temperature in North Dakota on the Celsius scale and the temperature in Florida on the Fahrenheit scale, one can report conditions in both areas on the Fahrenheit scale.
Similarly, instead of having a different scale at each grade, there is only one scale for each content area in Grades 3–8. One thing to keep in mind: The temperature range and average (mean) temperature in North Dakota are usually lower than they are in Florida, although the states sometimes have similar temperatures. In the same way, the ranges of scores and mean scores for Grade 3 are lower than those for Grades 4–8. Vertical scales are not used in Science or Social Studies since these are not given in adjacent grades.
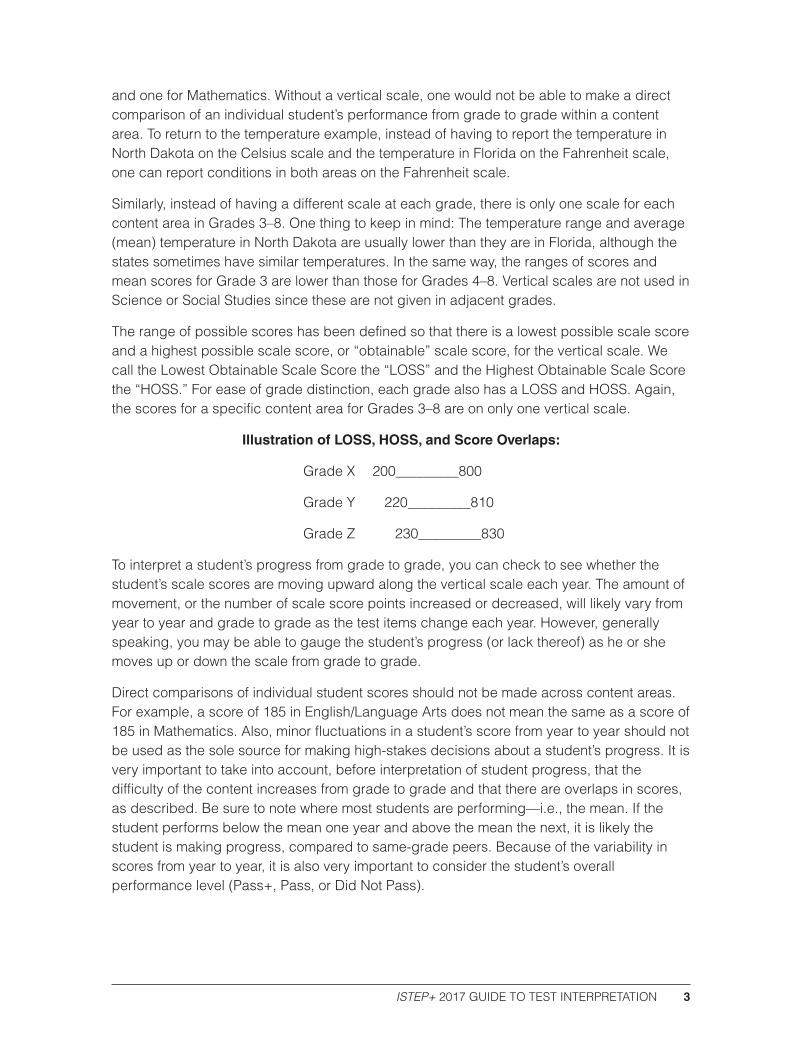
The range of possible scores has been defined so that there is a lowest possible scale score and a highest possible scale score, or “obtainable” scale score, for the vertical scale. We call the Lowest Obtainable Scale Score the “LOSS” and the Highest Obtainable Scale Score the “HOSS.” For ease of grade distinction, each grade also has a LOSS and HOSS. Again, the scores for a specific content area for Grades 3–8 are on only one vertical scale.
Illustration of LOSS, HOSS, and Score Overlaps:
Grade X 200_________800
Grade Y 220_________810
Grade Z 230_________830
To interpret a student’s progress from grade to grade, you can check to see whether the student’s scale scores are moving upward along the vertical scale each year. The amount of movement, or the number of scale score points increased or decreased, will likely vary from year to year and grade to grade as the test items change each year. However, generally speaking, you may be able to gauge the student’s progress (or lack thereof) as he or she moves up or down the scale from grade to grade.
Direct comparisons of individual student scores should not be made across content areas. For example, a score of 185 in English/Language Arts does not mean the same as a score of 185 in Mathematics. Also, minor fluctuations in a student’s score from year to year should not be used as the sole source for making high-stakes decisions about a student’s progress. It is very important to take into account, before interpretation of student progress, that the difficulty of the content increases from grade to grade and that there are overlaps in scores, as described. Be sure to note where most students are performing—i.e., the mean. If the student performs below the mean one year and above the mean the next, it is likely the student is making progress, compared to same-grade peers. Because of the variability in scores from year to year, it is also very important to consider the student’s overall performance level (Pass+, Pass, or Did Not Pass).

ISTEP+ 2017 GUIDE TO TEST INTERPRETATION4
Cut Scores and Performance Levels The Every Student Succeeds Act (ESSA) is federal legislation that requires that student achievement be reported in terms of at least three performance levels. One of these performance levels is designated as the proficient level. Each state must determine the number of performance levels to use, as well as the meanings associated with those levels. For Grades 3–8 and 10, the ISTEP+ test scale is divided into three performance levels using two cut scores. The cut score is the score that separates two performance levels. Based on their ISTEP+ scale score, students are placed into one of three performance levels: Pass+, Pass, or Did Not Pass. For Indiana students, the cut score for the “Pass” performance level represents the point on the scale above which performance is considered proficient.
Performance level information can be used to help plan individual instructional goals for the student. The category “Undetermined” is also reported for any student whose ISTEP+ scores for English/Language Arts, Mathematics, Science, and/or Social Studies are incomplete. A student is reported “Undetermined” if all or part of a test was not taken, was considered invalid by the school, or was not received by the test vendor.
Academic Standards Scores Indiana’s Academic Standards are listed by content area on the Student Report, the Class Academic Standards Report, and the Group Academic Standards Summary.
The Indiana Performance Index (IPI) is used to indicate a student’s performance on the Academic Standards. This is a statistical value that reflects the number of items a student would have answered correctly if the student had responded to 100 similar items for the specific Academic Standard on the test. It is a better measure of the student’s performance than a simple percentage of correct answers to a small number of questions.
The Student Report shows each Academic Standard as well as the student’s score (based on the IPI) and the Target Score (see page 18).
The Class Academic Standards Report indicates whether students have mastered each Academic Standard. Symbols appear on this report indicating 1) mastery, 2) non-mastery, or 3) whether a subtest was invalid or omitted. Mastery of an Academic Standard indicates that the student performance is equal to or greater than the passing level for a student on the standard.
The corporation Group Academic Standards Summary provides a summary of students’ performance for all schools in the corporation.
Mean and Median ScoresOn ISTEP+ reports, summary information for a group (such as a class) is often presented using mean or median scores. The mean is the average score obtained by adding together
ISTEP+ 2017 GUIDE TO TEST INTERPRETATION 5
all scores in the group and dividing by the number of students in the group. The median is the middle score. (Fifty percent of the scores fall below it, and fifty percent fall above it.)
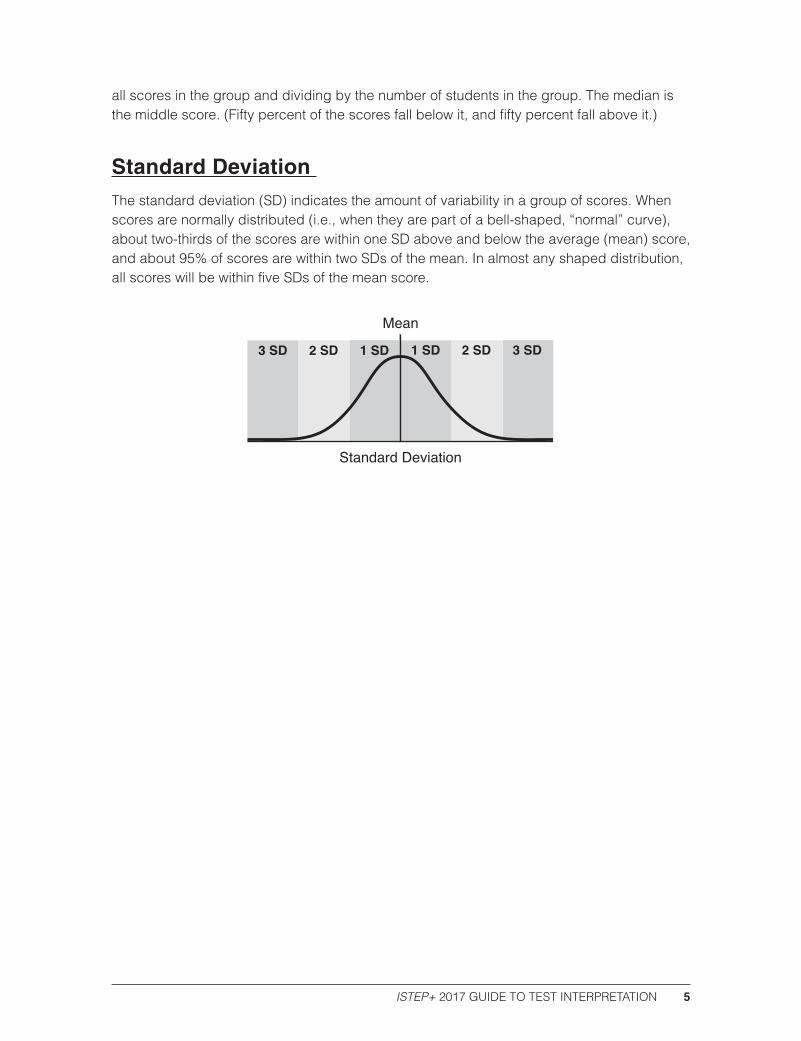
Standard Deviation The standard deviation (SD) indicates the amount of variability in a group of scores. When scores are normally distributed (i.e., when they are part of a bell-shaped, “normal” curve), about two-thirds of the scores are within one SD above and below the average (mean) score, and about 95% of scores are within two SDs of the mean. In almost any shaped distribution, all scores will be within five SDs of the mean score.
Standard Deviation

ISTEP+ 2017 GUIDE TO TEST INTERPRETATION6
The Testing Program for ISTEP+
Reports for ISTEP+This guide will help you understand ISTEP+ test results and reports more clearly, and using those results, provide educational opportunities for students more effectively. Each ISTEP+ report is designed to clearly present the most useful information for you and your discussions with parents, students, and other members of the educational community.
This guide provides educators with the purpose and intended audience for each report. The table on the next page lists each available report.
In order to interpret and apply the information in all of the ISTEP+ reports, it is necessary to understand the meaning of the scores presented. If you are unfamiliar with ISTEP+ or testing and scoring terms, please review the previous section in this guide, “Understanding ISTEP+ Test Results.” You will also find a glossary at the end of this guide.
Verify Test Administration
To access the online reports discussed in this guide, sign into PearsonAccessnext and verify that the ISTEP+ Spring 2017 test administration is selected before viewing any reports. To change the test administration, select the current test administration to display a drop-down menu and then select ISTEP+ Spring 2017.

ISTEP+ 2017 GUIDE TO TEST INTERPRETATION 7
ISTEP+ReportInformation
Report
NumberofPaperCopies PearsonAccessnext
ForParents IndividualStudentReport 1 0ForTeachers OnDemandReports–ReportingGroupsEnabled 0 1IndividualStudentReport(PDFCopies) 0 1Label 1 0ProficiencyGroupingReport–ReportingGroupsEnabled 0 1ProficiencySummaryReport–ReportingGroupsEnabled 0 1AcademicStandardsSummary–ReportingGroupsEnabled 0 1FortheSchoolAdministrator
IndividualStudentReport(PDFCopies) 0 1OnDemandReports
0
1
StudentDataFile 0 1AcademicStandardsFrequencyDistribution 0 1AcademicStandardsSummaryReport 0 1AppliedSkillsFrequencyDistribution 0 1DisaggregationFiles 0 1DisaggregationSummaryReport 0 1ProficiencyGroupingReport 0 1ProficiencySummaryReport 0 1RescoreReport 0 1FortheCorporationAdministrator OnDemandReports 0 1StudentDataFile 0 1AcademicStandardsFrequencyDistribution 0 1AcademicStandardsSummaryReport 0 1AppliedSkillsFrequencyDistribution 0 1DisaggregationFiles 0 1DisaggregationSummaryReport 0 1ProficiencyGroupingReport 0 1ProficiencySummaryReport 0 1RescoreReport 0 1
Images of student responses to the open-ended items are available to parents through Pearson’s Parent Portal at https://results.pearsonaccessnext.com/login.
NOTE: The aggregated data are embargoed and can only be shared with teachers, parents, and students to whom it applies until notification of release is indicated by IDOE. (Aggregated data from these reports cannot be shared at local school board meetings. Staff may evaluate aggregate data for instructional decisions needed.)
ISTEP+ 2017 GUIDE TO TEST INTERPRETATION8
ISTEP+ Results Reports
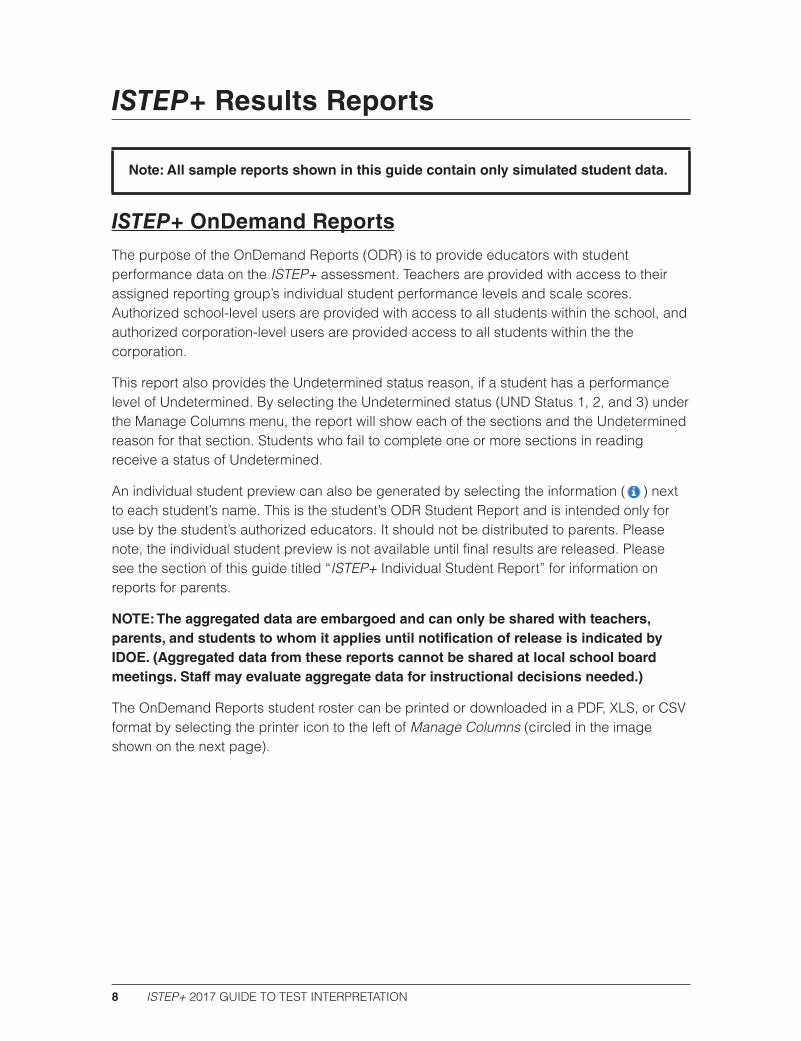
Note: All sample reports shown in this guide contain only simulated student data.
ISTEP+ OnDemand ReportsThe purpose of the OnDemand Reports (ODR) is to provide educators with student performance data on the ISTEP+ assessment. Teachers are provided with access to their assigned reporting group’s individual student performance levels and scale scores. Authorized school-level users are provided with access to all students within the school, and authorized corporation-level users are provided access to all students within the the corporation.
This report also provides the Undetermined status reason, if a student has a performance level of Undetermined. By selecting the Undetermined status (UND Status 1, 2, and 3) under the Manage Columns menu, the report will show each of the sections and the Undetermined reason for that section. Students who fail to complete one or more sections in reading receive a status of Undetermined.
An individual student preview can also be generated by selecting the information ( ) next to each student’s name. This is the student’s ODR Student Report and is intended only for use by the student’s authorized educators. It should not be distributed to parents. Please note, the individual student preview is not available until final results are released. Please see the section of this guide titled “ISTEP+ Individual Student Report” for information on reports for parents.
NOTE: The aggregated data are embargoed and can only be shared with teachers, parents, and students to whom it applies until notification of release is indicated by IDOE. (Aggregated data from these reports cannot be shared at local school board meetings. Staff may evaluate aggregate data for instructional decisions needed.)
The OnDemand Reports student roster can be printed or downloaded in a PDF, XLS, or CSV format by selecting the printer icon to the left of Manage Columns (circled in the image shown on the next page).

ISTEP+ 2017 GUIDE TO TEST INTERPRETATION 9
Features of the ISTEP+ OnDemand Reports
Indicates the Test Administration and Corporation or School.
Filters the data by Reporting Group.
Lists students according to the specified filtering criteria.
Produces the student report when the blue ( ) icon is selected (not available until final results are released).
Displays the specific subject for a student.
Displays each student scale score and performance level within the content area.
Adds or removes columns of information to be displayed in the OnDemand Reports.
How Can OnDemand Reports Be Accessed?
Results are posted in PearsonAccessnext. To access reports, use the following steps.
1. Select the Reports tab, and then select OnDemand Reports.
2. Results for the students in your school(s) will appear. You can display up to 100 students per screen by selecting the Displaying drop-down.

ISTEP+ 2017 GUIDE TO TEST INTERPRETATION10
You can display results for an individual student in the Student List Report by typing the student’s name into Find Students search box. You can also narrow down the list of results by using the Filters to search by organization, test name, or grade.
• Organization Name: Displays results for students only in the selected school(s) or corporation
• Reporting Group: Displays results for students in this specific reporting group
• Test Name: Displays results by test, which contains the tested grade and subject
• Subject Name: Displays results for a specific subject
• Enrolled Grade: Displays all results by the selected enrolled grade(s)
• Performance Level: Displays results by a specific Performance Level
Download the OnDemand Student List Report
1. Use the Manage Columns menu to add or remove fields from the Student List Report display.

ISTEP+ 2017 GUIDE TO TEST INTERPRETATION 11
2. Select the printer icon to download the Student List Report.
There are three available Student List Report data download options:
• Student List Report (downloads in a PDF format)

ISTEP+ 2017 GUIDE TO TEST INTERPRETATION12
• Student List Report CSV (downloads in a .csv file format)
• Student List Report Excel (downloads in an Excel file format)
NOTE: There is a limit of 500 OnDemand Reports that can be sent to PDF/CSV/XLS through the printer icon. 2017 OnDemand Reports are available only for the 2017 reporting cycle. If Published Reports do not offer the level of detail preferred for long-term records for your school(s), download the OnDemand Reports during this current reporting cycle and retain those versions for your corporation/school long-term records.
Individual Student Performance by Strand
• To access the student’s OnDemand Student Report, as well as the student’s Performance by Strand, select the information icon ( ) next to the student’s name.
• The OnDemand Student Report is not available until final results are released.
• This OnDemand Student Report should not be distributed to parents; it is intended for use by authorized educators only. You may download/print a single student’s Student Report by selecting the small printer icon in the upper right corner as shown on the next page.

ISTEP+ 2017 GUIDE TO TEST INTERPRETATION 13
• To download the entire reporting group’s Student Reports, navigate back to the Student List Report by closing out the individual student’s Student Report screen. Once at the Student List Report, select the printer icon and then select Student Detail.

ISTEP+ 2017 GUIDE TO TEST INTERPRETATION14
ISTEP+ Student Data FileThe purpose of the Student Data File is to provide a comprehensive file of student performance data on the ISTEP+ assessment to authorized school-level and corporation-level educators.
1. Download the ISTEP+ Spring 2017 Student Data File Layout from the Indiana Resource Center on PearsonAccessnext at http://indiana.pearsonaccessnext.com.
2. At the top of your screen, select Reporting Resources. Under Reporting Resources, select the Resources menu, and then select ISTEP+ Spring 2017 Student Data File Layout.
How Can the Student Data File Be Accessed?
Results are posted in PearsonAccessnext. Select the Reports tab, and then select Published Reports (ISTEP+ Student Data File will appear on the list for the school or corporation when the Student Data File is released).

ISTEP+ 2017 GUIDE TO TEST INTERPRETATION 15
ISTEP+ Individual Student ReportThe purpose of the ISTEP+ Individual Student Report (ISR) is to clearly communicate student performance to parents. The front of the report shows the student’s score and whether the student is placed in the Pass+, Pass, or Did Not Pass performance level in each content area, as established by the Indiana State Board of Education. The front of the report also provides information about the Learning LocatorTM, a resource of online learning activities mapped specifically to the student’s performance on ISTEP+. One paper copy of this report is provided to corporations (who distribute to schools). Schools provide this paper ISR to the parents of the student. A PDF version of the Student Report is also available through PearsonAccessnext at https://in.pearsonaccessnext.com. After sign in, go to Reports, select Published Reports, and then select the ISTEP+ Student Report.
NOTE: The PDF version of the ISR is available approximately the week prior to paper ISR delivery to corporations. The PDF and paper copies of the ISR provide information for parents, whereas the OnDemand Student Report (as shown in the “OnDemand Reports” section) is not intended for distribution to parents.
Parents also have access to their child’s ISR through the Parent Portal.

ISTEP+ 2017 GUIDE TO TEST INTERPRETATION16
Sample Individual Student Report
The sample Individual Student Report, as shown below, presents results for Karen M. Smith, a fictional student who took the ISTEP+ English/Language Arts (ELA) test. The middle section of the first page of this report shows Karen’s scale score and her associated performance level in this content area. The Student Learning Resource section near the bottom of the report provides information on how to access the online learning resource that contains learning activities specific to Karen’s performance, via the Learning LocatorTM code.

ISTEP+ 2017 GUIDE TO TEST INTERPRETATION 17
Features of the ISTEP+ Individual Student Report(Page 1 of the Individual Student Report is shown on page 16.)
Identifies the Grade and Content area for this report. The student will receive a separate report for each ISTEP+ content area tested.
Identifies the Student’s Name, Birth Date, Enrolled Grade, School Name, and Corporation Name.
Explains the student’s performance relative to the cut scores established by the Indiana State Board of Education.
Lists more information about the Student Learning Resource, Learning LocatorTM.

ISTEP+ 2017 GUIDE TO TEST INTERPRETATION18
Sample Student Report – Back of Report (Page 2)
The top portion on the back of the Student Report details Karen’s performance on each of the strands (topics) covered by the specific subject for the report. In addition to the student’s individual score, the state average score and target score are also provided. The middle section of this page of the report shows Karen’s performance on the ELA open-ended items (essay and short-answer questions). Each item is listed, along with the strand measured and the number of points Karen earned. This section also details how parents may access the Parent Portal to view their child’s responses to these open-ended items. Finally, the section at the bottom of the report provides ways to obtain more information about the assessment and the Indiana Academic Standards.

ISTEP+ 2017 GUIDE TO TEST INTERPRETATION 19
Features of the Individual Student Report – Back of Report (Page 2)(Page 2 of the Individual Student Report is shown on page 18.)
Lists the strand (topics) of the ISTEP+ Assessment content area.
Shows the student’s score for each strand.
Shows the state average score for the 2017 Assessment in each strand.
Shows the target score for the 2017 Assessment for each strand.
Shows the student’s performance on the items by strand. Listed is the specific item number on the assessment and the points earned out of the maximum number of points available, i.e., 0 of 2.
Provides an explanation of the Condition Codes and why a score of zero was received.
Provides information about accessing the IDOE assessment website, help desks, and the Parent Portal.

ISTEP+ 2017 GUIDE TO TEST INTERPRETATION20
ISTEP+ LabelThe ISTEP+ Label presents an individual student’s criterion-referenced test results in a form that school administrators can easily attach to the student’s permanent record.
ISTEP+ 2017 GUIDE TO TEST INTERPRETATION 21
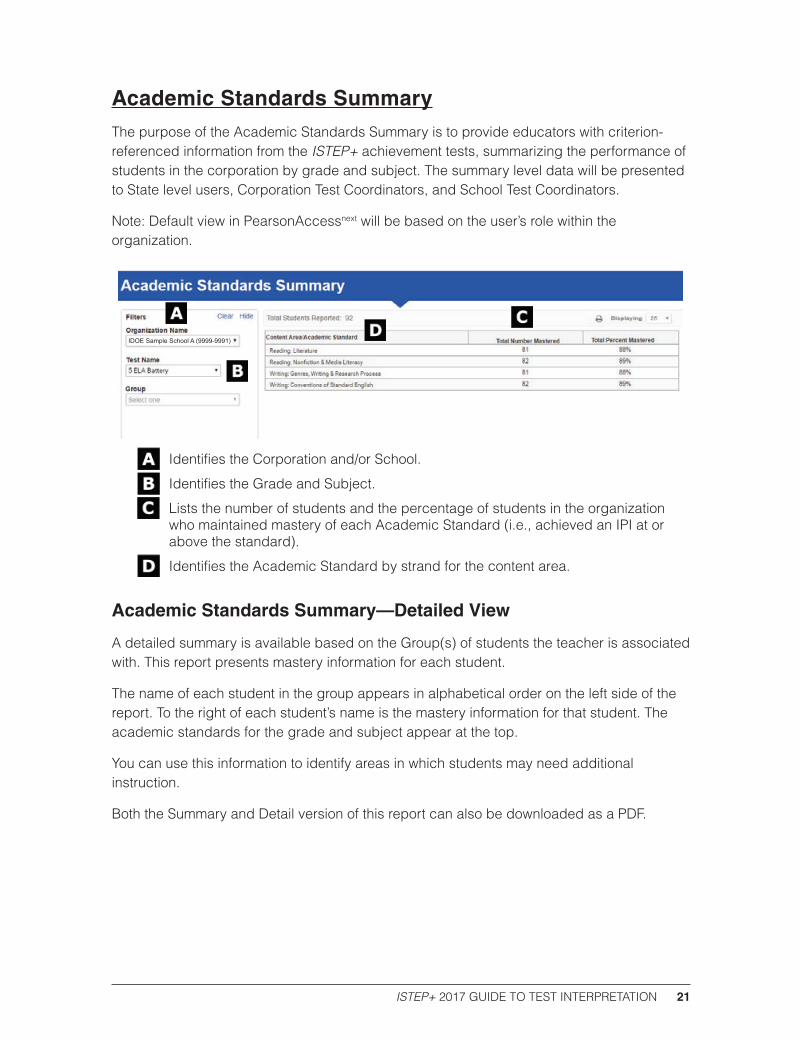
Academic Standards SummaryThe purpose of the Academic Standards Summary is to provide educators with criterion-referenced information from the ISTEP+ achievement tests, summarizing the performance of students in the corporation by grade and subject. The summary level data will be presented to State level users, Corporation Test Coordinators, and School Test Coordinators.
Note: Default view in PearsonAccessnext will be based on the user’s role within the organization.
IDOE Sample School A (9999-9991)
Identifies the Corporation and/or School.
Identifies the Grade and Subject.
Lists the number of students and the percentage of students in the organization who maintained mastery of each Academic Standard (i.e., achieved an IPI at or above the standard).
Identifies the Academic Standard by strand for the content area.
Academic Standards Summary—Detailed View
A detailed summary is available based on the Group(s) of students the teacher is associated with. This report presents mastery information for each student.
The name of each student in the group appears in alphabetical order on the left side of the report. To the right of each student’s name is the mastery information for that student. The academic standards for the grade and subject appear at the top.
You can use this information to identify areas in which students may need additional instruction.
Both the Summary and Detail version of this report can also be downloaded as a PDF.

ISTEP+ 2017 GUIDE TO TEST INTERPRETATION22
Identifies the Corporation and/or School.
Identifies the Grade and Subject.
Identifies the Group.
Lists the Academic Standards for that grade and subject.
Lists students alphabetically by name.
Indicates the number of students.
How Can the Academic Standards Summary Reports Be Accessed?
• Results are posted in PearsonAccessnext. Select the Reports tab, and then select Academic Standards Summary.
• For CTC and STC users, results for the students in your organization will appear by Test Name. You can display up to 100 Content Area/Academic Standards per screen by selecting the Displaying drop-down. (Please note that the maximum number of Academic Standards does not exceed 15 for Spring 2017.)

ISTEP+ 2017 GUIDE TO TEST INTERPRETATION 23
You can also narrow down the list of results by using the Filters to search by Organization Name, Test Name, or Group.
• Organization Name: Displays quantity of students only in the selected school(s) or corporation
• Test Name: Displays results by test
• Group: Displays summary results for students who are members of the selected reporting group(s)
Download the Academic Standards Summary Test Results
Based on the filters selected above for Organization Name, Test Name, and/or Group, select the printer icon to download report results.
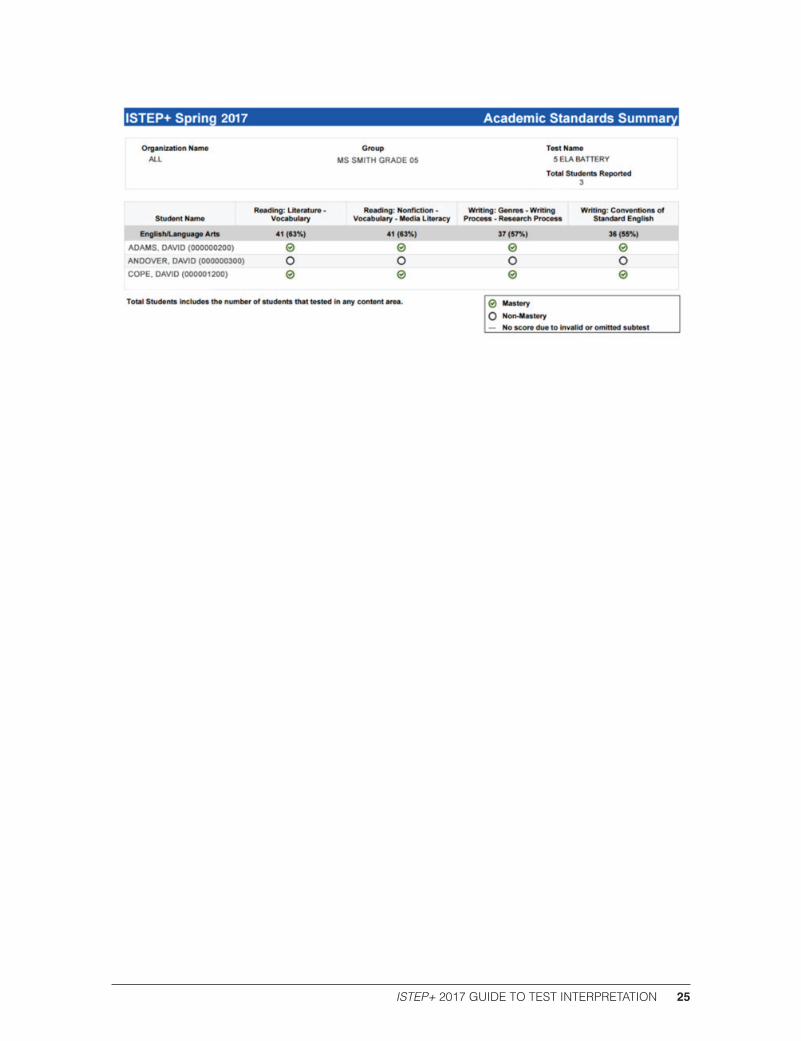
Academic Standards Summary PDF will download a PDF report with the specifics identified in the filters. Page 1 of a sample PDF report appears below:

ISTEP+ 2017 GUIDE TO TEST INTERPRETATION24
View Detailed Academic Standards Test Results
As a CTC or STC user, to view detail for a specific student or group, select a group within the Group drop-down. (Please note that Teacher Level users will default to the detail version of the report based on the Group(s) of students they are associated with for their specific organizations.)
In the sample report above, by selecting the Ms. Smith Grade 3 group under the Group drop-down, the user is able to view the specific results of the students in this group. The “green check” indicates student Mastery for the specific standard, while the “black circle” indicates Non-Mastery. A “—” indicates the student did not receive a score due to an invalidation or omitted subtest.
Download the Detailed Academic Standards Summary Test Results
Based on the filters selected above for Organization Name, Test Name, and/or Group, select the printer icon to print or download report results.
On the following page is a sample PDF of the Academic Standards Summary:
ISTEP+ 2017 GUIDE TO TEST INTERPRETATION 25

ISTEP+ 2017 GUIDE TO TEST INTERPRETATION26
Academic Standards Frequency DistributionThe purpose of the Academic Standards Frequency Distribution report is to provide educators with the distribution of scale scores achieved by all of the students tested in the corporation or school. The data is presented for analysis and can be used, along with other resources, to evaluate and plan educational priorities.
Users in PearsonAccessnext will have access to this report based on the organization or group within their organization that they are assigned to. This report can be filtered to show a group, test, and performance level. This report can also be downloaded as a PDF.
Indicates the Organization the data is coming from.
Filters the data by Reporting Groups.
Filters the data by Test Name.
Filters the data by Performance Level.
Indicates the scale score.
Indicates the number of students that achieved that scale score.
Indicates the percentage of students that achieved that scale score.
Indicates the number of students reported out (based on the number of students for that test with that Organization and Group selection).

ISTEP+ 2017 GUIDE TO TEST INTERPRETATION 27
PDF View of the Academic Frequency Distribution Report
Indicates the filtered data used for the PDF Report.
Indicates the Scale Score.
Indicates the number of students that achieved that scale score.
Indicates the percentage of students that achieved that scale score.
How Can Academic Standards Frequency Reports Be Accessed?
• Results are posted in PearsonAccessnext. Select the Reports tab, and then select Academic Standards Frequency.
• Results for the students in your corporation and/or school(s) will appear. You can display up to 100 scale scores per screen by selecting the Displaying drop-down.

ISTEP+ 2017 GUIDE TO TEST INTERPRETATION28
You can also narrow down the list of results by using the Filters to search by organization, test name, or performance level.
• Organization Name: Displays quantity of students only in the selected school(s) or corporation
• Group: Displays summary results for students who are members of the selected reporting group(s)
• Test Name: Displays results by test
• Performance Level: Displays all results by selected performance level
Download Academic Standards Frequency Test Results
Based on the filters selected above for Organization Name, Group, and/or Test Name, select the printer icon to print or download report results. For users that narrow down the results to a specific Performance Level, an option to generate a PDF of all the Performance levels—or just the specific Performance Level they are viewing on the screen—will appear in the same drop-down.
OR
ISTEP+ 2017 GUIDE TO TEST INTERPRETATION 29
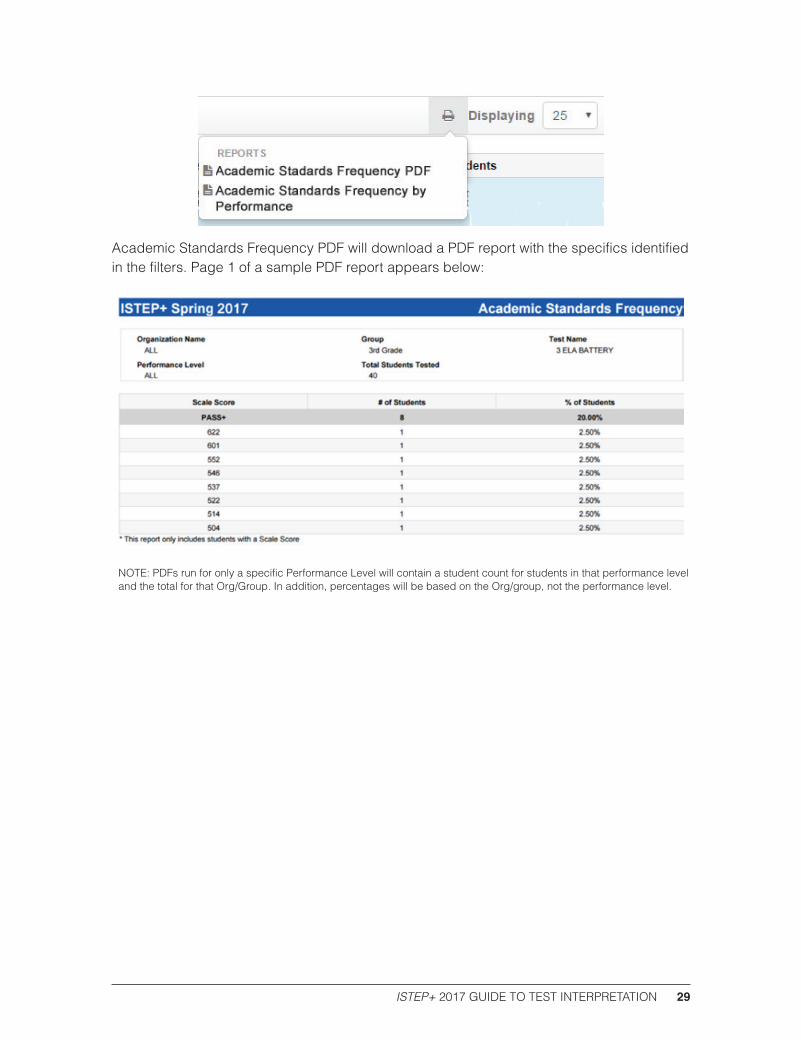
Academic Standards Frequency PDF will download a PDF report with the specifics identified in the filters. Page 1 of a sample PDF report appears below:
NOTE: PDFs run for only a specific Performance Level will contain a student count for students in that performance level and the total for that Org/Group. In addition, percentages will be based on the Org/group, not the performance level.

ISTEP+ 2017 GUIDE TO TEST INTERPRETATION30
Applied Skills Frequency DistributionThe purpose of the Applied Skills Frequency Distribution report is to provide educators, at the school level, the number and percentage of students who obtained each score point for the individual applied skills items. This information can be used to determine whether the students in your school show strengths or needs on specific applied skills items, and therefore, in the Academic Standards that are assessed by these items.
Indicates the program and Corporation/School.
Indicates the Grade and Subject.
Identifies the strand, section, and item number being scored.
Lists the total number of students tested.
Lists the number and percentage of students obtaining each score point.
Lists by condition code the number and percentage of students who did not receive a score.
ISTEP+ 2017 GUIDE TO TEST INTERPRETATION 31
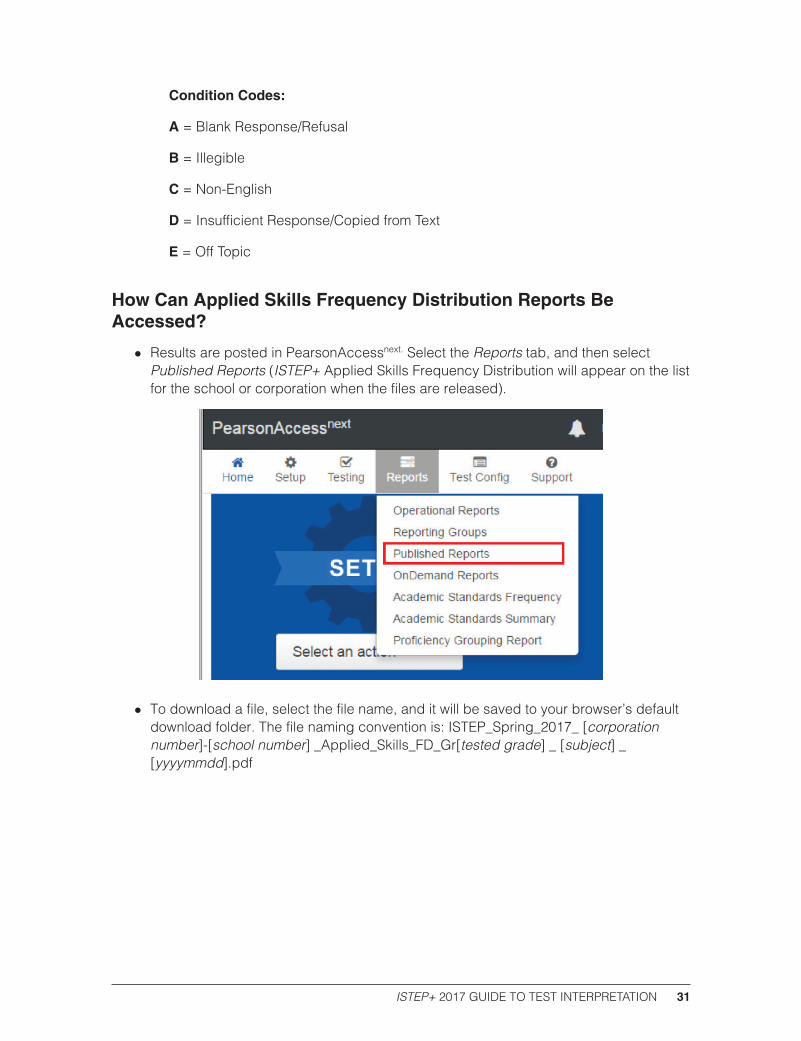
Condition Codes:
A = Blank Response/Refusal
B = Illegible
C = Non-English
D = Insufficient Response/Copied from Text
E = Off Topic
How Can Applied Skills Frequency Distribution Reports Be Accessed?
• Results are posted in PearsonAccessnext. Select the Reports tab, and then select Published Reports (ISTEP+ Applied Skills Frequency Distribution will appear on the list for the school or corporation when the files are released).
• To download a file, select the file name, and it will be saved to your browser’s default download folder. The file naming convention is: ISTEP_Spring_2017_ [corporation number]-[school number] _Applied_Skills_FD_Gr[tested grade] _ [subject] _ [yyyymmdd].pdf
ISTEP+ 2017 GUIDE TO TEST INTERPRETATION32
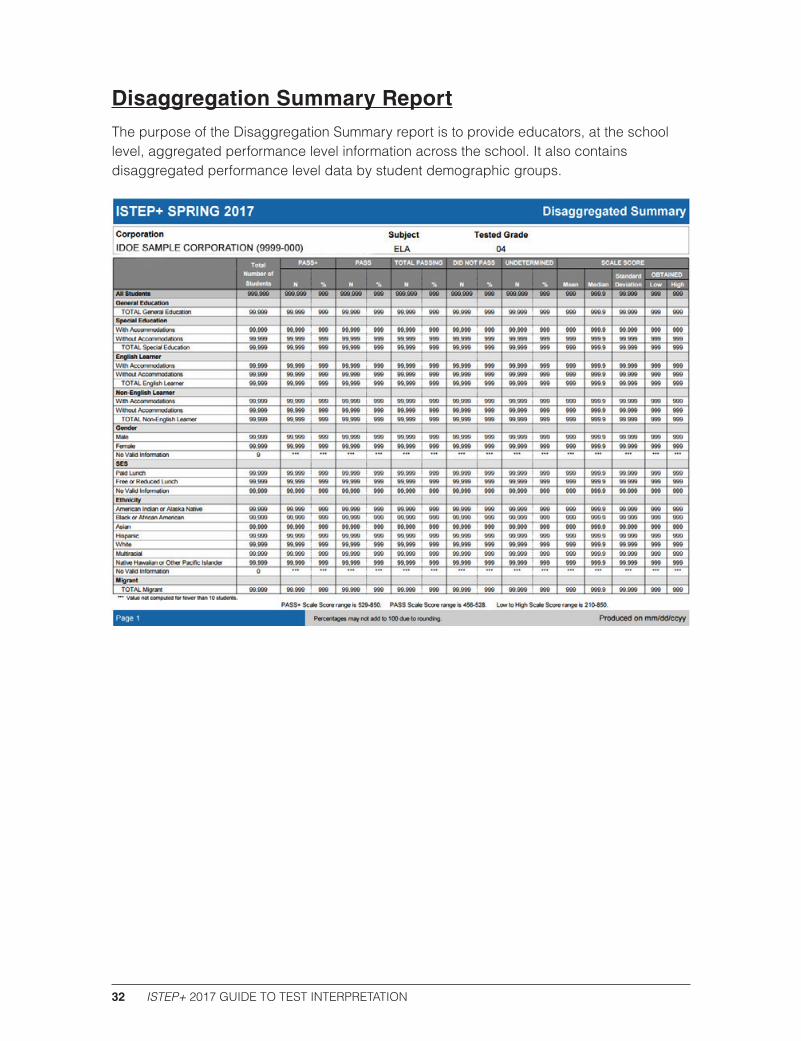
Disaggregation Summary ReportThe purpose of the Disaggregation Summary report is to provide educators, at the school level, aggregated performance level information across the school. It also contains disaggregated performance level data by student demographic groups.

ISTEP+ 2017 GUIDE TO TEST INTERPRETATION 33
How Can Disaggregation Summary Reports Be Accessed?
Results are posted in PearsonAccessnext. Select the Reports tab, and then select Published Reports (ISTEP+ Disaggregation Summary Report will appear on the list for the school or corporation when the files are released).
ISTEP+ 2017 GUIDE TO TEST INTERPRETATION34
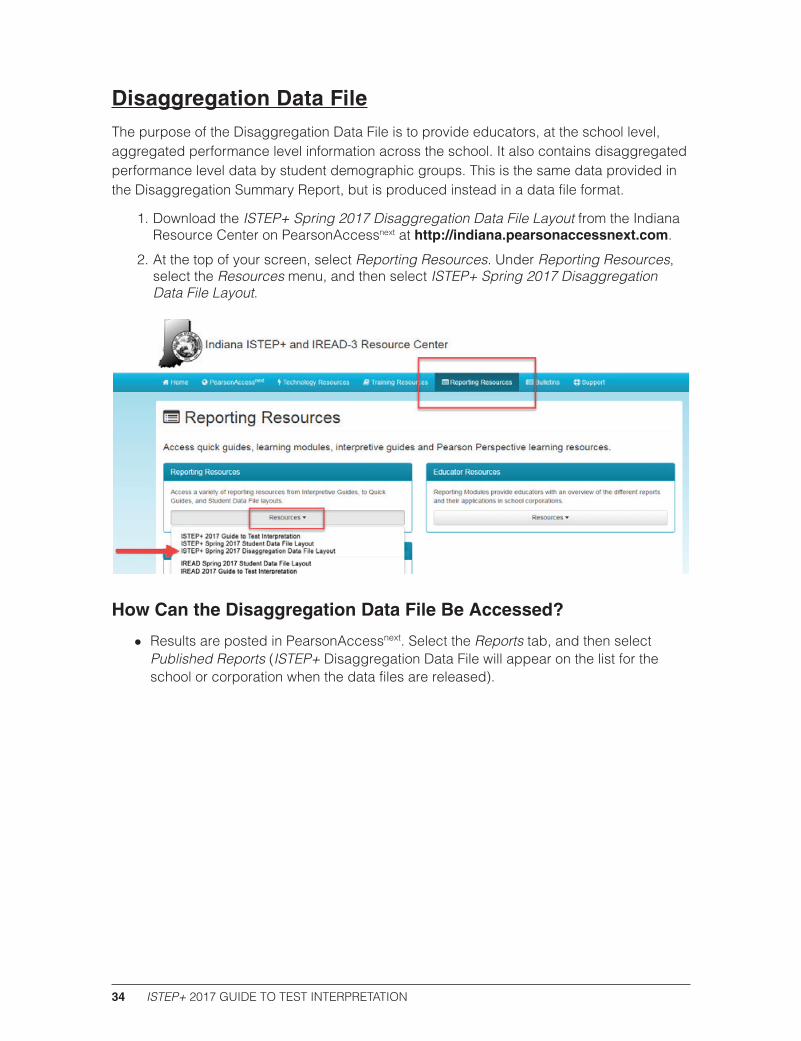
Disaggregation Data FileThe purpose of the Disaggregation Data File is to provide educators, at the school level, aggregated performance level information across the school. It also contains disaggregated performance level data by student demographic groups. This is the same data provided in the Disaggregation Summary Report, but is produced instead in a data file format.
1. Download the ISTEP+ Spring 2017 Disaggregation Data File Layout from the Indiana Resource Center on PearsonAccessnext at http://indiana.pearsonaccessnext.com.
2. At the top of your screen, select Reporting Resources. Under Reporting Resources, select the Resources menu, and then select ISTEP+ Spring 2017 Disaggregation Data File Layout.
How Can the Disaggregation Data File Be Accessed?
• Results are posted in PearsonAccessnext. Select the Reports tab, and then select Published Reports (ISTEP+ Disaggregation Data File will appear on the list for the school or corporation when the data files are released).

ISTEP+ 2017 GUIDE TO TEST INTERPRETATION 35
• To download a file, select the file name, and it will be saved to your browser’s default download folder. The file naming convention is: ISTEP_Spring_2017_ [corporation number]-[school number] _Disaggregation_File_Gr[tested grade]_[yyyymmdd].pdf

ISTEP+ 2017 GUIDE TO TEST INTERPRETATION36
Proficiency Summary ReportThe purpose of the Proficiency Summary Report is to provide educators with summary information for each performance level, by content area within your organization, facilitating comparisons. Teachers are provided with access to their assigned reporting group’s results. The data are presented for analysis and can be used, along with other resources, to evaluate and plan educational priorities.
Features of the ISTEP+ Proficiency Summary Report
Identifies the Corporation and/or School.
Identifies the Test Name.
Identifies the Reporting Group.
Provides performance level information at the State, Corporation, School, and Group Level.
How Can OnDemand Reports Be Accessed?
Results are posted in PearsonAccessnext. To access reports, use the following steps.
1. Select the Reports tab, and then select Proficiency Summary Report.

ISTEP+ 2017 GUIDE TO TEST INTERPRETATION 37
Download the Proficiency Summary Report
You may download a PDF version of the Proficiency Summary Report by selecting the Print button in the upper right corner of your screen.
On the following page is a sample PDF of the Proficiency Summary Report.

ISTEP+ 2017 GUIDE TO TEST INTERPRETATION38
Identifies the Corporation and/or School.
Identifies the Reporting Group.
Identifies the Test Name.
Provides performance level information at the State, Corporation, School, and Group Level.

ISTEP+ 2017 GUIDE TO TEST INTERPRETATION 39
Proficiency Grouping Report
Summary View
The purpose of the Proficiency Grouping Report’s summary view is to provide the total number/percentage of students by performance levels by subject, providing educators with overall performance data for their organization.
The number of students displayed is based on the specific organization and the tested grade selected.
The summary view can be downloaded as a PDF.
Identifies the Corporation and/or School.
Identifies the Group.
Identifies the Tested Grade.
Provides content area summary information for the organization.

ISTEP+ 2017 GUIDE TO TEST INTERPRETATION40
PDF View of the Proficiency Grouping Report
Identifies the Corporation and/or School.
Identifies the Group.
Identifies the Tested Grade.
Identifies the Proficiency Grouping.
Displays the number of students and the percentage based on the filters selected.

ISTEP+ 2017 GUIDE TO TEST INTERPRETATION 41
Detailed View
The detail version of this report is based on the Groups of students the user is associated with. Users can drill into this version by selecting a Group within their organization. This report groups students according to performance levels for English/Language Arts and Mathematics assessed by ISTEP+.
The columns report performance levels by content area, while the rows indicate the specific student. The students are alphabetical within each grouping.
Both the Summary and Detail version of this report can also be downloaded as a PDF.
Identifies the Corporation and/or School.
Identifies the Group.
Identifies the Tested Grade.
Identifies the Proficiency Grouping.
The columns report performance level by content area.
Lists students alphabetically within performance levels for both content areas.
Indicates the number of students.
ISTEP+ 2017 GUIDE TO TEST INTERPRETATION42
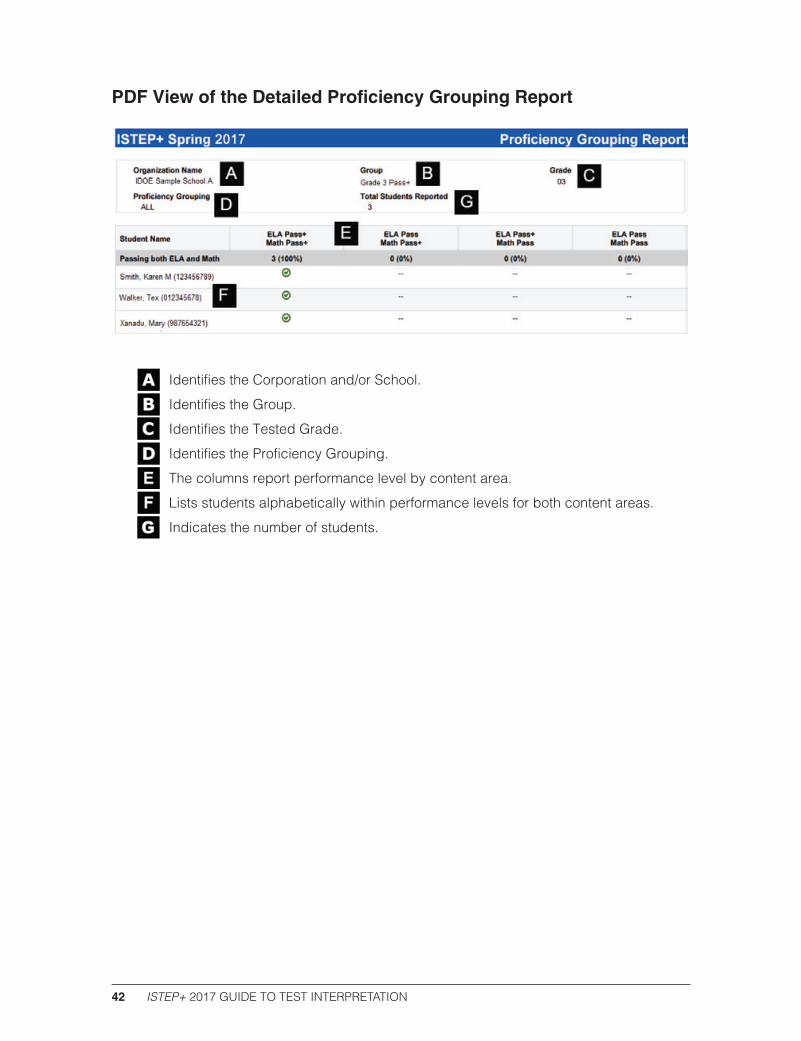
PDF View of the Detailed Proficiency Grouping Report
Identifies the Corporation and/or School.
Identifies the Group.
Identifies the Tested Grade.
Identifies the Proficiency Grouping.
The columns report performance level by content area.
Lists students alphabetically within performance levels for both content areas.
Indicates the number of students.

ISTEP+ 2017 GUIDE TO TEST INTERPRETATION 43
How Can Proficiency Grouping Reports Be Accessed?
• Results are posted in PearsonAccessnext. Select the Reports tab, and then select Proficiency Grouping Report.
• For CTC and STC users, results for the students in your organization will appear by specific Tested Grade.
You can also narrow down the list of results by using the Filters to search by Organization Name, Group and Tested Grade.
• Organization Name: Displays quantity of students only in the selected school(s) or corporation
• Group: Displays summary results for students who are members of the selected reporting group(s)
• Tested Grade: Displays results by test
Download the Proficiency Grouping Report Test Results
Based on the filters selected above for Organization Name, Tested Grade, and/or Group, select the printer icon to print or download report results.

ISTEP+ 2017 GUIDE TO TEST INTERPRETATION44
Below is a sample PDF of the Proficiency Grouping Report:
View Detailed Proficiency Level Test Results
As a CTC or STC user, to view detailed information for a specific student or group, select a group within the Group drop-down. (Please note that Teacher Level users will default to the detailed version of the report based on the Group(s) of students they are associated with for their specific organizations.)
Users can toggle to different views by selecting different Proficiency Groupings. The list in the drop-down includes the following:
• Passing
• Passing English/Language Arts
• Passing Mathematics
• Not Passing or Undetermined

ISTEP+ 2017 GUIDE TO TEST INTERPRETATION 45
Download Detailed Proficiency Level Test Results
Based on the filters selected above for Organization Name, Group, Tested Grade, and Proficiency Grouping, select the printer icon to download report results. Users can select the Proficiency Grouping Report or the Proficiency by Grouping Report.
Below is a sample PDF of the Proficiency Grouping Report:

ISTEP+ 2017 GUIDE TO TEST INTERPRETATION46
Rescore ReportThe purpose of the Rescore Report is to provide educators with records of open-ended items for students where rescores were requested. One record is provided for each rescored item within the report.
How Can the Rescore Report Be Accessed?
Results are posted in PearsonAccessnext. Select the Reports tab, and then select Published Reports (ISTEP+ Rescore Report will appear on the list for the school or corporation when the data files are released).

ISTEP+ 2017 GUIDE TO TEST INTERPRETATION 47
Reference
Glossary Criterion-Referenced Test
A test that reports students’ scores relative to the Indiana Academic Standards.
Cut Scores
Cut scores are scale scores that separate and define the performance levels. The cut scores define three general levels of knowledge and skill as follows:
Pass+: The student who scores at or above the Pass+ cut score in English/Language Arts, Mathematics, Science, and/or Social Studies is high-achieving in these subjects.
Pass: The student who scores at or above the Pass cut score in English/Language Arts, Mathematics, Science, and/or Social Studies demonstrates proficiency in these subjects.
Did Not Pass: The student who scores below the Pass cut score may require remedial assistance to be successful at the current grade level.
In addition, the category “Undetermined” is reported for any student whose ISTEP+ scores for English/Language Arts, Mathematics, Science, and/or Social Studies are incomplete. A student is reported “Undetermined” if all or part of a test was not taken, was considered invalid by the school, or was not received by the test vendor.
Indiana Academic Standards
To promote student academic achievement, the Indiana State Board of Education has adopted challenging standards. These standards are defined by a description of what students should know and be able to do at their grade levels.
Indiana Performance Index (IPI)
The Indiana Performance Index is an indication of a student’s performance on the individual Academic Standards that are measured by ISTEP+. It represents the expected number of items that the student would have answered correctly if the student had taken 100 similar items for the specific Academic Standard.
Indiana Scale Score
Student achievement levels relative to the Indiana Academic Standards are reported by ISTEP+ scale scores. These three-digit, equal-interval scores are expressed on a vertical scale by content area (English/Language Arts and Mathematics). ISTEP+ scale scores typically will range from about 100 to about 800.
Mean
The mean is the arithmetic average of a group of scores. It is calculated by adding the scores and dividing the sum by the number of scores.

ISTEP+ 2017 GUIDE TO TEST INTERPRETATION48
Median
The median is the score below which 50% of cases fall. The median and the 50th percentile are the same.
Number-Correct Scoring
A scoring procedure that involves adding up students’ scores on the test questions in a test.
Pattern Scoring
A procedure for assigning students’ scale scores that involves considering the pattern of students’ scores on the questions in a test as well as certain statistical characteristics of the questions.
Performance Levels
For ISTEP+, student achievement is reported in terms of three performance levels: Pass+, Pass, and Did Not Pass.
Raw Score
A student’s observed score on a test (i.e., the number correct). While raw scores do have some usefulness, they should not be used to make comparisons between performances on different tests unless other information about the characteristics of each test is known.
Standard Deviation (SD)
A statistic that indicates the amount of variability in a group of scores. When scores are normally distributed (i.e., when they are part of a bell-shaped, “normal” curve), about two-thirds of the scores are within one SD above and below the average (mean) score, and about 95% of scores are within two SDs of the mean. In almost any shaped distribution, all scores will be within five SDs of the mean score.
Standardized Test
A test administered in accordance with explicit directions for uniform administration.
Test Section
A subtest within a given content area.
Undetermined
A scoring category for students whose ISTEP+ English/Language Arts, Mathematics, Science, and/or Social Studies scores are incomplete (i.e., all or part of the test was not taken, was considered invalid by the school, or was not received by the test vendor).
Guide to Test Interpretation ISTEP+
Indiana Department of Education


![New istep.org - SHURAshura.shu.ac.uk/10663/1/iStepWebsiteOverview.pdf · 2018. 5. 12. · iStep Website [istep.org.uk] Introduction iStep is an initiative developed by Sheffield Hallam](https://img.pdfslide.net/doc/110x75/605451634a07bd5c177b2250/new-isteporg-2018-5-12-istep-website-isteporguk-introduction-istep-is.jpg)