Embed Size (px)
Citation preview
2017 North American Distribution Grid Monitoring
New Product Innovation Award
NORTH AMERICAN DISTRIBUTION GRID MONITORING
NEW PRODUCT INNOVATION AWARD
2017
BEST PRACTICES RESEARCH
© Frost & Sullivan 2017 2 “We Accelerate Growth”
Contents
Background and Company Performance .................................................................................... 3
Industry Challenges ......................................................................................................... 3
New Product Attributes and Customer Impact ...................................................................... 4
Conclusion ..................................................................................................................... 6
Significance of New Product Innovation ..................................................................................... 8
Understanding New Product Innovation ..................................................................................... 8
Key Benchmarking Criteria ............................................................................................... 9
New Product Attributes .................................................................................................... 9
Customer Impact ............................................................................................................ 9
Best Practices Recognition: 10 Steps to Researching, Identifying, and Recognizing Best Practices ..... 10
The Intersection between 360-Degree Research and Best Practices Awards ................................... 10
Research Methodology .................................................................................................... 10
About Frost & Sullivan ........................................................................................................... 10
BEST PRACTICES RESEARCH
© Frost & Sullivan 2017 3 “We Accelerate Growth”
Background and Company Performance
Industry Challenges
Across the globe, existing grid infrastructure is timeworn and built only to support unidirectional power flow, from generation to distribution. This leads to a number of problems including frequent line faults, outages, increasing downtime to clear these faults, and difficulties adding new renewable sources.
Because the existing grid design allows only for a one-way power flow from generation to the end user or consumer, safely adding distributed energy resources (DERs) such as roof-top solar, building integrated photovoltaics (BIPV), and microgrids proves more and more difficult as DER penetration grows, especially at the end user level. Nonetheless, addition of these sources leads to the desired two-way power flow, with power injection happening from both the distribution and end user levels. Unsuited for two-way power flow, existing grid components experience problems such as back-feeding and unreliable operation due to increased harmonic content. As more of these solutions are integrated, making the grid reliable and secure becomes critical to enable the protected flow of two-way power - which, as recent research from the University of Stanford shows, should reduce consumer electric bills by up to 50% in the future
Monitoring and data management play a crucial role in enabling reliable two-way power flow while the frequency and duration of outages largely determine the efficiency of a utility. Estimates suggest that even in developed regions such as North America, the utilities deal with approximately 4 to 5 fault-related outages each calendar day. Monitoring aging power infrastructure and identifying its operational lifetime, therefore, are intrinsic to determining and eventually improving grid performance and reliability.
The Solution
The Grid Analytics System is a consummate grid monitoring solution developed by Sentient Energy, Inc. (Sentient Energy). This system orchestrates the unified functioning of a group of monitoring and analytics platforms from Sentient Energy to leverage each solution’s unique advantages. It comprises the MM3™ Line Monitoring Sensors Platform, the ZM1™ Zero Amperage Grid Monitor, and the Ample® Analytics Platform, soon to be joined by the UM3™ Monitor for underground electric distribution. The MM3™ sensors collect data related to voltage, current, and temperature. The MM3™ fault monitoring app detects and reports faults whereas the GPS-enabled sensor helps the monitoring crew locate the fault with great accuracy. The ZM1™ line monitors can be deployed at grid locations such as lateral lines with low current, where, due to the increased exposure of smaller and older circuits to vegetation and animals in close proximity , t faults are more prominent and have longer outage times. Both sensor solutions are capable of operating in extreme climatic conditions. Last, the Ample Analytics Platform can be used in combination with a SCADA system or as a stand-alone monitoring and data analytics solution. The sensors collect high resolution, quality data related to disturbances and loading in the lines as well as fault details. They are distributed along the system at different levels and capture the maximum amount of data, which is sent to the Ample
BEST PRACTICES RESEARCH
© Frost & Sullivan 2017 4 “We Accelerate Growth”
Analytics Suite or to the end user’s SCADA system enabling more accurate decision making. They also help identify locations that need attention due to a high level of pre-fault electric disturbances and prompt proactive corrective measures to reduce the number of potential outages.
New Product Attributes and Customer Impact
Match to Needs
The Grid Analytics System delivers more accurate sensing and wider line performance data than existing line monitoring solutions, all in one system. Ultimately, Sentient Energy makes energy grids reliable, safe and solar ready. The company’s sensor solutions find deployment in overhead feeder and lateral lines as well as underground cables. In addition to fault detection, the sensors also provide loading details and monitor both power flow and direction. The Grid Analytics System helps in determining the direction of power flow, which is an important parameter to observe when adding solutions like roof-top solar and commercial electric storage. This will help address challenges including power backflow, which is a daily phenomenon in the growing two-way grid infrastructure. The utilities are provided with real-time information related to power flow direction that can help them manage the grid and solar generation effectively. Real-time data is critical to manage the grid based on factual measurements not computer models, minimizing outages and downtime.
The company differentiates itself by offering monitoring solutions for all grid locations including both overhead and underground cable solutions whereas most competing solution providers deliver monitoring options for overhead lines alone, not for underground cables. This flexibility is particularly useful for utilities operating in cities such Chicago and New York, where the dominance of underground power infrastructure like UG cables is very high. Frost & Sullivan research finds that Sentient Energy edges past its competitors with this dual application capability.
Reliability
Among the platform’s future-ready design features is the sensors’ energy-harvesting capability, which improves reliability in terms of data collected and transmitted. The company is dedicated to reducing power outage frequency and duration, and, so far, it has successfully reduced outage duration indices (SAIDI) by 8 to 20%. The Grid Analytics System’s capability to monitor the two-way power flow and its direction effectively includes managing the DERs that are added to the grid at the distribution level. Moreover, the system’s predictive analytics helps prevent outages by alerting the grid about equipment health in real time. These systems are built to operate harmoniously with DERMS making the DER and two-way power flow management easy and more efficient. Frost & Sullivan deems this a significant achievement in improving the reliability of distribution grids. In fact, deploying Grid Analytics Systems in developing regions such as India and Southeast Asian nations will lead to highly improved outage downtime reduction.
BEST PRACTICES RESEARCH
© Frost & Sullivan 2017 5 “We Accelerate Growth”
Quality
Sentient Energy customers can deploy the components or the building blocks of Grid Analytics as individual, stand-alone solutions or they can be deployed together as the Grid Analytics System. This means great freedom and options for the end user to choose from. For instance, end users can merely deploy the MM3™ sensors if they want to check the operational condition of the power lines or they can deploy the entire solution to get a more intricate view of the entire system. Another unique feature of the Grid Analytics System is its high-resolution waveform capture that has been further improved in the 2017 product versions. These sensors have been upgraded to deliver a resolution of about 130/156 samples per cycle in 60/50Hz systems, respectively, which is much higher when compared to the resolution provided by competitors. The high data resolution in combination with the analytics platform empowers utility companies to act proactively and reliably identify sections of the grid likely to face an issue in the near future. This knowledge sets Sentient's customers to proactively avoid outages and become more reliable.
Positioning
One distinct advantage of Sentient Energy’s Grid Analytics System over its competitors’ products is that it is highly scalable. The number of sensors that can be scaled up and connected to the analytics solution exceeds 30,000 in 2017; by contrast, competing platforms do not allow this degree of scalability. Also, the products that act as the building blocks of Grid Analytics System, the sensors and the Ample Analytics Platform, are capable of communicating with solutions other than cellular connections (e.g., 3G and 4G LTE). In fact, they are designed to communicate via the mesh networks of Landis + Gyr as well as operating on Silver Spring Networks. This flexibility gives Sentient Energy a clear edge over its closest market competitors, considering 60 to 80% of utilities have opted for communication solutions other than cellular.
Design
The resolution of data captured by the sensors is very high, approximately 10 times that of most competing products. Resolution corresponds with more data collected at shorter intervals. This is particularly useful during the fault conditions where fast sensing in terms of micro- to milli-seconds is critical while the sampling is done at a rate of 130 samples per cycle, functions that help utilities achieve better resolution in terms of distribution line performance. In particular, the Ample Analytics Platform stores data and provides customers with actionable insights to keep the lines and eventually the distribution system healthy. The platform has been designed in such a way that it can complement an existing SCADA system or be used as a primary analysis platform in the absence of a SCADA system. This gives customers more flexibility to operate and monitor according to what is required.
BEST PRACTICES RESEARCH
© Frost & Sullivan 2017 6 “We Accelerate Growth”
Brand Equity
In a move to make its products more compatible with -utility communications networks, Sentient Energy has collaborated with leading communication and network solution providers Landis + Gyr, AT&T, and Silver Spring Networks. This effort helped improve Sentient Energy’s product performance while subsequently supporting these networking and communication options. Frost & Sullivan finds that this feature is not present among other products available in the market, which has made Sentient Energy a pursued favorite in the distribution grid management sector. With respect to collaboration with utilities players, Manitoba Hydro exemplifies a success case in opting to deploy Sentient Energy’s solution; Pacific Gas & Electric, Exelon, Dominion, BC Hydro and many other well-known utilities are engaged in pilots; and Southern California Edison and Florida Power & Light have embarked on or already concluded Sentient deployments using tens of thousands of Sentient sensors in each account One of the prominent activities observed by Frost & Sullivan is that the company has partnered with major utilities in both the United States and Canada, where the monitoring solution deployment has been expanding significantly.
Conclusion
The Grid Analytics System of Sentient Energy is a complete, future-ready solution. It brings in high resolution sensing, analytics, real-time alerts, and utility-favoring communication solutions with highly scalable options for the utilities. When compared to its competitors, Sentient Energy’s products—all of the products—capture data at a very high sample rate, providing customers with better visibility.
The company has also been collaborating with leading network and communication providers to make its products compatible with existing utility infrastructure and SCADA systems. Sentient Energy has established a strong presence in both the United States and Canada, which is evidence of the product line up’s growing popularity and customer-pleasing performance. In addition, utilities leaders including Southern California Edison and Florida Lights and Power deploy the company’s solutions. This innovative company’s dedicated efforts across the United States support its ever-growing network of sensors and grid monitoring solutions.
When compared to competing solutions the ability of Sentient Energy’s products to communicate with solutions beyond the conventional cellular options makes them more reliable and cost effective. The Grid Analytics System, given the sensors’ capabilities and the company’s decentralized sensor deployment approach, provides the utilities with data resolution that is 10 times better than what competitors deliver. This helps utilities deploying the Grid Analytics System identify abnormalities in the distribution network more accurately. Ultimately, Sentient Energy has developed and deployed a consummate grid monitoring system that enables unmatched proactive maintenance of the grid.
With its ability to minimize the occurrence of outages, predict locations requiring the attention of utilities, enable proactive corrective measures, and increase grid reliability, especially in terms of adding more distributed energy sources, Sentient Energy Inc. is recognized with Frost & Sullivan’s 2017 New Product Innovation Award.
BEST PRACTICES RESEARCH
© Frost & Sullivan 2017 7 “We Accelerate Growth”
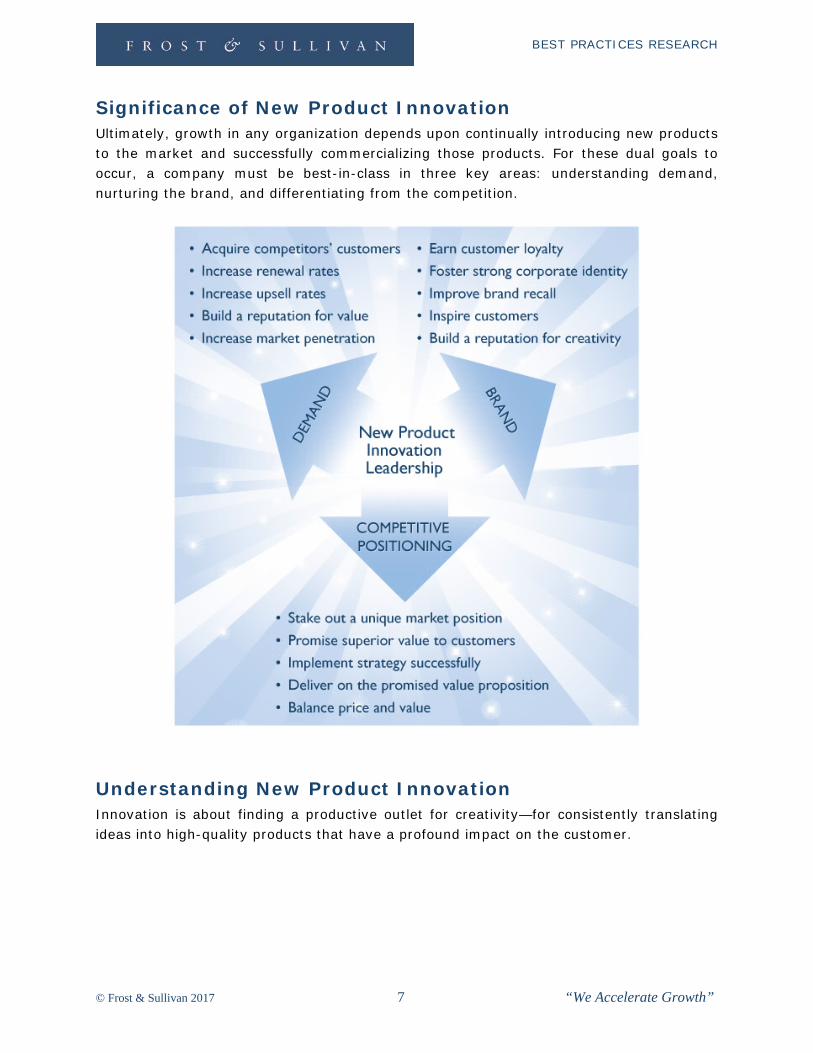
Significance of New Product Innovation Ultimately, growth in any organization depends upon continually introducing new products to the market and successfully commercializing those products. For these dual goals to occur, a company must be best-in-class in three key areas: understanding demand, nurturing the brand, and differentiating from the competition.
Understanding New Product Innovation Innovation is about finding a productive outlet for creativity—for consistently translating ideas into high-quality products that have a profound impact on the customer.
BEST PRACTICES RESEARCH
© Frost & Sullivan 2017 8 “We Accelerate Growth”
Key Benchmarking Criteria For the New Product Innovation Award, Frost & Sullivan analysts independently evaluated two key factors—New Product Attributes and Customer Impact—according to the criteria identified below.
New Product Attributes Criterion 1: Match to Needs Requirement: Customer needs directly influence and inspire the product’s design and positioning.
Criterion 2: Reliability Requirement: The product consistently meets or exceeds customer expectations for consistent performance during its entire life cycle.
Criterion 3: Quality Requirement: Product offers best-in-class quality, with a full complement of features and functionalities.
Criterion 4: Positioning Requirement: The product serves a unique, unmet need that competitors cannot easily replicate.
Criterion 5: Design Requirement: The product features an innovative design, enhancing both visual appeal and ease of use.
Customer Impact Criterion 1: Price/Performance Value Requirement: Products or services offer the best value for the price, compared to similar offerings in the market.
Criterion 2: Customer Purchase Experience Requirement: Customers feel they are buying the most optimal solution that addresses both their unique needs and their unique constraints.
Criterion 3: Customer Ownership Experience Requirement: Customers are proud to own the company’s product or service and have a positive experience throughout the life of the product or service.
Criterion 4: Customer Service Experience Requirement: Customer service is accessible, fast, stress-free, and of high quality.
Criterion 5: Brand Equity Requirement: Customers have a positive view of the brand and exhibit high brand loyalty.
BEST PRACTICES RESEARCH
© Frost & Sullivan 2017 9 “We Accelerate Growth”
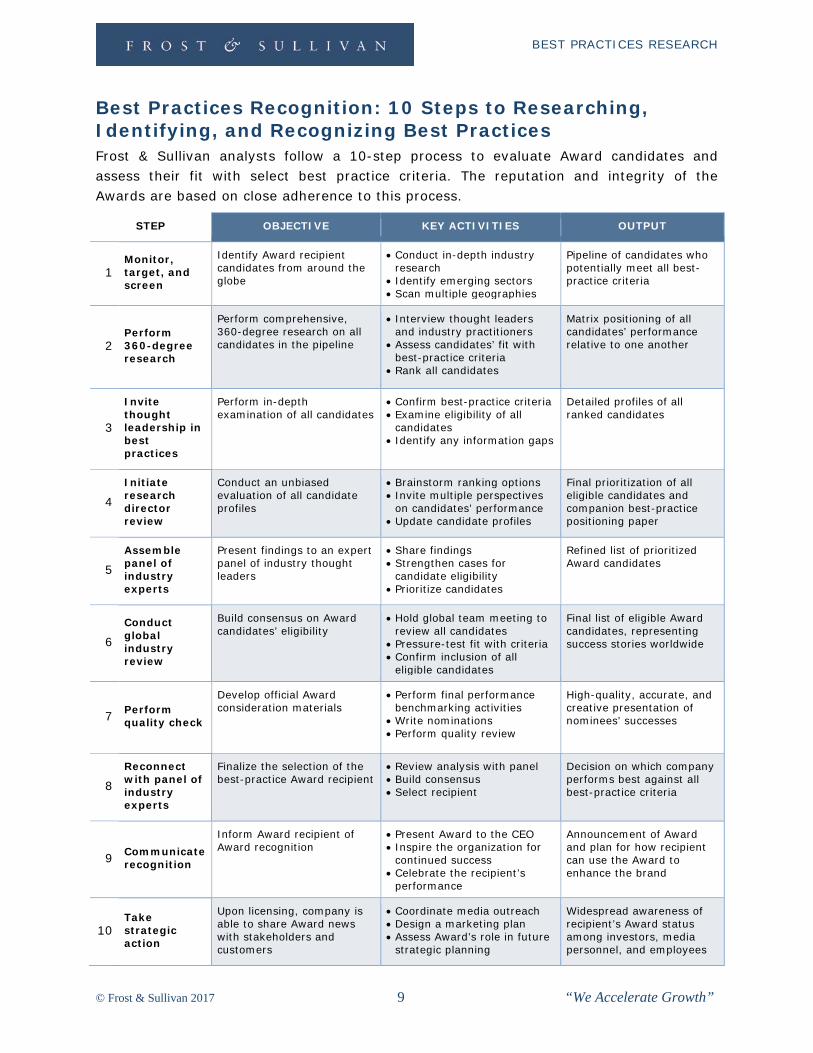
Best Practices Recognition: 10 Steps to Researching, Identifying, and Recognizing Best Practices Frost & Sullivan analysts follow a 10-step process to evaluate Award candidates and assess their fit with select best practice criteria. The reputation and integrity of the Awards are based on close adherence to this process.
STEP OBJECTIVE KEY ACTIVITIES OUTPUT
1 Monitor, target, and screen
Identify Award recipient candidates from around the globe
• Conduct in-depth industry research
• Identify emerging sectors • Scan multiple geographies
Pipeline of candidates who potentially meet all best-practice criteria
2 Perform 360-degree research
Perform comprehensive, 360-degree research on all candidates in the pipeline
• Interview thought leaders and industry practitioners
• Assess candidates’ fit with best-practice criteria
• Rank all candidates
Matrix positioning of all candidates’ performance relative to one another
3
Invite thought leadership in best practices
Perform in-depth examination of all candidates
• Confirm best-practice criteria • Examine eligibility of all
candidates • Identify any information gaps
Detailed profiles of all ranked candidates
4 Initiate research director review
Conduct an unbiased evaluation of all candidate profiles
• Brainstorm ranking options • Invite multiple perspectives
on candidates’ performance • Update candidate profiles
Final prioritization of all eligible candidates and companion best-practice positioning paper
5 Assemble panel of industry experts
Present findings to an expert panel of industry thought leaders
• Share findings • Strengthen cases for
candidate eligibility • Prioritize candidates
Refined list of prioritized Award candidates
6 Conduct global industry review
Build consensus on Award candidates’ eligibility
• Hold global team meeting to review all candidates
• Pressure-test fit with criteria • Confirm inclusion of all
eligible candidates
Final list of eligible Award candidates, representing success stories worldwide
7 Perform quality check
Develop official Award consideration materials
• Perform final performance benchmarking activities
• Write nominations • Perform quality review
High-quality, accurate, and creative presentation of nominees’ successes
8 Reconnect with panel of industry experts
Finalize the selection of the best-practice Award recipient
• Review analysis with panel • Build consensus • Select recipient
Decision on which company performs best against all best-practice criteria
9 Communicate recognition
Inform Award recipient of Award recognition
• Present Award to the CEO • Inspire the organization for
continued success • Celebrate the recipient’s
performance
Announcement of Award and plan for how recipient can use the Award to enhance the brand
10 Take strategic action
Upon licensing, company is able to share Award news with stakeholders and customers
• Coordinate media outreach • Design a marketing plan • Assess Award’s role in future
strategic planning
Widespread awareness of recipient’s Award status among investors, media personnel, and employees
BEST PRACTICES RESEARCH
© Frost & Sullivan 2017 10 “We Accelerate Growth”
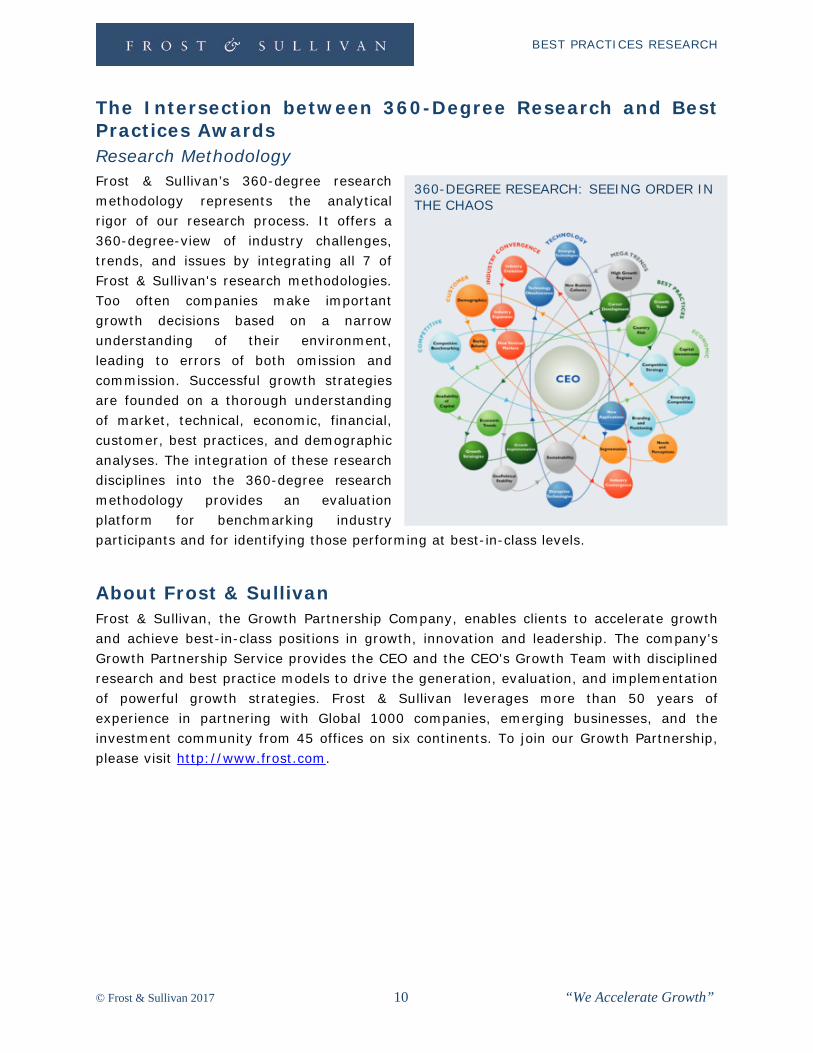
The Intersection between 360-Degree Research and Best Practices Awards Research Methodology Frost & Sullivan’s 360-degree research methodology represents the analytical rigor of our research process. It offers a 360-degree-view of industry challenges, trends, and issues by integrating all 7 of Frost & Sullivan's research methodologies. Too often companies make important growth decisions based on a narrow understanding of their environment, leading to errors of both omission and commission. Successful growth strategies are founded on a thorough understanding of market, technical, economic, financial, customer, best practices, and demographic analyses. The integration of these research disciplines into the 360-degree research methodology provides an evaluation platform for benchmarking industry participants and for identifying those performing at best-in-class levels.
About Frost & Sullivan Frost & Sullivan, the Growth Partnership Company, enables clients to accelerate growth and achieve best-in-class positions in growth, innovation and leadership. The company's Growth Partnership Service provides the CEO and the CEO's Growth Team with disciplined research and best practice models to drive the generation, evaluation, and implementation of powerful growth strategies. Frost & Sullivan leverages more than 50 years of experience in partnering with Global 1000 companies, emerging businesses, and the investment community from 45 offices on six continents. To join our Growth Partnership, please visit http://www.frost.com.
360-DEGREE RESEARCH: SEEING ORDER IN THE CHAOS