Embed Size (px)
Citation preview
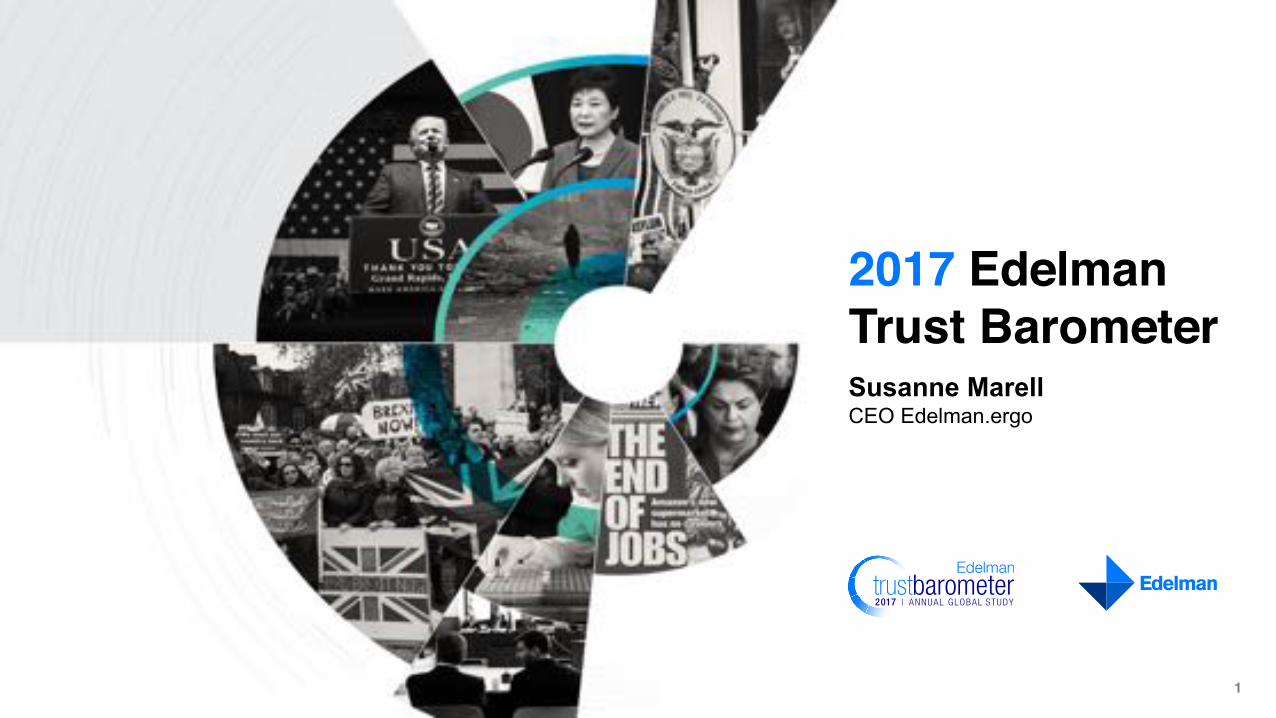
2017 Edelman Trust BarometerSusanne MarellCEO Edelman.ergo
1
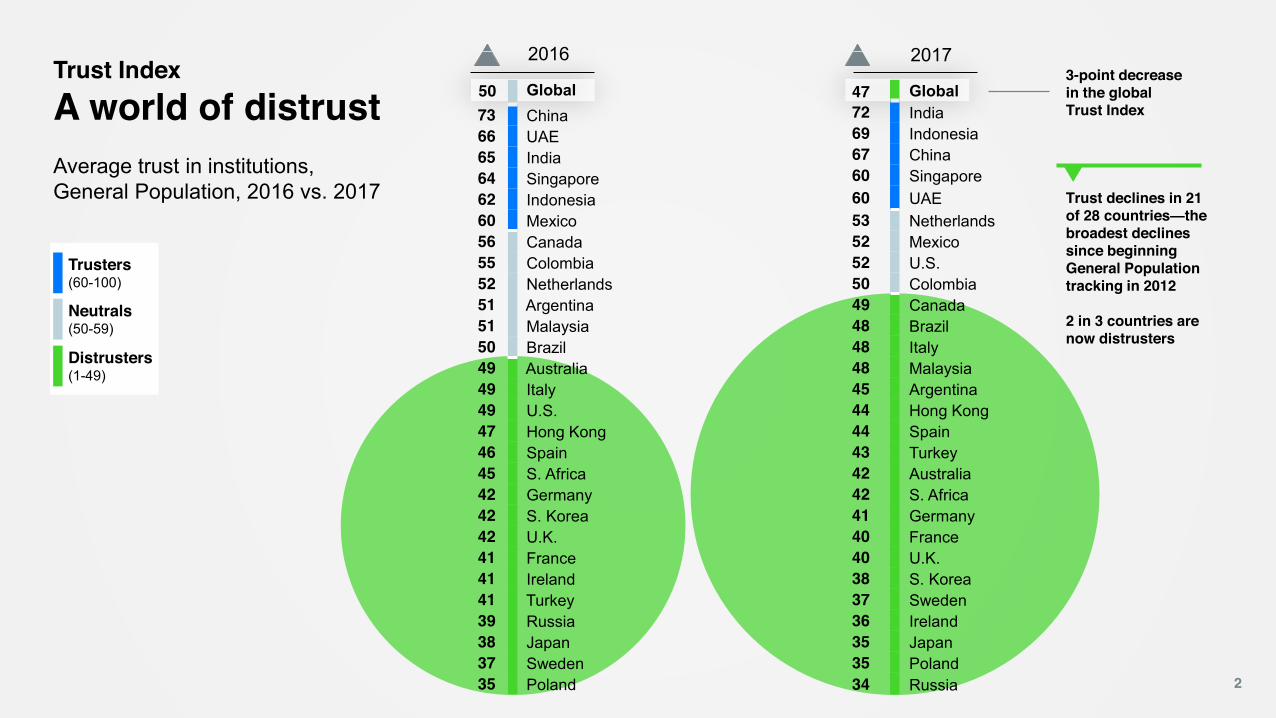
Trust IndexA world of distrustAverage trust in institutions, General Population, 2016 vs. 2017
2
47 Global72 India69 Indonesia67 China60 Singapore60 UAE53 Netherlands52 Mexico52 U.S.50 Colombia49 Canada48 Brazil48 Italy48 Malaysia45 Argentina44 Hong Kong44 Spain43 Turkey42 Australia42 S. Africa41 Germany40 France40 U.K.38 S. Korea37 Sweden36 Ireland35 Japan35 Poland34 Russia
2016 2017
50 Global73 China66 UAE65 India64 Singapore62 Indonesia60 Mexico56 Canada55 Colombia52 Netherlands51 Argentina51 Malaysia50 Brazil49 Australia49 Italy49 U.S.47 Hong Kong46 Spain45 S. Africa42 Germany42 S. Korea42 U.K.41 France41 Ireland41 Turkey39 Russia38 Japan37 Sweden35 Poland
Trusters(60-100)
Neutrals(50-59)
Distrusters (1-49)
3-point decrease in the global Trust Index
Trust declines in 21 of 28 countries—the broadest declines since beginning General Population tracking in 2012
2 in 3 countries are now distrusters
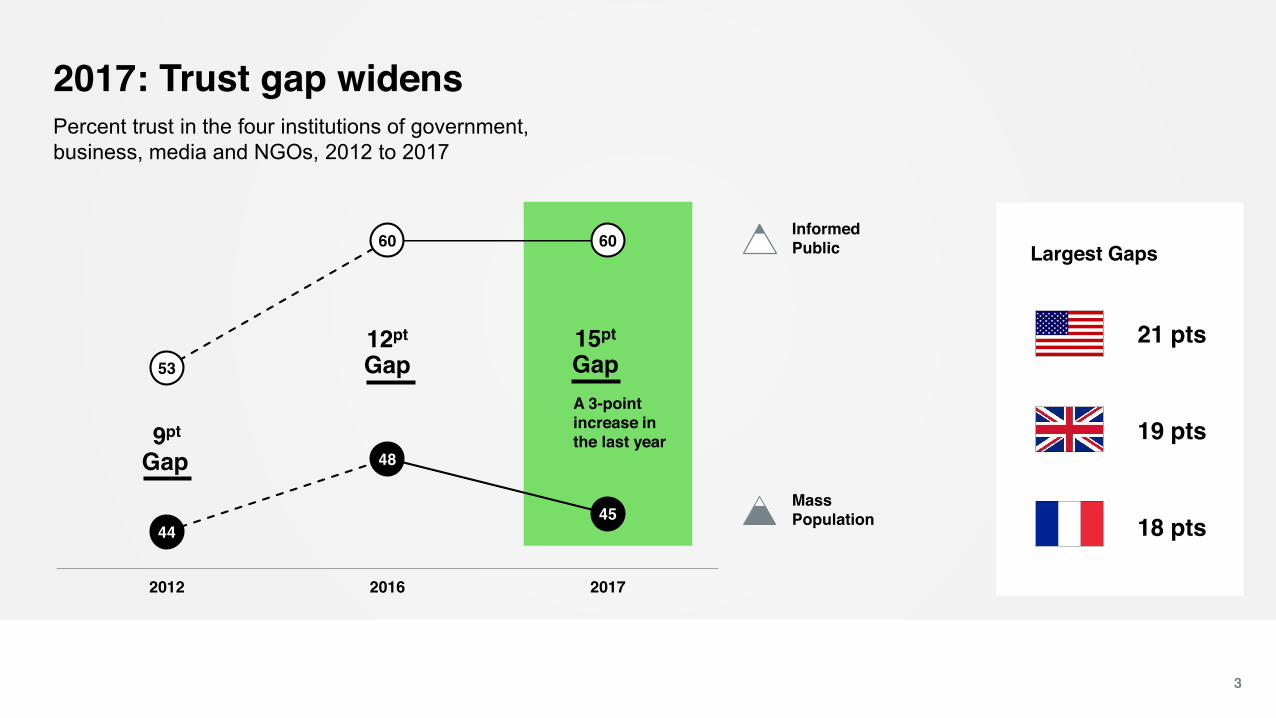
2017: Trust gap widens
3
Percent trust in the four institutions of government, business, media and NGOs, 2012 to 2017
21 pts
19 pts
18 pts
53
60 60
44
48
45
2012 2016 2017
Informed Public
15pt
Gap
9pt
Gap
A 3-point increase in the last year
12pt
Gap
Largest Gaps
MassPopulation
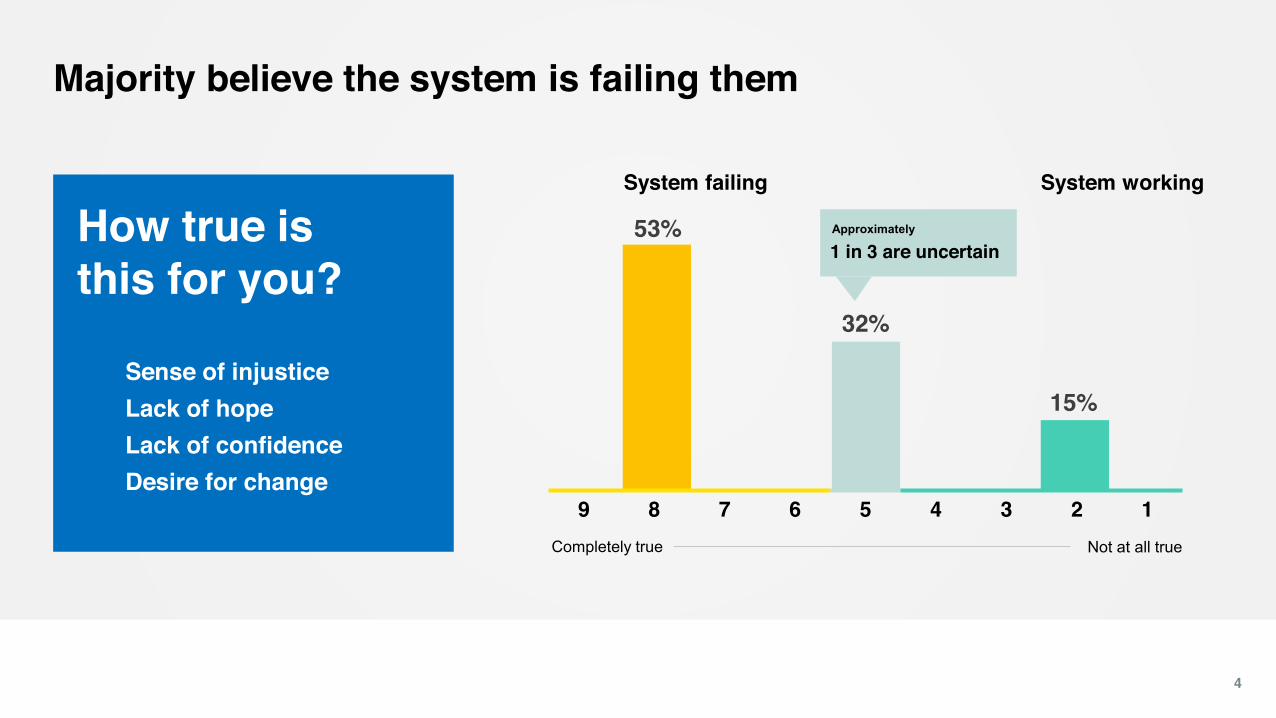
How true is this for you?
Sense of injustice Lack of hope Lack of confidence Desire for change
53%
32%
15%
Majority believe the system is failing them
4
Not at all true
9 8 7 6 5 4 3 2 1
1 in 3 are uncertain
Completely true
System failing System working
Approximately
5
Glo
bal
Fran
ce
Italy
Mex
ico
S. A
frica
Spai
n
Pola
nd
Braz
il
Col
ombi
a
Ger
man
y
U.K
.
Aust
ralia
Irela
nd
U.S
.
Net
herla
nds
Can
ada
Swed
en
Arge
ntin
a
Mal
aysi
a
Turk
ey
Rus
sia
S. K
orea
Indo
nesi
a
Japa
n
Indi
a
Hon
g Ko
ng
Sing
apor
e
Chi
na
UAE
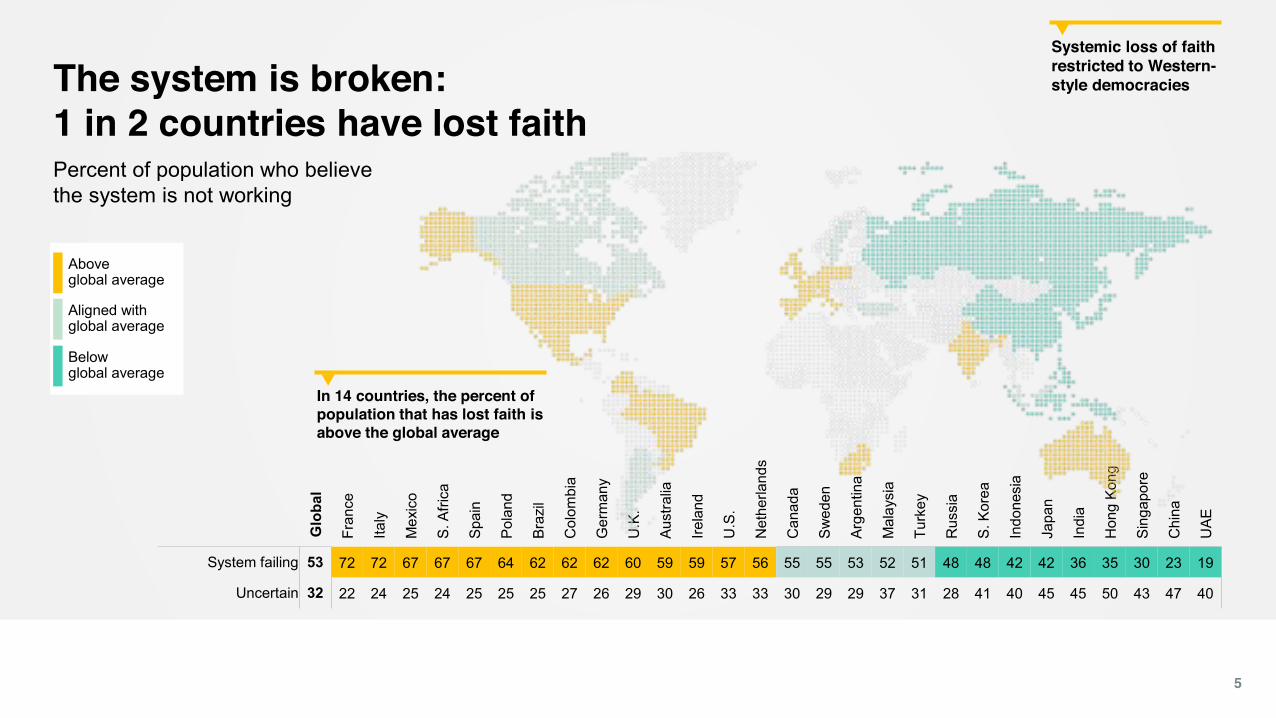
System failing 53 72 72 67 67 67 64 62 62 62 60 59 59 57 56 55 55 53 52 51 48 48 42 42 36 35 30 23 19
Uncertain 32 22 24 25 24 25 25 25 27 26 29 30 26 33 33 30 29 29 37 31 28 41 40 45 45 50 43 47 40
In 14 countries, the percent of population that has lost faith is above the global average
Systemic loss of faith restricted to Western-style democraciesThe system is broken:
1 in 2 countries have lost faithPercent of population who believethe system is not working
Above global average
Aligned withglobal average
Belowglobal average
6
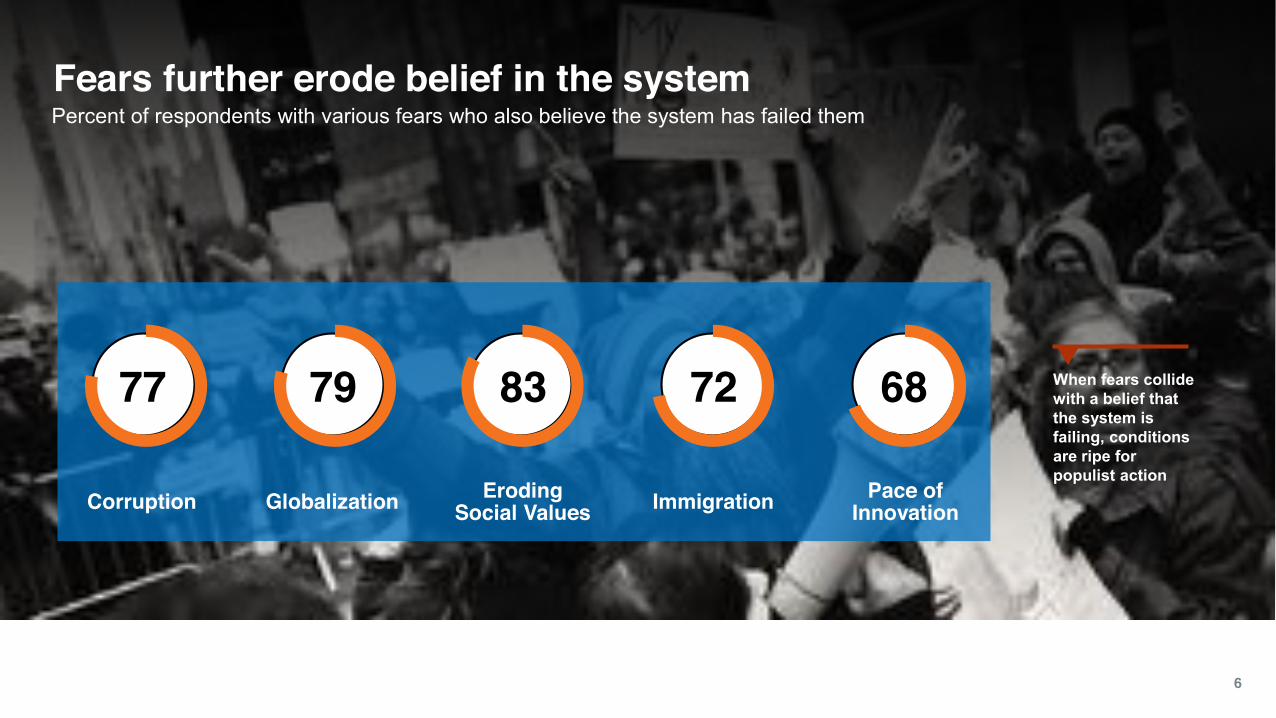
Fears further erode belief in the systemPercent of respondents with various fears who also believe the system has failed them
When fears collide with a belief that the system is failing, conditions are ripe for populist action
Corruption Globalization ErodingSocial Values Immigration Pace of
Innovation
77 79 83 72 68

55 5348
4253 52
43 41
Trust in crisis: All four institutions lose
8
Percent trust in the four institutions of government, business, media and NGOs, 2016 vs. 2017
Business MediaNGOs Government
Two of four institutions distrusted
50%Neutral
Trusted
Distrusted
-2 -1 -5 -1
20172016
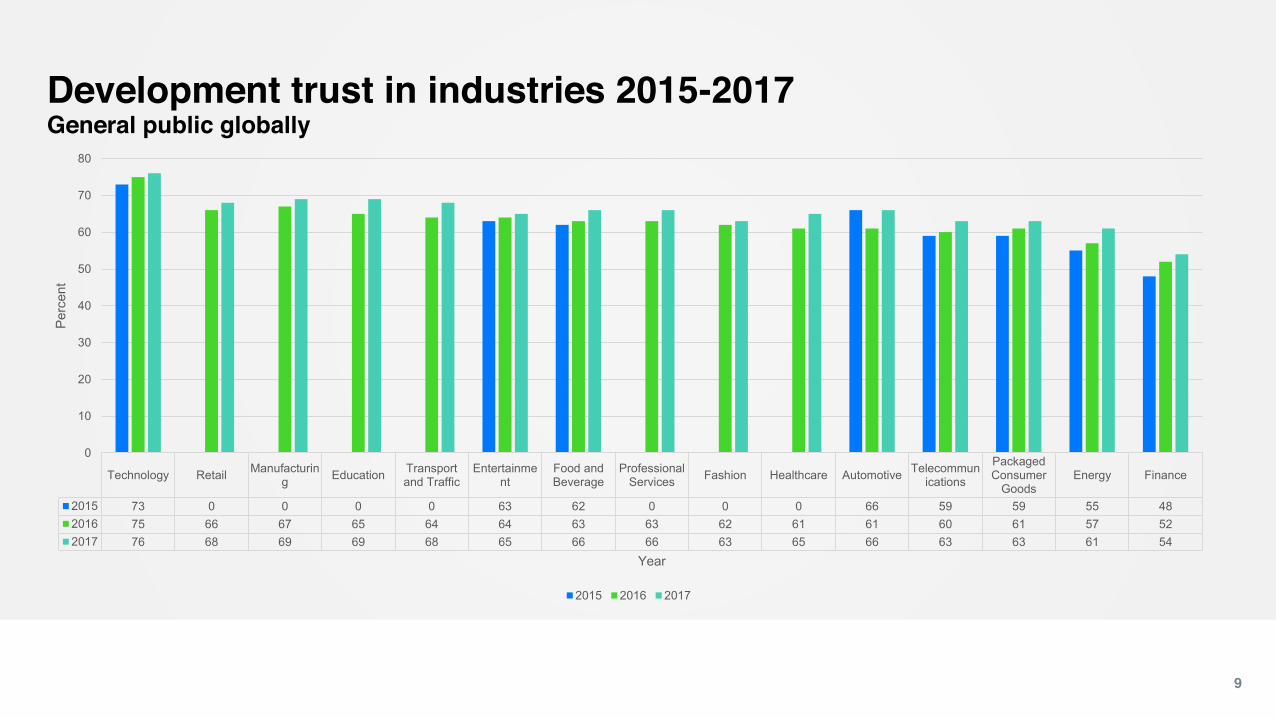
Technology Retail Manufacturing Education Transport
and TrafficEntertainme
ntFood andBeverage
ProfessionalServices Fashion Healthcare Automotive Telecommun
ications
PackagedConsumer
GoodsEnergy Finance
2015 73 0 0 0 0 63 62 0 0 0 66 59 59 55 482016 75 66 67 65 64 64 63 63 62 61 61 60 61 57 522017 76 68 69 69 68 65 66 66 63 65 66 63 63 61 54
0
10
20
30
40
50
60
70
80
Perc
ent
Year
Development trust in industries 2015-2017General public globally
2015 2016 2017
9
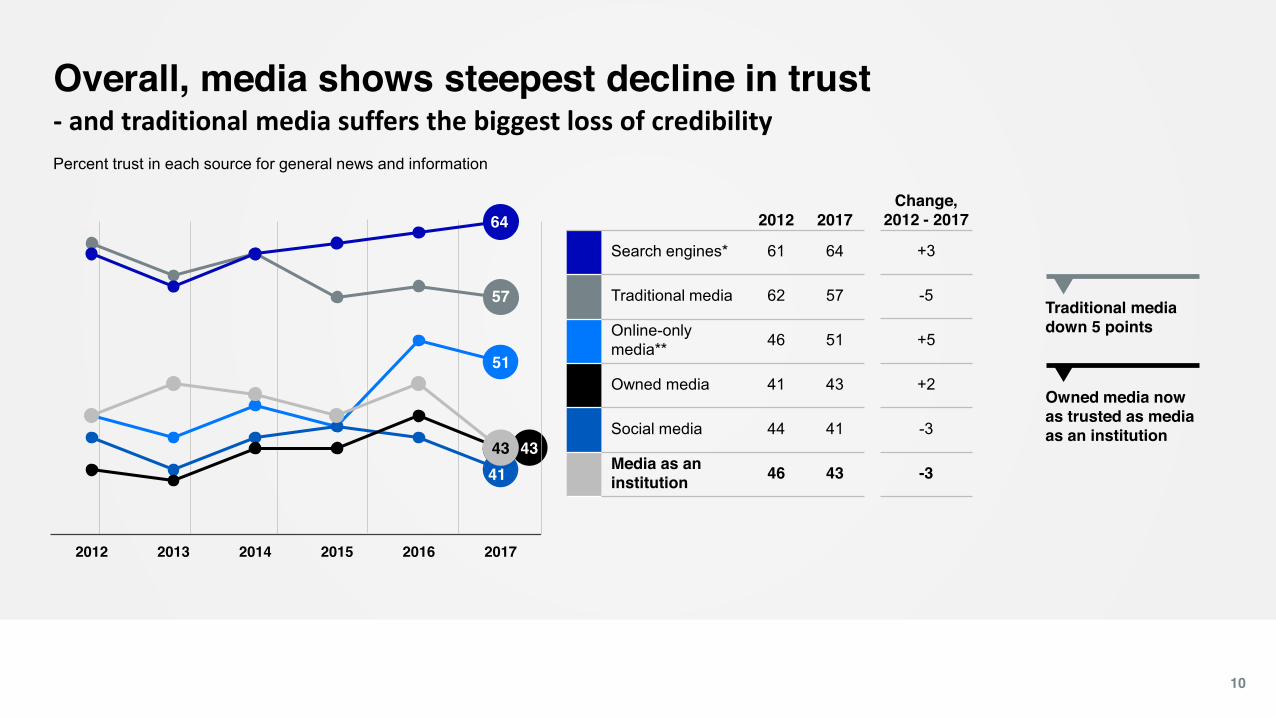
43
2012 2017
Search engines* 61 64
Traditional media 62 57
Online-onlymedia** 46 51
Owned media 41 43
Social media 44 41
Media as an institution 46 43
57
51
41
64
2012 2013 2014 2015 2016 2017
Overall, media shows steepest decline in trust- and traditional media suffers the biggest loss of credibility
Percent trust in each source for general news and information
10
Change,2012 - 2017
+3
-5
+5
+2
-3
-3
Owned media now as trusted as media as an institution
Traditional media down 5 points
43

11
People tend to get caught in “The Echo Chamber”
Facts matter less Bias is the filter No humans needed
1 in 2 agree
“I would support politicians I trust to make things better for me and my family even if they exaggerated the truth”
53%Do not regularly listen to people or organizations with whom they often disagree
Nearly
4x more likelyto ignore information that supports a position they do not believe in
More likely to believe
59%Search Engines
41%Human Editors
53%52% Never or rarely change their position on important social issues
Nearly
13
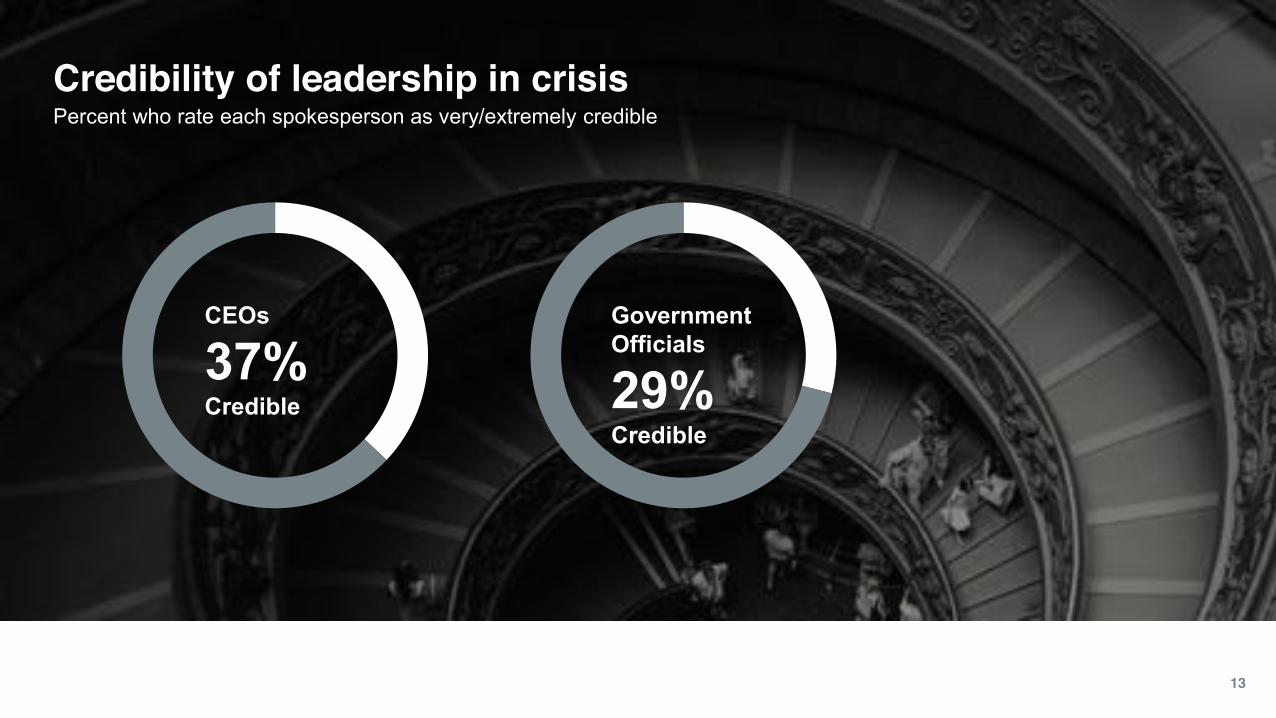
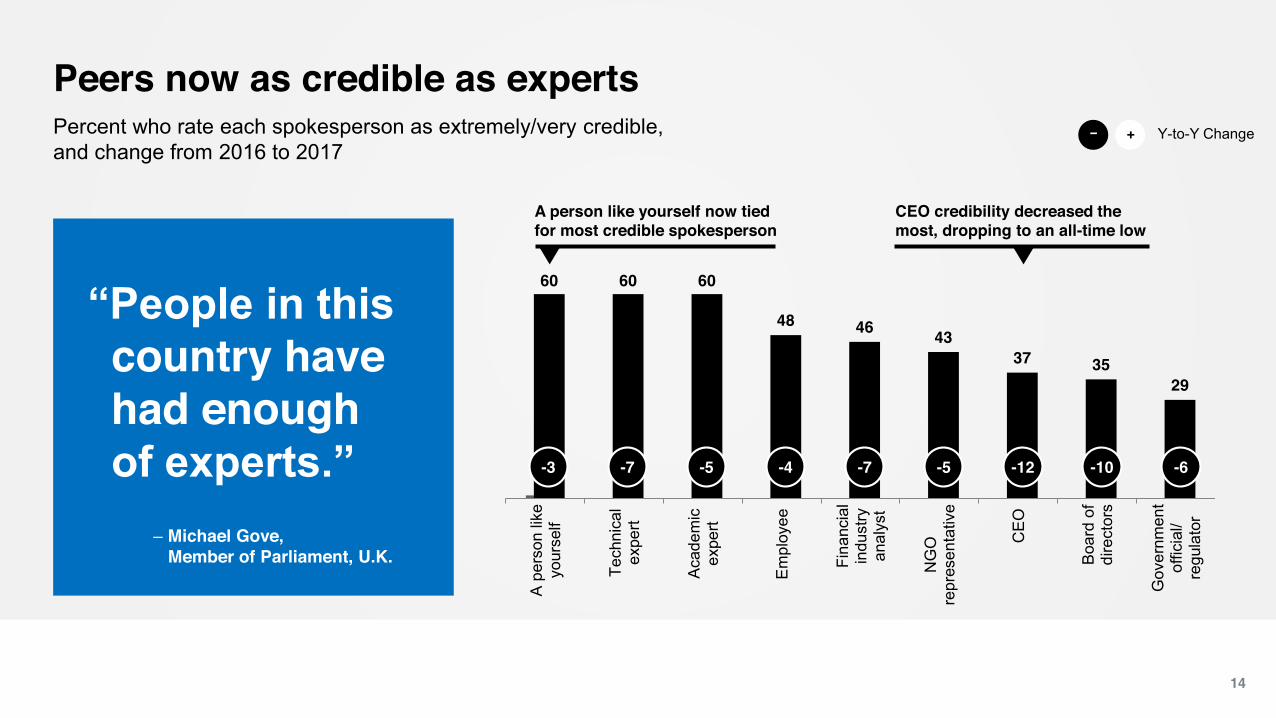
Credibility of leadership in crisisPercent who rate each spokesperson as very/extremely credible
CEOs
37% Credible
Government Officials
29% Credible
1
60 60 60
48 46 4337 35
29
A p
erso
n lik
eyo
urse
lf
Tech
nica
lex
pert
Aca
dem
icex
pert
Em
ploy
ee
Fina
ncia
lin
dust
ryan
alys
t
NG
Ore
pres
enta
tive
CE
O
Boa
rd o
fdi
rect
ors
Gov
ernm
ent
offic
ial/
regu
lato
r
Peers now as credible as experts
14
Percent who rate each spokesperson as extremely/very credible, and change from 2016 to 2017
CEO credibility decreased the most, dropping to an all-time low
-7 -5
“People in this country have had enough of experts.”
– Michael Gove, Member of Parliament, U.K.
A person like yourself now tied for most credible spokesperson
-3 -7 -5 -4 -7 -5 -12 -10 -6
Y-to-Y Change+−
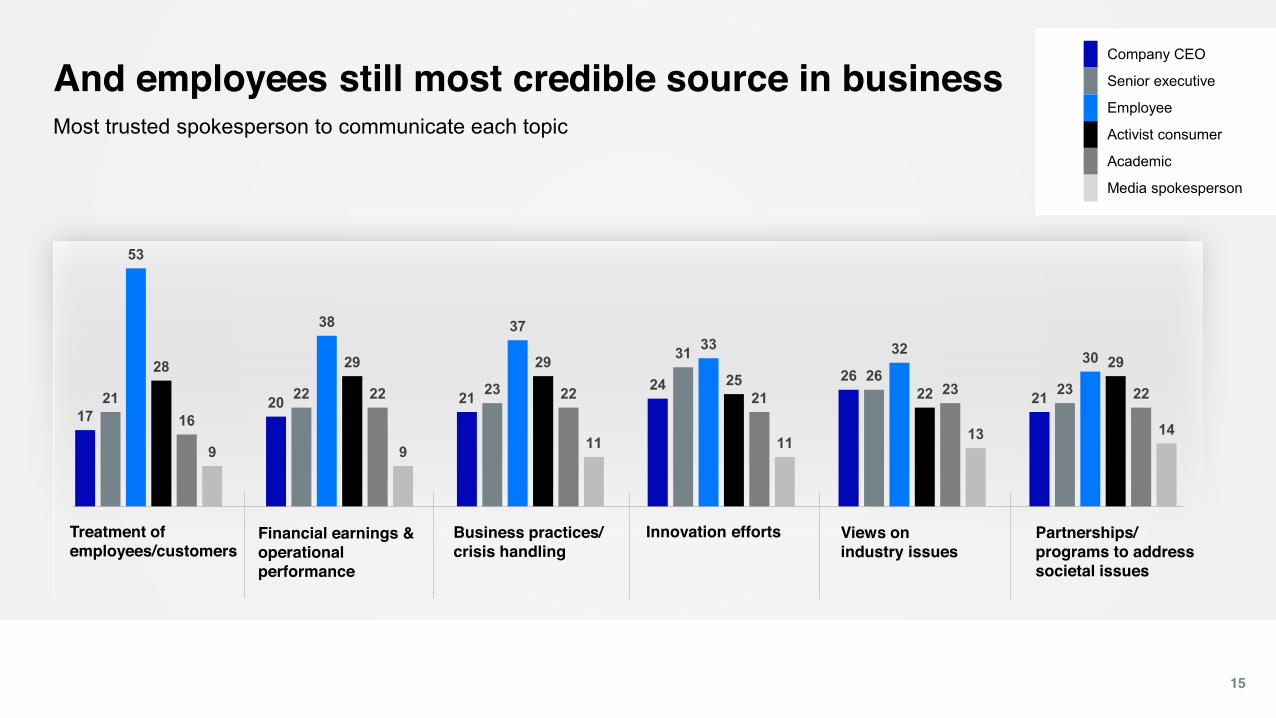
Partnerships/programs to address societal issues
Business practices/crisis handling
Financial earnings & operational performance
And employees still most credible source in business
15
Most trusted spokesperson to communicate each topic
Innovation effortsTreatment of employees/customers
Views on industry issues
Company CEO
Senior executive
Employee
Activist consumer
Academic
Media spokesperson
1720 21
24 262121 22 23
3126
23
53
38 3733 32 3028 29 29
2522
29
16
22 22 21 23 22
9 9 11 11 13 14
16
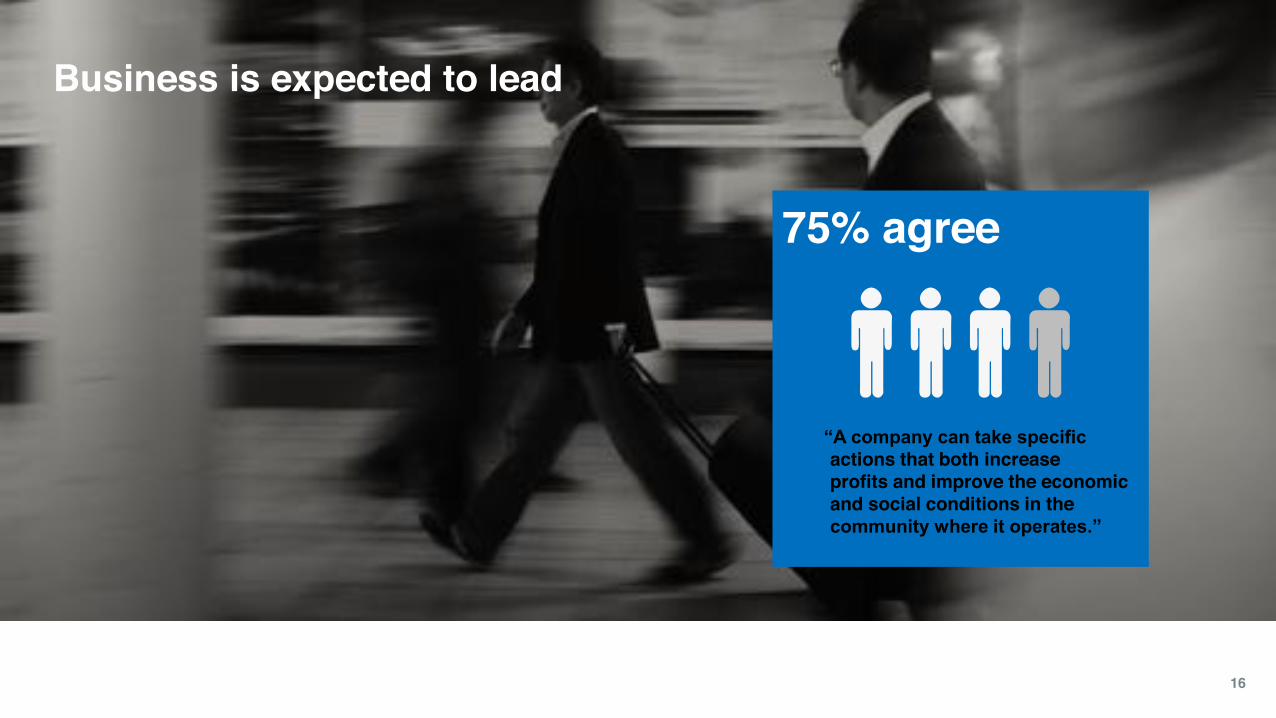
Business is expected to lead
75% agree
“A company can take specific actions that both increase profits and improve the economic and social conditions in the community where it operates.”
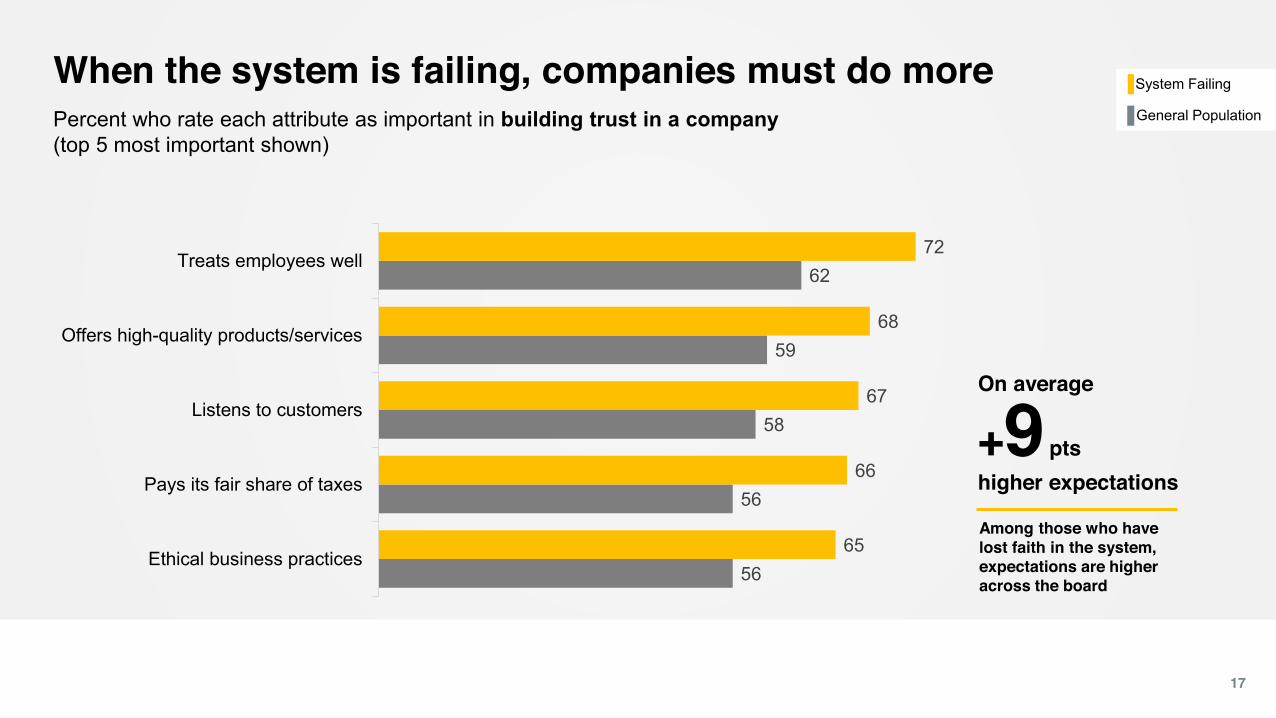
When the system is failing, companies must do more
17
Percent who rate each attribute as important in building trust in a company (top 5 most important shown)
56
56
58
59
62
65
66
67
68
72
Ethical business practices
Pays its fair share of taxes
Listens to customers
Offers high-quality products/services
Treats employees well
Among those who have lost faith in the system, expectations are higher across the board
On average
+9ptshigher expectations
System Failing
General Population

18
Do No HarmActions business can take that would most damage trust in a better future (top 5 most-selected)
1.Pay bribes to government officials to win contracts
2. Pay executives hundreds of times more than workers
3.Move profits to other countries to avoid taxes
4.Overcharge for products that people need to live
5. Reduce costs by lowering product quality
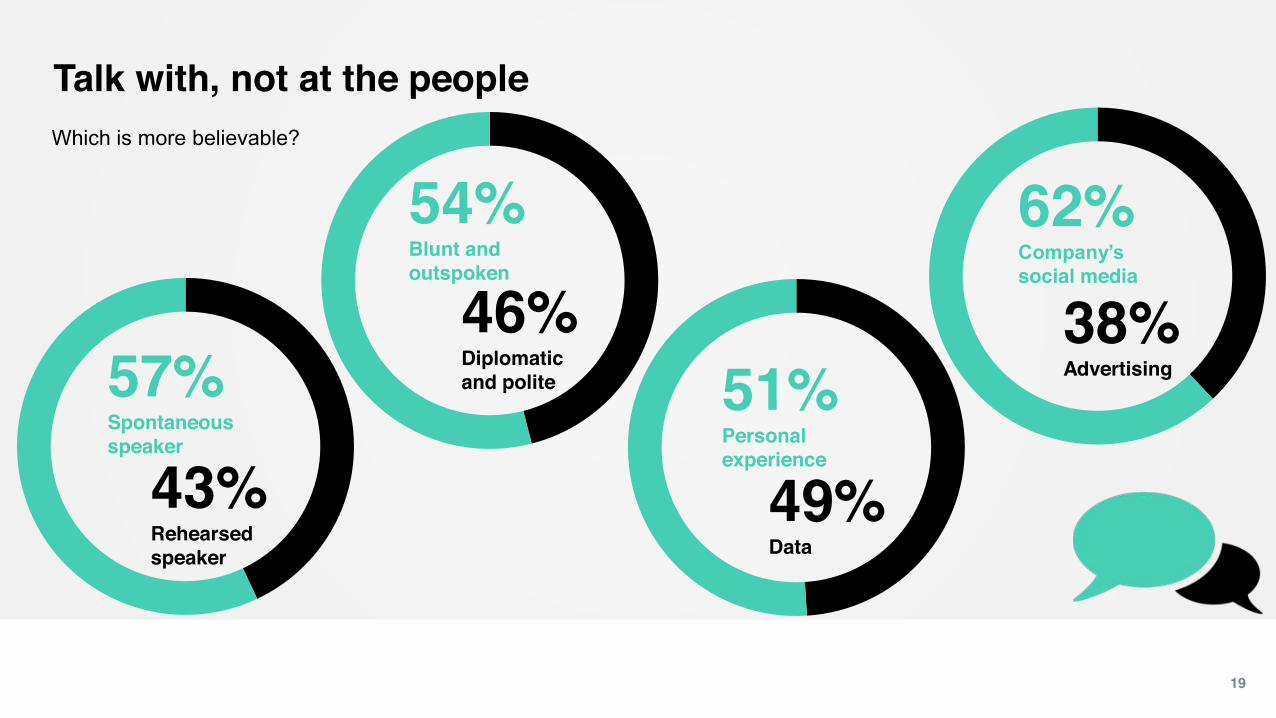
Which is more believable?
Talk with, not at the people
19
51% Personal experience
49% Data
57% Spontaneousspeaker
43% Rehearsedspeaker
54% Blunt and outspoken
46% Diplomatic and polite
62% Company’ssocial media
38% Advertising
Thank You
1
Appendix 2017 Edelman Trust Barometer
11
34
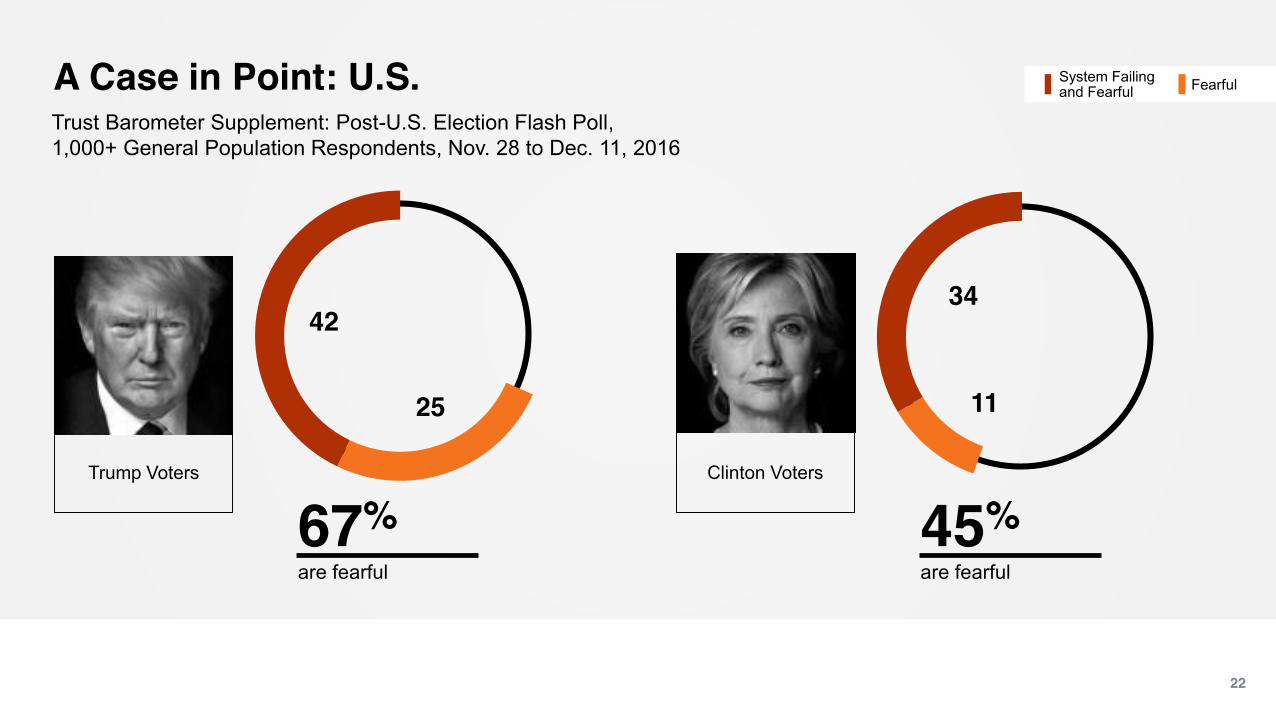
A Case in Point: U.S.
22
Trust Barometer Supplement: Post-U.S. Election Flash Poll, 1,000+ General Population Respondents, Nov. 28 to Dec. 11, 2016
Trump Voters Clinton Voters
25
42
67% are fearful
45% are fearful
System Failingand Fearful Fearful
7
21
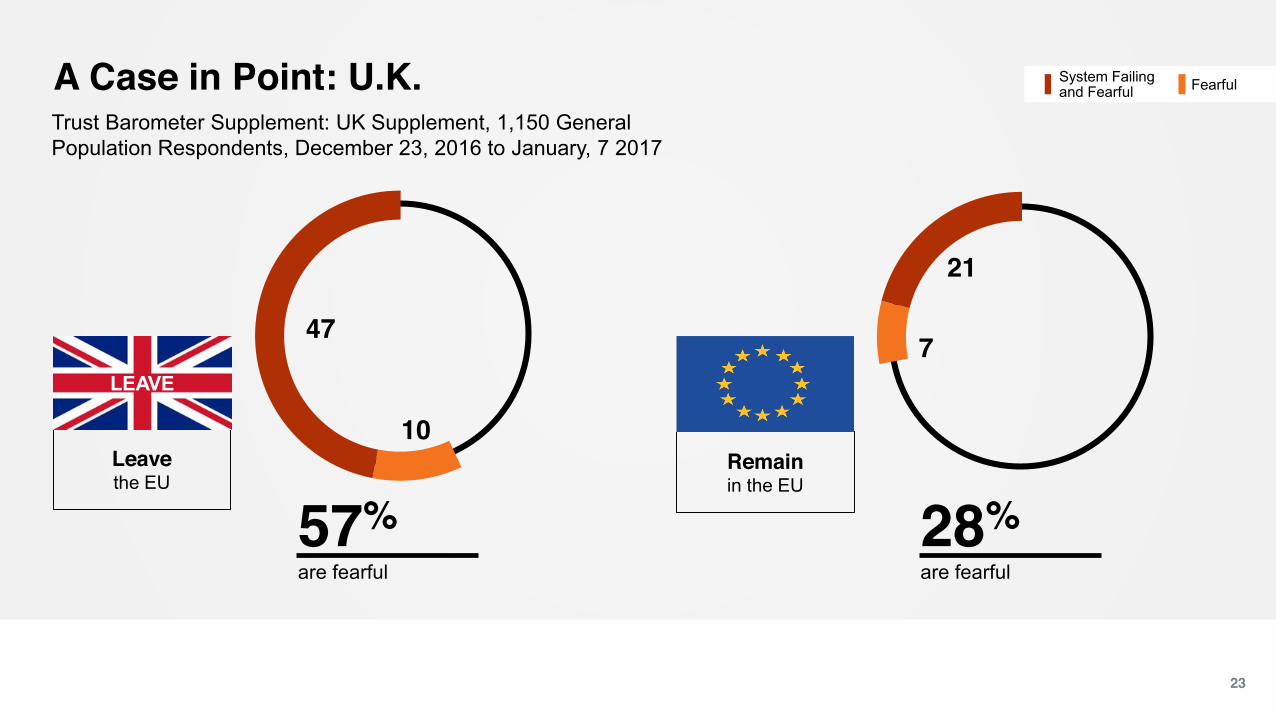
A Case in Point: U.K.
23
Trust Barometer Supplement: UK Supplement, 1,150 General Population Respondents, December 23, 2016 to January, 7 2017
Leavethe EU
Remainin the EU
10
47
57% are fearful
28% are fearful
System Failingand Fearful Fearful
LEAVE

Technical Appendix 2017 Edelman Trust Barometer

1. Why Edelman studies trust
2. The trust-building attributes
3. Methodology
4. The sample
5. How we measured: belief that the system is failing
6. How we measured: societal and economic fears
7. About the research team
8. About the social policy team
Table of Contents
54
2017 Edelman Trust Barometer Technical Appendix

Why Edelman Studies Trust
26
In modern society, we delegate important aspects of our well-being to the four institutions of business (economic well-being), government (national security and public policy), media (information and knowledge) and NGOs (social causes and issues).
In order to feel safe delegating important aspects of our lives and well-being to others, we need to trust them to act with integrity and with our best interests in mind. Trust, therefore, is at the heart of an individual’s relationship with an institution and, by association, its leadership.
If trust in these institutions breaks down, we begin to fear that we are no longer in safe, reliable hands. Without trust, the fabric of society can unravel to the detriment of all.
From an institutional standpoint, trust is a forward-looking metric. Unlike reputation, which is based on an organization’s historical behavior, trust is a predictor of whether stakeholders will find you credible in the future, will embrace new innovations you introduce and will enthusiastically support you.
For these reasons, trust is a valuable asset for all institutions, and ongoing trust-building activities should be one of the most important strategic priorities for every organization.
The Trust-Building AttributesEach year, we ask respondents to rate the importance of a series of attributes in building trust in a company, and how well companies are performing against them. These can be grouped into five clusters: Integrity, Engagement, Products, Purpose and Operations. These original 16 trust-building attributes are shown on the next slide.
In 2017, we explored additional dimensions to building trust in a company. These new dimensions fall into five areas, shown on the following slide: Employee Engagement, Diversity, Citizenship, Leadership and Relationship-Building.
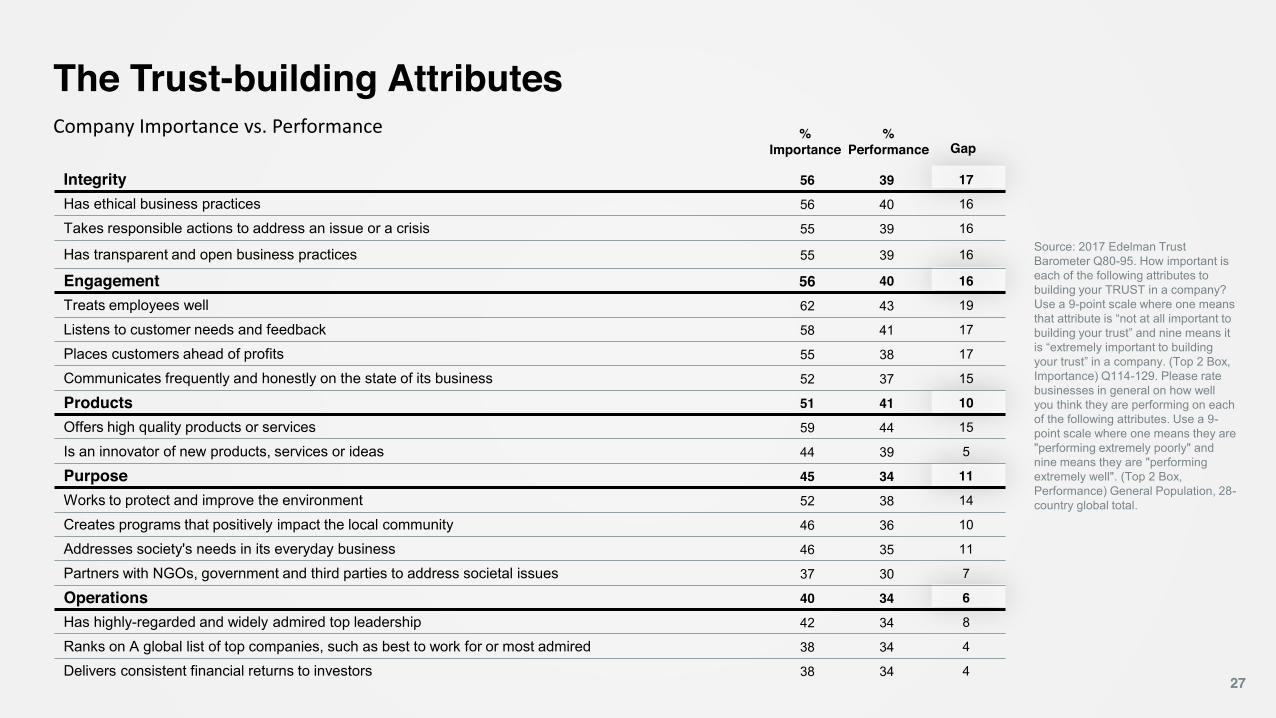
Integrity 56 39 17
Has ethical business practices 56 40 16
Takes responsible actions to address an issue or a crisis 55 39 16
Has transparent and open business practices 55 39 16
Engagement 56 40 16
Treats employees well 62 43 19
Listens to customer needs and feedback 58 41 17
Places customers ahead of profits 55 38 17
Communicates frequently and honestly on the state of its business 52 37 15
Products 51 41 10
Offers high quality products or services 59 44 15
Is an innovator of new products, services or ideas 44 39 5
Purpose 45 34 11
Works to protect and improve the environment 52 38 14
Creates programs that positively impact the local community 46 36 10
Addresses society's needs in its everyday business 46 35 11
Partners with NGOs, government and third parties to address societal issues 37 30 7
Operations 40 34 6
Has highly-regarded and widely admired top leadership 42 34 8
Ranks on A global list of top companies, such as best to work for or most admired 38 34 4
Delivers consistent financial returns to investors 38 34 4
The Trust-building AttributesCompany Importance vs. Performance %
Performance%
Importance Gap
27
Source: 2017 Edelman Trust Barometer Q80-95. How important is each of the following attributes to building your TRUST in a company? Use a 9-point scale where one means that attribute is “not at all important to building your trust” and nine means it is “extremely important to building your trust” in a company. (Top 2 Box, Importance) Q114-129. Please rate businesses in general on how well you think they are performing on each of the following attributes. Use a 9-point scale where one means they are "performing extremely poorly" and nine means they are "performing extremely well". (Top 2 Box, Performance) General Population, 28-country global total.
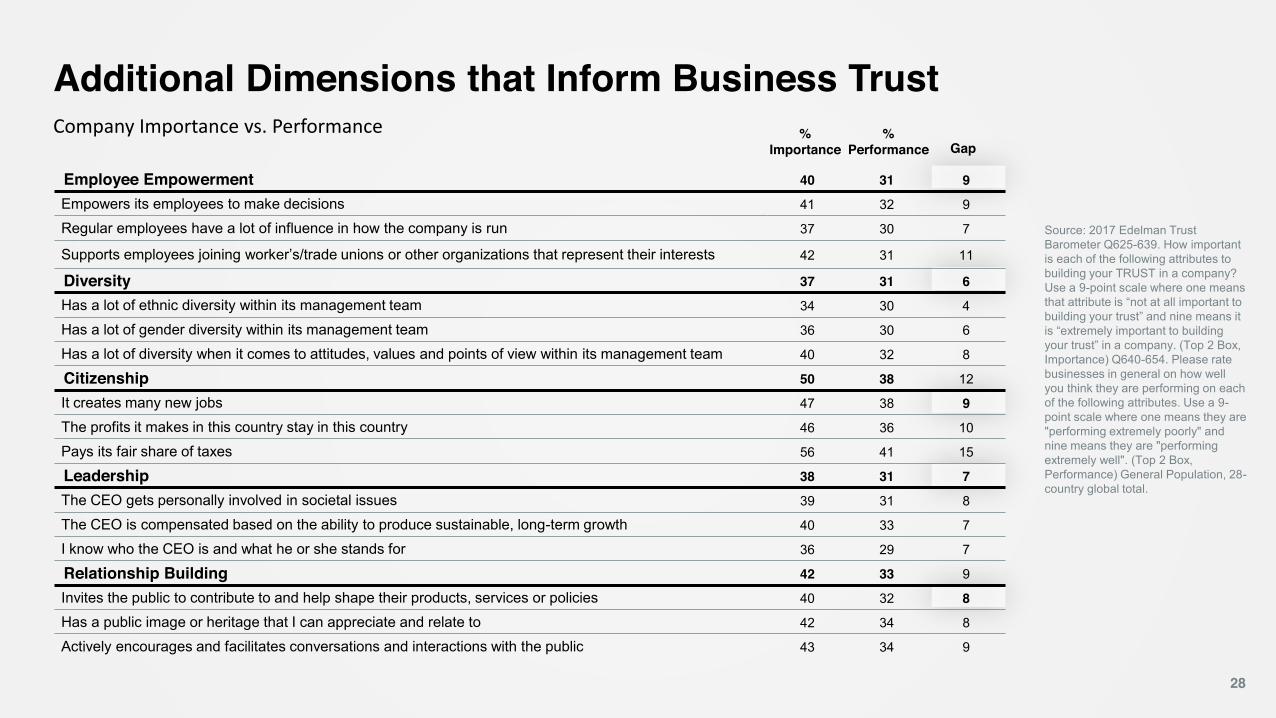
Employee Empowerment 40 31 9
Empowers its employees to make decisions 41 32 9
Regular employees have a lot of influence in how the company is run 37 30 7
Supports employees joining worker’s/trade unions or other organizations that represent their interests 42 31 11
Diversity 37 31 6
Has a lot of ethnic diversity within its management team 34 30 4
Has a lot of gender diversity within its management team 36 30 6
Has a lot of diversity when it comes to attitudes, values and points of view within its management team 40 32 8
Citizenship 50 38 12
It creates many new jobs 47 38 9
The profits it makes in this country stay in this country 46 36 10
Pays its fair share of taxes 56 41 15
Leadership 38 31 7
The CEO gets personally involved in societal issues 39 31 8
The CEO is compensated based on the ability to produce sustainable, long-term growth 40 33 7
I know who the CEO is and what he or she stands for 36 29 7
Relationship Building 42 33 9
Invites the public to contribute to and help shape their products, services or policies 40 32 8
Has a public image or heritage that I can appreciate and relate to 42 34 8
Actively encourages and facilitates conversations and interactions with the public 43 34 9
Additional Dimensions that Inform Business TrustCompany Importance vs. Performance %
Performance%
Importance Gap
28
Source: 2017 Edelman Trust Barometer Q625-639. How important is each of the following attributes to building your TRUST in a company? Use a 9-point scale where one means that attribute is “not at all important to building your trust” and nine means it is “extremely important to building your trust” in a company. (Top 2 Box, Importance) Q640-654. Please rate businesses in general on how well you think they are performing on each of the following attributes. Use a 9-point scale where one means they are "performing extremely poorly" and nine means they are "performing extremely well". (Top 2 Box, Performance) General Population, 28-country global total.
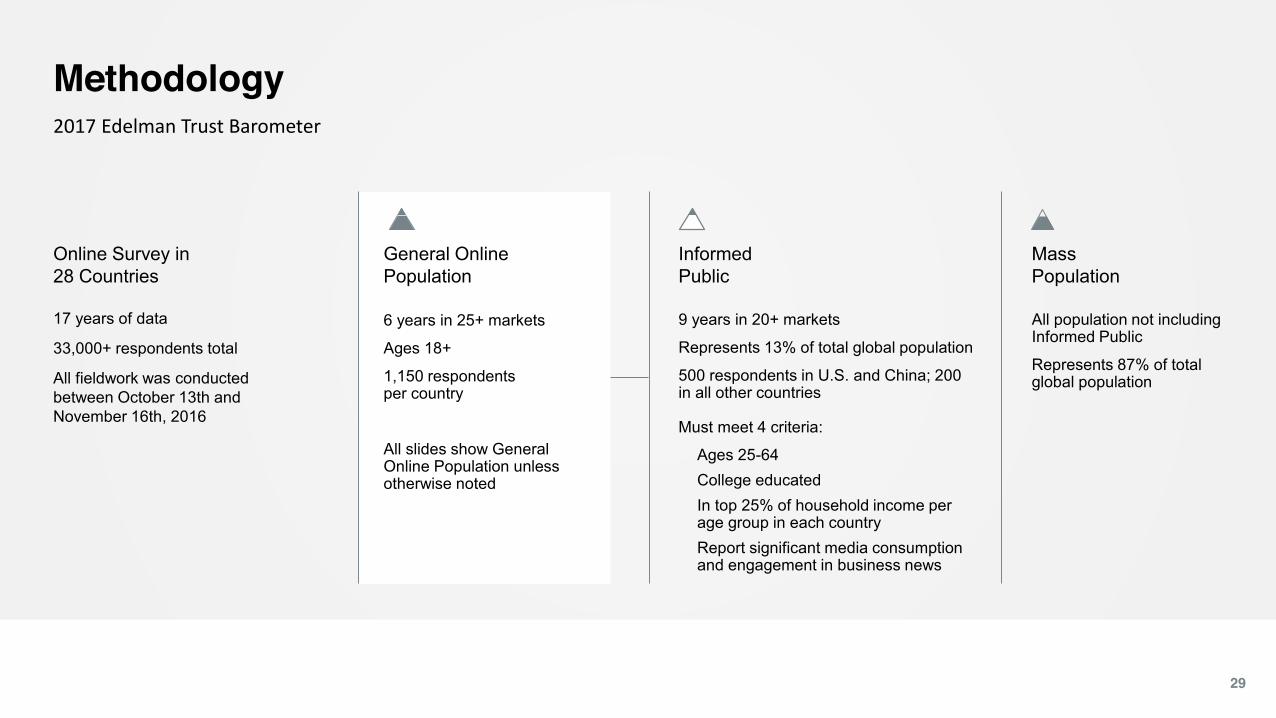
Informed Public
9 years in 20+ markets
Represents 13% of total global population
500 respondents in U.S. and China; 200 in all other countries
Must meet 4 criteria:
Ages 25-64College educatedIn top 25% of household income per age group in each countryReport significant media consumption and engagement in business news
General Online Population
6 years in 25+ markets
Ages 18+
1,150 respondents per country
All slides show General Online Population unless otherwise noted
Methodology
29
2017 Edelman Trust Barometer
17 years of data
33,000+ respondents total
All fieldwork was conducted between October 13th and November 16th, 2016
Online Survey in 28 Countries
Mass Population
All population not including Informed Public
Represents 87% of total global population
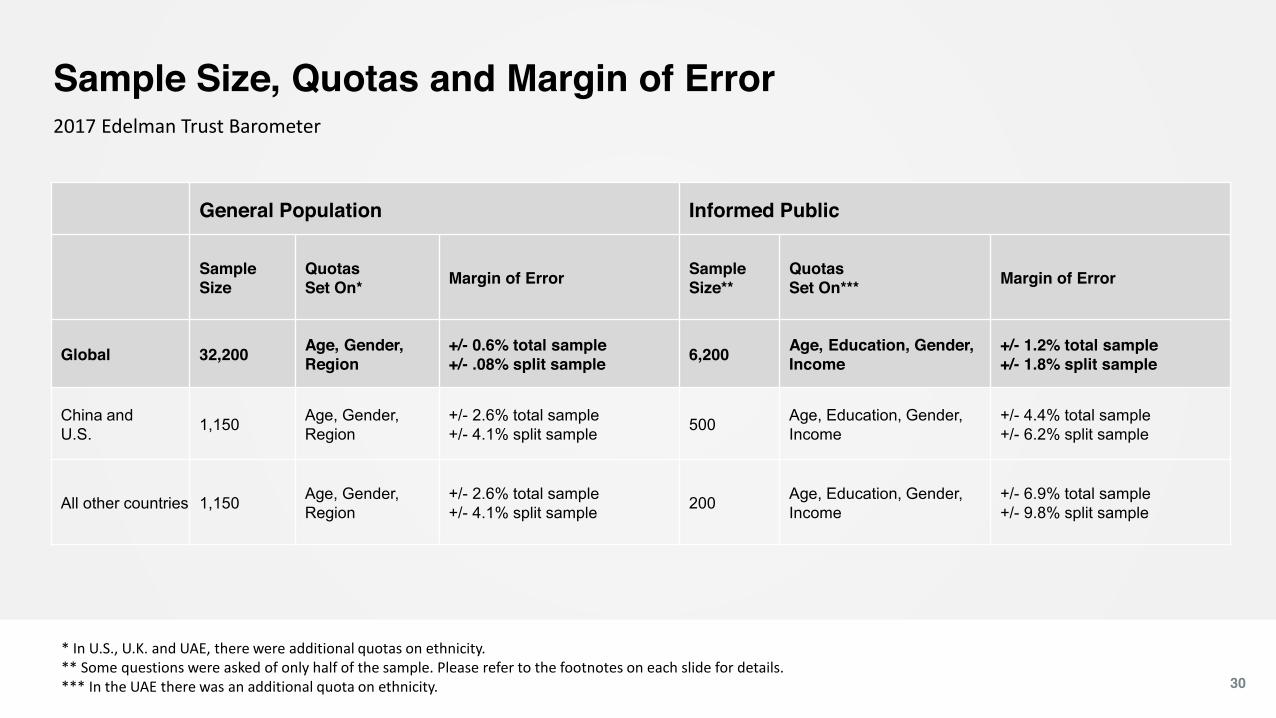
Sample Size, Quotas and Margin of Error
30
2017 Edelman Trust Barometer
General Population Informed Public
Sample Size
Quotas Set On* Margin of Error Sample
Size**Quotas Set On*** Margin of Error
Global 32,200 Age, Gender, Region
+/- 0.6% total sample+/- .08% split sample 6,200 Age, Education, Gender,
Income+/- 1.2% total sample+/- 1.8% split sample
China and U.S. 1,150 Age, Gender,
Region+/- 2.6% total sample+/- 4.1% split sample 500 Age, Education, Gender,
Income+/- 4.4% total sample+/- 6.2% split sample
All other countries 1,150 Age, Gender, Region
+/- 2.6% total sample+/- 4.1% split sample 200 Age, Education, Gender,
Income+/- 6.9% total sample+/- 9.8% split sample
* In U.S., U.K. and UAE, there were additional quotas on ethnicity. ** Some questions were asked of only half of the sample. Please refer to the footnotes on each slide for details.*** In the UAE there was an additional quota on ethnicity.

Languages and Internet Penetration by Country
The Edelman Trust Barometer is an online survey. In developed countries, a nationally representative online sample closely mirrors the general population. In countries with lower levels of Internet penetration, a nationally-representative online sample will be more affluent, educated, and urban than the general population.
31
Languages Internet Penetration*
Global - 50%
Argentina Localized Spanish 79%
Australia English 92%
Brazil Portuguese 68%
Canada English & French Canadian 93%
China Simplified Chinese 52%
Colombia Localized Spanish 59%
France French 84%
Germany German 88%
Hong Kong English & Traditional Chinese 80%
*Data source: http://www.internet worldstats.com/stats.htm.
Languages Internet Penetration*
India Hindi & English 37%
Indonesia Indonesian 51%
Ireland English 83%
Italy Italian 62%
Japan Japanese 91%
Malaysia Malay 68%
Mexico Localized Spanish 56%
Netherlands Dutch & English 96%
Poland Polish 68%
Russia Russian 71%
Languages Internet Penetration*
Singapore English & Simplified Chinese 81%
South Africa English & Afrikaans 53%
South Korea Korean 92%
Spain Spanish 77%
Sweden Swedish & English 95%
Turkey Turkish 60%
UAE Arabic & English 92%
U.K. English 92%
U.S. English 89%
2017 Edelman Trust Barometer
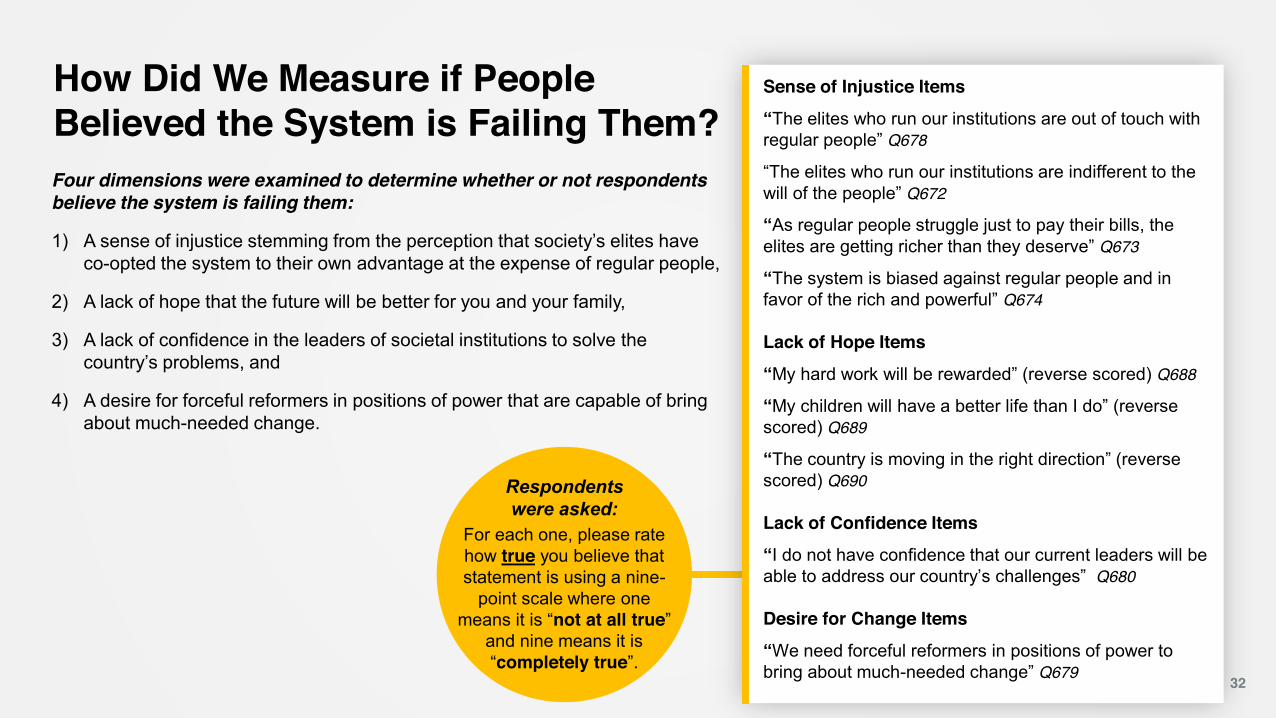
How Did We Measure if People Believed the System is Failing Them?Four dimensions were examined to determine whether or not respondents believe the system is failing them:
1) A sense of injustice stemming from the perception that society’s elites have co-opted the system to their own advantage at the expense of regular people,
2) A lack of hope that the future will be better for you and your family,
3) A lack of confidence in the leaders of societal institutions to solve the country’s problems, and
4) A desire for forceful reformers in positions of power that are capable of bring about much-needed change.
32
For each one, please rate how true you believe that statement is using a nine-
point scale where one means it is “not at all true”
and nine means it is “completely true”.
Sense of Injustice Items
“The elites who run our institutions are out of touch with regular people” Q678
“The elites who run our institutions are indifferent to the will of the people” Q672
“As regular people struggle just to pay their bills, the elites are getting richer than they deserve” Q673
“The system is biased against regular people and in favor of the rich and powerful” Q674
Lack of Hope Items
“My hard work will be rewarded” (reverse scored) Q688
“My children will have a better life than I do” (reverse scored) Q689
“The country is moving in the right direction” (reverse scored) Q690
Lack of Confidence Items
“I do not have confidence that our current leaders will be able to address our country’s challenges” Q680
Desire for Change Items
“We need forceful reformers in positions of power to bring about much-needed change” Q679
Respondents were asked:
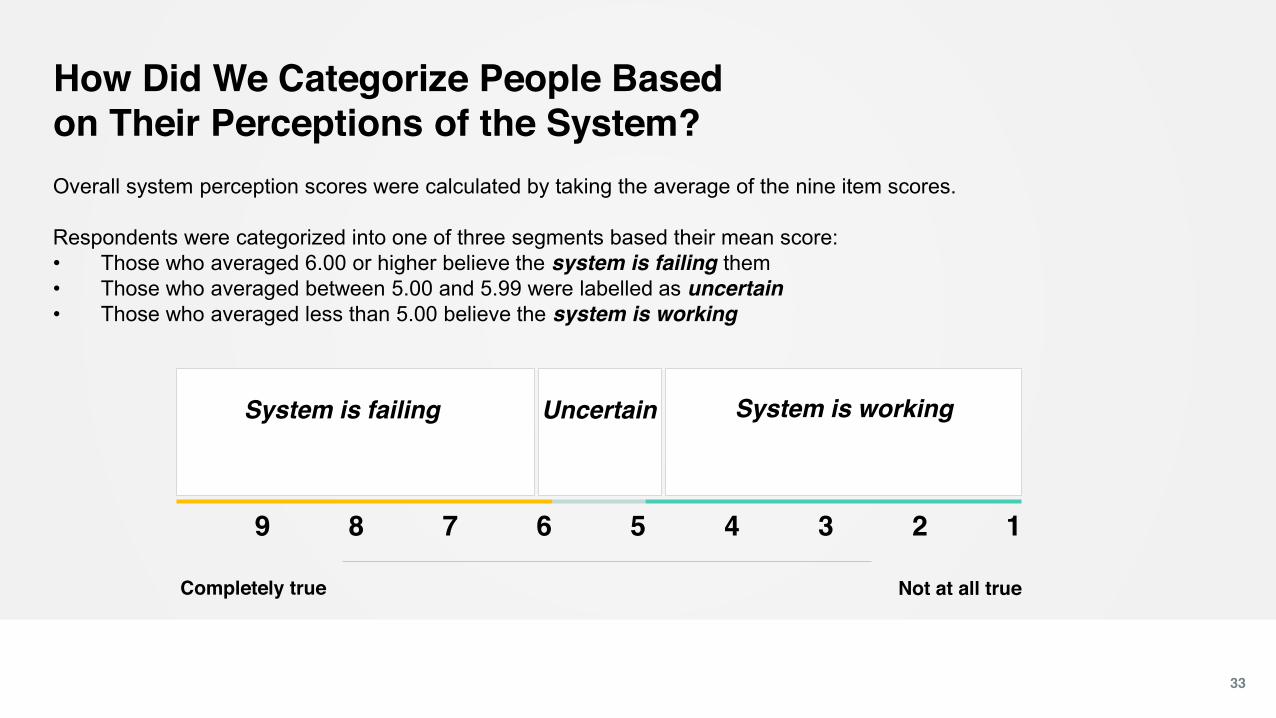
How Did We Categorize People Based on Their Perceptions of the System?
33
Overall system perception scores were calculated by taking the average of the nine item scores.
Respondents were categorized into one of three segments based their mean score:• Those who averaged 6.00 or higher believe the system is failing them• Those who averaged between 5.00 and 5.99 were labelled as uncertain• Those who averaged less than 5.00 believe the system is working
System is failing Uncertain System is working
Not at all trueCompletely true
9 8 7 6 5 4 3 2 1
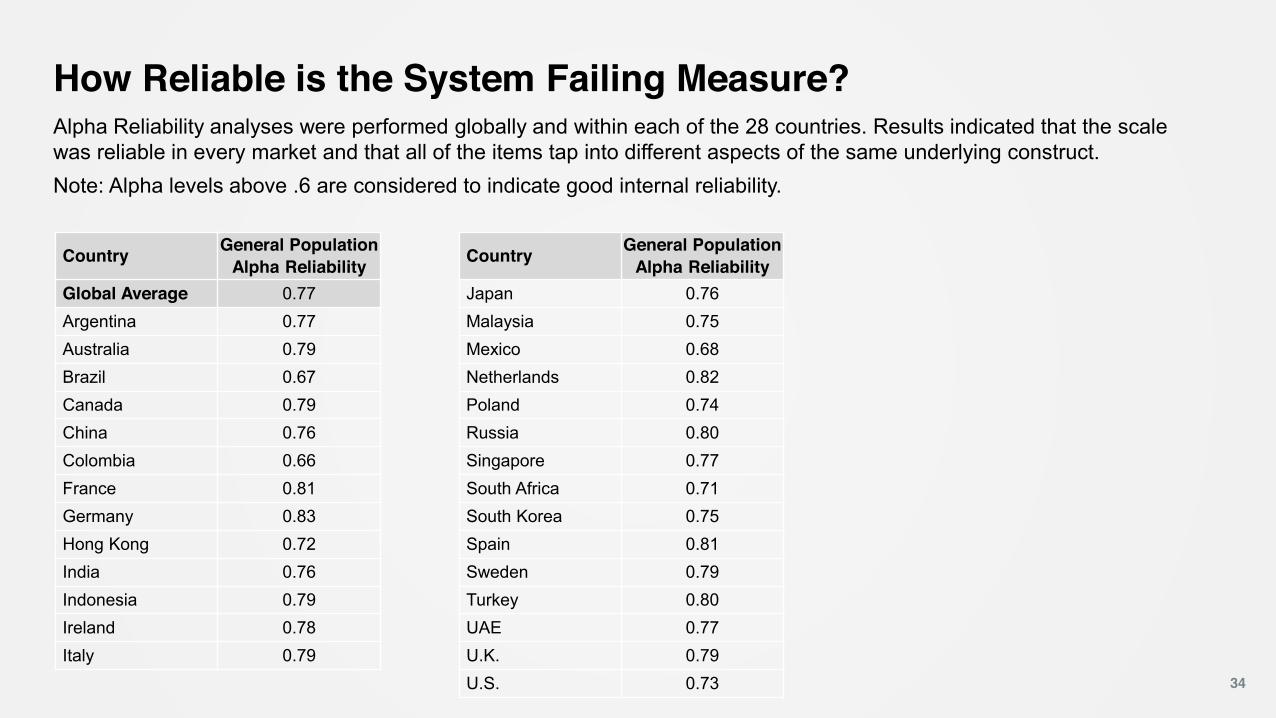
How Reliable is the System Failing Measure?
34
Country General PopulationAlpha Reliability
Japan 0.76Malaysia 0.75Mexico 0.68Netherlands 0.82Poland 0.74Russia 0.80Singapore 0.77South Africa 0.71South Korea 0.75Spain 0.81Sweden 0.79Turkey 0.80UAE 0.77U.K. 0.79U.S. 0.73
Country General PopulationAlpha Reliability
Global Average 0.77Argentina 0.77Australia 0.79Brazil 0.67Canada 0.79China 0.76Colombia 0.66France 0.81Germany 0.83Hong Kong 0.72India 0.76Indonesia 0.79Ireland 0.78Italy 0.79
Alpha Reliability analyses were performed globally and within each of the 28 countries. Results indicated that the scale was reliable in every market and that all of the items tap into different aspects of the same underlying construct. Note: Alpha levels above .6 are considered to indicate good internal reliability.
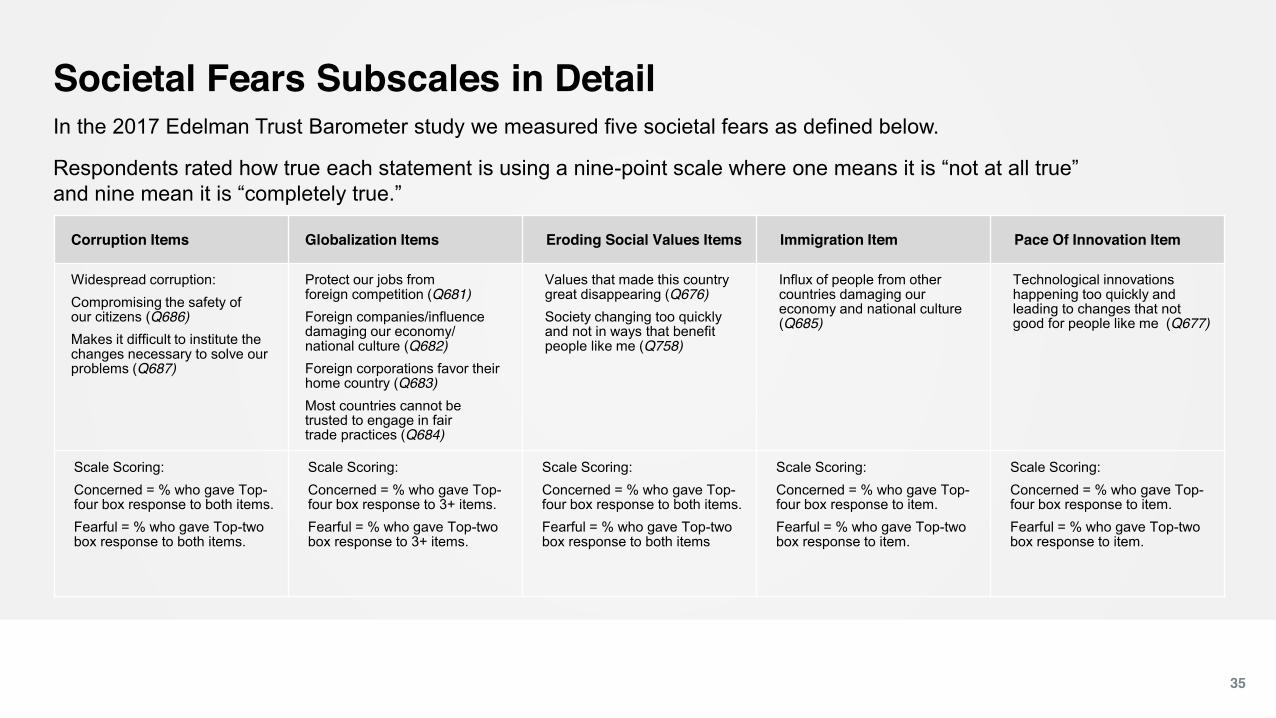
In the 2017 Edelman Trust Barometer study we measured five societal fears as defined below.
Respondents rated how true each statement is using a nine-point scale where one means it is “not at all true” and nine mean it is “completely true.”
Corruption Items Globalization Items Eroding Social Values Items Immigration Item Pace Of Innovation Item
Widespread corruption:Compromising the safety of our citizens (Q686)Makes it difficult to institute the changes necessary to solve our problems (Q687)
Protect our jobs from foreign competition (Q681)Foreign companies/influence damaging our economy/national culture (Q682)Foreign corporations favor their home country (Q683)Most countries cannot be trusted to engage in fair trade practices (Q684)
Values that made this country great disappearing (Q676)Society changing too quickly and not in ways that benefit people like me (Q758)
Influx of people from other countries damaging our economy and national culture (Q685)
Technological innovations happening too quickly and leading to changes that not good for people like me (Q677)
Scale Scoring:Concerned = % who gave Top-four box response to both items.Fearful = % who gave Top-two box response to both items.
Scale Scoring:Concerned = % who gave Top-four box response to 3+ items.Fearful = % who gave Top-two box response to 3+ items.
Scale Scoring:Concerned = % who gave Top-four box response to both items.Fearful = % who gave Top-two box response to both items
Scale Scoring:Concerned = % who gave Top-four box response to item.Fearful = % who gave Top-two box response to item.
Scale Scoring:Concerned = % who gave Top-four box response to item.Fearful = % who gave Top-two box response to item.
Societal Fears Subscales in Detail
35