Embed Size (px)
Citation preview
Monthly Market Update (India) – June 2018 |iFAST Research
Monthly Market Update (India) – June 2018 |iFAST Research
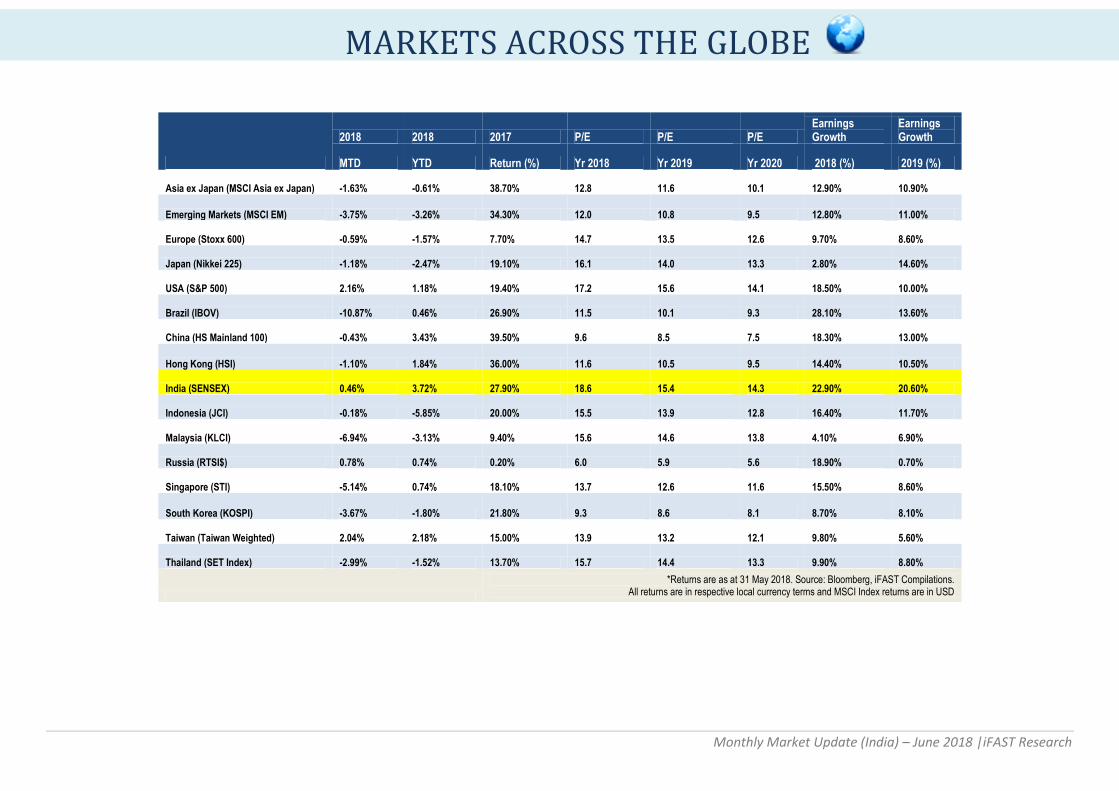
2018 2018 2017 P/E P/E P/E Earnings Growth
Earnings Growth
MTD YTD Return (%) Yr 2018 Yr 2019 Yr 2020 2018 (%) 2019 (%)
Asia ex Japan (MSCI Asia ex Japan) -1.63% -0.61% 38.70% 12.8 11.6 10.1 12.90% 10.90%
Emerging Markets (MSCI EM) -3.75% -3.26% 34.30% 12.0 10.8 9.5 12.80% 11.00%
Europe (Stoxx 600) -0.59% -1.57% 7.70% 14.7 13.5 12.6 9.70% 8.60%
Japan (Nikkei 225) -1.18% -2.47% 19.10% 16.1 14.0 13.3 2.80% 14.60%
USA (S&P 500) 2.16% 1.18% 19.40% 17.2 15.6 14.1 18.50% 10.00%
Brazil (IBOV) -10.87% 0.46% 26.90% 11.5 10.1 9.3 28.10% 13.60%
China (HS Mainland 100) -0.43% 3.43% 39.50% 9.6 8.5 7.5 18.30% 13.00%
Hong Kong (HSI) -1.10% 1.84% 36.00% 11.6 10.5 9.5 14.40% 10.50%
India (SENSEX) 0.46% 3.72% 27.90% 18.6 15.4 14.3 22.90% 20.60%
Indonesia (JCI) -0.18% -5.85% 20.00% 15.5 13.9 12.8 16.40% 11.70%
Malaysia (KLCI) -6.94% -3.13% 9.40% 15.6 14.6 13.8 4.10% 6.90%
Russia (RTSI$) 0.78% 0.74% 0.20% 6.0 5.9 5.6 18.90% 0.70%
Singapore (STI) -5.14% 0.74% 18.10% 13.7 12.6 11.6 15.50% 8.60%
South Korea (KOSPI) -3.67% -1.80% 21.80% 9.3 8.6 8.1 8.70% 8.10%
Taiwan (Taiwan Weighted) 2.04% 2.18% 15.00% 13.9 13.2 12.1 9.80% 5.60%
Thailand (SET Index) -2.99% -1.52% 13.70% 15.7 14.4 13.3 9.90% 8.80%
*Returns are as at 31 May 2018. Source: Bloomberg, iFAST Compilations. All returns are in respective local currency terms and MSCI Index returns are in USD
MARKETS ACROSS THE GLOBE
Monthly Market Update (India) – June 2018 |iFAST Research
Trade (April’18)
Exports during April 2018 were valued at USD 25.91 billion
as compared to USD 24.64 billion during April 2017
exhibiting a positive growth of 5.17% year-on-year. While
imports during April 2018 were valued at USD 39.63 billion
which was 4.6% year-on-year higher in USD terms over the
level of imports valued at USD 37.88 billion in April 2017.
Major commodity groups of export showing positive
growth over the corresponding month of last year are
Engineering Goods (17.63%), Organic & In-organic
Chemicals (38.48%), Drugs & Pharmaceuticals (13.56%),
Cotton Yarns/ Fabs/ Made-ups, Handloom Products
(15.66%) and Plastic & Linoleum (30.03%).
Major commodity groups of import showing high growth
in April 2018 over the corresponding month of last year
are Petroleum, Crude & products (41.49%), Machinery,
electrical & non electrical (9.11%), Coal, Coke &
Briquettes, etc. (20.43%), Organic & inorganic Chemicals
(18.36) and Transport & Equipment (33.18%). In effect,
the Trade Deficit for the month stood at US $ 13.72 billion
vis-a-vis the deficit of US $ 13.25 billion during April 2017.
Industrial Production (March‘18)
IIP stood at 4.4% year-on-year in March compared to
revised growth rate of 7.0% year-on-year in February. The
major sectors like Mining, Manufacturing and Electricity
registered growth rates of 2.8%, 4.4% and 5.9%
respectively. As per Use-based classification, the growth
rates in March 2018 over March 2017 are 2.9% in Primary
goods, -1.8% in Capital goods, 2.1% in Intermediate goods
and 8.8% in Infrastructure/ Construction Goods. Further,
the Consumer durables and Consumer non-durables have
recorded growth of 2.9% and 10.9% respectively.
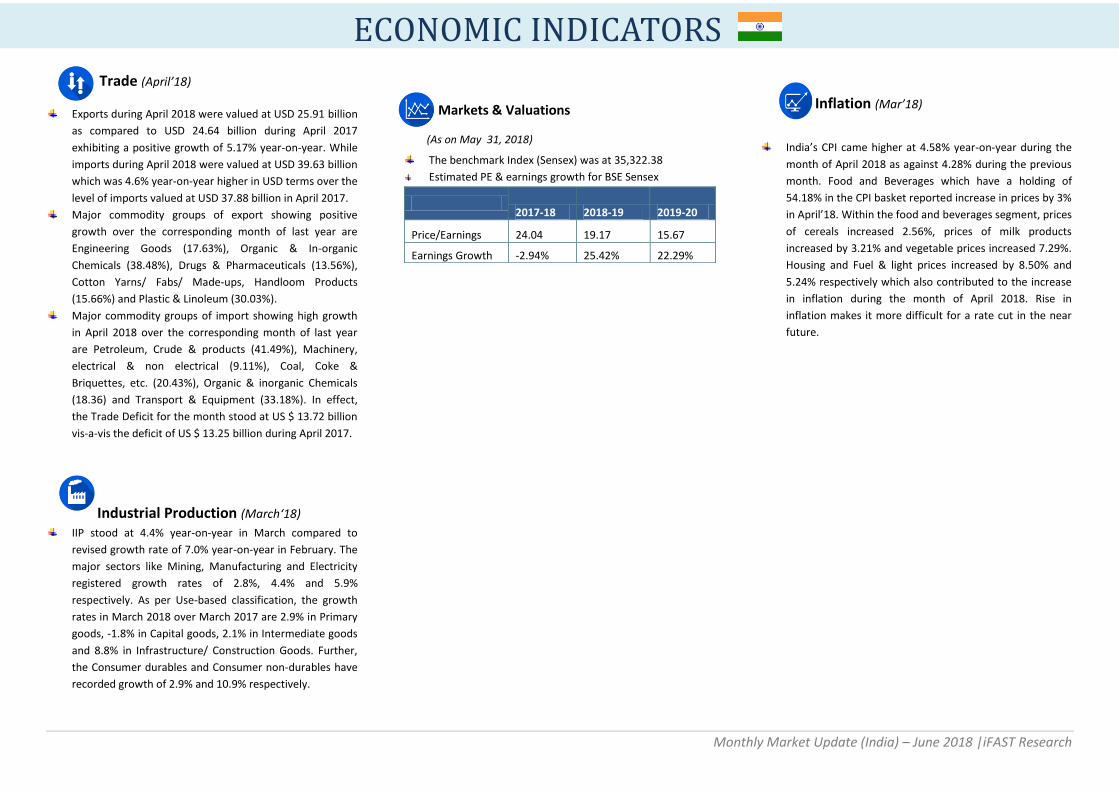
Markets & Valuations
(As on May 31, 2018)
The benchmark Index (Sensex) was at 35,322.38
Estimated PE & earnings growth for BSE Sensex
Inflation (Mar’18)
India’s CPI came higher at 4.58% year-on-year during the
month of April 2018 as against 4.28% during the previous
month. Food and Beverages which have a holding of
54.18% in the CPI basket reported increase in prices by 3%
in April’18. Within the food and beverages segment, prices
of cereals increased 2.56%, prices of milk products
increased by 3.21% and vegetable prices increased 7.29%.
Housing and Fuel & light prices increased by 8.50% and
5.24% respectively which also contributed to the increase
in inflation during the month of April 2018. Rise in
inflation makes it more difficult for a rate cut in the near
future.
2017-18 2018-19 2019-20
Price/Earnings 24.04 19.17 15.67
Earnings Growth -2.94% 25.42% 22.29%
ECONOMIC INDICATORS
Monthly Market Update (India) – June 2018 |iFAST Research
BSE Sensex - Top & bottom performers in May 2018. (As on May 31, 2018)
Top Performers MTD Bottom Performers MTD
Kotak Mahindra Bank Ltd 10% Tata Motors Ltd -17%
HDFC Bank Ltd 10% Sun Pharmaceutical Industries Ltd -9%
State Bank of India 9% Bharti Airtel Ltd -8.7%
Earnings growth estimates of top weighted stocks:
Stock FY-18 FY-19 FY-20
HDFC Bank Ltd. -3.17% 20.64% 23.37%
Housing Development Finance Corp Ltd -2.00% 18.75% 21.61%
Our view
The Indian market ended on a tepid note in the month of May with the benchmark index that
is S&P BSE Sensex giving a return of 0.46%. The outcome of the elections in Karnataka and
the uncertainty that surrounded the Government formation in the state kept the market on
tenterhooks. The positives for the market were good corporate results, fall in oil prices during
the course of the month, and a robust GDP number for the 4th quarter of FY18 which came
out on the last day of the month. However, the high drama that followed the government
formation in Karnataka along with the rising inflation numbers (both WPI and CPI) dented the
confidence of the market participants. If the first event created some uneasiness around the
General elections that is to take place in 2019, then the second event hinted towards a high
probability that the Central Bank would increase policy rates in the review that was to be
held in the first week of June. If this was not enough, global concerns like the US-China
negotiations along with the fear of a rate hike by the US Fed negatively impacted market
sentiments.
Going forward, we would advise our investors to take advantage of this volatility and take
exposure into equity funds via the SIP or STP route depending on their risk profiles. The long
term story of India is intact and hence we should not get bothered by the noise created on
the domestic or the global front.
Source: Bloomberg, iFAST Compilations. All returns are in respective local currency terms
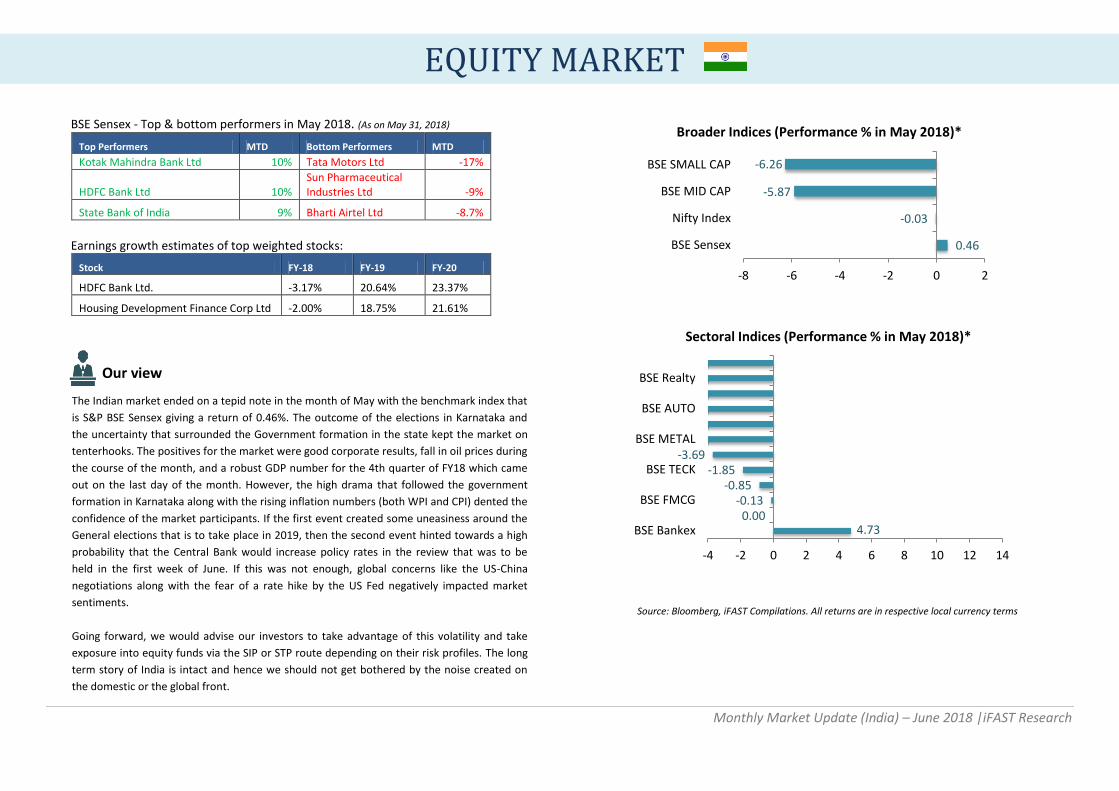
0.46
-0.03
-5.87
-6.26
-8 -6 -4 -2 0 2
BSE Sensex
Nifty Index
BSE MID CAP
BSE SMALL CAP
Broader Indices (Performance % in May 2018)*
4.73 0.00
-0.13 -0.85
-1.85 -3.69
-4 -2 0 2 4 6 8 10 12 14
BSE Bankex
BSE FMCG
BSE TECK
BSE METAL
BSE AUTO
BSE Realty
Sectoral Indices (Performance % in May 2018)*
EQUITY MARKET
Monthly Market Update (India) – June 2018 |iFAST Research
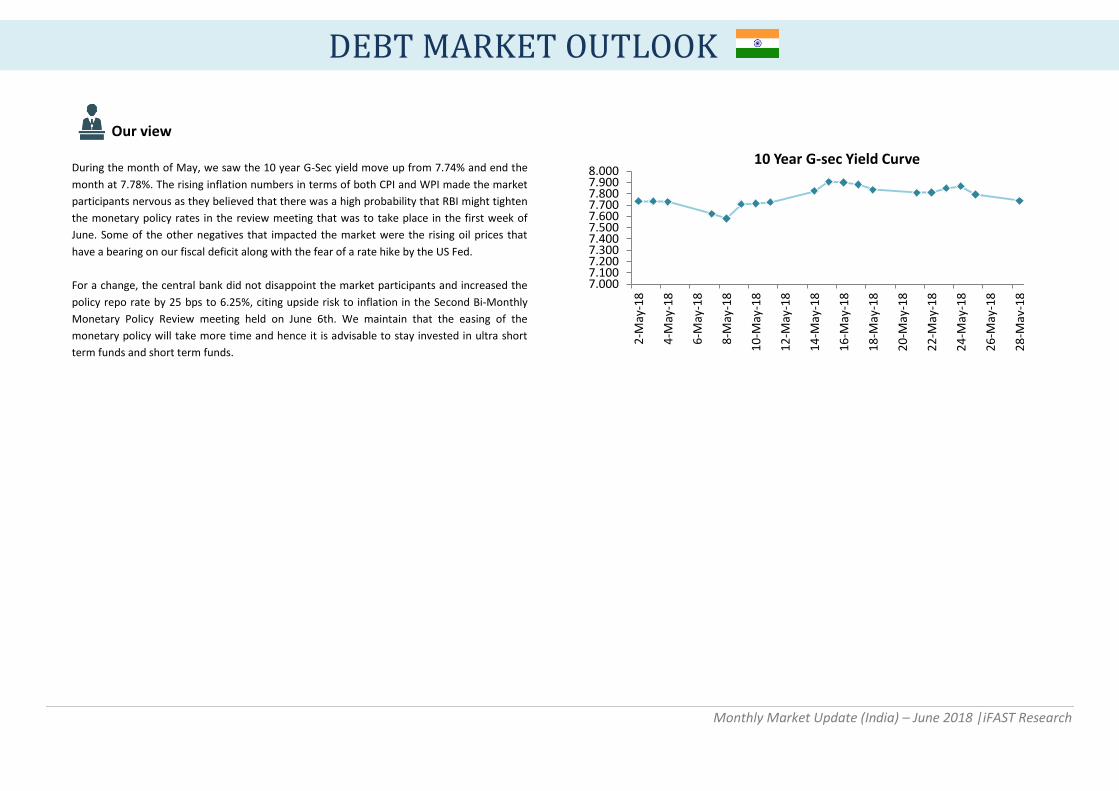
Our view
During the month of May, we saw the 10 year G-Sec yield move up from 7.74% and end the
month at 7.78%. The rising inflation numbers in terms of both CPI and WPI made the market
participants nervous as they believed that there was a high probability that RBI might tighten
the monetary policy rates in the review meeting that was to take place in the first week of
June. Some of the other negatives that impacted the market were the rising oil prices that
have a bearing on our fiscal deficit along with the fear of a rate hike by the US Fed.
For a change, the central bank did not disappoint the market participants and increased the
policy repo rate by 25 bps to 6.25%, citing upside risk to inflation in the Second Bi-Monthly
Monetary Policy Review meeting held on June 6th. We maintain that the easing of the
monetary policy will take more time and hence it is advisable to stay invested in ultra short
term funds and short term funds.
7.000 7.100 7.200 7.300 7.400 7.500 7.600 7.700 7.800 7.900 8.000
2-M
ay-1
8
4-M
ay-1
8
6-M
ay-1
8
8-M
ay-1
8
10
-May
-18
12
-May
-18
14
-May
-18
16
-May
-18
18
-May
-18
20
-May
-18
22
-May
-18
24
-May
-18
26
-May
-18
28
-May
-18
10 Year G-sec Yield Curve
DEBT MARKET OUTLOOK
Monthly Market Update (India) – June 2018 |iFAST Research
*Source: Bloomberg, iFAST Compilations. All returns are in respective local currency terms
Our View
In terms of employment numbers, April’s nonfarm payrolls came in at 164,000 as
compared to a March’s upward-revised 135,000. The unemployment rate fell to 3.9%,
while wages rose 2.6% year-on-year, similar to the prior downward-revised 2.6% year-
on-year gain (wages rose 0.1% month-on-month). We maintain our view that the pace
of job growth in the US will gradually moderate to a lower pace, as the US enters the
later stages of its business cycle. We acknowledge the near-term benefits of the recent
fiscal package, but are cognisant of relatively stretched valuations that limit the
potential upside to any long term investor. We maintain our rating of 2.0 Stars
“Unattractive” for the US equity market.
In terms of economic data, Eurozone advance GDP estimates for 1Q 18 came in at a
2.5% year-on-year rate, down from a prior upward-revised 2.8% year-on-year increase.
On a quarter-on-quarter basis, the economy grew by 0.4% (in line with consensus
estimates), slowing from 4Q 17’s upward-revised 0.7% growth rate. On a per-country
basis, the Eurostat’s data showed that growth slowed in Germany, France and in
Britain, while Italy and Spain saw a similar quarter-on-quarter growth rate in 1Q 18 as
compared to 4Q 17. Leading indicators such as the preliminary PMIs from Markit for the
month of May were softer than expected across the core countries such as Germany
and France, while Britain’s composite PMI reading stabilised in the month of April. With
data generally weaker than expected, investor optimism has declined correspondingly, and this is
reflected in lower ZEW readings in Germany and lower Sentix readings for the Eurozone. We do not
think that overall growth will slow down significantly at this juncture, and as such, any positive surprise
going into the second half of 2018 will benefit risk assets given that investors’ expectations have been
lowered. We maintain a 2.5 Stars “Neutral” rating for Europe, and advocate investors to remain an
underweight exposure to European equities in their portfolios.
Volatility once again struck Japanese equities in May, where Japanese equities spend first half of the
month rising, followed by a downward correction starting on 23 May 2018. Interestingly, besides the
political instability of Italy, the majority of recent downside catalysts is a reversal of previous upside
drivers. US Treasury bond yields fell from 3.11% to as low as 2.78% on 29 May, pressuring Japanese
equities as the JPY strengthened. We have been expecting a correction in rate hike expectation as we
are skeptical for quicker US rate hikes, but we also see no reason that the US Fed will give up their own
plan of raising rates three times this year; the fact that future implied probability of two rate hikes in
2018 has risen significantly points to possible market over-reaction in face of Italy uncertainties, this
could potentially provide treasury yield some correction momentum later on.We maintain our star
ratings of the Japanese market at an “Attractive” rating of 3.5 stars.
USA
Nonfarm payrolls rose 164,000 in Apr 18, after an upward-revised 135,000 gain in Mar 18
Private payrolls rose 168,000 in Apr 18, after an upward-revised 135,000 gain in Mar 18
Unemployment rate unchanged at 3.9% in Apr 18
EUROPE
Advance reading of Eurozone PMI composite at 54.1 in May 18, as compared to a finalised 55.1 in
Apr 18
Advance Consumer Confidence at 0.2 in May 18, decreasing from a finalised 0.3 reading in Apr 18
JAPAN
Apr Consumer Confidence Index fell to 43.6 from Mar’s 44.3
May Manufacturing PMI’s preliminary figure fell to 52.5, down from 53.8 in Apr
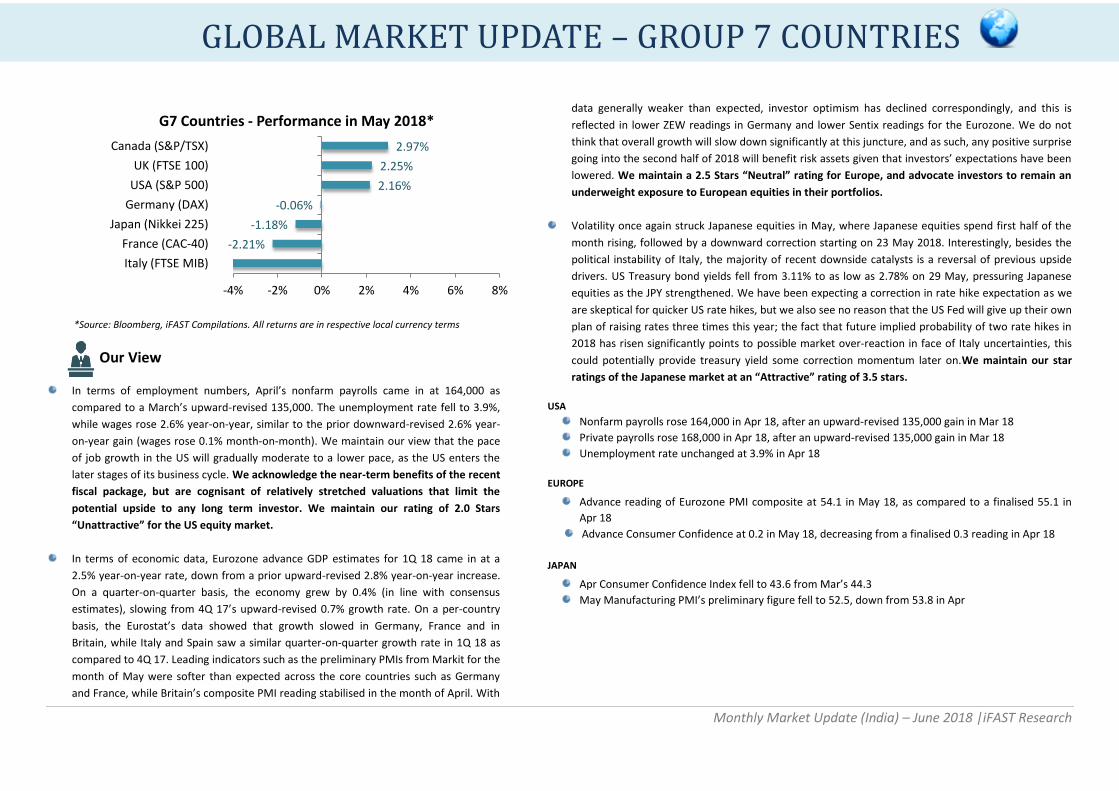
-2.21%
-1.18%
-0.06%
2.16%
2.25%
2.97%
-4% -2% 0% 2% 4% 6% 8%
Italy (FTSE MIB)
France (CAC-40)
Japan (Nikkei 225)
Germany (DAX)
USA (S&P 500)
UK (FTSE 100)
Canada (S&P/TSX)
G7 Countries - Performance in May 2018*
GLOBAL MARKET UPDATE – GROUP 7 COUNTRIES
Monthly Market Update (India) – June 2018 |iFAST Research
*Source: Bloomberg, iFAST Compilations. All returns are in respective local currency terms
Our View
CPI rose 0.1% year-on-year, cooling from a prior 0.2% year-on-year increase and falling
short of the consensus forecast of a 0.4% year-on-year rise. On a month-on-month
basis, CPI fell -0.5% as compared to the consensus estimate of a -0.1% decline, and
declining from a prior -0.2% decrease. Core CPI, which excludes energy, private
transport and accommodation costs, rose 1.3% year-on-year in April (consensus was for
a 1.4% year-on-year gain), easing from a prior 1.5% year-on-year increase. The decrease
was seen across most categories, with recreation articles the only exception, registering
a 0.7% year-on-year rise as compared to a 0.6% year-on-year increase in March.
Healthcare, clothing and education all registered slower year-on-year increases. While
the Monetary Authority of Singapore (MAS) did not make any changes to its inflation
forecasts, policy-makers now believe that inflation in 2018 will come in within the
current upper range of the targeted 1.0% - 2.0% range. We maintain a 4.0 Stars “Very
Attractive” rating on the Singapore equity market.
Across the month of May, the SET Index had its 2018 earnings forecasts upgraded by
1.5%, while 2019 earnings estimates remain unchanged. These brings the Thai equities’
earnings growth to 9.9% and 8.8% respectively over 2018 and 2019. Energy (+0.7%)
received earnings upgrades from analysts, with PTT PCL contributing most of the
earnings upgrades. Market participants expect the company’s earnings to remain
resilient on the back of robust gas business (renewals on gas block concessions) and
higher earnings contribution from downstream affiliates. Similarly, Industrials got its
earnings estimates revised upwards by 0.6%. Synergetic Auto Performance, a Thailand
car rental business is expected to generate higher revenues by higher volume of used car sales and a
boost in rental rates by increasing tourist arrivals towards the end of 2018. Other sectors who
witnessed an upgrade in earnings estimates are Health Care (+0.2%), Utilities (+0.2%) and
Telecommunication. We maintain the star rating for Indonesia at 3.0 stars (Attractive).
As for South Korea, it suffered from a sell-off on 29 May 2018 as fears over US-China Trade War rose.
It is however interesting that pure semi-conductor manufacturer SK Hynix are not influenced by
market drop at all, potentially result of still strong semiconductor demand throughout 1Q and possibly
extending to 2Q 18 of the year.The financial sector within South Korea faced consistent downward
pressure in May despite a recovery in April. We continue to see opportunity and potential within the
banking sector despite recent weakness. Current market interest remain consistently higher than
2017, with another rate hike by the central bank still on the table for rest of the year. A better interest
rate environment is now translating into better earnings for banks, where 8 out of 9 banks who are
under KOSPI index and have reported quarterly earnings posted an earnings surprise for their 1Q
results, and financial report results shows that multiple players have demonstrated visible
improvement in interest margins within 1Q of the year. Fundamentals seem to be solid for Korean
banks under current scenario.. Thus we remain bullish on south Korea financials and maintain our
star ratings of 4.5 stars “Very Attractive”.
SINGAPORE
Core CPI came in at 1.3% y-o-y in Apr 18, as compared to a 1.5% y-o-y rise in Mar 18 Industrial production rose 9.1% y-o-y in Apr 18, after an upward-revised 6.1% rise in Mar 18
INDONESIA
Exports grew to 9.01% y-o-y in Apr, after an upward-revised 6.14% y-o-y expansion in Mar 18 Imports grew by 34.68% y-o-y in Apr, after an upward-revised 9.07% y-o-y growth in Mar 18
SOUTH KOREA
KRW depreciated by -1.3% against USD month-to-date (as of 29 May 2018), as compared to -0.9% depreciation seen in Apr
Apr Manufacturing PMI fell to 48.4, down from 49.1 in Mar
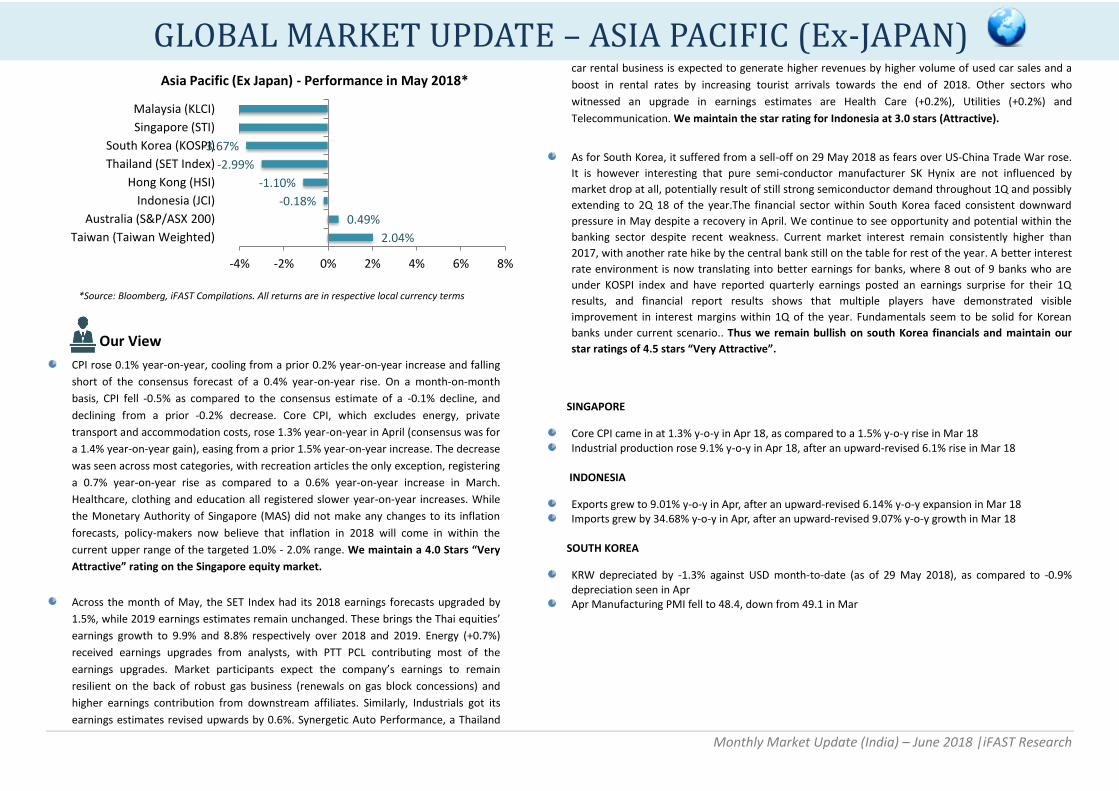
2.04%
0.49%
-0.18%
-1.10%
-2.99%
-3.67%
-4% -2% 0% 2% 4% 6% 8%
Taiwan (Taiwan Weighted)
Australia (S&P/ASX 200)
Indonesia (JCI)
Hong Kong (HSI)
Thailand (SET Index)
South Korea (KOSPI)
Singapore (STI)
Malaysia (KLCI)
Asia Pacific (Ex Japan) - Performance in May 2018*
GLOBAL MARKET UPDATE – ASIA PACIFIC (Ex-JAPAN)
Monthly Market Update (India) – June 2018 |iFAST Research
GLOBAL MARKET UPDATE – BRIC (Ex-India)
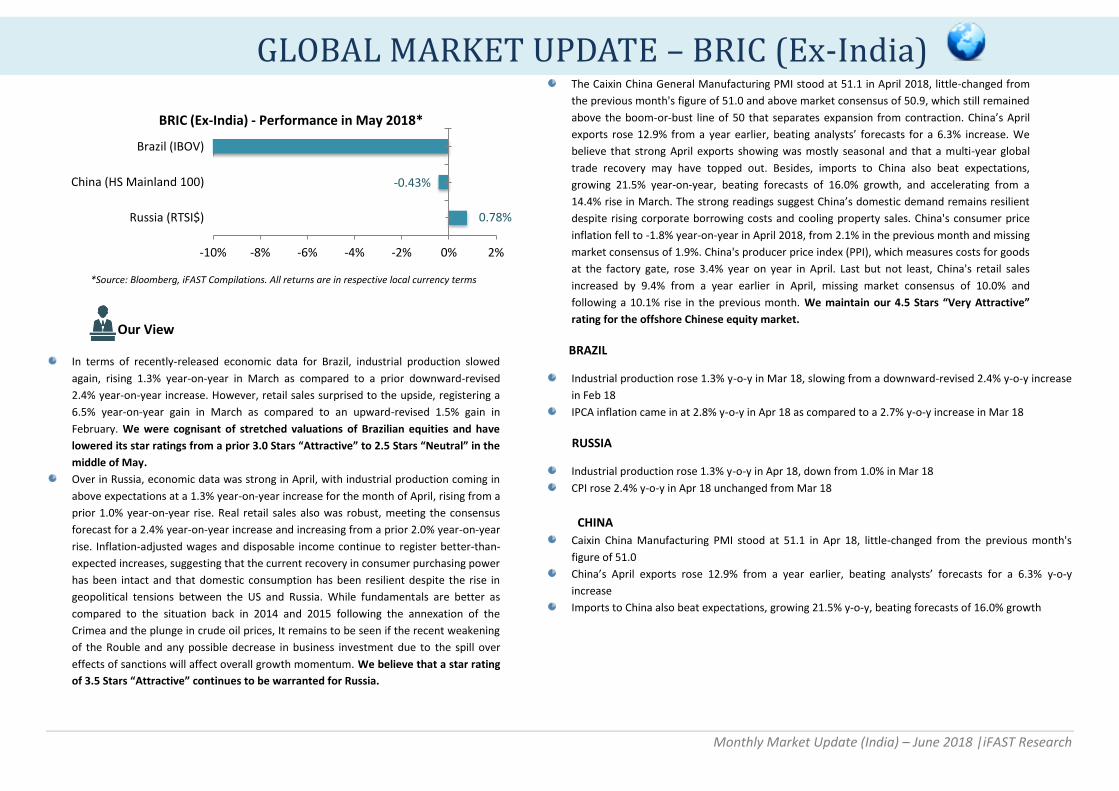
*Source: Bloomberg, iFAST Compilations. All returns are in respective local currency terms
Our View
In terms of recently-released economic data for Brazil, industrial production slowed
again, rising 1.3% year-on-year in March as compared to a prior downward-revised
2.4% year-on-year increase. However, retail sales surprised to the upside, registering a
6.5% year-on-year gain in March as compared to an upward-revised 1.5% gain in
February. We were cognisant of stretched valuations of Brazilian equities and have
lowered its star ratings from a prior 3.0 Stars “Attractive” to 2.5 Stars “Neutral” in the
middle of May. Over in Russia, economic data was strong in April, with industrial production coming in
above expectations at a 1.3% year-on-year increase for the month of April, rising from a
prior 1.0% year-on-year rise. Real retail sales also was robust, meeting the consensus
forecast for a 2.4% year-on-year increase and increasing from a prior 2.0% year-on-year
rise. Inflation-adjusted wages and disposable income continue to register better-than-
expected increases, suggesting that the current recovery in consumer purchasing power
has been intact and that domestic consumption has been resilient despite the rise in
geopolitical tensions between the US and Russia. While fundamentals are better as
compared to the situation back in 2014 and 2015 following the annexation of the
Crimea and the plunge in crude oil prices, It remains to be seen if the recent weakening
of the Rouble and any possible decrease in business investment due to the spill over
effects of sanctions will affect overall growth momentum. We believe that a star rating
of 3.5 Stars “Attractive” continues to be warranted for Russia.
The Caixin China General Manufacturing PMI stood at 51.1 in April 2018, little-changed from
the previous month's figure of 51.0 and above market consensus of 50.9, which still remained
above the boom-or-bust line of 50 that separates expansion from contraction. China’s April
exports rose 12.9% from a year earlier, beating analysts’ forecasts for a 6.3% increase. We
believe that strong April exports showing was mostly seasonal and that a multi-year global
trade recovery may have topped out. Besides, imports to China also beat expectations,
growing 21.5% year-on-year, beating forecasts of 16.0% growth, and accelerating from a
14.4% rise in March. The strong readings suggest China’s domestic demand remains resilient
despite rising corporate borrowing costs and cooling property sales. China's consumer price
inflation fell to -1.8% year-on-year in April 2018, from 2.1% in the previous month and missing
market consensus of 1.9%. China's producer price index (PPI), which measures costs for goods
at the factory gate, rose 3.4% year on year in April. Last but not least, China's retail sales
increased by 9.4% from a year earlier in April, missing market consensus of 10.0% and
following a 10.1% rise in the previous month. We maintain our 4.5 Stars “Very Attractive”
rating for the offshore Chinese equity market.
BRAZIL
Industrial production rose 1.3% y-o-y in Mar 18, slowing from a downward-revised 2.4% y-o-y increase
in Feb 18
IPCA inflation came in at 2.8% y-o-y in Apr 18 as compared to a 2.7% y-o-y increase in Mar 18
RUSSIA
Industrial production rose 1.3% y-o-y in Apr 18, down from 1.0% in Mar 18
CPI rose 2.4% y-o-y in Apr 18 unchanged from Mar 18
CHINA
Caixin China Manufacturing PMI stood at 51.1 in Apr 18, little-changed from the previous month's
figure of 51.0
China’s April exports rose 12.9% from a year earlier, beating analysts’ forecasts for a 6.3% y-o-y
increase
Imports to China also beat expectations, growing 21.5% y-o-y, beating forecasts of 16.0% growth
0.78%
-0.43%
-10% -8% -6% -4% -2% 0% 2%
Russia (RTSI$)
China (HS Mainland 100)
Brazil (IBOV)
BRIC (Ex-India) - Performance in May 2018*
Monthly Market Update (India) – June 2018 |iFAST Research
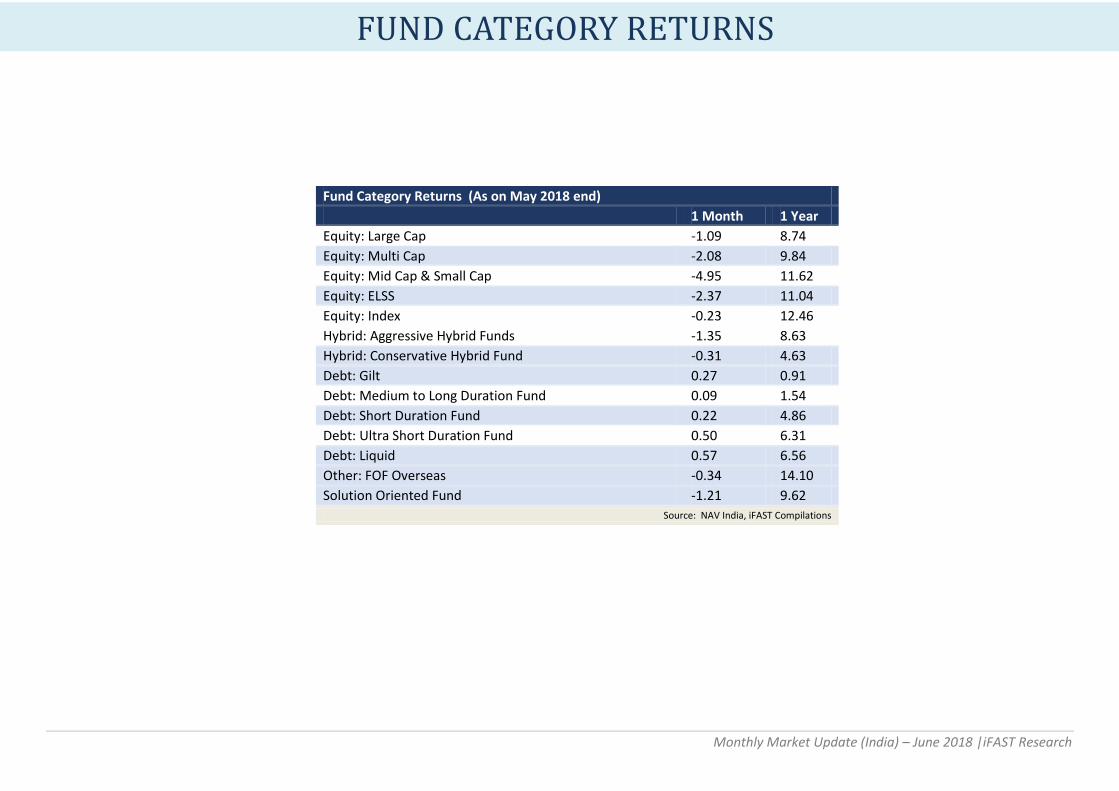
Fund Category Returns (As on May 2018 end)
1 Month 1 Year
Equity: Large Cap -1.09 8.74
Equity: Multi Cap -2.08 9.84
Equity: Mid Cap & Small Cap -4.95 11.62
Equity: ELSS -2.37 11.04
Equity: Index -0.23 12.46
Hybrid: Aggressive Hybrid Funds -1.35 8.63
Hybrid: Conservative Hybrid Fund -0.31 4.63
Debt: Gilt 0.27 0.91
Debt: Medium to Long Duration Fund 0.09 1.54
Debt: Short Duration Fund 0.22 4.86
Debt: Ultra Short Duration Fund 0.50 6.31
Debt: Liquid 0.57 6.56
Other: FOF Overseas -0.34 14.10
Solution Oriented Fund -1.21 9.62
Source: NAV India, iFAST Compilations
FUND CATEGORY RETURNS
Monthly Market Update (India) – June 2018 |iFAST Research
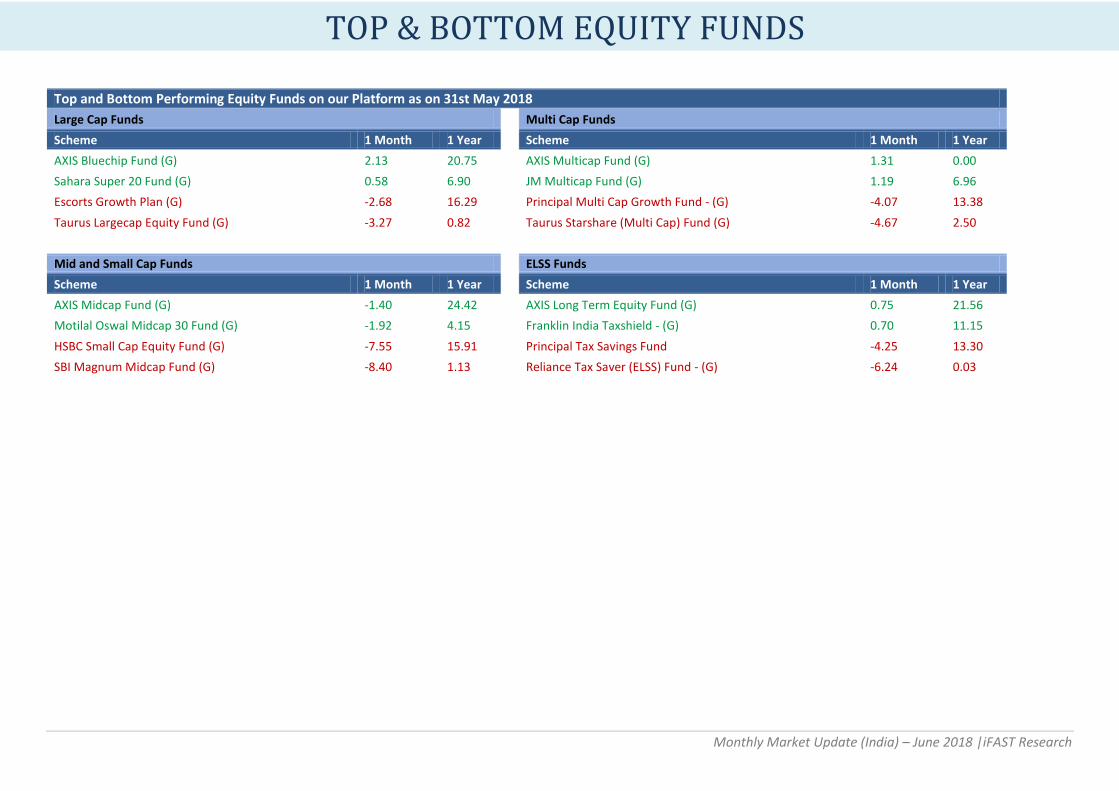
Top and Bottom Performing Equity Funds on our Platform as on 31st May 2018
Large Cap Funds Multi Cap Funds
Scheme 1 Month 1 Year Scheme 1 Month 1 Year
AXIS Bluechip Fund (G) 2.13 20.75 AXIS Multicap Fund (G) 1.31 0.00
Sahara Super 20 Fund (G) 0.58 6.90 JM Multicap Fund (G) 1.19 6.96
Escorts Growth Plan (G) -2.68 16.29 Principal Multi Cap Growth Fund - (G) -4.07 13.38
Taurus Largecap Equity Fund (G) -3.27 0.82 Taurus Starshare (Multi Cap) Fund (G) -4.67 2.50
Mid and Small Cap Funds ELSS Funds
Scheme 1 Month 1 Year Scheme 1 Month 1 Year
AXIS Midcap Fund (G) -1.40 24.42 AXIS Long Term Equity Fund (G) 0.75 21.56
Motilal Oswal Midcap 30 Fund (G) -1.92 4.15 Franklin India Taxshield - (G) 0.70 11.15
HSBC Small Cap Equity Fund (G) -7.55 15.91 Principal Tax Savings Fund -4.25 13.30
SBI Magnum Midcap Fund (G) -8.40 1.13 Reliance Tax Saver (ELSS) Fund - (G) -6.24 0.03
TOP & BOTTOM EQUITY FUNDS
Monthly Market Update (India) – June 2018 |iFAST Research
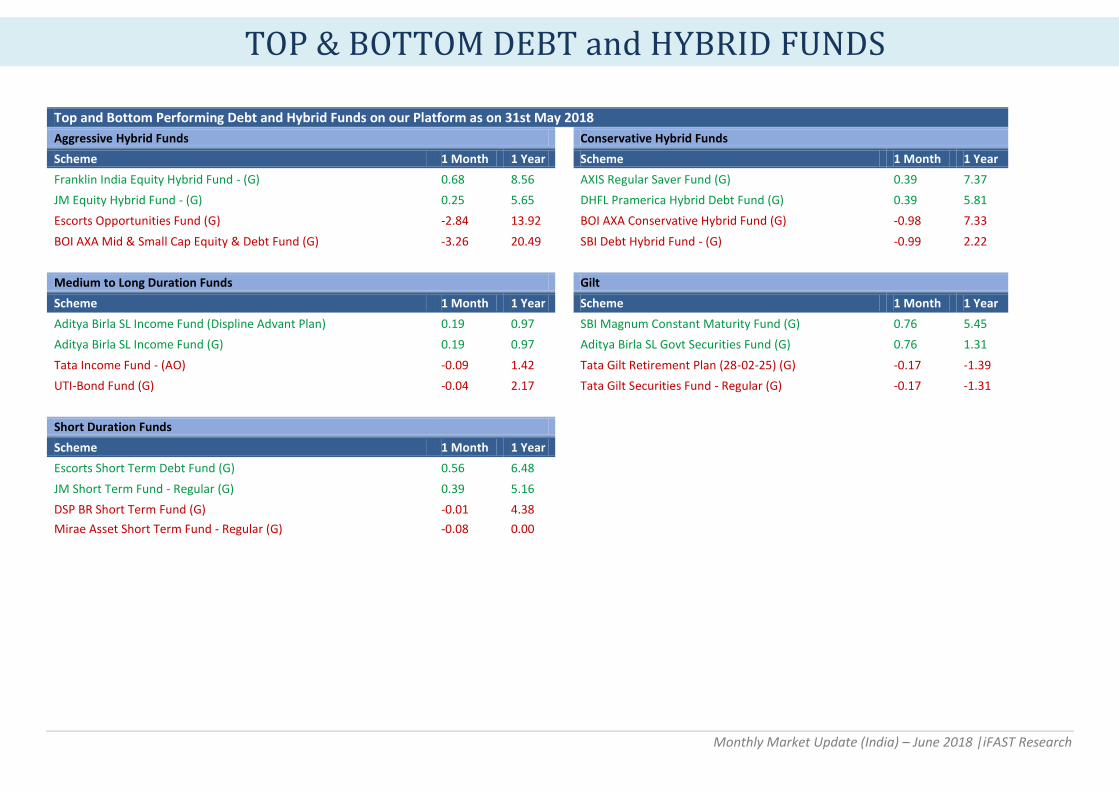
Top and Bottom Performing Debt and Hybrid Funds on our Platform as on 31st May 2018
Aggressive Hybrid Funds Conservative Hybrid Funds
Scheme 1 Month 1 Year Scheme 1 Month 1 Year
Franklin India Equity Hybrid Fund - (G) 0.68 8.56 AXIS Regular Saver Fund (G) 0.39 7.37
JM Equity Hybrid Fund - (G) 0.25 5.65 DHFL Pramerica Hybrid Debt Fund (G) 0.39 5.81
Escorts Opportunities Fund (G) -2.84 13.92 BOI AXA Conservative Hybrid Fund (G) -0.98 7.33
BOI AXA Mid & Small Cap Equity & Debt Fund (G) -3.26 20.49 SBI Debt Hybrid Fund - (G) -0.99 2.22
Medium to Long Duration Funds Gilt
Scheme 1 Month 1 Year Scheme 1 Month 1 Year
Aditya Birla SL Income Fund (Displine Advant Plan) 0.19 0.97 SBI Magnum Constant Maturity Fund (G) 0.76 5.45
Aditya Birla SL Income Fund (G) 0.19 0.97 Aditya Birla SL Govt Securities Fund (G) 0.76 1.31
Tata Income Fund - (AO) -0.09 1.42 Tata Gilt Retirement Plan (28-02-25) (G) -0.17 -1.39
UTI-Bond Fund (G) -0.04 2.17 Tata Gilt Securities Fund - Regular (G) -0.17 -1.31
Short Duration Funds
Scheme 1 Month 1 Year
Escorts Short Term Debt Fund (G) 0.56 6.48
JM Short Term Fund - Regular (G) 0.39 5.16
DSP BR Short Term Fund (G) -0.01 4.38 Mirae Asset Short Term Fund - Regular (G) -0.08 0.00
TOP & BOTTOM DEBT and HYBRID FUNDS
Monthly Market Update (India) – June 2018 |iFAST Research
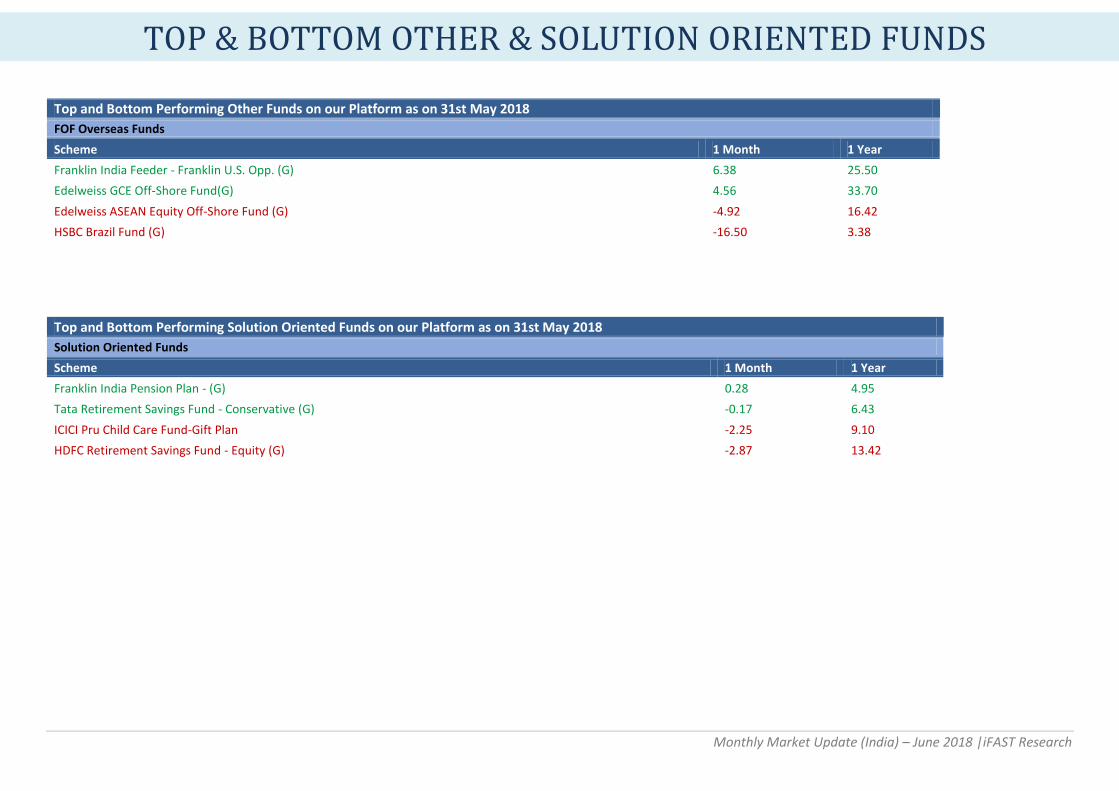
Top and Bottom Performing Other Funds on our Platform as on 31st May 2018
FOF Overseas Funds
Scheme 1 Month 1 Year
Franklin India Feeder - Franklin U.S. Opp. (G) 6.38 25.50
Edelweiss GCE Off-Shore Fund(G) 4.56 33.70
Edelweiss ASEAN Equity Off-Shore Fund (G) -4.92 16.42
HSBC Brazil Fund (G) -16.50 3.38
Top and Bottom Performing Solution Oriented Funds on our Platform as on 31st May 2018
Solution Oriented Funds
Scheme 1 Month 1 Year
Franklin India Pension Plan - (G) 0.28 4.95
Tata Retirement Savings Fund - Conservative (G) -0.17 6.43
ICICI Pru Child Care Fund-Gift Plan -2.25 9.10
HDFC Retirement Savings Fund - Equity (G) -2.87 13.42
TOP & BOTTOM OTHER & SOLUTION ORIENTED FUNDS
Monthly Market Update (India) – June 2018 |iFAST Research
DISCLAIMER: THIS REPORT IS NOT TO BE CONSTRUED AS AN OFFER OR SOLICITATION FOR THE SUBSCRIPTION, PURCHASE OR SALE OF ANY MUTUAL FUND. ANY ADVICE HEREIN IS MADE
ON A GENERAL BASIS AND DOES NOT TAKE INTO ACCOUNT THE SPECIFIC INVESTMENT OBJECTIVE OF THE SPECIFIC PERSON OR GROUP OF PERSONS. PAST PERFORMANCE AND ANY
FORECAST IS NOT NECESSARILY INDICATIVE OF THE FUTURE OR LIKE PERFORMANCE OF THE MUTUAL FUND. THE VALUE OF UNITS AND THE INCOME FROM THEM MAY FALL AS WELL AS
RISE. OPINIONS EXPRESSED HEREIN ARE SUBJECT TO CHANGE WITHOUT NOTICE.
MUTUAL FUND INVESTMENTS ARE SUBJECT TO MARKET RISKS, READ ALL SCHEME RELATED DOCUMENTS CAREFULLY.