Embed Size (px)
Citation preview
GUIDE FOR INTERPRETING RESULTS
and TECHNICAL DATA
for the
2018 ASE ENTRY-LEVEL
CERTIFICATION TESTS
Prepared by
NATIONAL INSTITUTE FOR AUTOMOTIVE SERVICE EXCELLENCE (ASE)
©ASE 2018

1
PREFACE
NOTE: Effective July 1, 2018 the ASE Student certification program was rebranded the ASE Entry-level certification program. Throughout this guide ‘ASE Student certification’ and ‘ASE Entry-level certification’ are used interchangeably. This guide contains information on interpreting your students' results on the ASE Entry-level certification exams administered in spring or fall of 2018. Also, it includes documentation of the technical adequacy of the assessment program for its intended purposes. Always use the Guide from the year of the test to interpret student scores. Because test forms change yearly, use the 2018 Guide to interpret results from tests given in 2018, the 2017 Guide for tests given in 2017, etc. The National Institute for Automotive Service Excellence (ASE) offers the ASE Entry-level tests, which are appropriate for evaluating students who are near the end of their studies in the areas of Automobile Service and Repair, Collision Repair and Refinish, and Medium/Heavy Duty Truck. The ASE Education Foundation administers the industry's accreditation program for career-entry Automobile, Collision Repair and Refinish, and Medium/Heavy Duty Truck training programs. The standards for becoming an ASE accredited program include specifications covering the content of instruction, tools and equipment, hours, and instructor qualifications. Concurrently, ASE conducts periodic analyses of the tasks and knowledge required to successfully perform many of the vehicle service jobs in the automotive industry. The task lists developed by ASE serve as the basis for the entry-level task lists. In this way, the contents of the ASE Entry-level exams are kept current, consistent with ASE, and linked to the specific tasks and knowledge requisite to the successful performance of the various automotive service occupations. The examinations are intended for students completing two-year secondary or post-secondary automotive technician training programs. Notice to organizations using the ASE entry-level examinations: The National Institute for Automotive Service Excellence (ASE) has developed these examinations expressly for use in the context of student evaluation and voluntary Entry-level, certification and all future revisions and refinements will be made in that context. ASE expressly disclaims any responsibility for the actions of organizations or entities which decide to use these examinations in any context other than voluntary entry-level evaluation. Questions pertaining to this program should be directed to the ASE Education Foundation at 1503 Edwards Ferry Rd., NE, Suite 401, Leesburg, VA 20176. Phone 800-362-0544. Or, go to www.ASE.com/EntryLevel for more information.
2
TABLE OF CONTENTS PREFACE ..................................................................................................................................................... 1 TABLE OF CONTENTS ................................................................................................................................ 2 ASE ENTRY-LEVEL CERTIFICATION ......................................................................................................... 3
Description of the Battery ......................................................................................................................... 3 Automobile ................................................................................................................................................ 3 Collision Repair And Refinish ................................................................................................................... 3 M/H Truck ................................................................................................................................................. 3 Test Development Procedures ................................................................................................................. 3
Content Specifications .......................................................................................................................... 3 Question Writing ................................................................................................................................... 3 Test Assembly ...................................................................................................................................... 4 Passing Standards ............................................................................................................................... 4
INTERPRETING RESULTS .......................................................................................................................... 4 Notice to Organizations Using ASE Entry-level Certification Examinations ............................................ 4 Performance Comparisons ....................................................................................................................... 5
Percentile Rank Tables ........................................................................................................................ 5 Comparing Individual Students ............................................................................................................ 5 Comparing Groups of Students ............................................................................................................ 5
SCORE REPORTS ....................................................................................................................................... 5 Who Gets Reports .................................................................................................................................... 5 Score Reports Retention and Replacement ............................................................................................. 5 Automobile Percentile Rank Table – 2018 ............................................................................................... 6
How To Use This Table ........................................................................................................................ 7 Collision Repair and Refinish Percentile Rank Table – 2018 ................................................................... 8
How To Use This Table ........................................................................................................................ 8 Medium / Heavy Truck Percentile Rank Table – 2018 ............................................................................. 9
How To Use This Table ........................................................................................................................ 9 TECHNICAL DATA ..................................................................................................................................... 10
Glossary of Terms .................................................................................................................................. 10 Validity .................................................................................................................................................... 11 ASE Entry-level Test Form Statistics - Spring 2018 ............................................................................... 12
3
ASE ENTRY-LEVEL CERTIFICATION
Description of the Battery
The Entry-level certification assessment consists of three series of secure multiple-choice examinations: Automobile Service and Repair, Collision Repair and Refinish, and Medium/Heavy Truck.
Automobile • Suspension and Steering • Brakes • Electrical/Electronic Systems • Engine Performance • Engine Repair • Automatic Transmission/Transaxle • Manual Drive Train and Axles • Heating and Air Conditioning • Maintenance and Light Repair • Automobile Service Technology
Collision Repair And Refinish • Painting and Refinishing • Structural Analysis and Damage Repair • Non-structural Analysis and Damage Repair • Mechanical and Electrical Components
M/H Truck
• Diesel Engines • Electrical/Electronic Systems • Brakes • Suspension and Steering
Each series is comprised of individual tests that relate to one or more of the technical areas under the ASE Education Foundation Standards. Students may be assigned a single examination, all examinations, or any combination of them. The examinations emphasize the application of knowledge and theory to tasks actually performed by automotive technicians. The examinations may be administered twice annually. Separate student score reports are prepared for each of the examinations. There are 40 – 80 scored questions in each examination, but the tests as given will be longer because of the inclusion of unscored "pretest" questions. Administration time is recommended to be 60 – 90 minutes per exam. Each student will be given a pass/fail status on each test attempted. For each test passed, students earn an ASE Entry-level certification.
Test Development Procedures Content Specifications ASE periodically conducts analyses of the work of the motor vehicle technician in the various subject areas. Job Analysis Workshops involving subject matter experts from around the country are convened specifically for this purpose. The task lists contained in the program standards for ASE accreditation are tied to ASE’s task lists derived from these job analyses. The task lists are then organized into content outlines. These subject areas are then weighted according to judgments of frequency and criticality of the tasks performed, and these weights are translated into numbers of questions in each content area. This provides the content specifications for the examinations. As described earlier, the task lists are designed to correspond to the tasks required to successfully perform the various motor vehicle service procedures. Question Writing Items (test questions) are written by groups of subject matter experts (SME’s) who are selected and trained by the ASE staff. The item writing teams include faculty members of educational institutions as well as experienced, working automotive technicians. After the SME’s draft the items and assign content codes, the items are reviewed by other SME’s for accuracy. They are then edited, formatted, and entered into a permanent item bank. SME’s then review and approve all the text changes. Newly written items are tried out as unscored "pretest" items embedded into the test forms. Data collected in this manner are then used to identify any items that may not function properly so that they can be rewritten or discarded if necessary. All data are banked with the item text in the item banks.
4
Test Assembly New forms of the exams are developed each year for each test title. Subject matter experts begin test assembly by selecting pretested, validated items from the bank for each of the examinations. All items chosen meet ASE specifications for accuracy and statistical performance. Items are selected so that each test form meets both content and statistical specifications. ASE employs state of the art psychometric procedures, including a 3-parameter logistic IRT (Item Response Theory) model to calibrate individual test questions. These statistics are used in form development to effectively pre-equate the exams, allowing instant scoring as soon as the exam is deployed. Items are also recalibrated during and after each deployment, allowing ASE to monitor the question’s performance and detect any problems, including changes in an item’s relevance or difficulty. This process contributes to consistency in form difficulty and other performance characteristics across school years. Instructors can have confidence that test forms are consistent in difficulty, free of problem questions, and meaningful in their reflection of a student’s actual ability. Items selected for the examinations are appropriately distributed among the tasks identified in the test specifications. Each form of the examination will sample the tasks, however not all tasks will be tested by each form of the examination. Relevant item statistics include discrimination (item-test correlation) indices that exceed 0.20 and a difficulty level (P-value) within the range of 0.20 to 0.90. Items with unsatisfactory statistics are discarded or rewritten. Each annual form may contain a combination of pre-tested and new items. Only pre-tested items count toward the student scores Passing Standards Passing standards are individually set for each of the examinations. The determination of passing scores for high-stakes examinations like the ASE Entry-level certification tests must be done systematically and with established procedures appropriate for such programs. Several methods are possible, but the one chosen as most appropriate is called a contrasting-groups approach. This method is based on actual performance of real students as opposed to item-level judgments made on test forms. Criterion groups of "should-pass," "borderline," and "should-not pass" students are selected in advance of testing. These selections are made by instructors with detailed knowledge of the level of preparedness of the students. After testing, a passing score is selected that minimizes the false-positive and false-negative classifications in the obtained score distributions of these groups. Passing standards set this way are generally regarded by instructors and administrators as more appropriate and more realistic than test-based judgmental approaches. These same passing standards are then carried forward to future forms of the ASE entry-level exams using the IRT equating process described above.
INTERPRETING RESULTS
The ASE entry-level exam score reports allow comparisons of a school’s or individual's performance with that of others participating in the program during the same year. Changes in group performance from year to year can be tracked reasonably well using the national percentile ranks, within the limits of the data as described in the Performance Comparisons section. Mean scores and pass/fail proportions are calculated for each of the examinations. These are reported at the instructor and school level. State reports comparing all the schools in a state are provided to the designated state level supervisor.
Notice to Organizations Using ASE Entry-level Certification Examinations The National Institute for Automotive Service Excellence (ASE) has developed these examinations expressly for use in the context of voluntary entry-level evaluation and certification, and all future revisions and refinements will be made in that context. ASE expressly disclaims any responsibility for the actions of organizations or entities which decide to use these examinations in any context other than entry-level evaluation and/or voluntary certification.
5
Performance Comparisons Percentile Rank Tables Following this narrative are tables of percentile ranks of the national population of examinees who took the current year’s test forms in the spring administration. This is useful for comparing your spring or fall students’ performance to the national sample. Individual scores and group means can be converted to percentile ranks. Instructions for using the tables are presented below each one. Comparing Individual Students Performance of individual students can of course be compared on the same test in the same year using raw scores. Percentile ranks, however, can be used to compare relative strengths across different tests. They are also useful for comparing a student’s performance to the national sample. Remember that the statistics reported for each administration are based upon the group taking the examinations in that testing period, and do not include prior year’s administrations. Comparing Groups of Students Mean scores of groups on the same test can be compared if they were tested in the same year. Raw score means and percentile rank equivalents can be compared this way. Percentile equivalents of group mean scores may also be compared across different test titles. Comparing groups across years is a more complex matter. Percentile ranks provide the best metric for comparison, but even these should be used with consideration of the limits of the data. First, the groups being compared are likely composed of different students. Also, the national sample of students changes from year to year, and there is likely some variation in ability in these reference groups. To the extent that the ability of the national reference group changes, one classroom of unchanged ability could get different percentile ranks across years. A critical issue is the extent to which the composition of your examinee group resembles that of any other group to which they are being compared. If population characteristics (e.g. age, amount of prior experience, etc.) account for differences between your students and another group, then the comparison may be of less use to you. You must make a judgment about any other characteristics that may contribute to differences in achievement, then decide how to interpret the comparison. Also, remember that the means of small groups can be expected to contain increased sampling error, and so should not be interpreted to accurately represent the performance of any larger population. For example, if only a few students from a school take a particular test, their performance should not be assumed to represent all the students in that school.
SCORE REPORTS
Who Gets Reports Reports are prepared for students, instructors, and state supervisors. Student level reports, available to both students and their instructor, include the number correct in each of the content areas, the total score, and pass/fail. The instructor report shows a summary of the information contained on that instructor’s student score reports. State reports summarize the results in terms of mean scores and pass/fail rates from each school in that state and are available to the designated state level supervisor.
Score Reports Retention and Replacement All recipients, including students, are allowed to keep their score reports. The ASE partner organizations do not provide a records-maintenance service, so duplicate or replacement copies of these reports are not normally available. Records are normally maintained in the test delivery system for the current and the two previous years and can be accessed according to the user's role in the system. Older data are not available.
6
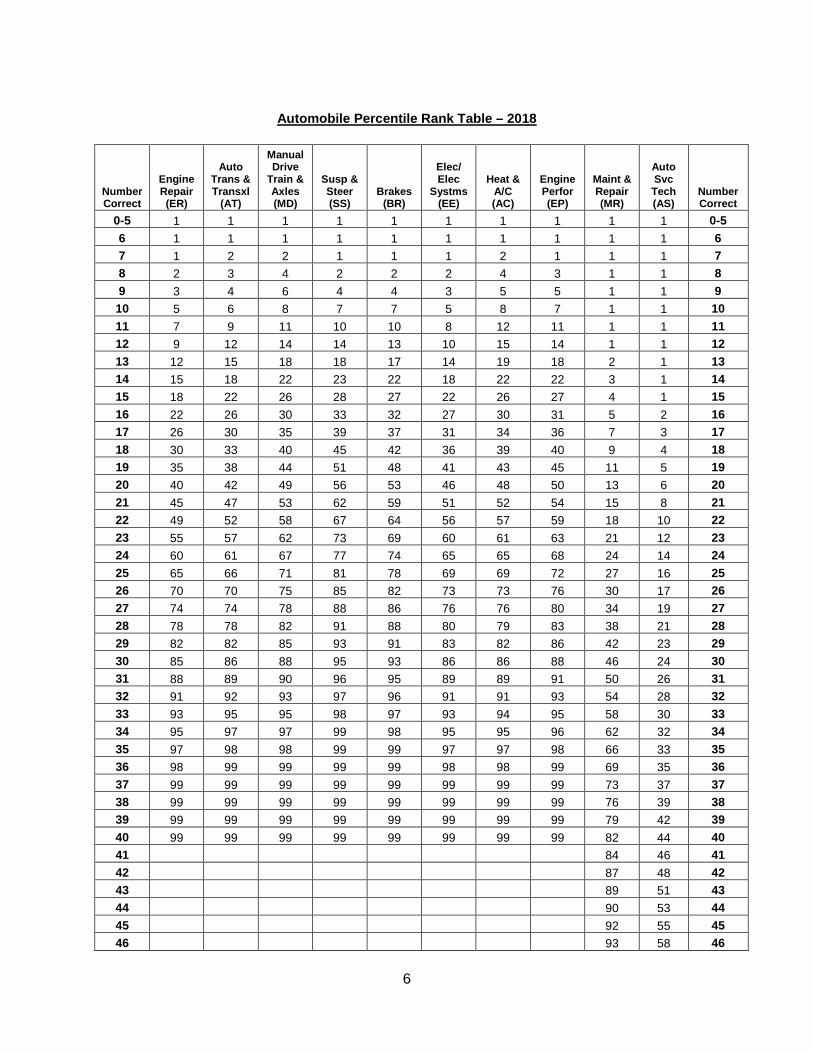
Automobile Percentile Rank Table – 2018
Number Correct
Engine Repair (ER)
Auto Trans & Transxl
(AT)
Manual Drive
Train & Axles (MD)
Susp & Steer (SS)
Brakes (BR)
Elec/ Elec
Systms (EE)
Heat & A/C (AC)
Engine Perfor (EP)
Maint & Repair (MR)
Auto Svc Tech (AS)
Number Correct
0-5 1 1 1 1 1 1 1 1 1 1 0-5 6 1 1 1 1 1 1 1 1 1 1 6 7 1 2 2 1 1 1 2 1 1 1 7 8 2 3 4 2 2 2 4 3 1 1 8 9 3 4 6 4 4 3 5 5 1 1 9 10 5 6 8 7 7 5 8 7 1 1 10 11 7 9 11 10 10 8 12 11 1 1 11 12 9 12 14 14 13 10 15 14 1 1 12 13 12 15 18 18 17 14 19 18 2 1 13 14 15 18 22 23 22 18 22 22 3 1 14 15 18 22 26 28 27 22 26 27 4 1 15 16 22 26 30 33 32 27 30 31 5 2 16 17 26 30 35 39 37 31 34 36 7 3 17 18 30 33 40 45 42 36 39 40 9 4 18 19 35 38 44 51 48 41 43 45 11 5 19 20 40 42 49 56 53 46 48 50 13 6 20 21 45 47 53 62 59 51 52 54 15 8 21 22 49 52 58 67 64 56 57 59 18 10 22 23 55 57 62 73 69 60 61 63 21 12 23 24 60 61 67 77 74 65 65 68 24 14 24 25 65 66 71 81 78 69 69 72 27 16 25 26 70 70 75 85 82 73 73 76 30 17 26 27 74 74 78 88 86 76 76 80 34 19 27 28 78 78 82 91 88 80 79 83 38 21 28 29 82 82 85 93 91 83 82 86 42 23 29 30 85 86 88 95 93 86 86 88 46 24 30 31 88 89 90 96 95 89 89 91 50 26 31 32 91 92 93 97 96 91 91 93 54 28 32 33 93 95 95 98 97 93 94 95 58 30 33 34 95 97 97 99 98 95 95 96 62 32 34 35 97 98 98 99 99 97 97 98 66 33 35 36 98 99 99 99 99 98 98 99 69 35 36 37 99 99 99 99 99 99 99 99 73 37 37 38 99 99 99 99 99 99 99 99 76 39 38 39 99 99 99 99 99 99 99 99 79 42 39 40 99 99 99 99 99 99 99 99 82 44 40 41
84 46 41
42
87 48 42 43
89 51 43
44
90 53 44 45
92 55 45
46
93 58 46
7
47
95 60 47 48
96 62 48
49
97 64 49 50
97 67 50
51
98 69 51 52
99 71 52
53
99 73 53 54
99 75 54
55
99 76 55 56
99 78 56
57
99 80 57 58
99 82 58
59
99 83 59 60
99 85 60
61
86 61 62
88 62
63
89 63 64
90 64
65
91 65 66
92 66
67
93 67 68
94 68
69
95 69 70
96 70
71
97 71 72
98 72
73
98 73 74
99 74
75
99 75 76
99 76
77
99 77 78
99 78
79
99 79 80
99 80
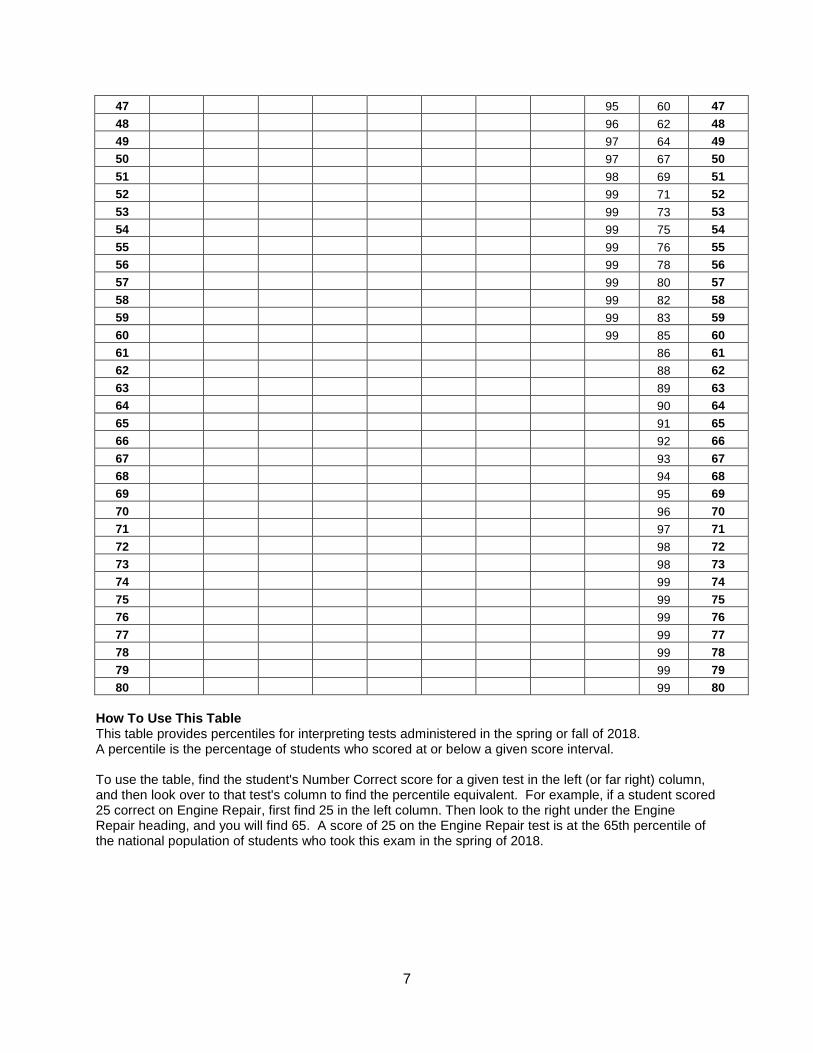
How To Use This Table This table provides percentiles for interpreting tests administered in the spring or fall of 2018. A percentile is the percentage of students who scored at or below a given score interval. To use the table, find the student's Number Correct score for a given test in the left (or far right) column, and then look over to that test's column to find the percentile equivalent. For example, if a student scored 25 correct on Engine Repair, first find 25 in the left column. Then look to the right under the Engine Repair heading, and you will find 65. A score of 25 on the Engine Repair test is at the 65th percentile of the national population of students who took this exam in the spring of 2018.
8
Collision Repair and Refinish Percentile Rank Table – 2018
Number Correct
Struct Anlys &
Dmg Rep (SR)
Nonstr Anlys &
Dmg Rep (NS)
Mech & Elect Comp (ME)
Paint & Refinish
(PR) Number Correct
0-5 1 1 1 1 0-5 6 1 1 1 1 6 7 3 1 2 1 7 8 4 3 3 2 8 9 6 4 6 3 9 10 8 7 8 4 10 11 10 10 11 6 11 12 13 13 16 8 12 13 16 17 21 11 13 14 19 21 25 14 14 15 23 25 31 17 15 16 26 30 36 22 16 17 30 35 42 27 17 18 35 40 47 33 18 19 40 45 52 38 19 20 45 51 58 44 20 21 51 57 64 50 21 22 57 62 69 56 22 23 62 68 75 62 23 24 67 72 79 67 24 25 73 77 83 72 25 26 77 81 86 77 26 27 82 85 89 81 27 28 86 87 91 84 28 29 89 90 94 87 29 30 92 93 96 90 30 31 93 94 96 93 31 32 95 96 98 95 32 33 97 97 98 96 33 34 98 98 99 98 34 35 99 99 99 99 35 36 99 99 99 99 36 37 99 99 99 99 37 38 99 99 99 99 38 39 99 99 99 99 39 40 99 99 99 99 40
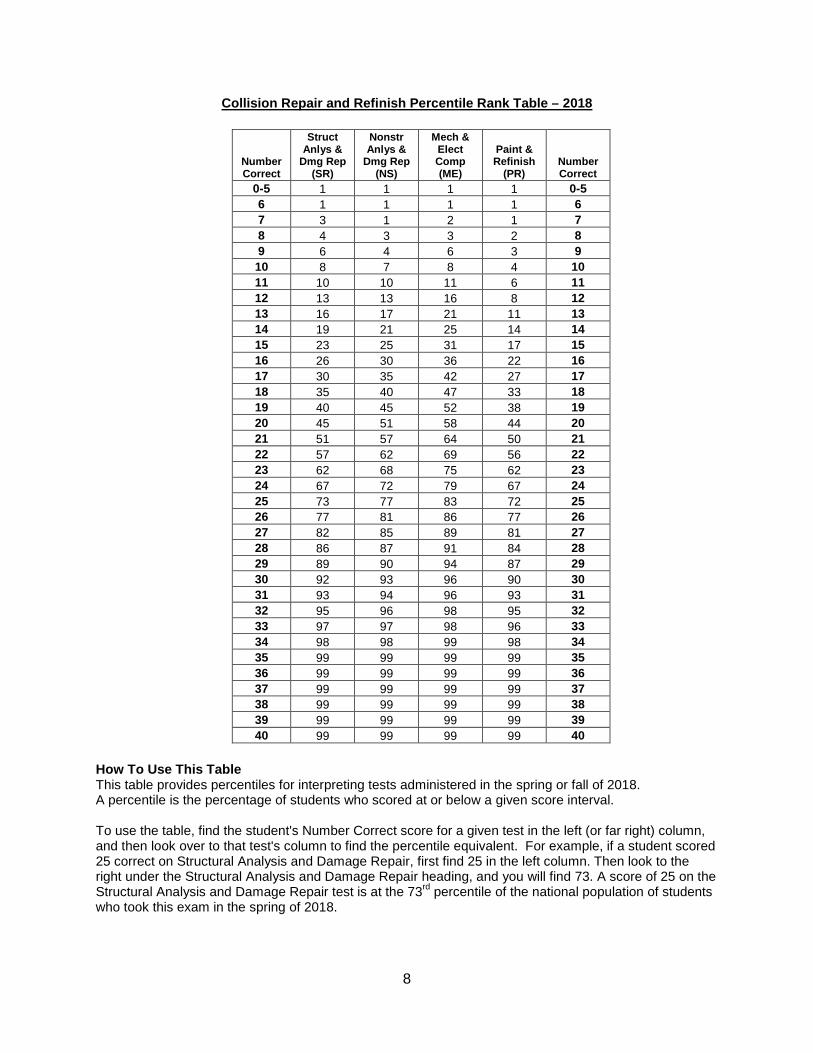
How To Use This Table This table provides percentiles for interpreting tests administered in the spring or fall of 2018. A percentile is the percentage of students who scored at or below a given score interval. To use the table, find the student's Number Correct score for a given test in the left (or far right) column, and then look over to that test's column to find the percentile equivalent. For example, if a student scored 25 correct on Structural Analysis and Damage Repair, first find 25 in the left column. Then look to the right under the Structural Analysis and Damage Repair heading, and you will find 73. A score of 25 on the Structural Analysis and Damage Repair test is at the 73rd percentile of the national population of students who took this exam in the spring of 2018.
9
Medium / Heavy Truck Percentile Rank Table – 2018
7umber Correct
Truck Diesel
Engines (DE)
Truck Brakes
(TB)
Truck Susp &
Steering (TS)
Truck Elect/Elect Systems
(TE) Number Correct
0-5 1 1 1 1 0-5 6 1 1 1 1 6 7 1 2 1 2 7 8 1 3 3 3 8 9 2 6 6 5 9
10 4 10 8 7 10 11 5 14 12 10 11 12 7 19 16 13 12 13 11 24 21 17 13 14 15 28 25 21 14 15 19 34 31 25 15 16 23 41 36 29 16 17 27 46 42 34 17 18 31 50 48 39 18 19 36 55 55 44 19 20 41 59 60 47 20 21 45 63 64 52 21 22 51 67 69 56 22 23 56 71 73 62 23 24 60 75 76 66 24 25 65 79 80 71 25 26 69 82 83 76 26 27 73 84 86 79 27 28 77 87 89 83 28 29 81 90 91 86 29 30 85 92 93 89 30 31 88 94 95 91 31 32 91 96 96 93 32 33 94 97 97 96 33 34 96 98 98 97 34 35 97 99 99 98 35 36 98 99 99 99 36 37 99 99 99 99 37 38 99 99 99 99 38 39 99 99 99 99 39 40 99 99 99 99 40
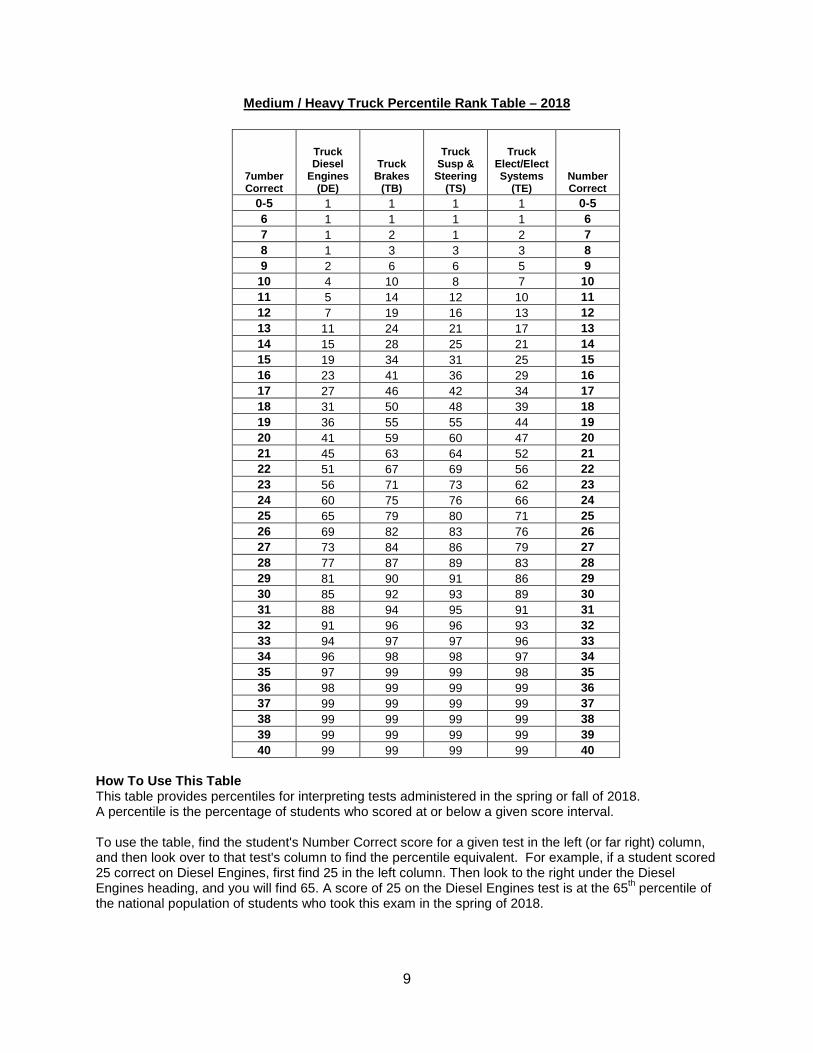
How To Use This Table This table provides percentiles for interpreting tests administered in the spring or fall of 2018. A percentile is the percentage of students who scored at or below a given score interval. To use the table, find the student's Number Correct score for a given test in the left (or far right) column, and then look over to that test's column to find the percentile equivalent. For example, if a student scored 25 correct on Diesel Engines, first find 25 in the left column. Then look to the right under the Diesel Engines heading, and you will find 65. A score of 25 on the Diesel Engines test is at the 65th percentile of the national population of students who took this exam in the spring of 2018.
10
TECHNICAL DATA
Glossary of Terms
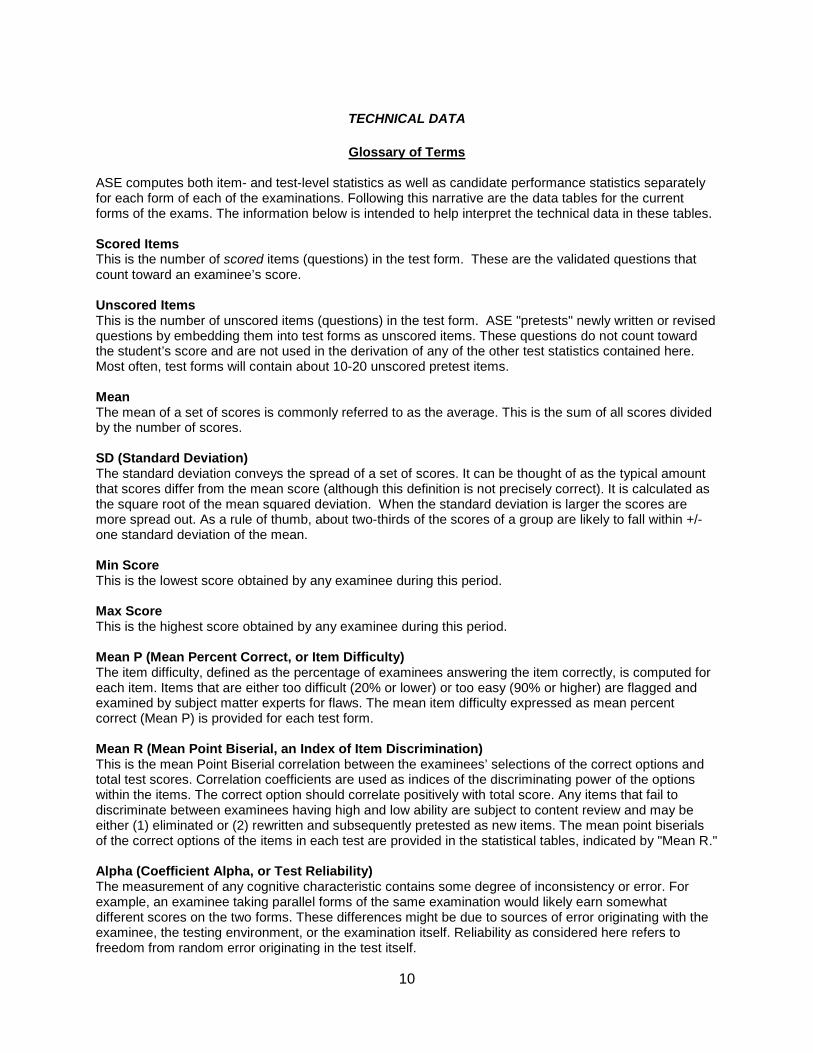
ASE computes both item- and test-level statistics as well as candidate performance statistics separately for each form of each of the examinations. Following this narrative are the data tables for the current forms of the exams. The information below is intended to help interpret the technical data in these tables. Scored Items This is the number of scored items (questions) in the test form. These are the validated questions that count toward an examinee’s score. Unscored Items This is the number of unscored items (questions) in the test form. ASE "pretests" newly written or revised questions by embedding them into test forms as unscored items. These questions do not count toward the student’s score and are not used in the derivation of any of the other test statistics contained here. Most often, test forms will contain about 10-20 unscored pretest items. Mean The mean of a set of scores is commonly referred to as the average. This is the sum of all scores divided by the number of scores. SD (Standard Deviation) The standard deviation conveys the spread of a set of scores. It can be thought of as the typical amount that scores differ from the mean score (although this definition is not precisely correct). It is calculated as the square root of the mean squared deviation. When the standard deviation is larger the scores are more spread out. As a rule of thumb, about two-thirds of the scores of a group are likely to fall within +/- one standard deviation of the mean. Min Score This is the lowest score obtained by any examinee during this period. Max Score This is the highest score obtained by any examinee during this period. Mean P (Mean Percent Correct, or Item Difficulty) The item difficulty, defined as the percentage of examinees answering the item correctly, is computed for each item. Items that are either too difficult (20% or lower) or too easy (90% or higher) are flagged and examined by subject matter experts for flaws. The mean item difficulty expressed as mean percent correct (Mean P) is provided for each test form. Mean R (Mean Point Biserial, an Index of Item Discrimination) This is the mean Point Biserial correlation between the examinees’ selections of the correct options and total test scores. Correlation coefficients are used as indices of the discriminating power of the options within the items. The correct option should correlate positively with total score. Any items that fail to discriminate between examinees having high and low ability are subject to content review and may be either (1) eliminated or (2) rewritten and subsequently pretested as new items. The mean point biserials of the correct options of the items in each test are provided in the statistical tables, indicated by "Mean R." Alpha (Coefficient Alpha, or Test Reliability) The measurement of any cognitive characteristic contains some degree of inconsistency or error. For example, an examinee taking parallel forms of the same examination would likely earn somewhat different scores on the two forms. These differences might be due to sources of error originating with the examinee, the testing environment, or the examination itself. Reliability as considered here refers to freedom from random error originating in the test itself.
11
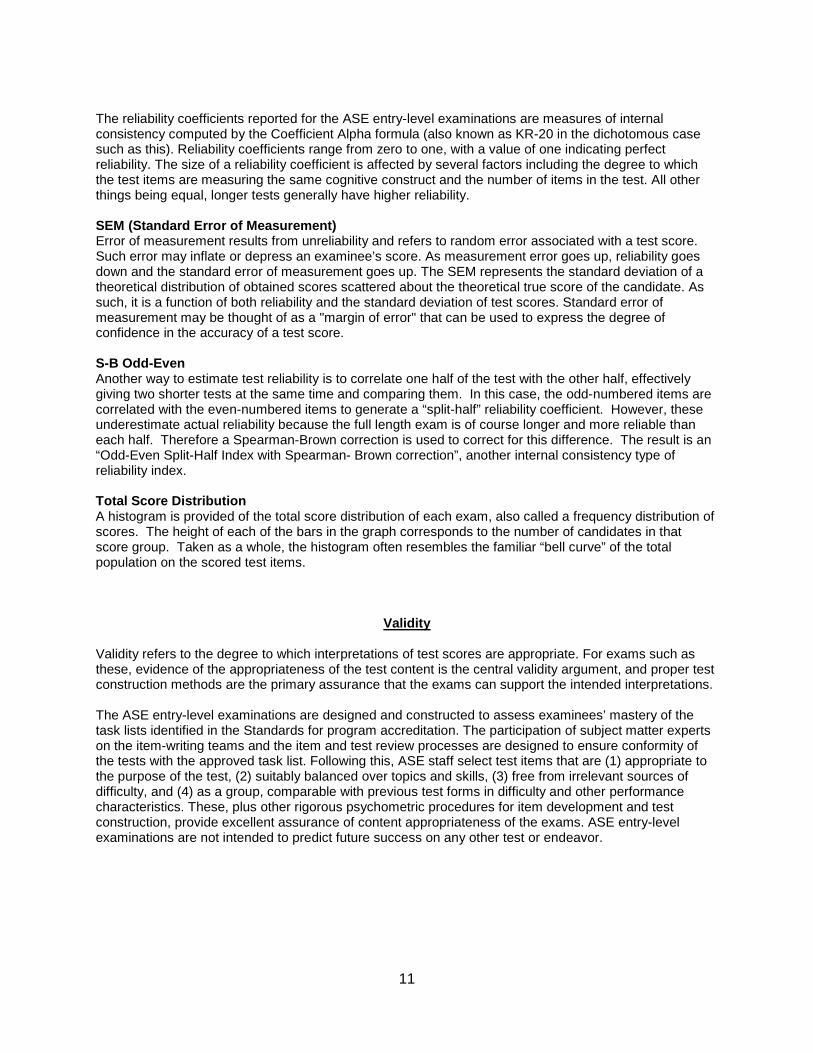
The reliability coefficients reported for the ASE entry-level examinations are measures of internal consistency computed by the Coefficient Alpha formula (also known as KR-20 in the dichotomous case such as this). Reliability coefficients range from zero to one, with a value of one indicating perfect reliability. The size of a reliability coefficient is affected by several factors including the degree to which the test items are measuring the same cognitive construct and the number of items in the test. All other things being equal, longer tests generally have higher reliability. SEM (Standard Error of Measurement) Error of measurement results from unreliability and refers to random error associated with a test score. Such error may inflate or depress an examinee’s score. As measurement error goes up, reliability goes down and the standard error of measurement goes up. The SEM represents the standard deviation of a theoretical distribution of obtained scores scattered about the theoretical true score of the candidate. As such, it is a function of both reliability and the standard deviation of test scores. Standard error of measurement may be thought of as a "margin of error" that can be used to express the degree of confidence in the accuracy of a test score. S-B Odd-Even Another way to estimate test reliability is to correlate one half of the test with the other half, effectively giving two shorter tests at the same time and comparing them. In this case, the odd-numbered items are correlated with the even-numbered items to generate a “split-half” reliability coefficient. However, these underestimate actual reliability because the full length exam is of course longer and more reliable than each half. Therefore a Spearman-Brown correction is used to correct for this difference. The result is an “Odd-Even Split-Half Index with Spearman- Brown correction”, another internal consistency type of reliability index. Total Score Distribution A histogram is provided of the total score distribution of each exam, also called a frequency distribution of scores. The height of each of the bars in the graph corresponds to the number of candidates in that score group. Taken as a whole, the histogram often resembles the familiar “bell curve” of the total population on the scored test items.
Validity
Validity refers to the degree to which interpretations of test scores are appropriate. For exams such as these, evidence of the appropriateness of the test content is the central validity argument, and proper test construction methods are the primary assurance that the exams can support the intended interpretations. The ASE entry-level examinations are designed and constructed to assess examinees’ mastery of the task lists identified in the Standards for program accreditation. The participation of subject matter experts on the item-writing teams and the item and test review processes are designed to ensure conformity of the tests with the approved task list. Following this, ASE staff select test items that are (1) appropriate to the purpose of the test, (2) suitably balanced over topics and skills, (3) free from irrelevant sources of difficulty, and (4) as a group, comparable with previous test forms in difficulty and other performance characteristics. These, plus other rigorous psychometric procedures for item development and test construction, provide excellent assurance of content appropriateness of the exams. ASE entry-level examinations are not intended to predict future success on any other test or endeavor.
12
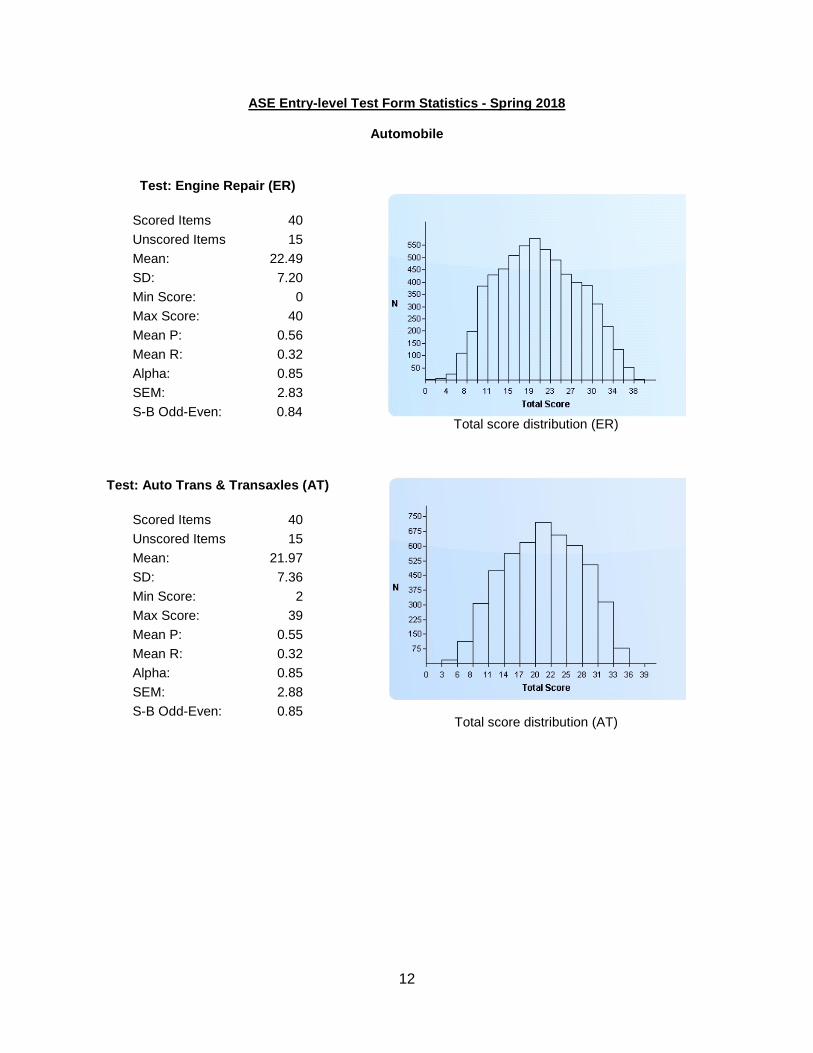
ASE Entry-level Test Form Statistics - Spring 2018
Automobile
Test: Engine Repair (ER)
Scored Items 40 Unscored Items 15 Mean: 22.49 SD: 7.20 Min Score: 0 Max Score: 40 Mean P: 0.56 Mean R: 0.32 Alpha: 0.85 SEM: 2.83 S-B Odd-Even: 0.84
Total score distribution (ER)
Test: Auto Trans & Transaxles (AT)
Scored Items 40 Unscored Items 15 Mean: 21.97 SD: 7.36 Min Score: 2 Max Score: 39 Mean P: 0.55 Mean R: 0.32 Alpha: 0.85 SEM: 2.88 S-B Odd-Even: 0.85
Total score distribution (AT)
13
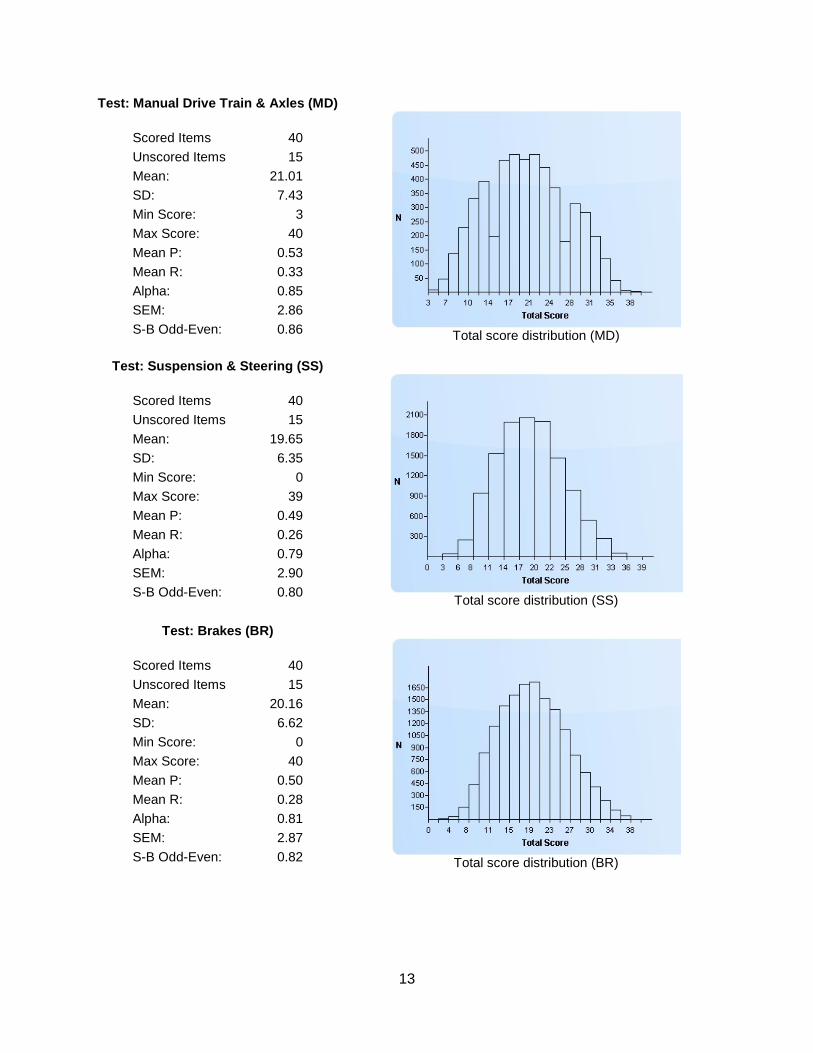
Test: Manual Drive Train & Axles (MD)
Scored Items 40 Unscored Items 15 Mean: 21.01 SD: 7.43 Min Score: 3 Max Score: 40 Mean P: 0.53 Mean R: 0.33 Alpha: 0.85 SEM: 2.86 S-B Odd-Even: 0.86
Total score distribution (MD)
Test: Suspension & Steering (SS)
Scored Items 40 Unscored Items 15 Mean: 19.65 SD: 6.35 Min Score: 0 Max Score: 39 Mean P: 0.49 Mean R: 0.26 Alpha: 0.79 SEM: 2.90 S-B Odd-Even: 0.80
Total score distribution (SS)
Test: Brakes (BR)
Scored Items 40 Unscored Items 15 Mean: 20.16 SD: 6.62 Min Score: 0 Max Score: 40 Mean P: 0.50 Mean R: 0.28 Alpha: 0.81 SEM: 2.87 S-B Odd-Even: 0.82
Total score distribution (BR)
14
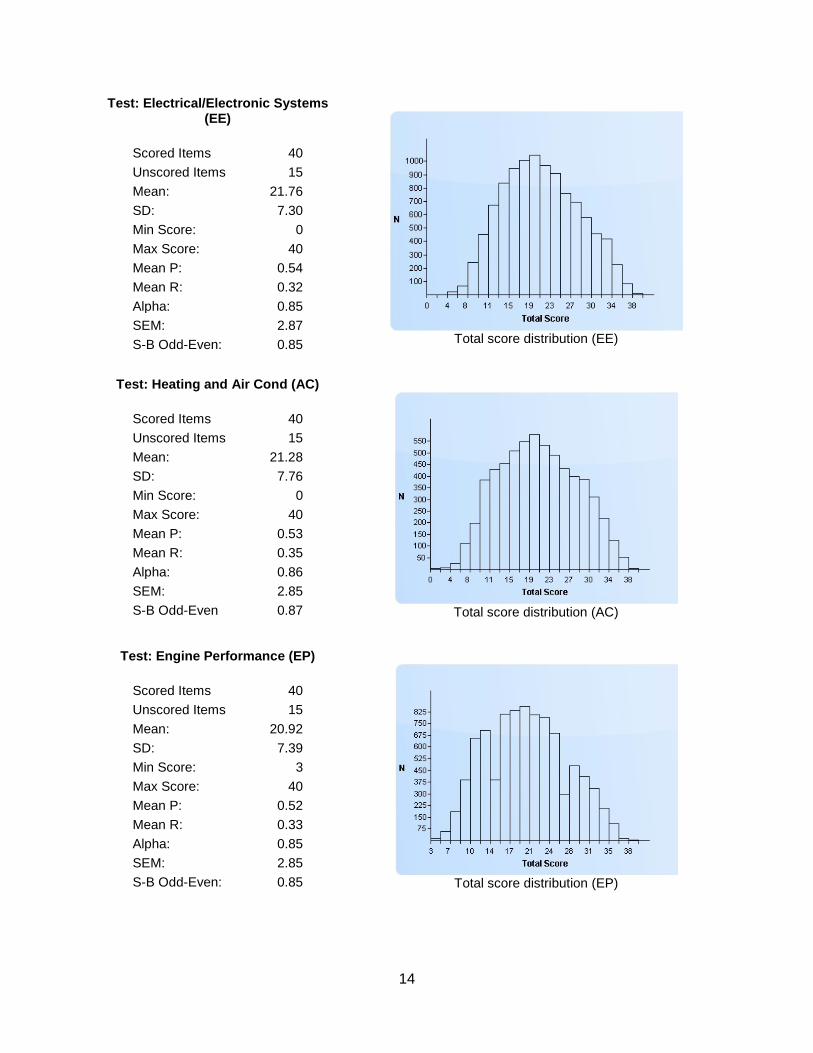
Test: Electrical/Electronic Systems (EE)
Scored Items 40 Unscored Items 15 Mean: 21.76 SD: 7.30 Min Score: 0 Max Score: 40 Mean P: 0.54 Mean R: 0.32 Alpha: 0.85 SEM: 2.87 S-B Odd-Even: 0.85
Total score distribution (EE)
Test: Heating and Air Cond (AC)
Scored Items 40 Unscored Items 15 Mean: 21.28 SD: 7.76 Min Score: 0 Max Score: 40 Mean P: 0.53 Mean R: 0.35 Alpha: 0.86 SEM: 2.85 S-B Odd-Even 0.87
Total score distribution (AC)
Test: Engine Performance (EP)
Scored Items 40 Unscored Items 15 Mean: 20.92 SD: 7.39 Min Score: 3 Max Score: 40 Mean P: 0.52 Mean R: 0.33 Alpha: 0.85 SEM: 2.85 S-B Odd-Even: 0.85
Total score distribution (EP)
15
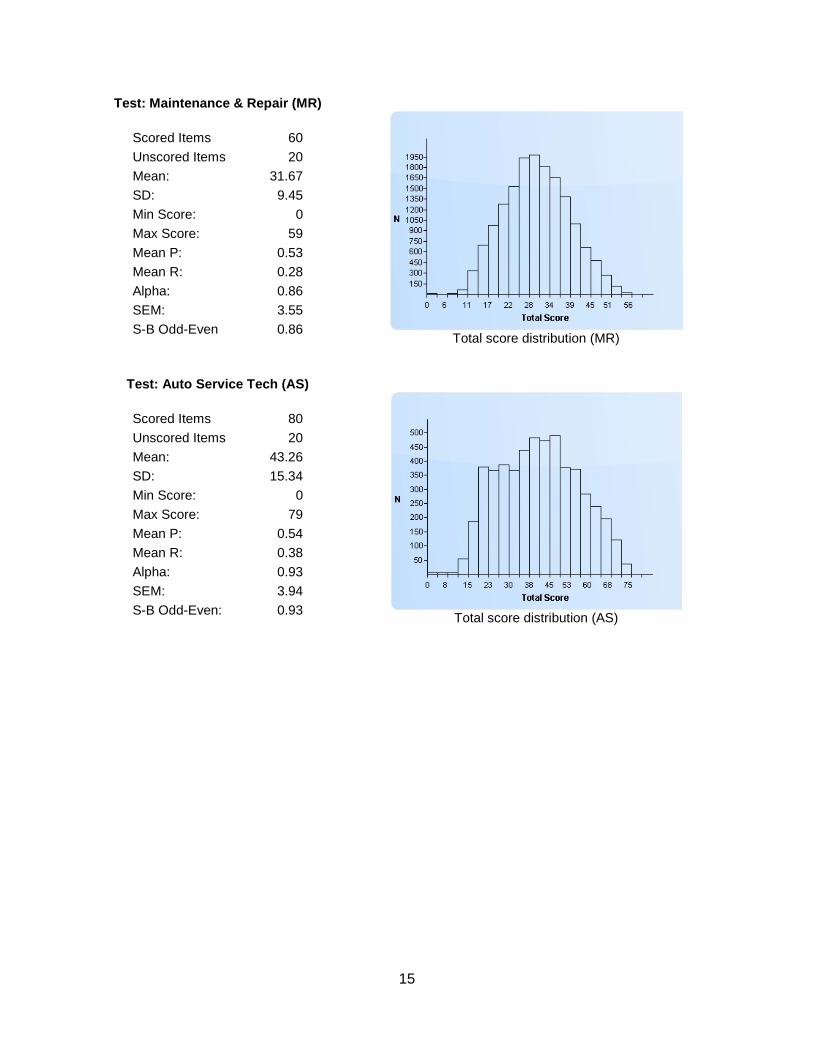
Test: Maintenance & Repair (MR)
Scored Items 60 Unscored Items 20 Mean: 31.67 SD: 9.45 Min Score: 0 Max Score: 59 Mean P: 0.53 Mean R: 0.28 Alpha: 0.86 SEM: 3.55 S-B Odd-Even 0.86
Total score distribution (MR)
Test: Auto Service Tech (AS)
Scored Items 80 Unscored Items 20 Mean: 43.26 SD: 15.34 Min Score: 0 Max Score: 79 Mean P: 0.54 Mean R: 0.38 Alpha: 0.93 SEM: 3.94 S-B Odd-Even: 0.93
Total score distribution (AS)

16
Collision Repair and Refinishing
Test: Structural Anlys & Dmg Rep (SR)
Scored Items 40 Unscored Items 15 Mean: 21.01 SD: 6.96 Min Score: 0 Max Score: 38 Mean P: 0.53 Mean R: 0.30 Alpha: 0.83 SEM: 2.89 S-B Odd-Even 0.82
Total score distribution (SR)
Test: Nonstruct Anlys & Dmg Rep (NS)
Scored Items 40 Unscored Items 15 Mean: 20.41 SD: 6.71 Min Score: 2 Max Score: 38 Mean P: 0.51 Mean R: 0.29 Alpha: 0.82 SEM: 2.86 S-B Odd-Even: 0.82
Total score distribution (NS)
17
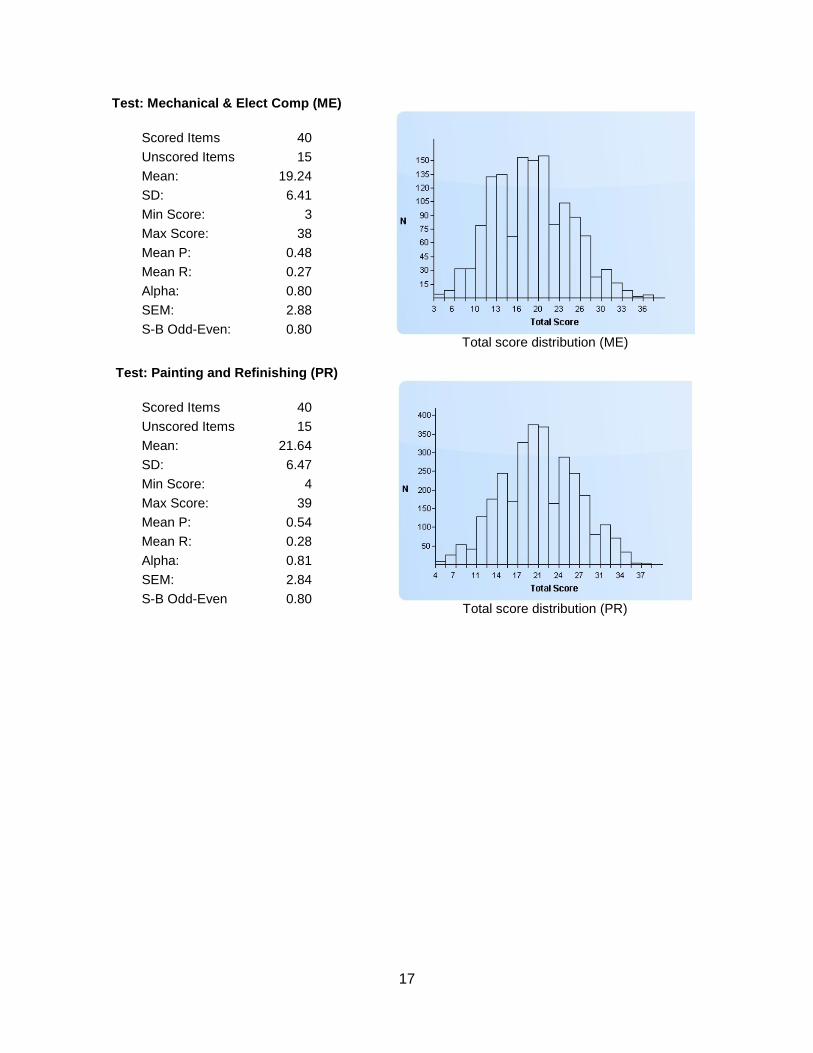
Test: Mechanical & Elect Comp (ME)
Scored Items 40 Unscored Items 15 Mean: 19.24 SD: 6.41 Min Score: 3 Max Score: 38 Mean P: 0.48 Mean R: 0.27 Alpha: 0.80 SEM: 2.88 S-B Odd-Even: 0.80
Total score distribution (ME)
Test: Painting and Refinishing (PR)
Scored Items 40 Unscored Items 15 Mean: 21.64 SD: 6.47 Min Score: 4 Max Score: 39 Mean P: 0.54 Mean R: 0.28 Alpha: 0.81 SEM: 2.84 S-B Odd-Even 0.80
Total score distribution (PR)
18
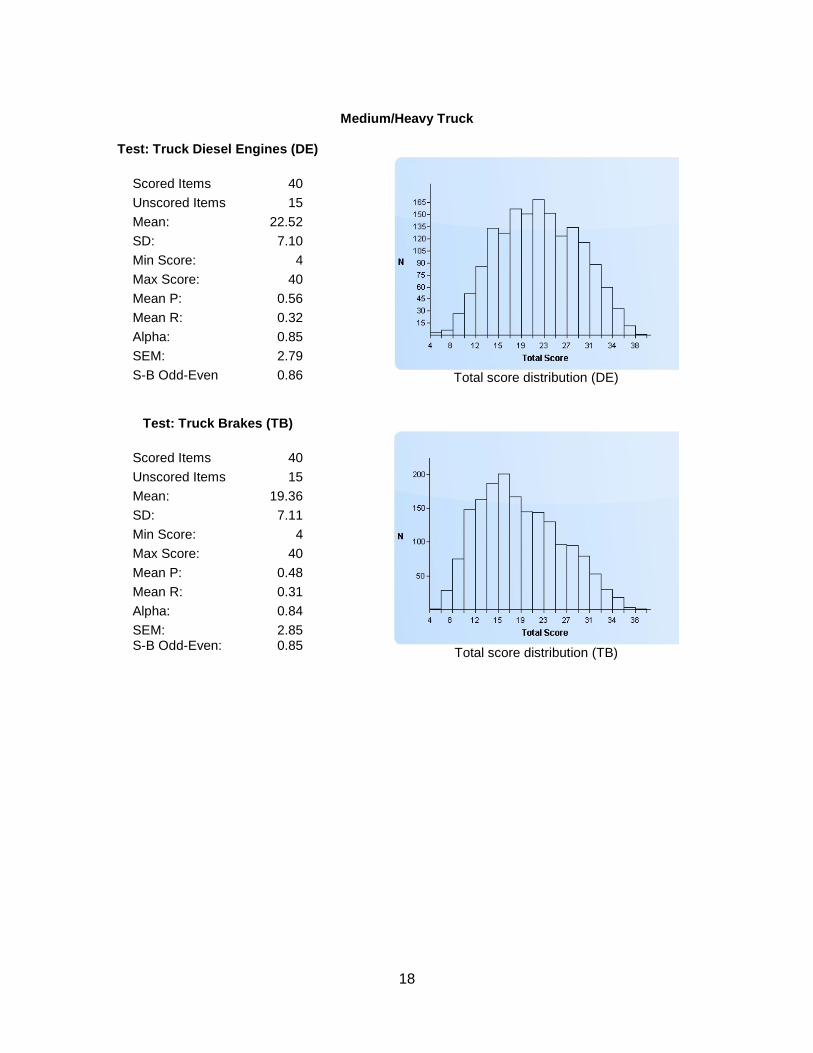
Medium/Heavy Truck
Test: Truck Diesel Engines (DE)
Scored Items 40 Unscored Items 15 Mean: 22.52 SD: 7.10 Min Score: 4 Max Score: 40 Mean P: 0.56 Mean R: 0.32 Alpha: 0.85 SEM: 2.79 S-B Odd-Even 0.86
Total score distribution (DE)
Test: Truck Brakes (TB)
Scored Items 40 Unscored Items 15 Mean: 19.36 SD: 7.11 Min Score: 4 Max Score: 40 Mean P: 0.48 Mean R: 0.31 Alpha: 0.84 SEM: 2.85 S-B Odd-Even: 0.85
Total score distribution (TB)
19
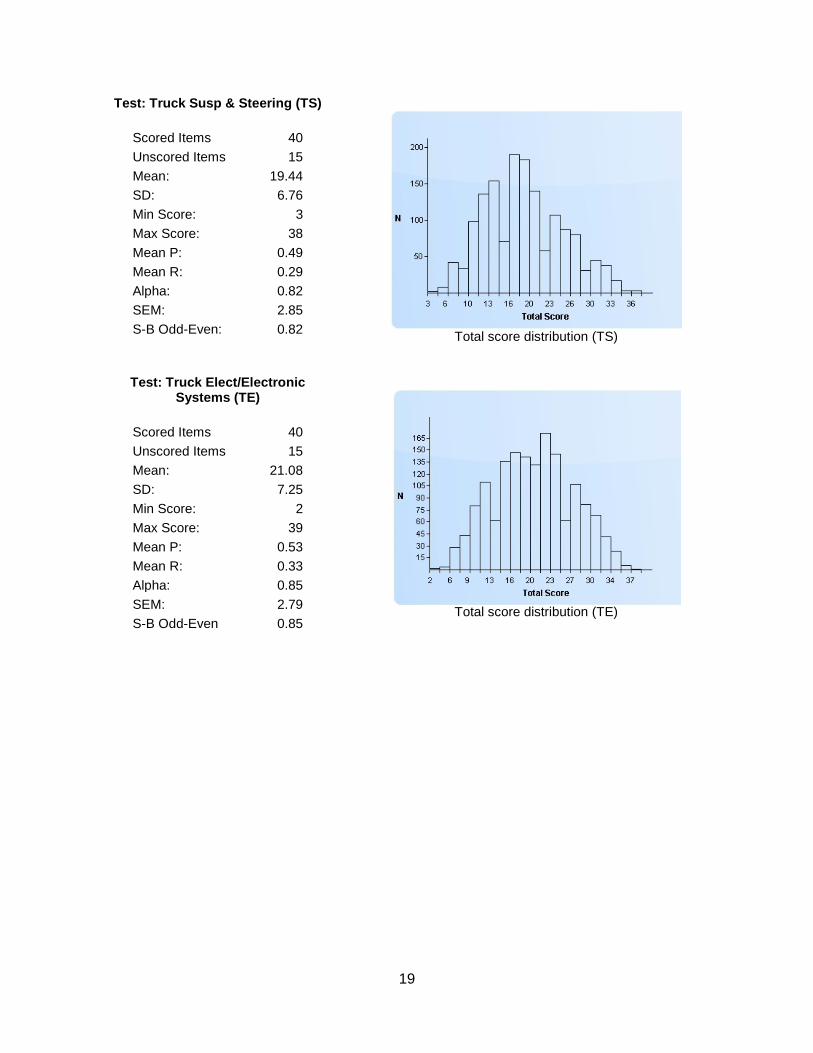
Test: Truck Susp & Steering (TS)
Scored Items 40 Unscored Items 15 Mean: 19.44 SD: 6.76 Min Score: 3 Max Score: 38 Mean P: 0.49 Mean R: 0.29 Alpha: 0.82 SEM: 2.85 S-B Odd-Even: 0.82
Total score distribution (TS)
Test: Truck Elect/Electronic Systems (TE)
Scored Items 40 Unscored Items 15 Mean: 21.08 SD: 7.25 Min Score: 2 Max Score: 39 Mean P: 0.53 Mean R: 0.33 Alpha: 0.85 SEM: 2.79 S-B Odd-Even 0.85
Total score distribution (TE)