Embed Size (px)
Citation preview
www.dec.ny.gov
BLACK BEAR HARVEST SUMMARY
2018
Results reported in this document were funded by the Federal Aid in Wildlife Restoration Act. Grant WE-173-G
Lauren McAllister with her St. Lawrence County black bear, September 2018.
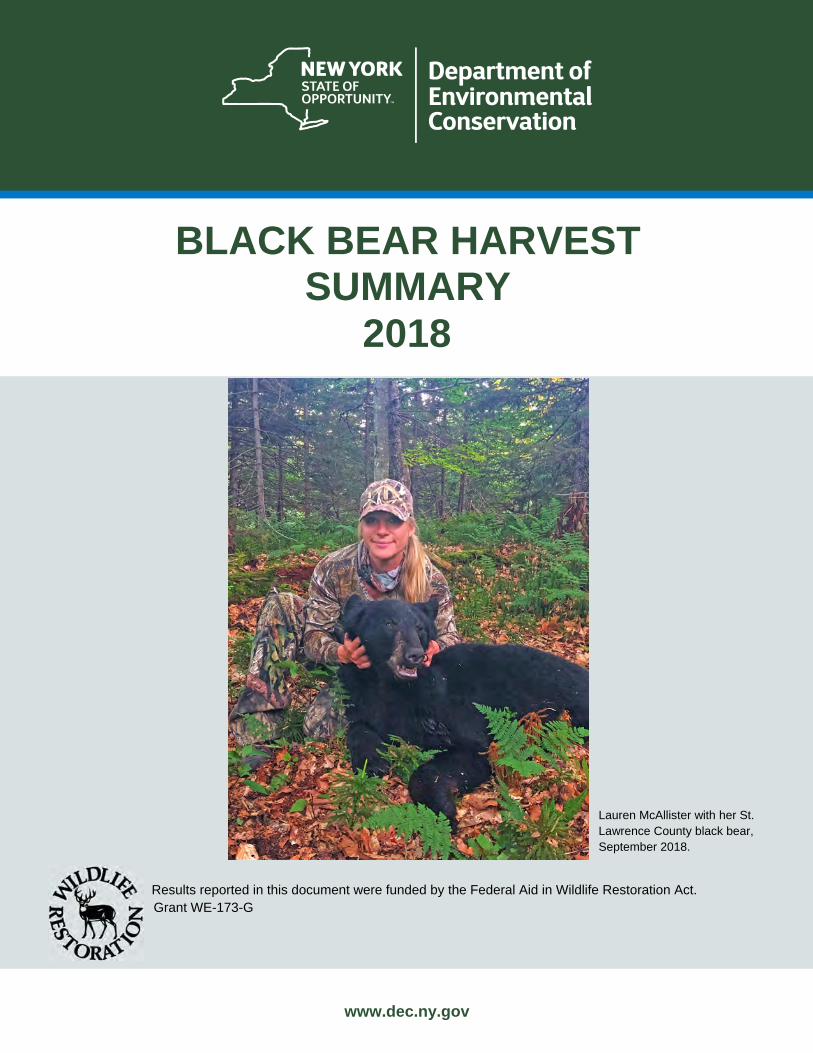
2018 20175‐Year Average
(2013 ‐ 2017)
Historical Average
(1991‐2000)
Northern Zone 491 383 476 515Early 259 82 176 172
Bow 55 25 33 15
Muzzleloader 48 33 53 25
Regular 129 242 213 303
Youth 0 1 NA NA
% Female : % Male 45% ‐ 55% 38% ‐ 62% 38% ‐ 62% 43% ‐ 57%
Southern Zone 804 1,037 1,056 207Early 179 150 227 NABow 294 330 332 54
Muzzleloader 18 12 12 1
Regular 302 537 528 153
Youth 11 8 NA NA
% Female : % Male 41% ‐ 59% 40% ‐ 60% 41% ‐ 59% 37% ‐ 63%
New York State 1,295 1,420 1,532 722Early 438 232 357 172
Bow 349 355 365 69
Muzzleloader 66 45 65 26
Regular 431 779 741 455
Youth 11 9 NA NA
% Female : % Male 42% ‐ 58% 39% ‐ 61% 40% ‐ 60% 41% ‐ 59%
NEW YORK STATE
DEPARTMENT OF ENVIRONMENTAL CONSERVATION
2018 Bear Harvest Summary
0%
20%
40%
60%
80%
100% Bear Take by ImplementNorthern Zone Southern Zone
Page 2
9S
9T
9X
9N
8J
8Y
6N
6H
6A
3K
4A
3C
5C
3G
9A
9R
8G
7R
6G
9K9M
8X
8C
8R
7H
7F
4P
6F
2A
4Z
1A
9A
9W
9Y
7J
7P
6S
4F
3A
4R
2A2A
3P
5F
4Y
5T
9H
8P
8T
8S
6P6R
6J
3H
4G 4H
4S
3N
4J
5G
4L
5S
7S
6C
2A
4B
3S
4T
4K
5A
9G
8M
8H
8W
7M
4O
4W
5H
3J
3R
5J
5R
1C
9J
9C
9F
8A
9P
8N
8F
7A 6K
3M
3F
4U
4C
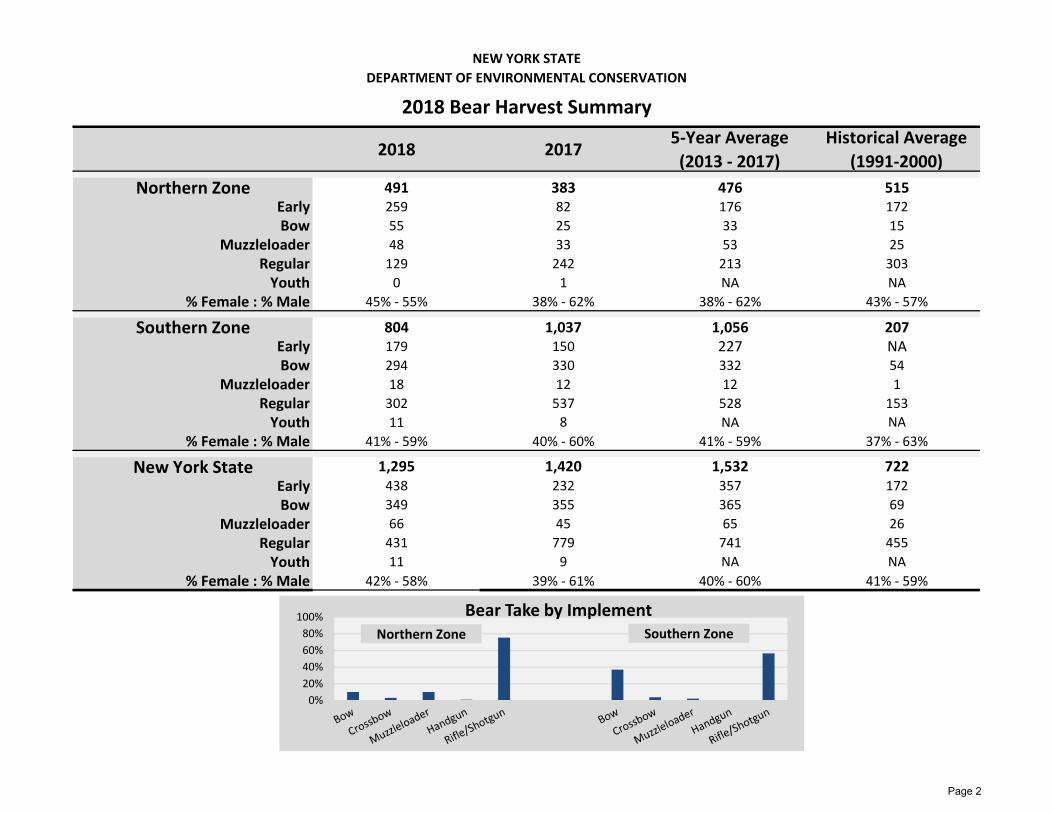
Black Bear Harvest Density2018
NYSDEC Bureau of Wildlife, February 2018
Northern Zone
Southern Zone
Allegany State Parkprohibits bear hunting
Bears Taken per 100 Square Miles0.05 - 2.5
2.6 - 5.0
5.1 - 10.0
10.1 - 15.0
15.1 - 32.0
WMUs
No Bear Hunting
Page 3
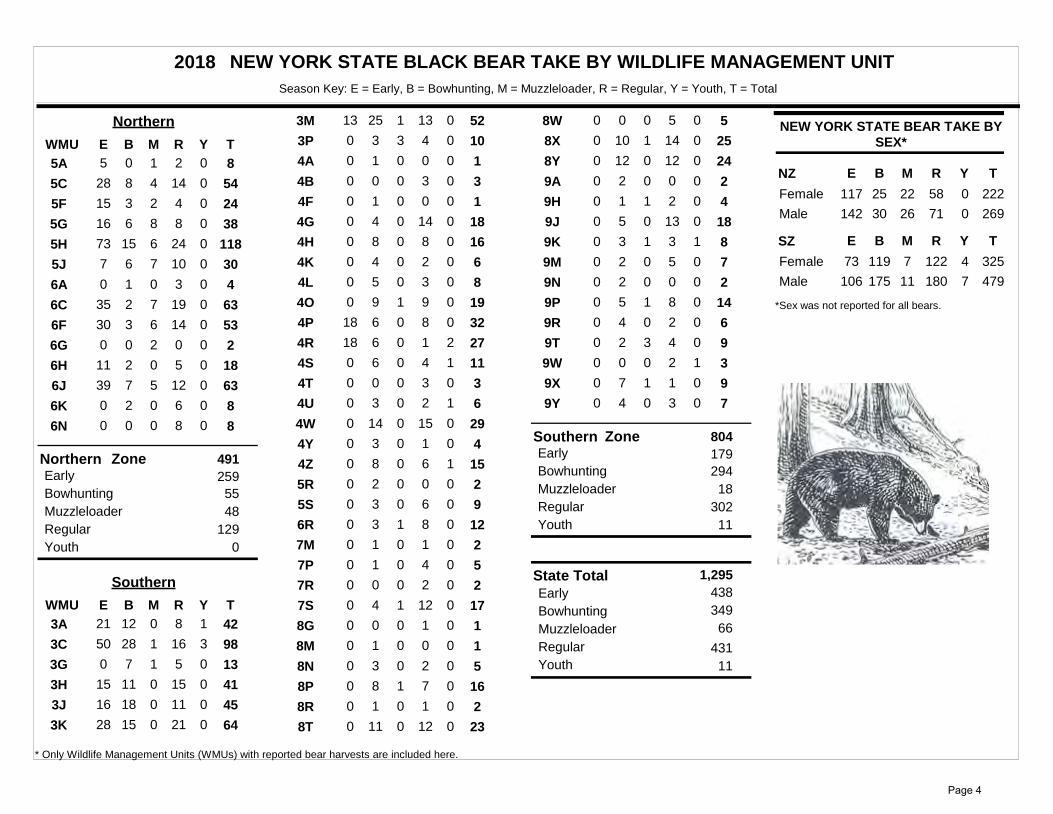
NEW YORK STATE BLACK BEAR TAKE BY WILDLIFE MANAGEMENT UNITSeason Key: E = Early, B = Bowhunting, M = Muzzleloader, R = Regular, Y = Youth, T = Total
2018
E
Northern
B M R TYWMU
05 1 2 805A
828 4 14 5405C
315 2 4 2405F
616 8 8 3805G
1573 6 24 11805H
67 7 10 3005J
10 0 3 406A
235 7 19 6306C
330 6 14 5306F
00 2 0 206G
211 0 5 1806H
739 5 12 6306J
20 0 6 806K
00 0 8 806N
ZoneNorthernEarly
Youth
259Bowhunting 55Muzzleloader 48Regular 129
0
491
E
Southern
B M R TYWMU
1221 0 8 4213A
2850 1 16 9833C
70 1 5 1303G
1115 0 15 4103H
1816 0 11 4503J
1528 0 21 6403K
2513 1 13 5203M
30 3 4 1003P
10 0 0 104A
00 0 3 304B
10 0 0 104F
40 0 14 1804G
80 0 8 1604H
40 0 2 604K
50 0 3 804L
90 1 9 1904O
618 0 8 3204P
618 0 1 2724R
60 0 4 1114S
00 0 3 304T
30 0 2 614U
140 0 15 2904W
30 0 1 404Y
80 0 6 1514Z
20 0 0 205R
30 0 6 905S
30 1 8 1206R
10 0 1 207M
10 0 4 507P
00 0 2 207R
40 1 12 1707S
00 0 1 108G
10 0 0 108M
30 0 2 508N
80 1 7 1608P
10 0 1 208R
110 0 12 2308T
00 0 5 508W
100 1 14 2508X
120 0 12 2408Y
20 0 0 209A
10 1 2 409H
50 0 13 1809J
30 1 3 819K
20 0 5 709M
20 0 0 209N
50 1 8 1409P
40 0 2 609R
20 3 4 909T
00 0 2 319W
70 1 1 909X
40 0 3 709Y
ZoneSouthernEarly
Youth
179Bowhunting 294Muzzleloader 18Regular 302
11
804
Early 438
Bowhunting 349
Muzzleloader 66
Regular 431Youth 11
State Total 1,295
NEW YORK STATE BEAR TAKE BY SEX*
YNZ B M R TE
Female 117 25 22 58 2220
Male 142 30 26 71 2690
YSZ B M R TE
Female 73 119 7 122 3254
Male 106 175 11 180 4797
*Sex was not reported for all bears.
* Only Wildlife Management Units (WMUs) with reported bear harvests are included here.
Page 4
9S
9T
9X
9N
8J
8Y
6N
6H
6A
3K
4A
3C
5C
3G
9A
9R
8G
7R
6G
9K9M
8X
8C
8R
7H
7F
4P
6F
2A
4Z
1A
9A
9W
9Y
7J
7P
6S
4F
3A
4R
2A2A
3P
5F
4Y
5T
9H
8P
8T
8S
6P6R
6J
3H
4G 4H
4S
3N
4J
5G
4L
5S
7S
6C
2A
4B
3S
4T
4K
5A
9G
8M
8H
8W
7M
4O
4W
5H
3J
3R
5J
5R
1C
9J
9C
9F
8A
9P
8N
8F
7A 6K
3M
3F
4U
4C
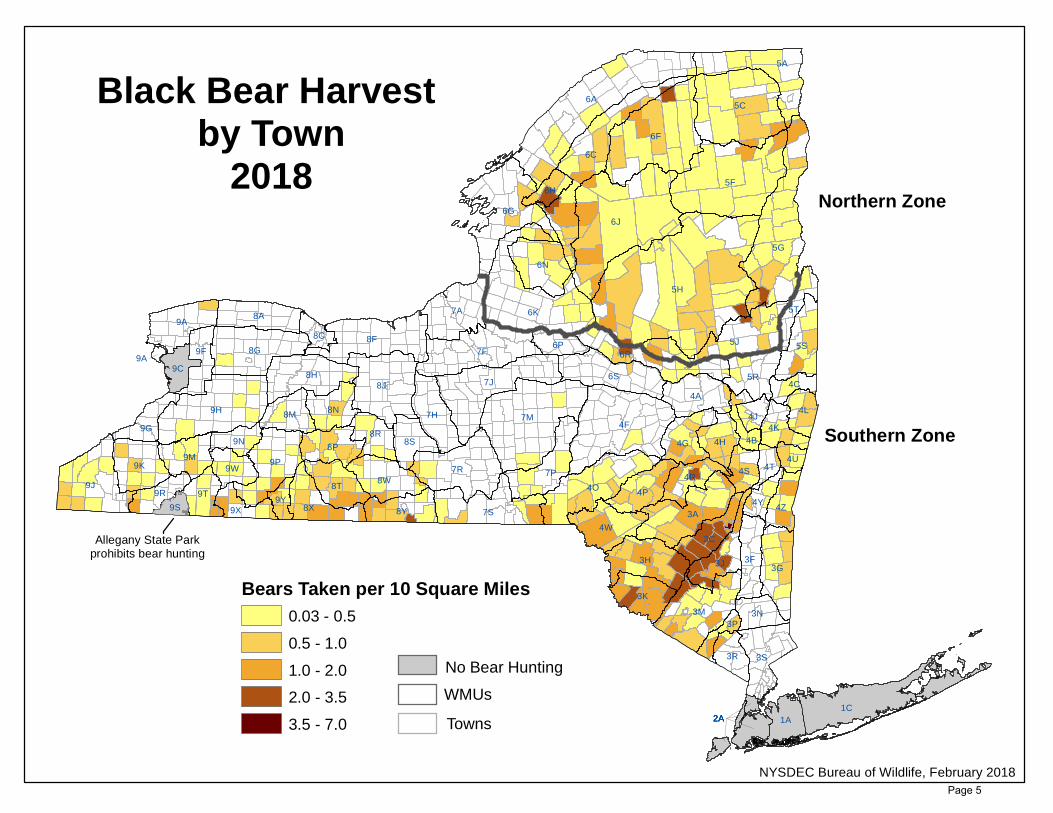
Black Bear Harvest by Town
2018
NYSDEC Bureau of Wildlife, February 2018
Northern Zone
Southern Zone
Allegany State Parkprohibits bear hunting
Bears Taken per 10 Square Miles0.03 - 0.5
0.5 - 1.0
1.0 - 2.0
2.0 - 3.5
3.5 - 7.0
No Bear Hunting
WMUs
Towns
Page 5
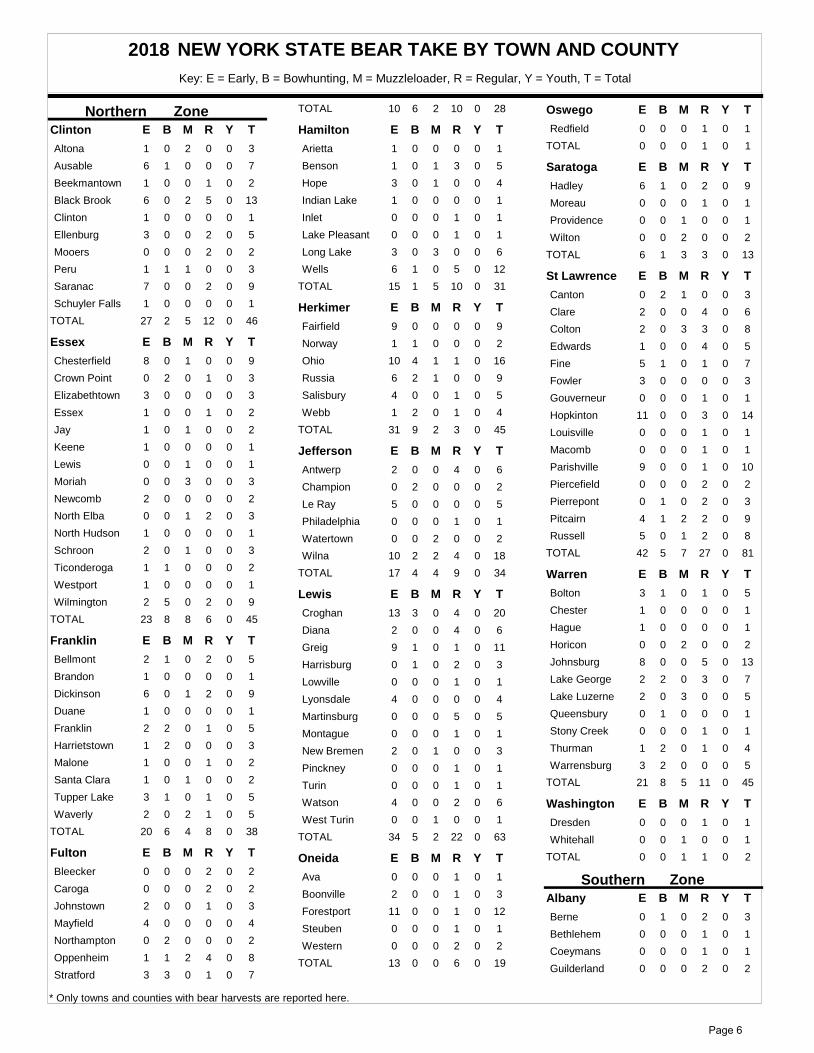
NEW YORK STATE BEAR TAKE BY TOWN AND COUNTY
Key: E = Early, B = Bowhunting, M = Muzzleloader, R = Regular, Y = Youth, T = Total
2018
ZoneNorthernYClinton B M R TE
Altona 01 2 0 30
Ausable 16 0 0 70
Beekmantown 01 0 1 20
Black Brook 06 2 5 130
Clinton 01 0 0 10
Ellenburg 03 0 2 50
Mooers 00 0 2 20
Peru 11 1 0 30
Saranac 07 0 2 90
Schuyler Falls 01 0 0 10
TOTAL 27 2 5 12 0 46
YEssex B M R TE
Chesterfield 08 1 0 90
Crown Point 20 0 1 30
Elizabethtown 03 0 0 30
Essex 01 0 1 20
Jay 01 1 0 20
Keene 01 0 0 10
Lewis 00 1 0 10
Moriah 00 3 0 30
Newcomb 02 0 0 20
North Elba 00 1 2 30
North Hudson 01 0 0 10
Schroon 02 1 0 30
Ticonderoga 11 0 0 20
Westport 01 0 0 10
Wilmington 52 0 2 90
TOTAL 23 8 8 6 0 45
YFranklin B M R TE
Bellmont 12 0 2 50
Brandon 01 0 0 10
Dickinson 06 1 2 90
Duane 01 0 0 10
Franklin 22 0 1 50
Harrietstown 21 0 0 30
Malone 01 0 1 20
Santa Clara 01 1 0 20
Tupper Lake 13 0 1 50
Waverly 02 2 1 50
TOTAL 20 6 4 8 0 38
YFulton B M R TE
Bleecker 00 0 2 20
Caroga 00 0 2 20
Johnstown 02 0 1 30
Mayfield 04 0 0 40
Northampton 20 0 0 20
Oppenheim 11 2 4 80
Stratford 33 0 1 70
TOTAL 10 6 2 10 0 28
YHamilton B M R TE
Arietta 01 0 0 10
Benson 01 1 3 50
Hope 03 1 0 40
Indian Lake 01 0 0 10
Inlet 00 0 1 10
Lake Pleasant 00 0 1 10
Long Lake 03 3 0 60
Wells 16 0 5 120
TOTAL 15 1 5 10 0 31
YHerkimer B M R TE
Fairfield 09 0 0 90
Norway 11 0 0 20
Ohio 410 1 1 160
Russia 26 1 0 90
Salisbury 04 0 1 50
Webb 21 0 1 40
TOTAL 31 9 2 3 0 45
YJefferson B M R TE
Antwerp 02 0 4 60
Champion 20 0 0 20
Le Ray 05 0 0 50
Philadelphia 00 0 1 10
Watertown 00 2 0 20
Wilna 210 2 4 180
TOTAL 17 4 4 9 0 34
YLewis B M R TE
Croghan 313 0 4 200
Diana 02 0 4 60
Greig 19 0 1 110
Harrisburg 10 0 2 30
Lowville 00 0 1 10
Lyonsdale 04 0 0 40
Martinsburg 00 0 5 50
Montague 00 0 1 10
New Bremen 02 1 0 30
Pinckney 00 0 1 10
Turin 00 0 1 10
Watson 04 0 2 60
West Turin 00 1 0 10
TOTAL 34 5 2 22 0 63
YOneida B M R TE
Ava 00 0 1 10
Boonville 02 0 1 30
Forestport 011 0 1 120
Steuben 00 0 1 10
Western 00 0 2 20
TOTAL 13 0 0 6 0 19
YOswego B M R TE
Redfield 00 0 1 10
TOTAL 0 0 0 1 0 1
YSaratoga B M R TE
Hadley 16 0 2 90
Moreau 00 0 1 10
Providence 00 1 0 10
Wilton 00 2 0 20
TOTAL 6 1 3 3 0 13
YSt Lawrence B M R TE
Canton 20 1 0 30
Clare 02 0 4 60
Colton 02 3 3 80
Edwards 01 0 4 50
Fine 15 0 1 70
Fowler 03 0 0 30
Gouverneur 00 0 1 10
Hopkinton 011 0 3 140
Louisville 00 0 1 10
Macomb 00 0 1 10
Parishville 09 0 1 100
Piercefield 00 0 2 20
Pierrepont 10 0 2 30
Pitcairn 14 2 2 90
Russell 05 1 2 80
TOTAL 42 5 7 27 0 81
YWarren B M R TE
Bolton 13 0 1 50
Chester 01 0 0 10
Hague 01 0 0 10
Horicon 00 2 0 20
Johnsburg 08 0 5 130
Lake George 22 0 3 70
Lake Luzerne 02 3 0 50
Queensbury 10 0 0 10
Stony Creek 00 0 1 10
Thurman 21 0 1 40
Warrensburg 23 0 0 50
TOTAL 21 8 5 11 0 45
YWashington B M R TE
Dresden 00 0 1 10
Whitehall 00 1 0 10
TOTAL 0 0 1 1 0 2
ZoneSouthernYAlbany B M R TE
Berne 10 0 2 30
Bethlehem 00 0 1 10
Coeymans 00 0 1 10
Guilderland 00 0 2 20
* Only towns and counties with bear harvests are reported here.
Page 6
New Scotland 10 0 0 10
Rensselaerville 50 0 1 60
Westerlo 00 0 3 30
TOTAL 0 7 0 10 0 17
YAllegany B M R TE
Alfred 00 0 1 10
Allen 00 1 0 10
Alma 00 1 0 10
Amity 10 0 0 10
Andover 10 0 0 10
Burns 00 0 1 10
Clarksville 20 0 0 20
Friendship 10 0 0 10
Hume 10 0 0 10
Independence 00 1 1 20
New Hudson 00 0 1 10
Rushford 10 0 0 10
Scio 20 0 3 50
Ward 20 0 1 30
Wellsville 20 0 0 20
West Almond 00 0 1 10
Willing 10 0 1 20
Wirt 10 0 0 10
TOTAL 0 15 3 10 0 28
YBroome B M R TE
Colesville 10 0 1 20
Fenton 00 0 1 10
Kirkwood 00 0 1 10
Sanford 10 0 1 20
Windsor 20 0 11 130
TOTAL 0 4 0 15 0 19
YCattaraugus B M R TE
Allegany 10 1 0 20
Ashford 00 0 2 20
Carrollton 10 0 0 10
Conewango 00 0 1 10
East Otto 00 0 1 10
Ellicottville 00 0 3 30
Franklinville 10 0 1 20
Humphrey 00 0 1 10
Lyndon 00 0 0 11
New Albion 00 0 1 10
Olean 10 0 3 40
Portville 20 2 1 50
Randolph 10 0 0 10
TOTAL 0 7 3 14 1 25
YChautauqua B M R TE
Arkwright 10 1 0 20
Carroll 20 0 2 40
Chautauqua 10 0 0 10
Cherry Creek 10 0 0 21
Clymer 00 0 2 20
Ellington 10 0 0 10
French Creek 00 0 3 30
Harmony 10 0 1 20
Mina 00 0 2 20
Poland 10 0 2 30
Ripley 00 0 1 10
Sherman 00 0 1 10
Stockton 10 0 1 20
Westfield 20 0 0 20
TOTAL 0 11 1 15 1 28
YChemung B M R TE
Ashland 30 0 2 50
Big Flats 10 0 3 40
Chemung 00 0 1 10
Erin 00 0 1 10
Southport 30 0 1 40
TOTAL 0 7 0 8 0 15
YChenango B M R TE
Greene 10 0 1 20
Guilford 00 0 1 10
Smithville 00 0 1 10
TOTAL 0 1 0 3 0 4
YColumbia B M R TE
Ancram 50 0 0 50
Austerlitz 00 0 1 21
Canaan 10 0 0 10
Chatham 20 0 3 50
Claverack 20 0 0 20
Copake 00 0 1 10
Germantown 10 0 0 10
Hillsdale 40 0 1 61
New Lebanon 00 0 1 10
Taghkanic 00 0 1 10
TOTAL 0 15 0 8 2 25
YDelaware B M R TE
Andes 17 0 1 90
Bovina 00 0 1 10
Colchester 10 0 5 60
Delhi 11 0 0 20
Deposit 20 0 1 30
Franklin 20 0 0 20
Hamden 31 0 0 40
Hancock 80 0 11 190
Kortright 01 0 0 10
Masonville 00 1 0 10
Middletown 44 0 1 90
Roxbury 27 0 1 100
Sidney 10 0 0 10
Stamford 02 0 1 30
Tompkins 30 0 4 70
Walton 11 0 1 30
TOTAL 24 29 1 27 0 81
YDutchess B M R TE
Amenia 30 0 0 30
Dover 20 1 0 30
Northeast 00 0 4 40
Pawling 10 0 1 20
Stanford 00 0 2 20
Union Vale 10 0 0 10
Washington 10 0 0 10
TOTAL 0 8 1 7 0 16
YErie B M R TE
Concord 00 1 0 10
TOTAL 0 0 1 0 0 1
YFulton B M R TE
Oppenheim 00 1 0 10
TOTAL 0 0 1 0 0 1
YGenesee B M R TE
Pembroke 00 0 1 10
TOTAL 0 0 0 1 0 1
YGreene B M R TE
Ashland 13 0 0 62
Athens 10 0 0 10
Cairo 33 0 2 80
Catskill 05 0 1 60
Coxsackie 10 0 0 21
Durham 13 0 0 40
Greenville 20 0 0 20
Hunter 03 0 0 30
Jewett 01 0 0 10
Lexington 10 0 1 20
Prattsville 01 0 0 10
Windham 02 0 0 20
TOTAL 21 10 0 4 3 38
YHerkimer B M R TE
Fairfield 00 0 2 20
Herkimer 00 0 2 20
Little Falls 10 0 1 20
Schuyler Falls 00 0 1 10
TOTAL 0 1 0 6 0 7
YLivingston B M R TE
Mount Morris 10 0 0 10
Springwater 00 0 1 10
TOTAL 0 1 0 1 0 2
YMadison B M R TE
Hamilton 10 0 0 10
TOTAL 0 1 0 0 0 1
YMontgomery B M R TE
Mohawk 10 0 0 10
Palatine 00 0 1 10
TOTAL 0 1 0 1 0 2
YNiagara B M R TE
Somerset 20 0 0 20
TOTAL 0 2 0 0 0 2
YOneida B M R TE
Trenton 00 0 1 10
TOTAL 0 0 0 1 0 1
* Only towns and counties with bear harvests are reported here.
Page 7
YOntario B M R TE
Canandaigua 10 0 0 10
Naples 00 0 1 10
South Bristol 20 0 0 20
TOTAL 0 3 0 1 0 4
YOrange B M R TE
Blooming Grove 40 0 0 40
Crawford 10 0 0 10
Deerpark 37 0 3 130
Goshen 00 0 2 20
Greenville 10 0 1 20
Highlands 20 0 0 20
Minisink 10 0 3 40
Monroe 00 0 1 10
Montgomery 20 0 0 20
Newburgh 10 0 0 10
Tuxedo 20 1 3 60
Wallkill 20 0 0 20
Warwick 22 2 4 100
Wawayanda 21 0 0 30
Woodbury 00 0 1 10
TOTAL 10 23 3 18 0 54
YOtsego B M R TE
Maryland 10 0 0 10
TOTAL 0 1 0 0 0 1
YRensselaer B M R TE
Berlin 30 0 0 30
East Greenbush 10 0 0 10
Grafton 00 0 1 10
Nassau 20 0 1 30
Petersburgh 00 0 3 30
Pittstown 20 0 0 20
Sand Lake 10 0 0 10
Schodack 00 0 1 10
Stephentown 00 0 1 10
TOTAL 0 9 0 7 0 16
YSaratoga B M R TE
Charlton 10 0 0 10
Milton 10 0 0 10
TOTAL 0 2 0 0 0 2
YSchenectady B M R TE
Rotterdam 20 0 0 20
TOTAL 0 2 0 0 0 2
YSchoharie B M R TE
Blenheim 10 0 3 40
Broome 00 0 2 20
Conesville 01 0 3 40
Fulton 10 0 2 30
Gilboa 20 0 2 40
Middleburg 10 0 3 40
Schoharie 00 0 1 10
TOTAL 1 5 0 16 0 22
YSchuyler B M R TE
Catharine 00 0 2 20
Cayuta 00 0 1 10
Reading 10 0 0 10
Tyrone 00 0 1 10
TOTAL 0 1 0 4 0 5
YSteuben B M R TE
Addison 10 0 2 30
Avoca 10 0 0 10
Bath 30 0 1 40
Cameron 10 0 2 30
Campbell 10 0 0 10
Canisteo 10 0 2 30
Caton 00 0 3 30
Cohocton 30 0 1 40
Corning 40 0 0 40
Dansville 00 0 3 30
Erwin 30 0 2 50
Greenwood 20 0 1 30
Hartsville 10 0 0 10
Hornby 00 0 1 10
Hornellsville 00 0 1 10
Howard 00 0 4 40
Lindley 20 0 2 40
Rathbone 20 0 2 40
Thurston 00 0 2 20
Troupsburg 30 0 5 80
Urbana 20 0 1 30
Wayland 10 0 0 10
West Union 10 0 2 30
Wheeler 00 2 1 30
Woodhull 30 0 4 70
TOTAL 0 35 2 42 0 79
YSullivan B M R TE
Bethel 12 0 1 40
Callicoon 11 0 1 30
Cochecton 01 0 4 50
Delaware 12 0 1 40
Fallsburgh 22 0 0 40
Forestburg 32 0 1 60
Fremont 10 0 4 50
Highland 43 0 4 110
Liberty 36 0 1 100
Lumberland 05 0 3 80
Mamakating 712 0 7 260
Neversink 33 0 1 70
Rockland 21 0 0 30
Thompson 53 0 1 90
Tusten 03 0 5 80
TOTAL 46 33 0 34 0 113
YTioga B M R TE
Barton 00 0 1 10
Nichols 10 1 1 30
TOTAL 0 1 1 2 0 4
YTompkins B M R TE
Newfield 00 0 1 10
TOTAL 0 0 0 1 0 1
YUlster B M R TE
Denning 15 1 1 80
Gardiner 22 0 1 50
Hardenburgh 03 0 0 30
Hurley 34 0 1 80
Kingston 32 0 0 50
Marbletown 73 0 2 120
New Paltz 40 0 4 80
Olive 57 0 4 171
Plattekill 20 0 0 20
Rochester 812 0 4 251
Rosendale 10 0 0 10
Saugerties 13 0 3 70
Shandaken 27 0 5 140
Shawangunk 85 0 2 150
Ulster 03 0 2 50
Wawarsing 416 0 5 272
Woodstock 45 0 2 110
TOTAL 77 55 1 36 4 173
YWashington B M R TE
Cambridge 10 0 3 40
Hebron 10 0 0 10
Jackson 10 0 0 10
Salem 00 0 3 30
White Creek 00 0 1 10
TOTAL 0 3 0 7 0 10
YWyoming B M R TE
Gainesville 10 0 0 10
Middlebury 00 0 1 10
Orangeville 00 0 1 10
TOTAL 0 1 0 2 0 3
YYates B M R TE
Jerusalem 00 0 1 10
TOTAL 0 0 0 1 0 1
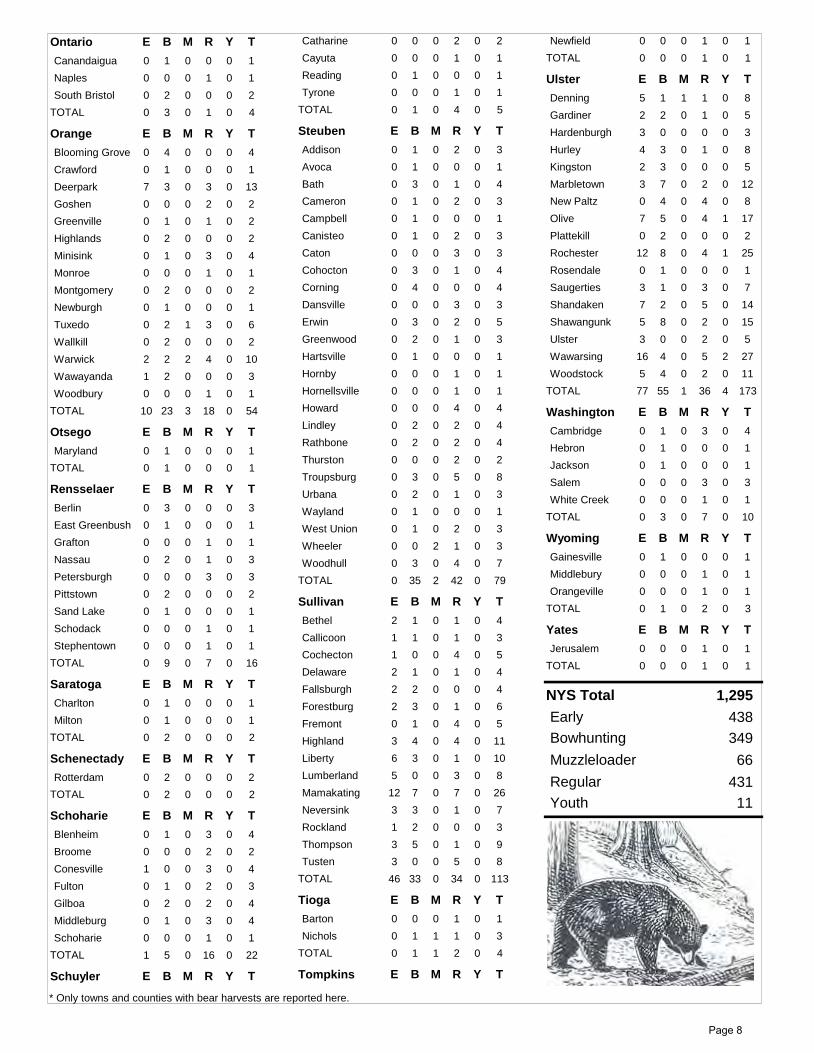
Early 438
Bowhunting 349
Muzzleloader 66
Regular 431
Youth 11
NYS Total 1,295
* Only towns and counties with bear harvests are reported here.
Page 8
NEW YORK STATE
DEPARTMENT OF ENVIRONMENTAL CONSERVATION
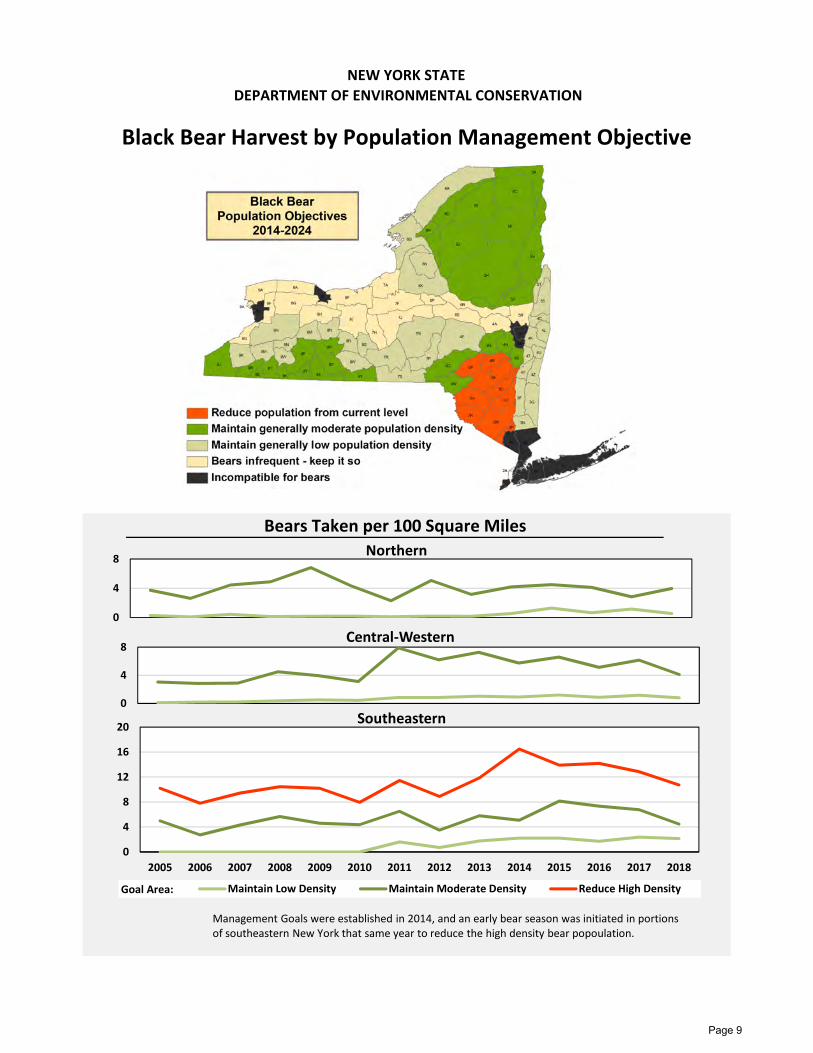
Black Bear Harvest by Population Management Objective
Bears Taken per 100 Square Miles
0
4
8Northern
0
4
8
12
16
20
2005 2006 2007 2008 2009 2010 2011 2012 2013 2014 2015 2016 2017 2018
Southeastern
Maintain Low Density Maintain Moderate Density Reduce High Density
0
4
8Central‐Western
Management Goals were established in 2014, and an early bear season was initiated in portions of southeastern New York that same year to reduce the high density bear popoulation.
Goal Area:
Page 9

Rank
Dressed
Weight
(pounds)
Sex Season County Town WMU
1 585 Male Bowhunting Ulster Shandaken 3A
2 550 Male Bowhunting Ulster Marbletown 3C
3 485 Male Muzzleloading St Lawrence Pitcairn 6C
4 459 Male Regular Chemung Chemung 8Y
5 454 Male Regular Ulster New Paltz 3J
6 440 Male Regular Dutchess Stanford 3G
7 425 Male Bowhunting Orange Highlands 3P
8 400 Male Early St Lawrence Pitcairn 6C
9 390 Male Early Sullivan Liberty 3H
10 385 Male Early Greene Catskill 3A
Scaled weights of dressed bears were submitted for 28% of the bears reported in 2018.
Average Weight by Age and Sex of Harvested Black Bears (2015‐2017)
Note: Bear ages are determined by examining cross‐sections of a premolar tooth (see
www.dec.ny.gov/outdoor/45598.html). Bear teeth from the 2018 seasons have not
yet been analyzed.
NEW YORK STATE
Distribution of Harvested Black Bears by Weight (2018)
DEPARTMENT OF ENVIRONMENTAL CONSERVATION
Heaviest Reported Bears ‐ 2018
0%
10%
20%
30%
40%
Dressed Weight (pounds)
Southern Zone
Female
Male
0%10%20%
30%40%50%
60%
Dressed Weight (pounds)
Northern Zone
Female
Male
0
100
200
300
400
≤1 2 3 4 5 6+Dressed W
eight (pounds)
Bear Age (years)
Northern Zone
FemaleMale
n = 339
0
100
200
300
400
≤1 2 3 4 5 6+
Dressed W
eight (pounds)
Bear Age (years)
Southern Zone
FemaleMale
n = 766
n = 96 n = 239
Page 10

Notes: Sum of male and female proportions across seasons within each zone equals 100%.
Male and female bear take during the Youth Seasons were <1% of the total harvest.
2018 Distribution of Black Bear Harvest by Sex
NEW YORK STATE
DEPARTMENT OF ENVIRONMENTAL CONSERVATION
2018 Reported Bear Take by Day
0
5
10
15
20
25
30
35
9/15 9/22 9/29 10/6 10/13 10/20 10/27 11/3 11/10 11/17 11/24 12/1
# Bears
Northern Zone
Female
Male
0
5
10
15
20
25
30
35
40
45
50
9/8 9/15 9/22 9/29 10/6 10/13 10/20 10/27 11/3 11/10 11/17 11/24 12/1 12/8 12/15
# Bears
Southern Zone
Female
Male
0%
5%
10%
15%
20%
25%
30%
35%
Early Bow Muzzle Regular Early Bow Muzzle Regular
Northern Zone Southern Zone
Female Male
Page 11
NEW YORK STATEDEPARTMENT OF ENVIRONMENTAL CONSERVATION
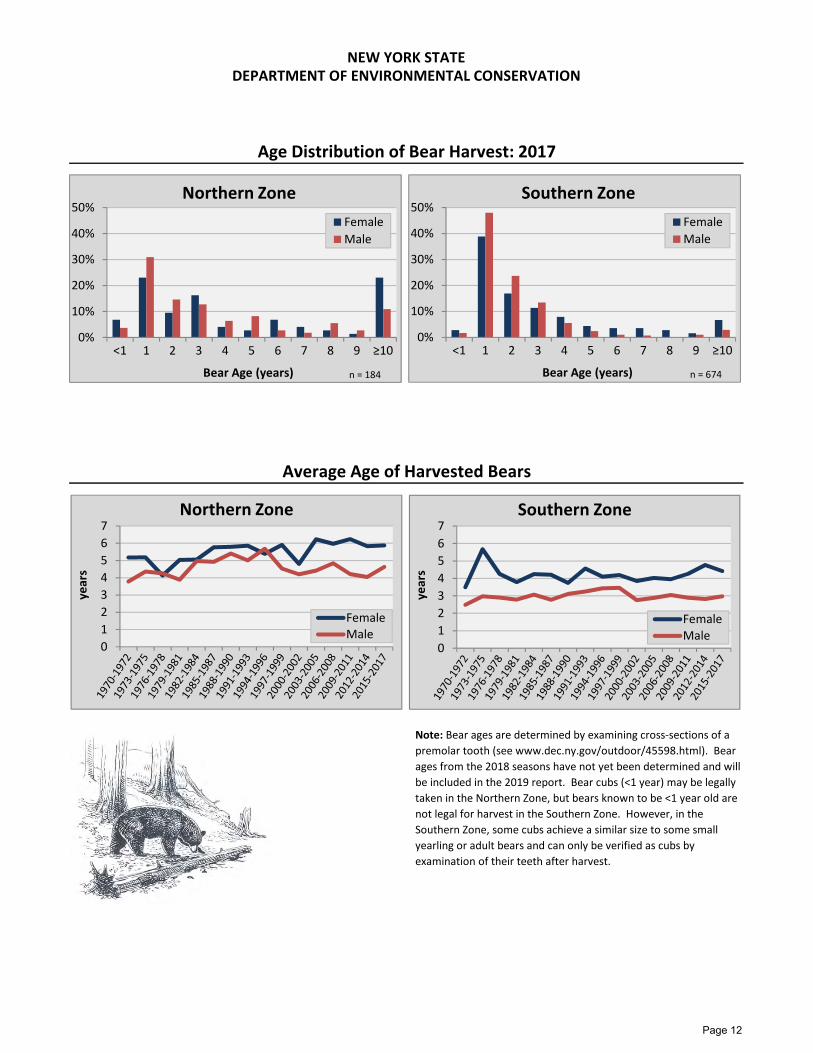
Age Distribution of Bear Harvest: 2017
Average Age of Harvested Bears
Note: Bear ages are determined by examining cross‐sections of a
premolar tooth (see www.dec.ny.gov/outdoor/45598.html). Bear
ages from the 2018 seasons have not yet been determined and will
be included in the 2019 report. Bear cubs (<1 year) may be legally
taken in the Northern Zone, but bears known to be <1 year old are
not legal for harvest in the Southern Zone. However, in the
Southern Zone, some cubs achieve a similar size to some small
yearling or adult bears and can only be verified as cubs by
examination of their teeth after harvest.
0
1
2
3
4
5
6
7
years
Northern Zone
FemaleMale
0
1
2
3
4
5
6
7
years
Southern Zone
Female
Male
0%
10%
20%
30%
40%
50%
<1 1 2 3 4 5 6 7 8 9 ≥10
Bear Age (years)
Northern Zone
Female
Male
n = 184
0%
10%
20%
30%
40%
50%
<1 1 2 3 4 5 6 7 8 9 ≥10
Bear Age (years)
Southern Zone
Female
Male
n = 674
Page 12
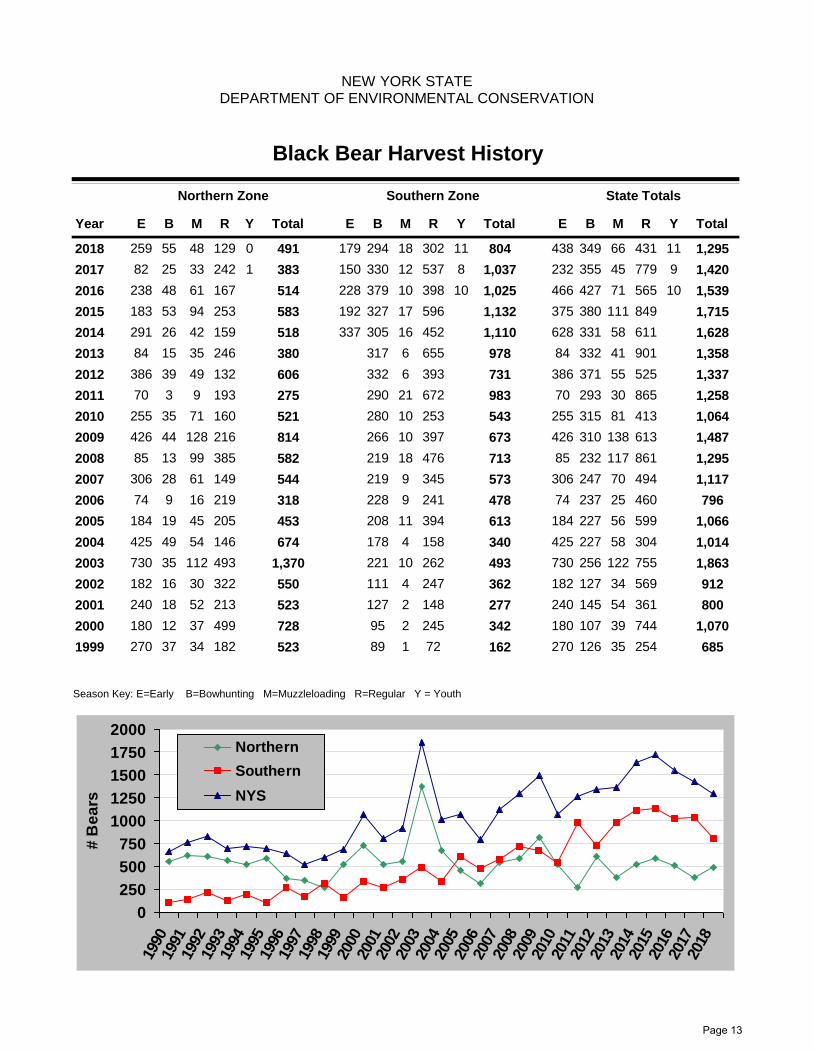
Black Bear Harvest History
NEW YORK STATEDEPARTMENT OF ENVIRONMENTAL CONSERVATION
Year
State Totals
E B M R
Northern Zone
E B M R
Southern Zone
TotalTotal E B M R TotalY YY
2018 1,295438 349 66 431491259 55 48 129 804179 294 18 302 11 110
2017 1,420232 355 45 77938382 25 33 242 1,037150 330 12 537 8 91
2016 1,539466 427 71 565514238 48 61 167 1,025228 379 10 398 10 10
2015 1,715375 380 111 849583183 53 94 253 1,132192 327 17 596
2014 1,628628 331 58 611518291 26 42 159 1,110337 305 16 452
2013 1,35884 332 41 90138084 15 35 246 978317 6 655
2012 1,337386 371 55 525606386 39 49 132 731332 6 393
2011 1,25870 293 30 86527570 3 9 193 983290 21 672
2010 1,064255 315 81 413521255 35 71 160 543280 10 253
2009 1,487426 310 138 613814426 44 128 216 673266 10 397
2008 1,29585 232 117 86158285 13 99 385 713219 18 476
2007 1,117306 247 70 494544306 28 61 149 573219 9 345
2006 79674 237 25 46031874 9 16 219 478228 9 241
2005 1,066184 227 56 599453184 19 45 205 613208 11 394
2004 1,014425 227 58 304674425 49 54 146 340178 4 158
2003 1,863730 256 122 7551,370730 35 112 493 493221 10 262
2002 912182 127 34 569550182 16 30 322 362111 4 247
2001 800240 145 54 361523240 18 52 213 277127 2 148
2000 1,070180 107 39 744728180 12 37 499 34295 2 245
1999 685270 126 35 254523270 37 34 182 16289 1 72
0
250
500
750
1000
1250
1500
1750
2000
1990
1991
1992
1993
1994
1995
1996
1997
1998
1999
2000
2001
2002
2003
2004
2005
2006
2007
2008
2009
2010
2011
2012
2013
2014
2015
2016
2017
2018
# B
ea
rs
Northern
Southern
NYS
Season Key: E=Early B=Bowhunting M=Muzzleloading R=Regular Y = Youth
Page 13
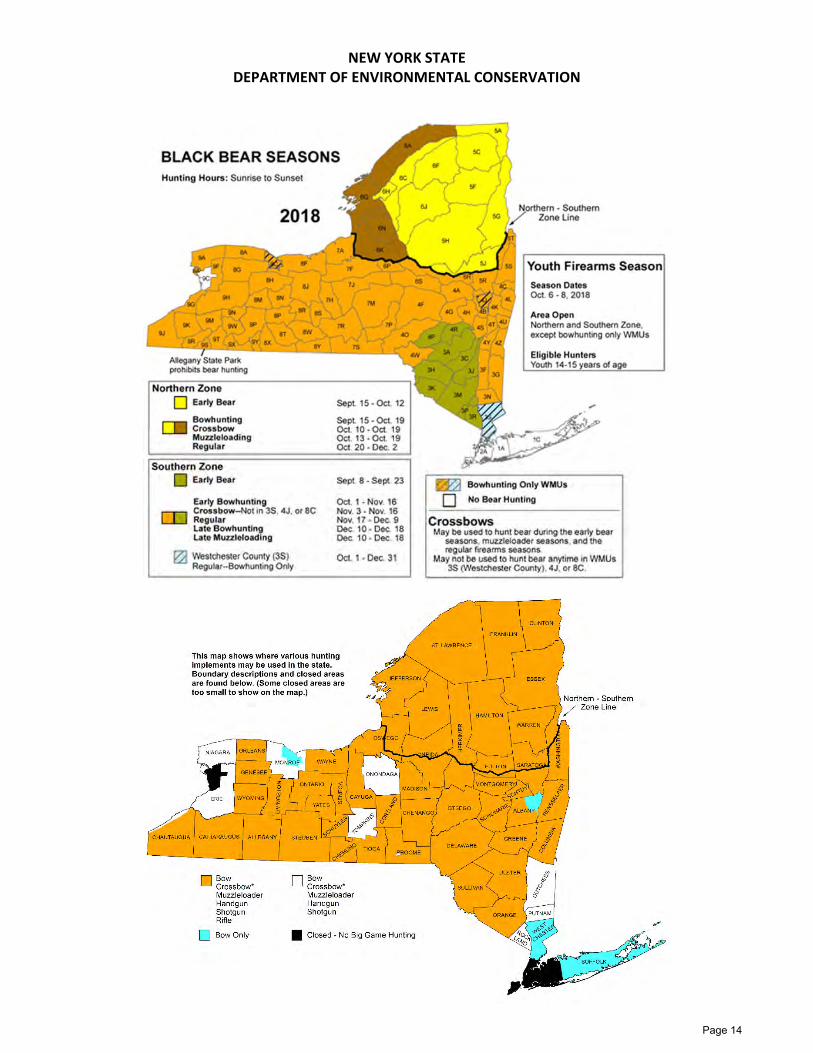
NEW YORK STATE DEPARTMENT OF ENVIRONMENTAL CONSERVATION
Page 14
NEW YORK STATE DEPARTMENT OF ENVIRONMENTAL CONSERVATION
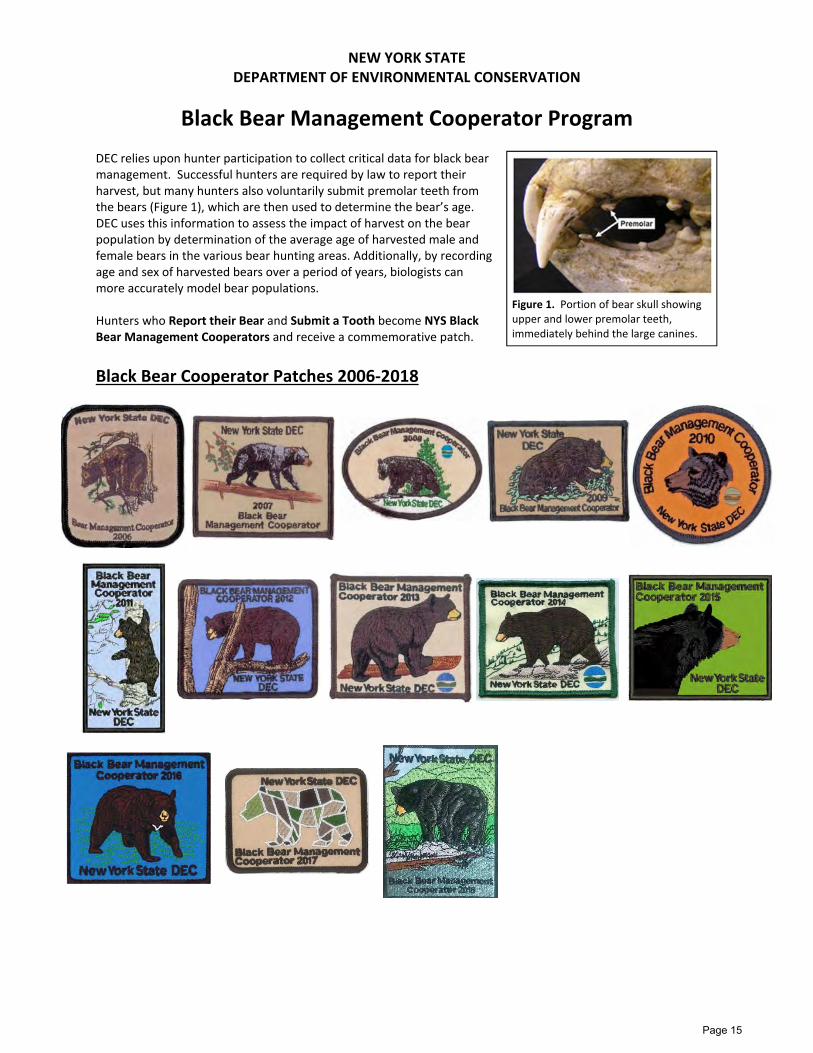
Black Bear Management Cooperator Program
DEC relies upon hunter participation to collect critical data for black bear management. Successful hunters are required by law to report their harvest, but many hunters also voluntarily submit premolar teeth from the bears (Figure 1), which are then used to determine the bear’s age. DEC uses this information to assess the impact of harvest on the bear population by determination of the average age of harvested male and female bears in the various bear hunting areas. Additionally, by recording age and sex of harvested bears over a period of years, biologists can more accurately model bear populations.
Hunters who Report their Bear and Submit a Tooth become NYS Black Bear Management Cooperators and receive a commemorative patch.
Black Bear Cooperator Patches 2006‐2018
Figure 1. Portion of bear skull showing upper and lower premolar teeth, immediately behind the large canines.
Page 15
NEW YORK STATE DEPARTMENT OF ENVIRONMENTAL CONSERVATION
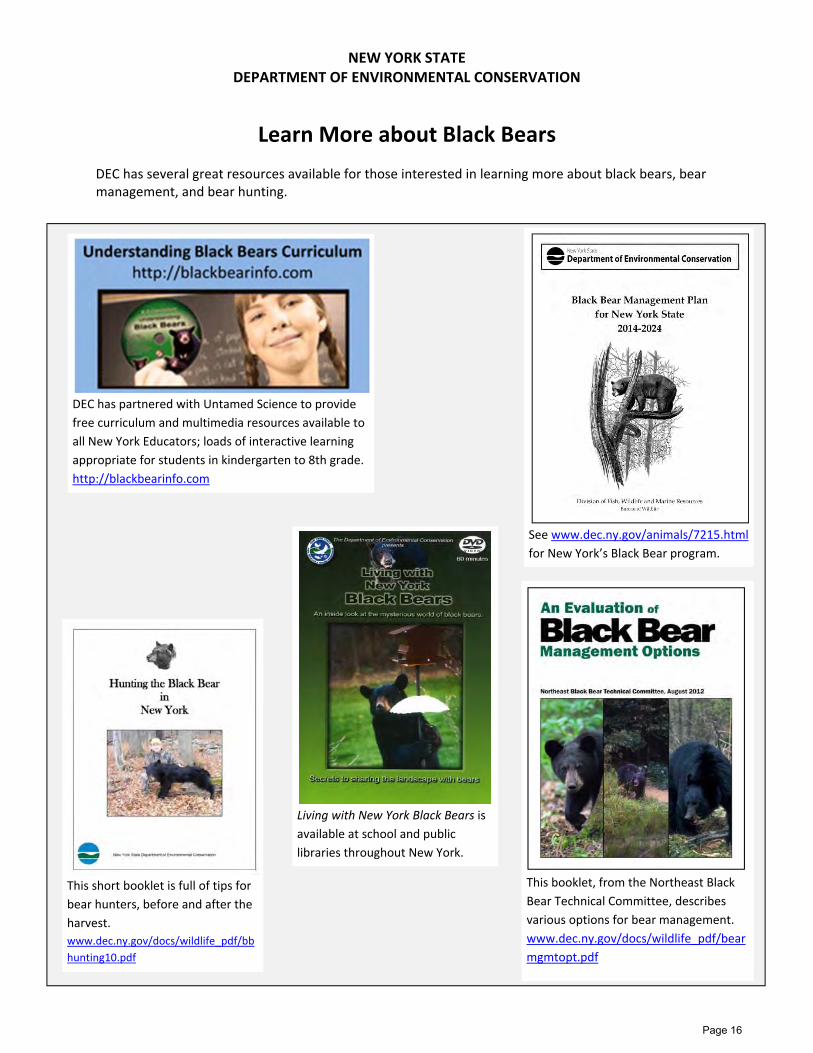
Learn More about Black Bears
DEC has several great resources available for those interested in learning more about black bears, bear management, and bear hunting.
This booklet, from the Northeast Black
Bear Technical Committee, describes
various options for bear management.
www.dec.ny.gov/docs/wildlife_pdf/bear
Living with New York Black Bears is
available at school and public
libraries throughout New York.
DEC has partnered with Untamed Science to provide
free curriculum and multimedia resources available to
all New York Educators; loads of interactive learning
appropriate for students in kindergarten to 8th grade.
http://blackbearinfo.com
This short booklet is full of tips for
bear hunters, before and after the
harvest.
www.dec.ny.gov/docs/wildlife_pdf/bb
hunting10.pdf
See www.dec.ny.gov/animals/7215.html
for New York’s Black Bear program.
This booklet, from the Northeast Black
Bear Technical Committee, describes
various options for bear management.
www.dec.ny.gov/docs/wildlife_pdf/bear
mgmtopt.pdf
Page 16


![· 1n ` ]n9 9y` = > , + # $ ./ ' ) # ($ ( . - 3)](https://img.pdfslide.net/doc/110x75/5c16cb5809d3f2946a8d082b/-1n-n9-9y-3.jpg)