Embed Size (px)
Citation preview
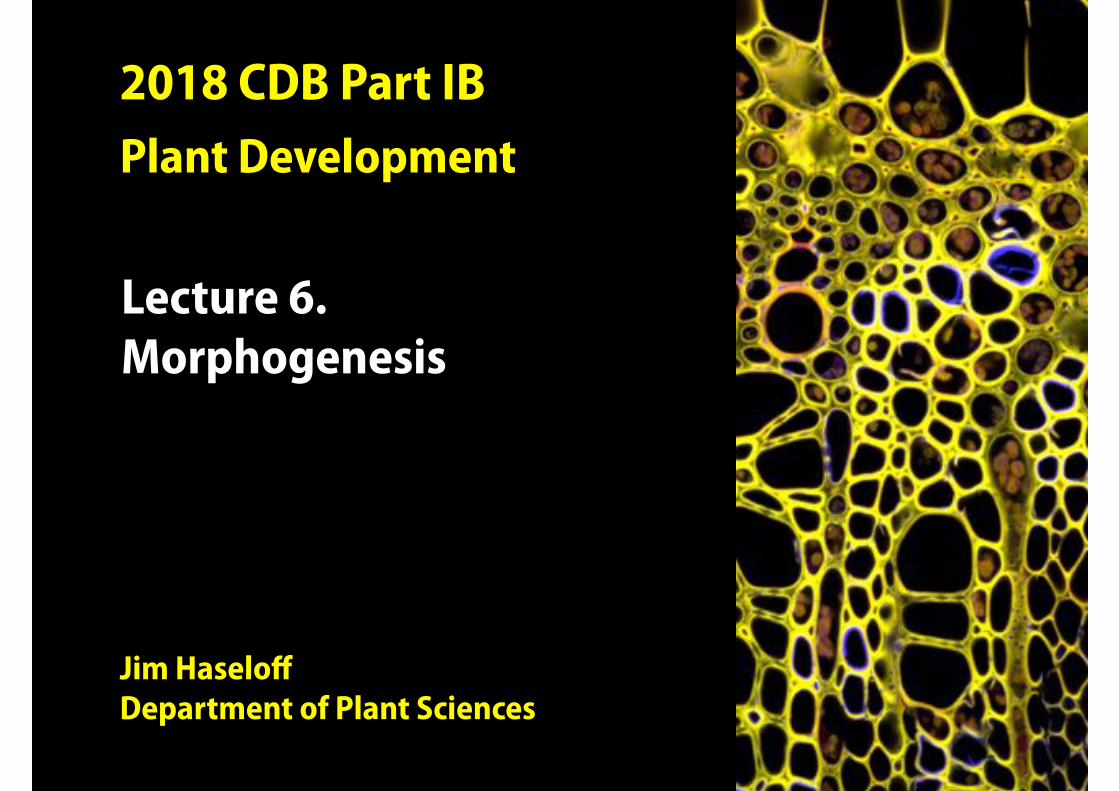
2018 CDB Part IB
Plant Development
Jim HaseloffDepartment of Plant Sciences
Lecture 6.Morphogenesis
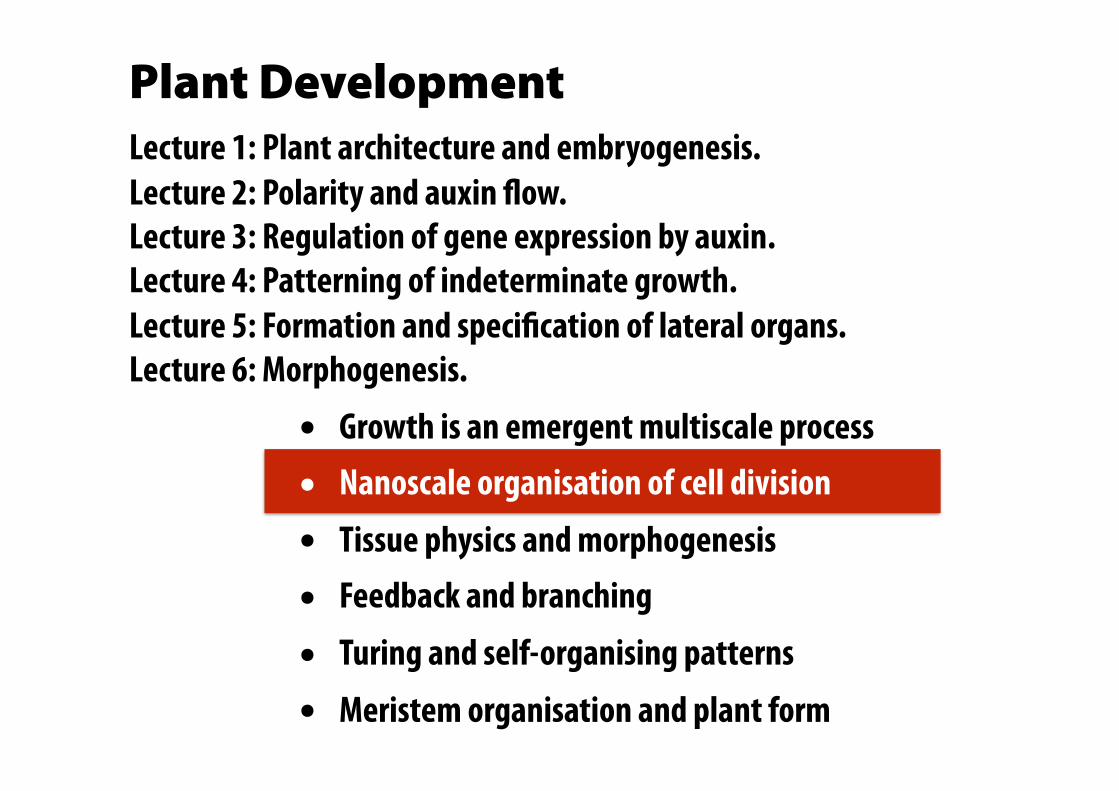
Plant Development Lecture 1: Plant architecture and embryogenesis.Lecture 2: Polarity and auxin flow. Lecture 3: Regulation of gene expression by auxin.Lecture 4: Patterning of indeterminate growth. Lecture 5: Formation and specification of lateral organs. Lecture 6: Morphogenesis.
• Growth is an emergent multiscale process
• Nanoscale organisation of cell division
• Tissue physics and morphogenesis
• Feedback and branching
• Turing and self-organising patterns
• Meristem organisation and plant form
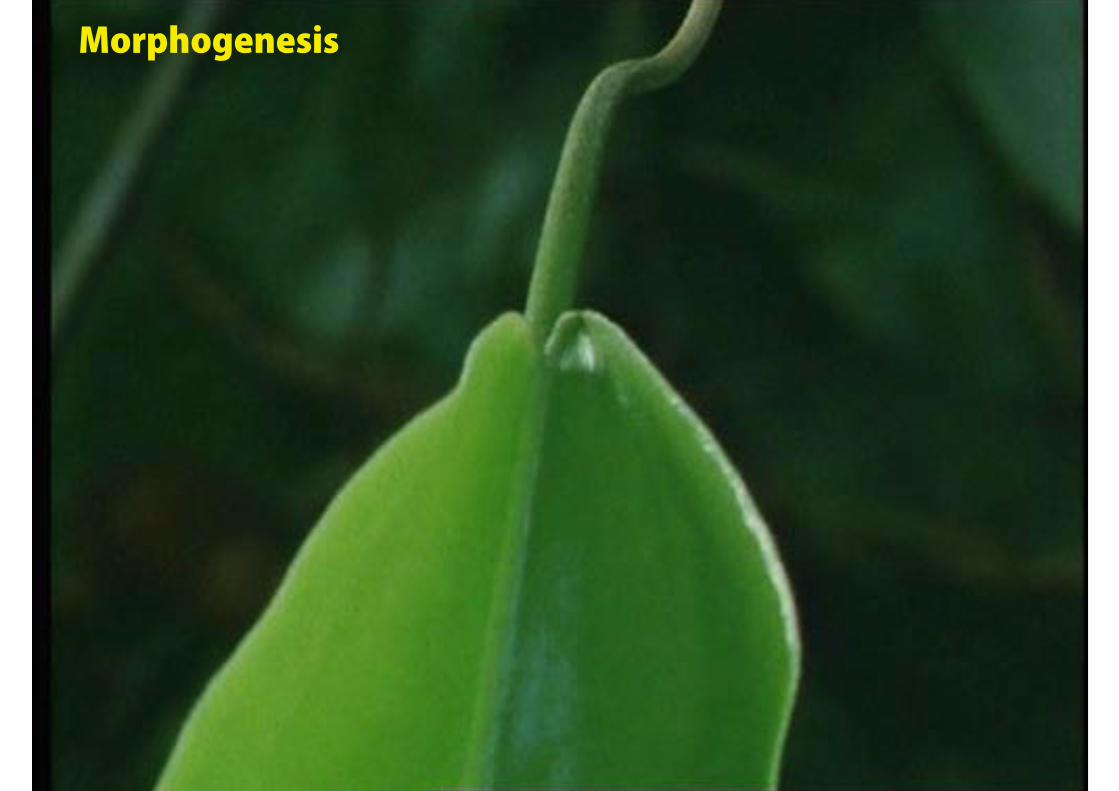
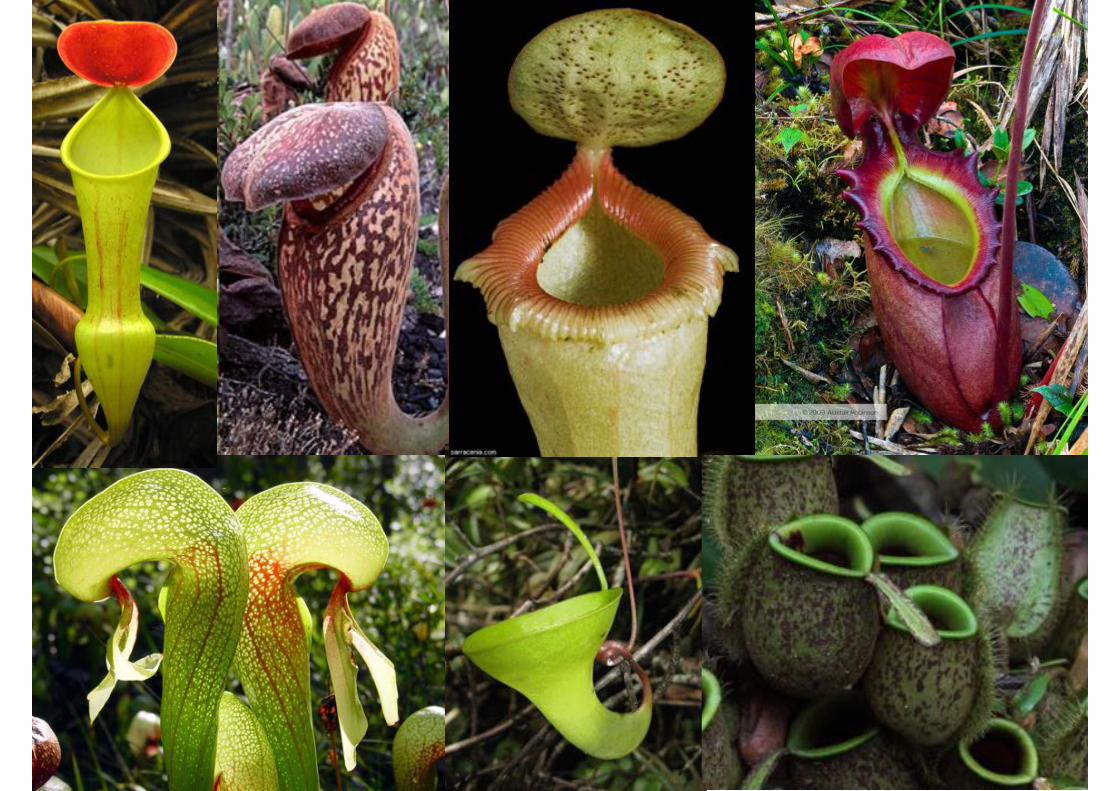
Morphogenesis
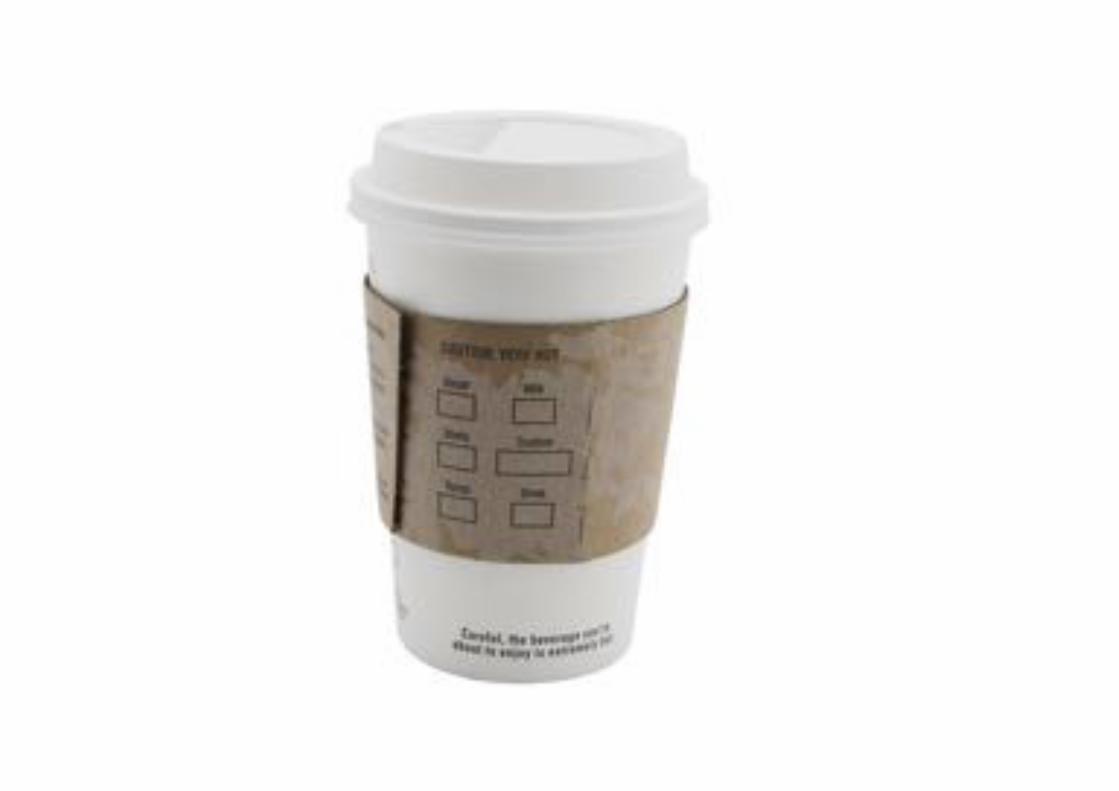
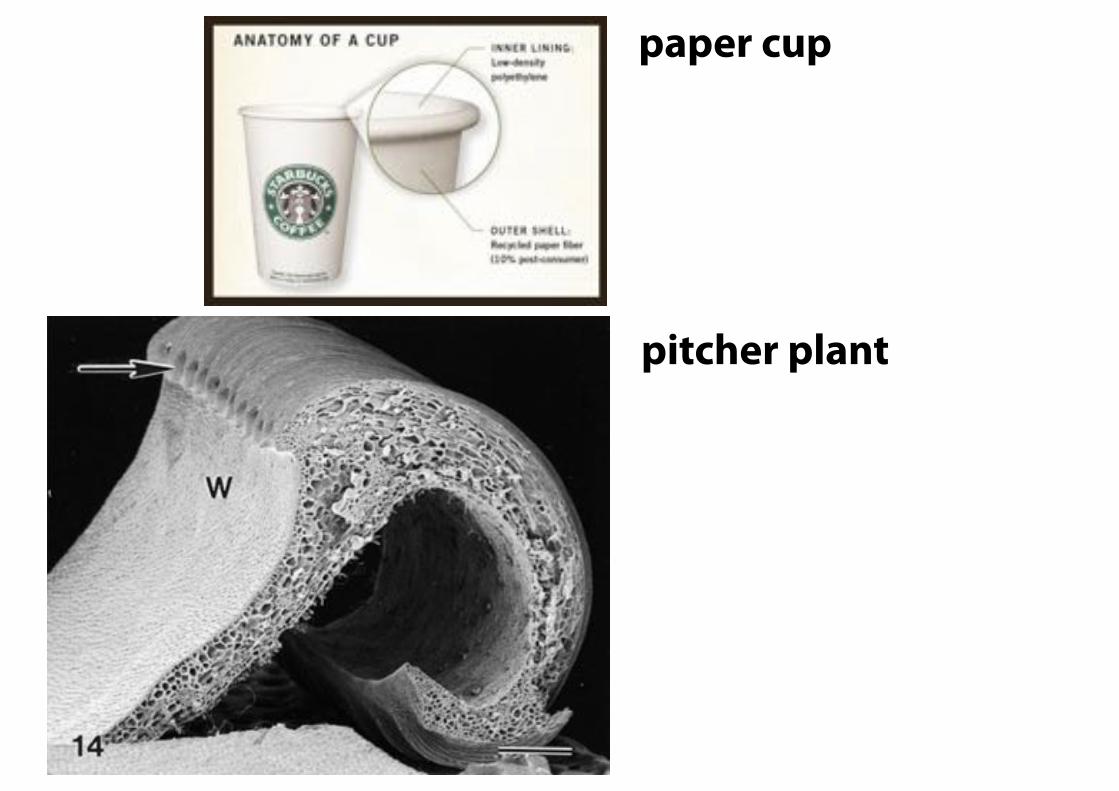
paper cup
pitcher plant

Plant cells are immobilised. Morphogenesis is driven by cell division and elongation.
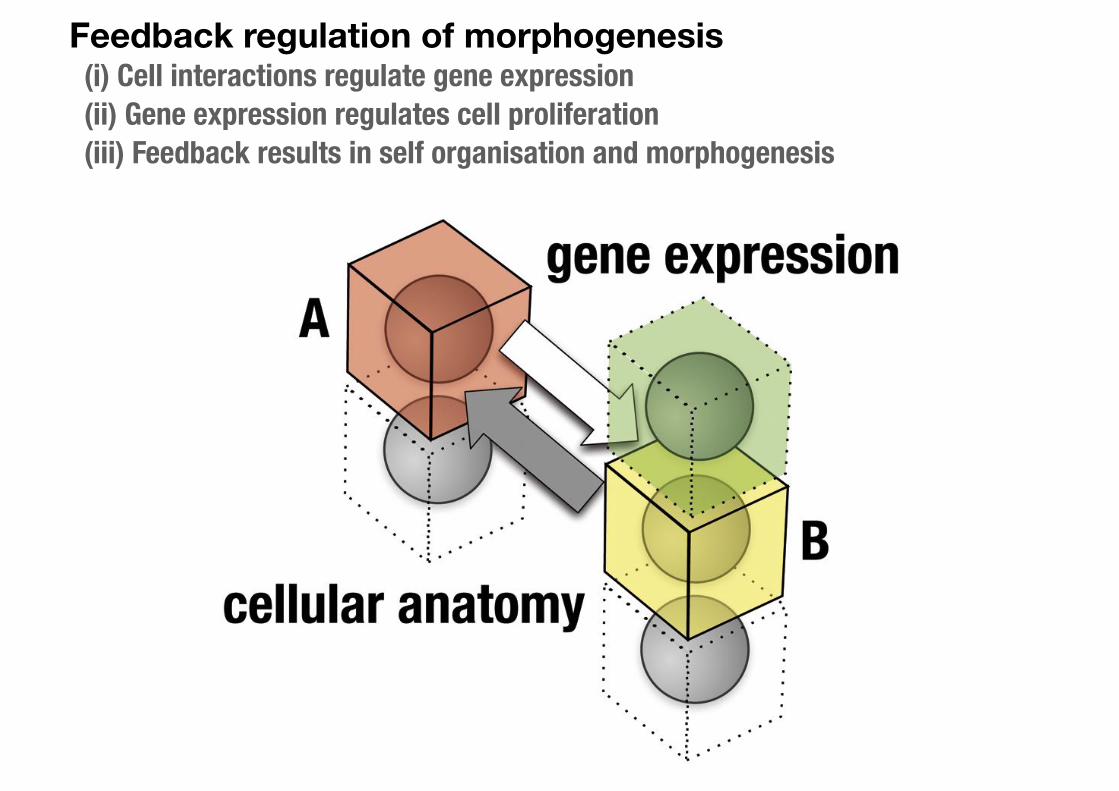
Feedback regulation of morphogenesis (i) Cell interactions regulate gene expression (ii) Gene expression regulates cell proliferation (iii) Feedback results in self organisation and morphogenesis
Plant Development Lecture 1: Plant architecture and embryogenesis.Lecture 2: Polarity and auxin flow. Lecture 3: Regulation of gene expression by auxin.Lecture 4: Patterning of indeterminate growth. Lecture 5: Formation and specification of lateral organs. Lecture 6: Morphogenesis.
• Growth is an emergent multiscale process
• Nanoscale organisation of cell division
• Tissue physics and morphogenesis
• Feedback and branching
• Turing and self-organising patterns
• Meristem organisation and plant form
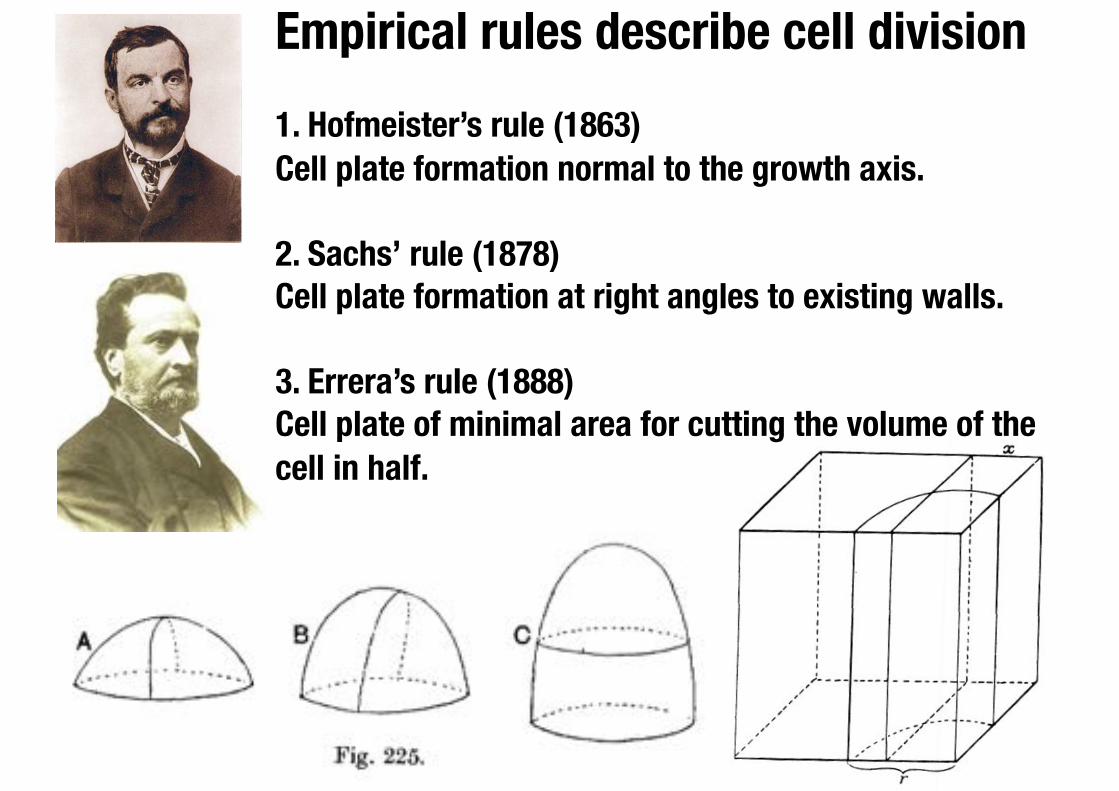
Empirical rules describe cell division
1. Hofmeister’s rule (1863)Cell plate formation normal to the growth axis.
2. Sachs’ rule (1878)Cell plate formation at right angles to existing walls.
3. Errera’s rule (1888)Cell plate of minimal area for cutting the volume of the cell in half.
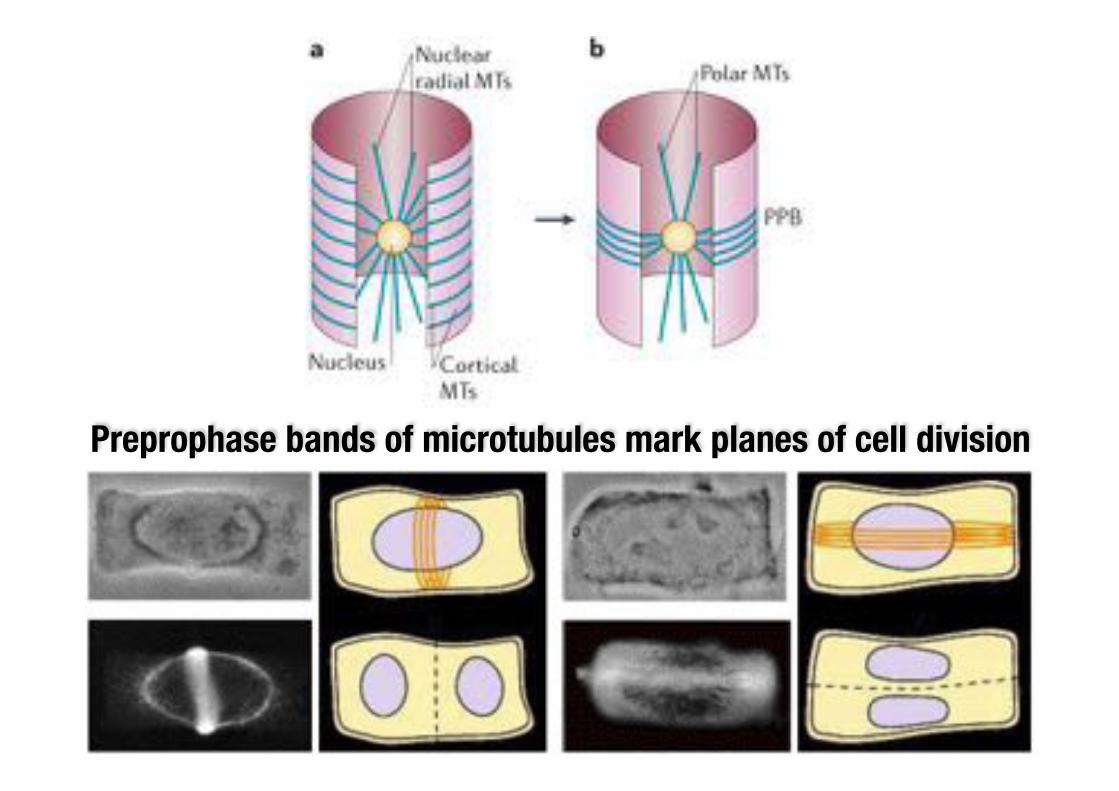
Preprophase bands of microtubules mark planes of cell division

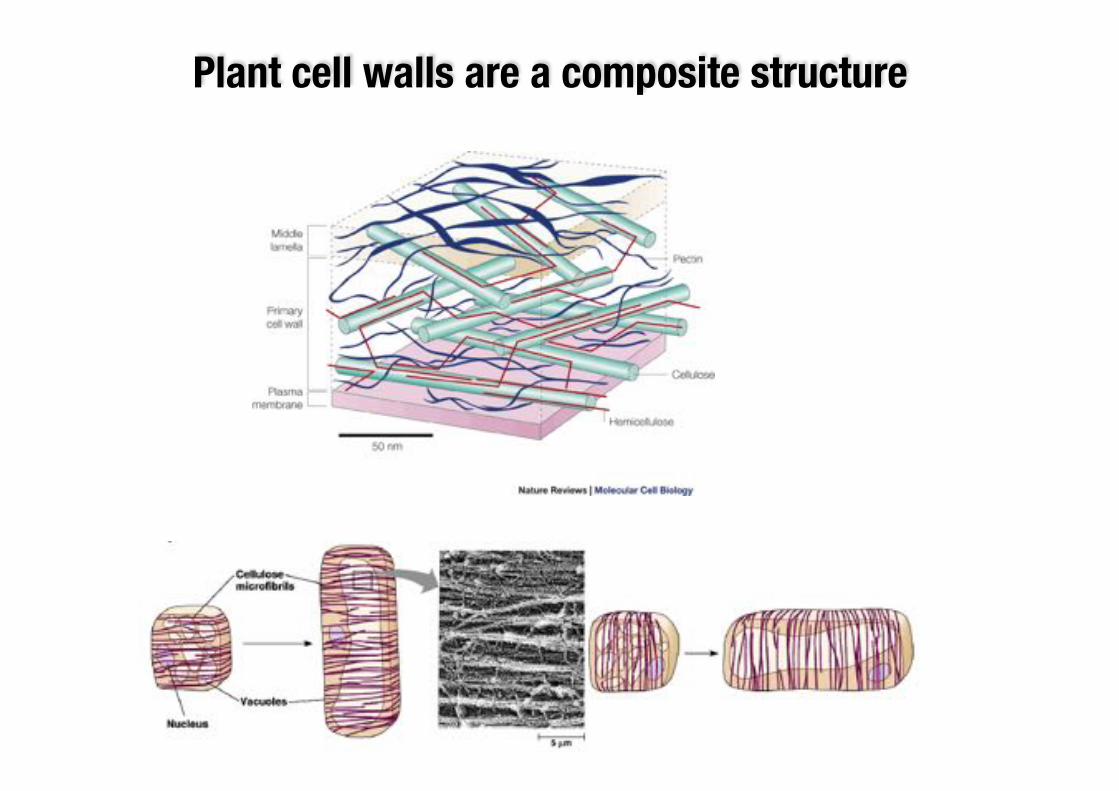
Plant cell walls are a composite structure

Plant Development Lecture 1: Plant architecture and embryogenesis.Lecture 2: Polarity and auxin flow. Lecture 3: Regulation of gene expression by auxin.Lecture 4: Patterning of indeterminate growth. Lecture 5: Formation and specification of lateral organs. Lecture 6: Morphogenesis.
• Growth is an emergent multiscale process
• Nanoscale organisation of cell division
• Tissue physics and morphogenesis
• Feedback and branching
• Turing and self-organising patterns
• Meristem organisation and plant form
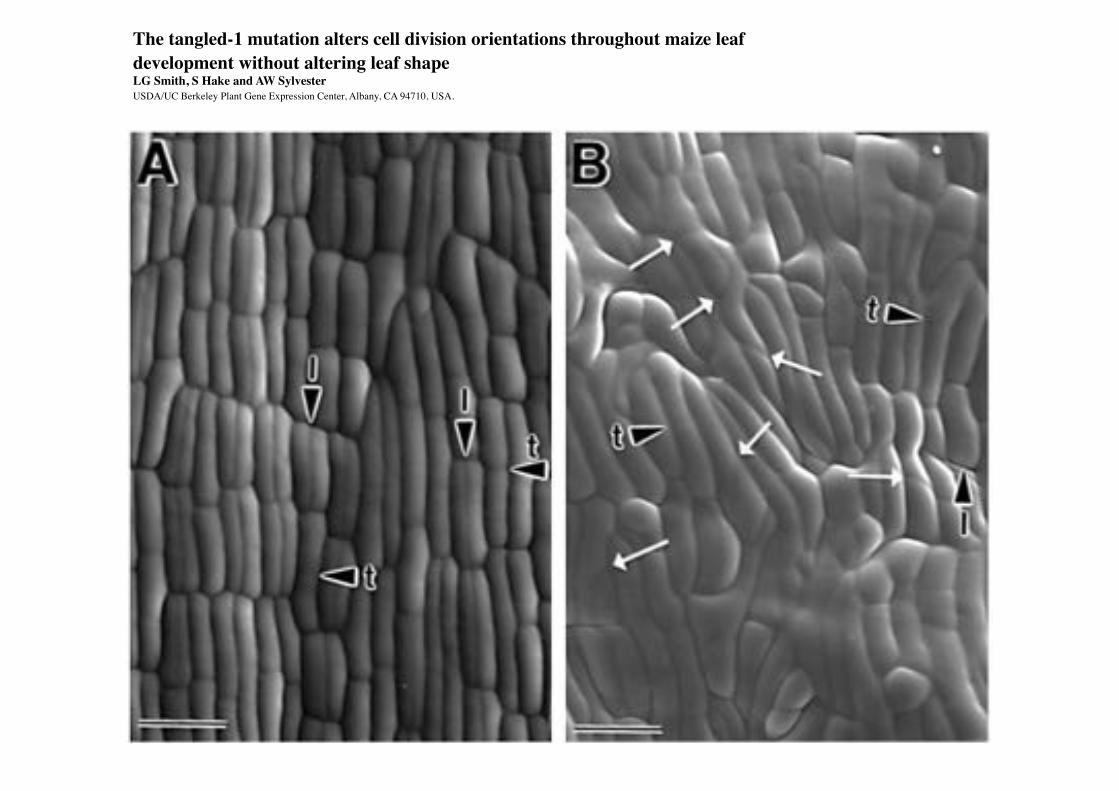
The tangled-1 mutation alters cell division orientations throughout maize leaf development without altering leaf shapeLG Smith, S Hake and AW Sylvester USDA/UC Berkeley Plant Gene Expression Center, Albany, CA 94710, USA.


Physical forces affect the orientation of cell division
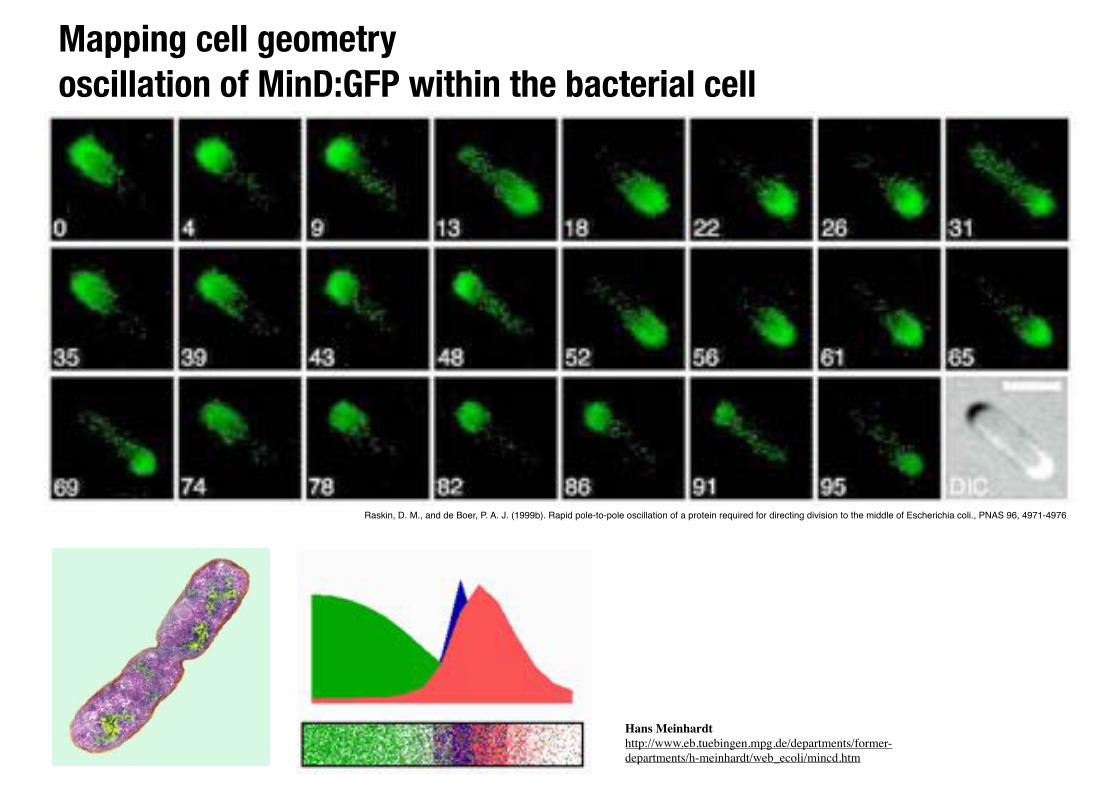
Mapping cell geometry oscillation of MinD:GFP within the bacterial cell
Raskin, D. M., and de Boer, P. A. J. (1999b). Rapid pole-to-pole oscillation of a protein required for directing division to the middle of Escherichia coli., PNAS 96, 4971-4976
Hans Meinhardthttp://www.eb.tuebingen.mpg.de/departments/former-departments/h-meinhardt/web_ecoli/mincd.htm
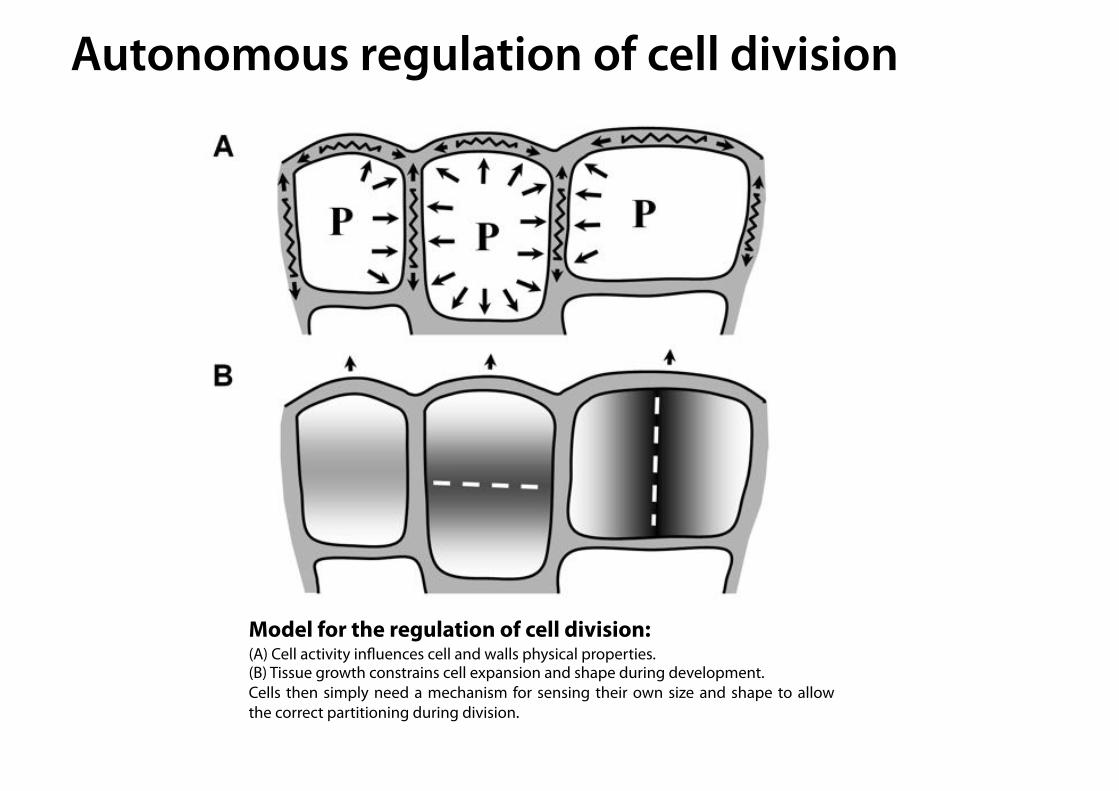
Model for the regulation of cell division: (A) Cell activity influences cell and walls physical properties. (B) Tissue growth constrains cell expansion and shape during development. Cells then simply need a mechanism for sensing their own size and shape to allow the correct partitioning during division.
!
Autonomous regulation of cell division
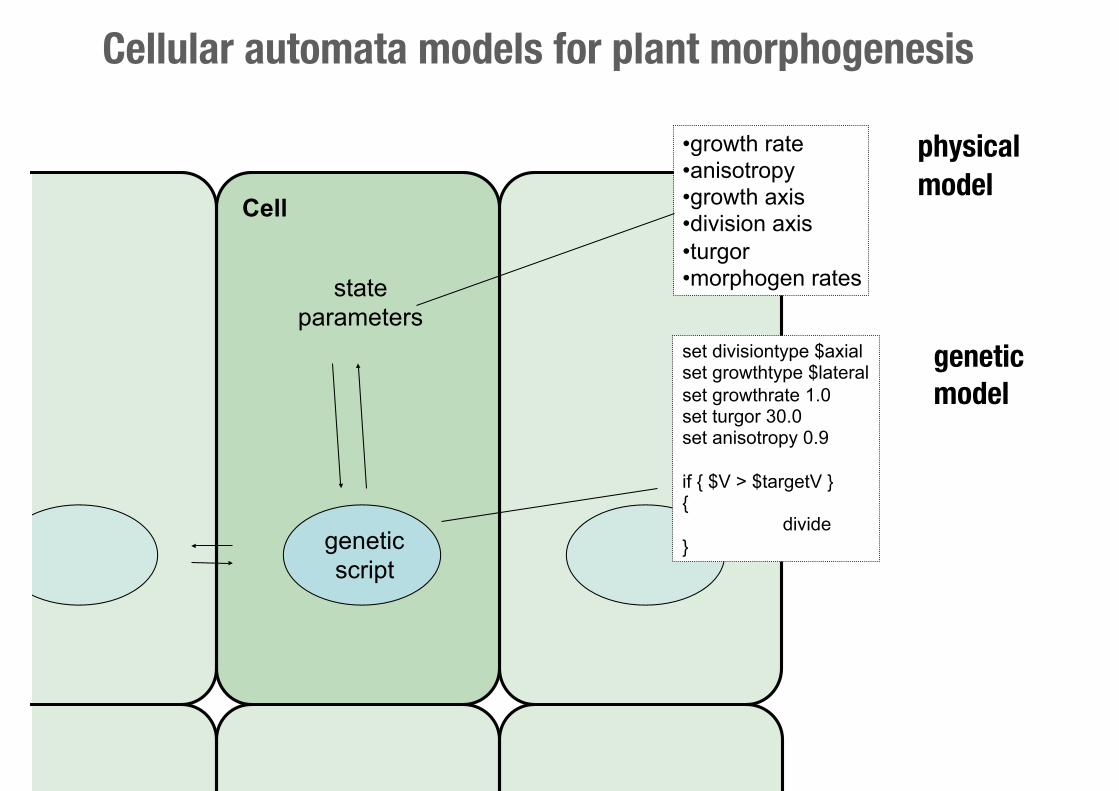
state parameters
•growth rate •anisotropy •growth axis •division axis •turgor •morphogen rates
set divisiontype $axial set growthtype $lateral set growthrate 1.0 set turgor 30.0 set anisotropy 0.9
if { $V > $targetV } { divide }
Cell
physical model
geneticscript
geneticmodel
Cellular automata models for plant morphogenesis

Computer model for cellular growth
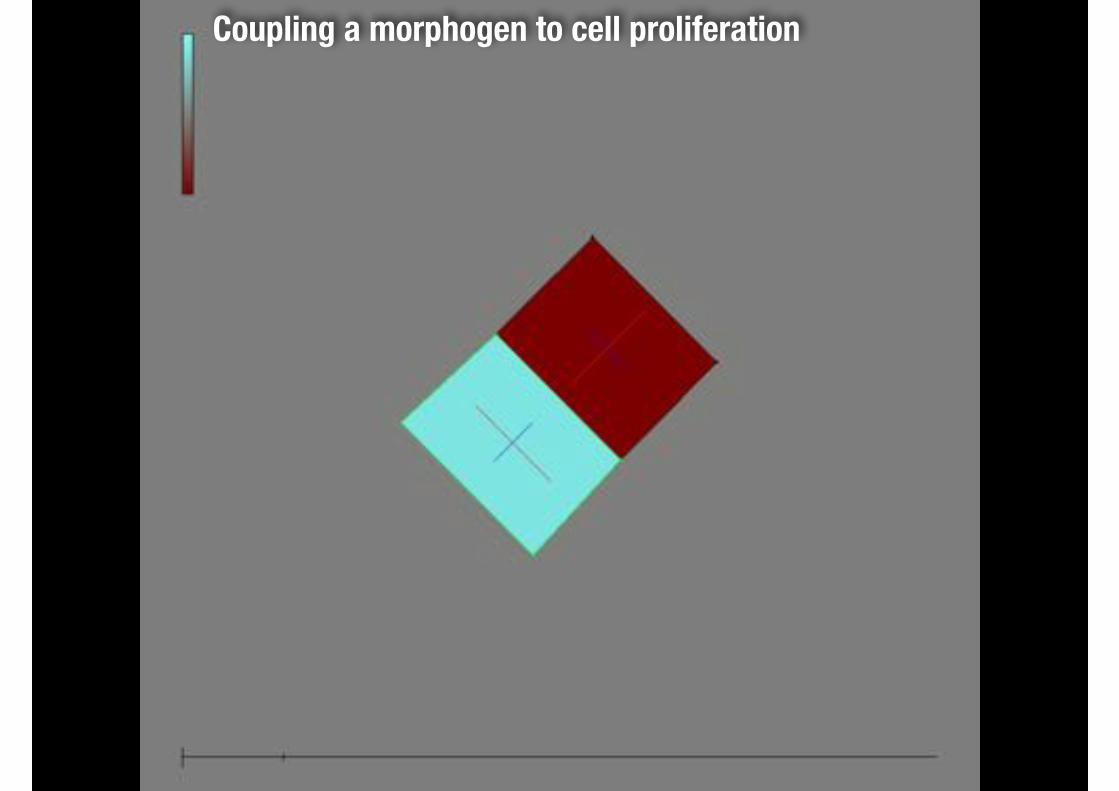
Coupling a morphogen to cell proliferation
Plant Development Lecture 1: Plant architecture and embryogenesis.Lecture 2: Polarity and auxin flow. Lecture 3: Regulation of gene expression by auxin.Lecture 4: Patterning of indeterminate growth. Lecture 5: Formation and specification of lateral organs. Lecture 6: Morphogenesis.
• Growth is an emergent multiscale process
• Nanoscale organisation of cell division
• Tissue physics and morphogenesis
• Feedback and branching
• Turing and self-organising patterns
• Meristem organisation and plant form
§
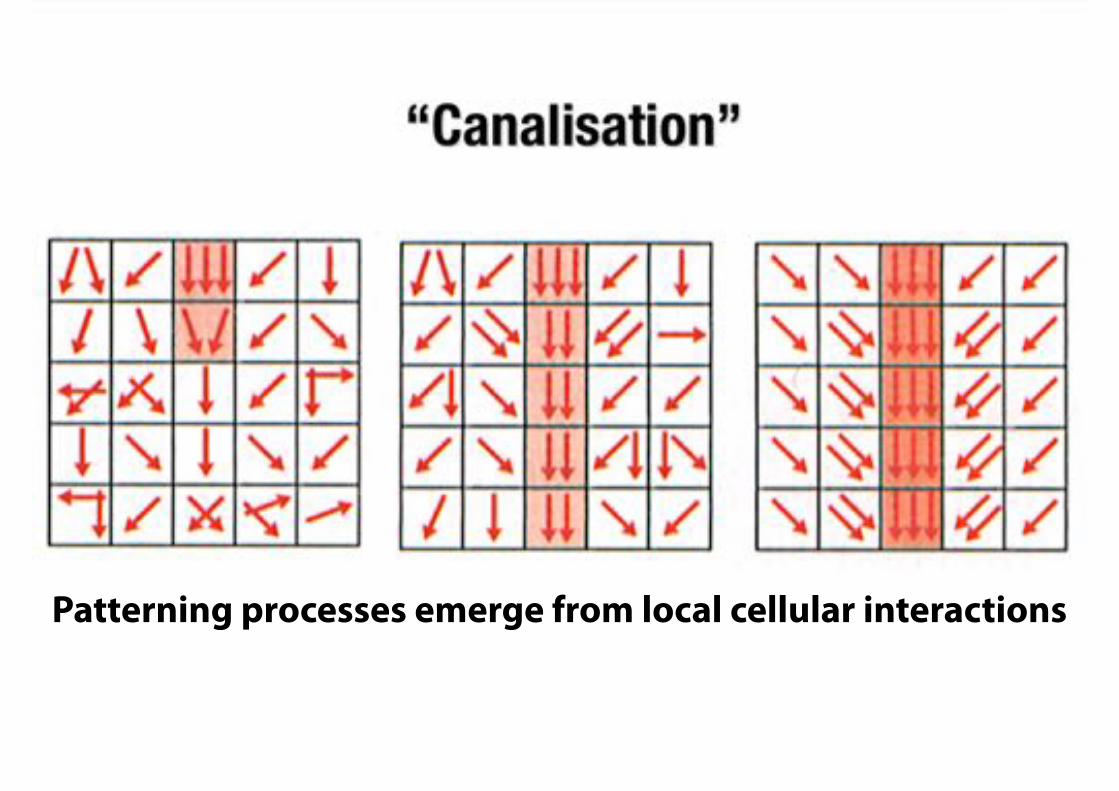
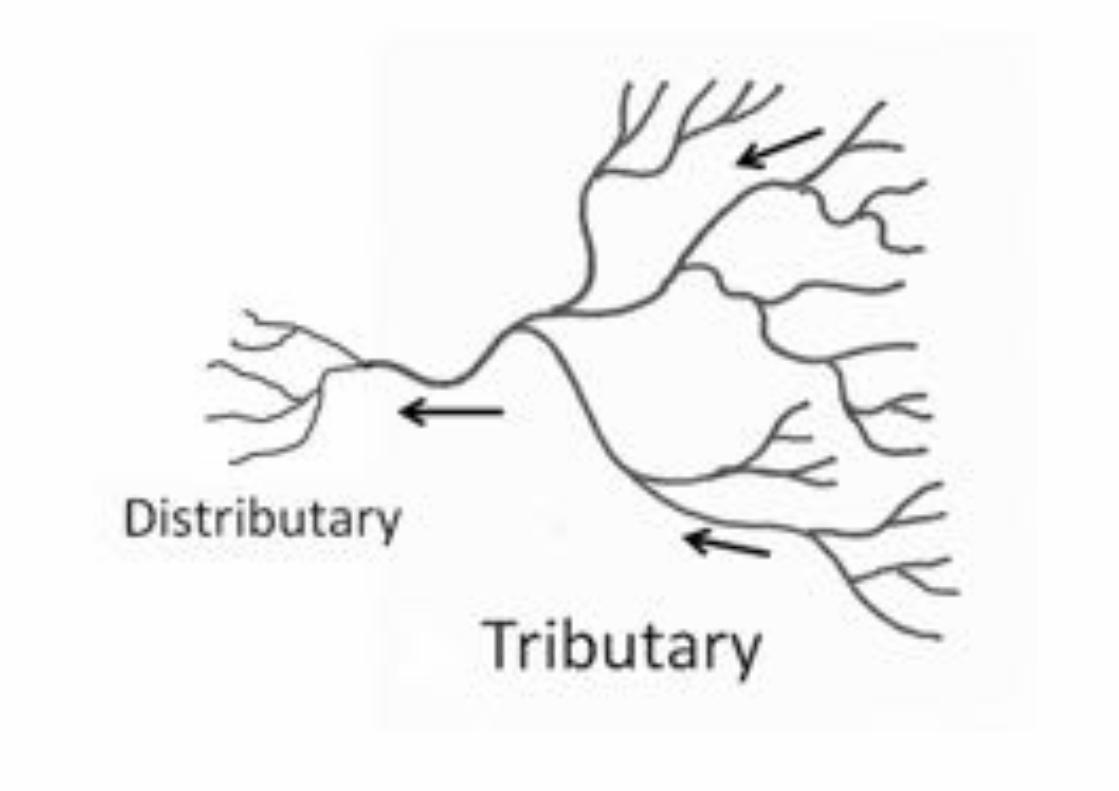
Patterning processes emerge from local cellular interactions
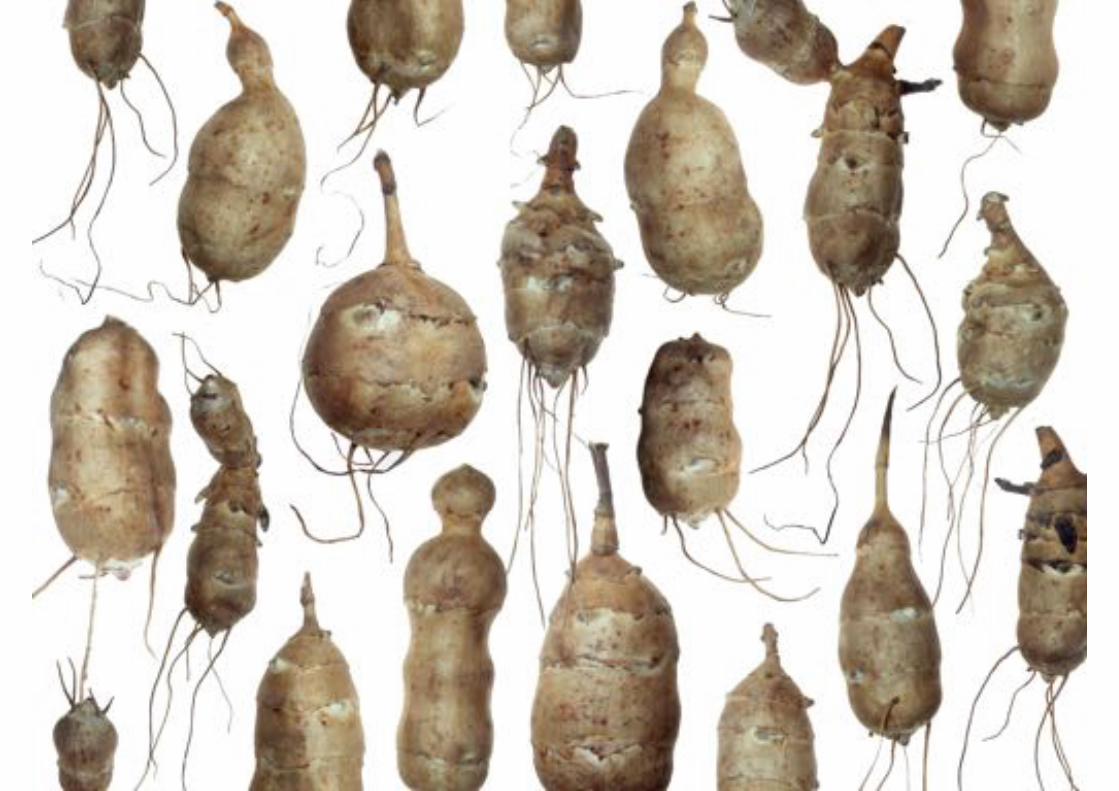
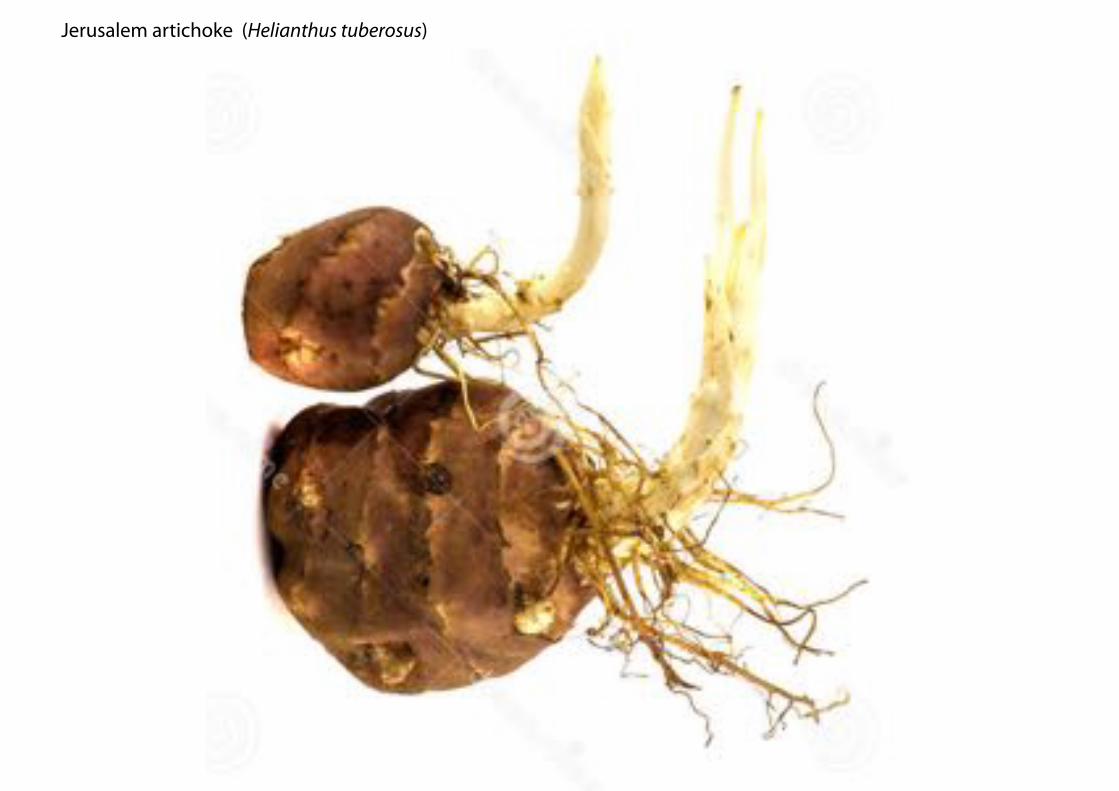
Jerusalem artichoke (Helianthus tuberosus)
Effects of SUT1 Inhibition on Tuber Metabolism
More detailed yield analyses demonstrated thattuber yield of antisense plants depends on the de-velopmental stage. Because tubers are supposed to
switch between apoplasmic and symplasmic un-loading, distinct stages of tuber development weredefined. The switch from apoplasmic to symplasmicphloem unloading occurs during stolon-to-tuber-transition of potato (Viola et al., 2001), and, thus,
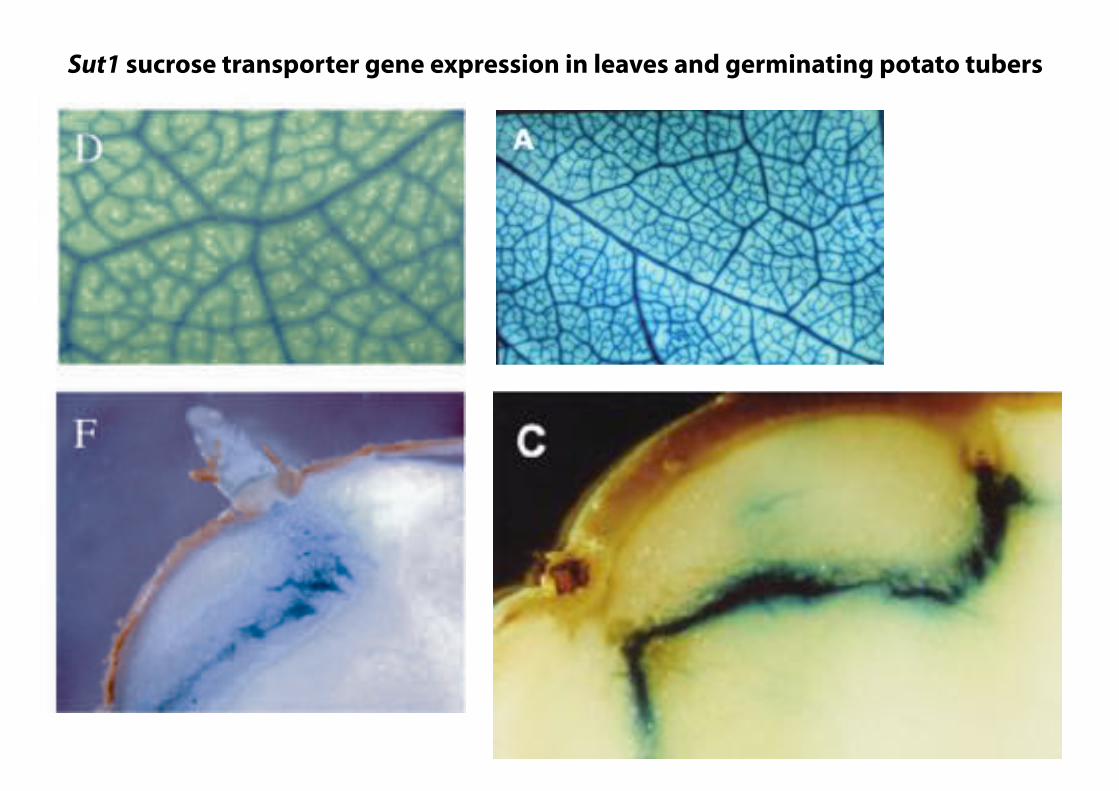
Figure 2. The GUS reporter gene expressed under control of the LeSUT1 promoter fragment in transgenic potato plants. A,Translational GUS fusion construct used for transformation. B, LeSUT1 promoter activity follows the sink to source transitionin leaves. C, LeSUT1 promoter activity is restricted to the vasculature of mature leaves and petioles. GUS expression isdetectable in major and minor veins of source leaves (D), sink tubers (E), and sprouting source tubers (F).
Suc Transport in Potato Tubers
Plant Physiol. Vol. 131, 2003 105 www.plant.org on May 9, 2016 - Published by www.plantphysiol.orgDownloaded from Copyright © 2003 American Society of Plant Biologists. All rights reserved.
Sut1 sucrose transporter gene expression in leaves and germinating potato tubers

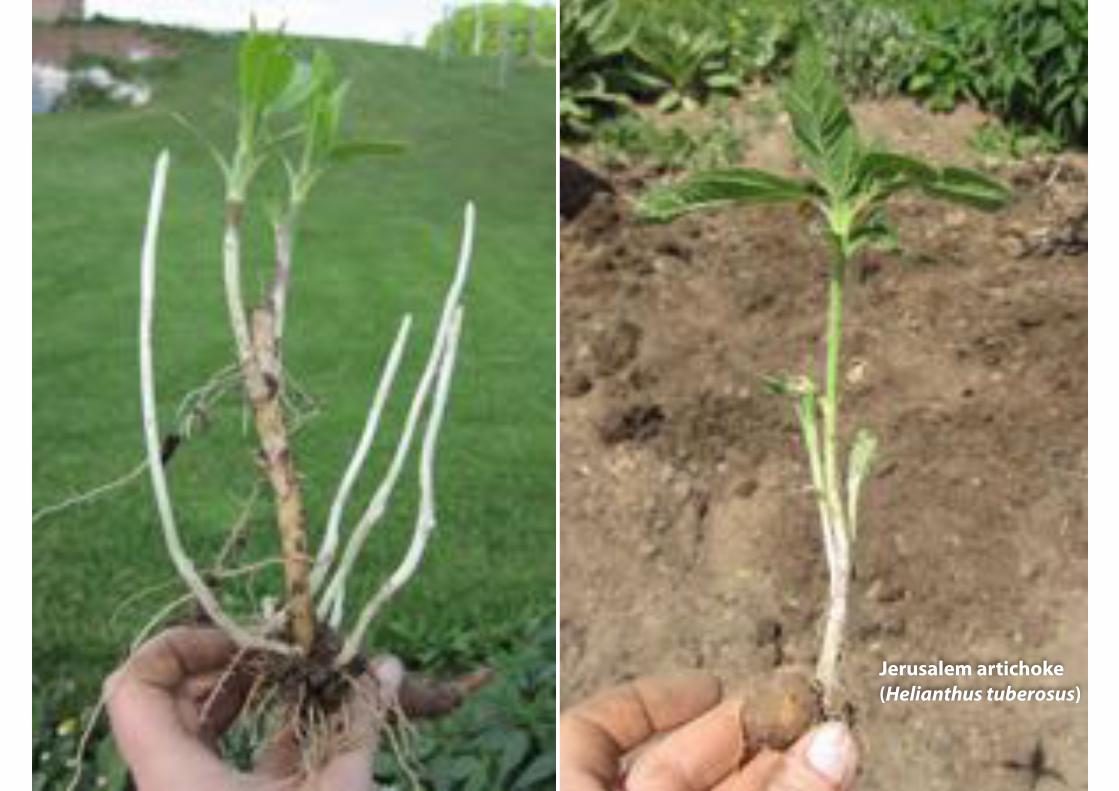
Jerusalem artichoke (Helianthus tuberosus)
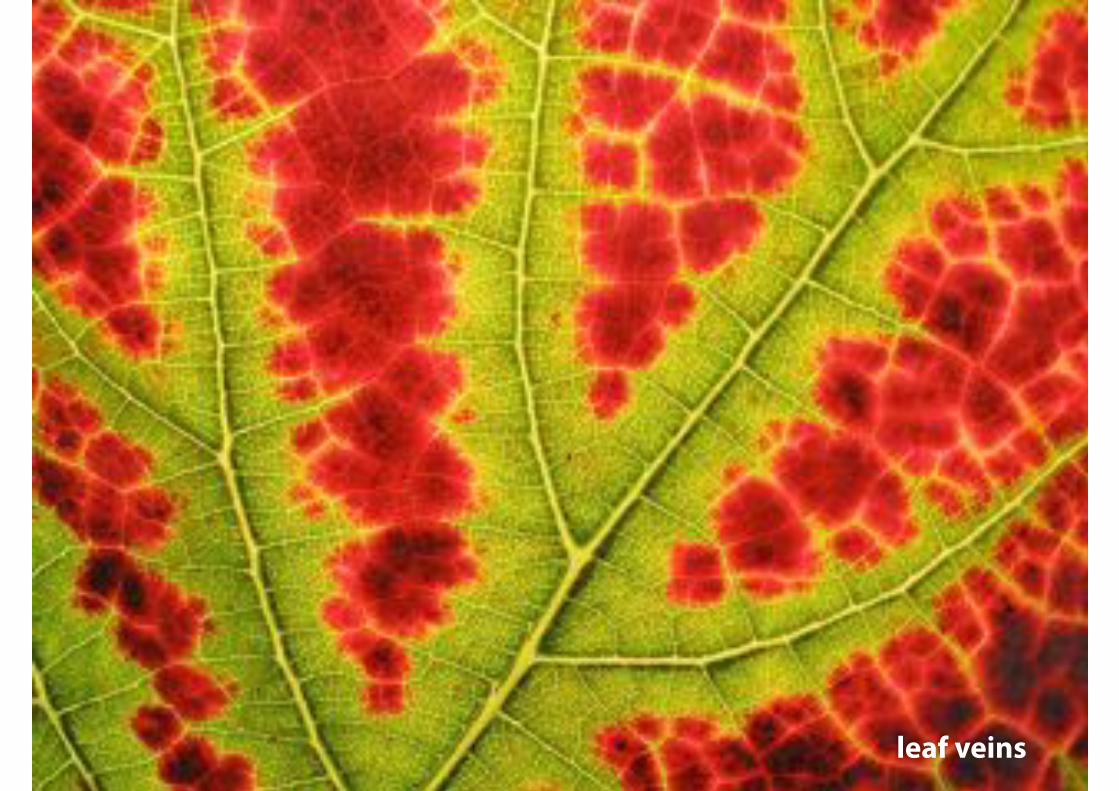
leaf veins
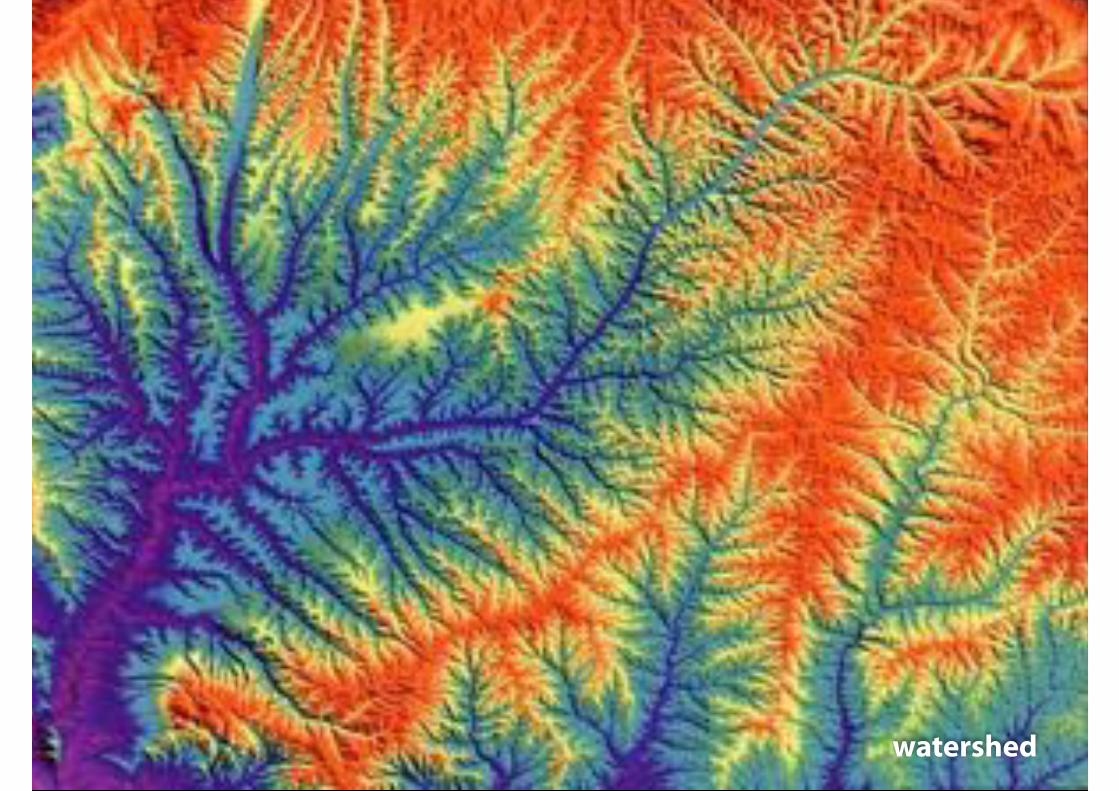
watershed
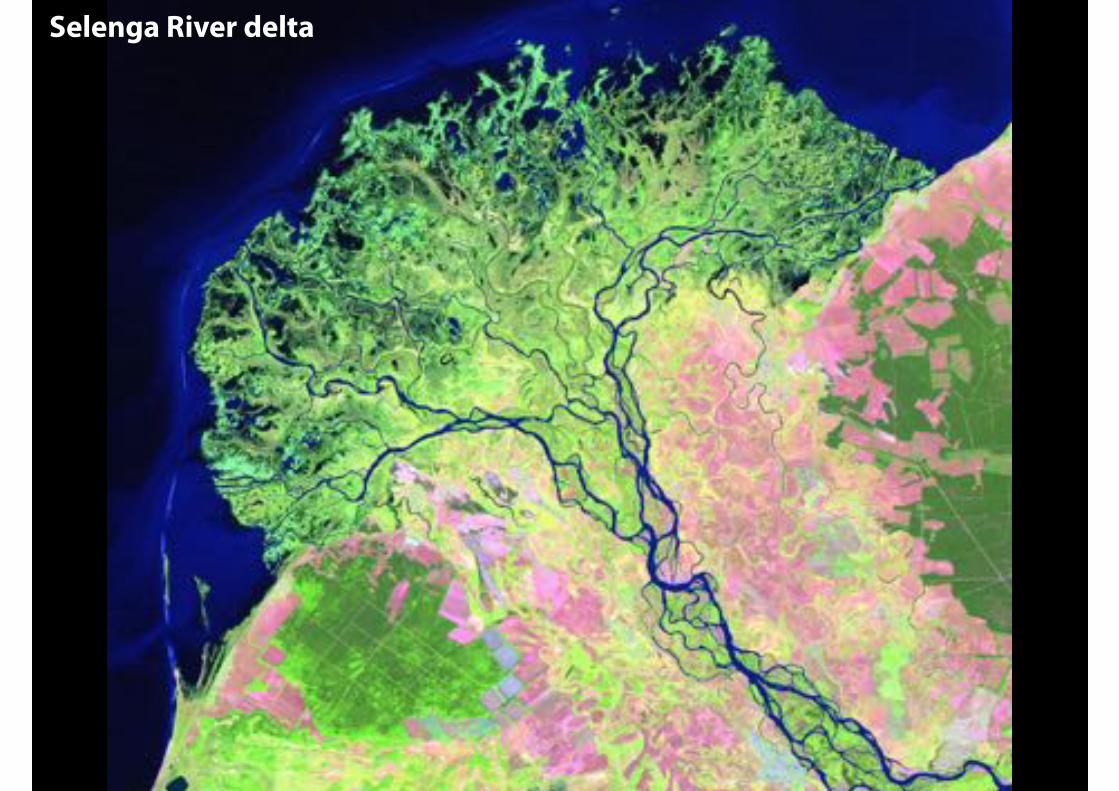
Selenga River delta

�37


Secret Life of Chaos
Plant Development Lecture 1: Plant architecture and embryogenesis.Lecture 2: Polarity and auxin flow. Lecture 3: Regulation of gene expression by auxin.Lecture 4: Patterning of indeterminate growth. Lecture 5: Formation and specification of lateral organs. Lecture 6: Morphogenesis.
• Growth is an emergent multiscale process
• Nanoscale organisation of cell division
• Tissue physics and morphogenesis
• Feedback and branching
• Turing and self-organising patterns
• Meristem organisation and plant form
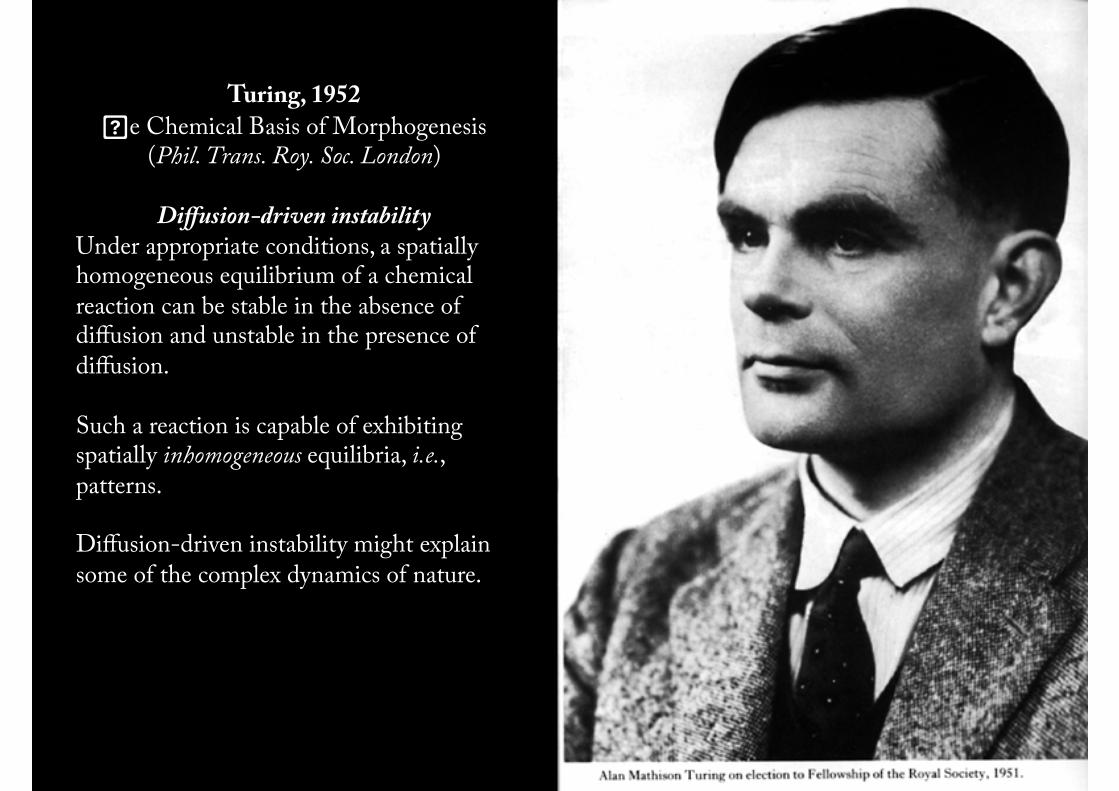
Turing, 1952 !e Chemical Basis of Morphogenesis
(Phil. Trans. Roy. Soc. London)
Diffusion-driven instability Under appropriate conditions, a spatially homogeneous equilibrium of a chemical reaction can be stable in the absence of diffusion and unstable in the presence of diffusion.
Such a reaction is capable of exhibiting spatially inhomogeneous equilibria, i.e., patterns.
Diffusion-driven instability might explain some of the complex dynamics of nature.
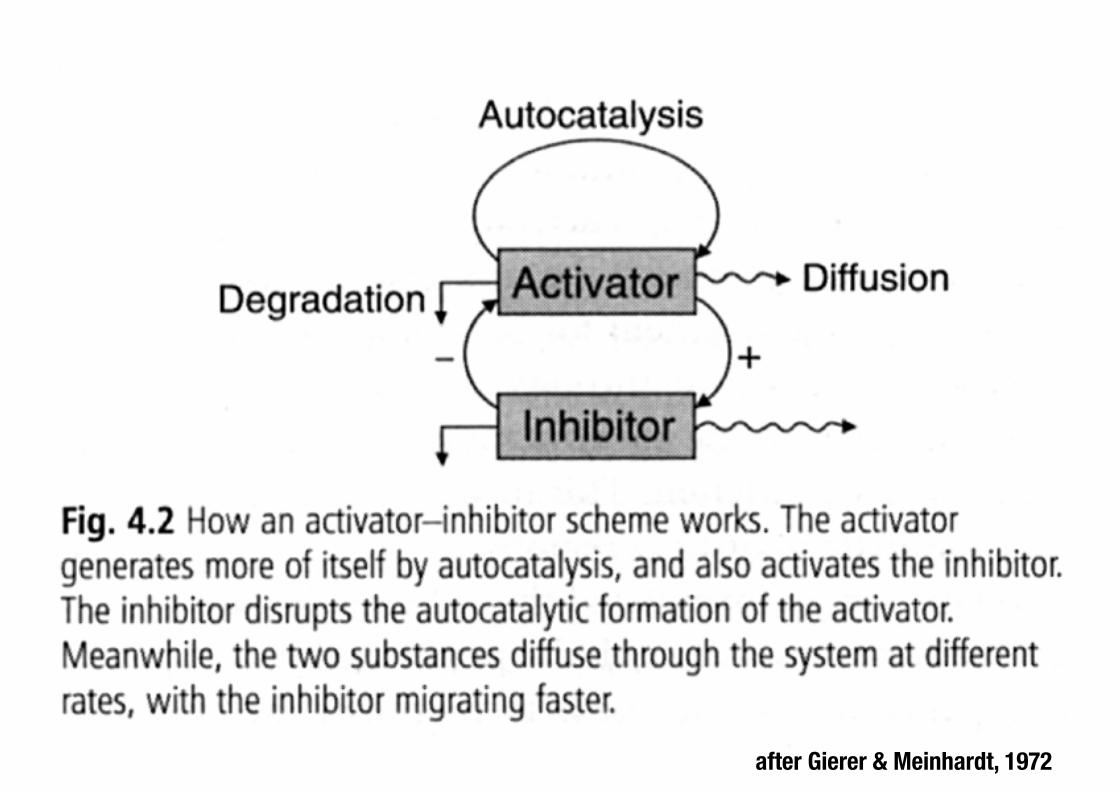
after Gierer & Meinhardt, 1972
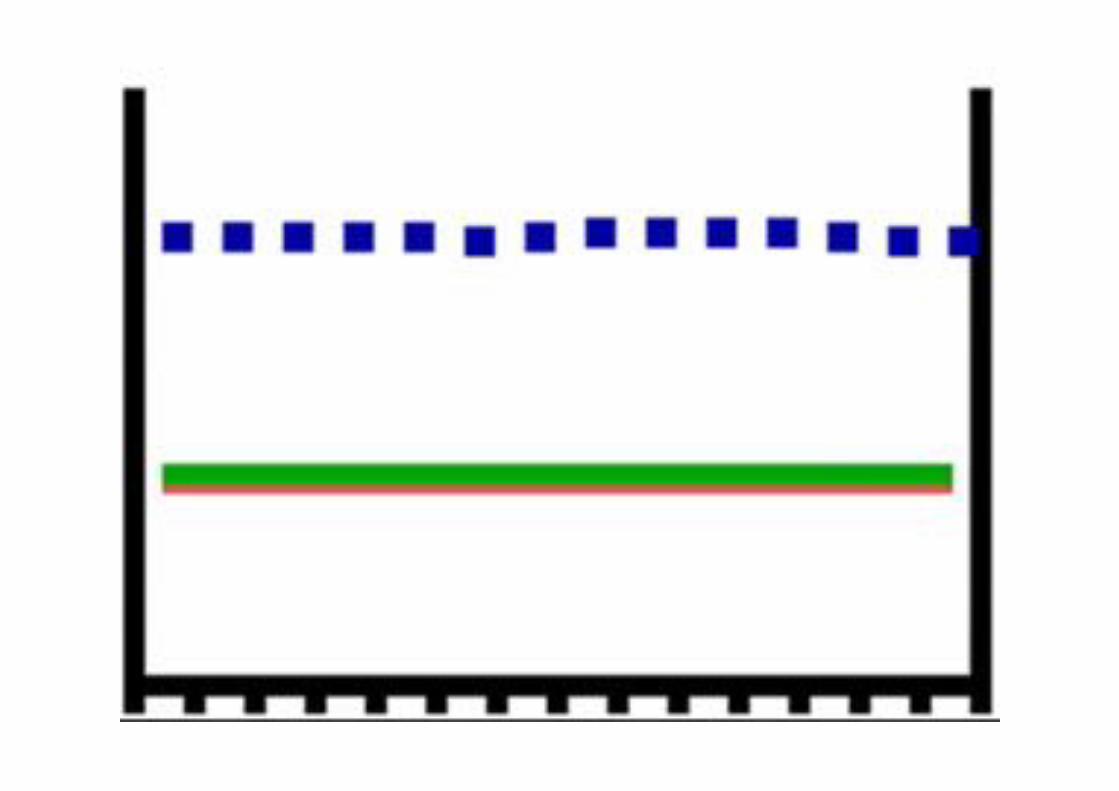
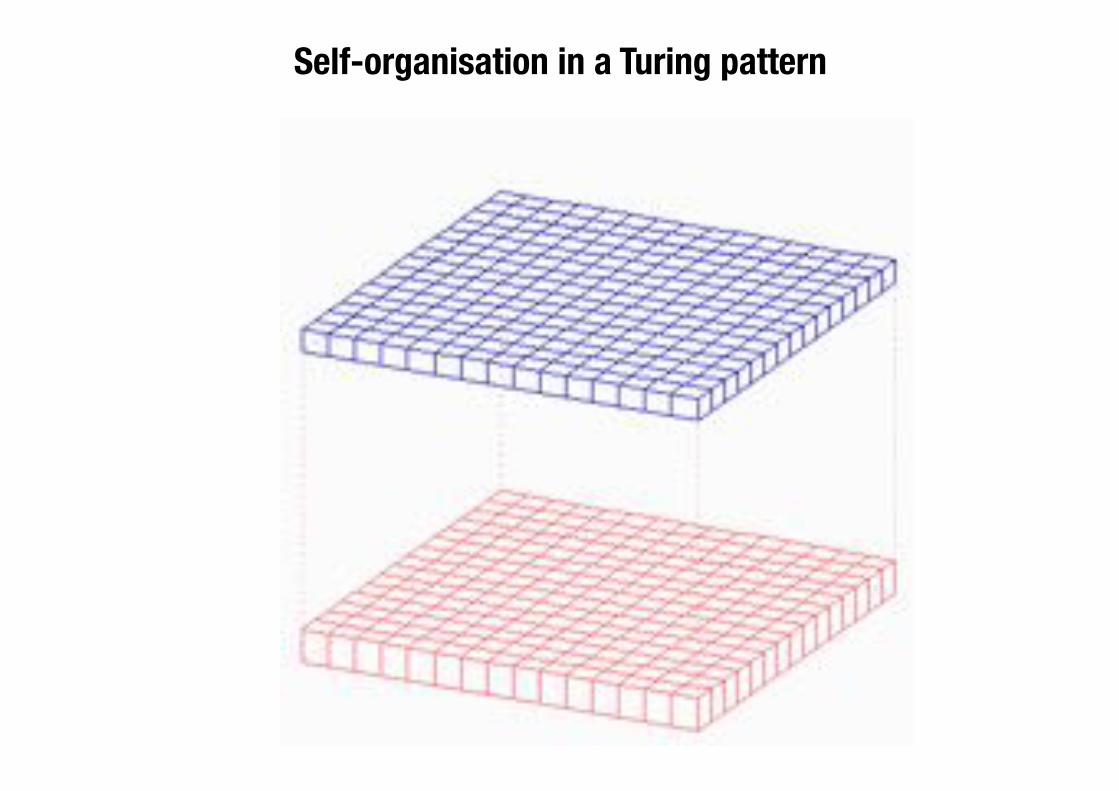
Self-organisation in a Turing pattern
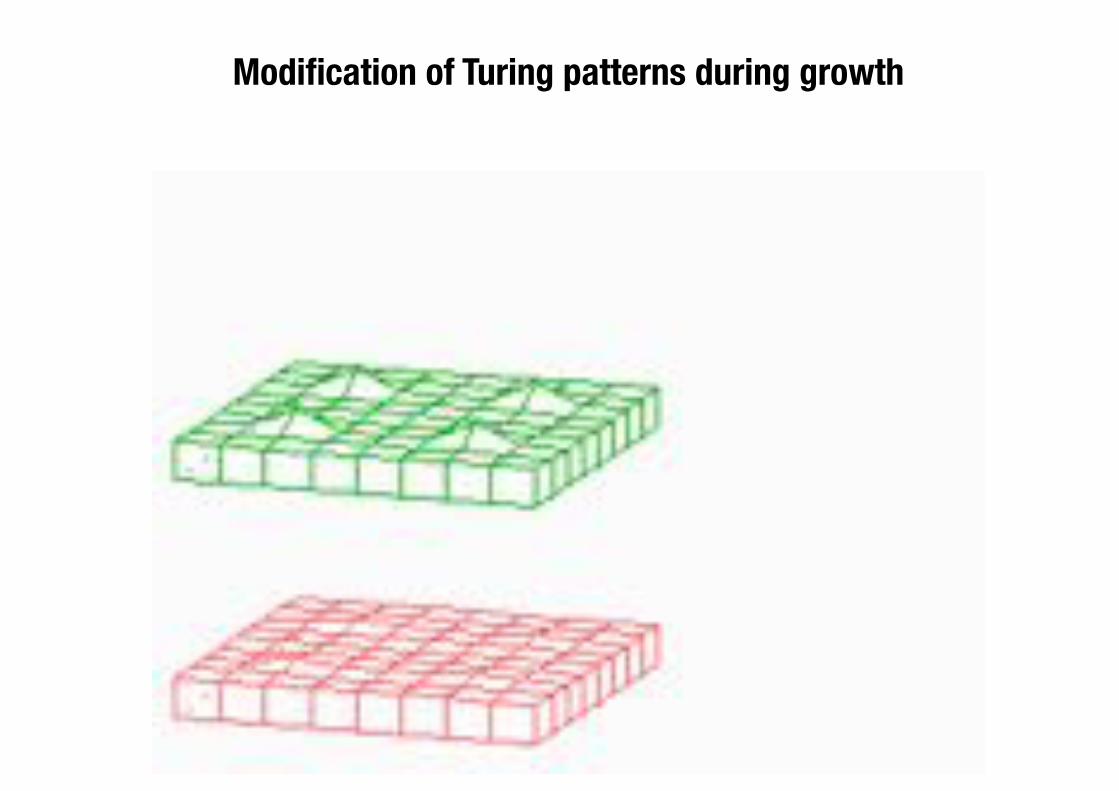
Modification of Turing patterns during growth
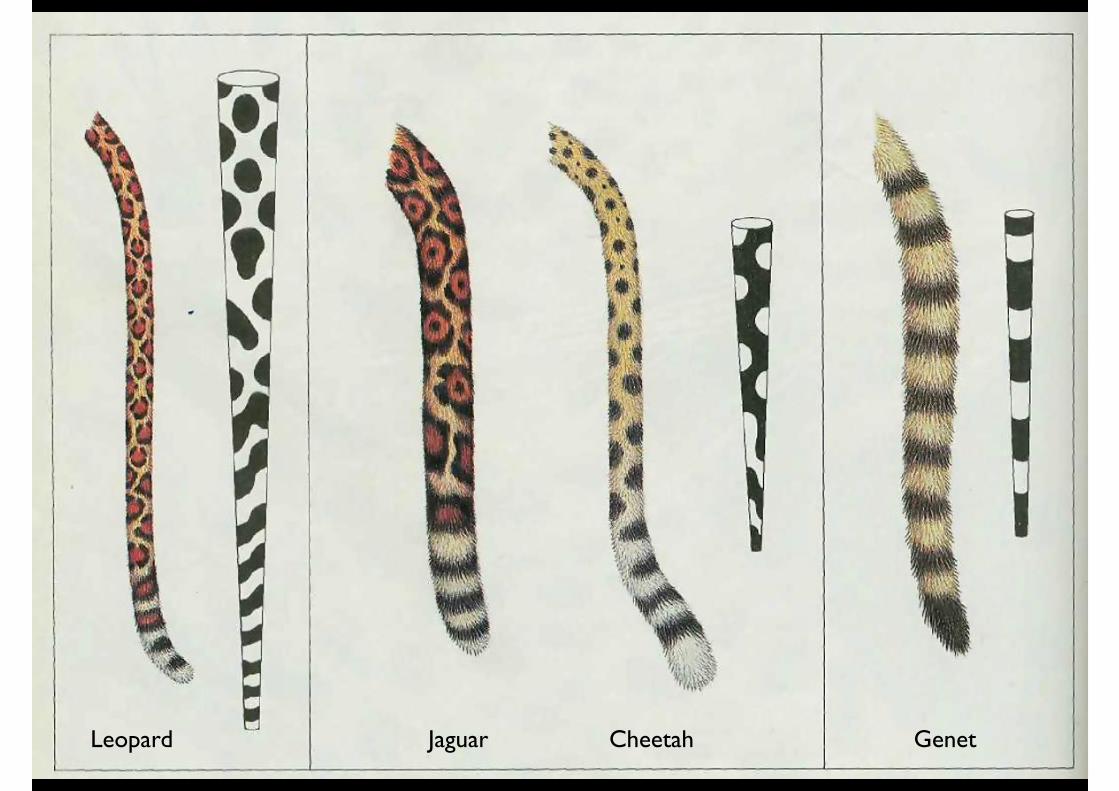
Leopard Jaguar Cheetah Genet
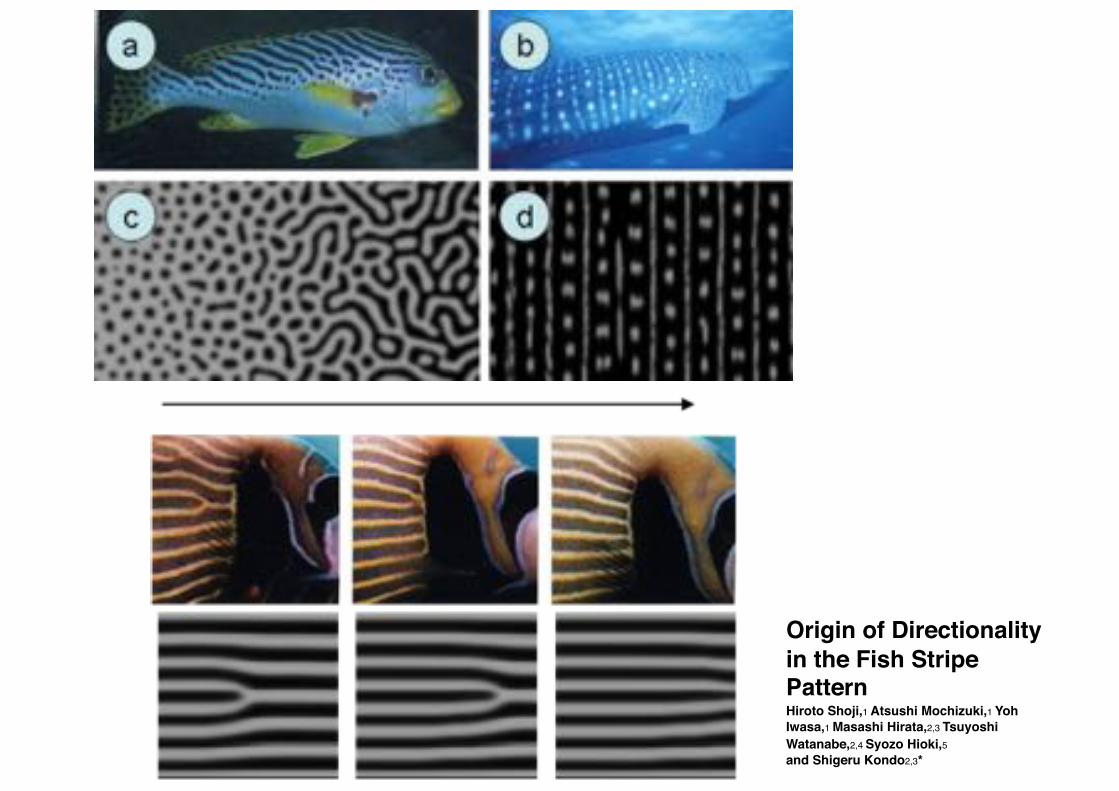
Origin of Directionality in the Fish Stripe PatternHiroto Shoji,1 Atsushi Mochizuki,1 Yoh Iwasa,1 Masashi Hirata,2,3 Tsuyoshi Watanabe,2,4 Syozo Hioki,5and Shigeru Kondo2,3*
A
B
C
Initial condition
Six stable states
Case VI (Turing pattern)Case V
Uniform, stationary
Oscillatory caseswith extremely short
wavelength
Oscillatory caseswith finite wavelength
Stationary waves withfinite wavelength(Turing pattern)
Uniform, oscillating Stationary waves withextremely short wavelength
Both morphogensdiffuse and reactwith each other
I II III
IV V VI
Fig. 2. Schematic drawing showing the mathematical analysis of the RDsystem and the patterns generated by the simulation. (A) Six stable statestoward which the two-factor RD system can converge. (B) Two-dimensionalpatterns generated by the Turing model. These patterns were made by anidentical equation with slightly different parameter values. These simulationswere calculated by the software provided as supporting online material. (C)
Reproduction of biological patterns created by modified RD mechanisms. Withmodification, the RD mechanism can generate more complex patterns such asthose seen in the real organism. Simulation images are courtesy of H. Meinhardt[sea shell pattern (5)] and A. R. Sandersen [fish pattern (13)]. Photos of actualseashells are from Bishougai-HP (http://shell.kwansei.ac.jp/~shell/). Images ofpopper fish are courtesy of Massimo Boyer (www.edge-of-reef.com).
24 SEPTEMBER 2010 VOL 329 SCIENCE www.sciencemag.org1618
REVIEW
on
May
30,
201
1w
ww
.sci
ence
mag
.org
Dow
nloa
ded
from
A I
Short-rangepositive feedback
Long-rangenegative feedback
A B
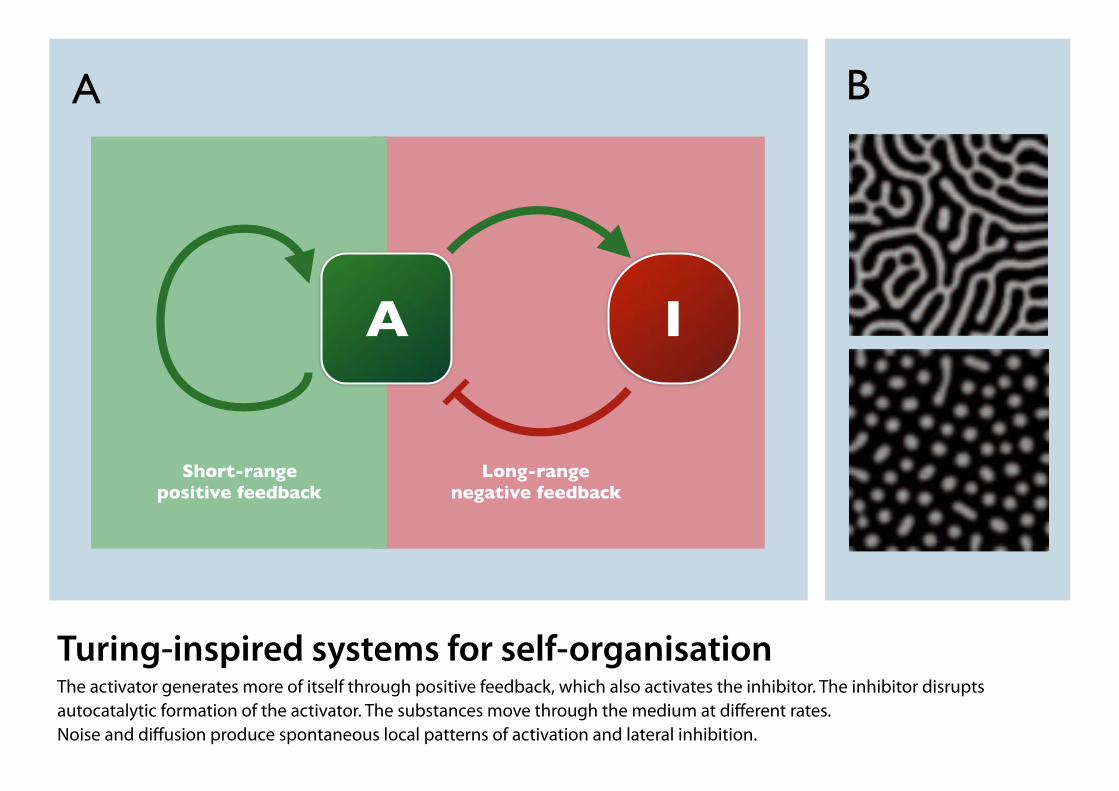
Turing-inspired systems for self-organisation The activator generates more of itself through positive feedback, which also activates the inhibitor. The inhibitor disrupts autocatalytic formation of the activator. The substances move through the medium at different rates. Noise and diffusion produce spontaneous local patterns of activation and lateral inhibition.
Compound Turing systems Jonathon McCabe “Bone Music” http://vimeo.com/jonathanmccabe
Plant Development Lecture 1: Plant architecture and embryogenesis.Lecture 2: Polarity and auxin flow. Lecture 3: Regulation of gene expression by auxin.Lecture 4: Patterning of indeterminate growth. Lecture 5: Formation and specification of lateral organs. Lecture 6: Morphogenesis.
• Growth is an emergent multiscale process
• Nanoscale organisation of cell division
• Tissue physics and morphogenesis
• Feedback and branching
• Turing and self-organising patterns
• Meristem organisation and plant form
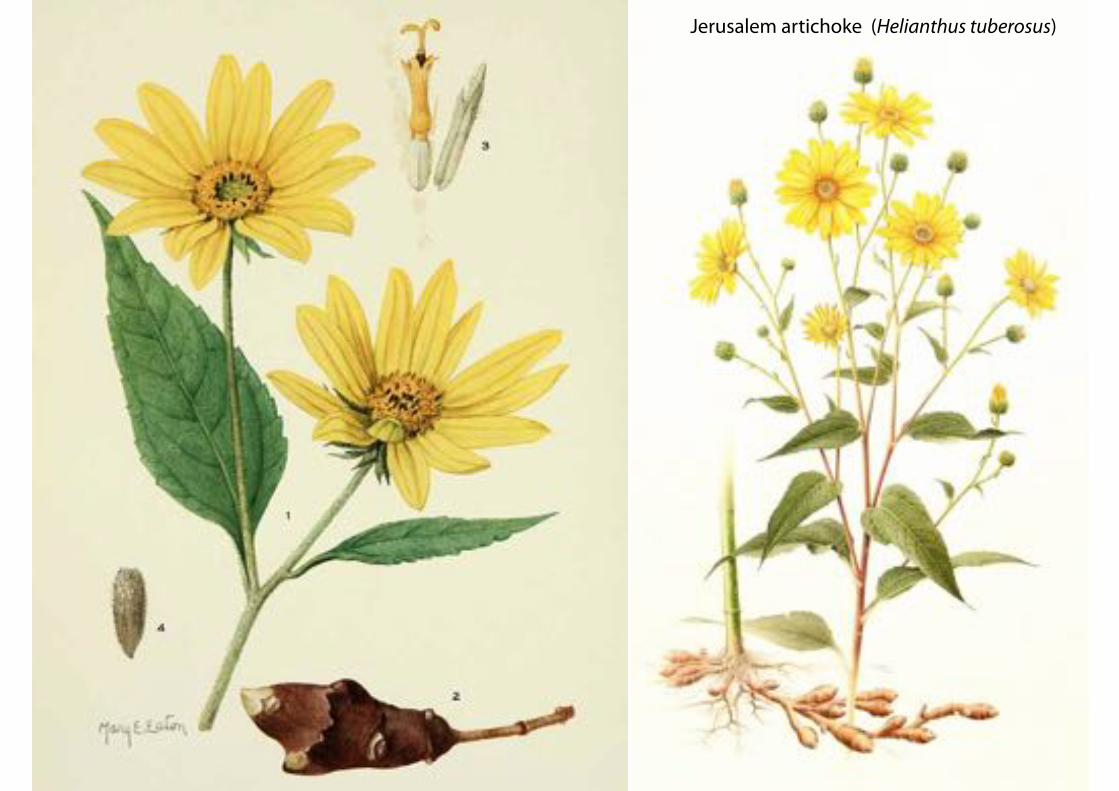
Jerusalem artichoke (Helianthus tuberosus)

�54
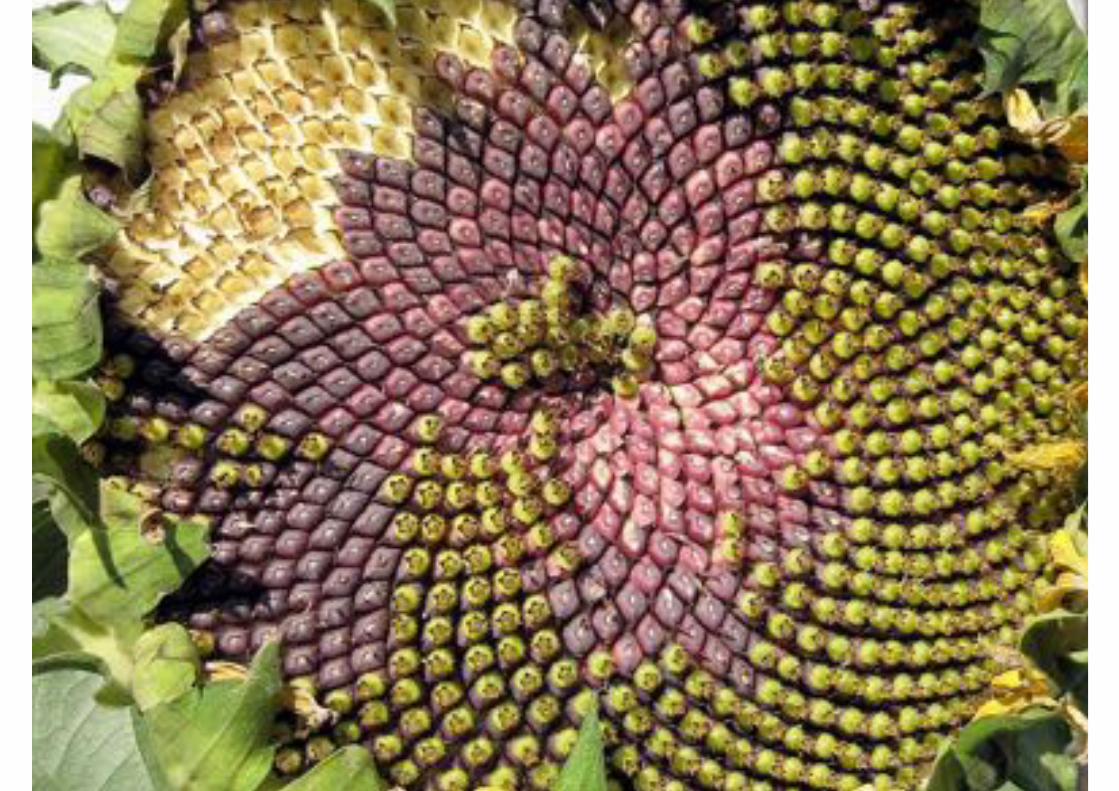
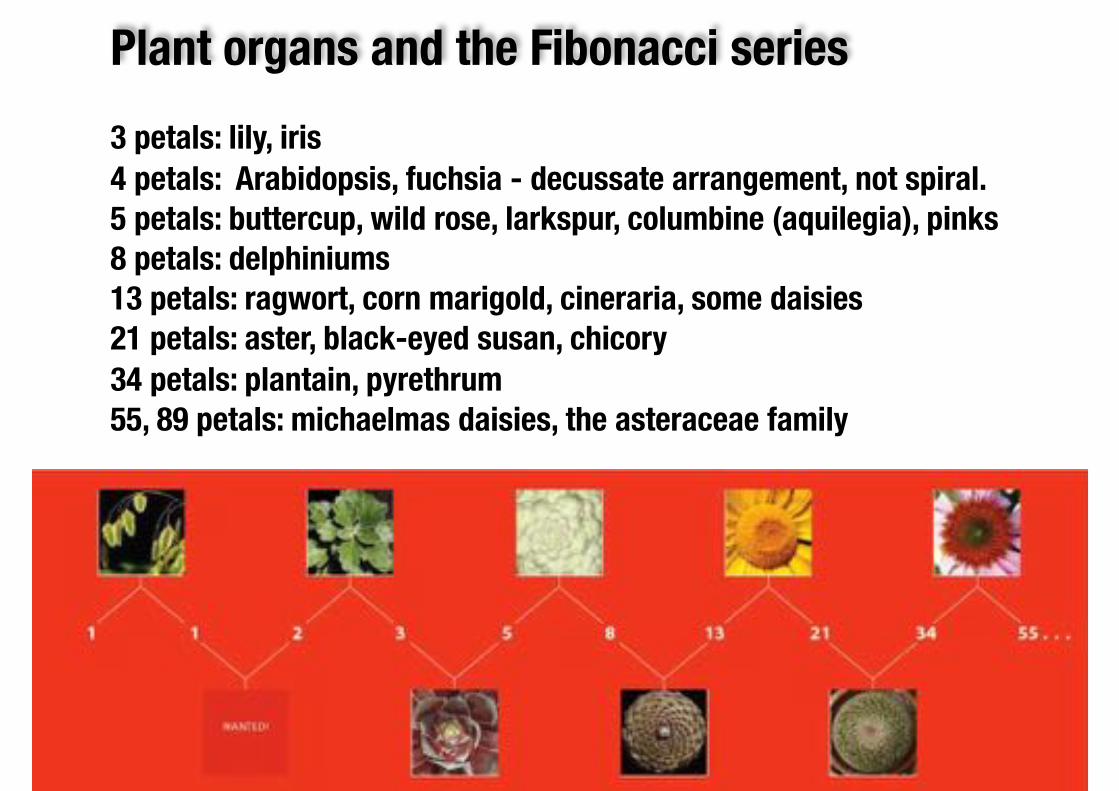
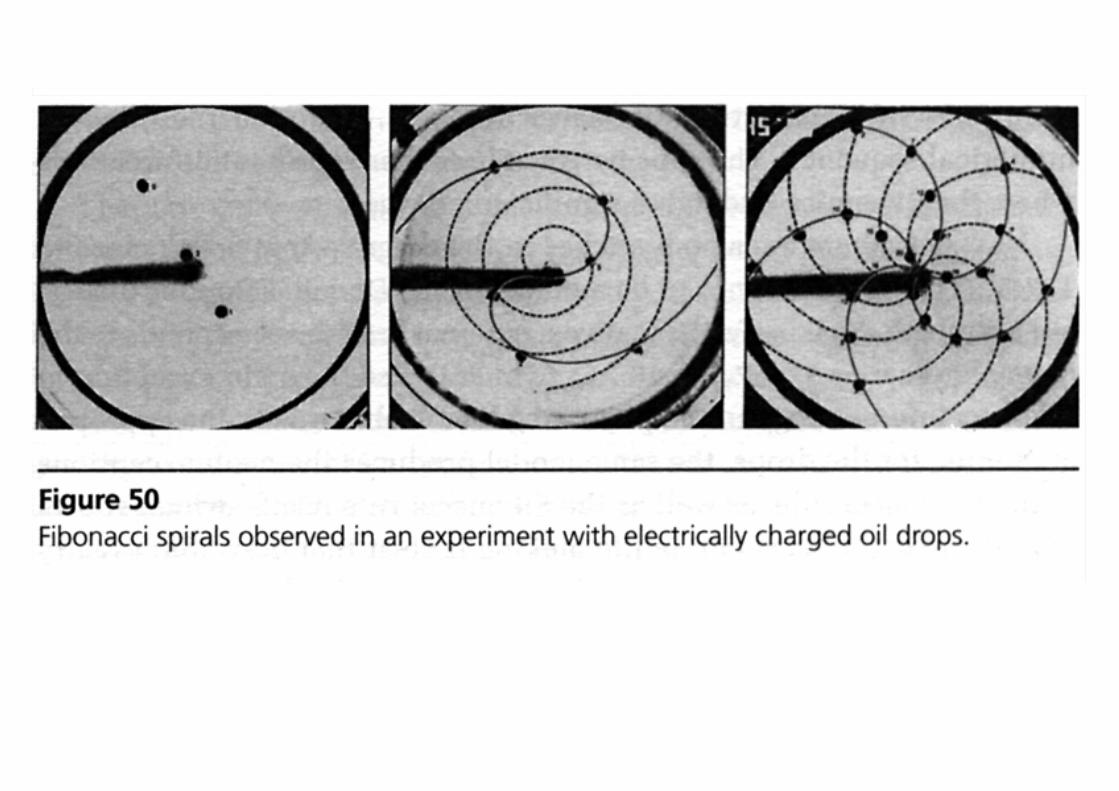
Plant organs and the Fibonacci series
3 petals: lily, iris 4 petals: Arabidopsis, fuchsia - decussate arrangement, not spiral. 5 petals: buttercup, wild rose, larkspur, columbine (aquilegia), pinks 8 petals: delphiniums 13 petals: ragwort, corn marigold, cineraria, some daisies 21 petals: aster, black-eyed susan, chicory 34 petals: plantain, pyrethrum 55, 89 petals: michaelmas daisies, the asteraceae family
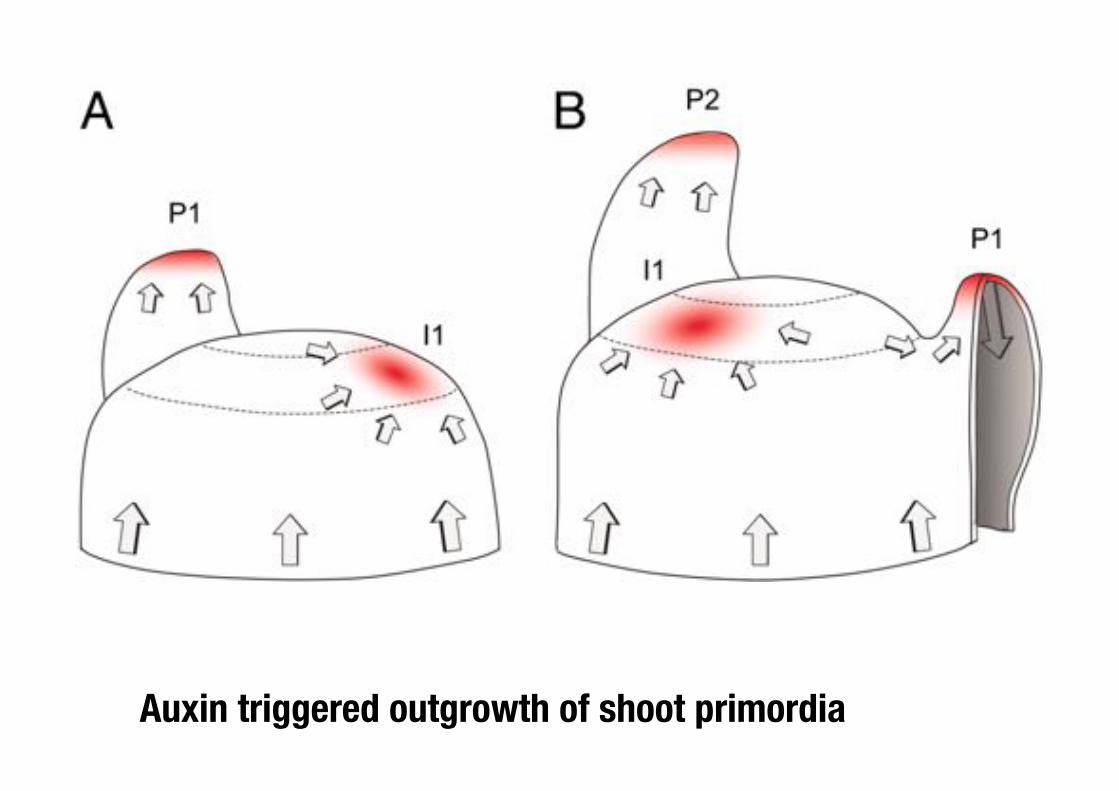
Auxin triggered outgrowth of shoot primordia

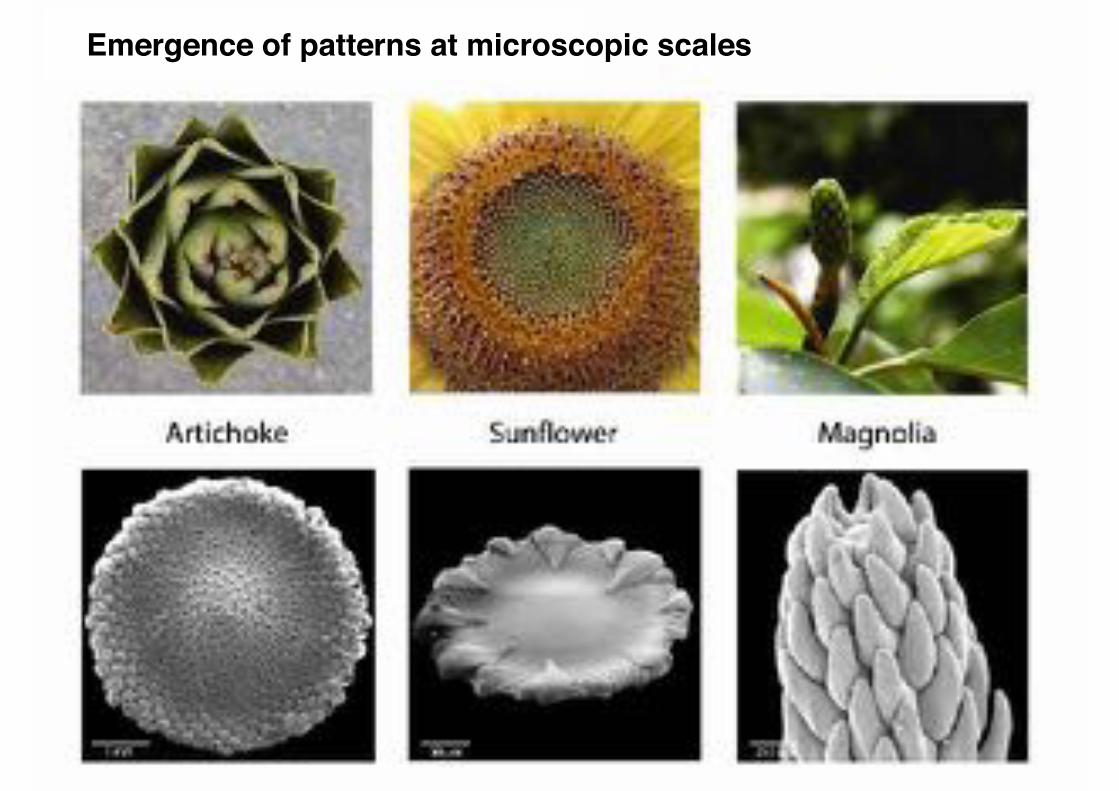
Emergence of patterns at microscopic scales
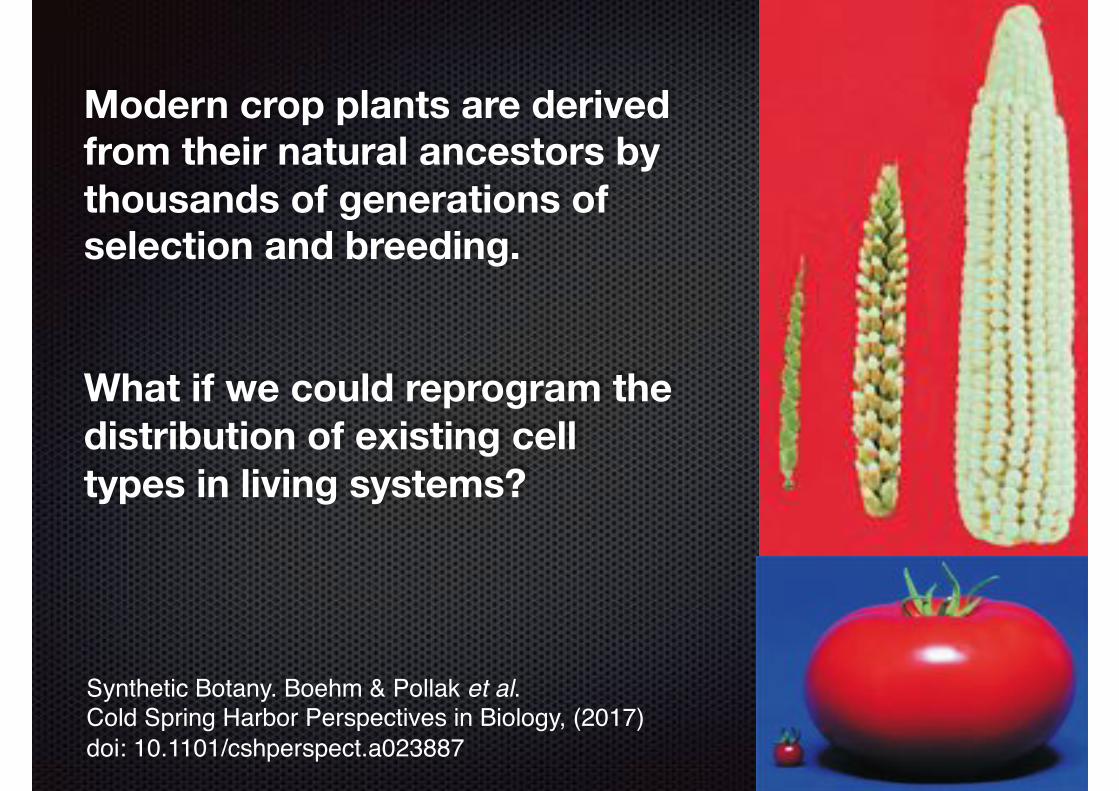
Modern crop plants are derived from their natural ancestors by thousands of generations of selection and breeding.
What if we could reprogram the distribution of existing cell types in living systems?
Synthetic Botany. Boehm & Pollak et al. Cold Spring Harbor Perspectives in Biology, (2017)doi: 10.1101/cshperspect.a023887
et al., 2017; Soyk et al., 2017; Swinnen et al., 2016). Here, wedesigned a genetic ‘‘drive’’ system that exploits heritability ofCRISPR/Cas9 transgenes carrying multiple gRNAs in ‘‘sensi-tized’’ F1 populations to rapidly and efficiently generate dozensof novel cis-regulatory alleles for three genes that regulate fruitsize, inflorescence architecture, and plant growth habit intomato. By segregating away the transgene in the followinggeneration, we recovered a wide range of stabilized promoteralleles that provided a continuum of variation for all three traits.For one of these genes, we found that transcriptional changewas a poor predictor of phenotypic effect, revealing unexploredcomplexity in how regulatory variation impacts quantitativetraits.
RESULTS
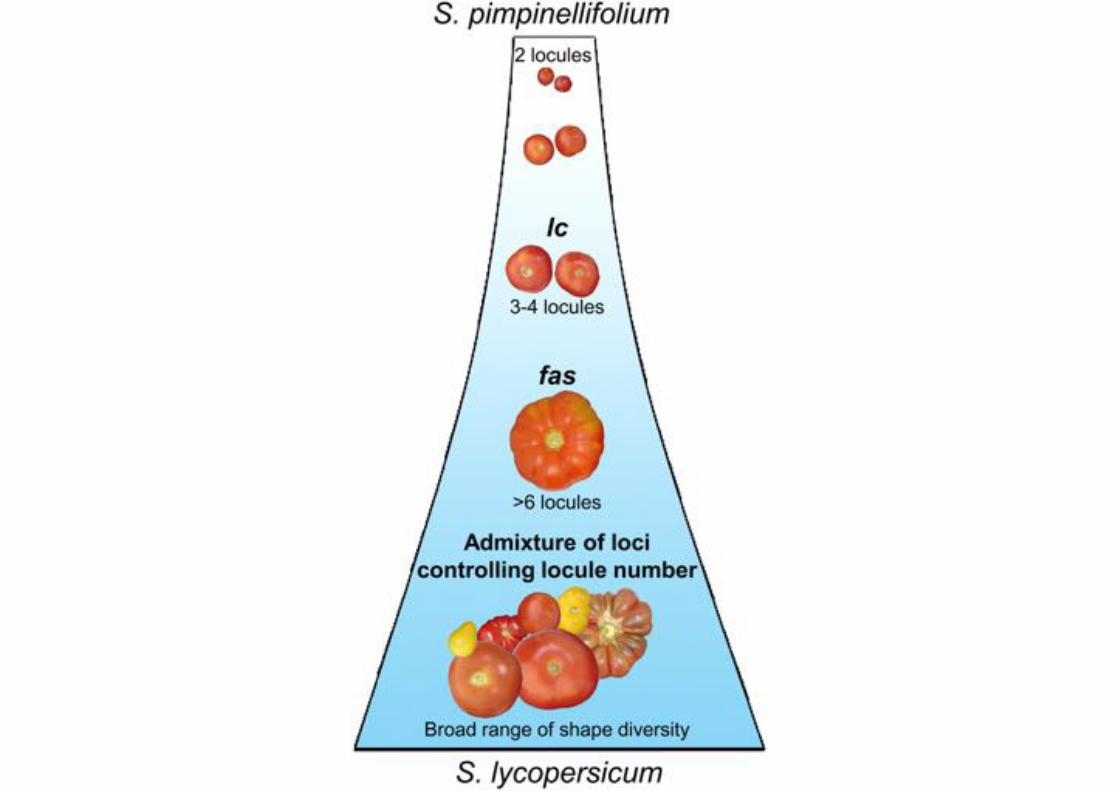
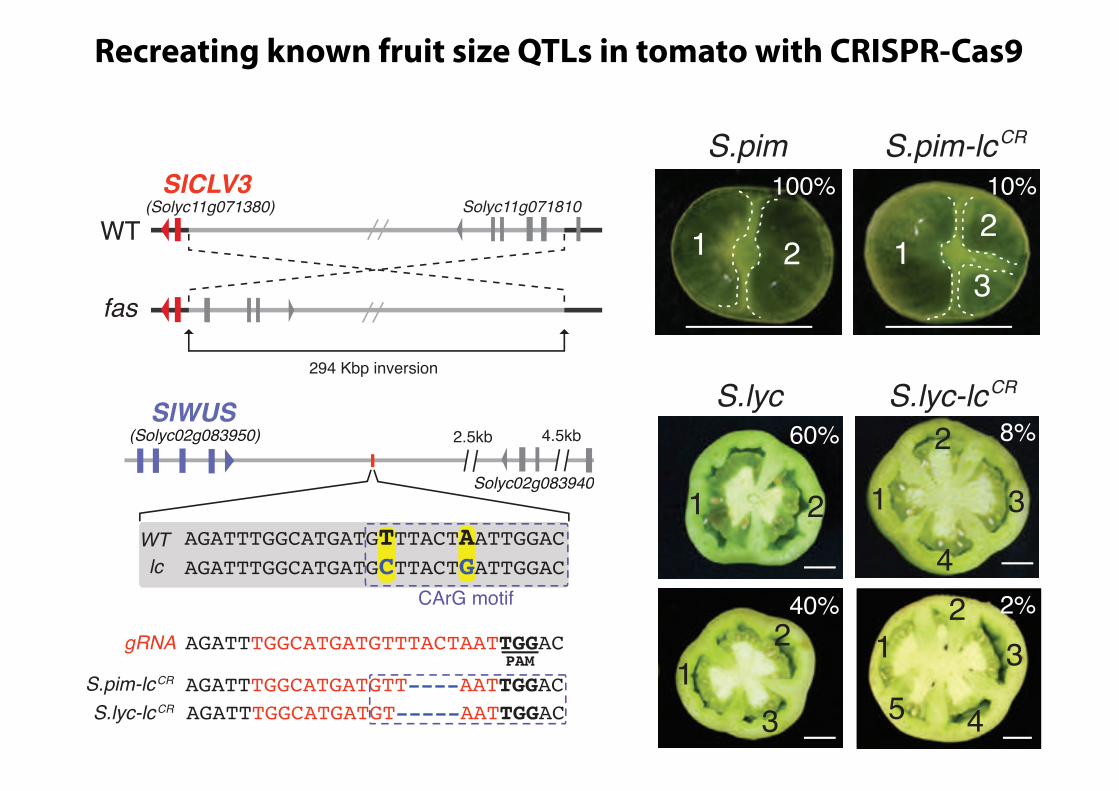
Recreating a Fruit Size QTL by CRISPR/Cas9Mutagenesis of a CREThe major feature of tomato domestication was a dramatic in-crease in fruit size, caused in large part by an increase in thenumber of carpels in flowers, and thus seed compartments (loc-ules) in fruits. QTL influencing tomato locule number includegenes involved in the classical CLAVATA-WUSCHEL stem cellcircuit (CLV-WUS), which controls meristem size (Somssichet al., 2016) (Figure 1A). Mutations in CLV-WUS, such as in thesignaling peptide gene CLV3, can cause meristems to enlargedue to stem cell overproliferation, leading to developmental de-fects that include additional organs in flowers and fruits (Soms-sich et al., 2016; Xu et al., 2015). The ancestor of tomato(S. pimpinellifolium, S.pim) produces small bilocular fruits, andthe fasciated (fas) and locule number (lc) QTLweremajor contrib-utors to increased locule number, and thus fruit size, in domes-ticated tomato (Solanum lycopersicum, S.lyc) (Figure 1B) (vander Knaap et al., 2014). fas is a partial loss of function causedby an inversion that disrupts the promoter of tomato CLV3(SlCLV3), resulting in amoderate effect on locule number (Huangand van der Knaap, 2011; Xu et al., 2015). In contrast, lc is a weakgain-of-function allele previously shown to be associated withtwo SNPs in a predicted 15-bp repressor element downstreamof tomatoWUS (SlWUS), a conserved homeobox gene that pro-motes stem cell proliferation (Somssich et al., 2016). While notfunctionally validated, this CRE shares similarity with the CArGelement ofArabidopsis that is bound by theMADSbox transcrip-tion factor AGAMOUS at the end of flower development todownregulate WUS and terminate meristem activity (Liu et al.,2011; Munos et al., 2011) (Figures 1C and 1D).To determine whether induced mutations in known CREs can
generate predictable quantitative variation, we used CRISPR/Cas9 to target the putative SlWUS CArG element (Figure 1E;see STAR Methods). The effect of lc is subtle (Munos et al.,2011), with 11% of fruits producing three to four locules inS.pim near isogenic lines (S.pim-lcNIL). Consistent with this, lcdoes not cause detectable changes in SlWUS expression, sug-gesting lc weakly affects the level, timing, or pattern of expres-sion (Munos et al., 2011). Notably, 10% of fruits from S.pimplants carrying a CRISPR/Cas9-induced 4-bp deletion in theCArG element developed three locules (S.pim-lcCR), nearlymatching the weak effect of lc (Figure 1F). We previously showed
B
D
E
A
C
F
G
p
p
p
7.7x10p 8.0x10 9
Figure 1. Recreating a Known Fruit Size QTL in Tomato(A) The conserved CLV3-WUS negative feedback circuit controls meristem
size. LP, leaf primordia.
(B) The fas and lc fruit size QTL increased locule number (arrowheads) during
domestication. Yellow arrowheads, locules.
(C) fas is caused by an inversion with a breakpoint 1 Kbp upstream of SlCLV3.
(D) The lcQTL (red rectangle) is associatedwith two SNPs (in bold) in a putative
repressor motif (CArG, blue-dashed square) 1.7 Kbp downstream of SlWUS.
(E) CRISPR/Cas9-induced deletions in the CArG repressor motif (blue-dashed
square) of S.pim and S.lyc. The gRNA target sequence is highlighted in red and
the PAM site underlined.
(F) S.pim-lcCR plants produce fruits with more than two locules. S.pim-fasNIL
S.pim-lcCR double mutants synergistically increase locule number.
(G) Locule number is increased in S.lyc-lcCR lines, and double mutants with
S.lyc-fasNIL are enhanced. N, plant number; n, fruit number. p: two-tailed, two-
sample t test.
Data in (F) and (G) are presented as percentage of fruits per locule number
category. N, plants per genotype; n, fruit number. See also Table S1. p: two-
tailed, two-sample t test. Scale bars, 100 mm in (A) and 1 cm in (B), (F), and (G).
Cell 171, 470–480, October 5, 2017 471
et al., 2017; Soyk et al., 2017; Swinnen et al., 2016). Here, wedesigned a genetic ‘‘drive’’ system that exploits heritability ofCRISPR/Cas9 transgenes carrying multiple gRNAs in ‘‘sensi-tized’’ F1 populations to rapidly and efficiently generate dozensof novel cis-regulatory alleles for three genes that regulate fruitsize, inflorescence architecture, and plant growth habit intomato. By segregating away the transgene in the followinggeneration, we recovered a wide range of stabilized promoteralleles that provided a continuum of variation for all three traits.For one of these genes, we found that transcriptional changewas a poor predictor of phenotypic effect, revealing unexploredcomplexity in how regulatory variation impacts quantitativetraits.
RESULTS
Recreating a Fruit Size QTL by CRISPR/Cas9Mutagenesis of a CREThe major feature of tomato domestication was a dramatic in-crease in fruit size, caused in large part by an increase in thenumber of carpels in flowers, and thus seed compartments (loc-ules) in fruits. QTL influencing tomato locule number includegenes involved in the classical CLAVATA-WUSCHEL stem cellcircuit (CLV-WUS), which controls meristem size (Somssichet al., 2016) (Figure 1A). Mutations in CLV-WUS, such as in thesignaling peptide gene CLV3, can cause meristems to enlargedue to stem cell overproliferation, leading to developmental de-fects that include additional organs in flowers and fruits (Soms-sich et al., 2016; Xu et al., 2015). The ancestor of tomato(S. pimpinellifolium, S.pim) produces small bilocular fruits, andthe fasciated (fas) and locule number (lc) QTLweremajor contrib-utors to increased locule number, and thus fruit size, in domes-ticated tomato (Solanum lycopersicum, S.lyc) (Figure 1B) (vander Knaap et al., 2014). fas is a partial loss of function causedby an inversion that disrupts the promoter of tomato CLV3(SlCLV3), resulting in amoderate effect on locule number (Huangand van der Knaap, 2011; Xu et al., 2015). In contrast, lc is a weakgain-of-function allele previously shown to be associated withtwo SNPs in a predicted 15-bp repressor element downstreamof tomatoWUS (SlWUS), a conserved homeobox gene that pro-motes stem cell proliferation (Somssich et al., 2016). While notfunctionally validated, this CRE shares similarity with the CArGelement ofArabidopsis that is bound by theMADSbox transcrip-tion factor AGAMOUS at the end of flower development todownregulate WUS and terminate meristem activity (Liu et al.,2011; Munos et al., 2011) (Figures 1C and 1D).To determine whether induced mutations in known CREs can
generate predictable quantitative variation, we used CRISPR/Cas9 to target the putative SlWUS CArG element (Figure 1E;see STAR Methods). The effect of lc is subtle (Munos et al.,2011), with 11% of fruits producing three to four locules inS.pim near isogenic lines (S.pim-lcNIL). Consistent with this, lcdoes not cause detectable changes in SlWUS expression, sug-gesting lc weakly affects the level, timing, or pattern of expres-sion (Munos et al., 2011). Notably, 10% of fruits from S.pimplants carrying a CRISPR/Cas9-induced 4-bp deletion in theCArG element developed three locules (S.pim-lcCR), nearlymatching the weak effect of lc (Figure 1F). We previously showed
B
D
E
A
C
F
G
p
p
p
7.7x10p 8.0x10 9
Figure 1. Recreating a Known Fruit Size QTL in Tomato(A) The conserved CLV3-WUS negative feedback circuit controls meristem
size. LP, leaf primordia.
(B) The fas and lc fruit size QTL increased locule number (arrowheads) during
domestication. Yellow arrowheads, locules.
(C) fas is caused by an inversion with a breakpoint 1 Kbp upstream of SlCLV3.
(D) The lcQTL (red rectangle) is associatedwith two SNPs (in bold) in a putative
repressor motif (CArG, blue-dashed square) 1.7 Kbp downstream of SlWUS.
(E) CRISPR/Cas9-induced deletions in the CArG repressor motif (blue-dashed
square) of S.pim and S.lyc. The gRNA target sequence is highlighted in red and
the PAM site underlined.
(F) S.pim-lcCR plants produce fruits with more than two locules. S.pim-fasNIL
S.pim-lcCR double mutants synergistically increase locule number.
(G) Locule number is increased in S.lyc-lcCR lines, and double mutants with
S.lyc-fasNIL are enhanced. N, plant number; n, fruit number. p: two-tailed, two-
sample t test.
Data in (F) and (G) are presented as percentage of fruits per locule number
category. N, plants per genotype; n, fruit number. See also Table S1. p: two-
tailed, two-sample t test. Scale bars, 100 mm in (A) and 1 cm in (B), (F), and (G).
Cell 171, 470–480, October 5, 2017 471
Recreating known fruit size QTLs in tomato with CRISPR-Cas9

generate one or more new alleles by targeting in trans the WTpromoter introduced from the cross. However, determiningwhich specific F1 individuals harbor new alleles that result inphenotypic change can be difficult. A telling example is thecomplex rearrangement of the SlCLV3CR-pro1-2 allele, whichhad no effect on floral organ number, and thus complementedand masked the effect of the strong loss-of-function large dele-tion allele in the original biallelic T0-1 plant (Figure 2I). To simulta-
B
A
C
ED
F
H
G
I
Figure 2. Inducing Mutations in the SlCLV3Promoter Using CRISPR/Cas9(A) Model showing how an allelic series of SlCLV3
transcriptional alleles could provide a range of
quantitative effects on floral organ number ac-
cording to a simple linear relationship of reduced
expression resulting in increased phenotypic
severity. WT, fas, and clv3CR are shown as refer-
ence points in this hypothesized continuous
relationship.
(B) Schematic of SlCLV3 promoter targeted by
eight gRNAs (numbered blue arrowheads). Blue
arrows, PCR primers.
(C) PCR showing multiple deletion alleles in four T0plants. Amplicons were obtained using primers
spanning the entire target region.
(D) Weak and strong effects on flower morphology
and fruit size were observed among T0 lines.
Number of floral organs and locules are indicated.
(E) Quantification of floral organ number (mean ±
SD; n R 10) in T0, WT, fas, and slclv3CR plants.
(F) Sequencing of SlCLV3 promoter alleles for all
T0 plants. Deletions (–) and insertions (+) indicated
by numbers or letters. T0-5 and T0-6 contained only
WT alleles (data not shown). Blue arrowheads,
gRNAs; a, allele.
(G) PCR genotyping of T1 progeny from T0-1 and
T0-2. UBIQUITIN (UBI) served as an internal
control. Absence of amplification for the target
region of SlCLV3 indicated homozygous plants
for hidden alleles in both T0-1 and T0-2.
(H) Genome sequencing of T0-1 and T0-2 offspring
homozygous for non-amplifiable alleles. Vertical
dashed lines show target region. Neighboring
genes, transposable elements, and repeats up-
stream of the target region are shown. See also
Table S2.
(I) Floral organ quantification (mean ± SD; n R 5)
from homozygous plants for each of the four T0-1and T0-2 alleles. Black arrowheads indicate WT
values. See also Table S3.
Scale bars, 100 mm and 1 cm in (A) 1 cm in (D).
neously maximize allele creation and effi-ciently identify thosewith phenotypes, weoutcrossed only T0 plants with strongloss-of-function alleles to produce asensitized population of heterozygousF1 plants. In this way, hundreds of F1progeny carrying a CRISPR/Cas9 trans-gene, each also having inherited a stableloss-of-function allele, could easily begenerated and screened for new loss-
of-function alleles, including those causing subtle phenotypesthat would otherwise be difficult to detect.To test this approach, we crossed T0-2 to WT and gener-
ated 1,152 F1 plants that were heterozygous for eitherSlCLV3CR-pro2-1 or SlCLV3CR-pro2-2 and a WT SlCLV3 promoter(see STAR Methods). PCR genotyping revealed nearly half ofthe population (42%) inherited the CRISPR/Cas9 transgene(hemizygous Cas9-/+) (Figures 3A and 3B), and phenotyping
Cell 171, 470–480, October 5, 2017 473
Hashing the SlCLV3 promoter using CRISPR-Cas9

A
F
B C
D
E
Figure 4. A Collection of 14 Engineered SlCLV3 Promoter Alleles Provides a Continuum of Locule Number Variation(A) PCR showing new SlCLV3 alleles from F1 plants with strong (s) and moderate (m) effects. Red asterisks, chimeric plants. Blue arrowheads, selected F1 plants
for recovering new alleles (see also Figure S1B). Green arrow, inherited SlCLV3 CR-pro2-1 allele. Lower panel, SlCLV3 CR-pro2-2 genotyping (see STAR Methods).
(B) Non-transgenic F2 individuals homozygous for a new allele (blue asterisk and yellow box) are expected to segregate 1/16 from biallelic F1s (highlighted in
dark gray).
(C) Segregation for a new allele and Cas9 from SlCLV3 CR-pro2-1/m1 F2 population. m1, new allele from F1 moderate-1. Blue arrowheads indicate non-transgenic
homozygotes. Lower panel, Cas9 . Absence of band indicates transgene-free individuals.
(D) Sequences of 14 new SlCLV3 pro alleles. Deletions (–) and insertions (+) indicated as numbers or letters. gRNAs, blue arrowheads. Parental F1s marked at right
(see also Figure S1B). Connected arrows indicate similar phenotypes for fas and the (SlCLV3 CR-pro) m6-derived allele. Quantification of locule number (percent of
fruits; n R 5 plants; mean ± SD shown) from homozygous F3 families is shown next to each allele sequence. fas and WT are references (See also Table S5).
(legend continued on next page)
Cell 171, 470–480, October 5, 2017 475
A collection of engineered SlCLV3 promoter alleles provides a continuum of locule number variation

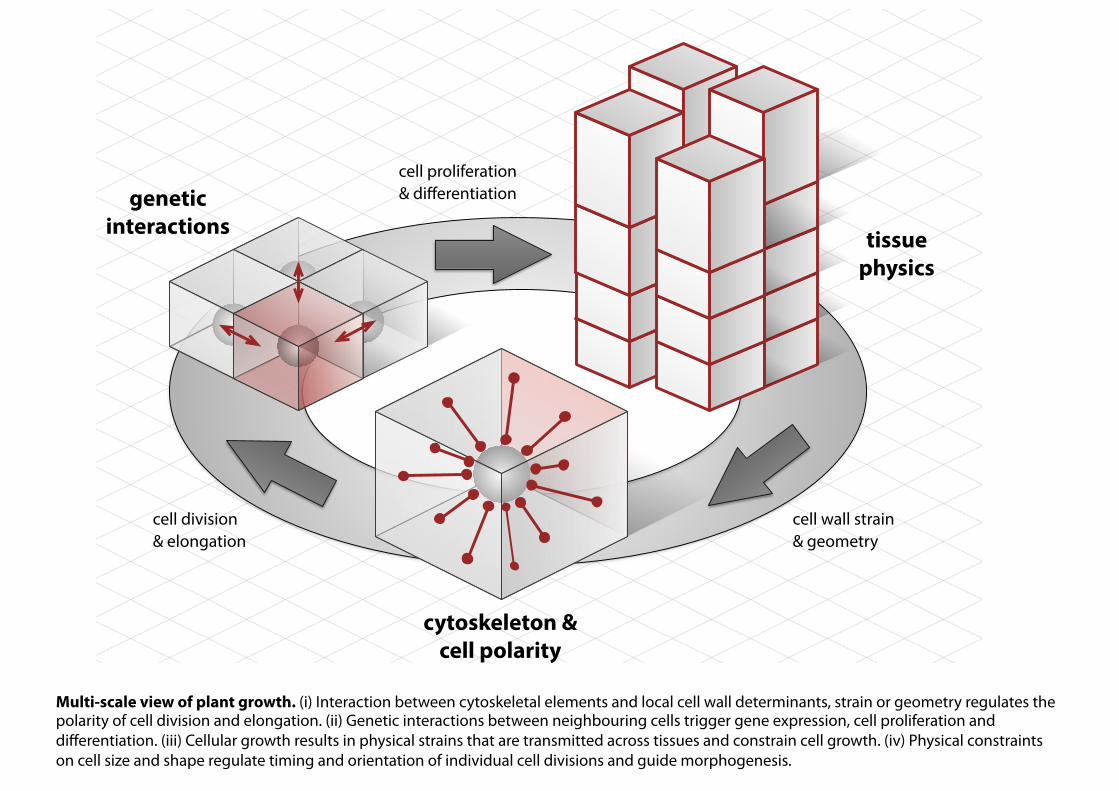
cytoskeleton &cell polarity
tissuephysics
geneticinteractions
cell division& elongation
cell proliferation & differentiation
cell wall strain& geometry
Multi-scale view of plant growth. (i) Interaction between cytoskeletal elements and local cell wall determinants, strain or geometry regulates the polarity of cell division and elongation. (ii) Genetic interactions between neighbouring cells trigger gene expression, cell proliferation and differentiation. (iii) Cellular growth results in physical strains that are transmitted across tissues and constrain cell growth. (iv) Physical constraints on cell size and shape regulate timing and orientation of individual cell divisions and guide morphogenesis.