Embed Size (px)
Citation preview

2018 Economic Forecast for Metro Denver
Including Adams, Arapahoe, Boulder, Broomfield, Denver, Douglas, and Jefferson Counties
January 2018
Prepared By:

Development Research Partners specializes in economic research and analysis for local and state government and private sector businesses. Founded in 1994, Development Research Partners combines extensive experience in real estate economics and economic development to provide clients with reliable consulting services in four areas of expertise:
Economic and Demographic Research Research in support of business and community activities, ranging from community profiles to evaluating and forecasting economic and market conditions.
Industry Studies
Specialized research projects including industry cluster research, industry trends analysis, and strategic competitive analysis.
Fiscal and Economic Impact Analysis
Comprehensive custom analysis and analytical tools to evaluate and forecast site‐specific activities and model business and government costs and benefits.
Real Estate and Public Finance Economics
Analysis and strategy for infill redevelopment, adaptive reuses, and property development including market and feasibility studies, public investment analysis, and public‐private partnering opportunities.
Patty Silverstein, President & Chief Economist
David Hansen, Senior Economist
10184 West Belleview Avenue, Suite 100 Littleton, Colorado 80127
www.DevelopmentResearch.net 303.991.0070

TABLE OF CONTENTS
Metro Denver Economic Development Corporation | January 2018
Table of Contents
EXECUTIVE SUMMARY ................................................................................................................................. i
U.S. ECONOMY ............................................................................................................................................ 1
International Economy ................................................................................................................................................ 1 Gross Domestic Product .............................................................................................................................................. 2
Household Spending .......................................................................................................................................................... 2 Business Spending .............................................................................................................................................................. 5
Government Spending ....................................................................................................................................................... 6 Net Exports ......................................................................................................................................................................... 7
Interest Rates .............................................................................................................................................................. 7 Employment & Unemployment ................................................................................................................................... 8 Income ........................................................................................................................................................................ 9 Inflation ...................................................................................................................................................................... 9
National Business Cycle ............................................................................................................................................. 10
COLORADO ECONOMY .............................................................................................................................. 12
Employment & Unemployment ................................................................................................................................. 13 Colorado Exports ....................................................................................................................................................... 16 Population ................................................................................................................................................................ 17 Income & Spending ................................................................................................................................................... 17 Inflation .................................................................................................................................................................... 18
METRO DENVER ECONOMY ...................................................................................................................... 20
Population ................................................................................................................................................................ 21
Income ...................................................................................................................................................................... 22
Residential Real Estate .............................................................................................................................................. 23 Employment & Unemployment ................................................................................................................................. 25
Industry Overviews ................................................................................................................................................... 27
Natural Resources & Construction ................................................................................................................................... 27 Manufacturing .................................................................................................................................................................. 32 Wholesale & Retail Trade ................................................................................................................................................. 33 Transportation, Warehousing & Utilities ......................................................................................................................... 34 Information ...................................................................................................................................................................... 35
Financial Activities ............................................................................................................................................................ 35 Professional & Business Services ..................................................................................................................................... 36 Education & Health Services ............................................................................................................................................ 37 Leisure & Hospitality ........................................................................................................................................................ 38 Other Services .................................................................................................................................................................. 39
Government ..................................................................................................................................................................... 39 Industry Clusters ....................................................................................................................................................... 40
DATA APPENDIX ........................................................................................................................................ 45
REFERENCES .............................................................................................................................................. 46

Metro Denver Economic Development Corporation | January 2018 | Page i
Executive Summary
U.S. Economy
The United States continued on an expansionary path through 2017 with gross domestic product growing at a 2.3 percent pace, employment increasing by 1.5 percent, and the unemployment rate falling to 4.4 percent. The nation’s businesses generated more than 2.1 million jobs, consumer confidence exceeded pre‐recession peaks, there was continued wage growth, and strong business investment activity.
While gross domestic product grew at a pace slower than the historic average since 1980 of 2.7 percent, growth in 2017 accelerated from the 1.5 percent pace posted in 2016 and was faster than the average since 2010 (2.1 percent). The improvement in 2017 was partially due to stabilized oil and gas prices that had impacted employment in several energy‐producing states and affected oil and gas investment activity and corporate profits. Gross domestic product will grow at a 2.4 percent pace in 2018 as the country enters its ninth year of the current economic expansion. Gross domestic product will be boosted by the recent tax reform act that was passed in December 2017 that will influence disposable personal income and business investment activity. The unemployment rate is expected to fall to 4.3 percent while employment growth slows to 1.2 percent as a result of tight labor markets and persistently low labor force participation rates.
Inflation accelerated at the beginning of the year before falling back below the Federal Reserve’s medium‐term objective by the end of the year. Inflation is expected to post a stable, 2 percent rate in 2018. While the low unemployment rate and wage growth will contribute to inflationary pressure, the Federal Reserve is expected to continue to increase the target federal funds rate. The Federal Reserve announced three rate hikes in 2017, increasing the target rate to a 1.25 percent to 1.5 percent range. Additionally, the Federal Reserve announced in October 2017 that it began the process of shrinking its balance sheet that grew to historic levels during the Great Recession. Oil prices are expected to average about $56 per barrel and prices of medical care and housing will continue to grow faster than average.
The greatest risks to U.S. economic growth include the possible renegotiation of NAFTA and trade agreements with China, Asia, and the European Union. International political tension is also a risk with escalating tension with North Korea and ongoing conflicts in the Middle East. Additionally, unexpected increases or decreases in energy prices remain a risk as well as the speed and pace that the Federal Reserve normalizes its balance sheet. As these risks influence business and consumer confidence, which in turn influence overall spending patterns, stability in these situations is needed for the U.S. expansion to remain on track.
Colorado Economy
The pace of growth in Colorado will likely slow in 2018 as net migration tapers gradually and the unemployment rate remains near historic lows. Still, Colorado will likely be among the top 10 states for employment growth during 2017. Employment is anticipated to increase 2.2 percent in 2017 and 1.9 percent in 2018. In 2018, employment will reach 2.71 million workers, representing the addition of 50,500 jobs from 2017 to 2018. The unemployment rate fell to 2.6 percent in 2017 and will rise to an anticipated 2.7 percent in 2018. As companies consistently increased staffing levels, and Colorado’s labor force continued to tighten, the unemployment rate in 2017 reached its lowest monthly and annual levels in the history of the data series going back to 1976. The previous monthly low was recorded in October 2000, which was 0.2 percentage points higher than the 2.2 percent rate posted in August 2017. Colorado is expected to benefit from in‐migrants, but as labor markets tighten across the country, net migration in Colorado is expected to slow.
Professional and business services, education and health services, and leisure and hospitality are anticipated to contribute the most to absolute employment growth in 2018. All eleven supersectors in Colorado are expected to add employment in 2018. The fastest growing regions in the state were along the Front Range. In 2017, the
Metro Denver Economic Development Corporation | January 2018 | Page ii
Executive Summary Greeley MSA was once again one of the fastest growing metro regions in the state while Grand Junction has continued to struggle since the Great Recession.
Total personal income increased a robust 4.1 percent in 2017 due to increasing wages, rising housing and asset prices, and higher transfer payments. The pace of growth will increase to an estimated 5 percent in 2018. Low unemployment and rising personal income bode well for consumer confidence and spending activity in 2018. Retail trade sales increased by about 4.9 percent in 2017 and are expected to post a 4.7 percent increase in 2018. Overall, the Colorado economy is expected to have another strong year of growth in 2018.
Metro Denver Economy
Metro Denver recorded a strong year of growth in 2017 with rising employment levels and falling unemployment rates. However, the pace of growth is slowing as population growth slows and tight labor markets limit employment growth. Net migration levels in Metro Denver remain strong, but have declined from peak 2015 levels. Job growth in 2017 pushed down the unemployment rate in Metro Denver to 2.5 percent, the lowest level recorded since 2000 (2.6 percent). The rate fell as low as 2.1 percent in August, but increased to 2.8 percent in November. The pace of Metro Denver job gains slowed during 2017, finishing out the year with 2.1 percent growth and the addition of 33,300 jobs.
All of Metro Denver’s 11 supersectors recorded employment growth between 2016 and 2017. Additionally, Metro Denver’s key industry clusters recorded robust and broad‐based growth over the past year. The three supersectors that added the most jobs in 2017 were professional and business services, leisure and hospitality, and natural resources and construction. The fastest growing supersectors were the transportation, warehousing, and utilities supersector, the other services supersector, and the natural resources and construction supersector. Growth in transportation, warehousing, and utilities was particularly strong as airlines at Denver International Airport recorded strong employment growth and several companies have opened large distribution and fulfillment centers in response to demand for e‐commerce. Another notable growth sector was computer systems design and software engineering that represented one of the strongest areas of growth in professional and business services.
The residential real estate market continued at a strong pace in 2017. Metro Denver home sales increased 2.9 percent in 2017 from 2016 home sales, and posted a new record high. In addition, the median home price continued to rise through 2017 as low inventory and population growth drove up prices. According to the S&P CoreLogic Case‐Shiller Index, home prices in Metro Denver have increased year‐over‐year for 71 consecutive months. Meanwhile, commercial construction activity in the office and industrial markets may be approaching a peak. According to a measure of market cycles, Denver’s office market was still in an expansionary phase, while industrial moved further into hypersupply. The retail market appears to be at an equilibrium level. In 2017, construction in the retail sector was close to its long‐run average.
Looking ahead, employment will increase 1.9 percent in 2018 with gains in all 11 supersectors. Once again, the transportation, warehousing, and utilities supersector will record the fastest pace of growth, followed by the natural resources and construction and the education and health services supersectors. The unemployment rate is expected to move up slightly to 2.6 percent in 2018 and remain near historic lows. Home sales activity is expected to fall in 2018 after six consecutive years of increases, declining by an estimated 1.5 percent. Overall, slower net migration activity, lower affordability, and higher interest rates should temper home price growth in 2018. Home price growth is expected to slow to 5 percent, similar to a national rate. The pace of construction activity will remain strong in 2018 as several million square feet of office and industrial space will continue to bolster the market. Additionally, large scale infrastructure projects and other public/nonprofit investment activity will continue at a robust pace. The Metro Denver region’s eighth consecutive year of expansion will provide diverse employment opportunities and increasing housing options for its 3.2 million residents.

U.S. ECONOMY
Metro Denver Economic Development Corporation | January 2018 | Page 1
U.S. Economy
The United States continued on an expansionary path through 2017 with gross domestic product growing at a 2.3 percent pace, employment increasing by 1.5 percent, and the unemployment rate falling to 4.4 percent. The nation’s businesses generated more than 2.1 million jobs, consumer confidence exceeded pre‐recession peaks, there was continued wage growth, and strong business investment activity.
While gross domestic product grew at a pace slower than the historic average since 1980 of 2.7 percent, growth in 2017 accelerated from the 1.5 percent pace posted in 2016 and was faster than the average since 2010 (2.1 percent). The improvement in 2017 was partially due to stabilized oil and gas prices that had impacted employment in several energy‐producing states and affected oil and gas investment activity and corporate profits. Gross domestic product will grow at a 2.4 percent pace in 2018 as the country enters its ninth year of the current economic expansion. Gross domestic product will be boosted by the recent tax reform act that was passed in December 2017 that will influence disposable personal income and business investment activity. The unemployment rate is expected to fall to 4.3 percent while employment growth slows to 1.2 percent as a result of tight labor markets and persistently low labor force participation rates.
Inflation accelerated at the beginning of the year before falling back below the Federal Reserve’s medium‐term objective by the end of the year. Inflation is expected to post a stable, 2 percent rate in 2018. While the low unemployment rate and wage growth will contribute to inflationary pressure, the Federal Reserve is expected to continue to increase the target federal funds rate. The Federal Reserve announced three rate hikes in 2017, increasing the target rate to a 1.25 percent to 1.5 percent range. Additionally, the Federal Reserve announced in October 2017 that it began the process of shrinking its balance sheet that grew to historic levels during the Great Recession. Oil prices are expected to average about $56 per barrel and prices of medical care and housing will continue to grow faster than average.
The greatest risks to U.S. economic growth include the possible renegotiation of NAFTA and other trade agreements with China, Asia, and the European Union. International political tension is also a risk with escalating tension with North Korea and ongoing conflicts in the Middle East. Additionally, unexpected increases or decreases in energy prices remain a risk as well as the speed and pace that the Federal Reserve normalizes its balance sheet. As these risks influence business and consumer confidence, which in turn influence overall spending patterns, stability in these situations is needed for the U.S. expansion to remain on track.
International Economy
According to the International Monetary Fund (IMF), global economic activity is strengthening and is expected to continue in 2018. The IMF expects the global growth rate to average 3.6 percent in 2017, higher than the 3.2 percent pace in 2016. In 2018, growth is expected to accelerate to 3.7 percent. The positive outlook is based in part on better than expected growth in the euro area, Japan, emerging Asia, emerging Europe, and Russia. Growth is expected for both advanced economies and emerging markets, characterized by strong investment, trade, and industrial production concurrent with stronger business and consumer confidence. Economic growth in the advanced economies is expected to rise to 2.2 percent in 2017 and remain at 2.2 percent in 2018. Meanwhile, monetary policy in both Japan and the euro area continues to be accommodative. On a negative note, the IMF revised down the outlook for the United Kingdom where growth through the first half of 2017 slowed more than anticipated. Consumption growth and real household incomes are slowing in the United Kingdom and there is uncertainty about trade, migration, and financial activity associated with upcoming negotiations concerning Brexit.
The value of output in the emerging economies is expected to grow from 4.6 percent in 2017 to 4.9 percent in 2018. In China, growth will be supported by policy reforms and from expansionary fiscal policy and high levels of public investment. Emerging economies have been bolstered by a recovery in commodity prices and stable

U.S. ECONOMY
Metro Denver Economic Development Corporation | January 2018 | Page 2
U.S. Economy
financial markets. Additionally, growth is expected to pick up slightly in Brazil and Latin America, and Russia emerged from a two‐year recession.
Gross Domestic Product
Throughout this publication, (e) is used to represent data that are estimated in the absence of data for all 12 months of 2017; (f) indicates a forecast figure.
Gross Domestic Product: +2.3 percent in 2017(e); +2.4 percent in 2018(f).
Gross domestic product (GDP)—the total value of goods and services produced in the U.S. economy—is a key gauge of the nation’s economic health. Between 1980 and 2000, annual GDP growth averaged about 3.4 percent. From 2000 to 2016, annual growth has averaged a much lower 1.8 percent due to a number of factors including the Great Recession, demographic shifts, and slower productivity growth.
More currently, real GDP growth has averaged 2.1 percent between 2010 and 2016. National real GDP reported 15 consecutive quarters of growth between the second quarter of 2014 and the fourth quarter of 2017. Positive contributors to GDP growth over the past year included consumption of durable goods, nonresidential fixed investment, and exports. Notably, nonresidential fixed investment and exports reported growth in 2017, reversing contractions in 2016. Nonresidential fixed investment was boosted by investment in structures, and strong growth in intellectual property products, such as software and research and development. With strong personal consumption and continued business spending, annual growth is forecast to be 2.3 percent in 2017 and accelerate to 2.4 percent in 2018.
Reasons for increased growth are easier to recognize when GDP is broken down into its four components: 1) household spending on goods and services; 2) business spending on software, equipment, and real estate; 3) government spending on goods and services; and 4) net exports, or foreign purchases of U.S. goods less our imports.
Household Spending
Household spending contributes nearly 70 percent of national output and has a long‐term average annual growth rate of about 2.7 percent. In 2017, consumer confidence was more than 16 percent higher on average than levels posted in 2007, and the unemployment rate dropped to its lowest level since 2000. Consumer‐spending growth in 2017 continued at a pace similar to 2016, with positive growth expected in 2018. Several factors will influence consumer spending in the year ahead.
Strong consumer confidence. Consumer confidence improved markedly in 2017, reaching well above levels posted in 2016 and exceeding pre‐recession peaks. Consumers’ assessment of their present situation continued to improve throughout 2017, including perceptions of business conditions and the availability of jobs. The exception was a dip due to hurricanes Harvey and Irma. Consumers’ expectations also improved in 2017 and the overall outlook is optimistic heading into 2018.

U.S. ECONOMY
Metro Denver Economic Development Corporation | January 2018 | Page 3
U.S. Economy
Positive financial situation. According to the latest Economy and Personal Finance Survey from Gallup, Americans’ assessment of their current financial situation continued on an upward trend in 2017 and recorded its highest level since 2007. Fifty‐two percent of U.S. adults said their current financial situation was excellent or good. The rate had remained at or below 50 percent from 2008 to 2016.
Tax reform increases disposable personal income. The Tax Cuts and Jobs Act (TCJA) recently passed by Congress is expected to boost the after‐tax income of most filers beginning in 2018, generating a positive effect on personal consumption expenditures. The TCJA reduces the individual income tax rate in five of the lower tax brackets and reduces the top rate to 37 percent from 39.6 percent. In addition, the TCJA doubles the standard deduction. The higher standard deduction will lower taxable income for some filers depending on their level of personal exemptions. Another boost to filers is an expansion of the child tax credit, which according to the Tax Foundation, will increase from $1,000 to $2,000 while increasing the phase out from $110,000 to $400,000 for married couples. Analysis from the Tax Policy Center estimates that after‐tax incomes will increase in 2018 by as much as 4 percent for some filers. At a macro level, the Tax Foundation estimates that the after‐tax incomes of all taxpayers will increase by 1.1 percent in the long run.
Tax reform may also increase the labor supply. The Joint Committee on Taxation notes that tax policies change the incentives for potential workers to supply labor to the economy. A change in after‐tax wage income could incentivize workers to work more, or encourage workers to enter the labor force. For instance, the Tax Policy Center posits that the TCJA will mostly encourage lower‐earning spouses to enter the work force or work additional hours. The increase in the labor supply will boost household incomes and stimulate aggregate demand, thereby boosting GDP growth. The Joint Committee on Taxation estimates the TCJA will increase consumption by 0.7 percent on average each year relative to baseline forecasts.
Wage growth continues. After years of up and down growth in average hourly earnings on an inflation‐adjusted basis, earnings for private nonfarm employees increased at a strong rate through 2015 and 2016. Low unemployment rates continue to contribute to positive wage pressure with real earnings growth recorded throughout 2017. According to the Federal Reserve Bank of Kansas City, positive contributors to labor market conditions have included job flows from unemployment to employment, hiring rates, and the percentage of firms planning to increase employment. Labor market conditions are expected to continue to support real wage growth for workers in 2018. The TCJA may also have a wage effect based on a reduction in the corporate income tax rate. Economic research indicates that labor bears part of the burden of the corporate income tax, although the amount is debated. Increased business investment may boost productivity and thereby increase wages. It should be noted that some of these effects will occur over the long‐term rather than in the short‐run.
Home price increases adding to household wealth. According to the S&P CoreLogic Case‐Shiller home price indices, the national home index was up 6.2 percent between November 2016 and 2017. According to the index, national home prices surpassed their pre‐recession peak set in 2006 by September 2016. The increase in housing prices provides a wealth effect to homeowners. Many homeowners utilized stronger home values and low

U.S. ECONOMY
Metro Denver Economic Development Corporation | January 2018 | Page 4
U.S. Economy
interest rates for cash‐out refinancing and second mortgages. Data from Freddie Mac indicate the volume of cash‐out refinancing continued to grow in 2017, increasing more than 13 percent year‐to‐date through the second quarter of 2017 compared with the same quarters in 2016. Cash‐out refinancing peaked in 2006 at $320.5 billion compared with $61.2 billion in 2016. Meanwhile, owners’ equity in real estate as a percent of value continued to climb, approaching 60 percent or near levels typical of the 1990s and early 2000s. The percentage had dipped as low as 36 percent during the Great Recession.
Equities contributing modestly to household wealth. The stock market is an economic indicator that is influenced by daily fluctuations in the economy. In 2017, stocks recorded their highest gains since 2013. Volatility in the market remained low throughout the year with the S&P 500 increasing 20 percent over‐the‐year, the NASDAQ increasing 28.2 percent, and the Dow Jones Industrial Average up 25.7 percent. In 2017, more American’s were investing in the stock market, but levels were much lower than before the recession. About 54 percent of American adults were invested in the stock market in 2017, up from 52 percent in 2016, according to Gallup’s annual Economy and Personal Finance survey. However, stock ownership since 2009 is much lower than pre‐recession levels. The average from 2009 to 2017 was 54 percent, down 8 percentage points from a 62 percent average from 2001 to 2008. Based on the survey, stock ownership rates for middle‐class adults and all
age groups 64 years and below are significantly lower.
The TCJA is expected to boost the stock market in 2018. A key provision of the law is a reduction in the corporate income tax rate from 35 percent to 21 percent. The law also allows businesses to immediately deduct new investment over the next five years. These provisions are expected to boost business investment and profits that may increase the value of equities and amount of dividend payouts. While taxes have only a modest influence on company earnings and valuations, the effect is likely positive.
Household borrowing activity strengthens, but the debt‐service ratio is stable. After the housing bubble burst in 2007, total household debt plunged compared with prior years. The housing component of the recession heavily influenced the mortgage debt portion of household debt. Growth in household debt has been positive since the fourth quarter of 2011. Growth in mortgage debt turned positive in 2013 and continued to increase through 2017. Consumer credit also continued to expand through 2017. Despite more household borrowing activity, the ratio of household debt service to disposable personal income remained below 10 percent through 2017, well below the high of 13.2 percent in the fourth quarter of 2007.

U.S. ECONOMY
Metro Denver Economic Development Corporation | January 2018 | Page 5
U.S. Economy
Business Spending
During the Great Recession, corporate profits took a major hit as consumers purchased less goods and services, investors were cautious of further economic declines, and Wall Street reeled from the impact of the housing crisis. Since the low of 2008, corporate profits surpassed the pre‐recession peak in January 2010. Corporate profits slumped after the fourth quarter of 2014, dipping by about 17 percent by the fourth quarter of 2015. Falling energy prices affected profits of oil and gas companies that were among the nation’s most profitable for many years. Additionally, profits were impacted by a weak global economy and strong dollar that influenced exports, which fell 2.5 percent in real terms from the fourth quarter of 2014 to the first quarter of 2016. As oil and gas prices stabilized, profit levels rebounded in 2016 and continued to grow in 2017, surpassing the fourth quarter 2014 level. Corporate profits were also bolstered by continued growth in exports. Profits are expected to remain on a generally positive trend through 2018.
Another factor that will influence business investment in 2018 is the passage of the TCJA. An analysis by the Tax Policy Center on the macroeconomic effects of the TCJA estimated that the law would improve businesses’ cash flow, boost near‐term investment activity, and stimulate aggregate demand and GDP. Another effect could include an influx of foreign capital. The Joint Committee on Taxation estimates that the amount of capital available for production will be 0.9 percent higher than baseline forecasts. Combined with individual income tax reforms, various tax analysts expect the new tax law to boost GDP by anywhere from 0.4 percent to 0.8 percent per year over the next few years. The gains in GDP and investment are expected to fade over time as the individual rate reductions expire and the near‐term expensing provisions sunset after five years. Additionally, the larger deficits resulting from the legislation are expected to dampen investment in the long‐term and increase interest rates. In addition, the fact that TCJA was passed during an economic expansion may limit the stimulating effects of the law.
After a slowdown in real nonresidential private fixed investment in 2016, growth increased at an estimated 4.1 percent annualized rate year‐to‐date through the third quarter of 2017 compared with the first three quarters of 2016. Investment in 2017 was characterized by broad‐based increases in investment for structures, equipment, and intellectual property. Investment in structures declined throughout 2015 and 2016, due in large part to the oil and gas contraction. Investment in exploration, shafts, and wells, which includes oil and gas, rebounded with a nearly 50 percent increase year‐to‐date through the third quarter of 2017 compared with 2016. Growth in commercial and healthcare structures was also strong. Investment in equipment rose in 2017 after falling in 2016, with companies investing in computers and peripheral equipment and industrial equipment. Intellectual property investments increased with strong growth in software and continued growth in R&D.

U.S. ECONOMY
Metro Denver Economic Development Corporation | January 2018 | Page 6
U.S. Economy
Government Spending
According to the Congressional Budget Office (CBO), the federal budget deficit for fiscal year 2017 is forecast to be $690 billion as of June 2017, 19 percent higher than 2016. The federal deficit as a percentage of GDP is projected to increase to 3.6 percent, marking the second year of increase after six consecutive years of declines since peaking at 9.8 percent in 2009. In 2018, the CBO estimates the deficit will decrease to $560 billion, and comprise only 2.8 percent of GDP. Despite the decline in 2018, the deficit is expected to resume its growth trend in subsequent years.
According to the CBO’s economic forecast, which serves as the basis for its budget projections, the larger deficit in 2017 was partially due to weak tax collections that increased more slowly than outlays. Concurrently, outlays grew due to higher education and housing subsidies. Federal outlays in 2017 comprised a higher percentage of GDP than 2016, increasing from 20.7 percent to 21 percent. Outlays are projected to fall to 20.5 percent of GDP in 2018 before rising back to more than 21 percent of GDP in 2019. The decrease in 2018 is mainly due to accounting procedures rather than a change in trend. Overall, the CBO expects that the economy will expand at a solid pace through 2018 with continued increase in the demand for workers, a tight labor market, and modestly rising inflation.
The size of the federal budget deficit will be impacted by the TCJA. The Joint Committee on Taxation estimates the TCJA will increase the budget deficit by about $1.1 trillion from 2018 to 2027. The Tax Policy Center estimates that the legislation will increase the federal budget deficit between $1.5 trillion and $1.8 trillion. The persistently larger budget deficits will increase the U.S. debt level. Tax Policy Center analysts estimate the law will raise the federal debt to GDP ratio by an estimated 5.5 to 6.3 percentage points. The increased deficit and federal debt may dampen economic growth over time through crowding out of investment activity and increased interest rates.
The International Monetary Fund’s (IMF) World Economic Outlook Database reports that the U.S. government gross debt in 2017 was estimated to be more than 108 percent of GDP, the fifth highest rate of the world’s advanced economies. The IMF estimates that gross debt will remain at about 108 percent of GDP in 2018. Major countries with the highest gross debt are Japan (240 percent), Greece (180 percent), Italy (133 percent), and Portugal (126 percent). In terms of net debt, or gross debt less the value of financial assets, the U.S. has the eighth highest rate at an estimated 82.5 percent of GDP in 2017. Net debt is projected to contract slightly to 81.1 percent of GDP by 2018.
State and local government consumption expenditures and gross investment slowed in 2017, recording no growth for the year. While there was moderate growth in consumption expenditures, a category that comprises about 83 percent of total state and local government spending, gross investment contracted by about 4.5 percent. Looking ahead, the CBO expects state and local governments to contribute little to the growth of output through 2018.
According to the 2015 Census of Government: Annual Surveys of State and Local Government Finances, the major sources of general revenue for state and local governments are taxes (46 percent), current charges (20

U.S. ECONOMY
Metro Denver Economic Development Corporation | January 2018 | Page 7
U.S. Economy
percent), intergovernmental (19 percent), and insurance trust (9 percent). Major expenditures for state and local governments are education (28 percent), public welfare (18 percent), insurance trust (10 percent), and public safety (7 percent).
Net Exports
In 2017, net exports subtracted a slightly larger share from GDP than was recorded in 2016. Net exports peaked in 2005 at ‐5.5 percent of GDP. However, since 2010 net exports have comprised about ‐3 percent of GDP on average, falling to as low as ‐2.6 percent in 2013, and rising as high as ‐3.5 percent in 2016. Trade volumes of both imports and exports fell in 2015 and 2016. However, the trade volume of imports and exports increased in 2017, with imports increasing at a faster pace than exports, leading to a growing trade deficit.
Major U.S. exports include transportation equipment, computers and electronic products, chemical products, and machinery. The nation’s largest trading partners in terms of exports are Canada, Mexico, China, Japan, and the United Kingdom. Contracting U.S. export activity in 2015 and 2016 coincided with a strengthening dollar. The value of the dollar peaked in December 2016 and fell throughout the first three quarters of 2017, contributing to growing export activity. The stronger global economy is anticipated to support growing export activity in 2018.
Interest Rates
Prime rate: 4.1 percent in 2017; 4.9 percent in 2018(f).
Since December 2015 the Federal Reserve has gradually increased the target federal funds rate, eventually maintaining a target range between 1.25 and 1.5 percent in late 2017. The December 2017 conference of the Federal Open Market Committee (FOMC) reported that while hurricane‐related disruptions affected economic activity, they did not change the outlook for the national economy. Economic activity has expanded at a solid pace and the labor market has been strong with a declining unemployment rate. The committee reported that household spending has been rising moderately and business fixed investment picked up. Inflation declined in the latter part of 2017 and the rate is still below the committee’s longer‐run objective of 2 percent. However, longer‐term inflation expectations were little changed. The FOMC still expects economic conditions will warrant gradual increases in the federal funds rate in 2018.

U.S. ECONOMY
Metro Denver Economic Development Corporation | January 2018 | Page 8
U.S. Economy
The federal funds rate, or the rate on short‐term loans between banks, and the prime rate offered by banks for short‐term business loans, are highly correlated. Since January 2016, the mean prime interest rate has averaged about 3.1 percentage points above the federal funds rate. Analysts anticipate three additional federal funds rate increases in 2018. As economic conditions remain strong, the outlook for the prime interest rate is 4.9 percent for 2018.
Employment & Unemployment
Employment: +1.5 percent in 2017(e); +1.2 percent in 2018(f).
Unemployment: 4.4 percent in 2017(e); 4.3 percent in 2018(f).
U.S. employment continued to grow in 2017, but at a slower rate of 1.5 percent compared with 1.7 percent in 2016. 2017 marks the seventh consecutive year of employment growth since contracting in 2010. The pace of job growth has declined as the unemployment rate continued to fall and the labor force participation rate remained near 40‐year lows. The labor force participation rate was up slightly from 2016, averaging 62.9 percent year‐to‐date through November 2017 compared with a monthly average of 62.8 percent in 2016. Meanwhile, the U.S. unemployment rate averaged 4.4 percent in 2017, its lowest annual average since 2000. In 2017, the median number of weeks individuals over the age of 16 remained unemployed ranged from 10 to 10.6 weeks, which was down from 11.6 weeks recorded in July 2016. Unemployment duration peaked at 25.8 weeks in April 2010.
The Manpower Employment Outlook Survey found hiring expectations in the U.S. remained strong for the first quarter of 2018 compared with the prior quarter, with U.S. employers reporting their strongest first quarter hiring intentions in 10 years. The percentage of employers planning to increase employment levels remained at 21 percent between the fourth quarter of 2017 and the first quarter of 2018. The percentage of companies planning to reduce employment levels decreased to 5 percent compared with 6 percent a year ago and in the last quarter. The percentage of companies planning to maintain staffing levels (71 percent) was 2 percentage points lower than the prior year’s level. Survey analysts noted that employers in all 13 industry sectors expected to add staff in the first quarter of 2018. The top industries were leisure and hospitality and transportation and utilities. For transportation and utilities specifically, job prospects were the strongest reported since the survey started in the first quarter of 1982. Additionally, a positive outlook was recorded in all four regions in the U.S., with the Midwest posting its strongest outlook since the beginning of 2001.

U.S. ECONOMY
Metro Denver Economic Development Corporation | January 2018 | Page 9
U.S. Economy
Income
Total Personal Income: +3.1 percent in 2017(e); +4.2 percent in 2018(f).
Personal income has several components: earnings from work, asset‐based income, and government social insurance (transfer) payments. Personal income growth slowed in 2016 due to a number of factors including slower wage and salary growth, a drop in asset‐based income, and lower growth in transfer receipts. However, as the unemployment rate continued to fall in 2017, the tight labor market led to an increase in employee compensation. Additionally, the push for higher minimum wages in many areas of the country may have supported higher wage levels. Twenty‐nine states have a minimum wage higher than the federal minimum. In 2017, nineteen states began the year with higher minimum wages that were automatically increased based on cost of living, enacted from previous legislation, or raised through ballot initiatives. In many cases, increases will be phased in over several years and will far outpace inflation. Additionally, proprietors’ income increased at its fastest rate in three years and asset‐based income rebounded. The tight labor market is anticipated to lead to wage gains in 2018.
Overall, total personal income increased 3.1 percent in 2017. Growth is expected to accelerate in 2018 to 4.2 percent.
Inflation
Consumer Price Index: +2.1 percent in 2017; +2.0 percent in 2018(f).
The Federal Reserve target inflation rate is 2 percent in the medium‐term, and the average in 2017 increased to 2.1 percent from 1.3 percent in 2016. Core inflation, which is total inflation less food and energy, increased at a 2.2 percent annual rate in 2016, but fell to a lower 1.8 percent rate in 2017. Overall inflation was boosted by more stable energy prices in 2017. In 2016, there was an 11 percent decline in the average crude oil price, following a 48 percent decline in 2015. However, the average price year‐to‐date in 2017 was about 19 percent higher than the same months in 2016. The average monthly price bottomed out in February 2016 at about $30.00 per barrel based on data from the U.S. Energy Information Administration (EIA). Prices in 2017 have fluctuated between about $45 and $57 per barrel.
Looking ahead, the most recent EIA forecast of crude oil prices predicts an average of about $56 per barrel in 2018. While U.S. production is expected to increase at a much faster pace in 2018 than domestic consumption, a strengthening global economy and growth in exports will support prices. Further, OPEC is expected to extend production cuts through 2018.
Based on year‐to‐date price appreciation for separate components of the consumer price index, housing and medical care are also contributing to stronger inflation in 2017. Over the past five years, prices in the housing index have increased at a 2.2 percent annual rate. However, year‐to‐date data indicate that housing is on pace for 3 percent growth in 2017, the fastest rate since 2008. For medical care, prices have appreciated at an annual rate of 3 percent from 2011 to 2016, much faster than the 1.3 percent annual rate for all items. In 2017, the

U.S. ECONOMY
Metro Denver Economic Development Corporation | January 2018 | Page 10
U.S. Economy
medical care index increased 2.6 percent year‐to‐date. Looking ahead, housing and medical care prices are expected to continue to outpace overall price appreciation.
Continued monetary tightening by the Federal Reserve should moderate the pace of inflation in 2018. The Federal Reserve announced three rate increases for its target federal funds rate in 2017, raising the range to 1.25 to 1.5 as of December 2017. The Fed also began the process of shrinking the size of its balance sheet in October. Monetary tightening typically dampens inflation as consumers have less money to spend and price increases of goods and services slow in response. Indeed, despite inflation accelerating at the beginning of 2017, the rate fell below the Fed’s target by the end of the year. While the growing economy will boost inflationary pressure, FOMC policy will stabilize inflation near its target.
National Business Cycle
An important component of business cycle theory is the concept of potential GDP. Potential GDP is a measure employed by the CBO used to guide its economic projections. Potential GDP is defined as the maximum output that can be achieved in the economy over time without increasing the risk of inflation. Actual GDP fluctuates above and below potential GDP during business cycles. During a recession and early recovery, actual GDP falls below potential GDP. During the later phases of economic expansions, actual GDP typically rises above potential GDP. The difference between actual and potential GDP is measured by the CBO using the output gap which is expressed as actual GDP less potential GDP, as a percent of potential GDP. Therefore, a negative output gap is associated with economic recessions and slack in the economy; a positive output gap is associated with overheating in the economy. According to the CBO, from 1961 to 2009, actual GDP was about 0.5 percent below potential GDP on average, or a slightly negative output gap.
Related to potential GDP is the concept of a natural rate of unemployment. The natural rate is defined as the unemployment rate exclusive of the influence of business cycles that is attributable to the economy’s ability to match jobs with employees. In other words, the unemployment rate associated with normal turnover, job creation and destruction, and the length of time required for job matching. During recessions, the actual unemployment rate will be well above the natural rate of unemployment and in the later stages of an expansion will be below it.
The CBO publishes measures of potential GDP and the natural rate of unemployment. Based on the CBO estimates, the output gap has been negative since the Great Recession, dipping as low as ‐5.8 percent in 2009. The output gap has gradually approached zero, measuring at ‐0.7 percent in 2016. Based on the CBO’s most recent analysis, the output gap will rise into positive territory in 2018 and will persist into 2019, representing an economy that is operating past its potential. The CBO estimates the natural rate of unemployment since 2016 has been 4.7 percent. The estimated average unemployment rate in 2017 is 4.4 percent, 0.3 percentage points below the natural rate. The unemployment rate is expected to fall further below CBO’s natural rate in 2018.
As of January 2018, the U.S. economy has been expanding for 102 months, the third‐longest expansion in records dating back to 1854. For comparison, the longest expansion lasted 120 months from 1991 to 2001 and

U.S. ECONOMY
Metro Denver Economic Development Corporation | January 2018 | Page 11
U.S. Economy
the shortest expansion lasted 12 months from 1980 to 1981. Once the current expansion surpasses 106 months, as it likely will, it will be the second‐longest expansion to date.
The Federal Reserve Bank of St. Louis produces a Smoothed U.S. Recession Probability model on a monthly basis that uses four variables to forecast the chance of an upcoming national recession. The variables are non‐farm payroll employment, the index of industrial production, real personal income, and real manufacturing and trade sales. Healthy employment growth generally results in a low probability of recession. Indeed, the U.S. has currently posted 51 consecutive months of a recession probability under 3 percent.
National Economy Summary
The United States continued on its expansionary path, as all jobs lost during the recession were recovered by mid‐2014 and employment in 2017 grew by an estimated 1.5 percent. The employment growth rate is expected to increase at a slower pace, falling to 1.2 percent in 2018. Real gross domestic product will grow at a 2.4 percent pace in 2018, which is still below the historic average of 2.7 percent, spurred by rising consumer confidence, increased consumption, and rising business investment. As GDP and employment expand, the nation’s unemployment rate will drop to 4.3 percent and total personal income will increase 4.2 percent in 2018. Inflation will continue to rise due to the stronger economy and more stable energy prices, lifting overall prices up by 2 percent.

COLORADO ECONOMY
Metro Denver Economic Development Corporation | January 2018 | Page 12
Colorado Economy
Colorado is expected to be among the top 10 states for employment growth during 2017, although final state employment data for the year will not be released until March. Colorado has ranked in the top 10 states for seven of the past 10 years, from 2007 to 2016. Preliminary numbers suggest 2.2 percent state employment growth in 2017, which is higher than the estimated national growth rate of 1.5 percent. The employment base will expand to 2.66 million workers in 2017, representing the addition of about 57,600 jobs.
Colorado’s growing labor market is supported by a diverse industry base and dynamic business climate. Colorado’s expanding employment base, high quality of life, and increasing presence in the global business community continue to attract individuals and businesses to the state. Colorado’s economy is expected to report positive trends through 2018 across most economic indicators.
The state has several unique advantages. The expanding entrepreneurial community, increasing start‐up activity, and highly educated workforce make Colorado an attractive location for business. In 2017, the state ranked:
…third for its technology employment concentration (9.3 percent in 2016) on the CompTIA’s Cyberstates 2017 report.
…fourth in the Economic Innovation Group’s Index of State Dynamism for the ability of its economy and population to adopt to changing conditions.
…fifth most innovative state by WalletHub based on the state’s high educational achievement, share of technology companies, share of STEM professionals, and projected STEM‐job demand by 2020.
…fifth most startup activity among the largest 25 states according to the 2017 Kauffman Index of Startup Activity for its rate of new entrepreneurs and startup density.
…sixth on CNBC’s list of America’s top states for business with high rankings for its workforce, technology and innovation, and business friendliness.
…seventh on the 2017 U.S. Clean Tech Leadership Index by Clean Edge, Inc., as one of only eight states to have a U.S. Department of Energy laboratory, a clean‐tech incubator, access to financial and human capital.
…eighth best state for business by Forbes. Colorado was credited for its young, educated labor supply and a migrating population that is attracted to its robust economy and outdoor recreational opportunities.
…ninth best state in U.S. News & World Report’s new best states rankings including No. 1 for its economy, No. 7 for infrastructure, and No. 11 in healthcare.
…tenth in the nation in attracting private‐equity investment according to the American Investment Council, receiving $16.1 billion in capital investments supporting 18,265 jobs in 2016.
These favorable rankings suggest the state will continue to grow solidly and attract attention as a highly desirable place to live and work.

COLORADO ECONOMY
Metro Denver Economic Development Corporation | January 2018 | Page 13
Colorado Economy
Employment & Unemployment
Note: Annual benchmark revisions to the employment and unemployment data series can significantly alter historic trends. As 2017 job data will be revised in March 2018, the exact revisions are not yet known. The following forecast is based on expected revisions to the data.
Employment: +2.2 percent in 2017(e); +1.9 percent in 2018(f).
Unemployment: 2.6 percent in 2017(e); 2.7 percent in 2018(f).
Colorado employment increased an estimated 2.2 percent in 2017, a similar pace as recorded in 2016. Estimates show the state gained 57,600 jobs in 2017 compared with 2016, and is expected to gain another 50,500 jobs during 2018. Data from the U.S. Department of Labor’s Current Employment Statistics (CES) show that statewide employment surpassed its pre‐recession peak in June 2013. From 2011 through 2017, Colorado added 433,600 jobs to the state’s economy.
Based on the unrevised, published employment numbers from the CES data, year‐to‐date through November, Colorado’s fastest growing supersectors in 2017 were the transportation, warehousing, and utilities supersector and the other services category; with transportation, warehousing, and utilities increasing 3.4 percent and other services increasing 3.3 percent. The transportation, warehousing, and utilities supersector has been supported by various company announcements including large distribution centers in the Metro Denver area. Other services includes personal services, repair and maintenance services, and nonprofit organizations. The supersector mostly was boosted from a reclassification of companies from healthcare. Despite the fast pace of growth, these two supersectors accounted for only about 12.6 percent of the absolute growth in Colorado’s employment base. Colorado’s largest growth sectors in terms of absolute employment were professional and business services, leisure and hospitality, wholesale and retail trade, and education and health services. Combined, these four supersectors comprised about 71 percent of Colorado’s absolute employment growth.
None of Colorado’s supersectors lost employment in 2017. However, three of Colorado’s supersectors recorded employment growth well below the state average. The natural resources and construction supersector continued to struggle with slow growth in the mining subsector that includes oil and gas. While further job losses are not expected in oil and gas, the industry continues to recover from the steep job losses posted in 2016. Manufacturing continued to be impacted by three consecutive years of export contraction from 2014 to 2016. However, employment was supported somewhat from an increase in exports through the first half of 2017, rising 7.1 percent compared with the first half of 2016. The information supersector recorded its fourth consecutive year of growth in 2017. However, the supersector has increased at an annualized rate of just 1 percent since 2013.
Looking ahead, the natural resources and construction; transportation, warehousing, and utilities; leisure and hospitality; and education and health services supersectors are expected to lead the state in employment growth through 2018. Professional and business services, education and health services, and leisure and

COLORADO ECONOMY
Metro Denver Economic Development Corporation | January 2018 | Page 14
Colorado Economy
hospitality are anticipated to contribute the most to absolute employment growth. All eleven supersectors in Colorado are expected to grow in 2018.
After uneven growth in 2016, the outlook is positive for the state’s metro regions after most regions posted rising employment in 2017. In 2016, despite strong statewide employment growth, both the Greeley metropolitan statistical area (MSA) and Grand Junction MSA contracted. The Greeley MSA was impacted by the oil and gas contraction and Grand Junction has continued to struggle since the Great Recession. Since the oil and gas sector has stabilized, employment in the Greeley MSA was boosted in 2017 by rapid growth in communities in the southern portion of Weld County, just north of Metro Denver. In 2017, the Greeley MSA was once again one of the fastest growing metro areas in the state. Fort Collins continues to post robust employment growth, increasing 3.5 percent in 2016 and by more than 4 percent in 2017. Other areas along the Front Range of Colorado are also growing faster than the statewide average. Metro Denver and employment in the Colorado Springs MSA increased 2 percent in 2017. Pueblo is one of the slower growing areas along the Front Range, increasing below the state average in 2016 and 2017.
Most of the state’s counties are not located in metro areas. Growth in employment has varied significantly in various parts of the state, with many rural areas lagging behind counties along the Front Range and in the mountain resort regions.

COLORADO ECONOMY
Metro Denver Economic Development Corporation | January 2018 | Page 15
Colorado Economy
An additional key facet of Colorado’s employment base is the state’s level of entrepreneurial activity. Sole proprietors are not counted in the nonfarm employment numbers for the state, and these individuals represent a tremendous force in the state. In 2016, Colorado had over 921,800 sole proprietors earning over $28.2 billion in income. Sole proprietor employment increased 2.3 percent between 2015 and 2016, and at an annualized rate of 2.4 percent since 2011. In 2016, Colorado had the sixth‐highest concentration of sole proprietors as a percent of employment of the 50 states.
According to the Manpower Employment Outlook Survey, the employment outlook for Colorado was stronger than the nation through 2017 and into the first quarter of 2018. The percent of companies expecting to hire in the state remained at 22 percent for the first quarter of 2018, higher than the 21 percent rate recorded for the U.S., and improved over‐the‐year from the first quarter of 2017. Additionally, only 4 percent of the companies in Colorado were expecting layoffs in the first quarter, lower than the 5 percent rate in the U.S. Analysts noted that job prospects appeared best in construction, manufacturing, and in most service sectors, while hiring in other services and government was expected to remain unchanged.
Colorado employers have been optimistic about their business future. As companies consistently increased staffing levels and Colorado’s labor force continued to tighten in 2017, the unemployment rate reached its lowest monthly and annual levels in the history of the data series going back to 1976. The previous monthly low was recorded in October 2000, which was 0.2 percentage points higher than the 2.2 percent rate posted in August 2017. The previous lowest average annual rate was recorded for the same year, 2000. In 2017, Colorado recorded a 2.6 percent annual unemployment rate. Additionally, Colorado’s unemployment rate has remained below the national rate for the 13th consecutive year.
The state’s unemployment rate is expected to remain near historically low levels in 2018, averaging 2.7 percent for the year. The rate is expected to tick up as employment growth slows and more people enter the labor force. The low unemployment rate affects businesses as finding employees with ideal skill sets becomes harder. Colorado is expected to benefit from in‐migrants, but as labor markets tighten across the country, net migration in Colorado is expected to slow.
The tight labor market may be influencing a higher labor force participation rate. The labor force participation rate declined
significantly during the Great Recession, falling from levels ranging from between about 71 percent to 73 percent to a low of about 66 percent through the end of 2016. In 2017, the average monthly labor force participation rate in Colorado posted its first annual increase since 2005. The rate has increased by 2 percentage
1Q 4Q 3Q 2Q 1Q
2018 2017 2017 2017 2017
% Hiring 22% 22% 32% 27% 21%
% Laying Off 4% 7% 4% 1% 6%
% No Change 70% 68% 64% 69% 71%
% Unsure 4% 3% 0% 3% 2%
U.S.
% Hiring 21% 21% 24% 22% 19%
% Laying Off 5% 6% 4% 3% 6%
% No Change 71% 71% 70% 73% 73%
% Unsure 3% 2% 2% 2% 2%Source: Manpower Inc.
Colorado
Colorado Employment Outlook Survey

COLORADO ECONOMY
Metro Denver Economic Development Corporation | January 2018 | Page 16
Colorado Economy
points from 66.3 percent in January 2017 to 68.3 percent in October. The strong state economy may be attracting previous labor force participants back into the job market, as well as encouraging new entrants.
All measures of unemployment for Colorado were significantly lower than the national rates based on the most recent data from the Bureau of Labor Statistics, including individuals who were underemployed and marginally attached to the labor force, referred to as U‐6 unemployment. This includes discouraged workers, individuals who work part‐time and would prefer a full‐time position, or other individuals who are not employed but who would join the labor force under better circumstances.
Based on the four quarters ending in the third quarter of 2017, Colorado’s U‐6 unemployment rate was 6.2 percent, 9.5 percentage points below the peak level of 15.7 percent in 2010, and at a level not posted in the series history back to 2003. The previous low was 7.3 percent in 2007. High underemployment rates during recessionary periods are expected as individuals who were laid off settle for jobs they would not ordinarily take during economic expansions. With Colorado on an economic expansionary path, the U‐6 rate continued to fall through 2017. Colorado’s rate is roughly double the “headline” unemployment rate, which is the typical relationship between unemployment and underemployment rates.
Colorado Exports
Colorado exports increased in 2017 after three consecutive years of declines. Through the first three quarters of 2017, Colorado exports totaled about $6 billion, increasing 5.3 percent compared with the same period in 2016. However, Colorado’s exports in 2017 will likely remain below the peak in 2013 of more than $8.5 billion. Colorado’s largest trading partners are Canada, Mexico, China, Japan, and South Korea. Colorado’s top five partners accounted for about 51 percent of the value of exports in 2016. Colorado recorded robust export growth to Mexico, Japan, and Malaysia in 2017. Exports to Mexico jumped by nearly 35 percent year‐to‐date through the third quarter of 2017, Japan increased by 5.7 percent, and Malaysia by 3.7 percent. However, the Chinese market contracted by about 3 percent. A decrease in the value of the dollar in 2017 and a stronger global economy contributed to demand for Colorado’s exports. While monetary tightening may put upward pressure on the value of the dollar in 2018, a stronger global economy will offset some of its effect on export activity.
Major Colorado exporting industries included computer and electronic products, food manufacturing, machinery, and chemicals. Data indicate that through the third quarter of 2017, the fastest growth in Colorado was in food manufacturing. Exports for food manufacturing increased more than 25 percent through the third quarter of 2017. Food manufacturing also accounted for the largest absolute increase in Colorado’s export value. Other sectors that posted strong growth included plastics and rubber products, primary metals, and nonmetallic minerals. Despite growth in many of Colorado’s sectors, the state’s computer and electronic products contracted for the fourth consecutive year. Colorado’s top commodities, which are represented in some of Colorado’s top exporting industries, included electronic integrated circuits; beef; medical, surgical, dental, and veterinary instruments and appliances; and civilian aircraft, engines, and parts. Based on the most recent commodity data for the state, export growth in each of these commodity categories from 2015 to 2016 helped offset overall declines for the year.
COLORADO ECONOMY
Metro Denver Economic Development Corporation | January 2018 | Page 17
Colorado Economy
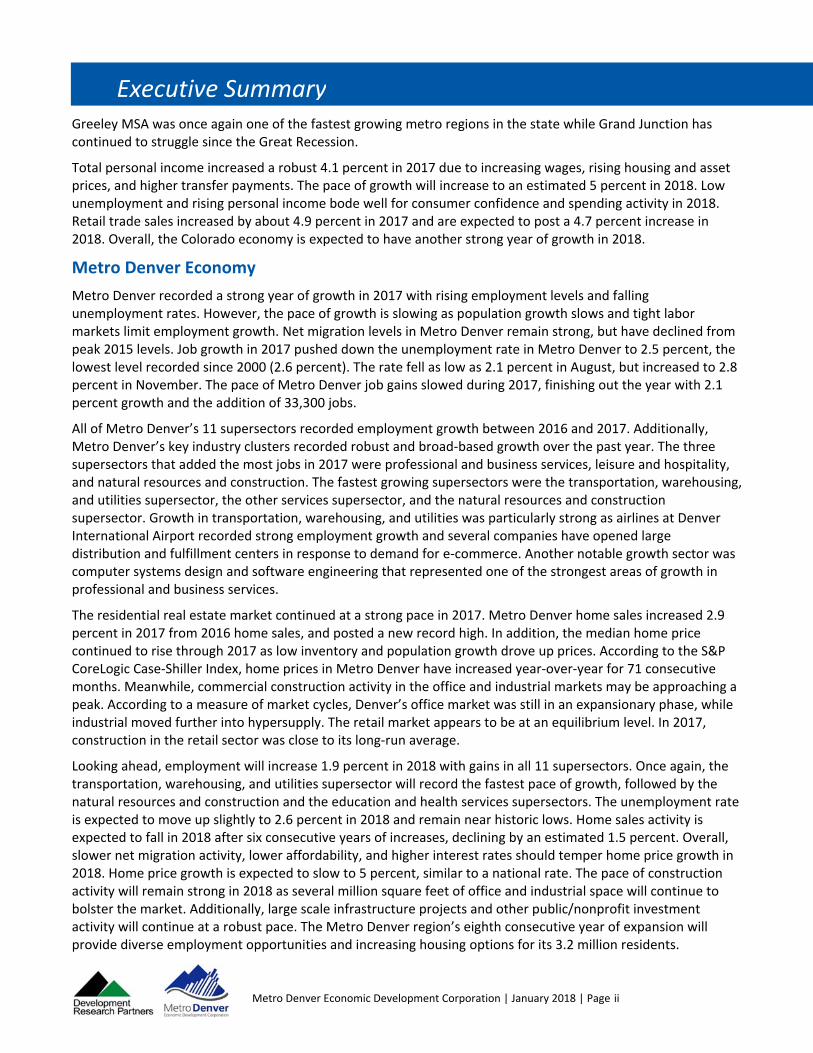
Population
Population: 5.63 million in 2017(e) (+1.7 percent); 5.72 million in 2018(f) (+1.6 percent).
According to data from the Colorado State Demography Office, the state’s population growth rate averaged 1.6 percent per year between 2007 and 2017. The population growth rate was estimated to be 1.7 percent in 2017 and is expected to slow in 2018 to 1.6 percent. Looking further in the future, total population is expected to increase an average of 1.6 percent per year through 2025. Demographers expect net migration—or the inflow of residents minus the outflow—will be the major contributing factor to Colorado’s population growth throughout the decade, representing about 67 percent of the state’s population increase in 2017. Based on the latest state‐to‐state migration data, in 2015 Colorado gained the most in‐migrants from California (12.8 percent), Texas (11.1 percent), Florida (5.5 percent), Illinois (5 percent), and Arizona (4.5 percent).
Colorado is experiencing two major demographic shifts in the state’s population. First, in 2015, the largest generational group residing in the state became the millennials (born 1981‐1997), surpassing the baby boomers (born 1946‐1964). Second, Colorado’s share of the population 65 years and older is increasing rapidly. The State Demography Office projects that by 2030, this percentage will increase to nearly 18 percent of the population, rising from about 744,000 to about 1.2 million people.
Income and Spending
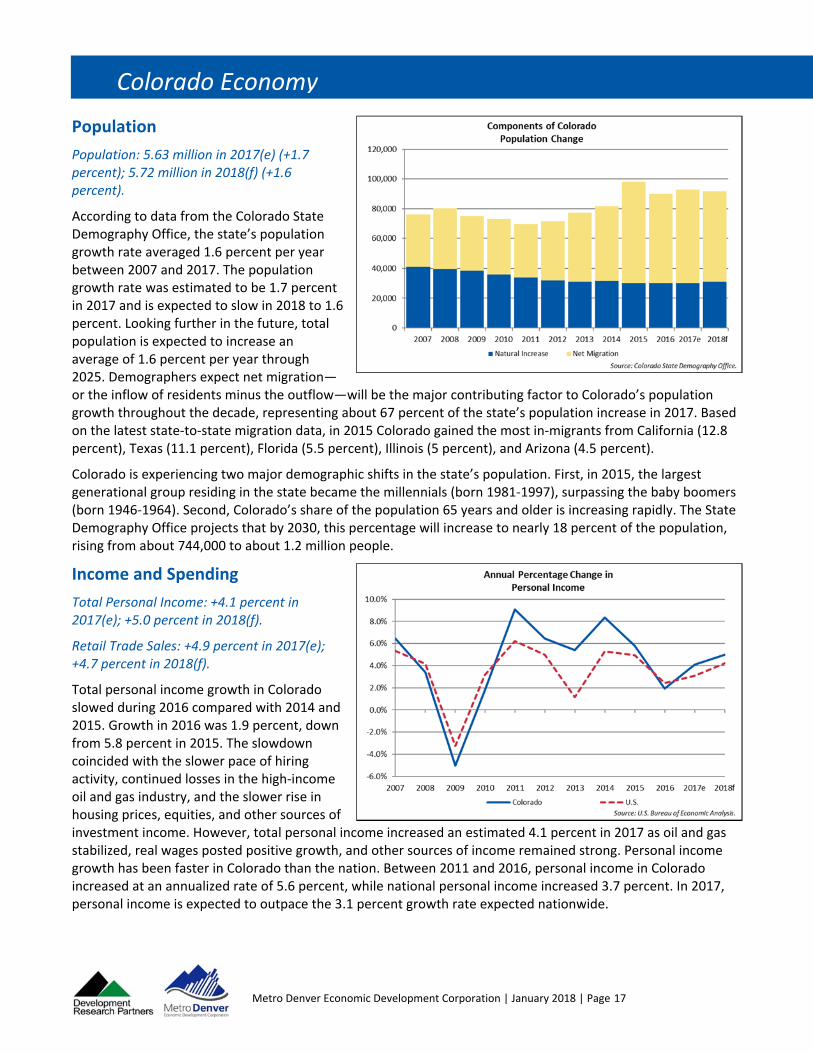
Total Personal Income: +4.1 percent in 2017(e); +5.0 percent in 2018(f).
Retail Trade Sales: +4.9 percent in 2017(e); +4.7 percent in 2018(f).
Total personal income growth in Colorado slowed during 2016 compared with 2014 and 2015. Growth in 2016 was 1.9 percent, down from 5.8 percent in 2015. The slowdown coincided with the slower pace of hiring activity, continued losses in the high‐income oil and gas industry, and the slower rise in housing prices, equities, and other sources of investment income. However, total personal income increased an estimated 4.1 percent in 2017 as oil and gas stabilized, real wages posted positive growth, and other sources of income remained strong. Personal income growth has been faster in Colorado than the nation. Between 2011 and 2016, personal income in Colorado increased at an annualized rate of 5.6 percent, while national personal income increased 3.7 percent. In 2017, personal income is expected to outpace the 3.1 percent growth rate expected nationwide.
COLORADO ECONOMY
Metro Denver Economic Development Corporation | January 2018 | Page 18
Colorado Economy
Looking ahead, the pace of personal income growth is expected to increase to 5 percent in 2018, lower than the 5.6 percent five‐year trend from 2011 to 2016. Growth in real wages, investment income, and government transfers from a larger retirement age population will contribute to faster growth than 2018. Social Security recipients will benefit from a higher cost of living adjustment due to a faster pace of inflation in the past year.
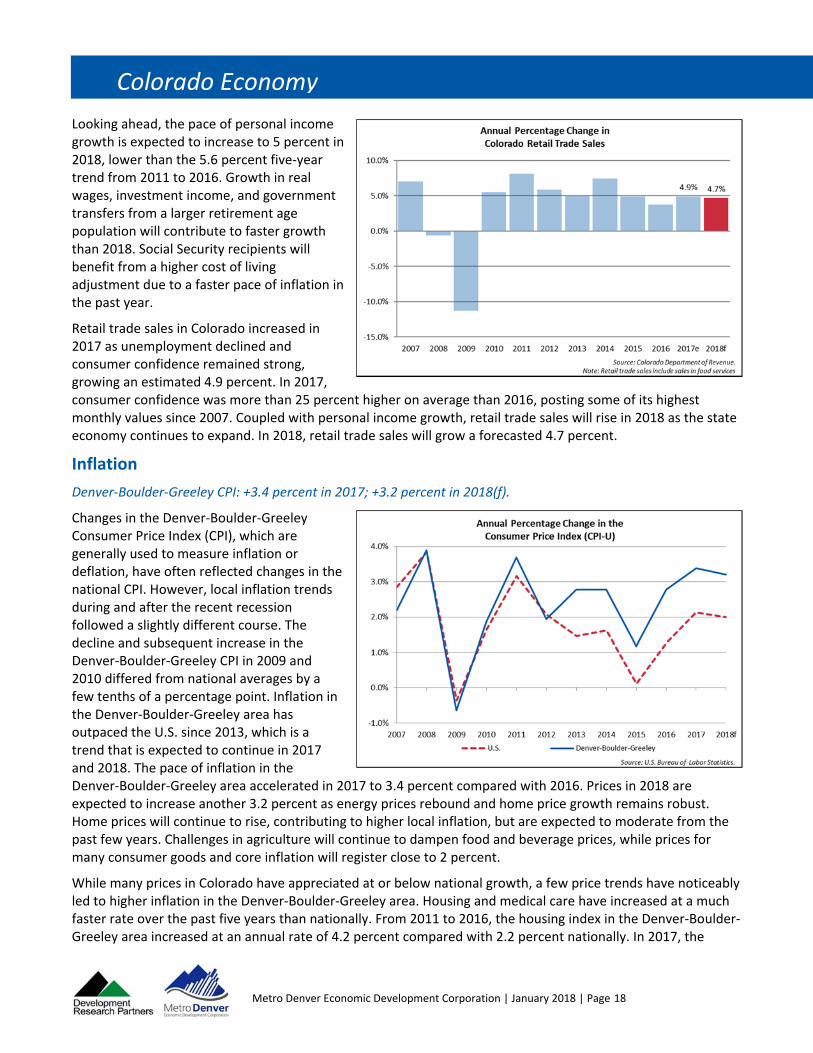
Retail trade sales in Colorado increased in 2017 as unemployment declined and consumer confidence remained strong, growing an estimated 4.9 percent. In 2017, consumer confidence was more than 25 percent higher on average than 2016, posting some of its highest monthly values since 2007. Coupled with personal income growth, retail trade sales will rise in 2018 as the state economy continues to expand. In 2018, retail trade sales will grow a forecasted 4.7 percent.
Inflation
Denver‐Boulder‐Greeley CPI: +3.4 percent in 2017; +3.2 percent in 2018(f).
Changes in the Denver‐Boulder‐Greeley Consumer Price Index (CPI), which are generally used to measure inflation or deflation, have often reflected changes in the national CPI. However, local inflation trends during and after the recent recession followed a slightly different course. The decline and subsequent increase in the Denver‐Boulder‐Greeley CPI in 2009 and 2010 differed from national averages by a few tenths of a percentage point. Inflation in the Denver‐Boulder‐Greeley area has outpaced the U.S. since 2013, which is a trend that is expected to continue in 2017 and 2018. The pace of inflation in the Denver‐Boulder‐Greeley area accelerated in 2017 to 3.4 percent compared with 2016. Prices in 2018 are expected to increase another 3.2 percent as energy prices rebound and home price growth remains robust. Home prices will continue to rise, contributing to higher local inflation, but are expected to moderate from the past few years. Challenges in agriculture will continue to dampen food and beverage prices, while prices for many consumer goods and core inflation will register close to 2 percent.
While many prices in Colorado have appreciated at or below national growth, a few price trends have noticeably led to higher inflation in the Denver‐Boulder‐Greeley area. Housing and medical care have increased at a much faster rate over the past five years than nationally. From 2011 to 2016, the housing index in the Denver‐Boulder‐Greeley area increased at an annual rate of 4.2 percent compared with 2.2 percent nationally. In 2017, the

COLORADO ECONOMY
Metro Denver Economic Development Corporation | January 2018 | Page 19
Colorado Economy
Denver‐Boulder‐Greeley housing index increased another 5.1 percent. Looking ahead, housing will continue to push inflation in Colorado to a higher rate than posted nationally. For medical care, the price index increased at an annual rate of 3.5 percent from 2011 to 2016 compared with 3 percent nationally. Price growth accelerated in the Denver‐Boulder‐Greeley region in 2017, increasing 4.4 percent compared with 2.5 percent nationally. Over the past five years, price appreciation in apparel, education and communication, food and beverages, and transportation was similar to the nation.
Colorado Economy Summary
The pace of growth in Colorado will likely slow in 2018 as net migration tapers gradually and the unemployment rate remains near historic lows. Still, Colorado will likely be among the top 10 states for employment growth during 2017. Employment is anticipated to increase 2.2 percent in 2017 and 1.9 percent in 2018. In 2018, employment will reach 2.71 million workers, representing the addition of 50,500 jobs from 2017 to 2018. The unemployment rate fell to 2.6 percent in 2017 and will rise to an anticipated 2.7 percent in 2018. As companies consistently increased staffing levels, and Colorado’s labor force continued to tighten, the unemployment rate in 2017 reached its lowest monthly and annual levels in the history of the data series going back to 1976. The previous monthly low was recorded in October 2000, which was 0.2 percentage points higher than the 2.2 percent rate posted in August 2017. Colorado is expected to benefit from in‐migrants, but as labor markets tighten across the country, net migration in Colorado is expected to slow.
Professional and business services, education and health services, and leisure and hospitality are anticipated to contribute the most to absolute employment growth in 2018. All eleven supersectors in Colorado are expected to add employment in 2018. The fastest growing regions in the state were along the Front Range. In 2017, the Greeley MSA was once again one of the fastest growing metro regions in the state while Grand Junction has continued to struggle since the Great Recession.
Total personal income increased a robust 4.1 percent in 2017 due to increasing wages, rising housing and asset prices, and higher transfer payments. The pace of growth will increase to an estimated 5 percent in 2018. Low unemployment and rising personal income bode well for consumer confidence and spending activity in 2018. Retail trade sales increased by about 4.9 percent in 2017 and are expected to post a 4.7 percent increase in 2018. Overall, the Colorado economy is expected to have another strong year of growth in 2018.

METRO DENVER ECONOMY
Metro Denver Economic Development Corporation | January 2018 | Page 20
Metro Denver Economy
The seven‐county Metro Denver region consists of Adams, Arapahoe, Boulder, Broomfield, Denver, Douglas, and Jefferson Counties. There are two metropolitan statistical areas (MSAs) located wholly or partly within the Metro Denver region: the Boulder MSA (Boulder County) and the Denver‐Aurora‐Lakewood MSA.1
Metro Denver reported strong economic trends in 2017 and continued employment growth is expected for 2018, albeit at a slower pace as net migration slows and the labor market remains tight. Compared with the national average, employment growth in Metro Denver was 0.6 percentage points higher at 2.1 percent and included gains across all supersectors. The expanding Metro Denver economy is bolstered by a vibrant entrepreneurial community, an active start‐up market, and optimistic businesses. Metro Denver received several accolades in 2017, including:
U.S. News and World Report named Denver the second best place to live in the country based on a healthy job market, net migration, and perception as a desirable place to live.
Forbes ranked Denver as the nation’s fourth best place for business and careers.
Bloomberg named Boulder (No. 1) and Denver (No. 10) among the nation’s top destinations for the best and brightest.
American City Business Journals ranked Denver as the eighth best market for entrepreneurs.
CBRE Group Inc. ranked Denver as the eighth‐hottest market for commercial real estate investment in North and South America.
Smart Asset named Denver No. 8 in the nation for the “Top 15 Cities for Women in Tech.”
Real estate services firm Cushman & Wakefield ranked Denver eighth nationally in talent, capital, and growth opportunities for technology.
WalletHub ranked Denver as the 10th most recovered city since the end of the Great Recession among 505 other U.S. cities.
The Ewing Marion Kauffman Foundation ranked Metro Denver 10th out of 40 metropolitan areas for startup activity.
Metro Denver will experience strong employment growth in the transportation, warehousing, and utilities, natural resources and construction, and education and health services supersectors in 2018. Additionally, the professional and business services supersector and leisure and hospitality supersector will continue to grow faster than the regional average and be among the top contributors to absolute employment growth. Construction activity will continue at a brisk pace through 2018 in all market areas including the residential, commercial, public/nonprofit, and nonbuilding sectors, although a slowdown in multifamily permits and construction is expected. Strong wage growth and consumer confidence will contribute to growth in retail sales, while inflation in the Metro Denver area will continue to outpace the nation. Home price growth is expected to slow in 2018, closer to the national average.
1 The Denver‐Aurora‐Lakewood MSA includes Adams, Arapahoe, Broomfield, Clear Creek, Denver, Douglas, Elbert, Gilpin, Jefferson, and Park Counties.

METRO DENVER ECONOMY
Metro Denver Economic Development Corporation | January 2018 | Page 21
Metro Denver Economy
Population
Population: 3.17 million in 2017(e) (+1.6 percent); 3.22 million in 2018(f) (+1.6 percent).
The seven‐county Metro Denver area is home to nearly 3.2 million people. Metro Denver’s population growth averaged 1.7 percent per year between 2007 and 2017, maintaining a stable growth rate through most of the recent recession and recovery due to strong positive net migration. Forecasters with the Colorado State Demography Office expect the region’s population growth rate will decrease to 1.6 percent in 2018, slower than the 2 percent peak in 2015, but significantly faster than the projected U.S. growth rate of 0.8 percent in 2018. Since the Great Recession, Metro Denver’s population has generally increased at a faster pace than the state. However, the region’s growth rate was slower than the state in 2016 and 2017, and is expected to grow at a similar rate in 2018. The state demographer expects population growth between 2017 and 2018 will be fastest in the City and County of Broomfield (+3.4 percent), Adams County (+2.1 percent), and Douglas County (+1.8 percent). Jefferson County (1.2 percent) and Boulder County (1.1 percent) will have the slowest rates of growth. Population growth in the region is expected to average 1.5 percent growth per year through 2025.
Population growth depends on two components—natural increase and net migration. Natural increase is the difference between births and deaths, and it tends to change only gradually as the population ages. Net migration reflects the number of people moving into the area minus the number leaving, which tends to be more volatile as economic cycles, housing costs, and other less‐predictable factors influence population mobility. Natural increase accounted for approximately 43 percent of

METRO DENVER ECONOMY
Metro Denver Economic Development Corporation | January 2018 | Page 22
Metro Denver Economy
population growth between 2007 and 2017. Net migration surged in Metro Denver following the Great Recession, comprising the majority of the net migration to Colorado. Since 2010, net migration in Metro Denver accounted for 62 percent of total Colorado net migration. However, Metro Denver’s net migration fell to 47 percent in 2016 and is projected to comprise about half of the state’s net migration in 2018.
The age composition of Metro Denver’s population will continue to shift significantly over the next 15 years. Individuals 65 years and over in Metro Denver represented 8.8 percent of the population in 2000 and grew to an estimated 12.7 percent of the population in 2017. In absolute terms, the population 65 years and over was about 214,200 in 2000 and increased to about 401,800 in 2017, an 87.5 percent increase. By 2030, the 65 years and over population is projected to increase by another 253,200 people to 655,000 and comprise an estimated 17 percent of the population. The older population has notable implications for the Metro Denver economy.
As the baby boomer generation has begun to enter traditional retirement age, it has coincided with higher labor force participation rates for the 65 years and over demographic, as well as increased earnings. Other economic factors related to the aging of the population include healthcare spending, housing preferences, and demand for goods and services. This generational shift will have large impacts on the business community. As baby boomers retire, business leaders will need to find ways to either retain some of these workers or fill their positions. Advance planning now can make for smoother transitions in the future. In the population by generation charts, it should be noted that the official name and birth year ranges for the “next gen” and “future gen” generational groups have not been established.
Another key demographic component for the Metro Denver region is the millennial generation. Millennials are the largest population group in Metro Denver, numbering about 818,122 in 2017 and comprising nearly 26 percent of the population. Millennials represent the largest share of the potential working age population ages 16 to 64 years. Metro Denver is an attractive location for this demographic and consistently ranks as a top area for college graduates and the millennial generation.
Income
Incomes in Metro Denver are higher than in the U.S. Data indicate that the per capita personal income in Metro Denver in 2016 was $57,770 compared with $49,250 in the U.S. At a household level, the median household income in the Metro Denver area in 2016 was $71,930 compared with $57,620 in the U.S. Additionally, incomes in Metro Denver have grown at a significantly faster rate than the U.S. emerging from the last recession, boosted in part by wage and salary growth, proprietors’ income, and an increase in transfer payments. Data indicate that from 2010 to 2016, per capita personal income in Metro Denver grew at an annual rate of 4.8 percent compared with 3.4 percent in the U.S. However, Metro Denver’s pace of growth slowed in 2016 below the rates posted for the U.S. and Colorado for the first time since 2009. In 2016, Metro Denver’s per capita personal income contracted by 0.1 percent while it increased by 0.2 percent in Colorado and 1.6 percent nationwide. Just as proprietors’ income boosted personal income in Metro Denver during the recovery, a fall in proprietors’ income in 2016 contributed to a contraction.

METRO DENVER ECONOMY
Metro Denver Economic Development Corporation | January 2018 | Page 23
Metro Denver Economy
The composition of personal income is shifting in the Metro Denver region. Transfer receipts have comprised a larger share of personal income in the past five years than before the Great Recession. From 2001 to 2007, transfers ranged from 6.9 percent to 8.3 percent of personal income. From 2010 to 2016, transfers have ranged from 10.7 percent to 12.7 percent of income. In 2016, personal income was comprised of earnings of employees and proprietors less contributions for government social insurance (68.8 percent); dividends, interest, and rent income (20.4 percent), and transfer receipts (11 percent).
Earnings vary by age group. Workers age 45 to 64 years had the highest median weekly earnings in 2016 based on data from the U.S. Bureau of Labor Statistics. This demographic was followed by workers age 35 to 44 years. The lowest earning workers were age 25 to 34 years. The rank of earnings for each age group has shifted since 2000. In 2000, the highest earners were age 45 to 54 years and the lowest were workers 65 years and over. Since 2007, workers age 55 to 64 years generally had the highest median earnings. Since 2000, median earnings of workers age 65 years and over has grown the fastest, increasing at an annual rate of 4 percent. The slowest increase was for workers age 25 to 34 years whose median earnings increased about 2 percent each year.
Residential Real Estate
Home sales: 57,788 in 2017 (+2.9 percent); 56,921 in 2018(f) (‐1.5 percent).
The largest purchase that most consumers ever make is a home. Metro Denver home sales increased 2.9 percent in 2017 from 2016 home sales, and posted a new record high. The pace of sales increased from the 0.1 percent pace recorded from 2015 to 2016. Sales activity is expected to fall in 2018 after six consecutive years of increases, declining by an estimated 1.5 percent.
Net migration activity in Metro Denver remained strong but also declined from peak 2015 levels. Demand remained strong in 2017, but low inventory and affordability limited the growth in sales. Housing inventory fell to record low levels. In December 2017, the Denver Metro Association of Realtors (DMAR) recorded 3,854 active listings, the lowest number of any month since they started tracking housing data.
While current inventories are constrained, in 2017 residential construction permits reached the highest level since 2001. There were nearly 24,300 residential construction permits issued in Metro Denver in 2017, up 3.3 percent from 2016. While permit activity is expected to decline 0.5 percent in 2018 to about 24,140 units, new housing will help alleviate some of the low inventory and ease some price pressure.

METRO DENVER ECONOMY
Metro Denver Economic Development Corporation | January 2018 | Page 24
Metro Denver Economy
Home Prices
Home prices in Metro Denver rose each year from 2012 through 2016 as demand was strong and housing inventory fell to record lows. The median home price continued to rise through 2017 as low inventory and strong in‐migration continued to drive up prices. The Metro Denver median annual home price will appreciate an estimated 7.4 percent in 2017 to $412,700, compared with the national increase of 5 percent to $247,500.
According to the S&P CoreLogic Case‐Shiller index, as of November 2017, home prices in Denver increased year‐over‐year for 71 consecutive months or since January 2012. Denver recorded the ninth largest over‐the‐year increase of the 20 cities tracked by the index. Analysts for the index reported low mortgage rates combined with an improving economy are supporting home prices. However, analysts also noted that affordability measures indicate the pool of buyers is shrinking while higher short‐term interest rates over time will remove a key factor supporting prices.
Overall, slower net migration activity, lower affordability, and higher interest rates should temper home price growth in 2018. Home price growth is expected to slow to 5 percent, reaching a median price of $433,300 in Metro Denver. U.S. prices are also expected to increase at a 5 percent rate, with the median home price rising to $259,600.
Foreclosures
Foreclosures in Metro Denver were down 8.3 percent in 2016 compared with 2015 and declined an additional 7.9 percent in 2017. Foreclosures peaked at 26,520 in 2007, but fell to 2,960 in 2017. Metro Denver’s low unemployment rate, strong job market, rising home prices, and demand for housing have enabled many homeowners to maintain mortgage payments, restructure debt, and avoid foreclosure. According to experts, tight underwriting standards paired with improved economic and housing market fundamentals brought down new mortgage delinquencies nationwide. Analysts at CoreLogic stated in November 2017 that Denver had one of the lowest delinquency rates in the nation. Experts note that at a national level, there has been a downward foreclosure trend for banks and government‐backed loans while there has been an uptick in foreclosures completed by some nonbank entities. Foreclosures are expected to increase 1 percent in 2018 after eight consecutive years of declines, while remaining at a historically low rate.

METRO DENVER ECONOMY
Metro Denver Economic Development Corporation | January 2018 | Page 25
Metro Denver Economy
Employment & Unemployment
Note: Annual benchmark revisions to the employment and unemployment data series can significantly alter historic trends. As 2017 job data will be revised in March 2018, the exact revisions are not yet known. The following forecast is based on expected revisions to the data.
Employment: 1.65 million in 2017(e) (+2.1 percent); 1.68 million in 2018(f) (+1.9 percent).
Unemployment: 2.5 percent in 2017(e); 2.6 percent in 2018(f).
Over 62 percent of employment in Colorado is located in Metro Denver, resulting in the region having a large influence on statewide job levels. Employment in the City and County of Denver accounts for nearly one‐fifth of all Colorado employment (19.4 percent). The City and County of Denver also accounts for just under one‐third of the employment in the Metro Denver region (31.4 percent). Over one‐fifth of the region’s employment base is in Arapahoe County (20.4 percent) and nearly 15 percent is located in Jefferson County. The employment in the remaining four counties represents one‐third of the Metro Denver total (33.5 percent).
The pace of Metro Denver job gains slowed during 2017, finishing out the year with the addition of 33,300 jobs. Employment rose 2.1 percent from 2016 to 2017 and is expected to increase 1.9 percent between 2017 and 2018.
Results of the most recent Manpower Employment Outlook Survey for the Denver‐Aurora‐Lakewood MSA show a slightly lower employment outlook for the first quarter of 2018 compared with 2017. Hiring prospects fell 2 percentage points in the first quarter of 2018 compared with the prior year. The percent of companies planning to hire rose as high as 30 percent in the third quarter of 2017. Through most of 2017, Metro Denver reported stronger hiring prospects compared with the national average. However, the outlook fell somewhat in the fourth quarter as the percent hiring fell below the national level and the percent laying off rose to 9 percent. Metro Denver’s outlook improved in the first quarter of 2018 above the national average.
1Q 4Q 3Q 2Q 1Q
2018 2017 2017 2017 2017
% Hiring 23% 20% 30% 27% 25%% Laying Off 2% 9% 5% 2% 8%% No Change 71% 68% 64% 69% 64%% Unsure 4% 3% 1% 2% 3%
U.S.
% Hiring 21% 21% 24% 22% 19%% Laying Off 5% 6% 4% 3% 6%% No Change 71% 71% 70% 73% 73%% Unsure 3% 2% 2% 2% 2%
Metro Denver Employment Outlook SurveyDenver‐Aurora‐
Lakewood MSA
Source: Manpower Inc.

METRO DENVER ECONOMY
Metro Denver Economic Development Corporation | January 2018 | Page 26
Metro Denver Economy
Job growth in 2017 pushed down the unemployment rate in Metro Denver to 2.5 percent. The rate increased to 2.8 percent by November after falling as low as 2.1 percent in August. The unemployment rate in 2017 is the lowest since 2000 (2.6 percent). As the area continues to attract new companies, draw in talented workers, and promote entrepreneurship, Metro Denver will experience steady job growth and a lower unemployment rate than the U.S. and Colorado. Labor conditions are expected to remain tight in 2018, leading to wage growth. Indeed, as of the second quarter of 2017, average annual wages in Metro Denver rose by 6.7 percent through the first half of 2017 compared with the same period in 2016. If sustained, wage growth in 2017 will mark the fastest pace since 2006 (4.8 percent). The improved job market may entice people to reenter the labor force while companies try to match worker skill sets to job openings. The unemployment rate is expected to average a slightly higher 2.6 percent in 2018.
Trends in Labor Force Participation
While Colorado’s labor force participation rate recently rose above 68 percent in June 2017 for the first time in nearly three years, the state’s rate is well below the peak in 1998 of 75.4 percent. Since 1998, labor force participation has been on a downward trend, with a noticeable decline coincident with the Great Recession. The labor force participation rate troughed in 2016 at 66.3 percent. The trend in Colorado mirrors similar trends occurring nationwide, with policymakers and researchers noting the decline is a cause for concern. Recently, a high‐profile paper from Alan Krueger of Princeton University detailing the national trend was published by the Brookings Institution, entitled “Where Have All the Workers Gone? An Inquiry into the Decline of the U.S. Labor Force Participation Rate.” Among potential causes of the decline are the aging workforce, a peak in growth of the women’s labor force, higher educational enrollment for younger age groups, stagnant wages, and the opioid epidemic among prime working age men. The business cycle has been floated as a potential cause, but according to Krueger’s findings, there is little support for this hypothesis and many of the trends started well before the recession.
Based on Krueger’s analysis, at least half of the decline in labor force participation can be attributed to shifting demographics, largely a result of the aging population. As noted earlier in this report, baby boomers started entering retirement age just as the economy was emerging from the Great Recession. Interestingly, older workers are one of the only groups that have recorded an increase in labor force participation over the past decade. Based on data from the U.S. Bureau of Labor Statistics, the participation rate for people 55 years and over increased by more than 2 percentage points from January 2007 to July 2017. Yet, labor force participation for workers 55 years and over is only about 40 percent, compared with 82 percent for people ages 25 to 54 years. Krueger notes that the aging workforce may put downward pressure on the labor force participation rate for the next two decades.
Data indicate that the decades‐long increase in women’s labor force participation rates plateaued in the late 1990s. According to Krueger’s findings, the rate for women has actually declined slightly since 2007. Rather than this being a cyclical cause of the Great Recession, Krueger posits that the participation rate may have reached a threshold; barring policies that may encourage more participation such as family‐oriented policies and those that help with the health and wellness of disabled workers and those not in the labor force.

METRO DENVER ECONOMY
Metro Denver Economic Development Corporation | January 2018 | Page 27
Metro Denver Economy
One of the biggest causes for concern regarding declining labor force participation is the decline by prime working age men. There are likely multiple reasons for the decline, including stagnant wages of less skilled workers, an increase in disability, and the rise in prescription pain medications. Krueger does note that there has been a steady decline for several decades, and not just in the U.S. The decline has also been recorded for all education levels, although it has been much steeper for men with a high school degree or less. Notably, over the past decade, the probability of not participating in the labor force because of a disability is increasing. Interestingly, Krueger notes that the increase is not because of veterans, who are comprising a smaller share of nonparticipants. The increase in disability coincides with an increase in the use of pain medications. Krueger finds that 47 percent of prime working age men that were not in the labor force responded affirmatively that they had taken pain medication the previous day, two‐thirds of which was prescription pain medication. Further, Krueger’s analysis finds that labor force participation is lower in areas of the U.S. with high rates of opioid prescriptions. Overall, Krueger finds evidence that the increase in opioid prescriptions accounts for about 20 percent of the decline in labor force participation for prime working age men. Unfortunately, the opioid epidemic has also affected women, accounting for about 25 percent of their decline in participation.
While there are large demographic and cultural forces putting downward pressure on labor force participation rates, there is cause for optimism with the recent increase in Colorado. Strong real wage growth and plentiful job opportunities may encourage people to stay in the labor force. Colorado continues to attract young net migrants into the state and the state has a relatively young population. Additionally, according to Kaiser State Health Facts, Colorado ranks in the top 20 states for the lowest rate of prescription opioid overdose deaths, and was one of only 12 states with a decline in the death rate from the previous year.
Industry Overviews
Industry employment data is grouped according to North American Industry Classification System (NAICS) codes. This coding structure includes 20 detailed industry sectors that are combined to form 11 “supersectors.” This section describes business activity in Metro Denver according to these supersectors.
Metro Denver’s largest industry supersectors are professional and business services, wholesale and retail trade, and government. The three supersectors that added the most jobs in 2017 were professional and business services (+7,000 jobs), leisure and hospitality (+5,500), and natural resources and construction (+4,500 jobs). All of the 11 supersectors recorded employment growth between 2016 and 2017. The transportation, warehousing, and utilities supersector, other services supersector, and natural resources and construction supersector reported the fastest over‐the‐year employment growth.
Natural Resources & Construction
Employment: +4.4 percent in 2017(e); +3.0 percent in 2018(f).
Natural Resources & Mining: Metro Denver’s urban geography makes for a relatively small concentration of natural resources employment, just 1 percent of total industry employment. The region is home to corporate,

METRO DENVER ECONOMY
Metro Denver Economic Development Corporation | January 2018 | Page 28
Metro Denver Economy
regional, and satellite offices for several energy and mining companies. The majority of Metro Denver’s natural resources employment is concentrated in oil and gas extraction companies and support industries.
The average spot price for Colorado crude peaked in 2013, falling 58 percent by 2016, negatively affecting production and employment in the industry. The industry has rapidly improved productivity over the past few years, partly through new technologies and partly through locating optimal sites. Many Colorado operators have been able to resume some of their operations with the rebound in price to about $45 per barrel in 2017. There was an average of 32 active rigs in Colorado in 2017, up from 19 in 2016.
Metro Denver’s natural resources employment fell by 19 percent from the fourth quarter of 2014 to the fourth quarter of 2016, mirroring trends at the state and national levels. However, the price of U.S. oil is forecasted to increase in 2018, averaging about $56 per barrel according to the most recent EIA projections. Colorado prices will follow the national trend and 2018 will mark Colorado’s first production increase since 2015. Employment in Metro Denver’s oil and gas companies is expected to increase in 2018, albeit slower than total employment in Metro Denver.
Construction (Residential): In 2017, new home construction in Metro Denver remained at levels not posted since the early 2000s. In 2017, there were an estimated 24,266 new residential units in the area, increasing 3.3 percent from 2016 and the highest level since 2001 (27,794). In 2018, new residential units are forecasted to fall slightly to 24,144 units, a decrease of 0.5 percent.
Homebuilders are responding to strong population growth, low vacancy, strong rental rates, and some of the fastest growing home prices of the nation’s major metro areas. According to the S&P CoreLogic Case‐Shiller home price index, Denver’s home prices in October 2017 were 7.2 percent higher than the prior year’s level, recording the fifth largest over‐the‐year increase of the 20 cities tracked by the index. The median home price in the Denver‐Aurora‐Lakewood MSA rose 7.7 percent between the third quarters of 2016 and 2017, while the Boulder MSA recorded a 10.4 percent increase during the same period.
Many factors contributed to the strong demand in the residential housing market including an improved economy, growing employment, more confident consumers, in‐migration, and low mortgage interest rates. Net migration represented about 63 percent of total population growth in Metro Denver in 2017, with total net
METRO DENVER ECONOMY
Metro Denver Economic Development Corporation | January 2018 | Page 29
Metro Denver Economy
migration reaching about 31,925 people. Mortgage rates remained near historically low levels in 2017, averaging 4 percent, up about 0.34 percentage points from the 2016 rate. The Denver‐Aurora‐Lakewood MSA was among the metro areas where listings spent the shortest amount of time on the market. However, net migration is expected to slow in the next few years and long‐term interest rates will continue to move up slowly, easing demand‐side price pressures somewhat.
Single‐family detached units were estimated to comprise about 47 percent of total new units in 2017 and 51.5 percent in 2018. The number of permitted single‐family detached units increased by more than 6 percent between 2016 and 2017, and is expected to increase by about 10 percent in 2018. Single‐family attached units comprised about 1.4 percent of the new units in 2017. The number of new single‐family attached units decreased significantly in 2017, falling by nearly 34 percent, but are forecast to increase 10 percent in 2018.
Strong rental rates and low vacancy have supported investment in multi‐family construction. Average apartment rent in the metro area was $1,412 in the third quarter of 2017, an increase of 3.2 percent over‐the‐year and marking the 30th consecutive quarter of over‐the‐year growth. However, rent growth appears to be slowing as the third quarter also marked the lowest growth rate recorded since 2011. In the third quarter, Metro Denver recorded a vacancy rate of 5.4 percent. Vacancy rates have been stable over the past two years, fluctuating between 5 percent and 6.2 percent. Since 2010, the vacancy rate dipped as low as 3.9 percent in the third quarter of 2014. Multi‐family construction comprised about 52 percent of the new units built in 2017, significantly higher than the 35 plus‐year average of multi‐family units representing roughly one‐quarter of construction. The pace of multi‐family construction is projected to slow in 2018, decreasing about 10 percent and comprising about 47 percent of the new units.
The condominium market is also expected to improve with the recent passage of legislation that is expected to reduce insurance costs and costs associated with construction defects litigation that has dampened activity in the state. By the end of 2017, condominiums were included in key development announcements in several areas of Metro Denver including in Boulder and Stapleton. While many of the announcements were for new product, some were for conversions of apartment units into condominiums.
Construction (Commercial): Commercial construction activity in the office and industrial markets may be approaching a peak, while construction activity in the retail and flex markets in 2017 were close to long‐run averages. Developers have responded to strong growth in rents for commercial property in Metro Denver and the low vacancy rates of the past few years. There is still a large amount of space under construction in the office, industrial, and retail markets that will support construction employment through 2018.
Cycles in the office, industrial, and retail real estate markets may occur in different manners than employment growth patterns. To provide insight as
4Q 2017 4Q 2016OfficeVacancy Rate 9.8% 9.2%Average Lease Rate $26.24 $25.54New Construction (YTD, millions sq.ft.) 3.00 1.36IndustrialVacancy Rate 3.9% 3.1%Average Lease Rate $7.61 $7.47New Construction (YTD, millions sq.ft.) 5.32 4.51FlexVacancy Rate 5.7% 7.5%Average Lease Rate $12.27 $11.49New Construction (YTD, millions sq.ft.) 0.56 0.24RetailVacancy Rate 4.3% 4.4%Average Lease Rate $17.95 $16.68New Construction (YTD, millions sq.ft.) 1.46 1.19
Metro Denver Commercial Real Estate Fundamentals
Note: Vacancy and lease rates are for direct space only. All lease rates are per square foot; office lease rate is full service and all other lease rates are triple-net.
Source: CoStar Realty Information, Inc.
METRO DENVER ECONOMY
Metro Denver Economic Development Corporation | January 2018 | Page 30
Metro Denver Economy
to the position of the commercial real estate market, Dr. Glenn Mueller of Black Creek Group releases the quarterly Cycle Monitor report that analyzes 54 MSAs in the U.S. Mueller’s model analyzes occupancy movements, rental growth rates, and new construction data to place a specific market in one of four phases, consisting of recovery, expansion, hypersupply, and recession. According to the third quarter 2017 Market Cycle Monitor report, Denver’s office market was still in an expansionary phase, while industrial moved further into hypersupply, and retail markets moved to equilibrium.
Office
In 2016, vacancy for office space fell to lows not posted since 2001, capping seven years of declines since the Great Recession ended in 2009. This has been accompanied by rapid growth in lease rates. Average lease rates in the office market grew at an annualized rate of 5.6 percent between the fourth quarters of 2011 and 2016. Solid market fundamentals and overall strength in Metro Denver’s economy over the past few years led to a strong year of construction activity in the office market. In 2017, 3 million square feet of space was completed in 38 buildings, up from 1.36 million square feet in 2016. About 48 percent of the newly completed space was in the City and County of Denver, or about 1.44 million square feet. Some of the largest office buildings completed through 2017 included the 318,000‐square‐foot One Belleview Station building, the 300,000‐square‐foot Denver Health administration building, and the 299,700‐square‐foot Granite Place at Village Center building in Greenwood Village.
Mueller places Denver’s office market at the beginning of the expansionary phase, indicating that the market has shown declining vacancy, rapidly rising rents, and increasing construction levels. However, current data suggest that the office market may be in a more mature expansionary phase. The fourth quarter 2017 direct vacancy rate of 9.8 percent is higher than the same periods in 2015 and 2016. The average lease rate rose 2.7 percent over‐the‐year to $26.24 per square foot during the fourth quarter of 2017, which was slower than the 5.3 percent increase in 2016 and the 5.9 percent increase in 2015. Additionally, the amount of office construction completed in 2017 was the highest level since 2001, and higher than the long‐run average of 2.08 million square feet completed each year since 2000.
Looking ahead, new construction activity remains well above the level of completions from 2011 to 2016. There was about 5.1 million square feet of office space under construction during the fourth quarter of 2017. While the level of activity was down slightly from 5.9 million square feet under construction a year ago, it was nearly double the 3.18 million square feet posted in the fourth quarter of 2015. The City and County of Denver continues to attract the largest share of construction activity in Metro Denver with more than 70 percent of the space, including the first new office skyscraper in the central business district in three decades (the 670,000‐square‐foot 1144 Fifteenth Street building by Hines). Arapahoe County also has some large properties under construction with 634,000 square feet under construction in three buildings.
Industrial
In 2017, there was 5.32 million square feet of industrial space completed in Metro Denver, the highest amount recorded since the beginning of the data series in 1999. The market was boosted with the construction of large distribution and fulfillment centers as online retail continues to grow. So far, the market has absorbed most of the new space. The third quarter market report from CBRE for the Denver area noted that Metro Denver had 30 consecutive quarters of positive net absorption in the industrial market. However, vacancy rates have increased over the past two years from a low of 2.5 percent in the first quarter of 2016. Concurrently, growth in the average lease rate has slowed.
According to Mueller, Denver’s industrial market progressed in the hypersupply phase, indicating increasing vacancy, rent growth but at a slower pace, and continued new construction. The fourth quarter 2017 vacancy rate was 3.9 percent, 0.8 percentage points higher than the prior year. Notably, the direct vacancy rate has been

METRO DENVER ECONOMY
Metro Denver Economic Development Corporation | January 2018 | Page 31
Metro Denver Economy
below 4 percent since the fourth quarter of 2013. The average lease rate increased 1.9 percent over‐the‐year to $7.61 per square foot (NNN) during the fourth quarter of 2017, a slower pace than the 6 percent increase recorded at this time last year, and the 16.7 percent increase recorded in the fourth quarter of 2015. Rising vacancy and slower growth in lease rates reflects the large amount of new industrial space that was brought online in 2017. The level of completed space in 2017 was significantly higher than the long‐run average of 1.93 million square feet each year since 2000.
Looking ahead, construction activity will remain strong through 2018. As of the fourth quarter of 2017 there was 5.83 million square feet of space under construction. The vast majority of the space is under construction in Adams County, with about 4.6 million square feet or 79 percent of the activity in Metro Denver, including a 2.4 million‐square‐foot Amazon fulfillment center in Thornton. Notably, CBRE estimated that more than 67 percent of the space under construction was speculative as of the third quarter of 2017.
Retail
Construction activity in Metro Denver’s retail market continued at a healthy pace in 2017, adding 1.62 million square feet in over 100 buildings. The level of construction was close to the long‐term average of 1.57 million square feet per year since 2006. Meanwhile, vacancy rates in the retail market remained low and growth in the average lease rate accelerated. The market has been supported with continued population and housing growth in the Metro Denver region with strong investment in grocery store‐anchored shopping centers and restaurants. The retail market has been undergoing a shift as online retail becomes more popular and big box stores have closed. Despite the change, the vacancy rate continues to fall, declining by 0.1 percentage points over‐the‐year to 4.3 percent in the fourth quarter of 2017. The fourth quarter direct vacancy rate was the lowest level since 2003. Notably, the average lease rate increased by 7.6 percent over‐the‐year in the fourth quarter of 2017, the fastest rate of growth since before the Great Recession. The average lease rate was $17.95 per square foot (NNN) in the fourth quarter of 2017.
Mueller places Denver’s retail market at an equilibrium of supply and demand with the market close to peak occupancy and supply and demand growing at the same balanced rate. Denver’s retail market moved from an expansionary phase earlier in the year to an equilibrium phase by the third quarter. Looking ahead, construction activity is expected to continue at a similar pace in 2018. As of the fourth quarter, there was 1.46 million square feet of space under construction in 60 buildings. Notable projects included the Denver Premium Outlets in Thornton and the redevelopment of the 9th and Colorado area in Denver.
Construction (Infrastructure, Public/Nonprofit): Construction activity remains robust in many other sectors in Metro Denver. There were several major projects under construction in 2017 and many more slated to begin in 2018. In 2018, construction is scheduled to start on Denver International Airport’s (DEN) $650 million terminal renovation as well as the airport’s $1.5 billion concourse expansions. The Denver Art Museum announced a $150 million update to its welcome center, including expanded gallery space. The Butterfly Pavilion and the Center for Invertebrate Research and Conservation announced a new $33 million, 60,000‐square‐foot facility in Broomfield.
Notable higher education projects included a $40 million campus in Castle Rock for Arapahoe Community College. The 14‐acre campus is expected to be completed in 2019. The University of Colorado Boulder approved the construction of an $82.5 million, 139,000‐square‐foot aerospace engineering sciences building expected to be completed in 2019. The University of Denver broke ground on the new $14.5 million administrative building in 2017 with expected completion by April 2018.
Healthcare construction activity was down in 2017, falling by 58 percent from 2016 with the addition of just 561,900 square feet. More than 1.3 million square feet was added in 2016. However, 2.7 million square feet were under construction as of the fourth quarter of 2017. While 44 percent of the healthcare space under

METRO DENVER ECONOMY
Metro Denver Economic Development Corporation | January 2018 | Page 32
Metro Denver Economy
construction was the Veteran’s Affairs (VA) hospital in Aurora, construction continued on several senior living facilities across Metro Denver and the 410,000‐square‐foot UCHealth Campus in Douglas County.
Major transportation and infrastructure projects will also contribute to construction activity in 2018. Denver Water is planning a $420 million expansion project to enlarge Gross Reservoir in Boulder to help supply water to 1.4 million people in Metro Denver. The project is expected to begin in 2018 and will add 131 feet to the dam’s height. Major transportation projects included work on C‐470 express lanes, widening of I‐225, express lanes along I‐70 east of downtown, and ongoing improvements to I‐25. The Regional Transportation District (RTD) will continue work on FasTracks projects in 2018 including the G Line from Wheat Ridge to Denver that spans 11 miles and eight stations between Union Station and near Ward Road and I‐70. Other projects include the North Metro Rail Line with 7 stations over 13 miles from Union Station through Thornton and an extension of the Southeast Rail Line into Lone Tree.
Overall, the construction sector will continue to expand as new residential and nonresidential projects are brought into the pipeline, including high levels of office and industrial construction. Employment will be supported by continued activity in the other commercial sectors. Public, nonprofit, infrastructure, higher education, and healthcare spending will add to demand. Employment levels are expected to increase through 2018, but access to skilled labor will be difficult for construction companies and is expected to limit the pace of growth.
Manufacturing
Employment: +1.1 percent in 2017(e); +1.1 percent in 2018(f).
The manufacturing sector includes producers of nondurable goods—such as food and beverages, pharmaceuticals, and apparel—and durable goods including machinery, computers and electronics, and furniture. Metro Denver’s manufacturing sector expanded by about 1,000 workers in 2017.
The seven‐county Metro Denver region represents more than 60 percent of Colorado’s manufacturing employment. Metro Denver’s largest subsectors in terms of employment are computer and electronic products, food manufacturing, fabricated metal products, and miscellaneous manufacturing, a category that includes medical devices, among other things. In 2017, 13 of Metro Denver’s manufacturing subsectors recorded employment growth, while eight posted declines.
One of the subsectors with the strongest growth was chemical manufacturing, which was the second fastest growing subsector and increased by nearly 500 jobs, the highest level of absolute growth. The subsector has been bolstered by growth in marijuana‐related companies and a rebound in pharmaceuticals where there was some renewed venture capital investments and large company announcements. Additionally, Colorado continues to benefit from growth in microbreweries and distilleries that have contributed to the nearly 10 percent growth rate in the beverage and tobacco product manufacturing subsector, the third fastest growth rate of Metro Denver’s manufacturing subsectors. The sector may be boosted further as the TCJA legislation included the Craft Beverage Modernization and Tax Reform Act that reduced the federal excise tax by half to $3.50 per barrel on the first 60,000 barrels for domestic brewers producing less than 2 million barrels annually. The rate is cut by 11 percent, to $16 per barrel, on the first 6 million barrels for all other brewers and beer importers.
The performance of aerospace companies has a large influence on transportation equipment manufacturing activity in Metro Denver. Aerospace companies are also represented in the region’s computer and electronic products, fabricated metals, and machinery manufacturing subsectors. Aerospace employment continued to contract nationally in 2017. At a national level, aerospace has contracted at an annualized rate of 0.9 percent over the past five years. However, Metro Denver has benefited from the national consolidation and strengthened its position in the industry. From 2016 to 2017, Metro Denver’s aerospace employment increased

METRO DENVER ECONOMY
Metro Denver Economic Development Corporation | January 2018 | Page 33
Metro Denver Economy
5.5 percent. Concurrently, computer and electronic products manufacturing recorded 3.4 percent growth in 2017 and posted the second highest level of absolute employment growth in the manufacturing subsectors. Transportation equipment manufacturing employment grew by a slower one percent rate, but continued to add jobs despite challenges in the subsector.
Wholesale & Retail Trade
Employment: +1.0 percent in 2017(e); +1.0 percent in 2018(f).
About one‐third of Metro Denver’s trade employment is in wholesale and two‐thirds in retail. Retail trade is heavily tied to consumer spending, which represents nearly 70 percent of all economic activity. Consumer behavior has a large influence on how well the economy performs. Consumer confidence for the nation and the Mountain Region, which includes Colorado, rose to levels in 2017 not posted since 2000. In 2017, consumer confidence in the Mountain region averaged more than 25 percent higher than levels posted in 2016.
Retail sales have steadily increased in Metro Denver over the past five years, increasing at an annual rate of about 5.4 percent each year. However, despite the improvement in consumer confidence and sales, retail employment has been challenged, growing just 0.5 percent year‐to‐date through the first half of 2017 based on Quarterly Census of Employment and Wages (QCEW) data. Slow growth is attributed in large part to contractions in several retail subsectors. However, retail employers may also be affected by the tight labor market and are competing for workers with other sectors, some of which may offer better wages, benefits, and work schedules. Notably, employment in the leisure and hospitality sector has increased much faster than retail trade. Also, while the retail sector has faced increasing competition for sales with online retailers, it may also be competing for employees with the large expansion of distribution and fulfillment centers in the metro area. Retail relies on seasonal workers during the holiday season, but the growth of e‐commerce has significantly increased demand for seasonal workers in distribution centers.
Employment growth has varied for the retail subsectors. Based on QCEW data, miscellaneous store retailers were the fastest growing subsector year‐to‐date through the second quarter of 2017, increasing 2.7 percent compared with the same period in 2016. General merchandise stores were the second fastest growing subsector

METRO DENVER ECONOMY
Metro Denver Economic Development Corporation | January 2018 | Page 34
Metro Denver Economy
(2.5 percent) and also had the highest level of absolute employment growth year‐to‐date, increasing by nearly 700 employees. While food and beverage stores grew at a lower 1.3 percent rate year‐to‐date, they posted the second highest level of absolute growth, adding more than 400 employees. Several retail subsectors contracted in 2017. In the first half of 2017, electronics and appliance stores (‐0.1 percent), clothing and accessories (‐0.3 percent), gasoline stations (‐2.5 percent), sporting goods and hobby/book stores (‐5.2 percent), and furniture and home furnishings (‐14.6 percent) decreased compared with 2016. Losses in furniture and home furnishings in particular offset more than 40 percent of the gains in retail in 2017, as the subsector contracted by about 890 jobs.
Metro Denver retailers continue to struggle with a changing retail landscape as consumers shift away from brick‐and‐mortar retailers to more e‐commerce. The change has impacted big box stores, department stores, and many other segments of the market. However, commercial real estate professionals note that a bright spot for Metro Denver’s retail market has been neighborhood grocery stores and other neighborhood retail as housing and population expands in the area. Looking ahead, the retail trade sector will continue to change due to challenges posed by e‐commerce. However, the expanding economy and strong consumer should help to alleviate some of the large store closings and announcements that have characterized the past few years.
While wholesale comprises about one‐third of trade employment, in 2017 it accounted for about 60 percent of the employment growth in the supersector. Wholesale trade added about 1,320 jobs year‐to‐date compared with the same period in 2016.
As the economy continues on an expansionary path and income levels rise, consumer spending will remain strong through 2018. Wholesale and retail trade employment is expected to grow at a similar level to 2017.
Transportation, Warehousing, and Utilities
Employment: +5.9 percent in 2017(e); +4.5 percent in 2018(f).
The transportation, warehousing, and utilities supersector includes aviation, trucking, storage and warehouse facilities, taxis, rail transportation, and utilities companies. The transportation and warehousing sector is on pace for its strongest year of growth since 2013 while the utilities sector is expected to contract for the second consecutive year in 2017. Overall, the supersector recorded the fastest growth rate in the Metro Denver region in 2017, with growth in aviation and air transportation related jobs, and the continued expansion of the warehousing and storage sector. Warehousing and storage in particular has benefited from Amazon’s expansion and the growth of fulfillment and distribution centers related to e‐commerce. In 2018, the transportation, warehousing, and utilities supersector will continue to grow in large part from continued growth in these two sectors.
As the sixth‐busiest airport in the country, Denver International Airport set multiple records for passenger traffic in 2017, and is on target to top 60 million passengers for the year. Through October 2017, passenger traffic was 5.7 percent higher than the same period in 2016. Fueled by strong demand and increased carrier capacity, international passenger traffic has grown significantly over the past several years. Between 2015 and 2016, international passenger traffic increased 5.1 percent from nearly 2.2 million passengers to over 2.3 million passengers. International traffic was up another 11 percent year‐to‐date as of October 2017. DEN plans to add 39 gates to its concourses by 2021 as a result of increased passenger demand. Airlines at DEN have also been expanding employment. According to QCEW data, air transportation employment increased by nearly 1,000 jobs through the first half of 2017 compared with the same period in 2016. United Airlines completed its new pilot training facility in Stapleton, adding about 200 new jobs. Southwest Airlines continued to expand in DEN and grew its number of daily flights out of DEN to 209, exceeding 200 daily flights for the first time. The second‐

METRO DENVER ECONOMY
Metro Denver Economic Development Corporation | January 2018 | Page 35
Metro Denver Economy
largest carrier at DEN will increase the frequency of heavily travelled routes, and provide daily expansions of formerly weekend‐only routes.
The warehousing and storage subsector has consistently recorded higher than average employment growth over the past few years. Employment increased by 4.1 percent in 2015 and by another 5.5 percent in 2016. However, several companies have opened large distribution and fulfillment centers in the Metro Denver area in 2017 with plans to hire hundreds of workers including UPS, Amazon, and Walmart. The subsector increased by nearly 18 percent through the first half of 2017, adding about 770 jobs compared to the first half of 2016. The subsector is expected to continue its strong growth in 2018 as new space is completed and hiring activity ramps up.
Information
Employment: +0.5 percent in 2017(e); +1.2 percent in 2018(f).
With the advancement of technology and consumers turning to digital media from print media, the information sector contracted by nearly 36 percent since 2000, falling from about 84,200 jobs to 54,300 jobs in 2016. Most of the decline occurred from 2000 to 2010, followed by a slow recovery in the past few years. Information is increasingly available free online and through other electronic services. Without the need for traditional publishing jobs, producers of newspapers, periodicals, and books are struggling to stay afloat, resulting in job losses. Further, telecommunications, another major information subsector, has been challenged by changing market strategies and consumer preferences. As companies compete for market share, the telecommunications subsector has been characterized by high levels of mergers and acquisition activity. Based on QCEW data, the number of establishments in telecommunications fell by more than 10 percent in the first half of 2017 compared with the same period in 2016.
There are also positive trends in some of the information subsectors. The data processing, hosting, and related services sector added more than 1,000 jobs from the first half of 2016 to the first half of 2017 according to QCEW data. The subsector has benefited from announcements of large data center expansions, as well as from companies like Google, which has doubled its presence in Colorado over the past two years and opened its new $131 million campus in Boulder. The site could ultimately accommodate up to 1,500 employees. Software has benefited from robust entrepreneurial activity, an influx of venture capital, and company relocations. Software has a high concentration of employment in the Metro Denver region and a talented workforce. Both the data processing, hosting, and related services subsector and software industry have had a rapid expansion of business establishments over the past year. Based on QCEW data, the number of establishments increased by about 24 percent through the first half of 2017 compared to the same period in 2016.
The rapid growth in data processing and software offset declines in telecommunications and other publishing industries in the information supersector. Overall, information employment is expected to increase by 0.5 percent in 2017. As job losses in telecommunications slow, employment growth is expected to increase to 1.2 percent in 2018.
Financial Activities
Employment: +2.8 percent in 2017(e); +1.9 percent in 2018(f).
The financial activities supersector has a significant presence in Metro Denver as the region serves as the major financial center between Los Angeles and Chicago. The region’s locational assets and competitive environment attract several Forbes Global 2000, Fortune 500, and Inc. 500 Fastest Growing companies. The financial activities supersector expanded in 2017, near its average annual 2.9 percent rate from 2011 to 2016, and faster than all industry employment growth in Metro Denver. About 73 percent of total employment in the supersector is in the finance and insurance industries, and real estate, rental, and leasing activity makes up the remaining 27

METRO DENVER ECONOMY
Metro Denver Economic Development Corporation | January 2018 | Page 36
Metro Denver Economy
percent. Both the finance and insurance sector and real estate, rental, and leasing sector increased at a similar pace in 2017, with positive factors contributing to growth.
Since 2011, the fastest growing financial activities subsector was securities, commodity contracts, and investment. Based on QCEW data, employment in the subsector increased at an annualized rate of 7.4 percent from 2011 to 2016, well above the second fastest growing subsector, real estate, rental, and leasing (2.8 percent). Credit intermediation and related activities was one of the slowest growing financial activities subsectors and includes industries such as commercial banking, credit unions, credit card issuing, mortgage brokers, and financial transactions processing. The subsector grew at an annual rate of about 1.5 percent from 2011 to 2016. The subsector has been challenged by increased regulations, consolidation, and increased automation and online banking. One bright spot for employment has been the rapid expansion of credit unions. According to the University of Colorado Leeds School of Business’ Business Economic Outlook for 2018, Colorado credit unions are on pace for the fifth‐straight year of double‐digit growth in their loan portfolios. At a state level, credit union employment grew 3.7 percent from 2015 to 2016.
Looking ahead, employment growth is expected to slow to 1.9 percent in 2018 as population growth slows in the Metro Denver region and labor markets remain tight. A strong real estate market will continue to support growth in real estate, while the insurance industry and commercial banks have flat to declining employment.
Professional & Business Services
Employment: +2.4 percent in 2017(e); +2.3 percent in 2018(f).
Professional and business services is Metro Denver’s largest supersector by employment, and it contains a diverse group of companies. Some provide expert services including engineering, accounting, legal, and design while others act as consultants, staffing companies, and groundskeepers. Based on data for the Denver MSA, the share of employment in professional and business services is comprised of administrative and waste services (38 percent), management of companies (12 percent), and professional and technical services (50 percent).
The strong growth in professional and business services bodes well for overall economic growth. Many companies will outsource various business services prior to increasing their own staff. Therefore, growth in this supersector tends to precede and accompany overall employment growth. In 2017, the expected addition of 7,000 jobs in Metro Denver’s professional and business services supersector represented about 21 percent of the total employment increase. Metro Denver’s employment grew an estimated 2.4 percent in 2017 and is expected to continue to grow at a faster pace than all industry employment growth in Metro Denver, posting a rate of 2.3 percent in 2018.
Most of the professional and business services subsectors have grown at a faster rate than total employment in Metro Denver. Computer systems design and software engineering are major expanding components of the professional and technical services sector. The computer systems design and related services subsector in the Denver MSA increased at an annualized rate of 7.1 percent from 2011 to 2016 and remained one of the fastest growing in 2017. Metro Denver is a global hub of innovation and entrepreneurship, attracting technology and information companies, a talented IT workforce, and venture capital activity. Another one of the fastest growing subsectors in professional and business services has been the management, scientific, and technical services subsector, which also grew at a 7.1 percent annualized rate from 2011 to 2016 in the Denver MSA.
The slowest growing professional and business services subsectors have been administrative and support services, and waste management and remediation services. Both subsectors have grown slower than Metro Denver total employment, and growth contracted sharply in 2017. Administration and support services employment increased at an annualized rate of 3.2 percent from 2011 to 2016, but slowed to just 0.3 percent

METRO DENVER ECONOMY
Metro Denver Economic Development Corporation | January 2018 | Page 37
Metro Denver Economy
through the first half of 2017. Waste management and remediation services increased at an annualized rate of 1.6 percent from 2011 to 2016 and slowed to 0.5 percent year‐to‐date in 2017.
Education & Health Services
Employment: +0.5 percent in 2017(e); +3.0 percent in 2018(f).
The education and health services supersector reported significant growth through 2016, as it has each year since at least 1991. Since 2011, education and health services has accounted for about 16.7 percent of the employment growth in the Metro Denver region. In the Denver MSA, the supersector is comprised of private educational services (14 percent of employment) and healthcare and social assistance (86 percent of employment). The education and health services supersector has been one of Metro Denver’s fastest growing supersectors, recording employment growth of about 4.4 percent each year since 2011. Employment growth has been concentrated for the most part in healthcare services, while educational services have increased slightly slower than total employment in Metro Denver. In 2017, the education and health services sector grew just 0.4 percent as a result of a reclassification of thousands of social assistance jobs to the other services supersector.
Employment growth in healthcare has been influenced by increasing demand due to an older population and an increase in insured persons due to the Affordable Care Act (ACA). Since the implementation of the ACA, and along with the rapidly changing Colorado health insurance landscape, the insured rate in Colorado increased from 83 percent in 2006 to 93.5 percent in 2016. Profit margins for Metro Denver area hospitals have also improved significantly with implementation of the ACA. As reported by the Denver Business Journal, several local medical centers operated at margins above 40 percent. Hospitals have invested in new facilities, digital healthcare, and new equipment, helping to sustain growing employment in the sector. Healthcare services will continue on a strong growth path, fueling a projected 3 percent growth rate in 2018.
The recent passage of the TCJA will impact health insurance rates starting in 2019 with the effective repeal of the individual mandate. The legislation reduces the tax penalty from the higher of $695 or 2.5 percent of income, to $0. The individual mandate was set up as part of the ACA to avoid adverse selection problems in health insurance markets. Adverse selection occurs when only sicker people elect to have health insurance while healthier people avoid it. Premiums rise over time, which drives more people out of the market, resulting in unsustainable costs and potentially the collapse of the market. In November, the CBO released estimates of the effect of repeal of the individual mandate on insured rates and premiums. The CBO estimated that repeal would reduce the number of insured by 4 million in 2019, growing to 13 million in 2027. Concurrently, average premiums in the nongroup market would increase an estimated 10 percent each year relative to baseline projections. There is also fear that repeal will drive out more insurers from the individual market where 29 percent of enrollees on the federal exchange already have only one option. The Metro Denver region is well supplied with insurers but the region would likely have an uptick in the number of uninsured as well. In Colorado, the Denver Post reported that 126,000 people paid the penalty in 2015, as the fine was often less than the cost of insurance. Based on estimates, repeal will increase the uninsured in the state by an additional 235,200 people.
The largest share of private education services employment is in colleges and universities in Metro Denver, followed by private elementary and secondary schools. Growth in these industries has been slightly slower than total employment growth since 2011. Part of the slow growth may be due to the counter‐cyclical nature of enrollment in higher education. However, employment in technical and trade schools in Metro Denver declined about 44 percent since peaking in 2008 as the industry has had numerous legal and accreditation challenges. The bright spot in educational services has been rapid growth in other schools and instruction.

METRO DENVER ECONOMY
Metro Denver Economic Development Corporation | January 2018 | Page 38
Metro Denver Economy
Leisure & Hospitality
Employment: +3.0 percent in 2017(e); +2.3 percent in 2018(f).
The leisure and hospitality supersector includes two sectors. The arts, entertainment, and recreation sector includes resorts and ski areas, museums, and other cultural and sports facilities. The other sector, accommodation and food services, includes hotels, restaurants, caterers, and other related businesses. Based on QCEW data, the arts, entertainment, and recreation sector comprises about 14 percent of the supersector employment, accommodation comprises about 9 percent of employment, and food services and drinking places about 77 percent. Growth in the supersector over the past five years has been mainly from arts, entertainment, and recreation that increased at an annualized rate of 4.1 percent from 2011 to 2016, and from robust growth in employment in food services and drinking places that increased 4.5 percent each year over the same period. Food services and drinking places accounted for more than 81 percent of the absolute employment growth in the supersector, adding about 26,800 employees from 2011 to 2016. Employment growth in the supersector slowed from the 3.9 percent rate of growth posted in 2016, to 3 percent in 2017. Growth is expected to slow further in 2018 to 2.3 percent, but still outpace total employment growth in Metro Denver.
Colorado’s world‐class ski resorts attract visitors from around the country and contribute significantly to the state’s leisure and hospitality supersector. Skier visits were down slightly in the 2016 to 2017 winter season from the record set in the 2015 to 2016 season. However, Colorado remains a top destination for skiers, capturing 22.9 percent of total U.S. resort skier visits according to the University of Colorado’s 2018 Business Economic Outlook, and the state had seven of the country’s 10 most visited resorts. The industry has benefited from strong season pass sales and lodging. Metro Denver also benefits from the headquarters operations of Vail Resorts and Alterra Mountain Company, the parent company of Steamboat Springs and Winter Park.
Hotel construction in the Metro Denver area fell after a boom in construction activity in 2016. The Denver Business Journal reported that the Denver area had 4,091 hotel rooms under construction in September 2017, down 8 percent from 4,470 under construction in September 2016. However, construction activity remains higher than the 1,787 rooms under construction in the fall of 2015. Occupancy rates remained stable despite the robust amount of construction activity. The hotel occupancy in Metro Denver averaged 74.9 percent in 2017 compared with 75 percent in 2016. However, the average daily room rate increased just 2.3 percent to $143.68, slower than the 5.1 percent increase recorded for 2016. Accommodations has been the slowest growing subsector in leisure and hospitality with employment growing about 2.2 percent each year from 2011 to 2016. Employment growth rose to 2.4 percent through the first half of 2017 compared to the same period in 2016, slightly faster than total employment growth in Metro Denver.
Employment growth in food and drinking services slowed considerably in 2017 from its average over the past five years. Year‐to‐date in the second quarter of 2017, employment increased 2.2 percent based on QCEW data, down from 4 percent in 2016. There is ongoing concern in the subsector about the impact of minimum wages. Colorado voters approved an amendment that will increase the minimum wage 90 cents an hour each year until it reaches $12 an hour in 2020. The state’s tipped minimum wage will rise to $8.98 by 2020. Additionally, the tight labor market has affected employment growth, driving up wages and increasing turnover as employers compete over available workers. Profit margins remain thin for the industry and some experts predict the market may be saturated with restaurants. In 2018, employment growth is expected to slow further.

METRO DENVER ECONOMY
Metro Denver Economic Development Corporation | January 2018 | Page 39
Metro Denver Economy
Other Services
Employment: +5.6 percent in 2017(e); +1.6 percent in 2018(f).
The other services sector is a diverse group of repair and maintenance businesses, beauty salons, grant making organizations, and a variety of other companies. These businesses largely rely on discretionary spending, which has improved with rising consumer confidence and a more favorable job market.
The demand for repair and maintenance on automotive, commercial machinery, electronic equipment, and household goods may be declining as consumers purchase new models of goods that do not require as much maintenance as older models. Since 2011, employment growth in the subsector has increased at a slower rate than total employment, an estimated 2.9 percent each year compared with 3.3 percent, respectively. Growth slowed even further in 2017 to about 1 percent. Another subsector that has been challenged is religious, grant making, civic, and other organizations. While the sector had a boost in employment in 2016 from election activity, increasing 3.7 percent from 2015 to 2016, the subsector has grown at an annualized rate of only 1.8 percent since 2011. There is concern in the subsector that the newly passed TCJA may impact charitable giving moving forward, as the act doubles the standard deduction and reduces the incentive to itemize deductions for many filers. Some estimates project that the rate of itemizers will fall from about one‐third of filers to about 10 percent. As a result, there is concern that without the incentive of a tax deduction, many people may reduce their amount of charitable donations.
A bright spot in the supersector is increased demand for other personal services such as hair and skin care. The personal and laundry services subsector has been the fastest growing subsector in other services and has accounted for more than 50 percent of absolute employment growth in the subsector from 2011 to 2016. These services have benefited from the aging population that provides a larger customer base for these services.
Based on a reclassification of several thousand employees into other services from health services in 2017, employment in the other services supersector increased by 5.6 percent. However, growth in 2018 is expected to slow in 2018, increasing by 1.6 percent.
Government
Employment: +0.8 percent in 2017(e); +0.4 percent in 2018(f).
The government is Metro Denver’s third‐largest supersector by employment, representing 14.3 percent of total nonfarm employment. This sector is comprised of federal (13.3 percent), state (26 percent), and local workers (60.7 percent) and includes a variety of services ranging from public safety and community development to national security and public education. Sustained economic growth and increases in tax collections supported 0.8 percent employment growth in Metro Denver’s government supersector in 2017. Employment growth will continue in 2018, but at a slower 0.4 percent pace.
Metro Denver has a strong concentration of federal government employment located in federal field offices, national laboratories, and military installations. After two years of job gains, federal employment declined slightly in Metro Denver in 2017. Cuts to discretionary spending have slowed employment growth as well as a Trump administration announcement of a hiring freeze. Based on these factors, federal employment is expected to remain constant in 2018.
Since the Great Recession, the state government has reported employment growth supported by strong revenue collections throughout Colorado. The state benefited in 2017 from legislation creating the Colorado Healthcare Affordability and Sustainability enterprise in the state budget. The bill changes the way fees collected from hospitals to help provide uncompensated care and services to uninsured patients counted toward limits imposed by the Taxpayers Bill of Rights (TABOR). The legislation gives the state more flexibility in meeting

METRO DENVER ECONOMY
Metro Denver Economic Development Corporation | January 2018 | Page 40
Metro Denver Economy
TABOR limits and more resources for other programs. State government reported strong employment growth in both general state government and higher education in 2017. State employment grew by 3.4 percent in 2017, a similar pace to 2015 (3.5 percent) and 2016 (3.3 percent). Part of the state’s rapid pace of growth has been from the UCHealth system as UCHealth’s mergers have resulted in a reclassification of employees from private health services to state government.
State tax revenues may increase by an additional $196 to $340 million due to changes from the TCJA, according to reporting in the Denver Post. The TCJA broadens the state income tax base through eliminating or capping deductions, increasing taxable income for a portion of Colorado filers, likely those with larger families or higher incomes. While the dip in tax rates is expected to result in a net tax cut for many at the federal level, Colorado’s income tax rate remains unchanged. The increased revenue has raised hopes of state lawmakers to use the money for increased transportation funding, increased education spending, or the state’s child health insurance program, depending on TABOR restrictions and legislative action. Looking ahead, the employment outlook for state government employment in Metro Denver is positive and will increase by an estimated 0.7 percent in 2018.
Metro Denver’s local government employment includes cities, counties, school districts, and special districts. Public education represents about 54 percent of total local government employment. These districts depend heavily on property taxes, sales and use taxes, fees, and intergovernmental revenue sources. The pace of local government hiring slowed in 2017 for the second consecutive year after peaking at 2.7 percent in 2015. Local government is expected to remain constant in 2017 and to record a slight increase of 0.3 percent in 2018. In the coming year, local governments in the Metro Denver region may face some revenue challenges. In particular, the residential assessment rate was reduced from 7.96 percent to 7.2 percent in 2017. The lower assessment rate will limit revenue growth from property taxes, affecting schools and many types of local government and special districts. The districts likely to be most affected are those where growth in property values has been more limited.
Industry Clusters
The prior section described Metro Denver’s employment base according to the federally defined NAICS codes, resulting in 11 supersectors. This section summarizes the nine industry clusters that form the basis of the region’s economic development strategy and are of critical importance to Metro Denver’s national recruitment and business retention and expansion efforts. Industry clusters are geographic concentrations of interconnected companies and institutions in a particular field, bringing companies together across the supersectors. Data in this section is for the nine‐county Metro Denver and Northern Colorado regions, which includes the seven Metro Denver counties plus Larimer and Weld counties (Norther Colorado). Detailed information on each industry cluster may be found at www.metrodenver.org/industries/overview/.
Aerospace: Colorado is an aerospace leader and a premier location for companies conducting aerospace‐related activities. Colorado’s aerospace cluster is anchored by four military commands, eight major space

METRO DENVER ECONOMY
Metro Denver Economic Development Corporation | January 2018 | Page 41
Metro Denver Economy
contractors, National Aeronautics and Space Administration research activities, and universities that are among the world’s best for aerospace engineering. The nine‐county Metro Denver and Northern Colorado region ranks first among the nation’s 50 largest metro areas for aerospace employment concentration and direct aerospace employment. The majority of Colorado’s key aerospace businesses, facilities, and research institutions are located in the nine‐county Metro Denver and Northern Colorado region. The region’s 21,090, private‐sector aerospace workers represent 79.2 percent of all aerospace workers in Colorado. The region’s 130 aerospace companies represent 73.3 percent of the state’s total companies in the cluster. The outlook for employment in the cluster remains strong with key company announcements including a new $350 million facility for Lockheed Martin Space System Co., a new Lockheed Martin contract to expand work on submarine‐launched missiles, a Sierra Nevada Corp. expansion over the next 18 months, and an expansion of Ball Corp. in Westminster.
Aviation: The region’s commercial, reliever, and general aviation airports are major economic catalysts, providing residents and businesses connectivity to worldwide markets and destinations. DEN generates more than $26 billion for the region annually and serves as one of the busiest airline hubs in the world. DEN is the nation’s sixth‐busiest airport and 18th‐busiest worldwide, serving 60 million passengers in 2017. DEN provides nonstop service to nearly 190 destinations worldwide, including 25 international destinations in 11 countries. Between 2012 and 2017, aviation employment rose 23.1 percent, compared with 4.1 percent nationally. Employment in the aviation cluster in the region rose 5.7 percent from 2016 to 2017, compared with a 0.1 percent increase nationwide, making aviation the fastest‐growing cluster in 2017. Employment in the region’s aviation cluster grew for the sixth‐consecutive year in 2017, rising to 20,140 employees.
Beverage Production: Companies in the beverage production cluster manufacture malt beverages, wines, distilled liquors, bottled drinks, and ice products. The MillerCoors Brewery is synonymous with Colorado and was founded in Golden in 1873. Fort Collins is home to Anheuser‐Busch InBev which opened a brewery in 1988 and runs distribution companies in Colorado. Celestial Seasonings in Boulder is one of the world’s largest herbal‐tea manufacturers and DanoneWave is a leading plant‐based beverage company in North America. Additionally, major beverage distributors located in the region include Pepsi‐Cola, Coca‐Cola, and 7‐Up Bottling Co. Coca‐Cola has invested $50 million along the Front Range since expanding to the area in 2014. The region is a leader in the craft beer revolution. Colorado craft beer has grown to a $3 billion industry, nearly tripling its economic impact since 2014 and has the highest economic impact per capita of any state. The beverage production cluster posted 4.7 percent employment growth between 2016 and 2017, rising for the eighth‐consecutive year. The region ranks as having the second‐highest employment concentration out of the 50 largest metropolitan areas in 2017. The beverage production cluster employs 9,790 workers in the nine‐county region at nearly 240 companies.
Bioscience: The region’s base of medical devices, diagnostics, biotechnology, and pharmaceuticals businesses employ about 16,100 workers. The vibrant and growing bioscience hub includes research institutions, life science expertise, numerous innovation assets, and 730 bioscience companies, as well as opportunities to bring together academic, research, and bioscience companies at the 578‐acre Fitzsimons Innovation Campus and the adjacent Anschutz Medical Campus in Aurora. The medical devices and diagnostics subcluster represents roughly 70 percent of the total bioscience employment base in the region, while pharmaceuticals and biotechnology represents 30 percent. In 2017, the pharmaceuticals and biotechnology subcluster grew 4.4 percent, contributing 68 percent of the total bioscience employment increase over‐the‐year. The medical devices and diagnostics subcluster posted 0.9 percent growth in the region and grew for the seventh‐consecutive year in 2017.
Broadcasting & Telecommunications: The broadcasting and telecommunications cluster includes companies that deliver voice, data, and video to end users. It includes landline and wireless telephone communications

METRO DENVER ECONOMY
Metro Denver Economic Development Corporation | January 2018 | Page 42
Metro Denver Economy
companies, radio and television communications companies, and cable and Internet service providers. Metro Denver is the largest region in the United States to offer one‐bounce satellite uplinks to six of seven continents in the same business day due to its unique geographic location in the Mountain time zone. The region ranks as having the fifth‐highest employment concentration out of the 50 largest metropolitan areas in 2017. It is the ninth‐largest broadcasting and telecommunications employment center in the nation, with more than 42,430 workers at nearly 2,750 companies. While the cluster has been challenged nationwide, employment in the nine‐county Metro Denver and Northern Colorado region rose 0.8 percent in 2017. Nationally, employment declined by 3.8 percent. Major 2017 company expansions included AT&T, Comcast, Charter Communications, and Google.
Energy: Colorado’s balanced energy economy is attributable to a wealth of fossil fuels and renewable energy resources. The state’s first renewable energy standard was approved by voters in 2004, and it has been updated three times. Currently, the state’s investor‐owned utilities must generate 30 percent of their power from renewables by 2020. As a result, significant renewable energy projects have come online in the last several years. The nine‐county region is a world‐class hub for energy research and technology innovation at universities, energy incubators, and federal facilities. In fact, the region is home to one of the highest concentrations of federal funded science and research centers in the nation. The National Renewable Energy Laboratory in Golden, the Department of Energy’s only laboratory committed to the research, development, commercialization, and deployment of renewable energy and energy efficiency, is a vital asset to the energy industry. Metro Denver and Norther Colorado is an energy powerhouse with both fossil fuels and cleantech together employing 51,280 people at 3,480 companies. In 2017, fossil fuels employment was still affected by the slump in oil prices and contracted 0.2 percent from 2016 to 2017. Cleantech employment growth also slowed in 2017, increasing by 1 percent. However, the subcluster has grown at an annualized rate of 3.8 percent from 2012 to 2017 and had the sixth‐most employees of the 50 largest metro areas in the nation.
Financial Services: Metro Denver and Northern Colorado’s central location and reputation as a global commercial gateway gives financial services companies a competitive edge. Metro Denver is the largest financial center between Los Angeles and Chicago. It is home to a branch of the Federal Reserve Bank and the location of one of only six U.S. Mints. The region is one of the few areas outside of the northeast with a substantial financial services industry in three subclusters: (1) banking and finance, (2) investments, and (3) insurance. With about 101,560 employees in nearly 14,770 companies, financial services is a large part of the employee base in the nine‐county region. Over the past five years, financial services employment grew 10.7 percent, compared with 7.5 percent nationally. Employment rose for the third‐consecutive year in 2017, increasing 3 percent and adding over 2,950 employees.
Healthcare & Wellness: The healthcare and wellness cluster includes a dynamic and growing group of companies that provide preventive, curative, and rehabilitative services offered by healthcare providers, medical and specialty hospitals, kidney dialysis centers, nutrition and weight loss facilities, fitness centers, medical spas and massage facilities, public health and education, and other healthcare and wellness organizations. Colorado and the nine‐county region are also leaders in the natural and organic products industry. The healthcare and wellness workforce continues to drive the region’s employment growth. Employment has increased every year since 2004, adding over 88,420 workers between 2004 and 2017. Over the past five years, employment in the region grew 24.1 percent, which was nearly double the U.S. growth rate of 10.7 percent. Between 2012 and 2017, the cluster accounted for 10 percent of the region’s total job growth. With an employment base of 222,700 workers in 21,160 companies, the healthcare and wellness cluster is the region’s largest cluster in terms of employment. Demand for healthcare and wellness services is expected to increase due to a growing and aging population, a higher prevalence of chronic conditions, and changes in residents’ behavior and lifestyle choices.

METRO DENVER ECONOMY
Metro Denver Economic Development Corporation | January 2018 | Page 43
Metro Denver Economy
Information Technology ‐ Software: The nine‐county Metro Denver and Northern Colorado region is the premier information technology (IT) hub between the coasts. The cluster includes companies involved in software, hardware, and telecommunications. The IT‐software industry is a significant economic driver. Tech‐related exports total about $100 million in the state and are among the state’s largest exports. The software industry also attracts significant capital and investments. In fact, the first half of 2017 represented the highest level of IT‐software venture capital funding in the state since the first half of 2005. IT‐software posted 5.3 percent employment growth between 2016 and 2017, rising for the seventh‐consecutive year. The region has the eighth‐highest employment concentration in IT‐software in the nation. Denver and Boulder counties represented 45 percent of the region’s total IT‐software employment. In 2017, IT‐software employed 58,190 workers in 5,550 companies.
Metro Denver Economy Summary
Metro Denver recorded a strong year of growth in 2017 with rising employment levels and falling unemployment rates. However, the pace of growth is slowing as population growth slows and tight labor markets limit employment growth. Metro Denver’s population growth averaged 1.7 percent per year between 2007 and 2017, but slowed to 1.5 percent in 2016. Population growth is expected to increase at a 1.6 percent rate in 2017 and 2018. While Metro Denver’s population has generally increased at a faster pace than the state, the region’s growth rate was slower than the state in 2016 and 2017. Net migration levels in Metro Denver remain strong, but have declined from peak 2015 levels.
Job growth in 2017 pushed down the unemployment rate in Metro Denver to 2.5 percent, the lowest level recorded since 2000 (2.6 percent). The rate fell as low as 2.1 percent in August, but increased to 2.8 percent in November. The pace of Metro Denver job gains slowed during 2017, finishing out the year with 2.1 percent growth and the addition of 33,300 jobs. The improved job market may entice young workers to join the labor force and other people to reenter it. In 2017, Colorado’s labor force participation rate rose above 68 percent for the first time in nearly three years.
All of Metro Denver’s 11 supersectors recorded employment growth between 2016 and 2017. Additionally, Metro Denver’s key industry clusters recorded robust and broad‐based growth over the past year. The three supersectors that added the most jobs in 2017 were professional and business services, leisure and hospitality, and natural resources and construction. The fastest growing supersectors were the transportation, warehousing, and utilities supersector, the other services supersector, and the natural resources and construction supersector. Growth in transportation, warehousing, and utilities was particularly strong as airlines at Denver International Airport recorded strong employment growth and several companies have opened large distribution and fulfillment centers in response to demand for e‐commerce. Another notable growth sector was computer systems design and software engineering that represented one of the strongest areas of growth in professional and business services.
The residential real estate market continued at a strong pace in 2017. Metro Denver home sales increased 2.9 percent in 2017 from 2016 home sales, and posted a new record high. In addition, the median home price continued to rise through 2017 as low inventory and population growth drove up prices. According to the S&P CoreLogic Case‐Shiller Index, home prices in Metro Denver have increased year‐over‐year for 71 consecutive months. Meanwhile, commercial construction activity in the office and industrial markets may be approaching a peak. Developers have responded to strong growth in rents for commercial property and low vacancy rates typical of the past few years. According to a measure of market cycles, Denver’s office market was still in an expansionary phase, while industrial moved further into hypersupply. The retail market appears to be at an equilibrium level. In 2017, construction in the retail sector was close to its long‐run average.

METRO DENVER ECONOMY
Metro Denver Economic Development Corporation | January 2018 | Page 44
Metro Denver Economy
Looking ahead, employment will increase 1.9 percent in 2018 with gains in all 11 supersectors. Once again, the transportation, warehousing, and utilities supersector will record the fastest pace of growth, followed by the natural resources and construction supersector and the education and health services supersector. The unemployment rate is expected to move up slightly to 2.6 percent in 2018 and remain near historic lows. Home sales activity is expected to fall in 2018 after six consecutive years of increases, declining by an estimated 1.5 percent. Overall, slower net migration activity, lower affordability, and higher interest rates should temper home price growth in 2018. Home price growth is expected to slow to 5 percent, similar to a national rate. The pace of construction activity will remain strong in 2018 as several million square feet of office and industrial space will continue to bolster the market. Additionally, large scale infrastructure projects and other public/nonprofit investment activity will continue at a robust pace. The Metro Denver region’s eighth consecutive year of expansion will provide diverse employment opportunities and increasing housing options for its 3.2 million residents.

DATA APPENDIX
Metro Denver Economic Development Corporation | January 2018 | Page 45
Data Appendix
2008 2009 2010 2011 2012 2013 2014 2015 2016 2017 (e) 2018 (f)
NATIONAL INDICATORS
Population (Thousands) 304,094 306,772 309,338 311,644 313,993 316,235 318,623 321,040 323,406 325,719 328,049
Real GDP (Bil lions) $14,830.4 $14,418.7 $14,783.8 $15,020.6 $15,354.6 $15,612.2 $16,013.3 $16,471.5 $16,716.2 $17,092.7 $17,520.1
Real GDP Growth Rate ‐0.3% ‐2.8% 2.5% 1.6% 2.2% 1.7% 2.6% 2.9% 1.5% 2.3% 2.5%
Employment Growth Rate ‐0.5% ‐4.3% ‐0.7% 1.2% 1.7% 1.6% 1.9% 2.1% 1.7% 1.5% 1.2%
Unemployment Rate 5.8% 9.3% 9.6% 8.9% 8.1% 7.4% 6.2% 5.3% 4.9% 4.4% 4.3%
Inflation Rate 3.8% ‐0.4% 1.6% 3.2% 2.1% 1.5% 1.6% 0.1% 1.3% 2.1% 2.0%
Personal Income Growth Rate 4.2% ‐3.3% 3.2% 6.2% 5.0% 1.1% 5.3% 5.0% 2.4% 3.1% 4.2%
Prime Rate 5.1% 3.3% 3.3% 3.3% 3.3% 3.3% 3.3% 3.3% 3.5% 4.1% 4.9%
COLORADO INDICATORS
Population (Thousands) 4,901.9 4,976.9 5,049.9 5,119.5 5,191.1 5,268.4 5,350.1 5,448.1 5,538.2 5,631.0 5,722.6
Net Migration 40,469 36,267 37,172 35,697 39,578 46,216 49,998 67,811 60,068 62,503 60,626
Employment Growth Rate 0.8% ‐4.5% ‐1.0% 1.6% 2.4% 3.0% 3.5% 3.1% 2.2% 2.2% 1.9%
Unemployment Rate 4.8% 7.3% 8.7% 8.4% 7.9% 6.8% 5.0% 3.9% 3.3% 2.6% 2.7%
Denver‐Boulder‐Greeley Inflation Rate 3.9% ‐0.6% 1.9% 3.7% 1.9% 2.8% 2.8% 1.2% 2.8% 3.4% 3.2%
Personal Income Growth Rate 3.4% ‐5.0% 1.8% 9.1% 6.4% 5.4% 8.3% 5.8% 1.9% 4.1% 5.0%
Retail Trade Sales Growth Rate ‐0.6% ‐11.3% 5.5% 8.1% 5.9% 5.0% 7.4% 4.9% 3.8% 4.9% 4.7%
Housing Permits Growth Rate ‐35.5% ‐50.8% 23.9% 16.5% 72.6% 18.1% 4.3% 11.1% 22.3% 9.0% 1.9%
METRO DENVER INDICATORS
Population (Thousands) 2,716.8 2,762.2 2,797.9 2,847.5 2,898.6 2,952.8 3,008.7 3,069.7 3,116.5 3,167.0 3,216.2
Net Migration 22,326 21,639 13,863 28,834 31,645 34,850 36,214 42,179 28,186 31,925 30,204
Employment Growth Rate 1.0% ‐4.3% ‐0.5% 1.8% 2.9% 3.6% 3.7% 3.6% 2.5% 2.1% 1.9%
Non‐Agricultural Employment (Thousands)
TOTAL 1,420.7 1,359.5 1,353.1 1,378.0 1,417.6 1,468.2 1,522.6 1,577.9 1,618.0 1,651.3 1,682.7
Natural Resources & Construction 97.3 81.4 74.1 73.7 77.5 85.0 95.3 100.1 102.2 106.7 109.9
Manufacturing 87.4 78.5 76.4 78.1 79.8 81.1 82.9 85.6 86.5 87.4 88.4
Wholesale & Retail Trade 215.9 203.5 202.3 205.4 209.9 215.4 221.6 228.2 232.5 234.8 237.2
Transp., Warehousing & Util ities 52.4 49.1 47.3 47.0 48.3 50.7 52.6 54.1 55.6 58.8 61.5
Information 56.2 53.7 52.5 52.5 52.0 52.8 53.5 54.0 54.3 54.5 55.2
Financial Activities 104.9 100.2 98.0 97.8 99.8 103.4 105.3 109.5 112.8 116.0 118.2
Professional & Business Services 247.7 232.3 232.7 241.8 254.1 265.1 275.5 285.3 291.7 298.7 305.6
Educational & Health Services 153.3 157.9 162.6 168.5 174.7 182.0 190.7 200.8 208.5 209.6 215.9
Leisure & Hospitality 147.7 142.7 144.5 149.2 154.3 160.4 167.4 175.2 181.9 187.4 191.7
Other Services 53.7 52.7 52.7 53.6 55.1 56.3 58.2 59.5 61.3 64.7 65.7
Government 204.5 207.5 210.1 210.4 212.2 216.1 219.6 225.7 230.7 232.6 233.5
Unemployment Rate 4.9% 7.3% 8.5% 8.1% 7.6% 6.5% 4.7% 3.7% 3.6% 2.5% 2.6%
Retail Trade Sales Growth Rate ‐0.8% ‐11.3% 5.2% 6.8% 7.3% 5.2% 8.0% 5.5% 5.0% 5.4% 5.5%
New Residential Units 9,557 4,288 5,554 7,199 14,925 16,940 16,910 19,269 23,496 24,266 24,144
CURRENT AND HISTORIC ECONOMIC INDICATORS
Sources: Board of Governors of the Federal Reserve System; Colorado Department of Labor & Employment, Labor Market Information; Colorado Department of Revenue; Colorado Division of Local Government;
U.S. Bureau of Labor Statistics; U.S. Bureau of Economic Analysis; U.S. Census Bureau.

REFERENCES
Metro Denver Economic Development Corporation | January 2018 | Page 46
References
Apartment Association of Metro Denver. Denver Metro Apartment Vacancy & Rent Survey. Bachman, Daniel and Majumdar, Rumki. “United States Economic Forecast, 3rd Quarter 2017.” Deloitte
University Press. September 13, 2017. www2.deloitte.com BizWest. Various articles. www.bizwest.com Bloomberg. “Three Colorado cities are in the Brain Concentration Index’s top 10.” October 10, 2017. www.bloomberg.com CBRE. 2018 U.S. Market Outlook. www.crbe.us Clean Edge Inc. “2017 U.S. Clean Tech Leadership Index.” May 2017. www.cleanedge.com CNBC. “America’s Top States for Business 2017.” July 12, 2017. www.cnbc.com Colorado Department of Labor and Employment, Labor Market Information. www.colmigateway.com Colorado Department of Local Affairs, Division of Housing. www.colorado.gov Colorado Department of Revenue. www.colorado.gov Colorado Department of Transportation. www.colorado.gov Colorado Division of Local Government, State Demography Office. www.colorado.gov Colorado Hotel and Lodging Association. “Rocky Mountain Lodging Report.” www.coloradolodging.com Colorado Legislative Council. Focus Colorado: Economic and Revenue Forecast. December 20, 2017.
www.colorado.gov CompTIA. Cyberstates 2017: The Definitive State‐by‐State Analysis of the U.S. High‐Technology Industry.
March 2017. www.comptia.org The Conference Board. www.conference‐board.org Congressional Budget Office. www.cbo.gov CoreLogic. “CoreLogic reports mortgage delinquency rates lowest in more than a decade.” November 14, 2017. www.corelogic.com CoStar Realty Information, Inc. www.costar.com Denver Business Journal. Various articles. www.denverbusinessjournal.com Denver International Airport. Finance and Administration Department. www.flydenver.com

REFERENCES
Metro Denver Economic Development Corporation | January 2018 | Page 47
References
Denver Metro Association of Realtors. DMAR Real Estate Market Trends Report. January 2018. www.dmarealtors.com
The Denver Post. Various articles. www.denverpost.com Elmendorf, Douglas W. and Sheiner, Louise M. “Federal Budget Policy with an Aging Population and Persistently
Low Interest Rates.” Journal of Economic Perspectives (31) 2017, 175‐194. Ewing Marion Kauffman Foundation. Kauffman Index of Entrepreneurial Activity. 2017. www.kauffman.org Federal Reserve Bank of St. Louis. Federal Reserve Economic Data (FRED). www.fred.stlouisfed.org The Federal Reserve Board. www.federalreserve.gov Forbes. “The Best and Worst States for Business 2017.” November 28, 2017. www.forbes.com Forbes. “The Best Places for Business and Careers 2017.” October 24, 2017. www.forbes.com Freddie Mac. Quarterly Refinance Statistics, Q3 2017. November 20, 2017. www.freddiemac.com Gallup. “Americans’ Financial Anxieties Ease in 2017.” May 19, 2017. www.gallup.com Gallup. “U.S. Stock Ownership Down Among All but Older, Higher‐Income.” May 24, 2017. www.gallup.com Gravelle, Jane G. “International Corporate Tax Rate Comparisons and Policy Implications." Congressional
Research Service, January 6, 2014. Innovation News. “WalletHub: Colorado ranks No. 5 for innovation.” March 23, 2017. www.innovationnews.com International Monetary Fund. World Economic Outlook: Seeking Sustainable Growth, Short‐Term Recovery, Long‐
Term Challenges. October 2017. www.imf.org Joint Committee on Taxation. “Macroeconomic Analysis of the Conference Agreement for H.R. 1, the “Tax Cuts
and Jobs Act.” December 22, 2017. www.jct.gov Krueger, Alan B. “Where Have All the Workers Gone? An Inquiry into the Decline of the U.S. Labor Force
Participation Rate.” Brookings Papers on Economic Activity. August 26, 2017. www.brookings.edu Manpower Inc. www.manpowergroup.com
Metro Denver Economic Development Corporation. 2017 Industry Cluster Study. www.metrodenver.org. Metro Denver public trustees (various). National Association of Business Economists. www.nabe.com National Association of Realtors. www.realtor.org

REFERENCES
Metro Denver Economic Development Corporation | January 2018 | Page 48
References
National Conference of State Legislatures. State Minimum Wages. January 5, 2017. www.ncsl.org Nunns, Jim. “How TPC Distributes the Corporate Income Tax.” Urban Institute and Urban‐Brookings Tax Policy
Center. September 13, 2012. www.taxpolicycenter.org Office of State Planning and Budgeting. The Colorado Economic Outlook: Economic and Fiscal Review. December
2017. www.colorado.gov Regional Transportation District, RTD FasTracks. www.rtd‐fastracks.com Silicon Valley Business Journal. “The U.S. cities where small businesses thrive.” February 24, 2017.
www.bizjournals.com S&P CoreLogic Case‐Shiller Home Price Indices. www.standardandpoors.com Tax Foundation. “Preliminary Details and Analysis of the Tax Cuts and Jobs Act.” Special Report No. 241,
December 2017. www.taxfoundation.org Tax Foundation. “Statement on Final Passage of the Tax Cuts and Jobs Act.” December 20, 2017.
www.taxfoundation.org Tax Policy Center. “Macroeconomic Analysis of the Tax Cuts and Jobs Acts.” December 20, 2017. www.taxpolicycenter.org Tax Policy Center. “Updated Effects of the Tax Cuts and Jobs Act on Representative Families.” December 22,
2017. www.taxpolicycenter.org University of Colorado at Boulder, Leeds School of Business, Business Research Division. Colorado Business
Economic Outlook 2018. December 2017. www.leeds.colorado.edu U.S. Department of Agriculture, Economic Research Service. www.ers.usda.gov U.S. Department of Commerce, Bureau of Economic Analysis. www.bea.gov U.S. Department of Commerce, Bureau of the Census. www.census.gov U.S. Department of Commerce, International Trade Administration. TradeStats Express. www.tse.export.gov U.S. Department of Energy, Energy Information Administration. www.eia.gov U.S. Department of Labor, Bureau of Labor Statistics. www.bls.gov U.S. Department of the Treasury. www.treasury.gov Yahoo! Finance. Stock Market Index Summary. www.finance.yahoo.com

REFERENCES
Page 49
Economic and Demographic Research Industry Studies Fiscal and Economic Impact Analysis Real Estate Economics
10184 West Belleview Avenue Suite 100 Littleton, Colorado 80127 www.DevelopmentResearch.net 303.991.0070