Embed Size (px)
Citation preview

Application No.: A.16-09- Exhibit No.: SCE-02, Vol. 1
(Appendix) Witnesses: R. Woods
(U 338-E)
2018 General Rate Case
Transmission & Distribution (T&D) Volume 1 – Appendix to Operational Overview and Risk-Informed Decision Making
Before the
Public Utilities Commission of the State of California
Rosemead, California
September 1, 2016

SCE-02: Transmission & Distribution Volume 1 – Appendix
Table Of Contents
Section Page Witness
-i-
A. Review of Key Risk Model Formulas, Terms, and Concepts ................1 R. Woods
1. Glossary of PRISM Terms .........................................................1
2. Risk Scoring Formula ................................................................2
3. Current Residual Risk and Mitigation Risk Reduction ...................................................................................3
4. Worst Reasonable Direct Impact (WRDI) .................................4
5. Data & Modeling .......................................................................4
B. Risk Modeling Analysis Details ............................................................5
1. Overhead Conductors.................................................................5
a) Risk Identification ..........................................................6
b) Current Residual Risk Evaluation ..................................7
(1) Triggering Event Frequency (TEF) ...................7
(2) Consequence Percentage (CP) and Consequence Impact (CI) ..................................8
c) Mitigation Alternatives Identification ............................9
d) Mitigation Risk Reduction Evaluation .........................10
(1) Tranche Analysis .............................................10
(2) TEF and CP Effectiveness ...............................11
e) Risk Spend Efficiency..................................................13
f) Key Takeaways ............................................................15
(1) Data ..................................................................15
(2) Modeling ..........................................................15
(3) Observation(s) ..................................................15

SCE-02: Transmission & Distribution Volume 1 – Appendix
Table Of Contents (Continued)
Section Page Witness
-ii-
2. Poles .........................................................................................15
a) Risk Identification ........................................................15
b) Current Residual Risk Evaluation ................................17
(1) Triggering Event Frequency ............................17
(2) Consequence Percentage (CP) and Consequence Impact (CI) ................................19
c) Mitigation Alternatives Identification ..........................20
d) Mitigation Risk Reduction Evaluation .........................21
(1) Pole Replacement.............................................21
(2) Steel Stubbing ..................................................21
(3) Guy Wire Repair / Replacement ......................22
(4) E-Truss .............................................................22
e) Risk Spend Efficiency..................................................22
f) Key Takeaways ............................................................24
(1) Modeling ..........................................................24
(2) Observation(s) ..................................................24
3. Underground Structures ...........................................................24
a) Risk Identification ........................................................25
b) Current Residual Risk Evaluation ................................26
(1) Triggering Event Frequency (TEF) .................26
(2) Consequence Percentage (CP) and Consequence Impact (CI) ................................27
c) Mitigation Alternatives Identification ..........................28
d) Mitigation Risk Reduction Evaluation .........................29
SCE-02: Transmission & Distribution Volume 1 – Appendix
Table Of Contents (Continued)
Section Page Witness
-iii-
(1) Tranche Analysis .............................................29
(2) TEF and CP Effectiveness ...............................30
e) Risk Spend Efficiency..................................................31
f) Key Takeaways ............................................................31
(1) Data ..................................................................31
(2) Modeling ..........................................................32
(3) Observation(s) ..................................................32
4. Circuit Breakers .......................................................................32
a) Risk Identification ........................................................33
b) Current Residual Risk Evaluation ................................33
(1) Triggering Event Frequency (TEF) .................34
(2) Consequence Percentage (CP) and Consequence Impact (CI). ...............................35
c) Mitigation Alternatives Identification ..........................35
d) Mitigation Risk Reduction Evaluation .........................35
(1) Tranche Analysis .............................................35
(2) TEF and CP Effectiveness ...............................36
e) Risk Spend Efficiency..................................................36
f) Key Takeaways ............................................................36
(1) Modeling ..........................................................36
5. Transformers ............................................................................37
a) Risk Identification ........................................................37
b) Current Residual Risk Evaluation ................................37

SCE-02: Transmission & Distribution Volume 1 – Appendix
Table Of Contents (Continued)
Section Page Witness
-iv-
(1) Triggering Event Frequency (TEF) .................39
(2) Consequence Percentage (CP) and Consequence Impact (CI) ................................39
c) Mitigation Alternatives Identification ..........................39
d) Mitigation Risk Reduction Evaluation .........................40
(1) Tranche Analysis .............................................40
(2) TEF and CP Effectiveness ...............................40
e) Risk Spend Efficiency..................................................40
f) Key Takeaways ............................................................41
(1) Modeling ..........................................................41
6. Underground Cables ................................................................41
a) Risk Identification ........................................................42
b) Current Residual Risk Evaluation ................................43
(1) Triggering Event Frequency (TEF) .................44
(2) Consequence Percentage (CP) and Consequence Impact (CI) ................................44
c) Mitigation Alternatives Identification ..........................45
d) Mitigation Risk Reduction Evaluation .........................46
(1) Tranche Analysis .............................................46
(2) TEF and CP Effectiveness ...............................46
e) Risk Spend Efficiency..................................................47
a) Key Takeaways ............................................................47
(1) Modeling ..........................................................47
7. 4 kV Circuits ............................................................................48

SCE-02: Transmission & Distribution Volume 1 – Appendix
Table Of Contents (Continued)
Section Page Witness
-v-
a) Risk Identification ........................................................48
b) Current Residual Risk Evaluation ................................48
(1) Triggering Event Frequency (TEF) .................49
(2) Consequence Percentage (CP) and Consequence Impact (CI) ................................49
c) Mitigation Alternatives Identification ..........................49
d) Mitigation Risk Reduction Evaluation .........................49
(1) Tranche Analysis .............................................49
(2) TEF and CP Effectiveness ...............................49
e) Risk Spend Efficiency..................................................51
f) Key Takeaways ............................................................52
(1) Modeling ..........................................................52
8. Vegetation Management ..........................................................52
a) Risk Identification ........................................................52
b) Current Residual Risk Evaluation ................................53
(1) Triggering Event Frequency (TEF) .................55
(2) Consequence Percentage (CP) and Consequence Impact (CI) ................................55
c) Mitigation Alternatives Identification ..........................56
d) Mitigation Risk Reduction Evaluation .........................57
(1) Tranche Analysis .............................................57
(2) TEF and CP Effectiveness ...............................57
e) Risk Spend Efficiency..................................................57
f) Key Takeaways ............................................................58

SCE-02: Transmission & Distribution Volume 1 – Appendix
Table Of Contents (Continued)
Section Page Witness
-vi-
(1) Data ..................................................................58
(2) Modeling ..........................................................58
9. Conclusion ...............................................................................58

1
I. 1
APPENDIX 2
A. Review of Key Risk Model Formulas, Terms, and Concepts 3
Prioritized Risk Informed Strategic Management (PRISM) leverages an event based 4
methodology. Events can lead to a number of negative outcomes, which can be classified in 5
consequence dimension. Outcomes are stratified into different levels of consequence impact. The 6
following provides a summary overview of key terms, formulae, and concepts related to the PRISM 7
framework that are referenced throughout this volume. 8
1. Glossary of PRISM Terms 9
Acronym Term Definition Asset T&D physical assets (poles, wires, substations, etc.) AST Asset
Strategy Team (AST)
Teams formed with subject matter experts to identify risks, drivers, mitigations, and data sources for a specific asset.
CS (1,2,3) Challenge Sessions
Sessions held to calibrate and validate scoring within (CS1) and across (CS2) Asset Strategy Teams, as well as with senior leadership (CS3)
Consequence The specific Impact Dimension within the Risk Evaluation Tool (e.g. Safety, Reliability, Financial, etc.) that is associated with an Outcome (e.g. injury, wildfire, property damage, etc.)
CI Consequence Impact
Magnitude or severity of impact measured on 1 to 7 scale
CP Consequence Percentage
Probability that a consequence occurs when triggering event occurs
CRR Current Residual Risk
Measure of risk units without the proposed mitigation in place. CRR inherently includes the benefits of past mitigations. A higher CRR means more risk
Driver Contributing factors causing an event or consequence Event Occurrence or change of a particular set of circumstances Impact
Dimension Categories created to capture the different types of consequences that a risk event may have (Safety, Reliability, Environmental, Financial, and Compliance)
MRR Mitigated Risk Reduction
Measure of risk units that are reduced associated with a given mitigation project or program. Also known as the “benefit” of a proposed mitigation project; a higher MRR means more risk mitigated.
Mitigation An action that would result in lowering an asset’s Risk Score, either through lowering the frequency of triggering events (TEF), the likelihood of the consequence to occur (CP) or the consequence impact’s severity (CI)
Outcome A negative consequence that occurs as a result of a risk event or triggering event (e.g. injury, wildfire, property damage, etc.). Outcomes can have consequences in one or more impact dimension

2
(e.g. safety, reliability, financial, etc.) PRR Planned
Residual Risk Measure of risk units after implementation of the proposed mitigation
PST Program Strategy Team
Team formed with subject matter experts to identify the proper technique to score current risks and mitigations for programs that cross multiple asset classes.
Risk Potential for an adverse event that can impact company's ability to achieve its objectives
RS Risk Score A numerical representation of a risk, defined as a measure of frequency and impact measures & resulting in a measure of “risk units”; Mathematically defined as (TEF x CP) x ICI (Currently, I = 10)
RSE Risk Spend Efficiency
A numerical measure of the efficiency with which a mitigation mitigates against a risk; Mathematically defined as the ratio of expected risk reduction (MRR) per $1,000. A higher RSE the more efficient a program or asset is at mitigating risk
Risk Statement
An event that leads to an outcome (e.g. “Cable failure leading to an outage”)
Risk Units The measure of risk scores used in PRISM, which is a function of risk frequency & impact
Tranche A subgroup of assets, grouped together based on similar risk profiles Triggering
Event A risk event that could potentially lead to one or more negative outcomes, each of which could have one or more consequences
TEF Triggering Event Frequency
Number of times a triggering event is expected within a one year timeframe
WRDI Worst Reasonable Direct Impact
The risk score associated with the highest risk score within a given risk statement, separated by various CP/CI values (e.g. for the risk statement “Cable failure leading on an outage,” the WRDI risk score splits out the observed outages by CI level and takes the CP*10CI combination that leads to the highest risk score
2. Risk Scoring Formula 1
The formula used to compute risk is: 2 = ∗ ∗ 10 3
TEF is the triggering event frequency, CP is the Consequence Percentage, and CI is the Consequence 4
Impact. Triggering events relate to circumstances that can lead to undesirable outcomes. TEF is 5
measured on a continuous frequency scale and represents that annual event frequency. The consequence 6
percentage refers to the conditional probability that an undesirable outcome occurs when the triggering 7
event occurs. Lastly, the Consequence Impact measures the impact severity on a one to seven scale. For 8
example, an overhead conductor down in service can be a triggering event with a forecast annual 9
frequency. When a wire down event does occur, some percentage of the time (CP value) it results in an 10

3
injury outcome. When the injury outcomes occur the worst reasonable impact severity is represented by 1
the Consequence Impact (CI). 2
3. Current Residual Risk and Mitigation Risk Reduction 3
The Current Residual Risk (CRR) represents the computed risk score prior to 4
implementation of a proposed mitigation. The CRR value is often determined based on inputs that rely 5
on historical event data, which inherently includes the risk reduction benefits of past mitigations. 6
Therefore, CRR values also include the benefits of past mitigations. CRR values can be represented as 7
1-year CRR (CRR1) scores or present value CRR scores (CRRPV). One-year CRR scores only account 8
for the risk in a single year while present value CRR scores represent the entire stream of yearly CRR 9
values over a 15-year window discounted to present value. For example, if a risk has a constant CRR 10
value of 100 risk units over a 15 year window, the CRR1 value for the present year would be 100 but the 11
CRRPV of the entire stream of risk discounted back to present would be 761.1 12
Mitigation Risk Reduction (MRR) represents the risk reduction benefit associated with a 13
mitigation. Risk reduction can stem from a mitigation’s ability to reduce the triggering event frequency, 14
the conditional probability the event would result in an outcome, the severity of an outcome, or some 15
combination of the three. For example, replacing overhead conductor with new and larger wire can 16
reduce wire down events (TEF) but new conductor does not impact whether the wire stays energized if it 17
does come down. On the other hand, advanced relays that can detect a hard to detect high-impedance 18
fault can de-energize a downed line and reduce the probability that someone is injured when a line 19
comes down (CP) but may not be able to prevent the original wire down event. Lastly, fire walls 20
between substation transformers is an example of a mitigation that can reduce the impact (CI). The walls 21
will not prevent an in-service failure of a transformer (TEF) or the likelihood it will result in an outage 22
(CP), but it can prevent the fire from spreading to neighboring transformers that could increase the size 23
of the outage (CI). 24
Current Residual Risk and Mitigation Risk Reduction are both measured over time as 25
discussed in the volume. The present value of mitigation benefits over the 15-year window are denoted 26
by the term MRRPV. 27
1 Using a risk over time discount rate equal to 10 percent. Refer to SCE-02, Vol. 1, Section III.D.2.b).

4
4. Worst Reasonable Direct Impact (WRDI) 1
PRISM currently uses a Worst Reasonable Direct Impact (WRDI) assumption that selects 2
the highest scoring combination of Consequence Percentage and Consequence Impact for each Risk 3
Statement. Consider the following risk statement as an example: overhead conductor down leading to an 4
outage. Historical data shows that wire down events lead to outages that range in severity, but the 5
Consequence Impact Level 3 (CI3) outage outcome yields the highest risk score, so the WRDI 6
assumption excludes scores for other CI levels. 7
This approach provides a consistent method for scoring across areas with varying levels 8
of data. For example, scoring risks with Reliability outcomes is supported by the robust Outage 9
Database & Reliability Metrics System (ODRM) that provides a comprehensive record for every 10
customer outage. On the other hand, scoring risks with Safety outcomes is supported by CPUC 11
Reportable Incident records, which may not include close call outcomes.2 The WRDI assumption is 12
intended to reflect scores in both areas, without under-valuing scores in areas like Safety that have less 13
comprehensive datasets. 14
5. Data & Modeling 15
We used a variety of data sources to build the PRISM risk scores. The sources we used 16
for the scoring areas covered in the testimony are below in Table I-1. 17
2 Rule 17 and 19 require an incident to be recorded as a CPUC Reportable Incident if the outcome results in
any of the following criteria: a significant injury leading to hospitalization or a fatality; an outage for 10% or more of SCE customers, greater than $50k in damage, or a newsworthy event.

5
Table I-1 Data Sources by Scoring Area
B. Risk Modeling Analysis Details 1
As discussed in the SCE-02 Vol 1, SCE has made significant efforts to advance its risk 2
evaluation capabilities by developing a quantitative risk-based scoring methodology. This section 3
provides analysis details for selected scoring areas, and is intended to illustrate how SCE’s risk 4
framework has been applied to specific assets and activities. Risk models are continuously improving 5
through each cycle and the information being presented is based on work through March 2016. 6
1. Overhead Conductors 7
The risk analysis for overhead conductors covers all distribution primary conductor and 8
Overhead Conductor Program (OCP) existing mitigations and mitigations in consideration for future 9

6
use. Overhead Conductor Program mitigations focus on reducing the frequency and impact of wire 1
down events; please see SCE-02, Volume 8 for more details. SCE first described its proposed 2
methodology for assessing and quantifying overhead conductor risks in its Safety Model Assessment 3
testimony filed in May of 2015.3 Overhead conductor risk statements have not changed, but the 4
methodology to estimate the impact of OCP mitigations has been updated. 5
a) Risk Identification 6
The risk event-outcome-impact combinations for overhead conductor risks are 7
summarized in Table I-2. We evaluate overhead conductor risks in relation to three possible events. 8
“Conductor down in service” relates to conductor falling the ground. “Intact conductor failure in 9
service” relates to incidents where the conductor fails due to faults or external causes, but remains intact 10
overhead. Finally, “human contact with intact conductor” refers to incidents in which people such as tree 11
trimmers or construction workers come in contact with in-service conductor. 12
Table I-2 Overhead Conductor Risk Statements
3 A.15-05-002, SCE’s Safety Model Assessment Proceeding Application filed May 1, 2015.
RS# Triggering Event Outcome Impact Dimension
1
Overhead conductor down in service
Injury Safety
Financial
2 Wildfire Safety
Financial Environmental
3 Property Damage Safety
Financial 4 Outage Reliability 5 Freeway/Road Closure Financial
6 Intact conductor failure in service Outage Reliability
Fatality Safety
7 Human contact with intact conductor Injury Safety
Financial

7
These risks are intended to capture the consequences of risks triggered by 1
overhead conductor events even if the outcome is not directly related to overhead conductor failure. For 2
example, in a human contacting intact conductor incident, the outcome is associated with overhead 3
conductor. In contrast, the outcomes resulting from car hit pole events are triggered by the pole asset and 4
are accounted for in pole risks. 5
b) Current Residual Risk Evaluation 6
We determined Risk Score inputs from historical data, prior to completing any 7
OCP work. As an initial assumption we estimate CRR for conductor down events with the assumption 8
that historical values represent the asset risk without mitigation programs in place. Overhead conductor 9
CRR scores are summarized in Table I-3. CRR score tables like the one below show single-year CRR 10
scores by risk statement. Each risk statement represents a unique triggering event–outcome pair. The 11
table also shows these scores broken out by risk dimension to facilitate comparisons of scores by risk 12
statement and risk dimension. For example, in Table I-3 below, it is possible to determine that human 13
contact with intact conductor leading to injury is the largest risk contribution for the overhead conductor 14
asset, and that the safety risk dimension drives this score. 15
Table I-3 Overhead Conductor CRR Scores
(1) Triggering Event Frequency (TEF) 16
Overhead conductor analysis accounts for three Triggering Events, each of 17
which relies on different data sources and estimates. 18
- Overhead conductor down (aka wire down): SCE started systematically recording wire down 19
events across all regions in May 2014 with Troubleman repair orders as the primary source. TEF 20
Triggering Event Outcome Safety Reliability Financial Environmental Compliance Subtotal % of TotalInjury 625,000 - 6,250 - - 631,250 18%Wildfire 13,333 - 13,333 13,333 - 39,999 1%Property Damage 12,500 - 213 - - 12,713 0%Outage - 305,157 - - - 305,157 9%Freeway/Road Closure - - 6,144 - - 6,144 0%
Intact conductor failure Outage 125,000 121,152 - - - 246,152 7%Human contact with intact conductor Injury 2,250,000 22,500 - - 2,272,500 65%
Subtotal 3,025,833 426,309 48,440 13,333 - 3,513,915 % of Total 86% 12% 1% 0% 0%
1-Year Current Residual Risk (CRR)
Overhead conductor down

8
is the annualized average of wire down incidents documented from May 2014 to December 2015 1
for lines classified as primary conductor. 2
- Intact conductor failure: The Outage Database & Reliability Metrics system (ODRM) is the 3
primary data source used to estimate TEF for intact conductor failures. ODRM data from 2007 to 4
2015 is filtered to outages with overhead equipment cause code descriptions. It is assumed that 5
all wire down events result in an outage, so the difference in annual overhead conductor caused 6
outages and wire down events is assumed to be the number of intact conductor failures per year. 7
- Human contact with intact conductor: A review of CPUC Reportable Incidents from 2007 to 8
2014 is relied on as the primary source to estimate the number of injuries per year that occur 9
from people coming in contact with in-service conductor. 10
(2) Consequence Percentage (CP) and Consequence Impact (CI) 11
Data sources and methodologies for CP and CI estimates vary by outcome 12
and impact dimension. 13
- Injury: CPUC Reportable Incidents from 2007 to 2014 provide counts for the number of 14
incidents in which all three overhead conductor triggering events result in serious injury or 15
fatality. 16
- Wildfire: CPUC reportable incidents and Cal Fire Data provide records for wildfires with 17
information on acreage damaged. Recent fires in SCE territory align with Consequence Impact 18
Level 4 (CI4) and CI5 severity. Subject Matter Experts (SMEs) considered the 2007 to 2014 19
CPUC report time frame as relatively short for estimating probability for a potential high 20
consequence wildfire. Given that SCE and SDG&E territories are adjacent to one another, it is 21
assumed that a wildfire of similar severity to the 2007 Witch/Guejito fire in SDG&E territory is 22
possible in SCE territory. Public press showed safety, environmental, and financial damages for 23
this 2007 fire were consistent with a CI6 severity, and SMEs assume it is possible to anticipate a 24
fire of this severity once every 25 years in SCE service territory. The risk for a CI6 wildfire is 25
evenly distributed between distribution overhead conductor, transmission overhead conductor, 26
and poles. 27
- Property Damage: CPUC Reportable Incidents from 2007 to 2014 provide counts for the number 28
of incidents that have led to property damage. 29

9
- Outage: ODRM data from 2007 to 2015 provides Customer Hours of Interruption (CHI) data to 1
estimate severity overhead conductor caused outages. Event IDs are used to link ODRM and 2
wire down repair order data to provide CHI estimates for wire down events. 3
- Freeway or Road Closure: Wire down data includes a field that tracks this outcome, which 4
provides the information needed to estimate a CP for this outcome when there is a wire down 5
event. CPUC reportable incidents included records of two such incidents consistent with a CI2 6
level financial outcome. 7
c) Mitigation Alternatives Identification 8
The Overhead Conductor Program began in 2015 with two primary mitigations: 9
Reconductoring and Branch Line Fusing. In addition to evaluating the two existing mitigations, PRISM 10
2015 reviewed other advanced mitigations capable of reducing overhead conductor risk in the future. 11
The process to determine which advanced mitigations we should evaluate started at the end of 2014; 12
SMEs met to determine the range of mitigation options with the potential to reduce public safety of wire 13
down events. SMEs originally suggested over 40 mitigations to consider as part of future OCP work. In 14
PRISM 2015, SMEs selected four advanced mitigations pilots to score: High Impedance Relays, Single 15
Phase Automatic Reclosers, Analog Radio Detection, and Clampstars. In PRISM 2016, we also scored 16
four alternative mitigations: Aerial Bundled Cable (underground cable use in overhead lines), tree wire, 17
Undergrounding, and Steel Poles. This section provides a brief explanation on the expected benefits of 18
each mitigation. 19
- Reconductoring is intended to target and replace small conductor to a minimum of 1/0 ACSR for 20
tap and 336 ACSR for main lines. While in the process of reconductoring, we also replace 21
deteriorated or corroded conductor, crossarms, poles, connection hardware, and other damaged 22
equipment. 23
- Branch Line Fusing (BLF) tap (branch) lines is intended to de‐energize conductor when a fuse 24
detects fault currents sufficiently large to potentially cause conductor annealing or melting. 25
- High Impedance (HiZ) Relay Detection devices are installed at substation(s) for distribution 26
circuits. The relays will detect a high impedance fault, which could indicate a possible energized 27
wire down condition that would otherwise go undetected by other existing protection devices. 28
- Single Phase Automatic Reclosers (ARs) improve circuit reliability by eliminating outages on 29
branch circuits caused by temporary faults and protect smaller conductor from arcing damage. 30

10
- Analog Radio Detection senses depressed voltage to indicate a possible load side energized wire 1
down condition on single phase radials using the SCE Netcomm radio system and voltage relays. 2
If successful, the detection system may be adopted by existing AMI smart meters to avoid 3
additional hardware installations. 4
- ClampStar Splice Applications are shunt connection devices used to improve automatic splice 5
installation capabilities on all SCE distribution wire sizes. 6
- Aerial Bundle Cable is insulated conductor wrapped around a guy messenger wire and is 7
intended to prevent faults caused by contact from animals, small tree limbs and other vegetation, 8
mylar balloons, and could include other types of contact. Preventing faults would reduce wire 9
downs and intact conductor failures. Aerial cable's insulation also provides significant protection 10
against safety incidents associated with humans contacting overhead lines. 11
- Tree wire is bare conductor enclosed in a high density polyethylene, which may provide partial 12
insulation. Compared to aerial bundle cable, the benefits are very similar. But since aerial cable 13
is fully insulated, the risk reduction benefits would be higher in comparison to tree wire. Tree 14
wire is intended to prevent momentary faults caused by contact from animals, small tree limbs 15
and other vegetation, mylar balloons, and could include other types of contact. Preventing faults 16
would reduce wire downs and intact conductor failures. Tree wire’s partial insulation also 17
provides some protection against safety incidents associated with humans contacting overhead 18
lines. 19
- Undergrounding overhead lines would mitigate all overhead risk but would inherit the risk of a 20
new underground line. Compared to the other five mitigations being evaluated, undergrounding 21
overhead lines would provide the most risk reduction, but at a very high cost. 22
- Steel Poles were evaluated as a fire mitigation measure, and are intended to provide the same 23
benefits as wood poles, plus the benefits resulting from greater fire resistance. Steel poles could 24
also potentially reduce the number of injuries to emergency personnel by reducing the amount of 25
pole and conductor debris on the ground in the event of a wildfire. 26
d) Mitigation Risk Reduction Evaluation 27
(1) Tranche Analysis 28
Overhead conductor mitigations were organized into groups with similar 29
risks, called tranches. Overhead conductor data is currently available at the circuit level. Since circuits 30

11
are a common reference point for conductor, SMEs elected to evaluate mitigations at a circuit level for 1
existing mitigations. 2
SCE’s service territory includes 4,636 circuits, of which approximately 3
4,000 contain some portion of overhead conductor. PRISM 2016 analysis ranks all circuits based on 4
what SMEs consider to be leading indicators of future wire down events. This includes historical wire 5
downs, circuit CB operations, fault duty, miles of small conductor, and conductor-related maintenance 6
notifications. Circuit ranks have been relied on to make 2016 and 2017 OCP scoping decisions. Circuit 7
rankings are the direct input to calculate a TEF value by circuit. An individual circuit’s attributes 8
relative to average circuit attributes in these indicators determines its predicted wire down count, or TEF 9
value. The sum of all predicted wire down counts accounts for these leading indicators and is made to 10
equal the historic annual observed TEF. 11
Risk analysis also allocates consequence risk according to CP attributes 12
for the circuit. Wildfire risk is allocated based on an analysis of high fire miles, high wind miles, and 13
proximity to canyons for a given circuit. Injury risk is allocated according to customer density for a 14
circuit relative to the maximum in the system. Outage risk is allocated according to number of outages 15
for a circuit relative to the maximum in the system. 16
(2) TEF and CP Effectiveness 17
TEF and CP effectiveness are quantified to estimate the effectiveness of 18
overhead conductor mitigation programs. Overhead conductor TEF effectiveness refers to the ability of 19
a mitigation to reduce the probability of wire down events. Overhead conductor CP effectiveness 20
generally refers to the ability of a mitigation to de‐energize downed wires, given that critical negative 21
consequences occur as a result of downed wires remaining energized. The CI is generally not impacted, 22
since the severity of the negative consequence is not mitigated (e.g., if a person contacts a downed wire 23
that is still energized, the assumption is the impact severity would still be a fatality). 24
Overhead Conductor SMEs collaborated to estimate TEF and CP 25
effectiveness during working sessions for each mitigation. A common exercise in this effort involved 26
asking SMEs how effective a certain mitigation would be at preventing wire downs for a given driver. 27
Wire down data detailing how frequently certain wire downs occurred as a result of melting or breaking 28
was considered by SMEs in this exercise. SMEs were then asked if a mitigation could de‐energize 29
downed wires. The following points provide brief explanations on how each mitigation is expected to 30
reduce TEF or CP. 31

12
- Reconductoring TEF Effectiveness: New, larger conductor reduces TEF through its improved 1
ability to withstand melt faults that lead to wire down events. Reconductoring also replaces 2
supporting structures and provides reductions in crossarm failures, connector failures, other 3
apparatus hardware, and splice failures. 4
- Branch Line Fuse TEF Effectiveness: Branch line fuses prevent melt failures from occurring by 5
minimizing the amount of time a segment of conductor is exposed to fault current. SCE does not 6
expect Branch line fuses to be effective at preventing arc failures. 7
- High Impedance Relay CP Effectiveness: Relays can detect high impedance faults and control 8
existing protection devices to de-energize downed wires. 9
- Single Phase AR TEF Effectiveness: Single Phase ARs can reduce outages on tap (branch) lines 10
caused by temporary faults; limiting outages on those lines helps maintain the conductor’s ability 11
to withstand melt and arc faults. 12
- Single Phase AR CP Effectiveness: Single Phase ARs can de‐energize a conductor, thus reducing 13
safety risks associated with energized conductor down. 14
- Analog Radio Detection CP Effectiveness: Analog Radio Detection can detect depressed voltage 15
and be integrated with existing protection devices to de‐energize downed wires and reduce 16
public safety risks associated with energized wire down events. 17
- ClampStar TEF Effectiveness: ClampStars can prevent automatic splices from failing, mitigating 18
wire down splice failures by automatic splices. 19
- Aerial Bundled Cable TEF Effectiveness: Aerial bundled cable can reduce TEF through its 20
improved ability to withstand melt and arcing faults that lead to wire downs. Aerial cable can 21
also reduce intact conductor failures due to faults caused by contact. 22
- Aerial Bundled Cable CP Effectiveness: Aerial cable can reduce outcomes associated with down 23
wire such as injury / fatalities, wildfires, and property fires. Aerial cable can also reduce the 24
safety consequences associated with humans contacting intact conductor. 25
- Tree wire TEF Effectiveness: Tree wire can reduce TEF through reducing the likelihood of melt 26
failure under fault conditions. Tree wire is only partially insulated due to the cover. Therefore, 27
benefits for tree wire will be less than the benefits for aerial cable. 28
- Tree wire CP Effectiveness: Tree wire can reduce outcomes associated with down wire such as 29
injury / fatalities, wildfires, and property fires. Tree wire can also reduce the safety consequences 30
associated with humans contacting intact conductor. 31

13
- Undergrounding TEF Effectiveness: Undergrounding would eliminate all overhead triggering 1
events (wire down, intact conductor failure, humans contacting intact conductor) and inherit 2
underground triggering events (UG cable failure, UG structure failure, and humans contacting 3
UG cable). 4
- Undergrounding CP Effectiveness: Consequences associated with overhead lines are eliminated 5
but consequences with underground lines are inherited. 6
- Steel Pole CP Effectiveness: In the event of a wire down or pole failure, steel poles are not 7
expected to reduce the CP of a wildfire starting. Steel poles may however reduce conditional 8
probabilities of potential financial, reliability, or safety impacts occurring. 9
e) Risk Spend Efficiency 10
Table I-4 shows select risk spend efficiency results. As noted, only the highest or 11
maximum individual circuit score for any given mitigation is shown in the table below. It is also 12
important to point out that subject matter experts are relatively more confident in the assumptions 13
underlying scores for mitigations currently in use (i.e. reconductoring and BLFs) than they are for inputs 14
to scores for alternative mitigations (i.e. aerial cable, tree wire, undergrounding, and steel poles). 15
Assumption for alternative mitigations require additional validation to better understand how these 16
mitigations could scale if they are to be deployed across the service territory. 17

14
Table I-4 Overhead Conductor Mitigation Risk Spend Efficiencies
Mitigation4 Highest RSEPV
5 (MRRPV/$1k)
Reconductoring & BLF 31Reconductoring 33BLF 69
Aerial Cable - Small Conductor 54Aerial Cable - All Conductor 67Tree Wire - Small Conductor 54Tree Wire - All Conductor 68Undergrounding 42Steel Poles 7
The results shown in Table I-4 represent circuits that have some level of risk and 1
are inexpensive to mitigate. The circuits are selected based on the core risk being addressed for each 2
mitigation. Comments below provides brief explanations of RSE scores for several mitigation options. 3
- Branch line fusing targets circuits that are generally in dense customer areas, have wire down 4
risk, and are inexpensive to mitigate. This means circuits that have few locations for branch lines 5
but protect a fair amount of conductor. 6
- Aerial bundled cable and tree wire also target circuits of short length that are in dense customer 7
areas; these circuits are less expensive relative to circuits that cover long distances, given costs 8
are estimated per foot. The top circuits being selected may not have had wire down incidents 9
occur, but were selected due to aerial cable and tree wire’s ability to reduce fatalities associated 10
with people touching intact conductor. Two scenarios are being shown above: (1) assuming 11
small conductor is replaced; and (2) assuming all conductor is replaced. 12
- Undergrounding is more cost-effective in targeting circuits that are smaller than 0.5 miles and 13
located in high customer density areas. 14
4 Scores for mitigations evaluated in 2015 (i.e. High Impedance Relays, Single Phase Automatic Reclosers,
Analog Radio Detection, and Clampstars) have not been scored at a circuit tranche level and therefore do not appear in Table I-4.
5 We performed OCP scoring by circuit, so the numbers in this column are for the circuit with the highest RSE for a given mitigation.

15
f) Key Takeaways 1
(1) Data 2
It is important to note that a lack of data on conductor condition and age 3
led SMEs to rely on proxy data that they assume are leading indicators for conductor failures. 4
Continuing to develop data sources will improve the risk analysis. For example, wire down data is a 5
critical input, but system‐wide data only exists for approximately two years. We continue to collect data, 6
and with a longer time period of data we should be able to improve the degree to which modeling can 7
assess trends with leading indicators. In the future, it may also be beneficial to expand data to more 8
granular levels than the circuit. 9
(2) Modeling 10
Continue to develop overhead conductor analysis to account for secondary 11
conductor risks and dependencies between overhead conductor mitigations and mitigations for other 12
assets. 13
(3) Observation(s) 14
The triggering event of human contact with intact conductor presents the 15
greatest absolute risk for overhead conductor. SCE currently invests in public outreach programs to 16
warn the public against getting near any intact conductor. In addition to these efforts, it may be 17
beneficial in the future to consider OCP mitigations focused on reducing the risk associated with human 18
contact with intact conductor events. 19
2. Poles 20
The risk analysis for poles encompasses all distribution and subtransmission wood poles, 21
and relates to the inspection and remediation activities associated with the Deteriorated Pole Program 22
and the Pole Loading Program described in SCE-02, Volume 9. SCE first described its proposed 23
methodology for assessing and quantifying pole-related risks in its Safety Model Assessment testimony 24
filed in May of 2015. The risk statements used to evaluate pole-related risks have not changed, but the 25
methodology to estimate the impact of SCE programs on pole-related risks have been updated and 26
enhanced. 27
a) Risk Identification 28
The risk event-outcome-impact combinations used to describe pole-related risk 29
are summarized in Table I-5. We evaluate pole risks in relation to a common triggering event of a pole 30
falling in service. The risk statements evaluated are “pole falls in service leading to injury,” “pole falls 31

16
in service leading to property damage,” “pole falls in service leading to outage,” and “pole falls in 1
service leading to wildfire.” 2
Table I-5 Pole Risk Statements
These risks are intended to capture the consequences of poles falling even if the 3
resulting hazardous event is not directly related to poles. For example, wildfires are not expected to be 4
caused by a pole falling, but rather by energized wire falling when the pole it is attached to falls. If the 5
pole did not fall, the consequences would not have been triggered, and hence the risks associated with 6
the wires in such cases are attributed to pole risks. The risks associated with overhead wire failing 7
independent of a pole falling are accounted for in overhead conductor risks. 8
Inspections and assessments provide information pertaining to the in-situ 9
condition of poles and were used in the risk modeling to inform the probability of a pole falling. Pole 10
loading assessments and intrusive inspections both identify poles for replacement, but the criteria for 11
replacement differs for each program. The risk scores take this into account by quantifying both the 12
overall risks presented by all poles and the specific level of risks presented by specific tranches of poles 13
grouped together based on the results of their intrusive inspections and pole loading assessments. 14

17
b) Current Residual Risk Evaluation 1
Table I-6 summarizes the 1-year current residual risk scores for poles, broken 2
down by risk statement and impact dimension. The following sections describe the inputs and 3
assumptions used to compute these scores. 4
Table I-6 Poles CRR Scores
(1) Triggering Event Frequency 5
We forecast Triggering Event Frequency using a model of pole behavior 6
which incorporated the impact of pole decay and pole loading on a pole’s capacity to withstand extreme 7
winds. This model created a virtual representation of approximately 1.4M wood poles in SCE’s 8
distribution and subtransmission system, including installation date, maintenance schedules, safety 9
factors, and levels of decay. The model includes several components which simulate the progression of 10
natural processes within the pole population over several decades, including the initiation and spread of 11
pole decay and the frequency of extreme wind events. By combining forecast prevalence and severity of 12
decay with the expected frequency of extreme winds, the model estimates the frequency of poles falling 13
as the pole population ages. Using this framework, the model was used to estimate the impact of the 14
intrusive inspection program and pole loading assessment program on the frequency of poles falling in 15
service. 16
A second model forecasts the quantity of poles that begin decaying. This 17
model uses pole attributes such as age and installation era to estimate the likelihood that decay will 18
begin. It relies on two years of inspection data on over 200,000 poles, and produces a fit to the observed 19
data as shown in Figure I-1. 20
Triggering Event Outcome Safety Reliability Financial Environmental Compliance Subtotal % of Totalfatality 441,751 - 441,751 40%fatality 4,418 4,418 0%property damage 221 221 0%outage 446,412 446,412 41%wildfire 68,154 68,154 68,154 204,463 19%
Subtotal 509,905 446,412 72,793 68,154 - 1,097,264 % of Total 46% 41% 7% 6% 0%
1-Year Current Residual Risk (CRR)
Pole Failure

18
Figure I-1 Modeled vs. Actual Inspection Failure Rates by Age
A simulation combining these models with data on the entire pole 1
population provides estimates of the number of poles that will be found for each pole tranche with the 2
current inspection standards and frequencies. A pole tranche represents a group of poles that share the 3
same characteristics across three attributes: decay level (5 levels depending on intrusive pole inspection 4
result), Pole Loading Calculation result (pass or fail), and whether pole resides in high fire zone (yes or 5
no). The simulation incorporates a virtual representation of every pole on SCE’s system. When possible, 6
specific age, inspection result, and high fire status data are merged together based on pole equipment 7
numbers to obtain the variables used to estimate the likelihood of an overwhelming wind event using the 8
methods described above. 9
When data is not available, we use population-level data to assign values 10
which represent the expected distribution of values at the population level. The simulation models the 11
progression of decay and likelihood of overwhelming wind events on a year-by-year and pole-by-pole 12
basis for the fifteen year period. At the same time, the simulation models the progress of Intrusive 13
Inspection Program and Pole Loading Programs through the virtual population of poles, and the flagging 14
of poles that are detected for removal according to current program standards. Removed poles are 15
replaced with new, sound poles that are free of decay and loaded for the applicable safety factor. 16

19
(2) Consequence Percentage (CP) and Consequence Impact (CI) 1
Table I-7 summarizes the consequence percentage and consequence 2
impact values for each risk statement along with the justification for the CI levels chosen. 3
Table I-7 Consequence Percentage and Consequence Impact Values
When possible, CP were based on claims data and pole notification 4
counts. For example, over a seven-year period two poles falling in service led to fatalities – a rate of 5
0.27 incidents per year. An average of 1,142 pole notifications were generated annually from late 2011 6
to early 2015; the rate of notifications was assumed to be relatively constant over the timeframe of the 7
claims data. This indicates that poles resulted in fatalities at a rate of 0.02%. Similarly, one property 8
damage claim equivalent to a level 3 impact occurred, a rate of 0.01% per notification. 9
We derived Wildfire CP based on a level 6 CI with a recurrence interval of 10
1 in 25 years. This reflects the belief that the drivers of wildfire risk – specifically, the extent and 11
intensity of SCE’s operations in high fire areas – have not dramatically changed over the past 25 years. 12
The age distribution of high fire poles in SCE’s current inventory supports this hypothesis: high-fire 13
poles comprise about 20% of those installed before 1980, and 28% of those installed after 1980. The 14
absence of a level 6 fire during this time period indicates that SCE’s current practices have succeeded in 15
reducing the risk of such a fire to some level less frequent than 1 in 25 years. Therefore, the 16
consequence percentage for wildfire reflects the 1 in 25 year “ceiling” frequency (0.04 per year) divided 17

20
by the estimated number of notifications in high-fire areas (1,142 * 22% of poles in high-fire areas = 1
251) or 0.02% per triggering event. This risk is allocated equally across poles, distribution overhead 2
conductor, and transmission overhead conductor. 3
c) Mitigation Alternatives Identification 4
Inspections are activities that support mitigations that can reduce risk, but are not 5
mitigations in and of themselves. The Intrusive Pole Inspection (IPI) Program detects interior decay in 6
poles, which reduces pole strength. Intrusive inspections determine the percentage of a pole’s original 7
strength that remains, given a certain level of interior decay. Poles failing intrusive inspections can result 8
in a mitigation such as pole replacement or restoration. 9
The Pole Loading Program (PLP) combines assessments and software modeling 10
to determine a pole’s ability to support expected equipment and wind loads. While intrusive inspections 11
can determine the percent of the pole’s original strength remaining, pole loading assessments can 12
determine the “as-built” capacity of the pole to support load. Pole loading failures can result in a 13
mitigation such as pole repair or replacement. This section provides a brief explanation on the expected 14
benefits of each mitigation. 15
- Pole Replacements involve wholesale replacement of an in-situ pole with a new pole meeting the 16
current design standards. Replacing a pole mitigates many, but not all, of the drivers that can 17
cause the triggering event of a pole falling in service. First, the new pole material has not 18
experienced strength reduction due to deterioration. Second, the replacement pole will be 19
designed to meet the current pole loading criteria, which will account for the actual loading on 20
the pole. Please note that pole replacement will not directly mitigate potential overloading due to 21
additional loads being applied to the pole following replacement. Finally, pole replacement can, 22
to some degree, mitigate weather driven triggering events. For example, poles designed to a 23
lower design wind speed that was later updated to a higher wind speed will necessarily have a 24
greater ability to withstand high wind and, thus, a lower probability of falling in the future. 25
- Steel Stubbing can potentially restore poles with decay above a minimum RSM threshold or that 26
fail pole loading calculations. Steel Stubbing can mitigate deterioration by reinforcing the pole 27
around the area of decay and restoring the pole to its original strength. Like pole replacements, 28
mitigations that improve the in-place strength of a pole can reduce the probability that the pole 29
would fall during a weather event and thus indirectly address the weather driver. 30

21
- Guy Wire Replacement can remediate cases of pole loading failures. Like pole replacements, 1
mitigations that improve the in-situ strength of a pole can reduce the probability that the pole 2
would fall during a weather event; thus, these mitigations can indirectly address the weather 3
driver. 4
- E-Trussing can potentially reinforce poles that fail pole loading calculations to increase the 5
strength of the pole. E-Truss restorations have not previously been applied as a pole loading 6
solution and require additional engineering analysis to determine the appropriate scope and 7
requirements for implementation. 8
d) Mitigation Risk Reduction Evaluation 9
The mitigation risk reduction for each of the pole mitigations is computed based 10
on a forecast reduction to TEF. For all mitigations, the CP and CI values are assumed to be unchanged; 11
the conditional probability that a pole falling would lead to an outcome (CP) and the associated 12
magnitude of that outcome (CI) are a function of the physical location of the pole and not the condition 13
of the pole itself. The following sections summarize the approach and assumptions used to compute the 14
MRR values for each mitigation. 15
(1) Pole Replacement 16
We determine the risk reduction for pole replacements by the severity of 17
decay and pole loading calculation results. The risk reduction stems from a reduction in triggering event 18
frequency, and we computed it using the pole model described in section I.B.2.b) of this appendix. The 19
likelihood of a pole experiencing an overwhelming wind load depends upon its current level of decay 20
and its pole loading status. The MRR of a pole replacement is calculated based on the reduction in risk 21
gained by replacing a pole with some level of decay, overloading, or both, with a pole that has no decay 22
and is properly pole loaded. 23
(2) Steel Stubbing 24
The steel stubbing mitigation is assumed to have the same risk-reduction 25
benefit as a pole replacement over the 15-year horizon used to calculate MRRpv. As a result, the MRR 26
values for steel stubbing and pole replacement are equal, and determined by the level of deterioration 27
and pole loading calculation results of the pole replaced or mitigated. Over longer time periods, steel 28
stubbing poles are not expected to have the same longevity as a pole replacement. 29

22
(3) Guy Wire Repair / Replacement 1
The MRR for guy repairs are based on an average MRR associated with 2
remediating a pole failing pole loading assessment. 3
(4) E-Truss 4
E-Truss MRR calculations use the same assumptions as those stated above 5
for steel stubbing. 6
e) Risk Spend Efficiency 7
The risk spend efficiencies for tranches defined by mitigation, decay level, pole 8
load calculation (PLC) status and high fire status are summarized in Table I-8 and Table I-9. The 9
“Estimated Units” in these tables reflect both the 20% PLC reject rate which was estimated prior to the 10
SpidaCalc client file update, and the 8.4% reject rate estimated for the new SpidaCalc client file.6 11
6 Refer to WP SCE-02, Vol. 9 (August_2015_SCE_SPIDACalc_Impact_Assessment).

23
Table I-8 Mitigation risk spend efficiencies (RSEpv) by tranche - Replacements
Unit Cost** RSEpv Estimated Units
Decay Level PLC Result High Fire
1 Replacement Highest Fail Y 15,915$ 40 5
2 Replacement Highest Pass Y 15,915$ 38 120
3 Replacement High Fail Y 15,915$ 33 9
4 Replacement High Pass Y 15,915$ 30 360
5 Replacement Highest Fail N 15,915$ 31 14
6 Replacement Highest Pass N 15,915$ 29 490
7 Replacement Medium Fail Y 15,915$ 26 5
8 Replacement Medium Pass Y 15,915$ 26 100
9 Replacement High Fail N 15,915$ 25 68
10 Replacement High Pass N 15,915$ 23 1,440
11 Replacement Low Pass Y 15,915$ 21 650
12 Replacement Medium Fail N 15,915$ 20 27
13 Replacement Medium Pass N 15,915$ 20 390
14 Replacement Low Fail Y 15,915$ 19 41
15 Replacement Low Pass N 15,915$ 16 2,690
16 Replacement Low Fail N 15,915$ 14 234
17 Replacement None Fail Y 15,915$ 5 2,183
18 Replacement None Fail N 15,915$ 4 7,646 **Unit costs are weighted average of transmission & distribution unit cost
# MitigationTranche Description
@ 9% PLC reject
($000) (MRR/$1K)

24
Table I-9 Mitigation Risk Spend Efficiencies by Tranche (RSEpv) – Repairs
f) Key Takeaways 1
(1) Modeling 2
Incremental risk associated with pole failure in high-fire areas is reflected 3
in the risk scores of otherwise similar poles. High-wind areas were not treated as a separate tranche. 4
(2) Observation(s) 5
Risk Spend Efficiency results for pole mitigations shows that when repairs 6
are possible, they represent more cost efficient mitigation relative to replacements. However, repair 7
options cannot be applied in all cases, and the time horizon of PRISM analysis does not include the full 8
life cycle of both repair and replacement options. For example, a repair lasting 20 years and a 9
replacement lasting 60 or more years are not treated differently, as long as the risk reduction achieved 10
over the next 15 years is equivalent given the current MRR forecast window extends 15 years as 11
discussed in SCE-02, Volume 1, Section III.D.2.b). 12
3. Underground Structures 13
Underground structures includes activities performed by the Underground Structure 14
Program. This program utilizes Underground Detailed Inspection (UDI) findings and detailed Field 15
Unit Cost** RSEpv Estimated Units
Decay Level PLC Result High Fire
19 Steel Stub Low Pass N 2,338$ 107 2,690
20 Repair (Guy) None Fail Y 1,913$ 43 65
21 Repair (Guy) None Fail N 1,913$ 33 229
22 E Truss* None Fail Y 4,900$ 17 2,183
23 E Truss* None Fail N 4,900$ 13 7,646
*This application is currently under review, unit cost and RSE are preliminary
**Unit costs are weighted average of transmission & distribution unit cost
# MitigationTranche Description
@ 9% PLC reject
($000) (MRR/$1K)

25
Investigations to assess and mitigate deteriorated underground vaults and manholes. SCE first 1
introduced the program in the 2009 General Rate Case as an Infrastructure Replacement program, and 2
expanded and refined the program as described in the 2012 and 2015 rate cases. 3
GO 165 requires that UDIs be performed on underground equipment. The Underground 4
Structure Program expands the scope of UDIs to include a preliminary assessment of the condition of 5
the structure containing the equipment. A UDI inspector may recommend that a structural engineer 6
perform a detailed Field Investigation assessment. The program manages the Field Investigation process 7
and evaluates findings to determine the appropriate method and timeframe for addressing deterioration 8
in the structure. 9
Up until 2014, vault replacement provided the only mitigation option for the 10
Underground Structure Program. Temporary shorings were also constructed, but only as a safety 11
measure until replacements could be completed. Late in 2014 the program began testing a long-term 12
shoring option which provides a lower-cost alternative to replacement in some cases, called adjustable 13
vault reinforcement. The program plans to scale up adjustable vault reinforcement in 2016 and to focus 14
conventional replacements on the highest risk structures. Please refer to SCE-02, Volume 5 for more 15
details the Underground Structure Program. 16
a) Risk Identification 17
Risks identified for underground structures are summarized below in Table I-10. 18

26
Table I-10 Underground Structure Risk Statements
RS# Triggering Event Outcome Impact Dimension
1
External Collapse of Nonstandard Structures with High Deterioration
(Tranche 1)
Traffic Accident Financial
2 Equipment Damage Financial
3 Outage Reliability
6 External Collapse of Standard Structure
with High Deterioration (Tranche 2)
Traffic Accident Financial Equipment Damage Financial
Outage Reliability
7
Internal Collapse of Standard Structure with High Deterioration
(Tranche 3)
Equipment Damage Financial
Outage Reliability
Internal Collapse of Standard Structure with Moderate Deterioration
(Tranche 4) Injury Safety
b) Current Residual Risk Evaluation 1
We developed CRR scores using a two-stage model of structure decay. The first 2
stage of the model forecasts the quantity of structures which are expected to fall within given location, 3
design, and deterioration levels. To forecast this quantity we used the age of the structure and level of 4
ceiling decay obtained from recent field investigations. 5
The second stage of the model forecasts the likelihood that a structure will 6
actually collapse once it reaches a certain level of decay. This stage relied on SME judgement on the 7
median number of years that structures with a given level of decay could last before experiencing a 8
collapse. Both stages of the model are described in greater detail in the following sections. 9
(1) Triggering Event Frequency (TEF) 10
The underground structure statistical model estimates the count of 11
structures with different levels of deterioration using installation dates, current ages of the underground 12
structure inventory, and field investigation results. Triggering event frequency forecasts rely on a 13
statistical model we developed using a subset that encompasses about 15% of the over 3,900 field 14
investigations that we have performed under the Underground Structure Program since its inception. 15

27
This data included structure number, design, general and specific location, and level of decay for that 1
subset of structures. 2
SMEs compared the statistical model against engineering models which 3
directly simulate the progress of decay within concrete. Engineering models suggest decay can progress 4
more rapidly than the statistical model, particularly for structures with certain designs and concrete 5
mixtures. Future refinements to the UGS model may rely more on a ground-up engineering approach 6
which identifies particular decay patterns for particular types of structures. 7
(2) Consequence Percentage (CP) and Consequence Impact (CI) 8
Consequence percentage estimates relied heavily on outage data from the 9
Outage Database and Reliability Metrics System (ODRM) and recent individual reports provided by 10
Underground Structure program management and stakeholders. Personal Injury Reports (PIR) provided 11
information on injuries occurring in conjunction with work in underground structures. 12
CP and CI calculations were estimated for each of the four triggering 13
events. These triggering events also correspond to the tranches in this risk analysis, which are covered in 14
detail in Planned Residual Risk section below. 15
- External Collapse of Nonstandard Structures with High Deterioration (Tranche 1): Data sources 16
relied on for underground structures indicate two external collapses in 10 years, or a TEF of 0.2 17
events per year. The estimated average population of structures falling into this tranche was 66 18
over a 10 year period. Dividing the annual rate of 0.2 incidents by the average tranche population 19
of 66 structures yields a CP of 0.24%. Historically, these incidents have led to vehicle damage, 20
equipment damage, and outages. The impact level for a traffic accident was set to CI 2 based on 21
the assumption that vehicle and road damage would fall between $30,000 and $300,000. The 22
consequence impact for equipment damage was also set to CI 2 assuming a similar level of 23
incremental equipment replacement costs. The consequence impact for outages was set to a CI 3 24
level based on ODRM data for a past structure collapse. 25
- External Collapse of Standard Structure with High Deterioration (Tranche 2): The structures in 26
Tranche 2 were assumed to be four times less likely as structures in Tranche 1 to be responsible 27
for external collapses based on their designs, as explained in the previous section. As a result, 28
20% of the historical rate of incidents was attributed to Tranche 2 structures. Since the historical 29
rate was calculated to be 0.2 events per year, 0.2 events per year * 20% or 0.04 events per year 30
were attributed to Tranche 2 structures. The estimated average population of structures falling 31

28
into this tranche was 587 over a ten year period. Dividing the annual rate of 0.04 incidents by the 1
average tranche population of 587 structures yields a consequence percentage of 0.01%. The 2
consequence impacts for Tranche 2 equal those of Tranche 1. 3
- Internal Collapse of Standard Structure with High Deterioration (Tranche 3): Two events were 4
observed in 10 years, resulting in an annual rate of 0.2 incidents per year. The estimated average 5
population of structures falling into this tranche was 300 over a 10 year period. Dividing the 6
annual rate of 0.2 incidents by the average tranche population of 300 structures yields a 7
consequence percentage of 0.07%. The reliability impact was set at a CI 3 level, based on the 8
same justification used for the reliability consequences for Tranches 1 and 2. Financial impacts 9
due to damaged equipment were estimated to fall in the $30,000 to $300,000 range associated 10
with CI 2 outcome. 11
- Internal collapse of Standard Structure with Moderate Deterioration (Tranche 4): Personal injury 12
report (PIR) data contains one debris-related injury in 4 years of data from the beginning of 2011 13
through the end of 2014, or an annual rate of 0.25 incidents per year. The population of 14
structures falling into this tranche was estimated at 1,600 for this 4 year period. Dividing the 15
annual rate of 0.25 incidents by the average tranche population of 1,600 structures yields a CP of 16
0.02%. The consequence severity was set to a CI 2 level based on the description of the injury in 17
the PIR report. 18
c) Mitigation Alternatives Identification 19
Three existing mitigations are currently in use and were considered in this risk 20
analysis. 21
- Conventional construction: Conventional structure replacements require a number of steps to 22
execute, including excavation of the site, removal of the structure in place, temporary removal of 23
equipment in the structure, installation of a complete new structure, and the transfer of 24
equipment into the new structure. At times, we may need to complete additional work, such as 25
repaving large sections of road surface. 26
- Adjustable vault reinforcement: Adjustable vault reinforcement improves on the shoring methods 27
we previously used to temporarily stabilize decaying surfaces in vaults. Unlike other shoring, 28
adjustable vault reinforcement provides a durable improvement to structures. This improvement 29
restores load-carrying capacity without significantly reducing the internal space available to 30
perform repairs and operations. Shoring methods and procedures designed to reduce the risk of 31

29
injury in structures may have negative consequences that are not captured in this analysis. For 1
example, temporary shoring may provide protection from debris, but can also make switch 2
operation difficult or impossible. Temporary shoring may also prevent employees from 3
performing thermal scans on equipment that is obscured by shoring materials. 4
- In-Place Vault Reinforcement: In-Place Vault Reinforcement is a technique that installs 5
permanent reinforcement to the interior of an existing decaying vaults. We use prefabricated 6
materials to install a smaller vault inside of the decaying vault. This significantly shores up the 7
structural integrity of the decaying vault. This option is much less expensive than conventional 8
replacement, because the work can be done with no excavation. This has the potential to save 9
costs on traffic control, permitting, and civil construction costs. 10
d) Mitigation Risk Reduction Evaluation 11
(1) Tranche Analysis 12
Tranches correspond to risk statements. The type and magnitude of risk 13
varies depending on a number of asset attributes. Each tranche represents a unique combination of three 14
attributes: location, design, and deterioration level. 15
- Tranche 1, External Collapse, Nonstandard Structures: Structures in this tranche have high 16
deterioration, nonstandard tunnel designs, and are located in streets. Due to their location and 17
design, these structures present a risk of collapse under surface loads. Tranche 1 structures reflect 18
a nonstandard tunnel design, which leaves the tunnel segment containing the access opening 19
particularly vulnerable to ceiling decay. This can rapidly undermine the capacity of the ceiling to 20
support load. Structures with a standard tunnel design are less vulnerable to ceiling decay, and 21
subject matter experts assume they represent a lower level of risk relative to nonstandard tunnel 22
design structures. 23
- Tranche 2, External Collapse, Standard Structures: Structures in this tranche have high 24
deterioration, standard designs, and are located in streets. Due to their location, these structures 25
present a risk of collapse under surface loads. 26
- Tranche 3, Internal Collapse, High Deterioration: Structures in this tranche have high 27
deterioration, standard designs, and are not located in streets. Due to their location, these 28
structures present a risk of internal collapse. 29

30
- Tranche 4: Internal Collapse Moderate Deterioration: Structures in this tranche have moderate 1
deterioration, standard designs, and are located in streets or other areas. Due to their deterioration 2
level, these structures present a risk to employees entering the structure. 3
(2) TEF and CP Effectiveness 4
Unlike other models that rely on TEF and CP Effectiveness estimates to 5
calculate MRR values, the underground structures analysis estimates MRR values with a series of 6
probability density functions. These functions are intended to project failure rates by tranche over time. 7
We calculate the MRR for each type of mitigation based on the tranche of 8
assets that we apply the mitigation to. SMEs assume that each mitigation discussed above will mitigate 9
100% of the risks in the 15-year analysis timeframe and MRR values vary by tranche. The per-unit 10
MRR for each tranche was calculated based on the second stage of the underground structure model as 11
discussed in Section 3b above. Based on the attributes of structures within each tranche, we developed a 12
different probability density function for failure over time. The per-unit MRR can be calculated using 13
probability density functions as a forecast of the likelihood of collapse for that individual asset. The 14
probability of failure in each future year is estimated as the product of TEF and CP values. 15
The MRR for each tranche is calculated by multiplying the probability 16
density function for each tranche (which is the equivalent of the TEF and CP product for the next 15 17
years) by the applicable consequence impact terms for the failure of an asset in that tranche. The 18
observed rate of collapses reflect the lower end of the probability density functions for each tranche. 19
This represents the relatively small amount of time that structures remain in this high deterioration state 20
before we discover the issue and repair the structure. Under the current program of UDIs and Field 21
Investigations, this should be five years at most – the three-year interval between UDI’s and a two-year 22
time period from planning to completing the replacement. 23
The expected rate of collapse for each tranche depends on the observed 24
historical rate and an assumed point in time in the future at which half the structures in that tranche 25
would have collapsed. The highest risk structures were assumed to reflect a 10-year median life, with the 26
remaining tranches experiencing 12.5, 15, and 20 year median remaining lifespans. The consequence 27
rates are consistent with observed historical rates of collapse, and the assumed median remaining 28
lifespans are comparable to the expected remaining lifespans of these structures. Structures with the 29
greatest rates of decay, installed from the mid-1960s through mid-1980s, have been in service for 30 to 30
50 years and originally were designed to last sixty years. 31

31
e) Risk Spend Efficiency 1
SMEs evaluated the current residual risk (CRR), mitigated residual risk (MRR), 2
and planned residual risk (PRR) scores for underground structure tranches with two different 3
mitigations: conventional structure replacement and adjustable vault reinforcement. The resulting risk 4
scores are shown below in Table I-11. 5
Table I-11 Underground Structure MRR & RSE
Risk Spend Efficiency (RSE) scores indicate that replacement of structures 6
located in streets generally results in higher risk benefits (Tranches 1 & 2 vs Tranches 3 & 4). The low 7
cost of shoring relative to conventional replacement produces a high RSE even for structures not located 8
in streets. It also provides a high risk value when shoring is technically feasible. Shoring and 9
replacement of moderately deteriorated structures produces a low RSE, but does not capture operational 10
benefits of maintaining access to equipment in structures. 11
f) Key Takeaways 12
(1) Data 13
The data sources we relied on in this analysis may understate the actual 14
rate of incidents caused by underground structures deteriorating. Evidence of debris-driven equipment 15
failures and outages may be destroyed by the subsequent violent failure of equipment. The energy 16
released by electrical equipment failure could also generate debris, which can be difficult to distinguish 17
from pre-existing structural decay. As awareness of the importance of this data increases, the number of 18
incidents reported will also likely increase. Since 2014, three events related to structure failure have 19
been reported. 20
Tranche ConsequenceRSE -
ConventionalRSE -
ShoringRSE -
VoltekObserved
CPCI MRRpv
Traffic accident 0.24% 2 12,353 Equipment Damage 0.24% 2 12,353 Outage 0.24% 3 123,530 Traffic accident 0.01% 2 26,040 Equipment Damage 0.01% 2 26,040 Outage 0.01% 3 260,401 Equipment Damage 0.07% 2 3,665 Outage 0.07% 3 36,650
4) Internal Collapse, Moderate
Deterioration Injury 0.00 0.00 0.00 0.02% 2 188
1) External Collapse, Nonstandard
2) External Collapse
3) Internal Collapse, High Deterioration
1.11
0.83
0.42
9.43
7.04
3.61
1.57
1.17
0.60

32
(2) Modeling 1
As mentioned in Mitigation Alternatives, shoring methods and procedures 2
designed to reduce the risk of injury in structures, particularly those with deterioration, may also have 3
consequences which are not captured in this analysis. Future analysis for underground structures may 4
consider incorporating risks associated with restrictions in operations and inspections that stem from 5
certain shoring practices. 6
Personal Injury Report (PIR) data includes injuries occurring in 7
underground structures, which cannot be directly linked to structure decay. However, conditions within 8
the structure may have played a role in these injuries. Risk analysis may produce different results if the 9
analysis incorporates data from the entire set of field investigations. We may explore incorporating more 10
data into the analysis to develop a more robust model, or to develop several models which project 11
different patterns of decay based on the attributes of the structure. 12
(3) Observation(s) 13
A substantial 500x increase in CRR from year 1 to year 10 is forecast for 14
underground structures. This trend is driven by the slow pace of concrete decay relative to the current 15
inspection cycle, as well as the near-term impact of structures with less-than-ideal concrete mixtures 16
reaching their end of service life. 17
4. Circuit Breakers 18
Circuit breakers (CBs) perform the critical function of “turning off” the flow of 19
electricity to a circuit which experiences an abnormal system condition. One such condition is an 20
electrical fault. If left unmitigated, electrical faults can draw a massive amount of energy through the 21
upstream portion of the circuit which can damage or destroy overhead conductor, underground cable, 22
distribution switches, substation buses, and transformers. In order to prevent this from occurring, circuit 23
breakers must operate quickly. A properly functioning circuit breaker is expected to detect an 24
overcurrent condition and isolate the circuit in less than one-tenth of a second. 25
Distribution circuit breakers are typically located in residential and commercial area 26
substations (“B” substations). At these substations, electricity is transformed from a sub transmission 27
level voltage (usually 66 kV but sometimes 115 kV) down to a distribution level voltage of either 33 kV, 28
13 kV, 16 kV, 12 kV, 4 kV, or 2.4 kV. The distribution (non-bulk) circuit breaker replacement program 29
identifies and replaces breakers that are approaching the end of their service lives and therefore 30
becoming increasingly unreliable. Such breakers may also contain parts prone to failure or that are no 31
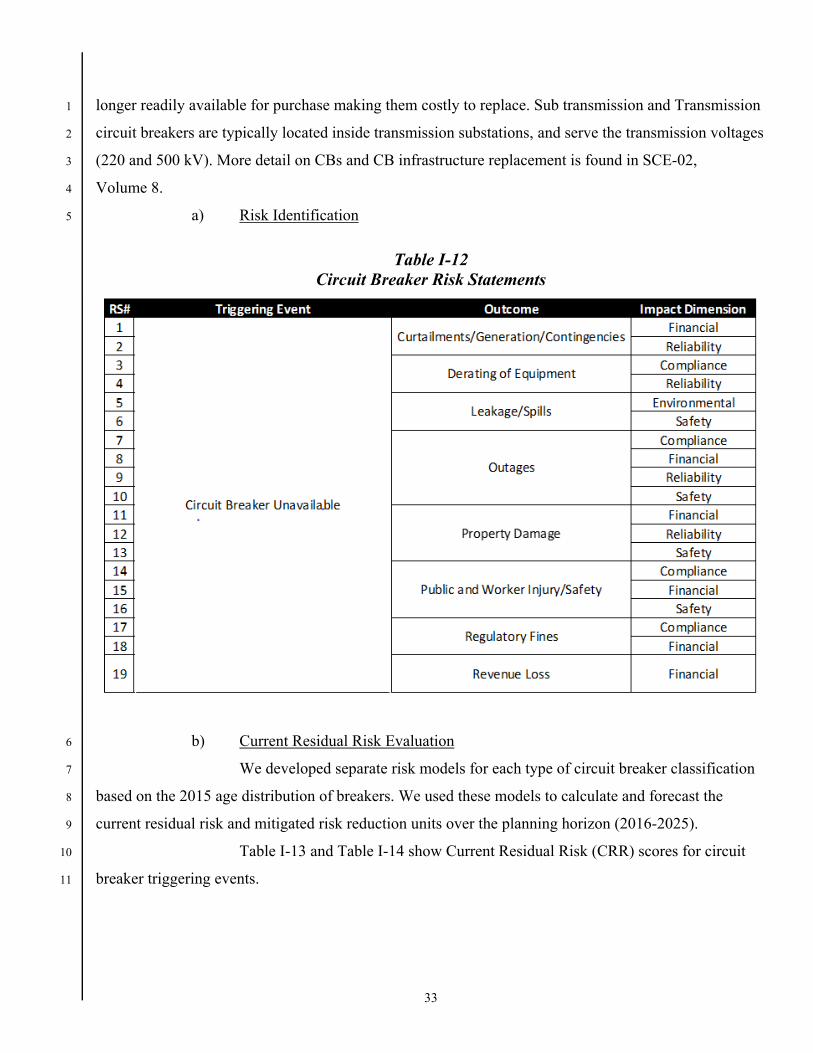
33
longer readily available for purchase making them costly to replace. Sub transmission and Transmission 1
circuit breakers are typically located inside transmission substations, and serve the transmission voltages 2
(220 and 500 kV). More detail on CBs and CB infrastructure replacement is found in SCE-02, 3
Volume 8. 4
a) Risk Identification 5
Table I-12 Circuit Breaker Risk Statements
b) Current Residual Risk Evaluation 6
We developed separate risk models for each type of circuit breaker classification 7
based on the 2015 age distribution of breakers. We used these models to calculate and forecast the 8
current residual risk and mitigated risk reduction units over the planning horizon (2016-2025). 9
Table I-13 and Table I-14 show Current Residual Risk (CRR) scores for circuit 10
breaker triggering events. 11

34
Table I-13 CB <=115kV CRR Scores
Table I-14 CB 220 & 500kV CRR Scores
(1) Triggering Event Frequency (TEF) 1
The circuit breaker triggering event is described as “circuit breaker being 2
unavailable,” which includes CB failure, CB explosion, and a non-operational CB due to potential faults 3
upstream or downstream. We evaluated and scored the triggering event for each two categories of CBs: 4
less than or equal to 115 kV and 220/500 kV CBs. Based on a driver analysis, we evaluated specific 5
mitigation plans that would reduce risks over the planning horizon (2016-2025). 6
The PRISM 2016 risk modeling framework pairs a Weibull curve with the 7
chronological age distribution of in service circuit breakers. A Weibull, or failure curve, provides an 8
estimated probability of failure for a given asset based on asset age; it is derived through a statistical 9
analysis of historical failures. The risk analysis assumes that assets removed preemptively were close to 10

35
in-service failure had action not been taken. This assumption is reasonable, given that we frequently test 1
and monitor these assets. That testing and monitoring provides an up-to-date indication of asset health, 2
which informs our decision to preemptively replace the asset. 3
The circuit breaker risk model calculates the end-of-life leading to 4
potential failure of circuit breakers over the planning horizon (2016-2025) based on the 2015 age 5
distribution and using the Weibull failure rate coefficients as described above. The model calculates the 6
end-of-life count of assets leading to in-service failures for that particular year based on the age 7
distribution of SCE’s portfolio of CBs in that current year. When a circuit breaker fails in a particular 8
year, the model replaces that breaker with a new unit with an age of “1” for the model to age for future 9
year projections. The age of the entire circuit breaker population is then increased by one year for the 10
subsequent year to calculate the failure rates. The process is repeated over the planning horizon (2016-11
2025) to forecast the current residual TEF units. 12
(2) Consequence Percentage (CP) and Consequence Impact (CI). 13
We perform detailed analysis, using multiple data sources, to map TEF to 14
the appropriate risk statements and calculate the CP. The Worst Reasonable Direct Impact (WRDI) 15
approach is used to score risks. In cases where there was limited or no data, SMEs relied on judgement 16
to evaluate risks. 17
c) Mitigation Alternatives Identification 18
The SCE Substation Infrastructure Replacement (SIR) program preemptively 19
replaces major pieces of aging or obsolete substation equipment in order to minimize the negative effect 20
of aging equipment on system reliability, safety, and operability/maintainability. The SIR program 21
includes two functions: Transformer Replacement and Circuit Breaker Replacement. This circuit breaker 22
risk model evaluates the current SIR Circuit Breaker Replacement process.7 23
d) Mitigation Risk Reduction Evaluation 24
(1) Tranche Analysis 25
For the purpose of this risk analysis, the following voltages are used to 26
divide SCE circuit breakers in two classes, or tranches of assets for analysis: 27
- Circuit Breakers less than and equal to 115 kV 28
7 Refer to SCE-02, Vol. 8 for more detail on the SIR program.

36
- Circuit Breakers 220 kV & 500 kV 1
(2) TEF and CP Effectiveness 2
Subject Matter Experts (SMEs) evaluated mitigations by quantifying their 3
impact on TEF, assuming that CP and CI remained unchanged over the planning horizon (2016-2030). 4
To forecast the MRR, we assume that we replace the oldest circuit breakers first. Since the CP and CI 5
remain unchanged, the MRR can be calculated for each CB in each tranche using a Weibull probability 6
density function alone. The probability density function is discounted at 10% to calculate the Net 7
Present Value (NPV) of avoided TEF. The MRR is then calculated as the product of the NPV of TEF, 8
CP, and CI. 9
e) Risk Spend Efficiency 10
MRR per unit and unit costs are used to calculate the Risk Spend Efficiency 11
(RSE) over the planning horizon, which is shown below in Table I-15. RSE decreases over time because 12
assets forecast to be replaced in the future are not as old as the assets replaced in the first year. 13
Table I-15 Circuit Breaker Mitigation Risk Spend Efficiencies by Year of Expected Replacement
f) Key Takeaways 14
(1) Modeling 15
SMEs identified multiple potential improvements for the risk model 16
related to how Consequence Impact is measured for substation risks. A cross-functional group of SMEs 17
will continue to improve the circuit breaker risk analysis model by considering scoring issues related to 18
grid reliability, financial impact, and the safety risk dimension. SMEs will also consider the possibility 19
Year RSEPV (CB<=115kV) RSEPV (220kV & 500kV)2016 13.9 1.1 2017 13.8 1.0 2018 13.7 1.0 2019 13.3 1.0 2020 12.4 1.0 2021 11.3 0.9 2022 10.7 0.9 2023 10.0 0.8 2024 9.0 0.7 2025 7.7 0.5

37
of measuring circuit breaker risks with additional tranche classifications that account for the insulating 1
medium (i.e. Oil, SF6, Gas, Vacuum and Air CBs). 2
5. Transformers 3
A substation power transformer controls the continuity of the power supply and when it is 4
unavailable through failure or other circumstance a stoppage or reduction in power supply is sustained. 5
Risk scoring for this asset covers B-Bank (<115 kV), A-Bank (220 kV), and AA-Bank (500 kV) 6
transformers. 7
a) Risk Identification 8
Table I-16 Transformer Risk Statements
b) Current Residual Risk Evaluation 9
Table I-17, Table I-18, and Table I-19 show Current Residual Risk (CRR) scores 10
for transformer triggering events for B, A, and AA-Bank transformers. 11

38
Table I-17 B-Bank Transformer CRR Scores
Table I-18 A-Bank Transformer CRR Scores
Table I-19 AA-Bank Transformer CRR Scores
Triggering Event Outcome Safety Reliability Financial Environmental Compliance Subtotal % of TotalCurtailments/Generation/Contingencies 20,034 20,034 71%Derating of Equipment 29 29 0%Outages 0 0 0%Power Quality - - 0%Property Damage 8,014 8,014 29%Regulatory Fines 0 0 1 0%Revenue Loss 0 0 0%Safety Incident 2 Leakage/Spills 29
Subtotal 2 29 28,048 29 0 28,107 % of Total 0% 0% 100% 0% 0%
AA Bank Transformers 1-Year Current Residual Risk (CRR)
Transformer Unavilibility

39
(1) Triggering Event Frequency (TEF) 1
The transformer triggering event is described as transformer 2
unavailability. We evaluated and scored the triggering event for three categories of transformers: B, A, 3
and AA-Bank. 4
The transformer risk analysis pairs a Weibull curve with the chronological 5
age distribution of in service transformer banks similar to the CB analysis. The risk analysis assumes 6
that transformers removed preemptively were close to in-service failure had action not been taken. This 7
assumption is reasonable, given that we frequently test and monitor these assets. That testing and 8
monitoring provides an up-to-date indication of asset health, which informs our decision to preemptively 9
replace the asset. 10
(2) Consequence Percentage (CP) and Consequence Impact (CI) 11
We performed detailed analysis, using multiple data sources, to map TEF 12
to the appropriated risk statements and calculate the CP. The Worst Reasonable Direct Impact (WRDI) 13
approach is used to score risks. In cases where there was limited data for safety and financial outcomes, 14
SMEs relied on judgement to evaluate risks by transformer bank classification: 15
- B-Banks (< =115 kV): Outage risk CP and CI values were determined through an ODRM 16
analysis using the WRDI approach. Safety risks were set at a CI6 level based on an event of 17
significant injury related to copper theft at substations. 18
- A-Banks (220 kV): Outage risk CP and CI values were determined in the same way as other 19
transformer bank classes. Financial risks linked to property damage were informed by SME 20
judgement. 21
- AA-Banks (500 kV): Outage risk CP and CI values were determined in the same way as other 22
transformer bank classes. Limited data is available to evaluate curtailments and property 23
damages for AA-Banks; SMEs relied on a past incident to determine financial risk CP and CI 24
values. 25
c) Mitigation Alternatives Identification 26
The SCE Substation Infrastructure Replacement (SIR) program preemptively 27
replaces major pieces of aging or obsolete substation equipment in order to minimize the negative effect 28
of aging equipment on system reliability, safety, and operability/maintainability. The SIR program 29
40
includes two functions: Transformer Replacement and Circuit Breaker Replacement. This transformer 1
risk model evaluates the current SIR Transformer Replacement process.8 2
d) Mitigation Risk Reduction Evaluation 3
(1) Tranche Analysis 4
For the purpose of this risk analysis, the following voltages are used to 5
divide SCE transformer banks in three classes, or tranches of assets for analysis: 6
- AA-Bank transformers are located in major substations where electricity enters the transformer 7
at the 500 kV transmission level and is transformed down to a 220 kV sub-transmission voltage. 8
- A-Bank transformers are located in major substations where electricity enters the transformer at 9
the 220 kV transmission level and is transformed down to either a 115 kV or 66 kV sub-10
transmission voltage. 11
- B-Bank transformers are typically located in neighborhood substations where electricity enters 12
the transformer at the sub-transmission level (66 or 115 kV) and is transformed down to 33 kV, 13
16 kV, 12 kV, or 4 kV. B-Banks then send the electricity out onto distribution circuits that feed 14
pole-mounted, pad-mounted, or sub-surface line transformers. 15
(2) TEF and CP Effectiveness 16
SMEs evaluated mitigations by quantifying their impact on TEF, assuming 17
that CP and CI remained unchanged over the planning horizon (2016-2030). Transformer MRR scores 18
were calculated with the same method used to calculate CB MRR scores described in the prior section. 19
We used inputs that reflect the number and age of transformers within SCE territory, and Weibull 20
functions for each of the three transformer classes. 21
e) Risk Spend Efficiency 22
MRR per unit and unit costs are used to calculate the Risk Spend Efficiency 23
(RSE) over the planning horizon, which is shown below in Table I-20. Transformer RSEs decrease over 24
time because the aging of the transformer population means that in the near term we are replacing older, 25
more risky assets. In the future, the model assumes those aging assets will have been replaced, and we 26
will have a younger less risky portfolio of transformers. 27
8 Refer to SCE-02, Vol. 8 for more detail on the SIR program.

41
Table I-20 Transformer Mitigation Risk Spend Efficiencies by Year of Expected Replacement
f) Key Takeaways 1
(1) Modeling 2
SMEs identified multiple potential improvements for the risk model 3
related to how Consequence Impact is measured for substation risks. A cross-functional group of SMEs 4
will continue to improve the transformer risk analysis model by considering scoring issues related to 5
grid reliability, financial impact, and the safety risk dimension. 6
6. Underground Cables 7
Distribution underground cable is mitigated through two primary programs: Worst 8
Circuit Rehabilitation (WCR) and Cable-in-Conduit Replacement (CIC). The WCR program is an 9
ongoing effort to manage system reliability by dealing with the challenge of infrastructure aging. 10
The two-fold objective of the WCR program is to: (1) minimize the negative impact of 11
infrastructure aging on overall system reliability; and (2) minimize the disparity among levels of 12
reliability received by customers served by different circuits. 13
The WCR program focuses attention on those circuits which are disproportionately high 14
in terms of their contribution to System Average Interruption Duration Index (SAIDI) and System 15
Average Interruption Frequency Index (SAIFI). The program also focuses on those circuits whose 16
average customers are receiving relatively lower service reliability. Circuit rehabilitation typically 17
involves replacing each circuit’s most risk-significant mainline cable. This program also replaces 18
infrastructure that has a lower reliability record, and adds circuit enhancements such as automation, 19
automatic reclosers, branch line fuses, and fault indicators. 20
Year B Bank (RSE) A Bank (RSE) AA Bank (RSE)2016 4.4 1.6 1.8 2017 3.9 1.2 1.4 2018 3.3 1.0 1.4 2019 3.1 0.6 1.3 2020 2.9 0.1 0.9 2021 2.7 0.1 0.5 2022 2.5 0.0 0.4 2023 2.2 0.0 0.3 2024 1.9 0.0 0.2 2025 1.6 0.0 0.2

42
The CIC Replacement Program preemptively replaces segments of SCE cable 1
approaching the end of service life. CIC began to be installed in the late 1960’s due to many immediate 2
benefits. However, decades later, we found that CIC is difficult to replace. Although CIC was easy to 3
install, it is challenging to pull it out. A typical outage caused by an in-service failure of CIC is over 20 4
hours. This indicates the importance of preemptively replacing this cable. 5
Due to the difficulty in estimating the remaining life of CIC, SCE has been using the 6
Cable Life Extension Program (CLE) to determine which CIC to replace. Please refer to SCE-02, 7
Volume 2 (Infrastructure Replacement) for further details on the CIC Replacement Program and the 8
Cable Life Extension program. 9
a) Risk Identification 10
The team identified a set of risks to score, which are summarized in the tables 11
below. Table I-21 shows the risk associated with contact with underground cable in a cable riser. This 12
occurs as a result of attempted theft of the cable, and results in a safety incident with safety and financial 13
impacts. 14
Table I-22 shows the risk associated with underground cable failing in service, 15
which can result in an outage with a reliability impact, as well as a safety incident with safety and 16
financial impacts. Table I-23 shows the risk associated with CIC cable failing in service, which can 17
result in an outage with a reliability impact, a property fire with safety and financial impacts, and a 18
safety incident with safety and financial impacts. 19
Table I-21 UG Cable Riser Risk Statements
RS# Triggering Event Outcome Impact
1a Safety
1b FinancialSafety IncidentContact with Underground Cable

43
Table I-22 WCR Risk Statements
Table I-23 CIC Risk Statements
b) Current Residual Risk Evaluation 1
CRR scores are presented in the tables below. Underground (UG) Cable Riser risk 2
is primarily driven by safety, while the risk for mainline and CIC Cable failure is primarily driven by 3
reliability. 4
Table I-24 UG Cable Riser CRR Scores
RS# Triggering Event Outcome Impact
1 Outage Reliability
2a Safety
2b Financial
Underground Cable FailureSafety Incident
RS# Triggering Event Outcome Impact
1 Outage Reliability
2a Safety
2b Financial
3a Safety
3b Financial
Property FireCIC Cable Failure
Safety Incident
Triggering Event Outcome Safety Reliability Financial Environmental Compliance Subtotal % of TotalContact with Underground Cable Safety Incident 125,000 - 1,250 - - 126,250 38%
Subtotal 125,000 - 1,250 - - 126,250 % of Total 99% 0% 1% 0% 0%
1-Year Current Residual Risk (CRR)

44
Table I-25 WCR CRR Scores
Table I-26 CIC CRR Scores
(1) Triggering Event Frequency (TEF) 1
Underground cable analysis identifies three TEFs associated with in-2
service cable failures. 3
- UG Cable Riser: The triggering event forecast is based on the frequency of the single observed 4
event, which was once in eight years according to CPUC Reportable Incidents data. 5
- WCR: The forecast of Triggering Events for WCR was defined by the overall SAIDI level if the 6
system were allowed to progress without any proactive replacement of underground cable. The 7
contribution of WCR to the unmitigated SAIDI level was converted to triggering events using 8
the historical average SAIDI contribution of mainline cable failure according to ODRM. 9
- CIC: The CIC triggering event forecast was calculated based on the CIC cable population 10
according to Facilities Inventory Mapping (FIM) cable population data along with the probability 11
of failure as described by a Weibull model. 12
(2) Consequence Percentage (CP) and Consequence Impact (CI) 13
Underground cable analysis also estimates the CP and CI terms associated 14
with the three TEFs associated with in-service cable failures. 15
- UG Cable Riser: The safety CI and CP for contact with underground cable was based on a 16
review of CPUC Reportable Incidents data. Given that there was a single event identified, the CP 17
Triggering Event Outcome Safety Reliability Financial Environmental Compliance Subtotal % of TotalSafety Incident 753 - 75 - - 828 0%Outage - 327,530 - - - 327,530 100%
Subtotal 753 327,530 75 - - 328,358 % of Total 0% 100% 0% 0% 0%
1-Year Current Residual Risk (CRR)
Underground Cable Failure
Triggering Event Outcome Safety Reliability Financial Environmental Compliance Subtotal % of TotalSafety Incident 2.03 - 0.02 - - 2 0%Property Fire 9,466 - 947 - - 10,413 17%Outage - 52,170 - - - 52,170 83%
Subtotal 9,468 52,170 947 - - 62,585 % of Total 15% 83% 2% 0% 0%
1-Year Current Residual Risk (CRR)
CIC Cable Failure

45
was set to 100% and the CI was set to level 6 based on the outcome of the event. The financial 1
CI was set to 4 based on guidance from claims for expected financial outcomes related to safety 2
incidents of this severity. 3
- WCR: The safety CI was set to level 5 for the safety incident according to the outcome of the 4
single event that was identified. The CP was calculated based on one event divided by the 5
number of faults we have seen on underground cable according to ODRM. The associated 6
financial CI was set to 3, again based on the guidance for expected financial outcomes. The 7
outage CI and CP was based on a WRDI analysis of historical ODRM data, which resulted in a 8
CI of 2 and a CP of 90%. These values were reached using the CAIDI measure, which is roughly 9
a 30% increase over the CP using SAIDI. 10
- CIC: The safety incident was not based on an observed outcome, but was based on the 11
probability of a safety incident occurring, given SCE has responded to a customer who 12
experienced a minor shock while swimming in a pool and determined the cause to be degraded 13
underground cable. This type of pool shock would become a CI level 6 safety incident if there 14
happened to be a fault condition at that time. We calculated the CP based on this assumption, 15
which is the probability of the pool shock occurring times the proportion of time CIC cable is in 16
fault condition, which results in an overall CP of 0.0000005%. The associated financial CI was 17
set to 4 as the expected financial outcome for a level 6 safety outcome. The property fire CI was 18
set to 5 in order to align with the property fire identified for distribution overhead conductor as 19
the event identified for CIC cable did not have a clearly documented outcome. The CP was 20
calculated based on the single event divided by the number of faults that would have been seen 21
over the timeframe of the available data. 22
c) Mitigation Alternatives Identification 23
No existing mitigations were identified for UG Cable Riser risks. The only 24
mitigation identified for mainline cable is the existing WCR program, which identifies the system’s 25
worst performing circuits and mitigates with enhancements including replacing deteriorated cable and 26
installing automation devices to reduce the impact of future outages. Regarding CIC, mitigations include 27
CLE testing and cable replacement programs, which have been combined and scored as a single 28
mitigation for the purpose of linking risk benefits directly to the cost of testing. Cable rejuvenation, or 29
cable injection, is a CIC program currently being piloted, where cable is injected with a special solution 30
in order to restore insulation. 31

46
d) Mitigation Risk Reduction Evaluation 1
(1) Tranche Analysis 2
WCR tranches consist of various levels. This varies from methods used 3
with other assets; however, this approach still allows for an assessment on the expected diminishing 4
returns for increasing investment. This approach is taken for tranching because the benefits for each year 5
of mitigation are contingent on the investment made in previous years for the WCR program. 6
CIC tranches were developed according to results of cable life extension 7
testing as there are varying levels of impact based on information gained during testing. 8
(2) TEF and CP Effectiveness 9
WCR and CIC mitigation risk reduction is calculated by estimating the 10
amount of TEF reduction associated with these mitigations. We have assumed that CP/CI are unaffected 11
by the mitigations under evaluation. 12
- WCR TEF Effectiveness: WCR serves to improve the reliability performance of poor performing 13
circuits by replacing old cable as well as installing circuit enhancements, which reduces the 14
impact of future outages on the system. The risk reduction for WCR is based on the projected 15
SAIDI output from the 2015 GRC CYMDIST model. For each level of investment, the projected 16
SAIDI level was translated into number of events according to the historical average SAIDI per 17
outage as identified in ODRM. This indicates the number of triggering events avoided and risk 18
scores can be calculated directly based on the CI/CP values for outages and safety incidents. 19
SMEs have also considered the possibility that WCR would also reduce the CI of outages, 20
however a simplifying assumption was made to translate all benefits avoided to TEF 21
Effectiveness. 22
- CIC TEF Effectiveness for Insulation Failure: We have assumed that a segment of cable that 23
fails a CLE test has a uniform probability density function over a 10 year period. Based on 24
historical data, we have also assumed that there are 8 segments per mile of cable and so the 25
replacement of a mile of cable will avoid 8 failures over a 10 year period. Risk scores are 26
calculated based on the outages avoided, without any benefit to property fires or safety incidents. 27
- CIC TEF Effectiveness for Concentric Neutral Failure: The number of triggering events avoided 28
for cable with concentric neutral failure is based on the Weibull probability of failure for 29
underground cable. Once the expected number of avoided failures is calculated, the risk score is 30
evaluated with the CI/CP values for outages, safety incidents, and property fires. The number of 31

47
failures avoided is significantly lower than cable that fails via insulation failure. Cable tests with 1
insulation and concentric neutral failure results are evaluated for outages, property fires, and 2
safety incidents. 3
- CIC TEF Effectiveness for Cable Rejuvenation: The risk benefit for Cable Rejuvenation is 4
assumed to be the same as CIC replacement for insulation failure; that is that cable will perform 5
as well as new cable for after rejuvenation work. 6
e) Risk Spend Efficiency 7
Risk Spend Efficiency (RSE) results for underground cable can be seen in Table 8
I-27 and Table I-28 below. Regards WCR, high program costs counter-balance reliability benefits for 9
the program. In contrast, cable rejuvenation scores show potential for the program if the pilot meets 10
expectations. 11
Table I-27 WCR Mitigation RSEs
Table I-28 CIC Mitigation RSEs
a) Key Takeaways 12
(1) Modeling 13
The cable failure model is a key input for this risk analysis and will need 14
to be refreshed. We expect this refresh to improve the way in which we model the cable replacement and 15
enhancement aspects of the WCR program. Areas for improvement also include, validation of the 16
Mitigation Tranche DescriptionUnits per Tranche
Unit of Measure MRRPV
Cost($000)
RSEPV
(MRRPV/$1K)WCR 98 miles per year 1 Program 365,184 337,120$ 1.08WCR 195 miles per year 1 Program 721,329 670,800$ 1.08WCR 260 miles per year 1 Program 941,132 894,400$ 1.05WCR 325 miles per year 1 Program 1,145,632 1,118,000$ 1.02WCR 390 miles per year 1 Program 1,423,345 1,341,600$ 1.06WCR 455 miles per year 1 Program 1,577,111 1,565,200$ 1.01
Mitigation Tranche DescriptionUnits per Tranche
Unit of Measure MRRPV
Cost($000)
RSEPV
(MRRPV/$1K)Cable Replacement Insulation Failure 60 miles 485 345$ 1.41Cable Replacement Concentric Neutral Failure 75 miles 86 345$ 0.25
Cable ReplacementInsulation & Concentric Neutral Failure 15 miles 514 345$ 1.49
Cable Rejuvenation Cable Rejuvenation 70 miles 485 130$ 3.73

48
probability density function for inspection-failed insulation, performance of rejuvenated cable, as well as 1
circuit level risk scoring. Risk analysis for underground cable will be updated to reflect these changes 2
once they are available. 3
We also plan to increase the breadth of mitigations evaluated from a risk 4
perspective. WCR includes compliance civil work for ducts and structures that do not meet current SCE 5
standards, which was not scored for PRISM 2016. This work is primarily driven by structures that house 6
equipment being replaced as well as duct banks that have too many runs of cable. While the benefits 7
related to this work were not scored, the cost of the related civil work is included in the unit cost, which 8
serves to reduce the spend efficiency of WCR. The CIC risk analysis scored for fault conditions, not for 9
steady-state conditions. These examples of unscored risks represent elements to revisit in subsequent 10
iterations of risk scoring. 11
7. 4 kV Circuits 12
SCE 4 kV Programs, as defined in SCE-02, Volume 3, consist of two programs: the 4 kV 13
Overload-Driven Cutover Program and the 4 kV Substation Elimination Program. The former is aimed 14
at maintaining distribution circuit and substation demand beneath loading thresholds, and is 15
accomplished by transferring 4 kV customers to higher voltage circuits (i.e., “cutting over”) whenever 16
these thresholds are violated. The latter, the 4 kV Substation Elimination Program, is a proactive 17
elimination program aimed at systematically removing antiquated 4 kV infrastructure that is no longer 18
suitable for today’s distribution needs. 19
a) Risk Identification 20
The 4 kV circuit scoring analyzed the prioritization of the 4 kV Overload-Driven 21
Cutover Program and the 4 kV Substation Elimination Program. The risk scoring framework was 22
applied to 42 cutover and elimination projects. These projects were already prioritized based on 23
engineering analysis that accounts for six drivers: (1) old and obsolete equipment; (2) space constraints; 24
(3) operational inflexibility and voltage quality; (4) insufficient capacity; (5) energy loss; and 25
(6) distributed energy resource integration. In addition to these drivers, subject matter experts provided 26
input on creating this prioritization. 27
b) Current Residual Risk Evaluation 28
The CRR for the reconductoring and branch line fusing of the circuits associated 29
with each project was taken from the analysis performed by the Distribution AST SMEs. These risk 30
scores were only available as a representation of a single year of risk. The CRR for the transformer 31

49
banks associated with a substation can be taken from the set of scores calculated by the Substation 1
SMEs. The 4 kV systems analysis took the single year CRR scores from 2016 – 2025 for the B-bank 2
tranche. Scores were not available for the 4 kV bank-level or the individual substation level. To narrow 3
the focus of the scores from the B-bank tranche, the 4 kV systems analysis took the weight of the 4 kV 4
banks from the tranche of B-banks, which was calculated to be 32.94%. This weight was applied to the 5
CRR scores to approximate the risk on a 4 kV tranche. Next, the 4 kV systems analysis calculated the 6
CRR per unit from the CRR scores for the 4 kV tranche. This value was then multiplied by the number 7
of 4 kV banks at the substation to determine the single year CRR scores for banks at that substation. A 8
similar analysis was applied to the circuit breakers at these sites using the weight of 4 kV CBs out of the 9
tranches of distribution CBs of 11.21%. The CRR for each project will also reflect the number and 10
impact of forecast capacity overloads at each of the substations listed in the 5-year plan. 11
(1) Triggering Event Frequency (TEF) 12
As 4 kV scoring was based on the various assets that would be cutover and 13
thus have their risk removed from the system, the TEFs related to the unavailability of the distribution 14
assets, substation assets, and capacity overloads was incorporated from the appropriate other scoring 15
areas. 16
(2) Consequence Percentage (CP) and Consequence Impact (CI) 17
As 4 kV scoring was based on the various assets that would be cutover and 18
thus have their risk removed from the system, the CP and CI related to the unavailability of the 19
distribution assets, substation assets, and capacity overloads was incorporated from the appropriate other 20
scoring areas. 21
c) Mitigation Alternatives Identification 22
The existing mitigation to combat issues on the 4 kV system is to cutover the 4 23
kV circuit to 12 kV or 16 kV and to eliminate the substation. 24
d) Mitigation Risk Reduction Evaluation 25
(1) Tranche Analysis 26
The analysis looked at all 4 kV substation cut-over/ elimination projects 27
and did not tranche further. 28
(2) TEF and CP Effectiveness 29
Mitigated risk reduction (MRR) scoring compiles the risk mitigated by 30
cutting over circuits and eliminating substations on a per-project basis. For risks associated with cutting 31

50
over the circuit, the MRR for reconductor and branch line fusing was compiled for each individual 1
circuit; the scores for each circuit associated with a substation elimination project were added together to 2
form the aggregate circuit MRR for a specific project. 3
For risks associated with eliminating the substation, it was assumed that 4
the risks associated with the circuit breaker and transformer failing would be reduced to zero starting in 5
the year after the substation elimination, since those assets would be no longer exist. However, the risks 6
associated with these substation assets would continue to exist until the elimination takes place. 7
Therefore, the MRR for each specific substation asset would be zero through the year of the substation 8
elimination, and would be equal to the CRR for each year after the substation elimination. 9
For risks associated with potential capacity overloads at the substations, 10
we completed an analysis to determine the difference between the mitigated and unmitigated forecast, as 11
well as impact of potential capacity overload, at each substation to drive a capacity MRR for each 12
project. This MRR would take effect in the year after the substation elimination. The sum of the MRR 13
for the circuit and substation assets, as well as the MRR from the capacity perspective, represents the 14
project MRR. 15

51
e) Risk Spend Efficiency 1
Table I-29 RSEs by 4 kV Project

52
Table I-29 shows the mitigated risk reduction and risk spend efficiencies 1
for each project. Note that this table does not line up with the 4 kV list in SCE-02, Volume 3 because 2
these risk scores do not take all 4 kV risks into account. As the 4 kV risk scoring process evolves 3
alongside the asset plan, risk scores will reflect all 4 kV work. These values reflect the present value of 4
risk benefits over a 15-year planning cycle. Costs shown are from project sponsor. Elimination years 5
shown are from the IR group. 6
f) Key Takeaways 7
(1) Modeling 8
Our 4 kV risk model included two of the six drivers explained in the 9
System Planning volume (SCE-02, Volume 3). The two drivers included are old and obsolete equipment 10
and operational inflexibility. Future scoring may consider how to incorporate the other four drivers used 11
to prioritize SCE 4 kV Programs. 12
Low voltage was identified as a risk associated with 4 kV systems, but 13
voltage-related risks could not be captured by the existing Reliability dimension. The 4 kV PST 14
proposed a new risk dimension, Customer Expectation, in order to capture the risk related to voltage. 15
However, we will need to undertake further analysis and refinement in the future before the Customer 16
Expectation risk dimension can formally be considered for adoption into the Risk Evaluation Tool. 17
8. Vegetation Management 18
The risk analysis for Vegetation Management covers several of the ways that SCE 19
mitigates against the risks vegetation presents to both the safety of the public and the reliability of the 20
electric grid. Vegetation Management mitigations focus on reducing the frequency of wire down events 21
and line outages. More detail on the program is found in SCE-02, Volume 4. This is the first time 22
PRISM has analyzed the Vegetation Management program. 23
a) Risk Identification 24
The risk event-outcome-impact combinations used to describe vegetation-related 25
risk are summarized in Table I-30. Two common triggering events analyzed were vegetation causing a 26
wire down and vegetation causing an outage. Scoring focused around vegetation across the system 27
growing into lines to cause an outage, palm fronds contacting lines and causing outages or wire downs, 28
and trees on the Crestline, Estaban, Jasper, Kinneloa, and Moritz circuits, which are among the high-fire 29
circuits that are most prone to vegetation-caused outages or wire downs. These scoring areas are 30
described more in-depth below in Table I-30 31

53
Table I-30 Summary of Vegetation-Related Risks Reflected in Risk Model
b) Current Residual Risk Evaluation 1
Risk Score inputs were determined from historical data. Table I-31 gives an 2
overview of the Vegetation Management CRR scores. 3
RS# Triggering Event Outcome Impact1 Vegetation Grows Into Line Outage Reliability
SafetyFinancial
EnvironmentalSafety
FinancialOutage Reliability
Freeway/Road Closure FinancialSafety
Financial3 Palm Tree Causes Outage Outage Reliability
4Tree on Crestline, Estaban, Jasper, Kinneloa, or Moritz Circuit Causes
OutageOutage Reliability
SafetyFinancial
EnvironmentalSafety
FinancialOutage Reliability
Freeway/Road Closure FinancialSafety
Financial
5
2
Wildfire
Property DamagePalm Tree Causes Wire Down
Injury
Tree on Crestline, Estaban, Jasper, Kinneloa, or Moritz Circuit Causes
Wire Down
Wildfire
Property Damage
Injury

54
Table I-31 Vegetation Management CRR Scores
Triggering Event Outcome Safety Reliability Financial Environmental Compliance Subtotal % of TotalVegetation Grows Into Line Outage 50,000 - - 50,000 15%
Wildfire 1,024 - 1,024 1,024 - 3,071 1%Property Damage 320 - 5 - - 325 0%
Outage - 7,810 - - - 7,810 2%Freeway/Road Closure - - 157 - - 157 0%
Injury 15,996 - 160 - - 16,156 5%Palm Tree Causes Outage Outage - 25,673 - - - 25,673 8%Vegetation Blows
Into Line* Outage - 51,810 - - - 51,810 16%
Wildfire 6,236 6,236 6,236 18,708 6%
Property Damage 1,949 33 1,982 1%
Outage 47,571 47,571 15%
Freeway/Road Closure 958 958 0%
Injury 97,432 974 98,406 30%Tree on Crestline, Estaban, Jasper,
Kinneloa, or Moritz Circuit
Causes Outage Outage - 594 - - - 594 0%
Wildfire 29 29 29 87 0%
Property Damage 9 0 9 0%
Outage 220 220 0%
Freeway/Road Closure 4 4 0%Injury 451 - 5 - - 456 0%
Subtotal 123,446 183,678 9,585 7,289 - 323,999 % of Total 38% 57% 3% 2% 0%
1-Year Current Residual Risk (CRR)
Palm Tree Causes Wire Down
Tree on Crestline, Estaban, Jasper,
Kinneloa, or Moritz Circuit Causes Wire
Down
Vegetation Caused Wire
Down*
* This is a PRR, as although Compliance Trims do not exist to prevent Blow In Outages and Wire Downs, stopping those trims would lead to an increase in both.

55
(1) Triggering Event Frequency (TEF) 1
Vegetation Management TEFs were calculated from a count of wire 2
downs and outages tagged as caused by vegetation contacting our lines. The data sources we used for 3
this measurement include: 4
• Vegetation grow-in outages from ODRM data; 5
• Palm tree-caused wire downs from O&QA data; 6
• Palm tree-caused outages from Tree-Caused Circuit Interruption investigation data; 7
• Crestline, Estaban, Jasper, Kinneloa, and Moritz circuit vegetation-caused outages from 8
ODRM data; and 9
• Crestline, Estaban, Jasper, Kinneloa, and Moritz circuit vegetation-caused wire downs from 10
predicted Wire Down model created by OH Conductor team. 11
(2) Consequence Percentage (CP) and Consequence Impact (CI) 12
All wire down CP and CI levels were based on the Overhead Conductor 13
analysis. Explanations for CP and CI distinctions for Overhead Conductor scores can be found in section 14
I.B.1.b)(2). 15
For vegetation growing into the line causing an outage, we analyzed the 16
grow-in outages from ODRM and tagged with a CI based on the level of Customer Hours of Interruption 17
(CHI) that they caused. We then calculated a CP based on the proportion of each CI level versus the 18
whole. The score was based on the WRDI CI level. 19
Palms contacting a line and causing an outage were scored by analyzing 20
TCCI data, in which outages are tagged by tree type. Palm-caused outages were tagged with a CI based 21
on the level of Customer Hours of Interruption (CHI) that they caused. A CP was then calculated based 22
on the proportion of each CI level versus the whole, and the score was based on the WRDI CI level. 23
Vegetation causing an outage on the Crestline, Estaban, Jasper, Kinneloa, 24
and Moritz circuits used ODRM data. We analyzed and tagged the data with a CI based on the level of 25
CHI that they caused. We then calculated a CP based on the proportion of each CI level versus the 26
whole. The score was based on the WRDI CI level. 27

56
Table I-32 Vegetation Management CP & CI by Risk Statement
c) Mitigation Alternatives Identification 1
The Compliance Trim program requires the company to perform a yearly survey 2
of each of the approximately 1.4 million trees in our system and, if necessary, trim so that within one 3
year the tree will still be in compliance based on that tree’s growth rate. Compliance is considered 48 4
inches from power lines in High Fire areas and 18 inches from power lines in non-High Fire areas. 5
The Reliability Trim program encompasses a more in-depth analysis of the trees 6
near SCE lines than the Compliance Trim program. Overhanging branches that may be far from the 7
compliance-designated trim zone but are still a clear danger to the lines, weak root systems that may 8
lead to a tree falling on lines or poles, and trees that have a dangerous amount of leaning are some of the 9
Risk Statement Consequence Impact Dimension CP CI
Vegetation Grows Into LineOutage Reliability 11.9% 3Wildfire Safety 0.0% 6Wildfire Financial 0.0% 6Wildfire Environmental 0.0% 6
Property Damage Safety 0.0% 5Property Damage Financial 0.3% 2
Outage Reliability 35.5% 3Freeway/Road Closure Financial 7.2% 2
Injury Safety 0.1% 6Injury Financial 0.1% 4
Palm Tree Causes OutageOutage Reliability 16.7% 3
Tree on Crestline, Estaban, Jasper, Kinneloa, or Moritz
Circuit Causes OutageOutage Reliability 23.2% 3Wildfire Safety 0.0% 6Wildfire Financial 0.0% 6Wildfire Environmental 0.0% 6
Property Damage Safety 0.0% 5Property Damage Financial 0.3% 2
Outage Reliability 35.5% 3Freeway/Road Closure Financial 7.2% 2
Injury Safety 0.1% 6Injury Financial 0.1% 4
Tree on Crestline, Estaban, Jasper, Kinneloa, or Moritz Circuit Causes Wire Down
Palm Tree Causes Wire Down

57
triggers for a Reliability Trim. Ten percent of the Reliability Trim budget is spent on close inspection of 1
the Crestline, Estaban, Jasper, Kinneloa, and Moritz circuits, which have been identified by SMEs as 2
among the high-fire circuits most prone to vegetation-caused outages and wire downs. 3
Palm Removal is another important part of SCE’s Vegetation Management 4
activities. Palm trees cause a large proportion of vegetation-caused outages and also cause wire downs. 5
A healthy green palm frond will rarely fly off, even in high winds. However, a dead brown palm frond 6
can “fly” for long distances and impact lines well over 50 feet away from the tree. According to 7
Vegetation Management SMEs, most municipal palm-trimming programs were discontinued or reduced 8
during the recent 2008 recession. As a result, there are now more dead fronds endangering the system 9
than before. The Palm Removal program identifies problem palms and removes them. 10
d) Mitigation Risk Reduction Evaluation 11
(1) Tranche Analysis 12
Vegetation Management programs were tranched by mitigation. 13
(2) TEF and CP Effectiveness 14
All scored Vegetation Management activities work to reduce the TEF of 15
outages and wire downs by mitigating against vegetation growing, blowing, or falling into lines. 16
e) Risk Spend Efficiency 17
Table I-33 MRR & RSE for Scored Vegetation Management Programs
Table I-33 underlines how effective the removal of problem trees is at mitigating 18
against outage and wire down. The high RSE reflects that once a tree is removed, it will no longer cause 19
any outages or wire downs and will not require any additional inspections or trims. By contrast, a trim 20
will mitigate against a vegetation-caused outage or wire down only until the tree grows back to the point 21
where it has the potential to contact the line. 22
Mitigation MRRpv Costpv ($000) RSEpv (MRR/$1k)Compliance Trims 45,000 45,374 0.99Reliability Trim, Crestline, Estaban, Jasper, Kinneloa, Moritz Circuits 6,134 504 12.16Palm Removal 65,271 2,956 22.08

58
f) Key Takeaways 1
(1) Data 2
The vegetation management program is in the process of loading the 3
location, species, and other notes for every individual tree SCE maintains into an online database. Once 4
this dataset is complete, we will be able to calculate risk for more granular tranches of trees. 5
(2) Modeling 6
The score for Compliance Trims does not account for the risk of 7
vegetation contacting lines that would be expected for each of the approximately 1.4 million trees SCE 8
maintains if Compliance Trims were to cease. The current score is only based on grow-ins avoided. 9
Future improvements for Vegetation Management scoring will include the potential blow-ins mitigated 10
by Compliance Trims. 11
The next step for scoring Vegetation Management risk is to create an 12
overall CRR for all vegetation risk on the SCE system and then score programs based on their abilities 13
to mitigate that risk. This will both give a more true measure of Compliance Trim risk mitigation and 14
make it easier to analyze the potential effectiveness of mitigation programs that do not yet exist. 15
9. Conclusion 16
As noted in the introduction of this section, the eight scoring areas presented here 17
represent works in progress. This appendix is included in our showing to demonstrate progress and 18
breadth in risk scoring. The unit costs, units, and projects presented here reflect information as of March 19
2016, and therefore may not represent final values as presented in other volumes of SCE’s GRC 20
showing. The risk scoring pilots detailed here have been necessary to develop a risk-informed decision-21
making methodology. However, we did not directly base 2018 GRC funding requests on this analysis, 22
unless specifically stated in testimony.23