Embed Size (px)
Citation preview
2018 Interim Results For the six months ended 31 March 2018
Fixed income investor update
Westpac Banking Corporation | ABN 33 007 457 141
Disclaimer
The material contained in this presentation is intended to be general background information on Westpac Banking Corporation (“Westpac”)(ABN 33 007 457 141) and its activities.
It should not be reproduced, distributed or transmitted to any person without the consent of Westpac and is not intended for distribution in anyjurisdiction in which such distribution would be contrary to local law or regulation. It does not constitute a prospectus, offering memorandum oroffer of securities.
The information is supplied in summary form and is therefore not necessarily complete. Also, it is not intended that it be relied upon as adviceto investors or potential investors, who should consider seeking independent professional advice depending upon their specific investmentobjectives, financial situation or particular needs. The material contained in this presentation may include information derived from publiclyavailable sources that have not been independently verified. No representation or warranty is made as to the accuracy, completeness orreliability of the information.
All amounts are in Australian dollars unless otherwise indicated.
Financial information in this presentation may be presented on a cash earnings basis. Cash earnings is a non-GAAP measure. Refer toWestpac’s 2018 Interim Financial results Announcement on Form 6-K for the six months ended 31 March 2018 (“Interim Financial ResultsAnnouncement”) filed with the SEC for details of the basis of preparation of cash earnings. Refer to Appendix 3 for a reconciliation ofreported net profit to cash earnings.
Financial data in this presentation is as at 31 March 2018 unless otherwise indicated. Comparisons of 1H18 financial results are to 1H17unless otherwise stated.
Information contained in or otherwise accessible through the websites mentioned in this presentation does not form part of the presentationunless we specifically state that the information is incorporated by reference thereby forming part of the presentation. All references in thispresentation to websites are inactive textual references and are for information only.
Disclosure regarding forward-looking statementsThis presentation contains statements that constitute “forward-looking statements” within the meaning of Section 27A of the US Securities Actof 1933, as amended, and Section 21E of the US Securities Exchange Act of 1934, as amended. Forward-looking statements are statementsabout matters that are not historical facts. Forward-looking statements appear in a number of places in this presentation and includestatements regarding our intent, belief or current expectations with respect to our business and operations, market conditions, results ofoperations and financial condition, including, without limitation, future loan loss provisions, financial support to certain borrowers, indicativedrivers, forecasted economic indicators and performance metric outcomes.
We use words such as ‘will’, ‘may’, ‘expect’, 'indicative', ‘intend’, ‘seek’, ‘would’, ‘should’, ‘could’, ‘continue’, ‘plan’, ‘aim’, ‘probability’, ‘risk’,‘forecast’, ‘likely’, ‘estimate’, ‘anticipate’, ‘believe’, or other similar words to identify forward-looking statements. These forward-lookingstatements reflect our current views with respect to future events and are subject to change, certain risks, uncertainties and assumptionswhich are, in many instances, beyond our control and have been made based upon management’s expectations and beliefs concerningfuture developments and their potential effect upon us. There can be no assurance that future developments will be in accordance with ourexpectations or that the effect of future developments on us will be those anticipated. Should one or more of the risks or uncertaintiesmaterialise, or should underlying assumptions prove incorrect, actual results could differ materially from the expectations described in thispresentation. Factors that may impact on the forward-looking statements made include, but are not limited to, those described in the sectionentitled ‘Risk factors’ in Westpac’s Interim Financial Results Announcement filed with the SEC. When relying on forward-looking statements tomake decisions with respect to us, investors and others should carefully consider such factors and other uncertainties and events. We areunder no obligation, and do not intend, to update any forward-looking statements contained in this presentation, whether as a result of newinformation, future events or otherwise, after the date of this presentation.
2
Franchise strength as at 31 March 2018Sustainability recognition
Balance sheet as at 31 March 20181H18 Financials (vs 1H17)
Westpac First Half 2018 Highlights
Westpac Group Debt Investor Update I May 2018
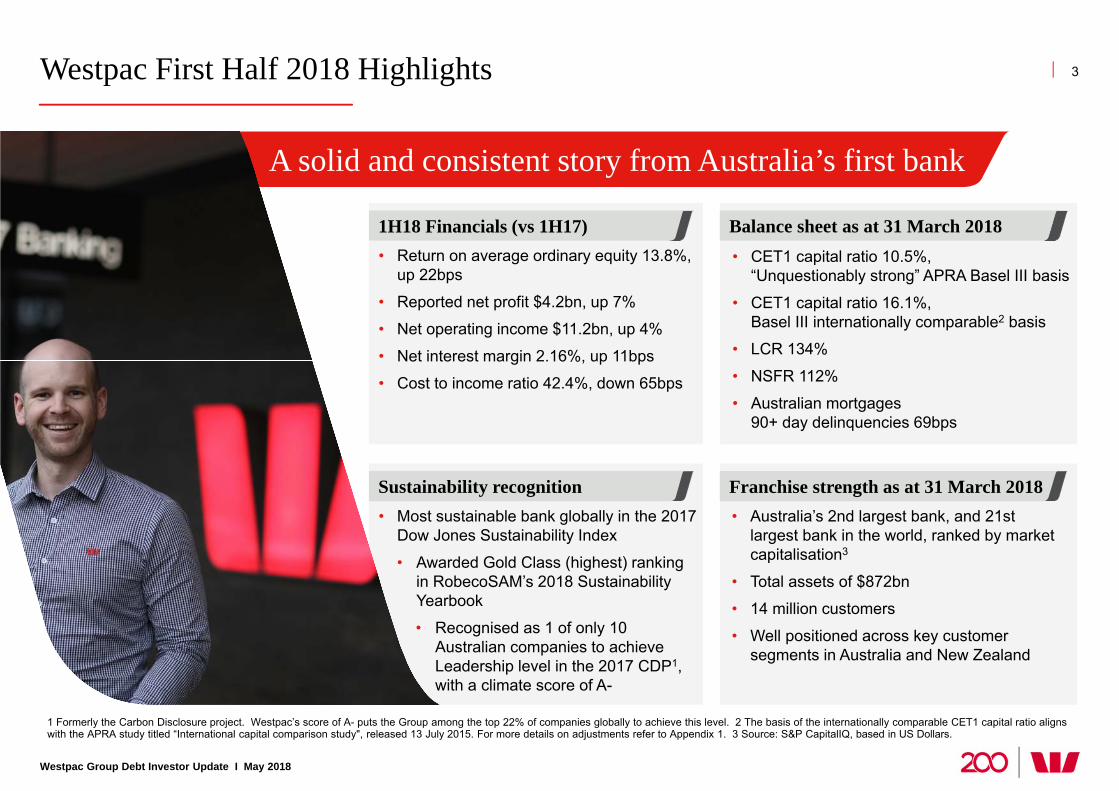
1 Formerly the Carbon Disclosure project. Westpac’s score of A- puts the Group among the top 22% of companies globally to achieve this level. 2 The basis of the internationally comparable CET1 capital ratio aligns with the APRA study titled “International capital comparison study", released 13 July 2015. For more details on adjustments refer to Appendix 1. 3 Source: S&P CapitalIQ, based in US Dollars.
3
• Australia’s 2nd largest bank, and 21stlargest bank in the world, ranked by marketcapitalisation3
• Total assets of $872bn
• 14 million customers
• Well positioned across key customersegments in Australia and New Zealand
• Return on average ordinary equity 13.8%,up 22bps
• Reported net profit $4.2bn, up 7%
• Net operating income $11.2bn, up 4%
• Net interest margin 2.16%, up 11bps
• Cost to income ratio 42.4%, down 65bps
• CET1 capital ratio 10.5%,“Unquestionably strong” APRA Basel III basis
• CET1 capital ratio 16.1%,Basel III internationally comparable2 basis
• LCR 134%
• NSFR 112%
• Australian mortgages90+ day delinquencies 69bps
• Most sustainable bank globally in the 2017Dow Jones Sustainability Index
• Awarded Gold Class (highest) rankingin RobecoSAM’s 2018 SustainabilityYearbook
• Recognised as 1 of only 10Australian companies to achieveLeadership level in the 2017 CDP1,with a climate score of A-
A solid and consistent story from Australia’s first bank
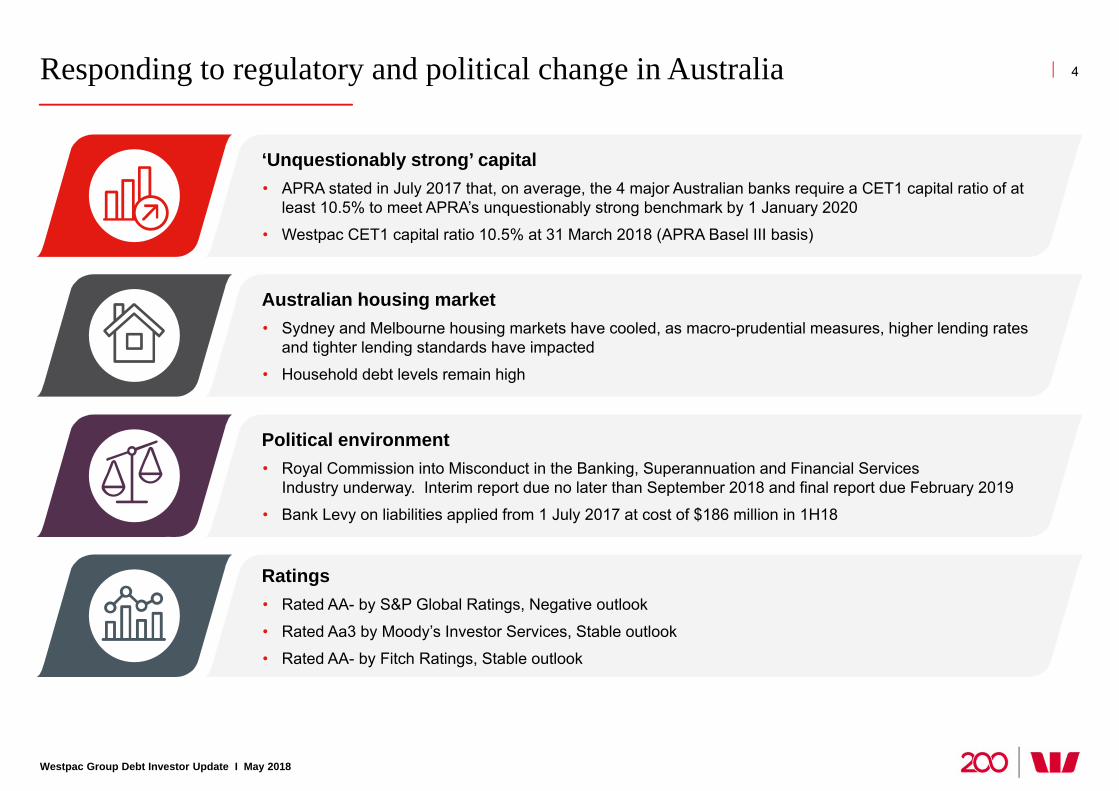
‘Unquestionably strong’ capital • APRA stated in July 2017 that, on average, the 4 major Australian banks require a CET1 capital ratio of at
least 10.5% to meet APRA’s unquestionably strong benchmark by 1 January 2020
• Westpac CET1 capital ratio 10.5% at 31 March 2018 (APRA Basel III basis)
Australian housing market• Sydney and Melbourne housing markets have cooled, as macro-prudential measures, higher lending rates
and tighter lending standards have impacted
• Household debt levels remain high
Political environment• Royal Commission into Misconduct in the Banking, Superannuation and Financial Services
Industry underway. Interim report due no later than September 2018 and final report due February 2019
• Bank Levy on liabilities applied from 1 July 2017 at cost of $186 million in 1H18
Ratings• Rated AA- by S&P Global Ratings, Negative outlook
• Rated Aa3 by Moody’s Investor Services, Stable outlook
• Rated AA- by Fitch Ratings, Stable outlook
Responding to regulatory and political change in Australia
Westpac Group Debt Investor Update I May 2018
4
5
Westpac Group Debt Investor Update I May 2018
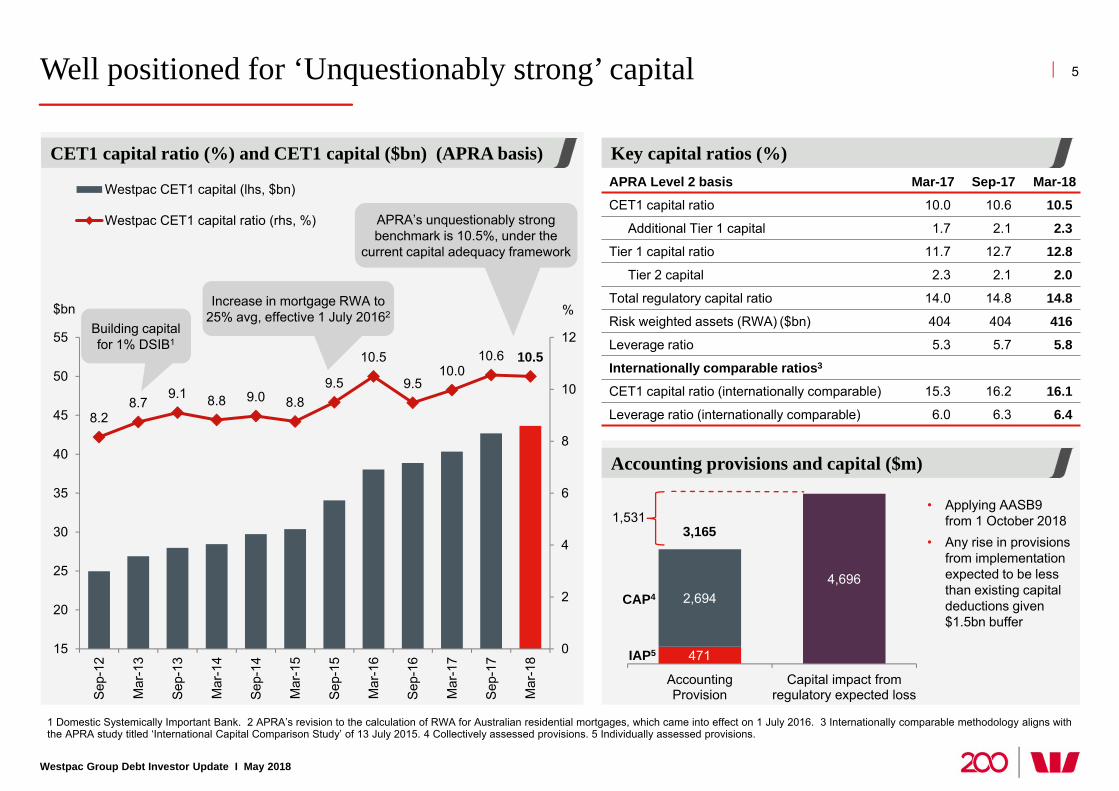
Well positioned for ‘Unquestionably strong’ capital
1 Domestic Systemically Important Bank. 2 APRA’s revision to the calculation of RWA for Australian residential mortgages, which came into effect on 1 July 2016. 3 Internationally comparable methodology aligns with the APRA study titled ‘International Capital Comparison Study’ of 13 July 2015. 4 Collectively assessed provisions. 5 Individually assessed provisions.
APRA Level 2 basis Mar-17 Sep-17 Mar-18
CET1 capital ratio 10.0 10.6 10.5
Additional Tier 1 capital 1.7 2.1 2.3Tier 1 capital ratio 11.7 12.7 12.8
Tier 2 capital 2.3 2.1 2.0
Total regulatory capital ratio 14.0 14.8 14.8
Risk weighted assets (RWA) ($bn) 404 404 416
Leverage ratio 5.3 5.7 5.8
Internationally comparable ratios3
CET1 capital ratio (internationally comparable) 15.3 16.2 16.1
Leverage ratio (internationally comparable) 6.0 6.3 6.4
Key capital ratios (%)
8.28.7
9.1 8.8 9.0 8.89.5
10.5
9.510.0
10.6 10.5
0
2
4
6
8
10
12
15
20
25
30
35
40
45
50
55
Sep-
12
Mar
-13
Sep-
13
Mar
-14
Sep-
14
Mar
-15
Sep-
15
Mar
-16
Sep-
16
Mar
-17
Sep-
17
Mar
-18
Westpac CET1 capital (lhs, $bn)
Westpac CET1 capital ratio (rhs, %)
CET1 capital ratio (%) and CET1 capital ($bn) (APRA basis)
%$bnBuilding capital for 1% DSIB1
Increase in mortgage RWA to 25% avg, effective 1 July 20162
APRA’s unquestionably strong benchmark is 10.5%, under the
current capital adequacy framework
471
2,6944,696
AccountingProvision
Capital impact fromregulatory expected loss
• Applying AASB9from 1 October 2018
• Any rise in provisionsfrom implementationexpected to be lessthan existing capitaldeductions given$1.5bn buffer
3,165
Accounting provisions and capital ($m)
IAP5
CAP41,531
1,531
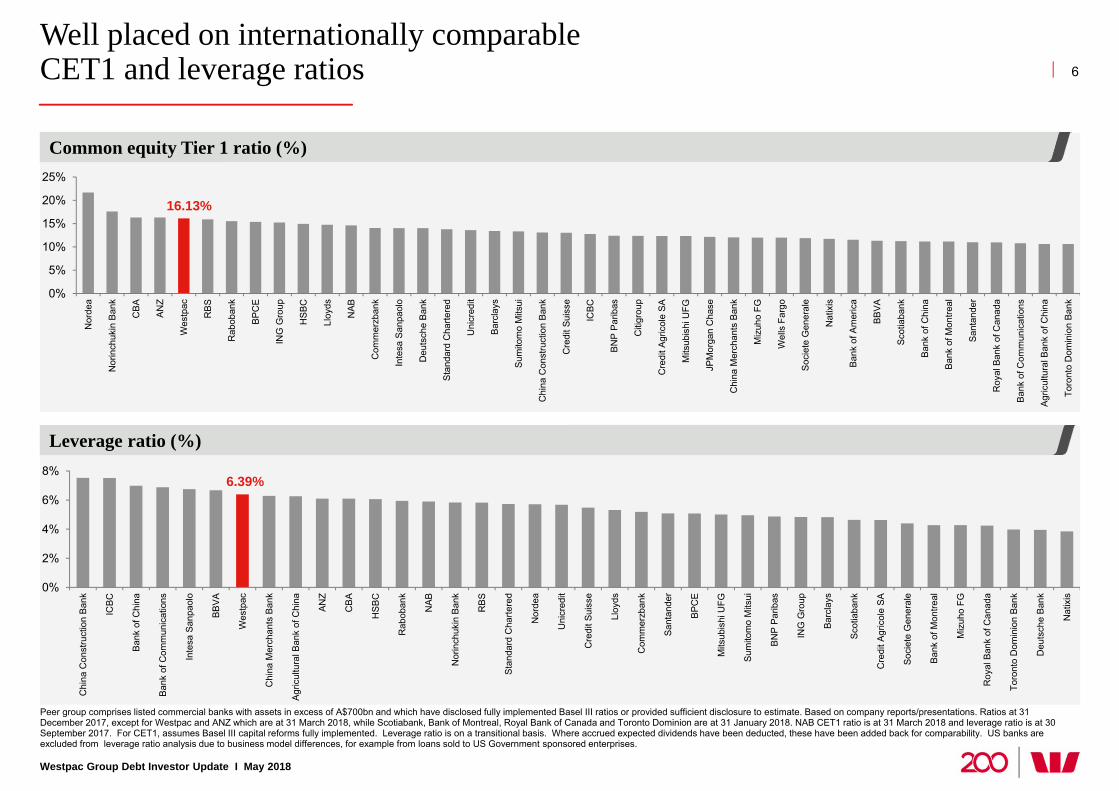
Well placed on internationally comparable CET1 and leverage ratios
Westpac Group Debt Investor Update I May 2018
6
Common equity Tier 1 ratio (%)
Leverage ratio (%)
16.13%
0%
5%
10%
15%
20%
25%
Nor
dea
Nor
inch
ukin
Ban
k
CBA AN
Z
Wes
tpac
RBS
Rab
oban
k
BPC
E
ING
Gro
up
HS
BC
Lloy
ds
NAB
Com
mer
zban
k
Inte
sa S
anpa
olo
Deu
tsch
e B
ank
Sta
ndar
d C
harte
red
Uni
cred
it
Barc
lays
Sum
itom
o M
itsui
Chi
na C
onst
ruct
ion
Ban
k
Cre
dit S
uiss
e
ICBC
BN
P P
arib
as
Citi
grou
p
Cre
dit A
gric
ole
SA
Mits
ubis
hi U
FG
JPM
orga
n C
hase
Chi
na M
erch
ants
Ban
k
Miz
uho
FG
Wel
ls F
argo
Soc
iete
Gen
eral
e
Nat
ixis
Ban
k of
Am
eric
a
BB
VA
Sco
tiaba
nk
Ban
k of
Chi
na
Ban
k of
Mon
treal
San
tand
er
Roy
al B
ank
of C
anad
a
Ban
k of
Com
mun
icat
ions
Agr
icul
tura
l Ban
k of
Chi
na
Toro
nto
Dom
inio
n Ba
nk
6.39%
0%
2%
4%
6%
8%
Chi
na C
onst
ruct
ion
Ban
k
ICBC
Ban
k of
Chi
na
Ban
k of
Com
mun
icat
ions
Inte
sa S
anpa
olo
BB
VA
Wes
tpac
Chi
na M
erch
ants
Ban
k
Agr
icul
tura
l Ban
k of
Chi
na
ANZ
CBA
HS
BC
Rab
oban
k
NAB
Nor
inch
ukin
Ban
k
RBS
Sta
ndar
d C
harte
red
Nor
dea
Uni
cred
it
Cre
dit S
uiss
e
Lloy
ds
Com
mer
zban
k
San
tand
er
BPC
E
Mits
ubis
hi U
FG
Sum
itom
o M
itsui
BN
P P
arib
as
ING
Gro
up
Barc
lays
Sco
tiaba
nk
Cre
dit A
gric
ole
SA
Soc
iete
Gen
eral
e
Ban
k of
Mon
treal
Miz
uho
FG
Roy
al B
ank
of C
anad
a
Toro
nto
Dom
inio
n Ba
nk
Deu
tsch
e B
ank
Nat
ixis
Peer group comprises listed commercial banks with assets in excess of A$700bn and which have disclosed fully implemented Basel III ratios or provided sufficient disclosure to estimate. Based on company reports/presentations. Ratios at 31 December 2017, except for Westpac and ANZ which are at 31 March 2018, while Scotiabank, Bank of Montreal, Royal Bank of Canada and Toronto Dominion are at 31 January 2018. NAB CET1 ratio is at 31 March 2018 and leverage ratio is at 30 September 2017. For CET1, assumes Basel III capital reforms fully implemented. Leverage ratio is on a transitional basis. Where accrued expected dividends have been deducted, these have been added back for comparability. US banks are excluded from leverage ratio analysis due to business model differences, for example from loans sold to US Government sponsored enterprises.
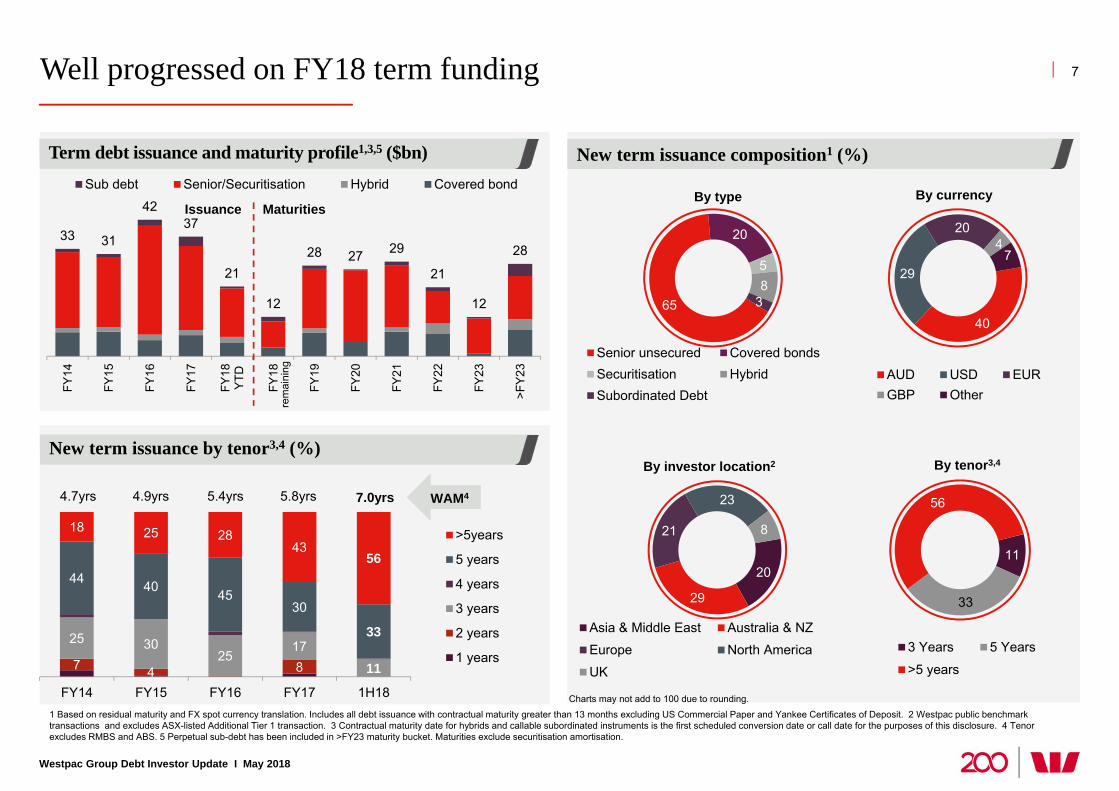
Well progressed on FY18 term funding
1 Based on residual maturity and FX spot currency translation. Includes all debt issuance with contractual maturity greater than 13 months excluding US Commercial Paper and Yankee Certificates of Deposit. 2 Westpac public benchmark transactions and excludes ASX-listed Additional Tier 1 transaction. 3 Contractual maturity date for hybrids and callable subordinated instruments is the first scheduled conversion date or call date for the purposes of this disclosure. 4 Tenor excludes RMBS and ABS. 5 Perpetual sub-debt has been included in >FY23 maturity bucket. Maturities exclude securitisation amortisation.
65
20
58
3
By type
Senior unsecured Covered bondsSecuritisation HybridSubordinated Debt
20
29
21
23
8
By investor location2
Asia & Middle East Australia & NZ
Europe North America
UK
40
29
204
7
By currency
AUD USD EURGBP Other
33 31
4237
21
12
28 27 29
21
12
28
FY14
FY15
FY16
FY17
FY18
YTD
FY18
FY19
FY20
FY21
FY22
FY23
>FY
23
Sub debt Senior/Securitisation Hybrid Covered bond
Issuance Maturities
Charts may not add to 100 due to rounding.
rem
aini
ng
New term issuance composition1 (%)Term debt issuance and maturity profile1,3,5 ($bn)
7
Westpac Group Debt Investor Update I May 2018
11
33
56
By tenor3,4
3 Years 5 Years
>5 years7 4 8
25 3025
1711
44 40 4530
33
18 25 2843
56
FY14 FY15 FY16 FY17 1H18
>5years
5 years
4 years
3 years
2 years
1 years
4.7yrs 4.9yrs 5.4yrs 5.8yrs
New term issuance by tenor3,4 (%)
7.0yrs WAM4
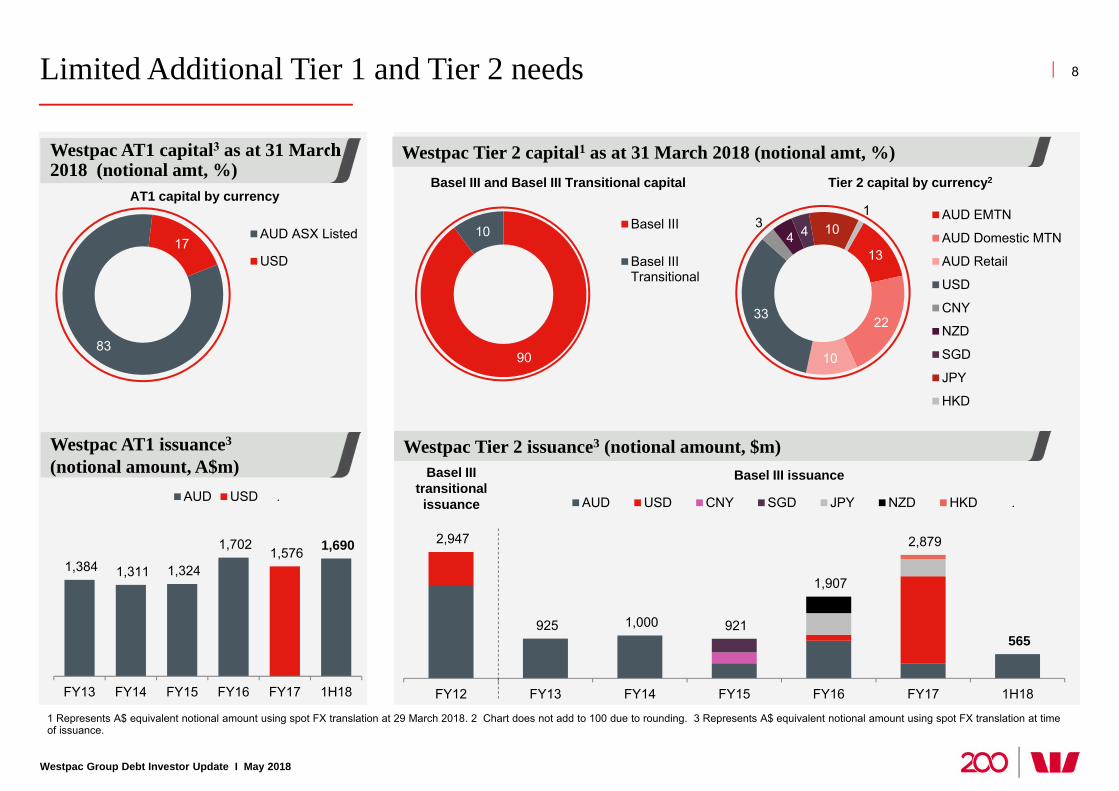
1,384 1,311 1,324
1,702 1,576 1,690
FY13 FY14 FY15 FY16 FY17 1H18
AUD USD .
Limited Additional Tier 1 and Tier 2 needs
Westpac Group Debt Investor Update I May 2018
8
Westpac Tier 2 issuance3 (notional amount, $m)
2,947
925 1,000 921
1,907
2,879
565
FY12 FY13 FY14 FY15 FY16 FY17 1H18
AUD USD CNY SGD JPY NZD HKD .
90
10 Basel III
Basel IIITransitional
13
22
10
33
34 4 10
1 AUD EMTN
AUD Domestic MTN
AUD Retail
USD
CNY
NZD
SGD
JPY
HKD
Basel III and Basel III Transitional capital Tier 2 capital by currency2
Basel III issuanceBasel III transitional
issuance
Westpac Tier 2 capital1 as at 31 March 2018 (notional amt, %)
83
17AUD ASX Listed
USD
AT1 capital by currency
1 Represents A$ equivalent notional amount using spot FX translation at 29 March 2018. 2 Chart does not add to 100 due to rounding. 3 Represents A$ equivalent notional amount using spot FX translation at time of issuance.
Westpac AT1 capital3 as at 31 March 2018 (notional amt, %)
Westpac AT1 issuance3
(notional amount, A$m)
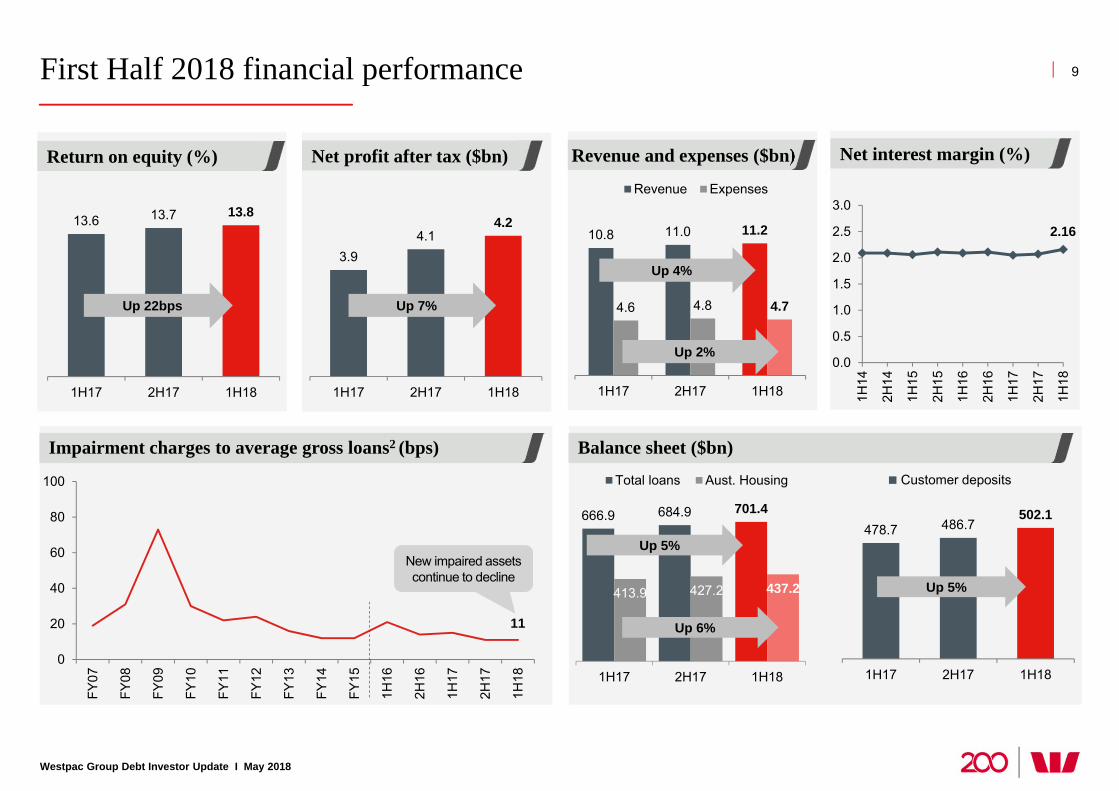
First Half 2018 financial performance
Westpac Group Debt Investor Update I May 2018
9
11
0
20
40
60
80
100
FY07
FY08
FY09
FY10
FY11
FY12
FY13
FY14
FY15
1H16
2H16
1H17
2H17
1H18
3.94.1
4.2
1H17 2H17 1H18
Impairment charges to average gross loans2 (bps)
Net profit after tax ($bn) Revenue and expenses ($bn)
Balance sheet ($bn)
Net interest margin (%)Return on equity (%)
2.16
0.0
0.5
1.0
1.5
2.0
2.5
3.0
1H14
2H14
1H15
2H15
1H16
2H16
1H17
2H17
1H18
10.8 11.0 11.2
4.6 4.8 4.7
1H17 2H17 1H18
Revenue Expenses
Up 7%
Up 4%
Up 2%
13.6 13.7 13.8
1H17 2H17 1H18
Up 22bps
666.9 684.9 701.4
413.9 427.2 437.2
1H17 2H17 1H18
Total loans Aust. Housing
478.7 486.7502.1
1H17 2H17 1H18
Up 5%
Up 5%
Up 6%
New impaired assets continue to decline
Customer deposits
Westpac Group Debt Investor Update I May 2018
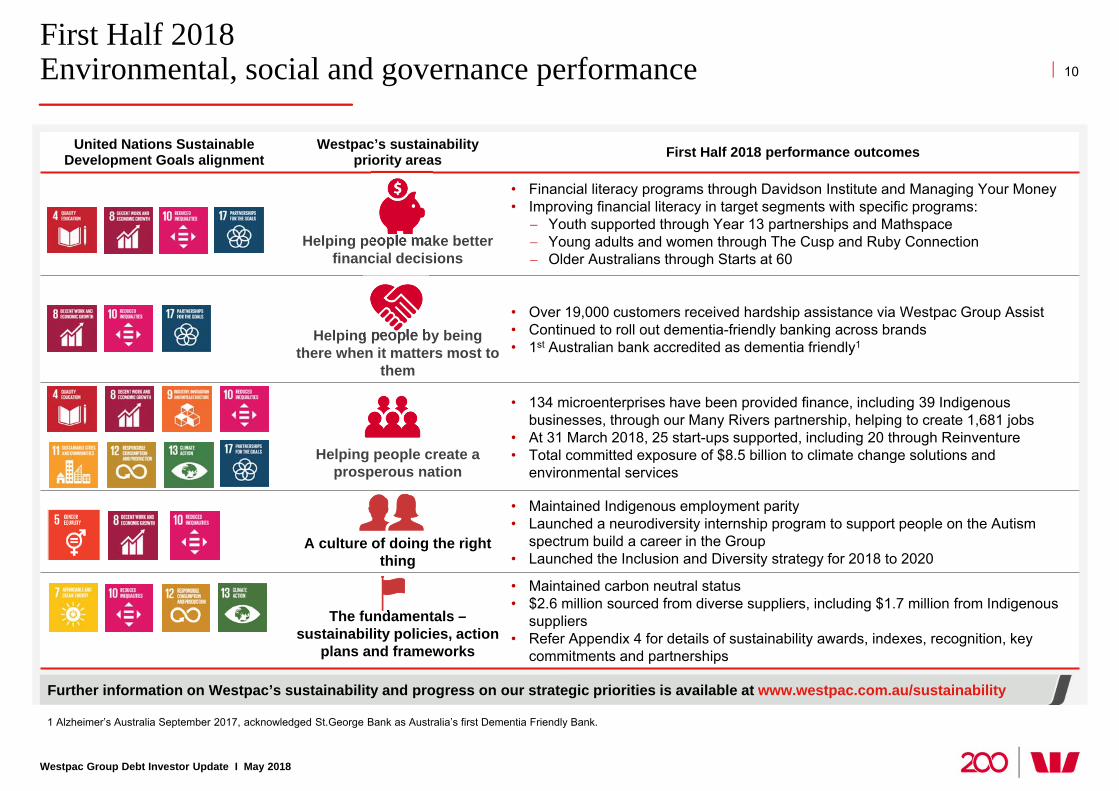
First Half 2018Environmental, social and governance performance
1 Alzheimer’s Australia September 2017, acknowledged St.George Bank as Australia’s first Dementia Friendly Bank.
10
Further information on Westpac’s sustainability and progress on our strategic priorities is available at www.westpac.com.au/sustainability
United Nations Sustainable Development Goals alignment
Westpac’s sustainability priority areas First Half 2018 performance outcomes
Helping people make better financial decisions
• Financial literacy programs through Davidson Institute and Managing Your Money• Improving financial literacy in target segments with specific programs:
Youth supported through Year 13 partnerships and Mathspace Young adults and women through The Cusp and Ruby Connection Older Australians through Starts at 60
Helping people by being there when it matters most to
them
• Over 19,000 customers received hardship assistance via Westpac Group Assist• Continued to roll out dementia-friendly banking across brands• 1st Australian bank accredited as dementia friendly1
Helping people create a prosperous nation
• 134 microenterprises have been provided finance, including 39 Indigenous businesses, through our Many Rivers partnership, helping to create 1,681 jobs
• At 31 March 2018, 25 start-ups supported, including 20 through Reinventure• Total committed exposure of $8.5 billion to climate change solutions and
environmental services
A culture of doing the right thing
• Maintained Indigenous employment parity• Launched a neurodiversity internship program to support people on the Autism
spectrum build a career in the Group• Launched the Inclusion and Diversity strategy for 2018 to 2020
The fundamentals –sustainability policies, action
plans and frameworks
• Maintained carbon neutral status• $2.6 million sourced from diverse suppliers, including $1.7 million from Indigenous
suppliers• Refer Appendix 4 for details of sustainability awards, indexes, recognition, key
commitments and partnerships
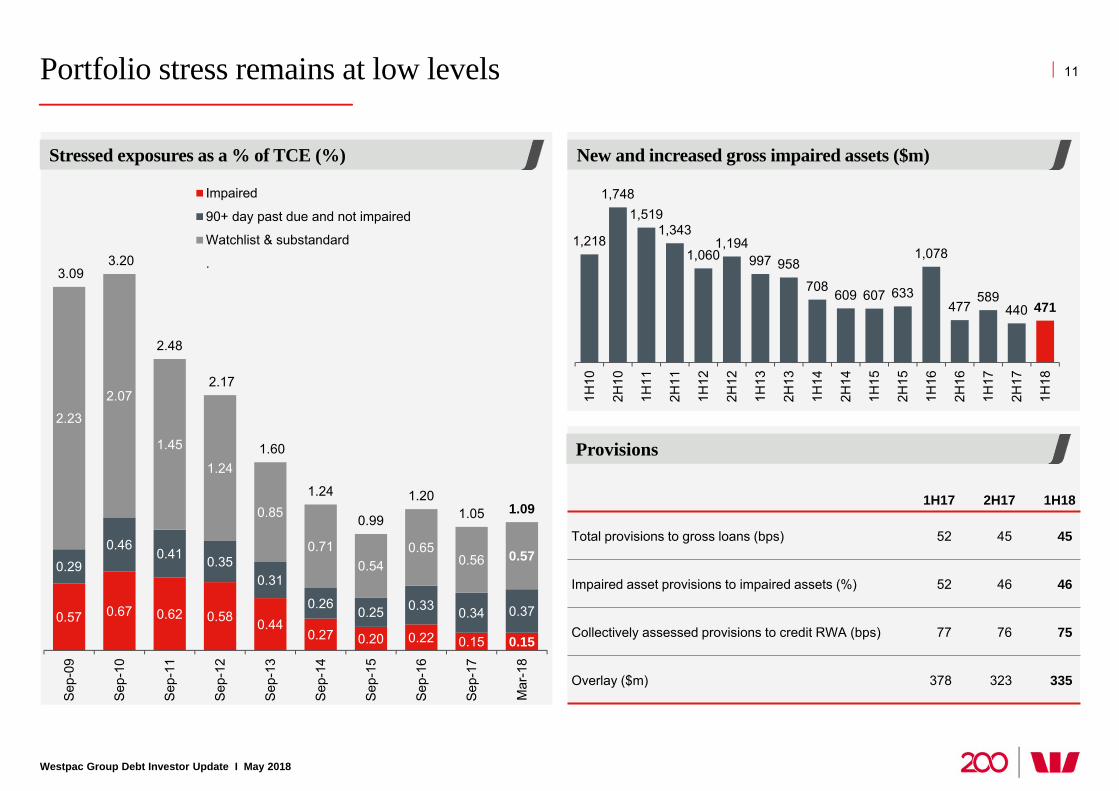
Portfolio stress remains at low levels
Westpac Group Debt Investor Update I May 2018
11
0.57 0.67 0.62 0.58 0.440.27 0.20 0.22 0.15 0.15
0.290.46
0.41 0.350.31
0.26 0.25 0.33 0.34 0.37
2.23
2.07
1.45
1.24
0.85
0.710.54
0.650.56 0.57
3.09 3.20
2.48
2.17
1.60
1.24
0.99
1.201.05 1.09
Sep-
09
Sep-
10
Sep-
11
Sep-
12
Sep-
13
Sep-
14
Sep-
15
Sep-
16
Sep-
17
Mar
-18
Impaired
90+ day past due and not impaired
Watchlist & substandard
.
1,218
1,748 1,519
1,343
1,060 1,194
997 958
708 609 607 633
1,078
477 589
440 471
1H10
2H10
1H11
2H11
1H12
2H12
1H13
2H13
1H14
2H14
1H15
2H15
1H16
2H16
1H17
2H17
1H18
Stressed exposures as a % of TCE (%) New and increased gross impaired assets ($m)
Provisions
1H17 2H17 1H18
Total provisions to gross loans (bps) 52 45 45
Impaired asset provisions to impaired assets (%) 52 46 46
Collectively assessed provisions to credit RWA (bps) 77 76 75
Overlay ($m) 378 323 335
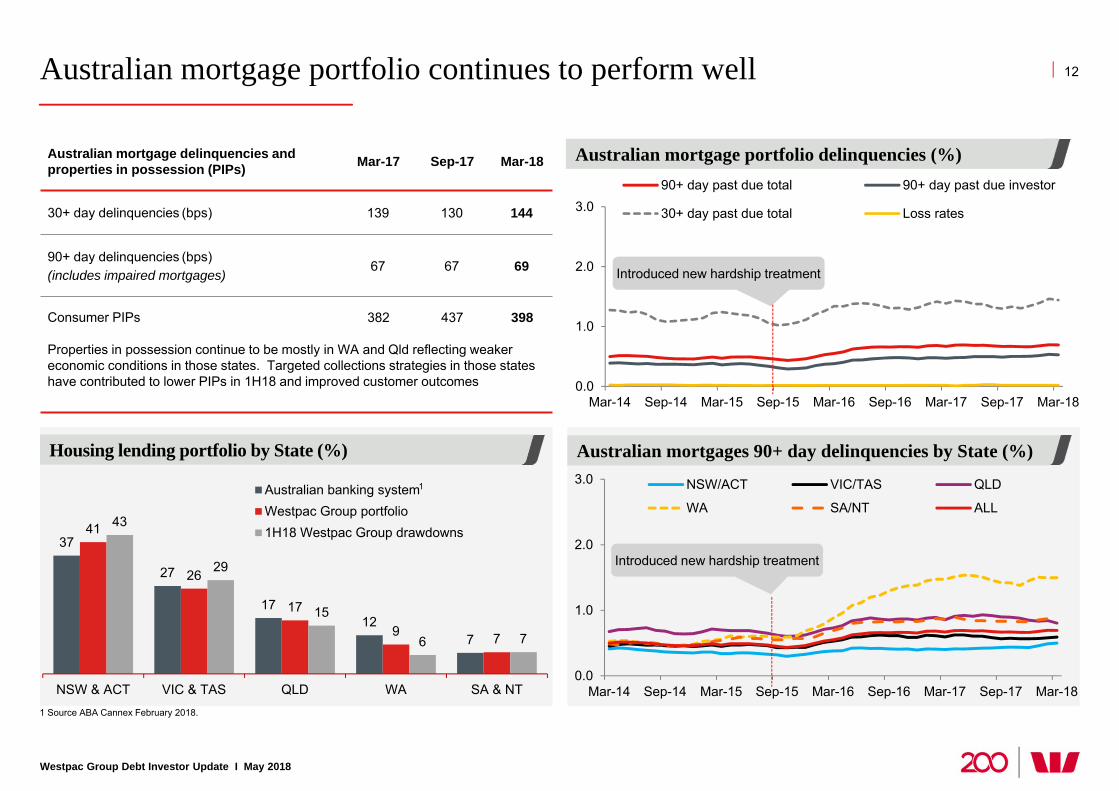
Australian mortgage portfolio continues to perform well
Westpac Group Debt Investor Update I May 2018
Australian mortgages 90+ day delinquencies by State (%)Housing lending portfolio by State (%)
Australian mortgage delinquencies and properties in possession (PIPs) Mar-17 Sep-17 Mar-18
30+ day delinquencies (bps) 139 130 144
90+ day delinquencies (bps) (includes impaired mortgages)
67 67 69
Consumer PIPs 382 437 398
Properties in possession continue to be mostly in WA and Qld reflecting weaker economic conditions in those states. Targeted collections strategies in those states have contributed to lower PIPs in 1H18 and improved customer outcomes 0.0
1.0
2.0
3.0
Mar-14 Sep-14 Mar-15 Sep-15 Mar-16 Sep-16 Mar-17 Sep-17 Mar-18
90+ day past due total 90+ day past due investor
30+ day past due total Loss rates
0.0
1.0
2.0
3.0
Mar-14 Sep-14 Mar-15 Sep-15 Mar-16 Sep-16 Mar-17 Sep-17 Mar-18
NSW/ACT VIC/TAS QLD
WA SA/NT ALL
37
27
1712
7
41
26
17
9 7
43
29
15
6 7
NSW & ACT VIC & TAS QLD WA SA & NT
Australian banking systemWestpac Group portfolio1H18 Westpac Group drawdowns
1 Source ABA Cannex February 2018.
12
1
Introduced new hardship treatment
Australian mortgage portfolio delinquencies (%)
Introduced new hardship treatment
Australian mortgage portfolio well collateralised
Westpac Group Debt Investor Update I May 2018
13
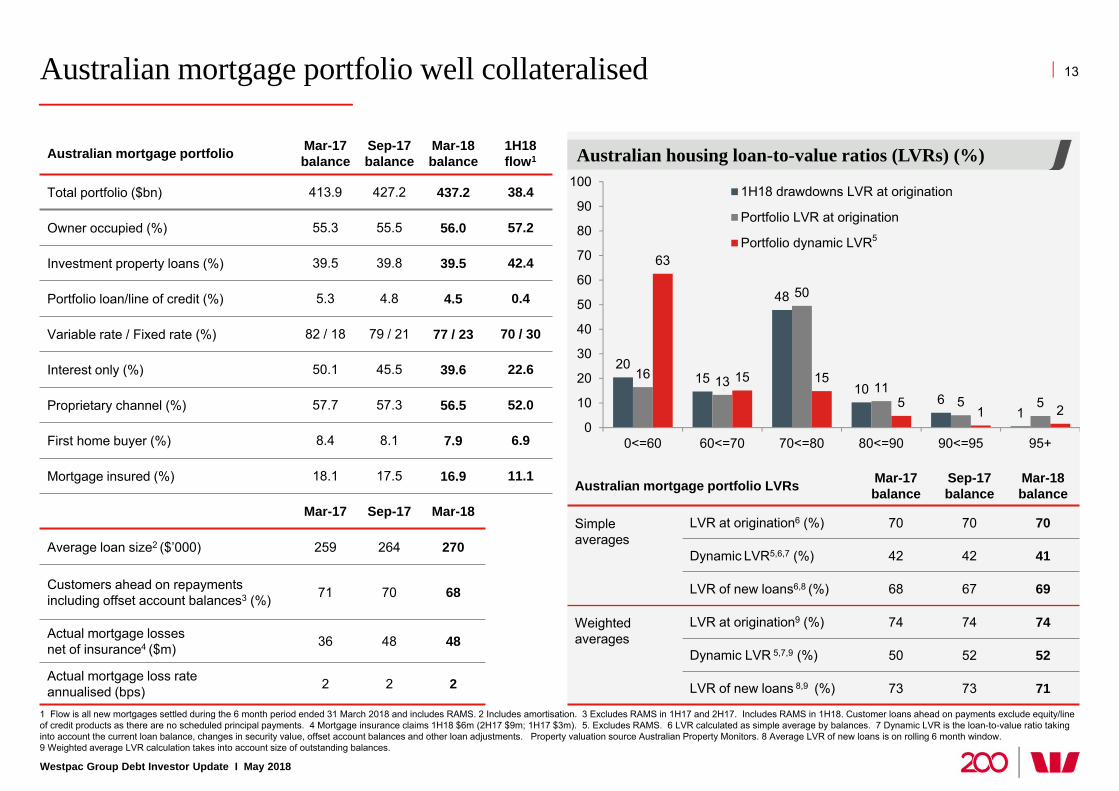
1 Flow is all new mortgages settled during the 6 month period ended 31 March 2018 and includes RAMS. 2 Includes amortisation. 3 Excludes RAMS in 1H17 and 2H17. Includes RAMS in 1H18. Customer loans ahead on payments exclude equity/line of credit products as there are no scheduled principal payments. 4 Mortgage insurance claims 1H18 $6m (2H17 $9m; 1H17 $3m). 5. Excludes RAMS. 6 LVR calculated as simple average by balances. 7 Dynamic LVR is the loan-to-value ratio taking into account the current loan balance, changes in security value, offset account balances and other loan adjustments. Property valuation source Australian Property Monitors. 8 Average LVR of new loans is on rolling 6 month window. 9 Weighted average LVR calculation takes into account size of outstanding balances.
Australian housing loan-to-value ratios (LVRs) (%)
Australian mortgage portfolio LVRs Mar-17 balance
Sep-17balance
Mar-18 balance
Simple averages
LVR at origination6 (%) 70 70 70
Dynamic LVR5,6,7 (%) 42 42 41
LVR of new loans6,8 (%) 68 67 69
Weighted averages
LVR at origination9 (%) 74 74 74
Dynamic LVR 5,7,9 (%) 50 52 52
LVR of new loans 8,9 (%) 73 73 71
2015
48
106
1
16 13
50
115 5
63
15 15
51 2
0
10
20
30
40
50
60
70
80
90
100
0<=60 60<=70 70<=80 80<=90 90<=95 95+
1H18 drawdowns LVR at origination
Portfolio LVR at origination
Portfolio dynamic LVR
Australian mortgage portfolio Mar-17 balance
Sep-17balance
Mar-18balance
1H18flow1
Total portfolio ($bn) 413.9 427.2 437.2 38.4
Owner occupied (%) 55.3 55.5 56.0 57.2
Investment property loans (%) 39.5 39.8 39.5 42.4
Portfolio loan/line of credit (%) 5.3 4.8 4.5 0.4
Variable rate / Fixed rate (%) 82 / 18 79 / 21 77 / 23 70 / 30
Interest only (%) 50.1 45.5 39.6 22.6
Proprietary channel (%) 57.7 57.3 56.5 52.0
First home buyer (%) 8.4 8.1 7.9 6.9
Mortgage insured (%) 18.1 17.5 16.9 11.1
Mar-17 Sep-17 Mar-18
Average loan size2 ($’000) 259 264 270
Customers ahead on repayments including offset account balances3 (%) 71 70 68
Actual mortgage losses net of insurance4 ($m) 36 48 48
Actual mortgage loss rateannualised (bps) 2 2 2
5
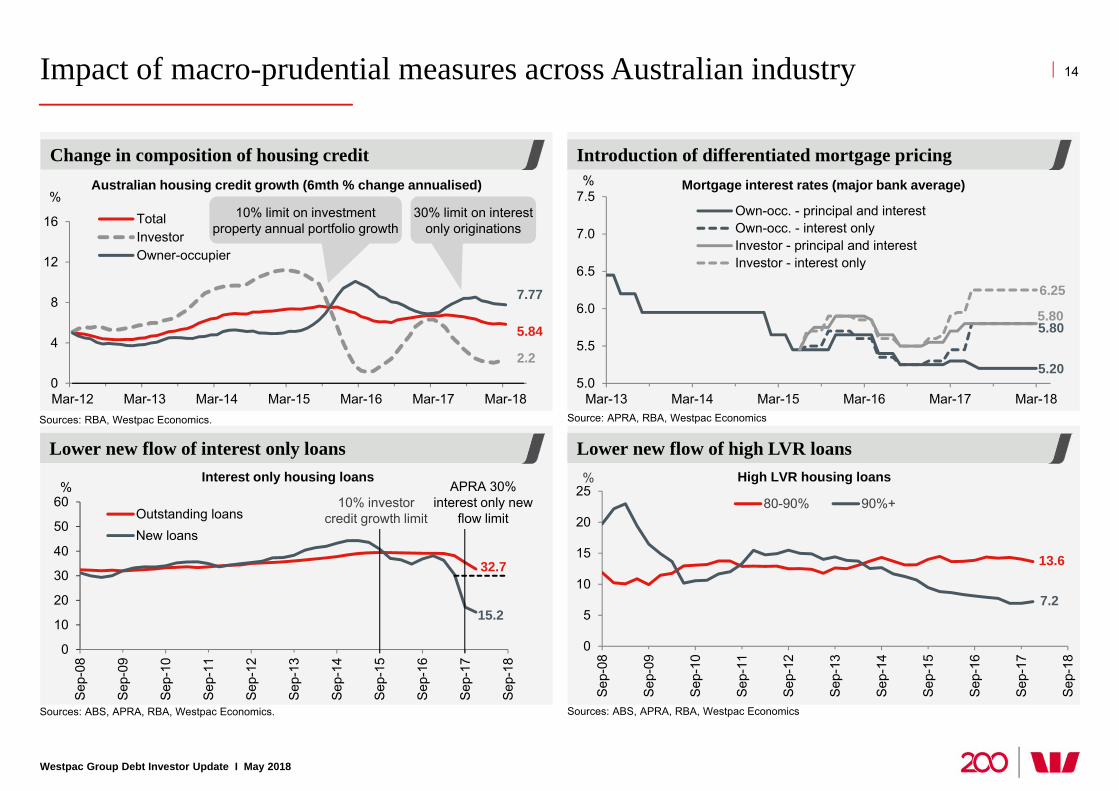
Impact of macro-prudential measures across Australian industry
Westpac Group Debt Investor Update I May 2018
Lower new flow of high LVR loans
Change in composition of housing credit
Lower new flow of interest only loans
14
Sources: RBA, Westpac Economics.
Sources: ABS, APRA, RBA, Westpac Economics. Sources: ABS, APRA, RBA, Westpac Economics
Source: APRA, RBA, Westpac Economics
High LVR housing loans
5.20
5.805.80
6.25
5.0
5.5
6.0
6.5
7.0
7.5
Mar-13 Mar-14 Mar-15 Mar-16 Mar-17 Mar-18
%
Own-occ. - principal and interestOwn-occ. - interest onlyInvestor - principal and interestInvestor - interest only
Mortgage interest rates (major bank average)
32.7
15.2
0
10
20
30
40
50
60
Sep-
08
Sep-
09
Sep-
10
Sep-
11
Sep-
12
Sep-
13
Sep-
14
Sep-
15
Sep-
16
Sep-
17
Sep-
18%
Outstanding loansNew loans
10% investor credit growth limit
APRA 30% interest only new
flow limit
13.6
7.2
0
5
10
15
20
25
Sep-
08
Sep-
09
Sep-
10
Sep-
11
Sep-
12
Sep-
13
Sep-
14
Sep-
15
Sep-
16
Sep-
17
Sep-
18
%
80-90% 90%+
Interest only housing loans
Introduction of differentiated mortgage pricing
5.84
2.2
7.77
0
4
8
12
16
Mar-12 Mar-13 Mar-14 Mar-15 Mar-16 Mar-17 Mar-18
TotalInvestorOwner-occupier
Australian housing credit growth (6mth % change annualised)%
10% limit on investment property annual portfolio growth
30% limit on interest only originations
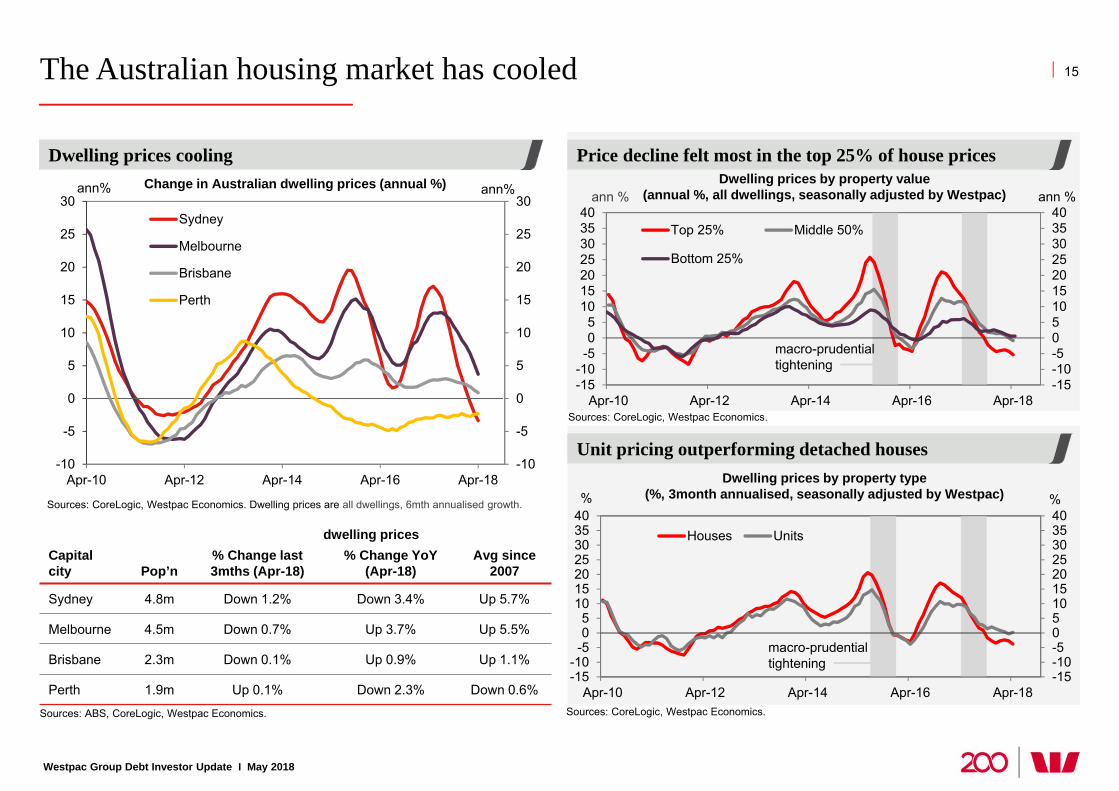
The Australian housing market has cooled
Westpac Group Debt Investor Update I May 2018
Price decline felt most in the top 25% of house prices
15
Sources: CoreLogic, Westpac Economics.
Dwelling prices cooling
Unit pricing outperforming detached houses
Sources: CoreLogic, Westpac Economics.
Dwelling prices by property type (%, 3month annualised, seasonally adjusted by Westpac)
-15-10-50510152025303540
-15-10
-505
10152025303540
Apr-10 Apr-12 Apr-14 Apr-16 Apr-18
%%
Houses Units
macro-prudential tightening
Dwelling prices by property value (annual %, all dwellings, seasonally adjusted by Westpac)
-15-10-50510152025303540
-15-10-505
10152025303540
Apr-10 Apr-12 Apr-14 Apr-16 Apr-18
ann %ann %
Top 25% Middle 50%
Bottom 25%
macro-prudential tightening
Sources: ABS, CoreLogic, Westpac Economics.
Sources: CoreLogic, Westpac Economics. Dwelling prices are all dwellings, 6mth annualised growth.
Change in Australian dwelling prices (annual %)
-10
-5
0
5
10
15
20
25
30
-10
-5
0
5
10
15
20
25
30
Apr-10 Apr-12 Apr-14 Apr-16 Apr-18
ann%ann%
Sydney
Melbourne
Brisbane
Perth
dwelling pricesCapital city Pop’n
% Change last 3mths (Apr-18)
% Change YoY (Apr-18)
Avg since 2007
Sydney 4.8m Down 1.2% Down 3.4% Up 5.7%
Melbourne 4.5m Down 0.7% Up 3.7% Up 5.5%
Brisbane 2.3m Down 0.1% Up 0.9% Up 1.1%
Perth 1.9m Up 0.1% Down 2.3% Down 0.6%
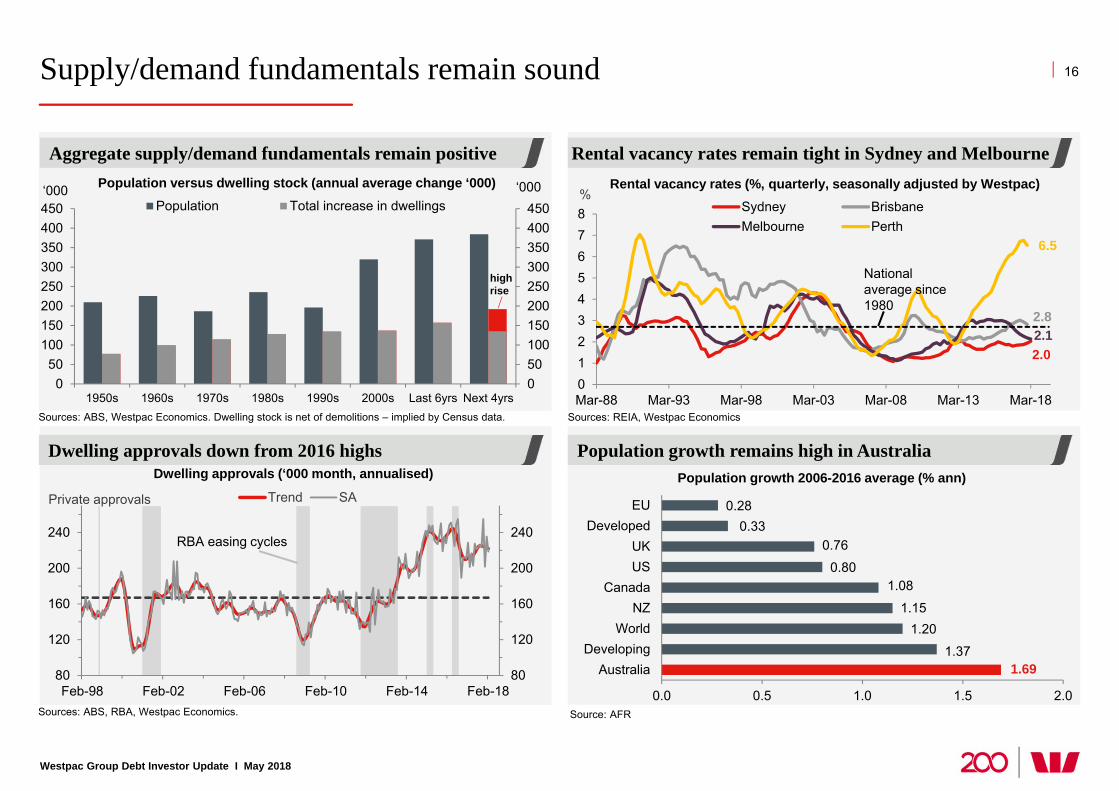
Westpac Group Debt Investor Update I May 2018
Supply/demand fundamentals remain sound 16
Sources: ABS, Westpac Economics. Dwelling stock is net of demolitions – implied by Census data.
Population versus dwelling stock (annual average change ‘000)
Sources: REIA, Westpac Economics
Rental vacancy rates (%, quarterly, seasonally adjusted by Westpac)
Aggregate supply/demand fundamentals remain positive Rental vacancy rates remain tight in Sydney and Melbourne
Population growth 2006-2016 average (% ann)
Population growth remains high in Australia
1.691.37
1.201.15
1.080.80
0.760.33
0.28
0.0 0.5 1.0 1.5 2.0
AustraliaDeveloping
WorldNZ
CanadaUSUK
DevelopedEU
Source: AFR
2.0
2.82.1
6.5
012345678
Mar-88 Mar-93 Mar-98 Mar-03 Mar-08 Mar-13 Mar-18
%Sydney BrisbaneMelbourne Perth
National average since 1980
050100150200250300350400450
050
100150200250300350400450
1950s 1960s 1970s 1980s 1990s 2000s Last 6yrs Next 4yrs
‘000‘000Population Total increase in dwellings
high rise
Sources: ABS, RBA, Westpac Economics.
Dwelling approvals (‘000 month, annualised)Dwelling approvals down from 2016 highs
80
120
160
200
240
80
120
160
200
240
Feb-98 Feb-02 Feb-06 Feb-10 Feb-14 Feb-18
Trend SAPrivate approvals
RBA easing cycles
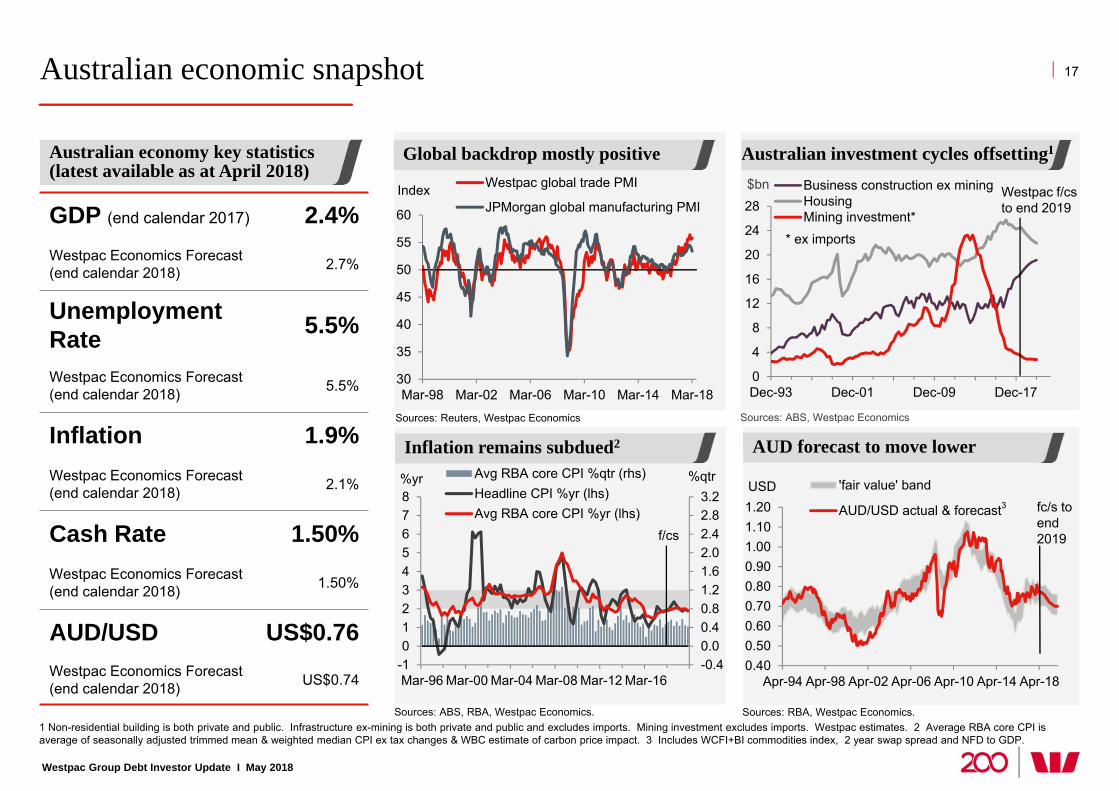
Australian economic snapshot
Australian economy key statistics (latest available as at April 2018)
Sources: ABS, RBA, Westpac Economics.
Inflation remains subdued2
Sources: Reuters, Westpac Economics
17
Westpac Group Debt Investor Update I May 2018
Sources: ABS, Westpac Economics
GDP (end calendar 2017) 2.4%Westpac Economics Forecast (end calendar 2018) 2.7%
Unemployment Rate 5.5%
Westpac Economics Forecast (end calendar 2018) 5.5%
Inflation 1.9%Westpac Economics Forecast (end calendar 2018) 2.1%
Cash Rate 1.50%Westpac Economics Forecast (end calendar 2018) 1.50%
AUD/USD US$0.76Westpac Economics Forecast (end calendar 2018) US$0.74
30
35
40
45
50
55
60
Mar-98 Mar-02 Mar-06 Mar-10 Mar-14 Mar-18
Westpac global trade PMI
JPMorgan global manufacturing PMIIndex
Sources: RBA, Westpac Economics.
AUD forecast to move lower
Global backdrop mostly positive Australian investment cycles offsetting1
1 Non-residential building is both private and public. Infrastructure ex-mining is both private and public and excludes imports. Mining investment excludes imports. Westpac estimates. 2 Average RBA core CPI is average of seasonally adjusted trimmed mean & weighted median CPI ex tax changes & WBC estimate of carbon price impact. 3 Includes WCFI+BI commodities index, 2 year swap spread and NFD to GDP.
0.400.500.600.700.800.901.001.101.20
Apr-94 Apr-98 Apr-02 Apr-06 Apr-10 Apr-14 Apr-18
USD 'fair value' band
AUD/USD actual & forecast fc/s toend2019
3
0
4
8
12
16
20
24
28
Dec-93 Dec-01 Dec-09 Dec-17
$bn Business construction ex miningHousingMining investment*
Westpac f/csto end 2019
* ex imports
-0.40.00.40.81.21.62.02.42.83.2
-1012345678
Mar-96 Mar-00 Mar-04 Mar-08 Mar-12 Mar-16
%qtr%yr Avg RBA core CPI %qtr (rhs)Headline CPI %yr (lhs)Avg RBA core CPI %yr (lhs)
f/cs

Economics
Westpac Group Debt Investor Update I May 2018
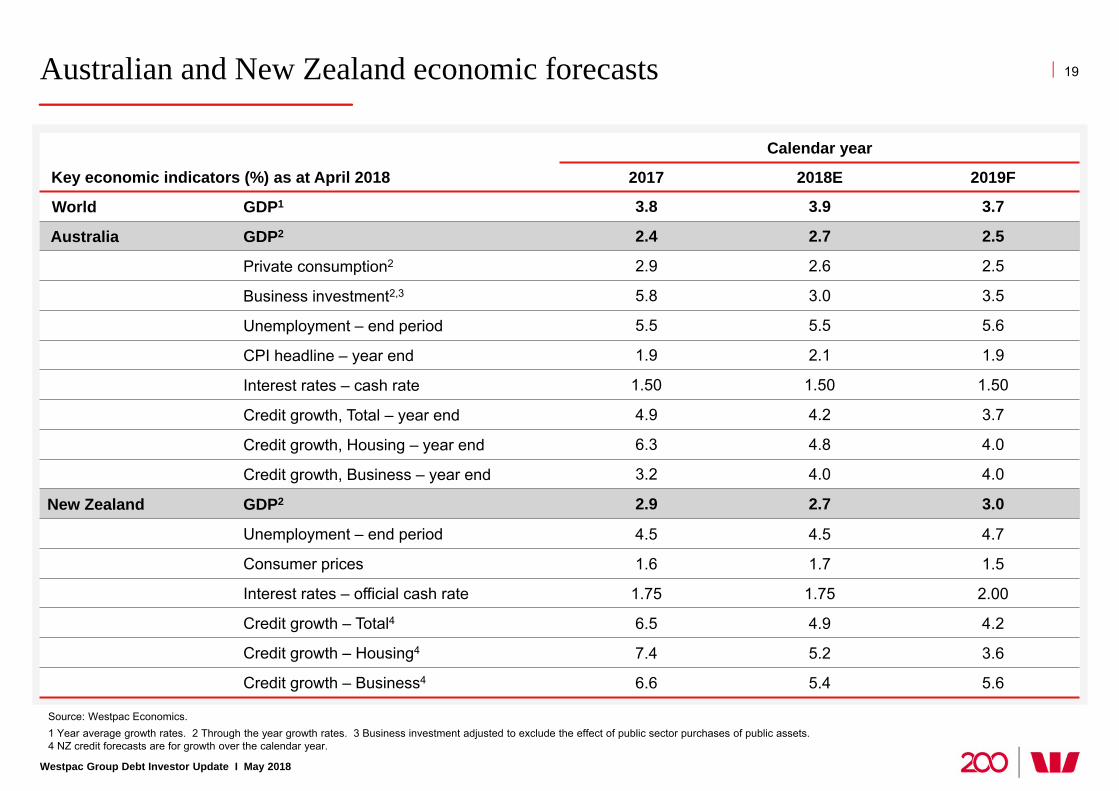
Australian and New Zealand economic forecasts 19
Calendar year
Key economic indicators (%) as at April 2018 2017 2018E 2019F
World GDP1 3.8 3.9 3.7
Australia GDP2 2.4 2.7 2.5
Private consumption2 2.9 2.6 2.5
Business investment2,3 5.8 3.0 3.5
Unemployment – end period 5.5 5.5 5.6
CPI headline – year end 1.9 2.1 1.9
Interest rates – cash rate 1.50 1.50 1.50
Credit growth, Total – year end 4.9 4.2 3.7
Credit growth, Housing – year end 6.3 4.8 4.0
Credit growth, Business – year end 3.2 4.0 4.0
New Zealand GDP2 2.9 2.7 3.0
Unemployment – end period 4.5 4.5 4.7
Consumer prices 1.6 1.7 1.5
Interest rates – official cash rate 1.75 1.75 2.00
Credit growth – Total4 6.5 4.9 4.2
Credit growth – Housing4 7.4 5.2 3.6
Credit growth – Business4 6.6 5.4 5.6
Source: Westpac Economics. 1 Year average growth rates. 2 Through the year growth rates. 3 Business investment adjusted to exclude the effect of public sector purchases of public assets.4 NZ credit forecasts are for growth over the calendar year.
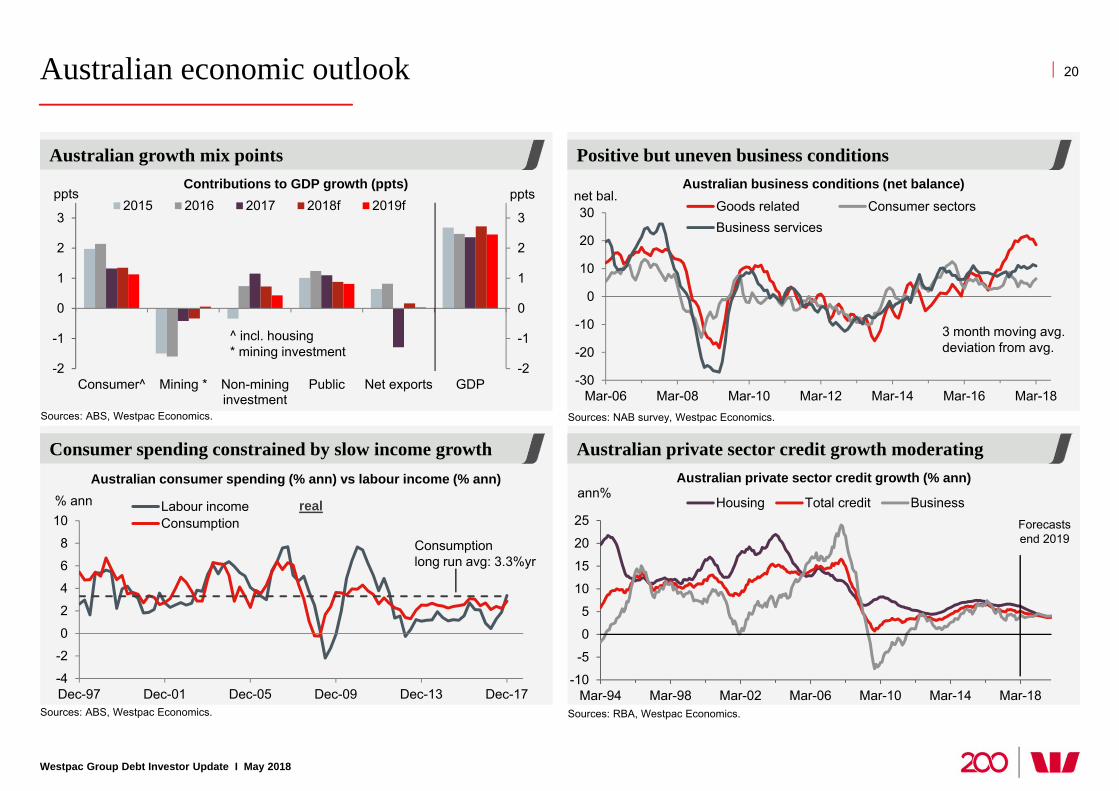
Australian economic outlook
Westpac Group Debt Investor Update I May 2018
Positive but uneven business conditions
Australian private sector credit growth moderating
Australian growth mix points
Consumer spending constrained by slow income growth
20
Sources: NAB survey, Westpac Economics.
-30
-20
-10
0
10
20
30
Mar-06 Mar-08 Mar-10 Mar-12 Mar-14 Mar-16 Mar-18
net bal.Goods related Consumer sectorsBusiness services
3 month moving avg.deviation from avg.
Australian consumer spending (% ann) vs labour income (% ann)
Australian business conditions (net balance)
Sources: ABS, Westpac Economics.
-2
-1
0
1
2
3
-2
-1
0
1
2
3
Consumer^ Mining * Non-mininginvestment
Public Net exports GDP
pptsppts2015 2016 2017 2018f 2019f
^ incl. housing * mining investment
Sources: ABS, Westpac Economics.
-4
-2
0
2
4
6
8
10
Dec-97 Dec-01 Dec-05 Dec-09 Dec-13 Dec-17
% ann Labour incomeConsumption
real
Consumption long run avg: 3.3%yr
Contributions to GDP growth (ppts)
Sources: RBA, Westpac Economics.
ann%Australian private sector credit growth (% ann)
-10
-5
0
5
10
15
20
25
Mar-94 Mar-98 Mar-02 Mar-06 Mar-10 Mar-14 Mar-18
Housing Total credit BusinessForecastsend 2019
Westpac Group Debt Investor Update I May 2018
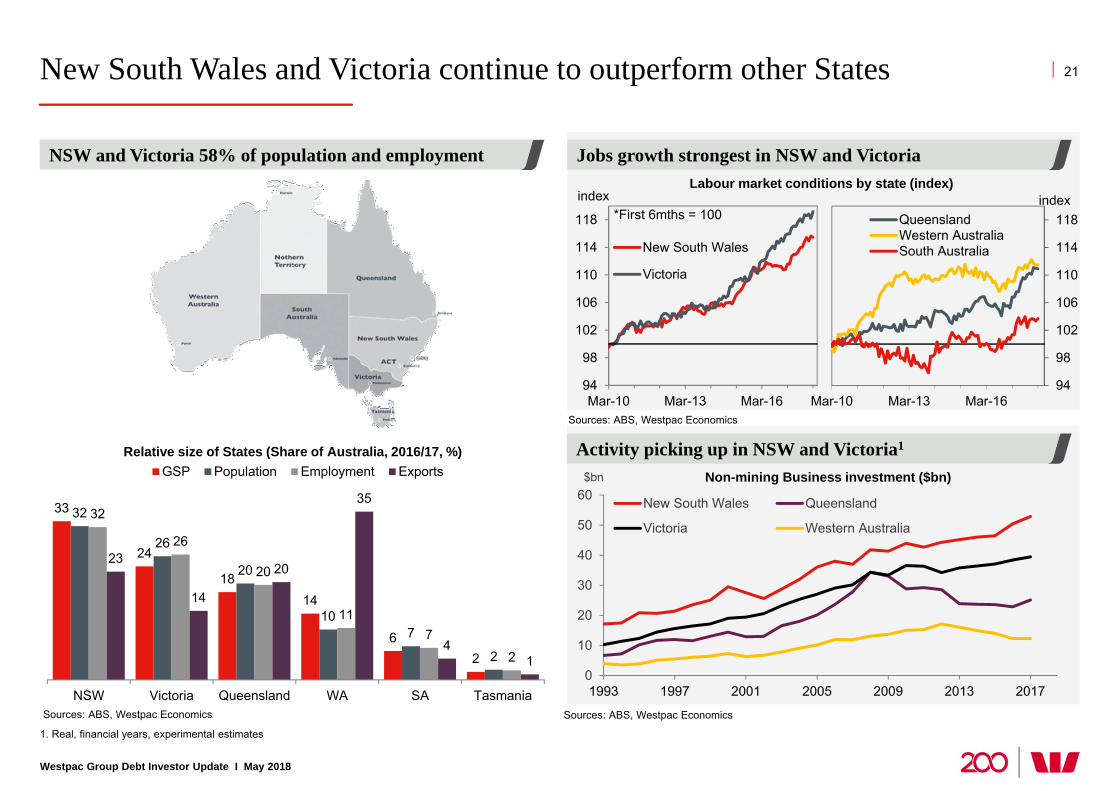
New South Wales and Victoria continue to outperform other States 21
33
24
1814
62
32
26
20
107
2
32
26
20
117
2
23
14
20
35
41
NSW Victoria Queensland WA SA Tasmania
GSP Population Employment Exports
0
10
20
30
40
50
60
1993 1997 2001 2005 2009 2013 2017
$bn
New South Wales Queensland
Victoria Western Australia
Non-mining Business investment ($bn)
1. Real, financial years, experimental estimates
Sources: ABS, Westpac Economics
Sources: ABS, Westpac Economics
Sources: ABS, Westpac Economics
Labour market conditions by state (index)
NSW and Victoria 58% of population and employment
Relative size of States (Share of Australia, 2016/17, %)
Jobs growth strongest in NSW and Victoria
Activity picking up in NSW and Victoria1
94
98
102
106
110
114
118
Mar-10 Mar-13 Mar-16
New South Wales
Victoria
index*First 6mths = 100
94
98
102
106
110
114
118
Mar-10 Mar-13 Mar-16
QueenslandWestern AustraliaSouth Australia
index
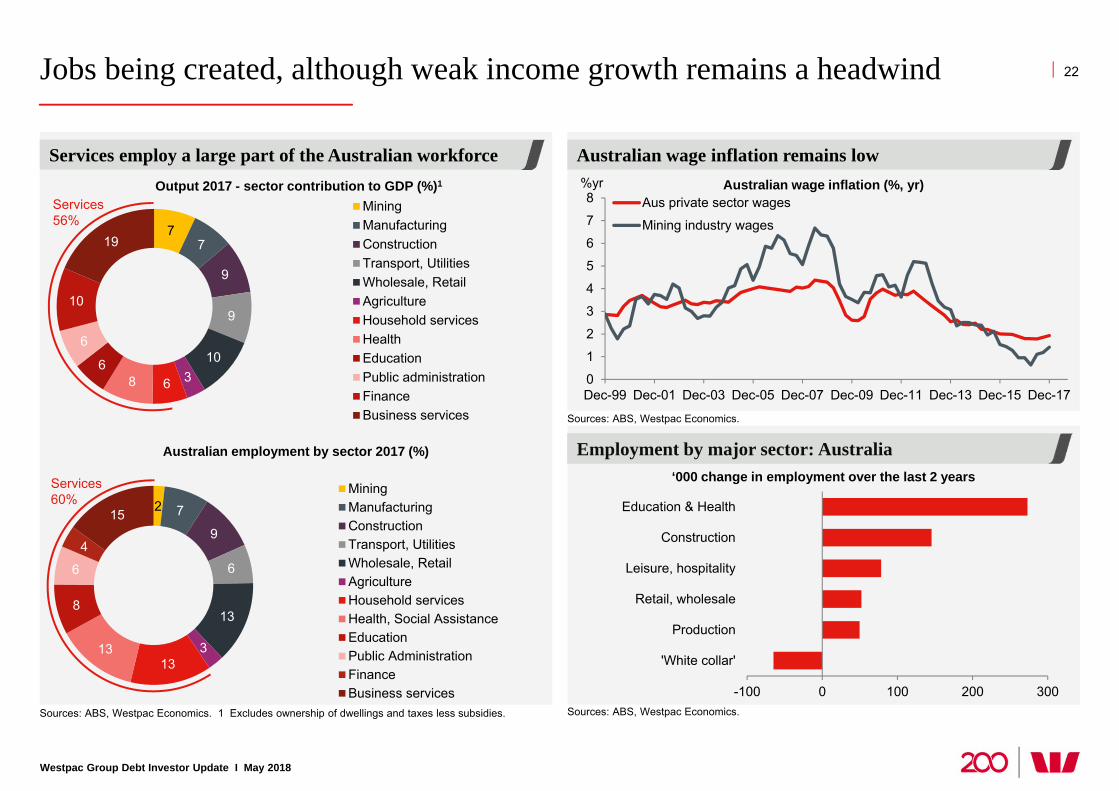
Jobs being created, although weak income growth remains a headwind
Westpac Group Debt Investor Update I May 2018
Services employ a large part of the Australian workforce
Australian wage inflation remains low
22
Sources: ABS, Westpac Economics.
Sources: ABS, Westpac Economics.
Employment by major sector: Australia
Australian wage inflation (%, yr)
Services employ a large part of the Australian workforce
‘000 change in employment over the last 2 years
0
1
2
3
4
5
6
7
8
Dec-99 Dec-01 Dec-03 Dec-05 Dec-07 Dec-09 Dec-11 Dec-13 Dec-15 Dec-17
%yrAus private sector wages
Mining industry wages
-100 0 100 200 300
'White collar'
Production
Retail, wholesale
Leisure, hospitality
Construction
Education & Health
Sources: ABS, Westpac Economics. 1 Excludes ownership of dwellings and taxes less subsidies.
77
9
9
10368
6
6
10
19
MiningManufacturingConstructionTransport, UtilitiesWholesale, RetailAgricultureHousehold servicesHealthEducationPublic administrationFinanceBusiness services
Output 2017 - sector contribution to GDP (%)1
Services 56%
2 7
9
6
13
313
13
8
6
4
15
MiningManufacturingConstructionTransport, UtilitiesWholesale, RetailAgricultureHousehold servicesHealth, Social AssistanceEducationPublic AdministrationFinanceBusiness services
Australian employment by sector 2017 (%)
Services 60%
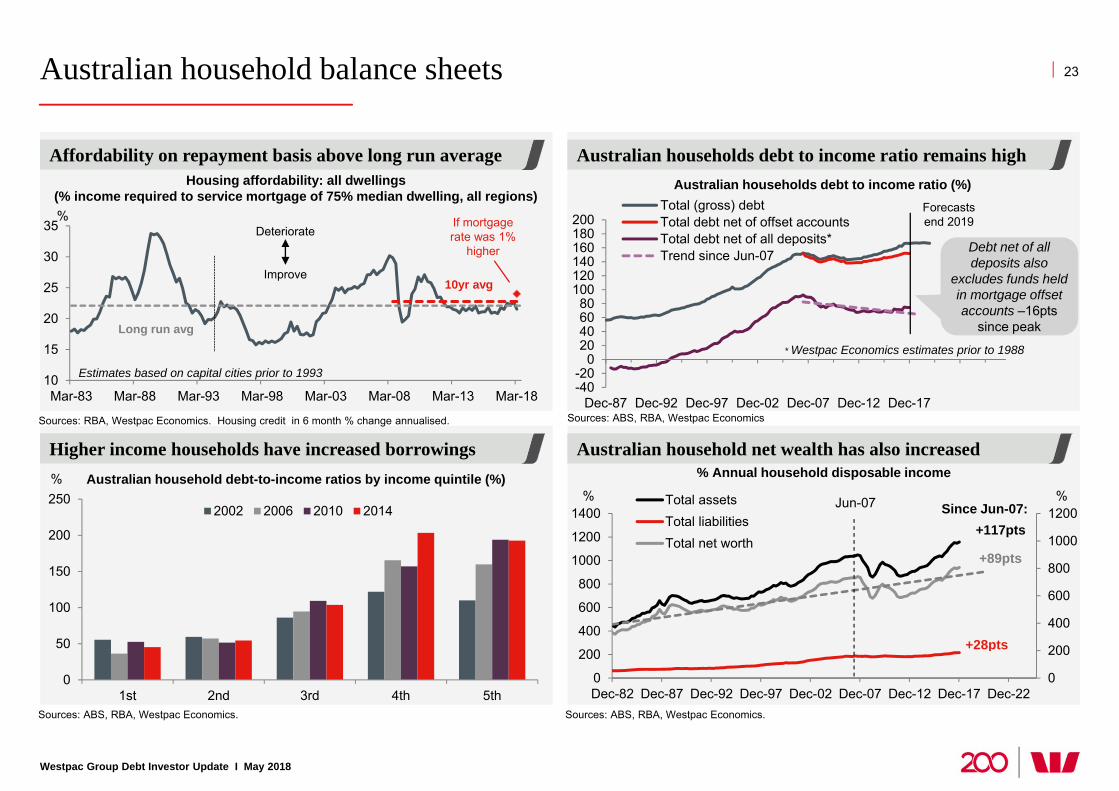
Australian household balance sheets
Westpac Group Debt Investor Update I May 2018
Australian households debt to income ratio remains high
Australian household net wealth has also increased
Affordability on repayment basis above long run average
Higher income households have increased borrowings
23
Sources: ABS, RBA, Westpac Economics. Sources: ABS, RBA, Westpac Economics.
0
200
400
600
800
1000
1200
1400
Dec-82 Dec-87 Dec-92 Dec-97 Dec-02 Dec-07 Dec-12 Dec-17 Dec-220
200
400
600
800
1000
1200% %Total assets
Total liabilitiesTotal net worth
+89pts
+117pts
+28pts
Jun-07 Since Jun-07:
% Annual household disposable income
Sources: RBA, Westpac Economics. Housing credit in 6 month % change annualised.
Housing affordability: all dwellings(% income required to service mortgage of 75% median dwelling, all regions)
Australian household debt-to-income ratios by income quintile (%)
0
50
100
150
200
250
1st 2nd 3rd 4th 5th
2002 2006 2010 2014
%
Sources: ABS, RBA, Westpac Economics
-40-20
020406080
100120140160180200
Dec-87 Dec-92 Dec-97 Dec-02 Dec-07 Dec-12 Dec-17
Total (gross) debtTotal debt net of offset accountsTotal debt net of all deposits*Trend since Jun-07
* Westpac Economics estimates prior to 1988
Forecastsend 2019
Australian households debt to income ratio (%)
10
15
20
25
30
35
Mar-83 Mar-88 Mar-93 Mar-98 Mar-03 Mar-08 Mar-13 Mar-18
Estimates based on capital cities prior to 1993
Long run avg
Deteriorate
Improve10yr avg
If mortgagerate was 1%
higher
%
Debt net of all deposits also
excludes funds held in mortgage offset accounts –16pts
since peak
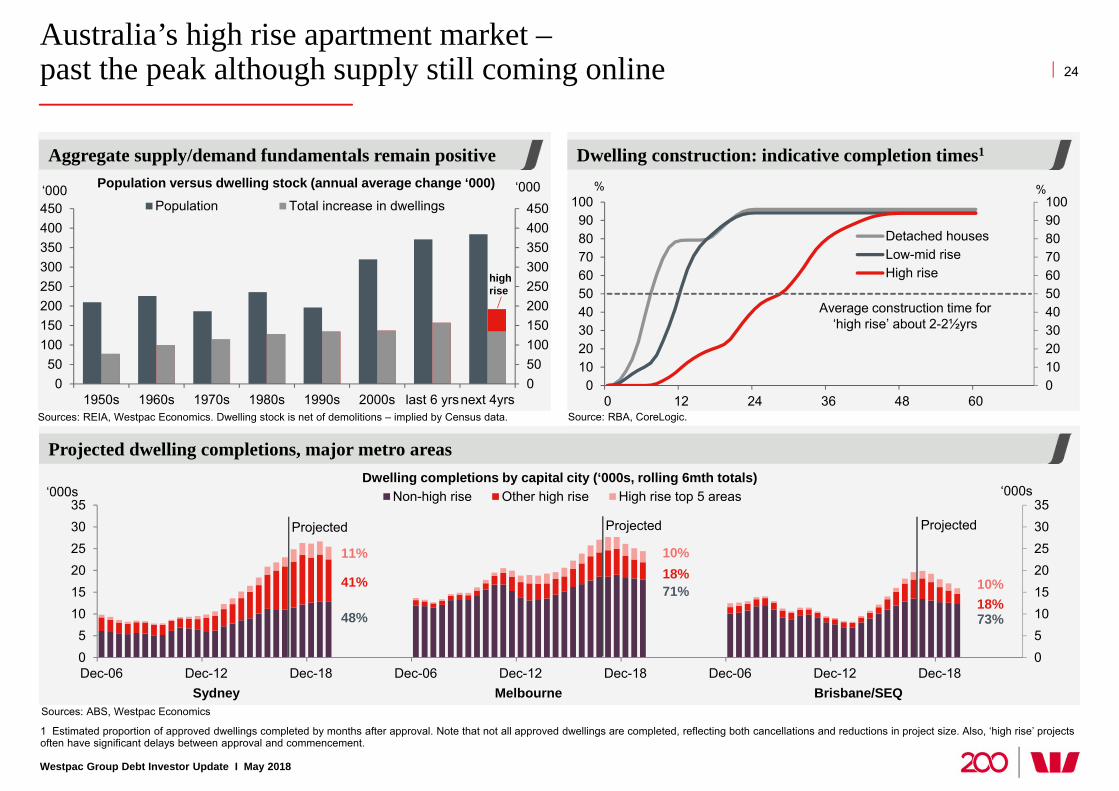
Australia’s high rise apartment market –past the peak although supply still coming online
Westpac Group Debt Investor Update I May 2018
1 Estimated proportion of approved dwellings completed by months after approval. Note that not all approved dwellings are completed, reflecting both cancellations and reductions in project size. Also, ‘high rise’ projects often have significant delays between approval and commencement.
Dwelling construction: indicative completion times1
24
0102030405060708090100
0102030405060708090
100
0 12 24 36 48 60
%%
Detached housesLow-mid riseHigh rise
Average construction time for ‘high rise’ about 2-2½yrs
Dwelling completions by capital city (‘000s, rolling 6mth totals)
Sources: ABS, Westpac Economics
05101520253035
05
101520253035
Dec-06 Dec-12 Dec-18 Dec-06 Dec-12 Dec-18 Dec-06 Dec-12 Dec-18
‘000s‘000s Non-high rise Other high rise High rise top 5 areas
Projected
Sydney Brisbane/SEQMelbourne
41%
11%
48%
18%10%
71%18%10%
73%
Projected Projected
Source: RBA, CoreLogic. Sources: REIA, Westpac Economics. Dwelling stock is net of demolitions – implied by Census data.
Population versus dwelling stock (annual average change ‘000)
Aggregate supply/demand fundamentals remain positive
050100150200250300350400450
050
100150200250300350400450
1950s 1960s 1970s 1980s 1990s 2000s last 6 yrsnext 4yrs
‘000‘000Population Total increase in dwellings
high rise
Projected dwelling completions, major metro areas
0
2
4
6
8
0
2
4
6
8
2005 2007 2009 2011 2013 2015 2017 2019
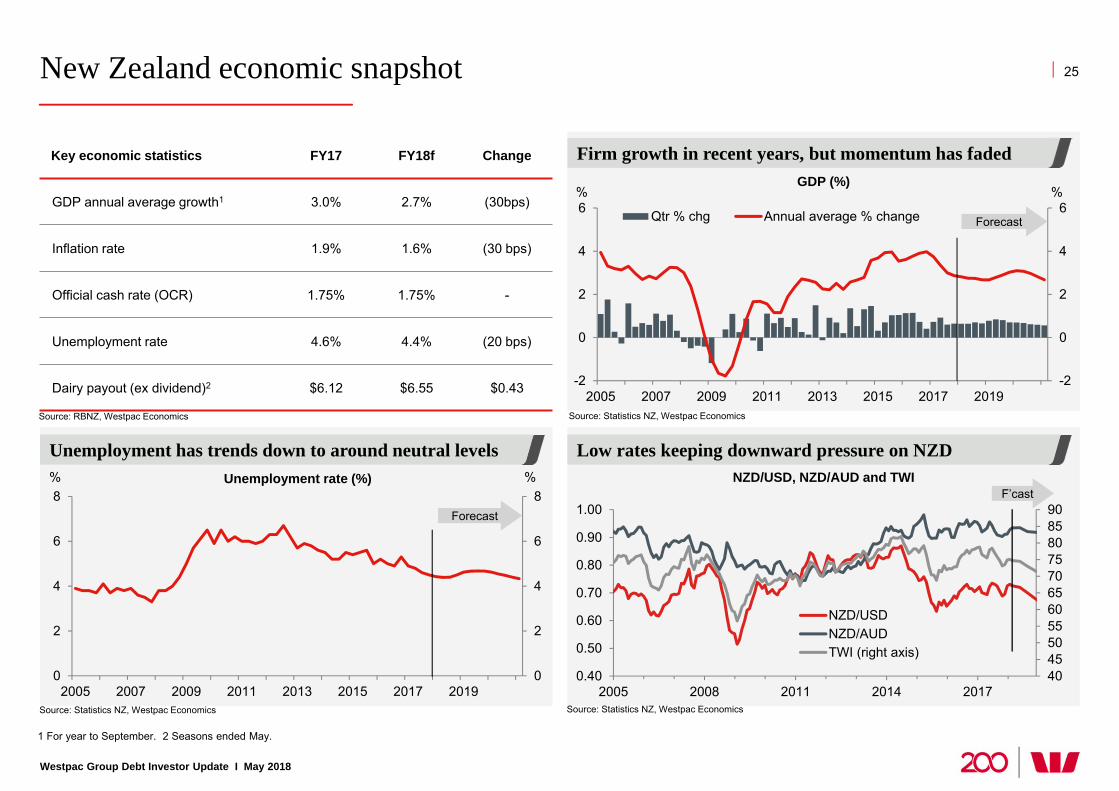
New Zealand economic snapshot
Westpac Group Debt Investor Update I May 2018
Low rates keeping downward pressure on NZD Unemployment has trends down to around neutral levels
1 For year to September. 2 Seasons ended May.
25
Key economic statistics FY17 FY18f Change
GDP annual average growth1 3.0% 2.7% (30bps)
Inflation rate 1.9% 1.6% (30 bps)
Official cash rate (OCR) 1.75% 1.75% -
Unemployment rate 4.6% 4.4% (20 bps)
Dairy payout (ex dividend)2 $6.12 $6.55 $0.43
Source: RBNZ, Westpac Economics
Firm growth in recent years, but momentum has faded
4045505560657075808590
0.40
0.50
0.60
0.70
0.80
0.90
1.00
2005 2008 2011 2014 2017
NZD/USDNZD/AUDTWI (right axis)
Forecast
F’cast
Source: Statistics NZ, Westpac Economics Source: Statistics NZ, Westpac Economics
Unemployment rate (%) NZD/USD, NZD/AUD and TWI
-2
0
2
4
6
-2
0
2
4
6
2005 2007 2009 2011 2013 2015 2017 2019
Qtr % chg Annual average % change
GDP (%)
Forecast
% %
% %
Source: Statistics NZ, Westpac Economics
New Zealand economy: growth to slow
Westpac Group Debt Investor Update I May 2018
0
5
10
15
20
25
30
35
40
0
5
10
15
20
25
30
35
40
2005 2008 2011 2014 2017 2020 2023
$bn$bn
Construction (excl. quake costs)Canterbury rebuildKaikoura earthquake costs
Migration cycle has started to turn down
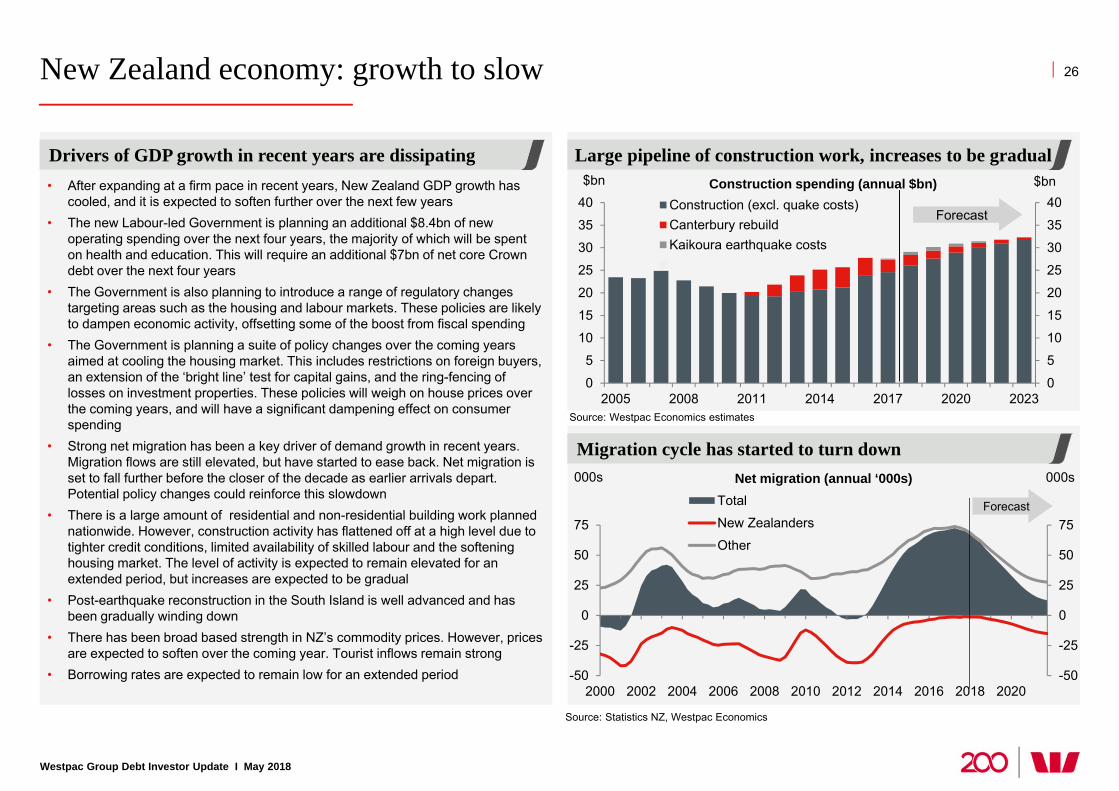
Large pipeline of construction work, increases to be gradualDrivers of GDP growth in recent years are dissipating
26
Construction spending (annual $bn)
Forecast
Source: Statistics NZ, Westpac Economics
Source: Westpac Economics estimates
Net migration (annual ‘000s)
• After expanding at a firm pace in recent years, New Zealand GDP growth has cooled, and it is expected to soften further over the next few years
• The new Labour-led Government is planning an additional $8.4bn of new operating spending over the next four years, the majority of which will be spent on health and education. This will require an additional $7bn of net core Crown debt over the next four years
• The Government is also planning to introduce a range of regulatory changes targeting areas such as the housing and labour markets. These policies are likely to dampen economic activity, offsetting some of the boost from fiscal spending
• The Government is planning a suite of policy changes over the coming years aimed at cooling the housing market. This includes restrictions on foreign buyers, an extension of the ‘bright line’ test for capital gains, and the ring-fencing of losses on investment properties. These policies will weigh on house prices over the coming years, and will have a significant dampening effect on consumer spending
• Strong net migration has been a key driver of demand growth in recent years. Migration flows are still elevated, but have started to ease back. Net migration is set to fall further before the closer of the decade as earlier arrivals depart. Potential policy changes could reinforce this slowdown
• There is a large amount of residential and non-residential building work planned nationwide. However, construction activity has flattened off at a high level due to tighter credit conditions, limited availability of skilled labour and the softening housing market. The level of activity is expected to remain elevated for an extended period, but increases are expected to be gradual
• Post-earthquake reconstruction in the South Island is well advanced and has been gradually winding down
• There has been broad based strength in NZ’s commodity prices. However, prices are expected to soften over the coming year. Tourist inflows remain strong
• Borrowing rates are expected to remain low for an extended period -50
-25
0
25
50
75
-50
-25
0
25
50
75
2000 2002 2004 2006 2008 2010 2012 2014 2016 2018 2020
000s000s
Total
New Zealanders
Other
Forecast
New Zealand economic indicators
Westpac Group Debt Investor Update I May 2018
27
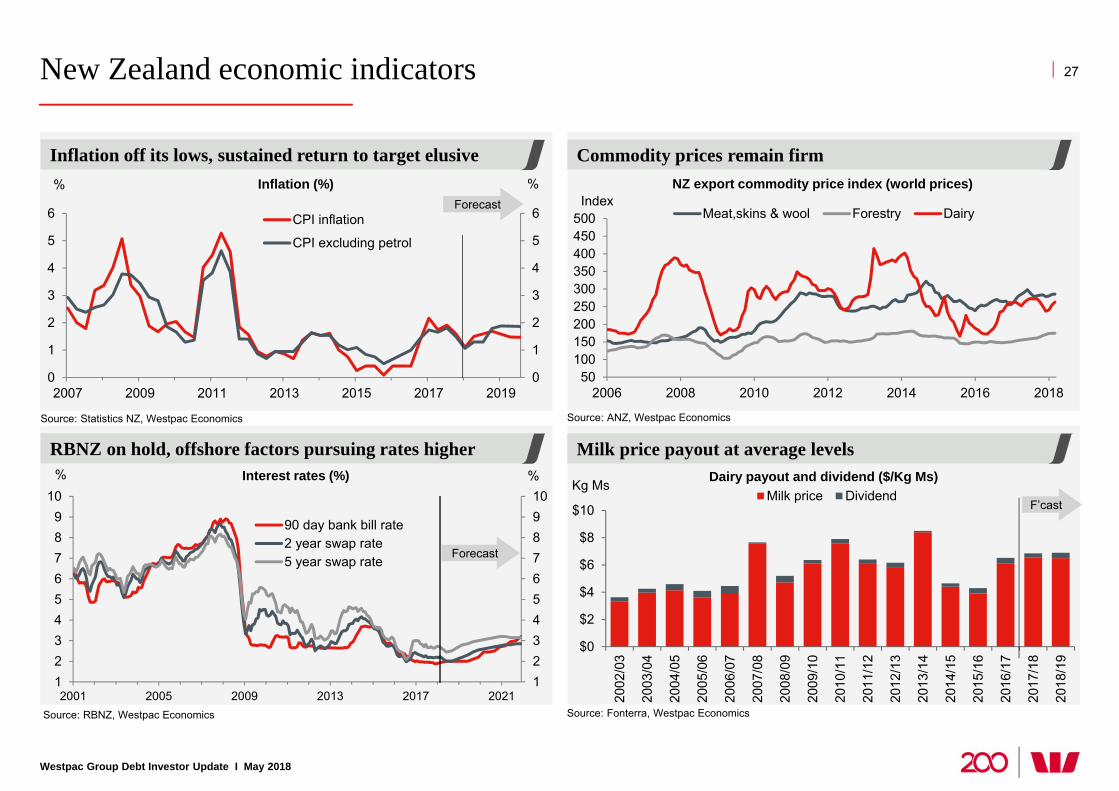
RBNZ on hold, offshore factors pursuing rates higher
Inflation off its lows, sustained return to target elusive
0
1
2
3
4
5
6
0
1
2
3
4
5
6
2007 2009 2011 2013 2015 2017 2019
%%
CPI inflation
CPI excluding petrol
12345678910
123456789
10
2001 2005 2009 2013 2017 2021
%%
90 day bank bill rate2 year swap rate5 year swap rate
Inflation (%)
Source: Statistics NZ, Westpac Economics
Source: RBNZ, Westpac Economics
Forecast
Forecast
Interest rates (%)
$0
$2
$4
$6
$8
$10
2002
/03
2003
/04
2004
/05
2005
/06
2006
/07
2007
/08
2008
/09
2009
/10
2010
/11
2011
/12
2012
/13
2013
/14
2014
/15
2015
/16
2016
/17
2017
/18
2018
/19
Kg MsMilk price Dividend
Milk price payout at average levels
Commodity prices remain firm
50100150200250300350400450500
2006 2008 2010 2012 2014 2016 2018
Meat,skins & wool Forestry DairyIndex
Source: ANZ, Westpac Economics
NZ export commodity price index (world prices)
Dairy payout and dividend ($/Kg Ms)
Source: Fonterra, Westpac Economics
F’cast
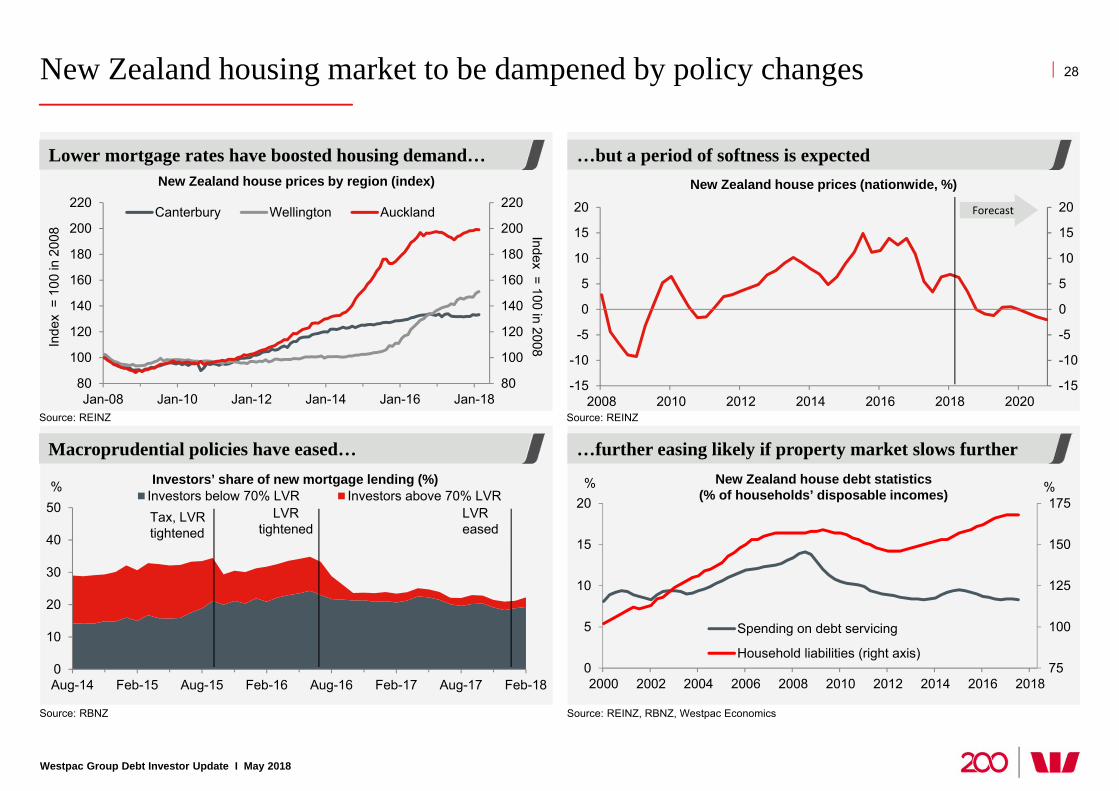
New Zealand housing market to be dampened by policy changes
Westpac Group Debt Investor Update I May 2018
28
-15
-10
-5
0
5
10
15
20
-15
-10
-5
0
5
10
15
20
2008 2010 2012 2014 2016 2018 2020
Forecast
New Zealand house prices by region (index)
…but a period of softness is expectedLower mortgage rates have boosted housing demand…
Source: REINZ Source: REINZ
New Zealand house prices (nationwide, %)
75
100
125
150
175
0
5
10
15
20
2000 2002 2004 2006 2008 2010 2012 2014 2016 2018
Spending on debt servicing
Household liabilities (right axis)
% %
…further easing likely if property market slows furtherNew Zealand house debt statistics
(% of households’ disposable incomes)
Macroprudential policies have eased…Investors’ share of new mortgage lending (%)
Source: RBNZ Source: REINZ, RBNZ, Westpac Economics
80
100
120
140
160
180
200
220
80
100
120
140
160
180
200
220
Jan-08 Jan-10 Jan-12 Jan-14 Jan-16 Jan-18
Canterbury Wellington Auckland
Inde
x =
100
in 2
008 Index = 100 in 2008
0
10
20
30
40
50
Aug-14 Feb-15 Aug-15 Feb-16 Aug-16 Feb-17 Aug-17 Feb-18
%Investors below 70% LVR Investors above 70% LVRTax, LVR tightened
LVR tightened
LVR eased
Additional information
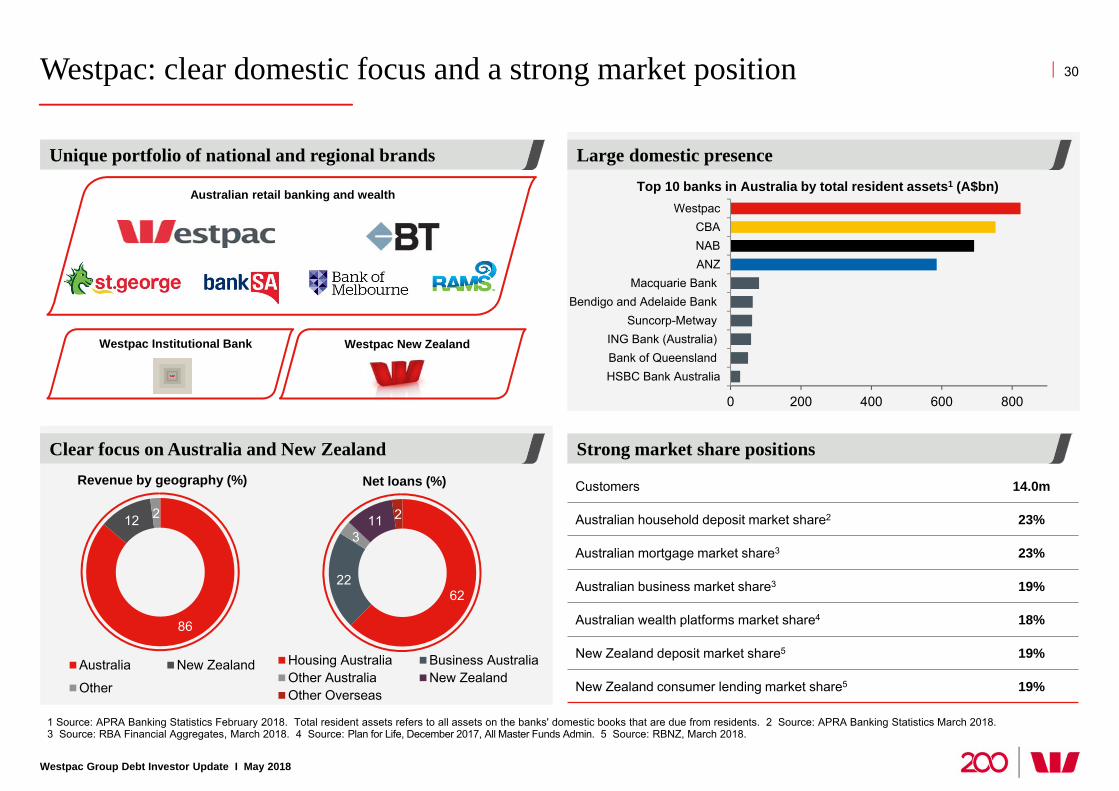
Westpac: clear domestic focus and a strong market position
Large domestic presence
Strong market share positions
Unique portfolio of national and regional brands
Clear focus on Australia and New Zealand
1 Source: APRA Banking Statistics February 2018. Total resident assets refers to all assets on the banks' domestic books that are due from residents. 2 Source: APRA Banking Statistics March 2018. 3 Source: RBA Financial Aggregates, March 2018. 4 Source: Plan for Life, December 2017, All Master Funds Admin. 5 Source: RBNZ, March 2018.
30
Westpac Group Debt Investor Update I May 2018
Net loans (%)
Westpac New Zealand Westpac Institutional Bank
Australian retail banking and wealth
86
12 2
Australia New Zealand
Other
6222
311 2
Housing Australia Business AustraliaOther Australia New ZealandOther Overseas
0 200 400 600 800
HSBC Bank AustraliaBank of QueenslandING Bank (Australia)
Suncorp-MetwayBendigo and Adelaide Bank
Macquarie BankANZNABCBA
Westpac
Revenue by geography (%)
Top 10 banks in Australia by total resident assets1 (A$bn)
Customers 14.0m
Australian household deposit market share2 23%
Australian mortgage market share3 23%
Australian business market share3 19%
Australian wealth platforms market share4 18%
New Zealand deposit market share5 19%
New Zealand consumer lending market share5 19%
Westpac Group Debt Investor Update I May 2018
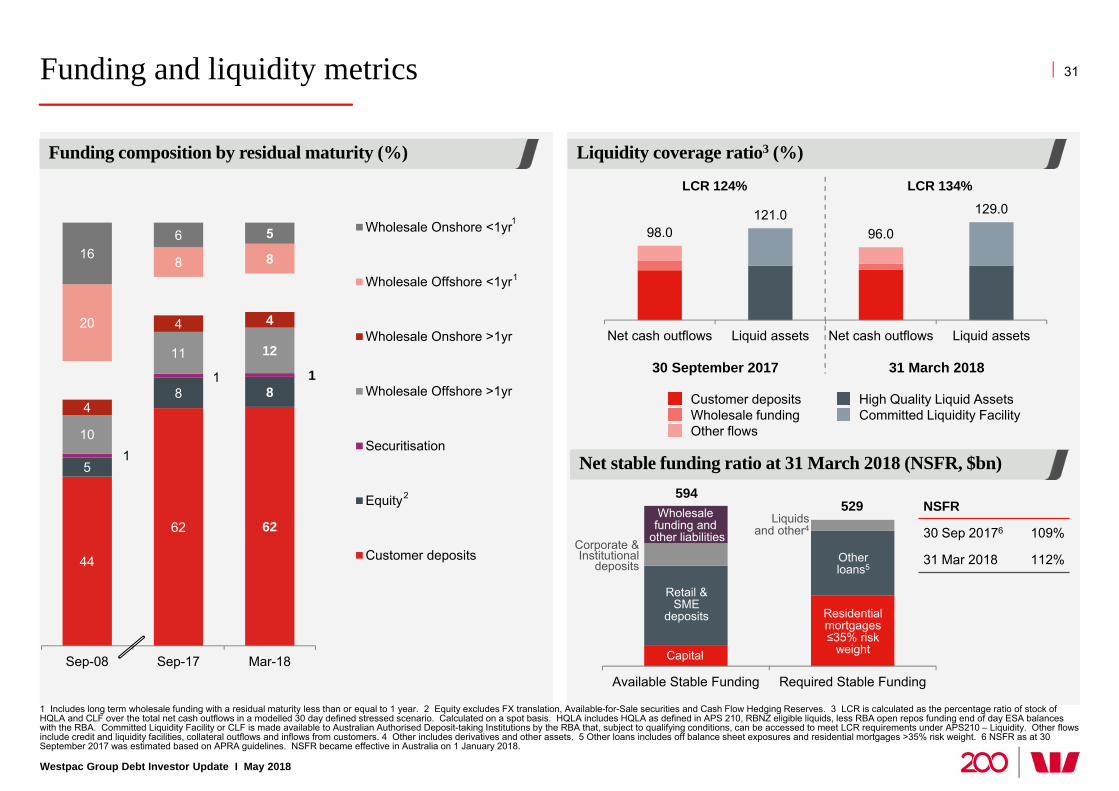
Funding and liquidity metrics
1 Includes long term wholesale funding with a residual maturity less than or equal to 1 year. 2 Equity excludes FX translation, Available-for-Sale securities and Cash Flow Hedging Reserves. 3 LCR is calculated as the percentage ratio of stock of HQLA and CLF over the total net cash outflows in a modelled 30 day defined stressed scenario. Calculated on a spot basis. HQLA includes HQLA as defined in APS 210, RBNZ eligible liquids, less RBA open repos funding end of day ESA balances with the RBA. Committed Liquidity Facility or CLF is made available to Australian Authorised Deposit-taking Institutions by the RBA that, subject to qualifying conditions, can be accessed to meet LCR requirements under APS210 – Liquidity. Other flows include credit and liquidity facilities, collateral outflows and inflows from customers. 4 Other includes derivatives and other assets. 5 Other loans includes off balance sheet exposures and residential mortgages >35% risk weight. 6 NSFR as at 30 September 2017 was estimated based on APRA guidelines. NSFR became effective in Australia on 1 January 2018.
31
Funding composition by residual maturity (%)
44
62 62
5
8 8
1
1 1
10
11 12
4
4 420
8 8166 5
Sep-08 Sep-17 Mar-18
Wholesale Onshore <1yr
Wholesale Offshore <1yr
Wholesale Onshore >1yr
Wholesale Offshore >1yr
Securitisation
Equity
Customer deposits
Net stable funding ratio at 31 March 2018 (NSFR, $bn)
Available Stable Funding Required Stable Funding
594529
Capital
Retail & SME
deposits
Corporate & Institutional
deposits
Wholesale funding and
other liabilities
Residential mortgages ≤35% risk
weight
Other loans5
Liquids and other4
Liquidity coverage ratio3 (%)
98.0121.0
96.0
129.0
Net cash outflows Liquid assets Net cash outflows Liquid assets
LCR 124% LCR 134%
30 September 2017 31 March 2018
Customer deposits High Quality Liquid AssetsWholesale funding Committed Liquidity FacilityOther flows
NSFR
30 Sep 20176 109%
31 Mar 2018 112%
2
1
1
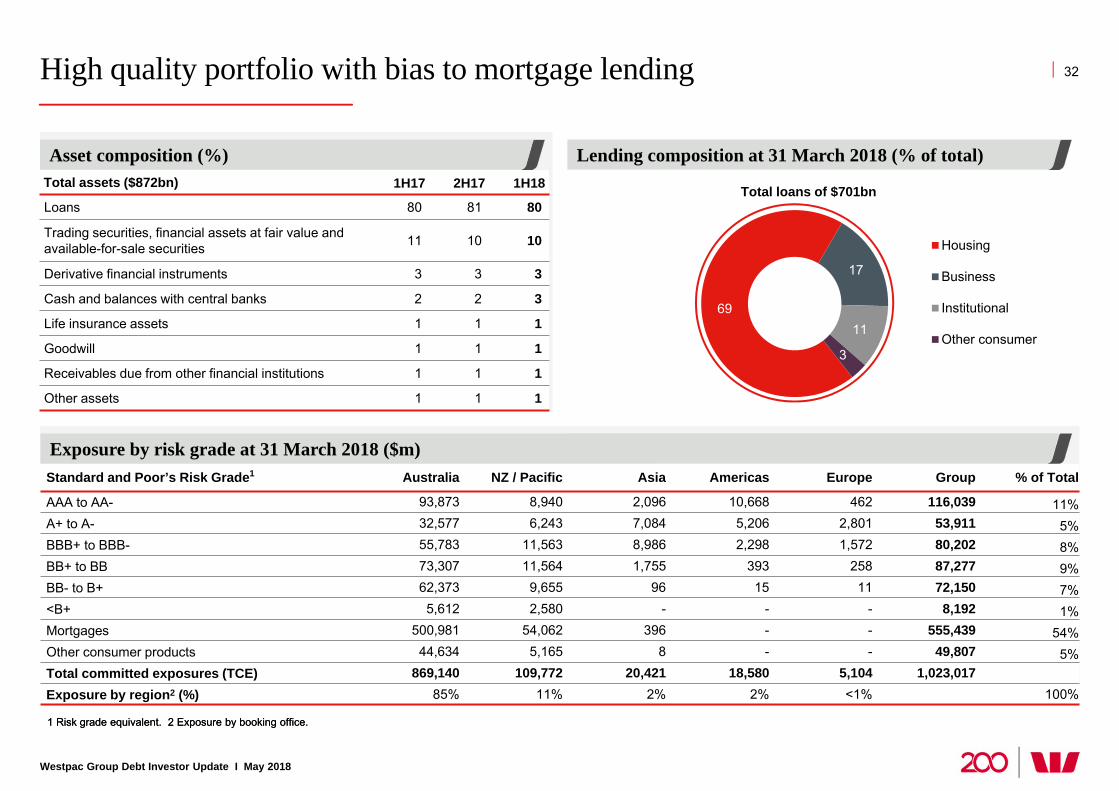
Standard and Poor’s Risk Grade1 Australia NZ / Pacific Asia Americas Europe Group % of Total
AAA to AA- 93,873 8,940 2,096 10,668 462 116,039 11%A+ to A- 32,577 6,243 7,084 5,206 2,801 53,911 5%BBB+ to BBB- 55,783 11,563 8,986 2,298 1,572 80,202 8%BB+ to BB 73,307 11,564 1,755 393 258 87,277 9%BB- to B+ 62,373 9,655 96 15 11 72,150 7%<B+ 5,612 2,580 - - - 8,192 1%Mortgages 500,981 54,062 396 - - 555,439 54%Other consumer products 44,634 5,165 8 - - 49,807 5%Total committed exposures (TCE) 869,140 109,772 20,421 18,580 5,104 1,023,017 Exposure by region2 (%) 85% 11% 2% 2% <1% 100%
High quality portfolio with bias to mortgage lending
Westpac Group Debt Investor Update I May 2018
1 Risk grade equivalent. 2 Exposure by booking office.
Lending composition at 31 March 2018 (% of total)Asset composition (%)
32
69
17
11
3
Housing
Business
Institutional
Other consumer
Total loans of $701bn
1 Risk grade equivalent. 2 Exposure by booking office.
Exposure by risk grade at 31 March 2018 ($m)
Total assets ($872bn) 1H17 2H17 1H18
Loans 80 81 80
Trading securities, financial assets at fair value and available-for-sale securities 11 10 10
Derivative financial instruments 3 3 3
Cash and balances with central banks 2 2 3
Life insurance assets 1 1 1
Goodwill 1 1 1
Receivables due from other financial institutions 1 1 1
Other assets 1 1 1
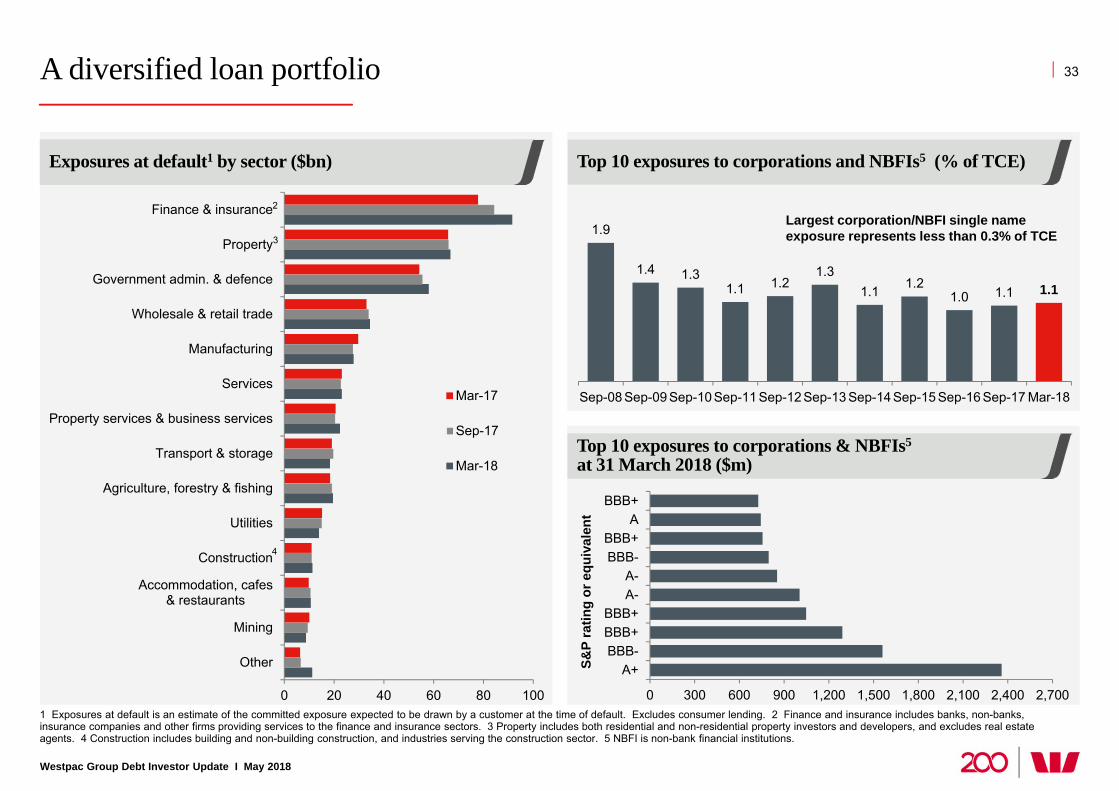
A diversified loan portfolio
Westpac Group Debt Investor Update I May 2018
1 Exposures at default is an estimate of the committed exposure expected to be drawn by a customer at the time of default. Excludes consumer lending. 2 Finance and insurance includes banks, non-banks, insurance companies and other firms providing services to the finance and insurance sectors. 3 Property includes both residential and non-residential property investors and developers, and excludes real estate agents. 4 Construction includes building and non-building construction, and industries serving the construction sector. 5 NBFI is non-bank financial institutions.
0 20 40 60 80 100
Other
Mining
Accommodation, cafes& restaurants
Construction
Utilities
Agriculture, forestry & fishing
Transport & storage
Property services & business services
Services
Manufacturing
Wholesale & retail trade
Government admin. & defence
Property
Finance & insurance
Mar-17
Sep-17
Mar-18
1.9
1.4 1.31.1 1.2
1.31.1 1.2
1.0 1.1 1.1
Sep-08 Sep-09 Sep-10 Sep-11 Sep-12 Sep-13 Sep-14 Sep-15 Sep-16 Sep-17 Mar-18
0 300 600 900 1,200 1,500 1,800 2,100 2,400 2,700
A+BBB-BBB+BBB+
A-A-
BBB-BBB+
ABBB+
S&P
ratin
g or
equ
ival
ent
Top 10 exposures to corporations and NBFIs5 (% of TCE)
Top 10 exposures to corporations & NBFIs5
at 31 March 2018 ($m)
33
Largest corporation/NBFI single name exposure represents less than 0.3% of TCE
Exposures at default1 by sector ($bn)
2
3
4
Well provisioned, sound asset quality
Westpac Group Debt Investor Update I May 2018
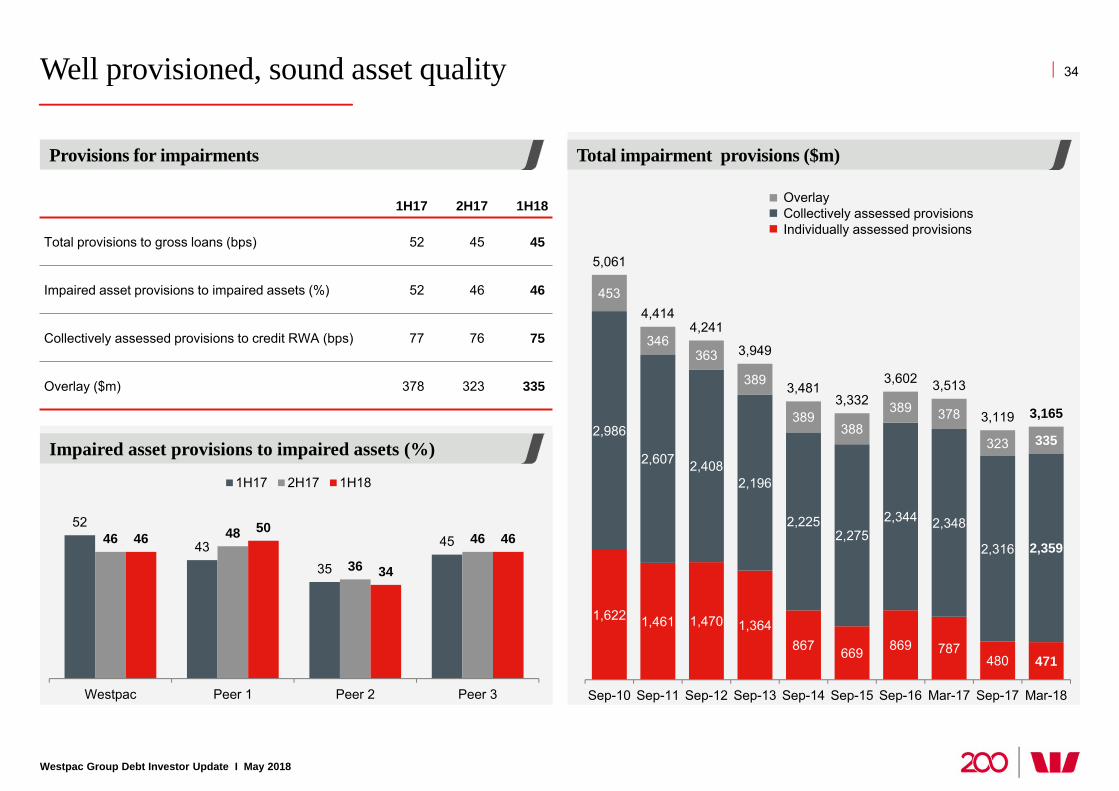
Provisions for impairments
Impaired asset provisions to impaired assets (%)
Total impairment provisions ($m)
34
OverlayCollectively assessed provisionsIndividually assessed provisions
1H17 2H17 1H18
Total provisions to gross loans (bps) 52 45 45
Impaired asset provisions to impaired assets (%) 52 46 46
Collectively assessed provisions to credit RWA (bps) 77 76 75
Overlay ($m) 378 323 335
1,622 1,461 1,470 1,364867 669 869 787
480 471
2,986
2,607 2,4082,196
2,2252,275
2,344 2,348
2,316 2,359
453
346363
389
389388
389 378
323 335
5,061
4,4144,241
3,949
3,4813,332
3,602 3,513
3,119 3,165
Sep-10 Sep-11 Sep-12 Sep-13 Sep-14 Sep-15 Sep-16 Mar-17 Sep-17 Mar-18
52
4335
4546 48
36
464650
34
46
Westpac Peer 1 Peer 2 Peer 3
1H17 2H17 1H18
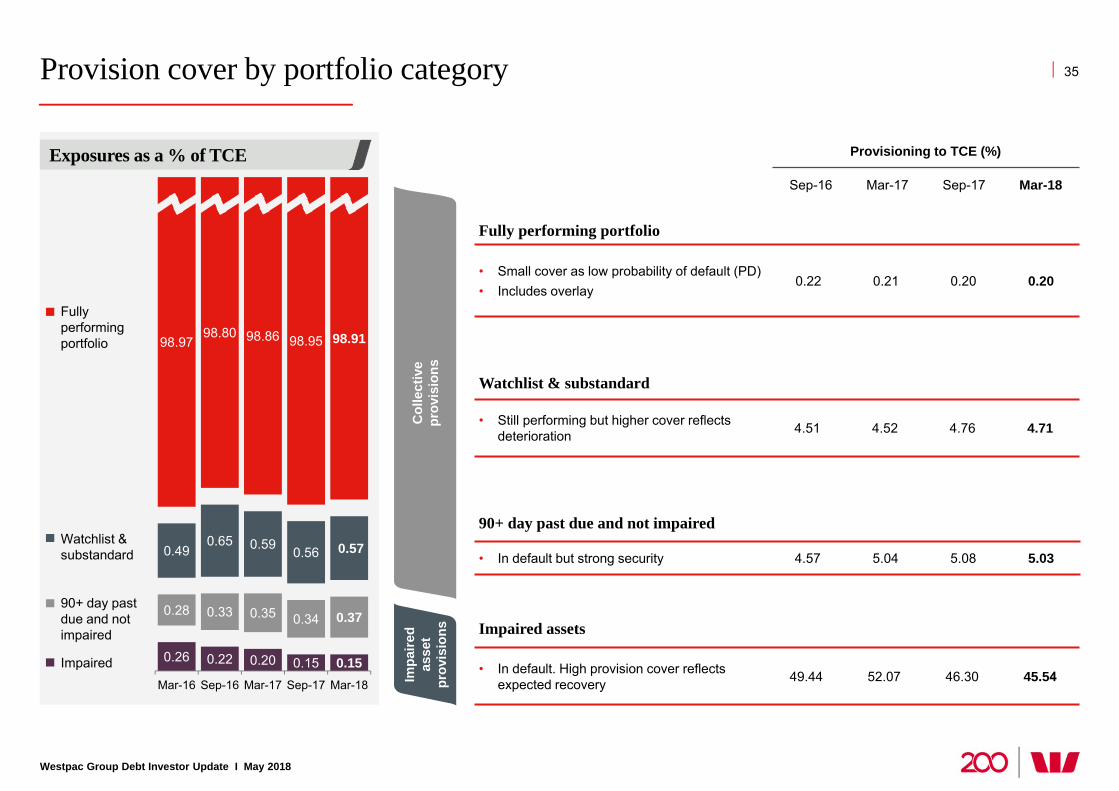
Provision cover by portfolio category
Westpac Group Debt Investor Update I May 2018
35
Exposures as a % of TCE
0.26 0.22 0.20 0.15 0.15
0.28 0.33 0.35 0.34 0.37
0.490.65 0.59 0.56 0.57
98.9798.80 98.86 98.95 98.91
Mar-16 Sep-16 Mar-17 Sep-17 Mar-18
Fully performing portfolio
Watchlist & substandard
90+ day past due and not impaired
Impaired
Fully performing portfolio
• Small cover as low probability of default (PD)• Includes overlay
0.22 0.21 0.20 0.20
Provisioning to TCE (%)
Sep-16 Mar-17 Sep-17 Mar-18
Watchlist & substandard
• Still performing but higher cover reflectsdeterioration 4.51 4.52 4.76 4.71
90+ day past due and not impaired
• In default but strong security 4.57 5.04 5.08 5.03
Impaired assets
• In default. High provision cover reflectsexpected recovery 49.44 52.07 46.30 45.54Im
paire
d as
set
prov
isio
ns
Col
lect
ive
prov
isio
ns
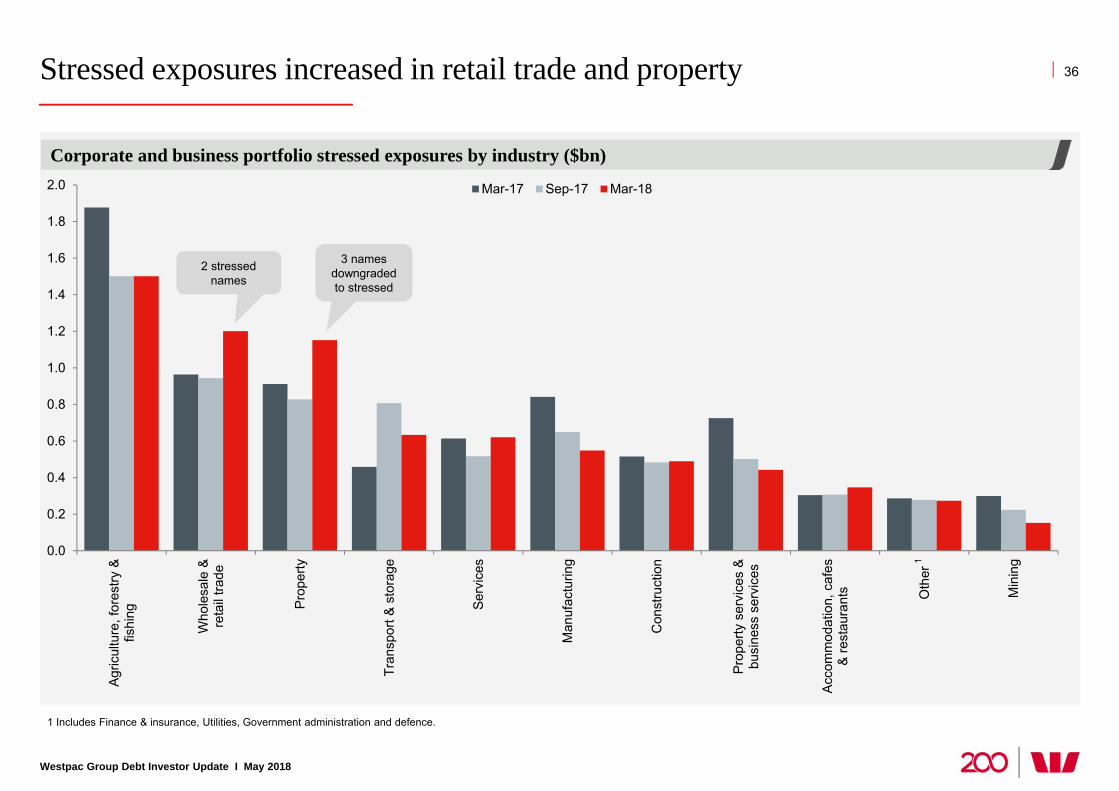
Stressed exposures increased in retail trade and property
Westpac Group Debt Investor Update I May 2018
1 Includes Finance & insurance, Utilities, Government administration and defence.
Corporate and business portfolio stressed exposures by industry ($bn)
36
0.0
0.2
0.4
0.6
0.8
1.0
1.2
1.4
1.6
1.8
2.0
Agric
ultu
re, f
ores
try &
fishi
ng
Who
lesa
le &
reta
il tra
de
Prop
erty
Tran
spor
t & s
tora
ge
Serv
ices
Man
ufac
turin
g
Con
stru
ctio
n
Prop
erty
ser
vice
s &
busi
ness
ser
vice
s
Acco
mm
odat
ion,
caf
es&
rest
aura
nts Oth
er
Min
ing
Mar-17 Sep-17 Mar-18
3 names downgraded to stressed
1
2 stressed names
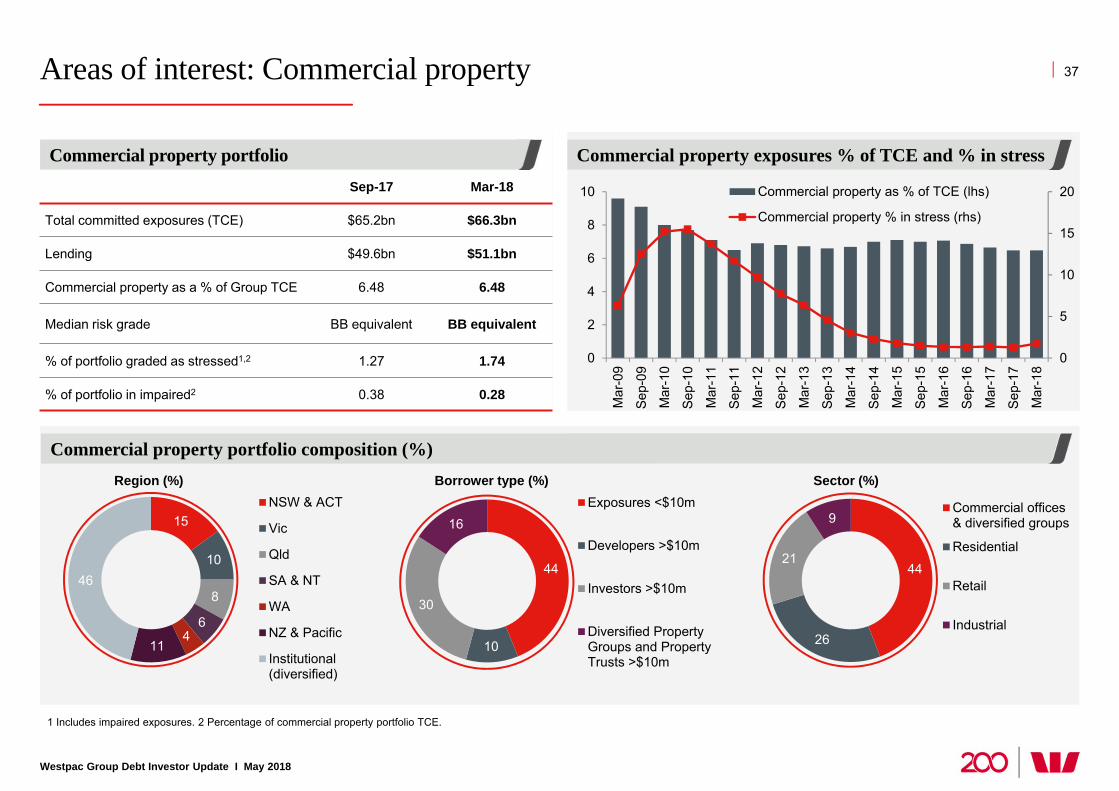
Areas of interest: Commercial property
Westpac Group Debt Investor Update I May 2018
1 Includes impaired exposures. 2 Percentage of commercial property portfolio TCE.
Commercial property portfolio composition (%)
Commercial property exposures % of TCE and % in stressCommercial property portfolio
37
0
5
10
15
20
0
2
4
6
8
10
Mar
-09
Sep-
09
Mar
-10
Sep-
10
Mar
-11
Sep-
11
Mar
-12
Sep-
12
Mar
-13
Sep-
13
Mar
-14
Sep-
14
Mar
-15
Sep-
15
Mar
-16
Sep-
16
Mar
-17
Sep-
17
Mar
-18
Commercial property as % of TCE (lhs)
Commercial property % in stress (rhs)
Sep-17 Mar-18
Total committed exposures (TCE) $65.2bn $66.3bn
Lending $49.6bn $51.1bn
Commercial property as a % of Group TCE 6.48 6.48
Median risk grade BB equivalent BB equivalent
% of portfolio graded as stressed1,2 1.27 1.74
% of portfolio in impaired2 0.38 0.28
15
10
8
64
11
46
NSW & ACT
Vic
Qld
SA & NT
WA
NZ & Pacific
Institutional(diversified)
44
10
30
16Exposures <$10m
Developers >$10m
Investors >$10m
Diversified PropertyGroups and PropertyTrusts >$10m
44
26
21
9Commercial offices& diversified groups
Residential
Retail
Industrial
Borrower type (%)Region (%) Sector (%)
Areas of interest: Inner city apartments
Westpac Group Debt Investor Update I May 2018
38
1 Percentage of commercial property TCE.
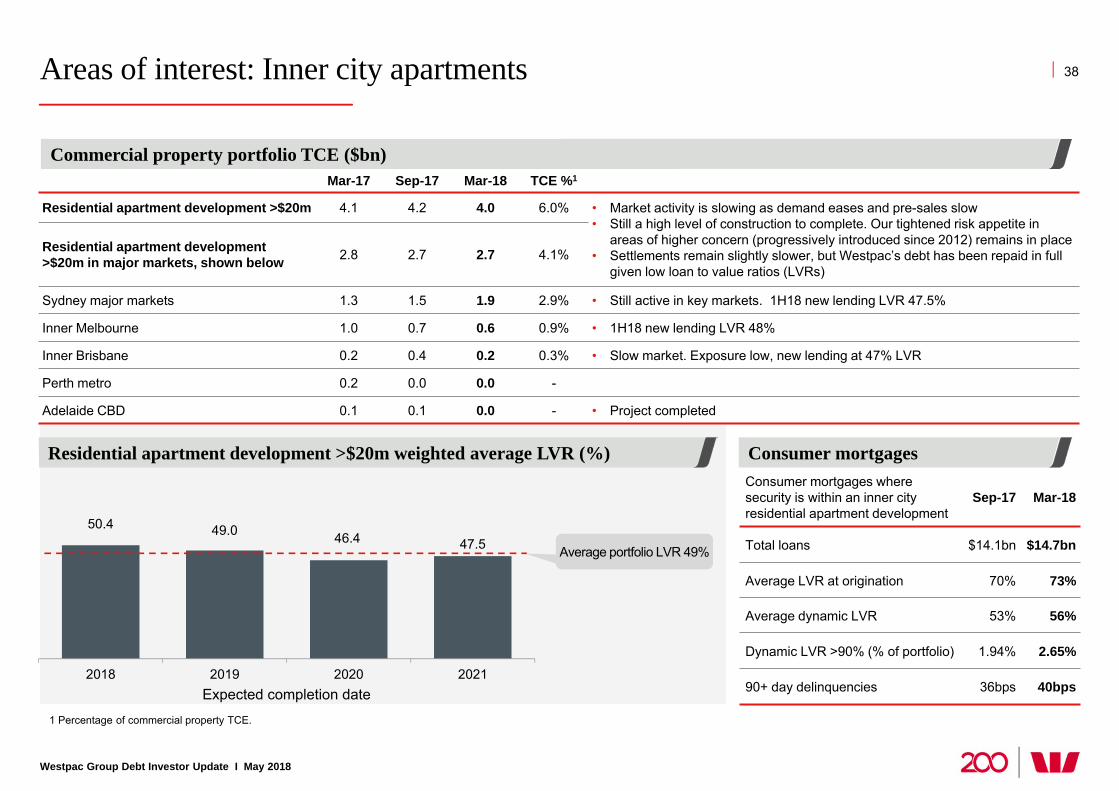
50.4 49.0 46.4 47.5
2018 2019 2020 2021Expected completion date
Mar-17 Sep-17 Mar-18 TCE %1
Residential apartment development >$20m 4.1 4.2 4.0 6.0% • Market activity is slowing as demand eases and pre-sales slow• Still a high level of construction to complete. Our tightened risk appetite in
areas of higher concern (progressively introduced since 2012) remains in place• Settlements remain slightly slower, but Westpac’s debt has been repaid in full
given low loan to value ratios (LVRs)
Residential apartment development >$20m in major markets, shown below 2.8 2.7 2.7 4.1%
Sydney major markets 1.3 1.5 1.9 2.9% • Still active in key markets. 1H18 new lending LVR 47.5%
Inner Melbourne 1.0 0.7 0.6 0.9% • 1H18 new lending LVR 48%
Inner Brisbane 0.2 0.4 0.2 0.3% • Slow market. Exposure low, new lending at 47% LVR
Perth metro 0.2 0.0 0.0 -
Adelaide CBD 0.1 0.1 0.0 - • Project completed
Average portfolio LVR 49%
Consumer mortgages where security is within an inner city residential apartment development
Sep-17 Mar-18
Total loans $14.1bn $14.7bn
Average LVR at origination 70% 73%
Average dynamic LVR 53% 56%
Dynamic LVR >90% (% of portfolio) 1.94% 2.65%
90+ day delinquencies 36bps 40bps
Residential apartment development >$20m weighted average LVR (%)
Commercial property portfolio TCE ($bn)
Consumer mortgages
Areas of interest: Retail trade
Westpac Group Debt Investor Update I May 2018
1 Includes impaired exposures. 2 Percentage of retail trade portfolio TCE.
Retail trade portfolio composition
Overview
39
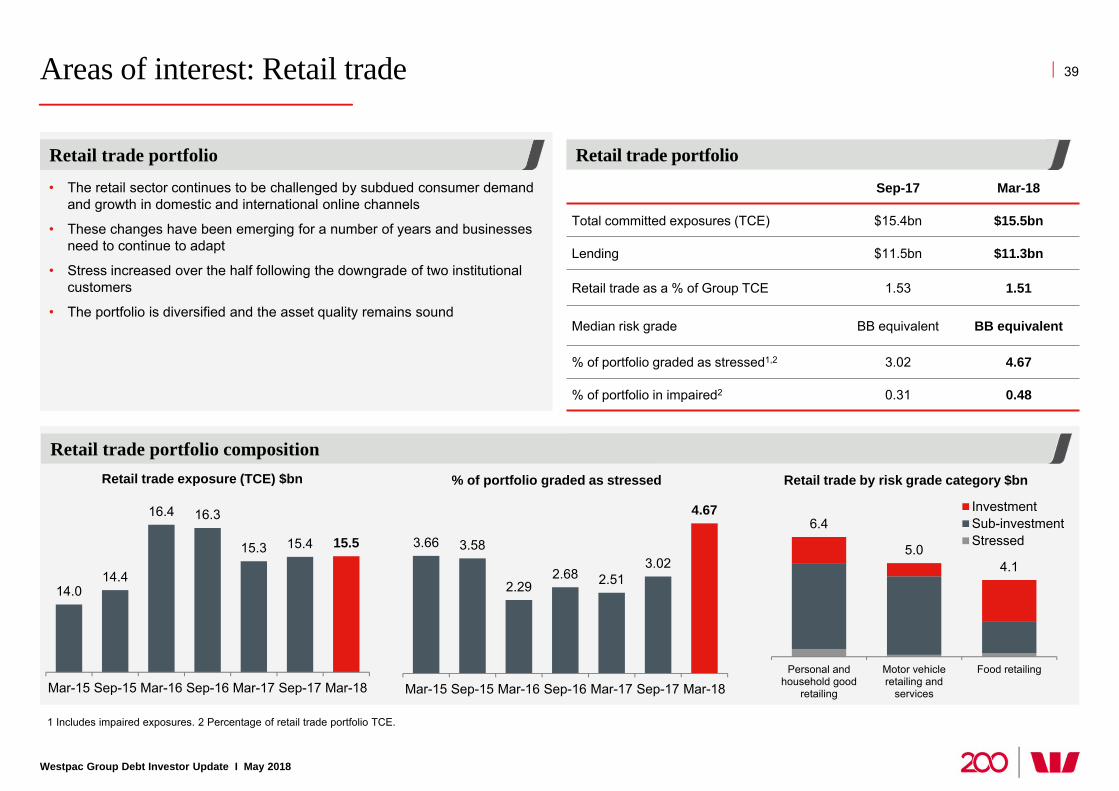
Sep-17 Mar-18
Total committed exposures (TCE) $15.4bn $15.5bn
Lending $11.5bn $11.3bn
Retail trade as a % of Group TCE 1.53 1.51
Median risk grade BB equivalent BB equivalent
% of portfolio graded as stressed1,2 3.02 4.67
% of portfolio in impaired2 0.31 0.48
Retail trade portfolio
• The retail sector continues to be challenged by subdued consumer demand and growth in domestic and international online channels
• These changes have been emerging for a number of years and businesses need to continue to adapt
• Stress increased over the half following the downgrade of two institutional customers
• The portfolio is diversified and the asset quality remains sound
14.014.4
16.4 16.3
15.3 15.4 15.5
Mar-15 Sep-15 Mar-16 Sep-16 Mar-17 Sep-17 Mar-18
Retail trade exposure (TCE) $bn
3.66 3.58
2.292.68 2.51
3.02
4.67
Mar-15 Sep-15 Mar-16 Sep-16 Mar-17 Sep-17 Mar-18
% of portfolio graded as stressed
Retail trade portfolio
6.4
5.04.1
Personal andhousehold good
retailing
Motor vehicleretailing and
services
Food retailing
InvestmentSub-investmentStressed
Retail trade by risk grade category $bn

Areas of interest: Mining and NZ dairy
Westpac Group Debt Investor Update I May 2018
1 Includes impaired exposures. 2 Percentage of portfolio TCE. 3 Sourced from Westpac Economics and Bloomberg. 4 The steel index 62% Fe fines benchmark. 5 Brent oil price. 6 Source Fonterra.
New Zealand dairy portfolio
Mining (inc. oil and gas) portfolio
40
Sep-17 Mar-18
Total committed exposures (TCE) $9.7bn $9.3bn
Lending $5.1bn $5.1bn
% of Group TCE 0.96 0.91
% of portfolio graded as stressed1,2 2.33 1.72
% of portfolio in impaired2 0.44 0.31
Sep-17 Mar-18
Total committed exposure (TCE) NZ$6.0bn NZ$6.1bn
Lending NZ$5.8bn NZ$5.8bn
% of Group TCE 0.55 0.55
% of portfolio graded as stressed1,2 17.02 14.94
% of portfolio in impaired2 0.34 0.47
Iron Ore and Oil prices($m)3Mining portfolio (TCE) by sector (%)
38
1122
5
15
9
Oil and gas Iron oreOther metal ore CoalMining services Other
NZ dairy portfolio (TCE) by security (%)
77
221
Fully securedPartially securedUnsecured
Milk price & Fonterra dividend6
(NZ$)
4.40 3.906.12 6.55 6.50
0.25 0.40
0.40 0.30 0.40
$0
$2
$4
$6
$8
$10
2014/15 2015/16 2016/17 2017/18 2018/19
Kg Ms Dividend Milk price
20
60
100
140
Sep-14 Sep-15 Sep-16 Sep-17 Sep-18
Iron ore (USD/t) Crude oil (USD/bbl)
Westpac Economics forecast
4 5
Westpac Economics forecast
90+ day delinquencies (%) 90+ day delinquencies (%)
Australian consumer unsecured lending, 3% of Group loans
Westpac Group Debt Investor Update I May 2018
Mar-17 Sep-17 Mar-18
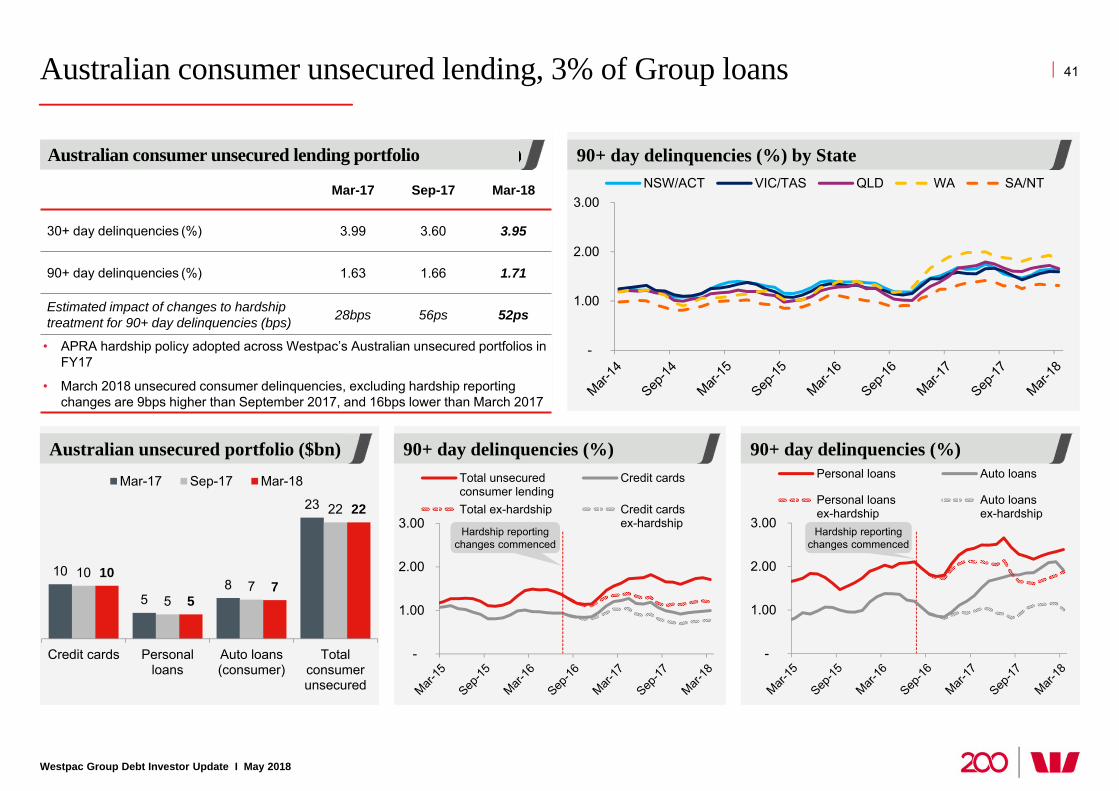
30+ day delinquencies (%) 3.99 3.60 3.95
90+ day delinquencies (%) 1.63 1.66 1.71
Estimated impact of changes to hardshiptreatment for 90+ day delinquencies (bps) 28bps 56ps 52ps
• APRA hardship policy adopted across Westpac’s Australian unsecured portfolios inFY17
• March 2018 unsecured consumer delinquencies, excluding hardship reportingchanges are 9bps higher than September 2017, and 16bps lower than March 2017
Australian unsecured portfolio ($bn)
10
58
23
10
57
22
10
57
22
Credit cards Personalloans
Auto loans(consumer)
Totalconsumerunsecured
Mar-17 Sep-17 Mar-18
90+ day delinquencies (%) by StateAustralian consumer unsecured lending portfolio
41
-
1.00
2.00
3.00
Total unsecuredconsumer lending
Credit cards
Total ex-hardship Credit cardsex-hardship
-
1.00
2.00
3.00NSW/ACT VIC/TAS QLD WA SA/NT
Hardship reporting changes commenced
Hardship reporting changes commenced
-
1.00
2.00
3.00
Personal loans Auto loans
Personal loansex-hardship
Auto loansex-hardship

Australian mortgage portfolio standards tightening
Westpac Group Debt Investor Update I May 2018
42
Australian mortgage portfolio by year of origination (% of total book)
5
22 3
44 4
5
7
10
14
1718
5
Pre
-200
6
2006
2007
2008
2009
2010
2011
2012
2013
2014
2015
2016
2017
2018
(YTD
)
Calendar year2014 • 10% limit on investment property lending growth announced –
implemented by 30 September 2015
2015
• Stricter loan affordability tests for new borrowers– Increase in minimum assessment (‘floor’) rate to 7.25%– Increase in serviceability assessment buffer to 2.25%
• Credit card repayments assessed at 3% of limit (previously 2%)• Expenses benchmark (HEM) adjusted by income bands as well as
post settlement postcode location, marital status and dependants• Serviceability for loans with interest only terms assessed over the
residual P&I term, not full loan term• Maximum IO terms reduced – Owner Occupied reduced to 5 years
2016
• Mandatory 20% minimum shading on all non base income (e.g. rental income, annuity income) – previously non base income discounted by varying amounts
• Stopped non resident lending– For Australian and NZ citizens and permanent visa holders using
foreign income, tightened verification and LVR restricted to 70% • Maximum IO terms for new IPLs reduced to 10 years• Maximum LVRs restricted to include LMI capitalisation
2017
• 30% limit on interest-only lending originations• Tighter limits on interest-only lending >80% LVR• Heightened supervision of mortgage lending warehouses• Strengthened pre settlement hind-sighting process with introduction of
day 2 review team
2018 • More granular assessment of living expenses through the introduction of 13 categories to capture living expenses and other commitments1
Notable changes to Westpac mortgage lending standards
More than half the portfolio originated after lending
standards tightening
1. Currently excludes RAMS. Additional expense categories expected to be implemented for RAMS in 2H18.
Australian mortgage portfolio repayment buffers
1 SVR is the Standard Variable Rate for owner-occupied Westpac Rocket Repay Home Loan inclusive of Premier Advantage Package discount. 2 Excludes RAMS. 3 Includes RAMS in 1H18. Customer loans ahead on payments exclude equity/line of credit products as there are no scheduled principal payments. ‘Behind’ is more than 30 days past due. ‘On time’ includes up to 30 days past due. Includes mortgage offset accounts.
1
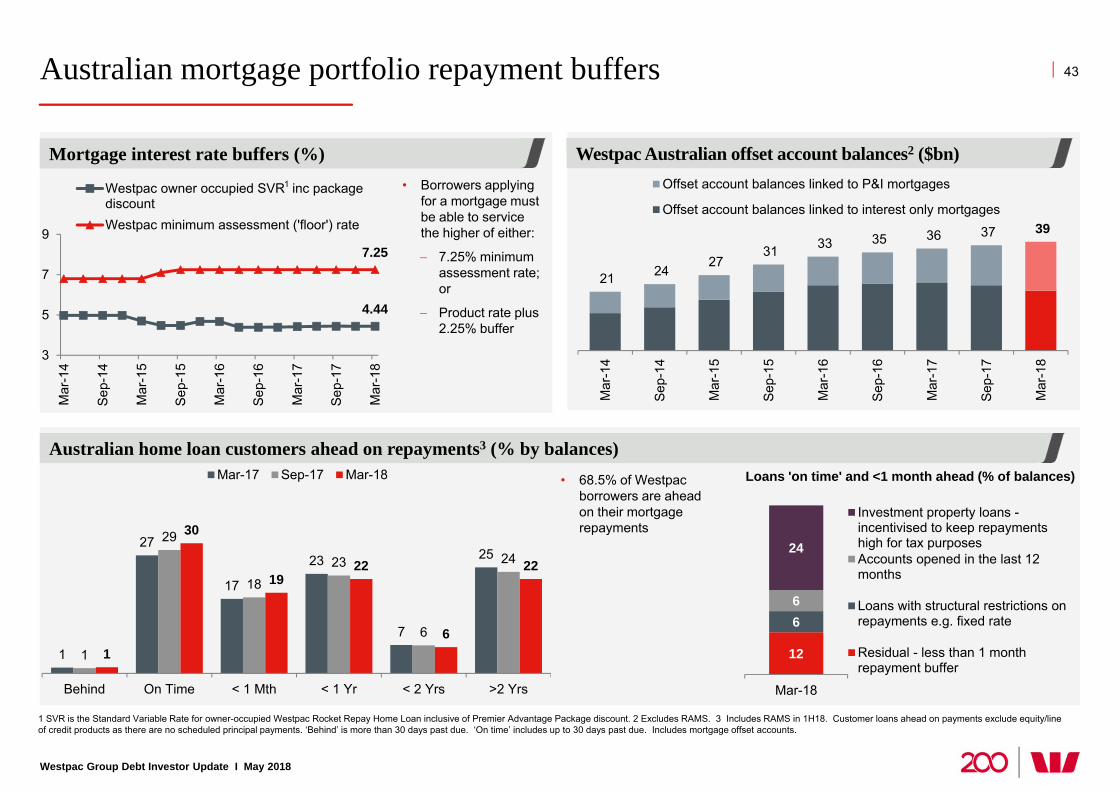
27
17
23
7
25
1
29
1823
6
24
1
30
1922
6
22
Behind On Time < 1 Mth < 1 Yr < 2 Yrs >2 Yrs
Mar-17 Sep-17 Mar-18
Westpac Group Debt Investor Update I May 2018
43
Australian home loan customers ahead on repayments3 (% by balances)
21 24 27
31 33 35 36 37 39
Mar
-14
Sep-
14
Mar
-15
Sep-
15
Mar
-16
Sep-
16
Mar
-17
Sep-
17
Mar
-18
.
Offset account balances linked to P&I mortgages
Offset account balances linked to interest only mortgages
• 68.5% of Westpac borrowers are ahead on their mortgage repayments
Westpac Australian offset account balances2 ($bn)
12
66
24
Mar-18
Investment property loans -incentivised to keep repaymentshigh for tax purposesAccounts opened in the last 12months
Loans with structural restrictions onrepayments e.g. fixed rate
Residual - less than 1 monthrepayment buffer
Loans 'on time' and <1 month ahead (% of balances)
4.44
7.25
3
5
7
9
Mar
-14
Sep-
14
Mar
-15
Sep-
15
Mar
-16
Sep-
16
Mar
-17
Sep-
17
Mar
-18
Westpac owner occupied SVR inc packagediscountWestpac minimum assessment ('floor') rate
1
Mortgage interest rate buffers (%)• Borrowers applying
for a mortgage must be able to service the higher of either:
7.25% minimum assessment rate; or
Product rate plus 2.25% buffer
Westpac Group Debt Investor Update I May 2018
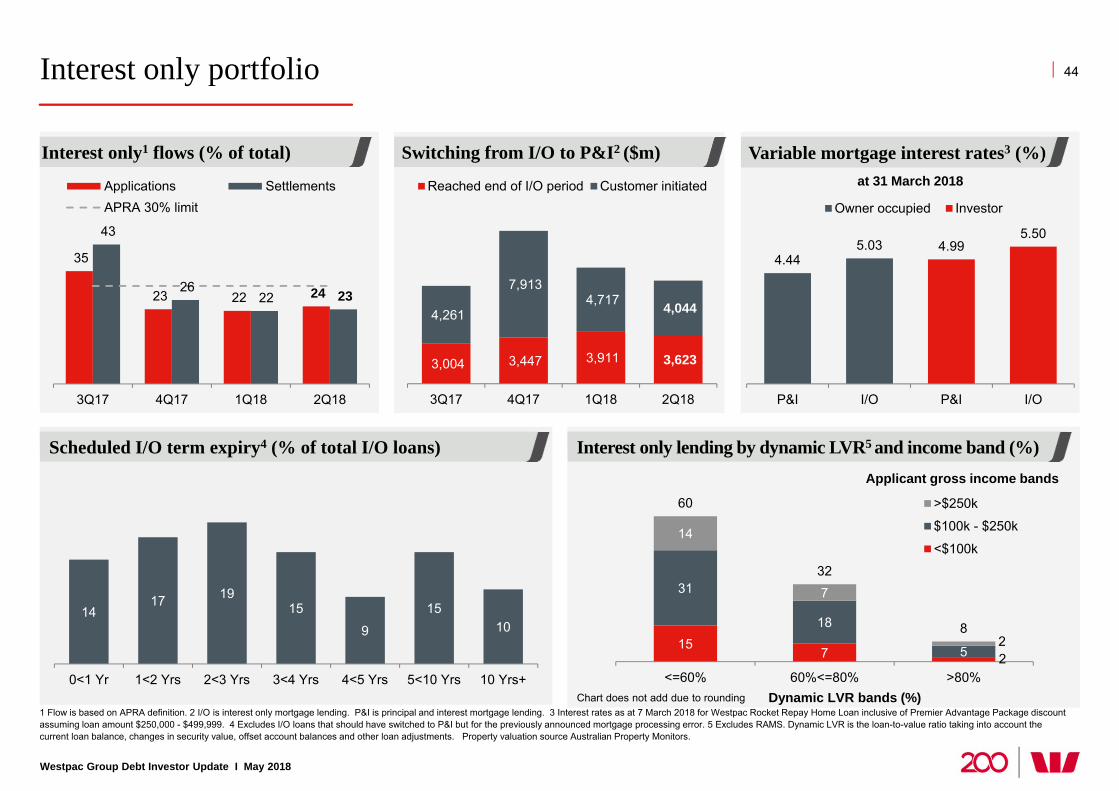
Interest only portfolio
1 Flow is based on APRA definition. 2 I/O is interest only mortgage lending. P&I is principal and interest mortgage lending. 3 Interest rates as at 7 March 2018 for Westpac Rocket Repay Home Loan inclusive of Premier Advantage Package discount assuming loan amount $250,000 - $499,999. 4 Excludes I/O loans that should have switched to P&I but for the previously announced mortgage processing error. 5 Excludes RAMS. Dynamic LVR is the loan-to-value ratio taking into account the current loan balance, changes in security value, offset account balances and other loan adjustments. Property valuation source Australian Property Monitors.
44
Switching from I/O to P&I2 ($m)Interest only1 flows (% of total)
Scheduled I/O term expiry4 (% of total I/O loans)
4.445.03 4.99
5.50
P&I I/O P&I I/O
Owner occupied Investor
Variable mortgage interest rates3 (%)
157 2
31
18
5
14
7
2
60
32
8
<=60% 60%<=80% >80%Dynamic LVR bands (%)
>$250k
$100k - $250k
<$100k
Applicant gross income bands
Chart does not add due to rounding
Interest only lending by dynamic LVR5 and income band (%)
3,004 3,447 3,911 3,623
4,261
7,913 4,717 4,044
3Q17 4Q17 1Q18 2Q18
Reached end of I/O period Customer initiated
35
23 22 24
43
26 22 23
3Q17 4Q17 1Q18 2Q18
Applications SettlementsAPRA 30% limit
at 31 March 2018
1417 19
15
9
1510
0<1 Yr 1<2 Yrs 2<3 Yrs 3<4 Yrs 4<5 Yrs 5<10 Yrs 10 Yrs+
Westpac Group Debt Investor Update I May 2018
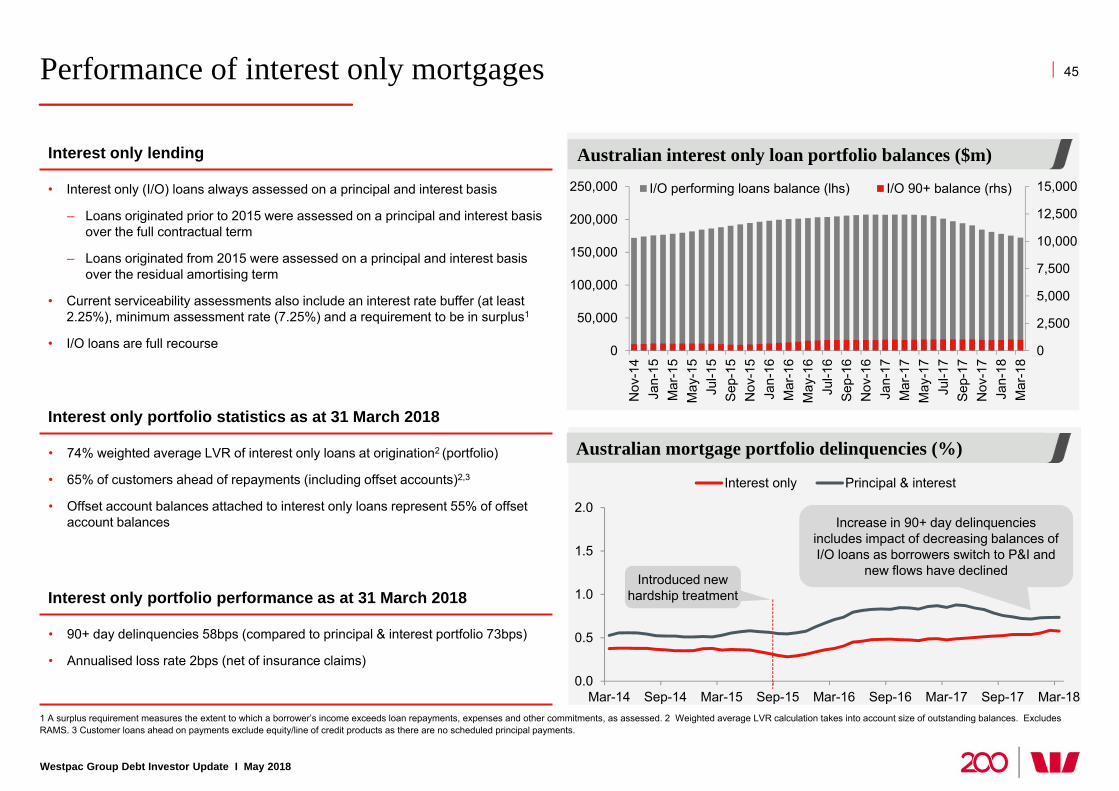
Performance of interest only mortgages 45
1 A surplus requirement measures the extent to which a borrower’s income exceeds loan repayments, expenses and other commitments, as assessed. 2 Weighted average LVR calculation takes into account size of outstanding balances. Excludes RAMS. 3 Customer loans ahead on payments exclude equity/line of credit products as there are no scheduled principal payments.
Interest only lending
• Interest only (I/O) loans always assessed on a principal and interest basis
– Loans originated prior to 2015 were assessed on a principal and interest basis over the full contractual term
– Loans originated from 2015 were assessed on a principal and interest basis over the residual amortising term
• Current serviceability assessments also include an interest rate buffer (at least 2.25%), minimum assessment rate (7.25%) and a requirement to be in surplus1
• I/O loans are full recourse
Interest only portfolio statistics as at 31 March 2018
• 74% weighted average LVR of interest only loans at origination2 (portfolio)
• 65% of customers ahead of repayments (including offset accounts)2,3
• Offset account balances attached to interest only loans represent 55% of offset account balances
Interest only portfolio performance as at 31 March 2018
• 90+ day delinquencies 58bps (compared to principal & interest portfolio 73bps)
• Annualised loss rate 2bps (net of insurance claims)0.0
0.5
1.0
1.5
2.0
Mar-14 Sep-14 Mar-15 Sep-15 Mar-16 Sep-16 Mar-17 Sep-17 Mar-18
Interest only Principal & interest
Australian mortgage portfolio delinquencies (%)
Australian interest only loan portfolio balances ($m)
0
2,500
5,000
7,500
10,000
12,500
15,000
0
50,000
100,000
150,000
200,000
250,000
Nov
-14
Jan-
15M
ar-1
5M
ay-1
5Ju
l-15
Sep-
15N
ov-1
5Ja
n-16
Mar
-16
May
-16
Jul-1
6Se
p-16
Nov
-16
Jan-
17M
ar-1
7M
ay-1
7Ju
l-17
Sep-
17N
ov-1
7Ja
n-18
Mar
-18
I/O performing loans balance (lhs) I/O 90+ balance (rhs)
Introduced new hardship treatment
Increase in 90+ day delinquencies includes impact of decreasing balances of I/O loans as borrowers switch to P&I and
new flows have declined
Westpac Group Debt Investor Update I May 2018
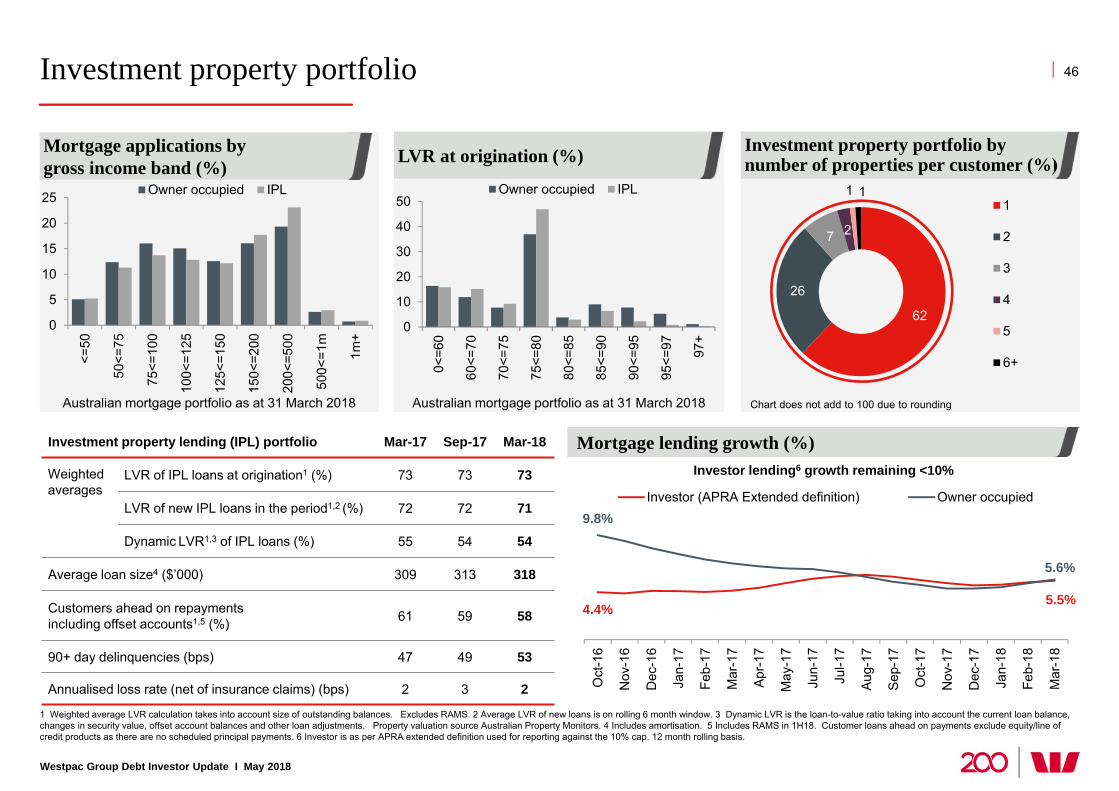
Investment property portfolio 46
1 Weighted average LVR calculation takes into account size of outstanding balances. Excludes RAMS. 2 Average LVR of new loans is on rolling 6 month window. 3 Dynamic LVR is the loan-to-value ratio taking into account the current loan balance, changes in security value, offset account balances and other loan adjustments. Property valuation source Australian Property Monitors. 4 Includes amortisation. 5 Includes RAMS in 1H18. Customer loans ahead on payments exclude equity/line of credit products as there are no scheduled principal payments. 6 Investor is as per APRA extended definition used for reporting against the 10% cap. 12 month rolling basis.
Investment property lending (IPL) portfolio Mar-17 Sep-17 Mar-18
Weighted averages
LVR of IPL loans at origination1 (%) 73 73 73
LVR of new IPL loans in the period1,2 (%) 72 72 71
Dynamic LVR1,3 of IPL loans (%) 55 54 54
Average loan size4 ($’000) 309 313 318
Customers ahead on repaymentsincluding offset accounts1,5 (%) 61 59 58
90+ day delinquencies (bps) 47 49 53
Annualised loss rate (net of insurance claims) (bps) 2 3 2
0
10
20
30
40
50
0<=6
0
60<=
70
70<=
75
75<=
80
80<=
85
85<=
90
90<=
95
95<=
97 97+
Owner occupied IPL
0
5
10
15
20
25
<=50
50<=
75
75<=
100
100<
=125
125<
=150
150<
=200
200<
=500
500<
=1m
1m+
Owner occupied IPL
Investment property portfolio by number of properties per customer (%)
62
26
7 2
1 11
2
3
4
5
6+
Investor lending6 growth remaining <10%
Mortgage lending growth (%)
4.4%5.5%
9.8%
5.6%
Oct
-16
Nov
-16
Dec
-16
Jan-
17
Feb-
17
Mar
-17
Apr-1
7
May
-17
Jun-
17
Jul-1
7
Aug-
17
Sep-
17
Oct
-17
Nov
-17
Dec
-17
Jan-
18
Feb-
18
Mar
-18
Investor (APRA Extended definition) Owner occupied
Australian mortgage portfolio as at 31 March 2018 Australian mortgage portfolio as at 31 March 2018
LVR at origination (%)Mortgage applications by gross income band (%)
Chart does not add to 100 due to rounding
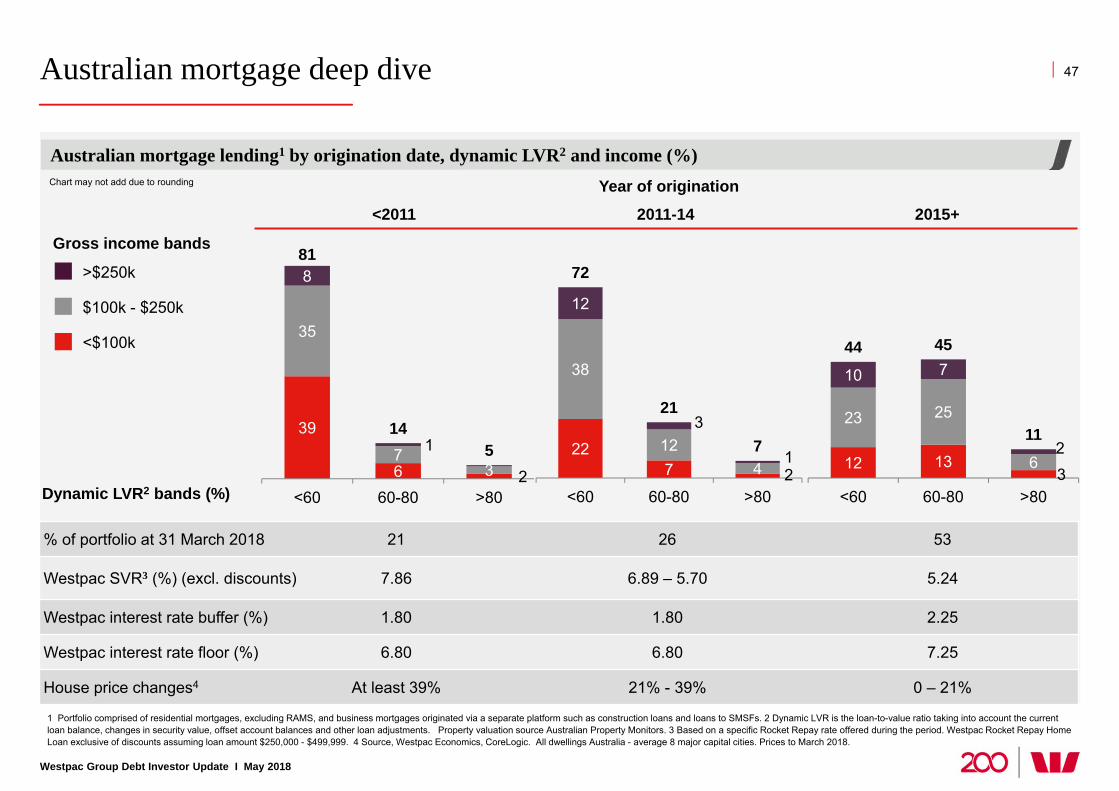
Australian mortgage deep dive
Westpac Group Debt Investor Update I May 2018
1 Portfolio comprised of residential mortgages, excluding RAMS, and business mortgages originated via a separate platform such as construction loans and loans to SMSFs. 2 Dynamic LVR is the loan-to-value ratio taking into account the current loan balance, changes in security value, offset account balances and other loan adjustments. Property valuation source Australian Property Monitors. 3 Based on a specific Rocket Repay rate offered during the period. Westpac Rocket Repay Home Loan exclusive of discounts assuming loan amount $250,000 - $499,999. 4 Source, Westpac Economics, CoreLogic. All dwellings Australia - average 8 major capital cities. Prices to March 2018.
Australian mortgage lending1 by origination date, dynamic LVR2 and income (%)
47
227 2
38
124
12
3
1
72
21
7
<60 60-80 >80
39
6 2
35
73
8
1
81
145
<60 60-80 >80
12 133
23 25
6
10 7
2
44 45
11
<60 60-80 >80
% of portfolio at 31 March 2018 21 26 53
Westpac SVR3 (%) (excl. discounts) 7.86 6.89 – 5.70 5.24
Westpac interest rate buffer (%) 1.80 1.80 2.25
Westpac interest rate floor (%) 6.80 6.80 7.25
House price changes4 At least 39% 21% - 39% 0 – 21%
<2011 2011-14 2015+
Dynamic LVR2 bands (%)
>$250k
$100k - $250k
<$100k
Gross income bands
Year of originationChart may not add due to rounding
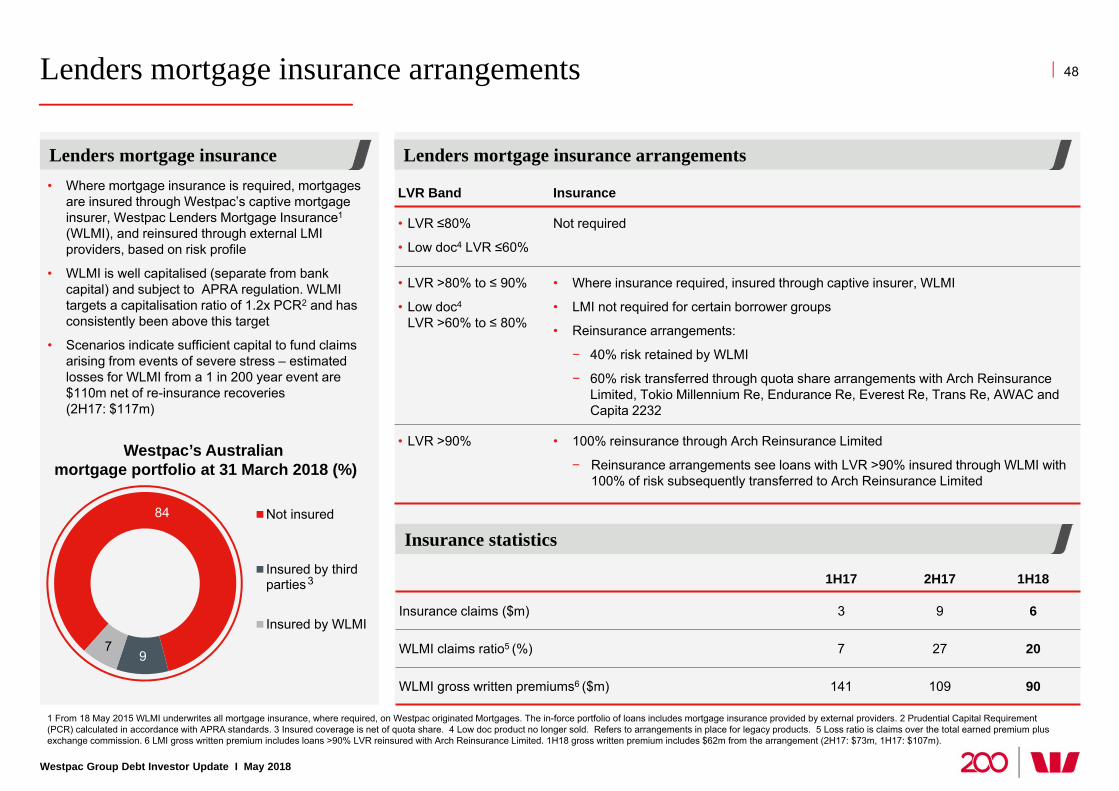
Lenders mortgage insurance arrangements
Westpac Group Debt Investor Update I May 2018
1 From 18 May 2015 WLMI underwrites all mortgage insurance, where required, on Westpac originated Mortgages. The in-force portfolio of loans includes mortgage insurance provided by external providers. 2 Prudential Capital Requirement (PCR) calculated in accordance with APRA standards. 3 Insured coverage is net of quota share. 4 Low doc product no longer sold. Refers to arrangements in place for legacy products. 5 Loss ratio is claims over the total earned premium plus exchange commission. 6 LMI gross written premium includes loans >90% LVR reinsured with Arch Reinsurance Limited. 1H18 gross written premium includes $62m from the arrangement (2H17: $73m, 1H17: $107m).
Lenders mortgage insurance arrangementsLenders mortgage insurance
48
LVR Band Insurance
• LVR ≤80%
• Low doc4 LVR ≤60%
Not required
• LVR >80% to ≤ 90%
• Low doc4
LVR >60% to ≤ 80%
• Where insurance required, insured through captive insurer, WLMI
• LMI not required for certain borrower groups
• Reinsurance arrangements:
− 40% risk retained by WLMI
− 60% risk transferred through quota share arrangements with Arch ReinsuranceLimited, Tokio Millennium Re, Endurance Re, Everest Re, Trans Re, AWAC and Capita 2232
• LVR >90% • 100% reinsurance through Arch Reinsurance Limited
− Reinsurance arrangements see loans with LVR >90% insured through WLMI with100% of risk subsequently transferred to Arch Reinsurance Limited
1H17 2H17 1H18
Insurance claims ($m) 3 9 6
WLMI claims ratio5 (%) 7 27 20
WLMI gross written premiums6 ($m) 141 109 90
Insurance statistics
• Where mortgage insurance is required, mortgagesare insured through Westpac’s captive mortgageinsurer, Westpac Lenders Mortgage Insurance1
(WLMI), and reinsured through external LMIproviders, based on risk profile
• WLMI is well capitalised (separate from bankcapital) and subject to APRA regulation. WLMItargets a capitalisation ratio of 1.2x PCR2 and hasconsistently been above this target
• Scenarios indicate sufficient capital to fund claimsarising from events of severe stress – estimatedlosses for WLMI from a 1 in 200 year event are$110m net of re-insurance recoveries(2H17: $117m)
84
97
Not insured
Insured by thirdparties
Insured by WLMI
Westpac’s Australianmortgage portfolio at 31 March 2018 (%)
3
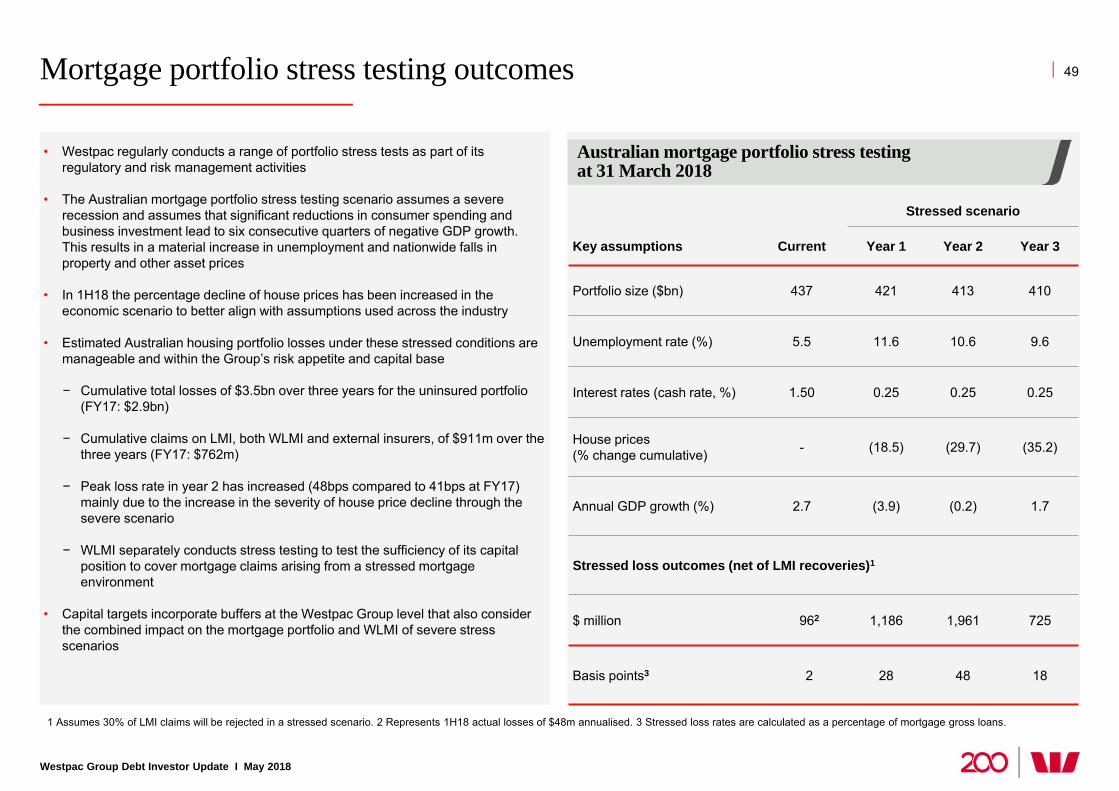
Mortgage portfolio stress testing outcomes
Westpac Group Debt Investor Update I May 2018
1 Assumes 30% of LMI claims will be rejected in a stressed scenario. 2 Represents 1H18 actual losses of $48m annualised. 3 Stressed loss rates are calculated as a percentage of mortgage gross loans.
49
Australian mortgage portfolio stress testing at 31 March 2018
Stressed scenario
Key assumptions Current Year 1 Year 2 Year 3
Portfolio size ($bn) 437 421 413 410
Unemployment rate (%) 5.5 11.6 10.6 9.6
Interest rates (cash rate, %) 1.50 0.25 0.25 0.25
House prices (% change cumulative) - (18.5) (29.7) (35.2)
Annual GDP growth (%) 2.7 (3.9) (0.2) 1.7
Stressed loss outcomes (net of LMI recoveries)1
$ million 962 1,186 1,961 725
Basis points3 2 28 48 18
• Westpac regularly conducts a range of portfolio stress tests as part of its regulatory and risk management activities
• The Australian mortgage portfolio stress testing scenario assumes a severe recession and assumes that significant reductions in consumer spending and business investment lead to six consecutive quarters of negative GDP growth. This results in a material increase in unemployment and nationwide falls in property and other asset prices
• In 1H18 the percentage decline of house prices has been increased in the economic scenario to better align with assumptions used across the industry
• Estimated Australian housing portfolio losses under these stressed conditions are manageable and within the Group’s risk appetite and capital base
− Cumulative total losses of $3.5bn over three years for the uninsured portfolio (FY17: $2.9bn)
− Cumulative claims on LMI, both WLMI and external insurers, of $911m over the three years (FY17: $762m)
− Peak loss rate in year 2 has increased (48bps compared to 41bps at FY17) mainly due to the increase in the severity of house price decline through the severe scenario
− WLMI separately conducts stress testing to test the sufficiency of its capital position to cover mortgage claims arising from a stressed mortgage environment
• Capital targets incorporate buffers at the Westpac Group level that also consider the combined impact on the mortgage portfolio and WLMI of severe stress scenarios
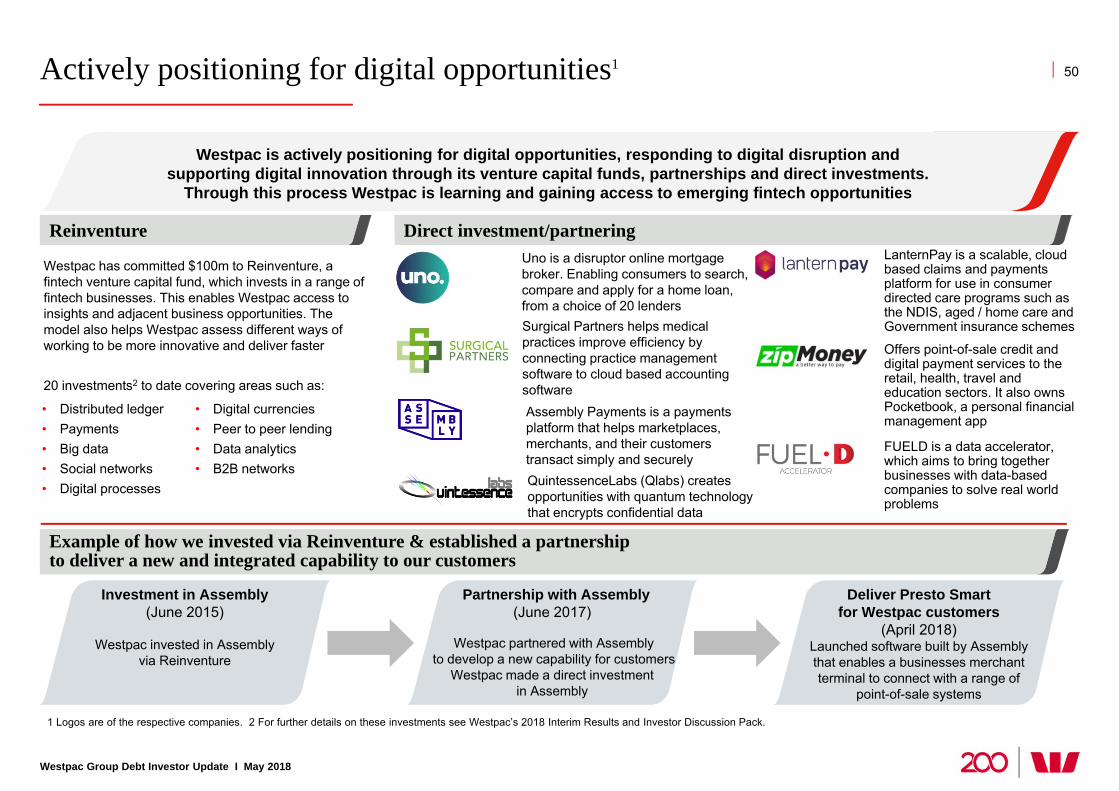
Actively positioning for digital opportunities1
Westpac Group Debt Investor Update I May 2018
1 Logos are of the respective companies. 2 For further details on these investments see Westpac’s 2018 Interim Results and Investor Discussion Pack.
50
Westpac is actively responding to digital threats and opportunities.We encourage digital innovation through investing in venture capital, partnerships and direct investments.
Westpac can learn directly and gain access to emerging fintech developments.
Westpac has committed $100m to Reinventure, a fintech venture capital fund, which invests in a range of fintech businesses. This enables Westpac access to insights and adjacent business opportunities. The model also helps Westpac assess different ways of working to be more innovative and deliver faster
20 investments2 to date covering areas such as:
Investment in Assembly(June 2015)
Westpac invested in Assembly via Reinventure
Partnership with Assembly(June 2017)
Westpac partnered with Assemblyto develop a new capability for customers
Westpac made a direct investment in Assembly
Deliver Presto Smart for Westpac customers
(April 2018)Launched software built by Assembly that enables a businesses merchant terminal to connect with a range of
point-of-sale systems
Uno is a disruptor online mortgage broker. Enabling consumers to search, compare and apply for a home loan, from a choice of 20 lendersSurgical Partners helps medical practices improve efficiency by connecting practice management software to cloud based accounting software
Offers point-of-sale credit and digital payment services to the retail, health, travel and education sectors. It also owns Pocketbook, a personal financial management app
LanternPay is a scalable, cloud based claims and payments platform for use in consumer directed care programs such as the NDIS, aged / home care and Government insurance schemes
FUELD is a data accelerator, which aims to bring together businesses with data-based companies to solve real world problems
Westpac is actively positioning for digital opportunities, responding to digital disruption and supporting digital innovation through its venture capital funds, partnerships and direct investments.
Through this process Westpac is learning and gaining access to emerging fintech opportunities
QuintessenceLabs (Qlabs) creates opportunities with quantum technology that encrypts confidential data
Assembly Payments is a payments platform that helps marketplaces, merchants, and their customers transact simply and securely
Direct investment/partneringReinventure
Example of how we invested via Reinventure & established a partnership to deliver a new and integrated capability to our customers
• Distributed ledger• Payments• Big data• Social networks • Digital processes
• Digital currencies • Peer to peer lending • Data analytics• B2B networks
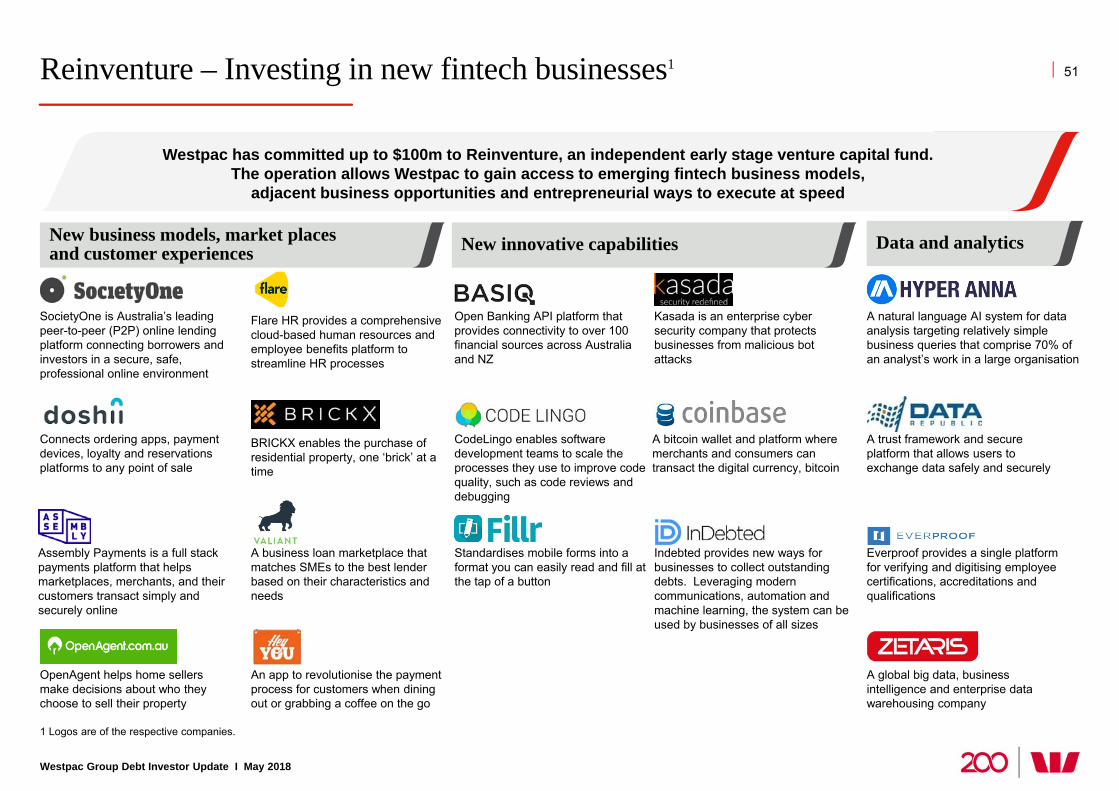
Reinventure – Investing in new fintech businesses1
1 Logos are of the respective companies.
Flare HR provides a comprehensive cloud-based human resources and employee benefits platform to streamline HR processes
A business loan marketplace that matches SMEs to the best lender based on their characteristics and needs
A natural language AI system for data analysis targeting relatively simple business queries that comprise 70% of an analyst’s work in a large organisation
Open Banking API platform that provides connectivity to over 100 financial sources across Australia and NZ
BRICKX enables the purchase of residential property, one ‘brick’ at a time
SocietyOne is Australia’s leading peer-to-peer (P2P) online lending platform connecting borrowers and investors in a secure, safe, professional online environment
A bitcoin wallet and platform where merchants and consumers can transact the digital currency, bitcoin
OpenAgent helps home sellers make decisions about who they choose to sell their property
Assembly Payments is a full stack payments platform that helps marketplaces, merchants, and their customers transact simply and securely online
Connects ordering apps, payment devices, loyalty and reservations platforms to any point of sale
A trust framework and secure platform that allows users to exchange data safely and securely
Standardises mobile forms into a format you can easily read and fill at the tap of a button
A global big data, business intelligence and enterprise data warehousing company
Kasada is an enterprise cyber security company that protects businesses from malicious bot attacks
CodeLingo enables software development teams to scale the processes they use to improve code quality, such as code reviews and debugging
Everproof provides a single platform for verifying and digitising employee certifications, accreditations and qualifications
Indebted provides new ways for businesses to collect outstanding debts. Leveraging modern communications, automation and machine learning, the system can be used by businesses of all sizes
An app to revolutionise the payment process for customers when dining out or grabbing a coffee on the go
New business models, market places and customer experiences New innovative capabilities Data and analytics
Westpac is actively responding to digital threats and opportunities.We encourage digital innovation through investing in venture capital, partnerships and direct investments.
Westpac can learn directly and gain access to emerging fintech developments.
Westpac has committed up to $100m to Reinventure, an independent early stage venture capital fund. The operation allows Westpac to gain access to emerging fintech business models,
adjacent business opportunities and entrepreneurial ways to execute at speed
Westpac Group Debt Investor Update I May 2018
51
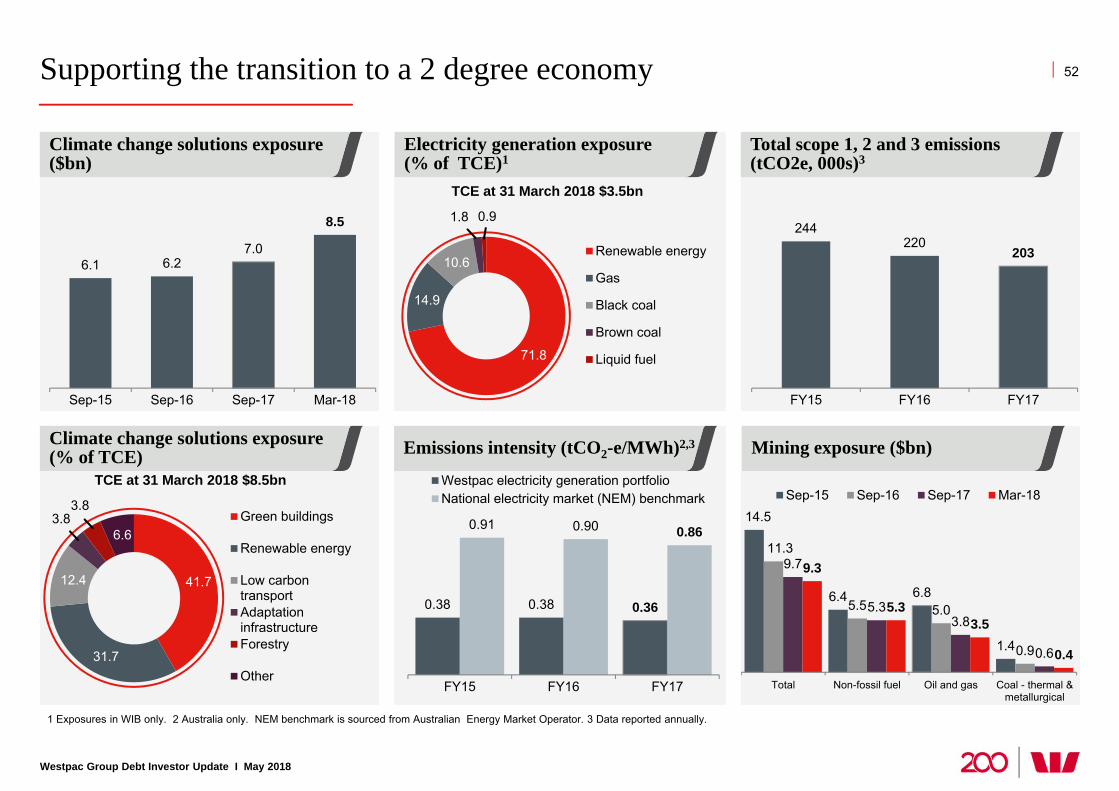
Supporting the transition to a 2 degree economy
Westpac Group Debt Investor Update I May 2018
1 Exposures in WIB only. 2 Australia only. NEM benchmark is sourced from Australian Energy Market Operator. 3 Data reported annually.
52
Climate change solutions exposure (% of TCE) Emissions intensity (tCO2-e/MWh)2,3
Electricity generation exposure (% of TCE)1
Total scope 1, 2 and 3 emissions (tCO2e, 000s)3
Climate change solutions exposure ($bn)
Mining exposure ($bn)
6.1 6.27.0
8.5
Sep-15 Sep-16 Sep-17 Mar-18
244220
203
FY15 FY16 FY17
71.8
14.9
10.6
1.8 0.9
Renewable energy
Gas
Black coal
Brown coal
Liquid fuel
41.7
31.7
12.4
3.8 3.8
6.6 Green buildings
Renewable energy
Low carbontransportAdaptationinfrastructureForestry
Other
0.38 0.38 0.36
0.91 0.90 0.86
FY15 FY16 FY17
Westpac electricity generation portfolioNational electricity market (NEM) benchmark
14.5
6.4 6.8
1.4
11.3
5.5 5.0
0.9
9.7
5.33.8
0.6
9.3
5.33.5
0.4
Total Non-fossil fuel Oil and gas Coal - thermal &metallurgical
Sep-15 Sep-16 Sep-17 Mar-18
TCE at 31 March 2018 $3.5bn
TCE at 31 March 2018 $8.5bn
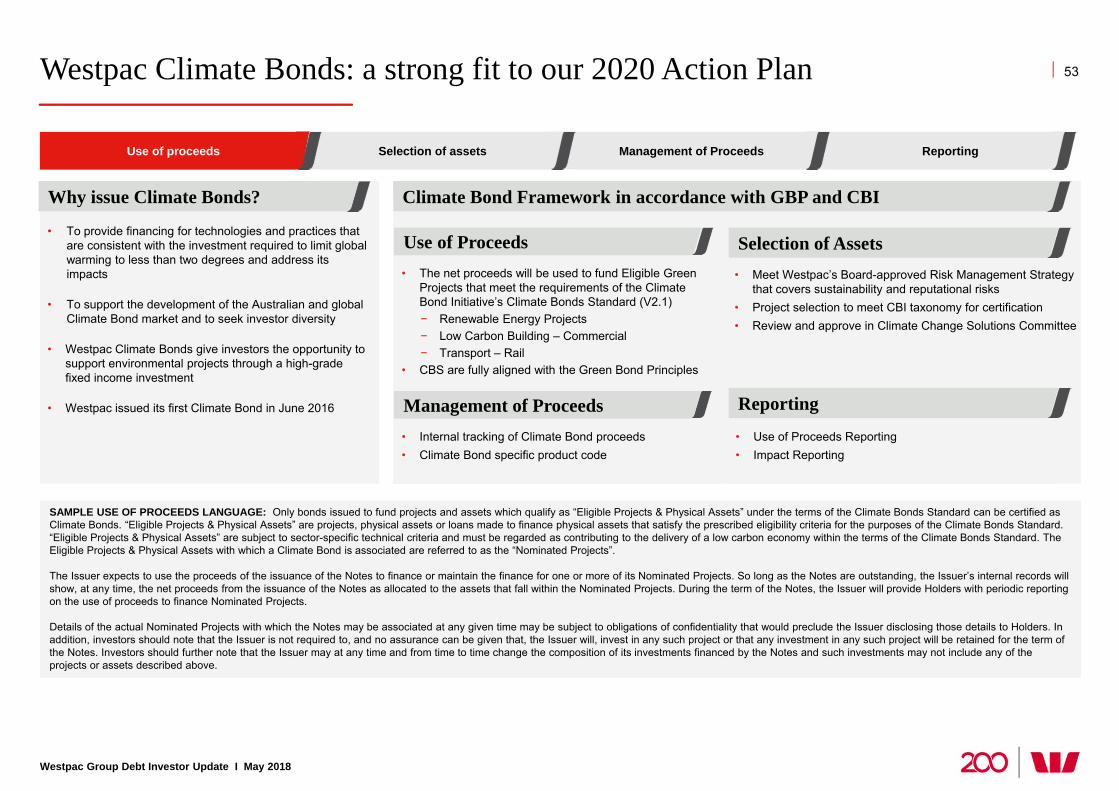
Westpac Climate Bonds: a strong fit to our 2020 Action Plan 53
• To provide financing for technologies and practices that are consistent with the investment required to limit global warming to less than two degrees and address its impacts
• To support the development of the Australian and global Climate Bond market and to seek investor diversity
• Westpac Climate Bonds give investors the opportunity to support environmental projects through a high-grade fixed income investment
• Westpac issued its first Climate Bond in June 2016
Westpac Group Debt Investor Update I May 2018
Why issue Climate Bonds?
Use of Proceeds Selection of Assets• Meet Westpac’s Board-approved Risk Management Strategy
that covers sustainability and reputational risks• Project selection to meet CBI taxonomy for certification• Review and approve in Climate Change Solutions Committee
Management of Proceeds• Internal tracking of Climate Bond proceeds• Climate Bond specific product code
• Use of Proceeds Reporting• Impact Reporting
SAMPLE USE OF PROCEEDS LANGUAGE: Only bonds issued to fund projects and assets which qualify as “Eligible Projects & Physical Assets” under the terms of the Climate Bonds Standard can be certified as Climate Bonds. “Eligible Projects & Physical Assets” are projects, physical assets or loans made to finance physical assets that satisfy the prescribed eligibility criteria for the purposes of the Climate Bonds Standard. “Eligible Projects & Physical Assets” are subject to sector-specific technical criteria and must be regarded as contributing to the delivery of a low carbon economy within the terms of the Climate Bonds Standard. The Eligible Projects & Physical Assets with which a Climate Bond is associated are referred to as the “Nominated Projects”.
The Issuer expects to use the proceeds of the issuance of the Notes to finance or maintain the finance for one or more of its Nominated Projects. So long as the Notes are outstanding, the Issuer’s internal records will show, at any time, the net proceeds from the issuance of the Notes as allocated to the assets that fall within the Nominated Projects. During the term of the Notes, the Issuer will provide Holders with periodic reporting on the use of proceeds to finance Nominated Projects.
Details of the actual Nominated Projects with which the Notes may be associated at any given time may be subject to obligations of confidentiality that would preclude the Issuer disclosing those details to Holders. In addition, investors should note that the Issuer is not required to, and no assurance can be given that, the Issuer will, invest in any such project or that any investment in any such project will be retained for the term of the Notes. Investors should further note that the Issuer may at any time and from time to time change the composition of its investments financed by the Notes and such investments may not include any of the projects or assets described above.
Use of proceeds Management of ProceedsSelection of assets Reporting
Reporting
Climate Bond Framework in accordance with GBP and CBI
• The net proceeds will be used to fund Eligible Green Projects that meet the requirements of the Climate Bond Initiative’s Climate Bonds Standard (V2.1) − Renewable Energy Projects− Low Carbon Building – Commercial− Transport – Rail
• CBS are fully aligned with the Green Bond Principles
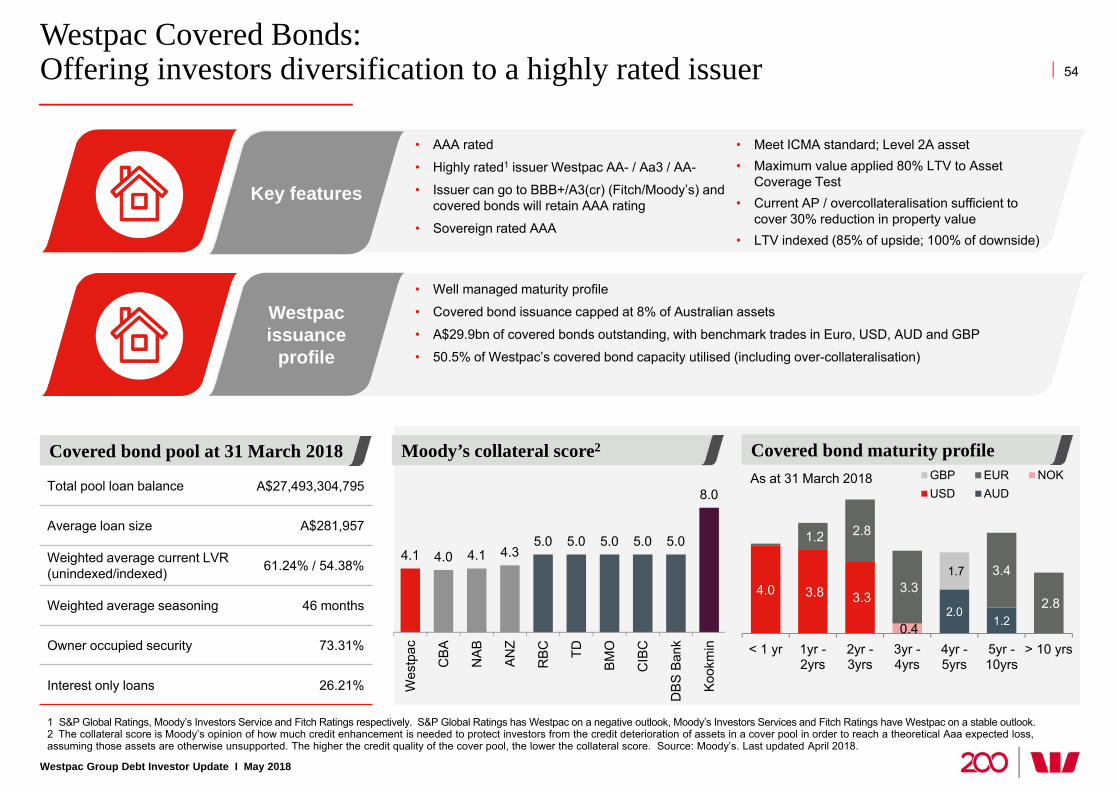
Westpac Covered Bonds: Offering investors diversification to a highly rated issuer
1 S&P Global Ratings, Moody’s Investors Service and Fitch Ratings respectively. S&P Global Ratings has Westpac on a negative outlook, Moody’s Investors Services and Fitch Ratings have Westpac on a stable outlook. 2 The collateral score is Moody’s opinion of how much credit enhancement is needed to protect investors from the credit deterioration of assets in a cover pool in order to reach a theoretical Aaa expected loss, assuming those assets are otherwise unsupported. The higher the credit quality of the cover pool, the lower the collateral score. Source: Moody’s. Last updated April 2018.
54
Westpac Group Debt Investor Update I May 2018
As at 31 March 2018
• AAA rated
• Highly rated1 issuer Westpac AA- / Aa3 / AA-
• Issuer can go to BBB+/A3(cr) (Fitch/Moody’s) and covered bonds will retain AAA rating
• Sovereign rated AAA
• Meet ICMA standard; Level 2A asset• Maximum value applied 80% LTV to Asset
Coverage Test• Current AP / overcollateralisation sufficient to
cover 30% reduction in property value• LTV indexed (85% of upside; 100% of downside)
• Well managed maturity profile
• Covered bond issuance capped at 8% of Australian assets
• A$29.9bn of covered bonds outstanding, with benchmark trades in Euro, USD, AUD and GBP
• 50.5% of Westpac’s covered bond capacity utilised (including over-collateralisation)
Covered bond maturity profileMoody’s collateral score2Covered bond pool at 31 March 2018
4.1 4.0 4.1 4.35.0 5.0 5.0 5.0 5.0
8.0
Wes
tpac
CBA
NAB AN
Z
RBC TD
BMO
CIB
C
DBS
Ban
k
Kook
min
Total pool loan balance A$27,493,304,795
Average loan size A$281,957
Weighted average current LVR (unindexed/indexed) 61.24% / 54.38%
Weighted average seasoning 46 months
Owner occupied security 73.31%
Interest only loans 26.21%
Westpac issuance
profile
Key features
2.01.2
4.0 3.8 3.3
-0.4
1.2 2.8
3.3 3.4
2.8
1.7
< 1 yr 1yr -2yrs
2yr -3yrs
3yr -4yrs
4yr -5yrs
5yr -10yrs
> 10 yrs
GBP EUR NOKUSD AUD
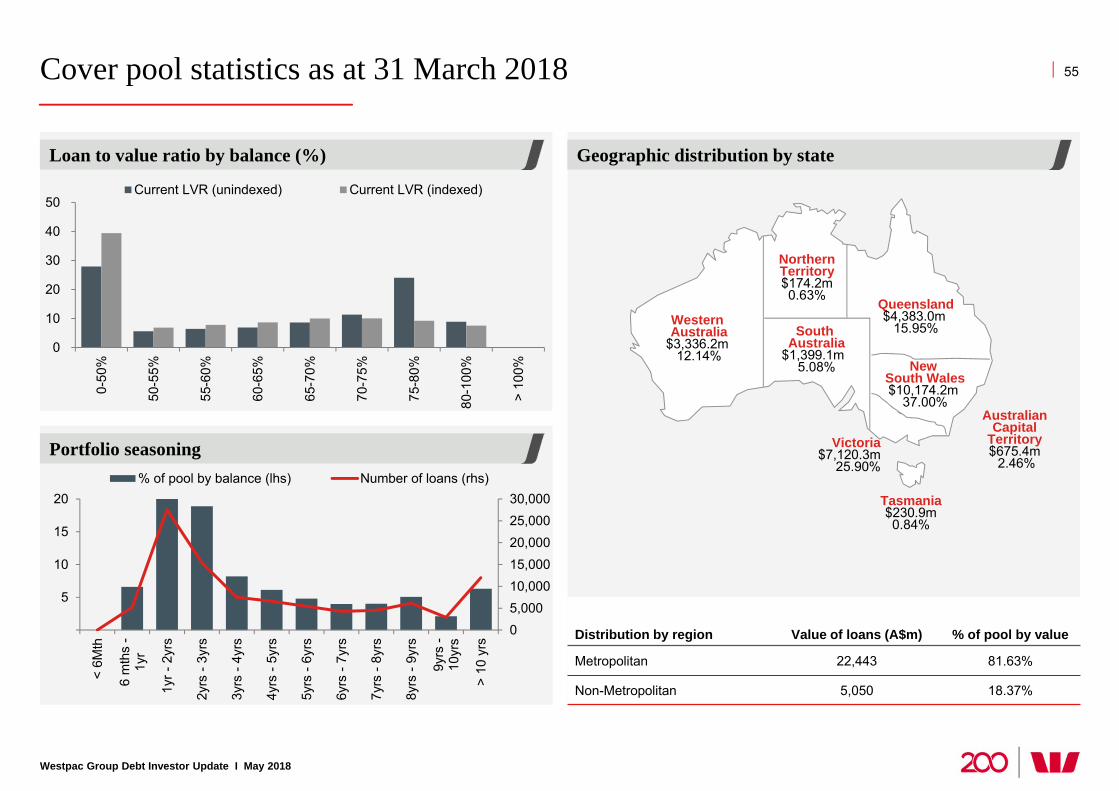
Cover pool statistics as at 31 March 2018
Loan to value ratio by balance (%)
Portfolio seasoning
Geographic distribution by state
55
Westpac Group Debt Investor Update I May 2018
0
10
20
30
40
50
0-50
%
50-5
5%
55-6
0%
60-6
5%
65-7
0%
70-7
5%
75-8
0%
80-1
00%
> 10
0%
Current LVR (unindexed) Current LVR (indexed)
05,00010,00015,00020,00025,00030,000
5
10
15
20
< 6M
th
6 m
ths
-1y
r
1yr -
2yr
s
2yrs
- 3y
rs
3yrs
- 4y
rs
4yrs
- 5y
rs
5yrs
- 6y
rs
6yrs
- 7y
rs
7yrs
- 8y
rs
8yrs
- 9y
rs
9yrs
-10
yrs
> 10
yrs
% of pool by balance (lhs) Number of loans (rhs)
Distribution by region Value of loans (A$m) % of pool by value
Metropolitan 22,443 81.63%
Non-Metropolitan 5,050 18.37%
Queensland$4,383.0m
15.95%Western Australia
$3,336.2m 12.14%
Victoria$7,120.3m
25.90%
New South Wales$10,174.2m
37.00%
South Australia
$1,399.1m 5.08%
Tasmania$230.9m 0.84%
NorthernTerritory$174.2m 0.63%
Australian Capital
Territory$675.4m
2.46%
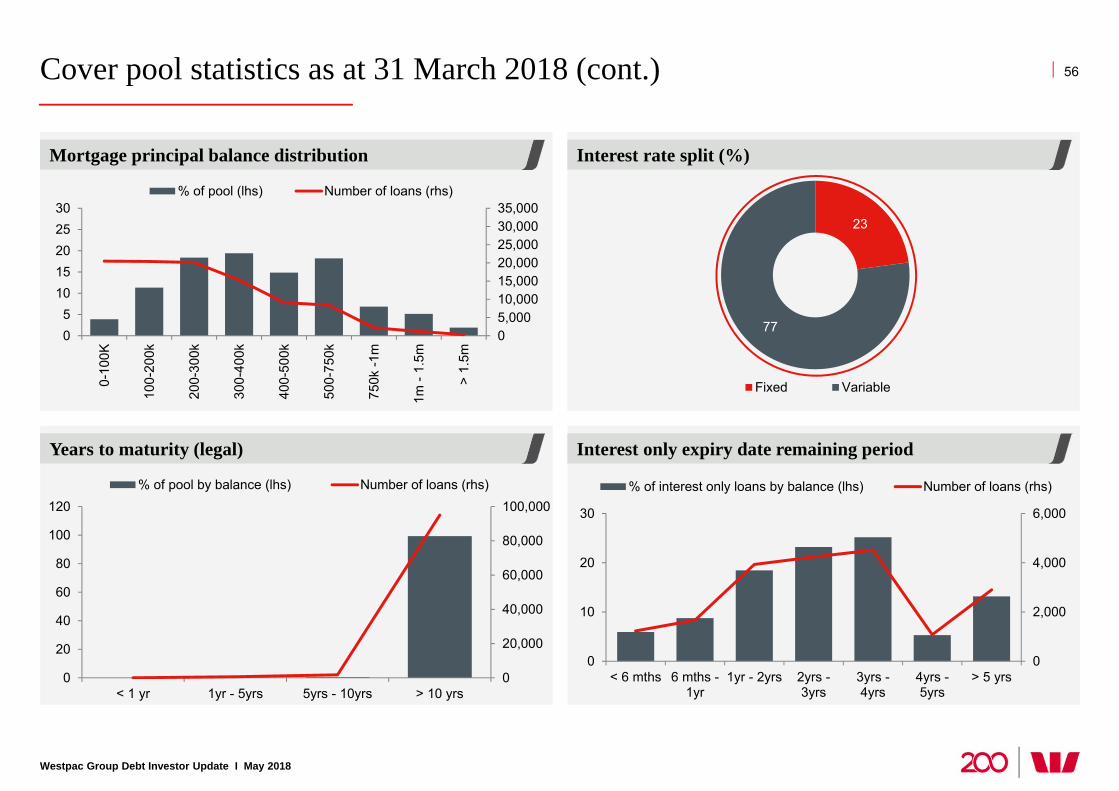
Cover pool statistics as at 31 March 2018 (cont.)
Interest rate split (%)
Interest only expiry date remaining period
Mortgage principal balance distribution
Years to maturity (legal)
56
05,00010,00015,00020,00025,00030,00035,000
05
1015202530
0-10
0K
100-
200k
200-
300k
300-
400k
400-
500k
500-
750k
750k
-1m
1m -
1.5m
> 1.
5m
% of pool (lhs) Number of loans (rhs)
0
20,000
40,000
60,000
80,000
100,000
0
20
40
60
80
100
120
< 1 yr 1yr - 5yrs 5yrs - 10yrs > 10 yrs
% of pool by balance (lhs) Number of loans (rhs)
23
77
Fixed Variable
0
2,000
4,000
6,000
0
10
20
30
< 6 mths 6 mths -1yr
1yr - 2yrs 2yrs -3yrs
3yrs -4yrs
4yrs -5yrs
> 5 yrs
% of interest only loans by balance (lhs) Number of loans (rhs)
Westpac Group Debt Investor Update I May 2018
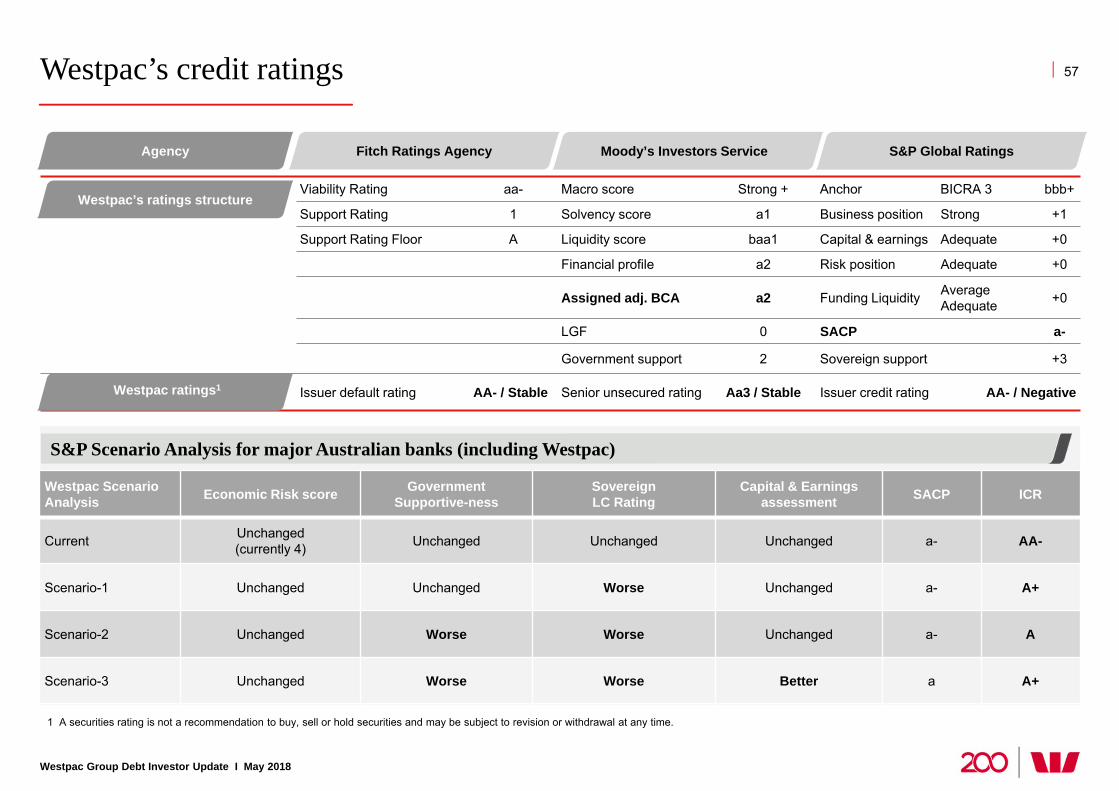
Westpac’s credit ratings
1 A securities rating is not a recommendation to buy, sell or hold securities and may be subject to revision or withdrawal at any time.
57
Westpac Group Debt Investor Update I May 2018
S&P Scenario Analysis for major Australian banks (including Westpac)
Viability Rating aa- Macro score Strong + Anchor BICRA 3 bbb+
Support Rating 1 Solvency score a1 Business position Strong +1
Support Rating Floor A Liquidity score baa1 Capital & earnings Adequate +0
Financial profile a2 Risk position Adequate +0
Assigned adj. BCA a2 Funding Liquidity Average Adequate +0
LGF 0 SACP a-
Government support 2 Sovereign support +3
Issuer default rating AA- / Stable Senior unsecured rating Aa3 / Stable Issuer credit rating AA- / Negative
Fitch Ratings Agency Moody’s Investors Service S&P Global RatingsAgency
Westpac’s ratings structure
Westpac ratings1
Westpac Scenario Analysis Economic Risk score Government
Supportive-nessSovereign LC Rating
Capital & Earnings assessment SACP ICR
Current Unchanged(currently 4) Unchanged Unchanged Unchanged a- AA-
Scenario-1 Unchanged Unchanged Worse Unchanged a- A+
Scenario-2 Unchanged Worse Worse Unchanged a- A
Scenario-3 Unchanged Worse Worse Better a A+
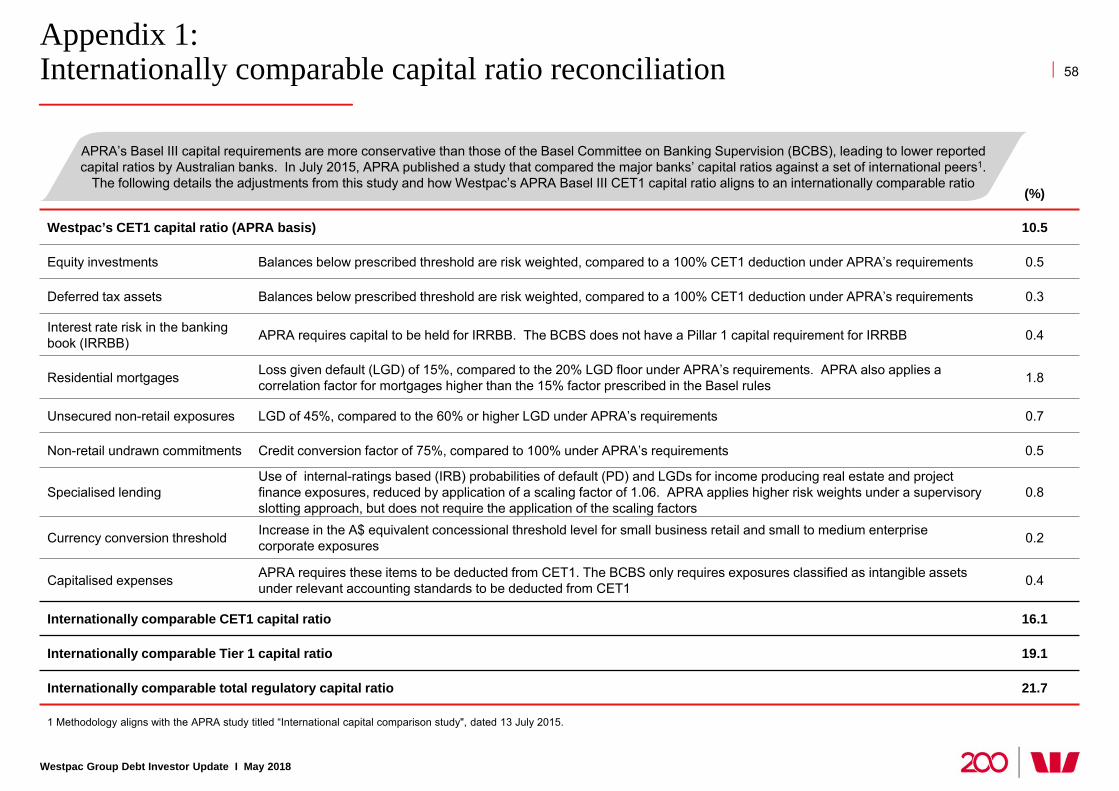
Appendix 1: Internationally comparable capital ratio reconciliation
Westpac Group Debt Investor Update I May 2018
58
1 Methodology aligns with the APRA study titled “International capital comparison study", dated 13 July 2015.
(%)
Westpac’s CET1 capital ratio (APRA basis) 10.5
Equity investments Balances below prescribed threshold are risk weighted, compared to a 100% CET1 deduction under APRA’s requirements 0.5
Deferred tax assets Balances below prescribed threshold are risk weighted, compared to a 100% CET1 deduction under APRA’s requirements 0.3
Interest rate risk in the banking book (IRRBB) APRA requires capital to be held for IRRBB. The BCBS does not have a Pillar 1 capital requirement for IRRBB 0.4
Residential mortgages Loss given default (LGD) of 15%, compared to the 20% LGD floor under APRA’s requirements. APRA also applies a correlation factor for mortgages higher than the 15% factor prescribed in the Basel rules 1.8
Unsecured non-retail exposures LGD of 45%, compared to the 60% or higher LGD under APRA’s requirements 0.7
Non-retail undrawn commitments Credit conversion factor of 75%, compared to 100% under APRA’s requirements 0.5
Specialised lendingUse of internal-ratings based (IRB) probabilities of default (PD) and LGDs for income producing real estate and project finance exposures, reduced by application of a scaling factor of 1.06. APRA applies higher risk weights under a supervisory slotting approach, but does not require the application of the scaling factors
0.8
Currency conversion threshold Increase in the A$ equivalent concessional threshold level for small business retail and small to medium enterprise corporate exposures 0.2
Capitalised expenses APRA requires these items to be deducted from CET1. The BCBS only requires exposures classified as intangible assets under relevant accounting standards to be deducted from CET1 0.4
Internationally comparable CET1 capital ratio 16.1
Internationally comparable Tier 1 capital ratio 19.1
Internationally comparable total regulatory capital ratio 21.7
APRA’s Basel III capital requirements are more conservative than those of the Basel Committee on Banking Supervision (BCBS), leading to lower reported capital ratios by Australian banks. In July 2015, APRA published a study that compared the major banks’ capital ratios against a set of international peers1.
The following details the adjustments from this study and how Westpac’s APRA Basel III CET1 capital ratio aligns to an internationally comparable ratio
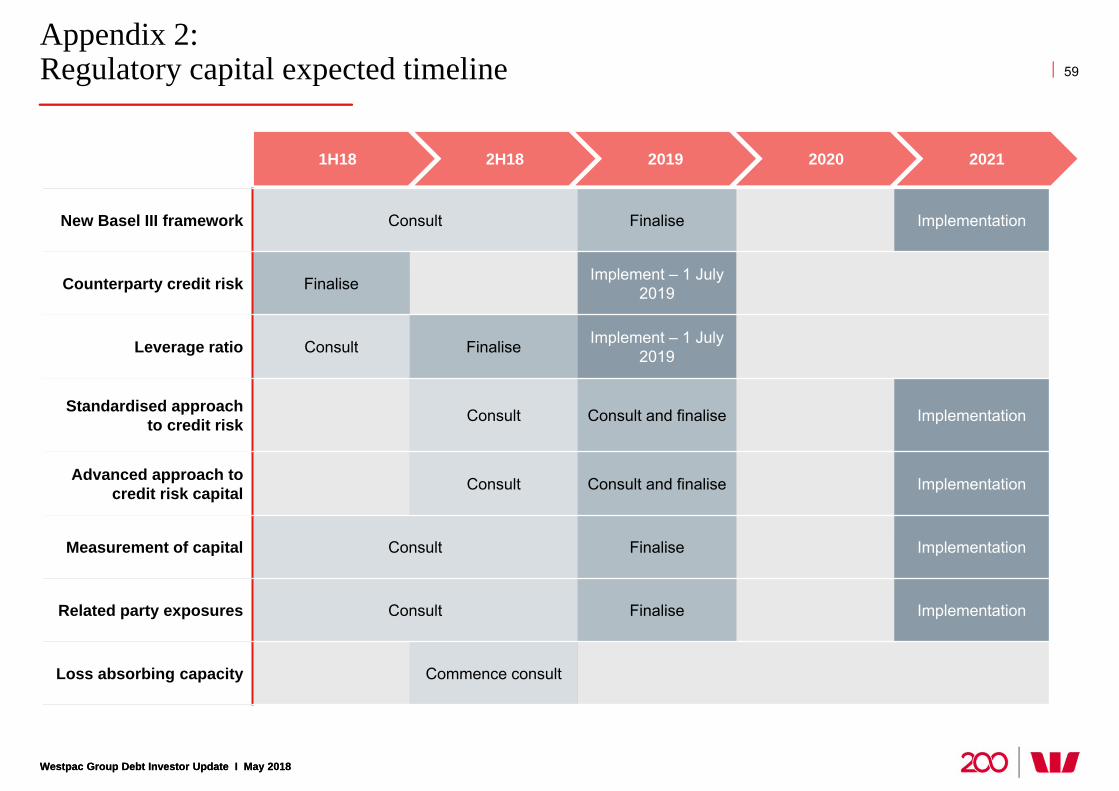
Westpac Group Debt Investor Update I May 2018
Appendix 2: Regulatory capital expected timeline
Westpac Group Debt Investor Update I May 2018
59
1H18 2H18 202120202019
New Basel III framework Consult Finalise Implementation
Counterparty credit risk Finalise Implement – 1 July 2019
Leverage ratio Consult Finalise Implement – 1 July 2019
Standardised approach to credit risk Consult Consult and finalise Implementation
Advanced approach to credit risk capital Consult Consult and finalise Implementation
Measurement of capital Consult Finalise Implementation
Related party exposures Consult Finalise Implementation
Loss absorbing capacity Commence consult
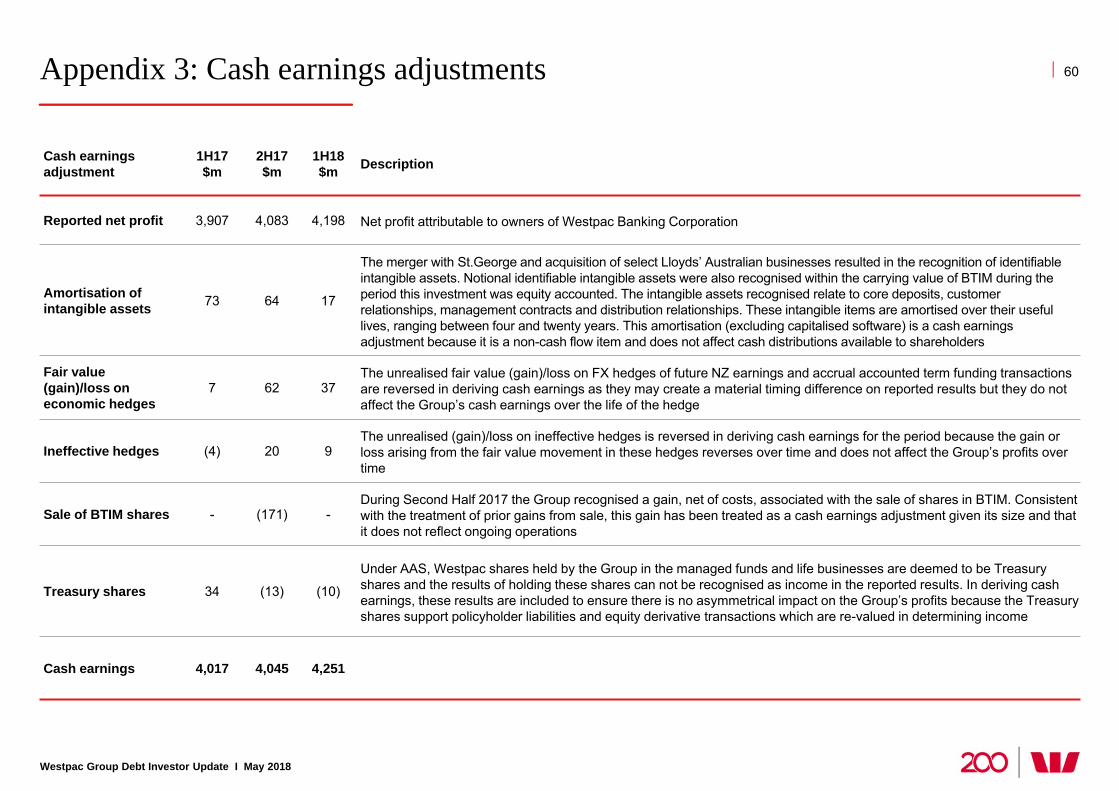
Appendix 3: Cash earnings adjustments
Cash earnings adjustment
1H17$m
2H17$m
1H18$m Description
Reported net profit 3,907 4,083 4,198 Net profit attributable to owners of Westpac Banking Corporation
Amortisation of intangible assets 73 64 17
The merger with St.George and acquisition of select Lloyds’ Australian businesses resulted in the recognition of identifiable intangible assets. Notional identifiable intangible assets were also recognised within the carrying value of BTIM during the period this investment was equity accounted. The intangible assets recognised relate to core deposits, customer relationships, management contracts and distribution relationships. These intangible items are amortised over their useful lives, ranging between four and twenty years. This amortisation (excluding capitalised software) is a cash earnings adjustment because it is a non-cash flow item and does not affect cash distributions available to shareholders
Fair value (gain)/loss on economic hedges
7 62 37The unrealised fair value (gain)/loss on FX hedges of future NZ earnings and accrual accounted term funding transactions are reversed in deriving cash earnings as they may create a material timing difference on reported results but they do not affect the Group’s cash earnings over the life of the hedge
Ineffective hedges (4) 20 9The unrealised (gain)/loss on ineffective hedges is reversed in deriving cash earnings for the period because the gain or loss arising from the fair value movement in these hedges reverses over time and does not affect the Group’s profits over time
Sale of BTIM shares - (171) -During Second Half 2017 the Group recognised a gain, net of costs, associated with the sale of shares in BTIM. Consistent with the treatment of prior gains from sale, this gain has been treated as a cash earnings adjustment given its size and thatit does not reflect ongoing operations
Treasury shares 34 (13) (10)
Under AAS, Westpac shares held by the Group in the managed funds and life businesses are deemed to be Treasury shares and the results of holding these shares can not be recognised as income in the reported results. In deriving cash earnings, these results are included to ensure there is no asymmetrical impact on the Group’s profits because the Treasury shares support policyholder liabilities and equity derivative transactions which are re-valued in determining income
Cash earnings 4,017 4,045 4,251
Westpac Group Debt Investor Update I May 2018
60
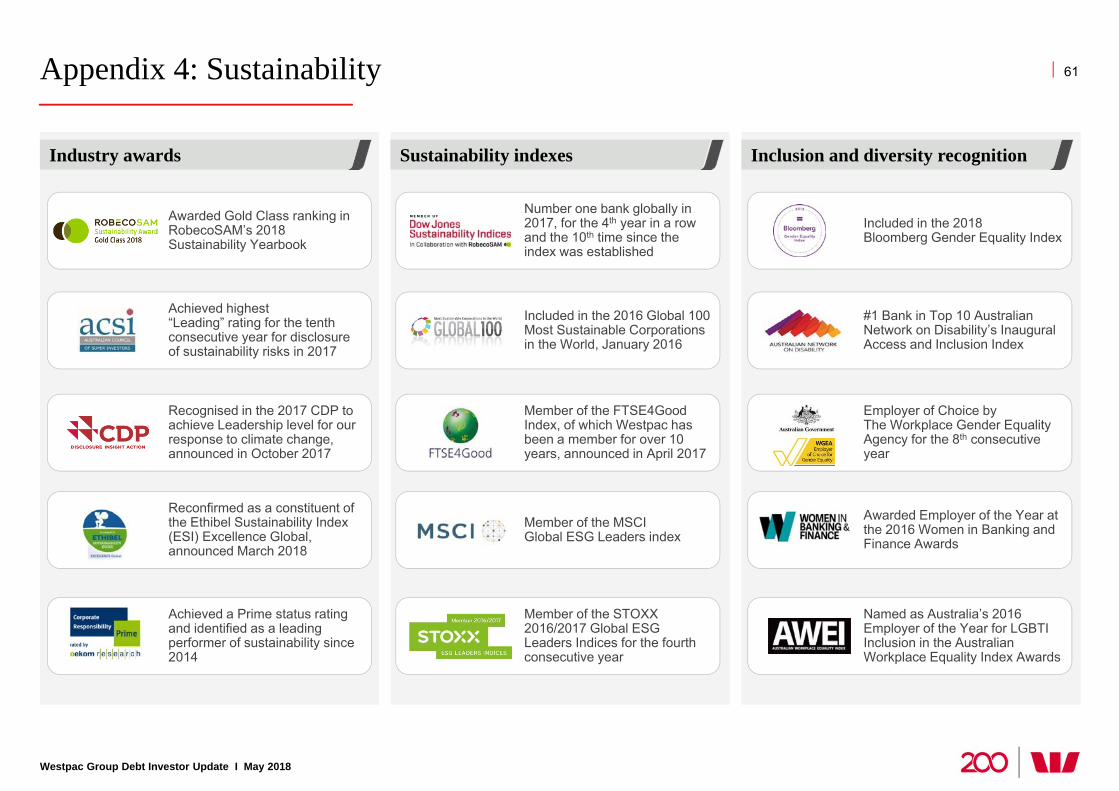
Appendix 4: Sustainability
Westpac Group Debt Investor Update I May 2018
Industry awards
61
Sustainability indexes Inclusion and diversity recognition
Achieved a Prime status rating and identified as a leading performer of sustainability since 2014
Member of the STOXX 2016/2017 Global ESG Leaders Indices for the fourth consecutive year
Named as Australia’s 2016 Employer of the Year for LGBTI Inclusion in the Australian Workplace Equality Index Awards
Reconfirmed as a constituent of the Ethibel Sustainability Index (ESI) Excellence Global, announced March 2018
Member of the MSCIGlobal ESG Leaders index
Awarded Employer of the Year at the 2016 Women in Banking and Finance Awards
Achieved highest“Leading” rating for the tenth consecutive year for disclosure of sustainability risks in 2017
Included in the 2016 Global 100 Most Sustainable Corporations in the World, January 2016
#1 Bank in Top 10 Australian Network on Disability’s Inaugural Access and Inclusion Index
Awarded Gold Class ranking in RobecoSAM’s 2018 Sustainability Yearbook
Number one bank globally in 2017, for the 4th year in a row and the 10th time since the index was established
Included in the 2018Bloomberg Gender Equality Index
Recognised in the 2017 CDP to achieve Leadership level for our response to climate change, announced in October 2017
Member of the FTSE4Good Index, of which Westpac has been a member for over 10 years, announced in April 2017
Employer of Choice byThe Workplace Gender Equality Agency for the 8th consecutive year
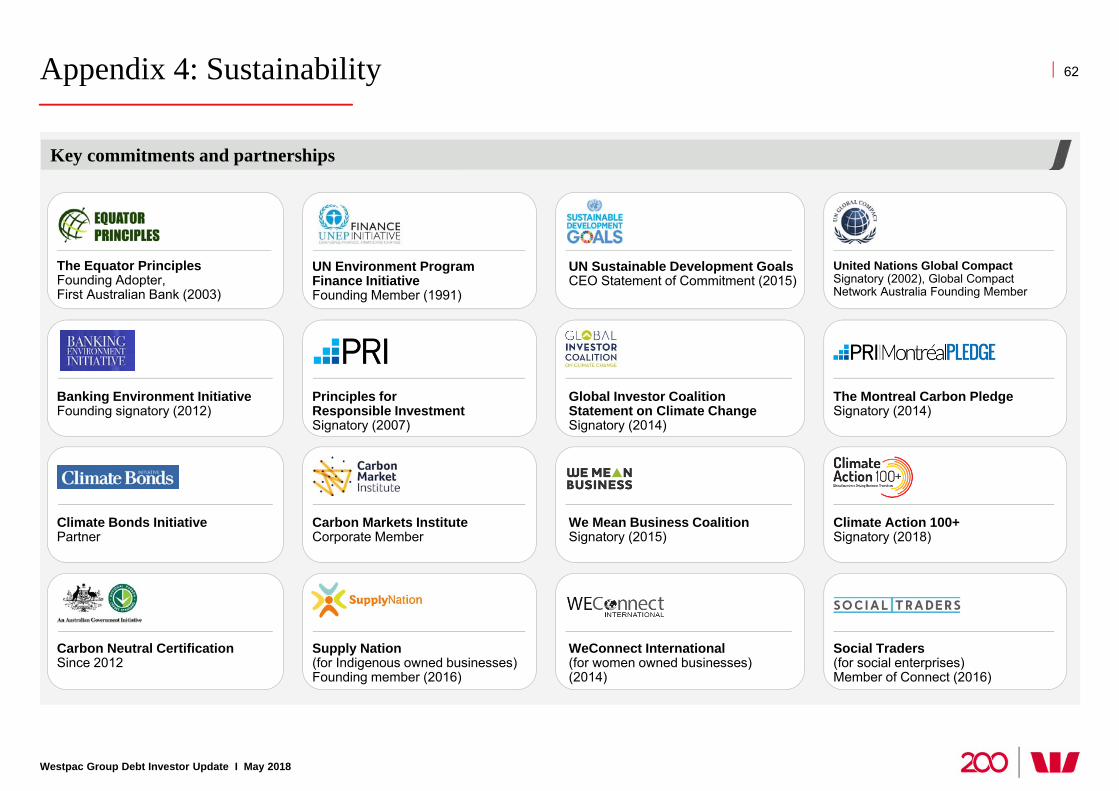
Appendix 4: Sustainability
Westpac Group Debt Investor Update I May 2018
Key commitments and partnerships
62
The Equator PrinciplesFounding Adopter,First Australian Bank (2003)
Banking Environment InitiativeFounding signatory (2012)
Climate Bonds InitiativePartner
Carbon Neutral CertificationSince 2012
UN Sustainable Development GoalsCEO Statement of Commitment (2015)
Global Investor CoalitionStatement on Climate ChangeSignatory (2014)
We Mean Business CoalitionSignatory (2015)
WeConnect International (for women owned businesses) (2014)
United Nations Global Compact Signatory (2002), Global Compact Network Australia Founding Member
The Montreal Carbon PledgeSignatory (2014)
Climate Action 100+Signatory (2018)
Social Traders(for social enterprises)Member of Connect (2016)
UN Environment Program Finance InitiativeFounding Member (1991)
Principles for Responsible Investment Signatory (2007)
Carbon Markets InstituteCorporate Member
Supply Nation (for Indigenous owned businesses)Founding member (2016)
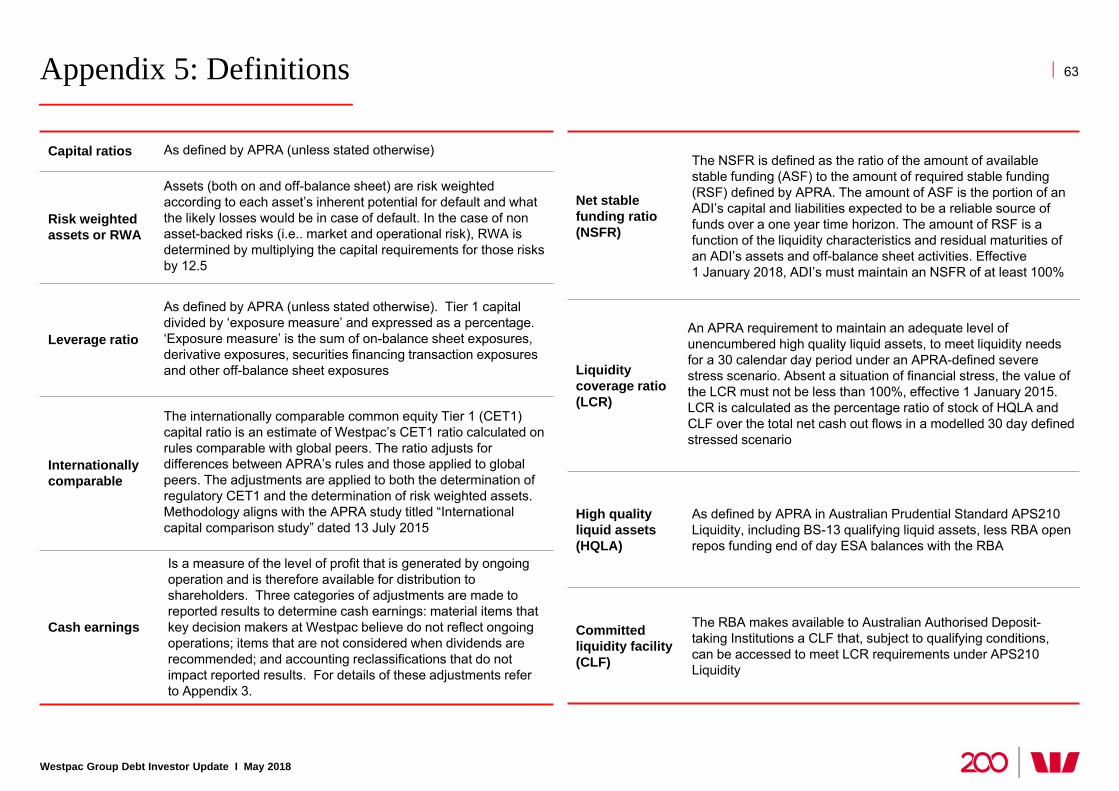
Appendix 5: Definitions
Westpac Group Debt Investor Update I May 2018
63
Capital ratios As defined by APRA (unless stated otherwise)
Risk weighted assets or RWA
Assets (both on and off-balance sheet) are risk weighted according to each asset’s inherent potential for default and what the likely losses would be in case of default. In the case of non asset-backed risks (i.e.. market and operational risk), RWA is determined by multiplying the capital requirements for those risks by 12.5
Leverage ratio
As defined by APRA (unless stated otherwise). Tier 1 capital divided by ‘exposure measure’ and expressed as a percentage. ‘Exposure measure’ is the sum of on-balance sheet exposures, derivative exposures, securities financing transaction exposures and other off-balance sheet exposures
Internationally comparable
The internationally comparable common equity Tier 1 (CET1) capital ratio is an estimate of Westpac’s CET1 ratio calculated on rules comparable with global peers. The ratio adjusts for differences between APRA’s rules and those applied to global peers. The adjustments are applied to both the determination of regulatory CET1 and the determination of risk weighted assets. Methodology aligns with the APRA study titled “International capital comparison study” dated 13 July 2015
Cash earnings
Is a measure of the level of profit that is generated by ongoing operation and is therefore available for distribution to shareholders. Three categories of adjustments are made to reported results to determine cash earnings: material items that key decision makers at Westpac believe do not reflect ongoing operations; items that are not considered when dividends are recommended; and accounting reclassifications that do not impact reported results. For details of these adjustments refer to Appendix 3.
Net stable funding ratio (NSFR)
The NSFR is defined as the ratio of the amount of available stable funding (ASF) to the amount of required stable funding (RSF) defined by APRA. The amount of ASF is the portion of an ADI’s capital and liabilities expected to be a reliable source of funds over a one year time horizon. The amount of RSF is a function of the liquidity characteristics and residual maturities of an ADI’s assets and off-balance sheet activities. Effective1 January 2018, ADI’s must maintain an NSFR of at least 100%
Liquidity coverage ratio (LCR)
An APRA requirement to maintain an adequate level of unencumbered high quality liquid assets, to meet liquidity needs for a 30 calendar day period under an APRA-defined severe stress scenario. Absent a situation of financial stress, the value of the LCR must not be less than 100%, effective 1 January 2015. LCR is calculated as the percentage ratio of stock of HQLA and CLF over the total net cash out flows in a modelled 30 day defined stressed scenario
High quality liquid assets (HQLA)
As defined by APRA in Australian Prudential Standard APS210 Liquidity, including BS-13 qualifying liquid assets, less RBA open repos funding end of day ESA balances with the RBA
Committed liquidity facility (CLF)
The RBA makes available to Australian Authorised Deposit-taking Institutions a CLF that, subject to qualifying conditions, can be accessed to meet LCR requirements under APS210 Liquidity
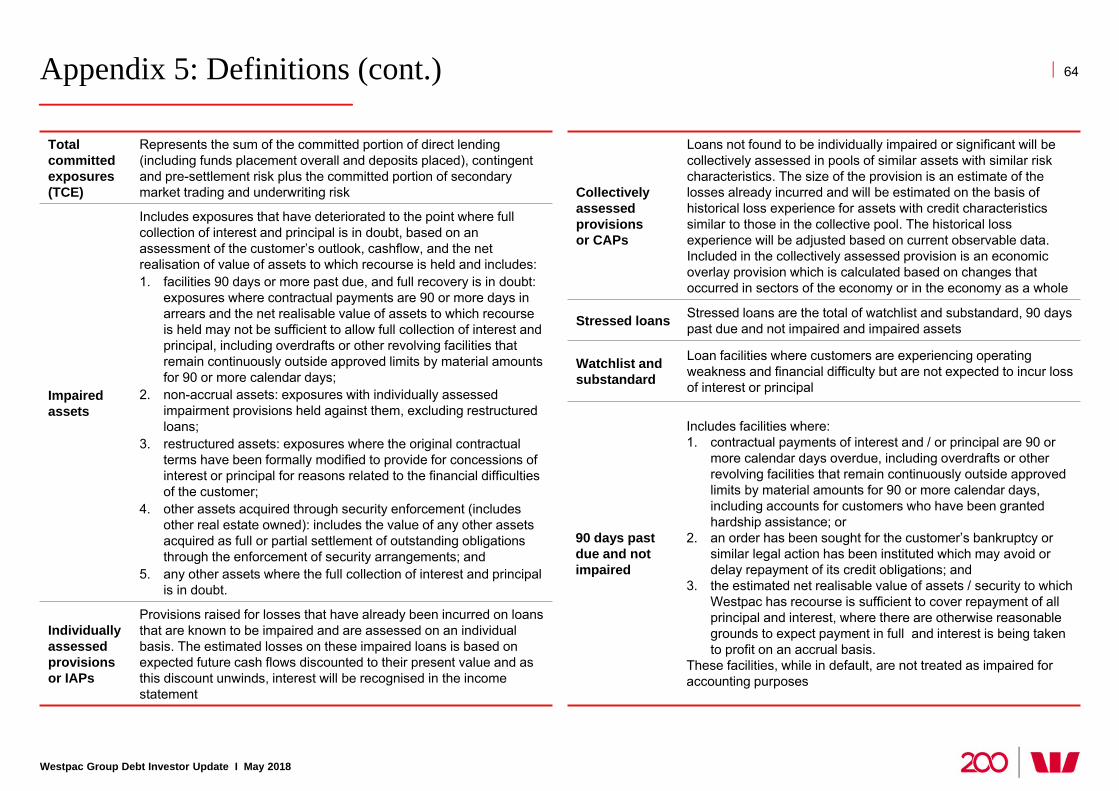
Appendix 5: Definitions (cont.)
Westpac Group Debt Investor Update I May 2018
64
Total committed exposures (TCE)
Represents the sum of the committed portion of direct lending (including funds placement overall and deposits placed), contingent and pre-settlement risk plus the committed portion of secondary market trading and underwriting risk
Impaired assets
Includes exposures that have deteriorated to the point where full collection of interest and principal is in doubt, based on an assessment of the customer’s outlook, cashflow, and the net realisation of value of assets to which recourse is held and includes:1. facilities 90 days or more past due, and full recovery is in doubt:
exposures where contractual payments are 90 or more days in arrears and the net realisable value of assets to which recourse is held may not be sufficient to allow full collection of interest and principal, including overdrafts or other revolving facilities that remain continuously outside approved limits by material amounts for 90 or more calendar days;
2. non-accrual assets: exposures with individually assessed impairment provisions held against them, excluding restructured loans;
3. restructured assets: exposures where the original contractual terms have been formally modified to provide for concessions of interest or principal for reasons related to the financial difficulties of the customer;
4. other assets acquired through security enforcement (includes other real estate owned): includes the value of any other assets acquired as full or partial settlement of outstanding obligations through the enforcement of security arrangements; and
5. any other assets where the full collection of interest and principal is in doubt.
Individually assessed provisions or IAPs
Provisions raised for losses that have already been incurred on loans that are known to be impaired and are assessed on an individual basis. The estimated losses on these impaired loans is based on expected future cash flows discounted to their present value and as this discount unwinds, interest will be recognised in the income statement
Collectively assessed provisions or CAPs
Loans not found to be individually impaired or significant will be collectively assessed in pools of similar assets with similar risk characteristics. The size of the provision is an estimate of the losses already incurred and will be estimated on the basis of historical loss experience for assets with credit characteristics similar to those in the collective pool. The historical loss experience will be adjusted based on current observable data. Included in the collectively assessed provision is an economic overlay provision which is calculated based on changes that occurred in sectors of the economy or in the economy as a whole
Stressed loans Stressed loans are the total of watchlist and substandard, 90 days past due and not impaired and impaired assets
Watchlist and substandard
Loan facilities where customers are experiencing operating weakness and financial difficulty but are not expected to incur loss of interest or principal
90 days past due and not impaired
Includes facilities where:1. contractual payments of interest and / or principal are 90 or
more calendar days overdue, including overdrafts or other revolving facilities that remain continuously outside approved limits by material amounts for 90 or more calendar days, including accounts for customers who have been granted hardship assistance; or
2. an order has been sought for the customer’s bankruptcy or similar legal action has been instituted which may avoid or delay repayment of its credit obligations; and
3. the estimated net realisable value of assets / security to which Westpac has recourse is sufficient to cover repayment of all principal and interest, where there are otherwise reasonable grounds to expect payment in full and interest is being taken to profit on an accrual basis.
These facilities, while in default, are not treated as impaired for accounting purposes
More information | www.westpac.com.au/investorcentre
Curt ZuberTreasurer, Westpac Banking Corporation
+61 2 8253 4230 [email protected]
Richard SalmonDirector, Global Funding
+61 2 8253 4314 [email protected]
Joanne DawsonDeputy Treasurer, Westpac Banking Corporation
+61 2 8204 2777 [email protected]
Nick CooperSenior Associate, Global Funding
+61 2 8253 4314 [email protected]
X-+
65
Contact our Global Funding team
Alexander BischoffExecutive Director, Global Funding
+61 2 8253 4314 [email protected]
Jacqueline BoddyDirector, Debt Investor Relations
+61 2 8253 3133 [email protected]