Embed Size (px)
Citation preview
2 0 1 8 ANNUAL R E P O R T
Q B E I N S U R A N C E G R O U P L I M I T E D

This is an interactive PDF designed to enhance your experience. The best way to view this report is with Adobe Acrobat Reader. Click on the links on the contents pages or use the home button in the footer to navigate the report.
Oth
er in
form
ation
6
Fin
ancial
Rep
ort
5
Bu
siness
review
2
Go
vern
ance
3
Directo
rs' R
epo
rt
4
QB
E In
suran
ce Gro
up
A
nn
ual R
epo
rt 2018
1P
erform
ance
ov
erview
1
QBE Insurance Group Limited | ABN 28 008 485 014
All amounts in this report are US dollars unless otherwise stated.
SECTION 1
Performance overview
Chairman’s message 2
2018 snapshot 4
Group Chief Executive Officer’s report 6
SECTION 2
Business review
Group Chief Financial Officer’s report 10
Divisions at a glance 24
North American Operations business review 26
European Operations business review 28
Australian & New Zealand Operations business review 30
Asia Pacific Operations business review 32
Equator Re business review 34
SECTION 3
Governance
Climate change action plan 36
Risk – our business 42
Board of Directors 44
Group Executive Committee 46
Corporate governance statement 48
SECTION 4
Directors’ Report
Directors’ Report 56
Remuneration Report 60
Auditor’s independence declaration 84
SECTION 5
Financial Report
Financial Report contents 85
Financial statements 86
Notes to the financial statements 90
Directors’ declaration 162
SECTION 6
Other information
Independent auditor’s report 163
Shareholder information 172
Financial calendar 175
10 year history 176
Glossary 177
Table of contentsA N N U A L R E P O R T 2 0 1 8
2
This result reflects the hard work of our people and the performance management discipline instilled throughout the year, together with an improvement in the quality and consistency of our underwriting. Indeed, our underwriting profit this year of $515 million 2 represents a very significant turnaround from the loss reported in 2017.
True to our plans, we exited portfolios, regions and countries where we lacked scale or were unable to achieve an acceptable rate of return. These transactions complete QBE’s portfolio rationalisation and I congratulate Pat Regan and his team on this significant milestone, achieved in just 12 months. The simplification of QBE is outlined in the Group CEO’s report on pages 6 and 7.
We saw a reduced incidence of natural catastrophes this year in contrast to the record losses that impacted the global insurance and reinsurance market in 2017. Nevertheless, catastrophe events were again elevated in 2018, including Hurricanes Florence and Michael in the United States, typhoons in Japan, a windstorm in Canada, the worsening drought in parts of Australia as well as localised storms, and the devastating wildfires that swept through parts of the United States, most recently in California. All had serious and often tragic consequences for local communities and caused heavy and widespread property and infrastructure damage.
Divisional ResultsAll of our divisions delivered improved underwriting results 1 in 2018.
Australian & New Zealand Operations recorded another strong underwriting result with the combined operating ratio improving slightly to 91.9% 1. Result quality continues to improve with a reduced reliance on positive prior accident year claims development and lenders’ mortgage insurance profits. Pricing conditions in Australia & New Zealand remain particularly strong.
I am pleased to report that the remediation of Asia Pacific Operations is now largely complete with the business generating an underwriting profit of $2 million 2 in the second half of 2018, following a $22 million 2 loss in the first half and a $100 million loss in 2017. Decisive action to restore underwriting margins naturally resulted in a reduction in premium income.
With remediation of Asia Pacific well progressed and our portfolio rationalisation program complete, we have consolidated the Group’s divisional structure. Effective 1 January 2019, our Asian entities joined with European Operations to form our new International division. At the same time, the Pacific Islands and Indian entities were consolidated into Australian & New Zealand Operations to form our Australia Pacific division.
These changes will help drive efficiencies across the Group, with much of the administration of the former standalone Asia Pacific Operations absorbed by the larger and better resourced International and Australia Pacific divisions.
Chairman's message
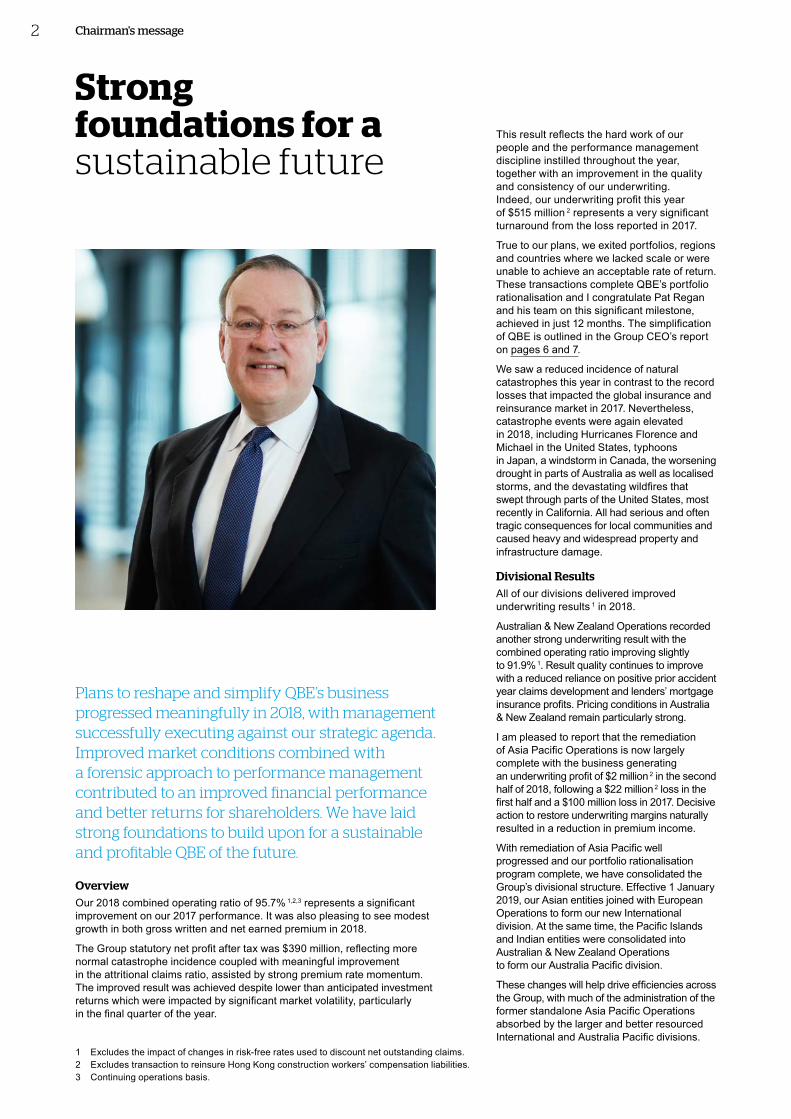
Plans to reshape and simplify QBE’s business progressed meaningfully in 2018, with management successfully executing against our strategic agenda. Improved market conditions combined with a forensic approach to performance management contributed to an improved financial performance and better returns for shareholders. We have laid strong foundations to build upon for a sustainable and profitable QBE of the future.
OverviewOur 2018 combined operating ratio of 95.7% 1,2,3 represents a significant improvement on our 2017 performance. It was also pleasing to see modest growth in both gross written and net earned premium in 2018.
The Group statutory net profit after tax was $390 million, reflecting more normal catastrophe incidence coupled with meaningful improvement in the attritional claims ratio, assisted by strong premium rate momentum. The improved result was achieved despite lower than anticipated investment returns which were impacted by significant market volatility, particularly in the final quarter of the year.
1 Excludes the impact of changes in risk-free rates used to discount net outstanding claims. 2 Excludes transaction to reinsure Hong Kong construction workers’ compensation liabilities.3 Continuing operations basis.
Strong foundations for a sustainable future
2
This result reflects the hard work of our people and the performance management discipline instilled throughout the year, together with an improvement in the quality and consistency of our underwriting. Indeed, our underwriting profit this year of $515 million 2 represents a very significant turnaround from the loss reported in 2017.
True to our plans, we exited portfolios, regions and countries where we lacked scale or were unable to achieve an acceptable rate of return. These transactions complete QBE’s portfolio rationalisation and I congratulate Pat Regan and his team on this significant milestone, achieved in just 12 months. The simplification of QBE is outlined in the Group CEO’s report on pages 6 and 7.
We saw a reduced incidence of natural catastrophes this year in contrast to the record losses that impacted the global insurance and reinsurance market in 2017. Nevertheless, catastrophe events were again elevated in 2018, including Hurricanes Florence and Michael in the United States, typhoons in Japan, a windstorm in Canada, the worsening drought in parts of Australia as well as localised storms, and the devastating wildfires that swept through parts of the United States, most recently in California. All had serious and often tragic consequences for local communities and caused heavy and widespread property and infrastructure damage.
Divisional ResultsAll of our divisions delivered improved underwriting results 1 in 2018.
Australian & New Zealand Operations recorded another strong underwriting result with the combined operating ratio improving slightly to 91.9% 1. Result quality continues to improve with a reduced reliance on positive prior accident year claims development and lenders’ mortgage insurance profits. Pricing conditions in Australia & New Zealand remain particularly strong.
I am pleased to report that the remediation of Asia Pacific Operations is now largely complete with the business generating an underwriting profit of $2 million 2 in the second half of 2018, following a $22 million 2 loss in the first half and a $100 million loss in 2017. Decisive action to restore underwriting margins naturally resulted in a reduction in premium income.
With remediation of Asia Pacific well progressed and our portfolio rationalisation program complete, we have consolidated the Group’s divisional structure. Effective 1 January 2019, our Asian entities joined with European Operations to form our new International division. At the same time, the Pacific Islands and Indian entities were consolidated into Australian & New Zealand Operations to form our Australia Pacific division.
These changes will help drive efficiencies across the Group, with much of the administration of the former standalone Asia Pacific Operations absorbed by the larger and better resourced International and Australia Pacific divisions.
Chairman's message
Plans to reshape and simplify QBE’s business progressed meaningfully in 2018, with management successfully executing against our strategic agenda. Improved market conditions combined with a forensic approach to performance management contributed to an improved financial performance and better returns for shareholders. We have laid strong foundations to build upon for a sustainable and profitable QBE of the future.
OverviewOur 2018 combined operating ratio of 95.7% 1,2,3 represents a significant improvement on our 2017 performance. It was also pleasing to see modest growth in both gross written and net earned premium in 2018.
The Group statutory net profit after tax was $390 million, reflecting more normal catastrophe incidence coupled with meaningful improvement in the attritional claims ratio, assisted by strong premium rate momentum. The improved result was achieved despite lower than anticipated investment returns which were impacted by significant market volatility, particularly in the final quarter of the year.
1 Excludes the impact of changes in risk-free rates used to discount net outstanding claims. 2 Excludes transaction to reinsure Hong Kong construction workers’ compensation liabilities.3 Continuing operations basis.
Strong foundations for a sustainable future
Oth
er in
form
ation
6
Fin
ancial
Rep
ort
5
Bu
siness
review
2
Go
vern
ance
3
Directo
rs' R
epo
rt
4
QB
E In
suran
ce Gro
up
A
nn
ual R
epo
rt 2018
3P
erform
ance
ov
erview
1
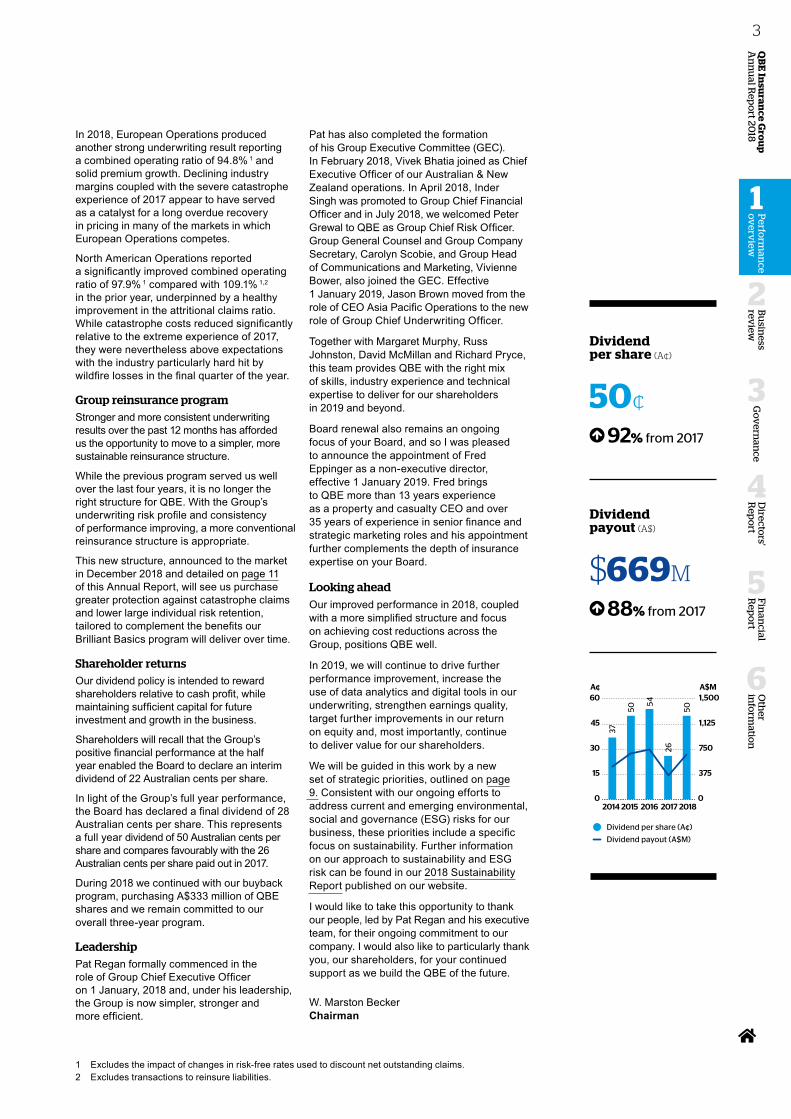
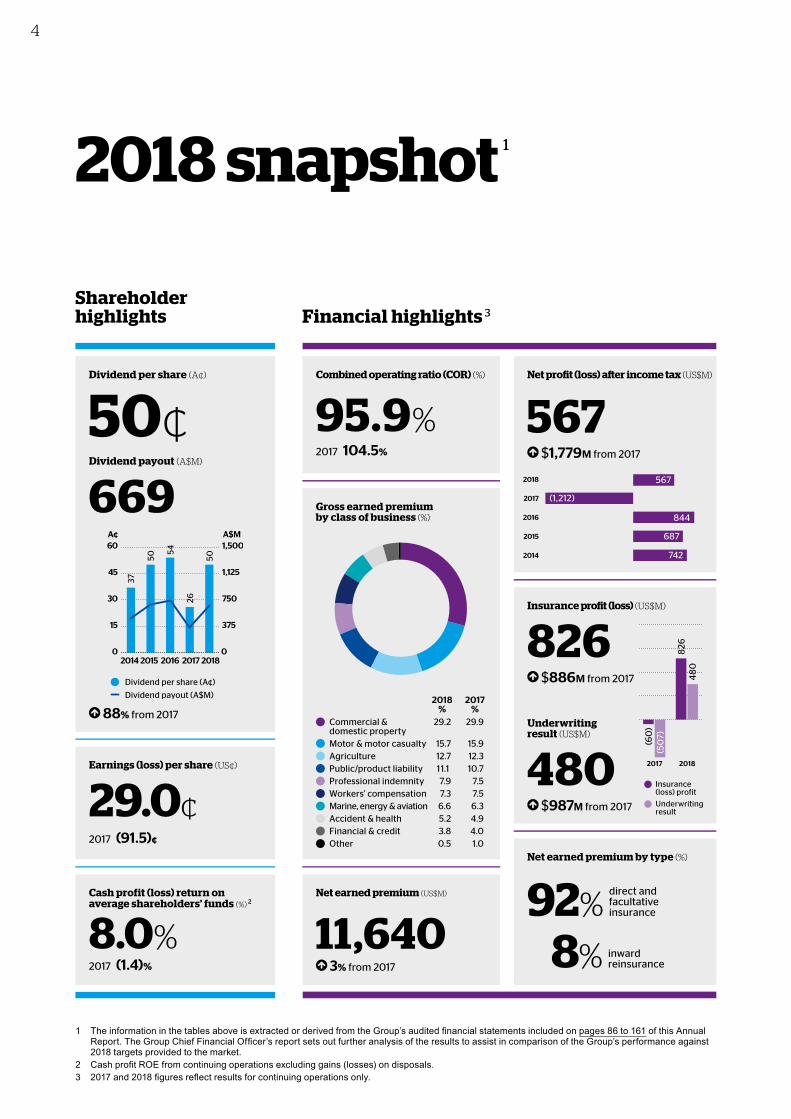
Dividend per share (A¢)
50�
92% from 2017
Dividend payout (A$)
$669M
88% from 2017
In 2018, European Operations produced another strong underwriting result reporting a combined operating ratio of 94.8% 1 and solid premium growth. Declining industry margins coupled with the severe catastrophe experience of 2017 appear to have served as a catalyst for a long overdue recovery in pricing in many of the markets in which European Operations competes.
North American Operations reported a significantly improved combined operating ratio of 97.9% 1 compared with 109.1% 1,2 in the prior year, underpinned by a healthy improvement in the attritional claims ratio. While catastrophe costs reduced significantly relative to the extreme experience of 2017, they were nevertheless above expectations with the industry particularly hard hit by wildfire losses in the final quarter of the year.
Group reinsurance programStronger and more consistent underwriting results over the past 12 months has afforded us the opportunity to move to a simpler, more sustainable reinsurance structure.
While the previous program served us well over the last four years, it is no longer the right structure for QBE. With the Group’s underwriting risk profile and consistency of performance improving, a more conventional reinsurance structure is appropriate.
This new structure, announced to the market in December 2018 and detailed on page 11 of this Annual Report, will see us purchase greater protection against catastrophe claims and lower large individual risk retention, tailored to complement the benefits our Brilliant Basics program will deliver over time.
Shareholder returnsOur dividend policy is intended to reward shareholders relative to cash profit, while maintaining sufficient capital for future investment and growth in the business.
Shareholders will recall that the Group’s positive financial performance at the half year enabled the Board to declare an interim dividend of 22 Australian cents per share.
In light of the Group’s full year performance, the Board has declared a final dividend of 28 Australian cents per share. This represents a full year dividend of 50 Australian cents per share and compares favourably with the 26 Australian cents per share paid out in 2017.
During 2018 we continued with our buyback program, purchasing A$333 million of QBE shares and we remain committed to our overall three-year program.
Leadership Pat Regan formally commenced in the role of Group Chief Executive Officer on 1 January, 2018 and, under his leadership, the Group is now simpler, stronger and more efficient.
Pat has also completed the formation of his Group Executive Committee (GEC). In February 2018, Vivek Bhatia joined as Chief Executive Officer of our Australian & New Zealand operations. In April 2018, Inder Singh was promoted to Group Chief Financial Officer and in July 2018, we welcomed Peter Grewal to QBE as Group Chief Risk Officer. Group General Counsel and Group Company Secretary, Carolyn Scobie, and Group Head of Communications and Marketing, Vivienne Bower, also joined the GEC. Effective 1 January 2019, Jason Brown moved from the role of CEO Asia Pacific Operations to the new role of Group Chief Underwriting Officer.
Together with Margaret Murphy, Russ Johnston, David McMillan and Richard Pryce, this team provides QBE with the right mix of skills, industry experience and technical expertise to deliver for our shareholders in 2019 and beyond.
Board renewal also remains an ongoing focus of your Board, and so I was pleased to announce the appointment of Fred Eppinger as a non-executive director, effective 1 January 2019. Fred brings to QBE more than 13 years experience as a property and casualty CEO and over 35 years of experience in senior finance and strategic marketing roles and his appointment further complements the depth of insurance expertise on your Board.
Looking aheadOur improved performance in 2018, coupled with a more simplified structure and focus on achieving cost reductions across the Group, positions QBE well.
In 2019, we will continue to drive further performance improvement, increase the use of data analytics and digital tools in our underwriting, strengthen earnings quality, target further improvements in our return on equity and, most importantly, continue to deliver value for our shareholders.
We will be guided in this work by a new set of strategic priorities, outlined on page 9. Consistent with our ongoing efforts to address current and emerging environmental, social and governance (ESG) risks for our business, these priorities include a specific focus on sustainability. Further information on our approach to sustainability and ESG risk can be found in our 2018 Sustainability Report published on our website.
I would like to take this opportunity to thank our people, led by Pat Regan and his executive team, for their ongoing commitment to our company. I would also like to particularly thank you, our shareholders, for your continued support as we build the QBE of the future.
W. Marston Becker Chairman
1 Excludes the impact of changes in risk-free rates used to discount net outstanding claims. 2 Excludes transactions to reinsure liabilities.
0
15
30
45
60
201820172016201520140
375
750
1,125
1,500A$M
37
50
54
26
50A¢
Dividend payout (A$M)
Dividend per share (A¢)
4
1 The information in the tables above is extracted or derived from the Group’s audited financial statements included on pages 86 to 161 of this Annual Report. The Group Chief Financial Officer’s report sets out further analysis of the results to assist in comparison of the Group’s performance against 2018 targets provided to the market.
2 Cash profit ROE from continuing operations excluding gains (losses) on disposals.3 2017 and 2018 figures reflect results for continuing operations only.
Shareholder highlights Financial highlights 3Net profit after income tax (US$M)
2013
2014
2015
2016
2017
2014
2015
2016
2017
2018
844
(1,212)
567
687
742
687
844
(1,249)
742
(254)
Gross earned premium by class of business
Other
Financial & credit
Accident & health
Marine energy & aviation
Workers' compensation
Professional indemnity
Public/product liability
Agriculture
Motor & motor casualty
Commercial & domestic property
Commercial & domestic propertyMotor & motor casualtyAgriculturePublic/product liabilityProfessional indemnityWorkers' compensationMarine, energy & aviationAccident & healthFinancial & creditOther
29.2
15.712.711.1 7.97.36.65.23.80.5
29.9
15.912.310.7
7.57.56.34.94.01.0
2018%
2017%
Combined operating ratio (COR) (%)
95.9%2017 104.5%
Net profit (loss) after income tax (US$M)
567 $1,779M from 2017
Gross earned premium by class of business (%)
Insurance profit (loss) (US$M)
826 $886M from 2017
Net earned premium by type (%)
92% direct and facultative insurance
8% inward reinsurance
Underwriting result (US$M)
480 $987M from 2017
Net earned premium (US$M)
11,640 3% from 2017
Insurance profit and underwriting result (US$M)
20182017
(60
)(5
07)
826
48
0
Insurance(loss) profit 4%Underwritingresult 6%
Dividend per share (A¢)
50¢
0
15
30
45
60
201820172016201520140
375
750
1,125
1,500A$M
37
50
54
26
50
A¢
Dividend payout (A$M)
Dividend per share (A¢)
Dividend payout (A$M)
669
Earnings (loss) per share (US¢)
29.0¢2017 (91.5)¢
Cash profit (loss) return on average shareholders’ funds (%) 2
8.0%
2017 (1.4)%
88% from 2017
2018 snapshot 1
Insurance (loss) profit
Underwriting result
Oth
er in
form
ation
6
Fin
ancial
Rep
ort
5
Bu
siness
review
2
Go
vern
ance
3
Directo
rs' R
epo
rt
4
QB
E In
suran
ce Gro
up
A
nn
ual R
epo
rt 2018
5P
erform
ance
ov
erview
1
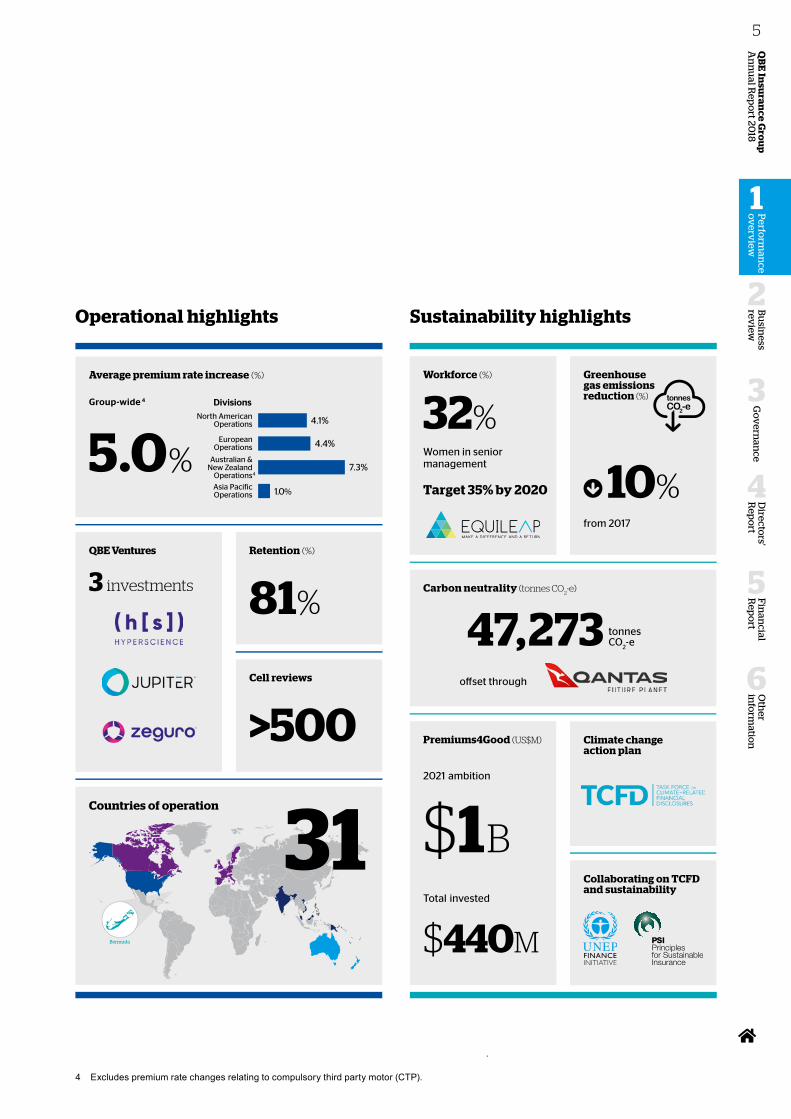
4 Excludes premium rate changes relating to compulsory third party motor (CTP).
Operational highlights
Bermuda
Countries of operation
31
Average premium rate increase (%)
QBE Ventures
3 investments
Retention (%)
81%
Cell reviews
>500
Sustainability highlights
Asia PacificOperations
Australian &New Zealand
Operations
EuropeanOperations
North AmericanOperations
7.3%
4.4%
4.1%
1.0%
Divisions
4
Group-wide 4
5.0%
Premiums4Good (US$M)
2021 ambition
$1BTotal invested
$440M
Carbon neutrality (tonnes CO2-e)
47,273 tonnesCO
2-e
offset through
Workforce (%)
32%Women in seniormanagement
Target 35% by 2020
Greenhouse gas emissions reduction (%)
10%from 2017
Climate change action plan
Collaborating on TCFD and sustainability
6
A stronger and simpler QBE
Group Chief Executive Officer’s report
The actions we have taken this year to simplify the Group, upgrade core capabilities in pricing, underwriting and claims management and implement a rigorous performance management framework have delivered meaningful improvement in the underlying quality of our business and our financial performance in 2018.
The positive momentum we have built throughout 2018, combined with our 2019 strategic agenda, positions us well to deliver value for our shareholders in 2019 and beyond. Set out hereafter is our progress against the seven key priorities we set ourselves at the start of 2018.
Simplify QBEDuring 2018, we successfully exited the countries and portfolios where we lacked scale or were not able to deliver an acceptable return to shareholders. This included the sale of operations in nine countries covering our entire Latin American Operations, Thailand, Indonesia and the Philippines. We also exited loss-making portfolios including North American personal lines, Hong Kong construction workers' compensation and Australian & New Zealand travel insurance.
Our disposal program generated total sale proceeds of around $550 million and a premium to book value of around $100 million. Businesses exited generated underwriting losses in 2017 of around $200 million.
Oth
er in
form
ation
6
Fin
ancial
Rep
ort
5
Bu
siness
review
2
Go
vern
ance
3
Directo
rs' R
epo
rt
4
QB
E In
suran
ce Gro
up
A
nn
ual R
epo
rt 2018
7P
erform
ance
ov
erview
1
Portfolio simplification has allowed us to streamline our operating structure, reducing the number of divisions to three: Australia Pacific, International and North America. From 1 January 2019, Asia sits within International, alongside our European Operations, while the Pacific and India have joined Australian & New Zealand Operations to form Australia Pacific. The restructure will allow our businesses in Asia, the Pacific and India to generate efficiencies by leveraging the scale and resources of our major divisions.
Brilliant BasicsThe Brilliant Basics program is at the core of our strategy. We are upgrading QBE’s capabilities in the basics of pricing, risk selection and claims management to deliver a consistent level of excellence in every country in which we do business and in every portfolio.
The implementation of a new set of Group-wide Underwriting Standards and Claims Standards during the year was a key milestone in creating a framework for consistent excellence across the Group. We also took steps to upgrade our pricing capabilities including making greater use of third-party data. The team delivering the Brilliant Basics program was also strengthened with the appointment of a Global Head of Pricing, the establishment of Chief Underwriting Offices in each of the divisions and the appointment of Jason Brown as the Group Chief Underwriting Officer. We now have a full team in place to accelerate the Brilliant Basics program in 2019.
Delivering on the planWe delivered a combined operating ratio of 95.7% 1,2 for 2018, ahead of the midpoint of our target range. Pleasingly, the result included a 2.9% 3 reduction in the attritional claims ratio with all divisions showing positive momentum underpinned by our rigorous approach to performance management through our cell review process. Cell reviews have proven to be an effective method to drive accountability throughout the organisation and enable us to quickly respond to changes in the market as they occur.
Together with other members of the GEC, I completed over 500 cell reviews in 2018. This performance management focus is quickly becoming part of the culture at QBE and the cell reviews will continue with the same frequency and intensity in 2019.
Further reposition North AmericaDespite above average catastrophe incidence, North American Operations recorded a much improved result in 2018 with a combined operating ratio of 97.9% 1 including a significantly improved attritional claims ratio.
In 2018, we exited the retail personal lines segment in North America which will enable us to take significant costs out of the business. Cost reduction will be an important driver of further margin expansion in this business over the next few years. We have also changed our operating model in North America, combining our Specialty and Commercial businesses to better align with customer needs and to deliver industry specialist capabilities.
Remediate AsiaThroughout the year, excellent progress was made in re-underwriting our Asian business, with Asia Pacific Operations returning to an underwriting profit in the second half of the year with a combined operating ratio of 99.5% 1,2. This turnaround was achieved in a highly competitive market and our Asian operations are now well positioned to return to selective growth in 2019 as part of the International division.
Talent and cultureWe are focused on creating a diverse, inclusive and high-performance workplace, and this year our efforts were recognised with QBE’s inclusion in the top 200 companies in the Equileap 2018 Gender Equality Global Report & Ranking and on the Bloomberg Gender-Equality Index. We have set ourselves the goal of having 35% of senior management roles filled by women by 2020. In 2018, we achieved a 2% increase to 32%. This is the second year in a row where we have achieved a 2% increase and reflects our ongoing focus on recruitment, selection, promotion and development.
In September I was pleased to launch the QBE DNA, which interlinks seven cultural elements that are fundamental to who we are and how we need to operate in the future to succeed. This new set of cultural elements places a greater emphasis on being customer-centred, technically excellent, diverse, fast-paced, courageous and accountable and working together as a team.
Build for the futureIn November, we launched a new customer commitment program (EQUITY), to bring our customer-centred DNA to life. Our aim is to consistently deliver a high-quality customer experience and outcome that will differentiate QBE.
Providing cutting edge solutions to our customers' current and emerging needs is essential to this work and we have continued to invest in solutions through our venture capital arm, QBE Ventures. We made three investments in 2018 including in HyperScience, a machine learning company focused on building artificial intelligence (AI) solutions for automating office work; Jupiter, an emerging leader in predicting and managing climate risk; and Zeguro a platform that helps SME customers manage cyber security risks.
These are in addition to our existing investments in Cytora, an AI company powering a new way for commercial insurers to target, select and price risk and RiskGenius, a machine learning company helping carriers, brokers and regulators to analyse policy and endorsement language and assist with product development.
In closing, I am pleased with the progress we have made against our strategic objectives for 2018, which is reflected in our improved financial performance for the year. With our simplified structure, the implementation of Brilliant Basics and our relentless focus on performance across the business, I am confident we can build upon this result to deliver value for our shareholders into 2019 and beyond.
Pat Regan Group Chief Executive Officer
1 Excludes the impact of changes in risk-free rates used to discount net outstanding claims.2 Excludes transactions to reinsure Hong Kong construction workers' compensation liabilities.3 Excludes Crop and LMI.
8 Group Chief Executive Officer’s report
Combined operating ratio 1
94.5% to 96.5%
Investment return 1
3.0% to 3.5%
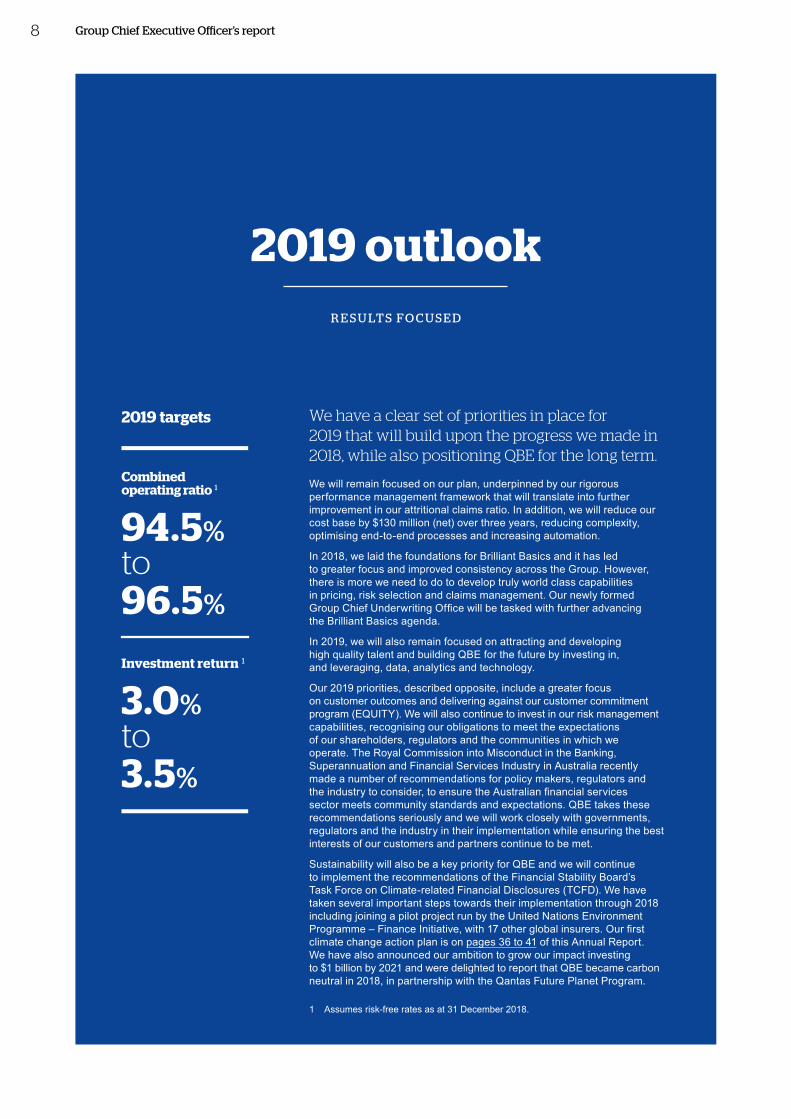
2019 targets We have a clear set of priorities in place for 2019 that will build upon the progress we made in 2018, while also positioning QBE for the long term.
We will remain focused on our plan, underpinned by our rigorous performance management framework that will translate into further improvement in our attritional claims ratio. In addition, we will reduce our cost base by $130 million (net) over three years, reducing complexity, optimising end-to-end processes and increasing automation.
In 2018, we laid the foundations for Brilliant Basics and it has led to greater focus and improved consistency across the Group. However, there is more we need to do to develop truly world class capabilities in pricing, risk selection and claims management. Our newly formed Group Chief Underwriting Office will be tasked with further advancing the Brilliant Basics agenda.
In 2019, we will also remain focused on attracting and developing high quality talent and building QBE for the future by investing in, and leveraging, data, analytics and technology.
Our 2019 priorities, described opposite, include a greater focus on customer outcomes and delivering against our customer commitment program (EQUITY). We will also continue to invest in our risk management capabilities, recognising our obligations to meet the expectations of our shareholders, regulators and the communities in which we operate. The Royal Commission into Misconduct in the Banking, Superannuation and Financial Services Industry in Australia recently made a number of recommendations for policy makers, regulators and the industry to consider, to ensure the Australian financial services sector meets community standards and expectations. QBE takes these recommendations seriously and we will work closely with governments, regulators and the industry in their implementation while ensuring the best interests of our customers and partners continue to be met.
Sustainability will also be a key priority for QBE and we will continue to implement the recommendations of the Financial Stability Board’s Task Force on Climate-related Financial Disclosures (TCFD). We have taken several important steps towards their implementation through 2018 including joining a pilot project run by the United Nations Environment Programme – Finance Initiative, with 17 other global insurers. Our first climate change action plan is on pages 36 to 41 of this Annual Report. We have also announced our ambition to grow our impact investing to $1 billion by 2021 and were delighted to report that QBE became carbon neutral in 2018, in partnership with the Qantas Future Planet Program.
2019 outlookR E S U LT S F O C U S E D
1 Assumes risk-free rates as at 31 December 2018.
8 Group Chief Executive Officer’s report
Combined operating ratio 1
94.5% to 96.5%
Investment return 1
3.0% to 3.5%
2019 targets We have a clear set of priorities in place for 2019 that will build upon the progress we made in 2018, while also positioning QBE for the long term.
We will remain focused on our plan, underpinned by our rigorous performance management framework that will translate into further improvement in our attritional claims ratio. In addition, we will reduce our cost base by $130 million (net) over three years, reducing complexity, optimising end-to-end processes and increasing automation.
In 2018, we laid the foundations for Brilliant Basics and it has led to greater focus and improved consistency across the Group. However, there is more we need to do to develop truly world class capabilities in pricing, risk selection and claims management. Our newly formed Group Chief Underwriting Office will be tasked with further advancing the Brilliant Basics agenda.
In 2019, we will also remain focused on attracting and developing high quality talent and building QBE for the future by investing in, and leveraging, data, analytics and technology.
Our 2019 priorities, described opposite, include a greater focus on customer outcomes and delivering against our customer commitment program (EQUITY). We will also continue to invest in our risk management capabilities, recognising our obligations to meet the expectations of our shareholders, regulators and the communities in which we operate. The Royal Commission into Misconduct in the Banking, Superannuation and Financial Services Industry in Australia recently made a number of recommendations for policy makers, regulators and the industry to consider, to ensure the Australian financial services sector meets community standards and expectations. QBE takes these recommendations seriously and we will work closely with governments, regulators and the industry in their implementation while ensuring the best interests of our customers and partners continue to be met.
Sustainability will also be a key priority for QBE and we will continue to implement the recommendations of the Financial Stability Board’s Task Force on Climate-related Financial Disclosures (TCFD). We have taken several important steps towards their implementation through 2018 including joining a pilot project run by the United Nations Environment Programme – Finance Initiative, with 17 other global insurers. Our first climate change action plan is on pages 36 to 41 of this Annual Report. We have also announced our ambition to grow our impact investing to $1 billion by 2021 and were delighted to report that QBE became carbon neutral in 2018, in partnership with the Qantas Future Planet Program.
2019 outlookR E S U LT S F O C U S E D
1 Assumes risk-free rates as at 31 December 2018.
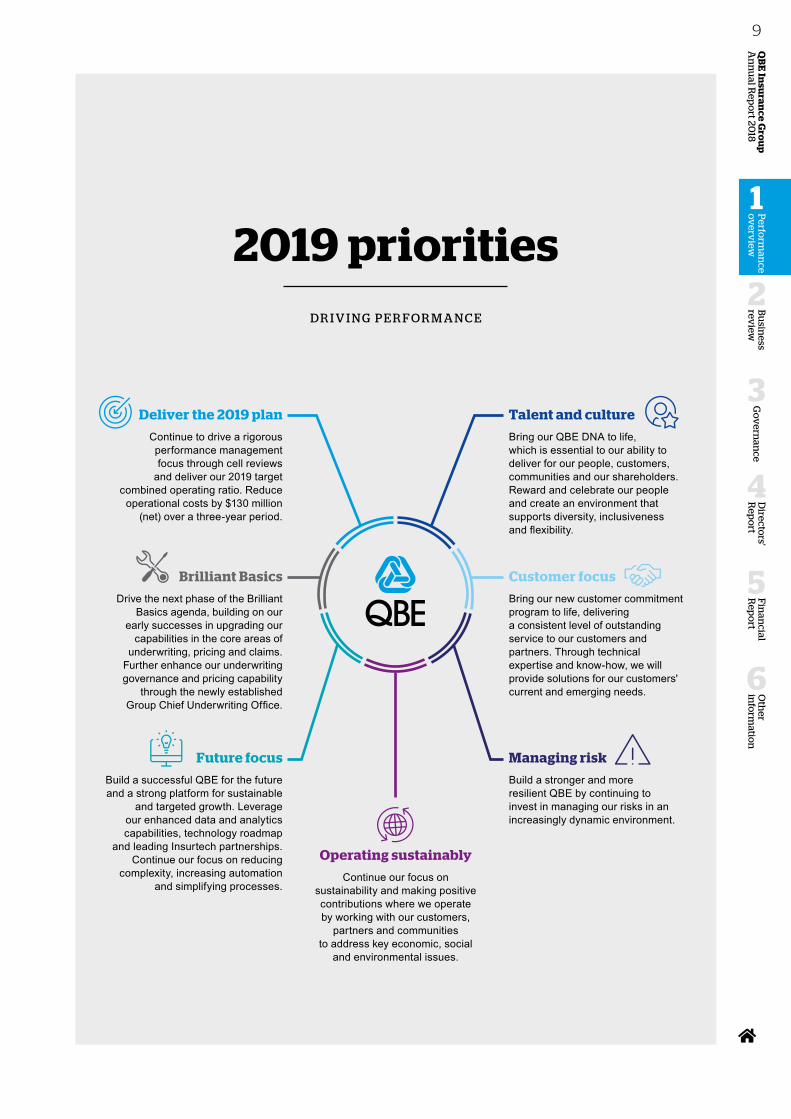
2019 prioritiesD R I V I N G P E R F O R M A N C E
Deliver the 2019 plan
Continue to drive a rigorous performance management focus through cell reviews
and deliver our 2019 target combined operating ratio. Reduce
operational costs by $130 million (net) over a three-year period.
Talent and culture
Bring our QBE DNA to life, which is essential to our ability to deliver for our people, customers, communities and our shareholders. Reward and celebrate our people and create an environment that supports diversity, inclusiveness and flexibility.
Future focus
Build a successful QBE for the future and a strong platform for sustainable
and targeted growth. Leverage our enhanced data and analytics capabilities, technology roadmap
and leading Insurtech partnerships. Continue our focus on reducing
complexity, increasing automation and simplifying processes.
Operating sustainably
Continue our focus on sustainability and making positive contributions where we operate by working with our customers,
partners and communities to address key economic, social
and environmental issues.
Managing risk
Build a stronger and more resilient QBE by continuing to invest in managing our risks in an increasingly dynamic environment.
Brilliant Basics
Drive the next phase of the Brilliant Basics agenda, building on our
early successes in upgrading our capabilities in the core areas of
underwriting, pricing and claims. Further enhance our underwriting governance and pricing capability
through the newly established Group Chief Underwriting Office.
Customer focus
Bring our new customer commitment program to life, delivering a consistent level of outstanding service to our customers and partners. Through technical expertise and know-how, we will provide solutions for our customers' current and emerging needs. O
ther
info
rmatio
n
6
Fin
ancial
Rep
ort
5
Bu
siness
review
2
Go
vern
ance
3
Directo
rs' R
epo
rt
4
QB
E In
suran
ce Gro
up
A
nn
ual R
epo
rt 2018
9P
erform
ance
ov
erview
1
10
Operating and financial review
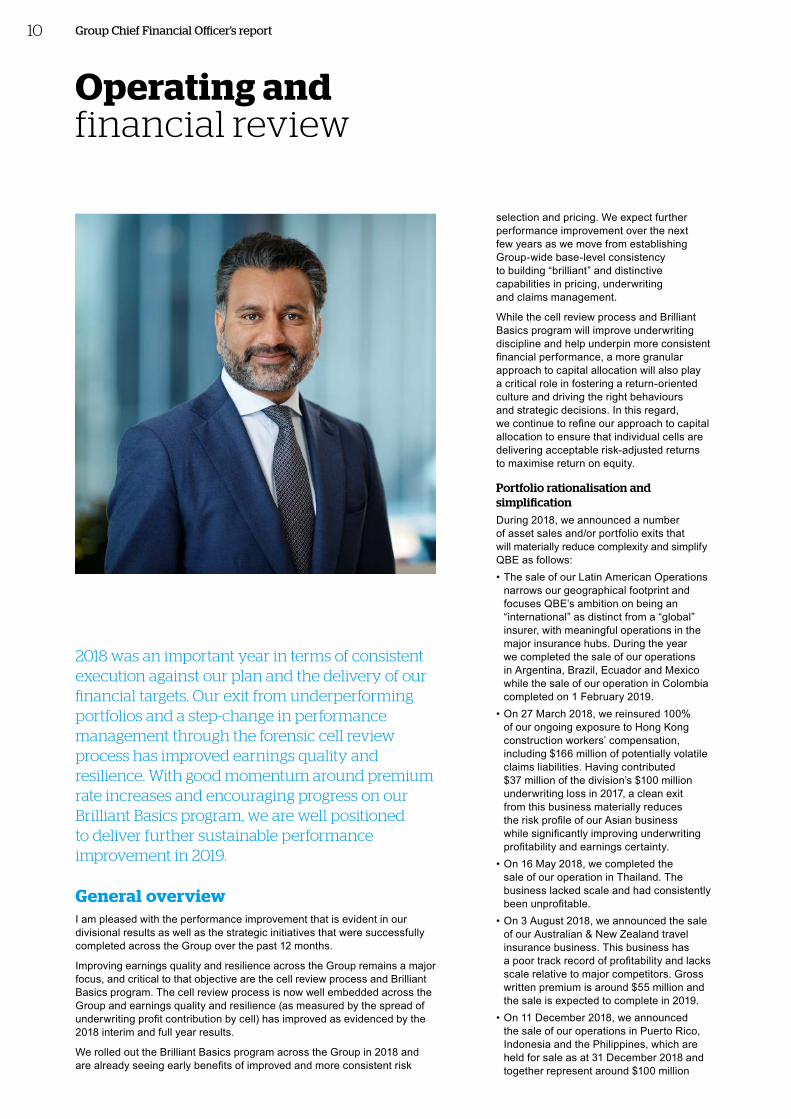
2018 was an important year in terms of consistent execution against our plan and the delivery of our financial targets. Our exit from underperforming portfolios and a step-change in performance management through the forensic cell review process has improved earnings quality and resilience. With good momentum around premium rate increases and encouraging progress on our Brilliant Basics program, we are well positioned to deliver further sustainable performance improvement in 2019.
General overviewI am pleased with the performance improvement that is evident in our divisional results as well as the strategic initiatives that were successfully completed across the Group over the past 12 months.
Improving earnings quality and resilience across the Group remains a major focus, and critical to that objective are the cell review process and Brilliant Basics program. The cell review process is now well embedded across the Group and earnings quality and resilience (as measured by the spread of underwriting profit contribution by cell) has improved as evidenced by the 2018 interim and full year results.
We rolled out the Brilliant Basics program across the Group in 2018 and are already seeing early benefits of improved and more consistent risk
selection and pricing. We expect further performance improvement over the next few years as we move from establishing Group-wide base-level consistency to building “brilliant” and distinctive capabilities in pricing, underwriting and claims management.
While the cell review process and Brilliant Basics program will improve underwriting discipline and help underpin more consistent financial performance, a more granular approach to capital allocation will also play a critical role in fostering a return-oriented culture and driving the right behaviours and strategic decisions. In this regard, we continue to refine our approach to capital allocation to ensure that individual cells are delivering acceptable risk-adjusted returns to maximise return on equity.
Portfolio rationalisation and simplification During 2018, we announced a number of asset sales and/or portfolio exits that will materially reduce complexity and simplify QBE as follows:• The sale of our Latin American Operations
narrows our geographical footprint and focuses QBE’s ambition on being an “international” as distinct from a “global” insurer, with meaningful operations in the major insurance hubs. During the year we completed the sale of our operations in Argentina, Brazil, Ecuador and Mexico while the sale of our operation in Colombia completed on 1 February 2019.
• On 27 March 2018, we reinsured 100% of our ongoing exposure to Hong Kong construction workers’ compensation, including $166 million of potentially volatile claims liabilities. Having contributed $37 million of the division’s $100 million underwriting loss in 2017, a clean exit from this business materially reduces the risk profile of our Asian business while significantly improving underwriting profitability and earnings certainty.
• On 16 May 2018, we completed the sale of our operation in Thailand. The business lacked scale and had consistently been unprofitable.
• On 3 August 2018, we announced the sale of our Australian & New Zealand travel insurance business. This business has a poor track record of profitability and lacks scale relative to major competitors. Gross written premium is around $55 million and the sale is expected to complete in 2019.
• On 11 December 2018, we announced the sale of our operations in Puerto Rico, Indonesia and the Philippines, which are held for sale as at 31 December 2018 and together represent around $100 million
Group Chief Financial Officer’s report
10
Operating and financial review
2018 was an important year in terms of consistent execution against our plan and the delivery of our financial targets. Our exit from underperforming portfolios and a step-change in performance management through the forensic cell review process has improved earnings quality and resilience. With good momentum around premium rate increases and encouraging progress on our Brilliant Basics program, we are well positioned to deliver further sustainable performance improvement in 2019.
General overviewI am pleased with the performance improvement that is evident in our divisional results as well as the strategic initiatives that were successfully completed across the Group over the past 12 months.
Improving earnings quality and resilience across the Group remains a major focus, and critical to that objective are the cell review process and Brilliant Basics program. The cell review process is now well embedded across the Group and earnings quality and resilience (as measured by the spread of underwriting profit contribution by cell) has improved as evidenced by the 2018 interim and full year results.
We rolled out the Brilliant Basics program across the Group in 2018 and are already seeing early benefits of improved and more consistent risk
selection and pricing. We expect further performance improvement over the next few years as we move from establishing Group-wide base-level consistency to building “brilliant” and distinctive capabilities in pricing, underwriting and claims management.
While the cell review process and Brilliant Basics program will improve underwriting discipline and help underpin more consistent financial performance, a more granular approach to capital allocation will also play a critical role in fostering a return-oriented culture and driving the right behaviours and strategic decisions. In this regard, we continue to refine our approach to capital allocation to ensure that individual cells are delivering acceptable risk-adjusted returns to maximise return on equity.
Portfolio rationalisation and simplification During 2018, we announced a number of asset sales and/or portfolio exits that will materially reduce complexity and simplify QBE as follows:• The sale of our Latin American Operations
narrows our geographical footprint and focuses QBE’s ambition on being an “international” as distinct from a “global” insurer, with meaningful operations in the major insurance hubs. During the year we completed the sale of our operations in Argentina, Brazil, Ecuador and Mexico while the sale of our operation in Colombia completed on 1 February 2019.
• On 27 March 2018, we reinsured 100% of our ongoing exposure to Hong Kong construction workers’ compensation, including $166 million of potentially volatile claims liabilities. Having contributed $37 million of the division’s $100 million underwriting loss in 2017, a clean exit from this business materially reduces the risk profile of our Asian business while significantly improving underwriting profitability and earnings certainty.
• On 16 May 2018, we completed the sale of our operation in Thailand. The business lacked scale and had consistently been unprofitable.
• On 3 August 2018, we announced the sale of our Australian & New Zealand travel insurance business. This business has a poor track record of profitability and lacks scale relative to major competitors. Gross written premium is around $55 million and the sale is expected to complete in 2019.
• On 11 December 2018, we announced the sale of our operations in Puerto Rico, Indonesia and the Philippines, which are held for sale as at 31 December 2018 and together represent around $100 million
Group Chief Financial Officer’s reportO
ther
info
rmatio
n
6
Fin
ancial
Rep
ort
5
Perfo
rman
ce o
verv
iew
1
Go
vern
ance
3
Directo
rs' R
epo
rt
4
QB
E In
suran
ce Gro
up
A
nn
ual R
epo
rt 2018
11B
usin
ess rev
iew
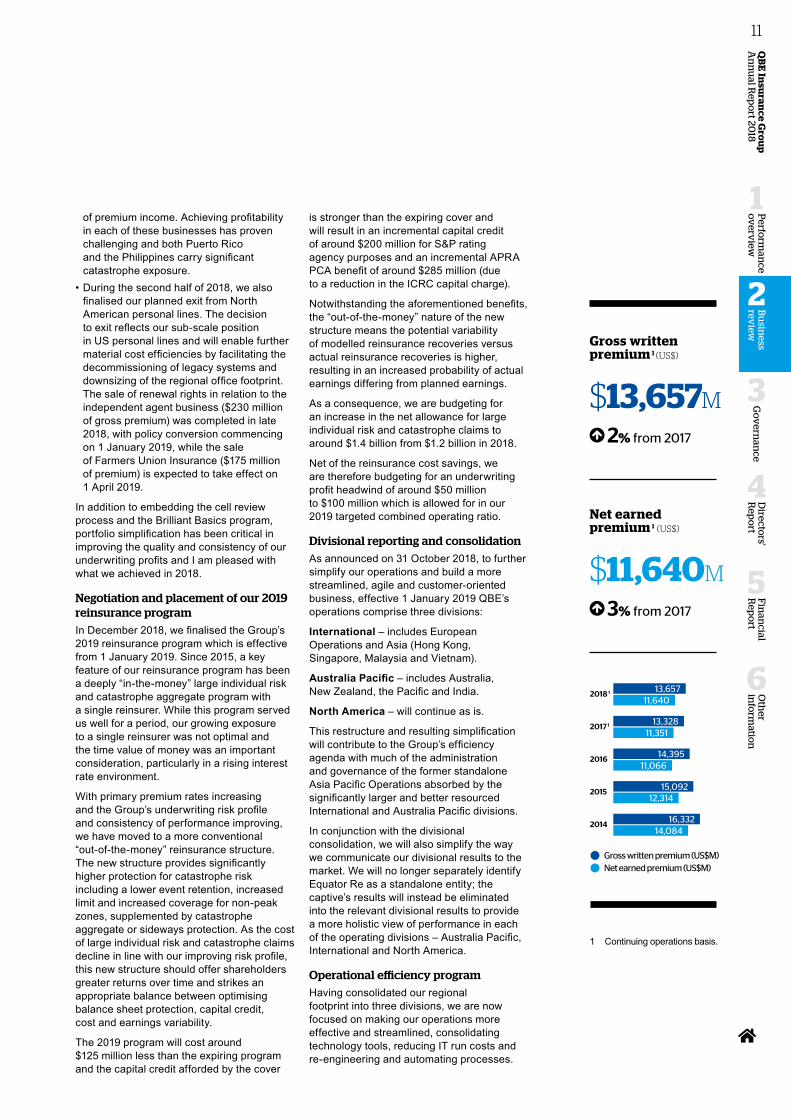
2Gross written premium 1 (US$)
$13,657M
2% from 2017
Net earned premium 1 (US$)
$11,640M
3% from 2017
of premium income. Achieving profitability in each of these businesses has proven challenging and both Puerto Rico and the Philippines carry significant catastrophe exposure.
• During the second half of 2018, we also finalised our planned exit from North American personal lines. The decision to exit reflects our sub-scale position in US personal lines and will enable further material cost efficiencies by facilitating the decommissioning of legacy systems and downsizing of the regional office footprint. The sale of renewal rights in relation to the independent agent business ($230 million of gross premium) was completed in late 2018, with policy conversion commencing on 1 January 2019, while the sale of Farmers Union Insurance ($175 million of premium) is expected to take effect on 1 April 2019.
In addition to embedding the cell review process and the Brilliant Basics program, portfolio simplification has been critical in improving the quality and consistency of our underwriting profits and I am pleased with what we achieved in 2018.
Negotiation and placement of our 2019 reinsurance programIn December 2018, we finalised the Group’s 2019 reinsurance program which is effective from 1 January 2019. Since 2015, a key feature of our reinsurance program has been a deeply “in-the-money” large individual risk and catastrophe aggregate program with a single reinsurer. While this program served us well for a period, our growing exposure to a single reinsurer was not optimal and the time value of money was an important consideration, particularly in a rising interest rate environment.
With primary premium rates increasing and the Group’s underwriting risk profile and consistency of performance improving, we have moved to a more conventional “out-of-the-money” reinsurance structure. The new structure provides significantly higher protection for catastrophe risk including a lower event retention, increased limit and increased coverage for non-peak zones, supplemented by catastrophe aggregate or sideways protection. As the cost of large individual risk and catastrophe claims decline in line with our improving risk profile, this new structure should offer shareholders greater returns over time and strikes an appropriate balance between optimising balance sheet protection, capital credit, cost and earnings variability.
The 2019 program will cost around $125 million less than the expiring program and the capital credit afforded by the cover
is stronger than the expiring cover and will result in an incremental capital credit of around $200 million for S&P rating agency purposes and an incremental APRA PCA benefit of around $285 million (due to a reduction in the ICRC capital charge).
Notwithstanding the aforementioned benefits, the “out-of-the-money” nature of the new structure means the potential variability of modelled reinsurance recoveries versus actual reinsurance recoveries is higher, resulting in an increased probability of actual earnings differing from planned earnings.
As a consequence, we are budgeting for an increase in the net allowance for large individual risk and catastrophe claims to around $1.4 billion from $1.2 billion in 2018.
Net of the reinsurance cost savings, we are therefore budgeting for an underwriting profit headwind of around $50 million to $100 million which is allowed for in our 2019 targeted combined operating ratio.
Divisional reporting and consolidationAs announced on 31 October 2018, to further simplify our operations and build a more streamlined, agile and customer-oriented business, effective 1 January 2019 QBE’s operations comprise three divisions:
International – includes European Operations and Asia (Hong Kong, Singapore, Malaysia and Vietnam).
Australia Pacific – includes Australia, New Zealand, the Pacific and India.
North America – will continue as is.
This restructure and resulting simplification will contribute to the Group’s efficiency agenda with much of the administration and governance of the former standalone Asia Pacific Operations absorbed by the significantly larger and better resourced International and Australia Pacific divisions.
In conjunction with the divisional consolidation, we will also simplify the way we communicate our divisional results to the market. We will no longer separately identify Equator Re as a standalone entity; the captive’s results will instead be eliminated into the relevant divisional results to provide a more holistic view of performance in each of the operating divisions – Australia Pacific, International and North America.
Operational efficiency programHaving consolidated our regional footprint into three divisions, we are now focused on making our operations more effective and streamlined, consolidating technology tools, reducing IT run costs and re-engineering and automating processes.
2014
2015
2016
2017 1
2018 1
Gross written premium (US$M)Net earned premium (US$M)
11,64013,657
13,32811,351
14,39511,066
15,09212,314
16,33214,084
1 Continuing operations basis.
12
1 Excludes transaction to reinsure Hong Kong construction workers’ compensation liabilities.2 Continuing operations basis.3 Excludes one-off impact on the Group’s underwriting result due to the Ogden decision in the UK.4 Excludes a $700 million non-cash goodwill impairment charge and a $230 million non-cash write-down of deferred tax assets.5 Excludes transaction to reinsure US liabilities.6 Excludes the impact of changes in risk-free rates used to discount net outstanding claims.
With that in mind, we recently embarked on a three-year operational efficiency program targeting more than $200 million of gross cost savings by 2021 translating into net savings of $130 million over the same time horizon after underlying inflation and further investment in the Brilliant Basics program, technology and digitisation. From our 2018 cost base of $1.8 billion and an expense ratio of 15.2% 1,2, we are targeting an expense ratio of less than 14% by 2021, inclusive of the benefit of very modest and selective premium growth.
The financial impact of efficiency benefits will be relatively modest in 2019 reflecting the earning of net cost savings of around $40 million while net earned premium will reflect the full year impact of previously discussed disposals. At the same time, we expect to incur one-off restructuring costs in 2019 that will not be reported as part of our underwriting results.
Our exit from underperforming portfolios, momentum around premium rates and underwriting performance improvement, the successful placement of our 2019 reinsurance program and the commencement of our new efficiency program position us well to deliver further sustainable performance improvement in 2019.
2018 full year resultWith respect to the recently announced 2018 full year result, I would like to discuss three broad areas:
1. Financial performance.2. Investment performance and strategy.
3. Financial strength and capital management.
1. Financial performanceQBE reported a statutory net profit after tax of $390 million, a significant turnaround from a net loss of $1,249 million in 2017, while cash profit after tax also rebounded strongly to $715 million from a loss of $262 million in the prior year.
Adjusted net profit after tax recovered to $420 million 1 from a net loss of $228 million 3,4,5 in 2017, reflecting significantly improved underwriting profitability partly offset by weaker investment returns.
The Group’s combined operating ratio improved to 95.7% 1,2,6 from 103.9% 2,3,5,6 in the prior year, primarily due to a significant improvement in the attritional claims ratio and a reduction in catastrophe claims following record industry losses in 2017.
Looking briefly at divisional performance, the key themes to emerge from the 2018 result are set out below:
Improved performance in North America after a difficult 2017North American Operations reported an improved combined operating ratio of 97.9% 6 compared with 109.1% 5,6 in the prior year.
While catastrophe experience improved significantly from the record levels experienced in the prior year, 2018 was still an above average year impacted by multiple hurricanes and wildfires.
The combined operating ratio also benefited from a 2.8% (excluding Crop) improvement in the attritional claims ratio reflecting more granular performance management driven by the cell review process coupled with early benefits from the Brilliant Basics program including improved risk selection and enhanced pricing capability.
Disciplined performance management and enhanced pricing capability contributed to an average premium rate increase of 4.1% compared with 0.7% in the prior year.
Good progress on Asia Pacific remediation with a return to underwriting profit in the second half of 2018Asia Pacific Operations finished the year strongly with a combined operating ratio of 104.2% 1,6 compared with 115.5% 6 in the prior year and 108.5% 1,6 in the first half of 2018, underpinned by a 5.0% improvement in the attritional claims ratio. Performance improvement gathered momentum as the year progressed culminating in a return to underwriting profitability in the second half with a combined operating ratio of 99.5% 1,6.
Premium income contracted 15% on a constant currency basis reflecting aggressive remediation including the sale of our business in Thailand, exiting Hong Kong construction workers’ compensation and the shedding of significant higher hazard marine, property and engineering business, particularly in Hong Kong, Singapore and Indonesia.
While key insurance markets remain competitive, Asia Pacific Operations achieved an average premium rate increase of 1.0% compared with a reduction of 2.3% in the prior period.
Group Chief Financial Officer’s report
12
1 Excludes transaction to reinsure Hong Kong construction workers’ compensation liabilities.2 Continuing operations basis.3 Excludes one-off impact on the Group’s underwriting result due to the Ogden decision in the UK.4 Excludes a $700 million non-cash goodwill impairment charge and a $230 million non-cash write-down of deferred tax assets.5 Excludes transaction to reinsure US liabilities.6 Excludes the impact of changes in risk-free rates used to discount net outstanding claims.
With that in mind, we recently embarked on a three-year operational efficiency program targeting more than $200 million of gross cost savings by 2021 translating into net savings of $130 million over the same time horizon after underlying inflation and further investment in the Brilliant Basics program, technology and digitisation. From our 2018 cost base of $1.8 billion and an expense ratio of 15.2% 1,2, we are targeting an expense ratio of less than 14% by 2021, inclusive of the benefit of very modest and selective premium growth.
The financial impact of efficiency benefits will be relatively modest in 2019 reflecting the earning of net cost savings of around $40 million while net earned premium will reflect the full year impact of previously discussed disposals. At the same time, we expect to incur one-off restructuring costs in 2019 that will not be reported as part of our underwriting results.
Our exit from underperforming portfolios, momentum around premium rates and underwriting performance improvement, the successful placement of our 2019 reinsurance program and the commencement of our new efficiency program position us well to deliver further sustainable performance improvement in 2019.
2018 full year resultWith respect to the recently announced 2018 full year result, I would like to discuss three broad areas:
1. Financial performance.2. Investment performance and strategy.
3. Financial strength and capital management.
1. Financial performanceQBE reported a statutory net profit after tax of $390 million, a significant turnaround from a net loss of $1,249 million in 2017, while cash profit after tax also rebounded strongly to $715 million from a loss of $262 million in the prior year.
Adjusted net profit after tax recovered to $420 million 1 from a net loss of $228 million 3,4,5 in 2017, reflecting significantly improved underwriting profitability partly offset by weaker investment returns.
The Group’s combined operating ratio improved to 95.7% 1,2,6 from 103.9% 2,3,5,6 in the prior year, primarily due to a significant improvement in the attritional claims ratio and a reduction in catastrophe claims following record industry losses in 2017.
Looking briefly at divisional performance, the key themes to emerge from the 2018 result are set out below:
Improved performance in North America after a difficult 2017North American Operations reported an improved combined operating ratio of 97.9% 6 compared with 109.1% 5,6 in the prior year.
While catastrophe experience improved significantly from the record levels experienced in the prior year, 2018 was still an above average year impacted by multiple hurricanes and wildfires.
The combined operating ratio also benefited from a 2.8% (excluding Crop) improvement in the attritional claims ratio reflecting more granular performance management driven by the cell review process coupled with early benefits from the Brilliant Basics program including improved risk selection and enhanced pricing capability.
Disciplined performance management and enhanced pricing capability contributed to an average premium rate increase of 4.1% compared with 0.7% in the prior year.
Good progress on Asia Pacific remediation with a return to underwriting profit in the second half of 2018Asia Pacific Operations finished the year strongly with a combined operating ratio of 104.2% 1,6 compared with 115.5% 6 in the prior year and 108.5% 1,6 in the first half of 2018, underpinned by a 5.0% improvement in the attritional claims ratio. Performance improvement gathered momentum as the year progressed culminating in a return to underwriting profitability in the second half with a combined operating ratio of 99.5% 1,6.
Premium income contracted 15% on a constant currency basis reflecting aggressive remediation including the sale of our business in Thailand, exiting Hong Kong construction workers’ compensation and the shedding of significant higher hazard marine, property and engineering business, particularly in Hong Kong, Singapore and Indonesia.
While key insurance markets remain competitive, Asia Pacific Operations achieved an average premium rate increase of 1.0% compared with a reduction of 2.3% in the prior period.
Group Chief Financial Officer’s reportO
ther
info
rmatio
n
6
Fin
ancial
Rep
ort
5
Perfo
rman
ce o
verv
iew
1
Go
vern
ance
3
Directo
rs' R
epo
rt
4
QB
E In
suran
ce Gro
up
A
nn
ual R
epo
rt 2018
13B
usin
ess rev
iew
2
1 Excludes the impact of changes in risk-free rates used to discount net outstanding claims.2 Excludes one-off impact on the Group’s underwriting result due to the Ogden decision in the UK.3 Excludes premium rate changes relating to CTP.4 Assumes risk-free rates as at 31 December 2018.
European Operations’ improved current accident year profitability underpinned by a lower attritional claims ratioEuropean Operations recorded another strong result with the combined operating ratio improving to 94.8% 1 from 95.2% 1,2 in the prior year due to a 2.8% improvement in the attritional claims ratio which more than offset a reduced level of positive prior accident year claims development.
While competition remains intense as evidenced by lower new business volumes, the soft pricing cycle has abated with an average premium rate increase of 4.4% representing a welcome turnaround from the 0.2% average premium rate reduction in the prior year. Although remaining vigilant with respect to underwriting discipline, gross written premium grew 6% on a constant currency basis indicating modest but pleasing volume growth.
Given significant uncertainty surrounding Brexit, it is comforting to report that we now have a fully operational and well-capitalised insurance and reinsurance company located in Belgium and successfully renewed our existing business in continental Europe at the recently completed 1 January 2019 renewals.
Further improvement in Australian & New Zealand Operations’ result quality and strong pricing momentum Despite further moderation in lenders’ mortgage insurance (LMI) earnings and the level of positive prior accident year claims development, Australian & New Zealand Operations’ performance continues to improve with the division recording a combined operating ratio of 91.9% 1, underpinned by a 2.9% (excluding LMI) improvement in the attritional claims ratio. The cell review discipline coupled with early benefits of the Brilliant Basics program contributed to a meaningful improvement in earnings quality and resilience (as measured by the spread of underwriting profit contribution by cell).
The combined operating ratio of our LMI business increased as a result of higher net commissions due to revised reinsurance and a lengthening of the assumed premium earning pattern in light of slower claims emergence. Despite some reduction in property prices, lending practices continue to improve and arrears rates are trending broadly in line with expectations. We have taken the opportunity to purchase 30% quota share reinsurance on the 2019 underwriting year from a panel of external reinsurers on favourable terms.
Pricing momentum accelerated as the year progressed (from already strong levels) with premium rate increases averaging 7.3% 3 across 2018 compared with 6.1% 3 in the prior period and 6.6% 3 in the first half of 2018.
2. Investment performance and strategyOur investment portfolio delivered a net investment yield of 2.2% compared with 3.1% in the prior year. This was at the bottom end of our 2.25%–2.75% target range reflecting especially volatile markets in the final quarter of 2018.
Fixed income assets generated a 1.8% return compared with 2.0% in the prior year. Returns were adversely impacted by higher US Treasury yields and wider global credit spreads. Growth asset returns moderated to 6.2% from 13.3% in the prior year.
Active duration management enhanced fixed income returns. While yields rose during the first half of 2018 we held duration around 1.5 years thereby minimising mark-to-market capital losses. During the second half, we extended duration to 2.1 years enabling us to capture more of the December global bond market rally. During December we also took advantage of the equity market weakness and increased our exposure to growth assets which finished the year at 13.7% of total cash and investments.
As at 31 December 2018, the running yield of the fixed income portfolio was 2.2%, up from 1.7% a year earlier. During 2019, we intend to manage fixed income duration in a 2.0–2.5 year range and growth assets within a 10%–15% range of total cash and investments which together should support our 2019 net investment return target range of 3.0%–3.5% 4.
3. Financial strength and capital managementThe Group’s capital position remains strong when measured against both regulatory and rating agency capital requirements. Our APRA PCA multiple increased to 1.78x from 1.64x at 31 December 2017 and the excess above Standard & Poor’s (S&P) ‘AA’ minimum capital levels increased.
Our improved capital strength reflects stronger earnings for 2018, the benefit of de-risking initiatives undertaken during the year (such as the disposal of non-core businesses and a reduction in our catastrophe exposure) and a material reduction in insurance risk charges due to the more traditional reinsurance program effective 1 January 2019. These positive impacts were partly offset by capital management initiatives and by the stronger US dollar which adversely impacted reported shareholders’ funds.
As announced in February 2017, QBE established a three-year cumulative on-market share buyback facility of up to A$1 billion, with a target of acquiring not more than A$333 million in any one calendar year. During 2018, QBE purchased A$333 million of QBE shares resulting in the cancellation of 31.3 million shares or 2.2% of issued capital. Since commencement of the buyback, QBE has purchased A$472 million of QBE shares resulting in the cancellation of 44.2 million shares or 3.2% of issued capital.
At 31 December 2018, QBE’s debt to equity ratio was 38.0%, down from 40.8% at 31 December 2017 and slightly above the benchmark range of 25%–35%, reflecting the debt buybacks undertaken during the first half of 2018, which were partly offset by the impact of the stronger US dollar and the share buyback.
The probability of adequacy (PoA) of outstanding claims was broadly stable at 90.1%, around the mid-point of our targeted PoA range of 87.5%–92.5%.
14
Operating and financial performance
Summary income statement
STATUTORY RESULT ADJUSTMENTS ADJUSTED RESULT
FOR THE YEAR ENDED 31 DECEMBER 2018 2017 2018 2017 2018 1 2017 2,3,4
US$M US$M US$M US$M US$M US$M
Gross written premium 13,657 13,328 – – 13,657 13,328 Gross earned premium 13,601 13,611 – – 13,601 13,611 Net earned premium 11,640 11,351 190 417 11,830 11,768 Net claims expense (7,405) (8,114) (166) (297) (7,571) (8,411)Net commission (1,957) (1,938) 6 – (1,951) (1,938)Underwriting and other expenses (1,798) (1,806) 5 2 (1,793) (1,804)Underwriting result 480 (507) 35 122 515 (385) Net investment income on policyholders’ funds 346 447 – – 346 447 Insurance profit (loss) 826 (60) 35 122 861 62 Net investment income on shareholders’ funds 201 311 – – 201 311 Financing and other costs (305) (302) – – (305) (302)Gains (losses) on sale of entities and businesses 12 (1) – – 12 (1) Unrealised losses on assets held for sale (25) – – – (25) – Share of net losses of associates (2) (1) – – (2) (1) Amortisation and impairment of intangibles (80) (740) – 700 (80) (40)Profit (loss) before income tax from continuing operations 627 (793) 35 822 662 29 Income tax expense (72) (423) (5) 199 (77) (224)Profit (loss) after income tax from continuing operations 555 (1,216) 30 1,021 585 (195) Loss after income tax from discontinued operations (177) (37) – – (177) (37)Non-controlling interests 12 4 – – 12 4 Net profit (loss) after income tax 390 (1,249) 30 1,021 420 (228)
1 Excludes transaction to reinsure Hong Kong construction workers’ compensation liabilities.2 Excludes one-off impact on the Group’s underwriting result due to the Ogden decision in the UK.3 Excludes transaction to reinsure US liabilities.4 Excludes a $700 million non-cash goodwill impairment charge and a $230 million non-cash write-down of deferred tax assets.
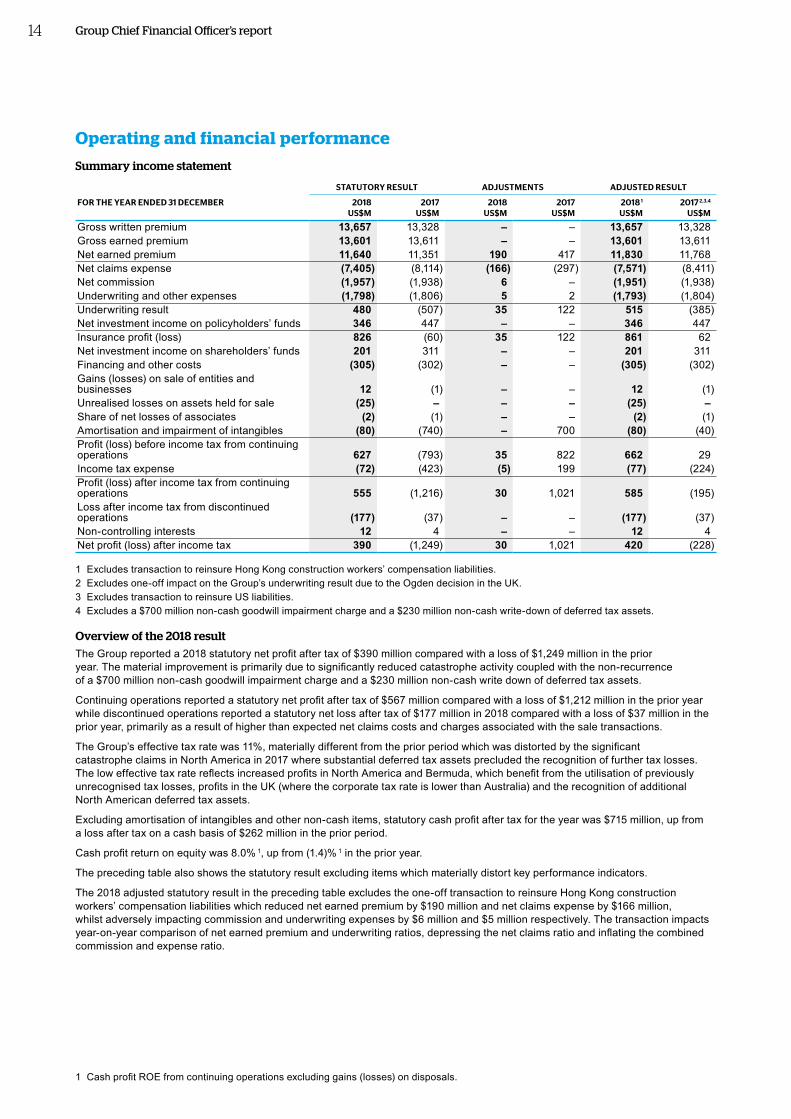
Overview of the 2018 resultThe Group reported a 2018 statutory net profit after tax of $390 million compared with a loss of $1,249 million in the prior year. The material improvement is primarily due to significantly reduced catastrophe activity coupled with the non-recurrence of a $700 million non-cash goodwill impairment charge and a $230 million non-cash write down of deferred tax assets.
Continuing operations reported a statutory net profit after tax of $567 million compared with a loss of $1,212 million in the prior year while discontinued operations reported a statutory net loss after tax of $177 million in 2018 compared with a loss of $37 million in the prior year, primarily as a result of higher than expected net claims costs and charges associated with the sale transactions.
The Group’s effective tax rate was 11%, materially different from the prior period which was distorted by the significant catastrophe claims in North America in 2017 where substantial deferred tax assets precluded the recognition of further tax losses. The low effective tax rate reflects increased profits in North America and Bermuda, which benefit from the utilisation of previously unrecognised tax losses, profits in the UK (where the corporate tax rate is lower than Australia) and the recognition of additional North American deferred tax assets.
Excluding amortisation of intangibles and other non-cash items, statutory cash profit after tax for the year was $715 million, up from a loss after tax on a cash basis of $262 million in the prior period.
Cash profit return on equity was 8.0% 1, up from (1.4)% 1 in the prior year.
The preceding table also shows the statutory result excluding items which materially distort key performance indicators.
The 2018 adjusted statutory result in the preceding table excludes the one-off transaction to reinsure Hong Kong construction workers’ compensation liabilities which reduced net earned premium by $190 million and net claims expense by $166 million, whilst adversely impacting commission and underwriting expenses by $6 million and $5 million respectively. The transaction impacts year-on-year comparison of net earned premium and underwriting ratios, depressing the net claims ratio and inflating the combined commission and expense ratio.
1 Cash profit ROE from continuing operations excluding gains (losses) on disposals.
Group Chief Financial Officer’s report
14
Operating and financial performance
Summary income statement
STATUTORY RESULT ADJUSTMENTS ADJUSTED RESULT
FOR THE YEAR ENDED 31 DECEMBER 2018 2017 2018 2017 2018 1 2017 2,3,4
US$M US$M US$M US$M US$M US$M
Gross written premium 13,657 13,328 – – 13,657 13,328 Gross earned premium 13,601 13,611 – – 13,601 13,611 Net earned premium 11,640 11,351 190 417 11,830 11,768 Net claims expense (7,405) (8,114) (166) (297) (7,571) (8,411)Net commission (1,957) (1,938) 6 – (1,951) (1,938)Underwriting and other expenses (1,798) (1,806) 5 2 (1,793) (1,804)Underwriting result 480 (507) 35 122 515 (385) Net investment income on policyholders’ funds 346 447 – – 346 447 Insurance profit (loss) 826 (60) 35 122 861 62 Net investment income on shareholders’ funds 201 311 – – 201 311 Financing and other costs (305) (302) – – (305) (302)Gains (losses) on sale of entities and businesses 12 (1) – – 12 (1) Unrealised losses on assets held for sale (25) – – – (25) – Share of net losses of associates (2) (1) – – (2) (1) Amortisation and impairment of intangibles (80) (740) – 700 (80) (40)Profit (loss) before income tax from continuing operations 627 (793) 35 822 662 29 Income tax expense (72) (423) (5) 199 (77) (224)Profit (loss) after income tax from continuing operations 555 (1,216) 30 1,021 585 (195) Loss after income tax from discontinued operations (177) (37) – – (177) (37)Non-controlling interests 12 4 – – 12 4 Net profit (loss) after income tax 390 (1,249) 30 1,021 420 (228)
1 Excludes transaction to reinsure Hong Kong construction workers’ compensation liabilities.2 Excludes one-off impact on the Group’s underwriting result due to the Ogden decision in the UK.3 Excludes transaction to reinsure US liabilities.4 Excludes a $700 million non-cash goodwill impairment charge and a $230 million non-cash write-down of deferred tax assets.
Overview of the 2018 resultThe Group reported a 2018 statutory net profit after tax of $390 million compared with a loss of $1,249 million in the prior year. The material improvement is primarily due to significantly reduced catastrophe activity coupled with the non-recurrence of a $700 million non-cash goodwill impairment charge and a $230 million non-cash write down of deferred tax assets.
Continuing operations reported a statutory net profit after tax of $567 million compared with a loss of $1,212 million in the prior year while discontinued operations reported a statutory net loss after tax of $177 million in 2018 compared with a loss of $37 million in the prior year, primarily as a result of higher than expected net claims costs and charges associated with the sale transactions.
The Group’s effective tax rate was 11%, materially different from the prior period which was distorted by the significant catastrophe claims in North America in 2017 where substantial deferred tax assets precluded the recognition of further tax losses. The low effective tax rate reflects increased profits in North America and Bermuda, which benefit from the utilisation of previously unrecognised tax losses, profits in the UK (where the corporate tax rate is lower than Australia) and the recognition of additional North American deferred tax assets.
Excluding amortisation of intangibles and other non-cash items, statutory cash profit after tax for the year was $715 million, up from a loss after tax on a cash basis of $262 million in the prior period.
Cash profit return on equity was 8.0% 1, up from (1.4)% 1 in the prior year.
The preceding table also shows the statutory result excluding items which materially distort key performance indicators.
The 2018 adjusted statutory result in the preceding table excludes the one-off transaction to reinsure Hong Kong construction workers’ compensation liabilities which reduced net earned premium by $190 million and net claims expense by $166 million, whilst adversely impacting commission and underwriting expenses by $6 million and $5 million respectively. The transaction impacts year-on-year comparison of net earned premium and underwriting ratios, depressing the net claims ratio and inflating the combined commission and expense ratio.
1 Cash profit ROE from continuing operations excluding gains (losses) on disposals.
Group Chief Financial Officer’s reportO
ther
info
rmatio
n
6
Fin
ancial
Rep
ort
5
Perfo
rman
ce o
verv
iew
1
Go
vern
ance
3
Directo
rs' R
epo
rt
4
QB
E In
suran
ce Gro
up
A
nn
ual R
epo
rt 2018
15B
usin
ess rev
iew
2
The 2017 adjusted statutory result in the preceding table is similarly presented after excluding:• a $139 million increase in the Group’s net central estimate of outstanding claims reflecting the increase in the statutory discount
rates applicable to UK personal injury liabilities (the Ogden decision) and a related $2 million reinsurance charge with an associated $31 million tax benefit;
• a transaction to reinsure US commercial auto run-off liabilities which reduced net earned premium by $415 million and net claims expense by $436 million while adversely impacting underwriting expenses by $2 million;
• a $700 million non-cash impairment charge pertaining to the carrying value of North American Operations’ goodwill; and• a $230 million non-cash write-down of the deferred tax asset in our North American Operations following the enacted reduction
in the US corporate tax rate to 21% from 35%.
The underwriting results in the preceding table are also presented on a continuing operations basis with the results of our Latin American Operations presented separately as discontinued operations for both the current and prior year.
Further details of the Group’s disposal activities are set out in note 7.1 to the financial statements.
Unless otherwise stated, the commentary following refers to the Group’s result on the basis described above.
The Group reported a 2018 adjusted net profit after tax of $420 million compared with a loss of $228 million in the prior year, including a profit after tax from continuing operations of $597 million compared with a loss of $191 million in the prior year.
On a constant currency basis, gross written premium increased by 3% reflecting premium rate driven growth in North American, European and Australian & New Zealand Operations, largely offset by a remediation-driven reduction in Asia Pacific Operations and a significant reduction in NSW CTP premium following recent legislative reform. On the same basis, net earned premium increased by 0.6% relative to the prior period.
The combined operating ratio improved to 95.7% 1 from 103.9% 1 in the prior year, primarily reflecting significantly reduced catastrophe activity and a strong improvement in the attritional claims ratio.
The net investment return on policyholders’ funds fell to 2.3% from 2.9% in the prior year, contributing 2.9% to the insurance profit margin compared with 3.8% in 2017. While returns on fixed income assets were marginally lower reflecting mark-to-market losses on sovereign and corporate bonds, growth asset returns were substantially down on the prior year.
The Group reported an insurance profit of $861 million, up substantially from $62 million in the prior year, with significantly improved underwriting profitability partly offset by lower investment income. The insurance profit margin increased to 7.3% from 0.5% in 2017.
Consistent with the reduction in investment income on policyholders’ funds, investment income on shareholders’ funds was significantly lower at $201 million compared with $311 million in 2017.
Financing and other costs increased slightly to $305 million from $302 million in the prior year. While the prior year included the net cost of the class action, the current year included significant costs associated with foreign exchange contracts coupled with other one-off costs. The Group’s cost of borrowings reduced to $205 million from $212 million in the prior year.
1 Excludes the impact of changes in risk-free rates used to discount net outstanding claims.
Reconciliation of cash profit 1
FOR THE YEAR ENDED 31 DECEMBER 2018 US$M
2017 US$M
Profit (loss) after tax from continuing operations including NCI 555 (1,216)Loss attributable to non-controlling interests (NCI) 12 4Profit (loss) after tax from continuing operations 567 (1,212)Discontinued operationsOperating loss from discontinued operations after tax (57) (32)Gain on sale of discontinued operations after tax 97 (5)Reclassification of foreign currency translation reserve 2 (217) –Loss after tax from discontinued operations (177) (37)Net profit (loss) after tax 390 (1,249)Amortisation and impairment of intangibles after tax 3 108 757Reclassification of foreign currency translation reserve 2 217 –Write down of deferred tax asset – 230Net cash profit (loss) after tax 715 (262) Return on average shareholders’ funds – cash basis (%) 8.0 4 (1.4) 4
Basic earnings per share – cash basis (US cents) 53.1 (18.9) 5 Dividend payout ratio (percentage of cash profit) 6 70% na
1 Cash profit is presented on a statutory basis.2 The sale of operations in Argentina, Brazil, Ecuador and Mexico gave rise to a foreign currency translation reserve (FCTR) reclassification
charge (out of equity into the profit or loss statement). This is a non-cash item and does not impact shareholders’ funds or QBE’s regulatory or rating agency capital base. Refer Note 7.1.1 for further details.
3 $33 million of pre-tax amortisation expense is included in underwriting expenses (2017 $29 million).4 Cash profit ROE from continuing operations excluding gains (losses) on disposals.5 As previously reported.6 Dividend payout ratio is calculated as the total AUD dividend divided by cash profit converted to AUD at the average rate of exchange
for the period.
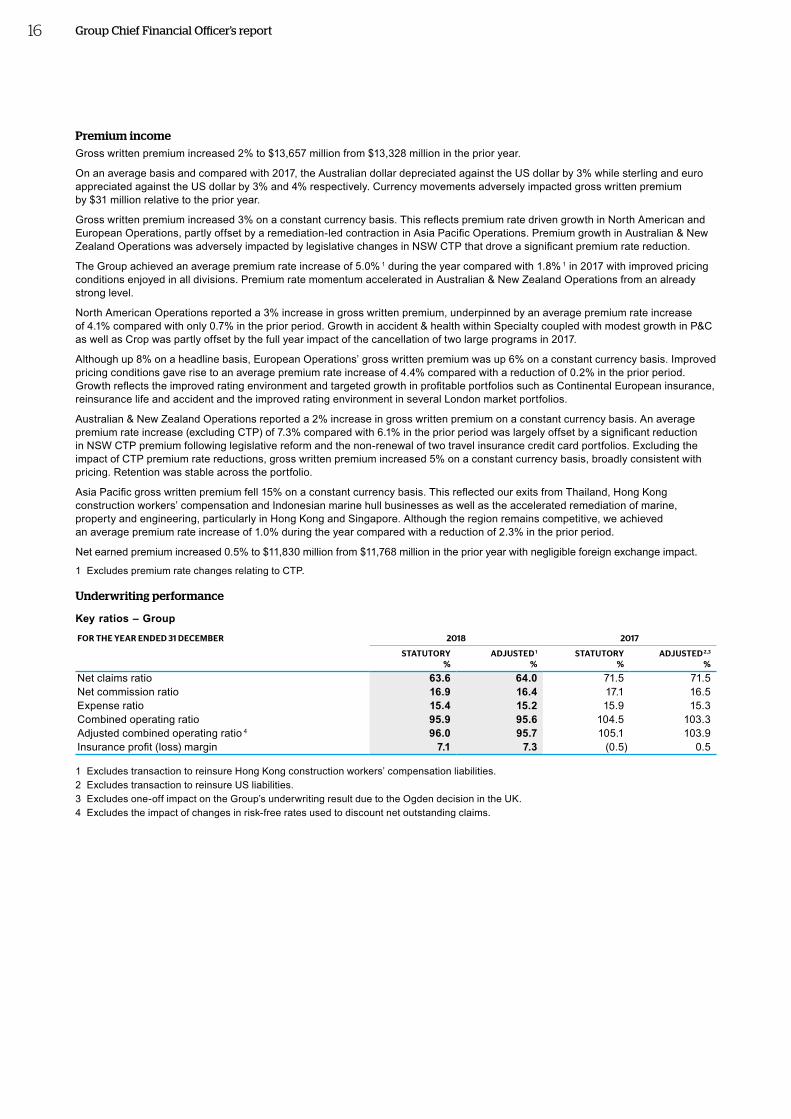
16
Premium incomeGross written premium increased 2% to $13,657 million from $13,328 million in the prior year.
On an average basis and compared with 2017, the Australian dollar depreciated against the US dollar by 3% while sterling and euro appreciated against the US dollar by 3% and 4% respectively. Currency movements adversely impacted gross written premium by $31 million relative to the prior year.
Gross written premium increased 3% on a constant currency basis. This reflects premium rate driven growth in North American and European Operations, partly offset by a remediation-led contraction in Asia Pacific Operations. Premium growth in Australian & New Zealand Operations was adversely impacted by legislative changes in NSW CTP that drove a significant premium rate reduction.
The Group achieved an average premium rate increase of 5.0% 1 during the year compared with 1.8% 1 in 2017 with improved pricing conditions enjoyed in all divisions. Premium rate momentum accelerated in Australian & New Zealand Operations from an already strong level.
North American Operations reported a 3% increase in gross written premium, underpinned by an average premium rate increase of 4.1% compared with only 0.7% in the prior period. Growth in accident & health within Specialty coupled with modest growth in P&C as well as Crop was partly offset by the full year impact of the cancellation of two large programs in 2017.
Although up 8% on a headline basis, European Operations’ gross written premium was up 6% on a constant currency basis. Improved pricing conditions gave rise to an average premium rate increase of 4.4% compared with a reduction of 0.2% in the prior period. Growth reflects the improved rating environment and targeted growth in profitable portfolios such as Continental European insurance, reinsurance life and accident and the improved rating environment in several London market portfolios.
Australian & New Zealand Operations reported a 2% increase in gross written premium on a constant currency basis. An average premium rate increase (excluding CTP) of 7.3% compared with 6.1% in the prior period was largely offset by a significant reduction in NSW CTP premium following legislative reform and the non-renewal of two travel insurance credit card portfolios. Excluding the impact of CTP premium rate reductions, gross written premium increased 5% on a constant currency basis, broadly consistent with pricing. Retention was stable across the portfolio.
Asia Pacific gross written premium fell 15% on a constant currency basis. This reflected our exits from Thailand, Hong Kong construction workers’ compensation and Indonesian marine hull businesses as well as the accelerated remediation of marine, property and engineering, particularly in Hong Kong and Singapore. Although the region remains competitive, we achieved an average premium rate increase of 1.0% during the year compared with a reduction of 2.3% in the prior period.
Net earned premium increased 0.5% to $11,830 million from $11,768 million in the prior year with negligible foreign exchange impact.
1 Excludes premium rate changes relating to CTP.
Underwriting performance
Key ratios – Group
FOR THE YEAR ENDED 31 DECEMBER 2018 2017
STATUTORY ADJUSTED 1 STATUTORY ADJUSTED 2,3
% % % %
Net claims ratio 63.6 64.0 71.5 71.5 Net commission ratio 16.9 16.4 17.1 16.5 Expense ratio 15.4 15.2 15.9 15.3 Combined operating ratio 95.9 95.6 104.5 103.3 Adjusted combined operating ratio 4 96.0 95.7 105.1 103.9 Insurance profit (loss) margin 7.1 7.3 (0.5) 0.5
1 Excludes transaction to reinsure Hong Kong construction workers’ compensation liabilities.2 Excludes transaction to reinsure US liabilities.3 Excludes one-off impact on the Group’s underwriting result due to the Ogden decision in the UK.4 Excludes the impact of changes in risk-free rates used to discount net outstanding claims.
Group Chief Financial Officer’s report

16
Premium incomeGross written premium increased 2% to $13,657 million from $13,328 million in the prior year.
On an average basis and compared with 2017, the Australian dollar depreciated against the US dollar by 3% while sterling and euro appreciated against the US dollar by 3% and 4% respectively. Currency movements adversely impacted gross written premium by $31 million relative to the prior year.
Gross written premium increased 3% on a constant currency basis. This reflects premium rate driven growth in North American and European Operations, partly offset by a remediation-led contraction in Asia Pacific Operations. Premium growth in Australian & New Zealand Operations was adversely impacted by legislative changes in NSW CTP that drove a significant premium rate reduction.
The Group achieved an average premium rate increase of 5.0% 1 during the year compared with 1.8% 1 in 2017 with improved pricing conditions enjoyed in all divisions. Premium rate momentum accelerated in Australian & New Zealand Operations from an already strong level.
North American Operations reported a 3% increase in gross written premium, underpinned by an average premium rate increase of 4.1% compared with only 0.7% in the prior period. Growth in accident & health within Specialty coupled with modest growth in P&C as well as Crop was partly offset by the full year impact of the cancellation of two large programs in 2017.
Although up 8% on a headline basis, European Operations’ gross written premium was up 6% on a constant currency basis. Improved pricing conditions gave rise to an average premium rate increase of 4.4% compared with a reduction of 0.2% in the prior period. Growth reflects the improved rating environment and targeted growth in profitable portfolios such as Continental European insurance, reinsurance life and accident and the improved rating environment in several London market portfolios.
Australian & New Zealand Operations reported a 2% increase in gross written premium on a constant currency basis. An average premium rate increase (excluding CTP) of 7.3% compared with 6.1% in the prior period was largely offset by a significant reduction in NSW CTP premium following legislative reform and the non-renewal of two travel insurance credit card portfolios. Excluding the impact of CTP premium rate reductions, gross written premium increased 5% on a constant currency basis, broadly consistent with pricing. Retention was stable across the portfolio.
Asia Pacific gross written premium fell 15% on a constant currency basis. This reflected our exits from Thailand, Hong Kong construction workers’ compensation and Indonesian marine hull businesses as well as the accelerated remediation of marine, property and engineering, particularly in Hong Kong and Singapore. Although the region remains competitive, we achieved an average premium rate increase of 1.0% during the year compared with a reduction of 2.3% in the prior period.
Net earned premium increased 0.5% to $11,830 million from $11,768 million in the prior year with negligible foreign exchange impact.
1 Excludes premium rate changes relating to CTP.
Underwriting performance
Key ratios – Group
FOR THE YEAR ENDED 31 DECEMBER 2018 2017
STATUTORY ADJUSTED 1 STATUTORY ADJUSTED 2,3
% % % %
Net claims ratio 63.6 64.0 71.5 71.5 Net commission ratio 16.9 16.4 17.1 16.5 Expense ratio 15.4 15.2 15.9 15.3 Combined operating ratio 95.9 95.6 104.5 103.3 Adjusted combined operating ratio 4 96.0 95.7 105.1 103.9 Insurance profit (loss) margin 7.1 7.3 (0.5) 0.5
1 Excludes transaction to reinsure Hong Kong construction workers’ compensation liabilities.2 Excludes transaction to reinsure US liabilities.3 Excludes one-off impact on the Group’s underwriting result due to the Ogden decision in the UK.4 Excludes the impact of changes in risk-free rates used to discount net outstanding claims.
Group Chief Financial Officer’s reportO
ther
info
rmatio
n
6
Fin
ancial
Rep
ort
5
Perfo
rman
ce o
verv
iew
1
Go
vern
ance
3
Directo
rs' R
epo
rt
4
QB
E In
suran
ce Gro
up
A
nn
ual R
epo
rt 2018
17B
usin
ess rev
iew
2
Divisional performance
Contributions by region
GROSS WRITTEN
PREMIUMNET EARNED
PREMIUMCOMBINED OPERATING
RATIOINSURANCE PROFIT
BEFORE INCOME TAX
FOR THE YEAR ENDED 31 DECEMBER 2018 2017 2018 2017 2018 2017 2018 2017 US$M US$M US$M US$M % % US$M US$M
North American Operations 1 4,711 4,556 3,569 3,541 96.9 108.8 221 (236)European Operations 2 4,355 4,049 3,505 3,212 95.0 93.4 311 335Australian & New Zealand Operations 3,992 4,024 3,519 3,480 92.4 91.9 420 438Asia Pacific Operations 3 633 740 538 653 103.7 115.3 (12) (93)Equator Re 1,486 1,580 664 847 91.0 141.3 85 (323)Equator Re elimination 4 (1,485) (1,567) – – – – – –Corporate adjustments (35) (54) 35 35 – – (164) (59)Group adjusted 13,657 13,328 11,830 11,768 95.6 103.3 861 62Reinsurance transactions – – (190) (415) 0.3 – (35) 19Ogden adjustment – – – (2) – 1.2 – (141)Group statutory 13,657 13,328 11,640 11,351 95.9 104.5 826 (60)Direct and facultative 12,599 12,289 10,708 10,471 96.4 104.1 703 (22)Inward reinsurance 1,058 1,039 932 880 89.8 108.3 123 (38)Group statutory 13,657 13,328 11,640 11,351 95.9 104.5 826 (60)
1 Excludes transaction to reinsure US liabilities in 2017.2 Excludes one-off adverse impact on the Group’s underwriting result due to the Ogden decision in the UK in 2017.3 Excludes transaction to reinsure Hong Kong construction workers’ compensation liabilities in 2018.4 Non-eliminated Equator Re gross written premium relates to minority interests in Lloyd’s Syndicate 386.
Incurred claimsThe Group’s net claims ratio improved to 64.0% from 71.5% in the prior year, reflecting significantly reduced catastrophe incidence and a strong improvement in the attritional claims ratio.
The table below provides a summary of the major components of the net claims ratio.
FOR THE YEAR ENDED 31 DECEMBER 2018 2017
STATUTORY ADJUSTED 1 STATUTORY ADJUSTED 2,3
% % % %
Attritional claims 53.2 52.3 56.6 54.5 Large individual risk and catastrophe claims 10.0 9.8 15.9 15.4 Impact of reinsurance transactions (0.1) – (0.7) – Claims settlement costs 3.3 3.3 3.1 3.0 Claims discount (2.0) (2.0) (2.2) (2.1)Net incurred central estimate claims ratio (current accident year) 64.4 63.4 72.7 70.8 Changes in undiscounted prior accident year central estimate (1.0) (1.0) (0.5) (0.4)Impact of reinsurance transactions (1.3) – (3.0) – Impact of Ogden – – 1.2 – Changes in discount rates (0.1) (0.1) (0.6) (0.6)Movement in risk margins 0.1 0.1 0.7 0.8 Other (including unwind of prior year discount) 1.5 1.6 1.0 0.9 Net incurred claims ratio (current financial year) 63.6 64.0 71.5 71.5
1 Excludes transaction to reinsure Hong Kong construction workers’ compensation liabilities.2 Excludes one-off impact on the Group’s underwriting result due to the Ogden decision in the UK.3 Excludes transaction to reinsure US liabilities.
Excluding Crop insurance and LMI, the attritional claims ratio reduced to 50.2% from 53.1% in the prior period, reflecting significant improvement across all divisions.
Excluding Crop insurance, North America Operations’ attritional claims ratio improved 2.8% relative to the prior year driven mainly by underwriting and pricing initiatives in our corporate, affiliated, directors & officers and trade credit & surety portfolios.
European Operations’ attritional claims ratio also improved 2.8% reflecting underlying improvement coupled with the unwind of the post-Brexit devaluation of sterling and the non-recurrence of one-off reinsurance expense which suppressed net earned premium in the prior year.
Excluding LMI, Australian & New Zealand Operations’ attritional claims ratio fell by 2.9% with improvement observed across most of the portfolio including significant reductions in commercial property, CTP and workers’ compensation.
Asia Pacific Operations’ attritional claims ratio improved by 5.0% reflecting strong portfolio management actions including the exiting of poor performing segments in Hong Kong workers’ compensation, Indonesian marine hull and our operations in Thailand, coupled with premium rate increases.
Equator Re’s attritional claims ratio improved very significantly due to a reduction in proportional business that ordinarily operates at a higher attritional claims ratio relative to excess of loss business.
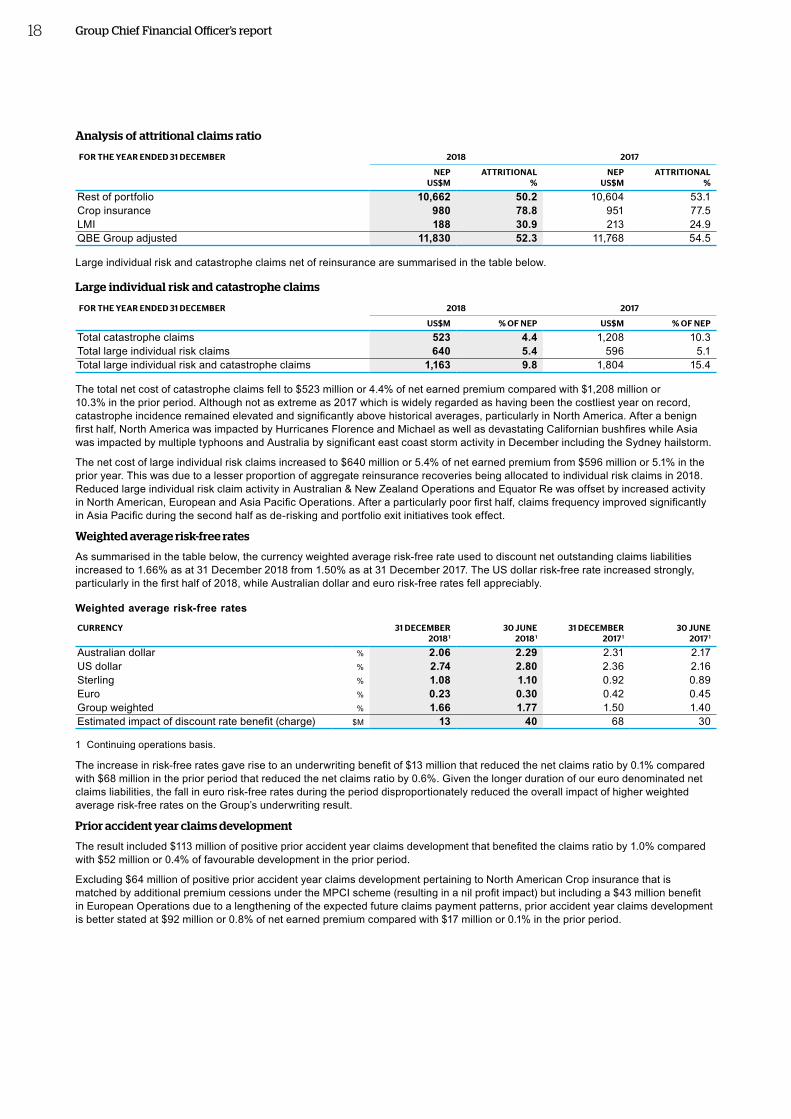
18
Analysis of attritional claims ratio
FOR THE YEAR ENDED 31 DECEMBER 2018 2017
NEP ATTRITIONAL NEP ATTRITIONAL US$M % US$M %
Rest of portfolio 10,662 50.2 10,604 53.1 Crop insurance 980 78.8 951 77.5 LMI 188 30.9 213 24.9 QBE Group adjusted 11,830 52.3 11,768 54.5
Large individual risk and catastrophe claims net of reinsurance are summarised in the table below.
Large individual risk and catastrophe claims
FOR THE YEAR ENDED 31 DECEMBER 2018 2017
US$M % OF NEP US$M % OF NEP
Total catastrophe claims 523 4.4 1,208 10.3 Total large individual risk claims 640 5.4 596 5.1 Total large individual risk and catastrophe claims 1,163 9.8 1,804 15.4
The total net cost of catastrophe claims fell to $523 million or 4.4% of net earned premium compared with $1,208 million or 10.3% in the prior period. Although not as extreme as 2017 which is widely regarded as having been the costliest year on record, catastrophe incidence remained elevated and significantly above historical averages, particularly in North America. After a benign first half, North America was impacted by Hurricanes Florence and Michael as well as devastating Californian bushfires while Asia was impacted by multiple typhoons and Australia by significant east coast storm activity in December including the Sydney hailstorm.
The net cost of large individual risk claims increased to $640 million or 5.4% of net earned premium from $596 million or 5.1% in the prior year. This was due to a lesser proportion of aggregate reinsurance recoveries being allocated to individual risk claims in 2018. Reduced large individual risk claim activity in Australian & New Zealand Operations and Equator Re was offset by increased activity in North American, European and Asia Pacific Operations. After a particularly poor first half, claims frequency improved significantly in Asia Pacific during the second half as de-risking and portfolio exit initiatives took effect.
Weighted average risk-free rates
As summarised in the table below, the currency weighted average risk-free rate used to discount net outstanding claims liabilities increased to 1.66% as at 31 December 2018 from 1.50% as at 31 December 2017. The US dollar risk-free rate increased strongly, particularly in the first half of 2018, while Australian dollar and euro risk-free rates fell appreciably.
Weighted average risk‑free rates
CURRENCY 31 DECEMBER 30 JUNE 31 DECEMBER 30 JUNE 2018 1 2018 1 2017 1 2017 1
Australian dollar % 2.06 2.29 2.31 2.17US dollar % 2.74 2.80 2.36 2.16Sterling % 1.08 1.10 0.92 0.89Euro % 0.23 0.30 0.42 0.45Group weighted % 1.66 1.77 1.50 1.40Estimated impact of discount rate benefit (charge) $M 13 40 68 30
1 Continuing operations basis.
The increase in risk-free rates gave rise to an underwriting benefit of $13 million that reduced the net claims ratio by 0.1% compared with $68 million in the prior period that reduced the net claims ratio by 0.6%. Given the longer duration of our euro denominated net claims liabilities, the fall in euro risk-free rates during the period disproportionately reduced the overall impact of higher weighted average risk-free rates on the Group’s underwriting result.
Prior accident year claims development
The result included $113 million of positive prior accident year claims development that benefited the claims ratio by 1.0% compared with $52 million or 0.4% of favourable development in the prior period.
Excluding $64 million of positive prior accident year claims development pertaining to North American Crop insurance that is matched by additional premium cessions under the MPCI scheme (resulting in a nil profit impact) but including a $43 million benefit in European Operations due to a lengthening of the expected future claims payment patterns, prior accident year claims development is better stated at $92 million or 0.8% of net earned premium compared with $17 million or 0.1% in the prior period.
Group Chief Financial Officer’s report
18
Analysis of attritional claims ratio
FOR THE YEAR ENDED 31 DECEMBER 2018 2017
NEP ATTRITIONAL NEP ATTRITIONAL US$M % US$M %
Rest of portfolio 10,662 50.2 10,604 53.1 Crop insurance 980 78.8 951 77.5 LMI 188 30.9 213 24.9 QBE Group adjusted 11,830 52.3 11,768 54.5
Large individual risk and catastrophe claims net of reinsurance are summarised in the table below.
Large individual risk and catastrophe claims
FOR THE YEAR ENDED 31 DECEMBER 2018 2017
US$M % OF NEP US$M % OF NEP
Total catastrophe claims 523 4.4 1,208 10.3 Total large individual risk claims 640 5.4 596 5.1 Total large individual risk and catastrophe claims 1,163 9.8 1,804 15.4
The total net cost of catastrophe claims fell to $523 million or 4.4% of net earned premium compared with $1,208 million or 10.3% in the prior period. Although not as extreme as 2017 which is widely regarded as having been the costliest year on record, catastrophe incidence remained elevated and significantly above historical averages, particularly in North America. After a benign first half, North America was impacted by Hurricanes Florence and Michael as well as devastating Californian bushfires while Asia was impacted by multiple typhoons and Australia by significant east coast storm activity in December including the Sydney hailstorm.
The net cost of large individual risk claims increased to $640 million or 5.4% of net earned premium from $596 million or 5.1% in the prior year. This was due to a lesser proportion of aggregate reinsurance recoveries being allocated to individual risk claims in 2018. Reduced large individual risk claim activity in Australian & New Zealand Operations and Equator Re was offset by increased activity in North American, European and Asia Pacific Operations. After a particularly poor first half, claims frequency improved significantly in Asia Pacific during the second half as de-risking and portfolio exit initiatives took effect.
Weighted average risk-free rates
As summarised in the table below, the currency weighted average risk-free rate used to discount net outstanding claims liabilities increased to 1.66% as at 31 December 2018 from 1.50% as at 31 December 2017. The US dollar risk-free rate increased strongly, particularly in the first half of 2018, while Australian dollar and euro risk-free rates fell appreciably.
Weighted average risk‑free rates
CURRENCY 31 DECEMBER 30 JUNE 31 DECEMBER 30 JUNE 2018 1 2018 1 2017 1 2017 1
Australian dollar % 2.06 2.29 2.31 2.17US dollar % 2.74 2.80 2.36 2.16Sterling % 1.08 1.10 0.92 0.89Euro % 0.23 0.30 0.42 0.45Group weighted % 1.66 1.77 1.50 1.40Estimated impact of discount rate benefit (charge) $M 13 40 68 30
1 Continuing operations basis.
The increase in risk-free rates gave rise to an underwriting benefit of $13 million that reduced the net claims ratio by 0.1% compared with $68 million in the prior period that reduced the net claims ratio by 0.6%. Given the longer duration of our euro denominated net claims liabilities, the fall in euro risk-free rates during the period disproportionately reduced the overall impact of higher weighted average risk-free rates on the Group’s underwriting result.
Prior accident year claims development
The result included $113 million of positive prior accident year claims development that benefited the claims ratio by 1.0% compared with $52 million or 0.4% of favourable development in the prior period.
Excluding $64 million of positive prior accident year claims development pertaining to North American Crop insurance that is matched by additional premium cessions under the MPCI scheme (resulting in a nil profit impact) but including a $43 million benefit in European Operations due to a lengthening of the expected future claims payment patterns, prior accident year claims development is better stated at $92 million or 0.8% of net earned premium compared with $17 million or 0.1% in the prior period.
Group Chief Financial Officer’s reportO
ther
info
rmatio
n
6
Fin
ancial
Rep
ort
5
Perfo
rman
ce o
verv
iew
1
Go
vern
ance
3
Directo
rs' R
epo
rt
4
QB
E In
suran
ce Gro
up
A
nn
ual R
epo
rt 2018
19B
usin
ess rev
iew
2
The Group’s overall net positive prior accident year claims development of $92 million compares with $17 million in the prior year and included the following:• North American Operations recorded $11 million of positive development compared with $149 million of adverse development
in the prior period, reflecting favourable development in Crop (that was not matched by additional premium cessions under the MPCI scheme) partly offset by adverse development in assumed multi-line, commercial corporate, D&O and Specialty programs;
• European Operations recorded $86 million of positive development compared with $141 million in the prior year, reflecting the aforementioned payment pattern benefit and a net reserve release of $43 million primarily driven by QBE Re European property business;
• Australian & New Zealand Operations reported $112 million of positive development compared with $158 million in the prior year, largely reflecting the continuing absence of any notable claims inflation across most long-tail classes;
• Asia Pacific Operations reported $10 million of adverse development primarily due to late notification of short-tail claims in the first half of 2018, a pleasing improvement from $35 million in the prior year;
• Equator Re reported $84 million of adverse development, down from $97 million in the prior year, largely relating to the September 2017 Mexican earthquakes coupled with reduced recoveries projected on older year aggregate reinsurance treaties; and
• adverse development of $23 million in Corporate reflects internal reinsurance between Latin American Operations and Equator Re, with the equivalent $23 million reinsurance recovery recorded in discontinued operations (resulting in a net nil impact to the Group).
The result also included a risk margin increase of $17 million ($12 million on a statutory basis) or 0.1% of net earned premium compared with an increase of $93 million ($75 million on a statutory basis) or 0.8% in the prior year.
Commission and expensesThe Group’s combined commission and expense ratio improved to 31.6% from 31.8% in the prior year.
The commission ratio improved slightly to 16.4% from 16.5% in 2017. European Operations’ commission ratio fell due to the non-recurrence of commission adjustments and one-off reinsurance spend in the prior year. This was partly offset by higher commission expense in Australian & New Zealand Operations primarily due to the non-renewal of the CTP quota share reinsurance treaty with Equator Re.
The Group’s expense ratio improved marginally to 15.2% from 15.3% in the prior year. Cost savings from efficiency initiatives were achieved in all divisions, partly offset by the loss of managed fund fee income in Australian & New Zealand Operations, costs associated with the implementation of the Brexit solution and the Brilliant Basics program as well as various other strategic initiatives across the Group.
Income tax expenseThe Group’s income tax expense of $77 million equated to an effective tax rate of 12% compared with tax expense of $224 million in 2017. The low effective tax rate reflects increased profits in North America and Bermuda, which benefit from the utilisation of previously unrecognised tax losses, profits in the UK (where the corporate tax rate is lower than Australia) and the recognition of additional North American deferred tax assets.
In 2018, QBE paid $200 million in corporate income tax to tax authorities globally, including $88 million in Australia. Income tax payments in Australia benefit our dividend franking account, the balance of which stood at A$224 million as at 31 December 2018.The Group is therefore capable of fully franking A$523 million of dividends. The dividend franking percentage will increase to 60% for dividend payments in calendar 2019 (including the 2018 final dividend), however, the franking rate is expected to fall to around 10% in 2020 and thereafter reflecting the anticipated increase in the profit contribution of non-Australian operations.
Balance sheet
Capital management summaryDuring 2018, the Group’s focus was on a return to the strong capital adequacy levels seen prior to the extreme catastrophe experience of 2017. As at 31 December 2018, the Group’s indicative APRA PCA multiple was 1.78x, up from 1.64x at 31 December 2017 and towards the upper end of our 1.6x–1.8x PCA target range, while our excess above S&P ‘AA’ minimum capital levels increased.
During the second half of 2018 and following detailed semi-annual reviews, the major rating agencies published updated credit rating opinions which resulted in the rating and outlook for QBE remaining unchanged. These outcomes are highlighted below: • On 5 September 2018, Fitch Ratings’ credit opinion highlighted the long-term issuer default rating (IDR) as ‘A-’ and the insurer
financial strength (IFS) ratings of QBE’s core subsidiaries at ‘A+’ (Strong). The ratings outlook is “stable”.• On 19 September 2018, S&P’s credit opinion highlighted the parent entity’s issuer credit rating (ICR) at ‘A-’ as well as the ICR and
IFS ratings on QBE’s core operating entities at ‘A+’. The outlook remained “stable”.On 21 December 2018, Moody’s reiterated QBE insurance Group Limited’s (the parent entity) ICR of ‘A3’, while the outlook remained “negative”. The IFS ratings of the core subsidiaries remain at ‘A1’, also with a “negative” outlook. While A.M. Best did not publish a revised credit opinion during the second half of 2018, A.M. Best’s long-term ICR of the parent entity and its main operating subsidiaries remains at ‘bbb+’ and ‘a+’ respectively, while the IFS of the main operating subsidiaries remain at ‘A’. The Group’s outlook remains “stable”.
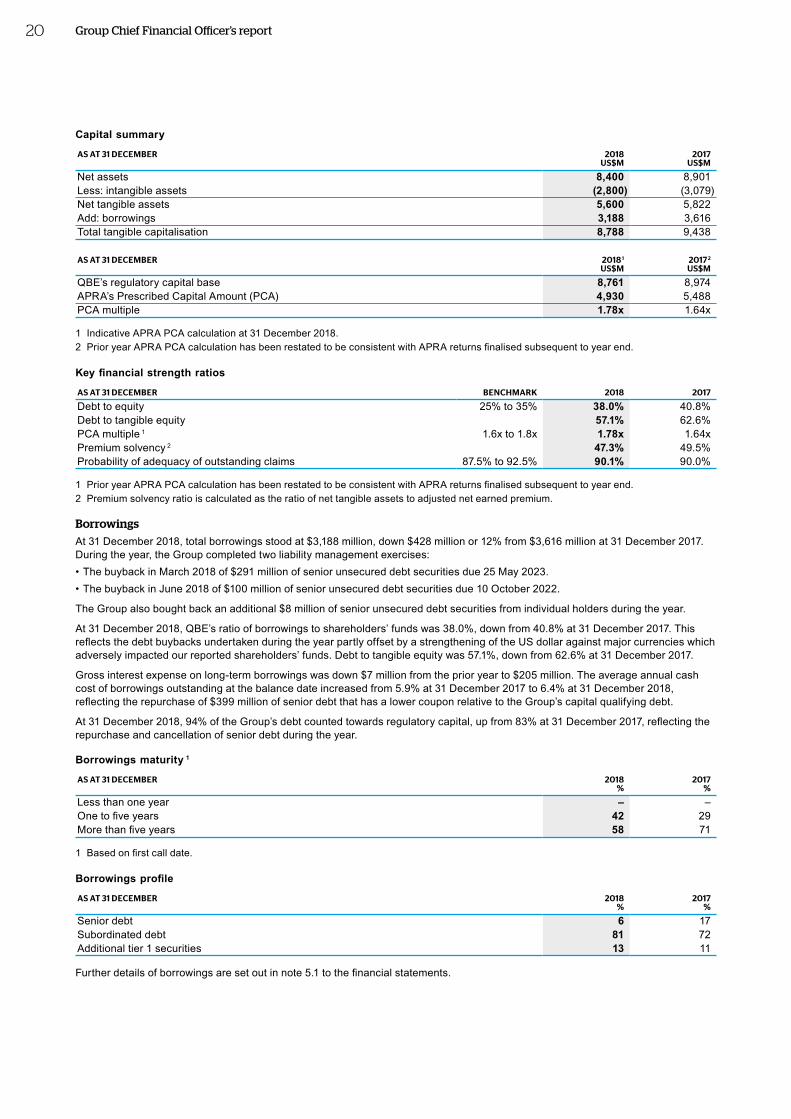
20
Capital summary
AS AT 31 DECEMBER 2018 US$M
2017 US$M
Net assets 8,400 8,901Less: intangible assets (2,800) (3,079)Net tangible assets 5,600 5,822Add: borrowings 3,188 3,616Total tangible capitalisation 8,788 9,438
AS AT 31 DECEMBER 2018 1 US$M
2017 2 US$M
QBE’s regulatory capital base 8,761 8,974APRA’s Prescribed Capital Amount (PCA) 4,930 5,488PCA multiple 1.78x 1.64x
1 Indicative APRA PCA calculation at 31 December 2018.2 Prior year APRA PCA calculation has been restated to be consistent with APRA returns finalised subsequent to year end.
Key financial strength ratios
AS AT 31 DECEMBER BENCHMARK 2018 2017
Debt to equity 25% to 35% 38.0% 40.8%Debt to tangible equity 57.1% 62.6%PCA multiple 1 1.6x to 1.8x 1.78x 1.64xPremium solvency 2 47.3% 49.5%Probability of adequacy of outstanding claims 87.5% to 92.5% 90.1% 90.0%
1 Prior year APRA PCA calculation has been restated to be consistent with APRA returns finalised subsequent to year end.2 Premium solvency ratio is calculated as the ratio of net tangible assets to adjusted net earned premium.
BorrowingsAt 31 December 2018, total borrowings stood at $3,188 million, down $428 million or 12% from $3,616 million at 31 December 2017. During the year, the Group completed two liability management exercises:• The buyback in March 2018 of $291 million of senior unsecured debt securities due 25 May 2023.• The buyback in June 2018 of $100 million of senior unsecured debt securities due 10 October 2022.
The Group also bought back an additional $8 million of senior unsecured debt securities from individual holders during the year.
At 31 December 2018, QBE’s ratio of borrowings to shareholders’ funds was 38.0%, down from 40.8% at 31 December 2017. This reflects the debt buybacks undertaken during the year partly offset by a strengthening of the US dollar against major currencies which adversely impacted our reported shareholders’ funds. Debt to tangible equity was 57.1%, down from 62.6% at 31 December 2017.
Gross interest expense on long-term borrowings was down $7 million from the prior year to $205 million. The average annual cash cost of borrowings outstanding at the balance date increased from 5.9% at 31 December 2017 to 6.4% at 31 December 2018, reflecting the repurchase of $399 million of senior debt that has a lower coupon relative to the Group’s capital qualifying debt.
At 31 December 2018, 94% of the Group’s debt counted towards regulatory capital, up from 83% at 31 December 2017, reflecting the repurchase and cancellation of senior debt during the year.
Borrowings maturity 1
AS AT 31 DECEMBER 2018 %
2017 %
Less than one year – – One to five years 42 29More than five years 58 71
1 Based on first call date.
Borrowings profile
AS AT 31 DECEMBER 2018 %
2017 %
Senior debt 6 17Subordinated debt 81 72Additional tier 1 securities 13 11
Further details of borrowings are set out in note 5.1 to the financial statements.
Group Chief Financial Officer’s report
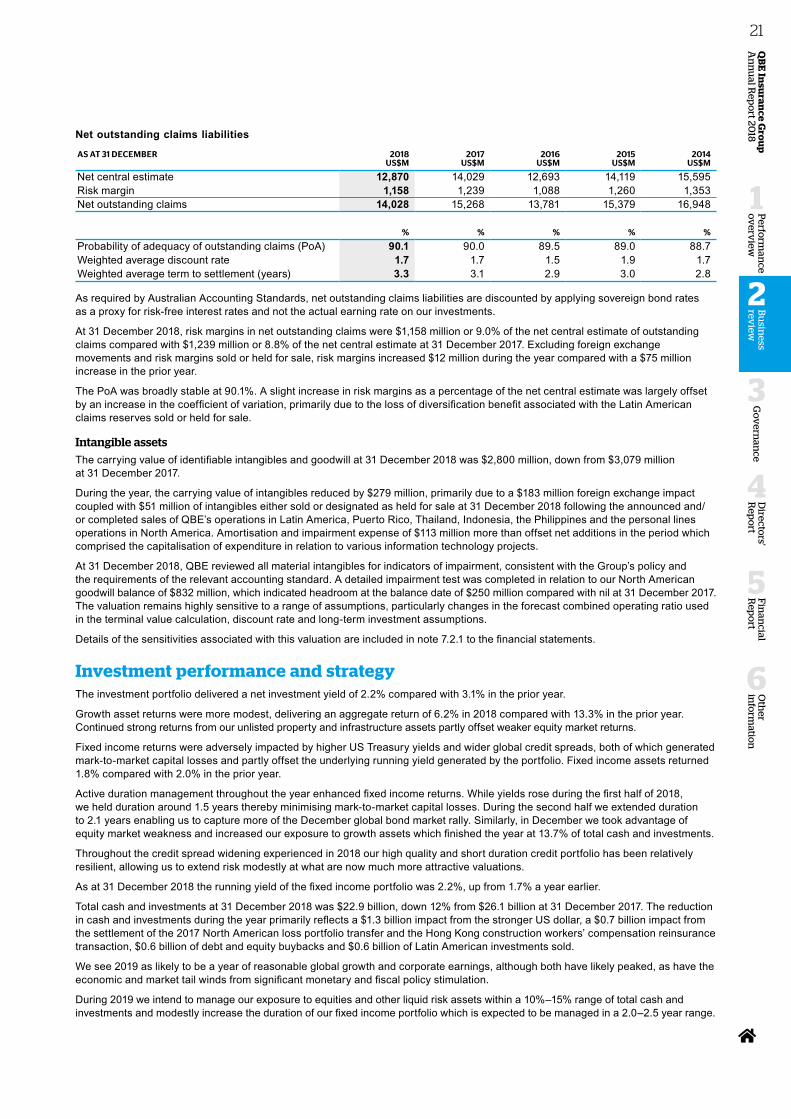
20
Capital summary
AS AT 31 DECEMBER 2018 US$M
2017 US$M
Net assets 8,400 8,901Less: intangible assets (2,800) (3,079)Net tangible assets 5,600 5,822Add: borrowings 3,188 3,616Total tangible capitalisation 8,788 9,438
AS AT 31 DECEMBER 2018 1 US$M
2017 2 US$M
QBE’s regulatory capital base 8,761 8,974APRA’s Prescribed Capital Amount (PCA) 4,930 5,488PCA multiple 1.78x 1.64x
1 Indicative APRA PCA calculation at 31 December 2018.2 Prior year APRA PCA calculation has been restated to be consistent with APRA returns finalised subsequent to year end.
Key financial strength ratios
AS AT 31 DECEMBER BENCHMARK 2018 2017
Debt to equity 25% to 35% 38.0% 40.8%Debt to tangible equity 57.1% 62.6%PCA multiple 1 1.6x to 1.8x 1.78x 1.64xPremium solvency 2 47.3% 49.5%Probability of adequacy of outstanding claims 87.5% to 92.5% 90.1% 90.0%
1 Prior year APRA PCA calculation has been restated to be consistent with APRA returns finalised subsequent to year end.2 Premium solvency ratio is calculated as the ratio of net tangible assets to adjusted net earned premium.
BorrowingsAt 31 December 2018, total borrowings stood at $3,188 million, down $428 million or 12% from $3,616 million at 31 December 2017. During the year, the Group completed two liability management exercises:• The buyback in March 2018 of $291 million of senior unsecured debt securities due 25 May 2023.• The buyback in June 2018 of $100 million of senior unsecured debt securities due 10 October 2022.
The Group also bought back an additional $8 million of senior unsecured debt securities from individual holders during the year.
At 31 December 2018, QBE’s ratio of borrowings to shareholders’ funds was 38.0%, down from 40.8% at 31 December 2017. This reflects the debt buybacks undertaken during the year partly offset by a strengthening of the US dollar against major currencies which adversely impacted our reported shareholders’ funds. Debt to tangible equity was 57.1%, down from 62.6% at 31 December 2017.
Gross interest expense on long-term borrowings was down $7 million from the prior year to $205 million. The average annual cash cost of borrowings outstanding at the balance date increased from 5.9% at 31 December 2017 to 6.4% at 31 December 2018, reflecting the repurchase of $399 million of senior debt that has a lower coupon relative to the Group’s capital qualifying debt.
At 31 December 2018, 94% of the Group’s debt counted towards regulatory capital, up from 83% at 31 December 2017, reflecting the repurchase and cancellation of senior debt during the year.
Borrowings maturity 1
AS AT 31 DECEMBER 2018 %
2017 %
Less than one year – – One to five years 42 29More than five years 58 71
1 Based on first call date.
Borrowings profile
AS AT 31 DECEMBER 2018 %
2017 %
Senior debt 6 17Subordinated debt 81 72Additional tier 1 securities 13 11
Further details of borrowings are set out in note 5.1 to the financial statements.
Group Chief Financial Officer’s reportO
ther
info
rmatio
n
6
Fin
ancial
Rep
ort
5
Perfo
rman
ce o
verv
iew
1
Go
vern
ance
3
Directo
rs' R
epo
rt
4
QB
E In
suran
ce Gro
up
A
nn
ual R
epo
rt 2018
21B
usin
ess rev
iew
2
Net outstanding claims liabilities
AS AT 31 DECEMBER 2018 US$M
2017 US$M
2016 US$M
2015 US$M
2014 US$M
Net central estimate 12,870 14,029 12,693 14,119 15,595 Risk margin 1,158 1,239 1,088 1,260 1,353 Net outstanding claims 14,028 15,268 13,781 15,379 16,948
% % % % %
Probability of adequacy of outstanding claims (PoA) 90.1 90.0 89.5 89.0 88.7Weighted average discount rate 1.7 1.7 1.5 1.9 1.7Weighted average term to settlement (years) 3.3 3.1 2.9 3.0 2.8
As required by Australian Accounting Standards, net outstanding claims liabilities are discounted by applying sovereign bond rates as a proxy for risk-free interest rates and not the actual earning rate on our investments.
At 31 December 2018, risk margins in net outstanding claims were $1,158 million or 9.0% of the net central estimate of outstanding claims compared with $1,239 million or 8.8% of the net central estimate at 31 December 2017. Excluding foreign exchange movements and risk margins sold or held for sale, risk margins increased $12 million during the year compared with a $75 million increase in the prior year.
The PoA was broadly stable at 90.1%. A slight increase in risk margins as a percentage of the net central estimate was largely offset by an increase in the coefficient of variation, primarily due to the loss of diversification benefit associated with the Latin American claims reserves sold or held for sale.
Intangible assetsThe carrying value of identifiable intangibles and goodwill at 31 December 2018 was $2,800 million, down from $3,079 million at 31 December 2017.
During the year, the carrying value of intangibles reduced by $279 million, primarily due to a $183 million foreign exchange impact coupled with $51 million of intangibles either sold or designated as held for sale at 31 December 2018 following the announced and/or completed sales of QBE’s operations in Latin America, Puerto Rico, Thailand, Indonesia, the Philippines and the personal lines operations in North America. Amortisation and impairment expense of $113 million more than offset net additions in the period which comprised the capitalisation of expenditure in relation to various information technology projects.
At 31 December 2018, QBE reviewed all material intangibles for indicators of impairment, consistent with the Group’s policy and the requirements of the relevant accounting standard. A detailed impairment test was completed in relation to our North American goodwill balance of $832 million, which indicated headroom at the balance date of $250 million compared with nil at 31 December 2017. The valuation remains highly sensitive to a range of assumptions, particularly changes in the forecast combined operating ratio used in the terminal value calculation, discount rate and long-term investment assumptions.
Details of the sensitivities associated with this valuation are included in note 7.2.1 to the financial statements.
Investment performance and strategyThe investment portfolio delivered a net investment yield of 2.2% compared with 3.1% in the prior year.
Growth asset returns were more modest, delivering an aggregate return of 6.2% in 2018 compared with 13.3% in the prior year. Continued strong returns from our unlisted property and infrastructure assets partly offset weaker equity market returns.
Fixed income returns were adversely impacted by higher US Treasury yields and wider global credit spreads, both of which generated mark-to-market capital losses and partly offset the underlying running yield generated by the portfolio. Fixed income assets returned 1.8% compared with 2.0% in the prior year.
Active duration management throughout the year enhanced fixed income returns. While yields rose during the first half of 2018, we held duration around 1.5 years thereby minimising mark-to-market capital losses. During the second half we extended duration to 2.1 years enabling us to capture more of the December global bond market rally. Similarly, in December we took advantage of equity market weakness and increased our exposure to growth assets which finished the year at 13.7% of total cash and investments.
Throughout the credit spread widening experienced in 2018 our high quality and short duration credit portfolio has been relatively resilient, allowing us to extend risk modestly at what are now much more attractive valuations.
As at 31 December 2018 the running yield of the fixed income portfolio was 2.2%, up from 1.7% a year earlier.
Total cash and investments at 31 December 2018 was $22.9 billion, down 12% from $26.1 billion at 31 December 2017. The reduction in cash and investments during the year primarily reflects a $1.3 billion impact from the stronger US dollar, a $0.7 billion impact from the settlement of the 2017 North American loss portfolio transfer and the Hong Kong construction workers’ compensation reinsurance transaction, $0.6 billion of debt and equity buybacks and $0.6 billion of Latin American investments sold.
We see 2019 as likely to be a year of reasonable global growth and corporate earnings, although both have likely peaked, as have the economic and market tail winds from significant monetary and fiscal policy stimulation.
During 2019 we intend to manage our exposure to equities and other liquid risk assets within a 10%–15% range of total cash and investments and modestly increase the duration of our fixed income portfolio which is expected to be managed in a 2.0–2.5 year range.
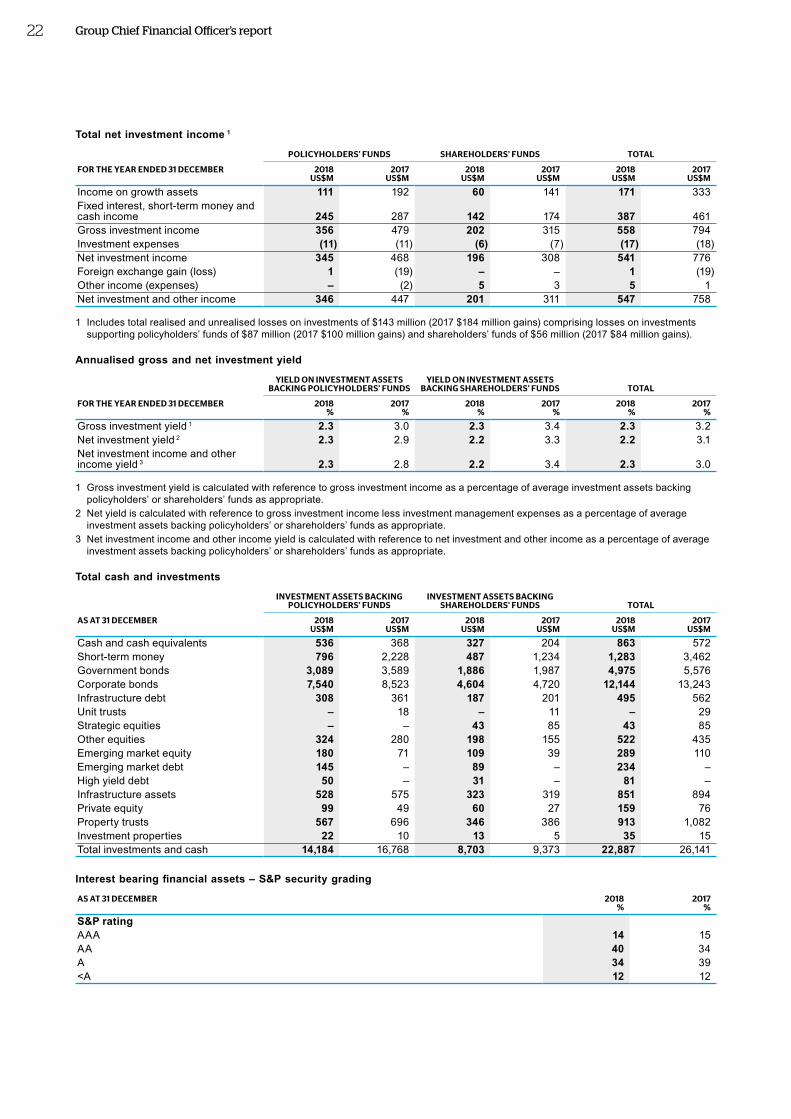
22
Total net investment income 1
POLICYHOLDERS’ FUNDS SHAREHOLDERS’ FUNDS TOTAL
FOR THE YEAR ENDED 31 DECEMBER 2018 US$M
2017 US$M
2018 US$M
2017 US$M
2018 US$M
2017 US$M
Income on growth assets 111 192 60 141 171 333Fixed interest, short-term money and cash income 245 287 142 174 387 461Gross investment income 356 479 202 315 558 794Investment expenses (11) (11) (6) (7) (17) (18)Net investment income 345 468 196 308 541 776Foreign exchange gain (loss) 1 (19) – – 1 (19)Other income (expenses) – (2) 5 3 5 1Net investment and other income 346 447 201 311 547 758
1 Includes total realised and unrealised losses on investments of $143 million (2017 $184 million gains) comprising losses on investments supporting policyholders’ funds of $87 million (2017 $100 million gains) and shareholders’ funds of $56 million (2017 $84 million gains).
Annualised gross and net investment yield
YIELD ON INVESTMENT ASSETS BACKING POLICYHOLDERS’ FUNDS
YIELD ON INVESTMENT ASSETS BACKING SHAREHOLDERS’ FUNDS TOTAL
FOR THE YEAR ENDED 31 DECEMBER 2018 %
2017 %
2018 %
2017 %
2018 %
2017 %
Gross investment yield 1 2.3 3.0 2.3 3.4 2.3 3.2Net investment yield 2 2.3 2.9 2.2 3.3 2.2 3.1Net investment income and other income yield 3 2.3 2.8 2.2 3.4 2.3 3.0
1 Gross investment yield is calculated with reference to gross investment income as a percentage of average investment assets backing policyholders’ or shareholders’ funds as appropriate.
2 Net yield is calculated with reference to gross investment income less investment management expenses as a percentage of average investment assets backing policyholders’ or shareholders’ funds as appropriate.
3 Net investment income and other income yield is calculated with reference to net investment and other income as a percentage of average investment assets backing policyholders’ or shareholders’ funds as appropriate.
Total cash and investments
INVESTMENT ASSETS BACKING
POLICYHOLDERS’ FUNDSINVESTMENT ASSETS BACKING
SHAREHOLDERS’ FUNDS TOTAL
AS AT 31 DECEMBER 2018 US$M
2017 US$M
2018 US$M
2017 US$M
2018 US$M
2017 US$M
Cash and cash equivalents 536 368 327 204 863 572Short-term money 796 2,228 487 1,234 1,283 3,462Government bonds 3,089 3,589 1,886 1,987 4,975 5,576Corporate bonds 7,540 8,523 4,604 4,720 12,144 13,243Infrastructure debt 308 361 187 201 495 562Unit trusts – 18 – 11 – 29Strategic equities – – 43 85 43 85Other equities 324 280 198 155 522 435Emerging market equity 180 71 109 39 289 110Emerging market debt 145 – 89 – 234 –High yield debt 50 – 31 – 81 –Infrastructure assets 528 575 323 319 851 894Private equity 99 49 60 27 159 76Property trusts 567 696 346 386 913 1,082Investment properties 22 10 13 5 35 15Total investments and cash 14,184 16,768 8,703 9,373 22,887 26,141
Interest bearing financial assets – S&P security grading
AS AT 31 DECEMBER 2018 %
2017 %
S&P rating AAA 14 15AA 40 34A 34 39<A 12 12
Group Chief Financial Officer’s report
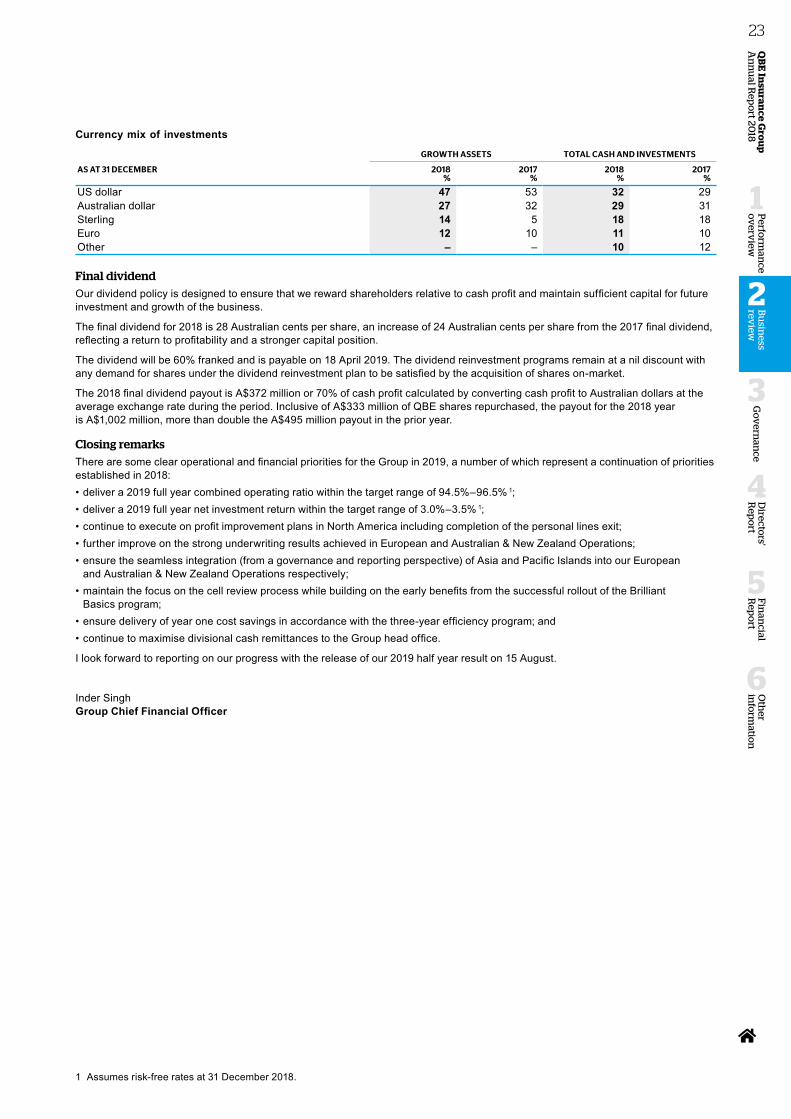
22
Total net investment income 1
POLICYHOLDERS’ FUNDS SHAREHOLDERS’ FUNDS TOTAL
FOR THE YEAR ENDED 31 DECEMBER 2018 US$M
2017 US$M
2018 US$M
2017 US$M
2018 US$M
2017 US$M
Income on growth assets 111 192 60 141 171 333Fixed interest, short-term money and cash income 245 287 142 174 387 461Gross investment income 356 479 202 315 558 794Investment expenses (11) (11) (6) (7) (17) (18)Net investment income 345 468 196 308 541 776Foreign exchange gain (loss) 1 (19) – – 1 (19)Other income (expenses) – (2) 5 3 5 1Net investment and other income 346 447 201 311 547 758
1 Includes total realised and unrealised losses on investments of $143 million (2017 $184 million gains) comprising losses on investments supporting policyholders’ funds of $87 million (2017 $100 million gains) and shareholders’ funds of $56 million (2017 $84 million gains).
Annualised gross and net investment yield
YIELD ON INVESTMENT ASSETS BACKING POLICYHOLDERS’ FUNDS
YIELD ON INVESTMENT ASSETS BACKING SHAREHOLDERS’ FUNDS TOTAL
FOR THE YEAR ENDED 31 DECEMBER 2018 %
2017 %
2018 %
2017 %
2018 %
2017 %
Gross investment yield 1 2.3 3.0 2.3 3.4 2.3 3.2Net investment yield 2 2.3 2.9 2.2 3.3 2.2 3.1Net investment income and other income yield 3 2.3 2.8 2.2 3.4 2.3 3.0
1 Gross investment yield is calculated with reference to gross investment income as a percentage of average investment assets backing policyholders’ or shareholders’ funds as appropriate.
2 Net yield is calculated with reference to gross investment income less investment management expenses as a percentage of average investment assets backing policyholders’ or shareholders’ funds as appropriate.
3 Net investment income and other income yield is calculated with reference to net investment and other income as a percentage of average investment assets backing policyholders’ or shareholders’ funds as appropriate.
Total cash and investments
INVESTMENT ASSETS BACKING
POLICYHOLDERS’ FUNDSINVESTMENT ASSETS BACKING
SHAREHOLDERS’ FUNDS TOTAL
AS AT 31 DECEMBER 2018 US$M
2017 US$M
2018 US$M
2017 US$M
2018 US$M
2017 US$M
Cash and cash equivalents 536 368 327 204 863 572Short-term money 796 2,228 487 1,234 1,283 3,462Government bonds 3,089 3,589 1,886 1,987 4,975 5,576Corporate bonds 7,540 8,523 4,604 4,720 12,144 13,243Infrastructure debt 308 361 187 201 495 562Unit trusts – 18 – 11 – 29Strategic equities – – 43 85 43 85Other equities 324 280 198 155 522 435Emerging market equity 180 71 109 39 289 110Emerging market debt 145 – 89 – 234 –High yield debt 50 – 31 – 81 –Infrastructure assets 528 575 323 319 851 894Private equity 99 49 60 27 159 76Property trusts 567 696 346 386 913 1,082Investment properties 22 10 13 5 35 15Total investments and cash 14,184 16,768 8,703 9,373 22,887 26,141
Interest bearing financial assets – S&P security grading
AS AT 31 DECEMBER 2018 %
2017 %
S&P rating AAA 14 15AA 40 34A 34 39<A 12 12
Group Chief Financial Officer’s reportO
ther
info
rmatio
n
6
Fin
ancial
Rep
ort
5
Perfo
rman
ce o
verv
iew
1
Go
vern
ance
3
Directo
rs' R
epo
rt
4
QB
E In
suran
ce Gro
up
A
nn
ual R
epo
rt 2018
23B
usin
ess rev
iew
2
Currency mix of investments
GROWTH ASSETS TOTAL CASH AND INVESTMENTS
AS AT 31 DECEMBER 2018 %
2017 %
2018 %
2017 %
US dollar 47 53 32 29Australian dollar 27 32 29 31Sterling 14 5 18 18Euro 12 10 11 10Other – – 10 12
Final dividendOur dividend policy is designed to ensure that we reward shareholders relative to cash profit and maintain sufficient capital for future investment and growth of the business.
The final dividend for 2018 is 28 Australian cents per share, an increase of 24 Australian cents per share from the 2017 final dividend, reflecting a return to profitability and a stronger capital position.
The dividend will be 60% franked and is payable on 18 April 2019. The dividend reinvestment programs remain at a nil discount with any demand for shares under the dividend reinvestment plan to be satisfied by the acquisition of shares on-market.
The 2018 final dividend payout is A$372 million or 70% of cash profit calculated by converting cash profit to Australian dollars at the average exchange rate during the period. Inclusive of A$333 million of QBE shares repurchased, the payout for the 2018 year is A$1,002 million, more than double the A$495 million payout in the prior year.
Closing remarksThere are some clear operational and financial priorities for the Group in 2019, a number of which represent a continuation of priorities established in 2018:• deliver a 2019 full year combined operating ratio within the target range of 94.5%–96.5% 1;• deliver a 2019 full year net investment return within the target range of 3.0%–3.5% 1;• continue to execute on profit improvement plans in North America including completion of the personal lines exit;• further improve on the strong underwriting results achieved in European and Australian & New Zealand Operations;• ensure the seamless integration (from a governance and reporting perspective) of Asia and Pacific Islands into our European
and Australian & New Zealand Operations respectively;• maintain the focus on the cell review process while building on the early benefits from the successful rollout of the Brilliant
Basics program; • ensure delivery of year one cost savings in accordance with the three-year efficiency program; and• continue to maximise divisional cash remittances to the Group head office.
I look forward to reporting on our progress with the release of our 2019 half year result on 15 August.
Inder Singh Group Chief Financial Officer
1 Assumes risk-free rates at 31 December 2018.
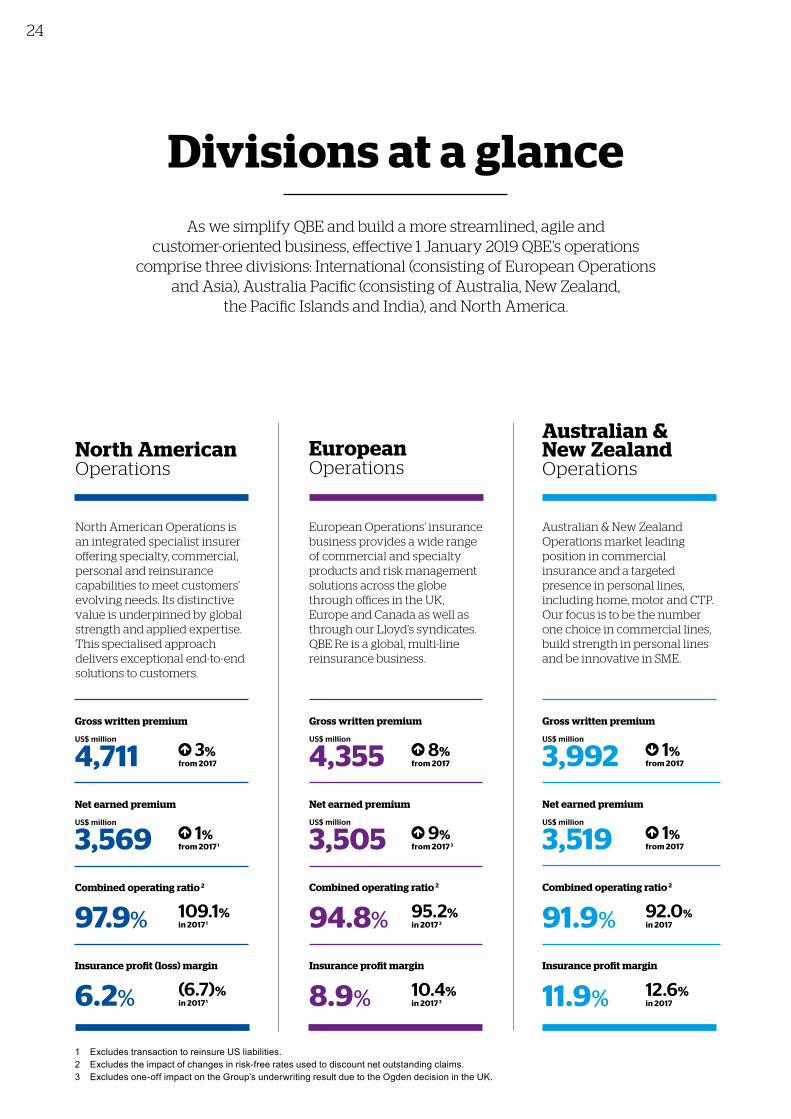
24
European Operations
European Operations’ insurance business provides a wide range of commercial and specialty products and risk management solutions across the globe through offices in the UK, Europe and Canada as well as through our Lloyd’s syndicates. QBE Re is a global, multi-line reinsurance business.
Gross written premium
US$ million
4,355 8%from 2017
Net earned premium
US$ million
3,505 9%from 2017 3
Combined operating ratio 2
94.8% 95.2%
in 2017 3
Insurance profit margin
8.9% 10.4%in 2017 3
Australian & New Zealand Operations
Australian & New Zealand Operations market leading position in commercial insurance and a targeted presence in personal lines, including home, motor and CTP. Our focus is to be the number one choice in commercial lines, build strength in personal lines and be innovative in SME.
Gross written premium
US$ million
3,992 1%from 2017
Net earned premium
US$ million
3,519 1%from 2017
Combined operating ratio 2
91.9% 92.0%in 2017
Insurance profit margin
11.9% 12.6%in 2017
North American Operations
North American Operations is an integrated specialist insurer offering specialty, commercial, personal and reinsurance capabilities to meet customers’ evolving needs. Its distinctive value is underpinned by global strength and applied expertise. This specialised approach delivers exceptional end-to-end solutions to customers.
3%from 2017
Gross written premium
US$ million
4,711Net earned premium
US$ million
3,569 1%from 2017 1
Combined operating ratio 2
97.9% 109.1%in 2017 1
Insurance profit (loss) margin
6.2% (6.7)%in 2017 1
As we simplify QBE and build a more streamlined, agile and customer-oriented business, effective 1 January 2019 QBE’s operations
comprise three divisions: International (consisting of European Operations and Asia), Australia Pacific (consisting of Australia, New Zealand,
the Pacific Islands and India), and North America.
Divisions at a glance
1 Excludes transaction to reinsure US liabilities.2 Excludes the impact of changes in risk-free rates used to discount net outstanding claims.3 Excludes one-off impact on the Group’s underwriting result due to the Ogden decision in the UK.
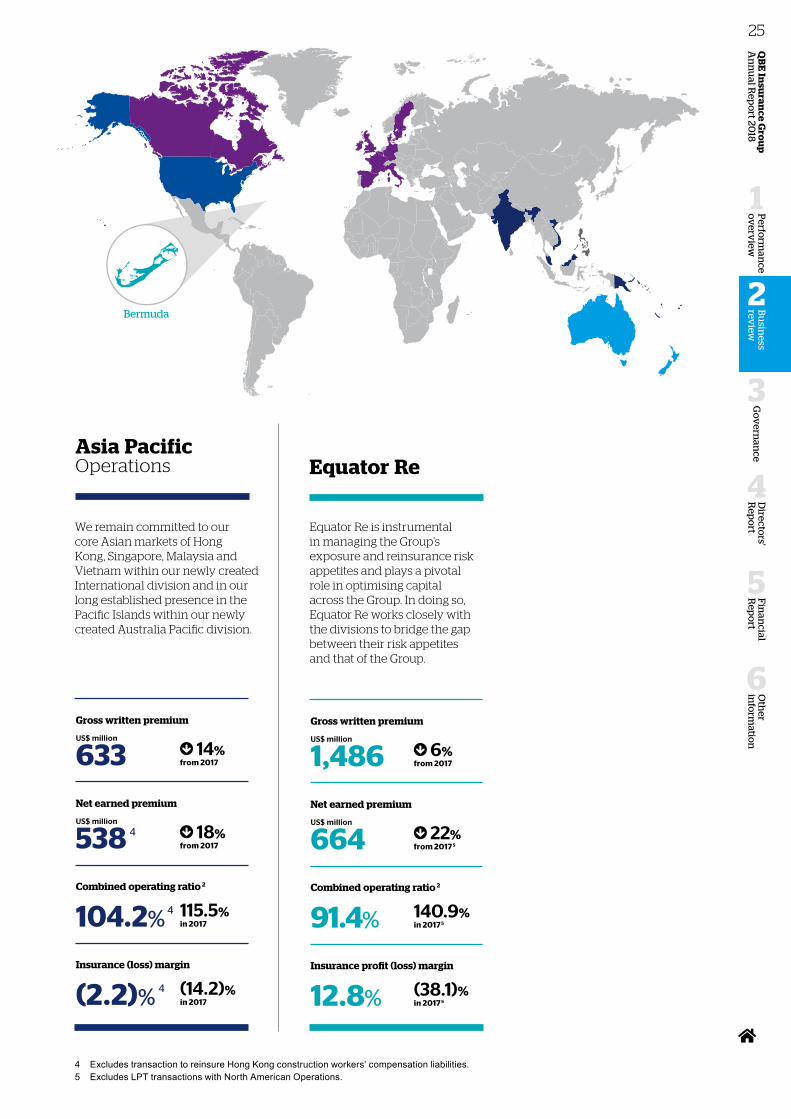
Oth
er in
form
ation
6
Fin
ancial
Rep
ort
5
Perfo
rman
ce o
verv
iew
1
Go
vern
ance
3
Directo
rs' R
epo
rt
4
QB
E In
suran
ce Gro
up
A
nn
ual R
epo
rt 2018
25B
usin
ess rev
iew
2Bermuda
We remain committed to our core Asian markets of Hong Kong, Singapore, Malaysia and Vietnam within our newly created International division and in our long established presence in the Pacific Islands within our newly created Australia Pacific division.
Gross written premium
US$ million
633 14%from 2017
Net earned premium
US$ million
538 4 18%from 2017
Combined operating ratio 2
104.2% 4 115.5%
in 2017
Insurance (loss) margin
(2.2)% 4 (14.2)%
in 2017
Equator Re
Equator Re is instrumental in managing the Group’s exposure and reinsurance risk appetites and plays a pivotal role in optimising capital across the Group. In doing so, Equator Re works closely with the divisions to bridge the gap between their risk appetites and that of the Group.
Gross written premium
US$ million
1,486 6%from 2017
Net earned premium
US$ million
664 22%from 2017 5
Combined operating ratio 2
91.4% 140.9%in 2017 5
Insurance profit (loss) margin
12.8% (38.1)%in 2017 5
Asia Pacific Operations
4 Excludes transaction to reinsure Hong Kong construction workers’ compensation liabilities.5 Excludes LPT transactions with North American Operations.
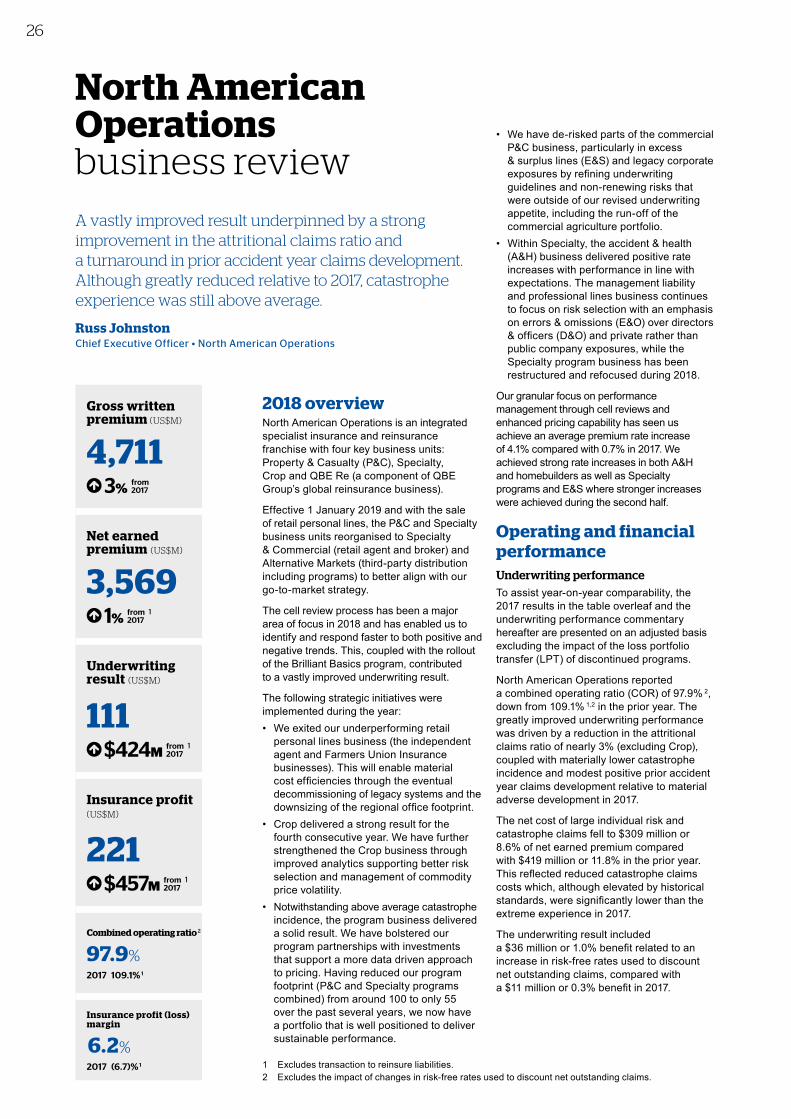
26
1 Excludes transaction to reinsure liabilities.2 Excludes the impact of changes in risk-free rates used to discount net outstanding claims.
2018 overviewNorth American Operations is an integrated specialist insurance and reinsurance franchise with four key business units: Property & Casualty (P&C), Specialty, Crop and QBE Re (a component of QBE Group’s global reinsurance business).
Effective 1 January 2019 and with the sale of retail personal lines, the P&C and Specialty business units reorganised to Specialty & Commercial (retail agent and broker) and Alternative Markets (third-party distribution including programs) to better align with our go-to-market strategy.
The cell review process has been a major area of focus in 2018 and has enabled us to identify and respond faster to both positive and negative trends. This, coupled with the rollout of the Brilliant Basics program, contributed to a vastly improved underwriting result.
The following strategic initiatives were implemented during the year:• We exited our underperforming retail
personal lines business (the independent agent and Farmers Union Insurance businesses). This will enable material cost efficiencies through the eventual decommissioning of legacy systems and the downsizing of the regional office footprint.
• Crop delivered a strong result for the fourth consecutive year. We have further strengthened the Crop business through improved analytics supporting better risk selection and management of commodity price volatility.
• Notwithstanding above average catastrophe incidence, the program business delivered a solid result. We have bolstered our program partnerships with investments that support a more data driven approach to pricing. Having reduced our program footprint (P&C and Specialty programs combined) from around 100 to only 55 over the past several years, we now have a portfolio that is well positioned to deliver sustainable performance.
• We have de-risked parts of the commercial P&C business, particularly in excess & surplus lines (E&S) and legacy corporate exposures by refining underwriting guidelines and non-renewing risks that were outside of our revised underwriting appetite, including the run-off of the commercial agriculture portfolio.
• Within Specialty, the accident & health (A&H) business delivered positive rate increases with performance in line with expectations. The management liability and professional lines business continues to focus on risk selection with an emphasis on errors & omissions (E&O) over directors & officers (D&O) and private rather than public company exposures, while the Specialty program business has been restructured and refocused during 2018.
Our granular focus on performance management through cell reviews and enhanced pricing capability has seen us achieve an average premium rate increase of 4.1% compared with 0.7% in 2017. We achieved strong rate increases in both A&H and homebuilders as well as Specialty programs and E&S where stronger increases were achieved during the second half.
Operating and financial performance Underwriting performanceTo assist year-on-year comparability, the 2017 results in the table overleaf and the underwriting performance commentary hereafter are presented on an adjusted basis excluding the impact of the loss portfolio transfer (LPT) of discontinued programs.
North American Operations reported a combined operating ratio (COR) of 97.9% 2, down from 109.1% 1,2 in the prior year. The greatly improved underwriting performance was driven by a reduction in the attritional claims ratio of nearly 3% (excluding Crop), coupled with materially lower catastrophe incidence and modest positive prior accident year claims development relative to material adverse development in 2017.
The net cost of large individual risk and catastrophe claims fell to $309 million or 8.6% of net earned premium compared with $419 million or 11.8% in the prior year. This reflected reduced catastrophe claims costs which, although elevated by historical standards, were significantly lower than the extreme experience in 2017.
The underwriting result included a $36 million or 1.0% benefit related to an increase in risk-free rates used to discount net outstanding claims, compared with a $11 million or 0.3% benefit in 2017.
North American Operations business review
A vastly improved result underpinned by a strong improvement in the attritional claims ratio and a turnaround in prior accident year claims development. Although greatly reduced relative to 2017, catastrophe experience was still above average.
Russ Johnston Chief Executive Officer • North American Operations
Gross written premium (US$M)
4,711 3%
from 2017
Net earned premium (US$M)
3,569 1%
from 2017
1
Underwriting result (US$M)
111 $424M
from 2017
1
Insurance profit (US$M)
221 $457M
from 2017
1
Combined operating ratio 2
97.9%2017 109.1% 1
Insurance profit (loss)margin
6.2%2017 (6.7)% 1
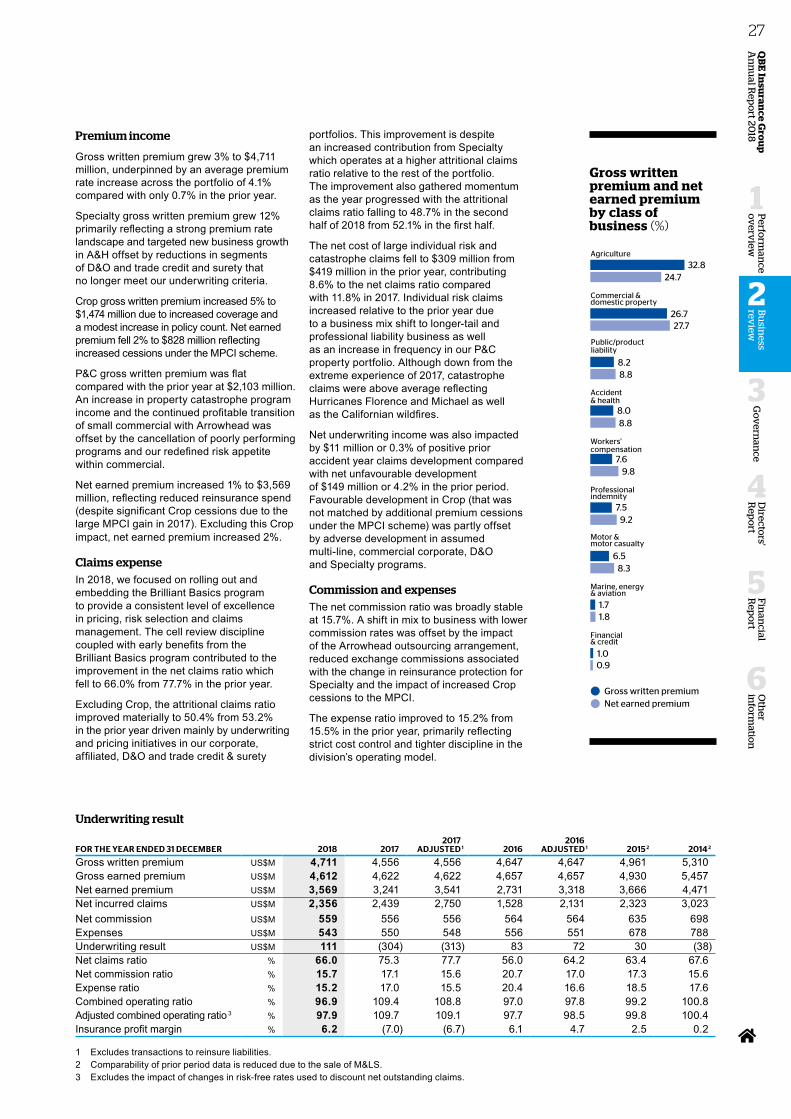
Oth
er in
form
ation
6
Fin
ancial
Rep
ort
5
Perfo
rman
ce o
verv
iew
1
Go
vern
ance
3
Directo
rs' R
epo
rt
4
QB
E In
suran
ce Gro
up
A
nn
ual R
epo
rt 2018
27B
usin
ess rev
iew
2
Gross written premiumNet earned premium
27.7
8.2
8.0
8.8
8.8
7.59.2
6.58.3
7.69.8
1.71.8
0.91.0
32.824.7
26.7
Agriculture
Accident & health
Professionalindemnity
Workers' compensation
Marine, energy & aviation
Financial & credit
Motor &motor casualty
Public/product liability
Commercial & domestic property
Gross written premiumNet earned premium
21.1
14.5
14.1
16.3
9.5
4.75.4
3.63.9
12.813.8
2.52.7
2.12.2
26.225.2
19.4
Marine, energy & aviation
Workers' compensation
Professional indemnity
Other
Financial & credit
Accident & health
Motor & motor casualty
Public/product liability
Commercial & domestic property
Gross written premiumNet earned premium
31.4
7.9
7.2
7.7
7.7
6.17.1
3.54.2
6.15.7
3.13.2
2.62.6
34.730.4
28.8
Financial & credit
Workers' compensation
Agriculture
Public/product liability
Marine, energy & aviation
Professional indemnity
Accident & health
Motor &motor casualty
Commercial & domestic property
Gross written premiumNet earned premium
Workers' compensation
16.8
13.8
12.5
18.1
14.8
7.2
7.0
11.0
12.2
7.1
8.0
2.54.6
28.0
20.6
15.8
Commercial & domestic property
Motor & motor casualty
Professional indemnity
Public/productliability
Financial & credit
Marine, energy & aviation
Accident & health
NAO
EO
ANZO
APO
Premium income
Gross written premium grew 3% to $4,711 million, underpinned by an average premium rate increase across the portfolio of 4.1% compared with only 0.7% in the prior year.
Specialty gross written premium grew 12% primarily reflecting a strong premium rate landscape and targeted new business growth in A&H offset by reductions in segments of D&O and trade credit and surety that no longer meet our underwriting criteria.
Crop gross written premium increased 5% to $1,474 million due to increased coverage and a modest increase in policy count. Net earned premium fell 2% to $828 million reflecting increased cessions under the MPCI scheme.
P&C gross written premium was flat compared with the prior year at $2,103 million. An increase in property catastrophe program income and the continued profitable transition of small commercial with Arrowhead was offset by the cancellation of poorly performing programs and our redefined risk appetite within commercial.
Net earned premium increased 1% to $3,569 million, reflecting reduced reinsurance spend (despite significant Crop cessions due to the large MPCI gain in 2017). Excluding this Crop impact, net earned premium increased 2%.
Claims expenseIn 2018, we focused on rolling out and embedding the Brilliant Basics program to provide a consistent level of excellence in pricing, risk selection and claims management. The cell review discipline coupled with early benefits from the Brilliant Basics program contributed to the improvement in the net claims ratio which fell to 66.0% from 77.7% in the prior year.
Excluding Crop, the attritional claims ratio improved materially to 50.4% from 53.2% in the prior year driven mainly by underwriting and pricing initiatives in our corporate, affiliated, D&O and trade credit & surety
portfolios. This improvement is despite an increased contribution from Specialty which operates at a higher attritional claims ratio relative to the rest of the portfolio. The improvement also gathered momentum as the year progressed with the attritional claims ratio falling to 48.7% in the second half of 2018 from 52.1% in the first half.
The net cost of large individual risk and catastrophe claims fell to $309 million from $419 million in the prior year, contributing 8.6% to the net claims ratio compared with 11.8% in 2017. Individual risk claims increased relative to the prior year due to a business mix shift to longer-tail and professional liability business as well as an increase in frequency in our P&C property portfolio. Although down from the extreme experience of 2017, catastrophe claims were above average reflecting Hurricanes Florence and Michael as well as the Californian wildfires.
Net underwriting income was also impacted by $11 million or 0.3% of positive prior accident year claims development compared with net unfavourable development of $149 million or 4.2% in the prior period. Favourable development in Crop (that was not matched by additional premium cessions under the MPCI scheme) was partly offset by adverse development in assumed multi-line, commercial corporate, D&O and Specialty programs.
Commission and expensesThe net commission ratio was broadly stable at 15.7%. A shift in mix to business with lower commission rates was offset by the impact of the Arrowhead outsourcing arrangement, reduced exchange commissions associated with the change in reinsurance protection for Specialty and the impact of increased Crop cessions to the MPCI.
The expense ratio improved to 15.2% from 15.5% in the prior year, primarily reflecting strict cost control and tighter discipline in the division’s operating model.
Gross written premium and net earned premium by class of business (%)
Underwriting result
FOR THE YEAR ENDED 31 DECEMBER 2018 20172017
ADJUSTED 1 20162016
ADJUSTED 1 2015 2 2014 2
Gross written premium US$M 4,711 4,556 4,556 4,647 4,647 4,961 5,310 Gross earned premium US$M 4,612 4,622 4,622 4,657 4,657 4,930 5,457 Net earned premium US$M 3,569 3,241 3,541 2,731 3,318 3,666 4,471 Net incurred claims US$M 2,356 2,439 2,750 1,528 2,131 2,323 3,023 Net commission US$M 559 556 556 564 564 635 698 Expenses US$M 543 550 548 556 551 678 788 Underwriting result US$M 111 (304) (313) 83 72 30 (38)Net claims ratio % 66.0 75.3 77.7 56.0 64.2 63.4 67.6 Net commission ratio % 15.7 17.1 15.6 20.7 17.0 17.3 15.6 Expense ratio % 15.2 17.0 15.5 20.4 16.6 18.5 17.6 Combined operating ratio % 96.9 109.4 108.8 97.0 97.8 99.2 100.8 Adjusted combined operating ratio 3 % 97.9 109.7 109.1 97.7 98.5 99.8 100.4 Insurance profit margin % 6.2 (7.0) (6.7) 6.1 4.7 2.5 0.2
1 Excludes transactions to reinsure liabilities.2 Comparability of prior period data is reduced due to the sale of M&LS.3 Excludes the impact of changes in risk-free rates used to discount net outstanding claims.
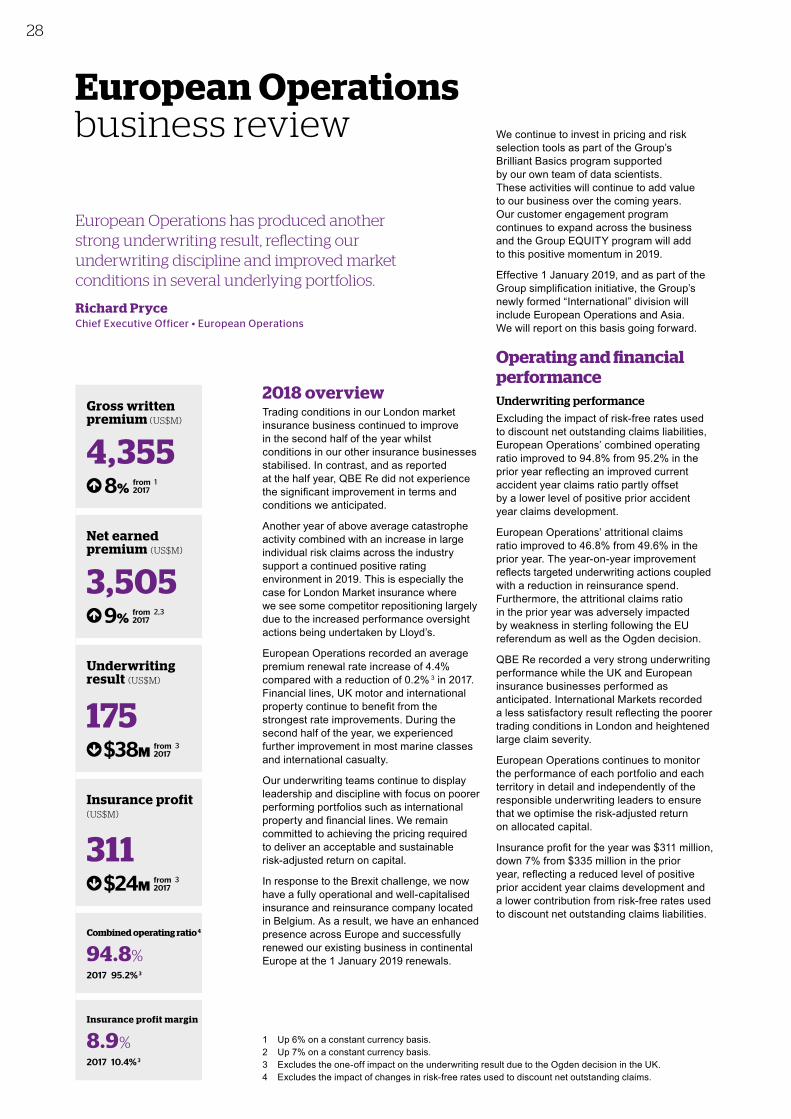
28
1 Up 6% on a constant currency basis.2 Up 7% on a constant currency basis.3 Excludes the one-off impact on the underwriting result due to the Ogden decision in the UK.4 Excludes the impact of changes in risk-free rates used to discount net outstanding claims.
2018 overviewTrading conditions in our London market insurance business continued to improve in the second half of the year whilst conditions in our other insurance businesses stabilised. In contrast, and as reported at the half year, QBE Re did not experience the significant improvement in terms and conditions we anticipated.
Another year of above average catastrophe activity combined with an increase in large individual risk claims across the industry support a continued positive rating environment in 2019. This is especially the case for London Market insurance where we see some competitor repositioning largely due to the increased performance oversight actions being undertaken by Lloyd’s.
European Operations recorded an average premium renewal rate increase of 4.4% compared with a reduction of 0.2% 3 in 2017. Financial lines, UK motor and international property continue to benefit from the strongest rate improvements. During the second half of the year, we experienced further improvement in most marine classes and international casualty.
Our underwriting teams continue to display leadership and discipline with focus on poorer performing portfolios such as international property and financial lines. We remain committed to achieving the pricing required to deliver an acceptable and sustainable risk-adjusted return on capital.
In response to the Brexit challenge, we now have a fully operational and well-capitalised insurance and reinsurance company located in Belgium. As a result, we have an enhanced presence across Europe and successfully renewed our existing business in continental Europe at the 1 January 2019 renewals.
We continue to invest in pricing and risk selection tools as part of the Group’s Brilliant Basics program supported by our own team of data scientists. These activities will continue to add value to our business over the coming years. Our customer engagement program continues to expand across the business and the Group EQUITY program will add to this positive momentum in 2019.
Effective 1 January 2019, and as part of the Group simplification initiative, the Group’s newly formed “International” division will include European Operations and Asia. We will report on this basis going forward.
Operating and financial performance Underwriting performanceExcluding the impact of risk-free rates used to discount net outstanding claims liabilities, European Operations’ combined operating ratio improved to 94.8% from 95.2% in the prior year reflecting an improved current accident year claims ratio partly offset by a lower level of positive prior accident year claims development.
European Operations’ attritional claims ratio improved to 46.8% from 49.6% in the prior year. The year-on-year improvement reflects targeted underwriting actions coupled with a reduction in reinsurance spend. Furthermore, the attritional claims ratio in the prior year was adversely impacted by weakness in sterling following the EU referendum as well as the Ogden decision.
QBE Re recorded a very strong underwriting performance while the UK and European insurance businesses performed as anticipated. International Markets recorded a less satisfactory result reflecting the poorer trading conditions in London and heightened large claim severity.
European Operations continues to monitor the performance of each portfolio and each territory in detail and independently of the responsible underwriting leaders to ensure that we optimise the risk-adjusted return on allocated capital.
Insurance profit for the year was $311 million, down 7% from $335 million in the prior year, reflecting a reduced level of positive prior accident year claims development and a lower contribution from risk-free rates used to discount net outstanding claims liabilities.
European Operations business review
European Operations has produced another strong underwriting result, reflecting our underwriting discipline and improved market conditions in several underlying portfolios.
Richard Pryce Chief Executive Officer • European Operations
Gross written premium (US$M)
4,355 8%
from 2017
1
Net earned premium (US$M)
3,505 9%
from 2017
2,3
Underwriting result (US$M)
175 $38M
from 2017
3
Insurance profit (US$M)
311 $24M
from 2017
3
Combined operating ratio 4
94.8%2017 95.2% 3
Insurance profit margin
8.9%2017 10.4% 3
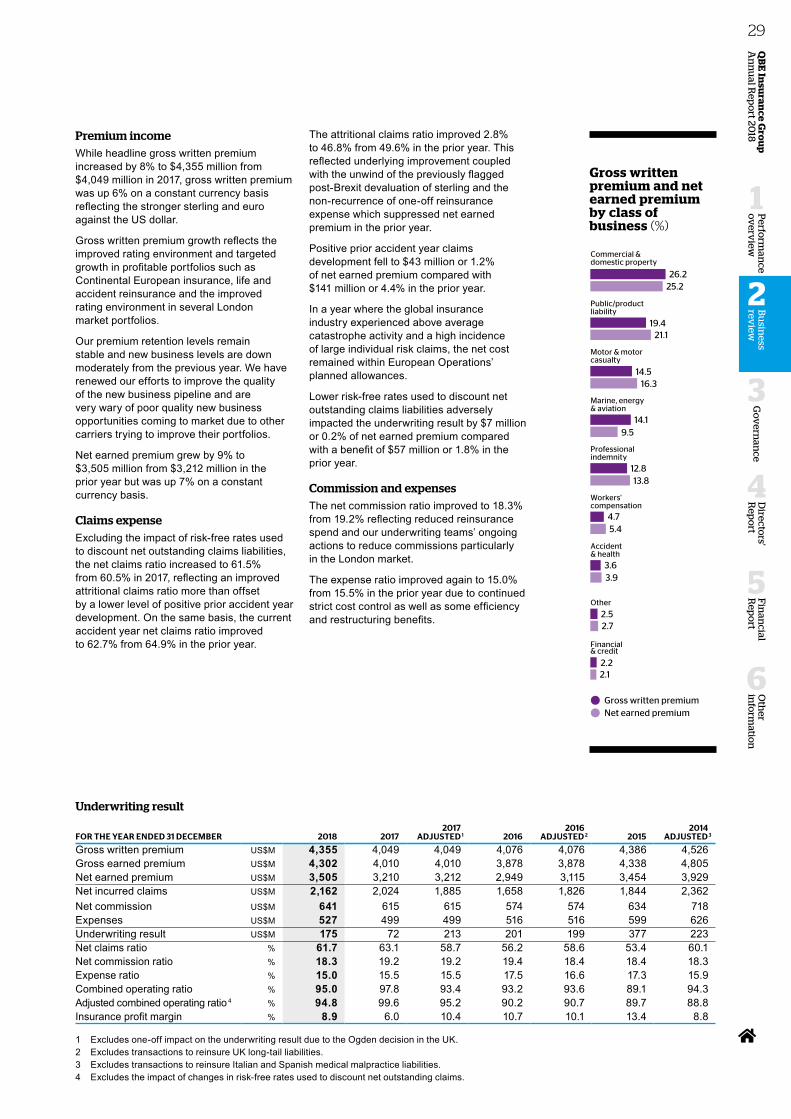
Oth
er in
form
ation
6
Fin
ancial
Rep
ort
5
Perfo
rman
ce o
verv
iew
1
Go
vern
ance
3
Directo
rs' R
epo
rt
4
QB
E In
suran
ce Gro
up
A
nn
ual R
epo
rt 2018
29B
usin
ess rev
iew
2
Gross written premiumNet earned premium
27.7
8.2
8.0
8.8
8.8
7.59.2
6.58.3
7.69.8
1.71.8
0.91.0
32.824.7
26.7
Agriculture
Accident & health
Professionalindemnity
Workers' compensation
Marine, energy & aviation
Financial & credit
Motor &motor casualty
Public/product liability
Commercial & domestic property
Gross written premiumNet earned premium
21.1
14.5
14.1
16.3
9.5
4.75.4
3.63.9
12.813.8
2.52.7
2.12.2
26.225.2
19.4
Marine, energy & aviation
Workers' compensation
Professional indemnity
Other
Financial & credit
Accident & health
Motor & motor casualty
Public/product liability
Commercial & domestic property
Gross written premiumNet earned premium
31.4
7.9
7.2
7.7
7.7
6.17.1
3.54.2
6.15.7
3.13.2
2.62.6
34.730.4
28.8
Financial & credit
Workers' compensation
Agriculture
Public/product liability
Marine, energy & aviation
Professional indemnity
Accident & health
Motor &motor casualty
Commercial & domestic property
Gross written premiumNet earned premium
Workers' compensation
16.8
13.8
12.5
18.1
14.8
7.2
7.0
11.0
12.2
7.1
8.0
2.54.6
28.0
20.6
15.8
Commercial & domestic property
Motor & motor casualty
Professional indemnity
Public/productliability
Financial & credit
Marine, energy & aviation
Accident & health
NAO
EO
ANZO
APO
Premium incomeWhile headline gross written premium increased by 8% to $4,355 million from $4,049 million in 2017, gross written premium was up 6% on a constant currency basis reflecting the stronger sterling and euro against the US dollar.
Gross written premium growth reflects the improved rating environment and targeted growth in profitable portfolios such as Continental European insurance, life and accident reinsurance and the improved rating environment in several London market portfolios.
Our premium retention levels remain stable and new business levels are down moderately from the previous year. We have renewed our efforts to improve the quality of the new business pipeline and are very wary of poor quality new business opportunities coming to market due to other carriers trying to improve their portfolios.
Net earned premium grew by 9% to $3,505 million from $3,212 million in the prior year but was up 7% on a constant currency basis.
Claims expenseExcluding the impact of risk-free rates used to discount net outstanding claims liabilities, the net claims ratio increased to 61.5% from 60.5% in 2017, reflecting an improved attritional claims ratio more than offset by a lower level of positive prior accident year development. On the same basis, the current accident year net claims ratio improved to 62.7% from 64.9% in the prior year.
The attritional claims ratio improved 2.8% to 46.8% from 49.6% in the prior year. This reflected underlying improvement coupled with the unwind of the previously flagged post-Brexit devaluation of sterling and the non-recurrence of one-off reinsurance expense which suppressed net earned premium in the prior year.
Positive prior accident year claims development fell to $43 million or 1.2% of net earned premium compared with $141 million or 4.4% in the prior year.
In a year where the global insurance industry experienced above average catastrophe activity and a high incidence of large individual risk claims, the net cost remained within European Operations’ planned allowances.
Lower risk-free rates used to discount net outstanding claims liabilities adversely impacted the underwriting result by $7 million or 0.2% of net earned premium compared with a benefit of $57 million or 1.8% in the prior year.
Commission and expensesThe net commission ratio improved to 18.3% from 19.2% reflecting reduced reinsurance spend and our underwriting teams’ ongoing actions to reduce commissions particularly in the London market.
The expense ratio improved again to 15.0% from 15.5% in the prior year due to continued strict cost control as well as some efficiency and restructuring benefits.
Gross written premium and net earned premium by class of business (%)
Underwriting result
FOR THE YEAR ENDED 31 DECEMBER 2018 20172017
ADJUSTED 1 20162016
ADJUSTED 2 20152014
ADJUSTED 3
Gross written premium US$M 4,355 4,049 4,049 4,076 4,076 4,386 4,526 Gross earned premium US$M 4,302 4,010 4,010 3,878 3,878 4,338 4,805 Net earned premium US$M 3,505 3,210 3,212 2,949 3,115 3,454 3,929 Net incurred claims US$M 2,162 2,024 1,885 1,658 1,826 1,844 2,362 Net commission US$M 641 615 615 574 574 634 718 Expenses US$M 527 499 499 516 516 599 626 Underwriting result US$M 175 72 213 201 199 377 223 Net claims ratio % 61.7 63.1 58.7 56.2 58.6 53.4 60.1 Net commission ratio % 18.3 19.2 19.2 19.4 18.4 18.4 18.3 Expense ratio % 15.0 15.5 15.5 17.5 16.6 17.3 15.9 Combined operating ratio % 95.0 97.8 93.4 93.2 93.6 89.1 94.3 Adjusted combined operating ratio 4 % 94.8 99.6 95.2 90.2 90.7 89.7 88.8 Insurance profit margin % 8.9 6.0 10.4 10.7 10.1 13.4 8.8
1 Excludes one-off impact on the underwriting result due to the Ogden decision in the UK.2 Excludes transactions to reinsure UK long-tail liabilities. 3 Excludes transactions to reinsure Italian and Spanish medical malpractice liabilities.4 Excludes the impact of changes in risk-free rates used to discount net outstanding claims.
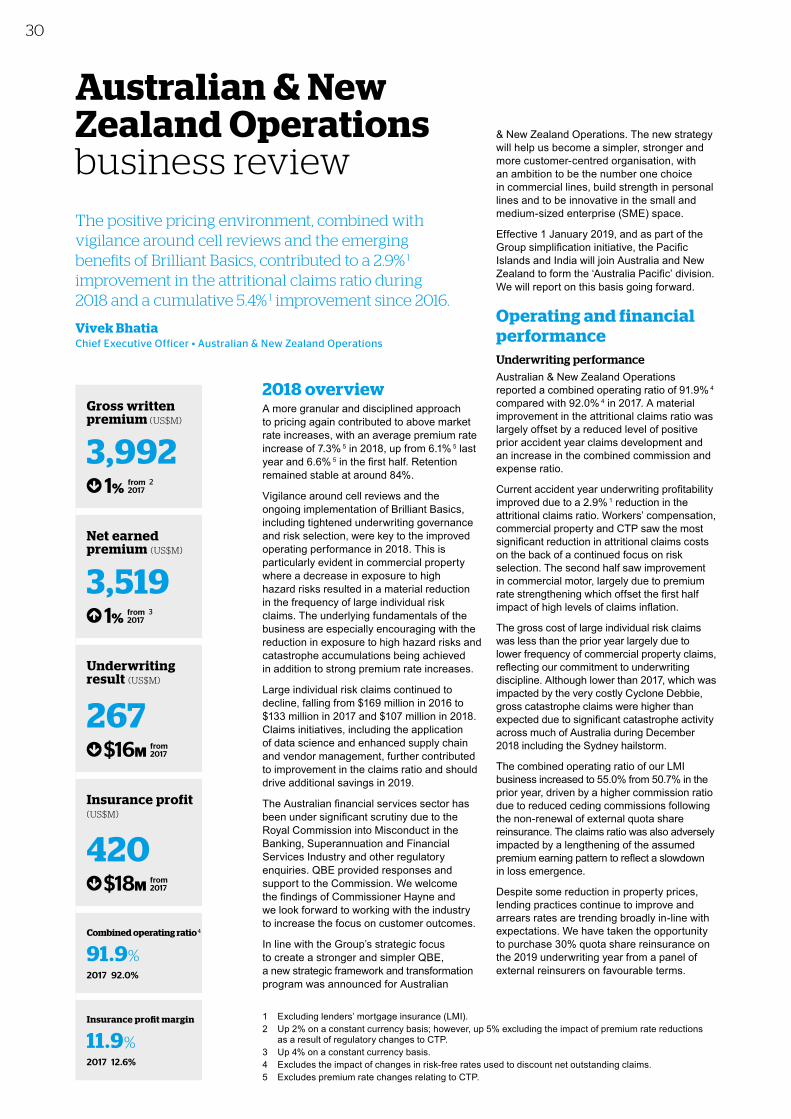
30
1 Excluding lenders’ mortgage insurance (LMI).2 Up 2% on a constant currency basis; however, up 5% excluding the impact of premium rate reductions
as a result of regulatory changes to CTP.3 Up 4% on a constant currency basis.4 Excludes the impact of changes in risk-free rates used to discount net outstanding claims.5 Excludes premium rate changes relating to CTP.
2018 overview A more granular and disciplined approach to pricing again contributed to above market rate increases, with an average premium rate increase of 7.3% 5 in 2018, up from 6.1% 5 last year and 6.6% 5 in the first half. Retention remained stable at around 84%.
Vigilance around cell reviews and the ongoing implementation of Brilliant Basics, including tightened underwriting governance and risk selection, were key to the improved operating performance in 2018. This is particularly evident in commercial property where a decrease in exposure to high hazard risks resulted in a material reduction in the frequency of large individual risk claims. The underlying fundamentals of the business are especially encouraging with the reduction in exposure to high hazard risks and catastrophe accumulations being achieved in addition to strong premium rate increases.
Large individual risk claims continued to decline, falling from $169 million in 2016 to $133 million in 2017 and $107 million in 2018. Claims initiatives, including the application of data science and enhanced supply chain and vendor management, further contributed to improvement in the claims ratio and should drive additional savings in 2019.
The Australian financial services sector has been under significant scrutiny due to the Royal Commission into Misconduct in the Banking, Superannuation and Financial Services Industry and other regulatory enquiries. QBE provided responses and support to the Commission. We welcome the findings of Commissioner Hayne and we look forward to working with the industry to increase the focus on customer outcomes.
In line with the Group’s strategic focus to create a stronger and simpler QBE, a new strategic framework and transformation program was announced for Australian
& New Zealand Operations. The new strategy will help us become a simpler, stronger and more customer-centred organisation, with an ambition to be the number one choice in commercial lines, build strength in personal lines and to be innovative in the small and medium-sized enterprise (SME) space.
Effective 1 January 2019, and as part of the Group simplification initiative, the Pacific Islands and India will join Australia and New Zealand to form the ‘Australia Pacific’ division. We will report on this basis going forward.
Operating and financial performanceUnderwriting performance Australian & New Zealand Operations reported a combined operating ratio of 91.9% 4 compared with 92.0% 4 in 2017. A material improvement in the attritional claims ratio was largely offset by a reduced level of positive prior accident year claims development and an increase in the combined commission and expense ratio.
Current accident year underwriting profitability improved due to a 2.9% 1 reduction in the attritional claims ratio. Workers’ compensation, commercial property and CTP saw the most significant reduction in attritional claims costs on the back of a continued focus on risk selection. The second half saw improvement in commercial motor, largely due to premium rate strengthening which offset the first half impact of high levels of claims inflation.
The gross cost of large individual risk claims was less than the prior year largely due to lower frequency of commercial property claims, reflecting our commitment to underwriting discipline. Although lower than 2017, which was impacted by the very costly Cyclone Debbie, gross catastrophe claims were higher than expected due to significant catastrophe activity across much of Australia during December 2018 including the Sydney hailstorm.
The combined operating ratio of our LMI business increased to 55.0% from 50.7% in the prior year, driven by a higher commission ratio due to reduced ceding commissions following the non-renewal of external quota share reinsurance. The claims ratio was also adversely impacted by a lengthening of the assumed premium earning pattern to reflect a slowdown in loss emergence.
Despite some reduction in property prices, lending practices continue to improve and arrears rates are trending broadly in-line with expectations. We have taken the opportunity to purchase 30% quota share reinsurance on the 2019 underwriting year from a panel of external reinsurers on favourable terms.
Australian & New Zealand Operations business review
The positive pricing environment, combined with vigilance around cell reviews and the emerging benefits of Brilliant Basics, contributed to a 2.9% 1 improvement in the attritional claims ratio during 2018 and a cumulative 5.4% 1 improvement since 2016.
Vivek Bhatia Chief Executive Officer • Australian & New Zealand Operations
Gross written premium (US$M)
3,992 1%
from 2017
2
Net earned premium (US$M)
3,519 1%
from 2017
3
Underwriting result (US$M)
267 $16M
from 2017
Insurance profit (US$M)
420 $18M
from 2017
Combined operating ratio 4
91.9%2017 92.0%
Insurance profit margin
11.9%2017 12.6%
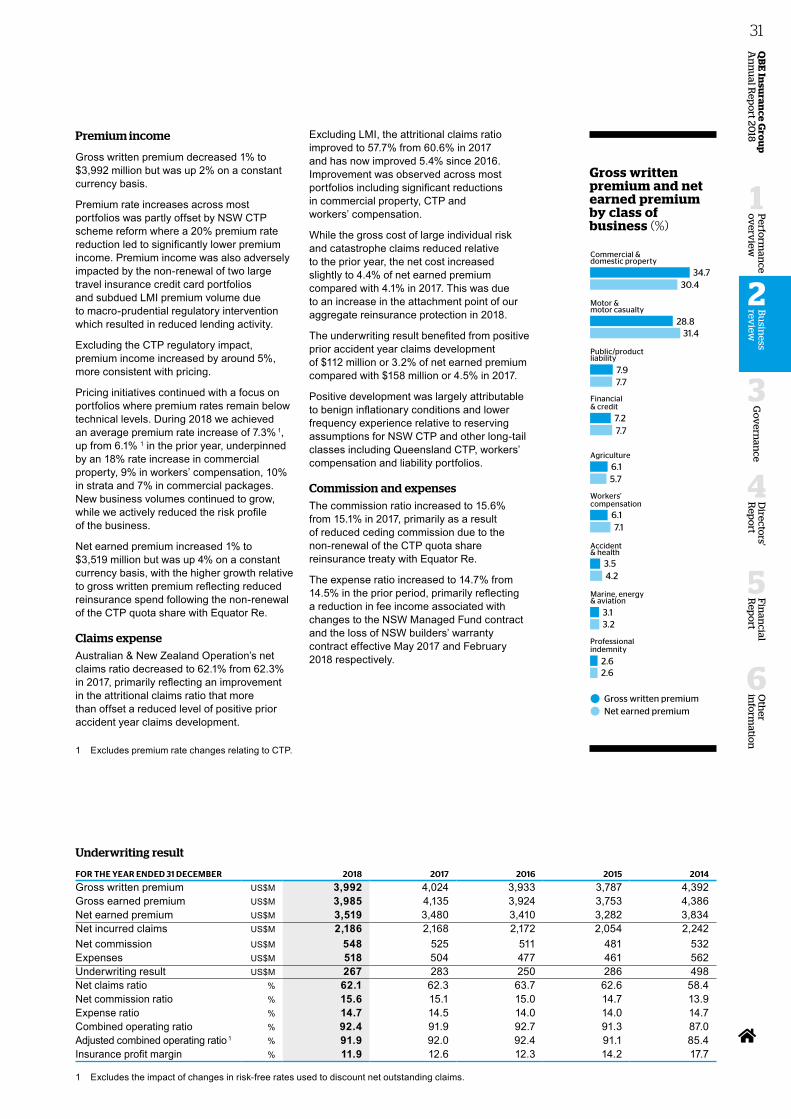
Oth
er in
form
ation
6
Fin
ancial
Rep
ort
5
Perfo
rman
ce o
verv
iew
1
Go
vern
ance
3
Directo
rs' R
epo
rt
4
QB
E In
suran
ce Gro
up
A
nn
ual R
epo
rt 2018
31B
usin
ess rev
iew
2
1 Excludes premium rate changes relating to CTP.
Gross written premiumNet earned premium
27.7
8.2
8.0
8.8
8.8
7.59.2
6.58.3
7.69.8
1.71.8
0.91.0
32.824.7
26.7
Agriculture
Accident & health
Professionalindemnity
Workers' compensation
Marine, energy & aviation
Financial & credit
Motor &motor casualty
Public/product liability
Commercial & domestic property
Gross written premiumNet earned premium
21.1
14.5
14.1
16.3
9.5
4.75.4
3.63.9
12.813.8
2.52.7
2.12.2
26.225.2
19.4
Marine, energy & aviation
Workers' compensation
Professional indemnity
Other
Financial & credit
Accident & health
Motor & motor casualty
Public/product liability
Commercial & domestic property
Gross written premiumNet earned premium
31.4
7.9
7.2
7.7
7.7
6.17.1
3.54.2
6.15.7
3.13.2
2.62.6
34.730.4
28.8
Financial & credit
Workers' compensation
Agriculture
Public/product liability
Marine, energy & aviation
Professional indemnity
Accident & health
Motor &motor casualty
Commercial & domestic property
Gross written premiumNet earned premium
Workers' compensation
16.8
13.8
12.5
18.1
14.8
7.2
7.0
11.0
12.2
7.1
8.0
2.54.6
28.0
20.6
15.8
Commercial & domestic property
Motor & motor casualty
Professional indemnity
Public/productliability
Financial & credit
Marine, energy & aviation
Accident & health
NAO
EO
ANZO
APO
Premium income
Gross written premium decreased 1% to $3,992 million but was up 2% on a constant currency basis.
Premium rate increases across most portfolios was partly offset by NSW CTP scheme reform where a 20% premium rate reduction led to significantly lower premium income. Premium income was also adversely impacted by the non-renewal of two large travel insurance credit card portfolios and subdued LMI premium volume due to macro-prudential regulatory intervention which resulted in reduced lending activity.
Excluding the CTP regulatory impact, premium income increased by around 5%, more consistent with pricing.
Pricing initiatives continued with a focus on portfolios where premium rates remain below technical levels. During 2018 we achieved an average premium rate increase of 7.3% 1, up from 6.1% 1 in the prior year, underpinned by an 18% rate increase in commercial property, 9% in workers’ compensation, 10% in strata and 7% in commercial packages. New business volumes continued to grow, while we actively reduced the risk profile of the business.
Net earned premium increased 1% to $3,519 million but was up 4% on a constant currency basis, with the higher growth relative to gross written premium reflecting reduced reinsurance spend following the non-renewal of the CTP quota share with Equator Re.
Claims expense Australian & New Zealand Operation’s net claims ratio decreased to 62.1% from 62.3% in 2017, primarily reflecting an improvement in the attritional claims ratio that more than offset a reduced level of positive prior accident year claims development.
Excluding LMI, the attritional claims ratio improved to 57.7% from 60.6% in 2017 and has now improved 5.4% since 2016. Improvement was observed across most portfolios including significant reductions in commercial property, CTP and workers’ compensation.
While the gross cost of large individual risk and catastrophe claims reduced relative to the prior year, the net cost increased slightly to 4.4% of net earned premium compared with 4.1% in 2017. This was due to an increase in the attachment point of our aggregate reinsurance protection in 2018.
The underwriting result benefited from positive prior accident year claims development of $112 million or 3.2% of net earned premium compared with $158 million or 4.5% in 2017.
Positive development was largely attributable to benign inflationary conditions and lower frequency experience relative to reserving assumptions for NSW CTP and other long-tail classes including Queensland CTP, workers’ compensation and liability portfolios.
Commission and expenses The commission ratio increased to 15.6% from 15.1% in 2017, primarily as a result of reduced ceding commission due to the non-renewal of the CTP quota share reinsurance treaty with Equator Re.
The expense ratio increased to 14.7% from 14.5% in the prior period, primarily reflecting a reduction in fee income associated with changes to the NSW Managed Fund contract and the loss of NSW builders’ warranty contract effective May 2017 and February 2018 respectively.
Gross written premium and net earned premium by class of business (%)
Underwriting result
FOR THE YEAR ENDED 31 DECEMBER 2018 2017 2016 2015 2014
Gross written premium US$M 3,992 4,024 3,933 3,787 4,392 Gross earned premium US$M 3,985 4,135 3,924 3,753 4,386 Net earned premium US$M 3,519 3,480 3,410 3,282 3,834 Net incurred claims US$M 2,186 2,168 2,172 2,054 2,242 Net commission US$M 548 525 511 481 532 Expenses US$M 518 504 477 461 562 Underwriting result US$M 267 283 250 286 498 Net claims ratio % 62.1 62.3 63.7 62.6 58.4 Net commission ratio % 15.6 15.1 15.0 14.7 13.9 Expense ratio % 14.7 14.5 14.0 14.0 14.7 Combined operating ratio % 92.4 91.9 92.7 91.3 87.0 Adjusted combined operating ratio 1 % 91.9 92.0 92.4 91.1 85.4 Insurance profit margin % 11.9 12.6 12.3 14.2 17.7
1 Excludes the impact of changes in risk-free rates used to discount net outstanding claims.
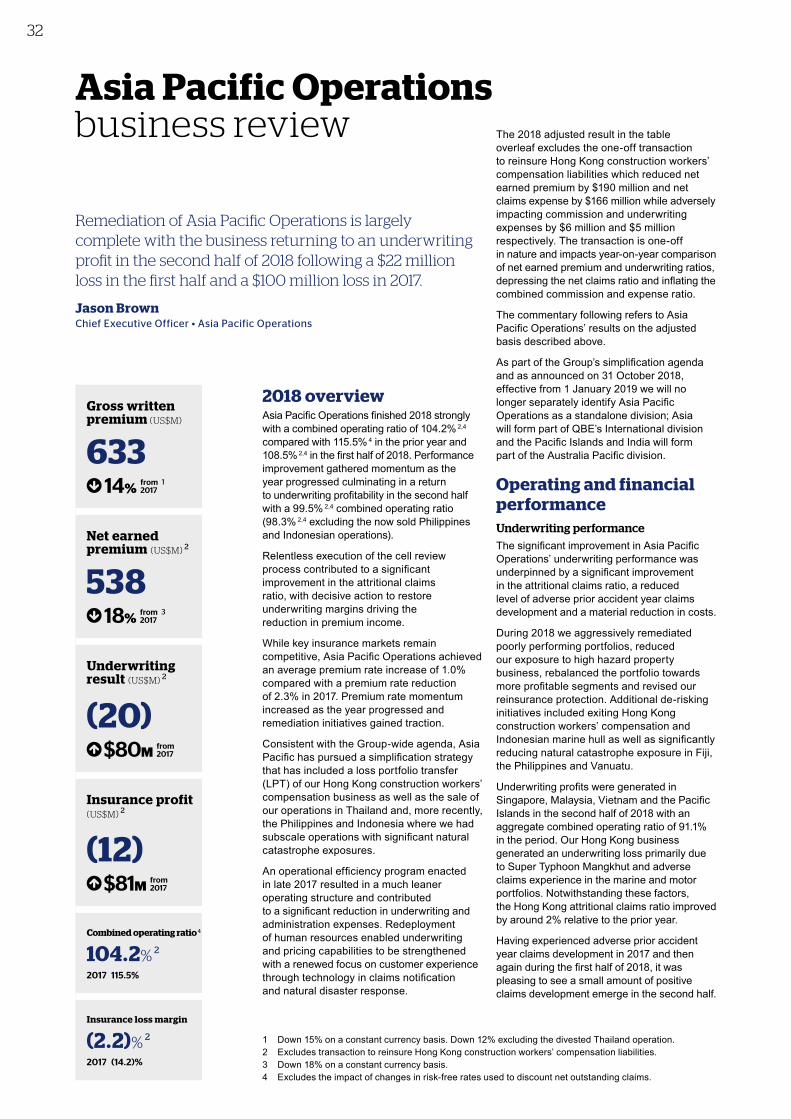
32
1 Down 15% on a constant currency basis. Down 12% excluding the divested Thailand operation.2 Excludes transaction to reinsure Hong Kong construction workers’ compensation liabilities.3 Down 18% on a constant currency basis.4 Excludes the impact of changes in risk-free rates used to discount net outstanding claims.
2018 overviewAsia Pacific Operations finished 2018 strongly with a combined operating ratio of 104.2% 2,4 compared with 115.5% 4 in the prior year and 108.5% 2,4 in the first half of 2018. Performance improvement gathered momentum as the year progressed culminating in a return to underwriting profitability in the second half with a 99.5% 2,4 combined operating ratio (98.3% 2,4 excluding the now sold Philippines and Indonesian operations).
Relentless execution of the cell review process contributed to a significant improvement in the attritional claims ratio, with decisive action to restore underwriting margins driving the reduction in premium income.
While key insurance markets remain competitive, Asia Pacific Operations achieved an average premium rate increase of 1.0% compared with a premium rate reduction of 2.3% in 2017. Premium rate momentum increased as the year progressed and remediation initiatives gained traction.
Consistent with the Group-wide agenda, Asia Pacific has pursued a simplification strategy that has included a loss portfolio transfer (LPT) of our Hong Kong construction workers’ compensation business as well as the sale of our operations in Thailand and, more recently, the Philippines and Indonesia where we had subscale operations with significant natural catastrophe exposures.
An operational efficiency program enacted in late 2017 resulted in a much leaner operating structure and contributed to a significant reduction in underwriting and administration expenses. Redeployment of human resources enabled underwriting and pricing capabilities to be strengthened with a renewed focus on customer experience through technology in claims notification and natural disaster response.
The 2018 adjusted result in the table overleaf excludes the one-off transaction to reinsure Hong Kong construction workers’ compensation liabilities which reduced net earned premium by $190 million and net claims expense by $166 million while adversely impacting commission and underwriting expenses by $6 million and $5 million respectively. The transaction is one-off in nature and impacts year-on-year comparison of net earned premium and underwriting ratios, depressing the net claims ratio and inflating the combined commission and expense ratio.
The commentary following refers to Asia Pacific Operations’ results on the adjusted basis described above.
As part of the Group’s simplification agenda and as announced on 31 October 2018, effective from 1 January 2019 we will no longer separately identify Asia Pacific Operations as a standalone division; Asia will form part of QBE’s International division and the Pacific Islands and India will form part of the Australia Pacific division.
Operating and financial performance Underwriting performanceThe significant improvement in Asia Pacific Operations’ underwriting performance was underpinned by a significant improvement in the attritional claims ratio, a reduced level of adverse prior accident year claims development and a material reduction in costs.
During 2018 we aggressively remediated poorly performing portfolios, reduced our exposure to high hazard property business, rebalanced the portfolio towards more profitable segments and revised our reinsurance protection. Additional de-risking initiatives included exiting Hong Kong construction workers’ compensation and Indonesian marine hull as well as significantly reducing natural catastrophe exposure in Fiji, the Philippines and Vanuatu.
Underwriting profits were generated in Singapore, Malaysia, Vietnam and the Pacific Islands in the second half of 2018 with an aggregate combined operating ratio of 91.1% in the period. Our Hong Kong business generated an underwriting loss primarily due to Super Typhoon Mangkhut and adverse claims experience in the marine and motor portfolios. Notwithstanding these factors, the Hong Kong attritional claims ratio improved by around 2% relative to the prior year.
Having experienced adverse prior accident year claims development in 2017 and then again during the first half of 2018, it was pleasing to see a small amount of positive claims development emerge in the second half.
Asia Pacific Operations business review
Remediation of Asia Pacific Operations is largely complete with the business returning to an underwriting profit in the second half of 2018 following a $22 million loss in the first half and a $100 million loss in 2017.
Jason Brown Chief Executive Officer • Asia Pacific Operations
Gross written premium (US$M)
633 14%
from 2017
1
Net earned premium (US$M) 2
538 18%
from 2017
3
Underwriting result (US$M) 2
(20) $80M
from 2017
Insurance profit (US$M) 2
(12) $81M
from 2017
Combined operating ratio 4
104.2% 2
2017 115.5%
Insurance loss margin
(2.2)% 2
2017 (14.2)%
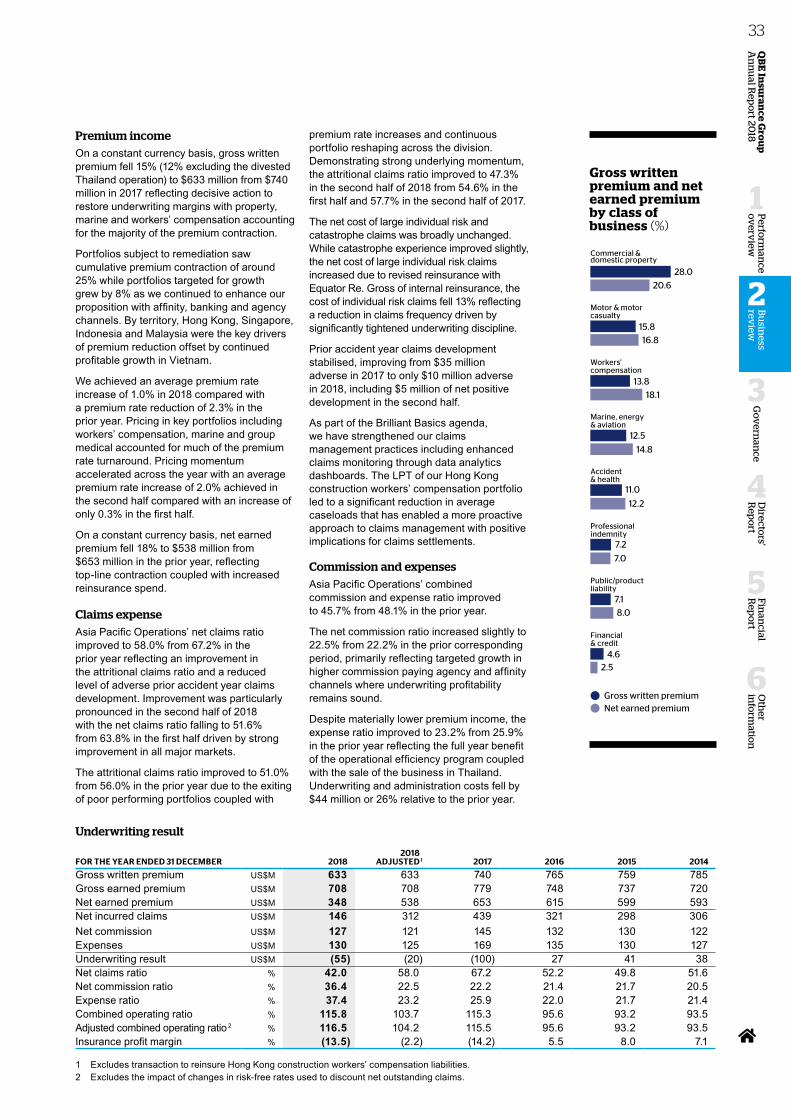
Oth
er in
form
ation
6
Fin
ancial
Rep
ort
5
Perfo
rman
ce o
verv
iew
1
Go
vern
ance
3
Directo
rs' R
epo
rt
4
QB
E In
suran
ce Gro
up
A
nn
ual R
epo
rt 2018
33B
usin
ess rev
iew
2
Gross written premiumNet earned premium
27.7
8.2
8.0
8.8
8.8
7.59.2
6.58.3
7.69.8
1.71.8
0.91.0
32.824.7
26.7
Agriculture
Accident & health
Professionalindemnity
Workers' compensation
Marine, energy & aviation
Financial & credit
Motor &motor casualty
Public/product liability
Commercial & domestic property
Gross written premiumNet earned premium
21.1
14.5
14.1
16.3
9.5
4.75.4
3.63.9
12.813.8
2.52.7
2.12.2
26.225.2
19.4
Marine, energy & aviation
Workers' compensation
Professional indemnity
Other
Financial & credit
Accident & health
Motor & motor casualty
Public/product liability
Commercial & domestic property
Gross written premiumNet earned premium
31.4
7.9
7.2
7.7
7.7
6.17.1
3.54.2
6.15.7
3.13.2
2.62.6
34.730.4
28.8
Financial & credit
Workers' compensation
Agriculture
Public/product liability
Marine, energy & aviation
Professional indemnity
Accident & health
Motor &motor casualty
Commercial & domestic property
Gross written premiumNet earned premium
Workers' compensation
16.8
13.8
12.5
18.1
14.8
7.2
7.0
11.0
12.2
7.1
8.0
2.54.6
28.0
20.6
15.8
Commercial & domestic property
Motor & motor casualty
Professional indemnity
Public/productliability
Financial & credit
Marine, energy & aviation
Accident & health
NAO
EO
ANZO
APO
Premium incomeOn a constant currency basis, gross written premium fell 15% (12% excluding the divested Thailand operation) to $633 million from $740 million in 2017 reflecting decisive action to restore underwriting margins with property, marine and workers’ compensation accounting for the majority of the premium contraction.
Portfolios subject to remediation saw cumulative premium contraction of around 25% while portfolios targeted for growth grew by 8% as we continued to enhance our proposition with affinity, banking and agency channels. By territory, Hong Kong, Singapore, Indonesia and Malaysia were the key drivers of premium reduction offset by continued profitable growth in Vietnam.
We achieved an average premium rate increase of 1.0% in 2018 compared with a premium rate reduction of 2.3% in the prior year. Pricing in key portfolios including workers’ compensation, marine and group medical accounted for much of the premium rate turnaround. Pricing momentum accelerated across the year with an average premium rate increase of 2.0% achieved in the second half compared with an increase of only 0.3% in the first half.
On a constant currency basis, net earned premium fell 18% to $538 million from $653 million in the prior year, reflecting top-line contraction coupled with increased reinsurance spend.
Claims expenseAsia Pacific Operations’ net claims ratio improved to 58.0% from 67.2% in the prior year reflecting an improvement in the attritional claims ratio and a reduced level of adverse prior accident year claims development. Improvement was particularly pronounced in the second half of 2018 with the net claims ratio falling to 51.6% from 63.8% in the first half driven by strong improvement in all major markets.
The attritional claims ratio improved to 51.0% from 56.0% in the prior year due to the exiting of poor performing portfolios coupled with
premium rate increases and continuous portfolio reshaping across the division. Demonstrating strong underlying momentum, the attritional claims ratio improved to 47.3% in the second half of 2018 from 54.6% in the first half and 57.7% in the second half of 2017.
The net cost of large individual risk and catastrophe claims was broadly unchanged. While catastrophe experience improved slightly, the net cost of large individual risk claims increased due to revised reinsurance with Equator Re. Gross of internal reinsurance, the cost of individual risk claims fell 13% reflecting a reduction in claims frequency driven by significantly tightened underwriting discipline.
Prior accident year claims development stabilised, improving from $35 million adverse in 2017 to only $10 million adverse in 2018, including $5 million of net positive development in the second half.
As part of the Brilliant Basics agenda, we have strengthened our claims management practices including enhanced claims monitoring through data analytics dashboards. The LPT of our Hong Kong construction workers’ compensation portfolio led to a significant reduction in average caseloads that has enabled a more proactive approach to claims management with positive implications for claims settlements.
Commission and expensesAsia Pacific Operations’ combined commission and expense ratio improved to 45.7% from 48.1% in the prior year.
The net commission ratio increased slightly to 22.5% from 22.2% in the prior corresponding period, primarily reflecting targeted growth in higher commission paying agency and affinity channels where underwriting profitability remains sound.
Despite materially lower premium income, the expense ratio improved to 23.2% from 25.9% in the prior year reflecting the full year benefit of the operational efficiency program coupled with the sale of the business in Thailand. Underwriting and administration costs fell by $44 million or 26% relative to the prior year.
Gross written premium and net earned premium by class of business (%)
Underwriting result
FOR THE YEAR ENDED 31 DECEMBER 20182018
ADJUSTED 1 2017 2016 2015 2014
Gross written premium US$M 633 633 740 765 759 785Gross earned premium US$M 708 708 779 748 737 720Net earned premium US$M 348 538 653 615 599 593Net incurred claims US$M 146 312 439 321 298 306Net commission US$M 127 121 145 132 130 122Expenses US$M 130 125 169 135 130 127Underwriting result US$M (55) (20) (100) 27 41 38Net claims ratio % 42.0 58.0 67.2 52.2 49.8 51.6Net commission ratio % 36.4 22.5 22.2 21.4 21.7 20.5Expense ratio % 37.4 23.2 25.9 22.0 21.7 21.4Combined operating ratio % 115.8 103.7 115.3 95.6 93.2 93.5Adjusted combined operating ratio 2 % 116.5 104.2 115.5 95.6 93.2 93.5Insurance profit margin % (13.5) (2.2) (14.2) 5.5 8.0 7.1
1 Excludes transaction to reinsure Hong Kong construction workers’ compensation liabilities.2 Excludes the impact of changes in risk-free rates used to discount net outstanding claims.
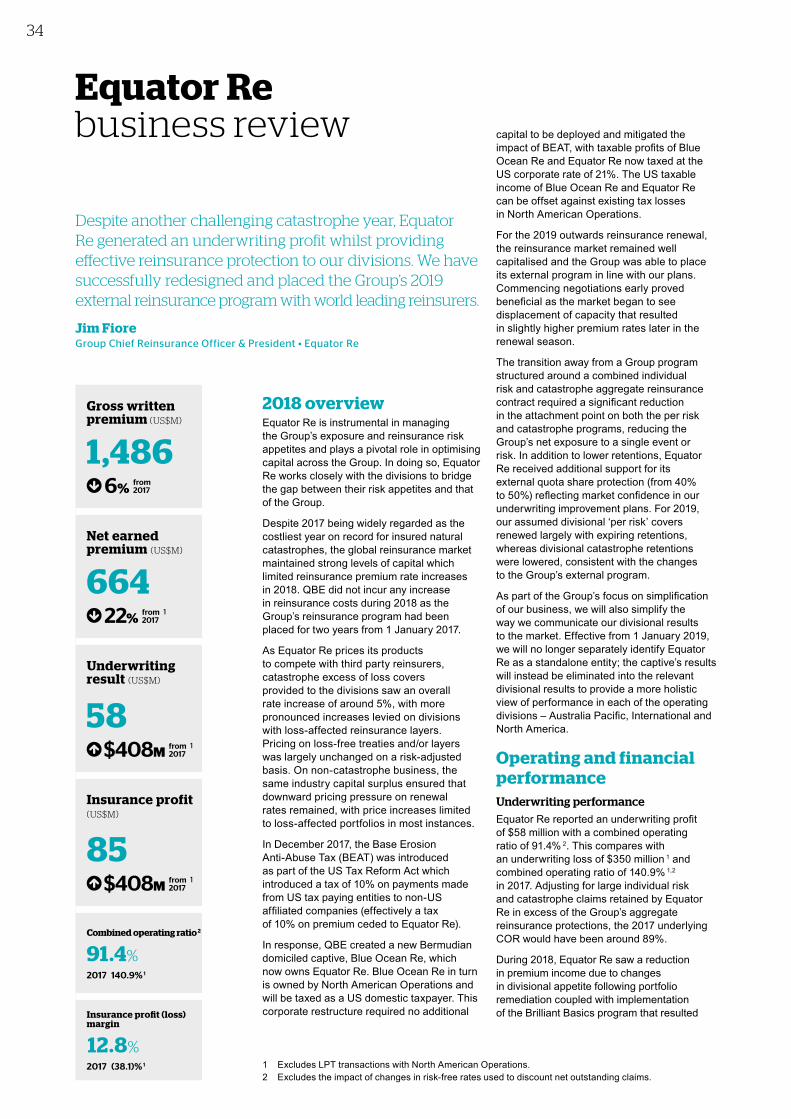
34
1 Excludes LPT transactions with North American Operations.2 Excludes the impact of changes in risk-free rates used to discount net outstanding claims.
2018 overviewEquator Re is instrumental in managing the Group’s exposure and reinsurance risk appetites and plays a pivotal role in optimising capital across the Group. In doing so, Equator Re works closely with the divisions to bridge the gap between their risk appetites and that of the Group.
Despite 2017 being widely regarded as the costliest year on record for insured natural catastrophes, the global reinsurance market maintained strong levels of capital which limited reinsurance premium rate increases in 2018. QBE did not incur any increase in reinsurance costs during 2018 as the Group’s reinsurance program had been placed for two years from 1 January 2017.
As Equator Re prices its products to compete with third party reinsurers, catastrophe excess of loss covers provided to the divisions saw an overall rate increase of around 5%, with more pronounced increases levied on divisions with loss-affected reinsurance layers. Pricing on loss-free treaties and/or layers was largely unchanged on a risk-adjusted basis. On non-catastrophe business, the same industry capital surplus ensured that downward pricing pressure on renewal rates remained, with price increases limited to loss-affected portfolios in most instances.
In December 2017, the Base Erosion Anti-Abuse Tax (BEAT) was introduced as part of the US Tax Reform Act which introduced a tax of 10% on payments made from US tax paying entities to non-US affiliated companies (effectively a tax of 10% on premium ceded to Equator Re).
In response, QBE created a new Bermudian domiciled captive, Blue Ocean Re, which now owns Equator Re. Blue Ocean Re in turn is owned by North American Operations and will be taxed as a US domestic taxpayer. This corporate restructure required no additional
capital to be deployed and mitigated the impact of BEAT, with taxable profits of Blue Ocean Re and Equator Re now taxed at the US corporate rate of 21%. The US taxable income of Blue Ocean Re and Equator Re can be offset against existing tax losses in North American Operations.
For the 2019 outwards reinsurance renewal, the reinsurance market remained well capitalised and the Group was able to place its external program in line with our plans. Commencing negotiations early proved beneficial as the market began to see displacement of capacity that resulted in slightly higher premium rates later in the renewal season.
The transition away from a Group program structured around a combined individual risk and catastrophe aggregate reinsurance contract required a significant reduction in the attachment point on both the per risk and catastrophe programs, reducing the Group’s net exposure to a single event or risk. In addition to lower retentions, Equator Re received additional support for its external quota share protection (from 40% to 50%) reflecting market confidence in our underwriting improvement plans. For 2019, our assumed divisional ‘per risk’ covers renewed largely with expiring retentions, whereas divisional catastrophe retentions were lowered, consistent with the changes to the Group’s external program.
As part of the Group’s focus on simplification of our business, we will also simplify the way we communicate our divisional results to the market. Effective from 1 January 2019, we will no longer separately identify Equator Re as a standalone entity; the captive’s results will instead be eliminated into the relevant divisional results to provide a more holistic view of performance in each of the operating divisions – Australia Pacific, International and North America.
Operating and financial performance Underwriting performance Equator Re reported an underwriting profit of $58 million with a combined operating ratio of 91.4% 2. This compares with an underwriting loss of $350 million 1 and combined operating ratio of 140.9% 1,2 in 2017. Adjusting for large individual risk and catastrophe claims retained by Equator Re in excess of the Group’s aggregate reinsurance protections, the 2017 underlying COR would have been around 89%.
During 2018, Equator Re saw a reduction in premium income due to changes in divisional appetite following portfolio remediation coupled with implementation of the Brilliant Basics program that resulted
Equator Re business review
Despite another challenging catastrophe year, Equator Re generated an underwriting profit whilst providing effective reinsurance protection to our divisions. We have successfully redesigned and placed the Group’s 2019 external reinsurance program with world leading reinsurers.
Jim Fiore Group Chief Reinsurance Officer & President • Equator Re
Gross written premium (US$M)
1,486 6%
from 2017
Net earned premium (US$M)
664 22%
from 2017
1
Underwriting result (US$M)
58 $408M
from 2017
1
Insurance profit (US$M)
85 $408M
from 2017
1
Combined operating ratio 2
91.4%2017 140.9% 1
Insurance profit (loss)margin
12.8%2017 (38.1)% 1
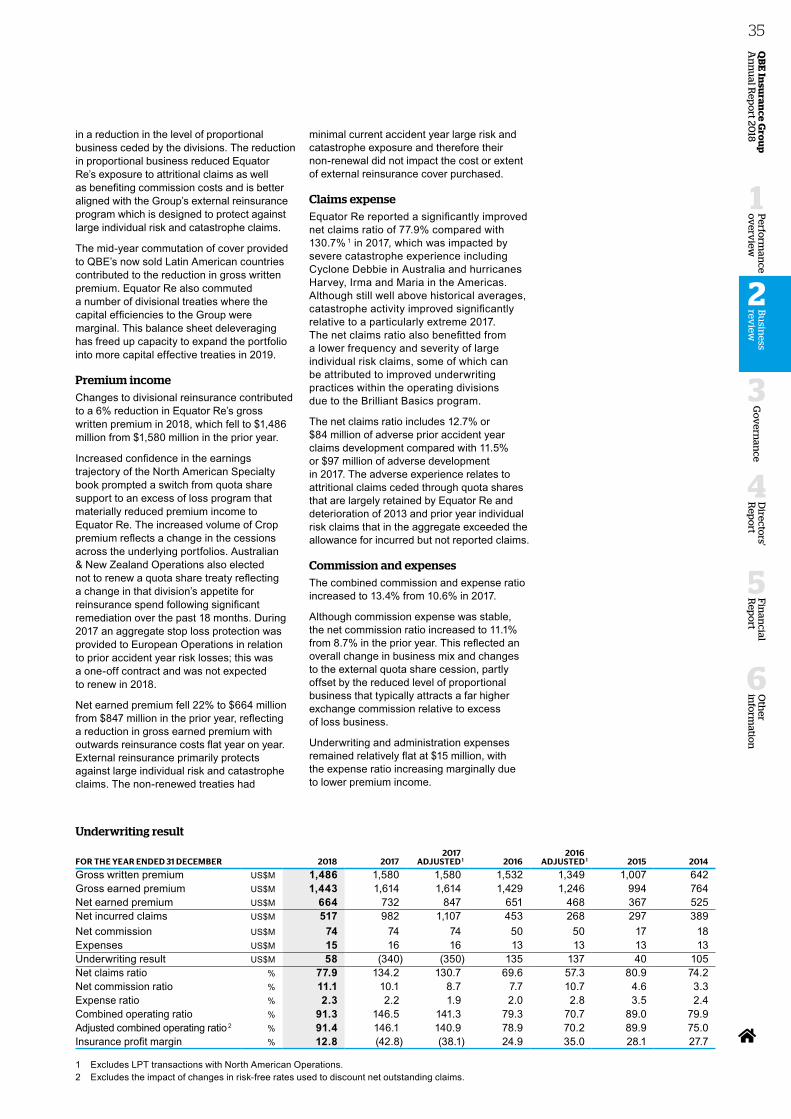
Oth
er in
form
ation
6
Fin
ancial
Rep
ort
5
Perfo
rman
ce o
verv
iew
1
Go
vern
ance
3
Directo
rs' R
epo
rt
4
QB
E In
suran
ce Gro
up
A
nn
ual R
epo
rt 2018
35B
usin
ess rev
iew
2
in a reduction in the level of proportional business ceded by the divisions. The reduction in proportional business reduced Equator Re’s exposure to attritional claims as well as benefiting commission costs and is better aligned with the Group’s external reinsurance program which is designed to protect against large individual risk and catastrophe claims.
The mid-year commutation of cover provided to QBE’s now sold Latin American countries contributed to the reduction in gross written premium. Equator Re also commuted a number of divisional treaties where the capital efficiencies to the Group were marginal. This balance sheet deleveraging has freed up capacity to expand the portfolio into more capital effective treaties in 2019.
Premium incomeChanges to divisional reinsurance contributed to a 6% reduction in Equator Re’s gross written premium in 2018, which fell to $1,486 million from $1,580 million in the prior year.
Increased confidence in the earnings trajectory of the North American Specialty book prompted a switch from quota share support to an excess of loss program that materially reduced premium income to Equator Re. The increased volume of Crop premium reflects a change in the cessions across the underlying portfolios. Australian & New Zealand Operations also elected not to renew a quota share treaty reflecting a change in that division’s appetite for reinsurance spend following significant remediation over the past 18 months. During 2017 an aggregate stop loss protection was provided to European Operations in relation to prior accident year risk losses; this was a one-off contract and was not expected to renew in 2018.
Net earned premium fell 22% to $664 million from $847 million in the prior year, reflecting a reduction in gross earned premium with outwards reinsurance costs flat year on year. External reinsurance primarily protects against large individual risk and catastrophe claims. The non-renewed treaties had
minimal current accident year large risk and catastrophe exposure and therefore their non-renewal did not impact the cost or extent of external reinsurance cover purchased.
Claims expenseEquator Re reported a significantly improved net claims ratio of 77.9% compared with 130.7% 1 in 2017, which was impacted by severe catastrophe experience including Cyclone Debbie in Australia and hurricanes Harvey, Irma and Maria in the Americas. Although still well above historical averages, catastrophe activity improved significantly relative to a particularly extreme 2017. The net claims ratio also benefitted from a lower frequency and severity of large individual risk claims, some of which can be attributed to improved underwriting practices within the operating divisions due to the Brilliant Basics program.
The net claims ratio includes 12.7% or $84 million of adverse prior accident year claims development compared with 11.5% or $97 million of adverse development in 2017. The adverse experience relates to attritional claims ceded through quota shares that are largely retained by Equator Re and deterioration of 2013 and prior year individual risk claims that in the aggregate exceeded the allowance for incurred but not reported claims.
Commission and expensesThe combined commission and expense ratio increased to 13.4% from 10.6% in 2017.
Although commission expense was stable, the net commission ratio increased to 11.1% from 8.7% in the prior year. This reflected an overall change in business mix and changes to the external quota share cession, partly offset by the reduced level of proportional business that typically attracts a far higher exchange commission relative to excess of loss business.
Underwriting and administration expenses remained relatively flat at $15 million, with the expense ratio increasing marginally due to lower premium income.
Underwriting result
FOR THE YEAR ENDED 31 DECEMBER 2018 20172017
ADJUSTED 1 20162016
ADJUSTED 1 2015 2014
Gross written premium US$M 1,486 1,580 1,580 1,532 1,349 1,007 642 Gross earned premium US$M 1,443 1,614 1,614 1,429 1,246 994 764 Net earned premium US$M 664 732 847 651 468 367 525 Net incurred claims US$M 517 982 1,107 453 268 297 389 Net commission US$M 74 74 74 50 50 17 18 Expenses US$M 15 16 16 13 13 13 13 Underwriting result US$M 58 (340) (350) 135 137 40 105 Net claims ratio % 77.9 134.2 130.7 69.6 57.3 80.9 74.2 Net commission ratio % 11.1 10.1 8.7 7.7 10.7 4.6 3.3 Expense ratio % 2.3 2.2 1.9 2.0 2.8 3.5 2.4 Combined operating ratio % 91.3 146.5 141.3 79.3 70.7 89.0 79.9 Adjusted combined operating ratio 2 % 91.4 146.1 140.9 78.9 70.2 89.9 75.0 Insurance profit margin % 12.8 (42.8) (38.1) 24.9 35.0 28.1 27.7
1 Excludes LPT transactions with North American Operations. 2 Excludes the impact of changes in risk-free rates used to discount net outstanding claims.
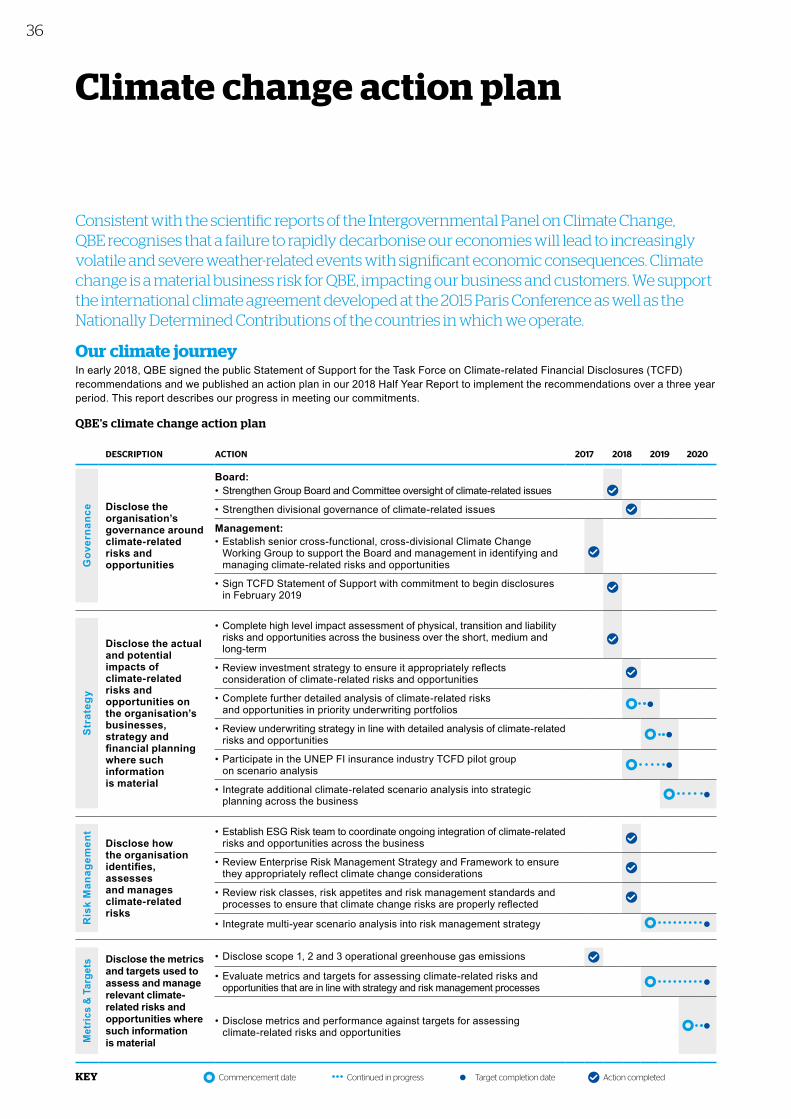
36
Consistent with the scientific reports of the Intergovernmental Panel on Climate Change, QBE recognises that a failure to rapidly decarbonise our economies will lead to increasingly volatile and severe weather-related events with significant economic consequences. Climate change is a material business risk for QBE, impacting our business and customers. We support the international climate agreement developed at the 2015 Paris Conference as well as the Nationally Determined Contributions of the countries in which we operate.
Our climate journeyIn early 2018, QBE signed the public Statement of Support for the Task Force on Climate-related Financial Disclosures (TCFD) recommendations and we published an action plan in our 2018 Half Year Report to implement the recommendations over a three year period. This report describes our progress in meeting our commitments.
KEY Commencement date Continued in progress Target completion date Action completed
DESCRIPTION ACTION 2017 2018 2019 2020
Gov
erna
nce Disclose the
organisation’s governance around climate‑related risks and opportunities
Board:• Strengthen Group Board and Committee oversight of climate-related issues
• Strengthen divisional governance of climate-related issues
Management:• Establish senior cross-functional, cross-divisional Climate Change
Working Group to support the Board and management in identifying and managing climate-related risks and opportunities
• Sign TCFD Statement of Support with commitment to begin disclosures in February 2019
Str
ateg
y
Disclose the actual and potential impacts of climate‑related risks and opportunities on the organisation’s businesses, strategy and financial planning where such information is material
• Complete high level impact assessment of physical, transition and liability risks and opportunities across the business over the short, medium and long-term
• Review investment strategy to ensure it appropriately reflects consideration of climate-related risks and opportunities
• Complete further detailed analysis of climate-related risks and opportunities in priority underwriting portfolios
• Review underwriting strategy in line with detailed analysis of climate-related risks and opportunities
• Participate in the UNEP FI insurance industry TCFD pilot group on scenario analysis
• Integrate additional climate-related scenario analysis into strategic planning across the business
Ris
k M
anag
emen
t
Disclose how the organisation identifies, assesses and manages climate‑related risks
• Establish ESG Risk team to coordinate ongoing integration of climate-related risks and opportunities across the business
• Review Enterprise Risk Management Strategy and Framework to ensure they appropriately reflect climate change considerations
• Review risk classes, risk appetites and risk management standards and processes to ensure that climate change risks are properly reflected
• Integrate multi-year scenario analysis into risk management strategy
Met
rics
& Ta
rget
s Disclose the metrics and targets used to assess and manage relevant climate‑ related risks and opportunities where such information is material
• Disclose scope 1, 2 and 3 operational greenhouse gas emissions
• Evaluate metrics and targets for assessing climate-related risks and opportunities that are in line with strategy and risk management processes
• Disclose metrics and performance against targets for assessing climate-related risks and opportunities
Climate change action plan
QBE's climate change action plan
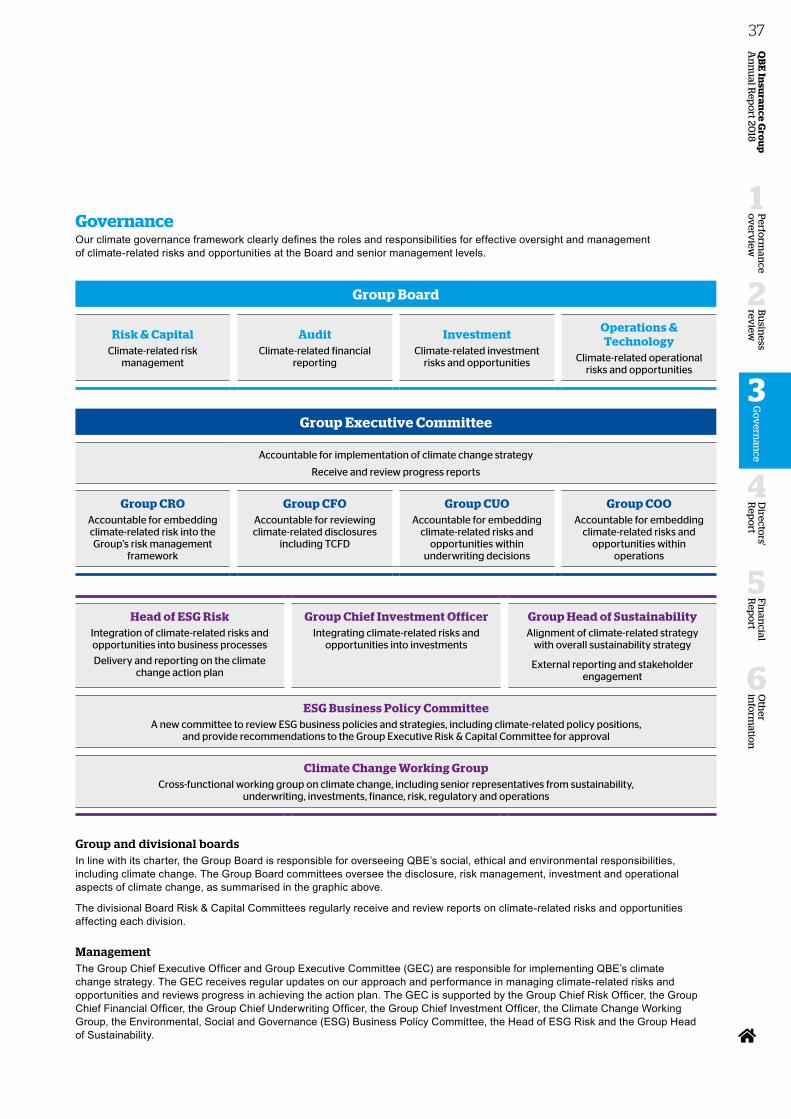
Oth
er in
form
ation
6
Fin
ancial
Rep
ort
5
Perfo
rman
ce o
verv
iew
1
Bu
siness
review
2
Directo
rs' R
epo
rt
4
QB
E In
suran
ce Gro
up
A
nn
ual R
epo
rt 2018
37G
ov
ernan
ce
3
Governance Our climate governance framework clearly defines the roles and responsibilities for effective oversight and management of climate-related risks and opportunities at the Board and senior management levels.
Group Board
Risk & CapitalClimate-related risk
management
AuditClimate-related financial
reporting
InvestmentClimate-related investment
risks and opportunities
Operations & Technology
Climate-related operational risks and opportunities
Group Executive Committee
Accountable for implementation of climate change strategy
Receive and review progress reports
Group CROAccountable for embedding climate-related risk into the Group’s risk management
framework
Group CFOAccountable for reviewing climate-related disclosures
including TCFD
Group CUOAccountable for embedding
climate-related risks and opportunities within
underwriting decisions
Group COOAccountable for embedding
climate-related risks and opportunities within
operations
Head of ESG RiskIntegration of climate-related risks and opportunities into business processes
Delivery and reporting on the climate change action plan
Group Chief Investment OfficerIntegrating climate-related risks and
opportunities into investments
Group Head of SustainabilityAlignment of climate-related strategy
with overall sustainability strategy
External reporting and stakeholder engagement
ESG Business Policy CommitteeA new committee to review ESG business policies and strategies, including climate-related policy positions,
and provide recommendations to the Group Executive Risk & Capital Committee for approval
Climate Change Working GroupCross-functional working group on climate change, including senior representatives from sustainability,
underwriting, investments, finance, risk, regulatory and operations
Group and divisional boardsIn line with its charter, the Group Board is responsible for overseeing QBE’s social, ethical and environmental responsibilities, including climate change. The Group Board committees oversee the disclosure, risk management, investment and operational aspects of climate change, as summarised in the graphic above.
The divisional Board Risk & Capital Committees regularly receive and review reports on climate-related risks and opportunities affecting each division.
ManagementThe Group Chief Executive Officer and Group Executive Committee (GEC) are responsible for implementing QBE’s climate change strategy. The GEC receives regular updates on our approach and performance in managing climate-related risks and opportunities and reviews progress in achieving the action plan. The GEC is supported by the Group Chief Risk Officer, the Group Chief Financial Officer, the Group Chief Underwriting Officer, the Group Chief Investment Officer, the Climate Change Working Group, the Environmental, Social and Governance (ESG) Business Policy Committee, the Head of ESG Risk and the Group Head of Sustainability.
38 Climate change action plan
High-level impact assessment In 2018, we worked with Deloitte to undertake a high-level impact assessment of QBE’s climate-related risks and opportunities in the short, medium and long-term. We considered the physical, transition and liability risks that may impact QBE’s key products and services, customer groups, geographic locations and business operations including a review of changing stakeholder needs and expectations. The high-level impact assessment informed our ongoing discussions with the Group Board and GEC and formed the basis for the development of our climate change action plan. In addition to reviewing our governance, risk management and metrics & targets, this plan provides a roadmap for addressing the different types of risks and opportunities we identified. These risks are highlighted below.
Liability riskAs climate change impacts become more apparent, parties who have suffered loss and damages from climate change could seek recovery from parties they believe responsible. Any successful actions could potentially lead to responsible parties seeking to recover these costs under insurance policies.
We note that there have already been legal actions against large energy companies by regulators, especially in the United States, and against directors of financial services companies. To date litigation outcomes have been in favour of the defendants and no significant liability claims have arisen. As a result, we do not currently regard liability risk to be significant but continue to closely monitor developments in this area. While our products are not necessarily designed to cover such claims, we expect the potential for liability risks to increase over the next 10 years.
Physical risks and opportunitiesIn line with the scientific evidence, we recognise that climate change is likely to increase the frequency and severity of weather-related natural perils such as floods, bushfires, tropical cyclones, hail, storms, coastal inundation and droughts, as well as leading to sea level rises and increased heat waves over time. By offering insurance products such as property, crop, marine, aviation and lenders' mortgage insurance (LMI), QBE is exposed to these climate-related physical risks which, in line with the scientific evidence from the Intergovernmental Panel on Climate Change, are expected to increase in the medium to long-term (6-10+ years).
Except for LMI, QBE’s business is primarily written and repriced on an annual basis, which enables us to re-assess our prices to appropriately reflect any expected increases in weather-related natural perils and thereby reduce our exposure to climate-related risks. The annual risk of higher than expected claims is managed through the Group’s reinsurance program.
LMI policies are for the term of the mortgage, but typically carry minimal risk after 10 years. Our LMI policies exclude the coverage of repairs to buildings from natural perils. If increased natural disasters result in falls in house prices for properties exposed to such events, then the severity of LMI claims may increase. Our LMI business purchases external reinsurance protection to help manage this risk.
Over the longer term, QBE recognises that climate change may cause insurance premiums to increase and for properties to become uninsurable, especially for customers in areas more exposed to natural perils. Our role as a global insurance company is to provide our customers insurance coverage and to help them recover from damages quickly. This is why QBE engages with external stakeholders, including national and local governments, to encourage adaptation and resilience measures against natural perils. During 2018, we worked with the Australian Government’s National Resilience Taskforce to develop a framework for adaptation finance and investment in resilience.
Oth
er in
form
ation
6
Fin
ancial
Rep
ort
5
Perfo
rman
ce o
verv
iew
1
Bu
siness
review
2
Directo
rs' R
epo
rt
4
QB
E In
suran
ce Gro
up
A
nn
ual R
epo
rt 2018
39G
ov
ernan
ce
3
Transition risks and opportunitiesAs signalled by the commitment of countries to the Paris Agreement, a transition to a low-carbon economy has begun. Growth in the development and deployment of new sustainable technologies will be necessary to achieve the Paris Agreement targets, along with reductions in greenhouse gas emissions. This global challenge requires concerted action led by governments and supported by industry to minimise economic disruption and deliver an orderly transition.
Transition risks affect our operations and clients. We monitor and engage with regulators to understand the potential impact of current and future climate change and energy policies. As set out in our climate change action plan, we are performing more detailed analysis of our insurance exposure to transition risk and will report on this in our 2019 Annual Report.
The pressure to transition is felt by many of our energy clients and will intensify in the medium to long-term. These clients are already undergoing rapid transition, driven by changes in policy, technology and markets. As a result, their insurance needs are changing, and we are seeking to increase our range of products to support them in their efforts.
An analysis of our investment portfolio has shown that we have minimal exposure to transition risk, as discussed on page 40. We believe that the transition to a low-carbon economy will lead to new investment opportunities and we actively look to invest in renewable energy and other opportunities consistent with a low-carbon economy, such as through QBE's Premiums4Good initiative.
Risk management and strategy
Our ESG Risk teamFollowing the high-level impact assessment undertaken in the first half of 2018, QBE created a new ESG Risk team with responsibility for coordinating the ongoing integration of climate-related risks and opportunities within the business. In collaboration with the business, the ESG Risk team is responsible for the day-to-day management of climate-related risks and opportunities and acts as an expert team for the Group and divisions. The team collaborates with subject matter experts and monitors market, technology, policy and regulatory changes.
Risk management frameworkQBE considers climate-related risks and opportunities throughout our business, supported by our Enterprise Risk Management (ERM) framework. QBE’s ERM framework is described in the CRO report section on page 42.
Climate-related risk is part of the overall ERM framework. It is explicitly included within the strategic risk class and implicitly considered within the insurance, credit, market, liquidity and operational risk classes. This strategic risk policy is being updated and incorporates key risk management activities for climate-related risks, such as risk and control self-assessment, incident and issue management process, emerging risk forums, stress testing and scenario analysis, cell reviews, performance monitoring and targeted risk reviews.
Investment strategy and risk managementQBE’s investment philosophy is to strike an appropriate balance between the return objectives of the organisation and our appetite for risk, earnings volatility and capital consumption, while managing climate-related and other non-traditional financial risks. The investment strategy is revisited annually as part of the business planning process and incorporates our expectations regarding economic and market performance for the year ahead, as well as the valuation of, and likely correlations between, the asset classes. In constructing targets and benchmarks against which to manage our portfolios, we consider the currency and liability profiles of the relevant entities, local risk appetites, regulatory constraints, local market conditions and asset opportunities.
In line with our investment strategy, QBE seeks to minimise transition risk within the investment portfolio. In particular, we seek to avoid exposure to stranded assets as we consider them a high risk for our long-term investment strategy.
What is the Paris Agreement?
195 countries have signed the 2015 Paris Agreement, committing to restrict temperature rises to well below 2˚C in order to mitigate climate-related physical impacts. The policy, legal, technology and market changes associated with a rapid transition towards a low-carbon economy present significant economic challenges and opportunities.
Q&A
40
Integration of climate change factors into investments
QBE’s fixed income portfolio represents approximately 85%-90% of our overall investment assets, and ESG factors, including climate-related factors that support our alignment with the Paris Agreement, are embedded in our investment decision making process.
We utilise relevant climate data and research from external providers to ensure that all securities being considered for inclusion in the portfolio, and the overall portfolio itself, meet our criteria for managing climate-related risks. These criteria are evolving to include both minimum standards as well as an ambition to manage the overall portfolio carbon metrics to an environmentally responsible level over time. During 2018 we initiated dialogue with the largest greenhouse gas emitters in our credit portfolio in relation to their commitment to implementing the TCFD recommendations.
QBE’s growth asset portfolio represents approximately 10%–15% of our overall investment assets, with external managers and passive index vehicles used to access various asset classes. Our selection process includes engagement to ensure alignment where practical to our direct investment philosophy, and to advocate for change where opportunities exist for more responsible climate risk management. Our investment guidelines require a minimum of 75% of our external managers to be PRI signatories, and currently 85% are signatories.
To understand the ESG and sustainability performance of the real estate fund managers, QBE joined Global Real Estate Sustainability Benchmark (GRESB) as an investor member in 2018 and reviewed the ESG and sustainability performance of the real estate portfolio managers. Based on the GRESB real estate sustainability benchmarks, the weighted average for the property portfolio is GRESB 4 Star and is in the top quartile GRESB. We continue to integrate ESG in our reviews with managers.
Analysis of transition risk in the investment portfolioTransition risk may arise in our investments where companies within our portfolio are not aligned to the Paris Agreement targets, and so expose QBE to sudden drops in asset values or increased credit risk. Predominantly, transition risk is associated with carbon intensive industries.
We assessed our credit portfolio by applying the 2 Degrees Investing Initiative (2Di) Paris Agreement Capital Transition Assessment Tool (PACTA) to confirm that our credit portfolio is aligned to the Paris Agreement, both now and in five years’ time.
We performed an internal analysis to assess coal-specific transition risks in the total investment portfolio. We identified investments in companies fitting one or more of the following criteria as coal-related assets:
• companies that have expansion plans for coal; • companies that have 30% or more revenue from coal or coal share of
power generation; • companies whose annual coal production equals 20 million tons or more; and • companies whose installed coal-fired capacity equals 10,000 MW or more. The analysis confirmed that we have less than 1% of our investment portfolio in coal‑related assets. The analysis affirms our investment philosophy and our focus on contributing to a low-carbon economy.
Climate-related opportunitiesQBE contributes to a low-carbon economy by financing renewable energy infrastructure and investing in green finance in both our wider portfolio and through our impact investment program, Premiums4Good. In 2018, QBE won Impact Asset Owner of the Year at the Australian Impact Investment Award for the innovative way the product mobilises capital for impact. Our Premiums4Good program has 32 investments ($440 million) of which 11 (with a value of $160 million) are related to sustainable energy and investments related to resource efficiency, recycling, reuse and conservation. We also hold $204 million in green bonds.
Climate change action plan
$364M
invested in green finance
What are stranded assets?
Assets that are unable to recover their investment cost as intended, with a loss of value for investors.
Q&A
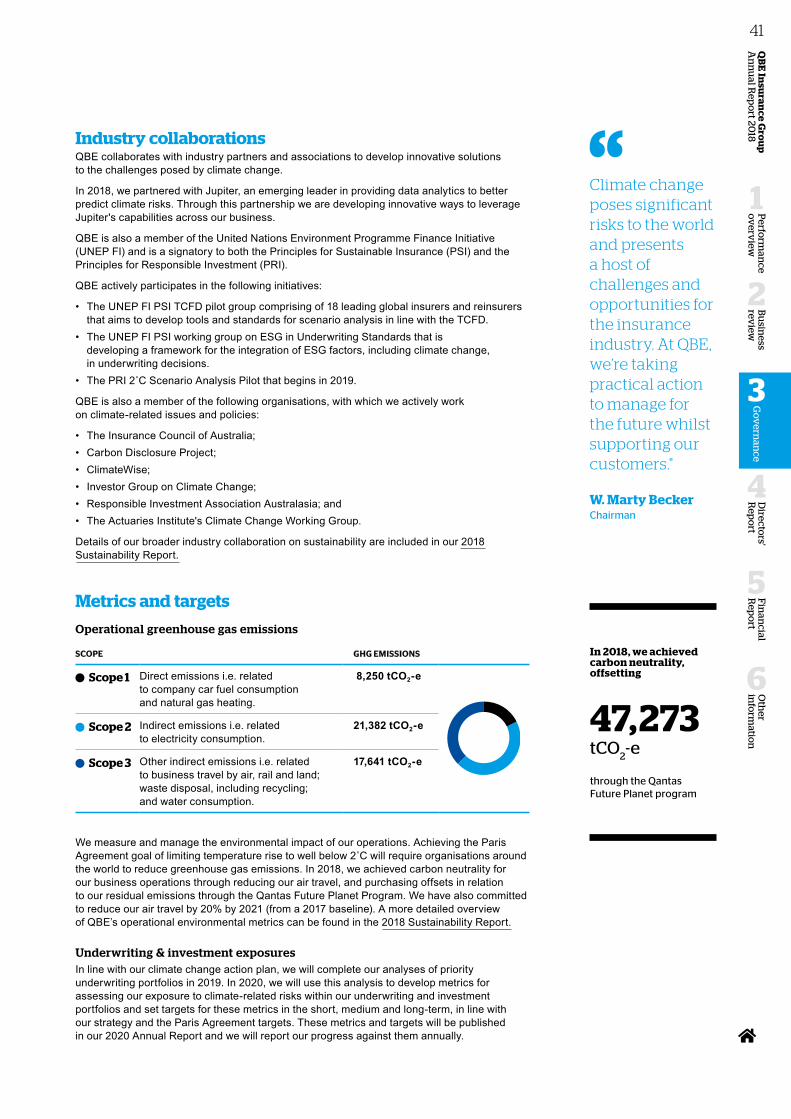
Oth
er in
form
ation
6
Fin
ancial
Rep
ort
5
Perfo
rman
ce o
verv
iew
1
Bu
siness
review
2
Directo
rs' R
epo
rt
4
QB
E In
suran
ce Gro
up
A
nn
ual R
epo
rt 2018
41G
ov
ernan
ce
3
Industry collaborationsQBE collaborates with industry partners and associations to develop innovative solutions to the challenges posed by climate change.
In 2018, we partnered with Jupiter, an emerging leader in providing data analytics to better predict climate risks. Through this partnership we are developing innovative ways to leverage Jupiter's capabilities across our business.
QBE is also a member of the United Nations Environment Programme Finance Initiative (UNEP FI) and is a signatory to both the Principles for Sustainable Insurance (PSI) and the Principles for Responsible Investment (PRI).
QBE actively participates in the following initiatives:
• The UNEP FI PSI TCFD pilot group comprising of 18 leading global insurers and reinsurers that aims to develop tools and standards for scenario analysis in line with the TCFD.
• The UNEP FI PSI working group on ESG in Underwriting Standards that is developing a framework for the integration of ESG factors, including climate change, in underwriting decisions.
• The PRI 2˚C Scenario Analysis Pilot that begins in 2019.
QBE is also a member of the following organisations, with which we actively work on climate-related issues and policies:
• The Insurance Council of Australia;• Carbon Disclosure Project;• ClimateWise;• Investor Group on Climate Change;• Responsible Investment Association Australasia; and• The Actuaries Institute's Climate Change Working Group.
Details of our broader industry collaboration on sustainability are included in our 2018 Sustainability Report.
Metrics and targets
Operational greenhouse gas emissions
SCOPE GHG EMISSIONS
Scope 1 Direct emissions i.e. related to company car fuel consumption and natural gas heating.
8,250 tCO2‑e
Scope 2 Indirect emissions i.e. related to electricity consumption.
21,382 tCO2‑e
Scope 3 Other indirect emissions i.e. related to business travel by air, rail and land; waste disposal, including recycling; and water consumption.
17,641 tCO2‑e
We measure and manage the environmental impact of our operations. Achieving the Paris Agreement goal of limiting temperature rise to well below 2˚C will require organisations around the world to reduce greenhouse gas emissions. In 2018, we achieved carbon neutrality for our business operations through reducing our air travel, and purchasing offsets in relation to our residual emissions through the Qantas Future Planet Program. We have also committed to reduce our air travel by 20% by 2021 (from a 2017 baseline). A more detailed overview of QBE’s operational environmental metrics can be found in the 2018 Sustainability Report.
Underwriting & investment exposuresIn line with our climate change action plan, we will complete our analyses of priority underwriting portfolios in 2019. In 2020, we will use this analysis to develop metrics for assessing our exposure to climate-related risks within our underwriting and investment portfolios and set targets for these metrics in the short, medium and long-term, in line with our strategy and the Paris Agreement targets. These metrics and targets will be published in our 2020 Annual Report and we will report our progress against them annually.
Climate change poses significant risks to the world and presents a host of challenges and opportunities for the insurance industry. At QBE, we’re taking practical action to manage for the future whilst supporting our customers."
W. Marty BeckerChairman
In 2018, we achieved carbon neutrality, offsetting
47,273 tCO
2-e
through the Qantas Future Planet program
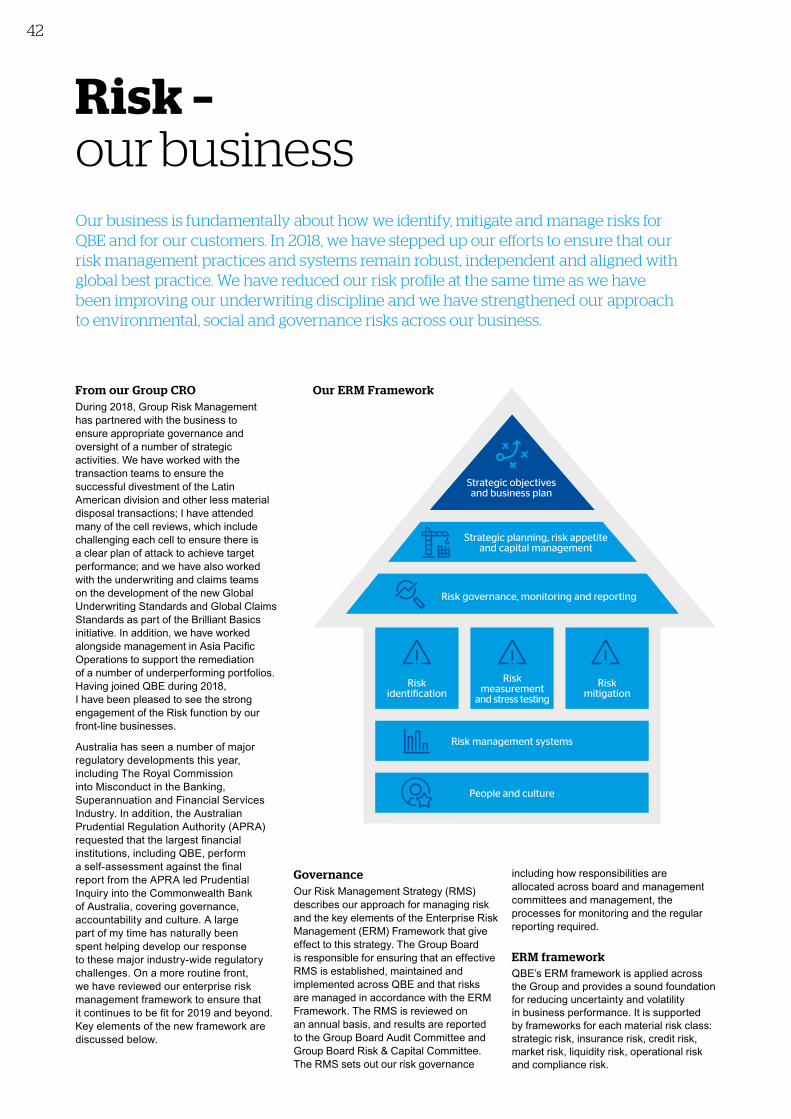
42
From our Group CRODuring 2018, Group Risk Management has partnered with the business to ensure appropriate governance and oversight of a number of strategic activities. We have worked with the transaction teams to ensure the successful divestment of the Latin American division and other less material disposal transactions; I have attended many of the cell reviews, which include challenging each cell to ensure there is a clear plan of attack to achieve target performance; and we have also worked with the underwriting and claims teams on the development of the new Global Underwriting Standards and Global Claims Standards as part of the Brilliant Basics initiative. In addition, we have worked alongside management in Asia Pacific Operations to support the remediation of a number of underperforming portfolios. Having joined QBE during 2018, I have been pleased to see the strong engagement of the Risk function by our front-line businesses.
Australia has seen a number of major regulatory developments this year, including The Royal Commission into Misconduct in the Banking, Superannuation and Financial Services Industry. In addition, the Australian Prudential Regulation Authority (APRA) requested that the largest financial institutions, including QBE, perform a self-assessment against the final report from the APRA led Prudential Inquiry into the Commonwealth Bank of Australia, covering governance, accountability and culture. A large part of my time has naturally been spent helping develop our response to these major industry-wide regulatory challenges. On a more routine front, we have reviewed our enterprise risk management framework to ensure that it continues to be fit for 2019 and beyond. Key elements of the new framework are discussed below.
GovernanceOur Risk Management Strategy (RMS) describes our approach for managing risk and the key elements of the Enterprise Risk Management (ERM) Framework that give effect to this strategy. The Group Board is responsible for ensuring that an effective RMS is established, maintained and implemented across QBE and that risks are managed in accordance with the ERM Framework. The RMS is reviewed on an annual basis, and results are reported to the Group Board Audit Committee and Group Board Risk & Capital Committee. The RMS sets out our risk governance
including how responsibilities are allocated across board and management committees and management, the processes for monitoring and the regular reporting required.
ERM frameworkQBE’s ERM framework is applied across the Group and provides a sound foundation for reducing uncertainty and volatility in business performance. It is supported by frameworks for each material risk class: strategic risk, insurance risk, credit risk, market risk, liquidity risk, operational risk and compliance risk.
Risk – our business
Our ERM Framework
Strategic planning, risk appetite and capital management
Risk governance, monitoring and reporting
Risk identification
Risk measurement
and stress testing
Risk mitigation
Risk management systems
People and culture
Strategic objectives and business plan
Our business is fundamentally about how we identify, mitigate and manage risks for QBE and for our customers. In 2018, we have stepped up our efforts to ensure that our risk management practices and systems remain robust, independent and aligned with global best practice. We have reduced our risk profile at the same time as we have been improving our underwriting discipline and we have strengthened our approach to environmental, social and governance risks across our business.
42
From our Group CRODuring 2018, Group Risk Managementhas partnered with the business to ensure appropriate governance andoversight of a number of strategicactivities. We have worked with thetransaction teams to ensure thesuccessful divestment of the LatinAmerican division and other less materialdisposal transactions; I have attendedmany of the cell reviews, which includechallenging each cell to ensure there isa clear plan of attack to achieve targetperformance; and we have also workedwith the underwriting and claims teamson the development of the new GlobalUnderwriting Standards and Global Claims Standards as part of the Brilliant Basicsinitiative. In addition, we have workedalongside management in Asia PacificOperations to support the remediationof a number of underperforming portfolios. Having joined QBE during 2018,I have been pleased to see the strongengagement of the Risk function by ourfront-line businesses.
Australia has seen a number of major regulatory developments this year, including The Royal Commission into Misconduct in the Banking, Superannuation and Financial Services Industry. In addition, the Australian Prudential Regulation Authority (APRA) requested that the largest financial institutions, including QBE, perform a self-assessment against the final report from the APRA led Prudential Inquiry into the Commonwealth Bank of Australia, covering governance, accountability and culture. A large part of my time has naturally been spent helping develop our response to these major industry-wide regulatory challenges. On a more routine front, we have reviewed our enterprise risk management framework to ensure that it continues to be fit for 2019 and beyond. Key elements of the new framework are discussed below.
GovernanceOur Risk Management Strategy (RMS)describes our approach for managing riskand the key elements of the Enterprise RiskManagement (ERM) Framework that giveeffect to this strategy. The Group Boardis responsible for ensuring that an effectiveRMS is established, maintained andimplemented across QBE and that risksare managed in accordance with the ERMFramework. The RMS is reviewed onan annual basis, and results are reportedto the Group Board Audit Committee andGroup Board Risk & Capital Committee.The RMS sets out our risk governance
including how responsibilities are allocated across board and managementcommittees and management, theprocesses for monitoring and the regularreporting required.
ERM frameworkQBE’s ERM framework is applied acrossthe Group and provides a sound foundationfor reducing uncertainty and volatility in business performance. It is supportedby frameworks for each material risk class:strategic risk, insurance risk, credit risk,market risk, liquidity risk, operational riskand compliance risk.
Risk –our business
Our ERM Framework
Strategic planning, risk appetite and capital management
Risk governance, monitoring and reporting
Riskidentification
Risk measurement
and stress testing
Riskmitigation
Risk management systems
People and culture
Strategic objectivesand business plan
Our business is fundamentally about how we identify, mitigate and manage risks for QBE and for our customers. In 2018, we have stepped up our efforts to ensure that our risk management practices and systems remain robust, independent and aligned with global best practice. We have reduced our risk profile at the same time as we have been improving our underwriting discipline and we have strengthened our approach to environmental, social and governance risks across our business.
Oth
er in
form
ation
6
Fin
ancial
Rep
ort
5
Perfo
rman
ce o
verv
iew
1
Bu
siness
review
2
Directo
rs' R
epo
rt
4
QB
E In
suran
ce Gro
up
A
nn
ual R
epo
rt 2018
43G
ov
ernan
ce
3
Strategic objectives and business planRisk management is embedded in our business planning process, which focuses on our strategic objectives over a three-year horizon. We assess material risks and mitigation strategies and perform Group-wide stress testing to develop actions to increase the likelihood of achieving our business plan and objectives and staying within our risk appetite and tolerance.
Strategic planning, risk appetite and capital managementOur strategic planning process considers factors such as market conditions, prior years’ results, business objectives, operational initiatives, financial targets and risk appetites, which inform our annual business plan.
Our Risk Appetite Statement (RAS) sets out the nature and level of risk that the Group Board and Group Executive Committee are willing to take in pursuit of our business objectives. The RAS is used to support risk-based decision making by clearly defining our appetite (what we should do) and tolerance (what we can do), and is cascaded, as appropriate, into the operating divisions.
Our Capital Management Plan ensures QBE maintains adequate capital to achieve balance between our strategic planning aspirations and our risk appetite. QBE uses several capital management tools to support the assessment of risk and allocation of capital including:
• QBE’s Economic Capital Model– an internal model, developed tomeasure overall exposure to risk aswell as exposure to each of our maincategories of risk. The model providesa quantitative base for us to understand,monitor and manage our exposures.We also use the model to make betterbusiness decisions, assess economiccapital requirements and measureperformance on a risk-adjusted basis.
• Analysis of regulatory and rating agencycapital models – to better understand howregulatory and rating agencies assessthe impact of our strategic decisions onour risk profile and capital requirements,we conduct financial modelling analysiswith reference to the requirements of thevarious capital environments in whichQBE operates.
• Bespoke risk assessment tools – we usecatastrophe models, scenario analysis,stress tests and reverse stress tests toevaluate business plans and support ourcapital plan.
Another key capital management tool is QBE’s Internal Capital Adequacy Assessment Process (ICAAP). The ICAAP is supported by both the
Economic Capital Model and scenario analysis, and is used to: • manage the capital held by QBE;• monitor the risk profile against appetite;• ensure the risks taken by QBE are
commensurate with required returns;• allocate capital to operating entities for
planning and performance monitoringpurposes; and
• analyse alternative reinsurance options and regulatory and rating agency submissions.
Our Group Reinsurance Management Strategy sets out our approach to reinsurance as part of our overall approach to risk and capital management.
Risk governance, monitoring and reportingAs previously mentioned, the Group Board is responsible for ensuring that an effective RMS is established, maintained and implemented across QBE.
Risk monitoring and reporting are embedded across the Group, supported by the three lines of defence:
1. The business, our first line of defence,generates risk exposure and isaccountable for identifying, owning andcontrolling risks, and for ensuring thataccepted risks are within the Group’srisk appetite.
2. Group Risk and Group Compliancefunctions provide independent oversightand challenge, by establishing andmaintaining Group-wide minimumstandards and policies.
3. Internal audit provides independentassurance to assist the Group Boardin discharging its responsibility for soundand prudent management of QBE,by providing an objective review of theeffectiveness and integrity of the RMS.
Risk identification, measurement, stress testing and mitigationQBE adopts a robust risk identification, measurement and mitigation process to support the ERM Framework.
These processes are outlined within each material risk policy and include key activities to manage risk such as the Risk and Control Self-Assessment process, incident and issue management process, emerging risk forums, stress testing and scenario analysis, cell reviews, performance monitoring, and targeted risk reviews.
Risk management systems QBE utilises Group-wide risk management systems to facilitate the recording, measurement, aggregation, monitoring and reporting of material risks to Group and key stakeholders. These systems enable the analysis of QBE’s material
risks, which helps us to better understand the risk environment and support risk-based decision making.
People and cultureQBE is committed to, and supports, a strong risk culture. We recognise the importance of risk awareness and risk culture as being instrumental in the effectiveness of QBE’s ERM Framework and an informal control mechanism for the organisation. We are currently focusing on achieving greater alignment between risk culture, the wider organisational culture, which we call our QBE DNA, and conduct risk, as well as further embedding Group-wide accountability for risk culture through remuneration and reward. We have embedded expected risk behaviours in our QBE DNA which are used in our people processes across the Group. They are also included in our Code of Ethics and Conduct which is applicable to all directors, employees and other representatives across the Group. For more information please refer to the 2018 Sustainability Report.
Regulatory riskAs a global insurance group, QBE is subject to oversight by many prudential regulatory regimes around the world, as well as extensive legal and regulatory requirements and obligations, industry codes, and business and ethical standards across our business activities. To manage the regulatory and compliance risk we face as a global organisation, we combine local expertise with a globally consistent compliance framework and consider regulatory risk as part of our strategic risk class. We continue to monitor regulatory developments in each of the markets in which the Group operates.
Emerging risksEmerging risks are also considered as part of our strategic risk class. Our emerging risk forums operate at a divisional level with overall coordination by the Global Emerging Risks Forum which identifies and analyses emergence and maturity of each risk, as well as monitoring and reporting on emerging risks. Over the year, the emerging risks forums have reviewed a range of emerging risks, including autonomous vehicles, big data, nanotechnology and cyber risks.
Climate-related risksClimate-related risks, which are considered as an existing strategic risk for us, are managed by the Climate Change Working Group and ESG Risk team. We discuss these in the climate change action plan section on page 36.

44
W. Marston (Marty) Becker JD, BSBA
Chairman
Marty was appointed as an independent non-executive director of QBE in 2013 and Chairman in April 2014. Marty is a member of the Audit, Investment, People & Remuneration, Risk & Capital, and Operations & Technology Committees. Marty previously served as President and CEO of Alterra Capital Holdings Limited from 2006–2013 and is on the Board of Governors of West Virginia University. Marty has over 37 years’ experience in general insurance, reinsurance, investment banking and private equity. Marty's past leadership roles with insurers and reinsurers also include serving as chair of Hales & Company (2000–2005); vice chair and director of Royal & SunAlliance USA (1999–2000); and chair and CEO of Orion Capital Corporation (1996–1999).
Patrick (Pat) Regan BSc, FCA Group Chief Executive Officer
Pat joined QBE in 2014 and was appointed Group Chief Executive Officer in 2018. He previously held the position of Group Chief Financial Officer (June 2014–September 2017) and Chief Executive Officer, Australian & New Zealand Operations (August 2016–December 2017). Before joining QBE, Pat was the Chief Financial Officer at Aviva plc in London (2010–2014) with responsibility for finance, strategy, investor relations and mergers and acquisitions. Pat has 30 years' business experience with 20 of those in insurance and financial services. Pat was previously the CFO/COO of Willis and has held several roles at RSA and AXA.
Fred Eppinger BA, MBA
Independent non-executive director
Fred was appointed as an independent non-executive director of QBE in 2019. Fred is a member of the Risk & Capital and Operations & Technology Committees. Fred was the President and Chief Executive Officer of The Hanover Insurance Group, Inc. for 13 years until 2016. He has more than 35 years' experience in finance and strategic marketing in the North American insurance industry, including serving as Executive Vice President, Property and Casualty for The Hartford Financial Services Group, Inc. He is currently a non-executive director of Centene Corporation, a large publicly-traded company and a multi-line managed care enterprise that serves as a major intermediary for both government-sponsored and privately insured health care programs. He is also a non-executive director of the publicly-traded company, Stewart Information Services Corporation.
Stephen Fitzgerald (AO) B Ec
Independent non-executive director
Stephen was appointed as an independent non-executive director of QBE in 2014. He is Chairman of the Investment Committee and People & Remuneration Committee. He is also a member of the Risk & Capital Committee. Stephen is the Managing Partner of Affirmative Investment Management. He has had a long career with Goldman Sachs (1992–2012) filling a number of leadership roles in London, Tokyo, Hong Kong and Australia and was Chairman of Goldman Sachs, Australia and New Zealand when he retired in 2012. He also served on the Goldman Sachs Partnership Committee. Stephen was previously a member of the Board of Guardians of the Future Fund (Australia’s Sovereign Wealth Fund). Stephen sits on the board of The Great Barrier Reef Foundation, the Male Champions of Change Limited and is a member of the Investment Committee of the British Museum.
John M. Green B JURIS/LLB, FAICD, SF FIN Deputy Chairman
John became an independent non-executive director of QBE in 2010. As well as Deputy Chairman of the Board he is also Deputy Chairman of the Investment and Operations & Technology Committees and a member of the People & Remuneration, Risk & Capital, and Audit Committees. He also chaired the Board’s subcommittee on QBE’s self-assessment against APRA’s CBA report on governance, accountability and culture. Currently, John is also a non-executive director of the Cyber Security Cooperative Research Centre and Challenger Limited (both appointed December 2017). John has extensive Australian and international board and advisory experience, including as a director of WorleyParsons Limited (from October 2002–October 2016), as an executive director at Macquarie Group leading its financial institutions group, and as a partner at two major law firms. He is also a novelist and co-founder of independent book publisher Pantera Press.
Board of Directors
Oth
er in
form
ation
6
Fin
ancial
Rep
ort
5
Perfo
rman
ce o
verv
iew
1
Bu
siness
review
2
Directo
rs' R
epo
rt
4
QB
E In
suran
ce Gro
up
A
nn
ual R
epo
rt 2018
45G
ov
ernan
ce
3
Kathryn (Kathy) Lisson B. Sc (Honours) Non-executive director
Kathy was appointed as a non-executive director in September 2016. Kathy is Chair of the Operations & Technology Committee and a member of the Audit Committee. Kathy has over 30 years’ experience across insurance and banking in technology, operations and management. In England, she was Chief Operating Officer for two global insurance companies (QBE Europe and Brit Insurance) and Operational Transformation Director at Barclays Bank. In Canada, Kathy held several executive positions at Bank of Montreal, including President of its Mortgage Corporation and EVP Technology Strategy and Delivery. Kathy was also a senior partner at Ernst & Young and Price Waterhouse in Canada, leading their insurance and banking advisory practices. Kathy also held previous non-executive director roles in the UK (for insurance exchange Ri3K and cheque-clearing corporation iPSL) and in Canada (for MCAP Services, Xceed Mortgage Corp, Flinx Corp and dealer Access).
Sir Brian Pomeroy MA, FCA
Independent non-executive director
Sir Brian was appointed as an independent non-executive director of QBE in June 2014. Sir Brian is Chairman of the Audit Committee and a member of the Investment and Risk & Capital Committees. He was formerly a non-executive member of the Board of the Financial Conduct Authority in the UK and a non-executive director on QBE’s European regulated boards. Sir Brian has extensive experience in the insurance industry, including in his previous role as a Nominated Member of the Council of Lloyd's and as Chairman of the Independent Commission on Equitable Life Payments. He was Chairman of the UK Treasury's Financial Inclusion Taskforce, the Payments Council and the Gambling Commission. He was the senior partner of Deloitte Consulting in the UK until 1999.
Jann Skinner B Com, FCA, FAICD Independent non-executive director
Jann was appointed as an independent non-executive director of QBE in 2014. She is Deputy Chairman of the Audit Committee and the Risk & Capital Committee and a member of the People & Remuneration Committee. Jann was a non-executive director on QBE’s Australian regulated boards, where she was also Chairman of the Audit and Risk & Capital Committees. Jann has over 30 years’ professional experience in audit and accounting with a focus on financial services, particularly the insurance industry. She had a long career with PricewaterhouseCoopers from 1975–2004 and was an audit partner of the firm for 17 years before retiring in 2004. Jann is a non-executive director of Telix Pharmaceuticals Ltd (appointed June 2018), HSBC Bank Australia Limited and Create Foundation Limited. Previously, Jann was a non-executive director of Enstar Australia Group and the Tasmanian Public Finance Corporation.
Rolf Tolle Dipl. Pol Independent non-executive director
Rolf was appointed as an independent non-executive director in March 2016. Rolf is the Chairman of the Risk & Capital Committee and a member of the People & Remuneration and Audit Committees. He has significant experience in specialist insurance and reinsurance businesses, having held senior positions in a number of global companies, including being Lloyd's first ever Franchise Performance Director. He was in this role for approximately seven years and was consequently awarded the Silver Medal for Services at Lloyd’s, an honour bestowed to only a few individuals since its creation in 1917. He is also on the advisory board of Wrisk Ltd. Rolf was previously a director of Beazley plc and Beazley Furlonge Ltd.
Michael (Mike) Wilkins (AO) B Com, MBA, FCA, FAICD
Independent non-executive director
Mike was appointed as an independent non-executive director of QBE in November 2016. Mike is Deputy Chairman of the People & Remuneration Committee and a member of the Audit and Operations & Technology Committees. He was the Managing Director and CEO of Insurance Australia Group Limited until November 2015. He has more than 30 years' experience in financial services, including serving as Managing Director and CEO of Promina Group Limited and Managing Director of Tyndall Australia Limited. He is currently a non-executive director of AMP Limited (appointed September 2016) and Medibank Private Limited (appointed May 2017). Previously he held non-executive roles at Maple-Brown Abbott Limited and Alinta Limited. Mike has served as a director of Alinta Limited, Maple-Brown Abbott Limited, The Geneva Association and the Australian Business and Community Network. He was on the Business Council of Australia for eight years and a member of the B20 Human Capital Taskforce in 2014. In 2013, Mike was the founding member of the Australian Business Roundtable for Disaster Resilience & Safer Communities until 2015 when he left his role of CEO at IAG.

46
Patrick (Pat) Regan BSc, FCA Group Chief Executive Officer
Pat joined QBE in 2014 and was appointed Group Chief Executive Officer in 2018. He previously held the position of Group Chief Financial Officer (June 2014–September 2017) and Chief Executive Officer, Australian & New Zealand Operations (August 2016–December 2017). Before joining QBE, Pat was the Chief Financial Officer at Aviva plc in London (2010–2014) with responsibility for finance, strategy, investor relations and mergers and acquisitions. Pat has 30 years' business experience with 20 of those in insurance and financial services. Pat was previously the CFO/COO of Willis and has held several roles at RSA and AXA.
Inder Singh BCom
Group Chief Financial Officer
Inder joined QBE in 2015 and was appointed Group Chief Financial Officer in 2018. His previous roles at QBE include Chief Financial Officer for Australian & New Zealand Operations, and Group Head of Corporate Development and Financial Planning & Analysis. Inder has 20 years’ experience in financial services spanning property & casualty, life insurance and banking. He started his career at Arthur Andersen before working in investment banking in Sydney and London with Deutsche Bank and UBS. Prior to joining QBE, he was Group M&A Director at Aviva plc in London where he led a number of transformational transactions. Inder qualified as a Chartered Accountant and graduated with a Bachelor of Commerce from Monash University, Melbourne.
Vivek Bhatia BEng, MBA, CFA Chief Executive Officer, Australian & New Zealand Operations (Australia Pacific from 1 January 2019)
Vivek joined QBE in February 2018 in the role of Chief Executive Officer, Australian & New Zealand Operations. Before joining QBE, Vivek was inaugural Chief Executive Officer and Managing Director of icare, the NSW Government public financial corporation managing the state's insurance and care schemes. Vivek has more than 20 years' experience in the insurance and management consulting sectors. Vivek was previously the Chief Executive Officer of Wesfarmers Insurance in Australia, where he was responsible for leading the multi-brand, multi-channel insurer through a significant transformation journey. He has also co-led McKinsey & Co's Asia Pacific Restructuring & Transformation practice.
Vivienne (Viv) Bower BA Org. Comms Group Head of Communications and Marketing
Viv joined QBE in January 2017 as Group Head of Communications and Marketing. Formerly Group Head of Corporate Affairs and Investor Relations for Lendlease, Viv has served in a number of senior consulting and internal roles specialising in investor relations and corporate affairs. This includes Head of Group Internal Communications at Westpac and Group General Manager of Communications at Multiplex Group (now Brookfield Multiplex), a global contracting and development company.
Jason Brown BEcon ACA
Chief Executive Officer, Asia Pacific Operations (Group Chief Underwriting Officer from 1 January 2019)
Jason has been involved in the financial services industry for over 25 years. Jason was the Chief Executive Officer, Asia Pacific from August 2017 and commenced the newly created role of Group Chief Underwriting Officer from January 2019. Jason joined QBE in 2002 after 13 years at Ernst & Young in the Financial Services Group in both assurance and consulting in Australia and the UK. Jason, a chartered accountant, worked in Australian & New Zealand Operations as Executive General Manager, Technical & Operations for seven years with responsibility for underwriting, reinsurance, actuarial and acquisitions before becoming Chief Risk Officer for Australian & New Zealand Operations and subsequently QBE Group.
Group Executive Committee
Oth
er in
form
ation
6
Fin
ancial
Rep
ort
5
Perfo
rman
ce o
verv
iew
1
Bu
siness
review
2
Directo
rs' R
epo
rt
4
QB
E In
suran
ce Gro
up
A
nn
ual R
epo
rt 2018
47G
ov
ernan
ce
3
Peter Grewal BA (Hons), CMIIA Group Chief Risk Officer
Peter joined QBE in July 2018 as Group Chief Risk Officer. Prior to joining QBE, Peter was the Chief Risk Officer, Reinsurance, at Swiss Re with a global remit covering property and casualty and life and health reinsurance. Earlier in his career Peter held roles in internal audit including Head of Group Internal Audit for Swiss Re, Head of Internal Audit for Scottish Re and Head of Audit for HSBC (Bank of Bermuda).
Russell (Russ) Johnston BSc, BF
Chief Executive Officer, North America
Russ joined QBE in May 2016 in the role of Chief Executive Officer, North American Operations. Russ has more than 30 years' insurance industry experience. Prior to joining QBE he held a range of senior business and operational roles at American International Group, most recently as the President of AIG Casualty Americas. Russ is also the Board President for the Boys and Girls Clubs of Monmouth County, an organisation focused on high risk youth.
David McMillan BA, MBA, FCMA
Group Chief Operations Officer
David joined QBE in September 2017 as Group Chief Operating Officer and is based in the company's London office. Prior to joining QBE, David was Chief Executive Officer Europe and India and Chairman of Global Health Insurance for Aviva plc. Earlier in his career at Aviva, David was Chief Executive Officer of UK General Insurance & Group Transformation Officer. David joined Aviva in 2002 following almost 10 years with the management consulting arm of PricewaterhouseCoopers.
Margaret Murphy BA (Hons) Business
Group Chief Human Resources Officer
Margaret joined QBE in October 2016 in the role of Group Chief Human Resources Officer. Prior to this, she spent 10 years at Barclays Bank, based in the UK and working globally. She held various Human Resources Director and transformation roles across the Group including within the retail bank, corporate bank and global functions leading large scale organisational change. She began her career with London Underground and subsequently spent time with Inchcape, British American Tobacco and was Head of Reward and Performance at J Sainsbury plc before joining Barclays in 2006.
Richard Pryce BHis (Hons)
Chief Executive Officer, European Operations (International from 1 January 2019)
Richard joined QBE in 2012 and was appointed Chief Executive Officer, European Operations in 2013. Richard began his insurance career with R.W. Sturge syndicate at Lloyd’s where he became Claims Director. In 1996, Richard moved to Ockham as Professional Lines Class Underwriter for Syndicate 204. Richard went on to run ACE’s Financial Lines business in London before becoming President of ACE Global Markets in 2003 and ACE UK in 2007. He has worked in the London insurance market for 35 years.
Carolyn Scobie BA, LLB, MA, AGIA and GAICD
Group General Counsel and Group Company Secretary
Carolyn joined QBE in January 2016 as Group General Counsel and Group Company Secretary. Prior to joining QBE, Carolyn was Group General Counsel at global industrial property group, Goodman, for 17 years, where she ran a multi-disciplinary legal team working across 16 countries. Carolyn has extensive experience in corporate law, compliance, regulatory matters, litigation and managing the complexity of multiple jurisdictions.
Corporate governance statement
QBE Insurance Group Limited (QBE) is committed to the highest standards of corporate governance. In 2018, QBE introduced its new DNA which interlinks seven cultural elements that are fundamental to QBE and how QBE needs to operate in the future to succeed, recognising its customers, people, shareholders and the community. QBE believes that a culture that rewards transparency, integrity and performance will promote its long-term sustainability and the ongoing success of its business.
This Corporate Governance Statement relates to the 2018 financial year, and should be read in conjunction with QBE’s 2018 Annual Report and the 2018 Sustainability Report. This Corporate Governance Statement has been approved by the Board and is dated 25 February 2019.
Board and management
Board functionsThe Board charter sets out the matters expressly reserved for the Board and those delegated to its Committees and management. In accordance with its charter, the Board:• oversees corporate governance;• selects and supervises the Group Chief Executive Officer;• provides direction to management;• approves the strategies and major policies of the QBE Group;• monitors performance against plan;• considers regulatory compliance;• monitors people-related strategies (including people development and succession planning);• reviews information technology and other resources; and• ensures that an effective risk management strategy is established and maintained.
The Board reviews strategy on an ongoing basis. To help the Board maintain its understanding of the business and to effectively assess management, directors receive regular presentations from the divisional chief executive officers and other senior managers of the various divisions on relevant topics including budgets, three-year business plans and operating performance. The Board receives updated forecasts during the year. The non-executive directors also have contact with senior executives at numerous times and in various forums during the year.
Visits by non-executive directors to the QBE Group’s offices in key locations are encouraged. The Board meets regularly in Australia and, due to QBE’s substantial overseas operations, usually spends time in the United Kingdom and the United States each year.
The Board visited the QBE Group’s operations in London in October 2018 and in New York in December. A delegation from the Board also visited Singapore in August 2018 to meet with and receive presentations from local management.
Each formal Board meeting normally considers reports from the Group Chief Executive Officer and the Group Chief Financial Officer, together with other relevant reports. The non-executive directors regularly meet in the absence of management. The Chairman and Group Chief Executive Officer in particular, and directors in general, including those on the divisional Boards, have substantial contact outside Board and Committee meetings.
Details of the number of Board meetings held during the 2018 financial year and attendance by directors are set out in the Directors’ Report.
The Board delegates responsibility to the Group Chief Executive Officer for management of the business on a day-to-day basis.
Senior management functionsManagement’s responsibilities are to:• develop a draft strategy, make recommendations to the Board and implement the Board approved strategy subject
to market conditions;• prepare annual budgets and three-year business plans;• carry on day-to-day operations within the Board approved annual budget and three-year business plans subject
to market conditions;• design and maintain internal controls;• set up and keep under review an effective risk management and compliance management system, and monitor and manage
all material risks consistent with the strategic objectives, risk appetite statements and policies approved by the Board;• inform the Board of material matters, and keep the Board and market fully informed about material continuous disclosure issues; and• ensure succession plans exist for all senior management positions other than the Group Chief Executive Officer.
48
QBE has operated under an extensive written system of delegated authorities for many years. In particular, a written delegated authority with specified limits is approved by the Board each year to enable the Group Chief Executive Officer to conduct the QBE Group’s business in accordance with detailed budgets and business plans. This authority deals with topics such as underwriting, reinsurance protection, claims, investments, acquisitions and expenses. The Group Chief Executive Officer delegates his authority to management throughout the QBE Group on a selective basis, taking into account expertise and past performance. Compliance with delegated authorities is monitored by management and adjusted as required for actual performance, market conditions and other factors. Management and the QBE Group’s internal audit teams review compliance with delegated authorities and any breach can lead to disciplinary procedures, including dismissal.
ChairmanThe independent Chairman of the Board of QBE is Marty Becker, who was appointed in April 2014. In his role as Chairman, Marty Becker is responsible for ensuring that the Board functions as an effective and cohesive group. Marty Becker works closely with the Group Chief Executive Officer to determine the strategic direction for QBE and to establish high standards of governance and leadership.
CommitteesThe Board is supported by several Committees which meet regularly to consider audit, risk management, investments, remuneration, technology, operations and other matters. The main Committees of the Board are the Audit, Investment, People & Remuneration, Governance & Nomination, Risk & Capital and Operations & Technology Committees. Further sub-committees of the Board may be convened to confer on particular issues from time to time. Any non-executive director may attend a Committee meeting. The Committees have free and unfettered access to QBE’s senior managers and may consult external advisers at QBE’s cost, including requiring their attendance at Committee meetings, with the consent of the Chairman. A report on each Committee’s last meeting is provided to the next Board meeting.
Each Committee comprises at least three independent directors and each Committee Chairman is an independent or non-executive director who is not the Chairman of the Board (excluding the Governance & Nominations Committee, the Chairman of which is Marty Becker). Each Committee operates under a written charter approved by the Board. These charters are available at www.qbe.com. The membership of each Committee is provided at www.qbe.com and details of the number of Committee meetings held during the 2018 financial year and attendance by Committee members at Committee meetings are set out in the Directors’ Report. Further information regarding the Committees can be found throughout this Corporate Governance Statement.
Company SecretaryThe Company Secretary acts as secretary to the Board and all of the Committees and is accountable directly to the Board, through the Chairman, on all matters to do with the proper functioning of the Board. All directors have direct access to the Company Secretary.
The Company Secretary’s role is described in the Board charter and includes communication with regulatory bodies and the Australian Securities Exchange (ASX), all statutory and other filings, assisting with good information flows within the Board and its Committees and between non-executive directors and senior management, as well as facilitating induction and professional development as required. The Company Secretary may also provide guidance to directors in relation to governance matters.
Board skills and experienceDirectors are selected to achieve a broad range of skills, experience and expertise complementary to the QBE Group’s insurance activities. At the date of this Corporate Governance Statement, the Board comprised 10 directors, being an independent Chairman, eight other non-executive directors, and the Group Chief Executive Officer.
The Board has a skills matrix covering the range of competencies and experience of each director. When the need for a new director is identified, the required experience and competencies of the new director are considered in the context of this matrix and any gaps that may exist.
The Board’s skills matrix is below.
SKILLS INDUSTRY
Financial literacy General insuranceLegal ReinsuranceGovernance Investment bankingStrategy Private equityCommercial expertise Financial servicesRisk management AccountingGovernment relations InvestmentsExecutive leadership Digital technologyCyber securityIT risksData analytics
Details of individual directors, including their qualifications and experience, independence status and the period of office serving on the Board, are set out in the Board of Directors section and can also be found on the QBE website at www.qbe.com.
Oth
er in
form
ation
6
Fin
ancial
Rep
ort
5
Perfo
rman
ce o
verv
iew
1
Bu
siness
review
2
Directo
rs' R
epo
rt
4
QB
E In
suran
ce Gro
up
A
nn
ual R
epo
rt 2018
49G
ov
ernan
ce
3
Corporate governance statement continued
Independence of the BoardThe majority of the Board are independent directors, applying the “independence” definition of the ASX Corporate Governance Council. When applying this definition, the Board has determined that an independent director’s relationship with QBE as a professional adviser, consultant, supplier, customer or otherwise is not material unless amounts paid under that relationship exceed 0.1% of QBE’s revenue. The roles of QBE’s Chairman and Group Chief Executive Officer are also not exercised by the same individual.
Directors are required to advise the Board on an ongoing basis of any interest they have that they believe could conflict with QBE’s interests. If a potential conflict does arise, either the director concerned may choose not to, or the Board may decide that he or she should not, receive documents or take part in Board discussions whilst the matter is being considered.
TenureThe mere fact that a director has served on the QBE Board for a lengthy period of time does not, of itself, suggest a lack of independence; however, the Board has agreed that an independent director’s term should be approximately 10 years. The Board considers that a mandatory limit on tenure would deprive the QBE Group of valuable and relevant corporate experience in the complex world of international general insurance and reinsurance. The tenure of each director is set out in the Board of directors’ section and can also be found on the QBE website at www.qbe.com.
QBE’s constitution provides that no director, except the Group Chief Executive Officer, shall hold office for a continuous period in excess of three years or past the third AGM following a director’s appointment, whichever is the longer, without submission for re-election. Under QBE’s constitution, there is no maximum fixed term or retirement age for non-executive directors.
Board selection processThe Board has a Governance & Nomination Committee which meets regularly during the year around the time of the Board meetings. The Committee assists the Board in appointing directors so that the Board as a whole has the necessary range of skills, knowledge and experience to be effective. The Governance & Nomination Committee is comprised of all the non-executive directors of the Board and is chaired by Marty Becker.
A formal process for the selection and appointment of directors is undertaken by the Governance & Nomination Committee and Board. Before the Board appoints a new director or puts forward a candidate for election, appropriate background checks are undertaken. External consultants may be employed, where necessary, to search for prospective directors. Candidates are assessed against the required skills and on their qualifications, backgrounds and personal qualities. In addition, candidates must have the required time to commit to the position. The Board regularly reviews the mix of skills that is required. Under QBE’s Constitution, the size of the Board is limited to 12 directors. The Board considers that a maximum of 12 will reflect the largest realistic size of the Board that is consistent with:• maintaining the Board’s efficiency and cohesion in carrying out its governance duties on behalf of shareholders;• reducing the risk of a director being insufficiently involved and informed in the business of QBE; and• providing individual directors with greater potential to contribute and participate.
QBE also provides shareholders with all material information in its possession that is relevant to a decision on whether or not to elect or re-elect a director through a number of channels, such as the Notice of Meeting, director biographies and other information contained in the Annual Report.
The Board believes that orderly succession and renewal contributes to strong corporate governance and is achieved by careful planning and continual review. As an ongoing evaluation, the Board regularly discusses its make up in relation to the mix of skills, diversity and geographic location of directors to meet the needs of QBE.
Director induction and trainingUpon appointment, each non-executive director (and senior executive) is provided with a written agreement which sets out the terms of their appointment. Directors also attend induction sessions upon their appointment, where they are briefed on QBE’s history and vision, strategy, financials, and risk management and governance frameworks.
The Board ensures it has the information it requires to be effective including, where necessary, independent professional advice. A non-executive director may seek such advice at QBE’s cost with the consent of the Chairman. Directors are also provided with ongoing professional development and training programs to enable them to develop and maintain their skills and knowledge at QBE’s cost, with the consent of the Chairman.
50
Corporate governance statement continued
Independence of the BoardThe majority of the Board are independent directors, applying the “independence” definition of the ASX Corporate Governance Council.When applying this definition, the Board has determined that an independent director’s relationship with QBE as a professional adviser,consultant, supplier, customer or otherwise is not material unless amounts paid under that relationship exceed 0.1% of QBE’s revenue.The roles of QBE’s Chairman and Group Chief Executive Officer are also not exercised by the same individual.
Directors are required to advise the Board on an ongoing basis of any interest they have that they believe could conflict with QBE’s interests. If a potential conflict does arise, either the director concerned may choose not to, or the Board may decide that he or she should not, receive documents or take part in Board discussions whilst the matter is being considered.
TenureThe mere fact that a director has served on the QBE Board for a lengthy period of time does not, of itself, suggest a lack of independence;however, the Board has agreed that an independent director’s term should be approximately 10 years. The Board considers that a mandatory limit on tenure would deprive the QBE Group of valuable and relevant corporate experience in the complex world of international general insurance and reinsurance. The tenure of each director is set out in the Board of directors’ section and can alsobe found on the QBE website at www.qbe.com.
QBE’s constitution provides that no director, except the Group Chief Executive Officer, shall hold office for a continuous period in excessof three years or past the third AGM following a director’s appointment, whichever is the longer, without submission for re-election. Under QBE’s constitution, there is no maximum fixed term or retirement age for non-executive directors.
Board selection processThe Board has a Governance & Nomination Committee which meets regularly during the year around the time of the Board meetings.The Committee assists the Board in appointing directors so that the Board as a whole has the necessary range of skills, knowledgeand experience to be effective. The Governance & Nomination Committee is comprised of all the non-executive directors of the Boardand is chaired by Marty Becker.
A formal process for the selection and appointment of directors is undertaken by the Governance & Nomination Committee and Board. Before the Board appoints a new director or puts forward a candidate for election, appropriate background checks are undertaken. External consultants may be employed, where necessary, to search for prospective directors. Candidates are assessed against the required skills and on their qualifications, backgrounds and personal qualities. In addition, candidates must have the required time to commit to the position. The Board regularly reviews the mix of skills that is required. Under QBE’s Constitution, the size of the Board is limited to 12 directors. The Board considers that a maximum of 12 will reflect the largest realistic size of the Board that is consistent with:• maintaining the Board’s efficiency and cohesion in carrying out its governance duties on behalf of shareholders;• reducing the risk of a director being insufficiently involved and informed in the business of QBE; and• providing individual directors with greater potential to contribute and participate.
QBE also provides shareholders with all material information in its possession that is relevant to a decision on whether or not to elect or re-elect a director through a number of channels, such as the Notice of Meeting, director biographies and other information containedin the Annual Report.
The Board believes that orderly succession and renewal contributes to strong corporate governance and is achieved by careful planning and continual review. As an ongoing evaluation, the Board regularly discusses its make up in relation to the mix of skills, diversity and geographic location of directors to meet the needs of QBE.
Director induction and trainingUpon appointment, each non-executive director (and senior executive) is provided with a written agreement which sets out the terms of their appointment. Directors also attend induction sessions upon their appointment, where they are briefed on QBE’s history and vision, strategy, financials, and risk management and governance frameworks.
The Board ensures it has the information it requires to be effective including, where necessary, independent professional advice.A non-executive director may seek such advice at QBE’s cost with the consent of the Chairman. Directors are also provided withongoing professional development and training programs to enable them to develop and maintain their skills and knowledge at QBE’s cost, with the consent of the Chairman.
50
Performance evaluation and remuneration
Performance evaluation – Board and directorsThe Chairman oversees the performance of the Board, its Committees and each director. The Board regularly reviews its performance through internal and external assessments, and recommendations for either improvement or increased focus are agreed and then implemented.
The Board performance evaluation for the 2018 year commenced in early 2019. The review covers the performance of the Board and its Committees, both at the Group and divisional level.
Performance evaluation – senior managementThe People & Remuneration Committee oversees the performance of senior management. In addition, the Board continually monitors the performance of senior management through regular contact and reporting.
In 2018, QBE used a balanced scorecard of an individual’s achievement against specific strategic priorities. Other than as set out in the Remuneration Report, senior management has 35% of their Executive Incentive Plan outcome determined with reference to individual objectives.
The scorecard is aligned to QBE’s business plans and measures objectives which support QBE’s strategic objectives in 2018. The Remuneration Report sets out a summary of the key objectives and outcomes for the Group Chief Executive Officer. The Group Chief Executive Officer’s scorecard was formulated initially through a discussion between the Group Chief Executive Officer and the Chairman and was approved by the Board. Consistent with the Group Chief Executive Officer, the scorecards for the rest of senior management align with QBE’s business plans and support the strategic priorities. The approval and assessment process for the senior management scorecards is completed by the People & Remuneration Committee.
The 2018 objectives for senior management were used to measure their performance for the 2018 year. These performance evaluations occurred in 2019.
People & Remuneration CommitteeThe Board has a People & Remuneration Committee which meets at least quarterly to assist it in overseeing major remuneration practices of the QBE Group. The People & Remuneration Committee is comprised of independent directors and is chaired by Stephen Fitzgerald.
Remuneration policies and practicesDetails of QBE’s policies and practices regarding the remuneration of executives and non-executive directors (being Key Management Personnel) are set out in the Remuneration Report.
Other than meeting statutory superannuation requirements, QBE does not have in place any retirement benefit schemes for non-executive directors.
QBE’s trading policy for dealing in securities of QBE Insurance Group Limited or other entities outlines QBE’s approach to derivatives or otherwise limiting the economic risk of participating in an equity-based remuneration scheme. The trading policy is available at www.qbe.com.
Group governance
Group Governance FrameworkIn line with its commitments to the highest standards of corporate governance, in 2018 the Group Board adopted an updated Group Governance Framework effective 1 January 2019. The Framework sets out five overarching governance principles that support best practice governance across the QBE Group, and is designed to encourage collective governance accountability across Group and the divisions.
The updated Framework refines the roles, responsibilities and composition of the Group and divisional Boards and Committees to ensure they provide appropriate guidance and oversight over the business. The Framework also strengthens the relationship and information flows between these governance bodies, so they can work together to achieve the best possible outcomes for QBE.
Oth
er in
form
ation
6
Fin
ancial
Rep
ort
5
Perfo
rman
ce o
verv
iew
1
Bu
siness
review
2
Directo
rs' R
epo
rt
4
QB
E In
suran
ce Gro
up
A
nn
ual R
epo
rt 2018
51G
ov
ernan
ce
3
Corporate governance statement continued
Group policiesIn February 2018, the QBE Group released its updated Code of Ethics and Conduct. The Code was reviewed and updated to take into account QBE’s changing business environment, approach and strategy and emerging regulatory and compliance issues. In May 2018, global Code of Ethics and Conduct training was released across QBE. The document was again revised in December 2018 to include the newly launched QBE DNA. The Code of Ethics and Conduct applies to all employees as well as directors, agents and contractors.
Also in May 2018, QBE changed the provider of its current whistleblowing system and released the new system, known as the QBE Ethics Hotline, across the majority of QBE. The availability of the Hotline reflects QBE’s commitment to develop a “speak up” culture and ensure disclosures made by employees are taken seriously and employees are protected. In June 2018, global Ethics Hotline training was released across QBE.
Director conduct is covered by both the Code of Ethics and Conduct and the non-executive directors’ nomination, performance evaluation and tenure guidelines. These guidelines cover director conduct, particularly in regard to tenure, performance and evaluation. The guidelines are available at www.qbe.com.
The QBE Group has global policies in key compliance areas, including conflicts of interest, anti-bribery and anti-corruption, sanctions, whistleblowing, diversity and inclusion, work, health and safety and privacy. Global policies are also in place to address prudential requirements of the Australian Prudential Regulation Authority, including risk management, business continuity management, reinsurance management, fitness and propriety and outsourcing. In 2018, QBE released a Group Modern Slavery Statement, introduced a global Priority Data Breach Policy and expanded the requirements of the Gift and Entertainment (G&E) Policy across QBE’s Group Head Office, Australia, New Zealand, Asia Pacific, Philippines (GSSC) and reinsurance divisions. North America and Europe continue to adopt a local approach to G&E.
In recognition of the importance of protecting employee and customer data across the QBE Group, the Group Privacy Officer chairs a global Privacy Working Group. QBE’s global approach in key compliance areas recognises that employees (including contractors, directors and agents) are key to maintaining a compliant and ethical approach to QBE’s business practices. Most global policies are supported by Group guidelines that provide additional information and guidance to support employees. As per the Group Compliance Monitoring Plan, QBE has finalised three compliance monitoring reviews covering gifts and entertainment, sanctions, and fitness and propriety. QBE has also enhanced the resource capability of the Group Compliance team, recruiting expertise in financial crime and learning and development.
In Australia, QBE complies with the General Insurance Code of Practice, a self-regulated code relating to the provision of products and services to customers of the general insurance industry in Australia. The Code Governance Committee (CGC) is the independent body that monitors and enforces insurers’ compliance with the Code. QBE’s Australian business is also a member of the Australian Financial Complaints Authority (AFCA), the external dispute resolution scheme that deals with complaints from consumers in the financial system.
Continuous disclosureQBE takes its continuous disclosure obligations seriously and issues market releases during the year to satisfy those obligations. All ASX announcements are set out on QBE’s website at www.qbe.com.
QBE’s continuous disclosure policy is available at www.qbe.com.
Diversity and inclusionQBE has a strong commitment to diversity and to offering a dynamic workplace culture; one that values and leverages the ideas, capabilities and experiences of our global workforce. The Global Diversity & Inclusion (D&I) policy was revised in 2018, aiming through its implementation to ensure the Group is:
• attracting and hiring diverse teams that enhance the approach to problem solving and innovation;• supporting productivity and engagement by offering an inclusive, flexible and modern workplace;• leveraging diverse skills to enhance the customer experience and organisational growth; and• supporting our local communities and strengthening our brand reputation.
To achieve this, the Group Executive Committee, which represents the Global Diversity & Inclusion Council, has set the following objectives which are implemented and overseen by the Council and assessed and reviewed annually by the People & Remuneration Committee of the Group Board:
52
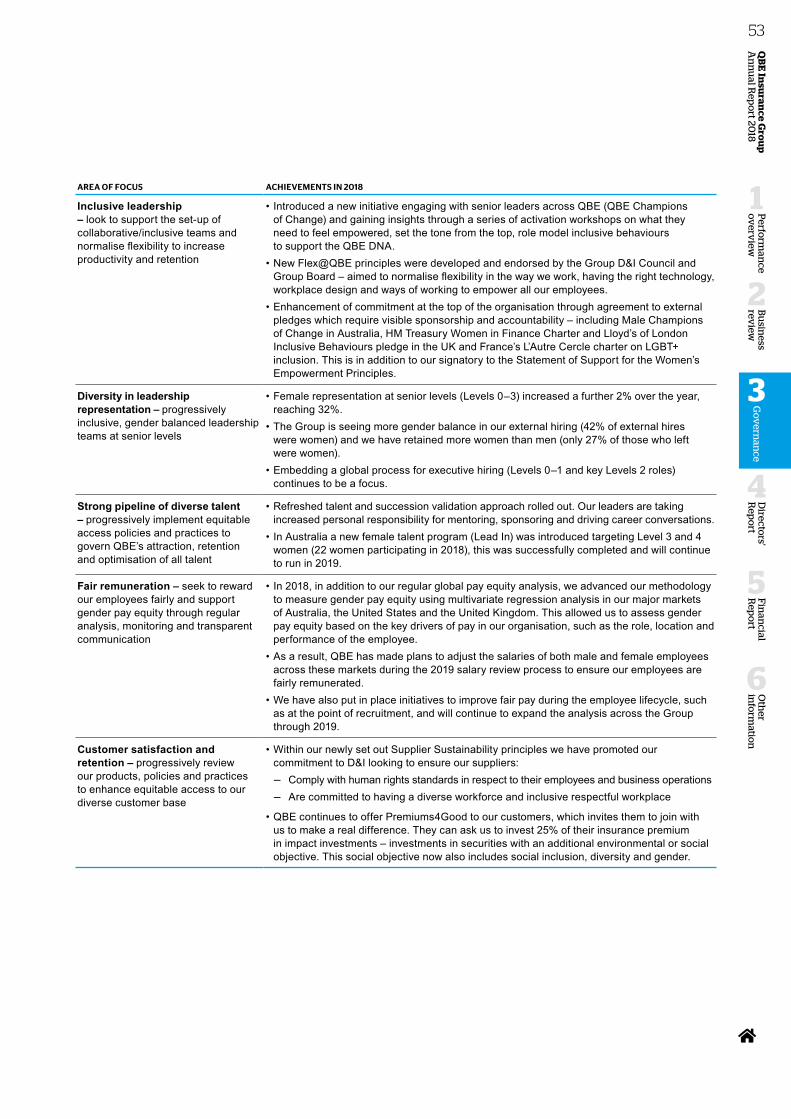
Corporate governance statement continued
Group policiesIn February 2018, the QBE Group released its updated Code of Ethics and Conduct. The Code was reviewed and updated to take into account QBE’s changing business environment, approach and strategy and emerging regulatory and compliance issues. In May2018, global Code of Ethics and Conduct training was released across QBE. The document was again revised in December 2018 to include the newly launched QBE DNA. The Code of Ethics and Conduct applies to all employees as well as directors, agents and contractors.
Also in May 2018, QBE changed the provider of its current whistleblowing system and released the new system, known as the QBE Ethics Hotline, across the majority of QBE. The availability of the Hotline reflects QBE’s commitment to develop a “speak up” culture and ensure disclosures made by employees are taken seriously and employees are protected. In June 2018, global Ethics Hotline training was released across QBE.
Director conduct is covered by both the Code of Ethics and Conduct and the non-executive directors’ nomination, performance evaluation and tenure guidelines. These guidelines cover director conduct, particularly in regard to tenure, performance and evaluation. The guidelines are available at www.qbe.com.
The QBE Group has global policies in key compliance areas, including conflicts of interest, anti-bribery and anti-corruption, sanctions,whistleblowing, diversity and inclusion, work, health and safety and privacy. Global policies are also in place to address prudentialrequirements of the Australian Prudential Regulation Authority, including risk management, business continuity management,reinsurance management, fitness and propriety and outsourcing. In 2018, QBE released a Group Modern Slavery Statement,introduced a global Priority Data Breach Policy and expanded the requirements of the Gift and Entertainment (G&E) Policy acrossQBE’s Group Head Office, Australia, New Zealand, Asia Pacific, Philippines (GSSC) and reinsurance divisions. North America andEurope continue to adopt a local approach to G&E.
In recognition of the importance of protecting employee and customer data across the QBE Group, the Group Privacy Officer chairs a global Privacy Working Group. QBE’s global approach in key compliance areas recognises that employees (including contractors, directors and agents) are key to maintaining a compliant and ethical approach to QBE’s business practices. Most global policies are supported by Group guidelines that provide additional information and guidance to support employees. As per the Group Compliance Monitoring Plan, QBE has finalised three compliance monitoring reviews covering gifts and entertainment, sanctions, and fitness and propriety. QBE has also enhanced the resource capability of the Group Compliance team, recruiting expertise in financial crime and learning and development.
In Australia, QBE complies with the General Insurance Code of Practice, a self-regulated code relating to the provision of products and services to customers of the general insurance industry in Australia. The Code Governance Committee (CGC) is the independent body that monitors and enforces insurers’ compliance with the Code. QBE’s Australian business is also a member of the Australian Financial Complaints Authority (AFCA), the external dispute resolution scheme that deals with complaints from consumers in the financial system.
Continuous disclosureQBE takes its continuous disclosure obligations seriously and issues market releases during the year to satisfy those obligations. All ASX announcements are set out on QBE’s website at www.qbe.com.
QBE’s continuous disclosure policy is available at www.qbe.com.
Diversity and inclusionQBE has a strong commitment to diversity and to offering a dynamic workplace culture; one that values and leverages the ideas, capabilities and experiences of our global workforce. The Global Diversity & Inclusion (D&I) policy was revised in 2018, aiming through its implementation to ensure the Group is:
• attracting and hiring diverse teams that enhance the approach to problem solving and innovation;• supporting productivity and engagement by offering an inclusive, flexible and modern workplace;• leveraging diverse skills to enhance the customer experience and organisational growth; and• supporting our local communities and strengthening our brand reputation.
To achieve this, the Group Executive Committee, which represents the Global Diversity & Inclusion Council, has set the following objectives which are implemented and overseen by the Council and assessed and reviewed annually by the People & Remuneration Committee of the Group Board:
52
AREA OF FOCUS ACHIEVEMENTS IN 2018
Inclusive leadership – look to support the set-up ofcollaborative/inclusive teams andnormalise flexibility to increaseproductivity and retention
• Introduced a new initiative engaging with senior leaders across QBE (QBE Championsof Change) and gaining insights through a series of activation workshops on what theyneed to feel empowered, set the tone from the top, role model inclusive behavioursto support the QBE DNA.
• New Flex@QBE principles were developed and endorsed by the Group D&I Council andGroup Board – aimed to normalise flexibility in the way we work, having the right technology,workplace design and ways of working to empower all our employees.
• Enhancement of commitment at the top of the organisation through agreement to externalpledges which require visible sponsorship and accountability – including Male Championsof Change in Australia, HM Treasury Women in Finance Charter and Lloyd’s of LondonInclusive Behaviours pledge in the UK and France’s L’Autre Cercle charter on LGBT+inclusion. This is in addition to our signatory to the Statement of Support for the Women’sEmpowerment Principles.
Diversity in leadership representation – progressively inclusive, gender balanced leadership teams at senior levels
• Female representation at senior levels (Levels 0–3) increased a further 2% over the year,reaching 32%.
• The Group is seeing more gender balance in our external hiring (42% of external hireswere women) and we have retained more women than men (only 27% of those who leftwere women).
• Embedding a global process for executive hiring (Levels 0–1 and key Levels 2 roles)continues to be a focus.
Strong pipeline of diverse talent – progressively implement equitableaccess policies and practices togovern QBE’s attraction, retentionand optimisation of all talent
• Refreshed talent and succession validation approach rolled out. Our leaders are takingincreased personal responsibility for mentoring, sponsoring and driving career conversations.
• In Australia a new female talent program (Lead In) was introduced targeting Level 3 and 4women (22 women participating in 2018), this was successfully completed and will continueto run in 2019.
Fair remuneration – seek to reward our employees fairly and support gender pay equity through regular analysis, monitoring and transparent communication
• In 2018, in addition to our regular global pay equity analysis, we advanced our methodologyto measure gender pay equity using multivariate regression analysis in our major marketsof Australia, the United States and the United Kingdom. This allowed us to assess genderpay equity based on the key drivers of pay in our organisation, such as the role, location andperformance of the employee.
• As a result, QBE has made plans to adjust the salaries of both male and female employeesacross these markets during the 2019 salary review process to ensure our employees arefairly remunerated.
• We have also put in place initiatives to improve fair pay during the employee lifecycle, suchas at the point of recruitment, and will continue to expand the analysis across the Groupthrough 2019.
Customer satisfaction and retention – progressively review our products, policies and practices to enhance equitable access to our diverse customer base
• Within our newly set out Supplier Sustainability principles we have promoted ourcommitment to D&I looking to ensure our suppliers:
— Comply with human rights standards in respect to their employees and business operations — Are committed to having a diverse workforce and inclusive respectful workplace
• QBE continues to offer Premiums4Good to our customers, which invites them to join withus to make a real difference. They can ask us to invest 25% of their insurance premiumin impact investments – investments in securities with an additional environmental or socialobjective. This social objective now also includes social inclusion, diversity and gender.
Oth
er in
form
ation
6
Fin
ancial
Rep
ort
5
Perfo
rman
ce o
verv
iew
1
Bu
siness
review
2
Directo
rs' R
epo
rt
4
QB
E In
suran
ce Gro
up
A
nn
ual R
epo
rt 2018
53G
ov
ernan
ce
3
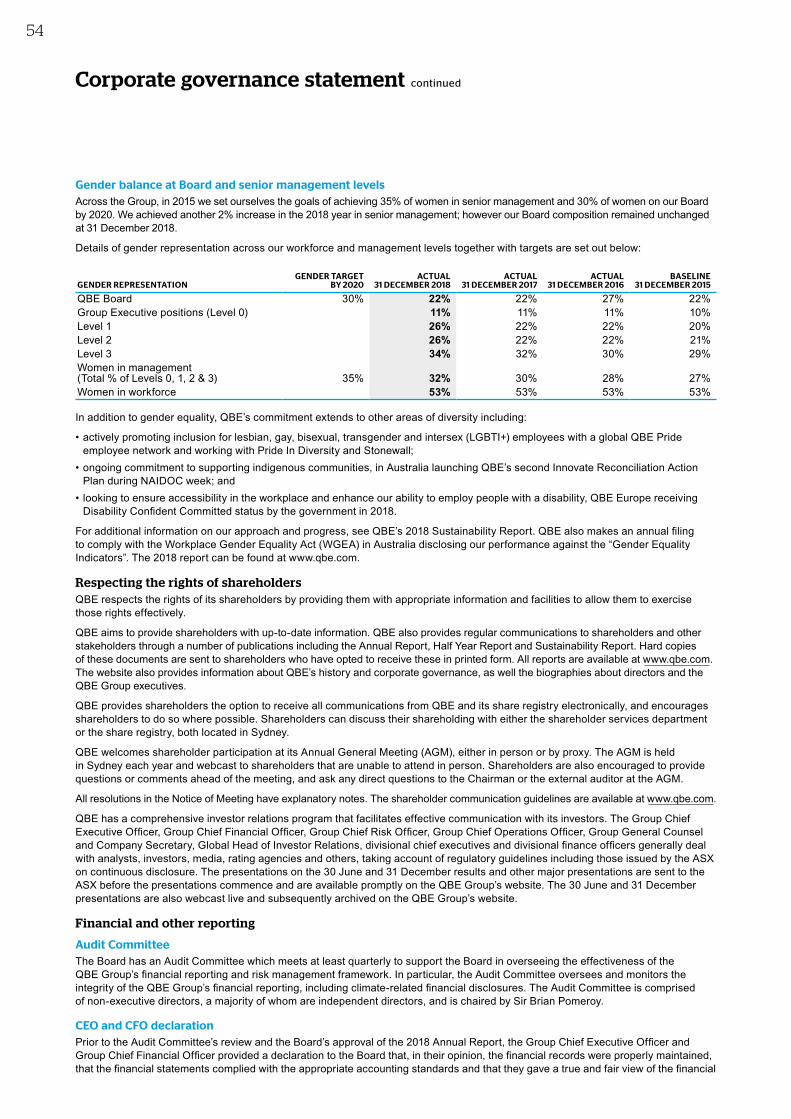
Corporate governance statement continued
Gender balance at Board and senior management levelsAcross the Group, in 2015 we set ourselves the goals of achieving 35% of women in senior management and 30% of women on our Board by 2020. We achieved another 2% increase in the 2018 year in senior management; however our Board composition remained unchanged at 31 December 2018.
Details of gender representation across our workforce and management levels together with targets are set out below:
GENDER REPRESENTATIONGENDER TARGET
BY 2020ACTUAL
31 DECEMBER 2018ACTUAL
31 DECEMBER 2017ACTUAL
31 DECEMBER 2016BASELINE
31 DECEMBER 2015
QBE Board 30% 22% 22% 27% 22%Group Executive positions (Level 0) 11% 11% 11% 10%Level 1 26% 22% 22% 20%Level 2 26% 22% 22% 21%Level 3 34% 32% 30% 29%Women in management (Total % of Levels 0, 1, 2 & 3) 35% 32% 30% 28% 27%Women in workforce 53% 53% 53% 53%
In addition to gender equality, QBE’s commitment extends to other areas of diversity including:
• actively promoting inclusion for lesbian, gay, bisexual, transgender and intersex (LGBTI+) employees with a global QBE Prideemployee network and working with Pride In Diversity and Stonewall;
• ongoing commitment to supporting indigenous communities, in Australia launching QBE’s second Innovate Reconciliation ActionPlan during NAIDOC week; and
• looking to ensure accessibility in the workplace and enhance our ability to employ people with a disability, QBE Europe receivingDisability Confident Committed status by the government in 2018.
For additional information on our approach and progress, see QBE’s 2018 Sustainability Report. QBE also makes an annual filing to comply with the Workplace Gender Equality Act (WGEA) in Australia disclosing our performance against the “Gender Equality Indicators”. The 2018 report can be found at www.qbe.com.
Respecting the rights of shareholdersQBE respects the rights of its shareholders by providing them with appropriate information and facilities to allow them to exercise those rights effectively.
QBE aims to provide shareholders with up-to-date information. QBE also provides regular communications to shareholders and other stakeholders through a number of publications including the Annual Report, Half Year Report and Sustainability Report. Hard copies of these documents are sent to shareholders who have opted to receive these in printed form. All reports are available at www.qbe.com. The website also provides information about QBE’s history and corporate governance, as well the biographies about directors and the QBE Group executives.
QBE provides shareholders the option to receive all communications from QBE and its share registry electronically, and encourages shareholders to do so where possible. Shareholders can discuss their shareholding with either the shareholder services department or the share registry, both located in Sydney.
QBE welcomes shareholder participation at its Annual General Meeting (AGM), either in person or by proxy. The AGM is held in Sydney each year and webcast to shareholders that are unable to attend in person. Shareholders are also encouraged to provide questions or comments ahead of the meeting, and ask any direct questions to the Chairman or the external auditor at the AGM.
All resolutions in the Notice of Meeting have explanatory notes. The shareholder communication guidelines are available at www.qbe.com.
QBE has a comprehensive investor relations program that facilitates effective communication with its investors. The Group Chief Executive Officer, Group Chief Financial Officer, Group Chief Risk Officer, Group Chief Operations Officer, Group General Counsel and Company Secretary, Global Head of Investor Relations, divisional chief executives and divisional finance officers generally deal with analysts, investors, media, rating agencies and others, taking account of regulatory guidelines including those issued by the ASX on continuous disclosure. The presentations on the 30 June and 31 December results and other major presentations are sent to the ASX before the presentations commence and are available promptly on the QBE Group’s website. The 30 June and 31 December presentations are also webcast live and subsequently archived on the QBE Group’s website.
Financial and other reporting
Audit CommitteeThe Board has an Audit Committee which meets at least quarterly to support the Board in overseeing the effectiveness of the QBE Group’s financial reporting and risk management framework. In particular, the Audit Committee oversees and monitors the integrity of the QBE Group’s financial reporting, including climate-related financial disclosures. The Audit Committee is comprised of non-executive directors, a majority of whom are independent directors, and is chaired by Sir Brian Pomeroy.
CEO and CFO declarationPrior to the Audit Committee’s review and the Board’s approval of the 2018 Annual Report, the Group Chief Executive Officer and Group Chief Financial Officer provided a declaration to the Board that, in their opinion, the financial records were properly maintained, that the financial statements complied with the appropriate accounting standards and that they gave a true and fair view of the financial
54
Corporate governance statement continued
Gender balance at Board and senior management levelsAcross the Group, in 2015 we set ourselves the goals of achieving 35% of women in senior management and 30% of women on our Board by 2020. We achieved another 2% increase in the 2018 year in senior management; however our Board composition remained unchanged at 31 December 2018.
Details of gender representation across our workforce and management levels together with targets are set out below:
GENDER REPRESENTATIONGENDER TARGET
BY 2020ACTUAL
31 DECEMBER 2018ACTUAL
31 DECEMBER 2017ACTUAL
31 DECEMBER 2016BASELINE
31 DECEMBER 2015
QBE Board 30% 22% 22% 27% 22%Group Executive positions (Level 0) 11% 11% 11% 10%Level 1 26% 22% 22% 20%Level 2 26% 22% 22% 21%Level 3 34% 32% 30% 29%Women in management (Total % of Levels 0, 1, 2 & 3) 35% 32% 30% 28% 27%Women in workforce 53% 53% 53% 53%
In addition to gender equality, QBE’s commitment extends to other areas of diversity including:
• actively promoting inclusion for lesbian, gay, bisexual, transgender and intersex (LGBTI+) employees with a global QBE Pride employee network and working with Pride In Diversity and Stonewall;
• ongoing commitment to supporting indigenous communities, in Australia launching QBE’s second Innovate Reconciliation Action Plan during NAIDOC week; and
• looking to ensure accessibility in the workplace and enhance our ability to employ people with a disability, QBE Europe receiving Disability Confident Committed status by the government in 2018.
For additional information on our approach and progress, see QBE’s 2018 Sustainability Report. QBE also makes an annual filing to comply with the Workplace Gender Equality Act (WGEA) in Australia disclosing our performance against the “Gender Equality Indicators”. The 2018 report can be found at www.qbe.com.
Respecting the rights of shareholdersQBE respects the rights of its shareholders by providing them with appropriate information and facilities to allow them to exercise those rights effectively.
QBE aims to provide shareholders with up-to-date information. QBE also provides regular communications to shareholders and other stakeholders through a number of publications including the Annual Report, Half Year Report and Sustainability Report. Hard copies of these documents are sent to shareholders who have opted to receive these in printed form. All reports are available at www.qbe.com. The website also provides information about QBE’s history and corporate governance, as well the biographies about directors and the QBE Group executives.
QBE provides shareholders the option to receive all communications from QBE and its share registry electronically, and encourages shareholders to do so where possible. Shareholders can discuss their shareholding with either the shareholder services department or the share registry, both located in Sydney.
QBE welcomes shareholder participation at its Annual General Meeting (AGM), either in person or by proxy. The AGM is held in Sydney each year and webcast to shareholders that are unable to attend in person. Shareholders are also encouraged to provide questions or comments ahead of the meeting, and ask any direct questions to the Chairman or the external auditor at the AGM.
All resolutions in the Notice of Meeting have explanatory notes. The shareholder communication guidelines are available at www.qbe.com.
QBE has a comprehensive investor relations program that facilitates effective communication with its investors. The Group Chief Executive Officer, Group Chief Financial Officer, Group Chief Risk Officer, Group Chief Operations Officer, Group General Counsel and Company Secretary, Global Head of Investor Relations, divisional chief executives and divisional finance officers generally deal with analysts, investors, media, rating agencies and others, taking account of regulatory guidelines including those issued by the ASX on continuous disclosure. The presentations on the 30 June and 31 December results and other major presentations are sent to the ASX before the presentations commence and are available promptly on the QBE Group’s website. The 30 June and 31 December presentations are also webcast live and subsequently archived on the QBE Group’s website.
Financial and other reporting
Audit CommitteeThe Board has an Audit Committee which meets at least quarterly to support the Board in overseeing the effectiveness of the QBE Group’s financial reporting and risk management framework. In particular, the Audit Committee oversees and monitors the integrity of the QBE Group’s financial reporting, including climate-related financial disclosures. The Audit Committee is comprised of non-executive directors, a majority of whom are independent directors, and is chaired by Sir Brian Pomeroy.
CEO and CFO declarationPrior to the Audit Committee’s review and the Board’s approval of the 2018 Annual Report, the Group Chief Executive Officer and Group Chief Financial Officer provided a declaration to the Board that, in their opinion, the financial records were properly maintained, that the financial statements complied with the appropriate accounting standards and that they gave a true and fair view of the financial
54
position and performance of the QBE Group. The declaration also provides that the opinion of the Group Chief Executive Officer and Group Chief Financial Officer was based on a sound system of risk management and internal control which is operating effectively.
External auditor independenceQBE firmly believes that the external auditor must be, and must be seen to be, independent. The external auditor confirms its independence and the Audit Committee confirms this by separate enquiry. The Audit Committee meets with the external auditor in the absence of management as part of each Committee meeting. The external auditor attends the AGM and a representative is available to answer questions from shareholders relevant to the audit.
The Audit Committee has free and unfettered access to the external auditor. The external auditor has free and unfettered access to the Audit Committee.
QBE has issued an internal guideline on external auditor independence. Under this guideline, the external auditor is not allowed to provide the excluded services of preparing accounting records, financial reports or asset or liability valuations. Furthermore, it cannot act in a management capacity, as a custodian of assets or as a share registry.
The Board believes some non-audit services are appropriate given the external auditor’s knowledge of the QBE Group. QBE may engage the external auditor for non-audit services other than excluded services subject to the general principle that fees for non-audit services should not exceed 50% of all fees paid to the external auditor in any one financial year. External tax services are generally provided by an accounting firm other than the external auditor.
The Audit Committee approves the audit plan each year and receives information on the external auditor’s fees. QBE also considers the terms of engagement of the external auditor every few years. The Corporations Act 2001 and Australian professional auditing standards require rotation of the lead engagement partner after five years. The lead engagement partner of the external auditor was last rotated in 2018.
In the event that the Audit Committee thought it appropriate to change the firm undertaking QBE’s external audit, it would conduct an appropriate competitive tender process.
Actuarial reviewIt is a longstanding practice of the directors to ensure that the QBE Group’s insurance liabilities are assessed by actuaries.
The central estimate of QBE Group’s insurance liabilities, comprising outstanding claims and premium liabilities, is determined by experienced internal actuarial staff. Actuarial staff form an independent view, separate from management, of both the central estimate and the probability of adequacy of outstanding claims and premium liabilities. At 31 December 2018, close to 100% of QBE’s outstanding claims central estimate was also reviewed by external actuaries.
Internal auditA global internal audit function is critical to the risk management process. QBE’s internal audit function reports to the Group Chief Financial Officer and the Audit Committee on the monitoring of the QBE Group’s worldwide operations. Internal audit provides independent assurance that the design and operation of the controls across the QBE Group are effective. The internal audit function operates under a written charter from the Audit Committee and the Group Head of Internal Audit has free and unfettered access to that Committee. Other governance documents include a reporting protocol, internal audit manual, internal audit issue rating system, internal audit opinion levels and internal audit timetables. A risk-based internal audit approach is used so that higher risk activities are reviewed more frequently.
Risk managementQBE is in the business of managing risk. The Board and management are fully committed to ensuring that a disciplined approach to managing risk delivers leading practice and that QBE Group’s risk management processes and systems are robust and independent. QBE’s risk framework supports its businesses across all divisions and provides a sound foundation for reducing uncertainty and volatility in business performance.
Risk & Capital CommitteeThe Board monitors the QBE Group’s performance and, as such, plays a significant role in ensuring that an effective risk management strategy is established and maintained. The Board has a Risk & Capital Committee which meets at least quarterly to support the Board in overseeing the effectiveness of QBE Group’s risk and capital management frameworks. The proper oversight of these frameworks supports strategic objectives, informs business plans and ensures that current and future risks are identified, assessed and monitored in line with risk appetite. Under its charter, the Risk & Capital Committee is required to review the risk framework periodically to confirm it continues to be sound. This review was undertaken during 2018 as part of the annual refresh of the Risk Management Strategy.
The Risk & Capital Committee is comprised of independent directors and is chaired by Rolf Tolle. The Risk & Capital Committee has access to the Group Chief Risk Officer and other relevant senior management.
Economic, social and environmental riskInformation about how QBE approaches sustainability and the management of environmental, social and governance (ESG) issues can be found in the 2018 Sustainability Report available at www.qbe.com.
Further details of how QBE manages risk are set out in the Group Chief Risk Officer’s Report. An overview of QBE’s risk management framework, including QBE’s material economic risks and how these are mitigated, is also set out in note 4 to the Financial Report.
Oth
er in
form
ation
6
Fin
ancial
Rep
ort
5
Perfo
rman
ce o
verv
iew
1
Bu
siness
review
2
Directo
rs' R
epo
rt
4
QB
E In
suran
ce Gro
up
A
nn
ual R
epo
rt 2018
55G
ov
ernan
ce
3
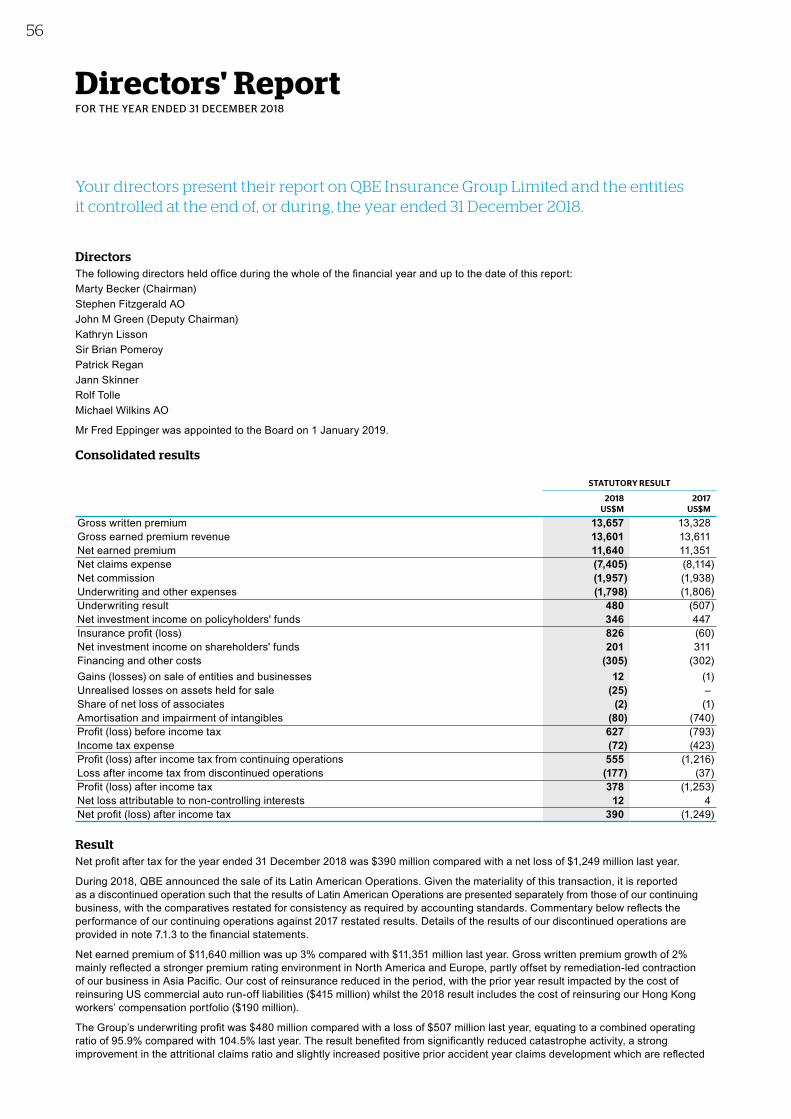
Directors' ReportFOR THE YEAR ENDED 31 DECEMBER 2018
Your directors present their report on QBE Insurance Group Limited and the entities it controlled at the end of, or during, the year ended 31 December 2018.
DirectorsThe following directors held office during the whole of the financial year and up to the date of this report:Marty Becker (Chairman)Stephen Fitzgerald AOJohn M Green (Deputy Chairman)Kathryn LissonSir Brian PomeroyPatrick ReganJann SkinnerRolf TolleMichael Wilkins AO
Mr Fred Eppinger was appointed to the Board on 1 January 2019.
Consolidated results
STATUTORY RESULT
2018 2017 US$M US$M
Gross written premium 13,657 13,328Gross earned premium revenue 13,601 13,611Net earned premium 11,640 11,351Net claims expense (7,405) (8,114)Net commission (1,957) (1,938)Underwriting and other expenses (1,798) (1,806)Underwriting result 480 (507)Net investment income on policyholders' funds 346 447Insurance profit (loss) 826 (60)Net investment income on shareholders' funds 201 311Financing and other costs (305) (302)Gains (losses) on sale of entities and businesses 12 (1)Unrealised losses on assets held for sale (25) –Share of net loss of associates (2) (1)Amortisation and impairment of intangibles (80) (740)Profit (loss) before income tax 627 (793)Income tax expense (72) (423)Profit (loss) after income tax from continuing operations 555 (1,216)Loss after income tax from discontinued operations (177) (37)Profit (loss) after income tax 378 (1,253)Net loss attributable to non-controlling interests 12 4Net profit (loss) after income tax 390 (1,249)
ResultNet profit after tax for the year ended 31 December 2018 was $390 million compared with a net loss of $1,249 million last year.
During 2018, QBE announced the sale of its Latin American Operations. Given the materiality of this transaction, it is reported as a discontinued operation such that the results of Latin American Operations are presented separately from those of our continuing business, with the comparatives restated for consistency as required by accounting standards. Commentary below reflects the performance of our continuing operations against 2017 restated results. Details of the results of our discontinued operations are provided in note 7.1.3 to the financial statements.
Net earned premium of $11,640 million was up 3% compared with $11,351 million last year. Gross written premium growth of 2% mainly reflected a stronger premium rating environment in North America and Europe, partly offset by remediation-led contraction of our business in Asia Pacific. Our cost of reinsurance reduced in the period, with the prior year result impacted by the cost of reinsuring US commercial auto run-off liabilities ($415 million) whilst the 2018 result includes the cost of reinsuring our Hong Kong workers’ compensation portfolio ($190 million).
The Group’s underwriting profit was $480 million compared with a loss of $507 million last year, equating to a combined operating ratio of 95.9% compared with 104.5% last year. The result benefited from significantly reduced catastrophe activity, a strong improvement in the attritional claims ratio and slightly increased positive prior accident year claims development which are reflected
56
in the lower net claims ratio of 63.6% compared with 71.5% last year. The prior year ratio was also adversely impacted by the Ogden decision in the UK ($141 million).
The combined commission and expense ratio improved to 32.3% from 33.0% last year. Cost savings from efficiency initiatives were achieved in all divisions, partly offset by the Group’s investment in a number of strategic initiatives during the year and reduced fee income in Australian & New Zealand Operations.
Net investment and other income was $547 million compared with $758 million last year, resulting in a net return of 2.3% compared with 3.0% last year. Fixed income returns were adversely impacted by higher US Treasury yields and wider global credit spreads.
The Group’s effective tax rate was 11%, reflecting the mix of corporate rates in the jurisdictions in which QBE operates as well as the recognition of deferred tax assets and the utilisation of previously unrecognised tax losses in the US tax group. The prior year effective tax rate was materially distorted by the write down of the deferred tax asset in North American Operations due to the reduction in the US corporate tax rate to 21% and significant catastrophe claims in both North American Operations, where an already substantial deferred tax asset precluded the further recognition of tax losses, and in Equator Re.
DividendsThe directors announce a final dividend of 28 Australian cents per share, up from the final dividend of four Australian cents per share for 2017. The dividend will be 60% franked. The total dividend payout is A$669 million, or 70% of cash profit, compared with A$356 million for 2017. Further details in relation to dividends paid during the year are set out on page 134 of this Annual Report.
Our objective is to deliver a stable and growing dividend to our shareholders. Our current dividend policy sets the full year dividend payout ratio at around 65% of cash profit.
ActivitiesThe principal activities of QBE during the year were underwriting general insurance and reinsurance risks, management of Lloyd’s syndicates and investment management.
Presentation currencyThe Group has presented the Financial Report in US dollars because a significant proportion of its underwriting activity is denominated in US dollars. The US dollar is also the currency that is widely understood by the global insurance industry, international investors and analysts.
Operating and financial reviewA review of the Group’s operations during the year and the results of those operations is set on pages 4 to 35 of this Annual Report. These pages also deal with the Group’s operations, financial position, business strategies and prospects for future financial years.
Outstanding claims liability The net central estimate of outstanding claims is determined by the Group Chief Actuary after consultation with internal and external actuaries. The assessment takes into account the statistical analysis of past claims, allowance for claims incurred but not reported, reinsurance and other recoveries and future interest and inflation factors.
As in previous years, the directors consider that substantial risk margins are required over the actuarial net central estimate to mitigate the inherent uncertainty in the net central estimate. The probability of adequacy of the outstanding claims liability at 31 December 2018 was 90.1% compared with 90.0% last year. The Australian Prudential Regulation Authority (APRA) prudential standards provide a capital credit for outstanding claims in excess of a probability of adequacy of 75%.
Group indemnitiesArticle 78 of the company’s constitution provides that the company indemnifies past and present directors, secretaries or other officers against any liability incurred by that person as a director, secretary or other officer of the company or its subsidiaries. The indemnity does not apply to any liability (excluding legal costs):• owed to the company or a related body corporate (e.g. breach of directors’ duties);• for a pecuniary penalty under section 1317G or a compensation order under sections 1317H or 1317HA of the Corporations Act
2001 (or a similar provision of the corresponding legislation in another jurisdiction); or• that is owed to someone other than the company or a related body corporate and which did not arise out of conduct in good faith.
The indemnity extends to legal costs other than where:• in civil proceedings, one or more of the above exclusions apply;• in criminal proceedings, the person is found guilty;• the person is liable in proceedings brought by the Australian Securities and Investments Commission (ASIC), a corresponding
regulator in another jurisdiction or a liquidator (unless as part of the investigation before proceedings are commenced); or• the court does not grant relief after an application under the Corporations Act 2001 or corresponding legislation in another jurisdiction.
In addition, a deed exists between the company and each director which includes an indemnity in similar terms to article 78 of the company’s constitution.
Oth
er in
form
ation
6
Fin
ancial
Rep
ort
5
Perfo
rman
ce o
verv
iew
1
Bu
siness
review
2
Go
vern
ance
3
Directo
rs' R
epo
rt
4
QB
E In
suran
ce Gro
up
A
nn
ual R
epo
rt 2018
57D
irectors'
Rep
ort
4
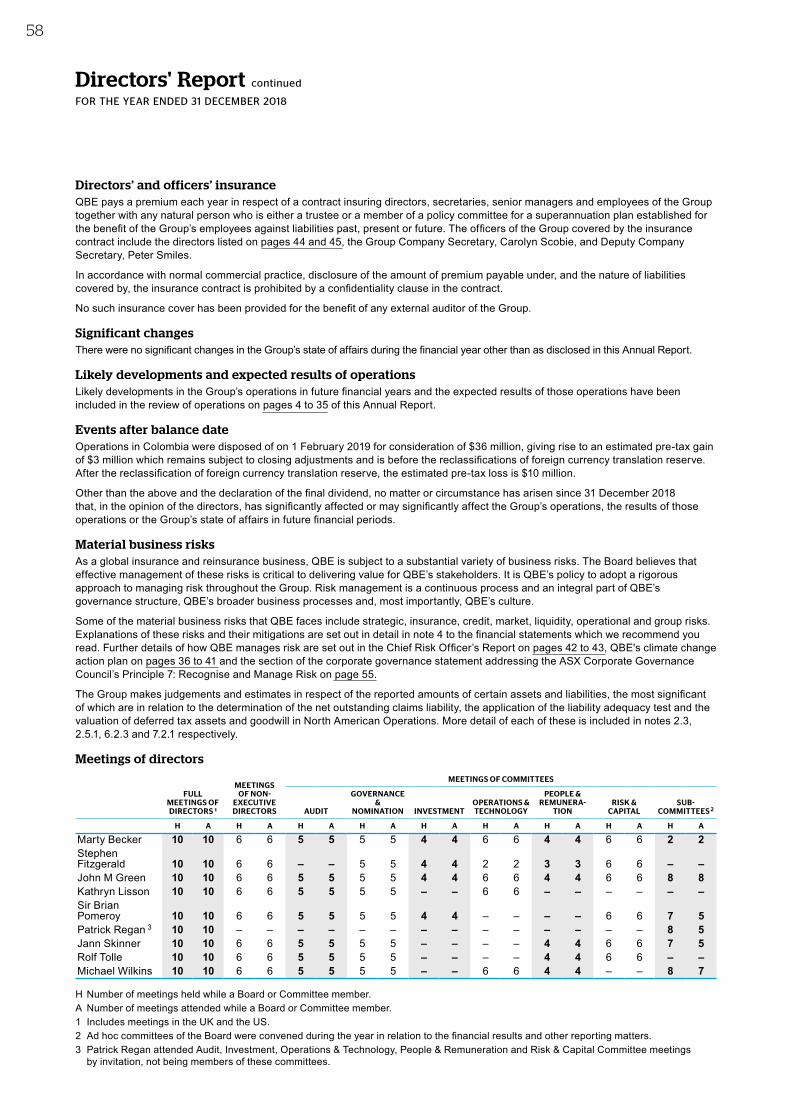
Directors' Report continued
FOR THE YEAR ENDED 31 DECEMBER 2018
Directors’ and officers’ insuranceQBE pays a premium each year in respect of a contract insuring directors, secretaries, senior managers and employees of the Group together with any natural person who is either a trustee or a member of a policy committee for a superannuation plan established for the benefit of the Group’s employees against liabilities past, present or future. The officers of the Group covered by the insurance contract include the directors listed on pages 44 and 45, the Group Company Secretary, Carolyn Scobie, and Deputy Company Secretary, Peter Smiles.
In accordance with normal commercial practice, disclosure of the amount of premium payable under, and the nature of liabilities covered by, the insurance contract is prohibited by a confidentiality clause in the contract.
No such insurance cover has been provided for the benefit of any external auditor of the Group.
Significant changesThere were no significant changes in the Group’s state of affairs during the financial year other than as disclosed in this Annual Report.
Likely developments and expected results of operationsLikely developments in the Group’s operations in future financial years and the expected results of those operations have been included in the review of operations on pages 4 to 35 of this Annual Report.
Events after balance dateOperations in Colombia were disposed of on 1 February 2019 for consideration of $36 million, giving rise to an estimated pre-tax gain of $3 million which remains subject to closing adjustments and is before the reclassifications of foreign currency translation reserve. After the reclassification of foreign currency translation reserve, the estimated pre-tax loss is $10 million.
Other than the above and the declaration of the final dividend, no matter or circumstance has arisen since 31 December 2018 that, in the opinion of the directors, has significantly affected or may significantly affect the Group’s operations, the results of those operations or the Group’s state of affairs in future financial periods.
Material business risksAs a global insurance and reinsurance business, QBE is subject to a substantial variety of business risks. The Board believes that effective management of these risks is critical to delivering value for QBE’s stakeholders. It is QBE’s policy to adopt a rigorous approach to managing risk throughout the Group. Risk management is a continuous process and an integral part of QBE’s governance structure, QBE’s broader business processes and, most importantly, QBE’s culture.
Some of the material business risks that QBE faces include strategic, insurance, credit, market, liquidity, operational and group risks. Explanations of these risks and their mitigations are set out in detail in note 4 to the financial statements which we recommend you read. Further details of how QBE manages risk are set out in the Chief Risk Officer’s Report on pages 42 to 43, QBE's climate change action plan on pages 36 to 41 and the section of the corporate governance statement addressing the ASX Corporate Governance Council’s Principle 7: Recognise and Manage Risk on page 55.
The Group makes judgements and estimates in respect of the reported amounts of certain assets and liabilities, the most significant of which are in relation to the determination of the net outstanding claims liability, the application of the liability adequacy test and the valuation of deferred tax assets and goodwill in North American Operations. More detail of each of these is included in notes 2.3, 2.5.1, 6.2.3 and 7.2.1 respectively.
Meetings of directors
FULL MEETINGS OF DIRECTORS 1
MEETINGS OF NON-
EXECUTIVEDIRECTORS
MEETINGS OF COMMITTEES
AUDIT
GOVERNANCE &
NOMINATION INVESTMENTOPERATIONS & TECHNOLOGY
PEOPLE & REMUNERA-
TIONRISK &
CAPITALSUB-
COMMITTEES 2
H A H A H A H A H A H A H A H A H A
Marty Becker 10 10 6 6 5 5 5 5 4 4 6 6 4 4 6 6 2 2Stephen Fitzgerald 10 10 6 6 – – 5 5 4 4 2 2 3 3 6 6 – –John M Green 10 10 6 6 5 5 5 5 4 4 6 6 4 4 6 6 8 8Kathryn Lisson 10 10 6 6 5 5 5 5 – – 6 6 – – – – – –Sir Brian Pomeroy 10 10 6 6 5 5 5 5 4 4 – – – – 6 6 7 5Patrick Regan 3 10 10 – – – – – – – – – – – – – – 8 5Jann Skinner 10 10 6 6 5 5 5 5 – – – – 4 4 6 6 7 5Rolf Tolle 10 10 6 6 5 5 5 5 – – – – 4 4 6 6 – –Michael Wilkins 10 10 6 6 5 5 5 5 – – 6 6 4 4 – – 8 7
H Number of meetings held while a Board or Committee member.A Number of meetings attended while a Board or Committee member.1 Includes meetings in the UK and the US.2 Ad hoc committees of the Board were convened during the year in relation to the financial results and other reporting matters.3 Patrick Regan attended Audit, Investment, Operations & Technology, People & Remuneration and Risk & Capital Committee meetings
by invitation, not being members of these committees.
58
Further meetings occurred during the year, including meetings of the Chairman and Group Chief Executive Officer and meetings of the directors with management. From time to time, directors attend meetings of committees of which they are not currently members.
Directorships of listed companies held by the members of the BoardFrom 1 January 2016 to 25 February 2019, the directors also served as directors of the following listed entities:
POSITION DATE APPOINTED DATE CEASED
John M GreenWorleyParsons Limited Director 11 October 2002 25 October 2016Challenger Limited Director 6 December 2017 –Michael WilkinsAMP Limited Director 12 September 2016 –Medibank Private Limited Director 25 May 2017 –Jann SkinnerTelix Pharmaceuticals Limited Director 19 June 2018 –
Qualifications and experience of directorsThe qualifications and experience of each director are set out on pages 44 to 45 of this Annual Report.
Qualifications and experience of company secretariesCarolyn Scobie, BA, LLB, MA, AGIA and GAICD Carolyn joined QBE in January 2016 as Group General Counsel and Group Company Secretary. Prior to joining QBE, Carolyn was Group General Counsel at global industrial property group, Goodman, for 17 years, where she ran a multi-disciplinary legal team working across 16 countries. Carolyn has extensive experience in corporate law, compliance, regulatory matters, litigation and managing the complexity of multiple jurisdictions.
Peter Smiles, LLB, MBA, FGIA, FCIS and GAICD
Peter is Deputy Company Secretary of QBE Insurance Group Limited and a company secretary of various QBE subsidiaries in Australia. He has 27 years of insurance experience, which includes 21 years as a corporate lawyer. Prior to commencing employment with QBE in 2002, Peter worked for the NRMA Insurance Group in various corporate roles. In addition to his current company secretarial duties, he acts as a corporate lawyer advising QBE Group head office departments.
Directors’ interests and benefits
Ordinary share capitalDirectors’ relevant interests in the ordinary share capital of the company at the date of this report are as follows:
DIRECTORNUMBER OF
SHARES HELD
Marty Becker 136,985Fred Eppinger –Stephen Fitzgerald 48,478John M Green 37,258Kathryn Lisson 23,297Sir Brian Pomeroy 22,297Patrick Regan 823,138Jann Skinner 50,000Rolf Tolle 39,759Michael Wilkins 25,107
Options and conditional rightsAt the date of this report, Patrick Regan had 446,654 (2017 581,339) conditional rights to ordinary shares of the company. No executives hold options at the date of this report. Details of the schemes under which options and rights are granted are provided in the Remuneration Report and in note 8.4 to the financial statements.
The names of all persons who currently hold options granted under the Employee Share and Option Plan (the Plan) and conditional rights to ordinary shares of the company are entered in the registers kept by the company pursuant to section 168 of the Corporations Act 2001.
Environmental regulationWhile the Group is not currently required to report under any significant environmental regulations under either Commonwealth, State or Territory legislation, details of QBE's climate change action plan are provided on pages 36 to 41 and operational greenhouse gas emissions and other environmental data is disclosed in the 2018 Sustainability Report.
Oth
er in
form
ation
6
Fin
ancial
Rep
ort
5
Perfo
rman
ce o
verv
iew
1
Bu
siness
review
2
Go
vern
ance
3
Directo
rs' R
epo
rt
4
QB
E In
suran
ce Gro
up
A
nn
ual R
epo
rt 2018
59D
irectors'
Rep
ort
4
This Remuneration Report sets out QBE’s remuneration framework and provides detail of remuneration outcomes for key management personnel (KMP) for 2018 and how this aligns with QBE’s performance.
Accounting standards define KMP as those executives and non-executive directors with the authority and responsibility for planning, directing and controlling the activities of the Group, either directly or indirectly.
The 2018 Remuneration Report has been prepared and audited in accordance with the disclosure requirements of the Corporations Act 2001.
Letter to our shareholders 61
2019 changes to executive remuneration 62
2018 remuneration at a glance 64
1. GROUP CHIEF EXECUTIVE OFFICER AND KMP PERFORMANCE SNAPSHOTS 66
2. REMUNERATION GOVERNANCE 71
3. 2018 EXECUTIVE REMUNERATION IN DETAIL 73
3.1 Fixed remuneration 73
3.2 Executive Incentive Plan 74
3.3 Employment agreements 75
4. EXECUTIVE REMUNERATION TABLES 76
4.1 Statutory remuneration disclosures 76
4.2 Conditional rights movements 77
4.3 Valuation of conditional rights outstanding at 31 December 2018 78
4.4 Executive shareholdings 79
4.5 Loans 79
4.6 Legacy equity schemes 80
5. NON-EXECUTIVE DIRECTOR REMUNERATION 81
5.1 Remuneration philosophy 81
5.2 Fee structure and components 81
5.3 Other benefits 81
5.4 Minimum shareholding requirement 81
5.5 Non-executive director shareholdings 82
5.6 Remuneration details for non-executive directors 82
Remuneration Report
60
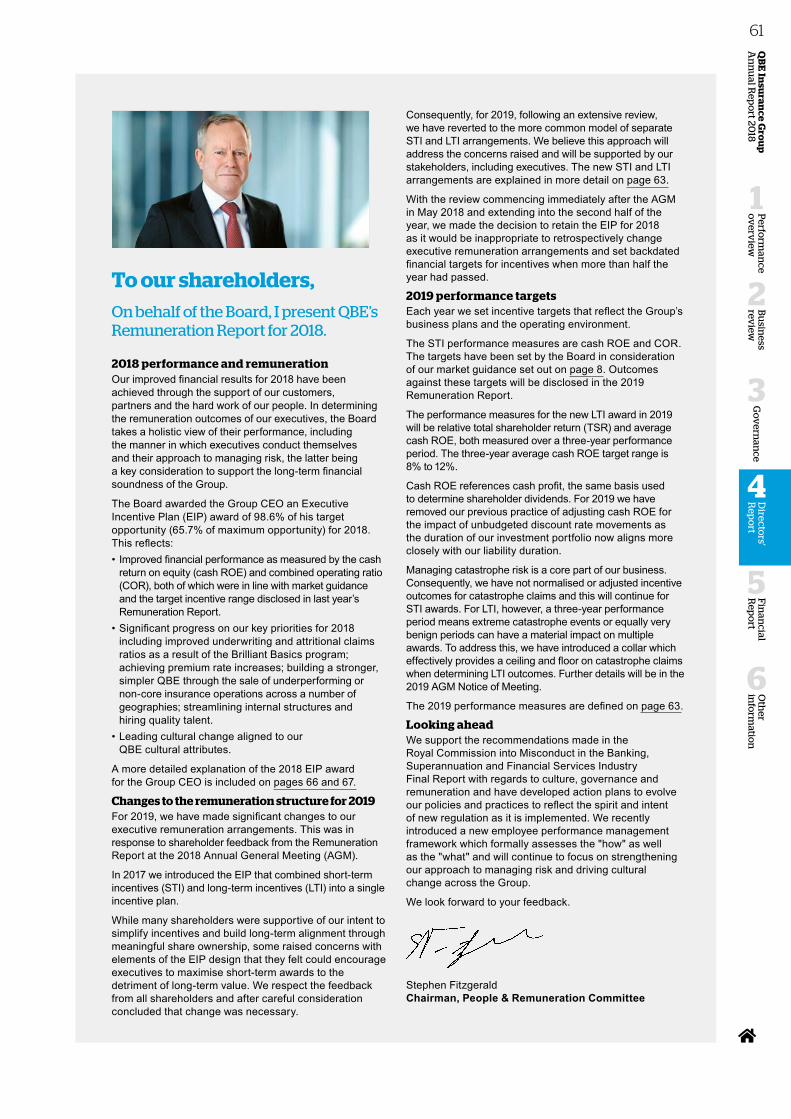
To our shareholders,On behalf of the Board, I present QBE’s Remuneration Report for 2018.
2018 performance and remunerationOur improved financial results for 2018 have been achieved through the support of our customers, partners and the hard work of our people. In determining the remuneration outcomes of our executives, the Board takes a holistic view of their performance, including the manner in which executives conduct themselves and their approach to managing risk, the latter being a key consideration to support the long-term financial soundness of the Group.
The Board awarded the Group CEO an Executive Incentive Plan (EIP) award of 98.6% of his target opportunity (65.7% of maximum opportunity) for 2018. This reflects:• Improved financial performance as measured by the cash
return on equity (cash ROE) and combined operating ratio (COR), both of which were in line with market guidance and the target incentive range disclosed in last year’s Remuneration Report.
• Significant progress on our key priorities for 2018 including improved underwriting and attritional claims ratios as a result of the Brilliant Basics program; achieving premium rate increases; building a stronger, simpler QBE through the sale of underperforming or non-core insurance operations across a number of geographies; streamlining internal structures and hiring quality talent.
• Leading cultural change aligned to our QBE cultural attributes.
A more detailed explanation of the 2018 EIP award for the Group CEO is included on pages 66 and 67.
Changes to the remuneration structure for 2019 For 2019, we have made significant changes to our executive remuneration arrangements. This was in response to shareholder feedback from the Remuneration Report at the 2018 Annual General Meeting (AGM).
In 2017 we introduced the EIP that combined short-term incentives (STI) and long-term incentives (LTI) into a single incentive plan.
While many shareholders were supportive of our intent to simplify incentives and build long-term alignment through meaningful share ownership, some raised concerns with elements of the EIP design that they felt could encourage executives to maximise short-term awards to the detriment of long-term value. We respect the feedback from all shareholders and after careful consideration concluded that change was necessary.
Consequently, for 2019, following an extensive review, we have reverted to the more common model of separate STI and LTI arrangements. We believe this approach will address the concerns raised and will be supported by our stakeholders, including executives. The new STI and LTI arrangements are explained in more detail on page 63.
With the review commencing immediately after the AGM in May 2018 and extending into the second half of the year, we made the decision to retain the EIP for 2018 as it would be inappropriate to retrospectively change executive remuneration arrangements and set backdated financial targets for incentives when more than half the year had passed.
2019 performance targetsEach year we set incentive targets that reflect the Group’s business plans and the operating environment.
The STI performance measures are cash ROE and COR. The targets have been set by the Board in consideration of our market guidance set out on page 8. Outcomes against these targets will be disclosed in the 2019 Remuneration Report.
The performance measures for the new LTI award in 2019 will be relative total shareholder return (TSR) and average cash ROE, both measured over a three-year performance period. The three-year average cash ROE target range is 8% to 12%.
Cash ROE references cash profit, the same basis used to determine shareholder dividends. For 2019 we have removed our previous practice of adjusting cash ROE for the impact of unbudgeted discount rate movements as the duration of our investment portfolio now aligns more closely with our liability duration.
Managing catastrophe risk is a core part of our business. Consequently, we have not normalised or adjusted incentive outcomes for catastrophe claims and this will continue for STI awards. For LTI, however, a three-year performance period means extreme catastrophe events or equally very benign periods can have a material impact on multiple awards. To address this, we have introduced a collar which effectively provides a ceiling and floor on catastrophe claims when determining LTI outcomes. Further details will be in the 2019 AGM Notice of Meeting.
The 2019 performance measures are defined on page 63.
Looking aheadWe support the recommendations made in the Royal Commission into Misconduct in the Banking, Superannuation and Financial Services Industry Final Report with regards to culture, governance and remuneration and have developed action plans to evolve our policies and practices to reflect the spirit and intent of new regulation as it is implemented. We recently introduced a new employee performance management framework which formally assesses the "how" as well as the "what" and will continue to focus on strengthening our approach to managing risk and driving cultural change across the Group.
We look forward to your feedback.
Stephen Fitzgerald Chairman, People & Remuneration Committee
Oth
er in
form
ation
6
Fin
ancial
Rep
ort
5
Perfo
rman
ce o
verv
iew
1
Bu
siness
review
2
Go
vern
ance
3
QB
E In
suran
ce Gro
up
A
nn
ual R
epo
rt 2018
61D
irectors'
Rep
ort
4
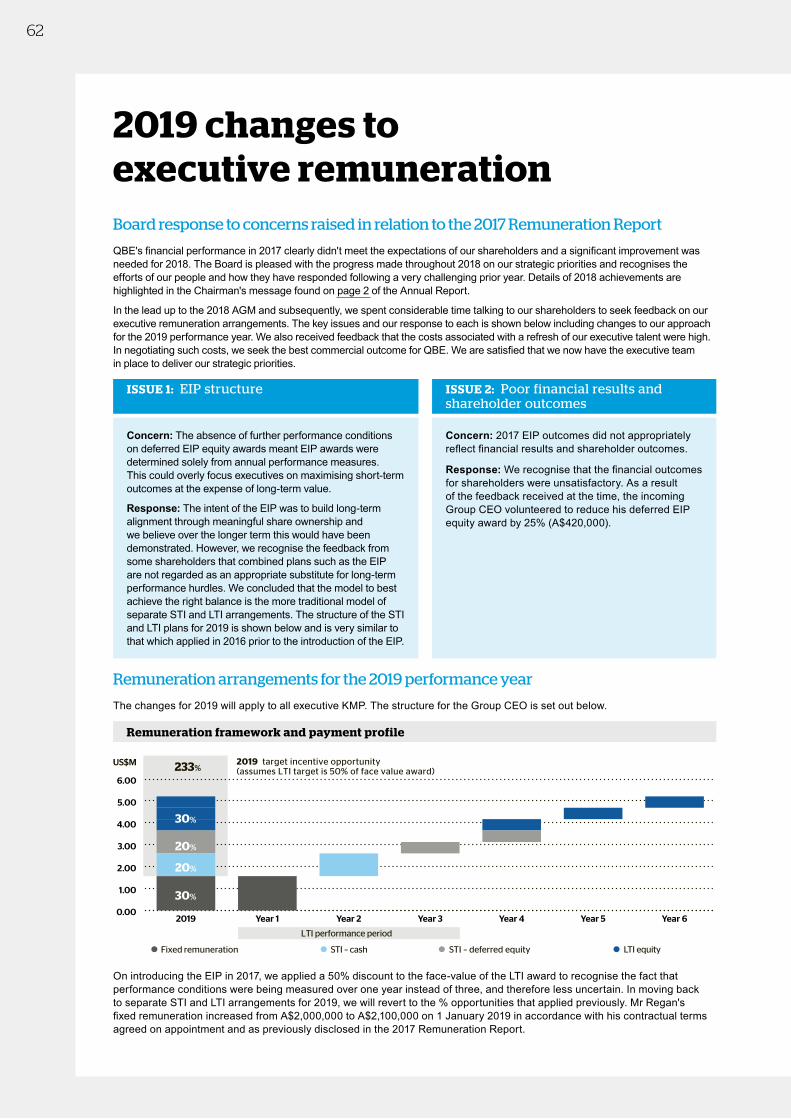
2019 changes toexecutive remunerationBoard response to concerns raised in relation to the 2017 Remuneration Report
QBE's financial performance in 2017 clearly didn't meet the expectations of our shareholders and a significant improvement was needed for 2018. The Board is pleased with the progress made throughout 2018 on our strategic priorities and recognises the efforts of our people and how they have responded following a very challenging prior year. Details of 2018 achievements are highlighted in the Chairman's message found on page 2 of the Annual Report.
In the lead up to the 2018 AGM and subsequently, we spent considerable time talking to our shareholders to seek feedback on our executive remuneration arrangements. The key issues and our response to each is shown below including changes to our approach for the 2019 performance year. We also received feedback that the costs associated with a refresh of our executive talent were high. In negotiating such costs, we seek the best commercial outcome for QBE. We are satisfied that we now have the executive team in place to deliver our strategic priorities.
ISSUE 1: EIP structure ISSUE 2: Poor financial results and shareholder outcomes
Concern: The absence of further performance conditions on deferred EIP equity awards meant EIP awards were determined solely from annual performance measures. This could overly focus executives on maximising short-term outcomes at the expense of long-term value.
Response: The intent of the EIP was to build long-term alignment through meaningful share ownership and we believe over the longer term this would have been demonstrated. However, we recognise the feedback from some shareholders that combined plans such as the EIP are not regarded as an appropriate substitute for long-term performance hurdles. We concluded that the model to best achieve the right balance is the more traditional model of separate STI and LTI arrangements. The structure of the STI and LTI plans for 2019 is shown below and is very similar to that which applied in 2016 prior to the introduction of the EIP.
Concern: 2017 EIP outcomes did not appropriately reflect financial results and shareholder outcomes.
Response: We recognise that the financial outcomes for shareholders were unsatisfactory. As a result of the feedback received at the time, the incoming Group CEO volunteered to reduce his deferred EIP equity award by 25% (A$420,000).
Remuneration arrangements for the 2019 performance year
The changes for 2019 will apply to all executive KMP. The structure for the Group CEO is set out below.
Remuneration framework and payment profile
US$M 233%2019 target incentive opportunity(assumes LTI target is 50% of face value award)
STI – cash LTI equityFixed remuneration
LTI performance period
STI – deferred equity
0.00
1.00
2.00
3.00
4.00
5.00
6.00
Year 6Year 5Year 4Year 3Year 2Year 12019
30%
30%
20%
20%
On introducing the EIP in 2017, we applied a 50% discount to the face-value of the LTI award to recognise the fact that performance conditions were being measured over one year instead of three, and therefore less uncertain. In moving back to separate STI and LTI arrangements for 2019, we will revert to the % opportunities that applied previously. Mr Regan's fixed remuneration increased from A$2,000,000 to A$2,100,000 on 1 January 2019 in accordance with his contractual terms agreed on appointment and as previously disclosed in the 2017 Remuneration Report.
62
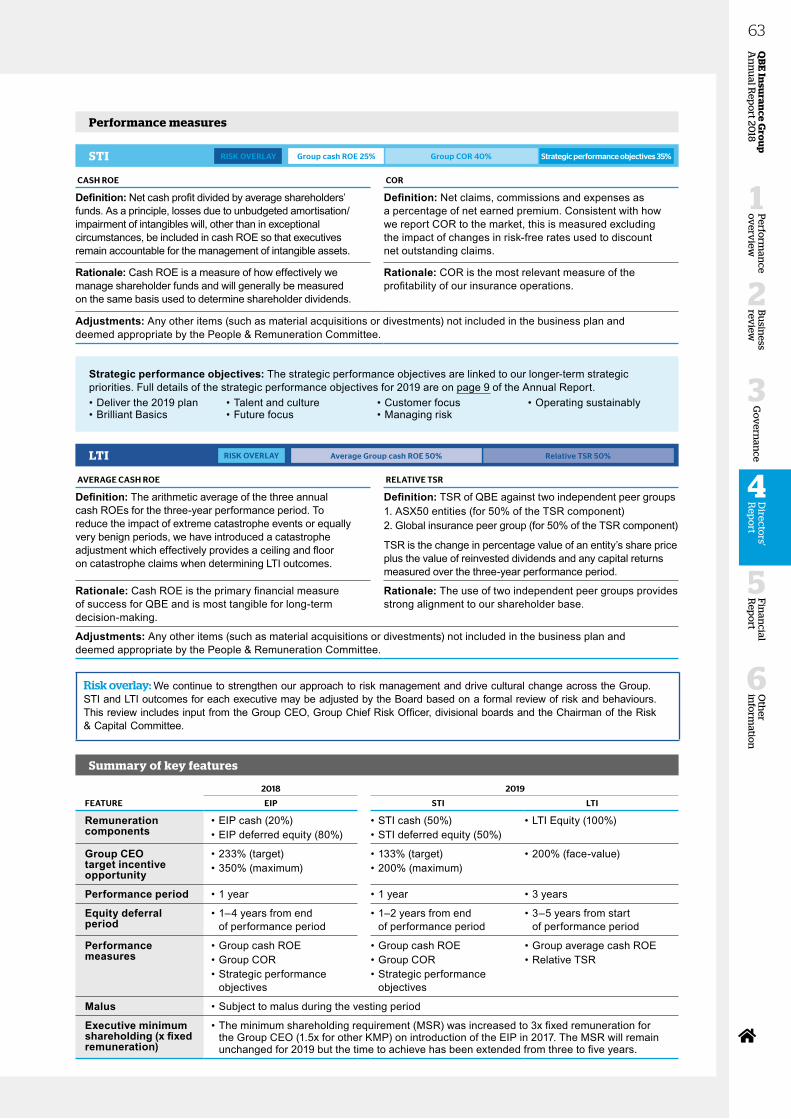
Performance measures
STI Group cash ROE 25%RISK OVERLAY Group COR 40% Strategic performance objectives 35%
CASH ROE COR
Definition: Net cash profit divided by average shareholders’ funds. As a principle, losses due to unbudgeted amortisation/impairment of intangibles will, other than in exceptional circumstances, be included in cash ROE so that executives remain accountable for the management of intangible assets.
Definition: Net claims, commissions and expenses as a percentage of net earned premium. Consistent with how we report COR to the market, this is measured excluding the impact of changes in risk-free rates used to discount net outstanding claims.
Rationale: Cash ROE is a measure of how effectively we manage shareholder funds and will generally be measured on the same basis used to determine shareholder dividends.
Rationale: COR is the most relevant measure of the profitability of our insurance operations.
Adjustments: Any other items (such as material acquisitions or divestments) not included in the business plan and deemed appropriate by the People & Remuneration Committee.
Strategic performance objectives: The strategic performance objectives are linked to our longer-term strategic priorities. Full details of the strategic performance objectives for 2019 are on page 9 of the Annual Report.• Deliver the 2019 plan• Brilliant Basics
• Talent and culture• Future focus
• Customer focus• Managing risk
• Operating sustainably
LTI Average Group cash ROE 50% Relative TSR 50%RISK OVERLAY
AVERAGE CASH ROE RELATIVE TSR
Definition: The arithmetic average of the three annual cash ROEs for the three-year performance period. To reduce the impact of extreme catastrophe events or equally very benign periods, we have introduced a catastrophe adjustment which effectively provides a ceiling and floor on catastrophe claims when determining LTI outcomes.
Definition: TSR of QBE against two independent peer groups1. ASX50 entities (for 50% of the TSR component)2. Global insurance peer group (for 50% of the TSR component)
TSR is the change in percentage value of an entity’s share price plus the value of reinvested dividends and any capital returns measured over the three-year performance period.
Rationale: Cash ROE is the primary financial measure of success for QBE and is most tangible for long-term decision-making.
Rationale: The use of two independent peer groups provides strong alignment to our shareholder base.
Adjustments: Any other items (such as material acquisitions or divestments) not included in the business plan and deemed appropriate by the People & Remuneration Committee.
Risk overlay: We continue to strengthen our approach to risk management and drive cultural change across the Group. STI and LTI outcomes for each executive may be adjusted by the Board based on a formal review of risk and behaviours. This review includes input from the Group CEO, Group Chief Risk Officer, divisional boards and the Chairman of the Risk & Capital Committee.
Summary of key features
2018 2019
FEATURE EIP STI LTI
Remuneration components
• EIP cash (20%)• EIP deferred equity (80%)
• STI cash (50%)• STI deferred equity (50%)
• LTI Equity (100%)
Group CEO target incentive opportunity
• 233% (target)• 350% (maximum)
• 133% (target)• 200% (maximum)
• 200% (face-value)
Performance period • 1 year • 1 year • 3 years
Equity deferral period
• 1–4 years from end of performance period
• 1–2 years from end of performance period
• 3–5 years from start of performance period
Performance measures
• Group cash ROE• Group COR• Strategic performance
objectives
• Group cash ROE• Group COR• Strategic performance
objectives
• Group average cash ROE• Relative TSR
Malus • Subject to malus during the vesting period
Executive minimum shareholding (x fixed remuneration)
• The minimum shareholding requirement (MSR) was increased to 3x fixed remuneration for the Group CEO (1.5x for other KMP) on introduction of the EIP in 2017. The MSR will remain unchanged for 2019 but the time to achieve has been extended from three to five years.
Oth
er in
form
ation
6
Fin
ancial
Rep
ort
5
Perfo
rman
ce o
verv
iew
1
Bu
siness
review
2
Go
vern
ance
3
QB
E In
suran
ce Gro
up
A
nn
ual R
epo
rt 2018
63D
irectors'
Rep
ort
4
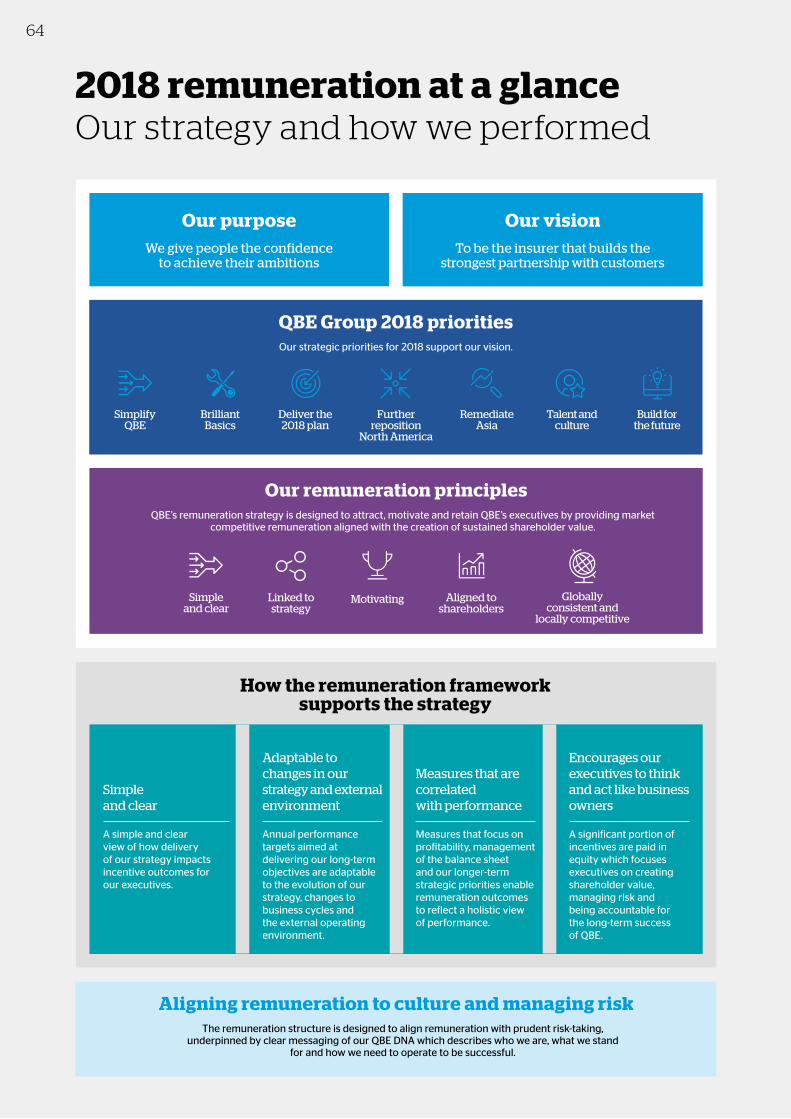
2018 remuneration at a glanceOur strategy and how we performed
How the remuneration framework supports the strategy
Simple and clear
A simple and clear view of how delivery of our strategy impacts incentive outcomes for our executives.
Adaptable to changes in our strategy and external environment
Annual performance targets aimed at delivering our long-term objectives are adaptable to the evolution of our strategy, changes to business cycles and the external operating environment.
Measures that are correlated with performance
Measures that focus on profitability, management of the balance sheet and our longer-term strategic priorities enable remuneration outcomes to reflect a holistic view of performance.
Encourages our executives to think and act like business owners
A significant portion of incentives are paid in equity which focuses executives on creating shareholder value, managing risk and being accountable for the long-term success of QBE.
Our purposeWe give people the confidence
to achieve their ambitions
Our visionTo be the insurer that builds the
strongest partnership with customers
Our remuneration principlesQBE’s remuneration strategy is designed to attract, motivate and retain QBE’s executives by providing market
competitive remuneration aligned with the creation of sustained shareholder value.
Simple and clear
Linked to strategy
Aligned to shareholders
Motivating Globally consistent and
locally competitive
QBE Group 2018 prioritiesOur strategic priorities for 2018 support our vision.
Build for the future
Remediate Asia
Talent and culture
Further reposition
North America
Deliver the 2018 plan
Brilliant Basics
Simplify QBE
Aligning remuneration to culture and managing riskThe remuneration structure is designed to align remuneration with prudent risk-taking,
underpinned by clear messaging of our QBE DNA which describes who we are, what we stand for and how we need to operate to be successful.
64
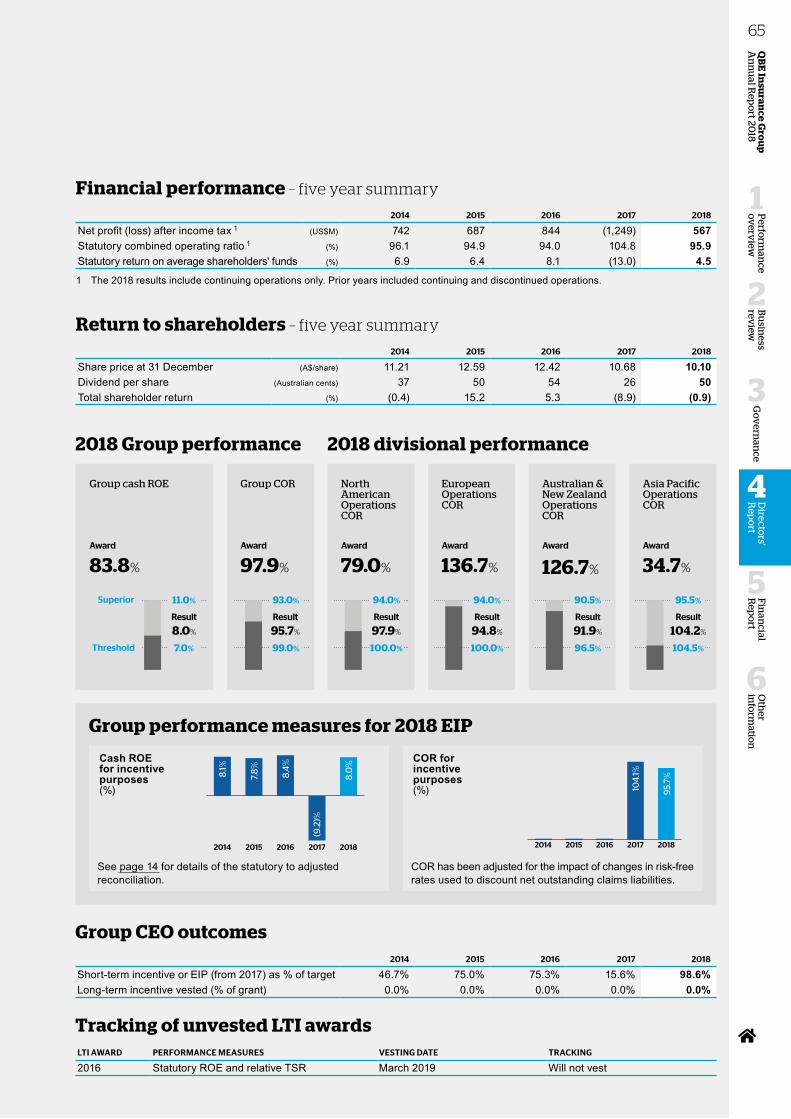
Group performance measures for 2018 EIP
Cash ROE for incentive purposes (%)
20182017201620152014
8.4
%
7.8
%
8.1%
(9.2
)%
8.0
%
See page 14 for details of the statutory to adjusted reconciliation.
COR for incentive purposes (%)
20182017201620152014
104
.1%
95.
7%
COR has been adjusted for the impact of changes in risk-free rates used to discount net outstanding claims liabilities.
Group CEO outcomes2014 2015 2016 2017 2018
Short-term incentive or EIP (from 2017) as % of target 46.7% 75.0% 75.3% 15.6% 98.6%Long-term incentive vested (% of grant) 0.0% 0.0% 0.0% 0.0% 0.0%
Tracking of unvested LTI awardsLTI AWARD PERFORMANCE MEASURES VESTING DATE TRACKING
2016 Statutory ROE and relative TSR March 2019 Will not vest
Financial performance – five year summary
2014 2015 2016 2017 2018
Net profit (loss) after income tax 1 (US$M) 742 687 844 (1,249) 567Statutory combined operating ratio 1 (%) 96.1 94.9 94.0 104.8 95.9Statutory return on average shareholders' funds (%) 6.9 6.4 8.1 (13.0) 4.5
1 The 2018 results include continuing operations only. Prior years included continuing and discontinued operations.
Return to shareholders – five year summary
2014 2015 2016 2017 2018
Share price at 31 December (A$/share) 11.21 12.59 12.42 10.68 10.10Dividend per share (Australian cents) 37 50 54 26 50Total shareholder return (%) (0.4) 15.2 5.3 (8.9) (0.9)
2018 Group performance 2018 divisional performance
Group cash ROE
Award
83.8%
Group COR
Award
97.9%
North American Operations COR
Award
79.0%
European Operations COR
Award
136.7%
Australian & New Zealand Operations COR
Award
126.7%
Asia Pacific Operations COR
Award
34.7%
95.5%
104.5%
Result
104.2%
90.5%
96.5%
Result
91.9%
94.0%
100.0%
Result
94.8%
94.0%
100.0%
Result
97.9%
93.0%
99.0%
Result
95.7%
Superior
Threshold 7.0%
Result
8.0%
11.0%
Oth
er in
form
ation
6
Fin
ancial
Rep
ort
5
Perfo
rman
ce o
verv
iew
1
Bu
siness
review
2
Go
vern
ance
3
QB
E In
suran
ce Gro
up
A
nn
ual R
epo
rt 2018
65D
irectors'
Rep
ort
4
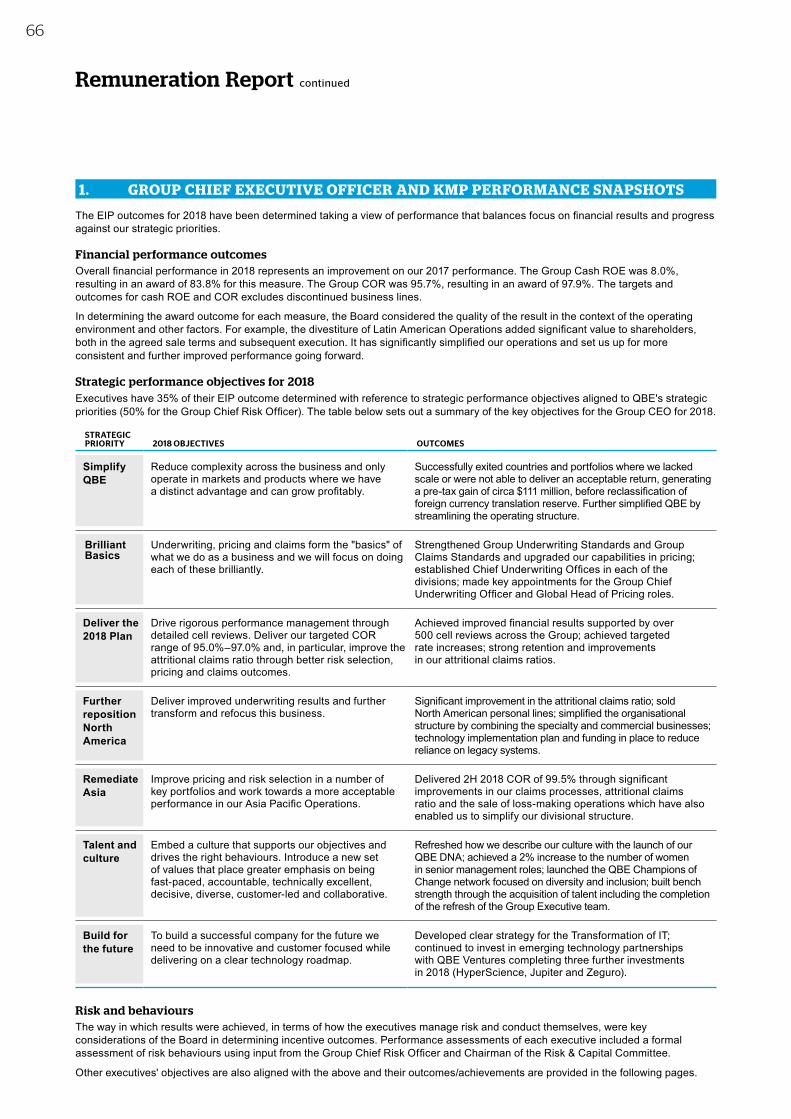
Remuneration Report continued
1. GROUP CHIEF EXECUTIVE OFFICER AND KMP PERFORMANCE SNAPSHOTS
The EIP outcomes for 2018 have been determined taking a view of performance that balances focus on financial results and progress against our strategic priorities.
Financial performance outcomes Overall financial performance in 2018 represents an improvement on our 2017 performance. The Group Cash ROE was 8.0%, resulting in an award of 83.8% for this measure. The Group COR was 95.7%, resulting in an award of 97.9%. The targets and outcomes for cash ROE and COR excludes discontinued business lines.
In determining the award outcome for each measure, the Board considered the quality of the result in the context of the operating environment and other factors. For example, the divestiture of Latin American Operations added significant value to shareholders, both in the agreed sale terms and subsequent execution. It has significantly simplified our operations and set us up for more consistent and further improved performance going forward.
Strategic performance objectives for 2018 Executives have 35% of their EIP outcome determined with reference to strategic performance objectives aligned to QBE's strategic priorities (50% for the Group Chief Risk Officer). The table below sets out a summary of the key objectives for the Group CEO for 2018.
STRATEGIC PRIORITY 2018 OBJECTIVES OUTCOMES
Simplify QBE
Reduce complexity across the business and only operate in markets and products where we have a distinct advantage and can grow profitably.
Successfully exited countries and portfolios where we lacked scale or were not able to deliver an acceptable return, generating a pre-tax gain of circa $111 million, before reclassification of foreign currency translation reserve. Further simplified QBE by streamlining the operating structure.
Brilliant Basics
Underwriting, pricing and claims form the "basics" of what we do as a business and we will focus on doing each of these brilliantly.
Strengthened Group Underwriting Standards and Group Claims Standards and upgraded our capabilities in pricing; established Chief Underwriting Offices in each of the divisions; made key appointments for the Group Chief Underwriting Officer and Global Head of Pricing roles.
Deliver the 2018 Plan
Drive rigorous performance management through detailed cell reviews. Deliver our targeted COR range of 95.0%–97.0% and, in particular, improve the attritional claims ratio through better risk selection, pricing and claims outcomes.
Achieved improved financial results supported by over 500 cell reviews across the Group; achieved targeted rate increases; strong retention and improvements in our attritional claims ratios.
Further reposition North America
Deliver improved underwriting results and further transform and refocus this business.
Significant improvement in the attritional claims ratio; sold North American personal lines; simplified the organisational structure by combining the specialty and commercial businesses; technology implementation plan and funding in place to reduce reliance on legacy systems.
Remediate Asia
Improve pricing and risk selection in a number of key portfolios and work towards a more acceptable performance in our Asia Pacific Operations.
Delivered 2H 2018 COR of 99.5% through significant improvements in our claims processes, attritional claims ratio and the sale of loss-making operations which have also enabled us to simplify our divisional structure.
Talent and culture
Embed a culture that supports our objectives and drives the right behaviours. Introduce a new set of values that place greater emphasis on being fast-paced, accountable, technically excellent, decisive, diverse, customer-led and collaborative.
Refreshed how we describe our culture with the launch of our QBE DNA; achieved a 2% increase to the number of women in senior management roles; launched the QBE Champions of Change network focused on diversity and inclusion; built bench strength through the acquisition of talent including the completion of the refresh of the Group Executive team.[x
Build for the future
To build a successful company for the future we need to be innovative and customer focused while delivering on a clear technology roadmap.
Developed clear strategy for the Transformation of IT; continued to invest in emerging technology partnerships with QBE Ventures completing three further investments in 2018 (HyperScience, Jupiter and Zeguro).
Risk and behavioursThe way in which results were achieved, in terms of how the executives manage risk and conduct themselves, were key considerations of the Board in determining incentive outcomes. Performance assessments of each executive included a formal assessment of risk behaviours using input from the Group Chief Risk Officer and Chairman of the Risk & Capital Committee.
Other executives' objectives are also aligned with the above and their outcomes/achievements are provided in the following pages.
66
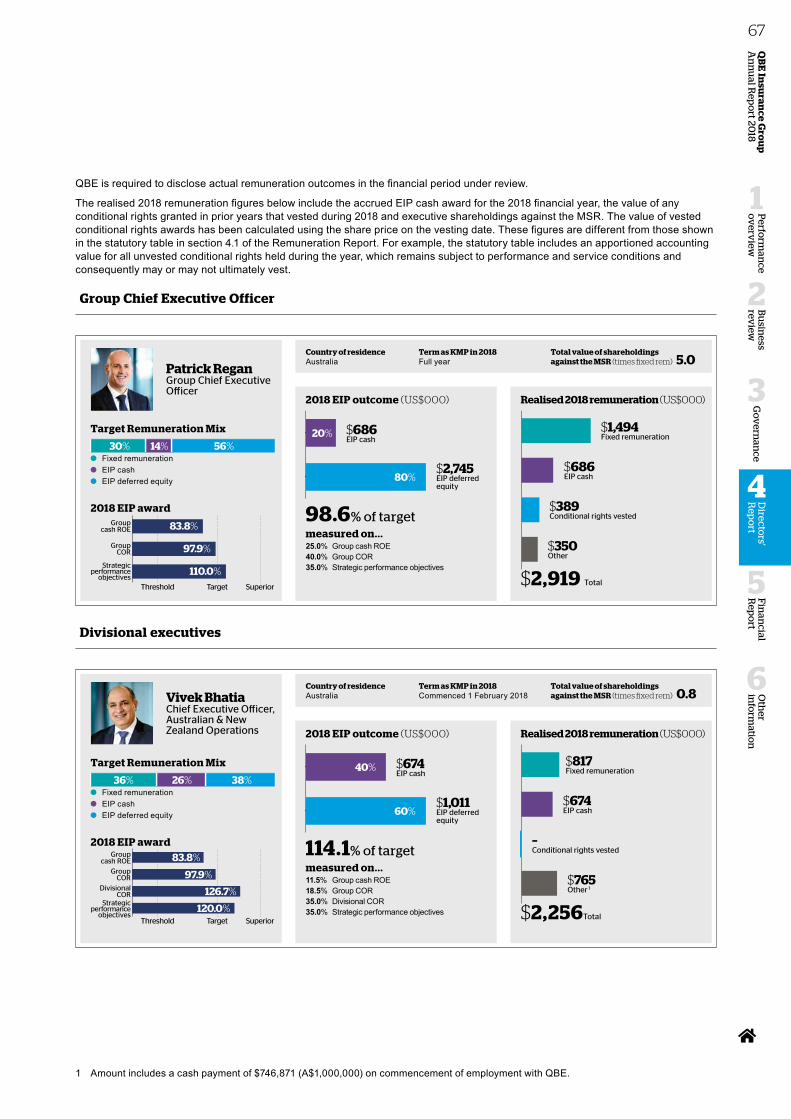
QBE is required to disclose actual remuneration outcomes in the financial period under review.
The realised 2018 remuneration figures below include the accrued EIP cash award for the 2018 financial year, the value of any conditional rights granted in prior years that vested during 2018 and executive shareholdings against the MSR. The value of vested conditional rights awards has been calculated using the share price on the vesting date. These figures are different from those shown in the statutory table in section 4.1 of the Remuneration Report. For example, the statutory table includes an apportioned accounting value for all unvested conditional rights held during the year, which remains subject to performance and service conditions and consequently may or may not ultimately vest.
Group Chief Executive Officer
Patrick Regan Group Chief Executive Officer
Target Remuneration Mix
30% 14% 56% Fixed remuneration EIP cash EIP deferred equity
2018 EIP award
Threshold Target Superior
Groupcash ROE
GroupCOR
Strategicperformance
objectives
97.9%
83.8%
110.0%
Country of residenceAustralia
Term as KMP in 2018Full year
Total value of shareholdings against the MSR (times fixed rem) 5.0
2018 EIP outcome (US$000)
20%
80%
$686EIP cash
$2,745EIP deferredequity
98.6% of targetmeasured on...25.0% Group cash ROE40.0% Group COR35.0% Strategic performance objectives
Realised 2018 remuneration (US$000)
$1,494Fixed remuneration
$686EIP cash
$389Conditional rights vested
$350Other
$2,919 Total
Divisional executives
Vivek Bhatia Chief Executive Officer, Australian & New Zealand Operations
Target Remuneration Mix
36% 26% 38% Fixed remuneration EIP cash EIP deferred equity
2018 EIP award
Threshold Target Superior
Groupcash ROE
DivisionalCOR
GroupCOR
Strategicperformance
objectives
97.9%
83.8%
120.0%
126.7%
Country of residenceAustralia
Term as KMP in 2018Commenced 1 February 2018
Total value of shareholdings against the MSR (times fixed rem) 0.8
2018 EIP outcome (US$000)
60%
$674EIP cash
$1,011EIP deferredequity
40%
114.1% of targetmeasured on...11.5% Group cash ROE18.5% Group COR35.0% Divisional COR35.0% Strategic performance objectives
Realised 2018 remuneration (US$000)
$817Fixed remuneration
$674EIP cash
–Conditional rights vested
$765Other 1
$2,256Total
1 Amount includes a cash payment of $746,871 (A$1,000,000) on commencement of employment with QBE.
Oth
er in
form
ation
6
Fin
ancial
Rep
ort
5
Perfo
rman
ce o
verv
iew
1
Bu
siness
review
2
Go
vern
ance
3
QB
E In
suran
ce Gro
up
A
nn
ual R
epo
rt 2018
67D
irectors'
Rep
ort
4
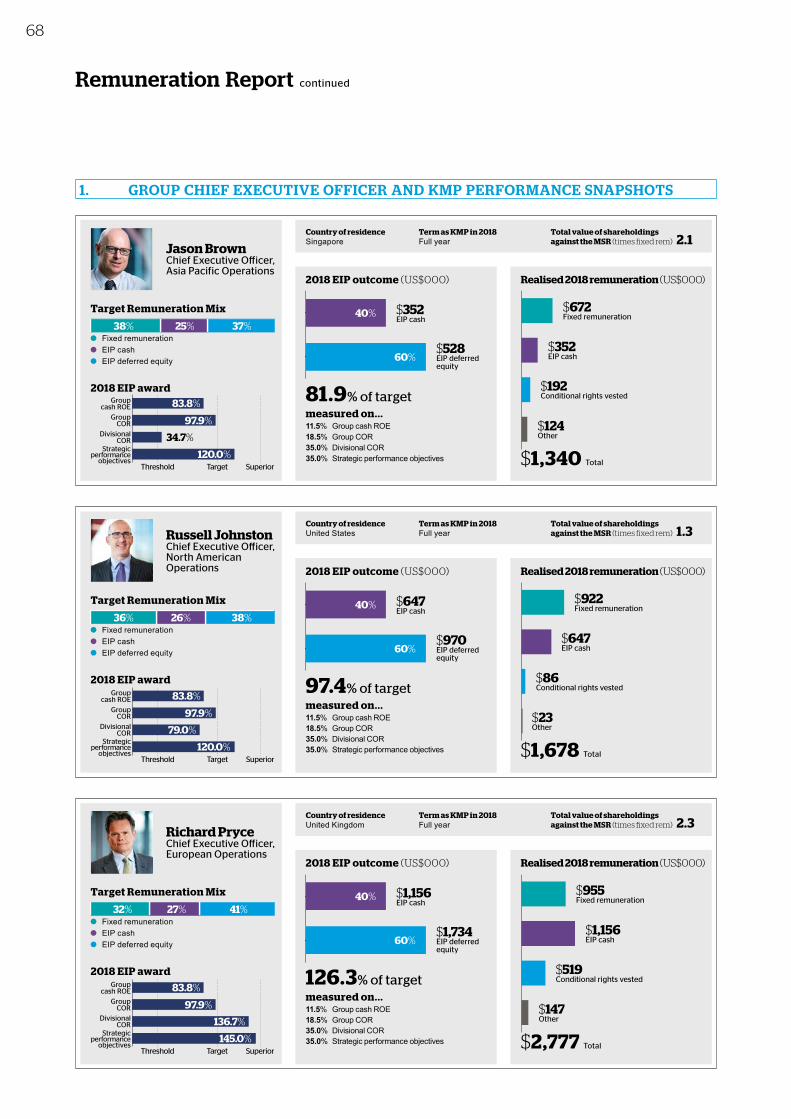
Remuneration Report continued
Jason Brown Chief Executive Officer, Asia Pacific Operations
Target Remuneration Mix
38% 25% 37% Fixed remuneration EIP cash EIP deferred equity
2018 EIP award
Threshold Target Superior
Groupcash ROE
DivisionalCOR
GroupCOR
Strategicperformance
objectives
97.9%
83.8%
120.0%
34.7%
Country of residenceSingapore
Term as KMP in 2018Full year
Total value of shareholdings against the MSR (times fixed rem) 2.1
2018 EIP outcome (US$000)
60%
$352EIP cash
$528EIP deferredequity
40%
81.9% of targetmeasured on...11.5% Group cash ROE18.5% Group COR35.0% Divisional COR35.0% Strategic performance objectives
Realised 2018 remuneration (US$000)
$672Fixed remuneration
$352EIP cash
$192Conditional rights vested
$124Other
$1,340 Total
Russell Johnston Chief Executive Officer, North American Operations
Target Remuneration Mix
36% 26% 38% Fixed remuneration EIP cash EIP deferred equity
2018 EIP award
Threshold Target Superior
Groupcash ROE
DivisionalCOR
GroupCOR
Strategicperformance
objectives
97.9%
83.8%
120.0%
79.0%
Country of residenceUnited States
Term as KMP in 2018Full year
Total value of shareholdings against the MSR (times fixed rem) 1.3
2018 EIP outcome (US$000)
60%
$647EIP cash
$970EIP deferredequity
40%
97.4% of targetmeasured on...11.5% Group cash ROE18.5% Group COR35.0% Divisional COR35.0% Strategic performance objectives
Realised 2018 remuneration (US$000)
$922Fixed remuneration
$647EIP cash
$86Conditional rights vested
$23Other
$1,678 Total
Richard Pryce Chief Executive Officer, European Operations
Target Remuneration Mix
32% 27% 41% Fixed remuneration EIP cash EIP deferred equity
2018 EIP award
Threshold Target Superior
Groupcash ROE
DivisionalCOR
GroupCOR
Strategicperformance
objectives
97.9%
83.8%
145.0%
136.7%
Country of residenceUnited Kingdom
Term as KMP in 2018Full year
Total value of shareholdings against the MSR (times fixed rem) 2.3
2018 EIP outcome (US$000)
60%
$1,156EIP cash
$1,734EIP deferredequity
40%
126.3% of targetmeasured on...11.5% Group cash ROE18.5% Group COR35.0% Divisional COR35.0% Strategic performance objectives
Realised 2018 remuneration (US$000)
$955Fixed remuneration
$1,156EIP cash
$519Conditional rights vested
$147Other
$2,777 Total
1. GROUP CHIEF EXECUTIVE OFFICER AND KMP PERFORMANCE SNAPSHOTS
68
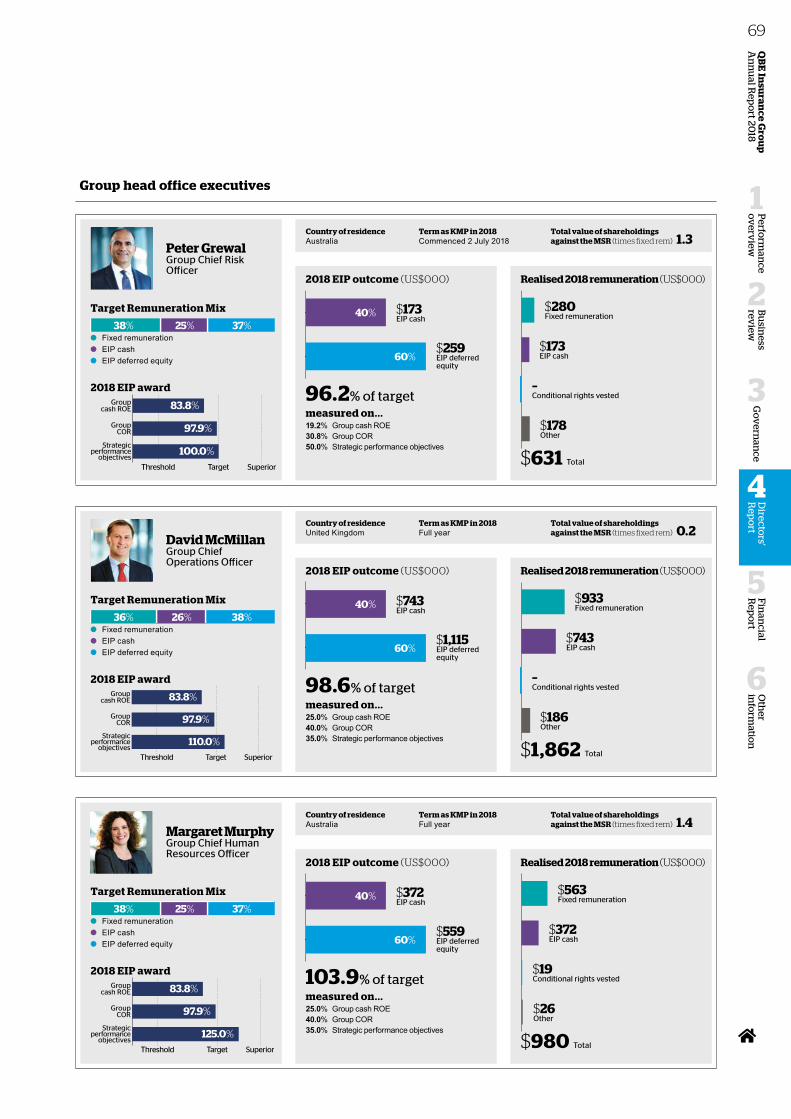
Group head office executives
Peter Grewal Group Chief Risk Officer
Target Remuneration Mix
38% 25% 37% Fixed remuneration EIP cash EIP deferred equity
2018 EIP award
Threshold Target Superior
Groupcash ROE
GroupCOR
Strategicperformance
objectives
97.9%
83.8%
100.0%
Country of residenceAustralia
Term as KMP in 2018Commenced 2 July 2018
Total value of shareholdings against the MSR (times fixed rem) 1.3
2018 EIP outcome (US$000)
60%
$173EIP cash
$259EIP deferredequity
40%
96.2% of targetmeasured on...19.2% Group cash ROE30.8% Group COR50.0% Strategic performance objectives
Realised 2018 remuneration (US$000)
$280Fixed remuneration
$173EIP cash
–Conditional rights vested
$178Other
$631 Total
David McMillan Group Chief Operations Officer
Target Remuneration Mix
36% 26% 38% Fixed remuneration EIP cash EIP deferred equity
2018 EIP award
Threshold Target Superior
Groupcash ROE
GroupCOR
Strategicperformance
objectives
97.9%
83.8%
110.0%
Country of residenceUnited Kingdom
Term as KMP in 2018Full year
Total value of shareholdings against the MSR (times fixed rem) 0.2
2018 EIP outcome (US$000)
60%
$743EIP cash
$1,115EIP deferredequity
40%
98.6% of targetmeasured on...25.0% Group cash ROE40.0% Group COR35.0% Strategic performance objectives
Realised 2018 remuneration (US$000)
$933Fixed remuneration
$743EIP cash
–Conditional rights vested
$186Other
$1,862 Total
Margaret Murphy Group Chief Human Resources Officer
Target Remuneration Mix
38% 25% 37% Fixed remuneration EIP cash EIP deferred equity
2018 EIP award
Threshold Target Superior
Groupcash ROE
GroupCOR
Strategicperformance
objectives
97.9%
83.8%
125.0%
Country of residenceAustralia
Term as KMP in 2018Full year
Total value of shareholdings against the MSR (times fixed rem) 1.4
2018 EIP outcome (US$000)
60%
$372EIP cash
$559EIP deferredequity
40%
103.9% of targetmeasured on...25.0% Group cash ROE40.0% Group COR35.0% Strategic performance objectives
Realised 2018 remuneration (US$000)
$563Fixed remuneration
$372EIP cash
$19Conditional rights vested
$26Other
$980 Total
Oth
er in
form
ation
6
Fin
ancial
Rep
ort
5
Perfo
rman
ce o
verv
iew
1
Bu
siness
review
2
Go
vern
ance
3
QB
E In
suran
ce Gro
up
A
nn
ual R
epo
rt 2018
69D
irectors'
Rep
ort
4
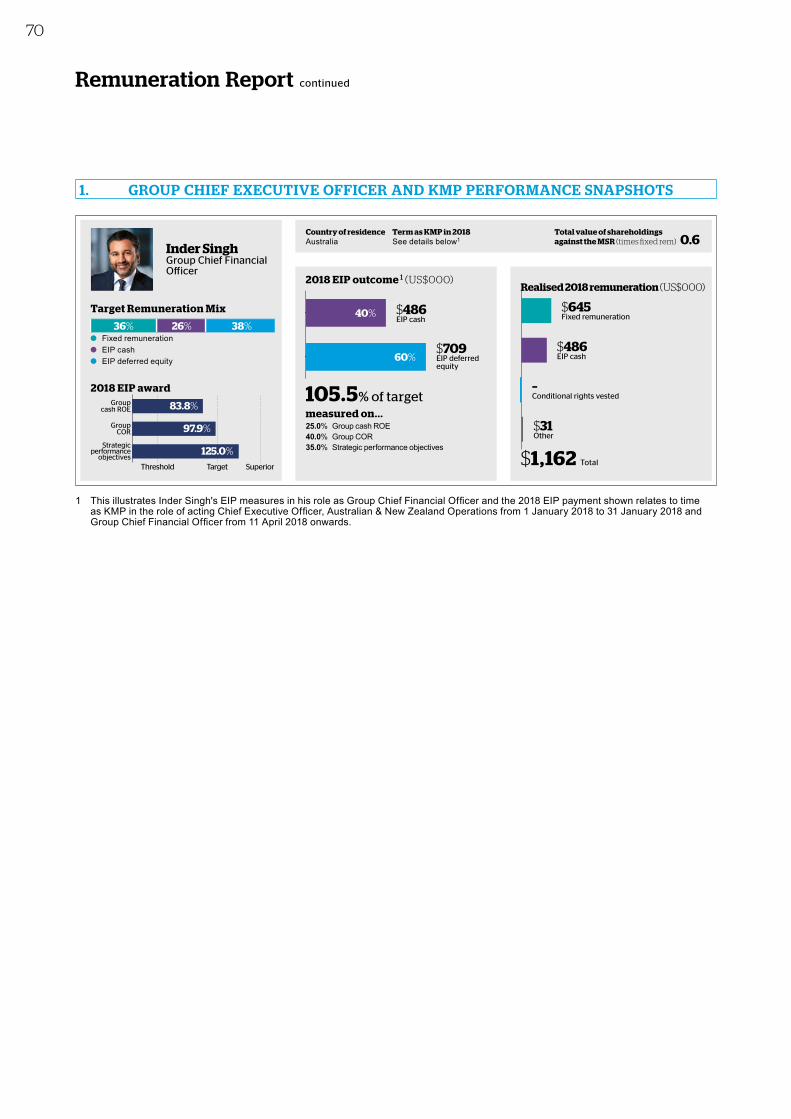
Remuneration Report continued
Inder Singh Group Chief Financial Officer
Target Remuneration Mix
36% 26% 38% Fixed remuneration EIP cash EIP deferred equity
2018 EIP award
Threshold Target Superior
Groupcash ROE
GroupCOR
Strategicperformance
objectives
97.9%
83.8%
125.0%
Country of residenceAustralia
Term as KMP in 2018See details below1
Total value of shareholdings against the MSR (times fixed rem) 0.6
2018 EIP outcome 1 (US$000)
60%
$486EIP cash
$709EIP deferredequity
40%
105.5% of targetmeasured on...25.0% Group cash ROE40.0% Group COR35.0% Strategic performance objectives
Realised 2018 remuneration (US$000)
$645Fixed remuneration
$486EIP cash
–Conditional rights vested
$31Other
$1,162 Total
1 This illustrates Inder Singh's EIP measures in his role as Group Chief Financial Officer and the 2018 EIP payment shown relates to time as KMP in the role of acting Chief Executive Officer, Australian & New Zealand Operations from 1 January 2018 to 31 January 2018 and Group Chief Financial Officer from 11 April 2018 onwards.
1. GROUP CHIEF EXECUTIVE OFFICER AND KMP PERFORMANCE SNAPSHOTS
70
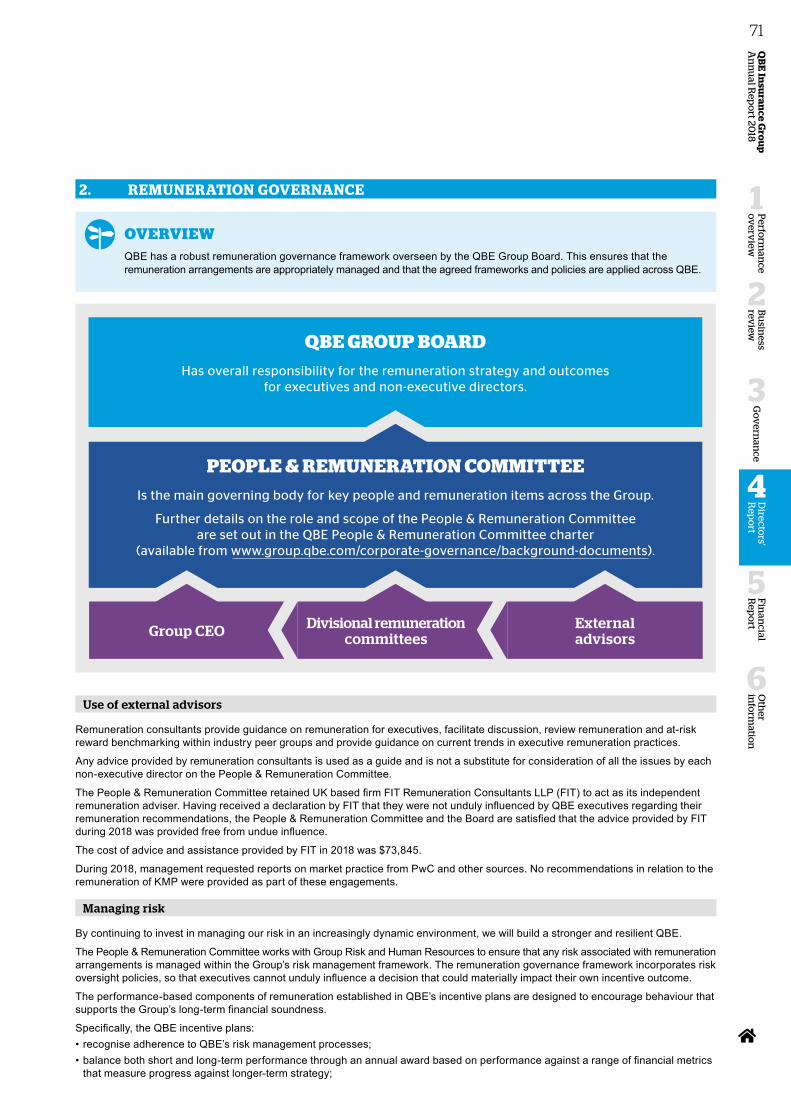
2. REMUNERATION GOVERNANCE
OVERVIEWQBE has a robust remuneration governance framework overseen by the QBE Group Board. This ensures that the remuneration arrangements are appropriately managed and that the agreed frameworks and policies are applied across QBE.
QBE GROUP BOARDHas overall responsibility for the remuneration strategy and outcomes
for executives and non-executive directors.
PEOPLE & REMUNERATION COMMITTEEIs the main governing body for key people and remuneration items across the Group.
Further details on the role and scope of the People & Remuneration Committee are set out in the QBE People & Remuneration Committee charter
(available from www.group.qbe.com/corporate-governance/background-documents).
Group CEO Divisional remuneration committees
External advisors
Use of external advisors
Remuneration consultants provide guidance on remuneration for executives, facilitate discussion, review remuneration and at-risk reward benchmarking within industry peer groups and provide guidance on current trends in executive remuneration practices.
Any advice provided by remuneration consultants is used as a guide and is not a substitute for consideration of all the issues by each non-executive director on the People & Remuneration Committee.
The People & Remuneration Committee retained UK based firm FIT Remuneration Consultants LLP (FIT) to act as its independent remuneration adviser. Having received a declaration by FIT that they were not unduly influenced by QBE executives regarding their remuneration recommendations, the People & Remuneration Committee and the Board are satisfied that the advice provided by FIT during 2018 was provided free from undue influence.
The cost of advice and assistance provided by FIT in 2018 was $73,845.
During 2018, management requested reports on market practice from PwC and other sources. No recommendations in relation to the remuneration of KMP were provided as part of these engagements.
Managing risk
By continuing to invest in managing our risk in an increasingly dynamic environment, we will build a stronger and resilient QBE.
The People & Remuneration Committee works with Group Risk and Human Resources to ensure that any risk associated with remuneration arrangements is managed within the Group’s risk management framework. The remuneration governance framework incorporates risk oversight policies, so that executives cannot unduly influence a decision that could materially impact their own incentive outcome.
The performance-based components of remuneration established in QBE’s incentive plans are designed to encourage behaviour that supports the Group’s long-term financial soundness.
Specifically, the QBE incentive plans:• recognise adherence to QBE’s risk management processes;• balance both short and long-term performance through an annual award based on performance against a range of financial metrics
that measure progress against longer-term strategy;
Oth
er in
form
ation
6
Fin
ancial
Rep
ort
5
Perfo
rman
ce o
verv
iew
1
Bu
siness
review
2
Go
vern
ance
3
QB
E In
suran
ce Gro
up
A
nn
ual R
epo
rt 2018
71D
irectors'
Rep
ort
4
Remuneration Report continued
• incorporate individual objectives that measure demonstrable proactive sound risk management, including the setting of a clear and consistent tone about the importance of managing risk throughout the organisation;
• set financial targets in the context of business plans that have been appropriately stress-tested by the Group Chief Risk Officer;• defer a significant portion of the award in equity (which vests over four years);• have Plan Rules which provide the Board with discretion to take other factors into account when determining the appropriate
award outcome;• include a malus provision (see below);• enable the build-up of meaningful shareholding through the deferred equity (underpinned by a minimum shareholding requirement
for executives) (see below); and• result in a target remuneration mix that is appropriately balanced between fixed/variable remuneration and short-term/long-term.
The Group Chief Risk Officer attends the People & Remuneration Committee annually to report on executive risk behaviours.
The Chairman of the People & Remuneration Committee is a member of the Risk & Capital Committee and vice versa.
The Group Board approves a comprehensive delegated authority for the Group CEO, which is an integral part of QBE’s risk management process.
Executives are required to adhere to a range of Group-wide policies to ensure risks are well managed, strong governance structures are in place and high ethical standards are maintained.
Treatment of conditional rights on a change in control of QBE
In accordance with the rules of each of QBE's incentive plans, a change in control is defined as either a scheme of arrangement that has been approved by QBE’s shareholders or the acquisition by a bidder of at least 50% of the issued and to be issued QBE shares under an unconditional takeover offer made in accordance with the Corporations Act 2001.
Should a change in organisational control occur, the People & Remuneration Committee has discretion to determine how unvested conditional rights should be treated, having regard to factors such as the length of time elapsed in the performance period, the level of performance to date and the circumstances of the change of control.
Malus provision
The “malus” provision gives the People & Remuneration Committee discretion to reduce the amount of an unvested award (including to zero) in certain circumstances during the retention period including in the case of:• serious misconduct; or• circumstances that materially undermine the reputation or performance of QBE; andon the basis that, in each case, the conduct or circumstances were not foreseen at the time of granting the award.
This provision reflects best practice and QBE’s obligations under APRA’s prudential standard CPS 510 to incorporate terms allowing for the adjustment of incentive awards to protect QBE’s financial soundness and ability to respond to unforeseen significant issues.
Minimum shareholding
The MSR ensures executives build their shareholding to have significant exposure to QBE's share price. Under the MSR, a minimum of 3x fixed remuneration for the Group CEO (1.5x for other executives) is to be maintained as long as the executive remains at QBE. The value of shareholdings as at 31 December 2018 for each executive is shown in section 1.
Trading policy
Trading in QBE ordinary shares is generally permitted outside of designated blackout periods. The QBE Share Trading Policy states that non-executive directors and executives should notify any intended share transaction to nominated people within the Group.
The policy prohibits the hedging of unvested equity entitlements by executives. The purpose of this prohibition is to ensure that, until equity has vested, there is an alignment between the interests of executives and shareholders, with the effect that share price movements (either positive or negative) will economically impact executive rewards. There is a further restriction on hedging vested equity entitlements if such entitlement counts towards the executive’s minimum shareholding requirement.
The policy is enforced by requiring non-executive directors and executives to sign an annual declaration that confirms compliance with the restrictions on hedging. A copy of QBE’s trading policy for dealing in securities is available from www.group.qbe.com/corporate-governance/background-documents.
Dilution limits for share plans
Shares awarded under QBE’s employee share plans may be purchased on market or issued subject to Board discretion and the requirements of the Corporations Act 2001 and the ASX Listing Rules. At 31 December 2018, the proportion of shares and unvested conditional rights and options held in the QBE Employee Share Plan is 1.76%. This is significantly less than the maximum of 10% over a 10 year period allowed under the plan rules.
2. REMUNERATION GOVERNANCE
72
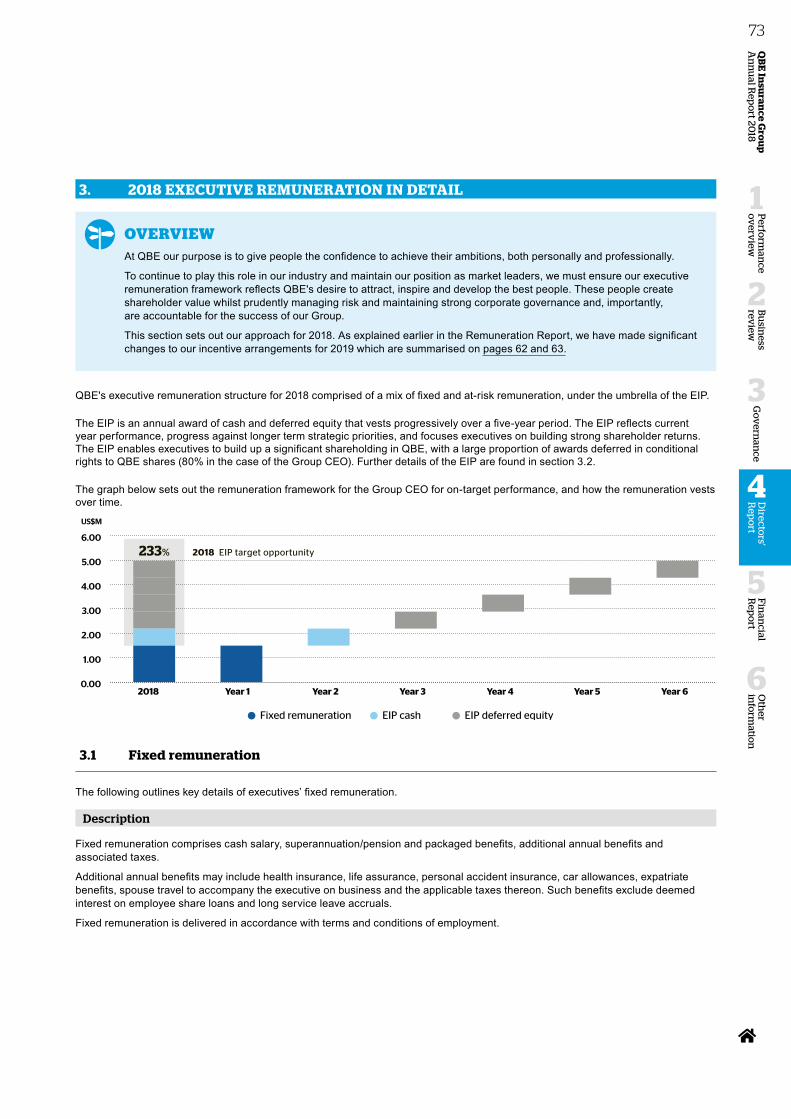
3. 2018 EXECUTIVE REMUNERATION IN DETAIL
OVERVIEWAt QBE our purpose is to give people the confidence to achieve their ambitions, both personally and professionally.
To continue to play this role in our industry and maintain our position as market leaders, we must ensure our executive remuneration framework reflects QBE's desire to attract, inspire and develop the best people. These people create shareholder value whilst prudently managing risk and maintaining strong corporate governance and, importantly, are accountable for the success of our Group.
This section sets out our approach for 2018. As explained earlier in the Remuneration Report, we have made significant changes to our incentive arrangements for 2019 which are summarised on pages 62 and 63.
QBE's executive remuneration structure for 2018 comprised of a mix of fixed and at-risk remuneration, under the umbrella of the EIP.
The EIP is an annual award of cash and deferred equity that vests progressively over a five-year period. The EIP reflects current year performance, progress against longer term strategic priorities, and focuses executives on building strong shareholder returns. The EIP enables executives to build up a significant shareholding in QBE, with a large proportion of awards deferred in conditional rights to QBE shares (80% in the case of the Group CEO). Further details of the EIP are found in section 3.2.
The graph below sets out the remuneration framework for the Group CEO for on-target performance, and how the remuneration vests over time.
Fixed remuneration EIP cash EIP deferred equity
US$M
0.00
1.00
2.00
3.00
4.00
5.00
6.00
Year 6Year 5Year 4Year 3Year 2Year 12018
233% 2018 EIP target opportunity
3.1 Fixed remuneration
The following outlines key details of executives’ fixed remuneration.
Description
Fixed remuneration comprises cash salary, superannuation/pension and packaged benefits, additional annual benefits and associated taxes.
Additional annual benefits may include health insurance, life assurance, personal accident insurance, car allowances, expatriate benefits, spouse travel to accompany the executive on business and the applicable taxes thereon. Such benefits exclude deemed interest on employee share loans and long service leave accruals.
Fixed remuneration is delivered in accordance with terms and conditions of employment.
Oth
er in
form
ation
6
Fin
ancial
Rep
ort
5
Perfo
rman
ce o
verv
iew
1
Bu
siness
review
2
Go
vern
ance
3
QB
E In
suran
ce Gro
up
A
nn
ual R
epo
rt 2018
73D
irectors'
Rep
ort
4
Remuneration Report continued
Determining fixed remuneration levels
Fixed remuneration considers the diversity, complexity and expertise required of individual roles. Remuneration quantum is set in the context of QBE’s broader reward strategy and internal relativities.
To assess the competitiveness of fixed remuneration, the People & Remuneration Committee considers market data and recognised published surveys. In addition, external market reviews are undertaken periodically to inform the setting of competitive fixed remuneration levels.
Executive roles that are Australian based are generally benchmarked to the ASX30 and ASX10-50 peer group of companies, with a specific focus on global companies and companies in the financial services industry.
Overseas-based executives or roles that have a global reach are compared with a peer group consisting of global insurers. The peer group of companies used for remuneration benchmarking purposes is set out in the table below:
PEER GROUP DESCRIPTION
ASX peer group Excludes infrastructure trusts and companies domiciled overseas. The financial services company sub-peer group is determined based on the industry classification listed on the ASX and includes commercial banks and insurers. The sub-peer group of global companies in the ASX is determined based on the global complexity of the organisation using the following criteria: • companies with greater than 25% revenue from overseas; and• companies operating in greater than two geographic locations.
Global insurance peer group
Consists of large, global insurance companies in the Dow Jones Insurance Titans Index excluding life and health insurance, reinsurance and insurance brokers. RSA and Hartford are included in this peer group given their similarities to QBE.
3.2 Executive Incentive Plan
The following outlines the key details of the EIP. The EIP awards made for 2018 are provided in section 1 of the Remuneration Report.
Description
The EIP is a performance-based incentive delivered in the form of an annual cash payment and a deferred award in the form of conditional rights to QBE shares. Performance is measured over a 12 month period.
Performance measures
EIP outcomes are based on performance against Group cash ROE and COR, divisional COR targets in the case of divisional executives and individual strategic performance objectives reflecting QBE's strategic priorities as they apply to each executive's role. An explanation of the financial measures and their rationale is provided below:
Group Cash ROE: is a measure of how effectively we are managing shareholders’ investment in QBE. For the EIP, this measure will generally be measured on the same basis as that used to determine shareholder dividends. As a principle, losses due to unbudgeted amortisation/impairment of intangibles will, other than in exceptional circumstances, be included in cash ROE so that executives remain accountable for the management of intangible assets.
COR: is the most relevant measure of the profitability of our insurance operations and therefore overall performance. It is widely used externally for non-life insurance companies. Divisional executives have both Group and Divisional COR measures for their respective division.
The EIP rules provide suitable discretion to the People & Remuneration Committee to adjust any formulaic outcome to ensure EIP awards appropriately reflect performance. Adjustments are typically made in limited cases to better reflect underlying performance. These include an adjustment for the impact of unbudgeted movements in discount rates and to exclude the impact of unbudgeted acquisitions or divestments.
Executive performance against the strategic performance objectives is evaluated annually by the Group CEO, and by the Chairman in respect of the Group CEO, through formal business review assessments which includes management of risk.
Vesting schedule
The EIP vesting schedule is outlined below:
THRESHOLD TARGET SUPERIOR
% of EIP opportunity achieved 30% 100% 150%
3. EXECUTIVE REMUNERATION IN DETAIL
74
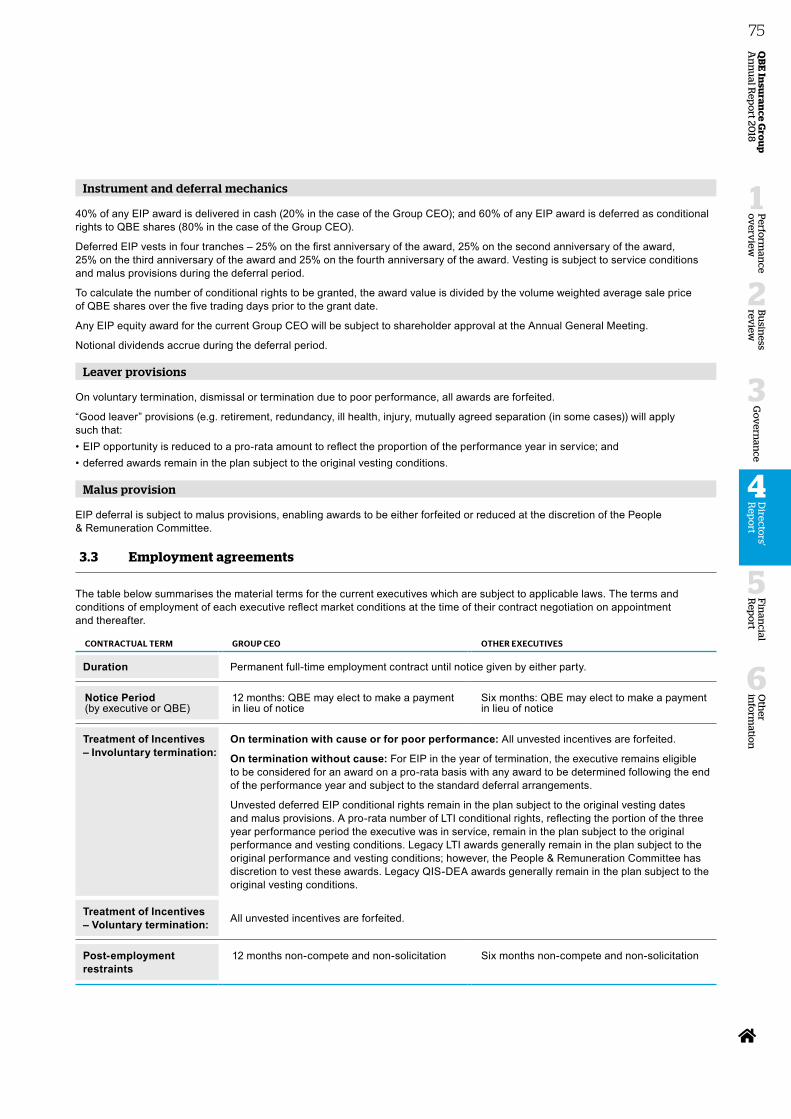
Instrument and deferral mechanics
40% of any EIP award is delivered in cash (20% in the case of the Group CEO); and 60% of any EIP award is deferred as conditional rights to QBE shares (80% in the case of the Group CEO).
Deferred EIP vests in four tranches – 25% on the first anniversary of the award, 25% on the second anniversary of the award, 25% on the third anniversary of the award and 25% on the fourth anniversary of the award. Vesting is subject to service conditions and malus provisions during the deferral period.
To calculate the number of conditional rights to be granted, the award value is divided by the volume weighted average sale price of QBE shares over the five trading days prior to the grant date.
Any EIP equity award for the current Group CEO will be subject to shareholder approval at the Annual General Meeting.
Notional dividends accrue during the deferral period.
Leaver provisions
On voluntary termination, dismissal or termination due to poor performance, all awards are forfeited.
“Good leaver” provisions (e.g. retirement, redundancy, ill health, injury, mutually agreed separation (in some cases)) will apply such that:• EIP opportunity is reduced to a pro-rata amount to reflect the proportion of the performance year in service; and• deferred awards remain in the plan subject to the original vesting conditions.
Malus provision
EIP deferral is subject to malus provisions, enabling awards to be either forfeited or reduced at the discretion of the People & Remuneration Committee.
3.3 Employment agreements
The table below summarises the material terms for the current executives which are subject to applicable laws. The terms and conditions of employment of each executive reflect market conditions at the time of their contract negotiation on appointment and thereafter.
CONTRACTUAL TERM GROUP CEO OTHER EXECUTIVES
Duration Permanent full-time employment contract until notice given by either party.
Notice Period (by executive or QBE)
12 months: QBE may elect to make a payment in lieu of notice
Six months: QBE may elect to make a payment in lieu of notice
Treatment of Incentives – Involuntary termination:
On termination with cause or for poor performance: All unvested incentives are forfeited.
On termination without cause: For EIP in the year of termination, the executive remains eligible to be considered for an award on a pro-rata basis with any award to be determined following the end of the performance year and subject to the standard deferral arrangements.
Unvested deferred EIP conditional rights remain in the plan subject to the original vesting dates and malus provisions. A pro-rata number of LTI conditional rights, reflecting the portion of the three year performance period the executive was in service, remain in the plan subject to the original performance and vesting conditions. Legacy LTI awards generally remain in the plan subject to the original performance and vesting conditions; however, the People & Remuneration Committee has discretion to vest these awards. Legacy QIS-DEA awards generally remain in the plan subject to the original vesting conditions.
Treatment of Incentives – Voluntary termination: All unvested incentives are forfeited.
Post‑employment restraints
12 months non-compete and non-solicitation Six months non-compete and non-solicitation
Oth
er in
form
ation
6
Fin
ancial
Rep
ort
5
Perfo
rman
ce o
verv
iew
1
Bu
siness
review
2
Go
vern
ance
3
QB
E In
suran
ce Gro
up
A
nn
ual R
epo
rt 2018
75D
irectors'
Rep
ort
4
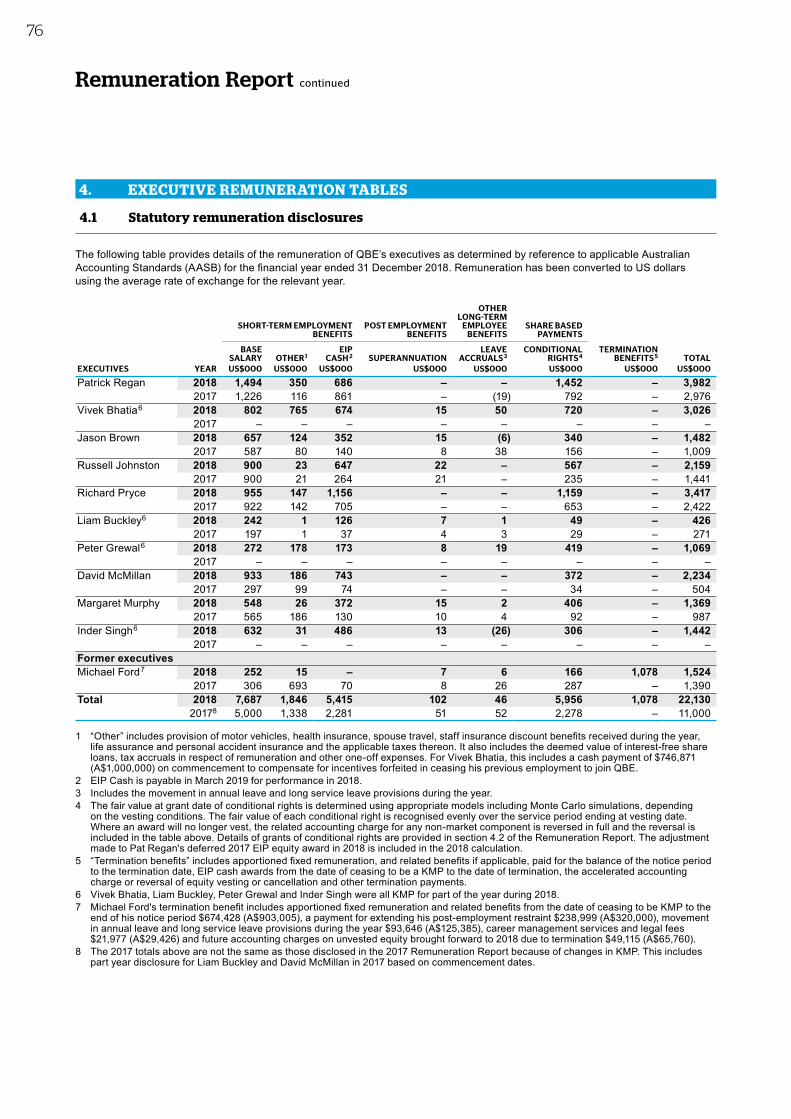
Remuneration Report continued
4. EXECUTIVE REMUNERATION TABLES
4.1 Statutory remuneration disclosures
The following table provides details of the remuneration of QBE’s executives as determined by reference to applicable Australian Accounting Standards (AASB) for the financial year ended 31 December 2018. Remuneration has been converted to US dollars using the average rate of exchange for the relevant year.
SHORT-TERM EMPLOYMENT BENEFITS
POST EMPLOYMENT BENEFITS
OTHER LONG-TERM
EMPLOYEE BENEFITS
SHARE BASED PAYMENTS
BASE SALARY OTHER1
EIP CASH 2 SUPERANNUATION
LEAVE ACCRUALS 3
CONDITIONAL RIGHTS4
TERMINATION BENEFITS 5 TOTAL
EXECUTIVES YEAR US$000 US$000 US$000 US$000 US$000 US$000 US$000 US$000
Patrick Regan 2018 1,494 350 686 – – 1,452 – 3,9822017 1,226 116 861 – (19) 792 – 2,976
Vivek Bhatia6 2018 802 765 674 15 50 720 – 3,0262017 – – – – – – – –
Jason Brown 2018 657 124 352 15 (6) 340 – 1,4822017 587 80 140 8 38 156 – 1,009
Russell Johnston 2018 900 23 647 22 – 567 – 2,1592017 900 21 264 21 – 235 – 1,441
Richard Pryce 2018 955 147 1,156 – – 1,159 – 3,4172017 922 142 705 – – 653 – 2,422
Liam Buckley6 2018 242 1 126 7 1 49 – 4262017 197 1 37 4 3 29 – 271
Peter Grewal6 2018 272 178 173 8 19 419 – 1,0692017 – – – – – – – –
David McMillan 2018 933 186 743 – – 372 – 2,2342017 297 99 74 – – 34 – 504
Margaret Murphy 2018 548 26 372 15 2 406 – 1,3692017 565 186 130 10 4 92 – 987
Inder Singh6 2018 632 31 486 13 (26) 306 – 1,4422017 – – – – – – – –
Former executivesMichael Ford7 2018 252 15 – 7 6 166 1,078 1,524
2017 306 693 70 8 26 287 – 1,390Total 2018 7,687 1,846 5,415 102 46 5,956 1,078 22,130
20178 5,000 1,338 2,281 51 52 2,278 – 11,000
1 “Other” includes provision of motor vehicles, health insurance, spouse travel, staff insurance discount benefits received during the year, life assurance and personal accident insurance and the applicable taxes thereon. It also includes the deemed value of interest-free share loans, tax accruals in respect of remuneration and other one-off expenses. For Vivek Bhatia, this includes a cash payment of $746,871 (A$1,000,000) on commencement to compensate for incentives forfeited in ceasing his previous employment to join QBE.
2 EIP Cash is payable in March 2019 for performance in 2018. 3 Includes the movement in annual leave and long service leave provisions during the year.4 The fair value at grant date of conditional rights is determined using appropriate models including Monte Carlo simulations, depending
on the vesting conditions. The fair value of each conditional right is recognised evenly over the service period ending at vesting date. Where an award will no longer vest, the related accounting charge for any non-market component is reversed in full and the reversal is included in the table above. Details of grants of conditional rights are provided in section 4.2 of the Remuneration Report. The adjustment made to Pat Regan's deferred 2017 EIP equity award in 2018 is included in the 2018 calculation.
5 “Termination benefits” includes apportioned fixed remuneration, and related benefits if applicable, paid for the balance of the notice period to the termination date, EIP cash awards from the date of ceasing to be a KMP to the date of termination, the accelerated accounting charge or reversal of equity vesting or cancellation and other termination payments.
6 Vivek Bhatia, Liam Buckley, Peter Grewal and Inder Singh were all KMP for part of the year during 2018. 7 Michael Ford's termination benefit includes apportioned fixed remuneration and related benefits from the date of ceasing to be KMP to the
end of his notice period $674,428 (A$903,005), a payment for extending his post-employment restraint $238,999 (A$320,000), movement in annual leave and long service leave provisions during the year $93,646 (A$125,385), career management services and legal fees $21,977 (A$29,426) and future accounting charges on unvested equity brought forward to 2018 due to termination $49,115 (A$65,760).
8 The 2017 totals above are not the same as those disclosed in the 2017 Remuneration Report because of changes in KMP. This includes part year disclosure for Liam Buckley and David McMillan in 2017 based on commencement dates.
76
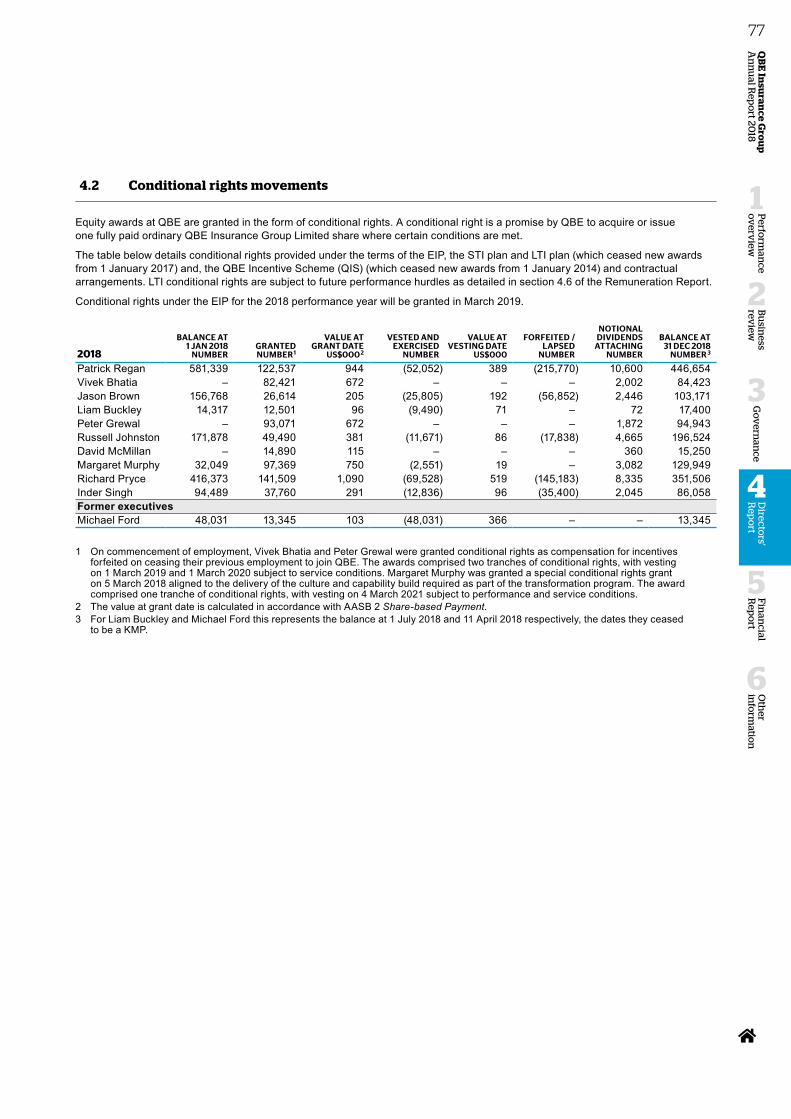
4.2 Conditional rights movements
Equity awards at QBE are granted in the form of conditional rights. A conditional right is a promise by QBE to acquire or issue one fully paid ordinary QBE Insurance Group Limited share where certain conditions are met.
The table below details conditional rights provided under the terms of the EIP, the STI plan and LTI plan (which ceased new awards from 1 January 2017) and, the QBE Incentive Scheme (QIS) (which ceased new awards from 1 January 2014) and contractual arrangements. LTI conditional rights are subject to future performance hurdles as detailed in section 4.6 of the Remuneration Report.
Conditional rights under the EIP for the 2018 performance year will be granted in March 2019.
2018
BALANCE AT 1 JAN 2018
NUMBERGRANTED NUMBER1
VALUE AT GRANT DATE
US$0002
VESTED AND EXERCISED
NUMBER
VALUE AT VESTING DATE
US$000
FORFEITED / LAPSED
NUMBER
NOTIONAL DIVIDENDS
ATTACHING NUMBER
BALANCE AT 31 DEC 2018
NUMBER 3
Patrick Regan 581,339 122,537 944 (52,052) 389 (215,770) 10,600 446,654Vivek Bhatia – 82,421 672 – – – 2,002 84,423Jason Brown 156,768 26,614 205 (25,805) 192 (56,852) 2,446 103,171Liam Buckley 14,317 12,501 96 (9,490) 71 – 72 17,400Peter Grewal – 93,071 672 – – – 1,872 94,943Russell Johnston 171,878 49,490 381 (11,671) 86 (17,838) 4,665 196,524David McMillan – 14,890 115 – – – 360 15,250Margaret Murphy 32,049 97,369 750 (2,551) 19 – 3,082 129,949Richard Pryce 416,373 141,509 1,090 (69,528) 519 (145,183) 8,335 351,506Inder Singh 94,489 37,760 291 (12,836) 96 (35,400) 2,045 86,058Former executivesMichael Ford 48,031 13,345 103 (48,031) 366 – – 13,345
1 On commencement of employment, Vivek Bhatia and Peter Grewal were granted conditional rights as compensation for incentives forfeited on ceasing their previous employment to join QBE. The awards comprised two tranches of conditional rights, with vesting on 1 March 2019 and 1 March 2020 subject to service conditions. Margaret Murphy was granted a special conditional rights grant on 5 March 2018 aligned to the delivery of the culture and capability build required as part of the transformation program. The award comprised one tranche of conditional rights, with vesting on 4 March 2021 subject to performance and service conditions.
2 The value at grant date is calculated in accordance with AASB 2 Share-based Payment.3 For Liam Buckley and Michael Ford this represents the balance at 1 July 2018 and 11 April 2018 respectively, the dates they ceased
to be a KMP.
Oth
er in
form
ation
6
Fin
ancial
Rep
ort
5
Perfo
rman
ce o
verv
iew
1
Bu
siness
review
2
Go
vern
ance
3
QB
E In
suran
ce Gro
up
A
nn
ual R
epo
rt 2018
77D
irectors'
Rep
ort
4
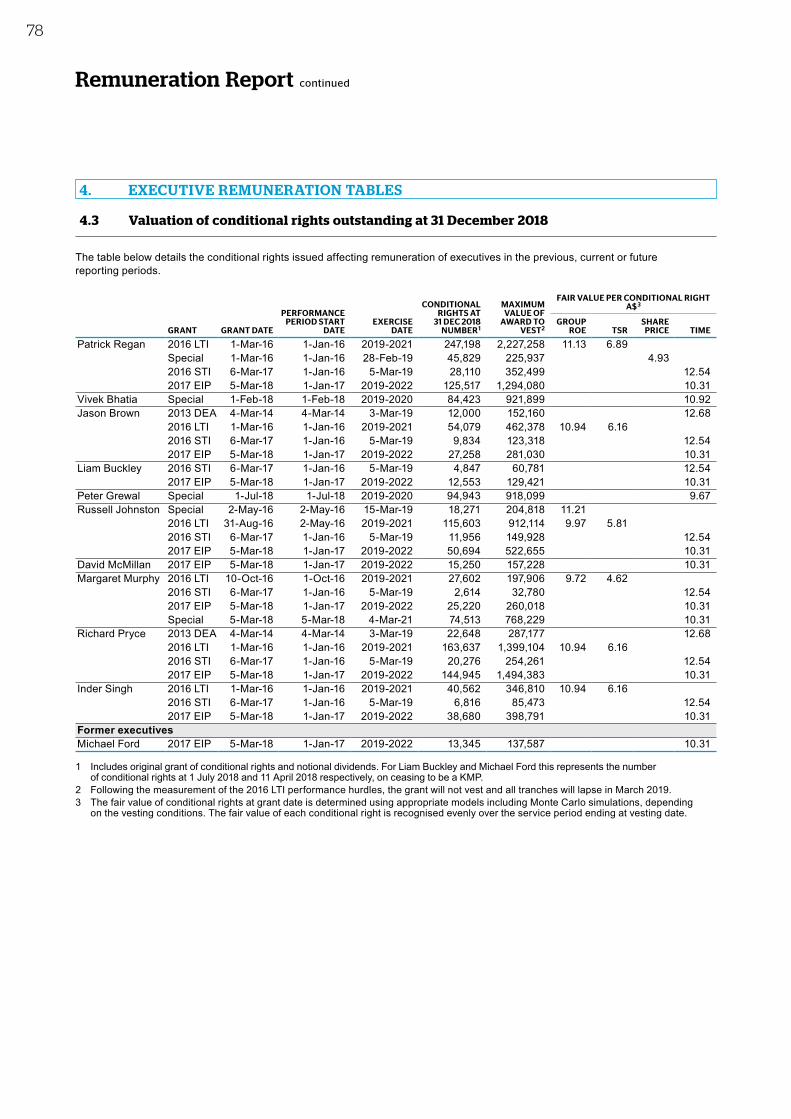
Remuneration Report continued
4.3 Valuation of conditional rights outstanding at 31 December 2018
The table below details the conditional rights issued affecting remuneration of executives in the previous, current or future reporting periods.
GRANT GRANT DATE
PERFORMANCE PERIOD START
DATEEXERCISE
DATE
CONDITIONAL RIGHTS AT
31 DEC 2018 NUMBER1
MAXIMUM VALUE OF
AWARD TO VEST2
FAIR VALUE PER CONDITIONAL RIGHT A$ 3
GROUP ROE TSR
SHARE PRICE TIME
Patrick Regan 2016 LTI 1-Mar-16 1-Jan-16 2019-2021 247,198 2,227,258 11.13 6.89Special 1-Mar-16 1-Jan-16 28-Feb-19 45,829 225,937 4.932016 STI 6-Mar-17 1-Jan-16 5-Mar-19 28,110 352,499 12.542017 EIP 5-Mar-18 1-Jan-17 2019-2022 125,517 1,294,080 10.31
Vivek Bhatia Special 1-Feb-18 1-Feb-18 2019-2020 84,423 921,899 10.92Jason Brown 2013 DEA 4-Mar-14 4-Mar-14 3-Mar-19 12,000 152,160 12.68
2016 LTI 1-Mar-16 1-Jan-16 2019-2021 54,079 462,378 10.94 6.162016 STI 6-Mar-17 1-Jan-16 5-Mar-19 9,834 123,318 12.542017 EIP 5-Mar-18 1-Jan-17 2019-2022 27,258 281,030 10.31
Liam Buckley 2016 STI 6-Mar-17 1-Jan-16 5-Mar-19 4,847 60,781 12.542017 EIP 5-Mar-18 1-Jan-17 2019-2022 12,553 129,421 10.31
Peter Grewal Special 1-Jul-18 1-Jul-18 2019-2020 94,943 918,099 9.67Russell Johnston Special 2-May-16 2-May-16 15-Mar-19 18,271 204,818 11.21
2016 LTI 31-Aug-16 2-May-16 2019-2021 115,603 912,114 9.97 5.812016 STI 6-Mar-17 1-Jan-16 5-Mar-19 11,956 149,928 12.542017 EIP 5-Mar-18 1-Jan-17 2019-2022 50,694 522,655 10.31
David McMillan 2017 EIP 5-Mar-18 1-Jan-17 2019-2022 15,250 157,228 10.31Margaret Murphy 2016 LTI 10-Oct-16 1-Oct-16 2019-2021 27,602 197,906 9.72 4.62
2016 STI 6-Mar-17 1-Jan-16 5-Mar-19 2,614 32,780 12.542017 EIP 5-Mar-18 1-Jan-17 2019-2022 25,220 260,018 10.31Special 5-Mar-18 5-Mar-18 4-Mar-21 74,513 768,229 10.31
Richard Pryce 2013 DEA 4-Mar-14 4-Mar-14 3-Mar-19 22,648 287,177 12.682016 LTI 1-Mar-16 1-Jan-16 2019-2021 163,637 1,399,104 10.94 6.162016 STI 6-Mar-17 1-Jan-16 5-Mar-19 20,276 254,261 12.542017 EIP 5-Mar-18 1-Jan-17 2019-2022 144,945 1,494,383 10.31
Inder Singh 2016 LTI 1-Mar-16 1-Jan-16 2019-2021 40,562 346,810 10.94 6.162016 STI 6-Mar-17 1-Jan-16 5-Mar-19 6,816 85,473 12.542017 EIP 5-Mar-18 1-Jan-17 2019-2022 38,680 398,791 10.31
Former executivesMichael Ford 2017 EIP 5-Mar-18 1-Jan-17 2019-2022 13,345 137,587 10.31
1 Includes original grant of conditional rights and notional dividends. For Liam Buckley and Michael Ford this represents the number of conditional rights at 1 July 2018 and 11 April 2018 respectively, on ceasing to be a KMP.
2 Following the measurement of the 2016 LTI performance hurdles, the grant will not vest and all tranches will lapse in March 2019. 3 The fair value of conditional rights at grant date is determined using appropriate models including Monte Carlo simulations, depending
on the vesting conditions. The fair value of each conditional right is recognised evenly over the service period ending at vesting date.
4. EXECUTIVE REMUNERATION TABLES
78
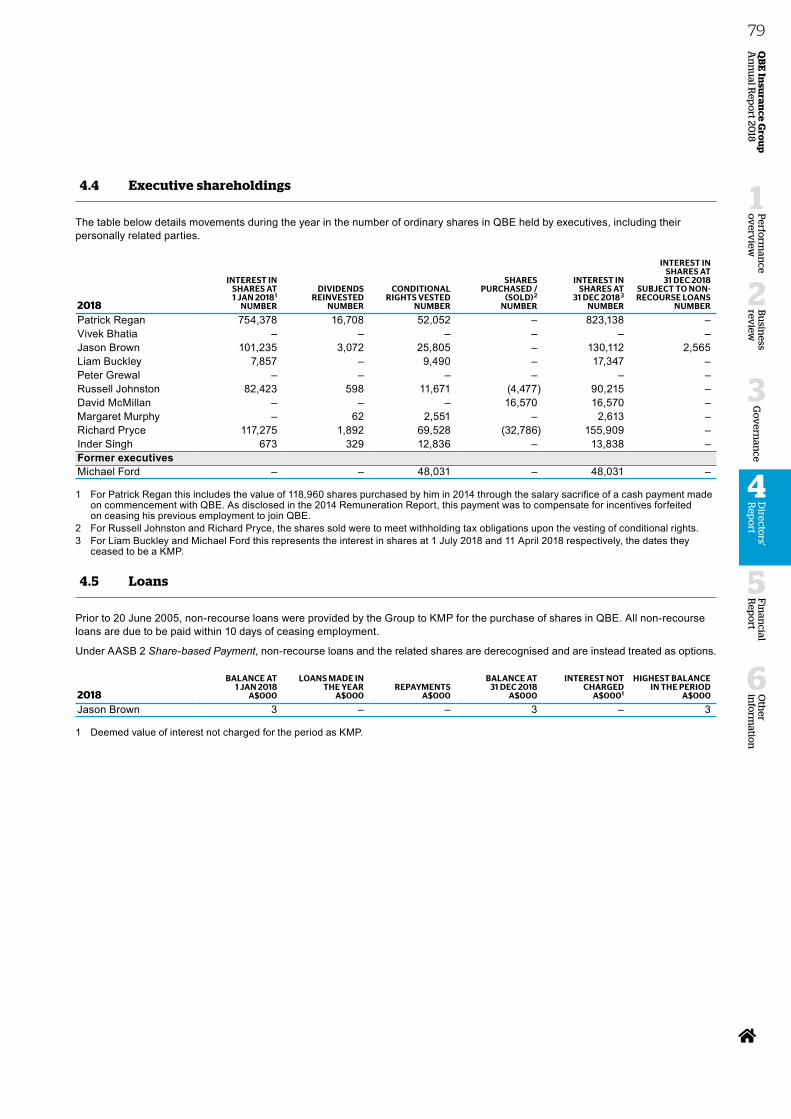
4.4 Executive shareholdings
The table below details movements during the year in the number of ordinary shares in QBE held by executives, including their personally related parties.
2018
INTEREST IN SHARES AT 1 JAN 20181
NUMBER
DIVIDENDS REINVESTED
NUMBER
CONDITIONAL RIGHTS VESTED
NUMBER
SHARES PURCHASED /
(SOLD)2 NUMBER
INTEREST IN SHARES AT
31 DEC 2018 3 NUMBER
INTEREST IN SHARES AT
31 DEC 2018 SUBJECT TO NON-RECOURSE LOANS
NUMBER
Patrick Regan 754,378 16,708 52,052 – 823,138 – Vivek Bhatia – – – – – – Jason Brown 101,235 3,072 25,805 – 130,112 2,565Liam Buckley 7,857 – 9,490 – 17,347 – Peter Grewal – – – – – – Russell Johnston 82,423 598 11,671 (4,477) 90,215 – David McMillan – – – 16,570 16,570 – Margaret Murphy – 62 2,551 – 2,613 – Richard Pryce 117,275 1,892 69,528 (32,786) 155,909 – Inder Singh 673 329 12,836 – 13,838 – Former executivesMichael Ford – – 48,031 – 48,031 –
1 For Patrick Regan this includes the value of 118,960 shares purchased by him in 2014 through the salary sacrifice of a cash payment made on commencement with QBE. As disclosed in the 2014 Remuneration Report, this payment was to compensate for incentives forfeited on ceasing his previous employment to join QBE.
2 For Russell Johnston and Richard Pryce, the shares sold were to meet withholding tax obligations upon the vesting of conditional rights.3 For Liam Buckley and Michael Ford this represents the interest in shares at 1 July 2018 and 11 April 2018 respectively, the dates they
ceased to be a KMP.
4.5 Loans
Prior to 20 June 2005, non-recourse loans were provided by the Group to KMP for the purchase of shares in QBE. All non-recourse loans are due to be paid within 10 days of ceasing employment.
Under AASB 2 Share-based Payment, non-recourse loans and the related shares are derecognised and are instead treated as options.
2018
BALANCE AT 1 JAN 2018
A$000
LOANS MADE IN THE YEAR
A$000REPAYMENTS
A$000
BALANCE AT 31 DEC 2018
A$000
INTEREST NOT CHARGED
A$0001
HIGHEST BALANCE IN THE PERIOD
A$000
Jason Brown 3 – – 3 – 3
1 Deemed value of interest not charged for the period as KMP.
Oth
er in
form
ation
6
Fin
ancial
Rep
ort
5
Perfo
rman
ce o
verv
iew
1
Bu
siness
review
2
Go
vern
ance
3
QB
E In
suran
ce Gro
up
A
nn
ual R
epo
rt 2018
79D
irectors'
Rep
ort
4
Remuneration Report continued
4.6 Legacy equity schemes
The information below summarises QBE’s legacy incentive plans.
Short-term incentive plan (STI) – until 31 December 2016
The STI plan was a short-term, at-risk reward structure comprised of cash and deferred equity awards. It was replaced by the EIP for 2017 and 2018 but remains in use for all employees below executive level. 67% is delivered in cash (50% in the case of the Group CEO) and 33% is deferred as conditional rights to fully paid ordinary QBE shares (50% in the case of the Group CEO).
The conditional rights were deferred in two equal tranches – 50% on the first anniversary of the award and the other 50% on the second anniversary of the award. STI outcomes were subject to the achievement of multiple performance measures over the one year performance period including the Group’s ROE target; individual performance ratings; and, for divisional staff, divisional return on allocated capital targets.
Long-term incentive plan (LTI) – until 31 December 2016
The LTI plan comprised an award of conditional rights to fully-paid shares without payment by the executive. On achievement of the performance measures (at the end of the three year performance period), conditional rights vest in three tranches as follows:• 33% at the end of the three year performance period;• 33% on the first anniversary of the end of the performance period; and• 34% on the second anniversary of the end of the performance period.
Vesting is subject to two equally weighted performance conditions over a three year performance period including the achievement of Group ROE performance targets and the performance of the Group’s relative total shareholder return (TSR).
The relative TSR comparator group consisted of companies in the Dow Jones Insurance Titans Index group adjusted for those with most relevance to QBE’s business operations. The comparator group for the 2016 LTI award was Allstate Corp (US), Allianz SE-Reg (Germany), American International Group (US), Assicurazoni Generali (Italy), Aviva Plc (UK), AXA – SA (France), Chubb Corp (US), IAG Ltd (Australia), RSA Group (UK), Suncorp Group Ltd (Australia), The Hartford (US), The Travellers Cos Inc (US), QBE Insurance Group Ltd (Australia) and Zurich Insurance Group (Switzerland).
Legacy long-term incentive plan (Legacy LTI) – until 31 December 2013
The Legacy LTI plan comprised an award of conditional rights to fully-paid shares without payment by the executive, subject to a five year tenure hurdle, with vesting contingent upon the achievement of two equally weighted future performance hurdles which included a hurdle based on QBE’s diluted EPS increasing by a compound average of 7.5% per annum over the five year vesting period; and QBE’s average statutory ROE and COR being in the top 10% of the top 50 largest global insurers and reinsurers as measured by net earned premium for the five year vesting period. Conditional rights were granted as a maximum percentage of fixed remuneration ranging from 50% for the Group CEO, 25% for the Group CFO and 15% for Group and divisional executives.
QBE incentive scheme (QIS) – until 31 December 2013
The QBE Incentive Scheme (QIS) was a short-term, at-risk reward structure comprised of cash and deferred equity awards (QIS-DEA). It came into effect from 1 January 2010 and was applicable to deferred equity awards made in the period March 2011 to March 2014. Half of the conditional rights vest after three years and the remaining half after five years. During the period from the date of the QIS grant to the vesting date of the conditional rights, further conditional rights are issued under the Bonus Share Plan to reflect dividends paid on ordinary shares of QBE. The shares issued pursuant to the conditional rights are issued without payment being made by the recipient (i.e. at a nil exercise price).
4. EXECUTIVE REMUNERATION TABLES
80
5. NON-EXECUTIVE DIRECTOR REMUNERATION
OVERVIEWThe following section contains information on the approach to non-executive director remuneration, the fees, other benefits and shareholdings.
5.1 Remuneration philosophy
Non-executive director remuneration reflects QBE’s desire to attract, motivate and retain experienced independent directors and to ensure their active participation in the Group’s affairs for the purposes of corporate governance, regulatory compliance and other matters. QBE aims to provide a level of remuneration for non-executive directors comparable with its peers, which include multinational financial institutions. The Board reviews surveys published by independent remuneration consultants and other public information to ensure that fee levels are appropriate. The remuneration arrangements of non-executive directors are distinct and separate from the executives. Non-executive directors do not have formal service agreements.
5.2 Fee structure and components
The aggregate amount approved by shareholders at the 2017 AGM was A$4,000,000 per annum.
The total amount paid to non-executive directors in 2018 was A$3,536,000 (2017 A$3,568,000).
Under the current fee framework, non-executive directors receive a base fee expressed in Australian dollars. In addition, a non-executive director (other than the Chairman) may receive further fees for chairmanship or membership of a board committee.
No changes were made to non-executive remuneration during 2018 and none are proposed for 2019.
The non-executive director fee structure for 2017 and 2018 is shown in the table below.
ROLE CHAIRMAN FEE DEPUTY CHAIRMAN FEE MEMBER FEE
Board A$663,000 A$229,000 A$208,000Committee A$50,000 – A$27,000
5.3 Other benefits
Non-executive directors do not receive any performance-based remuneration such as cash incentives or equity awards. Under QBE’s constitution, non-executive directors are entitled to be reimbursed for all travel and related expenses properly incurred in connection with the business of QBE. All non-executive directors receive an annual cash travel allowance of A$42,750 (A$64,000 for the Chairman) in addition to fees for the time involved in travelling to Board meetings and other Board commitments.
Superannuation
QBE pays superannuation to Australian-based non-executive directors in accordance with Australian superannuation guarantee legislation. Overseas-based non-executive directors receive the cash equivalent amount in addition to their fees.
5.4 Minimum shareholding requirement
With effect from 1 April 2014, a non-executive director MSR was introduced for the Group Board. Under this requirement, non-executive directors have five years to build a minimum shareholding equal to 100% of annual base fees.
To assist current and new non-executive directors in meeting the requirement, a Director Share Acquisition Plan (DSAP) was established with effect from 1 June 2014. The DSAP allows non-executive directors to sacrifice a portion of their pre-tax director fees to acquire QBE shares. Where the MSR has not been met, non-executive directors are required to sacrifice a mandatory minimum amount of 20% of pre-tax fees into the DSAP until the minimum shareholding is achieved. Shares acquired in this way are not subject to performance targets, as they are acquired in place of cash payments.
Directors’ shareholdings are shown in section 5.5 of the Remuneration Report. All non-executive directors have met the MSR as at 31 December 2018.
Oth
er in
form
ation
6
Fin
ancial
Rep
ort
5
Perfo
rman
ce o
verv
iew
1
Bu
siness
review
2
Go
vern
ance
3
QB
E In
suran
ce Gro
up
A
nn
ual R
epo
rt 2018
81D
irectors'
Rep
ort
4
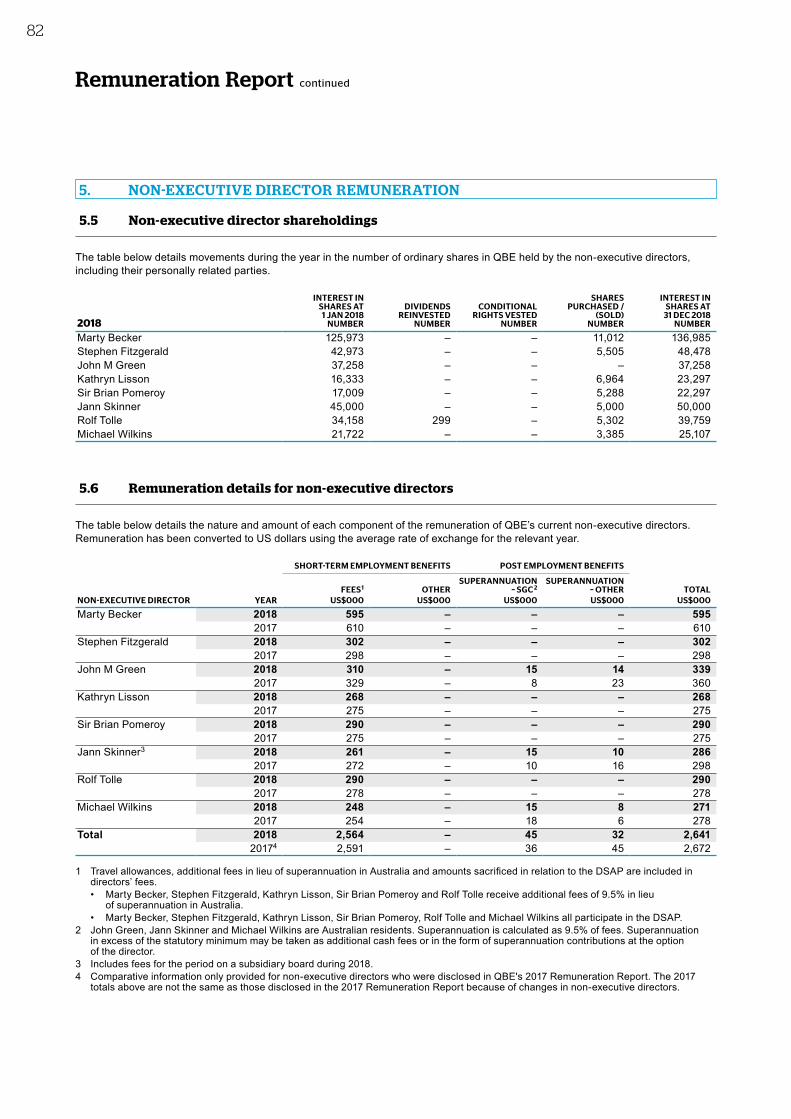
Remuneration Report continued
5.5 Non-executive director shareholdings
The table below details movements during the year in the number of ordinary shares in QBE held by the non-executive directors, including their personally related parties.
2018
INTEREST IN SHARES AT 1 JAN 2018
NUMBER
DIVIDENDS REINVESTED
NUMBER
CONDITIONAL RIGHTS VESTED
NUMBER
SHARES PURCHASED /
(SOLD) NUMBER
INTEREST IN SHARES AT
31 DEC 2018 NUMBER
Marty Becker 125,973 – – 11,012 136,985Stephen Fitzgerald 42,973 – – 5,505 48,478John M Green 37,258 – – – 37,258Kathryn Lisson 16,333 – – 6,964 23,297Sir Brian Pomeroy 17,009 – – 5,288 22,297Jann Skinner 45,000 – – 5,000 50,000Rolf Tolle 34,158 299 – 5,302 39,759Michael Wilkins 21,722 – – 3,385 25,107
5.6 Remuneration details for non-executive directors
The table below details the nature and amount of each component of the remuneration of QBE’s current non-executive directors. Remuneration has been converted to US dollars using the average rate of exchange for the relevant year.
SHORT-TERM EMPLOYMENT BENEFITS POST EMPLOYMENT BENEFITS
NON-EXECUTIVE DIRECTORFEES1 OTHER
SUPERANNUATION – SGC 2
SUPERANNUATION – OTHER TOTAL
YEAR US$000 US$000 US$000 US$000 US$000
Marty Becker 2018 595 – – – 5952017 610 – – – 610
Stephen Fitzgerald 2018 302 – – – 3022017 298 – – – 298
John M Green 2018 310 – 15 14 3392017 329 – 8 23 360
Kathryn Lisson 2018 268 – – – 2682017 275 – – – 275
Sir Brian Pomeroy 2018 290 – – – 2902017 275 – – – 275
Jann Skinner3 2018 261 – 15 10 2862017 272 – 10 16 298
Rolf Tolle 2018 290 – – – 2902017 278 – – – 278
Michael Wilkins 2018 248 – 15 8 2712017 254 – 18 6 278
Total 2018 2,564 – 45 32 2,64120174 2,591 – 36 45 2,672
1 Travel allowances, additional fees in lieu of superannuation in Australia and amounts sacrificed in relation to the DSAP are included in directors’ fees.• Marty Becker, Stephen Fitzgerald, Kathryn Lisson, Sir Brian Pomeroy and Rolf Tolle receive additional fees of 9.5% in lieu
of superannuation in Australia.• Marty Becker, Stephen Fitzgerald, Kathryn Lisson, Sir Brian Pomeroy, Rolf Tolle and Michael Wilkins all participate in the DSAP.
2 John Green, Jann Skinner and Michael Wilkins are Australian residents. Superannuation is calculated as 9.5% of fees. Superannuation in excess of the statutory minimum may be taken as additional cash fees or in the form of superannuation contributions at the option of the director.
3 Includes fees for the period on a subsidiary board during 2018.4 Comparative information only provided for non-executive directors who were disclosed in QBE's 2017 Remuneration Report. The 2017
totals above are not the same as those disclosed in the 2017 Remuneration Report because of changes in non-executive directors.
5. NON-EXECUTIVE DIRECTOR REMUNERATION
82
AuditorPricewaterhouseCoopers, Chartered Accountants, continue in office in accordance with section 327B of the Corporations Act 2001.
Non-audit services During the year, PricewaterhouseCoopers performed certain other services in addition to statutory duties.
The Board, on the advice of the Audit Committee, has considered the position and is satisfied that the provision of non-audit services is compatible with the general standard of independence for auditors imposed by the Corporations Act 2001. The directors are also satisfied that the provision of non-audit services by the auditor, as set out in note 8.7 to the financial statements, did not compromise the auditor independence requirements of the Corporations Act 2001.
A copy of the auditor’s independence declaration required under section 307C of the Corporations Act 2001 is set out on page 84.
Details of amounts paid or payable to PricewaterhouseCoopers for audit and non-audit services are provided in note 8.7 to the financial statements.
Rounding of amountsThe company is of a kind referred to in the ASIC Corporations (Rounding in Financial/Directors’ Reports) Instrument 2016/191. Amounts have been rounded off in the Directors’ Report to the nearest million dollars or, in certain cases, to the nearest thousand dollars in accordance with that instrument.
Signed in SYDNEY this 25th day of February 2019 in accordance with a resolution of the directors.
W. Marston Becker Patrick Regan Director Director
Directors' Report continued
FOR THE YEAR ENDED 31 DECEMBER 2018
Oth
er in
form
ation
6
Fin
ancial
Rep
ort
5
Perfo
rman
ce o
verv
iew
1
Bu
siness
review
2
Go
vern
ance
3
Directo
rs' R
epo
rt
4
QB
E In
suran
ce Gro
up
A
nn
ual R
epo
rt 2018
83D
irectors'
Rep
ort
4
Directors' Report continued
FOR THE YEAR ENDED 31 DECEMBER 2018
Auditor’s independence declaration for the year ended 31 December 2018As lead auditor for the audit of QBE Insurance Group Limited for the year ended 31 December 2018, I declare that, to the best of my knowledge and belief, there have been:(a) no contraventions of the auditor independence requirements of the Corporations Act 2001 in relation to the audit; and(b) no contraventions of any applicable code of professional conduct in relation to the audit.
This declaration is in respect of QBE Insurance Group Limited and the entities it controlled during the period.
SJ Hadfield Partner, PricewaterhouseCoopers
Sydney 25 February 2019
Liability limited by a scheme approved under Professional Standards Legislation
84
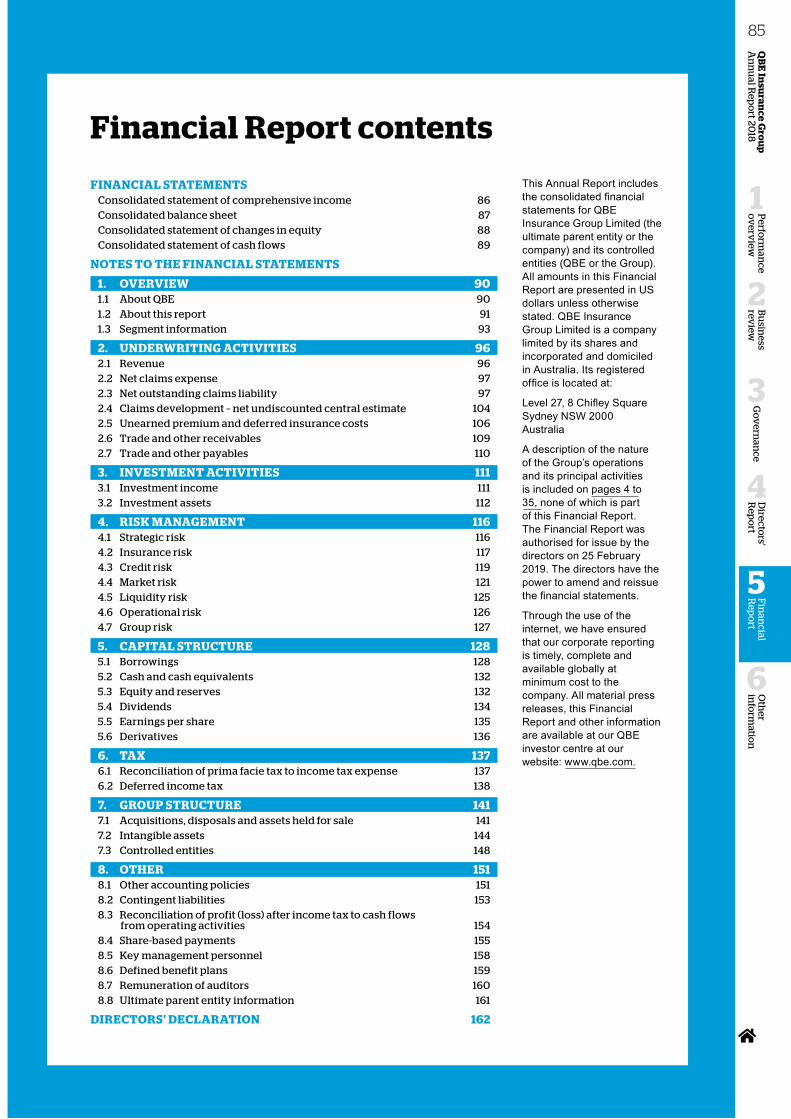
This Annual Report includes the consolidated financial statements for QBE Insurance Group Limited (the ultimate parent entity or the company) and its controlled entities (QBE or the Group). All amounts in this Financial Report are presented in US dollars unless otherwise stated. QBE Insurance Group Limited is a company limited by its shares and incorporated and domiciled in Australia. Its registered office is located at:
Level 27, 8 Chifley Square Sydney NSW 2000 Australia
A description of the nature of the Group’s operations and its principal activities is included on pages 4 to 35, none of which is part of this Financial Report. The Financial Report was authorised for issue by the directors on 25 February 2019. The directors have the power to amend and reissue the financial statements.
Through the use of the internet, we have ensured that our corporate reporting is timely, complete and available globally at minimum cost to the company. All material press releases, this Financial Report and other information are available at our QBE investor centre at our website: www.qbe.com.
FINANCIAL STATEMENTSConsolidated statement of comprehensive income 86Consolidated balance sheet 87Consolidated statement of changes in equity 88Consolidated statement of cash flows 89
NOTE S TO THE FINANCIAL STATEMENTS
1. OVERVIEW 901.1 About QBE 901.2 About this report 911.3 Segment information 93
2. UNDERWRITING ACTIVITIE S 962.1 Revenue 962.2 Net claims expense 972.3 Net outstanding claims liability 972.4 Claims development – net undiscounted central estimate 1042.5 Unearned premium and deferred insurance costs 1062.6 Trade and other receivables 1092.7 Trade and other payables 110
3. INVE STMENT ACTIVITIE S 1113.1 Investment income 1113.2 Investment assets 112
4. RISK MANAGEMENT 1164.1 Strategic risk 1164.2 Insurance risk 1174.3 Credit risk 1194.4 Market risk 1214.5 Liquidity risk 1254.6 Operational risk 1264.7 Group risk 127
5. CAPITAL STRUCTURE 1285.1 Borrowings 1285.2 Cash and cash equivalents 1325.3 Equity and reserves 1325.4 Dividends 1345.5 Earnings per share 1355.6 Derivatives 136
6. TAX 1376.1 Reconciliation of prima facie tax to income tax expense 1376.2 Deferred income tax 138
7. GROUP STRUCTURE 1417.1 Acquisitions, disposals and assets held for sale 1417.2 Intangible assets 1447.3 Controlled entities 148
8. OTHER 1518.1 Other accounting policies 1518.2 Contingent liabilities 1538.3 Reconciliation of profit (loss) after income tax to cash flows
from operating activities 1548.4 Share-based payments 1558.5 Key management personnel 1588.6 Defined benefit plans 1598.7 Remuneration of auditors 1608.8 Ultimate parent entity information 161
DIRECTORS' DECLARATION 162
Financial Report contents
Oth
er in
form
ation
6
Perfo
rman
ce o
verv
iew
1
Bu
siness
review
2
Go
vern
ance
3
Directo
rs' R
epo
rt
4
QB
E In
suran
ce Gro
up
A
nn
ual R
epo
rt 2018
85F
inan
cial R
epo
rt
5
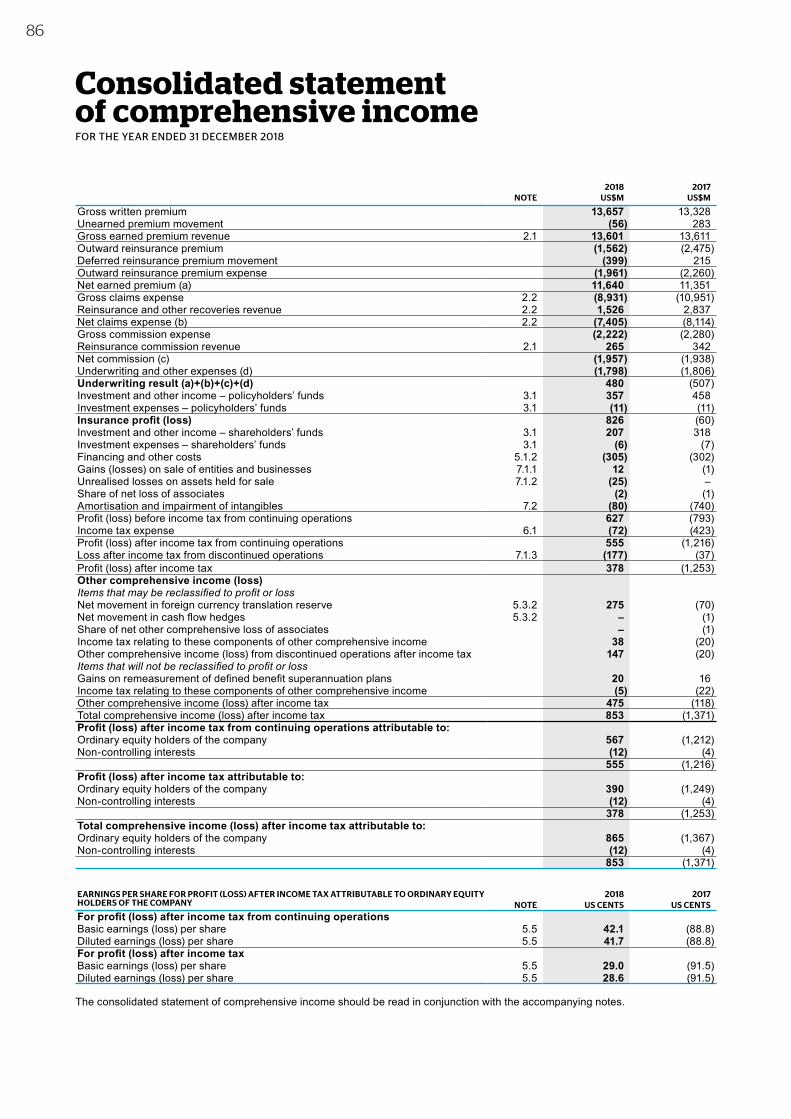
Consolidated statement of comprehensive incomeFOR THE YEAR ENDED 31 DECEMBER 2018
2018 2017NOTE US$M US$M
Gross written premium 13,657 13,328Unearned premium movement (56) 283Gross earned premium revenue 2.1 13,601 13,611Outward reinsurance premium (1,562) (2,475)Deferred reinsurance premium movement (399) 215Outward reinsurance premium expense (1,961) (2,260)Net earned premium (a) 11,640 11,351Gross claims expense 2.2 (8,931) (10,951)Reinsurance and other recoveries revenue 2.2 1,526 2,837Net claims expense (b) 2.2 (7,405) (8,114)Gross commission expense (2,222) (2,280)Reinsurance commission revenue 2.1 265 342Net commission (c) (1,957) (1,938)Underwriting and other expenses (d) (1,798) (1,806)Underwriting result (a)+(b)+(c)+(d) 480 (507)Investment and other income – policyholders’ funds 3.1 357 458Investment expenses – policyholders’ funds 3.1 (11) (11)Insurance profit (loss) 826 (60)Investment and other income – shareholders’ funds 3.1 207 318Investment expenses – shareholders’ funds 3.1 (6) (7)Financing and other costs 5.1.2 (305) (302)Gains (losses) on sale of entities and businesses 7.1.1 12 (1)Unrealised losses on assets held for sale 7.1.2 (25) – Share of net loss of associates (2) (1)Amortisation and impairment of intangibles 7.2 (80) (740)Profit (loss) before income tax from continuing operations 627 (793)Income tax expense 6.1 (72) (423)Profit (loss) after income tax from continuing operations 555 (1,216)Loss after income tax from discontinued operations 7.1.3 (177) (37)Profit (loss) after income tax 378 (1,253)Other comprehensive income (loss) Items that may be reclassified to profit or lossNet movement in foreign currency translation reserve 5.3.2 275 (70)Net movement in cash flow hedges 5.3.2 – (1)Share of net other comprehensive loss of associates – (1)Income tax relating to these components of other comprehensive income 38 (20)Other comprehensive income (loss) from discontinued operations after income tax 147 (20)Items that will not be reclassified to profit or lossGains on remeasurement of defined benefit superannuation plans 20 16Income tax relating to these components of other comprehensive income (5) (22)Other comprehensive income (loss) after income tax 475 (118)Total comprehensive income (loss) after income tax 853 (1,371)Profit (loss) after income tax from continuing operations attributable to:Ordinary equity holders of the company 567 (1,212)Non-controlling interests (12) (4)
555 (1,216)Profit (loss) after income tax attributable to:Ordinary equity holders of the company 390 (1,249)Non-controlling interests (12) (4)
378 (1,253)Total comprehensive income (loss) after income tax attributable to:Ordinary equity holders of the company 865 (1,367)Non-controlling interests (12) (4)
853 (1,371)
EARNINGS PER SHARE FOR PROFIT (LOSS) AFTER INCOME TAX ATTRIBUTABLE TO ORDINARY EQUITY HOLDERS OF THE COMPANY
2018 2017NOTE US CENTS US CENTS
For profit (loss) after income tax from continuing operationsBasic earnings (loss) per share 5.5 42.1 (88.8)Diluted earnings (loss) per share 5.5 41.7 (88.8)For profit (loss) after income taxBasic earnings (loss) per share 5.5 29.0 (91.5)Diluted earnings (loss) per share 5.5 28.6 (91.5)
The consolidated statement of comprehensive income should be read in conjunction with the accompanying notes.
86
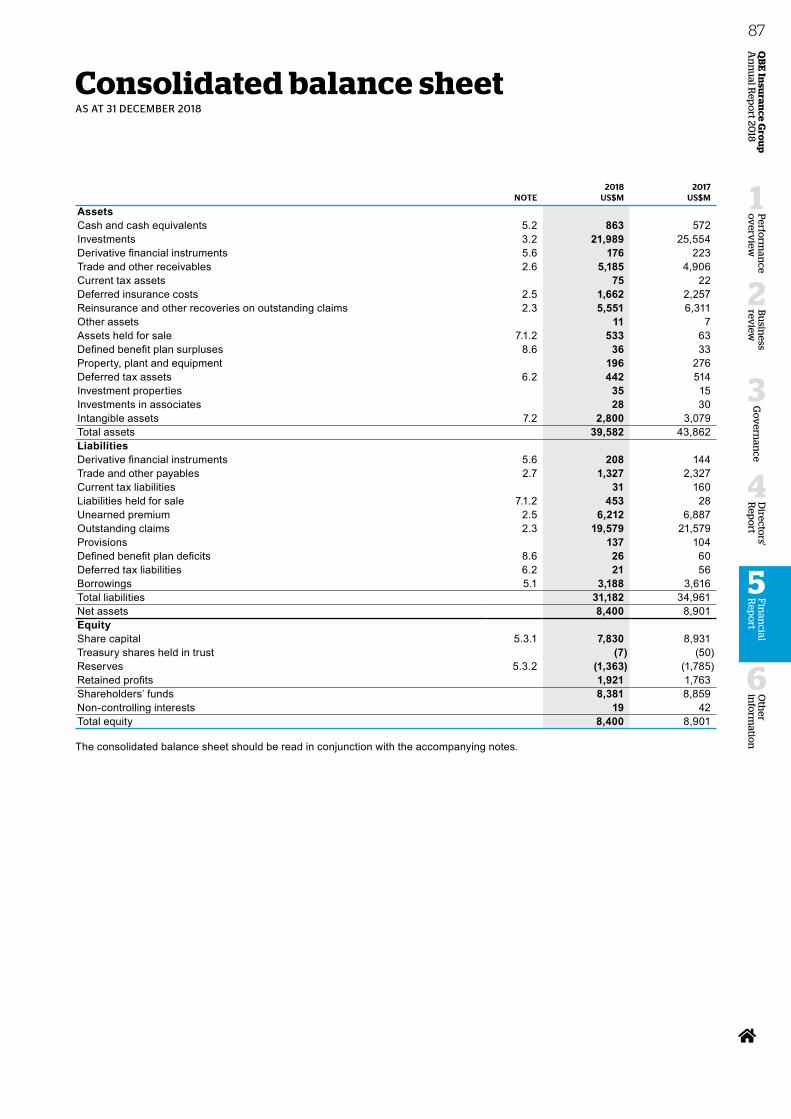
Consolidated balance sheetAS AT 31 DECEMBER 2018
2018 2017NOTE US$M US$M
Assets Cash and cash equivalents 5.2 863 572Investments 3.2 21,989 25,554Derivative financial instruments 5.6 176 223Trade and other receivables 2.6 5,185 4,906Current tax assets 75 22Deferred insurance costs 2.5 1,662 2,257Reinsurance and other recoveries on outstanding claims 2.3 5,551 6,311Other assets 11 7Assets held for sale 7.1.2 533 63Defined benefit plan surpluses 8.6 36 33Property, plant and equipment 196 276Deferred tax assets 6.2 442 514Investment properties 35 15Investments in associates 28 30Intangible assets 7.2 2,800 3,079Total assets 39,582 43,862Liabilities Derivative financial instruments 5.6 208 144Trade and other payables 2.7 1,327 2,327Current tax liabilities 31 160Liabilities held for sale 7.1.2 453 28Unearned premium 2.5 6,212 6,887Outstanding claims 2.3 19,579 21,579Provisions 137 104Defined benefit plan deficits 8.6 26 60Deferred tax liabilities 6.2 21 56Borrowings 5.1 3,188 3,616Total liabilities 31,182 34,961Net assets 8,400 8,901EquityShare capital 5.3.1 7,830 8,931Treasury shares held in trust (7) (50)Reserves 5.3.2 (1,363) (1,785)Retained profits 1,921 1,763Shareholders’ funds 8,381 8,859Non-controlling interests 19 42Total equity 8,400 8,901
The consolidated balance sheet should be read in conjunction with the accompanying notes.
Oth
er in
form
ation
6
Perfo
rman
ce o
verv
iew
1
Bu
siness
review
2
Go
vern
ance
3
Directo
rs' R
epo
rt
4
QB
E In
suran
ce Gro
up
A
nn
ual R
epo
rt 2018
87F
inan
cial R
epo
rt
5
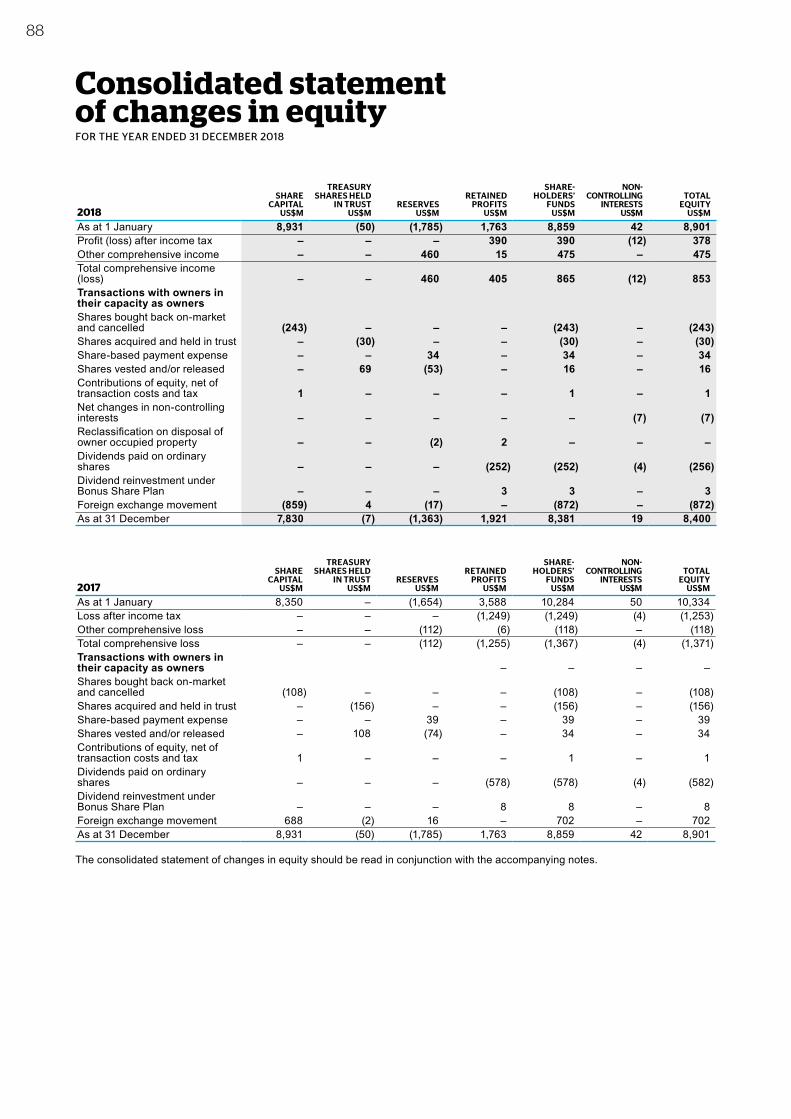
Consolidated statement of changes in equityFOR THE YEAR ENDED 31 DECEMBER 2018
2018
SHARE CAPITAL
US$M
TREASURY SHARES HELD
IN TRUST US$M
RESERVES US$M
RETAINED PROFITS
US$M
SHARE-HOLDERS’
FUNDS US$M
NON-CONTROLLING
INTERESTS US$M
TOTAL EQUITY
US$M
As at 1 January 8,931 (50) (1,785) 1,763 8,859 42 8,901Profit (loss) after income tax – – – 390 390 (12) 378Other comprehensive income – – 460 15 475 – 475Total comprehensive income (loss) – – 460 405 865 (12) 853Transactions with owners in their capacity as ownersShares bought back on-market and cancelled (243) – – – (243) – (243)Shares acquired and held in trust – (30) – – (30) – (30)Share-based payment expense – – 34 – 34 – 34Shares vested and/or released – 69 (53) – 16 – 16Contributions of equity, net of transaction costs and tax 1 – – – 1 – 1Net changes in non-controlling interests – – – – – (7) (7)Reclassification on disposal of owner occupied property – – (2) 2 – – – Dividends paid on ordinary shares – – – (252) (252) (4) (256)Dividend reinvestment under Bonus Share Plan – – – 3 3 – 3Foreign exchange movement (859) 4 (17) – (872) – (872)As at 31 December 7,830 (7) (1,363) 1,921 8,381 19 8,400
2017
SHARE CAPITAL
US$M
TREASURY SHARES HELD
IN TRUST US$M
RESERVES US$M
RETAINED PROFITS
US$M
SHARE-HOLDERS’
FUNDS US$M
NON-CONTROLLING
INTERESTS US$M
TOTAL EQUITY
US$M
As at 1 January 8,350 – (1,654) 3,588 10,284 50 10,334Loss after income tax – – – (1,249) (1,249) (4) (1,253)Other comprehensive loss – – (112) (6) (118) – (118)Total comprehensive loss – – (112) (1,255) (1,367) (4) (1,371)Transactions with owners in their capacity as owners – – – – Shares bought back on-market and cancelled (108) – – – (108) – (108)Shares acquired and held in trust – (156) – – (156) – (156)Share-based payment expense – – 39 – 39 – 39Shares vested and/or released – 108 (74) – 34 – 34Contributions of equity, net of transaction costs and tax 1 – – – 1 – 1Dividends paid on ordinary shares – – – (578) (578) (4) (582)Dividend reinvestment under Bonus Share Plan – – – 8 8 – 8Foreign exchange movement 688 (2) 16 – 702 – 702As at 31 December 8,931 (50) (1,785) 1,763 8,859 42 8,901
The consolidated statement of changes in equity should be read in conjunction with the accompanying notes.
88
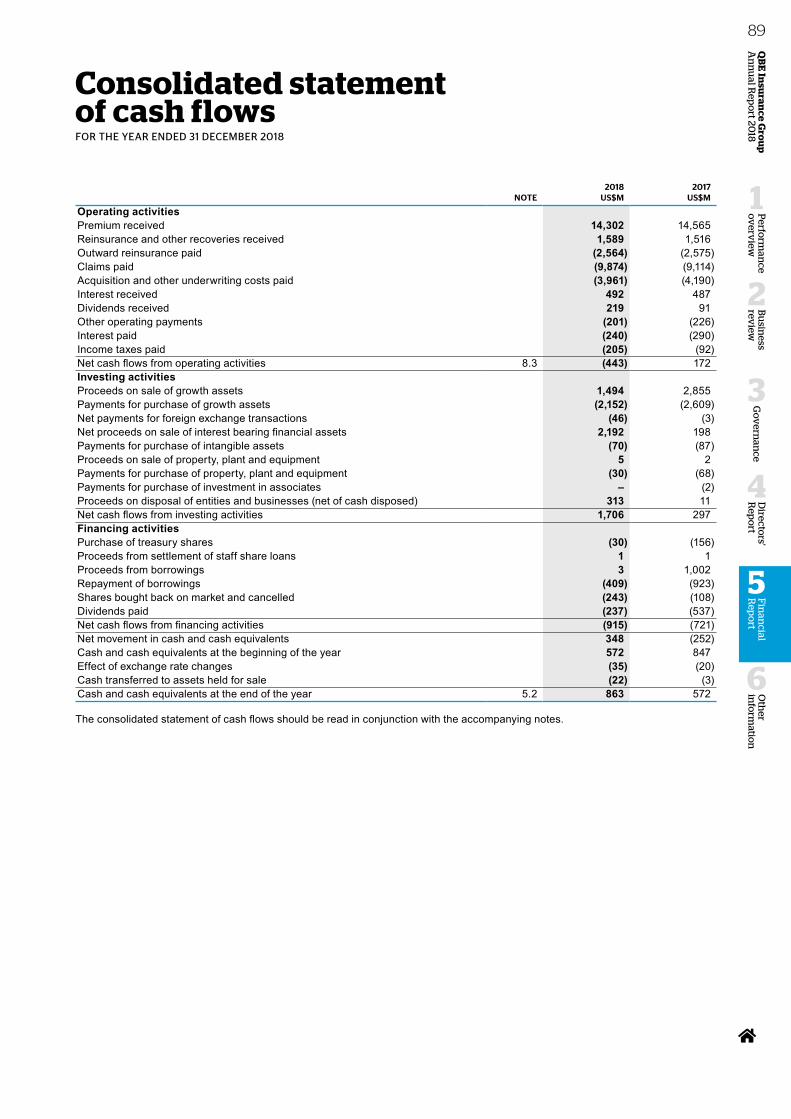
Consolidated statement of cash flowsFOR THE YEAR ENDED 31 DECEMBER 2018
2018 2017NOTE US$M US$M
Operating activitiesPremium received 14,302 14,565Reinsurance and other recoveries received 1,589 1,516Outward reinsurance paid (2,564) (2,575)Claims paid (9,874) (9,114)Acquisition and other underwriting costs paid (3,961) (4,190)Interest received 492 487Dividends received 219 91Other operating payments (201) (226)Interest paid (240) (290)Income taxes paid (205) (92)Net cash flows from operating activities 8.3 (443) 172Investing activitiesProceeds on sale of growth assets 1,494 2,855Payments for purchase of growth assets (2,152) (2,609)Net payments for foreign exchange transactions (46) (3)Net proceeds on sale of interest bearing financial assets 2,192 198Payments for purchase of intangible assets (70) (87)Proceeds on sale of property, plant and equipment 5 2Payments for purchase of property, plant and equipment (30) (68)Payments for purchase of investment in associates – (2)Proceeds on disposal of entities and businesses (net of cash disposed) 313 11Net cash flows from investing activities 1,706 297Financing activitiesPurchase of treasury shares (30) (156)Proceeds from settlement of staff share loans 1 1Proceeds from borrowings 3 1,002Repayment of borrowings (409) (923)Shares bought back on market and cancelled (243) (108)Dividends paid (237) (537)Net cash flows from financing activities (915) (721)Net movement in cash and cash equivalents 348 (252)Cash and cash equivalents at the beginning of the year 572 847Effect of exchange rate changes (35) (20)Cash transferred to assets held for sale (22) (3)Cash and cash equivalents at the end of the year 5.2 863 572
The consolidated statement of cash flows should be read in conjunction with the accompanying notes.
Oth
er in
form
ation
6
Perfo
rman
ce o
verv
iew
1
Bu
siness
review
2
Go
vern
ance
3
Directo
rs' R
epo
rt
4
QB
E In
suran
ce Gro
up
A
nn
ual R
epo
rt 2018
89F
inan
cial R
epo
rt
5
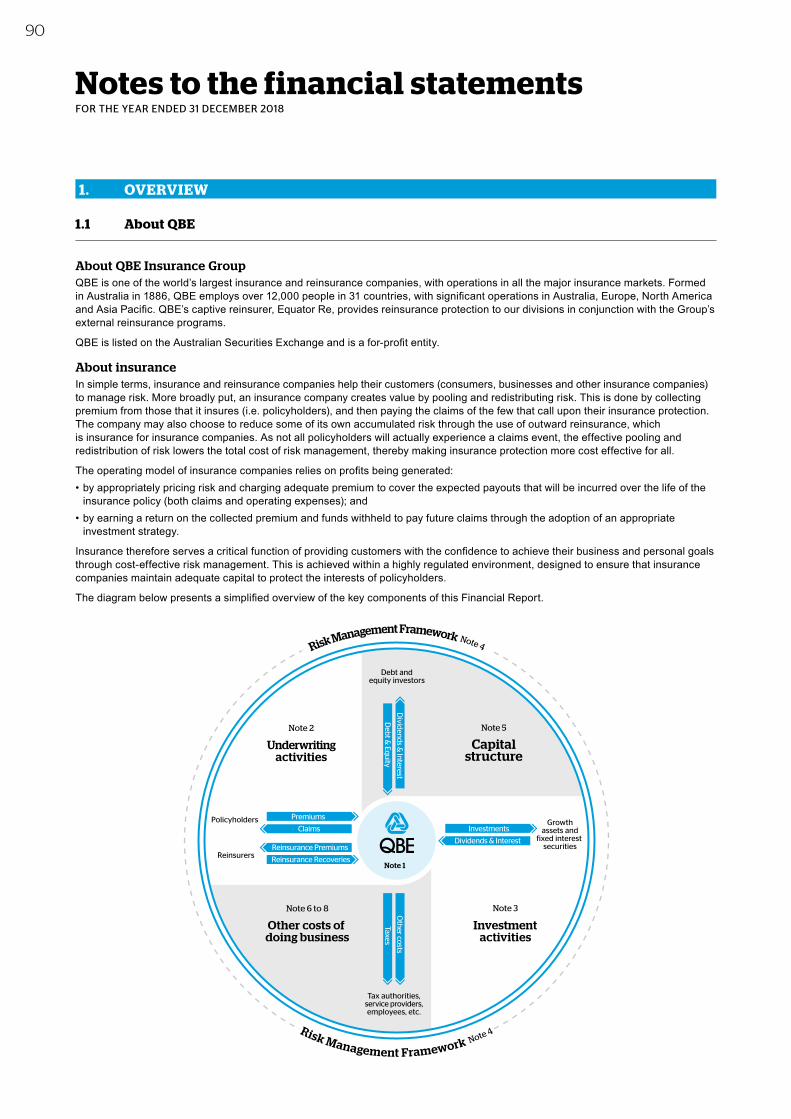
Notes to the financial statementsFOR THE YEAR ENDED 31 DECEMBER 2018
1. OVERVIEW
1.1 About QBE
About QBE Insurance GroupQBE is one of the world’s largest insurance and reinsurance companies, with operations in all the major insurance markets. Formed in Australia in 1886, QBE employs over 12,000 people in 31 countries, with significant operations in Australia, Europe, North America and Asia Pacific. QBE’s captive reinsurer, Equator Re, provides reinsurance protection to our divisions in conjunction with the Group’s external reinsurance programs.
QBE is listed on the Australian Securities Exchange and is a for-profit entity.
About insuranceIn simple terms, insurance and reinsurance companies help their customers (consumers, businesses and other insurance companies) to manage risk. More broadly put, an insurance company creates value by pooling and redistributing risk. This is done by collecting premium from those that it insures (i.e. policyholders), and then paying the claims of the few that call upon their insurance protection. The company may also choose to reduce some of its own accumulated risk through the use of outward reinsurance, which is insurance for insurance companies. As not all policyholders will actually experience a claims event, the effective pooling and redistribution of risk lowers the total cost of risk management, thereby making insurance protection more cost effective for all.
The operating model of insurance companies relies on profits being generated: • by appropriately pricing risk and charging adequate premium to cover the expected payouts that will be incurred over the life of the
insurance policy (both claims and operating expenses); and • by earning a return on the collected premium and funds withheld to pay future claims through the adoption of an appropriate
investment strategy.
Insurance therefore serves a critical function of providing customers with the confidence to achieve their business and personal goals through cost-effective risk management. This is achieved within a highly regulated environment, designed to ensure that insurance companies maintain adequate capital to protect the interests of policyholders.
The diagram below presents a simplified overview of the key components of this Financial Report.
Capitalstructure
Debt andequity investors
Note 5
Growthassets and
fixed interest securities
Investmentactivities
Note 3
Other costs of doing business
Tax authorities,service providers,employees, etc.
Note 6 to 8
Underwritingactivities
Note 2
Reinsurers
Policyholders Premiums
Reinsurance Recoveries
Reinsurance Premiums
Claims
Debt &
Equity
Dividends &
Interest
Taxes
Other costs
Investments
Dividends & Interest
Note 1
Risk Management Framework Note 4
Risk Management Framework Note 4
Risk Management Framework Note 4
Risk Management Framework Note 4
90
1.2 About this report
This Financial Report includes the consolidated financial statements of QBE Insurance Group Limited (the ultimate parent entity or the company) and its controlled entities (QBE or the Group).
The Financial Report includes the four primary statements, namely the statement of comprehensive income (which comprises profit or loss and other comprehensive income), balance sheet, statement of changes in equity and statement of cash flows as well as associated notes as required by Australian Accounting Standards. Disclosures have been grouped into the following categories in order to assist users in their understanding of the financial statements: 1. Overview contains information that impacts the Financial Report as a whole as well as segment reporting disclosures.2. Underwriting activities brings together results and balance sheet disclosures relevant to the Group’s insurance activities.3. Investment activities includes results and balance sheet disclosures relevant to the Group’s investments.4. Risk management provides commentary on the Group’s exposure to various financial and capital risks, explaining the potential
impact on the results and balance sheet and how the Group manages these risks.5. Capital structure provides information about the debt and equity components of the Group’s capital.6. Tax includes disclosures relating to the Group’s tax balances.7. Group structure provides a summary of the Group’s controlled entities and includes disclosures in relation to transactions
impacting the Group structure.8. Other includes additional disclosures required in order to comply with Australian Accounting Standards.
Where applicable within each note, disclosures are further analysed as follows:• Overview provides some context to assist users in understanding the disclosures.• Disclosures (both numbers and commentary) provide analysis of balances as required by Australian Accounting Standards. • How we account for the numbers summarises the accounting policies relevant to an understanding of the numbers.• Critical accounting judgements and estimates explains the key estimates and judgements applied by QBE in determining
the numbers.
The notes include information which the directors believe is required to understand the financial statements and is material and relevant to the operations, balance sheet and results of the Group. Information is considered material and relevant if:• the amount in question is significant because of its size or nature;• it is important to assist in understanding the results of the Group;• it helps to explain the impact of significant changes in the Group’s business – for example, significant acquisitions or disposals; or• it relates to an aspect of the Group’s operations that is important to its future performance.
1.2.1 Basis of preparationThis Financial Report is a general purpose financial report which:• has been prepared in accordance with Australian Accounting Standards and Interpretations as issued by the Australian Accounting
Standards Board (AASB), International Financial Reporting Standards (IFRS) as issued by the International Accounting Standards Board (IASB) and the Corporations Act 2001;
• has been prepared on a historical cost basis as modified by certain exceptions, the most significant of which are the measurement of investments and derivatives at fair value and the measurement of the net outstanding claims liability at present value;
• is presented in US dollars; and• is presented with values rounded to the nearest million dollars or, in certain cases, to the nearest thousand dollars in accordance
with ASIC Corporations (Rounding in Financial/Directors’ Reports) Instrument 2016/191.
New and amended Accounting Standards and Interpretations issued by the AASB that are now effective are detailed in note 8.1.
The Group has not adopted any Accounting Standards and Interpretations that have been issued or amended but are not yet effective.
The consolidated financial statements incorporate the assets and liabilities of all entities controlled by the company as at 31 December 2018 and the results for the financial year then ended. A list of entities controlled by the company at year end is contained in note 7.3.
In preparing the consolidated financial statements, all transactions between controlled entities are eliminated in full. Where control of an entity commences or ceases during a financial year, the results are included for that part of the year during which control existed.
Lloyd’s syndicates are accounted for on a proportional basis. The nature of Lloyd’s syndicates is such that, even when one party provides the majority of capital, the syndicate as a whole is not controlled for accounting purposes.
Oth
er in
form
ation
6
Perfo
rman
ce o
verv
iew
1
Bu
siness
review
2
Go
vern
ance
3
Directo
rs' R
epo
rt
4
QB
E In
suran
ce Gro
up
A
nn
ual R
epo
rt 2018
91F
inan
cial R
epo
rt
5
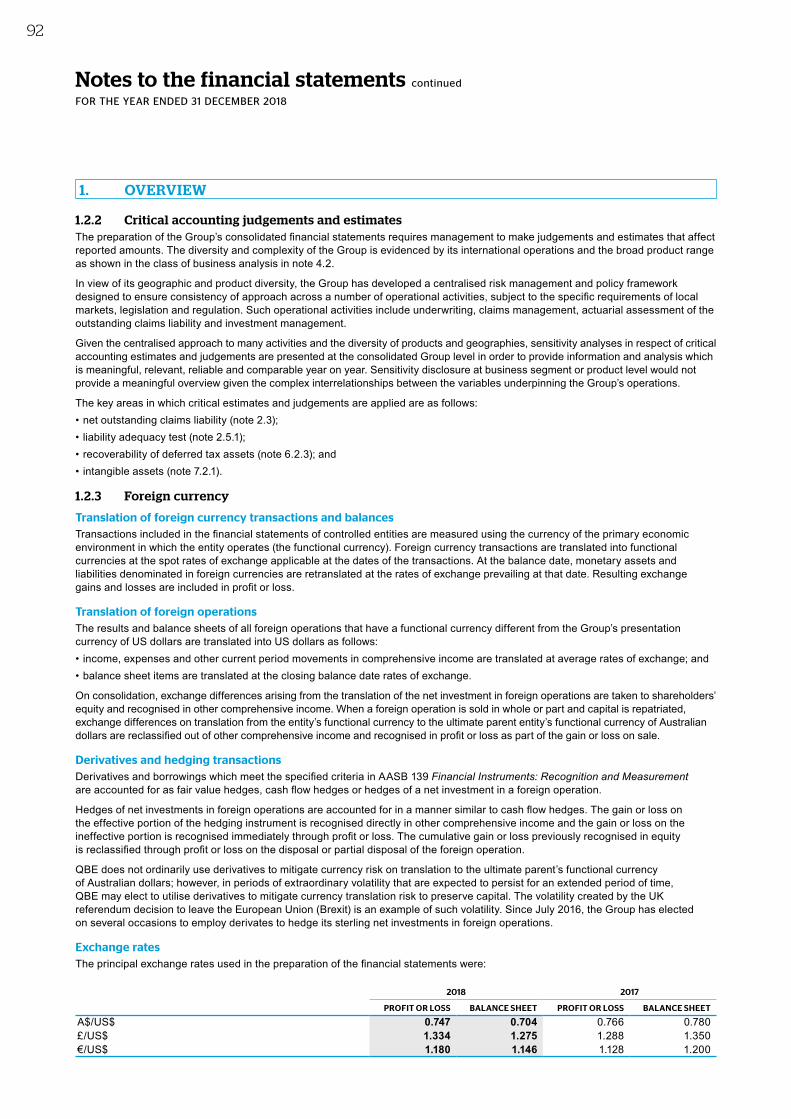
Notes to the financial statements continued
FOR THE YEAR ENDED 31 DECEMBER 2018
1.2.2 Critical accounting judgements and estimatesThe preparation of the Group’s consolidated financial statements requires management to make judgements and estimates that affect reported amounts. The diversity and complexity of the Group is evidenced by its international operations and the broad product range as shown in the class of business analysis in note 4.2.
In view of its geographic and product diversity, the Group has developed a centralised risk management and policy framework designed to ensure consistency of approach across a number of operational activities, subject to the specific requirements of local markets, legislation and regulation. Such operational activities include underwriting, claims management, actuarial assessment of the outstanding claims liability and investment management.
Given the centralised approach to many activities and the diversity of products and geographies, sensitivity analyses in respect of critical accounting estimates and judgements are presented at the consolidated Group level in order to provide information and analysis which is meaningful, relevant, reliable and comparable year on year. Sensitivity disclosure at business segment or product level would not provide a meaningful overview given the complex interrelationships between the variables underpinning the Group’s operations.
The key areas in which critical estimates and judgements are applied are as follows:• net outstanding claims liability (note 2.3);• liability adequacy test (note 2.5.1);• recoverability of deferred tax assets (note 6.2.3); and• intangible assets (note 7.2.1).
1.2.3 Foreign currency
Translation of foreign currency transactions and balancesTransactions included in the financial statements of controlled entities are measured using the currency of the primary economic environment in which the entity operates (the functional currency). Foreign currency transactions are translated into functional currencies at the spot rates of exchange applicable at the dates of the transactions. At the balance date, monetary assets and liabilities denominated in foreign currencies are retranslated at the rates of exchange prevailing at that date. Resulting exchange gains and losses are included in profit or loss.
Translation of foreign operationsThe results and balance sheets of all foreign operations that have a functional currency different from the Group’s presentation currency of US dollars are translated into US dollars as follows:• income, expenses and other current period movements in comprehensive income are translated at average rates of exchange; and • balance sheet items are translated at the closing balance date rates of exchange.
On consolidation, exchange differences arising from the translation of the net investment in foreign operations are taken to shareholders’ equity and recognised in other comprehensive income. When a foreign operation is sold in whole or part and capital is repatriated, exchange differences on translation from the entity’s functional currency to the ultimate parent entity’s functional currency of Australian dollars are reclassified out of other comprehensive income and recognised in profit or loss as part of the gain or loss on sale.
Derivatives and hedging transactionsDerivatives and borrowings which meet the specified criteria in AASB 139 Financial Instruments: Recognition and Measurement are accounted for as fair value hedges, cash flow hedges or hedges of a net investment in a foreign operation.
Hedges of net investments in foreign operations are accounted for in a manner similar to cash flow hedges. The gain or loss on the effective portion of the hedging instrument is recognised directly in other comprehensive income and the gain or loss on the ineffective portion is recognised immediately through profit or loss. The cumulative gain or loss previously recognised in equity is reclassified through profit or loss on the disposal or partial disposal of the foreign operation.
QBE does not ordinarily use derivatives to mitigate currency risk on translation to the ultimate parent’s functional currency of Australian dollars; however, in periods of extraordinary volatility that are expected to persist for an extended period of time, QBE may elect to utilise derivatives to mitigate currency translation risk to preserve capital. The volatility created by the UK referendum decision to leave the European Union (Brexit) is an example of such volatility. Since July 2016, the Group has elected on several occasions to employ derivates to hedge its sterling net investments in foreign operations.
Exchange ratesThe principal exchange rates used in the preparation of the financial statements were:
2018 2017
PROFIT OR LOSS BALANCE SHEET PROFIT OR LOSS BALANCE SHEET
A$/US$ 0.747 0.704 0.766 0.780£/US$ 1.334 1.275 1.288 1.350€/US$ 1.180 1.146 1.128 1.200
1. OVERVIEW
92
1.3 Segment information
OverviewThe segment note provides information by operating division to assist the understanding of the Group’s performance. The operating segments are consistent with the basis on which information is provided to the Group Executive for measuring performance and determining the allocation of capital, being the basis upon which the Group’s underwriting products and services are managed within the various markets in which QBE operates.
Operating segmentsThe Group’s operating segments are as follows:• North American Operations writes general insurance and reinsurance business in the US.• European Operations writes general insurance business principally in the UK, Canada and throughout mainland
Europe; both general insurance and reinsurance business through Lloyd’s of London; and worldwide reinsurance business through offices in the UK, Ireland, Bermuda and mainland Europe.
• Australian & New Zealand Operations primarily underwrites general insurance risks throughout Australia and New Zealand, providing all major lines of insurance for personal and commercial risks.
• Asia Pacific Operations provides personal, commercial and specialist general insurance covers throughout the Asia Pacific region.
• Equator Re is based in Bermuda and provides reinsurance protection to related entities. Inward premium received by Equator Re is principally derived from within the Group and is eliminated on consolidation.
Divisional management results are reported before corporate quota share reinsurances to Equator Re which exist to optimise capital management across the Group.
Corporate & Other includes non-operating holding companies that do not form part of the Group’s insurance operations; gains or losses on disposals except those relating to discontinued operations (refer note 7.1.1); financing costs; and amortisation of any intangibles which are not allocated to a specific operating segment. It also includes consolidation adjustments and internal reinsurance eliminations. Following the disposal of the Group's operations in Thailand, the results of Thailand for the current period are also presented in Corporate & Other.
This note includes the results of continuing operations only. Latin American Operations is classified as a discontinued operation and is therefore excluded from this note. The results of discontinued operations are presented in note 7.1.3.
Intersegment transactions are priced on an arm’s length basis and are eliminated on consolidation.
For future reporting periods, consistent with the way information is reported to the Group Executive from 1 January 2019:
• the Group’s entities in Asia will be combined with European Operations to form a new International operating segment;• the Group’s entities in the Pacific will be combined with Australian & New Zealand Operations to form a new Australia
Pacific operating segment; and• Equator Re will no longer be identified as a separate operating segment and will instead be incorporated into the
results of the other reportable segments.
Oth
er in
form
ation
6
Perfo
rman
ce o
verv
iew
1
Bu
siness
review
2
Go
vern
ance
3
Directo
rs' R
epo
rt
4
QB
E In
suran
ce Gro
up
A
nn
ual R
epo
rt 2018
93F
inan
cial R
epo
rt
5
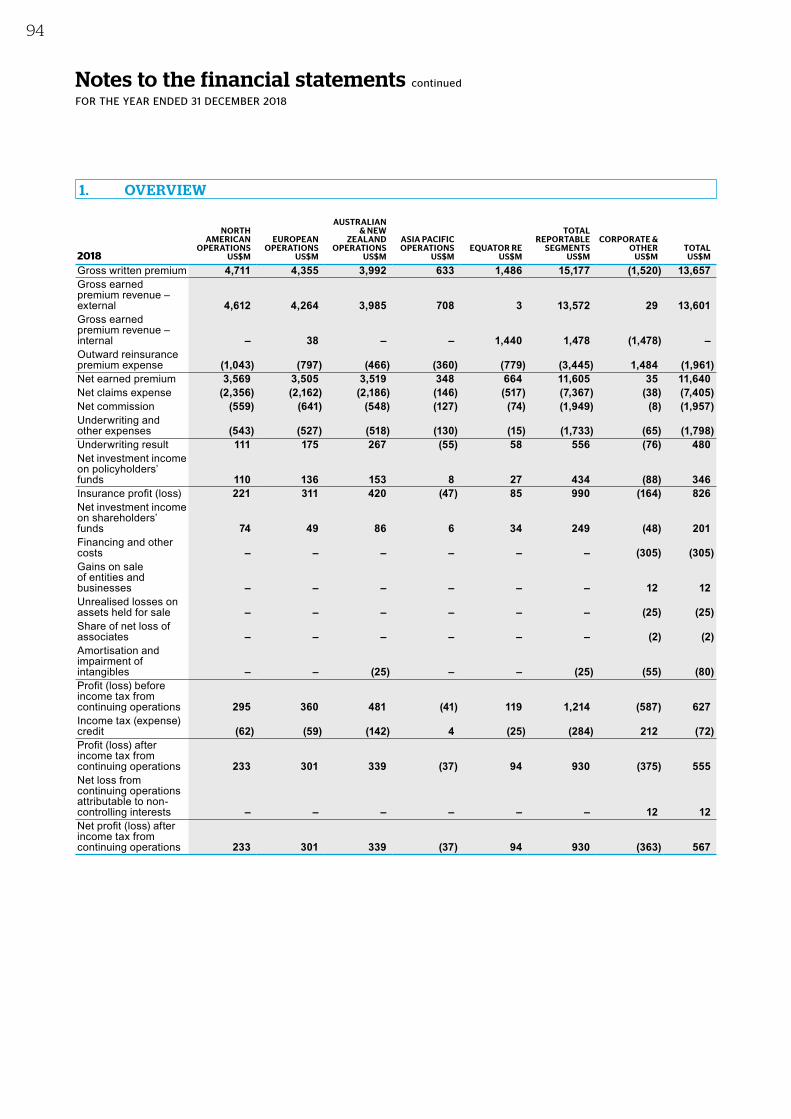
Notes to the financial statements continued
FOR THE YEAR ENDED 31 DECEMBER 2018
2018
NORTH AMERICAN
OPERATIONS US$M
EUROPEAN OPERATIONS
US$M
AUSTRALIAN & NEW
ZEALAND OPERATIONS
US$M
ASIA PACIFIC OPERATIONS
US$MEQUATOR RE
US$M
TOTAL REPORTABLE
SEGMENTS US$M
CORPORATE & OTHER
US$MTOTAL
US$M
Gross written premium 4,711 4,355 3,992 633 1,486 15,177 (1,520) 13,657Gross earned premium revenue – external 4,612 4,264 3,985 708 3 13,572 29 13,601Gross earned premium revenue – internal – 38 – – 1,440 1,478 (1,478) – Outward reinsurance premium expense (1,043) (797) (466) (360) (779) (3,445) 1,484 (1,961)Net earned premium 3,569 3,505 3,519 348 664 11,605 35 11,640Net claims expense (2,356) (2,162) (2,186) (146) (517) (7,367) (38) (7,405)Net commission (559) (641) (548) (127) (74) (1,949) (8) (1,957)Underwriting and other expenses (543) (527) (518) (130) (15) (1,733) (65) (1,798)Underwriting result 111 175 267 (55) 58 556 (76) 480Net investment income on policyholders’ funds 110 136 153 8 27 434 (88) 346Insurance profit (loss) 221 311 420 (47) 85 990 (164) 826Net investment income on shareholders’ funds 74 49 86 6 34 249 (48) 201Financing and other costs – – – – – – (305) (305)Gains on sale of entities and businesses – – – – – – 12 12Unrealised losses on assets held for sale – – – – – – (25) (25)Share of net loss of associates – – – – – – (2) (2)Amortisation and impairment of intangibles – – (25) – – (25) (55) (80)Profit (loss) before income tax from continuing operations 295 360 481 (41) 119 1,214 (587) 627Income tax (expense) credit (62) (59) (142) 4 (25) (284) 212 (72)Profit (loss) after income tax from continuing operations 233 301 339 (37) 94 930 (375) 555Net loss from continuing operations attributable to non-controlling interests – – – – – – 12 12Net profit (loss) after income tax from continuing operations 233 301 339 (37) 94 930 (363) 567
1. OVERVIEW
94
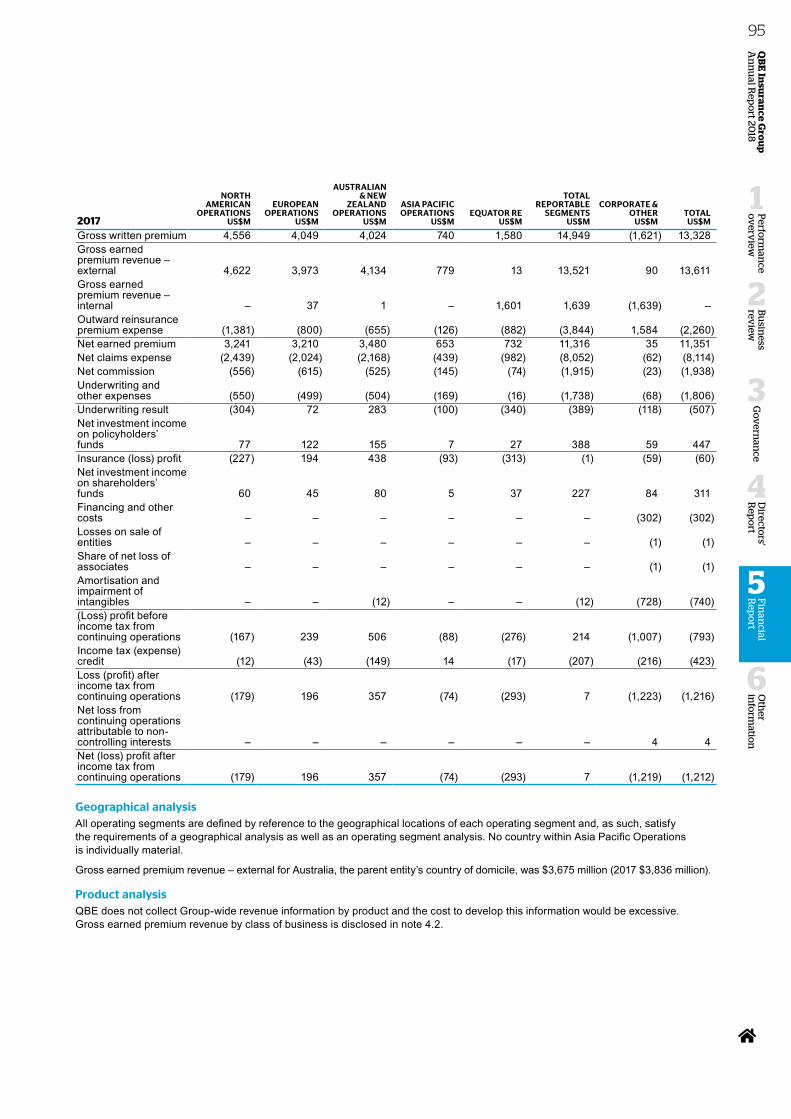
2017
NORTH AMERICAN
OPERATIONS US$M
EUROPEAN OPERATIONS
US$M
AUSTRALIAN & NEW
ZEALAND OPERATIONS
US$M
ASIA PACIFIC OPERATIONS
US$MEQUATOR RE
US$M
TOTAL REPORTABLE
SEGMENTS US$M
CORPORATE & OTHER
US$MTOTAL
US$M
Gross written premium 4,556 4,049 4,024 740 1,580 14,949 (1,621) 13,328Gross earned premium revenue – external 4,622 3,973 4,134 779 13 13,521 90 13,611Gross earned premium revenue – internal – 37 1 – 1,601 1,639 (1,639) – Outward reinsurance premium expense (1,381) (800) (655) (126) (882) (3,844) 1,584 (2,260)Net earned premium 3,241 3,210 3,480 653 732 11,316 35 11,351Net claims expense (2,439) (2,024) (2,168) (439) (982) (8,052) (62) (8,114)Net commission (556) (615) (525) (145) (74) (1,915) (23) (1,938)Underwriting and other expenses (550) (499) (504) (169) (16) (1,738) (68) (1,806)Underwriting result (304) 72 283 (100) (340) (389) (118) (507)Net investment income on policyholders’ funds 77 122 155 7 27 388 59 447Insurance (loss) profit (227) 194 438 (93) (313) (1) (59) (60)Net investment income on shareholders’ funds 60 45 80 5 37 227 84 311Financing and other costs – – – – – – (302) (302)Losses on sale of entities – – – – – – (1) (1)Share of net loss of associates – – – – – – (1) (1)Amortisation and impairment of intangibles – – (12) – – (12) (728) (740)(Loss) profit before income tax from continuing operations (167) 239 506 (88) (276) 214 (1,007) (793)Income tax (expense) credit (12) (43) (149) 14 (17) (207) (216) (423)Loss (profit) after income tax from continuing operations (179) 196 357 (74) (293) 7 (1,223) (1,216)Net loss from continuing operations attributable to non-controlling interests – – – – – – 4 4Net (loss) profit after income tax from continuing operations (179) 196 357 (74) (293) 7 (1,219) (1,212)
Geographical analysisAll operating segments are defined by reference to the geographical locations of each operating segment and, as such, satisfy the requirements of a geographical analysis as well as an operating segment analysis. No country within Asia Pacific Operations is individually material.
Gross earned premium revenue – external for Australia, the parent entity’s country of domicile, was $3,675 million (2017 $3,836 million).
Product analysisQBE does not collect Group-wide revenue information by product and the cost to develop this information would be excessive. Gross earned premium revenue by class of business is disclosed in note 4.2.
Oth
er in
form
ation
6
Perfo
rman
ce o
verv
iew
1
Bu
siness
review
2
Go
vern
ance
3
Directo
rs' R
epo
rt
4
QB
E In
suran
ce Gro
up
A
nn
ual R
epo
rt 2018
95F
inan
cial R
epo
rt
5
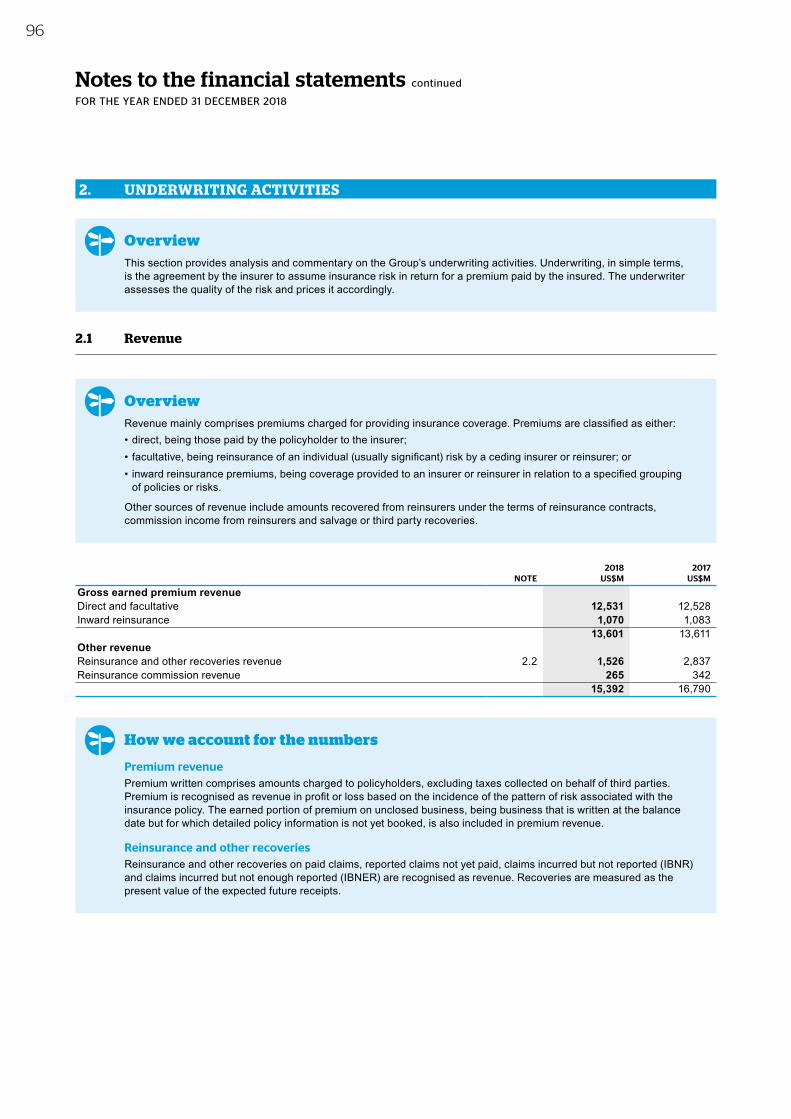
Notes to the financial statements continued
FOR THE YEAR ENDED 31 DECEMBER 2018
2. UNDERWRITING ACTIVITIES
OverviewThis section provides analysis and commentary on the Group’s underwriting activities. Underwriting, in simple terms, is the agreement by the insurer to assume insurance risk in return for a premium paid by the insured. The underwriter assesses the quality of the risk and prices it accordingly.
2.1 Revenue
OverviewRevenue mainly comprises premiums charged for providing insurance coverage. Premiums are classified as either:• direct, being those paid by the policyholder to the insurer;• facultative, being reinsurance of an individual (usually significant) risk by a ceding insurer or reinsurer; or• inward reinsurance premiums, being coverage provided to an insurer or reinsurer in relation to a specified grouping
of policies or risks.
Other sources of revenue include amounts recovered from reinsurers under the terms of reinsurance contracts, commission income from reinsurers and salvage or third party recoveries.
2018 2017NOTE US$M US$M
Gross earned premium revenueDirect and facultative 12,531 12,528Inward reinsurance 1,070 1,083
13,601 13,611Other revenueReinsurance and other recoveries revenue 2.2 1,526 2,837Reinsurance commission revenue 265 342
15,392 16,790
How we account for the numbers
Premium revenuePremium written comprises amounts charged to policyholders, excluding taxes collected on behalf of third parties. Premium is recognised as revenue in profit or loss based on the incidence of the pattern of risk associated with the insurance policy. The earned portion of premium on unclosed business, being business that is written at the balance date but for which detailed policy information is not yet booked, is also included in premium revenue.
Reinsurance and other recoveriesReinsurance and other recoveries on paid claims, reported claims not yet paid, claims incurred but not reported (IBNR) and claims incurred but not enough reported (IBNER) are recognised as revenue. Recoveries are measured as the present value of the expected future receipts.
96
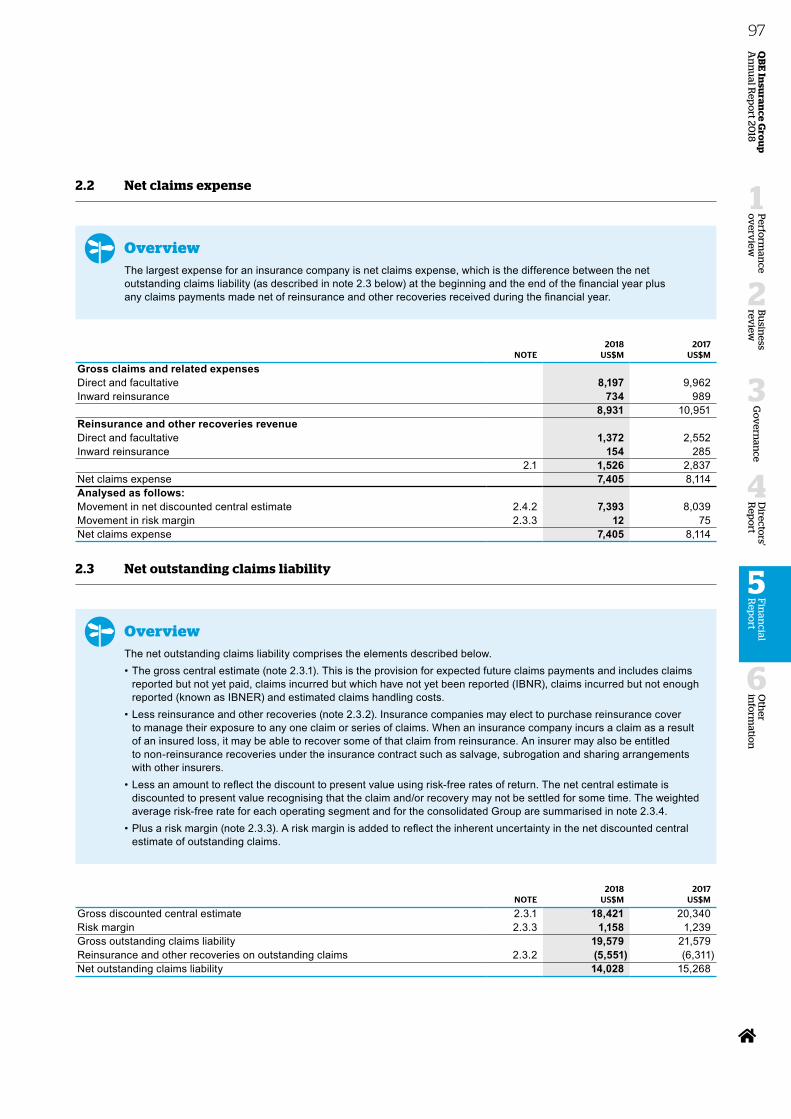
2.2 Net claims expense
OverviewThe largest expense for an insurance company is net claims expense, which is the difference between the net outstanding claims liability (as described in note 2.3 below) at the beginning and the end of the financial year plus any claims payments made net of reinsurance and other recoveries received during the financial year.
2018 2017NOTE US$M US$M
Gross claims and related expensesDirect and facultative 8,197 9,962Inward reinsurance 734 989
8,931 10,951Reinsurance and other recoveries revenueDirect and facultative 1,372 2,552Inward reinsurance 154 285
2.1 1,526 2,837Net claims expense 7,405 8,114Analysed as follows:Movement in net discounted central estimate 2.4.2 7,393 8,039Movement in risk margin 2.3.3 12 75Net claims expense 7,405 8,114
2.3 Net outstanding claims liability
OverviewThe net outstanding claims liability comprises the elements described below. • The gross central estimate (note 2.3.1). This is the provision for expected future claims payments and includes claims
reported but not yet paid, claims incurred but which have not yet been reported (IBNR), claims incurred but not enough reported (known as IBNER) and estimated claims handling costs.
• Less reinsurance and other recoveries (note 2.3.2). Insurance companies may elect to purchase reinsurance cover to manage their exposure to any one claim or series of claims. When an insurance company incurs a claim as a result of an insured loss, it may be able to recover some of that claim from reinsurance. An insurer may also be entitled to non-reinsurance recoveries under the insurance contract such as salvage, subrogation and sharing arrangements with other insurers.
• Less an amount to reflect the discount to present value using risk-free rates of return. The net central estimate is discounted to present value recognising that the claim and/or recovery may not be settled for some time. The weighted average risk-free rate for each operating segment and for the consolidated Group are summarised in note 2.3.4.
• Plus a risk margin (note 2.3.3). A risk margin is added to reflect the inherent uncertainty in the net discounted central estimate of outstanding claims.
2018 2017NOTE US$M US$M
Gross discounted central estimate 2.3.1 18,421 20,340Risk margin 2.3.3 1,158 1,239Gross outstanding claims liability 19,579 21,579Reinsurance and other recoveries on outstanding claims 2.3.2 (5,551) (6,311)Net outstanding claims liability 14,028 15,268
Oth
er in
form
ation
6
Perfo
rman
ce o
verv
iew
1
Bu
siness
review
2
Go
vern
ance
3
Directo
rs' R
epo
rt
4
QB
E In
suran
ce Gro
up
A
nn
ual R
epo
rt 2018
97F
inan
cial R
epo
rt
5
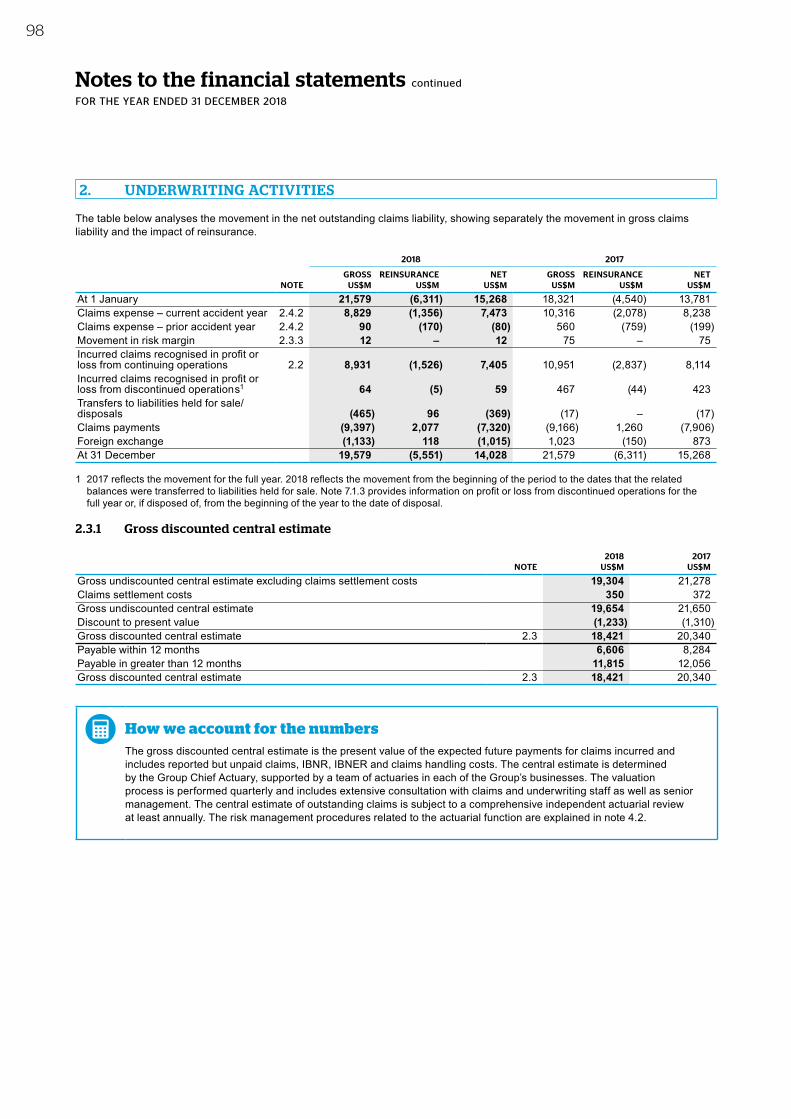
Notes to the financial statements continued
FOR THE YEAR ENDED 31 DECEMBER 2018
The table below analyses the movement in the net outstanding claims liability, showing separately the movement in gross claims liability and the impact of reinsurance.
2018 2017
GROSS REINSURANCE NET GROSS REINSURANCE NETNOTE US$M US$M US$M US$M US$M US$M
At 1 January 21,579 (6,311) 15,268 18,321 (4,540) 13,781Claims expense – current accident year 2.4.2 8,829 (1,356) 7,473 10,316 (2,078) 8,238Claims expense – prior accident year 2.4.2 90 (170) (80) 560 (759) (199)Movement in risk margin 2.3.3 12 – 12 75 – 75Incurred claims recognised in profit or loss from continuing operations 2.2 8,931 (1,526) 7,405 10,951 (2,837) 8,114Incurred claims recognised in profit or loss from discontinued operations1 64 (5) 59 467 (44) 423Transfers to liabilities held for sale/disposals (465) 96 (369) (17) – (17)Claims payments (9,397) 2,077 (7,320) (9,166) 1,260 (7,906)Foreign exchange (1,133) 118 (1,015) 1,023 (150) 873At 31 December 19,579 (5,551) 14,028 21,579 (6,311) 15,268
1 2017 reflects the movement for the full year. 2018 reflects the movement from the beginning of the period to the dates that the related balances were transferred to liabilities held for sale. Note 7.1.3 provides information on profit or loss from discontinued operations for the full year or, if disposed of, from the beginning of the year to the date of disposal.
2.3.1 Gross discounted central estimate
2018 2017NOTE US$M US$M
Gross undiscounted central estimate excluding claims settlement costs 19,304 21,278Claims settlement costs 350 372Gross undiscounted central estimate 19,654 21,650Discount to present value (1,233) (1,310)Gross discounted central estimate 2.3 18,421 20,340Payable within 12 months 6,606 8,284Payable in greater than 12 months 11,815 12,056Gross discounted central estimate 2.3 18,421 20,340
How we account for the numbersThe gross discounted central estimate is the present value of the expected future payments for claims incurred and includes reported but unpaid claims, IBNR, IBNER and claims handling costs. The central estimate is determined by the Group Chief Actuary, supported by a team of actuaries in each of the Group’s businesses. The valuation process is performed quarterly and includes extensive consultation with claims and underwriting staff as well as senior management. The central estimate of outstanding claims is subject to a comprehensive independent actuarial review at least annually. The risk management procedures related to the actuarial function are explained in note 4.2.
2. UNDERWRITING ACTIVITIES
98
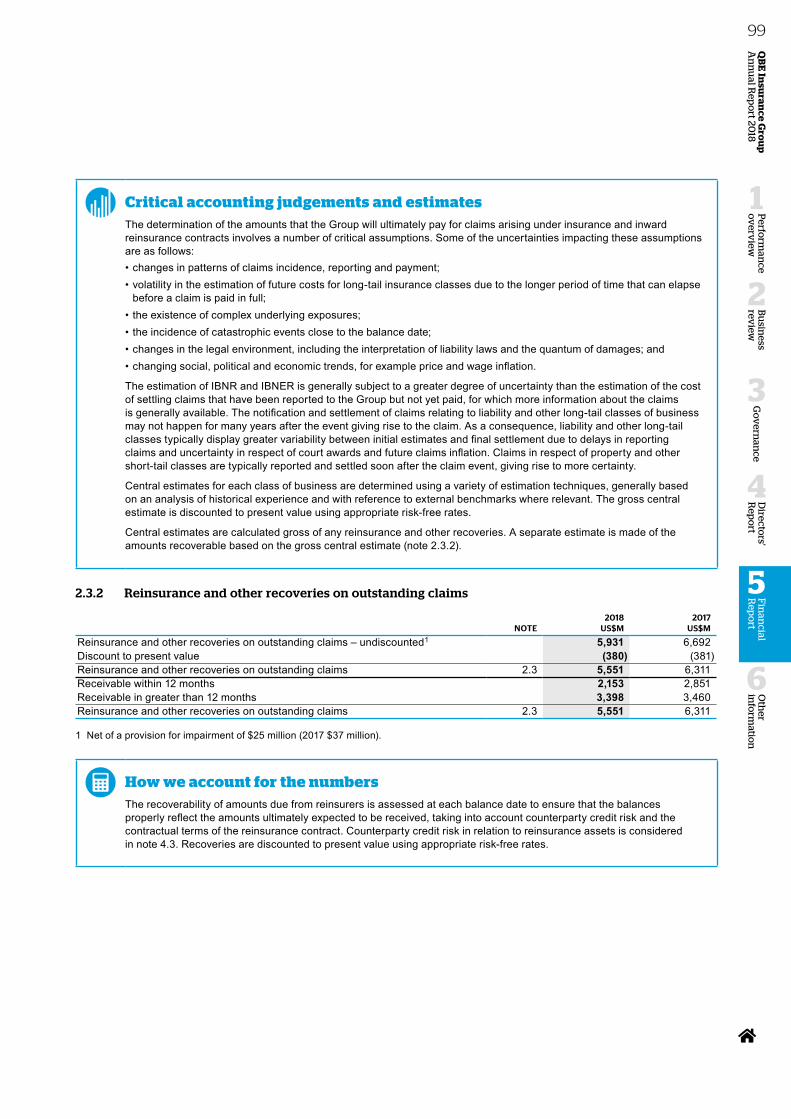
Critical accounting judgements and estimatesThe determination of the amounts that the Group will ultimately pay for claims arising under insurance and inward reinsurance contracts involves a number of critical assumptions. Some of the uncertainties impacting these assumptions are as follows:• changes in patterns of claims incidence, reporting and payment;• volatility in the estimation of future costs for long-tail insurance classes due to the longer period of time that can elapse
before a claim is paid in full;• the existence of complex underlying exposures;• the incidence of catastrophic events close to the balance date;• changes in the legal environment, including the interpretation of liability laws and the quantum of damages; and• changing social, political and economic trends, for example price and wage inflation.
The estimation of IBNR and IBNER is generally subject to a greater degree of uncertainty than the estimation of the cost of settling claims that have been reported to the Group but not yet paid, for which more information about the claims is generally available. The notification and settlement of claims relating to liability and other long-tail classes of business may not happen for many years after the event giving rise to the claim. As a consequence, liability and other long-tail classes typically display greater variability between initial estimates and final settlement due to delays in reporting claims and uncertainty in respect of court awards and future claims inflation. Claims in respect of property and other short-tail classes are typically reported and settled soon after the claim event, giving rise to more certainty.
Central estimates for each class of business are determined using a variety of estimation techniques, generally based on an analysis of historical experience and with reference to external benchmarks where relevant. The gross central estimate is discounted to present value using appropriate risk-free rates.
Central estimates are calculated gross of any reinsurance and other recoveries. A separate estimate is made of the amounts recoverable based on the gross central estimate (note 2.3.2).
2.3.2 Reinsurance and other recoveries on outstanding claims
2018 2017NOTE US$M US$M
Reinsurance and other recoveries on outstanding claims – undiscounted1 5,931 6,692Discount to present value (380) (381)Reinsurance and other recoveries on outstanding claims 2.3 5,551 6,311Receivable within 12 months 2,153 2,851Receivable in greater than 12 months 3,398 3,460Reinsurance and other recoveries on outstanding claims 2.3 5,551 6,311
1 Net of a provision for impairment of $25 million (2017 $37 million).
How we account for the numbersThe recoverability of amounts due from reinsurers is assessed at each balance date to ensure that the balances properly reflect the amounts ultimately expected to be received, taking into account counterparty credit risk and the contractual terms of the reinsurance contract. Counterparty credit risk in relation to reinsurance assets is considered in note 4.3. Recoveries are discounted to present value using appropriate risk-free rates.
Oth
er in
form
ation
6
Perfo
rman
ce o
verv
iew
1
Bu
siness
review
2
Go
vern
ance
3
Directo
rs' R
epo
rt
4
QB
E In
suran
ce Gro
up
A
nn
ual R
epo
rt 2018
99F
inan
cial R
epo
rt
5
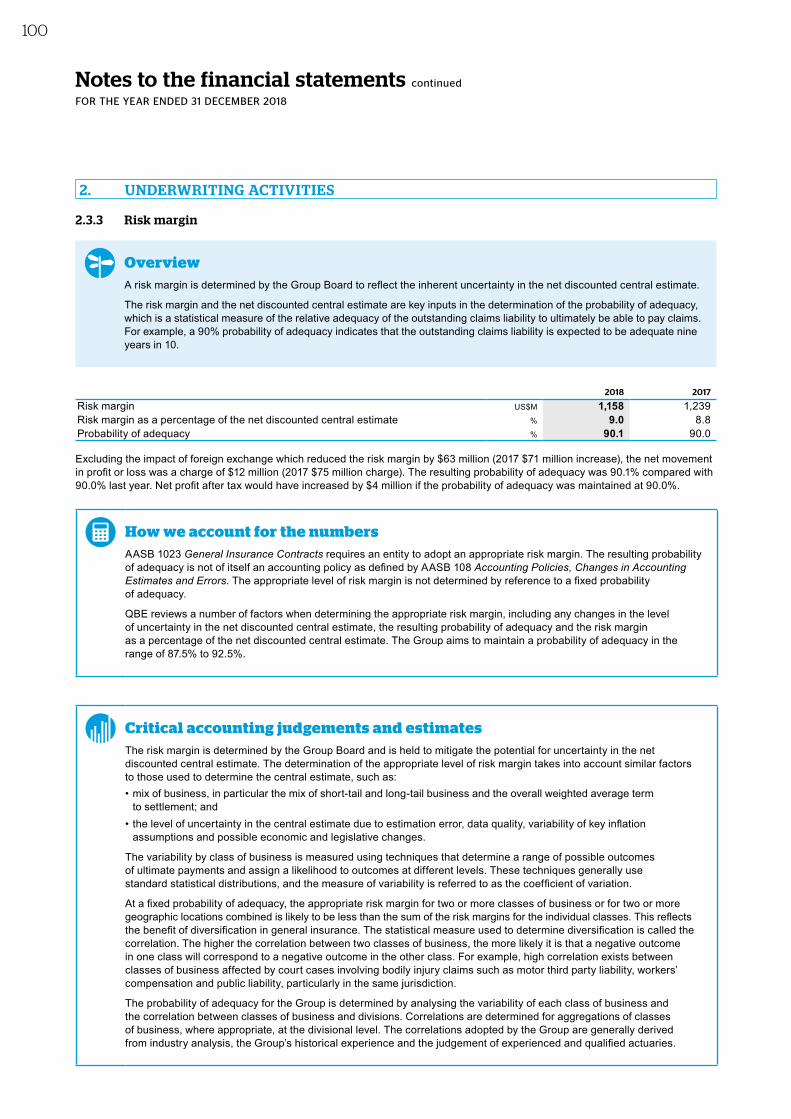
Notes to the financial statements continued
FOR THE YEAR ENDED 31 DECEMBER 2018
2.3.3 Risk margin
OverviewA risk margin is determined by the Group Board to reflect the inherent uncertainty in the net discounted central estimate.
The risk margin and the net discounted central estimate are key inputs in the determination of the probability of adequacy, which is a statistical measure of the relative adequacy of the outstanding claims liability to ultimately be able to pay claims. For example, a 90% probability of adequacy indicates that the outstanding claims liability is expected to be adequate nine years in 10.
2018 2017
Risk margin US$M 1,158 1,239 Risk margin as a percentage of the net discounted central estimate % 9.0 8.8 Probability of adequacy % 90.1 90.0
Excluding the impact of foreign exchange which reduced the risk margin by $63 million (2017 $71 million increase), the net movement in profit or loss was a charge of $12 million (2017 $75 million charge). The resulting probability of adequacy was 90.1% compared with 90.0% last year. Net profit after tax would have increased by $4 million if the probability of adequacy was maintained at 90.0%.
How we account for the numbersAASB 1023 General Insurance Contracts requires an entity to adopt an appropriate risk margin. The resulting probability of adequacy is not of itself an accounting policy as defined by AASB 108 Accounting Policies, Changes in Accounting Estimates and Errors. The appropriate level of risk margin is not determined by reference to a fixed probability of adequacy.
QBE reviews a number of factors when determining the appropriate risk margin, including any changes in the level of uncertainty in the net discounted central estimate, the resulting probability of adequacy and the risk margin as a percentage of the net discounted central estimate. The Group aims to maintain a probability of adequacy in the range of 87.5% to 92.5%.
Critical accounting judgements and estimatesThe risk margin is determined by the Group Board and is held to mitigate the potential for uncertainty in the net discounted central estimate. The determination of the appropriate level of risk margin takes into account similar factors to those used to determine the central estimate, such as: • mix of business, in particular the mix of short-tail and long-tail business and the overall weighted average term
to settlement; and • the level of uncertainty in the central estimate due to estimation error, data quality, variability of key inflation
assumptions and possible economic and legislative changes.
The variability by class of business is measured using techniques that determine a range of possible outcomes of ultimate payments and assign a likelihood to outcomes at different levels. These techniques generally use standard statistical distributions, and the measure of variability is referred to as the coefficient of variation.
At a fixed probability of adequacy, the appropriate risk margin for two or more classes of business or for two or more geographic locations combined is likely to be less than the sum of the risk margins for the individual classes. This reflects the benefit of diversification in general insurance. The statistical measure used to determine diversification is called the correlation. The higher the correlation between two classes of business, the more likely it is that a negative outcome in one class will correspond to a negative outcome in the other class. For example, high correlation exists between classes of business affected by court cases involving bodily injury claims such as motor third party liability, workers’ compensation and public liability, particularly in the same jurisdiction.
The probability of adequacy for the Group is determined by analysing the variability of each class of business and the correlation between classes of business and divisions. Correlations are determined for aggregations of classes of business, where appropriate, at the divisional level. The correlations adopted by the Group are generally derived from industry analysis, the Group’s historical experience and the judgement of experienced and qualified actuaries.
2. UNDERWRITING ACTIVITIES
100
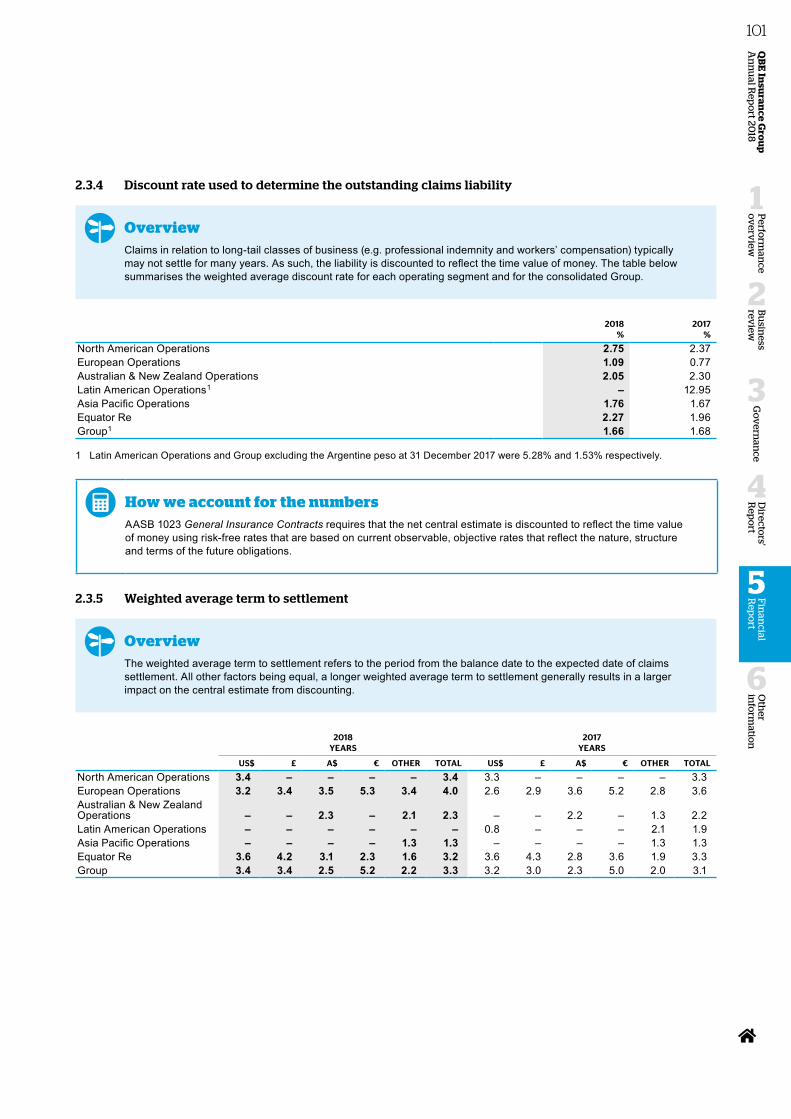
2.3.4 Discount rate used to determine the outstanding claims liability
OverviewClaims in relation to long-tail classes of business (e.g. professional indemnity and workers’ compensation) typically may not settle for many years. As such, the liability is discounted to reflect the time value of money. The table below summarises the weighted average discount rate for each operating segment and for the consolidated Group.
2018 2017% %
North American Operations 2.75 2.37 European Operations 1.09 0.77 Australian & New Zealand Operations 2.05 2.30 Latin American Operations1 – 12.95 Asia Pacific Operations 1.76 1.67 Equator Re 2.27 1.96 Group1 1.66 1.68
1 Latin American Operations and Group excluding the Argentine peso at 31 December 2017 were 5.28% and 1.53% respectively.
How we account for the numbersAASB 1023 General Insurance Contracts requires that the net central estimate is discounted to reflect the time value of money using risk-free rates that are based on current observable, objective rates that reflect the nature, structure and terms of the future obligations.
2.3.5 Weighted average term to settlement
OverviewThe weighted average term to settlement refers to the period from the balance date to the expected date of claims settlement. All other factors being equal, a longer weighted average term to settlement generally results in a larger impact on the central estimate from discounting.
2018 2017YEARS YEARS
US$ £ A$ € OTHER TOTAL US$ £ A$ € OTHER TOTAL
North American Operations 3.4 – – – – 3.4 3.3 – – – – 3.3European Operations 3.2 3.4 3.5 5.3 3.4 4.0 2.6 2.9 3.6 5.2 2.8 3.6Australian & New Zealand Operations – – 2.3 – 2.1 2.3 – – 2.2 – 1.3 2.2Latin American Operations – – – – – – 0.8 – – – 2.1 1.9Asia Pacific Operations – – – – 1.3 1.3 – – – – 1.3 1.3Equator Re 3.6 4.2 3.1 2.3 1.6 3.2 3.6 4.3 2.8 3.6 1.9 3.3Group 3.4 3.4 2.5 5.2 2.2 3.3 3.2 3.0 2.3 5.0 2.0 3.1
Oth
er in
form
ation
6
Perfo
rman
ce o
verv
iew
1
Bu
siness
review
2
Go
vern
ance
3
Directo
rs' R
epo
rt
4
QB
E In
suran
ce Gro
up
A
nn
ual R
epo
rt 2018
101F
inan
cial R
epo
rt
5
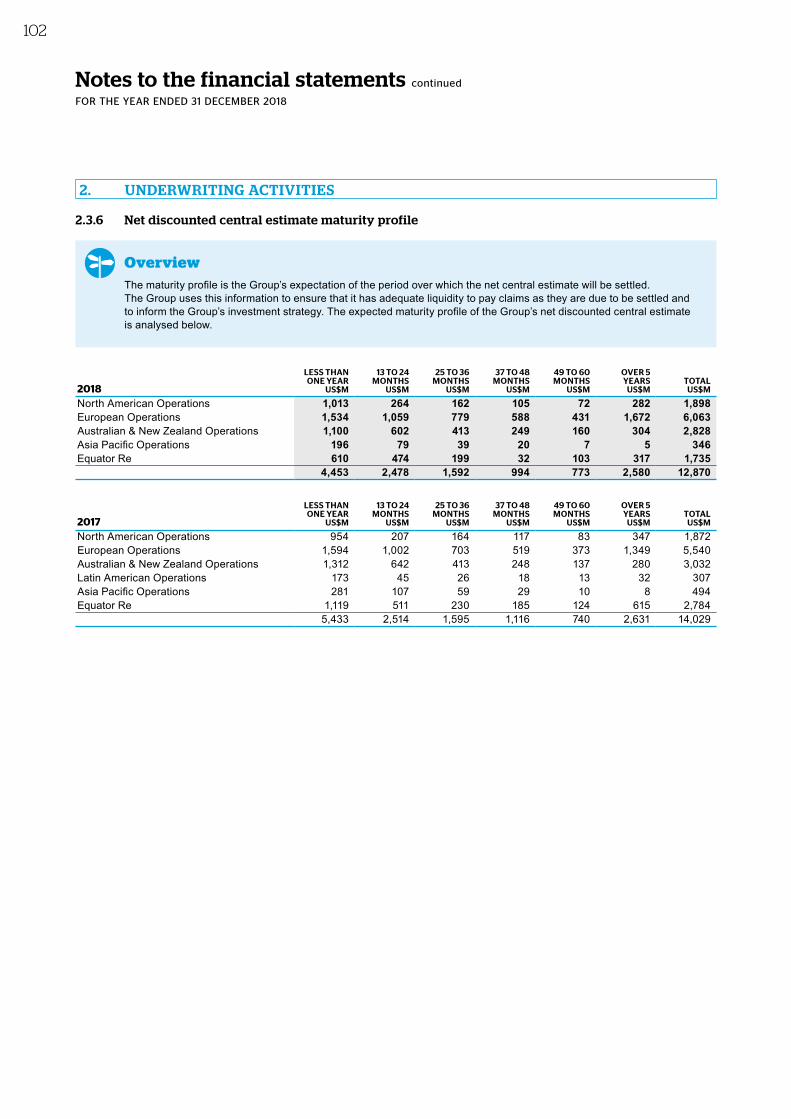
Notes to the financial statements continued
FOR THE YEAR ENDED 31 DECEMBER 2018
2.3.6 Net discounted central estimate maturity profile
OverviewThe maturity profile is the Group’s expectation of the period over which the net central estimate will be settled. The Group uses this information to ensure that it has adequate liquidity to pay claims as they are due to be settled and to inform the Group’s investment strategy. The expected maturity profile of the Group’s net discounted central estimate is analysed below.
2018
LESS THAN ONE YEAR
US$M
13 TO 24 MONTHS
US$M
25 TO 36 MONTHS
US$M
37 TO 48 MONTHS
US$M
49 TO 60 MONTHS
US$M
OVER 5 YEARS
US$MTOTAL
US$M
North American Operations 1,013 264 162 105 72 282 1,898European Operations 1,534 1,059 779 588 431 1,672 6,063Australian & New Zealand Operations 1,100 602 413 249 160 304 2,828Asia Pacific Operations 196 79 39 20 7 5 346Equator Re 610 474 199 32 103 317 1,735
4,453 2,478 1,592 994 773 2,580 12,870
2017
LESS THAN ONE YEAR
US$M
13 TO 24 MONTHS
US$M
25 TO 36 MONTHS
US$M
37 TO 48 MONTHS
US$M
49 TO 60 MONTHS
US$M
OVER 5 YEARS
US$MTOTAL
US$M
North American Operations 954 207 164 117 83 347 1,872European Operations 1,594 1,002 703 519 373 1,349 5,540Australian & New Zealand Operations 1,312 642 413 248 137 280 3,032Latin American Operations 173 45 26 18 13 32 307Asia Pacific Operations 281 107 59 29 10 8 494Equator Re 1,119 511 230 185 124 615 2,784
5,433 2,514 1,595 1,116 740 2,631 14,029
2. UNDERWRITING ACTIVITIES
102
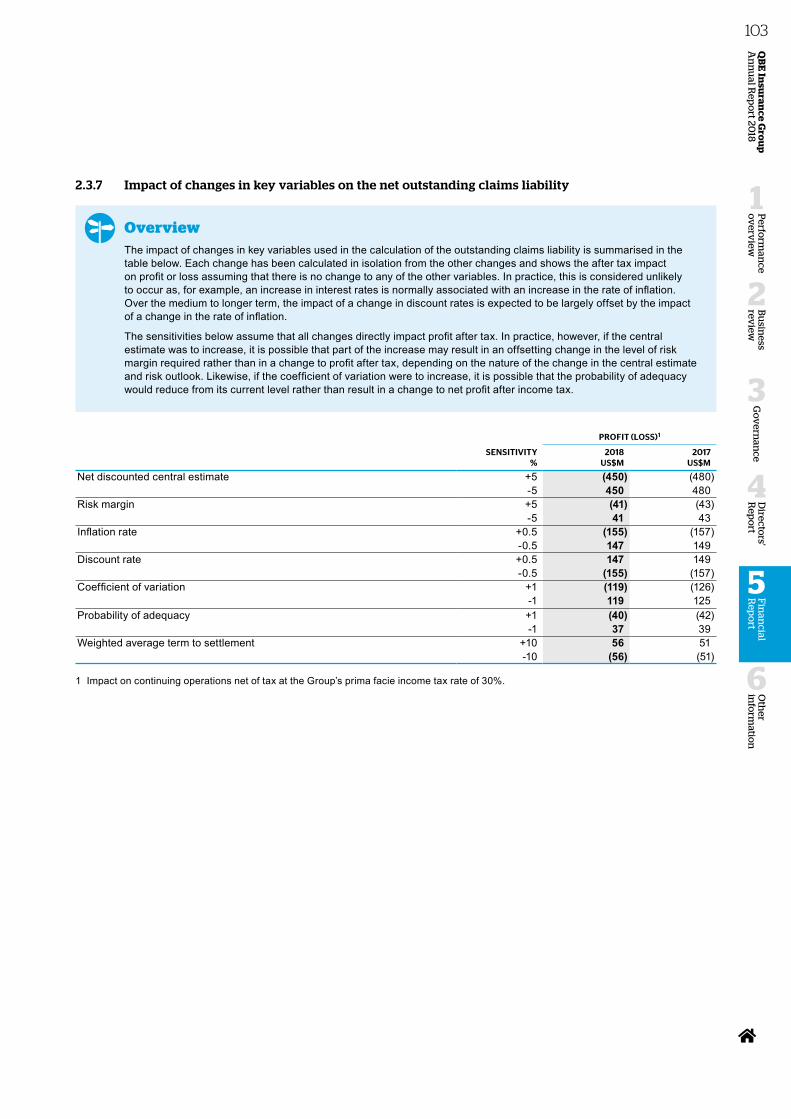
2.3.7 Impact of changes in key variables on the net outstanding claims liability
OverviewThe impact of changes in key variables used in the calculation of the outstanding claims liability is summarised in the table below. Each change has been calculated in isolation from the other changes and shows the after tax impact on profit or loss assuming that there is no change to any of the other variables. In practice, this is considered unlikely to occur as, for example, an increase in interest rates is normally associated with an increase in the rate of inflation. Over the medium to longer term, the impact of a change in discount rates is expected to be largely offset by the impact of a change in the rate of inflation.
The sensitivities below assume that all changes directly impact profit after tax. In practice, however, if the central estimate was to increase, it is possible that part of the increase may result in an offsetting change in the level of risk margin required rather than in a change to profit after tax, depending on the nature of the change in the central estimate and risk outlook. Likewise, if the coefficient of variation were to increase, it is possible that the probability of adequacy would reduce from its current level rather than result in a change to net profit after income tax.
PROFIT (LOSS)1
SENSITIVITY 2018 2017% US$M US$M
Net discounted central estimate +5 (450) (480)-5 450 480
Risk margin +5 (41) (43)-5 41 43
Inflation rate +0.5 (155) (157)-0.5 147 149
Discount rate +0.5 147 149-0.5 (155) (157)
Coefficient of variation +1 (119) (126)-1 119 125
Probability of adequacy +1 (40) (42)-1 37 39
Weighted average term to settlement +10 56 51-10 (56) (51)
1 Impact on continuing operations net of tax at the Group’s prima facie income tax rate of 30%.
Oth
er in
form
ation
6
Perfo
rman
ce o
verv
iew
1
Bu
siness
review
2
Go
vern
ance
3
Directo
rs' R
epo
rt
4
QB
E In
suran
ce Gro
up
A
nn
ual R
epo
rt 2018
103F
inan
cial R
epo
rt
5
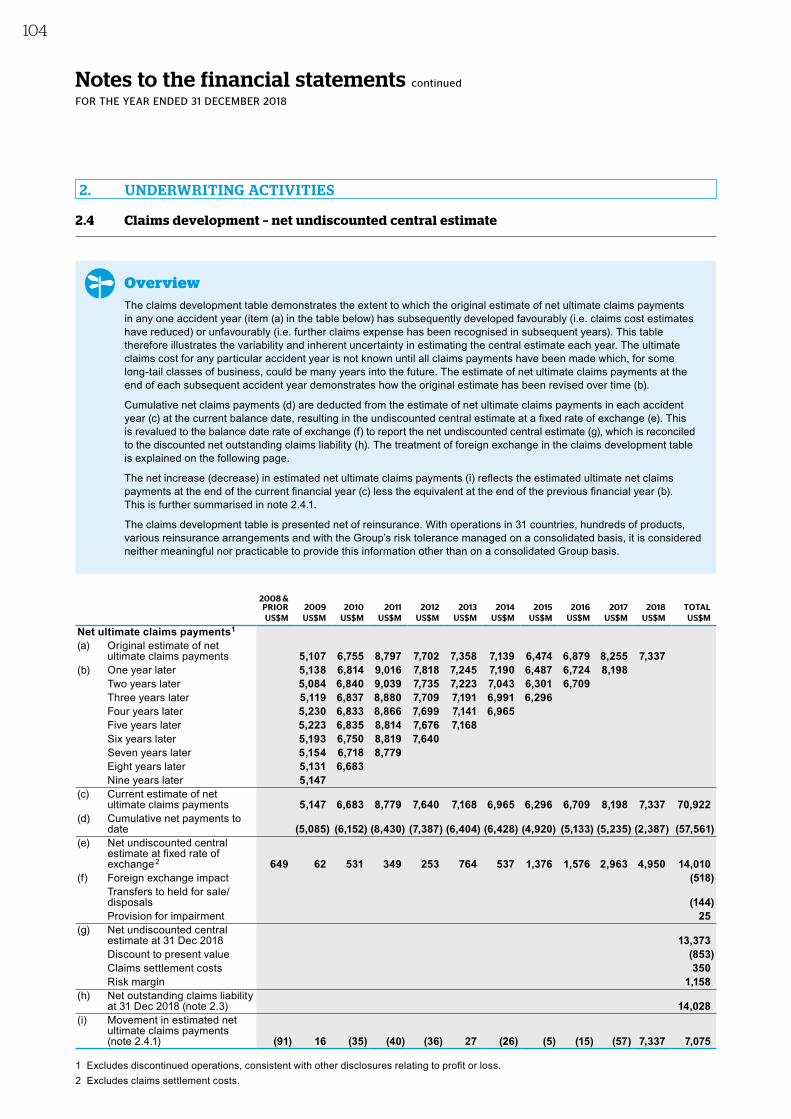
Notes to the financial statements continued
FOR THE YEAR ENDED 31 DECEMBER 2018
2.4 Claims development – net undiscounted central estimate
OverviewThe claims development table demonstrates the extent to which the original estimate of net ultimate claims payments in any one accident year (item (a) in the table below) has subsequently developed favourably (i.e. claims cost estimates have reduced) or unfavourably (i.e. further claims expense has been recognised in subsequent years). This table therefore illustrates the variability and inherent uncertainty in estimating the central estimate each year. The ultimate claims cost for any particular accident year is not known until all claims payments have been made which, for some long-tail classes of business, could be many years into the future. The estimate of net ultimate claims payments at the end of each subsequent accident year demonstrates how the original estimate has been revised over time (b).
Cumulative net claims payments (d) are deducted from the estimate of net ultimate claims payments in each accident year (c) at the current balance date, resulting in the undiscounted central estimate at a fixed rate of exchange (e). This is revalued to the balance date rate of exchange (f) to report the net undiscounted central estimate (g), which is reconciled to the discounted net outstanding claims liability (h). The treatment of foreign exchange in the claims development table is explained on the following page.
The net increase (decrease) in estimated net ultimate claims payments (i) reflects the estimated ultimate net claims payments at the end of the current financial year (c) less the equivalent at the end of the previous financial year (b). This is further summarised in note 2.4.1.
The claims development table is presented net of reinsurance. With operations in 31 countries, hundreds of products, various reinsurance arrangements and with the Group’s risk tolerance managed on a consolidated basis, it is considered neither meaningful nor practicable to provide this information other than on a consolidated Group basis.
2008 & PRIOR 2009 2010 2011 2012 2013 2014 2015 2016 2017 2018 TOTALUS$M US$M US$M US$M US$M US$M US$M US$M US$M US$M US$M US$M
Net ultimate claims payments1
(a) Original estimate of net ultimate claims payments 5,107 6,755 8,797 7,702 7,358 7,139 6,474 6,879 8,255 7,337
(b) One year later 5,138 6,814 9,016 7,818 7,245 7,190 6,487 6,724 8,198Two years later 5,084 6,840 9,039 7,735 7,223 7,043 6,301 6,709Three years later 5,119 6,837 8,880 7,709 7,191 6,991 6,296Four years later 5,230 6,833 8,866 7,699 7,141 6,965Five years later 5,223 6,835 8,814 7,676 7,168Six years later 5,193 6,750 8,819 7,640Seven years later 5,154 6,718 8,779Eight years later 5,131 6,683Nine years later 5,147
(c) Current estimate of net ultimate claims payments 5,147 6,683 8,779 7,640 7,168 6,965 6,296 6,709 8,198 7,337 70,922
(d) Cumulative net payments to date (5,085) (6,152) (8,430) (7,387) (6,404) (6,428) (4,920) (5,133) (5,235) (2,387) (57,561)
(e) Net undiscounted central estimate at fixed rate of exchange2 649 62 531 349 253 764 537 1,376 1,576 2,963 4,950 14,010
(f) Foreign exchange impact (518)Transfers to held for sale/disposals (144)Provision for impairment 25
(g) Net undiscounted central estimate at 31 Dec 2018 13,373Discount to present value (853)Claims settlement costs 350Risk margin 1,158
(h) Net outstanding claims liability at 31 Dec 2018 (note 2.3) 14,028
(i) Movement in estimated net ultimate claims payments (note 2.4.1) (91) 16 (35) (40) (36) 27 (26) (5) (15) (57) 7,337 7,075
1 Excludes discontinued operations, consistent with other disclosures relating to profit or loss.2 Excludes claims settlement costs.
2. UNDERWRITING ACTIVITIES
104
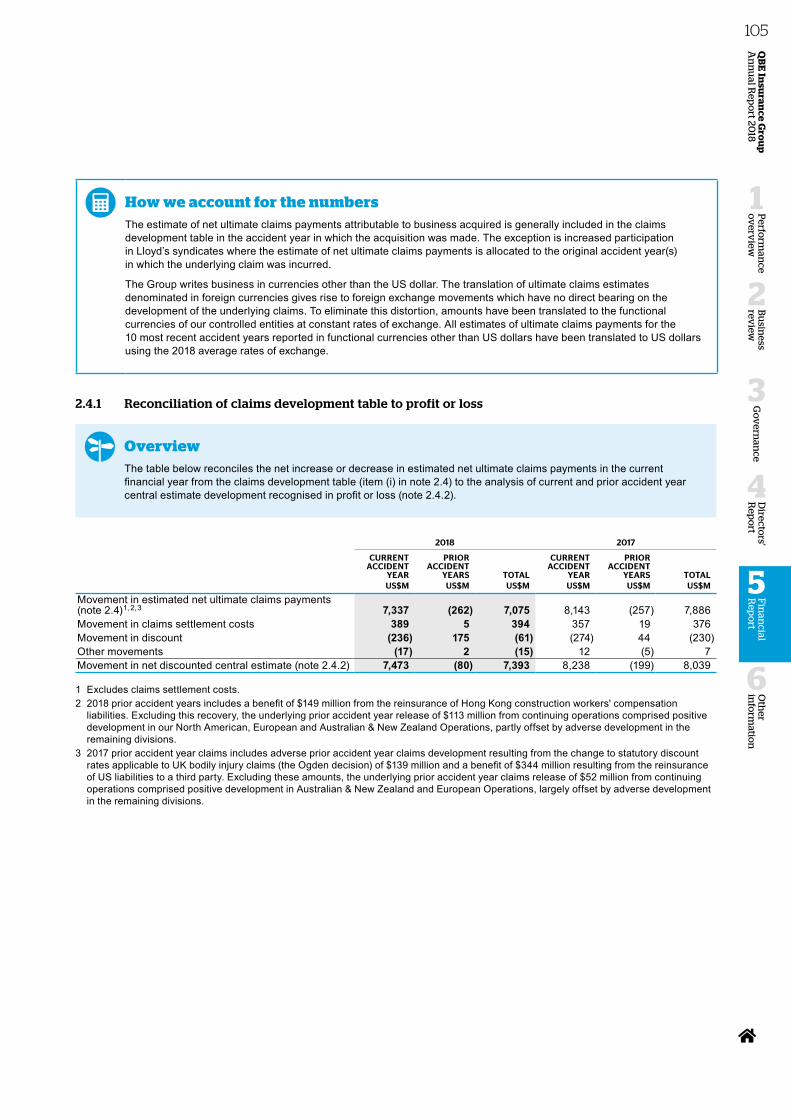
How we account for the numbersThe estimate of net ultimate claims payments attributable to business acquired is generally included in the claims development table in the accident year in which the acquisition was made. The exception is increased participation in Lloyd’s syndicates where the estimate of net ultimate claims payments is allocated to the original accident year(s) in which the underlying claim was incurred.
The Group writes business in currencies other than the US dollar. The translation of ultimate claims estimates denominated in foreign currencies gives rise to foreign exchange movements which have no direct bearing on the development of the underlying claims. To eliminate this distortion, amounts have been translated to the functional currencies of our controlled entities at constant rates of exchange. All estimates of ultimate claims payments for the 10 most recent accident years reported in functional currencies other than US dollars have been translated to US dollars using the 2018 average rates of exchange.
2.4.1 Reconciliation of claims development table to profit or loss
OverviewThe table below reconciles the net increase or decrease in estimated net ultimate claims payments in the current financial year from the claims development table (item (i) in note 2.4) to the analysis of current and prior accident year central estimate development recognised in profit or loss (note 2.4.2).
2018 2017
CURRENT ACCIDENT
YEAR
PRIOR ACCIDENT
YEARS TOTAL
CURRENT ACCIDENT
YEAR
PRIOR ACCIDENT
YEARS TOTALUS$M US$M US$M US$M US$M US$M
Movement in estimated net ultimate claims payments (note 2.4)1, 2,3 7,337 (262) 7,075 8,143 (257) 7,886Movement in claims settlement costs 389 5 394 357 19 376Movement in discount (236) 175 (61) (274) 44 (230)Other movements (17) 2 (15) 12 (5) 7Movement in net discounted central estimate (note 2.4.2) 7,473 (80) 7,393 8,238 (199) 8,039
1 Excludes claims settlement costs.2 2018 prior accident years includes a benefit of $149 million from the reinsurance of Hong Kong construction workers' compensation
liabilities. Excluding this recovery, the underlying prior accident year release of $113 million from continuing operations comprised positive development in our North American, European and Australian & New Zealand Operations, partly offset by adverse development in the remaining divisions.
3 2017 prior accident year claims includes adverse prior accident year claims development resulting from the change to statutory discount rates applicable to UK bodily injury claims (the Ogden decision) of $139 million and a benefit of $344 million resulting from the reinsurance of US liabilities to a third party. Excluding these amounts, the underlying prior accident year claims release of $52 million from continuing operations comprised positive development in Australian & New Zealand and European Operations, largely offset by adverse development in the remaining divisions.
Oth
er in
form
ation
6
Perfo
rman
ce o
verv
iew
1
Bu
siness
review
2
Go
vern
ance
3
Directo
rs' R
epo
rt
4
QB
E In
suran
ce Gro
up
A
nn
ual R
epo
rt 2018
105F
inan
cial R
epo
rt
5
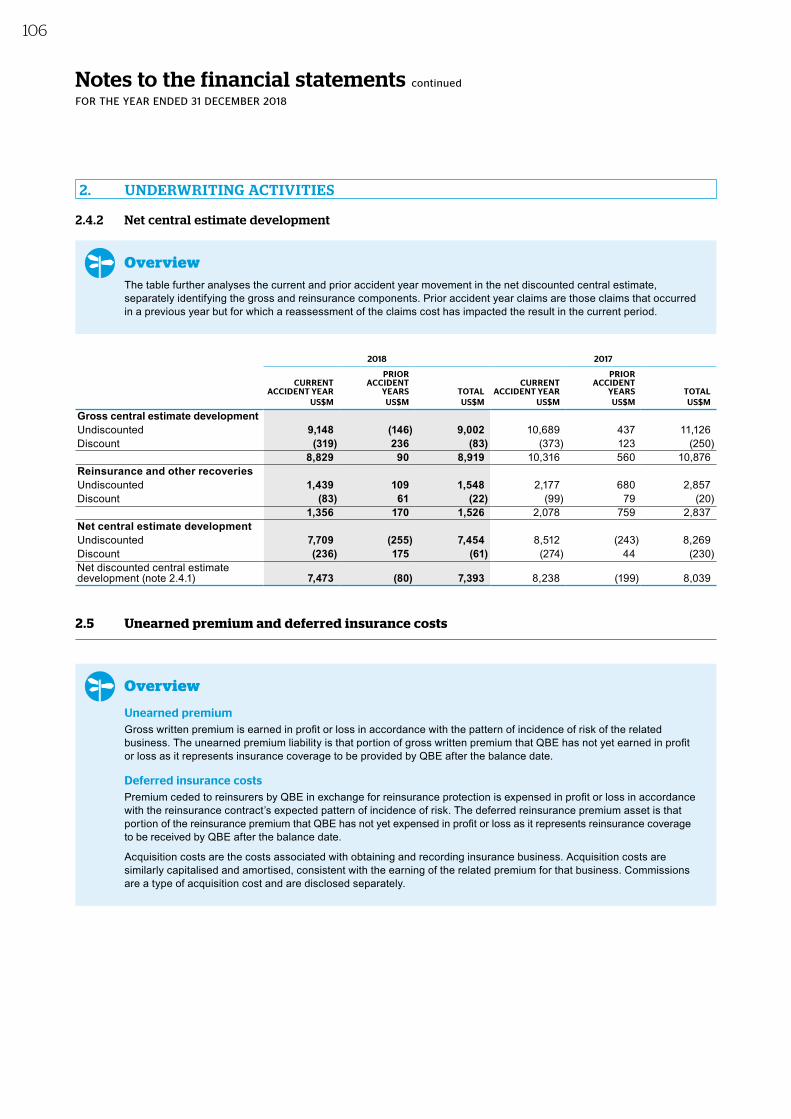
Notes to the financial statements continued
FOR THE YEAR ENDED 31 DECEMBER 2018
2.4.2 Net central estimate development
OverviewThe table further analyses the current and prior accident year movement in the net discounted central estimate, separately identifying the gross and reinsurance components. Prior accident year claims are those claims that occurred in a previous year but for which a reassessment of the claims cost has impacted the result in the current period.
2018 2017
CURRENT ACCIDENT YEAR
PRIOR ACCIDENT
YEARS TOTALCURRENT
ACCIDENT YEAR
PRIOR ACCIDENT
YEARS TOTALUS$M US$M US$M US$M US$M US$M
Gross central estimate development Undiscounted 9,148 (146) 9,002 10,689 437 11,126Discount (319) 236 (83) (373) 123 (250)
8,829 90 8,919 10,316 560 10,876Reinsurance and other recoveriesUndiscounted 1,439 109 1,548 2,177 680 2,857Discount (83) 61 (22) (99) 79 (20)
1,356 170 1,526 2,078 759 2,837Net central estimate developmentUndiscounted 7,709 (255) 7,454 8,512 (243) 8,269Discount (236) 175 (61) (274) 44 (230)Net discounted central estimate development (note 2.4.1) 7,473 (80) 7,393 8,238 (199) 8,039
2.5 Unearned premium and deferred insurance costs
Overview
Unearned premiumGross written premium is earned in profit or loss in accordance with the pattern of incidence of risk of the related business. The unearned premium liability is that portion of gross written premium that QBE has not yet earned in profit or loss as it represents insurance coverage to be provided by QBE after the balance date.
Deferred insurance costsPremium ceded to reinsurers by QBE in exchange for reinsurance protection is expensed in profit or loss in accordance with the reinsurance contract’s expected pattern of incidence of risk. The deferred reinsurance premium asset is that portion of the reinsurance premium that QBE has not yet expensed in profit or loss as it represents reinsurance coverage to be received by QBE after the balance date.
Acquisition costs are the costs associated with obtaining and recording insurance business. Acquisition costs are similarly capitalised and amortised, consistent with the earning of the related premium for that business. Commissions are a type of acquisition cost and are disclosed separately.
2. UNDERWRITING ACTIVITIES
106
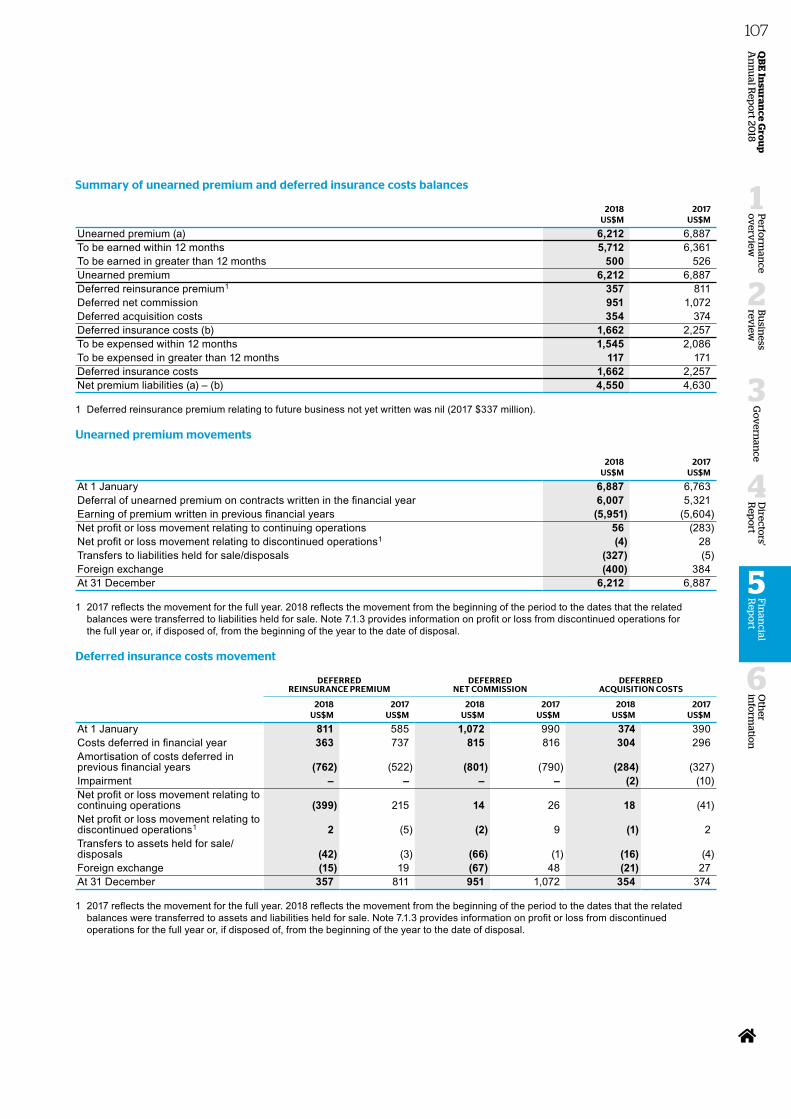
Summary of unearned premium and deferred insurance costs balances
2018 2017US$M US$M
Unearned premium (a) 6,212 6,887To be earned within 12 months 5,712 6,361To be earned in greater than 12 months 500 526Unearned premium 6,212 6,887Deferred reinsurance premium1 357 811Deferred net commission 951 1,072Deferred acquisition costs 354 374Deferred insurance costs (b) 1,662 2,257To be expensed within 12 months 1,545 2,086To be expensed in greater than 12 months 117 171Deferred insurance costs 1,662 2,257Net premium liabilities (a) – (b) 4,550 4,630
1 Deferred reinsurance premium relating to future business not yet written was nil (2017 $337 million).
Unearned premium movements
2018 2017US$M US$M
At 1 January 6,887 6,763Deferral of unearned premium on contracts written in the financial year 6,007 5,321Earning of premium written in previous financial years (5,951) (5,604)Net profit or loss movement relating to continuing operations 56 (283)Net profit or loss movement relating to discontinued operations1 (4) 28Transfers to liabilities held for sale/disposals (327) (5)Foreign exchange (400) 384At 31 December 6,212 6,887
1 2017 reflects the movement for the full year. 2018 reflects the movement from the beginning of the period to the dates that the related balances were transferred to liabilities held for sale. Note 7.1.3 provides information on profit or loss from discontinued operations for the full year or, if disposed of, from the beginning of the year to the date of disposal.
Deferred insurance costs movement
DEFERRED REINSURANCE PREMIUM
DEFERRED NET COMMISSION
DEFERRED ACQUISITION COSTS
2018 2017 2018 2017 2018 2017US$M US$M US$M US$M US$M US$M
At 1 January 811 585 1,072 990 374 390Costs deferred in financial year 363 737 815 816 304 296Amortisation of costs deferred in previous financial years (762) (522) (801) (790) (284) (327)Impairment – – – – (2) (10)Net profit or loss movement relating to continuing operations (399) 215 14 26 18 (41)Net profit or loss movement relating to discontinued operations1 2 (5) (2) 9 (1) 2Transfers to assets held for sale/disposals (42) (3) (66) (1) (16) (4)Foreign exchange (15) 19 (67) 48 (21) 27At 31 December 357 811 951 1,072 354 374
1 2017 reflects the movement for the full year. 2018 reflects the movement from the beginning of the period to the dates that the related balances were transferred to assets and liabilities held for sale. Note 7.1.3 provides information on profit or loss from discontinued operations for the full year or, if disposed of, from the beginning of the year to the date of disposal.
Oth
er in
form
ation
6
Perfo
rman
ce o
verv
iew
1
Bu
siness
review
2
Go
vern
ance
3
Directo
rs' R
epo
rt
4
QB
E In
suran
ce Gro
up
A
nn
ual R
epo
rt 2018
107F
inan
cial R
epo
rt
5
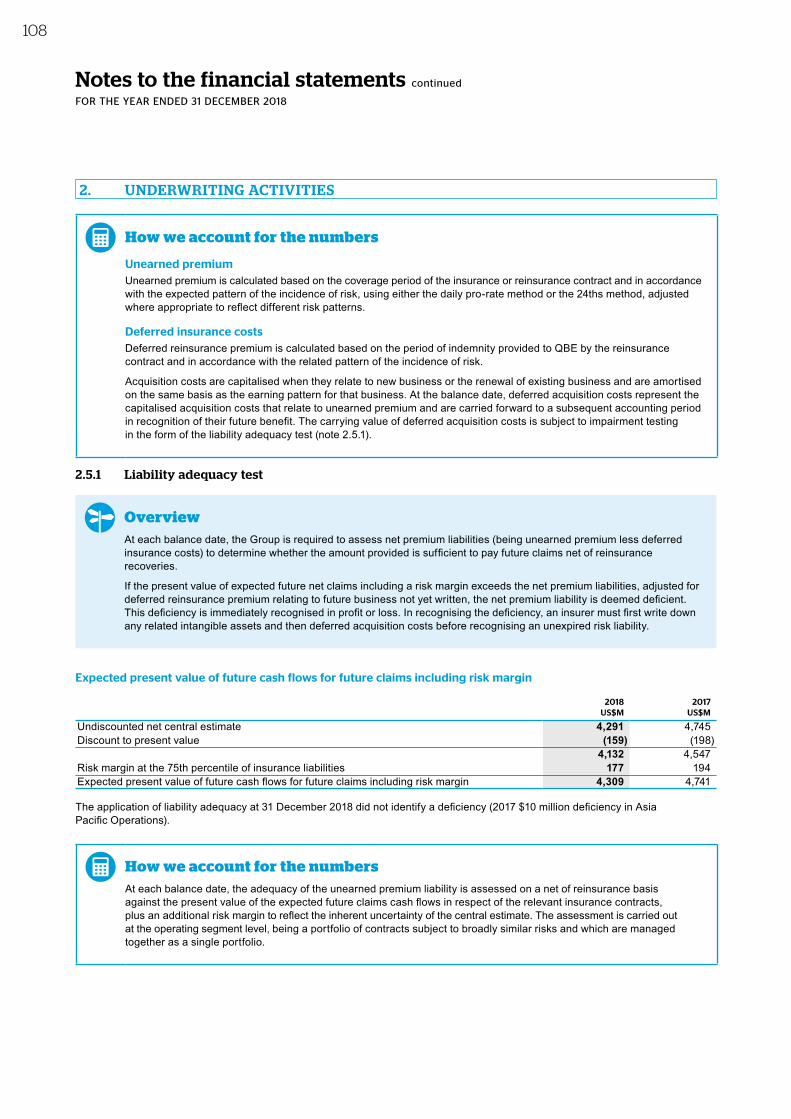
Notes to the financial statements continued
FOR THE YEAR ENDED 31 DECEMBER 2018
How we account for the numbers
Unearned premiumUnearned premium is calculated based on the coverage period of the insurance or reinsurance contract and in accordance with the expected pattern of the incidence of risk, using either the daily pro-rate method or the 24ths method, adjusted where appropriate to reflect different risk patterns.
Deferred insurance costsDeferred reinsurance premium is calculated based on the period of indemnity provided to QBE by the reinsurance contract and in accordance with the related pattern of the incidence of risk.
Acquisition costs are capitalised when they relate to new business or the renewal of existing business and are amortised on the same basis as the earning pattern for that business. At the balance date, deferred acquisition costs represent the capitalised acquisition costs that relate to unearned premium and are carried forward to a subsequent accounting period in recognition of their future benefit. The carrying value of deferred acquisition costs is subject to impairment testing in the form of the liability adequacy test (note 2.5.1).
2.5.1 Liability adequacy test
OverviewAt each balance date, the Group is required to assess net premium liabilities (being unearned premium less deferred insurance costs) to determine whether the amount provided is sufficient to pay future claims net of reinsurance recoveries.
If the present value of expected future net claims including a risk margin exceeds the net premium liabilities, adjusted for deferred reinsurance premium relating to future business not yet written, the net premium liability is deemed deficient. This deficiency is immediately recognised in profit or loss. In recognising the deficiency, an insurer must first write down any related intangible assets and then deferred acquisition costs before recognising an unexpired risk liability.
Expected present value of future cash flows for future claims including risk margin
2018 2017US$M US$M
Undiscounted net central estimate 4,291 4,745 Discount to present value (159) (198)
4,132 4,547 Risk margin at the 75th percentile of insurance liabilities 177 194 Expected present value of future cash flows for future claims including risk margin 4,309 4,741
The application of liability adequacy at 31 December 2018 did not identify a deficiency (2017 $10 million deficiency in Asia Pacific Operations).
How we account for the numbersAt each balance date, the adequacy of the unearned premium liability is assessed on a net of reinsurance basis against the present value of the expected future claims cash flows in respect of the relevant insurance contracts, plus an additional risk margin to reflect the inherent uncertainty of the central estimate. The assessment is carried out at the operating segment level, being a portfolio of contracts subject to broadly similar risks and which are managed together as a single portfolio.
2. UNDERWRITING ACTIVITIES
108
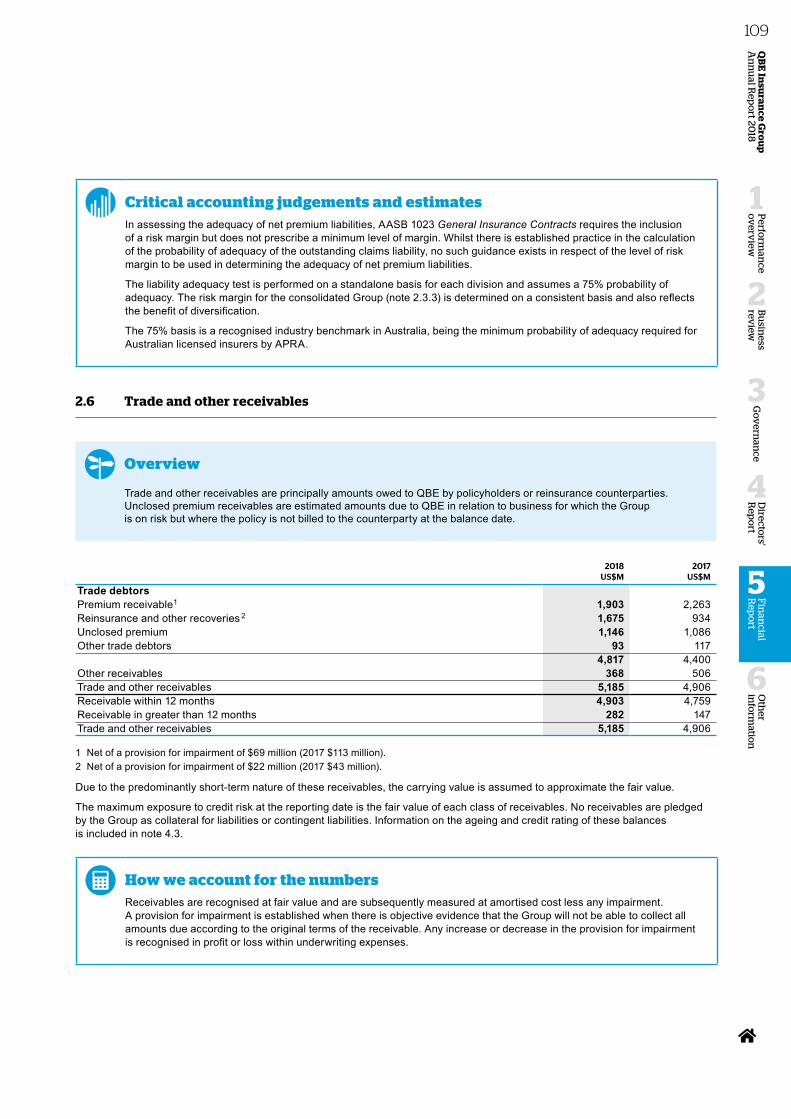
Critical accounting judgements and estimatesIn assessing the adequacy of net premium liabilities, AASB 1023 General Insurance Contracts requires the inclusion of a risk margin but does not prescribe a minimum level of margin. Whilst there is established practice in the calculation of the probability of adequacy of the outstanding claims liability, no such guidance exists in respect of the level of risk margin to be used in determining the adequacy of net premium liabilities.
The liability adequacy test is performed on a standalone basis for each division and assumes a 75% probability of adequacy. The risk margin for the consolidated Group (note 2.3.3) is determined on a consistent basis and also reflects the benefit of diversification.
The 75% basis is a recognised industry benchmark in Australia, being the minimum probability of adequacy required for Australian licensed insurers by APRA.
2.6 Trade and other receivables
Overview
Trade and other receivables are principally amounts owed to QBE by policyholders or reinsurance counterparties. Unclosed premium receivables are estimated amounts due to QBE in relation to business for which the Group is on risk but where the policy is not billed to the counterparty at the balance date.
2018 2017US$M US$M
Trade debtorsPremium receivable1 1,903 2,263 Reinsurance and other recoveries 2 1,675 934 Unclosed premium 1,146 1,086 Other trade debtors 93 117
4,817 4,400 Other receivables 368 506 Trade and other receivables 5,185 4,906 Receivable within 12 months 4,903 4,759 Receivable in greater than 12 months 282 147 Trade and other receivables 5,185 4,906
1 Net of a provision for impairment of $69 million (2017 $113 million).2 Net of a provision for impairment of $22 million (2017 $43 million).
Due to the predominantly short-term nature of these receivables, the carrying value is assumed to approximate the fair value.
The maximum exposure to credit risk at the reporting date is the fair value of each class of receivables. No receivables are pledged by the Group as collateral for liabilities or contingent liabilities. Information on the ageing and credit rating of these balances is included in note 4.3.
How we account for the numbersReceivables are recognised at fair value and are subsequently measured at amortised cost less any impairment. A provision for impairment is established when there is objective evidence that the Group will not be able to collect all amounts due according to the original terms of the receivable. Any increase or decrease in the provision for impairment is recognised in profit or loss within underwriting expenses.
Oth
er in
form
ation
6
Perfo
rman
ce o
verv
iew
1
Bu
siness
review
2
Go
vern
ance
3
Directo
rs' R
epo
rt
4
QB
E In
suran
ce Gro
up
A
nn
ual R
epo
rt 2018
109F
inan
cial R
epo
rt
5
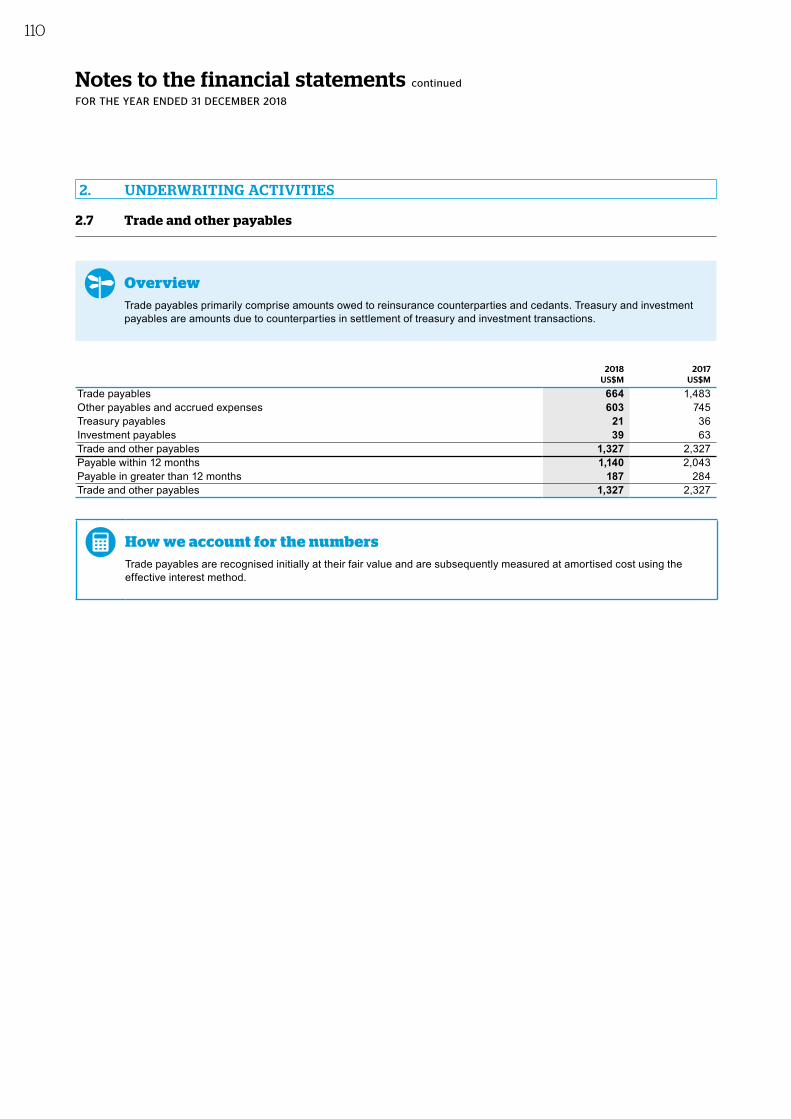
Notes to the financial statements continued
FOR THE YEAR ENDED 31 DECEMBER 2018
2.7 Trade and other payables
OverviewTrade payables primarily comprise amounts owed to reinsurance counterparties and cedants. Treasury and investment payables are amounts due to counterparties in settlement of treasury and investment transactions.
2018 2017US$M US$M
Trade payables 664 1,483 Other payables and accrued expenses 603 745 Treasury payables 21 36 Investment payables 39 63 Trade and other payables 1,327 2,327 Payable within 12 months 1,140 2,043 Payable in greater than 12 months 187 284 Trade and other payables 1,327 2,327
How we account for the numbersTrade payables are recognised initially at their fair value and are subsequently measured at amortised cost using the effective interest method.
2. UNDERWRITING ACTIVITIES
110
3. INVESTMENT ACTIVITIES
OverviewPremiums collected from policyholders are invested to meet the Group’s cash flow needs to pay claims and other expenses, as well as generating a return that contributes to the Group’s profitability. A sound investment strategy is therefore integral to the success of the Group’s operations.
The Group invests across a diversified range of instruments to achieve an appropriate balance between risk and return. Decisions on where to invest are dependent on expected returns, cash flow requirements of the Group, liquidity of the instrument, credit quality of the instrument and the overall risk appetite of the Group. Further details on the management of risk associated with investment assets can be found in note 4.
The Group’s investment assets are categorised as either backing policyholders’ or shareholders’ funds, with the former being investment assets which back insurance liabilities whilst the latter is comprised of all other investment assets.
3.1 Investment income
2018 2017US$M US$M
Income on growth assets 171 333 Income on fixed interest securities, short-term money and cash 387 461 Gross investment income1 558 794 Investment expenses (17) (18)Net investment income 541 776 Foreign exchange movement 1 (19)Other income 5 4 Other expenses – (3)Total investment income 547 758 Investment and other income – policyholders’ funds 357 458 Investment expenses – policyholders’ funds (11) (11)Investment and other income – shareholders’ funds 207 318 Investment expenses – shareholders’ funds (6) (7)Total investment income 547 758
1 Includes net fair value losses of $143 million (2017 gains of $184 million), interest income of $487 million (2017 $505 million) and dividend income of $214 million (2017 $105 million).
How we account for the numbersInterest income is recognised in the period in which it is earned. Dividends are recognised when the right to receive payment is established. Investment income includes realised and unrealised gains or losses on financial assets which are reported on a combined basis as fair value gains or losses on financial assets.
Oth
er in
form
ation
6
Perfo
rman
ce o
verv
iew
1
Bu
siness
review
2
Go
vern
ance
3
Directo
rs' R
epo
rt
4
QB
E In
suran
ce Gro
up
A
nn
ual R
epo
rt 2018
111F
inan
cial R
epo
rt
5
Notes to the financial statements continued
FOR THE YEAR ENDED 31 DECEMBER 2018
3.2 Investment assets
2018 2017US$M US$M
Fixed incomeShort-term money 1,283 3,462 Government bonds 4,975 5,576 Corporate bonds 12,144 13,243 Infrastructure debt 495 562 Unit trusts – 29
18,897 22,872 Growth assetsDeveloped market equity 565 520 Emerging market equity 289 110 Emerging market debt 234 – High yield debt 81 – Unlisted property trusts 913 1,082 Infrastructure assets 851 894 Private equity 159 76
3,092 2,682 Total investments 21,989 25,554 Amounts maturing within 12 months 3,034 5,951 Amounts maturing in greater than 12 months 18,955 19,603 Total investments 21,989 25,554
How we account for the numbers
Investments are designated as fair value through profit or loss. They are initially recognised at the cost of acquisition excluding transaction costs and are remeasured to fair value at each reporting date. The fair value hierarchy and the Group’s approach to measuring the fair value of each investment instrument is disclosed in note 3.2.1.
All purchases and sales of investments that require delivery of the asset within the time frame established by regulation or market convention are recognised at trade date, being the date on which the Group commits to buy or sell the asset. Investments are derecognised when the right to receive future cash flows from the asset has expired or has been transferred and the Group has transferred substantially all the risks and rewards of ownership.
3. INVESTMENT ACTIVITIES
112
3.2.1 Fair value hierarchy
OverviewThe Group Valuation Committee is responsible for the governance and oversight of the valuation process. The fair value of investments is determined in accordance with the Group’s investment valuation policy.
The investments of the Group are disclosed in the table below using a fair value hierarchy which reflects the significance of inputs into the determination of fair value as follows:
Level 1: Valuation is based on quoted prices in active markets for the same instruments.
Level 2: Valuation is based on quoted prices for identical instruments in markets which are not active, quoted prices for similar instruments, or valuation techniques for which all significant inputs are based on observable market data, for example, consensus pricing using broker quotes or valuation models with observable inputs.
Level 3: Valuation techniques are applied in which one or more significant inputs are not based on observable market data.
2018 2017
LEVEL 1 LEVEL 2 LEVEL 3 TOTAL LEVEL 1 LEVEL 2 LEVEL 3 TOTALUS$M US$M US$M US$M US$M US$M US$M US$M
Fixed incomeShort-term money 697 586 – 1,283 1,066 2,396 – 3,462Government bonds 3,609 1,366 – 4,975 3,337 2,238 1 5,576Corporate bonds – 12,140 4 12,144 – 13,221 22 13,243Infrastructure debt – 137 358 495 – 147 415 562Unit trusts – – – – – 29 – 29
4,306 14,229 362 18,897 4,403 18,031 438 22,872Growth assetsDeveloped market equity 563 – 2 565 518 – 2 520Emerging market equity 289 – – 289 – 110 – 110Emerging market debt 234 – – 234 – – – – High yield debt 81 – – 81 – – – – Unlisted property trusts – 913 – 913 – 1,082 – 1,082Infrastructure assets – – 851 851 – – 894 894Private equity – – 159 159 – – 76 76
1,167 913 1,012 3,092 518 1,192 972 2,682Total investments 5,473 15,142 1,374 21,989 4,921 19,223 1,410 25,554
The Group’s approach to measuring the fair value of investments is described below:
Short-term moneyTerm deposits are valued at par plus accrued interest and are categorised as level 1 fair value measurements. Other short-term money (bank bills, certificates of deposit, treasury bills and other short-term instruments) is priced using interest rates and yield curves observable at commonly quoted intervals.
Government bonds and corporate bondsBonds which are traded in active markets and have quoted prices from external data providers are categorised as level 1 fair value measurements. Bonds which are not traded in active markets are priced using broker quotes, comparable prices for similar instruments or pricing techniques set by local regulators or exchanges.
Infrastructure debtInfrastructure debt prices are sourced from the investment manager who may use a combination of observable market prices or comparable market prices where available and other valuation techniques.
Developed market equityListed equities traded in active markets are valued by reference to quoted bid prices. Unlisted equities are priced using QBE’s share of the net assets of the entity.
Oth
er in
form
ation
6
Perfo
rman
ce o
verv
iew
1
Bu
siness
review
2
Go
vern
ance
3
Directo
rs' R
epo
rt
4
QB
E In
suran
ce Gro
up
A
nn
ual R
epo
rt 2018
113F
inan
cial R
epo
rt
5
Notes to the financial statements continued
FOR THE YEAR ENDED 31 DECEMBER 2018
Emerging market equity, emerging market debt, high yield debt, unlisted property trusts, infrastructure assets and unit trustsThese assets are valued using quoted bid prices in active markets or current unit prices as advised by the responsible entity, trustee or equivalent of the investment management scheme.
Private equityThese assets comprise fund of funds vehicles. Fair value is based on the net asset value of the vehicle, and the responsibility for the valuation of the underlying securities lies with the external manager. In most cases, an independent administrator will be utilised by the external fund manager for pricing and valuation. A combination of observable market prices or comparable market prices (where available) and other valuation techniques may be used in the determination of fair value.
Movements in level 3 investments
The following table provides an analysis of investments valued with reference to level 3 inputs.
2018 2017LEVEL 3 US$M US$M
At 1 January 1,410 572 Purchases 522 856 Disposals (463) (88)Reclassifications to level 21 (19) –Fair value (losses) gains recognised in profit or loss from continuing operations (12) 37 Foreign exchange (64) 33 At 31 December 1,374 1,410
1 Corporate bonds were transferred from level 3 to level 2 due to the use of a more observable external price source.
3.2.2 Charges over investments and restrictions on useA controlled entity has given fixed and floating charges over certain of its investments and other assets in order to secure the obligations of the Group’s corporate members at Lloyd’s of London as described in note 8.2.
Included in investments are amounts totalling $2,530 million (2017 $2,941 million) which are held in Lloyd’s syndicate trust funds. In order to conduct underwriting business within some territories, Lloyd’s syndicates are required to lodge assets in locally regulated trust funds. Under Lloyd’s byelaws, these amounts can only be used to pay claims and allowable expenses of the syndicate and cannot be withdrawn from the trust funds until they become distributable as profit once annual solvency requirements are met. Included in this amount is $13 million (2017 $107 million) of short-term money.
3.2.3 Derivatives over investment assets
OverviewIn accordance with our investment management policies and procedures, derivatives may be used in the investment portfolio as both a hedging tool and to alter the risk profile of the portfolio. All long positions must be cash backed, all short positions must be covered by an underlying physical asset and no net short exposure to an asset class is permitted. Risk management policies over the use of derivatives are set out in note 4.
QBE may also have exposure to derivatives through investments in underlying pooled funds in accordance with the fund mandate. Those derivative exposures are not included in the table below.
The Group’s notional exposure to investment derivatives at the balance date is set out in the table below.
2018 2017NOTIONAL EXPOSURE US$M US$M
Equity futuresSPI 200 69 –
How we account for the numbersDerivatives over investment assets are initially recognised at fair value and are subsequently remeasured to fair value through profit or loss. For derivatives traded in an active market, the fair value of derivatives is determined by reference to quoted market prices. The mark to market value of futures positions are cash settled on a daily basis resulting in a fair value of nil at the balance date.
3. INVESTMENT ACTIVITIES
114
4. RISK MANAGEMENT
OverviewQBE is in the business of managing risk. The Group’s ability to satisfy customers’ risk management needs is central to what we do. QBE aims to generate wealth and maximise returns for its shareholders by pursuing opportunities that involve risk. Our people are responsible for ensuring that QBE’s risks are managed and controlled on a day to day basis. QBE aims to use its ability to properly manage risk to provide more certainty and improved outcomes for all stakeholders.
QBE applies a consistent and integrated approach to enterprise risk management (ERM). QBE’s global risk management framework sets out the approach to managing key risks and meeting strategic objectives whilst taking into account the creation of value for our shareholders. QBE’s risk management framework is articulated in the Risk Management Strategy (RMS) and Reinsurance Management Strategy (REMS), both of which are approved annually by the Group Board and lodged with APRA.
The framework consists of complementary elements that are embedded throughout the business management cycle and culture of the organisation. Key aspects include: risk appetite, governance, reporting, risk assessments, modelling and stress testing, management and monitoring and risk culture.
Risk management is a continuous process and an integral part of robust business management. QBE’s approach is to integrate risk management into the broader management processes of the organisation. It is QBE’s philosophy to ensure that risk management remains embedded in the business and that the risk makers or risk takers are themselves the risk managers. Specifically, the management of risk must occur at each point in the business management cycle.
QBE Group’s strategy for managing risk is to:• achieve competitive advantage by better understanding the risk environments in which we operate; • give confidence to the business to make objective, risk-based decisions to optimise returns; and• avoid unwelcome surprises to the achievement of business objectives by reducing uncertainty and volatility through the
identification and management of risks.
The framework is supported by a suite of policies that detail QBE’s approach to the key risk categories used by QBE to classify risk: • Strategic risk (note 4.1)• Insurance risk (note 4.2)• Credit risk (note 4.3)• Market risk (note 4.4)• Liquidity risk (note 4.5)• Operational risk (note 4.6)• Group risk (note 4.7).
Oth
er in
form
ation
6
Perfo
rman
ce o
verv
iew
1
Bu
siness
review
2
Go
vern
ance
3
Directo
rs' R
epo
rt
4
QB
E In
suran
ce Gro
up
A
nn
ual R
epo
rt 2018
115F
inan
cial R
epo
rt
5
Notes to the financial statements continued
FOR THE YEAR ENDED 31 DECEMBER 2018
4.1 Strategic risk
OverviewStrategic risk is the current and prospective impact on earnings and/or capital arising from strategic business decisions and responsiveness to external change. QBE classifies strategic risk into five subcategories, as follows:• business, product, market and distribution approach;• capital structure and management;• acquisition decision and negotiation;• tax planning and decisioning; and• investment strategy.
QBE’s approach to managing strategic risk is underpinned by the Group strategic risk appetite statement as set by the Group Board and is summarised below.
Business, product, market and distribution approachBusiness: The Group is a geographically diversified international general insurance and reinsurance group, underwriting most major commercial and personal lines classes of business through operations in 31 countries. The Group Board and the board of each division meet at least quarterly to review performance against business plans. Actual results are monitored and analysed regularly at various levels in the Group, including through the cell review process, to identify adverse trends so that remedial action can be taken at an early stage. One of the key tools used to ensure achievement of business plans is to identify our "manage to" likely scenarios impacting the plan year based on events that have occurred or risks identified since plans were set. We assess how these scenarios would impact return on equity (ROE) forecasts and develop and implement bridging actions to drive plan achievability.
Product: QBE reviews the structuring of its insurance products on an ongoing basis in line with market expectations and developments, legislation and claims trends.
Market and distribution approach: QBE makes use of distributed networks of insurance agents and brokers to undertake sales and marketing of its insurance products. The Group also markets and distributes insurance products directly by phone and on the internet.
Capital structure and managementThe Capital Management Plan (CMP) outlines QBE Group’s approach for ensuring adequate Group capital is maintained over time and for monitoring compliance with regulatory capital requirements and targets. The CMP is a key component of the Internal Capital Adequacy Assessment Process (ICAAP) and includes:• specific capital targets set in the context of QBE Group’s risk profile, the Board’s risk appetite and regulatory capital requirements;• plans for how target levels of capital are to be met; and• potential sources of additional capital, if required.
The CMP also sets out QBE Group’s actions and procedures for monitoring compliance with its regulatory capital requirements and capital targets. These include:• the setting of triggers to alert management to potential breaches of these requirements; and• actions to avert and rectify potential breaches of these requirements.
Management has a particular focus on the following performance indicators:• The Group actively manages the components of capital in order to maintain a level of eligible regulatory capital that exceeds APRA
requirements. Having determined that the current Group risk appetite remains appropriate, the Board has set the target level of regulatory capital for 2019 at 1.6–1.8 times (2018 1.6–1.8 times) the Prescribed Capital Amount (PCA).
• All regulated wholly-owned entities are required to maintain a minimum level of capital to meet obligations to policyholders. It is the Group’s policy that each regulated entity maintains a capital base appropriate to its size, business mix, complexity and risk profile which fully complies with and meets or exceeds local regulatory requirements.
• The Group aims to maintain the ratio of borrowings to shareholders’ funds at 25%–35% (2017 25%–35%). As at the balance date, the ratio of borrowings to shareholders’ funds was 38.0% (2017 40.8%), down from 2017 mainly due to the benefit of liability management initiatives offset by the impact of foreign exchange.
• Insurer financial strength ratings provided by the major rating agencies which indicate the Group’s financial strength and claims paying ability.
4. RISK MANAGEMENT
116
Acquisition decision and negotiationQBE’s approach to managing acquisition decision and negotiation is underpinned by the Group Acquisition and Disposal Manual. QBE’s growth strategy is based on a combination of organic and inorganic growth. QBE’s approach to inorganic growth/acquisitions is based on the principle that QBE will only acquire businesses that are aligned with our strategic intent and direction and which will contribute to the achievement of our corporate ambition. QBE regularly undertakes reviews of the performance and profitability of its business units and periodically will seek to undertake disposals of assets, businesses or portfolios.
Tax planning and decisioningQBE’s approach to managing taxation risk is underpinned by the QBE Group Tax Risk Management Framework, which is approved by the Group Board.
QBE’s approach to tax management is based on the following guiding principles:• QBE seeks open, honest and transparent relationships with tax authorities in all relevant jurisdictions;• QBE will comply with all applicable tax laws, regulations and disclosure requirements and pay the amount of tax that is legally
required to be paid in all the jurisdictions in which QBE operates;• QBE engages in efficient tax planning that supports our business and reflects commercial and economic activity – no transaction
will be entered into where obtaining a tax benefit is the primary purpose; and• QBE conducts transactions between Group companies on an arm’s length basis in accordance with current Organisation for
Economic Cooperation and Development (OECD) principles.
Investment strategyQBE’s approach to investment risk is underpinned by the Group’s investment strategy, which is designed to strike an appropriate balance between the return objectives of the organisation and QBE’s appetite for earnings volatility and capital consumption.
Climate changeAs discussed in the climate change action plan on pages 36 to 41, climate change is a material business risk for QBE, potentially impacting our business and customers in the medium to long-term. We have considered potential short-term scenarios that could affect our insurance business written to date, such as the early emergence of climate-related claims on liability insurance contracts, and we expect no material impact on the amounts recognised or disclosed in the financial statements.
4.2 Insurance risk
OverviewInsurance risk is the risk of fluctuations in the timing, frequency and severity of insured events and claims settlements, relative to expectations.
QBE classifies insurance risk into four subcategories, as follows:• underwriting/pricing;• insurance concentrations;• reserving; and• reinsurance.
QBE’s approach to managing insurance risk is underpinned by the Group insurance risk appetite statement as set by the Group Board and is summarised below.
Oth
er in
form
ation
6
Perfo
rman
ce o
verv
iew
1
Bu
siness
review
2
Go
vern
ance
3
Directo
rs' R
epo
rt
4
QB
E In
suran
ce Gro
up
A
nn
ual R
epo
rt 2018
117F
inan
cial R
epo
rt
5
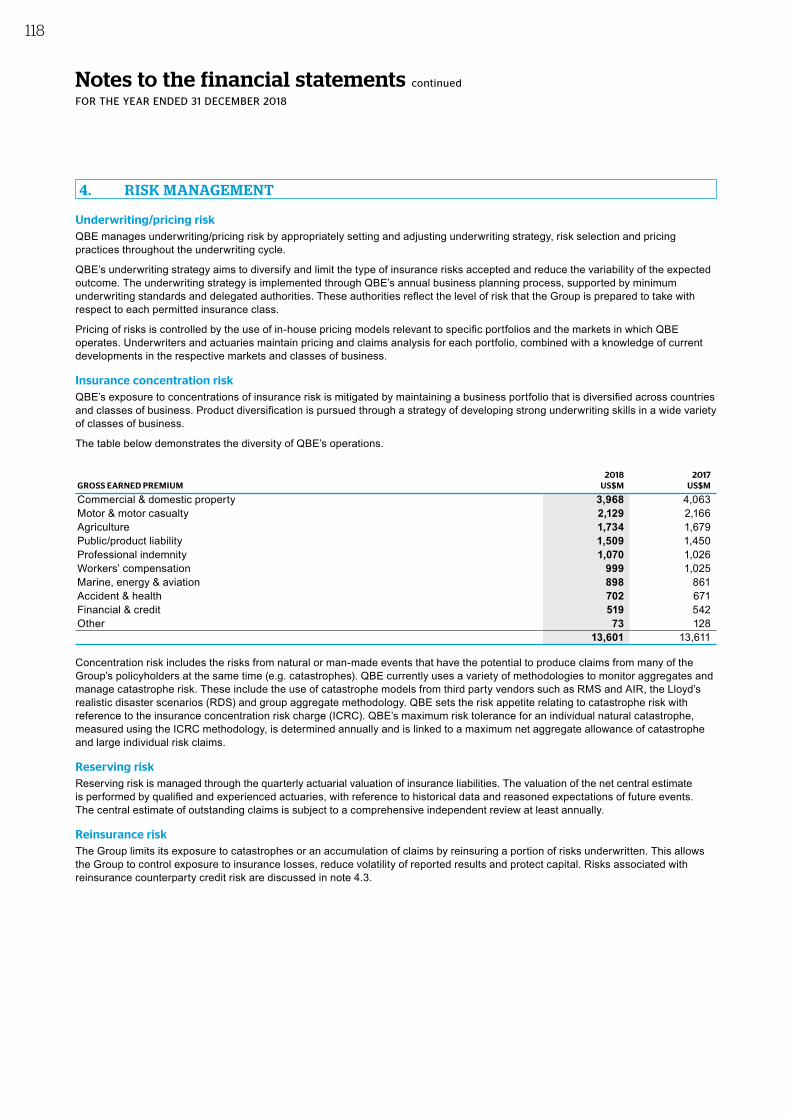
Notes to the financial statements continued
FOR THE YEAR ENDED 31 DECEMBER 2018
Underwriting/pricing riskQBE manages underwriting/pricing risk by appropriately setting and adjusting underwriting strategy, risk selection and pricing practices throughout the underwriting cycle.
QBE’s underwriting strategy aims to diversify and limit the type of insurance risks accepted and reduce the variability of the expected outcome. The underwriting strategy is implemented through QBE’s annual business planning process, supported by minimum underwriting standards and delegated authorities. These authorities reflect the level of risk that the Group is prepared to take with respect to each permitted insurance class.
Pricing of risks is controlled by the use of in-house pricing models relevant to specific portfolios and the markets in which QBE operates. Underwriters and actuaries maintain pricing and claims analysis for each portfolio, combined with a knowledge of current developments in the respective markets and classes of business.
Insurance concentration riskQBE’s exposure to concentrations of insurance risk is mitigated by maintaining a business portfolio that is diversified across countries and classes of business. Product diversification is pursued through a strategy of developing strong underwriting skills in a wide variety of classes of business.
The table below demonstrates the diversity of QBE’s operations.
2018 2017GROSS EARNED PREMIUM US$M US$M
Commercial & domestic property 3,968 4,063 Motor & motor casualty 2,129 2,166 Agriculture 1,734 1,679 Public/product liability 1,509 1,450 Professional indemnity 1,070 1,026 Workers’ compensation 999 1,025 Marine, energy & aviation 898 861 Accident & health 702 671 Financial & credit 519 542 Other 73 128
13,601 13,611
Concentration risk includes the risks from natural or man-made events that have the potential to produce claims from many of the Group’s policyholders at the same time (e.g. catastrophes). QBE currently uses a variety of methodologies to monitor aggregates and manage catastrophe risk. These include the use of catastrophe models from third party vendors such as RMS and AIR, the Lloyd’s realistic disaster scenarios (RDS) and group aggregate methodology. QBE sets the risk appetite relating to catastrophe risk with reference to the insurance concentration risk charge (ICRC). QBE’s maximum risk tolerance for an individual natural catastrophe, measured using the ICRC methodology, is determined annually and is linked to a maximum net aggregate allowance of catastrophe and large individual risk claims.
Reserving riskReserving risk is managed through the quarterly actuarial valuation of insurance liabilities. The valuation of the net central estimate is performed by qualified and experienced actuaries, with reference to historical data and reasoned expectations of future events. The central estimate of outstanding claims is subject to a comprehensive independent review at least annually.
Reinsurance riskThe Group limits its exposure to catastrophes or an accumulation of claims by reinsuring a portion of risks underwritten. This allows the Group to control exposure to insurance losses, reduce volatility of reported results and protect capital. Risks associated with reinsurance counterparty credit risk are discussed in note 4.3.
4. RISK MANAGEMENT
118
4.3 Credit risk
OverviewCredit risk is the risk of financial loss where a customer, counterparty or issuer fails to meet their financial obligations to QBE in accordance with agreed terms. QBE’s exposure to credit risk results from financial transactions with securities issuers, debtors, brokers, policyholders, reinsurers and guarantors.QBE’s approach to managing credit risk is underpinned by the Group credit risk appetite as set by the Group Board and is summarised below.
Reinsurance credit riskThe Group’s objective is to maximise placement of reinsurance with highly rated counterparties. Concentration of risk with reinsurance counterparties is monitored strictly and regularly by the Group’s Security Committee and is controlled by reference to the following protocols:• treaty or facultative reinsurance is placed in accordance with the requirements of the Group REMS and Group Security
Committee guidelines;• reinsurance arrangements are regularly reassessed to determine their effectiveness based on current exposures, historical
claims and potential future losses based on the Group’s insurance concentrations; and• exposure to reinsurance counterparties and the credit quality of those counterparties is actively monitored.
Credit risk exposures are calculated regularly and compared with authorised credit limits. The Group is exposed to material concentrations of credit risk in relation to reinsurance recoveries at the balance date, in particular to large global reinsurers. In certain cases, the Group requires letters of credit or other collateral arrangements to be provided to guarantee the recoverability of the amount involved. Collateral held for the Group in respect of reinsurance arrangements is $1,444 million (2017 $1,400 million). The credit rating analysis below includes the impact of such security arrangements. In some cases, further security has been obtained in the form of trust arrangements, reinsurer default protection and other potential offsets. This additional security has not been included in the credit rating analysis below.
The following table provides information about the quality of the Group’s credit risk exposure in respect of reinsurance recoveries at the balance date. The analysis classifies the assets according to Standard & Poor’s (S&P) counterparty credit ratings. AAA is the highest possible rating. Rated assets falling outside the range of AAA to BBB are classified as speculative grade.
CREDIT RATING
AAA AA A BBBSPECULATIVE
GRADE NOT RATED TOTALUS$M US$M US$M US$M US$M US$M US$M
As at 31 December 2018Reinsurance recoveries on outstanding claims1, 2 72 4,274 760 1 1 76 5,184Reinsurance recoveries on paid claims1 1 1,561 113 – – – 1,675As at 31 December 2017Reinsurance recoveries on outstanding claims1, 2 72 4,412 1,330 1 – 128 5,943Reinsurance recoveries on paid claims1 1 834 99 – – – 934
1 Net of a provision for impairment.2 Excludes other recoveries of $367 million (2017 $368 million).
The following table provides further information regarding the ageing of reinsurance recoveries on paid claims at the balance date.
PAST DUE BUT NOT IMPAIRED
NEITHER PAST
DUE NOR IMPAIRED
0 TO 3 MONTHS
4 TO 6 MONTHS
7 MONTHS TO 1 YEAR
GREATER THAN
1 YEAR TOTALYEAR US$M US$M US$M US$M US$M US$M
Reinsurance recoveries on paid claims1 2018 1,423 129 45 18 60 1,6752017 703 50 80 20 81 934
1 Net of a provision for impairment.
Oth
er in
form
ation
6
Perfo
rman
ce o
verv
iew
1
Bu
siness
review
2
Go
vern
ance
3
Directo
rs' R
epo
rt
4
QB
E In
suran
ce Gro
up
A
nn
ual R
epo
rt 2018
119F
inan
cial R
epo
rt
5
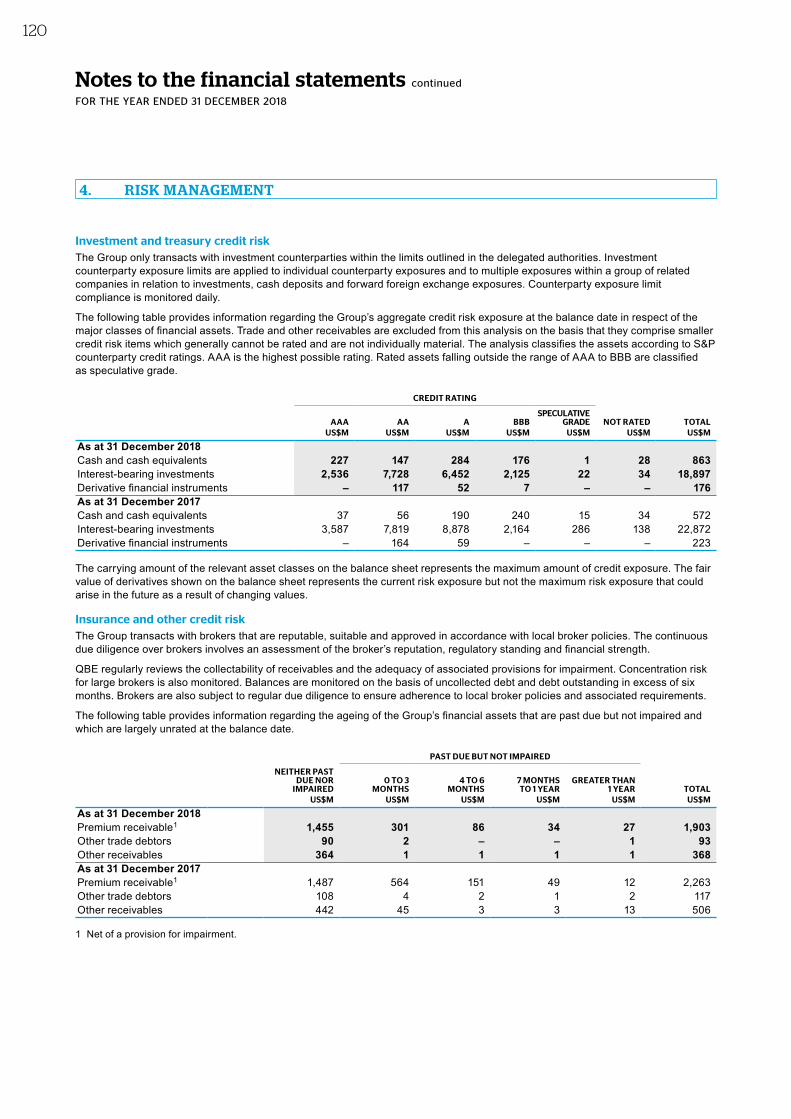
Notes to the financial statements continued
FOR THE YEAR ENDED 31 DECEMBER 2018
Investment and treasury credit riskThe Group only transacts with investment counterparties within the limits outlined in the delegated authorities. Investment counterparty exposure limits are applied to individual counterparty exposures and to multiple exposures within a group of related companies in relation to investments, cash deposits and forward foreign exchange exposures. Counterparty exposure limit compliance is monitored daily.
The following table provides information regarding the Group’s aggregate credit risk exposure at the balance date in respect of the major classes of financial assets. Trade and other receivables are excluded from this analysis on the basis that they comprise smaller credit risk items which generally cannot be rated and are not individually material. The analysis classifies the assets according to S&P counterparty credit ratings. AAA is the highest possible rating. Rated assets falling outside the range of AAA to BBB are classified as speculative grade.
CREDIT RATING
AAA AA A BBBSPECULATIVE
GRADE NOT RATED TOTALUS$M US$M US$M US$M US$M US$M US$M
As at 31 December 2018Cash and cash equivalents 227 147 284 176 1 28 863Interest-bearing investments 2,536 7,728 6,452 2,125 22 34 18,897Derivative financial instruments – 117 52 7 – – 176As at 31 December 2017Cash and cash equivalents 37 56 190 240 15 34 572Interest-bearing investments 3,587 7,819 8,878 2,164 286 138 22,872Derivative financial instruments – 164 59 – – – 223
The carrying amount of the relevant asset classes on the balance sheet represents the maximum amount of credit exposure. The fair value of derivatives shown on the balance sheet represents the current risk exposure but not the maximum risk exposure that could arise in the future as a result of changing values.
Insurance and other credit riskThe Group transacts with brokers that are reputable, suitable and approved in accordance with local broker policies. The continuous due diligence over brokers involves an assessment of the broker’s reputation, regulatory standing and financial strength.
QBE regularly reviews the collectability of receivables and the adequacy of associated provisions for impairment. Concentration risk for large brokers is also monitored. Balances are monitored on the basis of uncollected debt and debt outstanding in excess of six months. Brokers are also subject to regular due diligence to ensure adherence to local broker policies and associated requirements.
The following table provides information regarding the ageing of the Group’s financial assets that are past due but not impaired and which are largely unrated at the balance date.
PAST DUE BUT NOT IMPAIRED
NEITHER PAST DUE NOR
IMPAIRED0 TO 3
MONTHS4 TO 6
MONTHS7 MONTHS TO 1 YEAR
GREATER THAN 1 YEAR TOTAL
US$M US$M US$M US$M US$M US$M
As at 31 December 2018Premium receivable1 1,455 301 86 34 27 1,903Other trade debtors 90 2 – – 1 93Other receivables 364 1 1 1 1 368As at 31 December 2017Premium receivable1 1,487 564 151 49 12 2,263Other trade debtors 108 4 2 1 2 117Other receivables 442 45 3 3 13 506
1 Net of a provision for impairment.
4. RISK MANAGEMENT
120
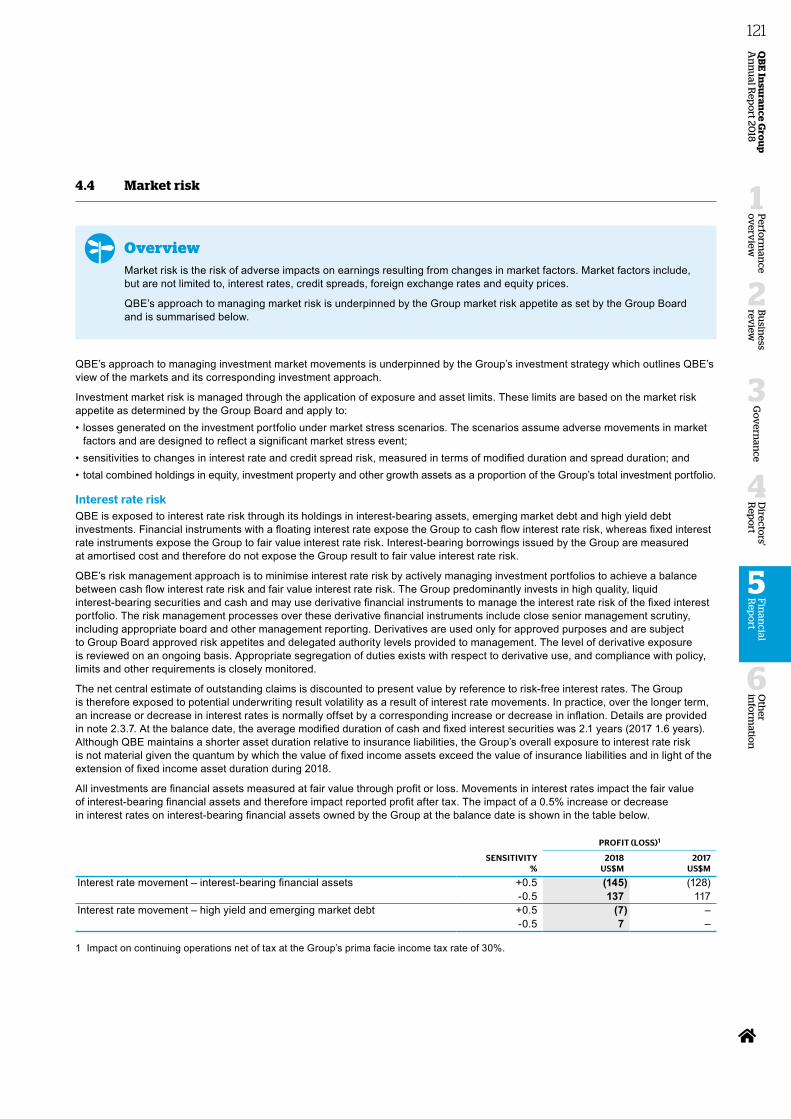
4.4 Market risk
OverviewMarket risk is the risk of adverse impacts on earnings resulting from changes in market factors. Market factors include, but are not limited to, interest rates, credit spreads, foreign exchange rates and equity prices.
QBE’s approach to managing market risk is underpinned by the Group market risk appetite as set by the Group Board and is summarised below.
QBE’s approach to managing investment market movements is underpinned by the Group’s investment strategy which outlines QBE’s view of the markets and its corresponding investment approach.
Investment market risk is managed through the application of exposure and asset limits. These limits are based on the market risk appetite as determined by the Group Board and apply to:• losses generated on the investment portfolio under market stress scenarios. The scenarios assume adverse movements in market
factors and are designed to reflect a significant market stress event;• sensitivities to changes in interest rate and credit spread risk, measured in terms of modified duration and spread duration; and• total combined holdings in equity, investment property and other growth assets as a proportion of the Group’s total investment portfolio.
Interest rate riskQBE is exposed to interest rate risk through its holdings in interest-bearing assets, emerging market debt and high yield debt investments. Financial instruments with a floating interest rate expose the Group to cash flow interest rate risk, whereas fixed interest rate instruments expose the Group to fair value interest rate risk. Interest-bearing borrowings issued by the Group are measured at amortised cost and therefore do not expose the Group result to fair value interest rate risk.
QBE’s risk management approach is to minimise interest rate risk by actively managing investment portfolios to achieve a balance between cash flow interest rate risk and fair value interest rate risk. The Group predominantly invests in high quality, liquid interest-bearing securities and cash and may use derivative financial instruments to manage the interest rate risk of the fixed interest portfolio. The risk management processes over these derivative financial instruments include close senior management scrutiny, including appropriate board and other management reporting. Derivatives are used only for approved purposes and are subject to Group Board approved risk appetites and delegated authority levels provided to management. The level of derivative exposure is reviewed on an ongoing basis. Appropriate segregation of duties exists with respect to derivative use, and compliance with policy, limits and other requirements is closely monitored.
The net central estimate of outstanding claims is discounted to present value by reference to risk-free interest rates. The Group is therefore exposed to potential underwriting result volatility as a result of interest rate movements. In practice, over the longer term, an increase or decrease in interest rates is normally offset by a corresponding increase or decrease in inflation. Details are provided in note 2.3.7. At the balance date, the average modified duration of cash and fixed interest securities was 2.1 years (2017 1.6 years). Although QBE maintains a shorter asset duration relative to insurance liabilities, the Group’s overall exposure to interest rate risk is not material given the quantum by which the value of fixed income assets exceed the value of insurance liabilities and in light of the extension of fixed income asset duration during 2018.
All investments are financial assets measured at fair value through profit or loss. Movements in interest rates impact the fair value of interest- bearing financial assets and therefore impact reported profit after tax. The impact of a 0.5% increase or decrease in interest rates on interest-bearing financial assets owned by the Group at the balance date is shown in the table below.
PROFIT (LOSS)1
SENSITIVITY 2018 2017% US$M US$M
Interest rate movement – interest-bearing financial assets +0.5 (145) (128)-0.5 137 117
Interest rate movement – high yield and emerging market debt +0.5 (7) – -0.5 7 –
1 Impact on continuing operations net of tax at the Group’s prima facie income tax rate of 30%.
Oth
er in
form
ation
6
Perfo
rman
ce o
verv
iew
1
Bu
siness
review
2
Go
vern
ance
3
Directo
rs' R
epo
rt
4
QB
E In
suran
ce Gro
up
A
nn
ual R
epo
rt 2018
121F
inan
cial R
epo
rt
5
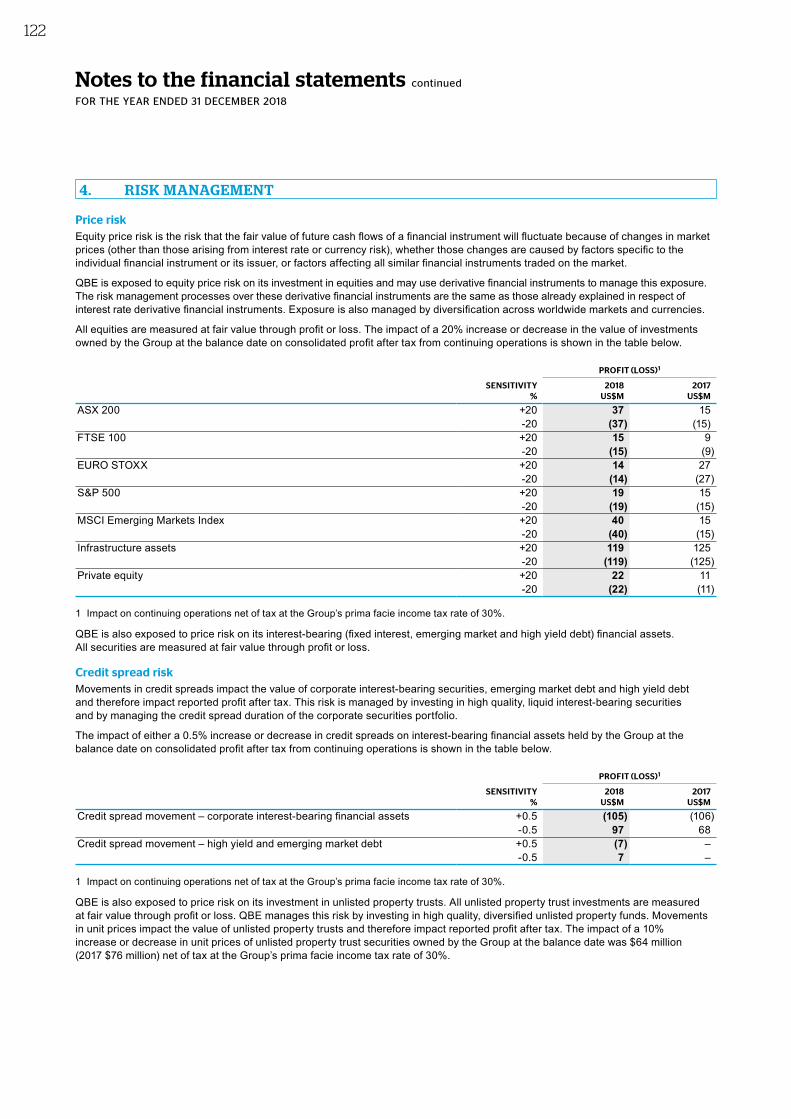
Notes to the financial statements continued
FOR THE YEAR ENDED 31 DECEMBER 2018
Price riskEquity price risk is the risk that the fair value of future cash flows of a financial instrument will fluctuate because of changes in market prices (other than those arising from interest rate or currency risk), whether those changes are caused by factors specific to the individual financial instrument or its issuer, or factors affecting all similar financial instruments traded on the market.
QBE is exposed to equity price risk on its investment in equities and may use derivative financial instruments to manage this exposure. The risk management processes over these derivative financial instruments are the same as those already explained in respect of interest rate derivative financial instruments. Exposure is also managed by diversification across worldwide markets and currencies.
All equities are measured at fair value through profit or loss. The impact of a 20% increase or decrease in the value of investments owned by the Group at the balance date on consolidated profit after tax from continuing operations is shown in the table below.
PROFIT (LOSS)1
SENSITIVITY 2018 2017% US$M US$M
ASX 200 +20 37 15-20 (37) (15)
FTSE 100 +20 15 9-20 (15) (9)
EURO STOXX +20 14 27-20 (14) (27)
S&P 500 +20 19 15-20 (19) (15)
MSCI Emerging Markets Index +20 40 15-20 (40) (15)
Infrastructure assets +20 119 125-20 (119) (125)
Private equity +20 22 11-20 (22) (11)
1 Impact on continuing operations net of tax at the Group’s prima facie income tax rate of 30%.
QBE is also exposed to price risk on its interest-bearing (fixed interest, emerging market and high yield debt) financial assets. All securities are measured at fair value through profit or loss.
Credit spread riskMovements in credit spreads impact the value of corporate interest-bearing securities, emerging market debt and high yield debt and therefore impact reported profit after tax. This risk is managed by investing in high quality, liquid interest-bearing securities and by managing the credit spread duration of the corporate securities portfolio.
The impact of either a 0.5% increase or decrease in credit spreads on interest-bearing financial assets held by the Group at the balance date on consolidated profit after tax from continuing operations is shown in the table below.
PROFIT (LOSS)1
SENSITIVITY 2018 2017% US$M US$M
Credit spread movement – corporate interest-bearing financial assets +0.5 (105) (106)-0.5 97 68
Credit spread movement – high yield and emerging market debt +0.5 (7) – -0.5 7 –
1 Impact on continuing operations net of tax at the Group’s prima facie income tax rate of 30%.
QBE is also exposed to price risk on its investment in unlisted property trusts. All unlisted property trust investments are measured at fair value through profit or loss. QBE manages this risk by investing in high quality, diversified unlisted property funds. Movements in unit prices impact the value of unlisted property trusts and therefore impact reported profit after tax. The impact of a 10% increase or decrease in unit prices of unlisted property trust securities owned by the Group at the balance date was $64 million (2017 $76 million) net of tax at the Group’s prima facie income tax rate of 30%.
4. RISK MANAGEMENT
122
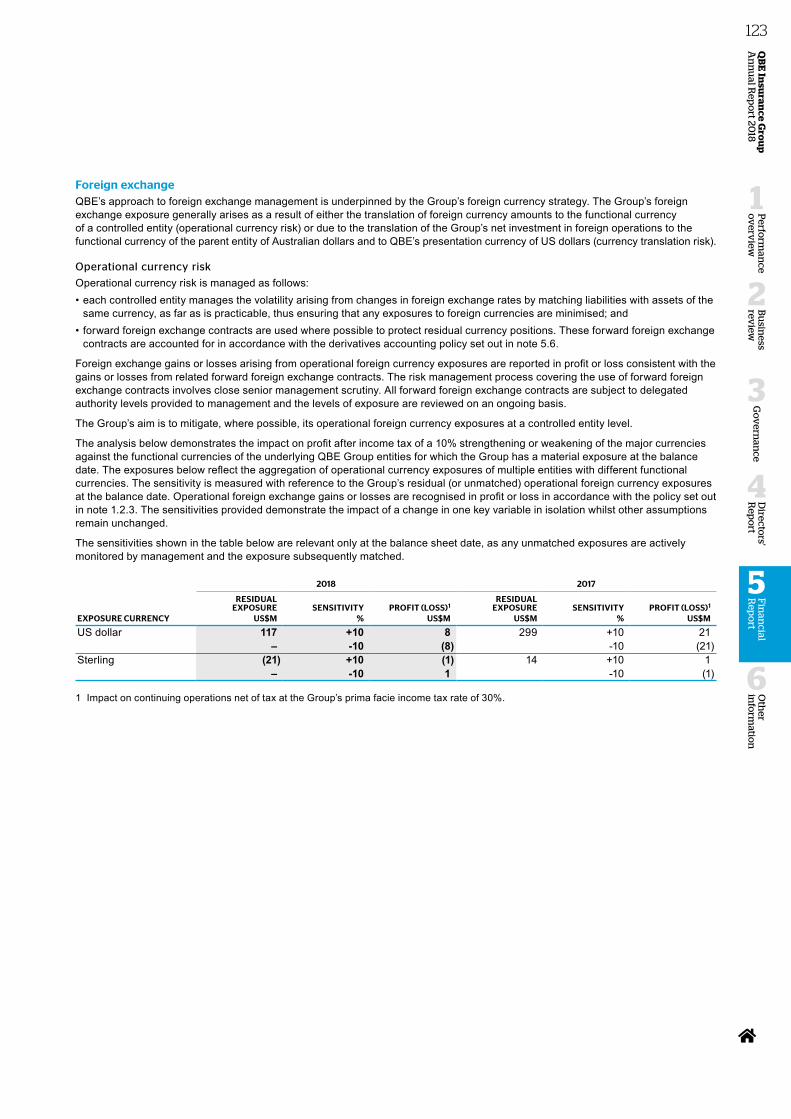
Foreign exchangeQBE’s approach to foreign exchange management is underpinned by the Group’s foreign currency strategy. The Group’s foreign exchange exposure generally arises as a result of either the translation of foreign currency amounts to the functional currency of a controlled entity (operational currency risk) or due to the translation of the Group’s net investment in foreign operations to the functional currency of the parent entity of Australian dollars and to QBE’s presentation currency of US dollars (currency translation risk).
Operational currency risk
Operational currency risk is managed as follows:• each controlled entity manages the volatility arising from changes in foreign exchange rates by matching liabilities with assets of the
same currency, as far as is practicable, thus ensuring that any exposures to foreign currencies are minimised; and• forward foreign exchange contracts are used where possible to protect residual currency positions. These forward foreign exchange
contracts are accounted for in accordance with the derivatives accounting policy set out in note 5.6.
Foreign exchange gains or losses arising from operational foreign currency exposures are reported in profit or loss consistent with the gains or losses from related forward foreign exchange contracts. The risk management process covering the use of forward foreign exchange contracts involves close senior management scrutiny. All forward foreign exchange contracts are subject to delegated authority levels provided to management and the levels of exposure are reviewed on an ongoing basis.
The Group’s aim is to mitigate, where possible, its operational foreign currency exposures at a controlled entity level.
The analysis below demonstrates the impact on profit after income tax of a 10% strengthening or weakening of the major currencies against the functional currencies of the underlying QBE Group entities for which the Group has a material exposure at the balance date. The exposures below reflect the aggregation of operational currency exposures of multiple entities with different functional currencies. The sensitivity is measured with reference to the Group’s residual (or unmatched) operational foreign currency exposures at the balance date. Operational foreign exchange gains or losses are recognised in profit or loss in accordance with the policy set out in note 1.2.3. The sensitivities provided demonstrate the impact of a change in one key variable in isolation whilst other assumptions remain unchanged.
The sensitivities shown in the table below are relevant only at the balance sheet date, as any unmatched exposures are actively monitored by management and the exposure subsequently matched.
2018 2017
RESIDUAL EXPOSURE SENSITIVITY PROFIT (LOSS)1
RESIDUAL EXPOSURE SENSITIVITY PROFIT (LOSS)1
EXPOSURE CURRENCY US$M % US$M US$M % US$M
US dollar 117 +10 8 299 +10 21– ‑10 (8) -10 (21)
Sterling (21) +10 (1) 14 +10 1– ‑10 1 -10 (1)
1 Impact on continuing operations net of tax at the Group’s prima facie income tax rate of 30%.
Oth
er in
form
ation
6
Perfo
rman
ce o
verv
iew
1
Bu
siness
review
2
Go
vern
ance
3
Directo
rs' R
epo
rt
4
QB
E In
suran
ce Gro
up
A
nn
ual R
epo
rt 2018
123F
inan
cial R
epo
rt
5
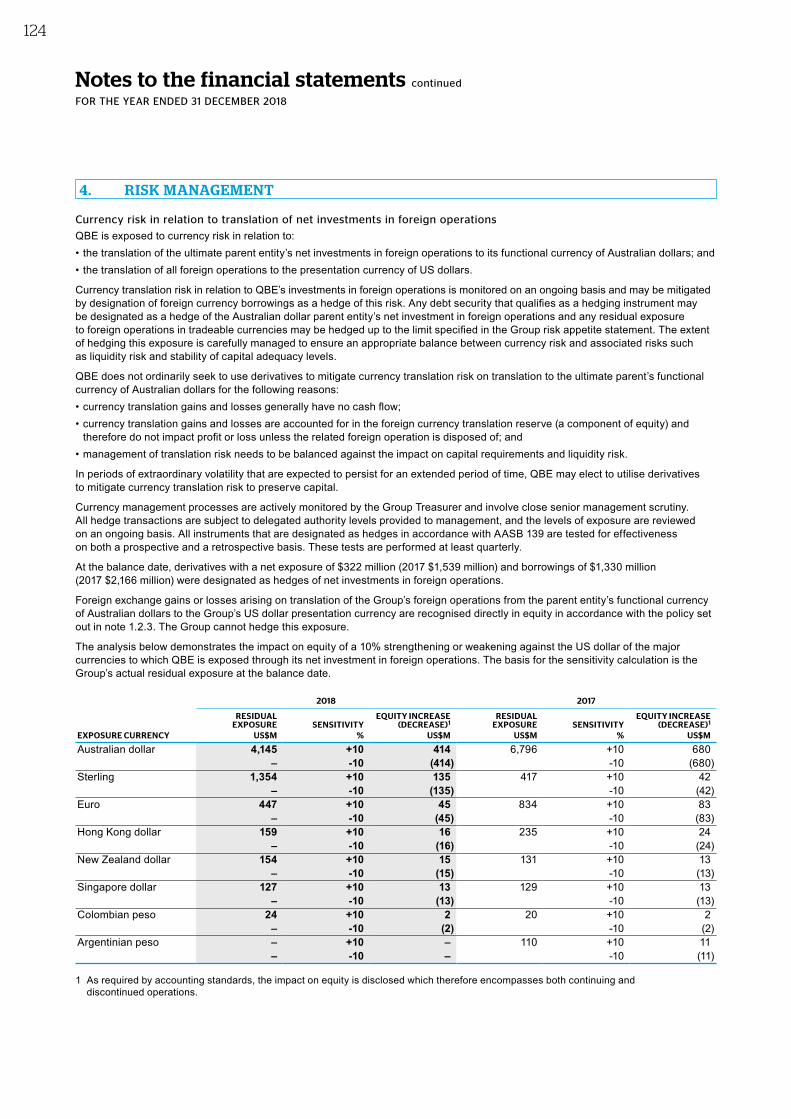
Notes to the financial statements continued
FOR THE YEAR ENDED 31 DECEMBER 2018
Currency risk in relation to translation of net investments in foreign operations
QBE is exposed to currency risk in relation to:• the translation of the ultimate parent entity’s net investments in foreign operations to its functional currency of Australian dollars; and• the translation of all foreign operations to the presentation currency of US dollars.
Currency translation risk in relation to QBE’s investments in foreign operations is monitored on an ongoing basis and may be mitigated by designation of foreign currency borrowings as a hedge of this risk. Any debt security that qualifies as a hedging instrument may be designated as a hedge of the Australian dollar parent entity’s net investment in foreign operations and any residual exposure to foreign operations in tradeable currencies may be hedged up to the limit specified in the Group risk appetite statement. The extent of hedging this exposure is carefully managed to ensure an appropriate balance between currency risk and associated risks such as liquidity risk and stability of capital adequacy levels.
QBE does not ordinarily seek to use derivatives to mitigate currency translation risk on translation to the ultimate parent’s functional currency of Australian dollars for the following reasons:• currency translation gains and losses generally have no cash flow;• currency translation gains and losses are accounted for in the foreign currency translation reserve (a component of equity) and
therefore do not impact profit or loss unless the related foreign operation is disposed of; and• management of translation risk needs to be balanced against the impact on capital requirements and liquidity risk.
In periods of extraordinary volatility that are expected to persist for an extended period of time, QBE may elect to utilise derivatives to mitigate currency translation risk to preserve capital.
Currency management processes are actively monitored by the Group Treasurer and involve close senior management scrutiny. All hedge transactions are subject to delegated authority levels provided to management, and the levels of exposure are reviewed on an ongoing basis. All instruments that are designated as hedges in accordance with AASB 139 are tested for effectiveness on both a prospective and a retrospective basis. These tests are performed at least quarterly.
At the balance date, derivatives with a net exposure of $322 million (2017 $1,539 million) and borrowings of $1,330 million (2017 $2,166 million) were designated as hedges of net investments in foreign operations.
Foreign exchange gains or losses arising on translation of the Group’s foreign operations from the parent entity’s functional currency of Australian dollars to the Group’s US dollar presentation currency are recognised directly in equity in accordance with the policy set out in note 1.2.3. The Group cannot hedge this exposure.
The analysis below demonstrates the impact on equity of a 10% strengthening or weakening against the US dollar of the major currencies to which QBE is exposed through its net investment in foreign operations. The basis for the sensitivity calculation is the Group’s actual residual exposure at the balance date.
2018 2017
RESIDUAL EXPOSURE SENSITIVITY
EQUITY INCREASE (DECREASE)1
RESIDUAL EXPOSURE SENSITIVITY
EQUITY INCREASE (DECREASE)1
EXPOSURE CURRENCY US$M % US$M US$M % US$M
Australian dollar 4,145 +10 414 6,796 +10 680– ‑10 (414) -10 (680)
Sterling 1,354 +10 135 417 +10 42– ‑10 (135) -10 (42)
Euro 447 +10 45 834 +10 83– ‑10 (45) -10 (83)
Hong Kong dollar 159 +10 16 235 +10 24– ‑10 (16) -10 (24)
New Zealand dollar 154 +10 15 131 +10 13– ‑10 (15) -10 (13)
Singapore dollar 127 +10 13 129 +10 13– ‑10 (13) -10 (13)
Colombian peso 24 +10 2 20 +10 2– ‑10 (2) -10 (2)
Argentinian peso – +10 – 110 +10 11– ‑10 – -10 (11)
1 As required by accounting standards, the impact on equity is disclosed which therefore encompasses both continuing and discontinued operations.
4. RISK MANAGEMENT
124
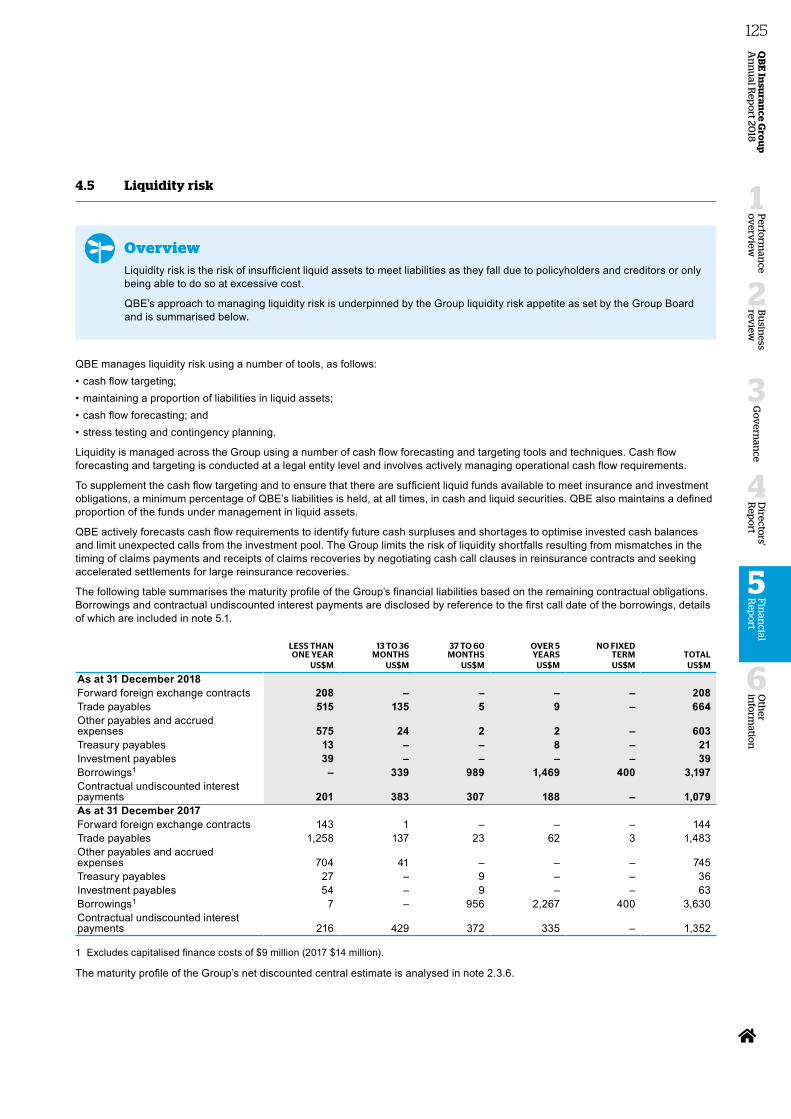
4.5 Liquidity risk
OverviewLiquidity risk is the risk of insufficient liquid assets to meet liabilities as they fall due to policyholders and creditors or only being able to do so at excessive cost.
QBE’s approach to managing liquidity risk is underpinned by the Group liquidity risk appetite as set by the Group Board and is summarised below.
QBE manages liquidity risk using a number of tools, as follows:• cash flow targeting;• maintaining a proportion of liabilities in liquid assets;• cash flow forecasting; and• stress testing and contingency planning.
Liquidity is managed across the Group using a number of cash flow forecasting and targeting tools and techniques. Cash flow forecasting and targeting is conducted at a legal entity level and involves actively managing operational cash flow requirements.
To supplement the cash flow targeting and to ensure that there are sufficient liquid funds available to meet insurance and investment obligations, a minimum percentage of QBE’s liabilities is held, at all times, in cash and liquid securities. QBE also maintains a defined proportion of the funds under management in liquid assets.
QBE actively forecasts cash flow requirements to identify future cash surpluses and shortages to optimise invested cash balances and limit unexpected calls from the investment pool. The Group limits the risk of liquidity shortfalls resulting from mismatches in the timing of claims payments and receipts of claims recoveries by negotiating cash call clauses in reinsurance contracts and seeking accelerated settlements for large reinsurance recoveries.
The following table summarises the maturity profile of the Group’s financial liabilities based on the remaining contractual obligations. Borrowings and contractual undiscounted interest payments are disclosed by reference to the first call date of the borrowings, details of which are included in note 5.1.
LESS THAN ONE YEAR
13 TO 36 MONTHS
37 TO 60 MONTHS
OVER 5 YEARS
NO FIXED TERM TOTAL
US$M US$M US$M US$M US$M US$M
As at 31 December 2018Forward foreign exchange contracts 208 – – – – 208Trade payables 515 135 5 9 – 664Other payables and accrued expenses 575 24 2 2 – 603Treasury payables 13 – – 8 – 21Investment payables 39 – – – – 39Borrowings1 – 339 989 1,469 400 3,197Contractual undiscounted interest payments 201 383 307 188 – 1,079As at 31 December 2017Forward foreign exchange contracts 143 1 – – – 144Trade payables 1,258 137 23 62 3 1,483Other payables and accrued expenses 704 41 – – – 745Treasury payables 27 – 9 – – 36Investment payables 54 – 9 – – 63Borrowings1 7 – 956 2,267 400 3,630Contractual undiscounted interest payments 216 429 372 335 – 1,352
1 Excludes capitalised finance costs of $9 million (2017 $14 million).
The maturity profile of the Group’s net discounted central estimate is analysed in note 2.3.6.
Oth
er in
form
ation
6
Perfo
rman
ce o
verv
iew
1
Bu
siness
review
2
Go
vern
ance
3
Directo
rs' R
epo
rt
4
QB
E In
suran
ce Gro
up
A
nn
ual R
epo
rt 2018
125F
inan
cial R
epo
rt
5
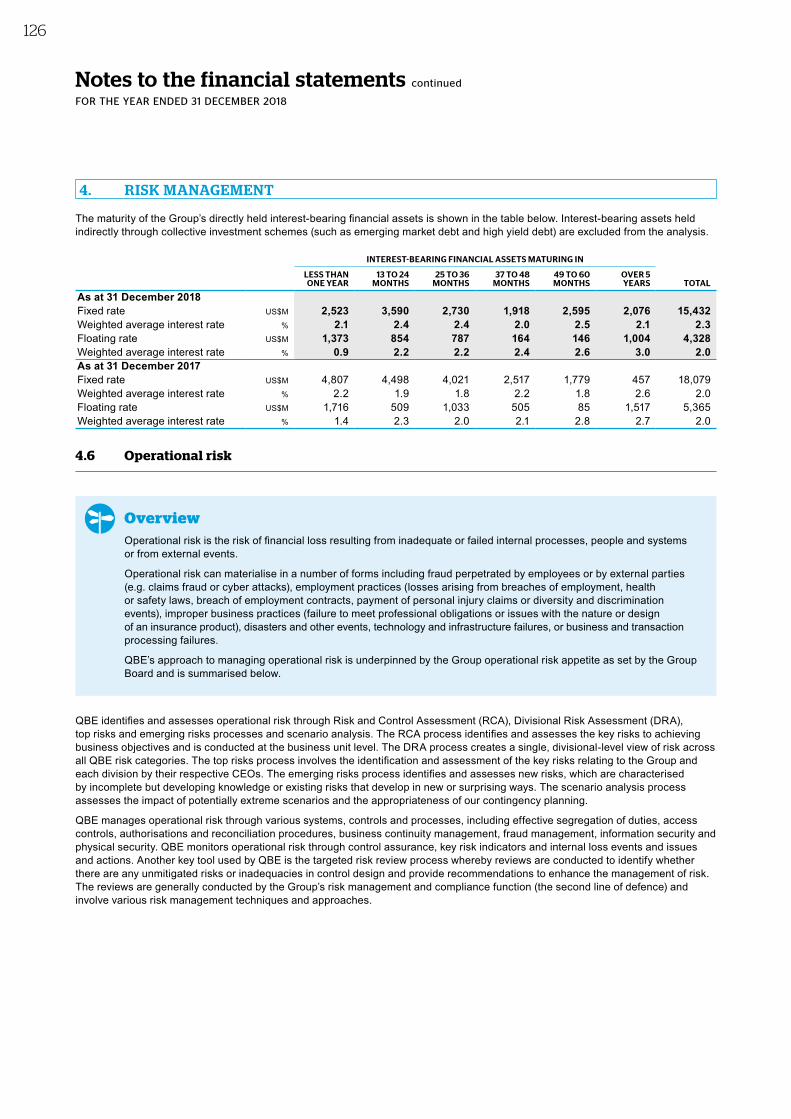
Notes to the financial statements continued
FOR THE YEAR ENDED 31 DECEMBER 2018
The maturity of the Group’s directly held interest-bearing financial assets is shown in the table below. Interest-bearing assets held indirectly through collective investment schemes (such as emerging market debt and high yield debt) are excluded from the analysis.
INTEREST-BEARING FINANCIAL ASSETS MATURING IN
LESS THAN ONE YEAR
13 TO 24 MONTHS
25 TO 36 MONTHS
37 TO 48 MONTHS
49 TO 60 MONTHS
OVER 5 YEARS TOTAL
As at 31 December 2018Fixed rate US$M 2,523 3,590 2,730 1,918 2,595 2,076 15,432Weighted average interest rate % 2.1 2.4 2.4 2.0 2.5 2.1 2.3Floating rate US$M 1,373 854 787 164 146 1,004 4,328Weighted average interest rate % 0.9 2.2 2.2 2.4 2.6 3.0 2.0As at 31 December 2017Fixed rate US$M 4,807 4,498 4,021 2,517 1,779 457 18,079Weighted average interest rate % 2.2 1.9 1.8 2.2 1.8 2.6 2.0Floating rate US$M 1,716 509 1,033 505 85 1,517 5,365Weighted average interest rate % 1.4 2.3 2.0 2.1 2.8 2.7 2.0
4.6 Operational risk
OverviewOperational risk is the risk of financial loss resulting from inadequate or failed internal processes, people and systems or from external events.
Operational risk can materialise in a number of forms including fraud perpetrated by employees or by external parties (e.g. claims fraud or cyber attacks), employment practices (losses arising from breaches of employment, health or safety laws, breach of employment contracts, payment of personal injury claims or diversity and discrimination events), improper business practices (failure to meet professional obligations or issues with the nature or design of an insurance product), disasters and other events, technology and infrastructure failures, or business and transaction processing failures.
QBE’s approach to managing operational risk is underpinned by the Group operational risk appetite as set by the Group Board and is summarised below.
QBE identifies and assesses operational risk through Risk and Control Assessment (RCA), Divisional Risk Assessment (DRA), top risks and emerging risks processes and scenario analysis. The RCA process identifies and assesses the key risks to achieving business objectives and is conducted at the business unit level. The DRA process creates a single, divisional-level view of risk across all QBE risk categories. The top risks process involves the identification and assessment of the key risks relating to the Group and each division by their respective CEOs. The emerging risks process identifies and assesses new risks, which are characterised by incomplete but developing knowledge or existing risks that develop in new or surprising ways. The scenario analysis process assesses the impact of potentially extreme scenarios and the appropriateness of our contingency planning.
QBE manages operational risk through various systems, controls and processes, including effective segregation of duties, access controls, authorisations and reconciliation procedures, business continuity management, fraud management, information security and physical security. QBE monitors operational risk through control assurance, key risk indicators and internal loss events and issues and actions. Another key tool used by QBE is the targeted risk review process whereby reviews are conducted to identify whether there are any unmitigated risks or inadequacies in control design and provide recommendations to enhance the management of risk. The reviews are generally conducted by the Group’s risk management and compliance function (the second line of defence) and involve various risk management techniques and approaches.
4. RISK MANAGEMENT
126
4.7 Group risk
OverviewGroup risk is the risk to a division arising specifically from being part of the wider QBE Group, including financial impact and loss of support from the parent company.
QBE’s approach to managing Group risk is underpinned by the Group risk appetite as set by the Group Board and is summarised below.
The sources of Group risk may include Group initiatives or strategies with a material impact on one or more divisions, shared global reinsurance programs, inter-company loans and shared use of centralised Group functions (e.g. Group Procurement and Group IT). Group risk also includes the potential risk from reputational contagion.
QBE identifies and assesses Group risk using the RCA and DRA.
QBE manages Group risk through various systems, controls and processes, including the use of Group intercompany transactions and balances accounting guidance, transfer pricing guidelines and investment management agreements. In the instance of a reputational event, the Group Crisis Management Plan would be invoked to coordinate and manage the Group’s response to such an event.
Oth
er in
form
ation
6
Perfo
rman
ce o
verv
iew
1
Bu
siness
review
2
Go
vern
ance
3
Directo
rs' R
epo
rt
4
QB
E In
suran
ce Gro
up
A
nn
ual R
epo
rt 2018
127F
inan
cial R
epo
rt
5
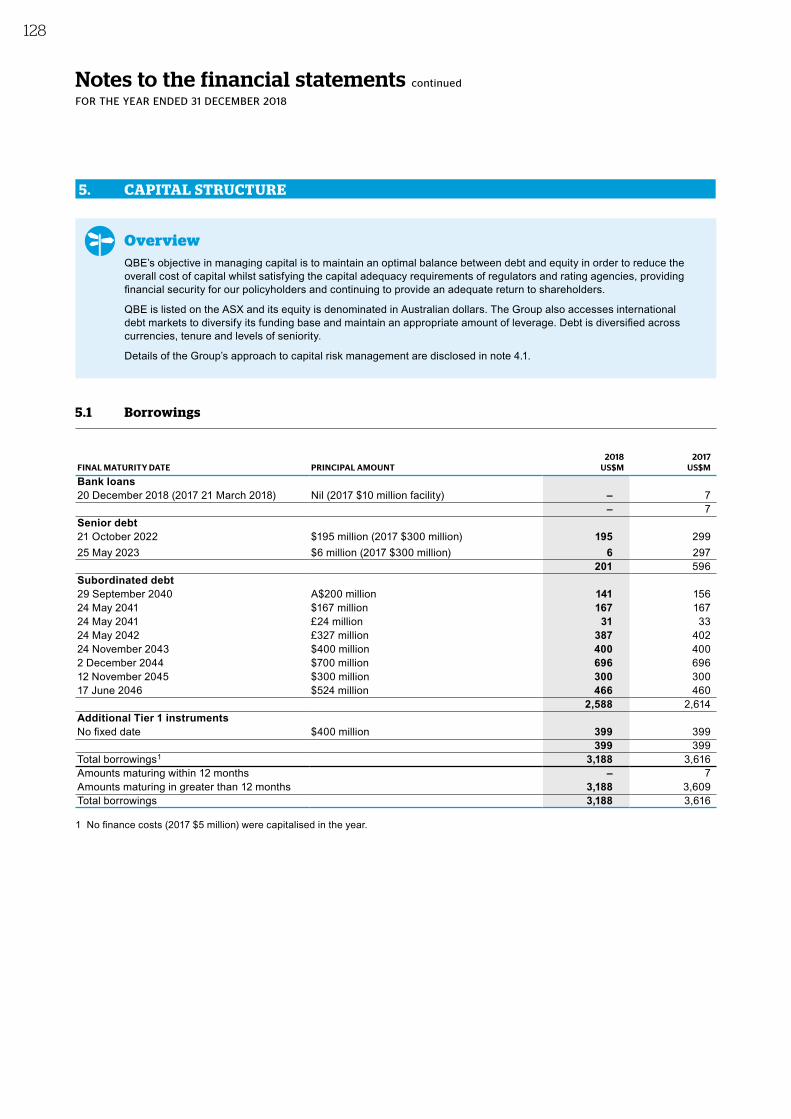
Notes to the financial statements continued
FOR THE YEAR ENDED 31 DECEMBER 2018
5. CAPITAL STRUCTURE
OverviewQBE’s objective in managing capital is to maintain an optimal balance between debt and equity in order to reduce the overall cost of capital whilst satisfying the capital adequacy requirements of regulators and rating agencies, providing financial security for our policyholders and continuing to provide an adequate return to shareholders.
QBE is listed on the ASX and its equity is denominated in Australian dollars. The Group also accesses international debt markets to diversify its funding base and maintain an appropriate amount of leverage. Debt is diversified across currencies, tenure and levels of seniority.
Details of the Group’s approach to capital risk management are disclosed in note 4.1.
5.1 Borrowings
2018 2017FINAL MATURITY DATE PRINCIPAL AMOUNT US$M US$M
Bank loans20 December 2018 (2017 21 March 2018) Nil (2017 $10 million facility) – 7
– 7Senior debt21 October 2022 $195 million (2017 $300 million) 195 29925 May 2023 $6 million (2017 $300 million) 6 297
201 596Subordinated debt29 September 2040 A$200 million 141 15624 May 2041 $167 million 167 16724 May 2041 £24 million 31 3324 May 2042 £327 million 387 40224 November 2043 $400 million 400 4002 December 2044 $700 million 696 69612 November 2045 $300 million 300 30017 June 2046 $524 million 466 460
2,588 2,614Additional Tier 1 instrumentsNo fixed date $400 million 399 399
399 399Total borrowings1 3,188 3,616Amounts maturing within 12 months – 7Amounts maturing in greater than 12 months 3,188 3,609Total borrowings 3,188 3,616
1 No finance costs (2017 $5 million) were capitalised in the year.
128
Senior debt
Senior notes due 2022
On 21 April 2017, the company issued $300 million of senior notes maturing on 21 October 2022. The notes are unsecured and unsubordinated obligations of the company and will rank equally among themselves and, subject to certain exceptions in relation to ranking, with all other unsecured existing and future unsubordinated indebtedness of the company. The securities entitle holders to receive interest at a fixed rate of 3.0% per annum payable semi-annually in arrears. The notes were issued under the QBE Green Bond Framework, details of which can be found on QBE’s website. During 2018, the Group repurchased $105 million of these notes for cash.
Senior notes due 2023
On 21 September 2017, the company issued $300 million of senior notes maturing on 25 May 2023. The notes are unsecured and unsubordinated obligations of the company and will rank equally among themselves and, subject to certain exceptions in relation to ranking, with all other unsecured existing and future unsubordinated indebtedness of the company. The securities entitle holders to receive interest at a fixed rate of 3.0% per annum payable semi-annually in arrears. During 2018, the Group repurchased $294 million of these notes for cash.
Subordinated debt
Subordinated debt due 2040
On 29 September 2015, the company issued A$200 million of subordinated debt securities with a 25 year maturity. The securities entitle the holders to receive interest at the 90 day average mid-rate bank bill rate plus a margin of 4.0%. Interest is payable quarterly in arrears.
The securities are redeemable at the option of QBE, with the written approval of APRA, on 29 September 2020 and on each subsequent interest payment date during the 12 months following or at any time in the event of certain tax and regulatory events.
The securities must be converted into a variable number of QBE ordinary shares, or written off, if APRA determines QBE to be non-viable. The conversion rate is subject to a price floor of 20% of the volume-weighted average price (VWAP) of the shares in the five trading days before the date of issue of the securities.
Subordinated debt due 2041
On 24 May 2011, QBE issued $1,000 million and £325 million of subordinated debt securities with a 30 year maturity. The securities entitle holders to receive interest at a fixed rate of 7.25% and 7.5% per annum respectively until 24 May 2021, at which time the rate will reset to a 10 year mid-market swap rate plus a margin of 4.05% and 4.0% per annum respectively. The rate will reset again, on the same basis, on 24 May 2031. Interest is payable semi-annually in arrears.
The securities are redeemable at the option of QBE, with the written approval of APRA, on 24 May 2021, 24 May 2031 or in the event of:• certain tax and US investment company registration events, which allow a redemption at any time; or• certain regulatory and rating agency equity credit events which allow redemption at any time after 24 May 2016.
During 2016, the Group exchanged $828 million of the $1,000 million and £291 million of the £325 million, details of which are set out below, and repurchased $5 million for cash.
During 2017, the Group repurchased a further £10 million for cash.
Subordinated debt due 2042
On 19 May 2016, QBE exchanged £291 million of subordinated debt securities due 2041 for £327 million of subordinated debt securities due 2042. The securities have a 26 year maturity and entitle holders to receive a fixed rate coupon of 6.115% per annum until 24 May 2022. The rate will reset in 2022, 2027, 2032 and 2037 to a rate calculated by reference to the then five year mid-market swap rate plus a margin of 5.0%. Interest is payable semi-annually in arrears.
The securities are redeemable at the option of QBE, with the written approval of APRA, on each interest reset date or at any time in the event of certain tax and regulatory events.
The securities must be converted into a variable number of QBE ordinary shares, or written off, if APRA determines QBE to be non-viable. The conversion rate is subject to a price floor of 20% of the VWAP of the shares in the five trading days before the date of issue of the securities.
Subordinated debt due 2043
On 17 November 2016, QBE exchanged $372 million of the subordinated debt securities due 2041 for $372 million of subordinated debt due 2043. On 28 November 2016, QBE issued an additional $28 million of the same subordinated debt. The securities have a 27 year maturity and entitle holders to receive a fixed rate coupon of 7.50% per annum until 24 November 2023. The rate will reset in 2023 and 2033 to a rate calculated by reference to the then 10 year US dollar swap rate plus a margin of 6.03%. Interest is payable semi-annually in arrears.
QBE has an option to defer payment of interest in certain circumstances and such deferral will not constitute an event of default. The securities are redeemable at the option of QBE, with the written approval of APRA, on each interest reset date or at any time in the event of certain tax and regulatory events.
Oth
er in
form
ation
6
Perfo
rman
ce o
verv
iew
1
Bu
siness
review
2
Go
vern
ance
3
Directo
rs' R
epo
rt
4
QB
E In
suran
ce Gro
up
A
nn
ual R
epo
rt 2018
129F
inan
cial R
epo
rt
5
Notes to the financial statements continued
FOR THE YEAR ENDED 31 DECEMBER 2018
The securities must be converted into a variable number of QBE ordinary shares, or written off, if APRA determines QBE to be non-viable. The conversion rate is subject to a price floor of 20% of the VWAP of the shares in the five trading days before the date of issue of the securities.
Subordinated debt due 2044
On 2 December 2014, the company issued $700 million of subordinated debt securities with a 30 year maturity. The securities entitle holders to receive interest at a fixed rate of 6.75% per annum until 2 December 2024, at which time the rate will reset to a 10 year mid-market swap rate plus a margin of 4.3%. The rate will reset again, on the same basis, on 2 December 2034. Interest is payable semi-annually in arrears.
The securities are redeemable at the option of QBE, with the written approval of APRA, on 2 December 2024, 2 December 2034 or at any time in the event of certain tax and regulatory events.
The securities must be converted into a variable number of QBE ordinary shares or written off if APRA determines QBE to be non-viable. The conversion rate is subject to a price floor of 20% of the VWAP of the shares in the five trading days before the date of issue of the securities.
Subordinated debt due 2045
On 12 November 2015, the company issued $300 million of subordinated debt securities with a 30 year maturity. The securities entitle holders to receive interest at a fixed rate of 6.1% per annum until 12 November 2025, at which time the rate will reset to a 10 year mid-market swap rate plus a margin of 3.993%. The rate will reset again, on the same basis, on 12 November 2035. Interest is payable semi-annually in arrears.
The securities are redeemable at the option of QBE, with the written approval of APRA, on 12 November 2025 and 12 November 2035 or at any time in the event of certain tax and regulatory events.
The securities must be converted into a variable number of QBE ordinary shares or written off if APRA determines QBE to be non-viable. The conversion rate is subject to a price floor of 20% of the VWAP of the shares in the five trading days before the date of issue of the securities.
Subordinated debt due 2046
On 17 June 2016, QBE exchanged $456 million of the $1,000 million subordinated debt securities due 2041 for $524 million of subordinated debt due 2046. The subordinated debt securities have a 30 year maturity and entitle holders to receive a fixed rate coupon of 5.875% per annum until 17 June 2026. The rate will reset in 2026 and 2036 to a rate calculated by reference to the then 10 year mid-market swap rate plus a margin of 4.395%. Interest is payable semi-annually in arrears.
The securities are redeemable at the option of QBE, with the written approval of APRA, on each interest reset date or at any time in the event of certain tax and regulatory events.
The securities must be converted into a variable number of QBE ordinary shares, or written off, if APRA determines QBE to be non-viable. The conversion rate is subject to a price floor of 20% of the VWAP of the shares in the five trading days before the date of issue of the securities.
Security arrangements
The claims of bondholders pursuant to the subordinated debt will be subordinated in right of payment to the claims of all senior creditors.
Additional Tier 1 instrumentsIn November 2017, the company issued $400 million of perpetual capital notes. These notes entitle holders to receive a fixed rate coupon of 5.25% per annum payable semi-annually in arrears until 16 May 2025. The rate will reset in May 2025 and on every fifth anniversary thereafter by reference to a reset rate to be determined at that time plus a margin of 3.047%. Distributions are discretionary and non-cumulative and the notes have no fixed redemption date.
The notes are redeemable at the option of QBE, with the prior written approval of APRA, on each interest reset date or at any time in the event of certain tax or regulatory events. In the event that APRA were to declare a point of non-viability, the notes must be converted into a variable number of QBE ordinary shares (in accordance with a predetermined formula) and if not converted within five business days then the notes must be written off.
The notes were issued under the QBE Gender Equality Bond Framework, details of which can be found on the QBE website.
How we account for the numbersBorrowings are initially measured at fair value net of transaction costs directly attributable to the transaction and are subsequently measured at amortised cost. Any difference between the proceeds and the redemption amount is recognised through profit or loss over the period of the financial liability using the effective interest method.
5. CAPITAL STRUCTURE
130
5.1.1 Fair value of borrowings
2018 2017US$M US$M
Bank loans – 7Senior debt 195 589Subordinated debt 2,719 3,056Additional Tier 1 instruments 348 407Total fair value of borrowings 3,262 4,059
Consistent with other financial instruments, QBE is required to disclose the basis of valuation with reference to the fair value hierarchy which is explained in detail in note 3.2.1. The fair value of the Group’s borrowings are categorised as level 2 fair value measurements. Fixed and floating rate securities are priced using broker quotes and comparable prices for similar instruments in active markets. Where no active market exists, floating rate resettable notes are priced using par plus accrued interest.
5.1.2 Financing and other costs
2018 2017US$M US$M
Financing costs 273 245Other costs 32 57Total financing and other costs 305 302
5.1.3 Movement in borrowings
2018 2017US$M US$M
At 1 January 3,616 3,474Net changes from financing cash flows (406) 79Other non-cash changes 17 14 Foreign exchange (39) 49 At 31 December 3,188 3,616
Oth
er in
form
ation
6
Perfo
rman
ce o
verv
iew
1
Bu
siness
review
2
Go
vern
ance
3
Directo
rs' R
epo
rt
4
QB
E In
suran
ce Gro
up
A
nn
ual R
epo
rt 2018
131F
inan
cial R
epo
rt
5
Notes to the financial statements continued
FOR THE YEAR ENDED 31 DECEMBER 2018
5.2 Cash and cash equivalents
2018 2017US$M US$M
Fixed interest rate 45 30Floating interest rate 818 542
863 572
Restrictions on useIncluded in cash and cash equivalents are amounts totalling $96 million (2017 $60 million) which are held in Lloyd’s syndicate trust funds. In order to conduct underwriting business within some territories, Lloyd’s syndicates are required to lodge assets in locally regulated trust funds. Under Lloyd’s byelaws, these amounts can only be used to pay claims and allowable expenses of the syndicates and cannot be withdrawn from the trust funds until allowed to be distributed as profit once annual solvency requirements are met.
QBE has operations in many countries which have foreign exchange controls and regulations. The nature of the controls and regulations is highly dependent on the relevant country’s banking practices, and these practices can vary from simple reporting requirements to outright prohibition of movement of funds without explicit prior central bank approval. The impact of these controls and regulations may be the restriction of the Group’s capacity to repatriate capital and/or profits. Whilst QBE’s operations in these countries are generally small, foreign exchange controls and regulations may impact our ability to repatriate funds.
How we account for the numbersCash and cash equivalents include cash at bank and on hand and deposits at call which are readily convertible to cash on hand and which are used for operational cash requirements. Amounts in cash and cash equivalents are the same as those included in the statement of cash flows.
The reconciliation of profit after income tax to cash flows from operating activities is included in note 8.3.
5.3 Equity and reserves
OverviewOrdinary shares in the company rank after all creditors, have no par value and entitle the holder to participate in dividends and the proceeds on winding up of the company in proportion to the number of shares held.
5.3.1 Share capital
2018 2017
NUMBER OF SHARES
NUMBER OF SHARES
MILLIONS US$M MILLIONS US$M
Issued ordinary shares, fully paid at 1 January 1,358 8,931 1,370 8,350Shares issued under the Employee Share and Option Plan – 1 – 1Shares issued under bonus share plan – – 1 – Shares bought back on-market and cancelled (31) (243) (13) (108)Foreign exchange – (859) – 688Issued ordinary shares, fully paid at 31 December 1,327 7,830 1,358 8,931Shares notified to the Australian Securities Exchange 1,328 7,834 1,359 8,937Less: Plan shares subject to non-recourse loans, derecognised under accounting standards (1) (4) (1) (6)Issued ordinary shares, fully paid at 31 December 1,327 7,830 1,358 8,931
5. CAPITAL STRUCTURE
132
5.3.2 Reserves
2018 2017US$M US$M
Owner occupied property revaluation reserve1
At 1 January 7 7Reclassification on disposal of owner occupied property (2) – Foreign exchange (1) – At 31 December 4 7Cash flow hedges reserve2
At 1 January (1) – Transfers into reserve – (1)At 31 December (1) (1)Foreign currency translation reserve3
At 1 January (1,977) (1,867)Net movement on translation 462 (216)Net movement on hedging transactions (187) 146Net movement relating to continuing operations 275 (70)Net movement relating to discontinued operations 147 (20)Taxation 38 (20)At 31 December (1,517) (1,977)Share‑based payment reserve4
At 1 January 202 220Options and conditional rights expense 34 39Transfers from reserve on vesting of options and conditional rights (53) (74)Foreign exchange (16) 17At 31 December 167 202Associates5
At 1 January – 1Net movement in the year – (1)At 31 December – – Premium on purchase of non‑controlling interests6
At 1 January (16) (15)Foreign exchange – (1)At 31 December (16) (16)Total reserves at 31 December (1,363) (1,785)
1 Used to recognise fair value movements in the carrying value of owner occupied property.2 Used to record gains or losses on cash flow hedges that are recognised directly in equity.3 Exchange gains and losses arising on translation of a foreign controlled entity and related hedging instruments are taken to the foreign
currency translation reserve, information on which is provided in notes 1.2.3 and 4.4. In the event of the disposal of a relevant net investment in a foreign operation, the related movement in the reserve is reclassified to profit or loss.
4 Used to recognise the fair value of instruments issued as share-based payments.5 Used to recognise the Group’s share of other comprehensive income of associates.6 Used to recognise movements in ownership interest that do not result in a change of control and represents the difference between the
amount by which the non-controlling interest is adjusted and the fair value of the consideration paid or received.
Oth
er in
form
ation
6
Perfo
rman
ce o
verv
iew
1
Bu
siness
review
2
Go
vern
ance
3
Directo
rs' R
epo
rt
4
QB
E In
suran
ce Gro
up
A
nn
ual R
epo
rt 2018
133F
inan
cial R
epo
rt
5
Notes to the financial statements continued
FOR THE YEAR ENDED 31 DECEMBER 2018
5.4 Dividends
OverviewThe Group’s dividend policy sets the dividend payout ratio in an ordinary year at around 65% of full year cash profit with a likely weighting of 40% for the interim dividend and 60% for the final.
2018 2017
INTERIM FINAL INTERIM
Dividend per share (Australian cents) 22 4 22 Franking percentage 30% 30% 30%Franked amount per share (Australian cents) 6.6 1.2 6.6Dividend payout (A$M) 297 54 302Payment date 5 October 2018 20 April 2018 29 September 2017
On 25 February 2019, the directors declared a 60% franked final dividend of 28 Australian cents per share payable on 18 April 2019. The final dividend payout is A$372 million (2017 A$54 million).
2018 2017US$M US$M
Previous year final dividend on ordinary shares – 30% franked (2016 50% franked) 42 342 Interim dividend on ordinary shares – 30% franked (2017 30% franked) 210 236 Bonus Share Plan dividend forgone (3) (8)Total dividend paid 249 570
Dividend Reinvestment and Bonus Share PlansThe company operates a Dividend Reinvestment Plan (DRP) and a Bonus Share Plan (BSP) which allow equity holders to receive their dividend entitlement in the form of QBE ordinary shares.
The last date of receipt of election notices to participate in the DRP or the BSP is 11 March 2019.
Bonus Share Plan dividend forgoneThe amount paid in dividends during the year has been reduced as a result of certain eligible shareholders participating in the BSP and forgoing all or part of their right to dividends. These shareholders were issued ordinary shares under the BSP. During the year 365,838 (2017 914,246) ordinary shares were issued under the BSP.
Franking creditsThe franking account balance on a tax paid basis at 31 December 2018 was a surplus of A$224 million (2017 A$199 million). After taking into account the impact of franking on the final dividend recommended by the Board since year end, but not recognised as a liability at year end, as well as franking credits relating to the tax payments for the 2018 financial year, the franking account balance will have a surplus of A$113 million (2017 A$257 million).
The unfranked part of the dividend is declared to be conduit foreign income. For shareholders not resident in Australia, the dividend will not be subject to Australian withholding tax.
5. CAPITAL STRUCTURE
134
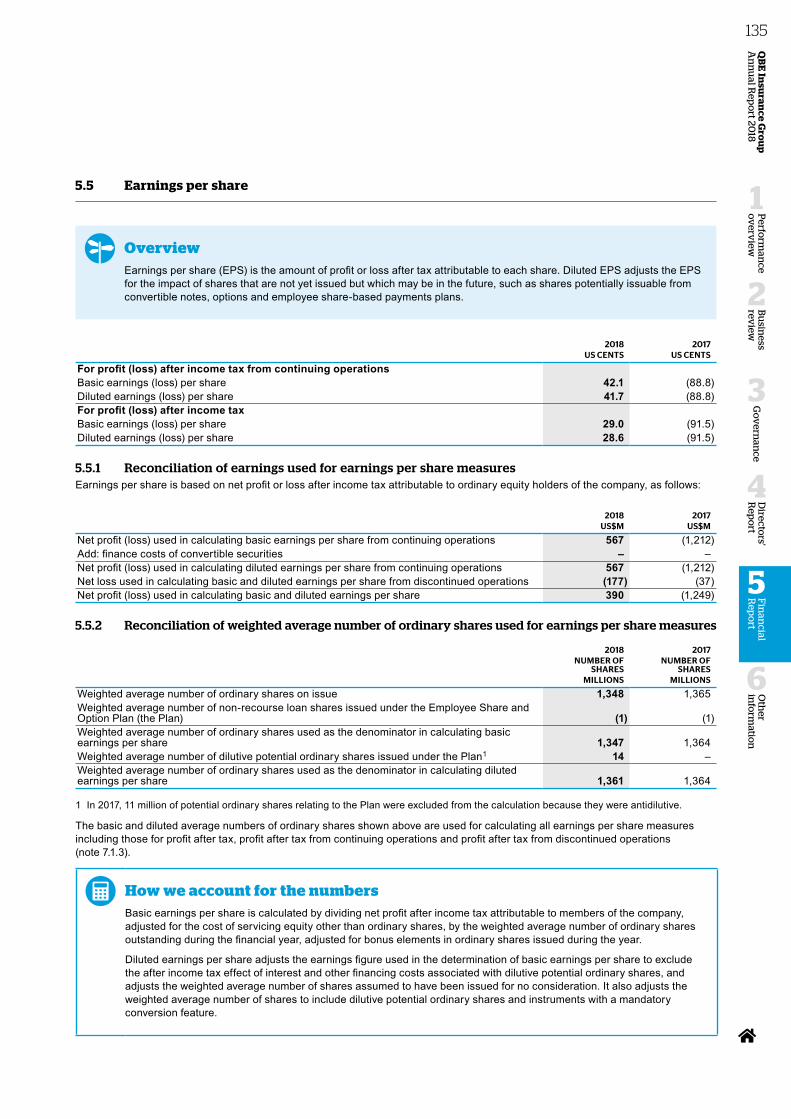
5.5 Earnings per share
OverviewEarnings per share (EPS) is the amount of profit or loss after tax attributable to each share. Diluted EPS adjusts the EPS for the impact of shares that are not yet issued but which may be in the future, such as shares potentially issuable from convertible notes, options and employee share-based payments plans.
2018 2017US CENTS US CENTS
For profit (loss) after income tax from continuing operationsBasic earnings (loss) per share 42.1 (88.8)Diluted earnings (loss) per share 41.7 (88.8)For profit (loss) after income taxBasic earnings (loss) per share 29.0 (91.5)Diluted earnings (loss) per share 28.6 (91.5)
5.5.1 Reconciliation of earnings used for earnings per share measuresEarnings per share is based on net profit or loss after income tax attributable to ordinary equity holders of the company, as follows:
2018 2017US$M US$M
Net profit (loss) used in calculating basic earnings per share from continuing operations 567 (1,212)Add: finance costs of convertible securities – – Net profit (loss) used in calculating diluted earnings per share from continuing operations 567 (1,212)Net loss used in calculating basic and diluted earnings per share from discontinued operations (177) (37)Net profit (loss) used in calculating basic and diluted earnings per share 390 (1,249)
5.5.2 Reconciliation of weighted average number of ordinary shares used for earnings per share measures
2018 2017NUMBER OF
SHARESNUMBER OF
SHARESMILLIONS MILLIONS
Weighted average number of ordinary shares on issue 1,348 1,365 Weighted average number of non-recourse loan shares issued under the Employee Share and Option Plan (the Plan) (1) (1)Weighted average number of ordinary shares used as the denominator in calculating basic earnings per share 1,347 1,364 Weighted average number of dilutive potential ordinary shares issued under the Plan1 14 –Weighted average number of ordinary shares used as the denominator in calculating diluted earnings per share 1,361 1,364
1 In 2017, 11 million of potential ordinary shares relating to the Plan were excluded from the calculation because they were antidilutive.
The basic and diluted average numbers of ordinary shares shown above are used for calculating all earnings per share measures including those for profit after tax, profit after tax from continuing operations and profit after tax from discontinued operations (note 7.1.3).
How we account for the numbersBasic earnings per share is calculated by dividing net profit after income tax attributable to members of the company, adjusted for the cost of servicing equity other than ordinary shares, by the weighted average number of ordinary shares outstanding during the financial year, adjusted for bonus elements in ordinary shares issued during the year.
Diluted earnings per share adjusts the earnings figure used in the determination of basic earnings per share to exclude the after income tax effect of interest and other financing costs associated with dilutive potential ordinary shares, and adjusts the weighted average number of shares assumed to have been issued for no consideration. It also adjusts the weighted average number of shares to include dilutive potential ordinary shares and instruments with a mandatory conversion feature.
Oth
er in
form
ation
6
Perfo
rman
ce o
verv
iew
1
Bu
siness
review
2
Go
vern
ance
3
Directo
rs' R
epo
rt
4
QB
E In
suran
ce Gro
up
A
nn
ual R
epo
rt 2018
135F
inan
cial R
epo
rt
5
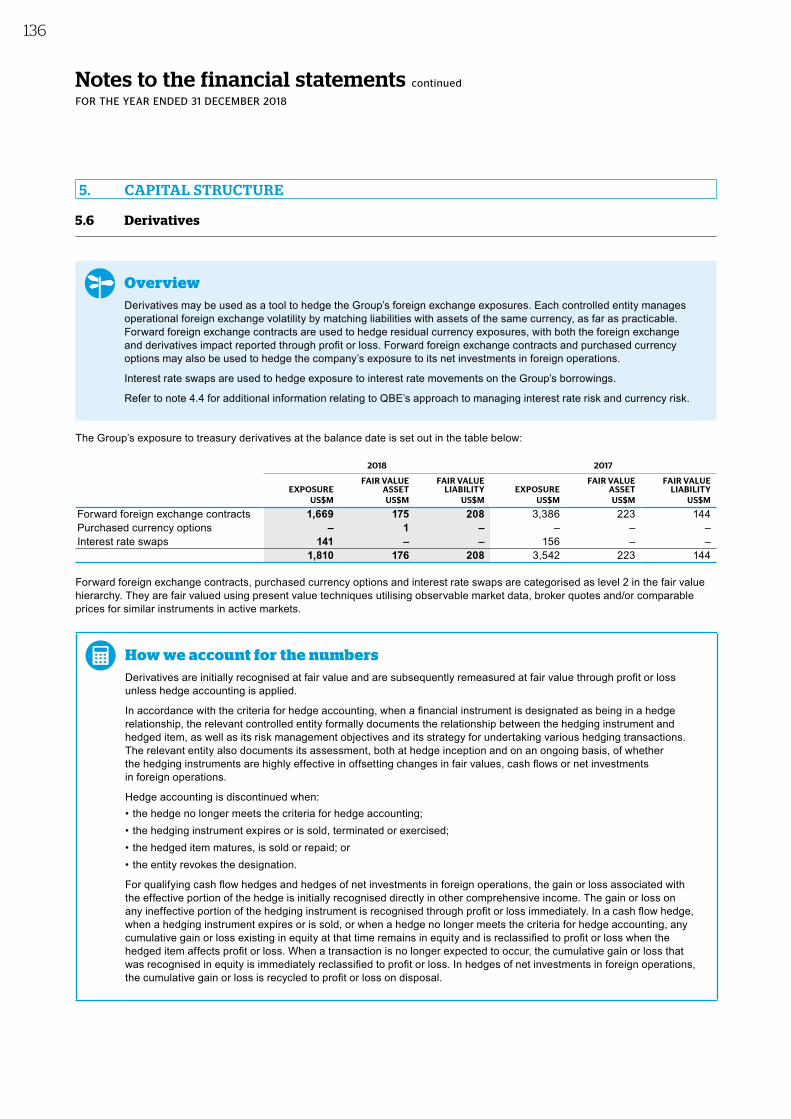
Notes to the financial statements continued
FOR THE YEAR ENDED 31 DECEMBER 2018
5.6 Derivatives
OverviewDerivatives may be used as a tool to hedge the Group’s foreign exchange exposures. Each controlled entity manages operational foreign exchange volatility by matching liabilities with assets of the same currency, as far as practicable. Forward foreign exchange contracts are used to hedge residual currency exposures, with both the foreign exchange and derivatives impact reported through profit or loss. Forward foreign exchange contracts and purchased currency options may also be used to hedge the company’s exposure to its net investments in foreign operations.
Interest rate swaps are used to hedge exposure to interest rate movements on the Group’s borrowings.
Refer to note 4.4 for additional information relating to QBE’s approach to managing interest rate risk and currency risk.
The Group’s exposure to treasury derivatives at the balance date is set out in the table below:
2018 2017
EXPOSUREFAIR VALUE
ASSETFAIR VALUE
LIABILITY EXPOSUREFAIR VALUE
ASSETFAIR VALUE
LIABILITYUS$M US$M US$M US$M US$M US$M
Forward foreign exchange contracts 1,669 175 208 3,386 223 144Purchased currency options – 1 – – – – Interest rate swaps 141 – – 156 – –
1,810 176 208 3,542 223 144
Forward foreign exchange contracts, purchased currency options and interest rate swaps are categorised as level 2 in the fair value hierarchy. They are fair valued using present value techniques utilising observable market data, broker quotes and/or comparable prices for similar instruments in active markets.
How we account for the numbersDerivatives are initially recognised at fair value and are subsequently remeasured at fair value through profit or loss unless hedge accounting is applied.
In accordance with the criteria for hedge accounting, when a financial instrument is designated as being in a hedge relationship, the relevant controlled entity formally documents the relationship between the hedging instrument and hedged item, as well as its risk management objectives and its strategy for undertaking various hedging transactions. The relevant entity also documents its assessment, both at hedge inception and on an ongoing basis, of whether the hedging instruments are highly effective in offsetting changes in fair values, cash flows or net investments in foreign operations.
Hedge accounting is discontinued when:• the hedge no longer meets the criteria for hedge accounting;• the hedging instrument expires or is sold, terminated or exercised; • the hedged item matures, is sold or repaid; or• the entity revokes the designation.
For qualifying cash flow hedges and hedges of net investments in foreign operations, the gain or loss associated with the effective portion of the hedge is initially recognised directly in other comprehensive income. The gain or loss on any ineffective portion of the hedging instrument is recognised through profit or loss immediately. In a cash flow hedge, when a hedging instrument expires or is sold, or when a hedge no longer meets the criteria for hedge accounting, any cumulative gain or loss existing in equity at that time remains in equity and is reclassified to profit or loss when the hedged item affects profit or loss. When a transaction is no longer expected to occur, the cumulative gain or loss that was recognised in equity is immediately reclassified to profit or loss. In hedges of net investments in foreign operations, the cumulative gain or loss is recycled to profit or loss on disposal.
5. CAPITAL STRUCTURE
136
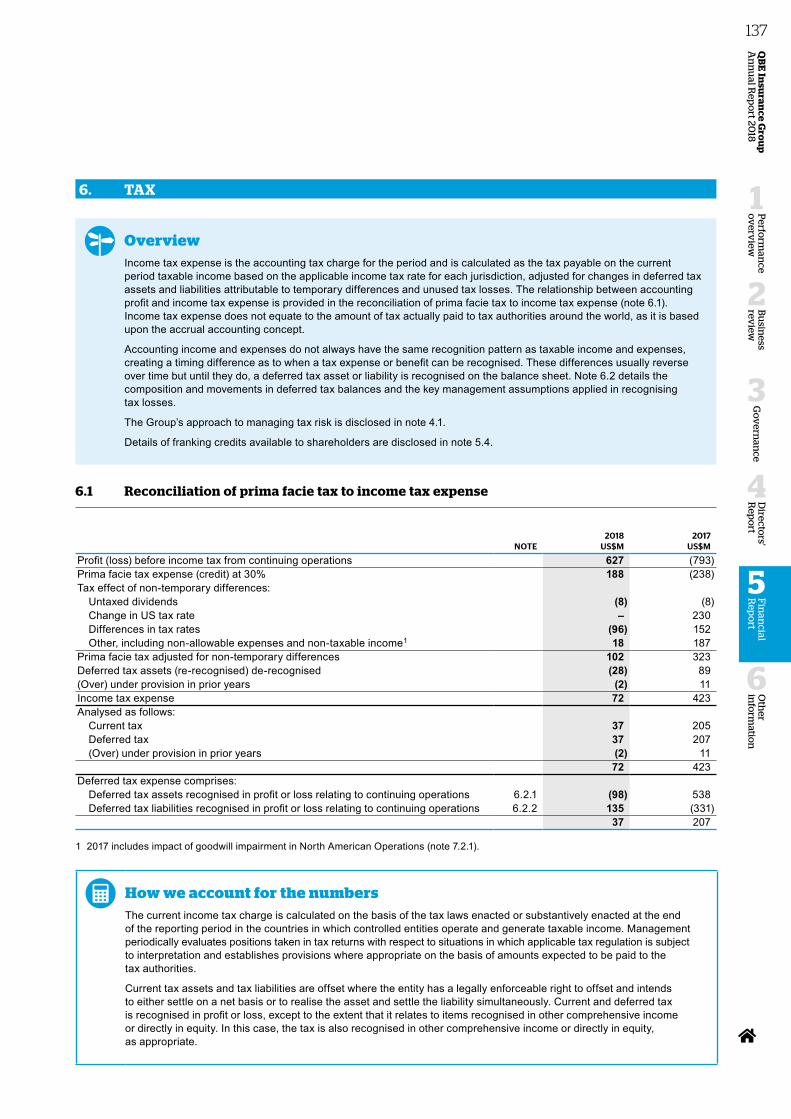
6. TAX
OverviewIncome tax expense is the accounting tax charge for the period and is calculated as the tax payable on the current period taxable income based on the applicable income tax rate for each jurisdiction, adjusted for changes in deferred tax assets and liabilities attributable to temporary differences and unused tax losses. The relationship between accounting profit and income tax expense is provided in the reconciliation of prima facie tax to income tax expense (note 6.1). Income tax expense does not equate to the amount of tax actually paid to tax authorities around the world, as it is based upon the accrual accounting concept.
Accounting income and expenses do not always have the same recognition pattern as taxable income and expenses, creating a timing difference as to when a tax expense or benefit can be recognised. These differences usually reverse over time but until they do, a deferred tax asset or liability is recognised on the balance sheet. Note 6.2 details the composition and movements in deferred tax balances and the key management assumptions applied in recognising tax losses.
The Group’s approach to managing tax risk is disclosed in note 4.1.
Details of franking credits available to shareholders are disclosed in note 5.4.
6.1 Reconciliation of prima facie tax to income tax expense
2018 2017NOTE US$M US$M
Profit (loss) before income tax from continuing operations 627 (793)Prima facie tax expense (credit) at 30% 188 (238)Tax effect of non-temporary differences:
Untaxed dividends (8) (8)Change in US tax rate – 230Differences in tax rates (96) 152Other, including non-allowable expenses and non-taxable income1 18 187
Prima facie tax adjusted for non-temporary differences 102 323Deferred tax assets (re-recognised) de-recognised (28) 89(Over) under provision in prior years (2) 11Income tax expense 72 423Analysed as follows:
Current tax 37 205Deferred tax 37 207(Over) under provision in prior years (2) 11
72 423Deferred tax expense comprises:
Deferred tax assets recognised in profit or loss relating to continuing operations 6.2.1 (98) 538Deferred tax liabilities recognised in profit or loss relating to continuing operations 6.2.2 135 (331)
37 207
1 2017 includes impact of goodwill impairment in North American Operations (note 7.2.1).
How we account for the numbersThe current income tax charge is calculated on the basis of the tax laws enacted or substantively enacted at the end of the reporting period in the countries in which controlled entities operate and generate taxable income. Management periodically evaluates positions taken in tax returns with respect to situations in which applicable tax regulation is subject to interpretation and establishes provisions where appropriate on the basis of amounts expected to be paid to the tax authorities.
Current tax assets and tax liabilities are offset where the entity has a legally enforceable right to offset and intends to either settle on a net basis or to realise the asset and settle the liability simultaneously. Current and deferred tax is recognised in profit or loss, except to the extent that it relates to items recognised in other comprehensive income or directly in equity. In this case, the tax is also recognised in other comprehensive income or directly in equity, as appropriate.
Oth
er in
form
ation
6
Perfo
rman
ce o
verv
iew
1
Bu
siness
review
2
Go
vern
ance
3
Directo
rs' R
epo
rt
4
QB
E In
suran
ce Gro
up
A
nn
ual R
epo
rt 2018
137F
inan
cial R
epo
rt
5
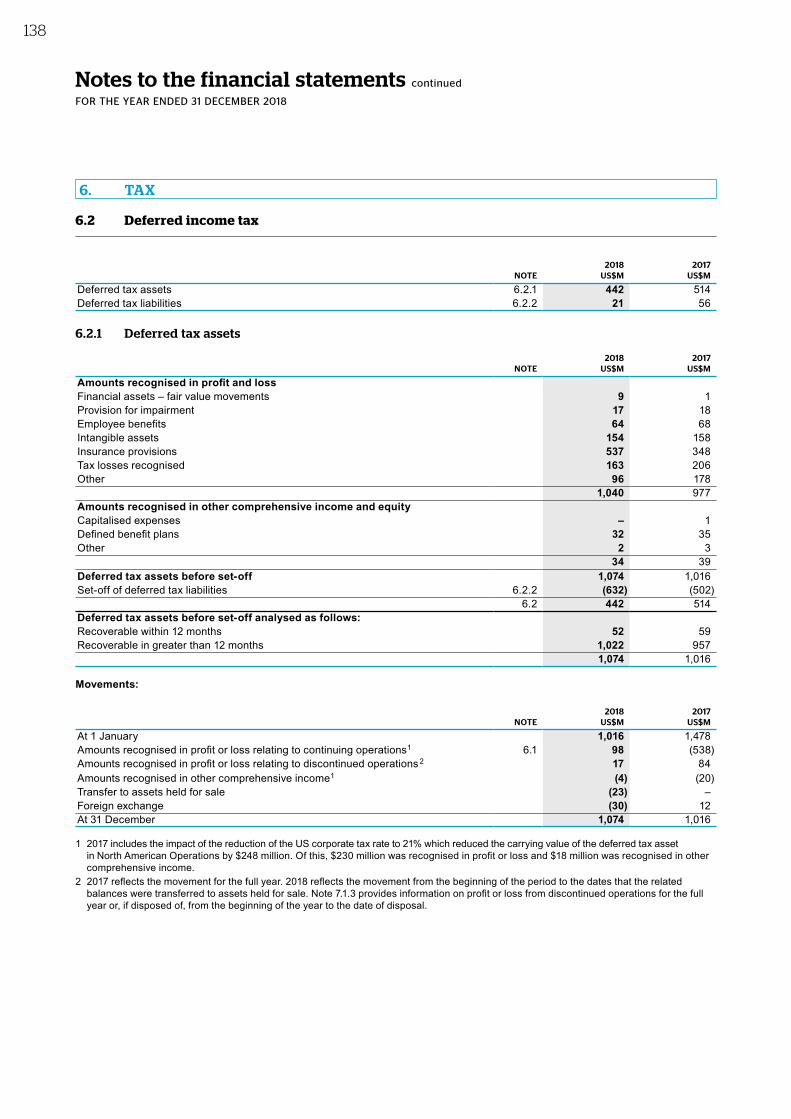
Notes to the financial statements continued
FOR THE YEAR ENDED 31 DECEMBER 2018
6.2 Deferred income tax
2018 2017NOTE US$M US$M
Deferred tax assets 6.2.1 442 514 Deferred tax liabilities 6.2.2 21 56
6.2.1 Deferred tax assets
2018 2017NOTE US$M US$M
Amounts recognised in profit and lossFinancial assets – fair value movements 9 1Provision for impairment 17 18Employee benefits 64 68Intangible assets 154 158Insurance provisions 537 348Tax losses recognised 163 206Other 96 178
1,040 977Amounts recognised in other comprehensive income and equityCapitalised expenses – 1Defined benefit plans 32 35Other 2 3
34 39Deferred tax assets before set‑off 1,074 1,016Set-off of deferred tax liabilities 6.2.2 (632) (502)
6.2 442 514Deferred tax assets before set‑off analysed as follows:Recoverable within 12 months 52 59Recoverable in greater than 12 months 1,022 957
1,074 1,016
Movements:
2018 2017NOTE US$M US$M
At 1 January 1,016 1,478Amounts recognised in profit or loss relating to continuing operations1 6.1 98 (538)Amounts recognised in profit or loss relating to discontinued operations 2 17 84Amounts recognised in other comprehensive income1 (4) (20)Transfer to assets held for sale (23) – Foreign exchange (30) 12At 31 December 1,074 1,016
1 2017 includes the impact of the reduction of the US corporate tax rate to 21% which reduced the carrying value of the deferred tax asset in North American Operations by $248 million. Of this, $230 million was recognised in profit or loss and $18 million was recognised in other comprehensive income.
2 2017 reflects the movement for the full year. 2018 reflects the movement from the beginning of the period to the dates that the related balances were transferred to assets held for sale. Note 7.1.3 provides information on profit or loss from discontinued operations for the full year or, if disposed of, from the beginning of the year to the date of disposal.
6. TAX
138
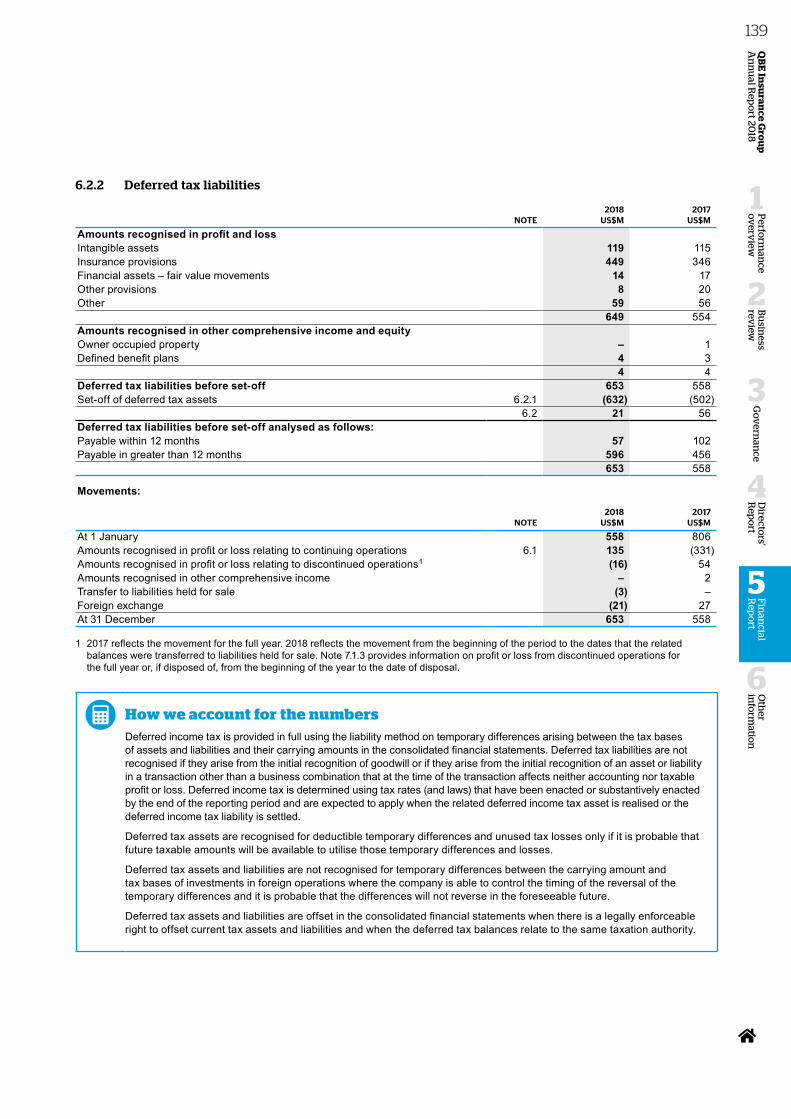
6.2.2 Deferred tax liabilities
2018 2017NOTE US$M US$M
Amounts recognised in profit and lossIntangible assets 119 115Insurance provisions 449 346Financial assets – fair value movements 14 17Other provisions 8 20Other 59 56
649 554Amounts recognised in other comprehensive income and equityOwner occupied property – 1Defined benefit plans 4 3
4 4Deferred tax liabilities before set‑off 653 558Set-off of deferred tax assets 6.2.1 (632) (502) 6.2 21 56Deferred tax liabilities before set‑off analysed as follows:Payable within 12 months 57 102Payable in greater than 12 months 596 456
653 558
Movements:
2018 2017NOTE US$M US$M
At 1 January 558 806Amounts recognised in profit or loss relating to continuing operations 6.1 135 (331)Amounts recognised in profit or loss relating to discontinued operations1 (16) 54Amounts recognised in other comprehensive income – 2Transfer to liabilities held for sale (3) – Foreign exchange (21) 27At 31 December 653 558
1 2017 reflects the movement for the full year. 2018 reflects the movement from the beginning of the period to the dates that the related balances were transferred to liabilities held for sale. Note 7.1.3 provides information on profit or loss from discontinued operations for the full year or, if disposed of, from the beginning of the year to the date of disposal.
How we account for the numbersDeferred income tax is provided in full using the liability method on temporary differences arising between the tax bases of assets and liabilities and their carrying amounts in the consolidated financial statements. Deferred tax liabilities are not recognised if they arise from the initial recognition of goodwill or if they arise from the initial recognition of an asset or liability in a transaction other than a business combination that at the time of the transaction affects neither accounting nor taxable profit or loss. Deferred income tax is determined using tax rates (and laws) that have been enacted or substantively enacted by the end of the reporting period and are expected to apply when the related deferred income tax asset is realised or the deferred income tax liability is settled.
Deferred tax assets are recognised for deductible temporary differences and unused tax losses only if it is probable that future taxable amounts will be available to utilise those temporary differences and losses.
Deferred tax assets and liabilities are not recognised for temporary differences between the carrying amount and tax bases of investments in foreign operations where the company is able to control the timing of the reversal of the temporary differences and it is probable that the differences will not reverse in the foreseeable future.
Deferred tax assets and liabilities are offset in the consolidated financial statements when there is a legally enforceable right to offset current tax assets and liabilities and when the deferred tax balances relate to the same taxation authority.
Oth
er in
form
ation
6
Perfo
rman
ce o
verv
iew
1
Bu
siness
review
2
Go
vern
ance
3
Directo
rs' R
epo
rt
4
QB
E In
suran
ce Gro
up
A
nn
ual R
epo
rt 2018
139F
inan
cial R
epo
rt
5
Notes to the financial statements continued
FOR THE YEAR ENDED 31 DECEMBER 2018
6.2.3 Tax lossesThe Group has not brought to account $295 million (2017 $259 million) of tax losses, which includes the benefit arising from tax losses in overseas countries. $69 million of tax losses not brought to account have an indefinite life, $74 million expire on 1 January 2019 due to Brexit and the remaining $152 million expire in six to 19 years. The benefits of unused tax losses will only be brought to account when it is probable that they will be realised.
This benefit of tax losses will only be obtained if:• the Group derives future assessable income of a nature and an amount sufficient to enable the benefit from the deductions for the
losses to be realised;• the Group continues to comply with the conditions for deductibility imposed by tax legislation; and• no changes in tax legislation adversely affect the Group in realising the benefit from the deductions for the losses.
Critical accounting judgements and estimates
Recoverability of deferred tax assetsQBE assesses the recoverability of deferred tax assets at each balance date. In making this assessment, QBE considers in particular the controlled entity’s future business plans, history of generating taxable profits, whether the unused tax losses resulted from identifiable causes which are unlikely to recur and if any tax planning opportunities exist in the period in which the taxable losses can be utilised.
As discussed in the Group’s Half Year Report for the period ended 30 June 2018, the US Tax Reform Act signed into law on 22 December 2017 introduced a Base Erosion Anti-Abuse Tax (BEAT) on payments made from US tax paying entities to non-US affiliated companies, which for Bermudian domiciled captive reinsurers like Equator Re introduced a 10% tax on all premium ceded from US based cedants. During the first half of 2018, and in response to the US tax reform, QBE created Blue Ocean Re, a new Bermudian domiciled captive which owns Equator Re and is in turn owned by North American Operations. The corporate restructure required no additional capital to be deployed and mitigated the impact of the BEAT, with taxable profits of Blue Ocean Re and Equator Re now effectively taxed at the US corporate rate of 21% and able to be offset against existing tax losses in North American Operations.
The recognised US deferred tax asset of $370 million (2017 $325 million) comprises $151 million (2017 $59 million) of carry forward tax losses and $219 million (2017 $266 million) of deductible temporary differences, net of applicable offsetting deferred tax liabilities, as a result of insurance technical reserves and the tax deductibility of goodwill and other intangibles.
Uncertainty continues to exist in relation to the utilisation of this asset, which is subject to there being continued future taxable profits over the period of time in which the losses can be utilised. QBE has made a judgement that the US tax group will be able to generate sufficient taxable profits over the foreseeable future, based upon its future business plans. Key assumptions include a continuation of taxable profit driven by no material deterioration in the prior accident year central estimate, a sustained return to underwriting profitability, benefits flowing from initiatives to reduce the cost base of the division and future increases in investment yields. Losses expire over the next 19 years, with the majority expiring between 2030 and 2034. The uncertainty around the recognition of the deferred tax asset will be resolved in future years if taxable profits are generated. Recovery of the asset continues to be sensitive to changes in the combined operating ratio, premium growth and investment yield assumption as these items are the key drivers of future taxable income.
6.2.4 Tax consolidation legislationOn adoption of the tax consolidation legislation, the company and its wholly-owned Australian controlled entities entered into a tax sharing and tax funding agreement that requires the Australian entities to fully compensate the company for current tax liabilities and to be fully compensated by the company for any current tax or deferred tax assets in respect of tax losses arising from external transactions occurring after the date of implementation of the tax consolidation legislation. The contributions are allocated by reference to the notional taxable income of each Australian entity. The head entity is QBE Insurance Group Limited.
6. TAX
140
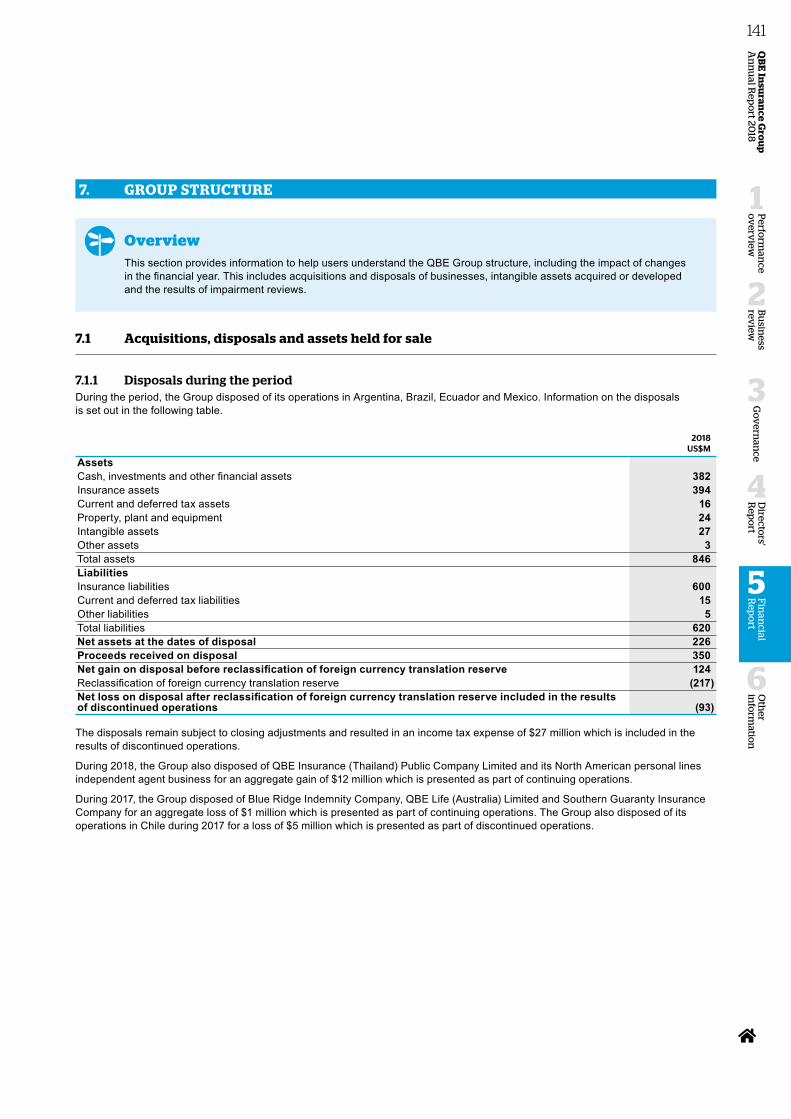
7. GROUP STRUCTURE
OverviewThis section provides information to help users understand the QBE Group structure, including the impact of changes in the financial year. This includes acquisitions and disposals of businesses, intangible assets acquired or developed and the results of impairment reviews.
7.1 Acquisitions, disposals and assets held for sale
7.1.1 Disposals during the periodDuring the period, the Group disposed of its operations in Argentina, Brazil, Ecuador and Mexico. Information on the disposals is set out in the following table.
2018US$M
Assets Cash, investments and other financial assets 382Insurance assets 394Current and deferred tax assets 16Property, plant and equipment 24Intangible assets 27Other assets 3Total assets 846LiabilitiesInsurance liabilities 600Current and deferred tax liabilities 15Other liabilities 5Total liabilities 620Net assets at the dates of disposal 226Proceeds received on disposal 350Net gain on disposal before reclassification of foreign currency translation reserve 124Reclassification of foreign currency translation reserve (217)Net loss on disposal after reclassification of foreign currency translation reserve included in the results of discontinued operations (93)
The disposals remain subject to closing adjustments and resulted in an income tax expense of $27 million which is included in the results of discontinued operations.
During 2018, the Group also disposed of QBE Insurance (Thailand) Public Company Limited and its North American personal lines independent agent business for an aggregate gain of $12 million which is presented as part of continuing operations.
During 2017, the Group disposed of Blue Ridge Indemnity Company, QBE Life (Australia) Limited and Southern Guaranty Insurance Company for an aggregate loss of $1 million which is presented as part of continuing operations. The Group also disposed of its operations in Chile during 2017 for a loss of $5 million which is presented as part of discontinued operations.
Oth
er in
form
ation
6
Perfo
rman
ce o
verv
iew
1
Bu
siness
review
2
Go
vern
ance
3
Directo
rs' R
epo
rt
4
QB
E In
suran
ce Gro
up
A
nn
ual R
epo
rt 2018
141F
inan
cial R
epo
rt
5
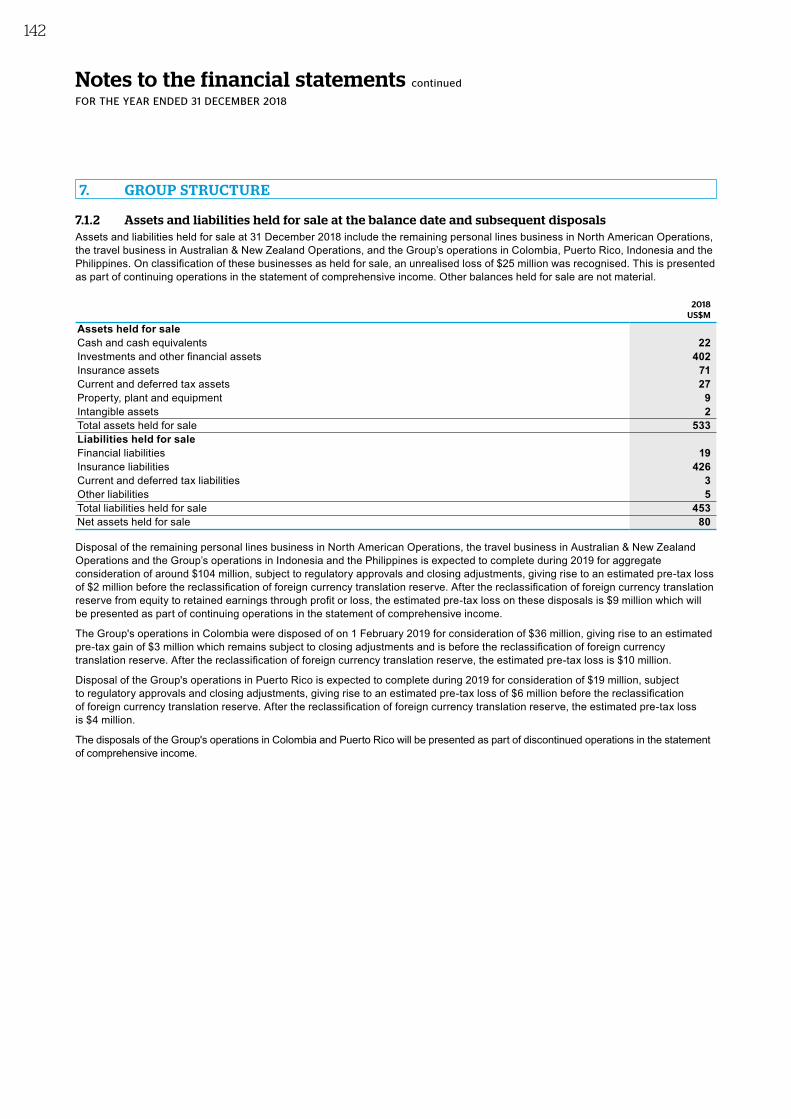
Notes to the financial statements continued
FOR THE YEAR ENDED 31 DECEMBER 2018
7.1.2 Assets and liabilities held for sale at the balance date and subsequent disposalsAssets and liabilities held for sale at 31 December 2018 include the remaining personal lines business in North American Operations, the travel business in Australian & New Zealand Operations, and the Group’s operations in Colombia, Puerto Rico, Indonesia and the Philippines. On classification of these businesses as held for sale, an unrealised loss of $25 million was recognised. This is presented as part of continuing operations in the statement of comprehensive income. Other balances held for sale are not material.
2018US$M
Assets held for saleCash and cash equivalents 22Investments and other financial assets 402Insurance assets 71Current and deferred tax assets 27Property, plant and equipment 9Intangible assets 2Total assets held for sale 533Liabilities held for saleFinancial liabilities 19Insurance liabilities 426Current and deferred tax liabilities 3Other liabilities 5Total liabilities held for sale 453Net assets held for sale 80
Disposal of the remaining personal lines business in North American Operations, the travel business in Australian & New Zealand Operations and the Group’s operations in Indonesia and the Philippines is expected to complete during 2019 for aggregate consideration of around $104 million, subject to regulatory approvals and closing adjustments, giving rise to an estimated pre-tax loss of $2 million before the reclassification of foreign currency translation reserve. After the reclassification of foreign currency translation reserve from equity to retained earnings through profit or loss, the estimated pre-tax loss on these disposals is $9 million which will be presented as part of continuing operations in the statement of comprehensive income.
The Group's operations in Colombia were disposed of on 1 February 2019 for consideration of $36 million, giving rise to an estimated pre-tax gain of $3 million which remains subject to closing adjustments and is before the reclassification of foreign currency translation reserve. After the reclassification of foreign currency translation reserve, the estimated pre-tax loss is $10 million.
Disposal of the Group's operations in Puerto Rico is expected to complete during 2019 for consideration of $19 million, subject to regulatory approvals and closing adjustments, giving rise to an estimated pre-tax loss of $6 million before the reclassification of foreign currency translation reserve. After the reclassification of foreign currency translation reserve, the estimated pre-tax loss is $4 million.
The disposals of the Group's operations in Colombia and Puerto Rico will be presented as part of discontinued operations in the statement of comprehensive income.
7. GROUP STRUCTURE
142
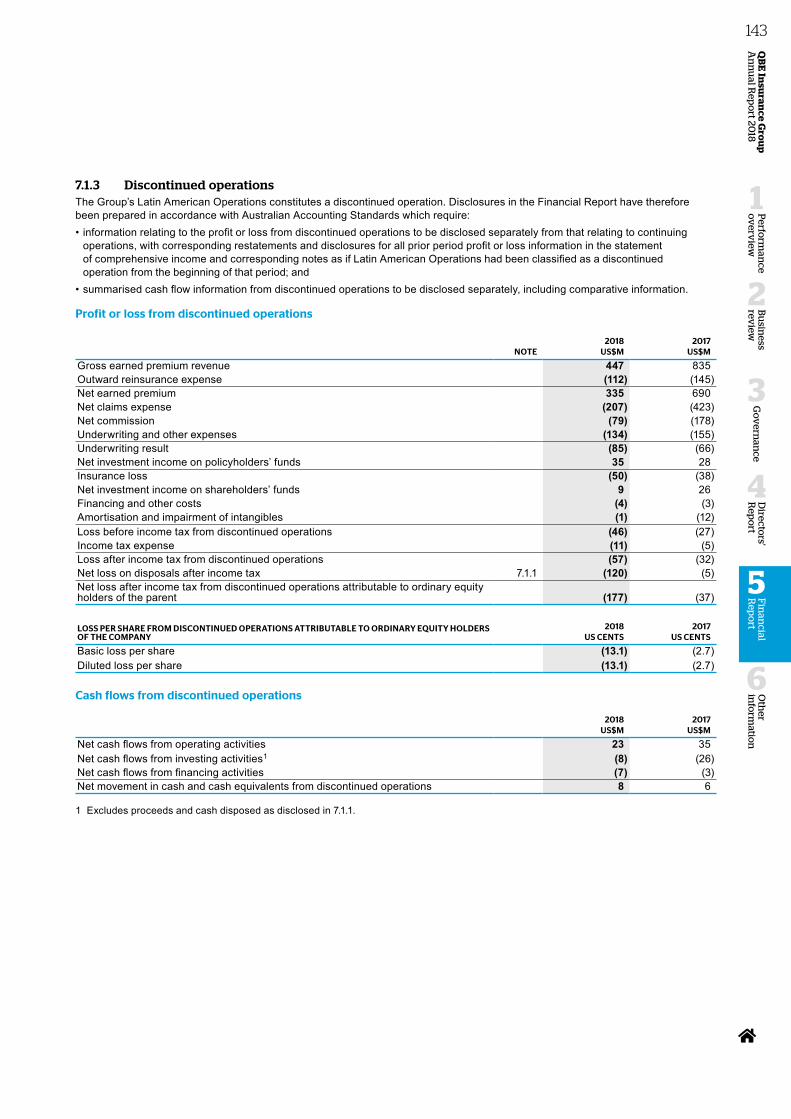
7.1.3 Discontinued operationsThe Group’s Latin American Operations constitutes a discontinued operation. Disclosures in the Financial Report have therefore been prepared in accordance with Australian Accounting Standards which require:• information relating to the profit or loss from discontinued operations to be disclosed separately from that relating to continuing
operations, with corresponding restatements and disclosures for all prior period profit or loss information in the statement of comprehensive income and corresponding notes as if Latin American Operations had been classified as a discontinued operation from the beginning of that period; and
• summarised cash flow information from discontinued operations to be disclosed separately, including comparative information.
Profit or loss from discontinued operations
2018 2017NOTE US$M US$M
Gross earned premium revenue 447 835Outward reinsurance expense (112) (145)Net earned premium 335 690Net claims expense (207) (423)Net commission (79) (178)Underwriting and other expenses (134) (155)Underwriting result (85) (66)Net investment income on policyholders’ funds 35 28Insurance loss (50) (38)Net investment income on shareholders’ funds 9 26Financing and other costs (4) (3)Amortisation and impairment of intangibles (1) (12)Loss before income tax from discontinued operations (46) (27)Income tax expense (11) (5)Loss after income tax from discontinued operations (57) (32)Net loss on disposals after income tax 7.1.1 (120) (5)Net loss after income tax from discontinued operations attributable to ordinary equity holders of the parent (177) (37)
LOSS PER SHARE FROM DISCONTINUED OPERATIONS ATTRIBUTABLE TO ORDINARY EQUITY HOLDERS OF THE COMPANY
2018 2017US CENTS US CENTS
Basic loss per share (13.1) (2.7)Diluted loss per share (13.1) (2.7)
Cash flows from discontinued operations
2018 2017US$M US$M
Net cash flows from operating activities 23 35Net cash flows from investing activities1 (8) (26)Net cash flows from financing activities (7) (3)Net movement in cash and cash equivalents from discontinued operations 8 6
1 Excludes proceeds and cash disposed as disclosed in 7.1.1.
Oth
er in
form
ation
6
Perfo
rman
ce o
verv
iew
1
Bu
siness
review
2
Go
vern
ance
3
Directo
rs' R
epo
rt
4
QB
E In
suran
ce Gro
up
A
nn
ual R
epo
rt 2018
143F
inan
cial R
epo
rt
5
Notes to the financial statements continued
FOR THE YEAR ENDED 31 DECEMBER 2018
7.2 Intangible assets
OverviewIntangible assets are assets with no physical substance. The most significant classes of intangible assets are detailed below:
Lloyd’s syndicate capacityThe Lloyd’s syndicate capacity intangible asset relates to the syndicate capacity acquired as part of the acquisition of QBE Underwriting Limited (formerly trading as Limit) in 2000 and costs incurred as a result of increasing capacity since that date. Syndicate capacity is the aggregate of the premium limits of each member of that syndicate at a point in time. An existing capital provider has the first right to participate on the next year of account, giving the indefinite right to participate on all future years of account. The Group has demonstrated a long-term commitment to developing its operations at Lloyd’s. The value of this asset is in the access it gives to future underwriting profits at Lloyd’s. For these reasons, Lloyd’s syndicate capacity is deemed to have an indefinite useful life.
Customer relationshipsCustomer relationships comprise the capitalisation of future profits relating to insurance contracts acquired and the expected renewal of those contracts. It also includes the value of the distribution networks and agency relationships. Customer relationships are amortised over remaining lives of up to 20 years depending on the classes of business to which the assets relate.
Brand namesThese assets reflect the revenue generating ability of acquired brands. In some circumstances, brand names are considered to have an indefinite useful life due to the long-term nature of the asset. When there is a contractual limit on the use of the brand name, the asset is amortised over the remaining period, being in the range of up to 20 years.
Insurance licencesThese assets give the Group the right to operate in certain geographic locations and to write certain classes of business with a potential to generate additional revenue. They are considered to have an indefinite useful life due to their long-term nature.
SoftwareThis includes both acquired and internally developed software which is not integral or closely related to an item of hardware such as an underwriting system. Capitalised software is amortised over periods of up to 10 years, reflecting the period during which the Group is expected to benefit from the use of the software.
GoodwillGoodwill represents the excess of the cost of an acquisition over the fair value of the Group’s share of the net identifiable assets acquired. Goodwill has an indefinite useful life and therefore is not subject to amortisation but is tested for impairment annually, or more often if there is an indication of impairment.
7. GROUP STRUCTURE
144
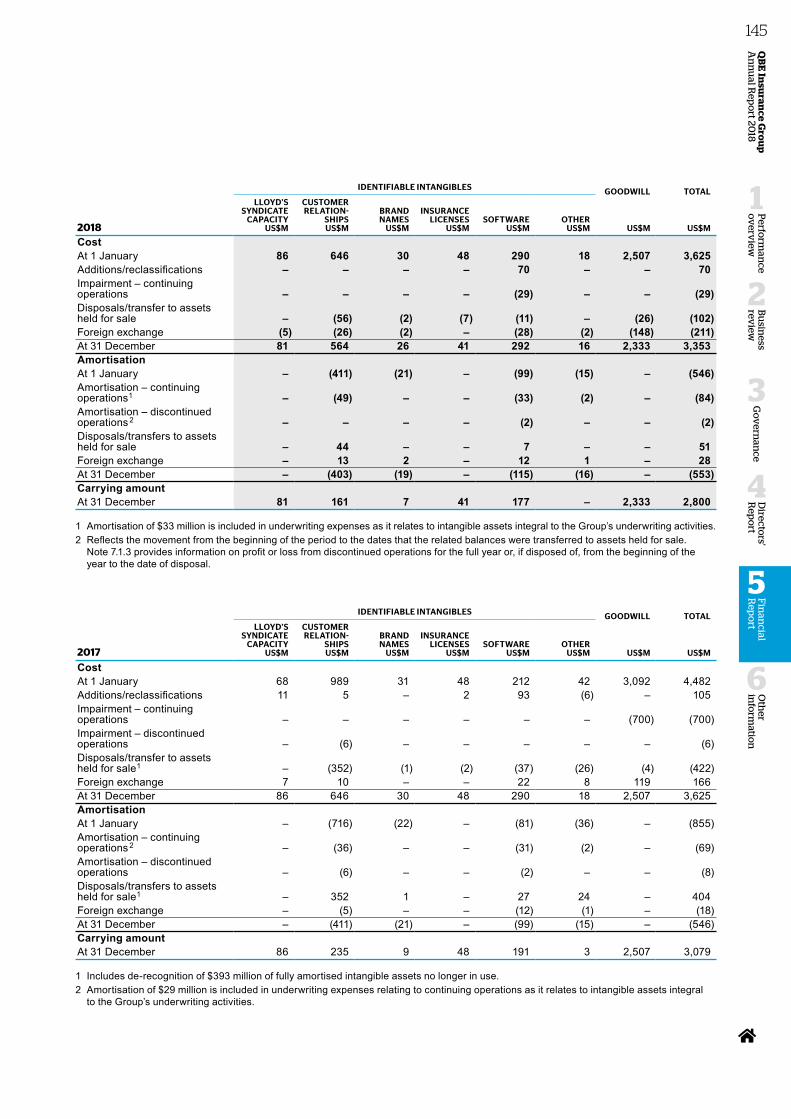
IDENTIFIABLE INTANGIBLES GOODWILL TOTAL
2018
LLOYD’S SYNDICATE
CAPACITY US$M
CUSTOMER RELATION-
SHIPS US$M
BRAND NAMES
US$M
INSURANCE LICENSES
US$MSOFTWARE
US$MOTHER
US$M
US$M
US$M
CostAt 1 January 86 646 30 48 290 18 2,507 3,625Additions/reclassifications – – – – 70 – – 70Impairment – continuing operations – – – – (29) – – (29)Disposals/transfer to assets held for sale – (56) (2) (7) (11) – (26) (102)Foreign exchange (5) (26) (2) – (28) (2) (148) (211)At 31 December 81 564 26 41 292 16 2,333 3,353 AmortisationAt 1 January – (411) (21) – (99) (15) – (546)Amortisation – continuing operations1 – (49) – – (33) (2) – (84)Amortisation – discontinued operations2 – – – – (2) – – (2)Disposals/transfers to assets held for sale – 44 – – 7 – – 51Foreign exchange – 13 2 – 12 1 – 28At 31 December – (403) (19) – (115) (16) – (553)Carrying amountAt 31 December 81 161 7 41 177 – 2,333 2,800
1 Amortisation of $33 million is included in underwriting expenses as it relates to intangible assets integral to the Group’s underwriting activities.2 Reflects the movement from the beginning of the period to the dates that the related balances were transferred to assets held for sale.
Note 7.1.3 provides information on profit or loss from discontinued operations for the full year or, if disposed of, from the beginning of the year to the date of disposal.
IDENTIFIABLE INTANGIBLES GOODWILL TOTAL
2017
LLOYD’S SYNDICATE
CAPACITY US$M
CUSTOMER RELATION-
SHIPS US$M
BRAND NAMES
US$M
INSURANCE LICENSES
US$MSOFTWARE
US$MOTHER
US$M
US$M
US$M
CostAt 1 January 68 989 31 48 212 42 3,092 4,482Additions/reclassifications 11 5 – 2 93 (6) – 105Impairment – continuing operations – – – – – – (700) (700)Impairment – discontinued operations – (6) – – – – – (6)Disposals/transfer to assets held for sale1 – (352) (1) (2) (37) (26) (4) (422)Foreign exchange 7 10 – – 22 8 119 166At 31 December 86 646 30 48 290 18 2,507 3,625 AmortisationAt 1 January – (716) (22) – (81) (36) – (855)Amortisation – continuing operations 2 – (36) – – (31) (2) – (69)Amortisation – discontinued operations – (6) – – (2) – – (8)Disposals/transfers to assets held for sale1 – 352 1 – 27 24 – 404Foreign exchange – (5) – – (12) (1) – (18)At 31 December – (411) (21) – (99) (15) – (546)Carrying amountAt 31 December 86 235 9 48 191 3 2,507 3,079
1 Includes de-recognition of $393 million of fully amortised intangible assets no longer in use.2 Amortisation of $29 million is included in underwriting expenses relating to continuing operations as it relates to intangible assets integral
to the Group’s underwriting activities.
Oth
er in
form
ation
6
Perfo
rman
ce o
verv
iew
1
Bu
siness
review
2
Go
vern
ance
3
Directo
rs' R
epo
rt
4
QB
E In
suran
ce Gro
up
A
nn
ual R
epo
rt 2018
145F
inan
cial R
epo
rt
5
Notes to the financial statements continued
FOR THE YEAR ENDED 31 DECEMBER 2018
How we account for the numbersIntangible assets are measured at cost less accumulated amortisation and impairment. Those with a finite useful life are amortised over their estimated useful life in accordance with the pattern of expected consumption of economic benefits, with amortisation expense reported in underwriting and other expenses or in amortisation and impairment of intangibles depending on the use of the asset. Intangible assets with an indefinite useful life are not subject to amortisation but are tested for impairment annually or more frequently if there are indicators of impairment. Intangible assets with a finite useful life are reviewed for impairment whenever events or changes in circumstances indicate that the carrying amount may not be recoverable.
7.2.1 Impairment testing of intangible assets
OverviewAn intangible asset’s recoverable value is the greater of its value in use and its fair value less cost to sell.
For intangible assets with a finite life, if there are indicators that the intangible asset’s recoverable value has fallen below its carrying value (e.g. due to changing market conditions), an impairment test is performed and a loss is recognised for the amount by which the carrying value exceeds the asset’s recoverable value.
Intangible assets that have an indefinite useful life, such as goodwill, are tested annually for impairment or more frequently where there is an indication that the carrying amount may not be recoverable.
Goodwill is allocated to cash generating units, or groups of units, expected to benefit from synergies arising from the acquisition giving rise to the goodwill. Cash generating units or groups of cash generating units reflect the level at which goodwill is monitored for impairment by management. As the Group continues to acquire operations and reorganise the way that operations are managed, reporting structures may change, giving rise to a reassessment of cash generating units and/or the allocation of goodwill to those cash generating units.
The goodwill relating to certain acquisitions is denominated in currencies other than the US dollar and so is subject to foreign exchange movements.
Goodwill is analysed by groups of cash generating units as follows:
2018 2017US$M US$M
North American Operations 832 843Australian & New Zealand Operations 1,098 1,217European Operations 401 425Other 2 22
2,333 2,507
Impairment lossesDuring 2018, software assets of $29 million were impaired following management's review.
During 2017, $700 million of goodwill in North American Operations was impaired. This was mainly due to updated assumptions in our business plan after consideration of second half year performance and taking into account the impact of a transaction in late 2017 to reinsure potentially volatile claims liabilities to a third party. Intangibles in Latin American Operations of $6 million were also impaired following management’s review of expected future cash flows.
7. GROUP STRUCTURE
146
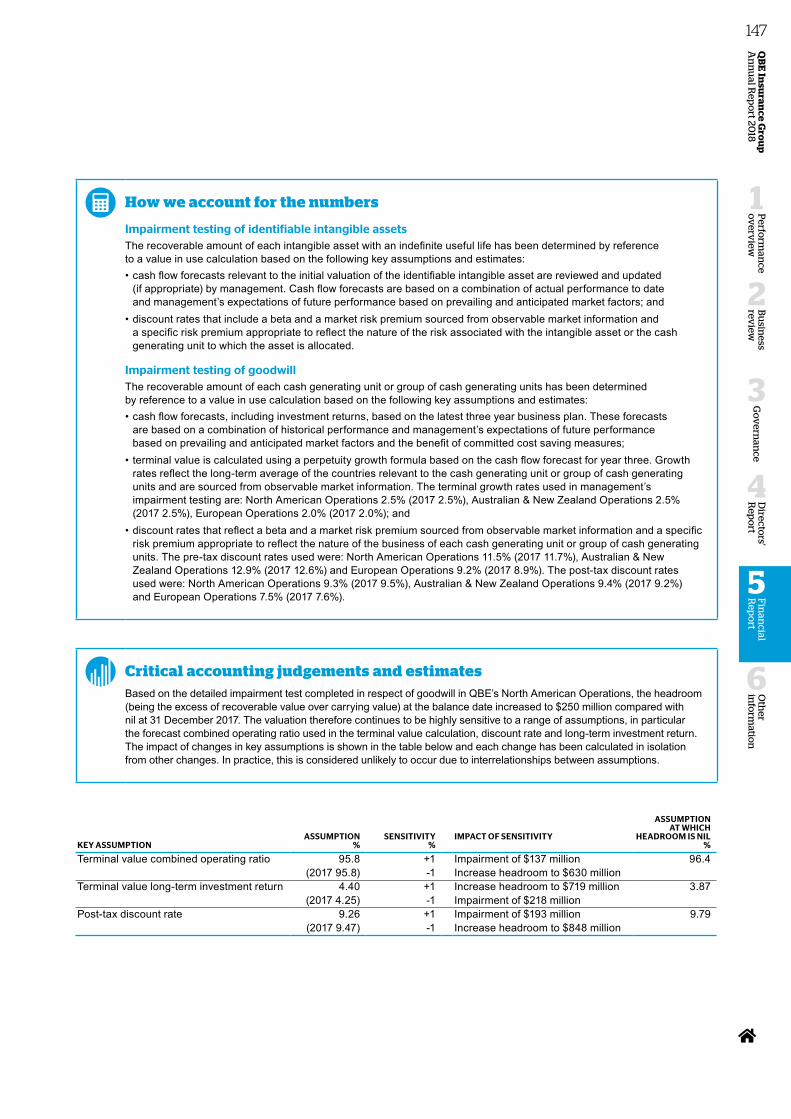
How we account for the numbers
Impairment testing of identifiable intangible assetsThe recoverable amount of each intangible asset with an indefinite useful life has been determined by reference to a value in use calculation based on the following key assumptions and estimates:• cash flow forecasts relevant to the initial valuation of the identifiable intangible asset are reviewed and updated
(if appropriate) by management. Cash flow forecasts are based on a combination of actual performance to date and management’s expectations of future performance based on prevailing and anticipated market factors; and
• discount rates that include a beta and a market risk premium sourced from observable market information and a specific risk premium appropriate to reflect the nature of the risk associated with the intangible asset or the cash generating unit to which the asset is allocated.
Impairment testing of goodwillThe recoverable amount of each cash generating unit or group of cash generating units has been determined by reference to a value in use calculation based on the following key assumptions and estimates:• cash flow forecasts, including investment returns, based on the latest three year business plan. These forecasts
are based on a combination of historical performance and management’s expectations of future performance based on prevailing and anticipated market factors and the benefit of committed cost saving measures;
• terminal value is calculated using a perpetuity growth formula based on the cash flow forecast for year three. Growth rates reflect the long-term average of the countries relevant to the cash generating unit or group of cash generating units and are sourced from observable market information. The terminal growth rates used in management’s impairment testing are: North American Operations 2.5% (2017 2.5%), Australian & New Zealand Operations 2.5% (2017 2.5%), European Operations 2.0% (2017 2.0%); and
• discount rates that reflect a beta and a market risk premium sourced from observable market information and a specific risk premium appropriate to reflect the nature of the business of each cash generating unit or group of cash generating units. The pre-tax discount rates used were: North American Operations 11.5% (2017 11.7%), Australian & New Zealand Operations 12.9% (2017 12.6%) and European Operations 9.2% (2017 8.9%). The post-tax discount rates used were: North American Operations 9.3% (2017 9.5%), Australian & New Zealand Operations 9.4% (2017 9.2%) and European Operations 7.5% (2017 7.6%).
Critical accounting judgements and estimatesBased on the detailed impairment test completed in respect of goodwill in QBE’s North American Operations, the headroom (being the excess of recoverable value over carrying value) at the balance date increased to $250 million compared with nil at 31 December 2017. The valuation therefore continues to be highly sensitive to a range of assumptions, in particular the forecast combined operating ratio used in the terminal value calculation, discount rate and long-term investment return. The impact of changes in key assumptions is shown in the table below and each change has been calculated in isolation from other changes. In practice, this is considered unlikely to occur due to interrelationships between assumptions.
KEY ASSUMPTIONASSUMPTION
%SENSITIVITY
%IMPACT OF SENSITIVITY
ASSUMPTION AT WHICH
HEADROOM IS NIL%
Terminal value combined operating ratio 95.8 +1 Impairment of $137 million 96.4(2017 95.8) -1 Increase headroom to $630 million
Terminal value long-term investment return 4.40 +1 Increase headroom to $719 million 3.87(2017 4.25) -1 Impairment of $218 million
Post-tax discount rate 9.26 +1 Impairment of $193 million 9.79(2017 9.47) -1 Increase headroom to $848 million
Oth
er in
form
ation
6
Perfo
rman
ce o
verv
iew
1
Bu
siness
review
2
Go
vern
ance
3
Directo
rs' R
epo
rt
4
QB
E In
suran
ce Gro
up
A
nn
ual R
epo
rt 2018
147F
inan
cial R
epo
rt
5
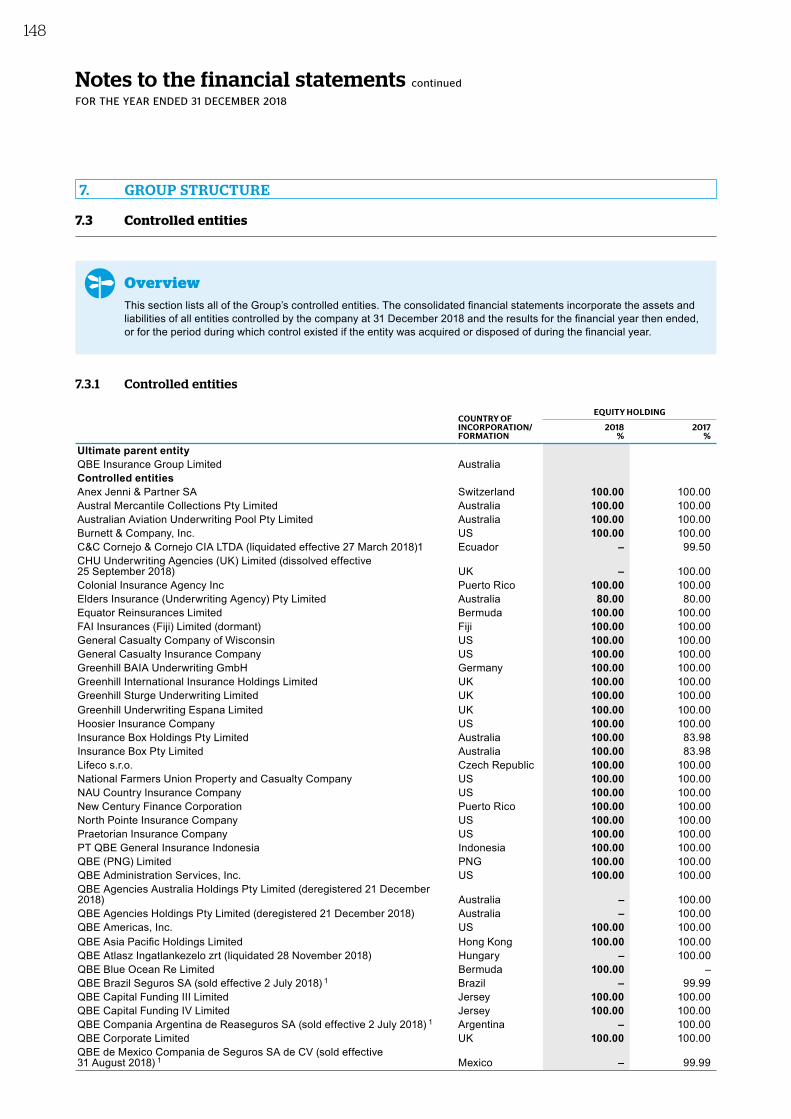
Notes to the financial statements continued
FOR THE YEAR ENDED 31 DECEMBER 2018
7.3 Controlled entities
OverviewThis section lists all of the Group’s controlled entities. The consolidated financial statements incorporate the assets and liabilities of all entities controlled by the company at 31 December 2018 and the results for the financial year then ended, or for the period during which control existed if the entity was acquired or disposed of during the financial year.
7.3.1 Controlled entities
COUNTRY OFINCORPORATION/FORMATION
EQUITY HOLDING
2018%
2017%
Ultimate parent entityQBE Insurance Group Limited AustraliaControlled entities Anex Jenni & Partner SA Switzerland 100.00 100.00Austral Mercantile Collections Pty Limited Australia 100.00 100.00Australian Aviation Underwriting Pool Pty Limited Australia 100.00 100.00Burnett & Company, Inc. US 100.00 100.00C&C Cornejo & Cornejo CIA LTDA (liquidated effective 27 March 2018)1 Ecuador – 99.50CHU Underwriting Agencies (UK) Limited (dissolved effective 25 September 2018) UK – 100.00Colonial Insurance Agency Inc Puerto Rico 100.00 100.00Elders Insurance (Underwriting Agency) Pty Limited Australia 80.00 80.00Equator Reinsurances Limited Bermuda 100.00 100.00FAI Insurances (Fiji) Limited (dormant) Fiji 100.00 100.00General Casualty Company of Wisconsin US 100.00 100.00General Casualty Insurance Company US 100.00 100.00Greenhill BAIA Underwriting GmbH Germany 100.00 100.00Greenhill International Insurance Holdings Limited UK 100.00 100.00Greenhill Sturge Underwriting Limited UK 100.00 100.00Greenhill Underwriting Espana Limited UK 100.00 100.00Hoosier Insurance Company US 100.00 100.00Insurance Box Holdings Pty Limited Australia 100.00 83.98Insurance Box Pty Limited Australia 100.00 83.98Lifeco s.r.o. Czech Republic 100.00 100.00National Farmers Union Property and Casualty Company US 100.00 100.00NAU Country Insurance Company US 100.00 100.00New Century Finance Corporation Puerto Rico 100.00 100.00North Pointe Insurance Company US 100.00 100.00Praetorian Insurance Company US 100.00 100.00PT QBE General Insurance Indonesia Indonesia 100.00 100.00QBE (PNG) Limited PNG 100.00 100.00QBE Administration Services, Inc. US 100.00 100.00QBE Agencies Australia Holdings Pty Limited (deregistered 21 December 2018) Australia – 100.00QBE Agencies Holdings Pty Limited (deregistered 21 December 2018) Australia – 100.00QBE Americas, Inc. US 100.00 100.00QBE Asia Pacific Holdings Limited Hong Kong 100.00 100.00QBE Atlasz Ingatlankezelo zrt (liquidated 28 November 2018) Hungary – 100.00QBE Blue Ocean Re Limited Bermuda 100.00 –QBE Brazil Seguros SA (sold effective 2 July 2018) 1 Brazil – 99.99QBE Capital Funding III Limited Jersey 100.00 100.00QBE Capital Funding IV Limited Jersey 100.00 100.00QBE Compania Argentina de Reaseguros SA (sold effective 2 July 2018) 1 Argentina – 100.00QBE Corporate Limited UK 100.00 100.00QBE de Mexico Compania de Seguros SA de CV (sold effective 31 August 2018) 1 Mexico – 99.99
7. GROUP STRUCTURE
148
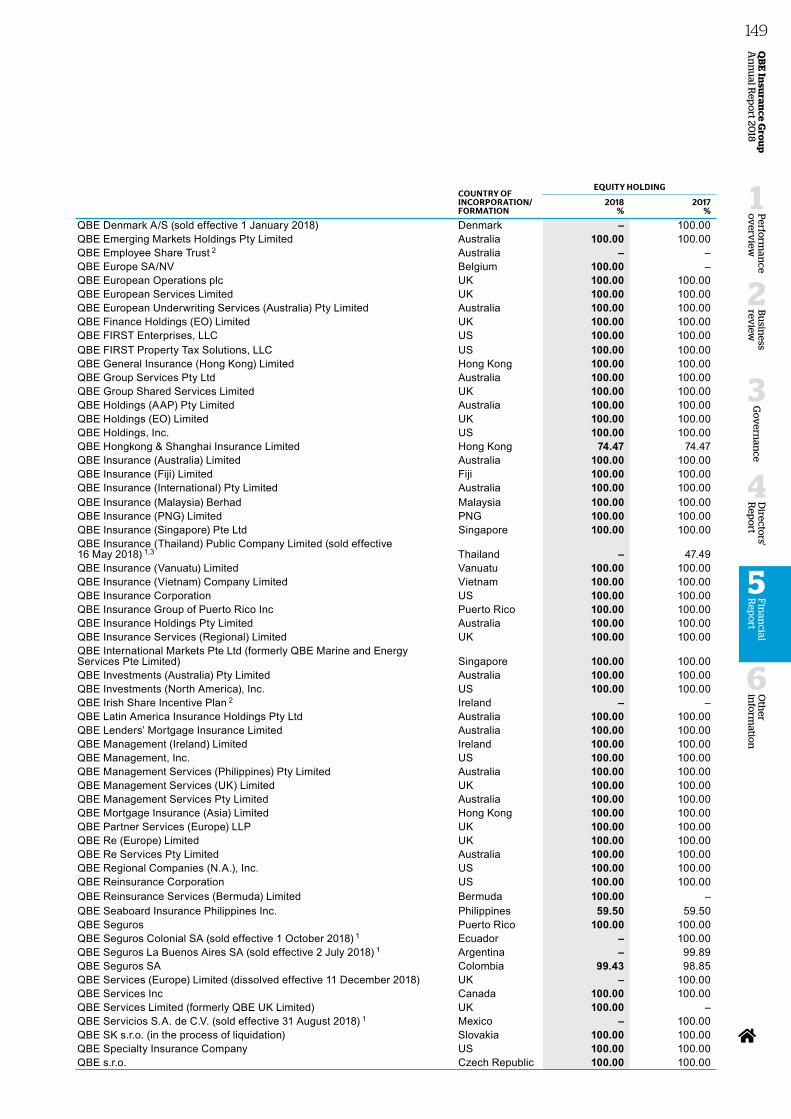
COUNTRY OFINCORPORATION/FORMATION
EQUITY HOLDING
2018%
2017%
QBE Denmark A/S (sold effective 1 January 2018) Denmark – 100.00QBE Emerging Markets Holdings Pty Limited Australia 100.00 100.00QBE Employee Share Trust 2 Australia – –QBE Europe SA/NV Belgium 100.00 –QBE European Operations plc UK 100.00 100.00QBE European Services Limited UK 100.00 100.00QBE European Underwriting Services (Australia) Pty Limited Australia 100.00 100.00QBE Finance Holdings (EO) Limited UK 100.00 100.00QBE FIRST Enterprises, LLC US 100.00 100.00QBE FIRST Property Tax Solutions, LLC US 100.00 100.00QBE General Insurance (Hong Kong) Limited Hong Kong 100.00 100.00QBE Group Services Pty Ltd Australia 100.00 100.00QBE Group Shared Services Limited UK 100.00 100.00QBE Holdings (AAP) Pty Limited Australia 100.00 100.00QBE Holdings (EO) Limited UK 100.00 100.00QBE Holdings, Inc. US 100.00 100.00QBE Hongkong & Shanghai Insurance Limited Hong Kong 74.47 74.47QBE Insurance (Australia) Limited Australia 100.00 100.00QBE Insurance (Fiji) Limited Fiji 100.00 100.00QBE Insurance (International) Pty Limited Australia 100.00 100.00QBE Insurance (Malaysia) Berhad Malaysia 100.00 100.00QBE Insurance (PNG) Limited PNG 100.00 100.00QBE Insurance (Singapore) Pte Ltd Singapore 100.00 100.00QBE Insurance (Thailand) Public Company Limited (sold effective 16 May 2018) 1,3 Thailand – 47.49QBE Insurance (Vanuatu) Limited Vanuatu 100.00 100.00QBE Insurance (Vietnam) Company Limited Vietnam 100.00 100.00QBE Insurance Corporation US 100.00 100.00QBE Insurance Group of Puerto Rico Inc Puerto Rico 100.00 100.00QBE Insurance Holdings Pty Limited Australia 100.00 100.00QBE Insurance Services (Regional) Limited UK 100.00 100.00QBE International Markets Pte Ltd (formerly QBE Marine and Energy Services Pte Limited) Singapore 100.00 100.00QBE Investments (Australia) Pty Limited Australia 100.00 100.00QBE Investments (North America), Inc. US 100.00 100.00QBE Irish Share Incentive Plan 2 Ireland – –QBE Latin America Insurance Holdings Pty Ltd Australia 100.00 100.00QBE Lenders’ Mortgage Insurance Limited Australia 100.00 100.00QBE Management (Ireland) Limited Ireland 100.00 100.00QBE Management, Inc. US 100.00 100.00QBE Management Services (Philippines) Pty Limited Australia 100.00 100.00QBE Management Services (UK) Limited UK 100.00 100.00QBE Management Services Pty Limited Australia 100.00 100.00QBE Mortgage Insurance (Asia) Limited Hong Kong 100.00 100.00QBE Partner Services (Europe) LLP UK 100.00 100.00QBE Re (Europe) Limited UK 100.00 100.00QBE Re Services Pty Limited Australia 100.00 100.00QBE Regional Companies (N.A.), Inc. US 100.00 100.00QBE Reinsurance Corporation US 100.00 100.00QBE Reinsurance Services (Bermuda) Limited Bermuda 100.00 –QBE Seaboard Insurance Philippines Inc. Philippines 59.50 59.50QBE Seguros Puerto Rico 100.00 100.00QBE Seguros Colonial SA (sold effective 1 October 2018) 1 Ecuador – 100.00QBE Seguros La Buenos Aires SA (sold effective 2 July 2018) 1 Argentina – 99.89QBE Seguros SA Colombia 99.43 98.85QBE Services (Europe) Limited (dissolved effective 11 December 2018) UK – 100.00QBE Services Inc Canada 100.00 100.00QBE Services Limited (formerly QBE UK Limited) UK 100.00 –QBE Servicios S.A. de C.V. (sold effective 31 August 2018) 1 Mexico – 100.00QBE SK s.r.o. (in the process of liquidation) Slovakia 100.00 100.00QBE Specialty Insurance Company US 100.00 100.00QBE s.r.o. Czech Republic 100.00 100.00
Oth
er in
form
ation
6
Perfo
rman
ce o
verv
iew
1
Bu
siness
review
2
Go
vern
ance
3
Directo
rs' R
epo
rt
4
QB
E In
suran
ce Gro
up
A
nn
ual R
epo
rt 2018
149F
inan
cial R
epo
rt
5
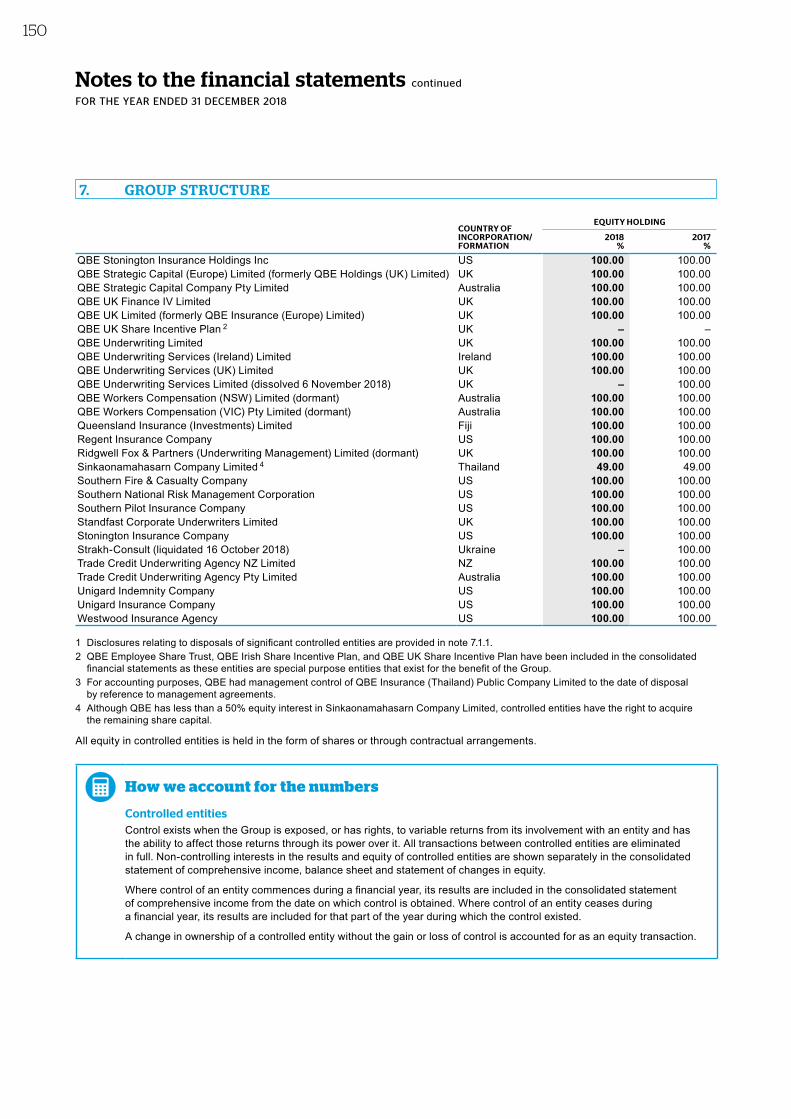
Notes to the financial statements continued
FOR THE YEAR ENDED 31 DECEMBER 2018
COUNTRY OFINCORPORATION/FORMATION
EQUITY HOLDING
2018%
2017%
QBE Stonington Insurance Holdings Inc US 100.00 100.00QBE Strategic Capital (Europe) Limited (formerly QBE Holdings (UK) Limited) UK 100.00 100.00QBE Strategic Capital Company Pty Limited Australia 100.00 100.00QBE UK Finance IV Limited UK 100.00 100.00QBE UK Limited (formerly QBE Insurance (Europe) Limited) UK 100.00 100.00QBE UK Share Incentive Plan 2 UK – –QBE Underwriting Limited UK 100.00 100.00QBE Underwriting Services (Ireland) Limited Ireland 100.00 100.00QBE Underwriting Services (UK) Limited UK 100.00 100.00QBE Underwriting Services Limited (dissolved 6 November 2018) UK – 100.00QBE Workers Compensation (NSW) Limited (dormant) Australia 100.00 100.00QBE Workers Compensation (VIC) Pty Limited (dormant) Australia 100.00 100.00Queensland Insurance (Investments) Limited Fiji 100.00 100.00Regent Insurance Company US 100.00 100.00Ridgwell Fox & Partners (Underwriting Management) Limited (dormant) UK 100.00 100.00Sinkaonamahasarn Company Limited 4 Thailand 49.00 49.00Southern Fire & Casualty Company US 100.00 100.00Southern National Risk Management Corporation US 100.00 100.00Southern Pilot Insurance Company US 100.00 100.00Standfast Corporate Underwriters Limited UK 100.00 100.00Stonington Insurance Company US 100.00 100.00Strakh-Consult (liquidated 16 October 2018) Ukraine – 100.00Trade Credit Underwriting Agency NZ Limited NZ 100.00 100.00Trade Credit Underwriting Agency Pty Limited Australia 100.00 100.00Unigard Indemnity Company US 100.00 100.00Unigard Insurance Company US 100.00 100.00Westwood Insurance Agency US 100.00 100.00
1 Disclosures relating to disposals of significant controlled entities are provided in note 7.1.1.2 QBE Employee Share Trust, QBE Irish Share Incentive Plan, and QBE UK Share Incentive Plan have been included in the consolidated
financial statements as these entities are special purpose entities that exist for the benefit of the Group.3 For accounting purposes, QBE had management control of QBE Insurance (Thailand) Public Company Limited to the date of disposal
by reference to management agreements.4 Although QBE has less than a 50% equity interest in Sinkaonamahasarn Company Limited, controlled entities have the right to acquire
the remaining share capital.
All equity in controlled entities is held in the form of shares or through contractual arrangements.
How we account for the numbers
Controlled entitiesControl exists when the Group is exposed, or has rights, to variable returns from its involvement with an entity and has the ability to affect those returns through its power over it. All transactions between controlled entities are eliminated in full. Non-controlling interests in the results and equity of controlled entities are shown separately in the consolidated statement of comprehensive income, balance sheet and statement of changes in equity.
Where control of an entity commences during a financial year, its results are included in the consolidated statement of comprehensive income from the date on which control is obtained. Where control of an entity ceases during a financial year, its results are included for that part of the year during which the control existed.
A change in ownership of a controlled entity without the gain or loss of control is accounted for as an equity transaction.
7. GROUP STRUCTURE
150
8. OTHER
OverviewThis section includes other information that must be disclosed to comply with the Australian Accounting Standards or the Corporations Act 2001.
8.1 Other accounting policies
8.1.1 New and amended standards adopted by the GroupThe Group adopted the following new or revised accounting standards which became effective for the annual reporting period commencing on 1 January 2018.
TITLE
AASB 15 Revenue from Contracts with CustomersAASB 1048 Interpretation of StandardsAASB 2016-5 Classification and Measurement of Share-based Payment TransactionsAASB 2016-6 Applying AASB 9 Financial Instruments with AASB 4 Insurance ContractsAASB 2017-1 Transfers of Investment Property, Annual Improvements 2014-2016 Cycle and Other AmendmentsAASB 2017-3 Clarifications to AASB 4AASB Interpretation 22 Foreign Currency Transactions and Advance Consideration
The adoption of these new or revised standards did not materially change the Group’s accounting policies or financial statements; however, the adoption of AASB 2016-6 and AASB 2017-3 allows insurers which meet certain criteria to defer the application of AASB 9 to 1 January 2021. This is discussed in note 8.1.2 below.
8.1.2 New accounting standards and amendments issued but not yet effective
TITLE OPERATIVE DATE
AASB 16 Leases 1 January 2019AASB 2017-7 Long-term Interests in Associates and Joint Ventures 1 January 2019AASB 2018-1 Annual Improvements 2015-2017 Cycle 1 January 2019AASB 2018-2 Plan Amendment, Curtailment or Settlement 1 January 2019AASB Interpretation 23 Uncertainty over Income Tax Treatments 1 January 2019Revised Conceptual Framework for Financial Reporting 1 January 2020AASB 9 Financial Instruments 1 January 2021AASB 17 Insurance Contracts 1 January 2021AASB 2014-10 Sale or Contribution of Assets between an Investor and its Associate or Joint Venture 1 January 2022
The Australian Accounting Standards and amendments detailed in the table above are not mandatory for the Group until the operative dates stated; however, early adoption is often permitted.
The Group currently plans to adopt the standards and amendments detailed above in the reporting periods beginning on their respective operative dates. An assessment of the financial impact of the standards and amendments has been undertaken and they are not expected to have a material impact on the Group’s financial statements, except where noted below.
Oth
er in
form
ation
6
Perfo
rman
ce o
verv
iew
1
Bu
siness
review
2
Go
vern
ance
3
Directo
rs' R
epo
rt
4
QB
E In
suran
ce Gro
up
A
nn
ual R
epo
rt 2018
151F
inan
cial R
epo
rt
5
Notes to the financial statements continued
FOR THE YEAR ENDED 31 DECEMBER 2018
AASB 16 LeasesAASB 16, which was issued in 2016 and sets out the principles for recognition, measurement, presentation and disclosure of leases, will replace existing accounting requirements for leases from 1 January 2019. Under current requirements leases are classified based on their nature, either as finance leases which are recognised on the balance sheet or operating leases which are not recognised on the balance sheet. The application of AASB 16 will result in the recognition of all leases on the balance sheet in the form of a right-of-use asset and a corresponding lease liability. Over the life of the lease, the liability incurs interest and is reduced as lease payments are made, and the asset is amortised over its useful life.
The new standard is expected to impact leases which are currently classified by the Group as operating leases, being mainly leases over premises, equipment and motor vehicles. On adoption of AASB 16, QBE will apply an exemption under the new standard and will not recognise low value leases and leases with a term of less than 12 months on the balance sheet. The resulting amount to be recognised as a gross up to the balance sheet at 1 January 2019 is approximately $320 million. The Group intends to apply the modified retrospective approach on adoption of the standard and expects that there will be no material impact to opening retained earnings at 1 January 2019. Future profit or loss is also not expected to be materially impacted by the adoption of this standard.
AASB 9 Financial InstrumentsAASB 9 was issued during 2014 and replaces existing accounting requirements for financial instruments. Accounting standards currently permit deferral of adoption of AASB 9 to 1 January 2021; however, the International Accounting Standards Board has tentatively decided to extend this to 1 January 2022. The Group has elected to apply this temporary exemption as it meets the following relevant criteria:• the carrying amount of the Group’s insurance liabilities within the scope of AASB 1023 (being outstanding claims, unearned
premium liabilities and reinsurance premiums payable) exceed 80% of the carrying amount of the Group’s total liabilities; and• the Group does not engage in any significant activity unconnected with insurance, on the basis that its business is almost
exclusively in the nature of issuing insurance contracts, purchasing reinsurance protection and deriving a return from the investment of insurance premiums.
The following information is provided to assist users in comparing the Group’s financial statements with entities which have adopted AASB 9:
Impact on financial assets
QBE’s investments are currently designated as fair value through profit or loss on initial recognition and are subsequently remeasured to fair value at each reporting date, reflecting QBE’s business model for managing and evaluating the investment portfolio. Adoption of AASB 9 does not result in any changes to accounting for these investments.
Financial assets within the scope of AASB 1023, such as premiums receivable and reinsurance and other recoveries on paid claims, which together form the majority of the carrying value of the Group’s trade and other receivables, as well as reinsurance recoveries on outstanding claims are outside the scope of AASB 9 and are unaffected by the new requirements. Trade and other receivables also includes other financial assets with a relatively small carrying value which are measured at amortised cost, the majority of which are receivable within 12 months. The application of AASB 9 will not materially impact these balances.
Impact on financial liabilities
During 2016, QBE executed three debt exchanges, details of which are included in note 5.1. These were accounted for as modifications to financial liabilities, resulting in recognition of $117 million of premium which is being amortised to the first call dates of the respective borrowings. Under AASB 9, this premium would have been expensed immediately; therefore, on adoption of AASB 9, opening retained earnings will reduce by the remaining unamortised premium and borrowings will increase by the same amount. The opening balance sheet impact will be offset by reduced interest expense over the remaining period to the first call dates. As at 31 December 2018, this balance is $84 million (31 December 2017 $98 million). Other than this, accounting for the Group’s borrowings is unchanged under AASB 9.
Financial liabilities within the scope of AASB 1023, such as reinsurance premiums payable and outstanding claims, are outside the scope of AASB 9 and are therefore unaffected by the new requirements. Trade and other payables also includes other financial liabilities measured at amortised cost arising from the Group’s activities, the accounting for which is materially unchanged by AASB 9.
Impact on controlled entities
Certain controlled entities of the Group may not meet the criteria to defer AASB 9 for entity-level statutory reporting. The impact on the Group’s borrowings described above only occurs at the consolidated Group level and does not impact any controlled entity. In all other respects, the impacts of adopting AASB 9 by those subsidiaries are therefore similar to those described above and are not material to the Group.
8. OTHER
152
AASB 17 Insurance ContractsAASB 17, a new accounting standard for insurance contracts, was adopted by the Australian Accounting Standards Board in July 2017. It is currently effective for reporting periods beginning on or after 1 January 2021, but this is expected to be deferred to 1 January 2022 following a tentative decision of the IASB to delay the mandatory implementation date by one year.
The standard will be applicable to general, life and health insurance business and introduces a new ‘general model’ for recognition and measurement of insurance contracts. It also permits application of a simplified model (which is similar to the current basis on which general insurance is brought to account under AASB 1023) if the liability for remaining coverage under the simplified model would not materially differ from the general model.
QBE has completed a global impact assessment and additional analysis on key areas of interpretation and has determined that the simplified approach is expected to apply to more than 95% of the Group’s business, based on the existing business mix. This analysis also identified key requirements of AASB 17 where the technical interpretation remains unclear. In addition, the IASB is in the process of considering potential changes to the wording of IFRS 17 to remedy implementation issues identified and it is expected these changes would then be adopted into AASB 17. Given the potential for changes in AASB 17 and the broad scope, complexity and lack of general consensus on the interpretation of some key areas of the standard, the impact of AASB 17 on the consolidated Group’s financial statements is still being determined; however, significant disclosure changes and some impact on reported profit or loss are expected. We continue to monitor market developments in order to assess the impact of changes and evolving interpretations on the Group.
8.2 Contingent liabilities
OverviewContingent liabilities are disclosed when the possibility of a future settlement of economic benefits is considered to be less than probable but more likely than remote. If the expected settlement of the liability becomes probable, a provision is recognised.
QBE is required to support the underwriting activities of the Group’s controlled entities which are corporate members at Lloyd’s of London. Funds at Lloyd’s are those funds of the Group which are subject to the terms of the Lloyd’s Deposit Trust Deed and are required to support underwriting for the following year and the open years of account, determined by a formula prescribed by Lloyd’s each year. At the balance date, letters of credit and similar forms of support of $2,054 million (2017 $1,716 million) were in place in respect of the Group’s participation in Lloyd’s, along with cash and investments of $65 million (2017 $308 million). In addition, a controlled entity has entered into various trust and security deeds with Lloyd’s in respect of assets lodged to support its underwriting activities. These deeds contain covenants that require the entity to meet financial obligations should they arise in relation to cash calls from syndicate participations. A cash call would be made first on the assets held in syndicate trust funds and would only call on funds at Lloyd’s after syndicate resources were exhausted. Only if the level of these trust funds was not sufficient would a cash call result in a draw down on the letters of credit and other assets lodged with Lloyd’s.
In the normal course of business, the Group is also exposed to contingent liabilities in relation to claims litigation and regulatory examinations arising out of its insurance and reinsurance activities. The Group may also be exposed to the possibility of contingent liabilities in relation to non-insurance litigation, taxation and compliance matters.
Oth
er in
form
ation
6
Perfo
rman
ce o
verv
iew
1
Bu
siness
review
2
Go
vern
ance
3
Directo
rs' R
epo
rt
4
QB
E In
suran
ce Gro
up
A
nn
ual R
epo
rt 2018
153F
inan
cial R
epo
rt
5
Notes to the financial statements continued
FOR THE YEAR ENDED 31 DECEMBER 2018
8.3 Reconciliation of profit (loss) after income tax to cash flows from operating activities
OverviewAASB 1054 Australian Additional Disclosures requires a reconciliation of profit after income tax to cash flows from operating activities.
2018 2017US$M US$M
Profit (loss) after income tax from continuing operations 555 (1,216)Loss after income tax from discontinued operations (177) (37)Profit (loss) after income tax 378 (1,253)Adjustments for:
Depreciation/impairment of property, plant and equipment 44 49Amortisation and impairment of intangibles 115 783Losses on sale of entities 108 6Share of net loss of associates 2 1Net foreign exchange (gains) losses (1) 33Fair value losses (gains) on financial assets 131 (226)Unrealised losses on assets held for sale 25 –Share-based payments expense 34 39
Balance sheet movements:(Increase) decrease in trade debtors (487) 361Increase in net operating assets (117) (283)(Decrease) increase in trade payables (1,059) 183Increase in net outstanding claims 109 630Increase (decrease) in unearned premium 15 (255)Decrease (increase) in deferred insurance costs 391 (216)Decrease in net defined benefit obligation (13) (16)(Increase) decrease in net tax assets (118) 336
Net cash flows from operating activities (443) 172
8. OTHER
154
8.4 Share-based payments
OverviewShare-based payments are equity based compensation schemes provided to employees and executives. The company issues shares from time to time under an Employee Share and Option Plan (the Plan). Any full-time or part-time employee of the Group or any equally-owned joint venture who is offered shares or options is eligible to participate in the Plan.
8.4.1 Share schemesA summary of the current deferred equity award plans together with the legacy deferred equity award plans is set out below.
Current deferred equity plans
PLAN AVAILABLE TO NATURE OF AWARD VESTING CONDITIONS
Executive Incentive Plan (EIP) (2017–2018)
Executives and other key senior employees
• 40% delivered in cash (20% in the case of the Group CEO).
• 60% deferred as conditional rights to fully paid ordinary QBE shares (80% in the case of the Group CEO).
The conditional rights are deferred in four equal tranches, such that 25% vests on each of the first, second, third and fourth anniversaries of the award.
EIP outcomes are subject to the achievement of:• Group COR and cash ROE targets;• individual performance ratings; and• Group strategic priorities for Group staff and divisional strategic
priorities and COR targets for divisional staff.
Additionally, for current QBE deferred equity plans:• Plan rules provide suitable discretion for the Remuneration Committee to adjust any formulaic outcome to ensure that awards made
under the EIP plans appropriately reflect performance.• During the period from the grant date to the vesting date, further conditional rights are issued under the Bonus Share Plan to reflect
dividends paid on ordinary shares of the company. These conditional rights are subject to the same vesting conditions as the original grant of conditional rights.
• Recipients must remain in the Group’s service throughout the service period in order for the awards to vest, except in cases where good leaver provisions apply. Vesting is also subject to malus provisions.
• Under good leaver provisions (e.g. retirement, redundancy, ill health, injury) a pro-rata amount of conditional rights remain subject to the performance and vesting conditions.
• Once vested, conditional rights can be exercised for no consideration.
Oth
er in
form
ation
6
Perfo
rman
ce o
verv
iew
1
Bu
siness
review
2
Go
vern
ance
3
Directo
rs' R
epo
rt
4
QB
E In
suran
ce Gro
up
A
nn
ual R
epo
rt 2018
155F
inan
cial R
epo
rt
5
Notes to the financial statements continued
FOR THE YEAR ENDED 31 DECEMBER 2018
Legacy deferred equity plans
PLAN AVAILABLE TO NATURE OF AWARD VESTING CONDITIONS
Short‑term incentive (STI) (2014–2016)
Executives and other key senior employees
• 67% delivered in cash (50% in the case of the Group CEO).
• 33% deferred as conditional rights to fully paid ordinary QBE shares (50% in the case of the Group CEO).
The conditional rights are deferred in two equal tranches such that 50% vests on the first anniversary of the award and 50% vests on the second anniversary of the award.
STI outcomes are subject to the achievement of:• Group ROE target;• individual performance ratings; and• for divisional staff, divisional return on allocated capital targets.
Long‑term incentive (LTI) (2014–2016)
Executives Conditional rights to fully paid ordinary QBE shares.
On achievement of the performance measures (at the end of the three year performance period), conditional rights vest in three tranches as follows:• 33% at the end of the three year performance period;• 33% on the first anniversary of the end of the performance
period; and• 34% on the second anniversary of the end of the
performance period.
Vesting is subject to performance conditions as follows:• 50% of each tranche is subject to the achievement of Group ROE
performance targets over a three year performance period; and• 50% of each tranche is subject to the performance of the
Group’s relative total shareholder return over a three year performance period.
Long‑term Incentive plan legacy scheme (2013)
Executives Conditional rights to fully paid ordinary shares.
Conditional rights vested over a five year service period.
Vesting is also subject to performance conditions as follows:• 50% of the award is subject to the Group’s average diluted
EPS increasing by a compound average of 7.5% per annum over the five year period; and
• 50% of the award is subject to the Group’s average ROE and combined operating ratio being in the top 10% of the top 50 largest global insurers and reinsurers as measured by net earned premium over the five year period.
QBE Incentive Scheme (2010–2013)
Executives and other key senior employees
Conditional rights to fully paid ordinary QBE shares.
The maximum deferred equity award was the lesser of 80% for executives and 66.67% for other key senior employees of the cash award earned or 100% of fixed remuneration for the financial year.
The conditional rights are deferred in two equal tranches, with the first tranche vesting over a three year service period from the grant date and the second over five years.
Additionally, for legacy QBE deferred equity plans:• Plan rules provide suitable discretion for the People & Remuneration Committee to adjust any formulaic outcome to ensure that
awards made under the STI and LTI plans appropriately reflect performance.• During the period from the grant date to the vesting date, further conditional rights are issued under the Bonus Share Plan to reflect
dividends paid on ordinary shares of the company. These conditional rights are subject to the same vesting conditions as the original grant of conditional rights.
• Recipients must remain in the Group’s service throughout the service period in order for the awards to vest, except in cases where good leaver provisions apply. Vesting is also subject to malus provisions.
• Under good leaver provisions (e.g. retirement, redundancy, ill health, injury) a pro-rata amount of conditional rights remain subject to the performance and vesting conditions.
• Once vested, conditional rights can be exercised for no consideration.• The People & Remuneration Committee has the discretion to pay cash in lieu of shares in certain circumstances such as death,
disability, redundancy or retirement if the individual is not subject to disciplinary proceedings or notice to terminate employment on that date. In relation to the QBE Incentive Scheme, this only applies to awards made prior to 2012.
8. OTHER
156
8.4.2 Conditional rightsDetails of the number of employee entitlements to conditional rights to ordinary shares granted, vested and transferred to employees during the year are as follows:
2018 2017NUMBER OF
RIGHTSNUMBER OF
RIGHTS
At 1 January 18,833,412 25,129,726Granted in the year 4,429,134 4,875,667Dividends attaching in the year 305,516 882,299Vested and transferred to employees in the year (6,181,530) (7,817,681)Forfeited in the year (4,756,433) (4,236,599)At 31 December 12,630,099 18,833,412Weighted average share price at date of vesting of conditional rights during the year A$10.00 A$12.58Weighted average fair value of conditional rights granted during the year A$10.32 A$12.49
8.4.3 Fair value of conditional rightsThe fair value of conditional rights granted during the year was determined using the following significant assumptions:
2018 2017
Five day volume weighted average price of instrument at grant date A$ 9.61 – 11.42 9.89 – 12.98Expected life of instrument Years 0.1 – 5.0 0.1 – 5.0
The fair value is determined using appropriate models including Monte Carlo simulations, depending on the vesting conditions. Some of the assumptions used may be based on historical data which is not necessarily indicative of future trends. Reasonable changes in these assumptions would not have a material impact on the amounts recognised in the financial statements.
8.4.4 Employee optionsThe market value of all shares underlying the options at the balance date is A$0.2 million (2017 A$0.2 million). During 2018, no options were cancelled or forfeited. At 31 December 2018, 17,000 remained (excluding notional dividends). The options were issued to employees in 2004 in lieu of shares under the Plan. The options vested immediately and are exercisable until March 2024.
8.4.5 Share-based payment expenseTotal expenses arising from share-based payment awards under the Plan amounted to $34 million (2017 $39 million). These amounts are included in underwriting and other expenses.
8.4.6 Shares purchased on-marketThe Group may purchase shares on-market to satisfy entitlements under employee share schemes. The Group acquired two million (2017 13 million) such shares during the period at an average price of A$10.73 (2017 A$12.34).
How we account for the numbersThe fair value of the employee services received in exchange for the grant of equity settled instruments is recognised as an expense. The total amount to be expensed over the vesting period is determined by reference to the fair value of the instruments granted, excluding the impact of any non-market vesting conditions. Non-market vesting conditions are included in assumptions about the number of instruments that are expected to become exercisable.
The fair value of each instrument is recognised evenly over the service period ending at the vesting date; however, at each balance date, the Group revises its estimates of the number of instruments that are expected to become exercisable due to the achievement of non-market vesting conditions. The Group recognises the impact of the revision of original estimates, if any, in profit or loss with a corresponding adjustment to equity.
Oth
er in
form
ation
6
Perfo
rman
ce o
verv
iew
1
Bu
siness
review
2
Go
vern
ance
3
Directo
rs' R
epo
rt
4
QB
E In
suran
ce Gro
up
A
nn
ual R
epo
rt 2018
157F
inan
cial R
epo
rt
5
Notes to the financial statements continued
FOR THE YEAR ENDED 31 DECEMBER 2018
8.5 Key management personnel
OverviewAASB 124 Related Party Disclosures requires disclosure of the compensation of directors (executive and non-executive) and those persons having authority and responsibility for planning, directing and controlling the activities of the Group, either directly or indirectly. This group is collectively defined as key management personnel. Additional details in respect of key management personnel and their remuneration are shown in the Remuneration Report.
2018 2017US$000 US$000
Short-term employee benefits 17,512 15,249Post-employment benefits 179 146Other long-term employment benefits 46 92Share-based payments 5,956 2,314Termination benefits 1,078 7,223
24,771 25,024
How we account for the numbers
Short-term employee benefits – profit sharing and bonus plansA provision is recognised for profit sharing and bonus plans where there is a contractual obligation or where past practice has created a constructive obligation at the end of each reporting period. Bonus or profit sharing obligations are settled within 12 months from the balance date.
Post-employment benefits – defined contribution plansDefined contribution plans are post-employment benefit plans under which an entity pays a fixed contribution into a fund during the course of employment and has no legal or constructive obligation to pay further contributions if the fund does not hold sufficient assets to pay all employee benefits relating to employee service in the current and prior periods. Contributions to defined contribution plans are expensed as incurred.
Other long-term employee benefit obligationsThe liabilities for long service leave and annual leave are recognised in the provision for employee benefits and measured as the present value of expected future payments to be made in respect of services provided by employees up to the end of the reporting period using the projected unit credit method. Consideration is given to expected future wage and salary levels, experience of employee departures and periods of service. Expected future payments are discounted using high quality corporate bond yields with terms and currencies that match, as closely as possible, the estimated future cash outflows. Remeasurements as a result of experience adjustments and changes in actuarial assumptions are recognised in profit or loss.
Termination benefitsTermination benefits are payable when employment is terminated before the normal retirement date or when an employee accepts voluntary redundancy in exchange for these benefits. The Group recognises termination benefits at the earlier of the date:• when the Group can no longer withdraw the offer of those benefits; and• when the Group recognises costs for a restructuring that is within the scope of AASB 137 Provisions, Contingent
Liabilities and Contingent Assets and involves the payment of termination benefits.
In the case of an offer made to encourage voluntary redundancy, the termination benefits are measured based on the number of employees expected to accept the offer. Benefits falling due more than 12 months after the end of the reporting period are discounted to present value.
8. OTHER
158
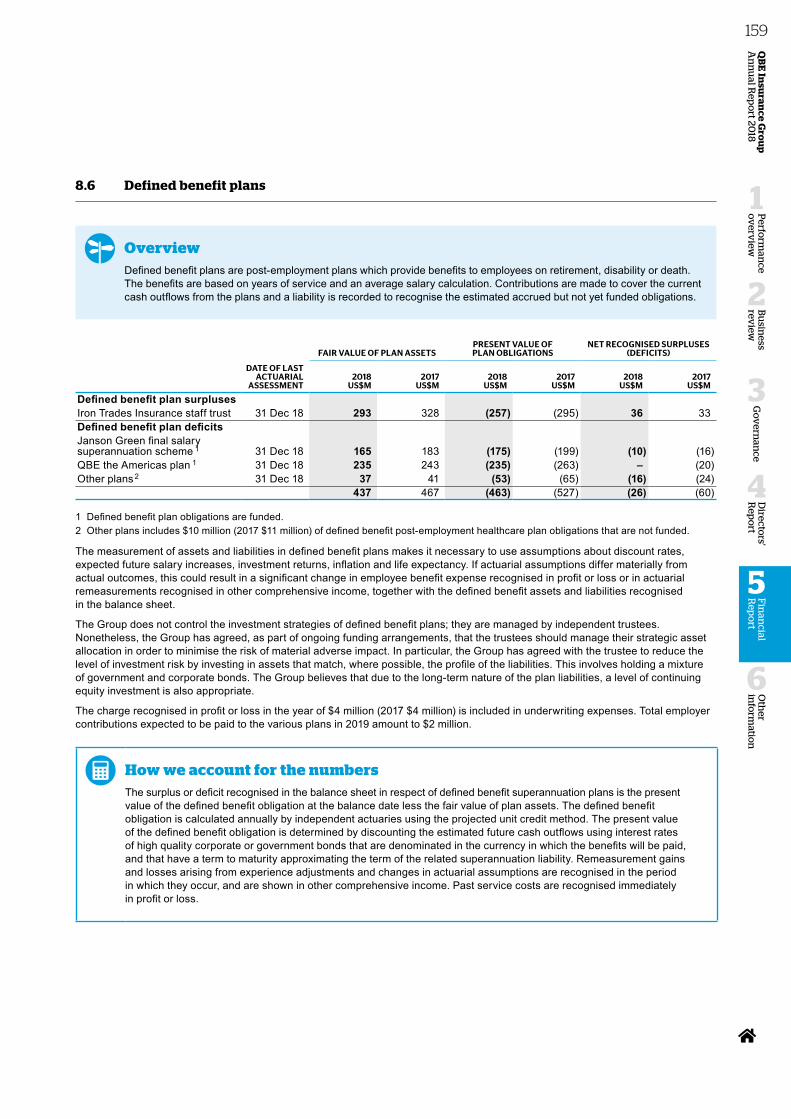
8.6 Defined benefit plans
OverviewDefined benefit plans are post-employment plans which provide benefits to employees on retirement, disability or death. The benefits are based on years of service and an average salary calculation. Contributions are made to cover the current cash outflows from the plans and a liability is recorded to recognise the estimated accrued but not yet funded obligations.
FAIR VALUE OF PLAN ASSETSPRESENT VALUE OF PLAN OBLIGATIONS
NET RECOGNISED SURPLUSES (DEFICITS)
DATE OF LAST ACTUARIAL
ASSESSMENT2018
US$M2017
US$M2018
US$M2017
US$M2018
US$M2017
US$M
Defined benefit plan surplusesIron Trades Insurance staff trust 31 Dec 18 293 328 (257) (295) 36 33 Defined benefit plan deficitsJanson Green final salary superannuation scheme 1 31 Dec 18 165 183 (175) (199) (10) (16)QBE the Americas plan 1 31 Dec 18 235 243 (235) (263) – (20)Other plans 2 31 Dec 18 37 41 (53) (65) (16) (24)
437 467 (463) (527) (26) (60)
1 Defined benefit plan obligations are funded.2 Other plans includes $10 million (2017 $11 million) of defined benefit post-employment healthcare plan obligations that are not funded.
The measurement of assets and liabilities in defined benefit plans makes it necessary to use assumptions about discount rates, expected future salary increases, investment returns, inflation and life expectancy. If actuarial assumptions differ materially from actual outcomes, this could result in a significant change in employee benefit expense recognised in profit or loss or in actuarial remeasurements recognised in other comprehensive income, together with the defined benefit assets and liabilities recognised in the balance sheet.
The Group does not control the investment strategies of defined benefit plans; they are managed by independent trustees. Nonetheless, the Group has agreed, as part of ongoing funding arrangements, that the trustees should manage their strategic asset allocation in order to minimise the risk of material adverse impact. In particular, the Group has agreed with the trustee to reduce the level of investment risk by investing in assets that match, where possible, the profile of the liabilities. This involves holding a mixture of government and corporate bonds. The Group believes that due to the long-term nature of the plan liabilities, a level of continuing equity investment is also appropriate.
The charge recognised in profit or loss in the year of $4 million (2017 $4 million) is included in underwriting expenses. Total employer contributions expected to be paid to the various plans in 2019 amount to $2 million.
How we account for the numbersThe surplus or deficit recognised in the balance sheet in respect of defined benefit superannuation plans is the present value of the defined benefit obligation at the balance date less the fair value of plan assets. The defined benefit obligation is calculated annually by independent actuaries using the projected unit credit method. The present value of the defined benefit obligation is determined by discounting the estimated future cash outflows using interest rates of high quality corporate or government bonds that are denominated in the currency in which the benefits will be paid, and that have a term to maturity approximating the term of the related superannuation liability. Remeasurement gains and losses arising from experience adjustments and changes in actuarial assumptions are recognised in the period in which they occur, and are shown in other comprehensive income. Past service costs are recognised immediately in profit or loss.
Oth
er in
form
ation
6
Perfo
rman
ce o
verv
iew
1
Bu
siness
review
2
Go
vern
ance
3
Directo
rs' R
epo
rt
4
QB
E In
suran
ce Gro
up
A
nn
ual R
epo
rt 2018
159F
inan
cial R
epo
rt
5
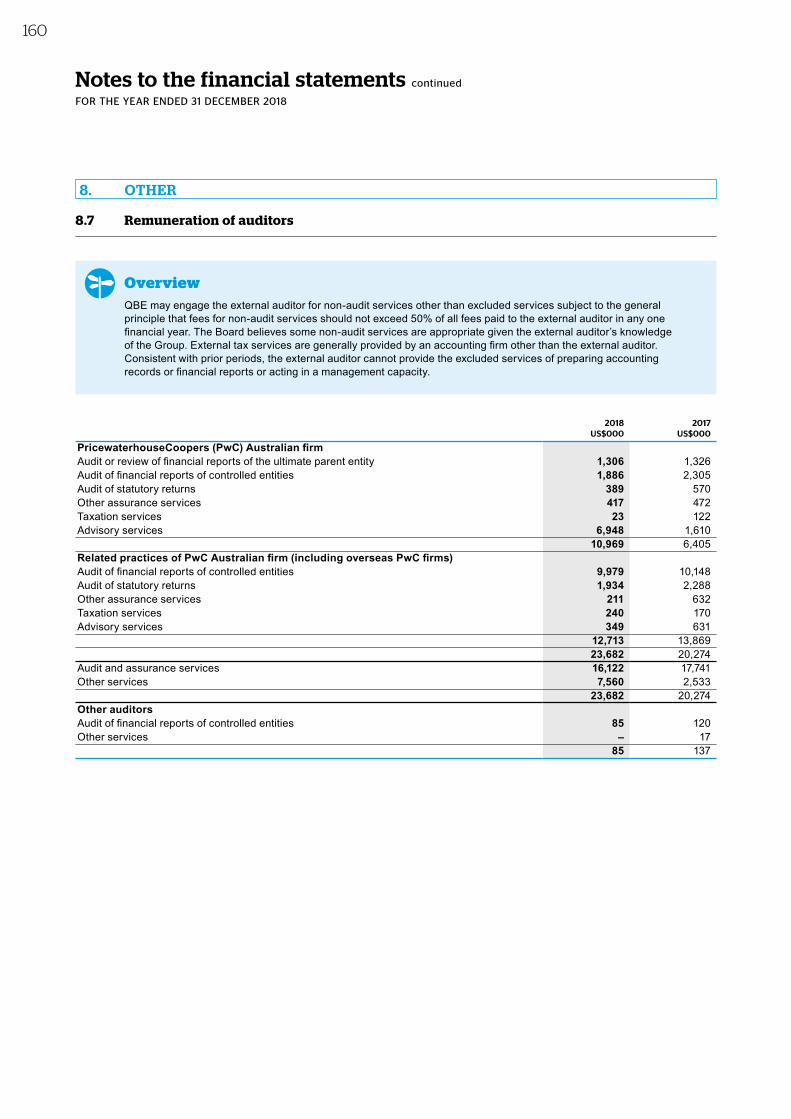
Notes to the financial statements continued
FOR THE YEAR ENDED 31 DECEMBER 2018
8.7 Remuneration of auditors
OverviewQBE may engage the external auditor for non-audit services other than excluded services subject to the general principle that fees for non-audit services should not exceed 50% of all fees paid to the external auditor in any one financial year. The Board believes some non-audit services are appropriate given the external auditor’s knowledge of the Group. External tax services are generally provided by an accounting firm other than the external auditor. Consistent with prior periods, the external auditor cannot provide the excluded services of preparing accounting records or financial reports or acting in a management capacity.
2018 2017US$000 US$000
PricewaterhouseCoopers (PwC) Australian firmAudit or review of financial reports of the ultimate parent entity 1,306 1,326Audit of financial reports of controlled entities 1,886 2,305Audit of statutory returns 389 570Other assurance services 417 472Taxation services 23 122Advisory services 6,948 1,610
10,969 6,405Related practices of PwC Australian firm (including overseas PwC firms)Audit of financial reports of controlled entities 9,979 10,148Audit of statutory returns 1,934 2,288Other assurance services 211 632Taxation services 240 170Advisory services 349 631
12,713 13,86923,682 20,274
Audit and assurance services 16,122 17,741Other services 7,560 2,533
23,682 20,274Other auditorsAudit of financial reports of controlled entities 85 120Other services – 17
85 137
8. OTHER
160
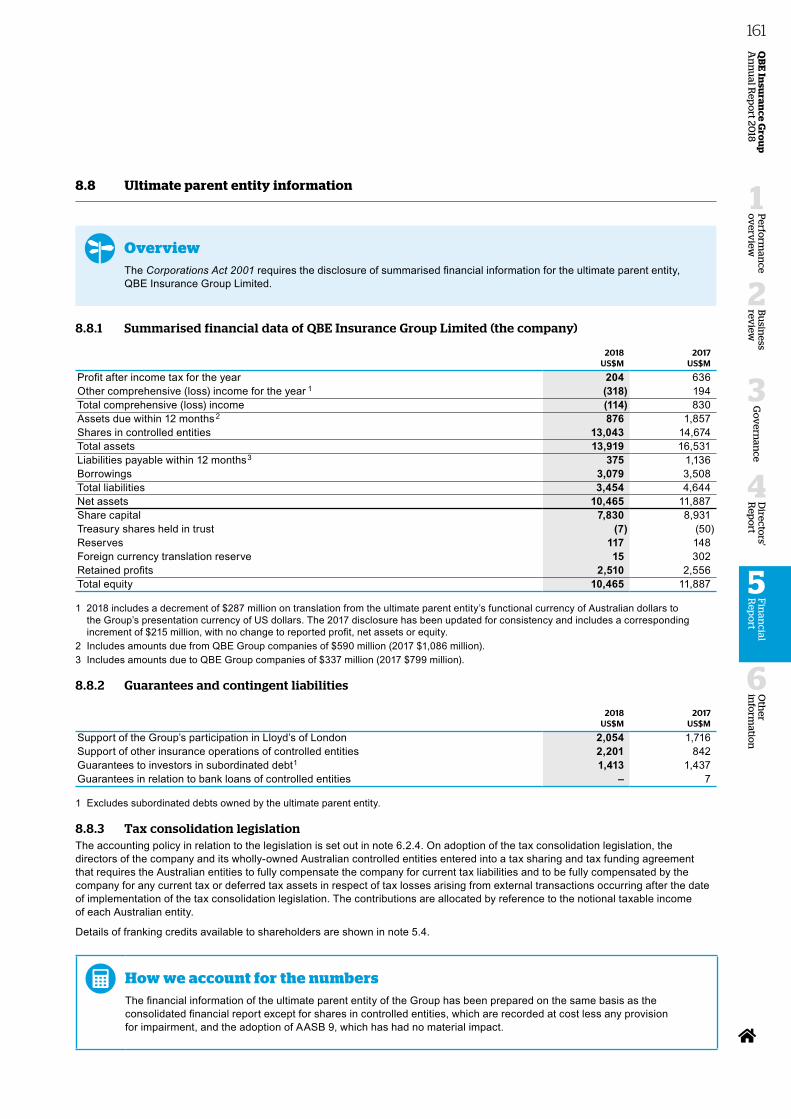
8.8 Ultimate parent entity information
OverviewThe Corporations Act 2001 requires the disclosure of summarised financial information for the ultimate parent entity, QBE Insurance Group Limited.
8.8.1 Summarised financial data of QBE Insurance Group Limited (the company)
2018 2017US$M US$M
Profit after income tax for the year 204 636Other comprehensive (loss) income for the year 1 (318) 194Total comprehensive (loss) income (114) 830Assets due within 12 months 2 876 1,857Shares in controlled entities 13,043 14,674Total assets 13,919 16,531Liabilities payable within 12 months3 375 1,136Borrowings 3,079 3,508Total liabilities 3,454 4,644Net assets 10,465 11,887Share capital 7,830 8,931Treasury shares held in trust (7) (50)Reserves 117 148Foreign currency translation reserve 15 302Retained profits 2,510 2,556Total equity 10,465 11,887
1 2018 includes a decrement of $287 million on translation from the ultimate parent entity’s functional currency of Australian dollars to the Group’s presentation currency of US dollars. The 2017 disclosure has been updated for consistency and includes a corresponding increment of $215 million, with no change to reported profit, net assets or equity.
2 Includes amounts due from QBE Group companies of $590 million (2017 $1,086 million).3 Includes amounts due to QBE Group companies of $337 million (2017 $799 million).
8.8.2 Guarantees and contingent liabilities
2018 2017US$M US$M
Support of the Group’s participation in Lloyd’s of London 2,054 1,716Support of other insurance operations of controlled entities 2,201 842Guarantees to investors in subordinated debt1 1,413 1,437Guarantees in relation to bank loans of controlled entities – 7
1 Excludes subordinated debts owned by the ultimate parent entity.
8.8.3 Tax consolidation legislationThe accounting policy in relation to the legislation is set out in note 6.2.4. On adoption of the tax consolidation legislation, the directors of the company and its wholly-owned Australian controlled entities entered into a tax sharing and tax funding agreement that requires the Australian entities to fully compensate the company for current tax liabilities and to be fully compensated by the company for any current tax or deferred tax assets in respect of tax losses arising from external transactions occurring after the date of implementation of the tax consolidation legislation. The contributions are allocated by reference to the notional taxable income of each Australian entity.
Details of franking credits available to shareholders are shown in note 5.4.
How we account for the numbersThe financial information of the ultimate parent entity of the Group has been prepared on the same basis as the consolidated financial report except for shares in controlled entities, which are recorded at cost less any provision for impairment, and the adoption of AASB 9, which has had no material impact.
Oth
er in
form
ation
6
Perfo
rman
ce o
verv
iew
1
Bu
siness
review
2
Go
vern
ance
3
Directo
rs' R
epo
rt
4
QB
E In
suran
ce Gro
up
A
nn
ual R
epo
rt 2018
161F
inan
cial R
epo
rt
5
Directors' declarationFOR THE YEAR ENDED 31 DECEMBER 2018
In the directors’ opinion:
(a) the financial statements and notes set out on pages 86 to 161 are in accordance with the Corporations Act 2001, including:(i) complying with accounting standards, the Corporations Regulations 2001 and other mandatory professional reporting
requirements; and (ii) giving a true and fair view of the Group’s financial position as at 31 December 2018 and of its performance for the financial
year ended on that date; and(b) there are reasonable grounds to believe that the company will be able to pay its debts as and when they become due and payable.
Note 1.2.1 confirms that the financial statements comply with International Financial Reporting Standards as issued by the International Accounting Standards Board.
The directors have been given the declarations by the Group Chief Executive Officer and Group Chief Financial Officer required by section 295A of the Corporations Act 2001 and as recommended under the ASX Corporate Governance Council’s Corporate Governance Principles and Recommendations.
Signed in SYDNEY this 25th day of February 2019 in accordance with a resolution of the directors.
W. Marston Becker Director
Patrick Regan Director
162
Independent auditor's reportTO THE SHAREHOLDERS OF QBE INSURANCE GROUP LIMITED
Report on the audit of the Financial Report
Our opinionIn our opinion:
The accompanying Financial Report of QBE Insurance Group Limited (the company) and its controlled entities (together the Group) is in accordance with the Corporations Act 2001, including:(a) giving a true and fair view of the Group’s financial position as at 31 December 2018 and of its financial performance for the year
then ended (b) complying with Australian Accounting Standards and the Corporations Regulations 2001.
What we have auditedThe Group Financial Report comprises:• the consolidated balance sheet as at 31 December 2018• the consolidated statement of comprehensive income for the year then ended• the consolidated statement of changes in equity for the year then ended• the consolidated statement of cash flows for the year then ended• the notes to the consolidated financial statements, which include a summary of significant accounting policies• the directors’ declaration.
Basis for opinionWe conducted our audit in accordance with Australian Auditing Standards. Our responsibilities under those standards are further described in the Auditor’s responsibilities for the audit of the Financial Report section of our report.
We believe that the audit evidence we have obtained is sufficient and appropriate to provide a basis for our opinion.
IndependenceWe are independent of the Group in accordance with the auditor independence requirements of the Corporations Act 2001 and the ethical requirements of the Accounting Professional and Ethical Standards Board’s APES 110 Code of Ethics for Professional Accountants (the Code) that are relevant to our audit of the Financial Report in Australia. We have also fulfilled our other ethical responsibilities in accordance with the Code.
PricewaterhouseCoopers, ABN 52 780 433 757One International Towers Sydney, Watermans Quay, Barangaroo, GPO BOX 2650, SYDNEY NSW 2001Level 11, 1PSQ, 169 Macquarie Street, Parramatta NSW 2150, PO Box 1155, Parramatta NSW 2124 Liability limited by a scheme approved under Professional Standards Legislation.
Fin
ancial
Rep
ort
5
Perfo
rman
ce o
verv
iew
1
Bu
siness
review
2
Go
vern
ance
3
Directo
rs' R
epo
rt
4
QB
E In
suran
ce Gro
up
A
nn
ual R
epo
rt 2018
163O
ther
info
rmatio
n
6
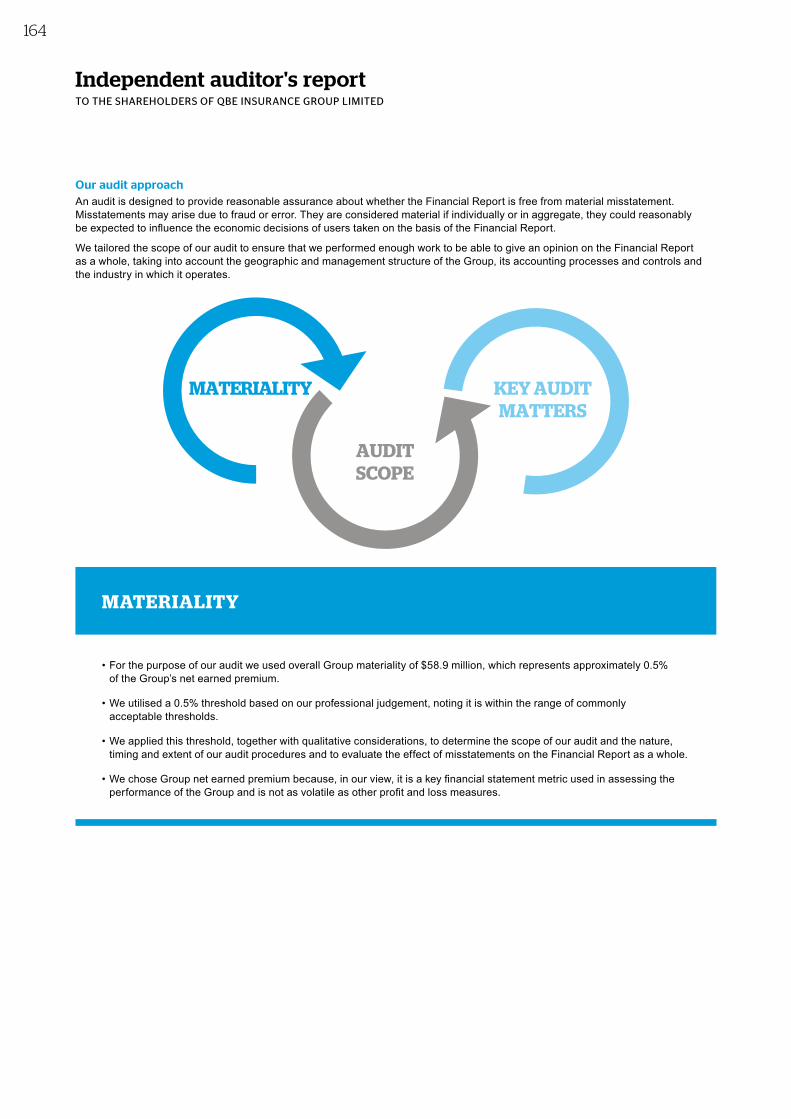
Independent auditor's reportTO THE SHAREHOLDERS OF QBE INSURANCE GROUP LIMITED
Our audit approachAn audit is designed to provide reasonable assurance about whether the Financial Report is free from material misstatement. Misstatements may arise due to fraud or error. They are considered material if individually or in aggregate, they could reasonably be expected to influence the economic decisions of users taken on the basis of the Financial Report.
We tailored the scope of our audit to ensure that we performed enough work to be able to give an opinion on the Financial Report as a whole, taking into account the geographic and management structure of the Group, its accounting processes and controls and the industry in which it operates.
AUDITSCOPE
MATERIALITY KEY AUDITMATTERS
MATERIALITY
• For the purpose of our audit we used overall Group materiality of $58.9 million, which represents approximately 0.5% of the Group’s net earned premium.
• We utilised a 0.5% threshold based on our professional judgement, noting it is within the range of commonly acceptable thresholds.
• We applied this threshold, together with qualitative considerations, to determine the scope of our audit and the nature, timing and extent of our audit procedures and to evaluate the effect of misstatements on the Financial Report as a whole.
• We chose Group net earned premium because, in our view, it is a key financial statement metric used in assessing the performance of the Group and is not as volatile as other profit and loss measures.
164
AUDIT SCOPE
• Our audit focused on where the Group made subjective judgements; for example, significant accounting estimates involving assumptions and inherently uncertain future events.
• We ensured that the audit teams at both Group and operational levels possessed the appropriate skills and competencies needed for the audit of a complex global insurer. This included industry expertise in insurance, as well as IT specialists, actuarial, tax and valuation professionals.
• We conducted an audit of the most financially significant divisions being North American Operations, European Operations, Australian & New Zealand Operations and Equator Re (the divisions). In addition, we performed specified risk focused audit procedures on certain account balances for other entities within the Group.
• For the work performed by auditors within PwC Australia or from other firms operating under our instructions, we determined the level of involvement we needed to have in their audit work to be satisfied that sufficient audit evidence had been obtained for the purposes of our opinion.
• We kept in regular communication with audit teams throughout the year with conference calls, discussions and written instructions, where appropriate. Further, we visited and met with management and local audit teams in New York, London, Hong Kong and Sydney.
• We performed further audit procedures at a Group level over the remaining balances and the consolidation of the Group’s reporting segments.
Fin
ancial
Rep
ort
5
Perfo
rman
ce o
verv
iew
1
Bu
siness
review
2
Go
vern
ance
3
Directo
rs' R
epo
rt
4
QB
E In
suran
ce Gro
up
A
nn
ual R
epo
rt 2018
165O
ther
info
rmatio
n
6
Independent auditor's reportTO THE SHAREHOLDERS OF QBE INSURANCE GROUP LIMITED
Key audit mattersKey audit matters are those matters that, in our professional judgement, were of most significance in our audit of the Financial Report for the current period. The key audit matters were addressed in the context of our audit of the Financial Report as a whole, and in forming our opinion thereon, and we do not provide a separate opinion on these matters. Further, any commentary on the outcomes of a particular audit procedure is made in that context. We communicated the key audit matters to the Audit Committee.
KEY AUDIT MATTER How our audit addressed the key audit matter
Valuation of net outstanding claims(Refer to note 2.3) $14,028 million
We considered the valuation of net outstanding claims a key audit matter because of the complexity involved in the estimation process and the significant judgements that the Group makes in determining the balance. Note 2.3 to the financial statements describes the elements that make up the balance. We comment on the most judgemental aspects of these elements below.
(a) Gross discounted central estimate(Refer to note 2.3.1) $18,421 million
The estimation of outstanding claims involves significant judgement given the size of the liability and inherent uncertainty in estimating the expected future payments for claims incurred.
The valuation of outstanding claims relies on the quality of the underlying data. It involves complex and subjective judgements about future events, both internal and external to the business, for which minor changes in assumptions can result in material impacts on the estimate. Claims estimates in respect of catastrophe events may involve additional uncertainty, particularly those occurring closer to the year end, given the materiality of amounts involved, and the inherent difficulty in initially assessing amounts until further evidence emerges.
Judgement also arises over the estimation of payments for claims that have been incurred at the reporting date but have not yet been reported to the Group as there is generally less information available in relation to these claims. Classes of business where there is a greater length of time between the initial claim event and settlement (such as workers’ compensation, professional indemnity and other liability classes) tend to display greater variability between initial estimates and final settlement.
The estimate of expected future payments is discounted to present value using a risk-free rate of return in order to reflect the time value of money. Judgement is involved in estimating the period over which claims are expected to settle.
Our procedures, in conjunction with PwC actuarial experts, included:• Assessing the design and testing the operating effectiveness
of certain controls over the actuarial function.• Testing historical claims, a key input into the actuarial
estimates, by selecting a sample of claims case estimates and settlements, and agreeing the key elements to underlying documentation.
• Assessing those classes of business where claims reserve estimates present a higher risk and focusing on those which inherently involve greater levels of judgement and have shown greater year on year variation over previous estimates. In the current year these included large risk and catastrophe claims reserves related to Hurricane Michael, the California wildfires and certain longer tail liability portfolios.
• Evaluating whether the Group’s actuarial methodologies were consistent with those used in the industry and with prior periods.
• Assessing key actuarial assumptions such as the claims ratios and expected frequency and severity of claims, together with our actuarial experts. We considered these assumptions by comparing them with our expectations based on the Group’s experience, current trends and benchmarks, and our own industry knowledge. For some classes of business, we also performed our own independent actuarial projections and compared the results with the Group’s estimates.
• Testing the discount applied, by territory and line of business, for classes of business where there is a greater length of time between the initial claim event and settlement. This included comparing the rates applied to external market data and the payment patterns to historical information.
• Considering the work and findings of external actuarial experts engaged by the Group to review the discounted central estimates.
166
KEY AUDIT MATTER How our audit addressed the key audit matter
(b) Reinsurance and other recoveries(Refer to note 2.3.2) $5,551 million
The valuation of reinsurance assets requires a significant level of judgement, given its inherent dependence on underlying estimates of gross outstanding claims.
In addition, significant judgement may be required by the Group to ensure contractual terms are correctly accounted for (such as the Group’s aggregate large risk and catastrophe reinsurance program (GLRC)).
Our procedures included:• Obtaining audit evidence in relation to the data and actuarial
processes for estimating reinsurance recoveries on outstanding claims by performing the same audit procedures as those outlined above for gross claims estimates.
• For the GLRC program, evaluating a sample of claims that are subject to recovery under the program. This included considering the work of the Group’s actuarial experts and comparing the Group’s recovery calculations to the terms of the underlying contracts with the reinsurer.
• For remaining material reinsurance assets, we inspected a sample of relevant contracts to determine whether the key terms had been reflected in the financial statements in accordance with Australian Accounting Standards. We also performed procedures to assess the recoverability of those assets, including consideration of the ageing on amounts receivable and assessment of the credit ratings of relevant reinsurance counterparties.
(c) Risk margins and probability of adequacy (PoA)(Refer to note 2.3.3) $1,158 million
The net outstanding claims provision includes, in addition to the central estimate of the present value of the expected future payments, a risk margin which relates to the inherent uncertainty in that estimate. In determining the risk margin, the Group must make judgements about the variability of each class of business underwritten and the extent of correlation within each division and between different geographical locations.
Probability of adequacy (PoA) is a measure of the estimated overall sufficiency of reserves including a risk margin in light of that variability.
Our procedures included:• Assessing the Board’s approach to setting the risk margin
in accordance with the requirements of Australian Accounting Standards, with a particular focus on the assessed level of uncertainty in the net central estimate leading to a change in the margin year on year. We evaluated these factors by considering the findings from our work performed on the net central estimate.
• Testing the Group’s actuarial calculation of the PoA for reasonableness and consistency with previous valuations. This included developing an understanding of and testing the actuarial techniques applied by the Group, and comparing the results with industry benchmarks.
Fin
ancial
Rep
ort
5
Perfo
rman
ce o
verv
iew
1
Bu
siness
review
2
Go
vern
ance
3
Directo
rs' R
epo
rt
4
QB
E In
suran
ce Gro
up
A
nn
ual R
epo
rt 2018
167O
ther
info
rmatio
n
6
Independent auditor's reportTO THE SHAREHOLDERS OF QBE INSURANCE GROUP LIMITED
KEY AUDIT MATTER How our audit addressed the key audit matter
Valuation of goodwill in North American Operations(Refer to note 7.2.1) $832 million
Goodwill has been recognised as a result of the Group’s historical acquisitions and is allocated to cash generating units (CGUs) expected to benefit from synergies arising from the acquisitions giving rise to the goodwill.
An impairment assessment is performed annually by the Group, comparing the carrying value of the CGUs with their recoverable amount. The recoverable amount of each CGU is determined by calculating the fair value of the CGU.
The fair value of the CGU is contingent on future cash flows and there is a risk that goodwill will be impaired if cash flows are not in line with the Group’s expectations. The projections in the Group’s impairment model contain a number of significant judgements and estimates including the terminal growth rate, the forecast combined operating ratios in the projection period and investment return assumptions. Changes in these assumptions could lead to an impairment to the carrying value of goodwill.
We considered goodwill relating to the North American Operations to be a key audit matter because of the financial significance of the carrying value of the balance and previous impairment charges recorded, and because the impairment assessment is sensitive to reasonably possible changes in assumptions.
Our procedures included:• Assessing whether the methodology used by the Group
for impairment assessment purposes was in line with the requirements of Australian Accounting Standards.
• Developing an understanding of the process by which the projected future cash flow forecasts were developed and comparing the cash flows included in the impairment assessment with the three year business plan presented to the Board.
• Assessing the key assumptions used to derive the future cash flows, taking into consideration the past projections and actual performance of the North American Operations.
• Together with PwC valuation experts, evaluating the consistency of the terminal growth rate and investment returns with available external analyses, and reperforming the calculation of the discount rate applied to future cash flows, comparing key inputs (including risk-free rate, market premium, unlevered beta and company specific risk premium).
• Reperforming the Group’s sensitivity analysis calculations, and considering other reasonably possible changes in key assumptions.
• Considering the work and findings of external valuation experts engaged by the Group to assess a supportable range for the valuation of the North American Operations CGU.
168
KEY AUDIT MATTER How our audit addressed the key audit matter
Recoverability of deferred tax assets in the US tax group(Refer to note 6.2.3) $370 million
The Group continues to recognise a US deferred tax asset comprised of carry forward tax losses and deductible temporary differences. Following the restructure relating to Blue Ocean in the first half of 2018 (as detailed in Note 6.2.3 to the financial statements), North American Operations’ carry forward tax losses can be applied against Equator Re’s profits.
The recoverability of the US deferred tax asset depends upon sustained improvement in the profitability of the North American Operations, the rate at which those profits will be taxed, the period over which tax losses will be available for recovery, and the execution of any future tax planning.
We considered this a key audit matter due to the significant judgement required by the Group to assess the recoverability of the US deferred tax asset.
Our procedures included:• Considering the impact of the restructure of the US tax group
(as detailed in note 6.2.3 to the financial statements) on the recoverability of the US deferred tax asset.
• Evaluating the progress made by the Group in improving the profitability of the North American Operations in recent periods, which included the remediation of the causes of past losses through, amongst other initiatives, business disposals and cost reduction programs.
• Comparing future taxable profits used in the deferred tax asset recoverability assessment to the current year results and three year business plan presented to the Board.
• Analysing the tax rate applied to forecast future taxable profits in light of the US tax law changes.
• Considering key assumptions adopted by the Group in relation to future tax planning strategies, as outlined in Note 4.1 to the financial statements.
• Together with PwC tax experts, considering whether the tax losses are legally available for the forecast recoupment period.
Valuation of investments(Refer to note 3.2) $21,989 million
The Group holds investments representing 56% of the total assets.
The majority of the Group’s investments are considered to be non-complex in nature as fair value is based on prices and rates that can be easily observed in the relevant markets. On this basis, the majority of the Group’s investments are classified under Australian Accounting Standards as either "Level 1" (i.e. where key inputs to the valuation are based on quoted prices in the market) or "Level 2" (i.e. where key inputs to the valuation are based on observable prices in the market). We considered these Level 1 and Level 2 investments to be a key audit matter due to their financial significance to the Group.
The Group also holds a limited number of investments considered to be "Level 3" under Australian Accounting Standards (i.e. where key inputs to the valuation require additional judgement as significant inputs are not based on observable market data) primarily in respect to infrastructure debt, infrastructure assets and private equity investments. While the Group’s holdings of such investments is limited relative to total investment holdings, we considered their valuation to be a key audit matter because there is more judgement involved in determining their value.
Our procedures included:• Assessing the design and testing the operating effectiveness
of selected controls over the investment function.• Comparing the Group’s calculation of fair value for a sample
of investments to our own independent calculation. Together with PwC valuation experts, this included sourcing independent inputs from market data providers and using our own valuation models.
• Obtaining independent confirmations from fund managers or equivalent over the existence of investments.
Fin
ancial
Rep
ort
5
Perfo
rman
ce o
verv
iew
1
Bu
siness
review
2
Go
vern
ance
3
Directo
rs' R
epo
rt
4
QB
E In
suran
ce Gro
up
A
nn
ual R
epo
rt 2018
169O
ther
info
rmatio
n
6
Independent auditor's reportTO THE SHAREHOLDERS OF QBE INSURANCE GROUP LIMITED
KEY AUDIT MATTER How our audit addressed the key audit matter
Operation of IT systems and controls The Group is dependent on complex IT systems for the processing and recording of significant volumes of transactions.
In particular, in common with all large financial services organisations, access rights to technology are important because they are intended to ensure that changes to applications and data are appropriately authorised. Ensuring staff have appropriate access to IT systems and access is monitored, are key controls in mitigating the potential for fraud or error as a result of a change to an application or underlying data.
We considered this a key audit matter because a significant number of the key financial controls we seek to rely on in our audit are related to IT systems and automated controls.
Our procedures included:• Developing an understanding of the significant business
processes, IT systems and relevant controls.• Assessing the design and testing the operating effectiveness
of the key controls over the relevant IT systems.
This involved assessing: • Access to programs and data: the access controls designed
to enforce segregation of duties or ensure that data is only changed through authorised means.
• Change management: the processes and controls used to develop, test and authorise changes to the functionality and configurations within systems.
• IT operations: the controls over key operations are used to ensure that any issues that arise are managed appropriately.
For in-scope IT operations where technology services are provided by a third party, we considered assurance reports from the third party’s auditor on the design and operating effectiveness of controls.
We also carried out further independent tests over the operation of key applications to establish the accuracy of selected calculations, the correct generation of certain reports, and to assess the correct operation of selected automated controls and technology-dependent manual controls.
Where we identified design and operating effectiveness issues with the access and change management controls, a combination of compensating controls and detailed testing provided sufficient evidence for our audit.
Other informationThe directors are responsible for the other information. The other information comprises the information included in the Annual Report for the year ended 31 December 2018, but does not include the Financial Report and our auditor’s report thereon.
Our opinion on the Financial Report does not cover the other information and accordingly we do not express any form of assurance conclusion thereon.
In connection with our audit of the Financial Report, our responsibility is to read the other information and, in doing so, consider whether the other information is materially inconsistent with the Financial Report or our knowledge obtained in the audit, or otherwise appears to be materially misstated.
If, based on the work we have performed on the other information that we obtained prior to the date of this auditor’s report, we conclude that there is a material misstatement of this other information, we are required to report that fact. We have nothing to report in this regard.
Responsibilities of the directors for the Financial ReportThe directors of the company are responsible for the preparation of the Financial Report that gives a true and fair view in accordance with Australian Accounting Standards and the Corporations Act 2001 and for such internal control as the directors determine is necessary to enable the preparation of the Financial Report that gives a true and fair view and is free from material misstatement, whether due to fraud or error.
In preparing the Financial Report, the directors are responsible for assessing the ability of the Group to continue as a going concern, disclosing, as applicable, matters related to going concern and using the going concern basis of accounting unless the directors either intend to liquidate the Group or to cease operations, or have no realistic alternative but to do so.
170
Auditor’s responsibilities for the audit of the Financial ReportOur objectives are to obtain reasonable assurance about whether the Financial Report as a whole is free from material misstatement, whether due to fraud or error, and to issue an auditor’s report that includes our opinion. Reasonable assurance is a high level of assurance, but is not a guarantee that an audit conducted in accordance with the Australian Auditing Standards will always detect a material misstatement when it exists. Misstatements can arise from fraud or error and are considered material if, individually or in the aggregate, they could reasonably be expected to influence the economic decisions of users taken on the basis of the Financial Report.
A further description of our responsibilities for the audit of the Financial Report is located at the Auditing and Assurance Standards Board website at: http://www.auasb.gov.au/auditors_responsibilities/ar1.pdf.
This description forms part of our auditor’s report.
Report on the Remuneration Report
Our opinion on the Remuneration ReportWe have audited the Remuneration Report included in pages 60 to 82 of the Directors’ Report for the year ended 31 December 2018.
In our opinion, the Remuneration Report of QBE Insurance Group Limited for the year ended 31 December 2018 complies with section 300A of the Corporations Act 2001.
ResponsibilitiesThe directors of the company are responsible for the preparation and presentation of the Remuneration Report in accordance with section 300A of the Corporations Act 2001. Our responsibility is to express an opinion on the Remuneration Report, based on our audit conducted in accordance with Australian Auditing Standards.
PricewaterhouseCoopers
SJ Hadfield B GriffinPartner Partner
Sydney 25 February 2019
Fin
ancial
Rep
ort
5
Perfo
rman
ce o
verv
iew
1
Bu
siness
review
2
Go
vern
ance
3
Directo
rs' R
epo
rt
4
QB
E In
suran
ce Gro
up
A
nn
ual R
epo
rt 2018
171O
ther
info
rmatio
n
6
Shareholder information
QBE is incorporated in Australia, is listed on the Australian Securities Exchange (ASX) and trades under the code “QBE”.
Registered office
QBE Insurance Group Limited
Level 27, 8 Chifley Square Sydney NSW 2000 Australia
Telephone: +61 2 9375 4444 Facsimile: +61 2 9231 6104
Website: www.qbe.com
QBE websiteQBE’s website provides investors with information about QBE including annual reports, corporate governance statements, sustainability reports, half yearly reports and announcements to the ASX. The website also offers regular QBE share price updates, a calendar of events, a history of QBE’s dividend and online access to your shareholding details via the share registry.
Shareholder information and enquiriesEnquiries and correspondence regarding shareholdings can be directed to QBE’s share registry:
Computershare Investor Services Pty Limited (Computershare)
GPO Box 2975 Melbourne VIC 3001 Australia
452 Johnston Street Abbotsford VIC 3067 Australia
Telephone: 1300 723 487 (Australia) Telephone: +61 3 9415 4840 (International)
Web: www.computershare.com.au Email: [email protected]
For security purposes, you will need to quote your Securityholder Reference Number (SRN) or Holder Identification Number (HIN).
If you are broker (CHESS) sponsored, queries relating to incorrect registrations and changes to name and/or address can only be processed by your stockbroker. Please contact your stockbroker. Computershare cannot assist you with these changes.
Shareholding details onlineManage your shareholding online by visiting QBE’s share registry, Computershare. Log onto www.investorcentre.com to view your holding balance and dividend statements, to update your address (if you are registered with an SRN) or direct credit instructions, provide DRP or BSP instructions or change/add your TFN/ABN details.
You may also register to receive shareholder documentation electronically including your dividend statement, notice of meeting and proxy and annual reports.
Privacy legislationChapter 2C of the Corporations Act 2001 requires information about you as a security holder (including your name, address and details of the securities you hold) to be included in QBE’s share register. These details must continue to be included in the public register even if you cease to be a security holder. A copy of the privacy policy is available on Computershare’s website.
Relevant interests registerNasdaq OMX Pty Ltd of Level 8, 155 George Street, Sydney NSW 2000 Australia maintains QBE’s register of information about relevant interests. Shareholders and other parties can telephone Nasdaq OMX on +61 2 8076 2600 or facsimile on +61 2 8076 2601 if they wish to inspect this register.
DividendsQBE pays cash dividends to shareholders resident in Australia and New Zealand by direct credit. Shareholders in the UK and the US also have the option to receive their cash dividends by direct credit, although it is not mandatory. The benefit to shareholders of the direct credit facility is access to cleared funds quickly and securely – reducing the risk of cheques being lost or stolen. Shareholders in other countries will receive cheque payments in Australian dollars if they have not elected to receive their payment by direct credit. Shareholders receive a dividend statement for tax records, either by post or by email depending on the selected communications option.
Eligible shareholders can participate in QBE’s Dividend Reinvestment Plan (DRP) and Bonus Share Plan (BSP) when the plans are active. The DRP enables shareholders to subscribe for additional shares. The BSP is a bonus share plan whereby the dividend entitlement is forgone for bonus shares in lieu of the dividend. In order to participate in either the DRP or BSP, shareholders must have a minimum shareholding of 100 shares and have a registered address in Australia or New Zealand.
Participants may change their election to participate in the DRP and BSP at any time. DRP/BSP election cut-off dates and application forms are available from QBE’s website.
172
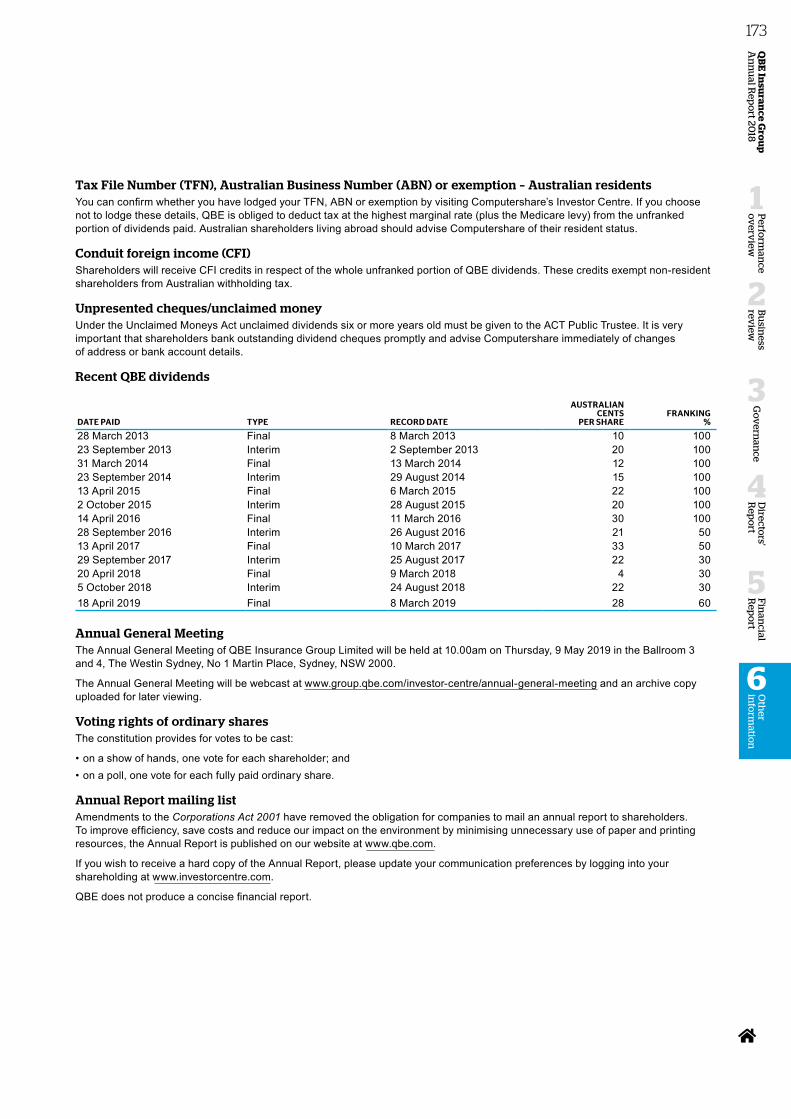
Tax File Number (TFN), Australian Business Number (ABN) or exemption – Australian residentsYou can confirm whether you have lodged your TFN, ABN or exemption by visiting Computershare’s Investor Centre. If you choose not to lodge these details, QBE is obliged to deduct tax at the highest marginal rate (plus the Medicare levy) from the unfranked portion of dividends paid. Australian shareholders living abroad should advise Computershare of their resident status.
Conduit foreign income (CFI)Shareholders will receive CFI credits in respect of the whole unfranked portion of QBE dividends. These credits exempt non-resident shareholders from Australian withholding tax.
Unpresented cheques/unclaimed moneyUnder the Unclaimed Moneys Act unclaimed dividends six or more years old must be given to the ACT Public Trustee. It is very important that shareholders bank outstanding dividend cheques promptly and advise Computershare immediately of changes of address or bank account details.
Recent QBE dividends
DATE PAID TYPE RECORD DATE
AUSTRALIANCENTS
PER SHAREFRANKING
%
28 March 2013 Final 8 March 2013 10 10023 September 2013 Interim 2 September 2013 20 10031 March 2014 Final 13 March 2014 12 10023 September 2014 Interim 29 August 2014 15 10013 April 2015 Final 6 March 2015 22 1002 October 2015 Interim 28 August 2015 20 10014 April 2016 Final 11 March 2016 30 10028 September 2016 Interim 26 August 2016 21 5013 April 2017 Final 10 March 2017 33 5029 September 2017 Interim 25 August 2017 22 3020 April 2018 Final 9 March 2018 4 305 October 2018 Interim 24 August 2018 22 3018 April 2019 Final 8 March 2019 28 60
Annual General MeetingThe Annual General Meeting of QBE Insurance Group Limited will be held at 10.00am on Thursday, 9 May 2019 in the Ballroom 3 and 4, The Westin Sydney, No 1 Martin Place, Sydney, NSW 2000.
The Annual General Meeting will be webcast at www.group.qbe.com/investor-centre/annual-general-meeting and an archive copy uploaded for later viewing.
Voting rights of ordinary sharesThe constitution provides for votes to be cast:
• on a show of hands, one vote for each shareholder; and• on a poll, one vote for each fully paid ordinary share.
Annual Report mailing listAmendments to the Corporations Act 2001 have removed the obligation for companies to mail an annual report to shareholders. To improve efficiency, save costs and reduce our impact on the environment by minimising unnecessary use of paper and printing resources, the Annual Report is published on our website at www.qbe.com.
If you wish to receive a hard copy of the Annual Report, please update your communication preferences by logging into your shareholding at www.investorcentre.com.
QBE does not produce a concise financial report.
Fin
ancial
Rep
ort
5
Perfo
rman
ce o
verv
iew
1
Bu
siness
review
2
Go
vern
ance
3
Directo
rs' R
epo
rt
4
QB
E In
suran
ce Gro
up
A
nn
ual R
epo
rt 2018
173O
ther
info
rmatio
n
6
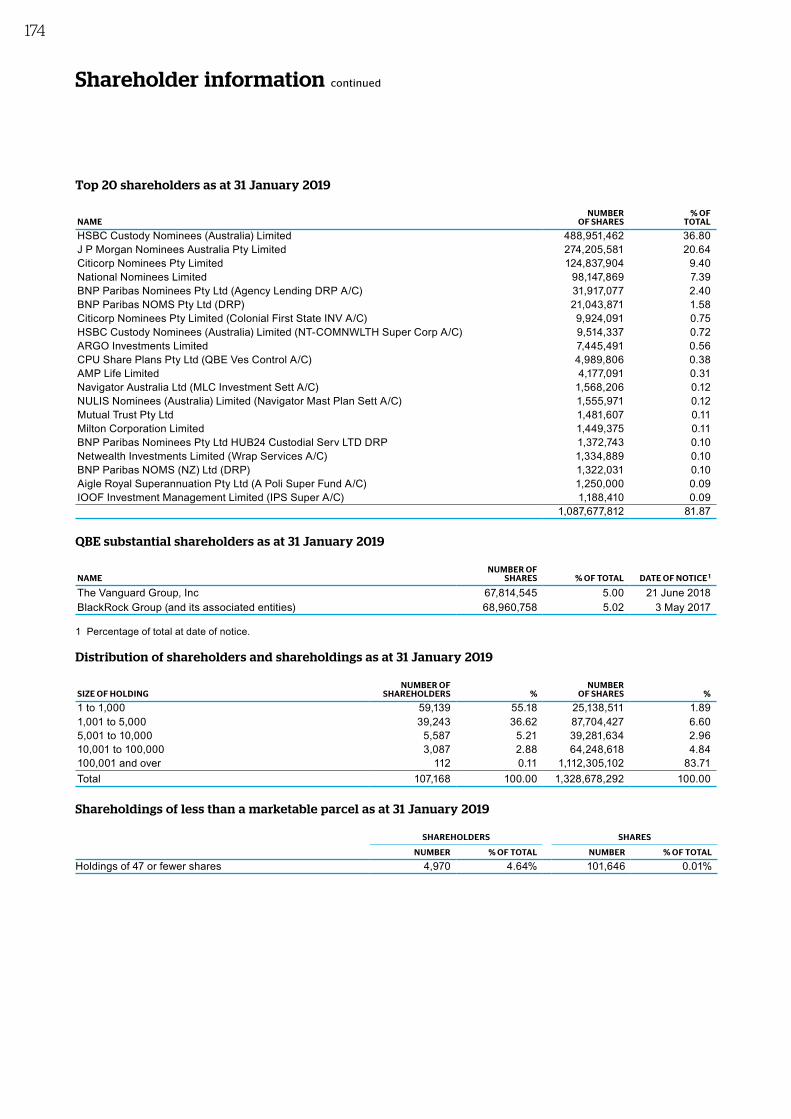
Shareholder information continued
Top 20 shareholders as at 31 January 2019
NAMENUMBER
OF SHARES% OF
TOTAL
HSBC Custody Nominees (Australia) Limited 488,951,462 36.80J P Morgan Nominees Australia Pty Limited 274,205,581 20.64Citicorp Nominees Pty Limited 124,837,904 9.40National Nominees Limited 98,147,869 7.39BNP Paribas Nominees Pty Ltd (Agency Lending DRP A/C) 31,917,077 2.40BNP Paribas NOMS Pty Ltd (DRP) 21,043,871 1.58Citicorp Nominees Pty Limited (Colonial First State INV A/C) 9,924,091 0.75HSBC Custody Nominees (Australia) Limited (NT-COMNWLTH Super Corp A/C) 9,514,337 0.72ARGO Investments Limited 7,445,491 0.56CPU Share Plans Pty Ltd (QBE Ves Control A/C) 4,989,806 0.38AMP Life Limited 4,177,091 0.31Navigator Australia Ltd (MLC Investment Sett A/C) 1,568,206 0.12NULIS Nominees (Australia) Limited (Navigator Mast Plan Sett A/C) 1,555,971 0.12Mutual Trust Pty Ltd 1,481,607 0.11Milton Corporation Limited 1,449,375 0.11BNP Paribas Nominees Pty Ltd HUB24 Custodial Serv LTD DRP 1,372,743 0.10Netwealth Investments Limited (Wrap Services A/C) 1,334,889 0.10BNP Paribas NOMS (NZ) Ltd (DRP) 1,322,031 0.10Aigle Royal Superannuation Pty Ltd (A Poli Super Fund A/C) 1,250,000 0.09IOOF Investment Management Limited (IPS Super A/C) 1,188,410 0.09
1,087,677,812 81.87
QBE substantial shareholders as at 31 January 2019
NAMENUMBER OF
SHARES % OF TOTAL DATE OF NOTICE 1
The Vanguard Group, Inc 67,814,545 5.00 21 June 2018BlackRock Group (and its associated entities) 68,960,758 5.02 3 May 2017
1 Percentage of total at date of notice.
Distribution of shareholders and shareholdings as at 31 January 2019
SIZE OF HOLDINGNUMBER OF
SHAREHOLDERS %NUMBER
OF SHARES %
1 to 1,000 59,139 55.18 25,138,511 1.891,001 to 5,000 39,243 36.62 87,704,427 6.605,001 to 10,000 5,587 5.21 39,281,634 2.9610,001 to 100,000 3,087 2.88 64,248,618 4.84100,001 and over 112 0.11 1,112,305,102 83.71Total 107,168 100.00 1,328,678,292 100.00
Shareholdings of less than a marketable parcel as at 31 January 2019
SHAREHOLDERS SHARES
NUMBER % OF TOTAL NUMBER % OF TOTAL
Holdings of 47 or fewer shares 4,970 4.64% 101,646 0.01%
174
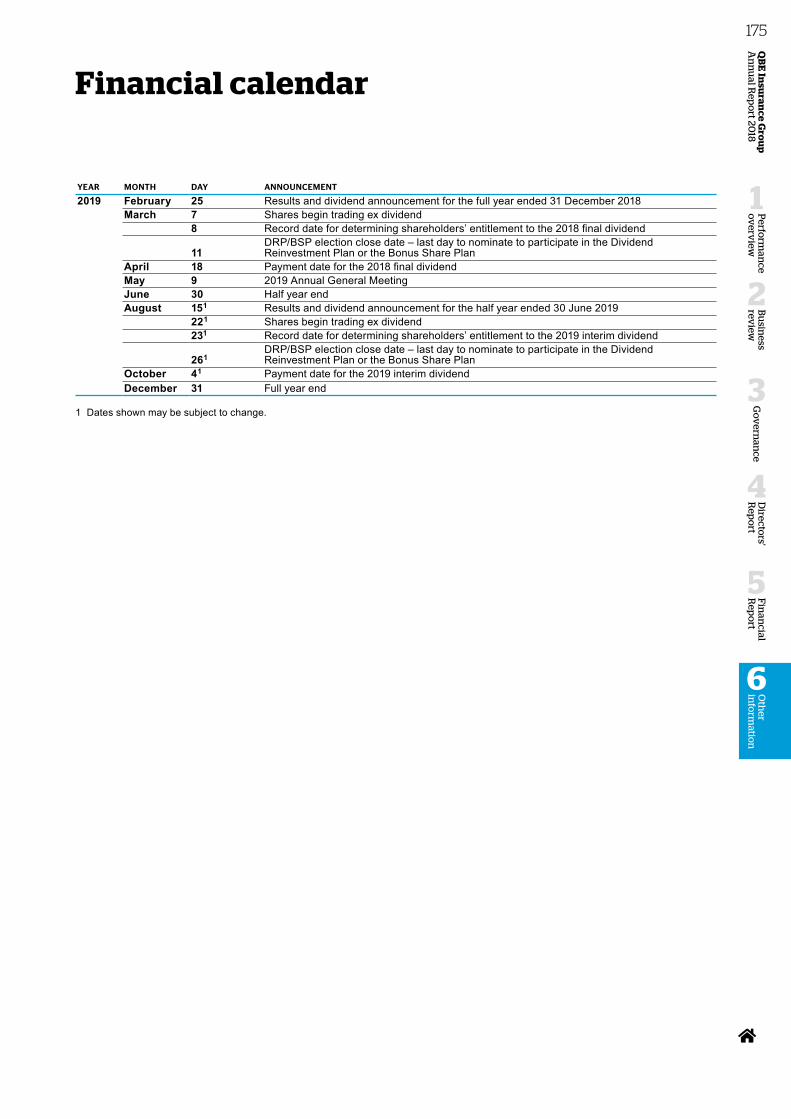
Financial calendar
YEAR MONTH DAY ANNOUNCEMENT
2019 February 25 Results and dividend announcement for the full year ended 31 December 2018March 7 Shares begin trading ex dividend
8 Record date for determining shareholders’ entitlement to the 2018 final dividend
11DRP/BSP election close date – last day to nominate to participate in the Dividend Reinvestment Plan or the Bonus Share Plan
April 18 Payment date for the 2018 final dividendMay 9 2019 Annual General MeetingJune 30 Half year endAugust 151 Results and dividend announcement for the half year ended 30 June 2019
221 Shares begin trading ex dividend231 Record date for determining shareholders’ entitlement to the 2019 interim dividend
261DRP/BSP election close date – last day to nominate to participate in the Dividend Reinvestment Plan or the Bonus Share Plan
October 41 Payment date for the 2019 interim dividendDecember 31 Full year end
1 Dates shown may be subject to change.
Fin
ancial
Rep
ort
5
Perfo
rman
ce o
verv
iew
1
Bu
siness
review
2
Go
vern
ance
3
Directo
rs' R
epo
rt
4
QB
E In
suran
ce Gro
up
A
nn
ual R
epo
rt 2018
175O
ther
info
rmatio
n
6
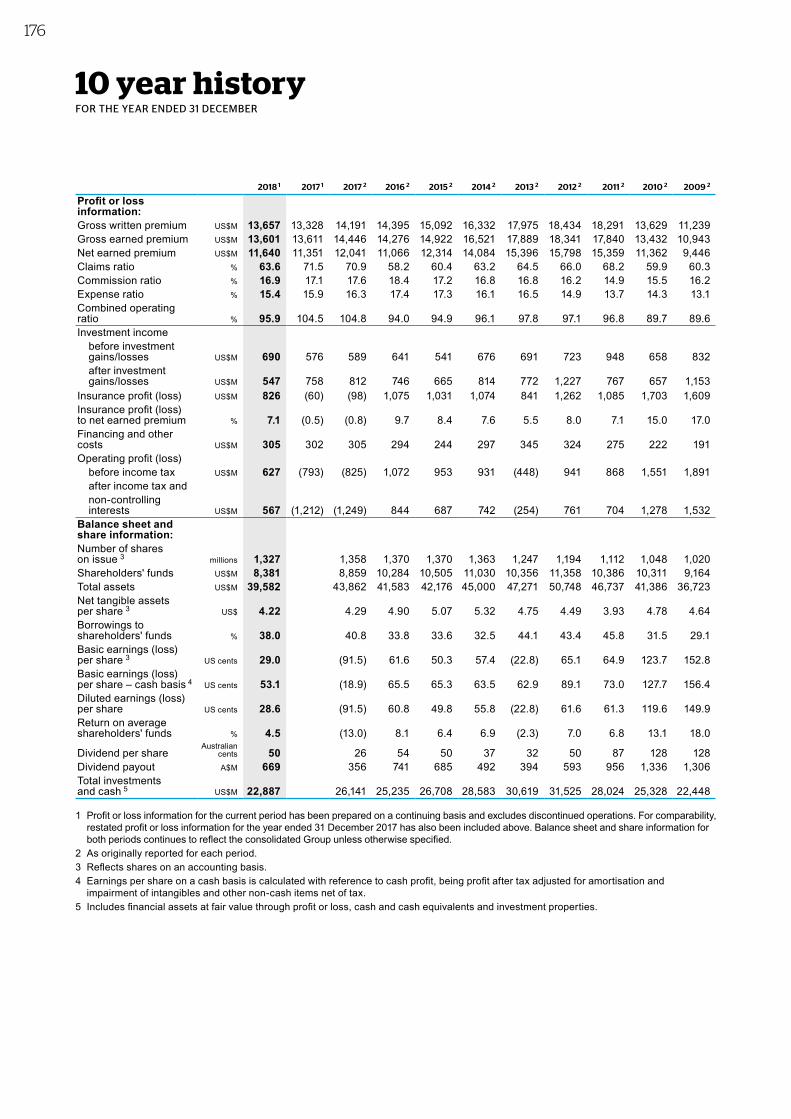
10 year historyFOR THE YEAR ENDED 31 DECEMBER
2018 1 2017 1 2017 2 2016 2 2015 2 2014 2 2013 2 2012 2 2011 2 2010 2 2009 2
Profit or loss information:Gross written premium US$M 13,657 13,328 14,191 14,395 15,092 16,332 17,975 18,434 18,291 13,629 11,239Gross earned premium US$M 13,601 13,611 14,446 14,276 14,922 16,521 17,889 18,341 17,840 13,432 10,943Net earned premium US$M 11,640 11,351 12,041 11,066 12,314 14,084 15,396 15,798 15,359 11,362 9,446Claims ratio % 63.6 71.5 70.9 58.2 60.4 63.2 64.5 66.0 68.2 59.9 60.3Commission ratio % 16.9 17.1 17.6 18.4 17.2 16.8 16.8 16.2 14.9 15.5 16.2Expense ratio % 15.4 15.9 16.3 17.4 17.3 16.1 16.5 14.9 13.7 14.3 13.1Combined operating ratio % 95.9 104.5 104.8 94.0 94.9 96.1 97.8 97.1 96.8 89.7 89.6Investment income
before investment gains/losses US$M 690 576 589 641 541 676 691 723 948 658 832after investment gains/losses US$M 547 758 812 746 665 814 772 1,227 767 657 1,153
Insurance profit (loss) US$M 826 (60) (98) 1,075 1,031 1,074 841 1,262 1,085 1,703 1,609Insurance profit (loss) to net earned premium % 7.1 (0.5) (0.8) 9.7 8.4 7.6 5.5 8.0 7.1 15.0 17.0Financing and other costs US$M 305 302 305 294 244 297 345 324 275 222 191Operating profit (loss)
before income tax US$M 627 (793) (825) 1,072 953 931 (448) 941 868 1,551 1,891after income tax andnon-controlling interests US$M 567 (1,212) (1,249) 844 687 742 (254) 761 704 1,278 1,532
Balance sheet and share information:Number of shares on issue 3 millions 1,327 1,358 1,370 1,370 1,363 1,247 1,194 1,112 1,048 1,020Shareholders' funds US$M 8,381 8,859 10,284 10,505 11,030 10,356 11,358 10,386 10,311 9,164Total assets US$M 39,582 43,862 41,583 42,176 45,000 47,271 50,748 46,737 41,386 36,723Net tangible assets per share 3 US$ 4.22 4.29 4.90 5.07 5.32 4.75 4.49 3.93 4.78 4.64Borrowings to shareholders' funds % 38.0 40.8 33.8 33.6 32.5 44.1 43.4 45.8 31.5 29.1Basic earnings (loss)per share 3 US cents 29.0 (91.5) 61.6 50.3 57.4 (22.8) 65.1 64.9 123.7 152.8Basic earnings (loss) per share – cash basis 4 US cents 53.1 (18.9) 65.5 65.3 63.5 62.9 89.1 73.0 127.7 156.4Diluted earnings (loss) per share US cents 28.6 (91.5) 60.8 49.8 55.8 (22.8) 61.6 61.3 119.6 149.9Return on average shareholders' funds % 4.5 (13.0) 8.1 6.4 6.9 (2.3) 7.0 6.8 13.1 18.0
Dividend per shareAustralian
cents 50 26 54 50 37 32 50 87 128 128Dividend payout A$M 669 356 741 685 492 394 593 956 1,336 1,306Total investments and cash 5 US$M 22,887 26,141 25,235 26,708 28,583 30,619 31,525 28,024 25,328 22,448
1 Profit or loss information for the current period has been prepared on a continuing basis and excludes discontinued operations. For comparability, restated profit or loss information for the year ended 31 December 2017 has also been included above. Balance sheet and share information for both periods continues to reflect the consolidated Group unless otherwise specified.
2 As originally reported for each period.3 Reflects shares on an accounting basis.4 Earnings per share on a cash basis is calculated with reference to cash profit, being profit after tax adjusted for amortisation and
impairment of intangibles and other non-cash items net of tax.5 Includes financial assets at fair value through profit or loss, cash and cash equivalents and investment properties.
176
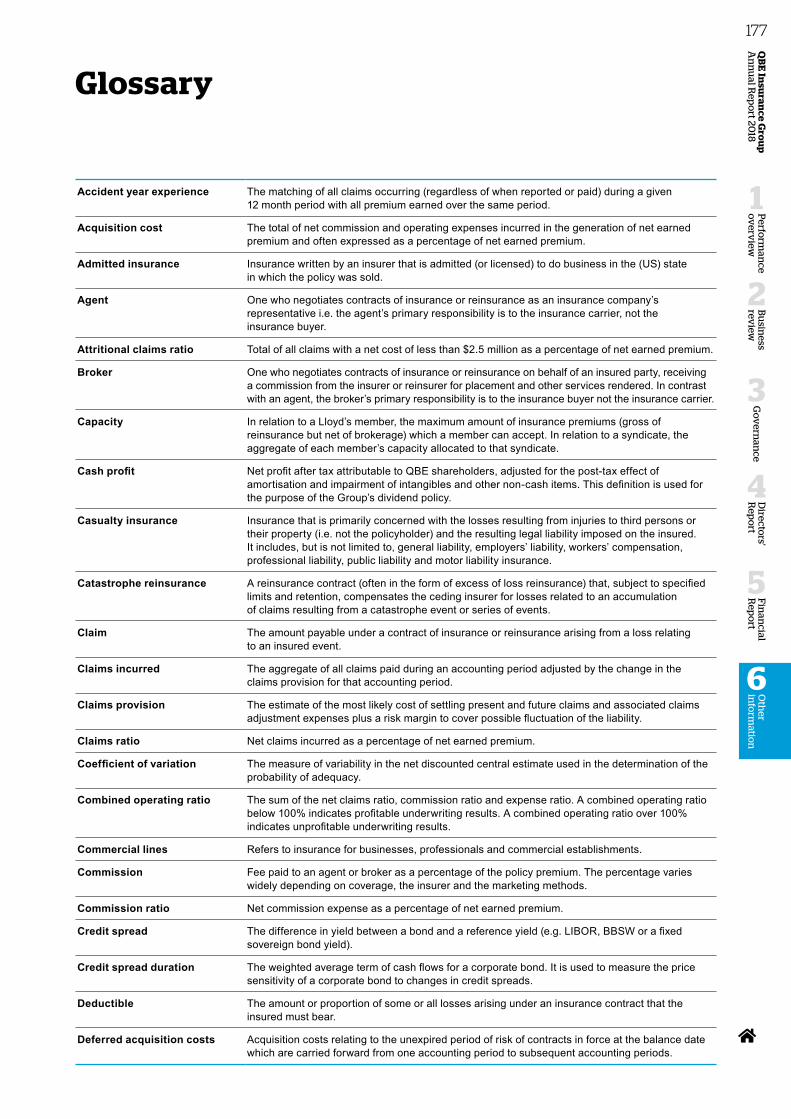
Glossary
Accident year experience The matching of all claims occurring (regardless of when reported or paid) during a given 12 month period with all premium earned over the same period.
Acquisition cost The total of net commission and operating expenses incurred in the generation of net earned premium and often expressed as a percentage of net earned premium.
Admitted insurance Insurance written by an insurer that is admitted (or licensed) to do business in the (US) state in which the policy was sold.
Agent One who negotiates contracts of insurance or reinsurance as an insurance company’s representative i.e. the agent’s primary responsibility is to the insurance carrier, not the insurance buyer.
Attritional claims ratio Total of all claims with a net cost of less than $2.5 million as a percentage of net earned premium.
Broker One who negotiates contracts of insurance or reinsurance on behalf of an insured party, receiving a commission from the insurer or reinsurer for placement and other services rendered. In contrast with an agent, the broker’s primary responsibility is to the insurance buyer not the insurance carrier.
Capacity In relation to a Lloyd’s member, the maximum amount of insurance premiums (gross of reinsurance but net of brokerage) which a member can accept. In relation to a syndicate, the aggregate of each member’s capacity allocated to that syndicate.
Cash profit Net profit after tax attributable to QBE shareholders, adjusted for the post-tax effect of amortisation and impairment of intangibles and other non-cash items. This definition is used for the purpose of the Group’s dividend policy.
Casualty insurance Insurance that is primarily concerned with the losses resulting from injuries to third persons or their property (i.e. not the policyholder) and the resulting legal liability imposed on the insured. It includes, but is not limited to, general liability, employers’ liability, workers’ compensation, professional liability, public liability and motor liability insurance.
Catastrophe reinsurance A reinsurance contract (often in the form of excess of loss reinsurance) that, subject to specified limits and retention, compensates the ceding insurer for losses related to an accumulation of claims resulting from a catastrophe event or series of events.
Claim The amount payable under a contract of insurance or reinsurance arising from a loss relating to an insured event.
Claims incurred The aggregate of all claims paid during an accounting period adjusted by the change in the claims provision for that accounting period.
Claims provision The estimate of the most likely cost of settling present and future claims and associated claims adjustment expenses plus a risk margin to cover possible fluctuation of the liability.
Claims ratio Net claims incurred as a percentage of net earned premium.
Coefficient of variation The measure of variability in the net discounted central estimate used in the determination of the probability of adequacy.
Combined operating ratio The sum of the net claims ratio, commission ratio and expense ratio. A combined operating ratio below 100% indicates profitable underwriting results. A combined operating ratio over 100% indicates unprofitable underwriting results.
Commercial lines Refers to insurance for businesses, professionals and commercial establishments.
Commission Fee paid to an agent or broker as a percentage of the policy premium. The percentage varies widely depending on coverage, the insurer and the marketing methods.
Commission ratio Net commission expense as a percentage of net earned premium.
Credit spread The difference in yield between a bond and a reference yield (e.g. LIBOR, BBSW or a fixed sovereign bond yield).
Credit spread duration The weighted average term of cash flows for a corporate bond. It is used to measure the price sensitivity of a corporate bond to changes in credit spreads.
Deductible The amount or proportion of some or all losses arising under an insurance contract that the insured must bear.
Deferred acquisition costs Acquisition costs relating to the unexpired period of risk of contracts in force at the balance date which are carried forward from one accounting period to subsequent accounting periods.
Fin
ancial
Rep
ort
5
Perfo
rman
ce o
verv
iew
1
Bu
siness
review
2
Go
vern
ance
3
Directo
rs' R
epo
rt
4
QB
E In
suran
ce Gro
up
A
nn
ual R
epo
rt 2018
177O
ther
info
rmatio
n
6
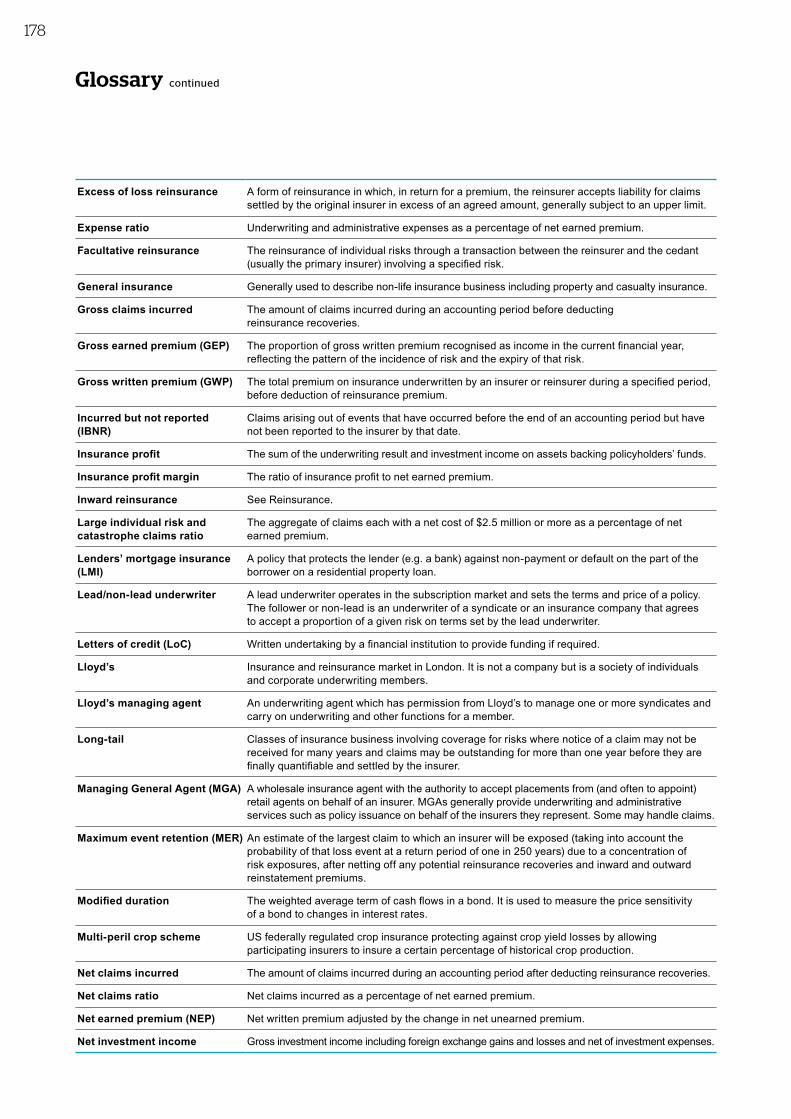
Glossary continued
Excess of loss reinsurance A form of reinsurance in which, in return for a premium, the reinsurer accepts liability for claims settled by the original insurer in excess of an agreed amount, generally subject to an upper limit.
Expense ratio Underwriting and administrative expenses as a percentage of net earned premium.
Facultative reinsurance The reinsurance of individual risks through a transaction between the reinsurer and the cedant (usually the primary insurer) involving a specified risk.
General insurance Generally used to describe non-life insurance business including property and casualty insurance.
Gross claims incurred The amount of claims incurred during an accounting period before deducting reinsurance recoveries.
Gross earned premium (GEP) The proportion of gross written premium recognised as income in the current financial year, reflecting the pattern of the incidence of risk and the expiry of that risk.
Gross written premium (GWP) The total premium on insurance underwritten by an insurer or reinsurer during a specified period, before deduction of reinsurance premium.
Incurred but not reported (IBNR)
Claims arising out of events that have occurred before the end of an accounting period but have not been reported to the insurer by that date.
Insurance profit The sum of the underwriting result and investment income on assets backing policyholders’ funds.
Insurance profit margin The ratio of insurance profit to net earned premium.
Inward reinsurance See Reinsurance.
Large individual risk and catastrophe claims ratio
The aggregate of claims each with a net cost of $2.5 million or more as a percentage of net earned premium.
Lenders’ mortgage insurance (LMI)
A policy that protects the lender (e.g. a bank) against non-payment or default on the part of the borrower on a residential property loan.
Lead/non‑lead underwriter A lead underwriter operates in the subscription market and sets the terms and price of a policy. The follower or non-lead is an underwriter of a syndicate or an insurance company that agrees to accept a proportion of a given risk on terms set by the lead underwriter.
Letters of credit (LoC) Written undertaking by a financial institution to provide funding if required.
Lloyd’s Insurance and reinsurance market in London. It is not a company but is a society of individuals and corporate underwriting members.
Lloyd’s managing agent An underwriting agent which has permission from Lloyd’s to manage one or more syndicates and carry on underwriting and other functions for a member.
Long‑tail Classes of insurance business involving coverage for risks where notice of a claim may not be received for many years and claims may be outstanding for more than one year before they are finally quantifiable and settled by the insurer.
Managing General Agent (MGA) A wholesale insurance agent with the authority to accept placements from (and often to appoint) retail agents on behalf of an insurer. MGAs generally provide underwriting and administrative services such as policy issuance on behalf of the insurers they represent. Some may handle claims.
Maximum event retention (MER) An estimate of the largest claim to which an insurer will be exposed (taking into account the probability of that loss event at a return period of one in 250 years) due to a concentration of risk exposures, after netting off any potential reinsurance recoveries and inward and outward reinstatement premiums.
Modified duration The weighted average term of cash flows in a bond. It is used to measure the price sensitivity of a bond to changes in interest rates.
Multi‑peril crop scheme US federally regulated crop insurance protecting against crop yield losses by allowing participating insurers to insure a certain percentage of historical crop production.
Net claims incurred The amount of claims incurred during an accounting period after deducting reinsurance recoveries.
Net claims ratio Net claims incurred as a percentage of net earned premium.
Net earned premium (NEP) Net written premium adjusted by the change in net unearned premium.
Net investment income Gross investment income including foreign exchange gains and losses and net of investment expenses.
178
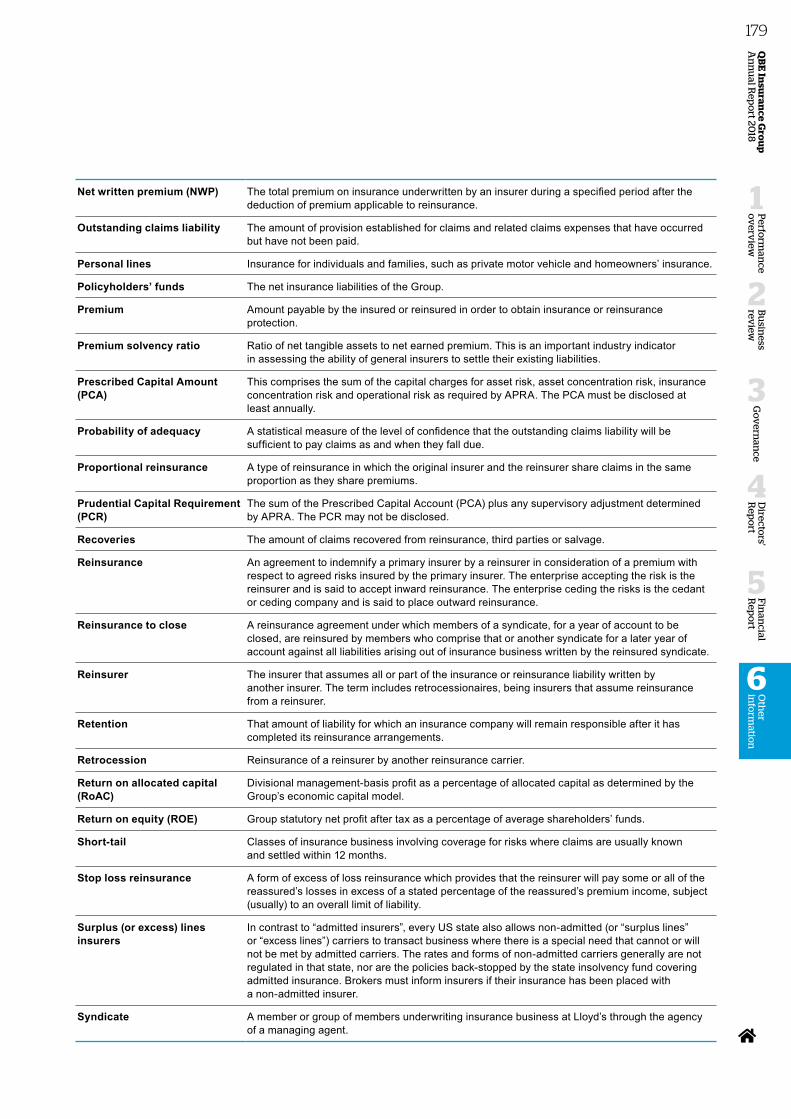
Net written premium (NWP) The total premium on insurance underwritten by an insurer during a specified period after the deduction of premium applicable to reinsurance.
Outstanding claims liability The amount of provision established for claims and related claims expenses that have occurred but have not been paid.
Personal lines Insurance for individuals and families, such as private motor vehicle and homeowners’ insurance.
Policyholders’ funds The net insurance liabilities of the Group.
Premium Amount payable by the insured or reinsured in order to obtain insurance or reinsurance protection.
Premium solvency ratio Ratio of net tangible assets to net earned premium. This is an important industry indicator in assessing the ability of general insurers to settle their existing liabilities.
Prescribed Capital Amount (PCA)
This comprises the sum of the capital charges for asset risk, asset concentration risk, insurance concentration risk and operational risk as required by APRA. The PCA must be disclosed at least annually.
Probability of adequacy A statistical measure of the level of confidence that the outstanding claims liability will be sufficient to pay claims as and when they fall due.
Proportional reinsurance A type of reinsurance in which the original insurer and the reinsurer share claims in the same proportion as they share premiums.
Prudential Capital Requirement (PCR)
The sum of the Prescribed Capital Account (PCA) plus any supervisory adjustment determined by APRA. The PCR may not be disclosed.
Recoveries The amount of claims recovered from reinsurance, third parties or salvage.
Reinsurance An agreement to indemnify a primary insurer by a reinsurer in consideration of a premium with respect to agreed risks insured by the primary insurer. The enterprise accepting the risk is the reinsurer and is said to accept inward reinsurance. The enterprise ceding the risks is the cedant or ceding company and is said to place outward reinsurance.
Reinsurance to close A reinsurance agreement under which members of a syndicate, for a year of account to be closed, are reinsured by members who comprise that or another syndicate for a later year of account against all liabilities arising out of insurance business written by the reinsured syndicate.
Reinsurer The insurer that assumes all or part of the insurance or reinsurance liability written by another insurer. The term includes retrocessionaires, being insurers that assume reinsurance from a reinsurer.
Retention That amount of liability for which an insurance company will remain responsible after it has completed its reinsurance arrangements.
Retrocession Reinsurance of a reinsurer by another reinsurance carrier.
Return on allocated capital (RoAC)
Divisional management-basis profit as a percentage of allocated capital as determined by the Group’s economic capital model.
Return on equity (ROE) Group statutory net profit after tax as a percentage of average shareholders’ funds.
Short‑tail Classes of insurance business involving coverage for risks where claims are usually known and settled within 12 months.
Stop loss reinsurance A form of excess of loss reinsurance which provides that the reinsurer will pay some or all of the reassured’s losses in excess of a stated percentage of the reassured’s premium income, subject (usually) to an overall limit of liability.
Surplus (or excess) lines insurers
In contrast to “admitted insurers”, every US state also allows non-admitted (or “surplus lines” or “excess lines”) carriers to transact business where there is a special need that cannot or will not be met by admitted carriers. The rates and forms of non-admitted carriers generally are not regulated in that state, nor are the policies back-stopped by the state insolvency fund covering admitted insurance. Brokers must inform insurers if their insurance has been placed with a non-admitted insurer.
Syndicate A member or group of members underwriting insurance business at Lloyd’s through the agency of a managing agent.
Fin
ancial
Rep
ort
5
Perfo
rman
ce o
verv
iew
1
Bu
siness
review
2
Go
vern
ance
3
Directo
rs' R
epo
rt
4
QB
E In
suran
ce Gro
up
A
nn
ual R
epo
rt 2018
179O
ther
info
rmatio
n
6
Glossary continued
Survival ratio A measure of how many years it would take for dust disease claims to exhaust the current level of claims provision. It is calculated on the average level of claims payments in the last three years.
Total shareholder return (TSR) A measure of performance of a company’s shares over time. It includes share price appreciation and dividend performance.
Treaty reinsurance Reinsurance of risks in which the reinsurer is obliged by agreement with the cedant to accept, within agreed limits, all risks to be underwritten by the cedant within specified classes of business in a given period of time.
Underwriting The process of reviewing applications submitted for insurance or reinsurance coverage, deciding whether to provide all or part of the coverage requested and determining the applicable premium.
Underwriting expenses The aggregate of policy acquisition costs, excluding commissions, and the portion of administrative, general and other expenses attributable to underwriting operations.
Underwriting result The amount of profit or loss from insurance activities exclusive of net investment income and capital gains or losses.
Underwriting year The year in which the contract of insurance commenced or was underwritten.
Unearned premium The portion of a premium representing the unexpired portion of the contract term as of a certain date.
Volume weighted average price (VWAP)
A methodology used for determining the share price applicable to dividend and other share related transactions.
Written premium Premiums written, whether or not earned, during a given period.
180
Designed and produced by ArmstrongQ

QBE Insurance Group LimitedLevel 27, 8 Chifley Square, Sydney NSW 2000 Australia
telephone +61 2 9375 4444 www.qbe.com


![QBE at a glance UK · QBE Insurance Group Limited A– [negative] A– [negative] bbb [negative] QBE Insurance (Europe) Limited A– [negative] a [negative] QBE Re (Europe) Limited](https://img.pdfslide.net/doc/110x75/5fa8e28b58047158406a3b4f/qbe-at-a-glance-uk-qbe-insurance-group-limited-aa-negative-aa-negative-bbb.jpg)