Embed Size (px)
Citation preview
2018 REPORTS AND OPINIONS
OF THE PROPERTY TAX ADMINISTATOR
CHERRY COUNTY

April 6, 2018
Commissioner Keetle:
The Property Tax Administrator has compiled the 2018 Reports and Opinions of the Property Tax
Administrator for Cherry County pursuant to Neb. Rev. Stat. § 77-5027. This Report and Opinion
will inform the Tax Equalization and Review Commission of the level of value and quality of
assessment for real property in Cherry County.
The information contained within the County Reports of the Appendices was provided by the
county assessor pursuant to Neb. Rev. Stat. § 77-1514.
For the Tax Commissioner
Sincerely,
Ruth A. Sorensen
Property Tax Administrator
402-471-5962
cc: Betty Daugherty, Cherry County Assessor
16 Cherry Page 2

Table of Contents
2018 Reports and Opinions of the Property Tax Administrator:
Certification to the Commission Introduction County Overview Residential Correlation Commercial Correlation Agricultural Land Correlation PTA’s Opinion
Appendices:
Commission Summary
Statistical Reports and Displays:
Residential Statistics Commercial Statistics Chart of Net Sales Compared to Commercial Assessed Value Agricultural Land Statistics Table-Average Value of Land Capability Groups Special Valuation Statistics (if applicable)
Market Area Map Valuation History Charts
County Reports:
County Abstract of Assessment for Real Property, Form 45 County Abstract of Assessment for Real Property Compared to the Prior Year Certificate of Taxes Levied (CTL). Assessor Survey Three-Year Plan of Assessment Special Value Methodology (if applicable) Ad Hoc Reports Submitted by County (if applicable)
16 Cherry Page 3

Introduction
Neb. Rev. Stat. § 77-5027 provides that the Property Tax Administrator (PTA) shall prepare and
deliver an annual Reports and Opinions (R&O) document to each county and to the Tax
Equalization and Review Commission (Commission). This will contain statistical and narrative
reports informing the Commission of the certified opinion of the PTA regarding the level of value
and the quality of assessment of the classes and subclasses of real property within each county. In
addition to an opinion of the level of value and quality of assessment in the county, the PTA may
make nonbinding recommendations for subclass adjustments for consideration by the
Commission.
The statistical and narrative reports contained in the R&O of the PTA provide an analysis of the
assessment process implemented by each county to reach the levels of value and quality of
assessment required by Nebraska law. The PTA’s opinion of the level of value and quality of
assessment in each county is a conclusion based upon all the data provided by the county assessor
and gathered by the Nebraska Department of Revenue, Property Assessment Division (Division)
regarding the assessment activities in the county during the preceding year.
The statistical reports are developed using the statewide sales file that contains all arm’s-length
transactions as required by Neb. Rev. Stat. § 77-1327. From this sales file, the Division prepares
a statistical analysis comparing assessments to sale prices. After analyzing all available
information to determine that the sales represent the class or subclass of properties being measured,
inferences are drawn regarding the assessment level and quality of assessment of the class or
subclass being evaluated. The statistical reports contained in the R&O are developed based on
standards developed by the International Association of Assessing Officers (IAAO).
The analysis of assessment practices in each county is necessary to give proper context to the
statistical inferences from the assessment sales ratio studies and the overall quality of assessment
in the county. The assessment practices are evaluated in the county to ensure professionally
accepted mass appraisal methods are used and that those methods will generally produce uniform
and proportionate valuations.
The PTA considers the statistical reports and the analysis of assessment practices when forming
conclusions on both the level of value and quality of assessment. The consideration of both the
statistical indicators and assessment processes used to develop valuations is necessary to
accurately determine the level of value and quality of assessment. Assessment practices that
produce a biased sales file will generally produce a biased statistical indicator, which, on its face,
would otherwise appear to be valid. Likewise, statistics produced on small, unrepresentative, or
otherwise unreliable samples, may indicate issues with assessment uniformity and assessment
level—however, a detailed review of the practices and valuation models may suggest otherwise.
For these reasons, the detail of the PTA’s analysis is presented and contained within the
Residential, Commercial, and Agricultural land correlations.
16 Cherry Page 4

Statistical Analysis:
In determining a point estimate of the level of value, the PTA considers three measures as
indicators of the central tendency of assessment: the median ratio, weighted mean ratio, and mean
ratio. The use and reliability of each measure is based on inherent strengths and weaknesses which
are the quantity and quality of the information from which it was calculated and the defined scope
of the analysis.
The median ratio is considered the most appropriate statistical measure to determine a level of
value for direct equalization, which is the process of adjusting the values of classes or subclasses
of property in response to an unacceptable level. Since the median ratio is considered neutral in
relationship to either assessed value or selling price, adjusting the class or subclass of properties
based on the median measure will not change the relationships between assessed value and level
of value already present in the class of property. Additionally, the median ratio is less influenced
by the presence of extreme ratios, commonly called outliers, which can skew the outcome in the
other measures.
The weighted mean ratio best reflects a comparison of the fully assessable valuation of a
jurisdiction, by measuring the total assessed value against the total of selling prices. The weighted
mean ratio can be heavily influenced by sales of large-dollar property with extreme ratios.
The mean ratio is used as a basis for other statistical calculations, such as the Price Related
Differential (PRD) and Coefficient of Variation (COV). As a simple average of the ratios the mean
ratio has limited application in the analysis of the level of value because it assumes a normal
distribution of the data set around the mean ratio with each ratio having the same impact on the
calculation regardless of the assessed value or the selling price.
The quality of assessment relies in part on statistical indicators as well. If the weighted mean ratio,
because of its dollar-weighting feature, is significantly different from the mean ratio, it may be an
indication of disproportionate assessments. The coefficient produced by this calculation is referred
to as the PRD and measures the assessment level of lower-priced properties relative to the
assessment level of higher-priced properties.
The Coefficient of Dispersion (COD) is a measure also used in the evaluation of assessment
quality. The COD measures the average deviation from the median and is expressed as a
percentage of the median. A COD of 15% indicates that half of the assessment ratios are expected
to fall within 15% of the median. The closer the ratios are grouped around the median the more
equitable the property assessments tend to be.
The confidence interval is another measure used to evaluate the reliability of the statistical
indicators. The Division primarily relies upon the median confidence interval, although the mean
and weighted mean confidence intervals are calculated as well. While there are no formal standards
regarding the acceptable width of such measure, the range established is often useful in
determining the range in which the true level of value is expected to exist.
16 Cherry Page 5

Pursuant to Section 77-5023, the acceptable range is 69% to 75% of actual value for agricultural
land and 92% to 100% for all other classes of real property.
Nebraska Statutes do not provide for a range of acceptability for the COD or PRD; however, the
IAAO Standard on Ratio Studies establishes the following range of acceptability for the COD:
A COD under 5% indicates that the properties in the sample are either unusually homogenous, or
possibly indicative of a non-representative sample due to the selective reappraisal of sold parcels.
The reliability of the COD can be directly affected by extreme ratios.
The PRD range stated in IAAO standards is 98% to 103%. A perfect match in assessment level
between the low-dollar properties and high-dollar properties indicates a PRD of 100%. The reason
for the extended range on the high end is IAAO’s recognition of the inherent bias in assessment.
The IAAO Standard on Ratio Studies notes that the PRD is sensitive to sales with higher prices
even if the ratio on higher priced sales do not appear unusual relative to other sales, and that small
samples, samples with high dispersion, or extreme ratios may not provide an accurate indication
of assessment regressivity or progressivity.
Analysis of Assessment Practices:
The Division reviews assessment practices that ultimately affect the valuation of real property in
each county. This review is done to ensure the reliability of the statistical analysis and to ensure
professionally accepted mass appraisal methods are used in the county assessor’s effort to establish
uniform and proportionate valuations. The review of assessment practices is based on information
filed from county assessors in the form of the Assessment Practices Survey, and in observed
assessment practices in the county.
To ensure county assessors are submitting all Real Estate Transfer Statements, required for the
development of the state sales file pursuant to Section 77-1327, a random sample from the county
registers of deeds’ records is audited to confirm that the required sales have been submitted and
reflect accurate information. The timeliness of the submission is also reviewed to ensure the sales
16 Cherry Page 6
file allows analysis of up-to-date information. The county’s sales verification and qualification
procedures are reviewed to ensure that sales are properly considered arm’s-length transactions
unless determined to be otherwise through the verification process. Proper sales verification
practices ensure the statistical analysis is based on an unbiased sample of sales.
Valuation groupings and market areas are also examined to identify whether the groupings and
areas being measured truly represent economic areas within the county. The measurement of
economic areas is the method by which the PTA ensures intra-county equalization exists. The
progress of the county’s six-year inspection and review cycle is documented to ensure compliance
with Neb. Rev. Stat. § 77-1311.03 and also to confirm that all property is being uniformly listed
and described for valuation purposes.
Valuation methodologies developed by the county assessor are reviewed for both appraisal logic
and to ensure compliance with professionally accepted mass appraisal methods. Methods and sales
used to develop lot values are also reviewed to ensure the land component of the valuation process
is based on the local market, and agricultural outbuildings and sites are reviewed as well.
Compliance with statutory reporting requirements is also a component of the assessment practices
review. Late, incomplete, or excessive errors in statutory reports can be problematic for the end
users, and highlight potential issues in other areas of the assessment process. Public trust in the
assessment process demands transparency, and practices are reviewed to ensure taxpayers are
served with such transparency.
The comprehensive review of assessment practices is conducted throughout the year. When
practical, potential issues identified are presented to the county assessor for clarification. The
county assessor can then work to implement corrective measures prior to establishing assessed
values. The PTA’s conclusion that assessment quality is either compliant or not compliant with
professionally accepted mass appraisal methods is based on the totality of the assessment practices
in the county.
*Further information may be found in Exhibit 94
16 Cherry Page 7

County Overview
With a total area of 5,960 miles, Cherry County
had 5,832 residents, per the Census Bureau
Quick Facts for 2016, a 2% population increase
over the 2010 U.S. Census. Reports indicated
that 62% of county residents were homeowners
and 88% of residents occupied the same
residence as in the prior year (Census Quick
Facts).
The majority of the commercial properties in Cherry County are located in and around Valentine,
the county seat. According to the latest information available from the U.S. Census Bureau, there
were 231 employer establishments with total employment of 1,619.
Agricultural land is the main component of Cherry County’s value base. Grassland makes up a
majority of the land in the county. Cherry County is included in both the Middle Niobrara and
Upper Loup Natural Resources
Districts (NRD). When compared
against the top crops of the other
counties in Nebraska, Cherry County
ranks first in forage-land used for all
hay and haylage, grass silage, and
green chop. The county is best suited
for the grazing of livestock. In the
northern part of the county corn is
grown. Other acres scattered across the
county serve to raise a supplemental
feed source for the cattle on the
ranches. In top livestock inventory
items, Cherry County ranks first in
bison (USDA AgCensus).
16 Cherry Page 8

2018 Residential Correlation for Cherry County Assessment Actions
A contracted appraisal firm was hired to complete the review of Valuation Group 1 and a portion of Valuation Group 2 for the 2018 assessment year, which included the City of Valentine and subdivisions within one mile of Valentine city limits. After completing the review work, new land value tables were established, cost tables were updated, and new depreciation tables were developed.
The review of rural Valentine did not include acreages located within one mile of the city limits, or the rural parcels around Valentine that are subject to similar economic conditions. After analyzing the sales of rural properties around Valentine, the county assessor increased those 13%, to equalize them with changes made to Valentine; that area will be prioritized for inspection and reappraisal in 2019.
For the remainder of the class, appraisal maintenance was completed by office staff using building permits, physical inspections, and drive-by inspections.
Description of Analysis
Cherry County segments each village into a separate valuation group, including individual valuation groups for rural Valentine and all the remaining rural residences in the county. Generally, Valuation Group 1 is the only classification that contains an adequate number of sales each study period.
Valuation Group Description
1 Valentine – largest city and county seat
2 Rural Valentine – residential property from Valentine city limits to exactly one mile out
3 Cody
4 Crookston
5 Kilgore
6 Merriman
7 Wood Lake
8 Rural – all residential property not within a village
9 Nenzel
Review of the statistical profile supports the use of the median to represent the level of value within the county. All three measures of central tendency are within the acceptable range, and the qualitative statistics support that assessments are uniform within the class. Additionally, value in the Abstract of Assessment, Form 45 Compared to the CTL reflects a 15% increase to the
16 Cherry Page 9
2018 Residential Correlation for Cherry County residential class, which correlates closely to the amount of change on sold properties within the sample.
All of the subclasses contain insufficiently small samples of sales within the study period. Although there are few sales outside the City of Valentine, the county assessor applied an equalization adjustment to rural residential acreages around Valentine pending complete reappraisal next year. Further, when the sales from all of the small villages are combined for analysis, the measures of central tendency are all within the range, and the qualitative statistics support uniformity in assessments. Based on the analysis, all residential properties in Cherry County are assessed within the acceptable range.
Assessment Practice Review
The Division’s annual assessment practice review focuses on the submission and qualification of sales data, in addition to all aspects of the valuation process. In Cherry County, the county assessor submits sales data to the state sales file on a routine basis in accordance with the Division’s regulations. Routine audits confirm that the sales data is accurately reported. The county has consistently utilized approximately 65% of residential transactions each year, and review of qualified and non-qualified sales support that the qualification determinations were made without sales bias.
After review and verification of the sales data, the Division will compare sold and unsold properties to ensure that the county’s valuation practices uniformly attribute value to unsold parcels. Based on the review conducted in 2017, valuations in Cherry County were uniformly assessed to all property.
Regarding the valuation of residential property, all properties are inspected within the required six-year timeline; both the county staff and the contract appraisers will conduct inspection work. When the contract appraiser revalues an area, they will attempt to contact the property owner to verify characteristics of the interior of the property. Land, cost, and depreciation tables are all updated after a physical inspection. Land values are developed using a sales comparison approach, establishing values by the square foot.
Although the small villages in Cherry County have some differences in local amenities, there are few sales within each. The county’s practice of keeping them separate valuation groups has not caused uniformity concerns within the class; however, as the villages are reappraised in the next assessment cycle, they will be analyzed in greater detail to determine whether some combinations could be made.
16 Cherry Page 10

2018 Residential Correlation for Cherry County Equalization and Quality of Assessment
Although there are few sales in all valuation groups outside of Valentine, the analysis supports that an acceptable level of value has been achieved for all properties. The county complies with generally accepted mass appraisal practices.
Level of Value
Based on the review of all available information, the level of value of residential property in Cherry County is determined to be 98%.
16 Cherry Page 11

2018 Commercial Correlation for Cherry County Assessment Actions
For the current assessment year, the county assessor’s office conducted routine pickup work including physical inspections of property, and complied with the six-year inspection and review cycle.
Description of Analysis
Commercial property in Cherry County is stratified into four valuation groups based on economic factors and location.
Valuation Group Description
1 Valentine
2 Rural Valentine
3 Cody, Crookston, Kilgore, Merriman, Nenzel, & Wood Lake
8 Rural
Historically, values throughout the county have reacted relatively similarly based on current economic conditions and comparable to the other commercial markets in the Sandhills; values remained relatively flat since the last county reappraisal. Overall valuation of commercial property in the county grew less than a quarter of a percent from the previous year to present.
Valuation Group 1 was the only classification that contained enough sales within the study period to rely on the statistics to analyze the valuations. This group was responsible for twenty of the qualified commercial sales. Each measure of central tendency for the group falls in line within the acceptable range. The statistical sample also demonstrates stability when outliers are removed.
The villages in Valuation Group 3 have shown relatively stable valuation increases over the last ten years in the commercial sector at an annualize rate. The two largest villages, Cody and Merriman, contain the more developed commercial markets in the valuation group. The increases in these two villages are at or above the annualized increases seen in the City of Valentine over five and ten year periods. Cody and Merriman also provide a better indicator of the economic conditions compared to the rest of the Sandhills. Total commercial valuation increases were comparable to similarly sized villages in Arthur, Grant, Sheridan, and Thomas counties. Additionally, no qualified sales were reported during the study period in Valuation Group 8.
Assessment Practice Review
In the commercial class, the Division’s assessment practice review focuses on sales qualification, equalized treatment of sold and unsold parcels, and examines all aspects of the valuation process.
16 Cherry Page 12
2018 Commercial Correlation for Cherry County In Cherry County, sales utilization rates have been stable for the past several years and at about 50%, are typical for the commercial class of property. Review of sales revealed no bias in the qualification process, all arm’s-length sales were utilized for commercial measurement.
All commercial properties in the county were inspected in 2015, the review work included an on-site interior inspection and interview with property owners, where permitted. At the time of the reappraisal, all land and improvement values were updated. Lot models are established using the sales comparison approach and arriving at an assessed value per square foot. Improvements were also typically valued using the sales comparison approach unless income and expense information was available and relevant. Review of sold and unsold parcels since the reappraisal confirmed that changes were equitably distributed.
To complete the assessment practice review in the commercial class the valuation group were analyzed. Valentine is the largest city in the county, and the central hub for commercial activity within the county. The small villages have been grouped together, each have few commercial businesses and little demand for commercial property. Rural properties have appropriately been split into two groups, those influenced by Valentine and those removed from Valentine’s influence.
Equalization and Quality of Assessment
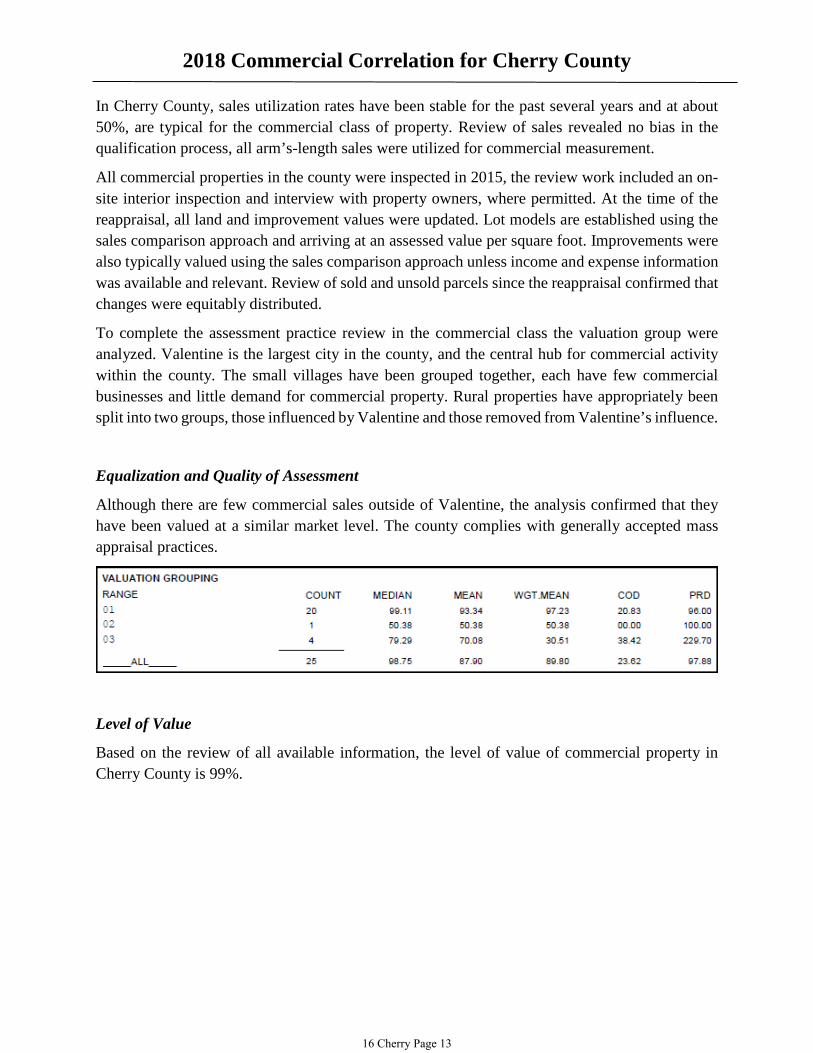
Although there are few commercial sales outside of Valentine, the analysis confirmed that they have been valued at a similar market level. The county complies with generally accepted mass appraisal practices.
Level of Value
Based on the review of all available information, the level of value of commercial property in Cherry County is 99%.
16 Cherry Page 13

2018 Agricultural Correlation for Cherry County Assessor Actions
Only routine maintenance was completed for the improved agricultural parcels this year. The county conducted a sales analysis of unimproved agricultural land, and determined that values were at an acceptable level without adjustment.
Description of Analysis
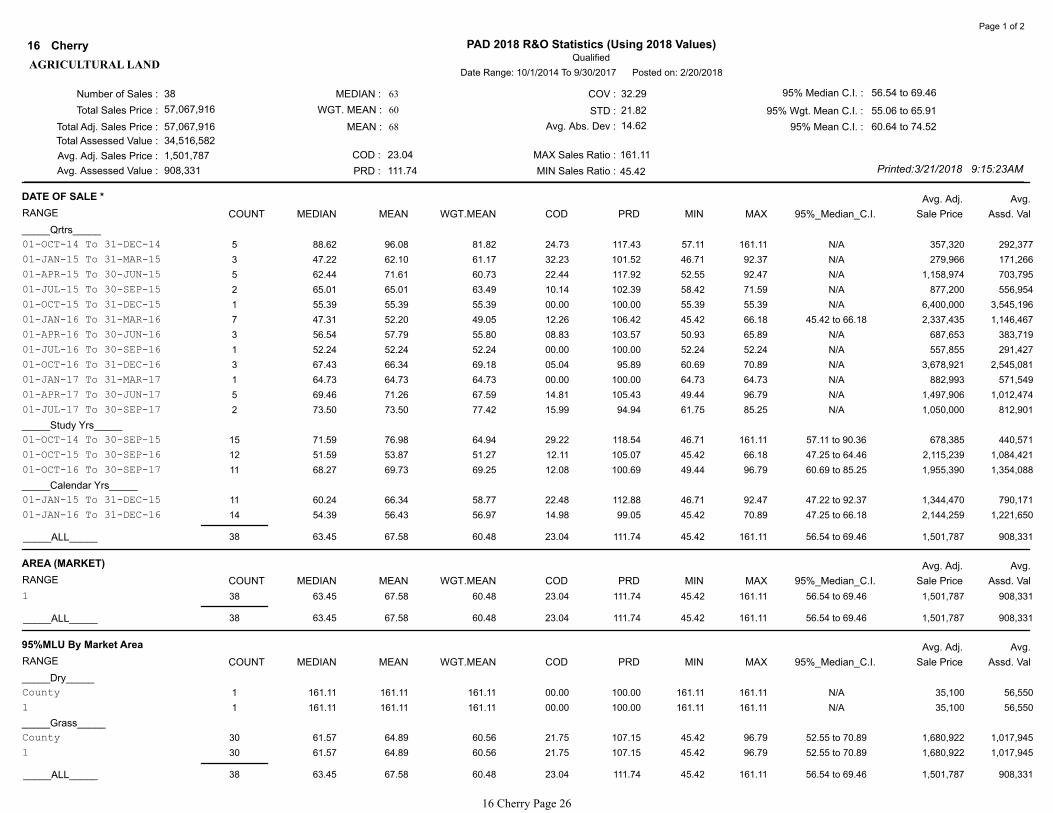
Review of the statistical profile for the county shows a sample of 38 sales with a median well below the acceptable range. The sales sample contains one irrigated sale and two mixed-use sales; a statistical profile of just the 80% Majority Land Use (MLU) sales gives a better picture of the grassland sales in the county. The following chart shows the 35 grassland sales arrayed by sale date; a full profile of the 80% MLU grassland sales can be found in the appendices of this report.
Stratifying the sales by study period indicates that the middle year is 16 to 18 percentage points lower than the first and third years of the study period. As identified in the 2017 Reports and Opinions of the Property Tax Administrator (R&O), from 2014-2015 the economy within the Sandhill’s region was temporarily stimulated by a combination of retroactive drought relief payments made available in the 2014 Farm Bill and record high cattle prices. All aspects of the local economy, including the agricultural land market, were impacted by what ended up being a large, but short-lived windfall in revenue. The sample of agricultural land sales in Cherry County is heavily impacted by this short time period, but does not adequately represent the market of agricultural land in 2017 to present.
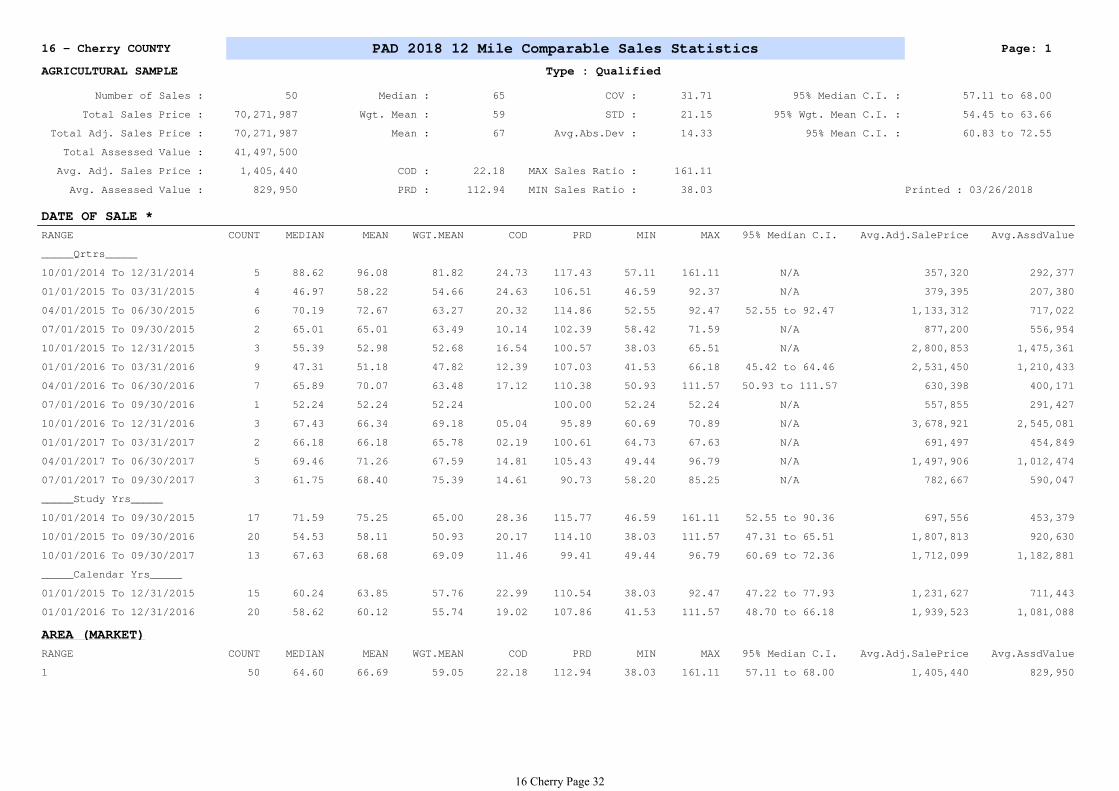
The sample of grassland sales is only slightly weighted toward the oldest time period. The Division examined the effects of expanding the sample with comparable sales from outside of the county; the result increased the grassland median a few percentage points, and displayed a very similar pattern over the three-year study period. Further analysis was conducted removing the middle year of sales from the sample, as expected this produces a median at the low end of the acceptable range.
The county assessor’s decision to make no adjustment to agricultural land values is consistent within the region; only Sheridan County increased values in the region this year. Sheridan County adjusted just the lower two classes of grassland, resulting in a 6% increase to the class overall. Sheridan County’s grassland (4G) value remains 5% lower than Cherry County’s grassland (4G) value, looking at the weighted average the values are similar because Sheridan County has a larger
16 Cherry Page 14
2018 Agricultural Correlation for Cherry County percent of land in the grass 4G1 land capability group (LCG) and in general, a larger differentiation in grassland capability. Based on the analysis of all available information, the value of grassland in Cherry County is believed to be within the acceptable range. There are few sales of cropland in the county within the study period. Cherry County’s irrigated and dryland values are toward the upper end in the region, only Keya Paha and Brown counties to the east have higher irrigated values. None of the counties in the area increased cropland values this year.
Assessment Practice Review
Within the agricultural land class, the Division’s annual assessment practice review focuses on sales qualification, classification and valuation of agricultural land, including market area, as well as the assessment of agricultural homes and outbuildings.
Regarding sales qualification, the county assessor utilizations all available arm’s-length transactions. The county assessor has attempted to remove any untypical conditions and sales involving special factors from the sales file, per Directive 16-3. Discussion of sales information and review of qualification determinations supported that the county assessor attempted to screen sales carefully and removed transactions without a bias.
Agricultural land use is periodically reviewed using aerial imagery. If the land is not primarily being used for agricultural purposes it will be coded rural residential or recreational, and valued accordingly. There are no individual market areas within the county; however, the county utilizes subclasses of grassland to differentiate value to ensure all properties are at uniform portions of market value.
Agricultural homes and outbuildings are first reviewed using aerial imagery, with follow-up inspections on-site where additional information is needed. Agricultural homes are valued using the same site acre, cost, and depreciation tables that are used to value the rural residential homes. Agricultural outbuildings are valued using locally derived sales information, with values last updated in 2017.
Equalization and Quality of Assessment
Agricultural improvements in the county are assessed the same as other similar types of property; the agricultural improvements are equalized at an acceptable level of value.
Based on the analysis of all available information, agricultural land is also equalized. An increase in values based on the statistics alone would give weight to market conditions that no longer exist and would create disequalization in the area. The quality of assessment of agricultural land in Cherry County complies with professionally accepted mass appraisal standards.
16 Cherry Page 15

2018 Agricultural Correlation for Cherry County
Level of Value
Based on the review of all available information, the level of value of agricultural land in Cherry County is determined to be at the statutory level of 75% of market value.
16 Cherry Page 16

2018 Opinions of the Property Tax Administrator
for Cherry County
My opinions and recommendations are stated as a conclusion based on all of the factors known to me
regarding the assessment practices and statistical analysis for this county. See, Neb. Rev. Stat. § 77-5027
(Cum. Supp. 2016). While the median assessment sales ratio from the Qualified Statistical Reports for
each class of real property is considered, my opinion of the level of value for a class of real property may
be determined from other evidence contained within these Reports and Opinions of the Property Tax
Administrator. My opinion of quality of assessment for a class of real property may be influenced by the
assessment practices of the county assessor.
Residential Real
Property
Commercial Real
Property
Agricultural Land
Class Level of Value Quality of Assessment
99
75
98
Meets generally accepted mass appraisal
practices.
Meets generally accepted mass appraisal
practices.
Meets generally accepted mass appraisal
practices.
No recommendation.
No recommendation.
No recommendation.
Non-binding recommendation
**A level of value displayed as NEI (not enough information) represents a class of property with insufficient
information to determine a level of value.
Dated this 6th day of April, 2018.
Ruth A. Sorensen
Property Tax Administrator
16 Cherry Page 17
Appendices
APPENDICES
16 Cherry Page 18

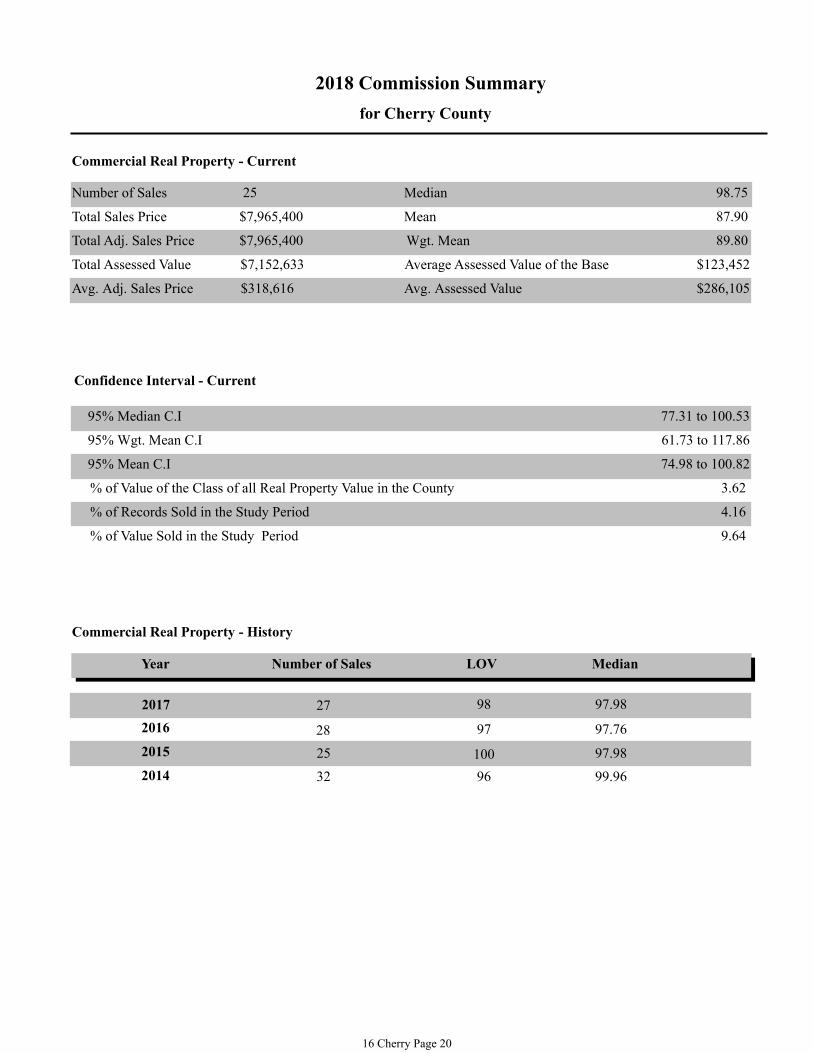
2018 Commission Summary
for Cherry County
Residential Real Property - Current
Number of Sales
Total Sales Price
Total Adj. Sales Price
Total Assessed Value
Avg. Adj. Sales Price Avg. Assessed Value
Median
Wgt. Mean
Mean
95% Median C.I
95% Wgt. Mean C.I
95% Mean C.I
94.98 to 101.04
92.19 to 101.89
95.96 to 103.92
% of Value of the Class of all Real Property Value in the County
% of Records Sold in the Study Period
% of Value Sold in the Study Period
Average Assessed Value of the Base
8.98
5.21
8.10
$69,016
Residential Real Property - History
Year
2015
2014
2016
Number of Sales LOV
Confidence Interval - Current
Median
139
99.94
98.43
97.04
$15,360,426
$15,360,426
$14,905,993
$110,507 $107,237
98.66 105 99
106 97.73 98
94.39 110 95
2017 92 92.38 124
16 Cherry Page 19
2018 Commission Summary
for Cherry County
Commercial Real Property - Current
Number of Sales
Total Sales Price
Total Adj. Sales Price
Total Assessed Value
Avg. Adj. Sales Price Avg. Assessed Value
Median
Wgt. Mean
Mean
95% Median C.I
95% Wgt. Mean C.I
95% Mean C.I
% of Value of the Class of all Real Property Value in the County
% of Records Sold in the Study Period
% of Value Sold in the Study Period
Average Assessed Value of the Base
Commercial Real Property - History
Year
2015
Number of Sales LOV
25
77.31 to 100.53
61.73 to 117.86
74.98 to 100.82
3.62
4.16
9.64
$123,452
Confidence Interval - Current
Median
$7,965,400
$7,965,400
$7,152,633
$318,616 $286,105
87.90
98.75
89.80
2014 99.96 96 32
97.98 25 100
28 97.76 972016
98 97.98 272017
16 Cherry Page 20

Number of Sales :
Total Sales Price :
Total Adj. Sales Price :
Total Assessed Value :
Avg. Adj. Sales Price :
Avg. Assessed Value :
MEDIAN :
WGT. MEAN :
MEAN :
COD :
PRD :
COV :
STD :
Avg. Abs. Dev :
MAX Sales Ratio :
MIN Sales Ratio :
95% Median C.I. :
95% Wgt. Mean C.I. :
95% Mean C.I. :
139
15,360,426
15,360,426
14,905,993
110,507
107,237
14.26
102.99
23.93
23.92
14.04
259.34
27.72
94.98 to 101.04
92.19 to 101.89
95.96 to 103.92
Printed:3/21/2018 9:15:21AM
Qualified
PAD 2018 R&O Statistics (Using 2018 Values)Cherry16
Date Range: 10/1/2015 To 9/30/2017 Posted on: 2/20/2018
98
97
100
RESIDENTIAL
Page 1 of 2
Avg. Adj.
RANGE Assd. ValSale Price95%_Median_C.I.MAXMINPRDCODWGT.MEANMEANMEDIANCOUNT
Avg.DATE OF SALE *
_____Qrtrs_____
01-OCT-15 To 31-DEC-15 10 97.83 97.78 85.18 09.69 114.79 67.83 118.88 90.47 to 111.23 135,940 115,796
01-JAN-16 To 31-MAR-16 16 99.75 103.88 101.25 10.37 102.60 89.81 149.31 92.58 to 106.86 124,000 125,551
01-APR-16 To 30-JUN-16 20 101.44 101.19 100.89 09.26 100.30 68.01 127.35 93.00 to 108.92 102,475 103,386
01-JUL-16 To 30-SEP-16 16 99.16 110.52 100.43 18.23 110.05 84.13 259.34 93.07 to 112.54 115,906 116,402
01-OCT-16 To 31-DEC-16 15 95.93 97.42 96.08 12.10 101.39 74.87 144.77 88.10 to 102.11 85,329 81,984
01-JAN-17 To 31-MAR-17 14 99.61 106.38 110.16 17.30 96.57 66.53 174.09 88.67 to 136.98 137,279 151,231
01-APR-17 To 30-JUN-17 22 101.76 100.12 95.94 13.11 104.36 43.03 155.85 92.29 to 103.84 116,900 112,150
01-JUL-17 To 30-SEP-17 26 91.86 88.69 85.27 19.27 104.01 27.72 132.03 79.62 to 103.86 89,977 76,723
_____Study Yrs_____
01-OCT-15 To 30-SEP-16 62 99.32 103.74 97.92 12.09 105.94 67.83 259.34 94.86 to 102.65 116,893 114,466
01-OCT-16 To 30-SEP-17 77 96.93 96.87 96.25 16.09 100.64 27.72 174.09 92.79 to 101.73 105,364 101,417
_____Calendar Yrs_____
01-JAN-16 To 31-DEC-16 67 99.18 103.21 100.01 12.42 103.20 68.01 259.34 94.67 to 102.08 106,984 106,996
_____ALL_____ 139 98.43 99.94 97.04 14.26 102.99 27.72 259.34 94.98 to 101.04 110,507 107,237
Avg. Adj.
RANGE Assd. ValSale Price95%_Median_C.I.MAXMINPRDCODWGT.MEANMEANMEDIANCOUNT
Avg.VALUATION GROUPING
01 100 98.98 102.02 98.96 10.25 103.09 68.01 259.34 95.38 to 101.55 108,657 107,524
02 6 105.20 115.93 103.89 24.13 111.59 69.45 174.09 69.45 to 174.09 287,567 298,764
03 6 82.41 90.63 89.22 20.92 101.58 69.21 132.03 69.21 to 132.03 43,124 38,474
04 2 109.65 109.65 98.66 13.49 111.14 94.86 124.44 N/A 40,150 39,611
06 11 99.67 91.72 92.43 22.44 99.23 43.03 141.07 52.83 to 119.12 16,368 15,129
07 5 90.93 97.90 108.51 25.46 90.22 66.53 146.50 N/A 40,148 43,563
08 9 79.62 81.30 81.32 27.76 99.98 27.72 136.98 52.90 to 107.66 227,722 185,190
_____ALL_____ 139 98.43 99.94 97.04 14.26 102.99 27.72 259.34 94.98 to 101.04 110,507 107,237
Avg. Adj.
RANGE Assd. ValSale Price95%_Median_C.I.MAXMINPRDCODWGT.MEANMEANMEDIANCOUNT
Avg.PROPERTY TYPE *
01 138 98.69 100.17 97.10 14.10 103.16 27.72 259.34 94.98 to 101.32 111,090 107,867
06 0 00.00 00.00 00.00 00.00 00.00 00.00 00.00 N/A 0 0
07 1 68.01 68.01 68.01 00.00 100.00 68.01 68.01 N/A 30,000 20,404
_____ALL_____ 139 98.43 99.94 97.04 14.26 102.99 27.72 259.34 94.98 to 101.04 110,507 107,237
16 Cherry Page 21

Number of Sales :
Total Sales Price :
Total Adj. Sales Price :
Total Assessed Value :
Avg. Adj. Sales Price :
Avg. Assessed Value :
MEDIAN :
WGT. MEAN :
MEAN :
COD :
PRD :
COV :
STD :
Avg. Abs. Dev :
MAX Sales Ratio :
MIN Sales Ratio :
95% Median C.I. :
95% Wgt. Mean C.I. :
95% Mean C.I. :
139
15,360,426
15,360,426
14,905,993
110,507
107,237
14.26
102.99
23.93
23.92
14.04
259.34
27.72
94.98 to 101.04
92.19 to 101.89
95.96 to 103.92
Printed:3/21/2018 9:15:21AM
Qualified
PAD 2018 R&O Statistics (Using 2018 Values)Cherry16
Date Range: 10/1/2015 To 9/30/2017 Posted on: 2/20/2018
98
97
100
RESIDENTIAL
Page 2 of 2
Avg. Adj.
RANGE Assd. ValSale Price95%_Median_C.I.MAXMINPRDCODWGT.MEANMEANMEDIANCOUNT
Avg.SALE PRICE *
_____Low $ Ranges_____
Less Than 5,000 3 90.93 96.54 94.69 30.59 101.95 57.61 141.07 N/A 1,350 1,278
Less Than 15,000 12 104.06 112.50 118.60 31.35 94.86 52.90 259.34 84.16 to 127.35 7,775 9,221
Less Than 30,000 23 93.97 100.34 97.93 33.68 102.46 27.72 259.34 82.80 to 119.12 14,878 14,571
__Ranges Excl. Low $__
Greater Than 4,999 136 98.69 100.01 97.04 13.86 103.06 27.72 259.34 95.36 to 101.04 112,915 109,575
Greater Than 14,999 127 98.11 98.75 96.91 12.50 101.90 27.72 174.09 94.86 to 101.04 120,214 116,499
Greater Than 29,999 116 98.69 99.86 97.02 10.65 102.93 66.53 174.09 95.36 to 101.32 129,468 125,611
__Incremental Ranges__
0 TO 4,999 3 90.93 96.54 94.69 30.59 101.95 57.61 141.07 N/A 1,350 1,278
5,000 TO 14,999 9 108.45 117.82 119.68 29.76 98.45 52.90 259.34 84.16 to 127.35 9,916 11,868
15,000 TO 29,999 11 90.47 87.07 90.19 31.77 96.54 27.72 144.77 43.03 to 132.03 22,627 20,407
30,000 TO 59,999 22 97.47 99.63 99.43 15.79 100.20 66.53 174.09 88.91 to 106.40 43,524 43,276
60,000 TO 99,999 36 101.76 103.50 103.70 09.95 99.81 75.05 155.85 95.38 to 103.84 77,592 80,461
100,000 TO 149,999 29 99.00 100.55 100.65 07.74 99.90 86.01 136.98 94.25 to 104.15 127,448 128,275
150,000 TO 249,999 15 96.22 97.87 97.50 05.53 100.38 89.63 111.23 93.07 to 102.90 173,493 169,153
250,000 TO 499,999 12 93.09 95.33 97.23 11.08 98.05 78.15 142.51 83.67 to 99.18 307,583 299,050
500,000 TO 999,999 2 68.64 68.64 68.57 01.18 100.10 67.83 69.45 N/A 639,000 438,156
1,000,000 + 0 00.00 00.00 00.00 00.00 00.00 00.00 00.00 N/A 0 0
_____ALL_____ 139 98.43 99.94 97.04 14.26 102.99 27.72 259.34 94.98 to 101.04 110,507 107,237
16 Cherry Page 22
Number of Sales :
Total Sales Price :
Total Adj. Sales Price :
Total Assessed Value :
Avg. Adj. Sales Price :
Avg. Assessed Value :
MEDIAN :
WGT. MEAN :
MEAN :
COD :
PRD :
COV :
STD :
Avg. Abs. Dev :
MAX Sales Ratio :
MIN Sales Ratio :
95% Median C.I. :
95% Wgt. Mean C.I. :
95% Mean C.I. :
25
7,965,400
7,965,400
7,152,633
318,616
286,105
23.62
97.88
35.60
31.29
23.32
164.52
21.20
77.31 to 100.53
61.73 to 117.86
74.98 to 100.82
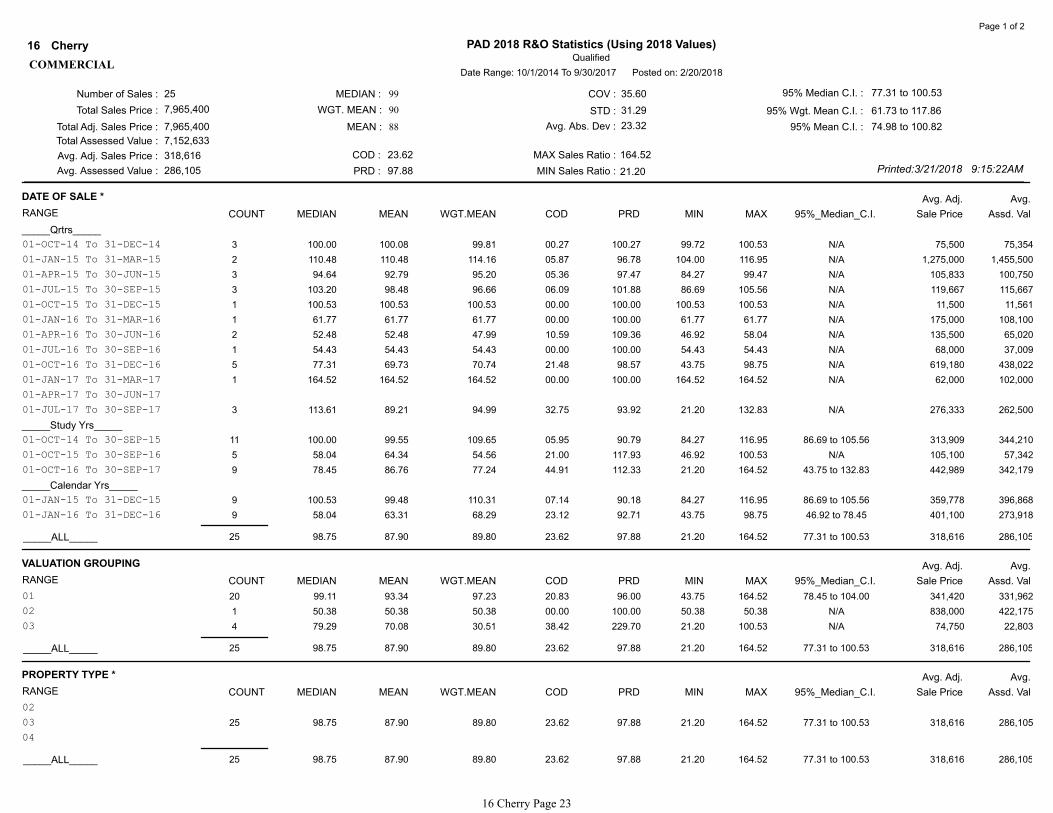
Printed:3/21/2018 9:15:22AM
Qualified
PAD 2018 R&O Statistics (Using 2018 Values)Cherry16
Date Range: 10/1/2014 To 9/30/2017 Posted on: 2/20/2018
99
90
88
COMMERCIAL
Page 1 of 2
Avg. Adj.
RANGE Assd. ValSale Price95%_Median_C.I.MAXMINPRDCODWGT.MEANMEANMEDIANCOUNT
Avg.DATE OF SALE *
_____Qrtrs_____
01-OCT-14 To 31-DEC-14 3 100.00 100.08 99.81 00.27 100.27 99.72 100.53 N/A 75,500 75,354
01-JAN-15 To 31-MAR-15 2 110.48 110.48 114.16 05.87 96.78 104.00 116.95 N/A 1,275,000 1,455,500
01-APR-15 To 30-JUN-15 3 94.64 92.79 95.20 05.36 97.47 84.27 99.47 N/A 105,833 100,750
01-JUL-15 To 30-SEP-15 3 103.20 98.48 96.66 06.09 101.88 86.69 105.56 N/A 119,667 115,667
01-OCT-15 To 31-DEC-15 1 100.53 100.53 100.53 00.00 100.00 100.53 100.53 N/A 11,500 11,561
01-JAN-16 To 31-MAR-16 1 61.77 61.77 61.77 00.00 100.00 61.77 61.77 N/A 175,000 108,100
01-APR-16 To 30-JUN-16 2 52.48 52.48 47.99 10.59 109.36 46.92 58.04 N/A 135,500 65,020
01-JUL-16 To 30-SEP-16 1 54.43 54.43 54.43 00.00 100.00 54.43 54.43 N/A 68,000 37,009
01-OCT-16 To 31-DEC-16 5 77.31 69.73 70.74 21.48 98.57 43.75 98.75 N/A 619,180 438,022
01-JAN-17 To 31-MAR-17 1 164.52 164.52 164.52 00.00 100.00 164.52 164.52 N/A 62,000 102,000
01-APR-17 To 30-JUN-17 0 00.00 00.00 00.00 00.00 00.00 00.00 00.00 N/A 0 0
01-JUL-17 To 30-SEP-17 3 113.61 89.21 94.99 32.75 93.92 21.20 132.83 N/A 276,333 262,500
_____Study Yrs_____
01-OCT-14 To 30-SEP-15 11 100.00 99.55 109.65 05.95 90.79 84.27 116.95 86.69 to 105.56 313,909 344,210
01-OCT-15 To 30-SEP-16 5 58.04 64.34 54.56 21.00 117.93 46.92 100.53 N/A 105,100 57,342
01-OCT-16 To 30-SEP-17 9 78.45 86.76 77.24 44.91 112.33 21.20 164.52 43.75 to 132.83 442,989 342,179
_____Calendar Yrs_____
01-JAN-15 To 31-DEC-15 9 100.53 99.48 110.31 07.14 90.18 84.27 116.95 86.69 to 105.56 359,778 396,868
01-JAN-16 To 31-DEC-16 9 58.04 63.31 68.29 23.12 92.71 43.75 98.75 46.92 to 78.45 401,100 273,918
_____ALL_____ 25 98.75 87.90 89.80 23.62 97.88 21.20 164.52 77.31 to 100.53 318,616 286,105
Avg. Adj.
RANGE Assd. ValSale Price95%_Median_C.I.MAXMINPRDCODWGT.MEANMEANMEDIANCOUNT
Avg.VALUATION GROUPING
01 20 99.11 93.34 97.23 20.83 96.00 43.75 164.52 78.45 to 104.00 341,420 331,962
02 1 50.38 50.38 50.38 00.00 100.00 50.38 50.38 N/A 838,000 422,175
03 4 79.29 70.08 30.51 38.42 229.70 21.20 100.53 N/A 74,750 22,803
_____ALL_____ 25 98.75 87.90 89.80 23.62 97.88 21.20 164.52 77.31 to 100.53 318,616 286,105
Avg. Adj.
RANGE Assd. ValSale Price95%_Median_C.I.MAXMINPRDCODWGT.MEANMEANMEDIANCOUNT
Avg.PROPERTY TYPE *
02 0 00.00 00.00 00.00 00.00 00.00 00.00 00.00 N/A 0 0
03 25 98.75 87.90 89.80 23.62 97.88 21.20 164.52 77.31 to 100.53 318,616 286,105
04 0 00.00 00.00 00.00 00.00 00.00 00.00 00.00 N/A 0 0
_____ALL_____ 25 98.75 87.90 89.80 23.62 97.88 21.20 164.52 77.31 to 100.53 318,616 286,105
16 Cherry Page 23
Number of Sales :
Total Sales Price :
Total Adj. Sales Price :
Total Assessed Value :
Avg. Adj. Sales Price :
Avg. Assessed Value :
MEDIAN :
WGT. MEAN :
MEAN :
COD :
PRD :
COV :
STD :
Avg. Abs. Dev :
MAX Sales Ratio :
MIN Sales Ratio :
95% Median C.I. :
95% Wgt. Mean C.I. :
95% Mean C.I. :
25
7,965,400
7,965,400
7,152,633
318,616
286,105
23.62
97.88
35.60
31.29
23.32
164.52
21.20
77.31 to 100.53
61.73 to 117.86
74.98 to 100.82
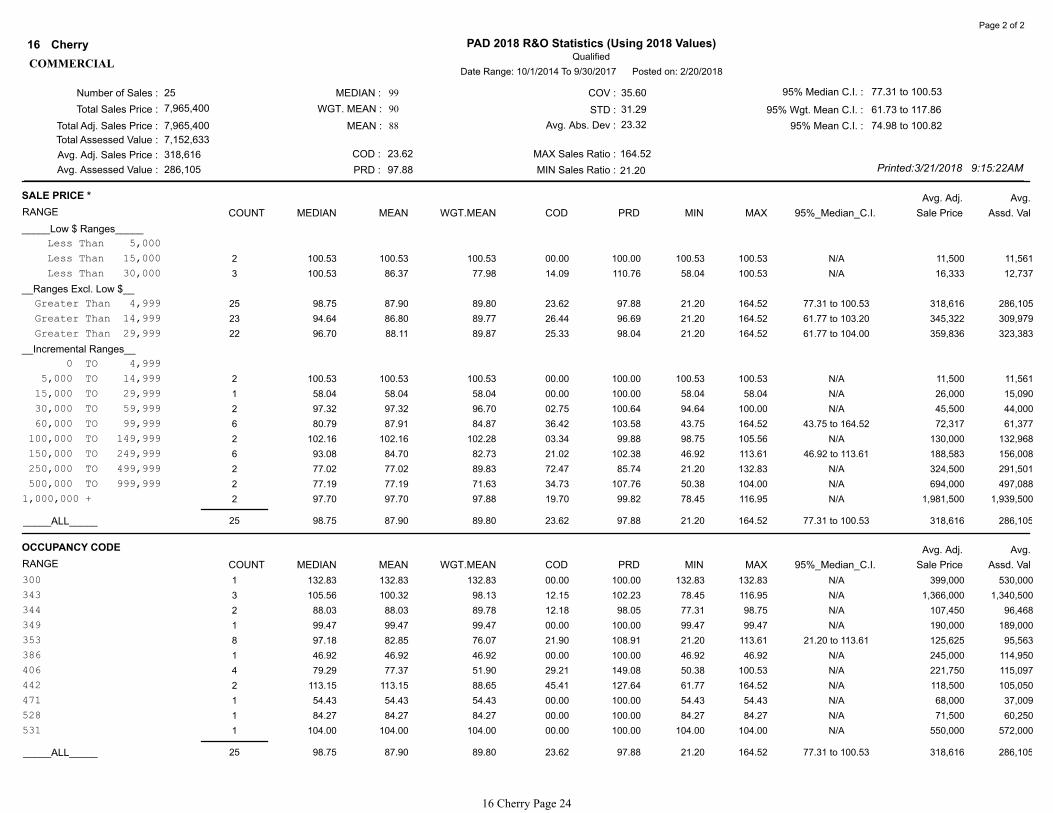
Printed:3/21/2018 9:15:22AM
Qualified
PAD 2018 R&O Statistics (Using 2018 Values)Cherry16
Date Range: 10/1/2014 To 9/30/2017 Posted on: 2/20/2018
99
90
88
COMMERCIAL
Page 2 of 2
Avg. Adj.
RANGE Assd. ValSale Price95%_Median_C.I.MAXMINPRDCODWGT.MEANMEANMEDIANCOUNT
Avg.SALE PRICE *
_____Low $ Ranges_____
Less Than 5,000 0 00.00 00.00 00.00 00.00 00.00 00.00 00.00 N/A 0 0
Less Than 15,000 2 100.53 100.53 100.53 00.00 100.00 100.53 100.53 N/A 11,500 11,561
Less Than 30,000 3 100.53 86.37 77.98 14.09 110.76 58.04 100.53 N/A 16,333 12,737
__Ranges Excl. Low $__
Greater Than 4,999 25 98.75 87.90 89.80 23.62 97.88 21.20 164.52 77.31 to 100.53 318,616 286,105
Greater Than 14,999 23 94.64 86.80 89.77 26.44 96.69 21.20 164.52 61.77 to 103.20 345,322 309,979
Greater Than 29,999 22 96.70 88.11 89.87 25.33 98.04 21.20 164.52 61.77 to 104.00 359,836 323,383
__Incremental Ranges__
0 TO 4,999 0 00.00 00.00 00.00 00.00 00.00 00.00 00.00 N/A 0 0
5,000 TO 14,999 2 100.53 100.53 100.53 00.00 100.00 100.53 100.53 N/A 11,500 11,561
15,000 TO 29,999 1 58.04 58.04 58.04 00.00 100.00 58.04 58.04 N/A 26,000 15,090
30,000 TO 59,999 2 97.32 97.32 96.70 02.75 100.64 94.64 100.00 N/A 45,500 44,000
60,000 TO 99,999 6 80.79 87.91 84.87 36.42 103.58 43.75 164.52 43.75 to 164.52 72,317 61,377
100,000 TO 149,999 2 102.16 102.16 102.28 03.34 99.88 98.75 105.56 N/A 130,000 132,968
150,000 TO 249,999 6 93.08 84.70 82.73 21.02 102.38 46.92 113.61 46.92 to 113.61 188,583 156,008
250,000 TO 499,999 2 77.02 77.02 89.83 72.47 85.74 21.20 132.83 N/A 324,500 291,501
500,000 TO 999,999 2 77.19 77.19 71.63 34.73 107.76 50.38 104.00 N/A 694,000 497,088
1,000,000 + 2 97.70 97.70 97.88 19.70 99.82 78.45 116.95 N/A 1,981,500 1,939,500
_____ALL_____ 25 98.75 87.90 89.80 23.62 97.88 21.20 164.52 77.31 to 100.53 318,616 286,105
Avg. Adj.
RANGE Assd. ValSale Price95%_Median_C.I.MAXMINPRDCODWGT.MEANMEANMEDIANCOUNT
Avg.OCCUPANCY CODE
300 1 132.83 132.83 132.83 00.00 100.00 132.83 132.83 N/A 399,000 530,000
343 3 105.56 100.32 98.13 12.15 102.23 78.45 116.95 N/A 1,366,000 1,340,500
344 2 88.03 88.03 89.78 12.18 98.05 77.31 98.75 N/A 107,450 96,468
349 1 99.47 99.47 99.47 00.00 100.00 99.47 99.47 N/A 190,000 189,000
353 8 97.18 82.85 76.07 21.90 108.91 21.20 113.61 21.20 to 113.61 125,625 95,563
386 1 46.92 46.92 46.92 00.00 100.00 46.92 46.92 N/A 245,000 114,950
406 4 79.29 77.37 51.90 29.21 149.08 50.38 100.53 N/A 221,750 115,097
442 2 113.15 113.15 88.65 45.41 127.64 61.77 164.52 N/A 118,500 105,050
471 1 54.43 54.43 54.43 00.00 100.00 54.43 54.43 N/A 68,000 37,009
528 1 84.27 84.27 84.27 00.00 100.00 84.27 84.27 N/A 71,500 60,250
531 1 104.00 104.00 104.00 00.00 100.00 104.00 104.00 N/A 550,000 572,000
_____ALL_____ 25 98.75 87.90 89.80 23.62 97.88 21.20 164.52 77.31 to 100.53 318,616 286,105
16 Cherry Page 24

Tax Growth % Growth Value Ann.%chg Net Taxable % Chg Net
Year Value Value of Value Exclud. Growth w/o grwth Sales Value Tax. Sales
2007 42,231,922$ 269,794$ 0.64% 41,962,128$ - 50,088,068$ -
2008 43,440,586$ 1,080,473$ 2.49% 42,360,113$ 0.30% 50,026,940$ -0.12%
2009 43,310,508$ 369,459$ 0.85% 42,941,049$ -1.15% 49,628,318$ -0.80%
2010 46,176,775$ 1,095,400$ 2.37% 45,081,375$ 4.09% 53,571,890$ 7.95%
2011 60,412,028$ 10,870,724$ 17.99% 49,541,304$ 7.29% 57,216,248$ 6.80%
2012 63,193,528$ 2,276,698$ 3.60% 60,916,830$ 0.84% 59,134,792$ 3.35%
2013 65,418,696$ 2,412,010$ 3.69% 63,006,686$ -0.30% 65,498,248$ 10.76%
2014 59,534,324$ 1,400,860$ 2.35% 58,133,464$ -11.14% 71,610,401$ 9.33%
2015 71,641,461$ 484,969$ 0.68% 71,156,492$ 19.52% 73,322,291$ 2.39%
2016 71,864,809$ 1,297,784$ 1.81% 70,567,025$ -1.50% 70,878,203$ -3.33%
2017 73,453,950$ 1,352,167$ 1.84% 72,101,783$ 0.33% 70,773,086$ -0.15%
Ann %chg 5.69% Average 1.83% 3.93% 3.62%
Tax Cmltv%chg Cmltv%chg Cmltv%chg County Number 16
Year w/o grwth Value Net Sales County Name Cherry
2007 - - -
2008 0.30% 2.86% -0.12%
2009 1.68% 2.55% -0.92%
2010 6.75% 9.34% 6.96%
2011 17.31% 43.05% 14.23%
2012 44.24% 49.63% 18.06%
2013 49.19% 54.90% 30.77%
2014 37.65% 40.97% 42.97%
2015 68.49% 69.64% 46.39%
2016 67.09% 70.17% 41.51%
2017 70.73% 73.93% 41.30%
Cumulative Change
-20%
-10%
0%
10%
20%
30%
40%
50%
60%
70%
80%
2007 2008 2009 2010 2011 2012 2013 2014 2015 2016 2017
Commercial & Industrial Value Change Vs. Net Taxable Sales Change
Comm.&Ind w/o Growth
Comm.&Ind. Value Chg
Net Tax. Sales Value Change
Linear (Comm.&Ind w/oGrowth)Linear (Net Tax. Sales ValueChange)
Sources:
Value; 2006-2016 CTL Report
Growth Value; 2006-2016 Abstract Rpt
Net Taxable Sales; Dept. of Revenue
website.
16 Cherry Page 25
Number of Sales :
Total Sales Price :
Total Adj. Sales Price :
Total Assessed Value :
Avg. Adj. Sales Price :
Avg. Assessed Value :
MEDIAN :
WGT. MEAN :
MEAN :
COD :
PRD :
COV :
STD :
Avg. Abs. Dev :
MAX Sales Ratio :
MIN Sales Ratio :
95% Median C.I. :
95% Wgt. Mean C.I. :
95% Mean C.I. :
38
57,067,916
57,067,916
34,516,582
1,501,787
908,331
23.04
111.74
32.29
21.82
14.62
161.11
45.42
56.54 to 69.46
55.06 to 65.91
60.64 to 74.52
Printed:3/21/2018 9:15:23AM
Qualified
PAD 2018 R&O Statistics (Using 2018 Values)Cherry16
Date Range: 10/1/2014 To 9/30/2017 Posted on: 2/20/2018
63
60
68
AGRICULTURAL LAND
Page 1 of 2
Avg. Adj.
RANGE Assd. ValSale Price95%_Median_C.I.MAXMINPRDCODWGT.MEANMEANMEDIANCOUNT
Avg.DATE OF SALE *
_____Qrtrs_____
01-OCT-14 To 31-DEC-14 5 88.62 96.08 81.82 24.73 117.43 57.11 161.11 N/A 357,320 292,377
01-JAN-15 To 31-MAR-15 3 47.22 62.10 61.17 32.23 101.52 46.71 92.37 N/A 279,966 171,266
01-APR-15 To 30-JUN-15 5 62.44 71.61 60.73 22.44 117.92 52.55 92.47 N/A 1,158,974 703,795
01-JUL-15 To 30-SEP-15 2 65.01 65.01 63.49 10.14 102.39 58.42 71.59 N/A 877,200 556,954
01-OCT-15 To 31-DEC-15 1 55.39 55.39 55.39 00.00 100.00 55.39 55.39 N/A 6,400,000 3,545,196
01-JAN-16 To 31-MAR-16 7 47.31 52.20 49.05 12.26 106.42 45.42 66.18 45.42 to 66.18 2,337,435 1,146,467
01-APR-16 To 30-JUN-16 3 56.54 57.79 55.80 08.83 103.57 50.93 65.89 N/A 687,653 383,719
01-JUL-16 To 30-SEP-16 1 52.24 52.24 52.24 00.00 100.00 52.24 52.24 N/A 557,855 291,427
01-OCT-16 To 31-DEC-16 3 67.43 66.34 69.18 05.04 95.89 60.69 70.89 N/A 3,678,921 2,545,081
01-JAN-17 To 31-MAR-17 1 64.73 64.73 64.73 00.00 100.00 64.73 64.73 N/A 882,993 571,549
01-APR-17 To 30-JUN-17 5 69.46 71.26 67.59 14.81 105.43 49.44 96.79 N/A 1,497,906 1,012,474
01-JUL-17 To 30-SEP-17 2 73.50 73.50 77.42 15.99 94.94 61.75 85.25 N/A 1,050,000 812,901
_____Study Yrs_____
01-OCT-14 To 30-SEP-15 15 71.59 76.98 64.94 29.22 118.54 46.71 161.11 57.11 to 90.36 678,385 440,571
01-OCT-15 To 30-SEP-16 12 51.59 53.87 51.27 12.11 105.07 45.42 66.18 47.25 to 64.46 2,115,239 1,084,421
01-OCT-16 To 30-SEP-17 11 68.27 69.73 69.25 12.08 100.69 49.44 96.79 60.69 to 85.25 1,955,390 1,354,088
_____Calendar Yrs_____
01-JAN-15 To 31-DEC-15 11 60.24 66.34 58.77 22.48 112.88 46.71 92.47 47.22 to 92.37 1,344,470 790,171
01-JAN-16 To 31-DEC-16 14 54.39 56.43 56.97 14.98 99.05 45.42 70.89 47.25 to 66.18 2,144,259 1,221,650
_____ALL_____ 38 63.45 67.58 60.48 23.04 111.74 45.42 161.11 56.54 to 69.46 1,501,787 908,331
Avg. Adj.
RANGE Assd. ValSale Price95%_Median_C.I.MAXMINPRDCODWGT.MEANMEANMEDIANCOUNT
Avg.AREA (MARKET)
1 38 63.45 67.58 60.48 23.04 111.74 45.42 161.11 56.54 to 69.46 1,501,787 908,331
_____ALL_____ 38 63.45 67.58 60.48 23.04 111.74 45.42 161.11 56.54 to 69.46 1,501,787 908,331
Avg. Adj.
RANGE Assd. ValSale Price95%_Median_C.I.MAXMINPRDCODWGT.MEANMEANMEDIANCOUNT
Avg.95%MLU By Market Area
_____Dry_____
County 1 161.11 161.11 161.11 00.00 100.00 161.11 161.11 N/A 35,100 56,550
1 1 161.11 161.11 161.11 00.00 100.00 161.11 161.11 N/A 35,100 56,550
_____Grass_____
County 30 61.57 64.89 60.56 21.75 107.15 45.42 96.79 52.55 to 70.89 1,680,922 1,017,945
1 30 61.57 64.89 60.56 21.75 107.15 45.42 96.79 52.55 to 70.89 1,680,922 1,017,945
_____ALL_____ 38 63.45 67.58 60.48 23.04 111.74 45.42 161.11 56.54 to 69.46 1,501,787 908,331
16 Cherry Page 26

Number of Sales :
Total Sales Price :
Total Adj. Sales Price :
Total Assessed Value :
Avg. Adj. Sales Price :
Avg. Assessed Value :
MEDIAN :
WGT. MEAN :
MEAN :
COD :
PRD :
COV :
STD :
Avg. Abs. Dev :
MAX Sales Ratio :
MIN Sales Ratio :
95% Median C.I. :
95% Wgt. Mean C.I. :
95% Mean C.I. :
38
57,067,916
57,067,916
34,516,582
1,501,787
908,331
23.04
111.74
32.29
21.82
14.62
161.11
45.42
56.54 to 69.46
55.06 to 65.91
60.64 to 74.52
Printed:3/21/2018 9:15:23AM
Qualified
PAD 2018 R&O Statistics (Using 2018 Values)Cherry16
Date Range: 10/1/2014 To 9/30/2017 Posted on: 2/20/2018
63
60
68
AGRICULTURAL LAND
Page 2 of 2
Avg. Adj.
RANGE Assd. ValSale Price95%_Median_C.I.MAXMINPRDCODWGT.MEANMEANMEDIANCOUNT
Avg.80%MLU By Market Area
_____Irrigated_____
County 1 65.89 65.89 65.89 00.00 100.00 65.89 65.89 N/A 531,460 350,171
1 1 65.89 65.89 65.89 00.00 100.00 65.89 65.89 N/A 531,460 350,171
_____Dry_____
County 1 161.11 161.11 161.11 00.00 100.00 161.11 161.11 N/A 35,100 56,550
1 1 161.11 161.11 161.11 00.00 100.00 161.11 161.11 N/A 35,100 56,550
_____Grass_____
County 35 62.44 65.13 60.35 20.71 107.92 45.42 96.79 55.39 to 69.46 1,594,324 962,218
1 35 62.44 65.13 60.35 20.71 107.92 45.42 96.79 55.39 to 69.46 1,594,324 962,218
_____ALL_____ 38 63.45 67.58 60.48 23.04 111.74 45.42 161.11 56.54 to 69.46 1,501,787 908,331
16 Cherry Page 27

2 3 4 5 6 7 8 9 10 11 12.00
Mkt
Area1A1 1A 2A1 2A 3A1 3A 4A1 4A
WEIGHTED
AVG IRR
1 n/a 2300 2300 2299 2088 2070 2092 2100 2139
1 3200 3200 3100 3100 2800 2800 2700 2700 2851
1 n/a 3887 3871 3842 3095 2971 2604 2795 3358
1 n/a 2100 n/a 2100 2100 2100 2100 2100 2100
1 n/a n/a 2100 n/a 2100 2100 2100 2100 2100
1 n/a n/a n/a n/a n/a 1800 1800 1800 1800
1 n/a n/a n/a n/a n/a 1500 1500 1500 1500
1 n/a 1775 1660 1605 1585 1585 1570 1525 16511 13 14 15 16 17 18 19 20 21
Mkt
Area1D1 1D 2D1 2D 3D1 3D 4D1 4D
WEIGHTED
AVG DRY
1 n/a 725 725 725 725 725 725 725 725
1 1000 1000 995 995 965 965 915 915 974
1 n/a 1090 1090 1090 995 810 810 810 963
1 n/a 720 n/a n/a n/a 720 720 720 720
1 n/a n/a n/a n/a n/a n/a n/a n/a n/a
1 n/a n/a n/a n/a n/a n/a n/a n/a n/a
1 n/a n/a n/a n/a n/a n/a n/a n/a n/a
1 n/a 690 620 615 600 570 560 550 61522 23 24 25 26 27 28 29 30
Mkt
Area1G1 1G 2G1 2G 3G1 3G 4G1 4G
WEIGHTED
AVG GRASS
1 n/a 700 670 645 599 550 425 425 449
1 810 810 745 745 735 735 725 725 730
1 n/a 915 914 915 860 695 525 525 567
1 n/a 720 720 720 720 720 570 570 574
1 n/a n/a 465 n/a 465 465 465 465 465
1 n/a n/a n/a n/a n/a 450 450 450 450
1 n/a n/a n/a n/a n/a 404 404 404 404
1 n/a 520 485 485 475 475 465 405 45032 33 31
Mkt
AreaCRP TIMBER WASTE
1 725 n/a 73
1 n/a n/a 60
1 586 500 78
1 n/a n/a 25
1 n/a n/a 150
1 n/a n/a 9
1 n/a n/a 10
1 n/a n/a 55
Source: 2018 Abstract of Assessment, Form 45, Schedule IX and Grass Detail from Schedule XIII.
CRP and TIMBER values are weighted averages from Schedule XIII, line 104 and 113.
Blaine
Thomas
Hooker
Grant
Sheridan
Brown
Sheridan
County
Cherry
County
Cherry
Keya Paha
Brown
Blaine
Keya Paha
Brown
Blaine
Thomas
Hooker
Grant
Cherry County 2018 Average Acre Value Comparison
Thomas
Hooker
County
Cherry
Keya Paha
Sheridan
Grant
County
Cherry
Keya Paha
Brown
Blaine
Thomas
Hooker
Grant
Sheridan
16 Cherry Page 28

What IF
16 - Cherry COUNTY PAD 2018 R&O Agricultural Statistics What IF Stat Page: 1
AGRICULTURAL Type : Qualified
Number of Sales : 35 Median : 62 COV : 24.44 95% Median C.I. : 55.39 to 69.46
Total Sales Price : 55,801,356 Wgt. Mean : 60 STD : 15.92 95% Wgt. Mean C.I. : 54.80 to 65.91
Total Adj. Sales Price : 55,801,356 Mean : 65 Avg.Abs.Dev : 12.93 95% Mean C.I. : 59.86 to 70.40
Total Assessed Value : 33,677,623
Avg. Adj. Sales Price : 1,594,324 COD : 20.71 MAX Sales Ratio : 96.79
Avg. Assessed Value : 962,218 PRD : 107.92 MIN Sales Ratio : 45.42
DATE OF SALE *
RANGE COUNT MEDIAN MEAN WGT.MEAN COD PRD MIN MAX 95% Median C.I. Avg.Adj.SalePrice Avg.AssdValue
_____Qrtrs_____
10/01/2014 To 12/31/2014 4 86.30 79.82 80.24 10.75 99.48 57.11 89.58 N/A 437,875 351,334
01/01/2015 To 03/31/2015 3 47.22 62.10 61.17 32.23 101.52 46.71 92.37 N/A 279,966 171,266
04/01/2015 To 06/30/2015 5 62.44 71.61 60.73 22.44 117.92 52.55 92.47 N/A 1,158,974 703,795
07/01/2015 To 09/30/2015 2 65.01 65.01 63.49 10.14 102.39 58.42 71.59 N/A 877,200 556,954
10/01/2015 To 12/31/2015 1 55.39 55.39 55.39 100.00 55.39 55.39 N/A 6,400,000 3,545,196
01/01/2016 To 03/31/2016 7 47.31 52.20 49.05 12.26 106.42 45.42 66.18 45.42 to 66.18 2,337,435 1,146,467
04/01/2016 To 06/30/2016 2 53.74 53.74 52.30 05.23 102.75 50.93 56.54 N/A 765,750 400,494
07/01/2016 To 09/30/2016 1 52.24 52.24 52.24 100.00 52.24 52.24 N/A 557,855 291,427
10/01/2016 To 12/31/2016 3 67.43 66.34 69.18 05.04 95.89 60.69 70.89 N/A 3,678,921 2,545,081
01/01/2017 To 03/31/2017 1 64.73 64.73 64.73 100.00 64.73 64.73 N/A 882,993 571,549
04/01/2017 To 06/30/2017 5 69.46 71.26 67.59 14.81 105.43 49.44 96.79 N/A 1,497,906 1,012,474
07/01/2017 To 09/30/2017 1 85.25 85.25 85.25 100.00 85.25 85.25 N/A 1,400,000 1,193,563
_____Study Yrs_____
10/01/2014 To 09/30/2015 14 67.02 70.98 64.61 23.90 109.86 46.71 92.47 52.55 to 90.36 724,333 468,001
10/01/2015 To 09/30/2016 11 50.93 52.77 50.95 10.72 103.57 45.42 66.18 46.07 to 64.46 2,259,218 1,151,171
10/01/2016 To 09/30/2017 10 68.87 70.53 69.50 12.23 101.48 49.44 96.79 60.69 to 85.25 2,080,929 1,446,273
_____Calendar Yrs_____
01/01/2015 To 12/31/2015 11 60.24 66.34 58.77 22.48 112.88 46.71 92.47 47.22 to 92.37 1,344,470 790,171
01/01/2016 To 12/31/2016 13 52.24 55.70 56.81 14.80 98.05 45.42 70.89 47.25 to 66.18 2,268,321 1,288,687
16 Cherry Page 29

What IF
16 - Cherry COUNTY PAD 2018 R&O Agricultural Statistics What IF Stat Page: 2
AGRICULTURAL Type : Qualified
Number of Sales : 35 Median : 62 COV : 24.44 95% Median C.I. : 55.39 to 69.46
Total Sales Price : 55,801,356 Wgt. Mean : 60 STD : 15.92 95% Wgt. Mean C.I. : 54.80 to 65.91
Total Adj. Sales Price : 55,801,356 Mean : 65 Avg.Abs.Dev : 12.93 95% Mean C.I. : 59.86 to 70.40
Total Assessed Value : 33,677,623
Avg. Adj. Sales Price : 1,594,324 COD : 20.71 MAX Sales Ratio : 96.79
Avg. Assessed Value : 962,218 PRD : 107.92 MIN Sales Ratio : 45.42
AREA (MARKET)
RANGE COUNT MEDIAN MEAN WGT.MEAN COD PRD MIN MAX 95% Median C.I. Avg.Adj.SalePrice Avg.AssdValue
1 35 62.44 65.13 60.35 20.71 107.92 45.42 96.79 55.39 to 69.46 1,594,324 962,218
95%MLU By Market Area
RANGE COUNT MEDIAN MEAN WGT.MEAN COD PRD MIN MAX 95% Median C.I. Avg.Adj.SalePrice Avg.AssdValue
_____Grass_____
County 30 61.57 64.89 60.56 21.75 107.15 45.42 96.79 52.55 to 70.89 1,680,922 1,017,945
1 30 61.57 64.89 60.56 21.75 107.15 45.42 96.79 52.55 to 70.89 1,680,922 1,017,945
_______ALL_______
10/01/2014 To 09/30/2017 35 62.44 65.13 60.35 20.71 107.92 45.42 96.79 55.39 to 69.46 1,594,324 962,218
80%MLU By Market Area
RANGE COUNT MEDIAN MEAN WGT.MEAN COD PRD MIN MAX 95% Median C.I. Avg.Adj.SalePrice Avg.AssdValue
_____Grass_____
County 35 62.44 65.13 60.35 20.71 107.92 45.42 96.79 55.39 to 69.46 1,594,324 962,218
1 35 62.44 65.13 60.35 20.71 107.92 45.42 96.79 55.39 to 69.46 1,594,324 962,218
_______ALL_______
10/01/2014 To 09/30/2017 35 62.44 65.13 60.35 20.71 107.92 45.42 96.79 55.39 to 69.46 1,594,324 962,218
16 Cherry Page 30

What IF
16 - Cherry COUNTY Printed: 03/24/2018
AGRICULTURAL - ADJUSTED
SUMMARY OF ADJUSTED PARAMETERS FOR CALCULATION FROM USER FILE
Strata Heading Strata Change Value Change Type Percent Change
80%MLU By Market Area Grass_1 Total Increase 0%
16 Cherry Page 31
16 - Cherry COUNTY PAD 2018 12 Mile Comparable Sales Statistics Page: 1
AGRICULTURAL SAMPLE Type : Qualified
Number of Sales : 50 Median : 65 COV : 31.71 95% Median C.I. : 57.11 to 68.00
Total Sales Price : 70,271,987 Wgt. Mean : 59 STD : 21.15 95% Wgt. Mean C.I. : 54.45 to 63.66
Total Adj. Sales Price : 70,271,987 Mean : 67 Avg.Abs.Dev : 14.33 95% Mean C.I. : 60.83 to 72.55
Total Assessed Value : 41,497,500
Avg. Adj. Sales Price : 1,405,440 COD : 22.18 MAX Sales Ratio : 161.11
Avg. Assessed Value : 829,950 PRD : 112.94 MIN Sales Ratio : 38.03 Printed : 03/26/2018
DATE OF SALE *
RANGE COUNT MEDIAN MEAN WGT.MEAN COD PRD MIN MAX 95% Median C.I. Avg.Adj.SalePrice Avg.AssdValue
_____Qrtrs_____
10/01/2014 To 12/31/2014 5 88.62 96.08 81.82 24.73 117.43 57.11 161.11 N/A 357,320 292,377
01/01/2015 To 03/31/2015 4 46.97 58.22 54.66 24.63 106.51 46.59 92.37 N/A 379,395 207,380
04/01/2015 To 06/30/2015 6 70.19 72.67 63.27 20.32 114.86 52.55 92.47 52.55 to 92.47 1,133,312 717,022
07/01/2015 To 09/30/2015 2 65.01 65.01 63.49 10.14 102.39 58.42 71.59 N/A 877,200 556,954
10/01/2015 To 12/31/2015 3 55.39 52.98 52.68 16.54 100.57 38.03 65.51 N/A 2,800,853 1,475,361
01/01/2016 To 03/31/2016 9 47.31 51.18 47.82 12.39 107.03 41.53 66.18 45.42 to 64.46 2,531,450 1,210,433
04/01/2016 To 06/30/2016 7 65.89 70.07 63.48 17.12 110.38 50.93 111.57 50.93 to 111.57 630,398 400,171
07/01/2016 To 09/30/2016 1 52.24 52.24 52.24 100.00 52.24 52.24 N/A 557,855 291,427
10/01/2016 To 12/31/2016 3 67.43 66.34 69.18 05.04 95.89 60.69 70.89 N/A 3,678,921 2,545,081
01/01/2017 To 03/31/2017 2 66.18 66.18 65.78 02.19 100.61 64.73 67.63 N/A 691,497 454,849
04/01/2017 To 06/30/2017 5 69.46 71.26 67.59 14.81 105.43 49.44 96.79 N/A 1,497,906 1,012,474
07/01/2017 To 09/30/2017 3 61.75 68.40 75.39 14.61 90.73 58.20 85.25 N/A 782,667 590,047
_____Study Yrs_____
10/01/2014 To 09/30/2015 17 71.59 75.25 65.00 28.36 115.77 46.59 161.11 52.55 to 90.36 697,556 453,379
10/01/2015 To 09/30/2016 20 54.53 58.11 50.93 20.17 114.10 38.03 111.57 47.31 to 65.51 1,807,813 920,630
10/01/2016 To 09/30/2017 13 67.63 68.68 69.09 11.46 99.41 49.44 96.79 60.69 to 72.36 1,712,099 1,182,881
_____Calendar Yrs_____
01/01/2015 To 12/31/2015 15 60.24 63.85 57.76 22.99 110.54 38.03 92.47 47.22 to 77.93 1,231,627 711,443
01/01/2016 To 12/31/2016 20 58.62 60.12 55.74 19.02 107.86 41.53 111.57 48.70 to 66.18 1,939,523 1,081,088
AREA (MARKET)
RANGE COUNT MEDIAN MEAN WGT.MEAN COD PRD MIN MAX 95% Median C.I. Avg.Adj.SalePrice Avg.AssdValue
1 50 64.60 66.69 59.05 22.18 112.94 38.03 161.11 57.11 to 68.00 1,405,440 829,950
16 Cherry Page 32

16 - Cherry COUNTY PAD 2018 12 Mile Comparable Sales Statistics Page: 2
AGRICULTURAL SAMPLE Type : Qualified
Number of Sales : 50 Median : 65 COV : 31.71 95% Median C.I. : 57.11 to 68.00
Total Sales Price : 70,271,987 Wgt. Mean : 59 STD : 21.15 95% Wgt. Mean C.I. : 54.45 to 63.66
Total Adj. Sales Price : 70,271,987 Mean : 67 Avg.Abs.Dev : 14.33 95% Mean C.I. : 60.83 to 72.55
Total Assessed Value : 41,497,500
Avg. Adj. Sales Price : 1,405,440 COD : 22.18 MAX Sales Ratio : 161.11
Avg. Assessed Value : 829,950 PRD : 112.94 MIN Sales Ratio : 38.03 Printed : 03/26/2018
95%MLU By Market Area
RANGE COUNT MEDIAN MEAN WGT.MEAN COD PRD MIN MAX 95% Median C.I. Avg.Adj.SalePrice Avg.AssdValue
_____Dry_____
County 1 161.11 161.11 161.11 100.00 161.11 161.11 N/A 35,100 56,550
1 1 161.11 161.11 161.11 100.00 161.11 161.11 N/A 35,100 56,550
_____Grass_____
County 39 62.44 63.96 60.28 20.28 106.10 38.03 96.79 53.66 to 69.46 1,496,829 902,231
1 39 62.44 63.96 60.28 20.28 106.10 38.03 96.79 53.66 to 69.46 1,496,829 902,231
_______ALL_______
10/01/2014 To 09/30/2017 50 64.60 66.69 59.05 22.18 112.94 38.03 161.11 57.11 to 68.00 1,405,440 829,950
80%MLU By Market Area
RANGE COUNT MEDIAN MEAN WGT.MEAN COD PRD MIN MAX 95% Median C.I. Avg.Adj.SalePrice Avg.AssdValue
_____Irrigated_____
County 3 65.89 80.99 68.61 23.30 118.04 65.51 111.57 N/A 343,620 235,750
1 3 65.89 80.99 68.61 23.30 118.04 65.51 111.57 N/A 343,620 235,750
_____Dry_____
County 1 161.11 161.11 161.11 100.00 161.11 161.11 N/A 35,100 56,550
1 1 161.11 161.11 161.11 100.00 161.11 161.11 N/A 35,100 56,550
_____Grass_____
County 45 62.44 63.75 58.83 20.13 108.36 38.03 96.79 55.39 to 68.00 1,522,356 895,588
1 45 62.44 63.75 58.83 20.13 108.36 38.03 96.79 55.39 to 68.00 1,522,356 895,588
_______ALL_______
10/01/2014 To 09/30/2017 50 64.60 66.69 59.05 22.18 112.94 38.03 161.11 57.11 to 68.00 1,405,440 829,950
16 Cherry Page 33

Cherry
Grant
Arthur
Hooker Thomas
LoganMcPhersonGarden
Blaine
Custer
SheridanBrown
Keya Paha
16_1
3_160_1
38_1 46_1 86_1
81_1
57_1
9_1
5_1
35_1 21_2
52_1
21_1
883
511
881
135
367
611
777
133
889
513
627 629
887
529
773
879
279
779
631615 623
531
603515
781
283
535509
377
891
789
261
607
129
625
523
263
801
537
769
893
277
149
775
633
521
771
613
897
273 251
519
259
139
379
783
527 505
275 265
375
255
635
141
877871
271
605 609
267
525
145143
795
507
147
371
163
381
253281
903
153
269
785
137
787
151
791
517
895
533
793
617
885
637
373
131
361 365
257
875
503
155
357 383363 369355 359349 353
873
351
1147
1347
1153
1061
14271423
1349
14291425
1151
1345
1711
1165
1433
1157
1431
1145
1075
11631159
35
11551149 1173 1175 1177 117911711169
1073
1325
1167
1063
2011
1713
1343
31
1437
33
1615
13271329
1717
1619
1989
1435
1051
1321
29
1323
1881
1997
16111627
2001
16011605
1903
1999
1907
1705
1055
1623 1603
1439
1891
1995
1331 1319
1621
2285
1715
1625
22932281
1709
1913
1991
1707
1617
1333
2301
1421
10431069
1993
1065
1721
2273
2195
1905
14511629
1893
1987
2187
1597
2279 2283
19011729
2197 2183
17311897
1047
2277
1449
1053
1613
1317
17031735
2189
2271 2291
1351
1447
1161
2017
2191
1895 1883
2005
1443
20152185
1885
1041
1719
2295 2297
1599
2177
1049
1341
2287
2193
2289
2173
1733
1609
1045
218120092007
2179
1337
1887
1057
2003
1067
2175
1727
2013
2299
1723
2269
2171
1985
2169
1335
1445
1339
1441
37
1059
1725
1607
39
2487
1071
2303
2485
63 41
2483
2019
434559
2481
4761 49
2479
5157
2477
53
2475
55
2473 2467 2465 2463
1983
2457
27157
869
161159
797799
901899
621
767
249
619
1631
19111899
1915
17011909
1453
2275
1455
2199
1889
2471 2469 2461 24592267
2489
1419
65
£¤83
LegendCounty LinesMarket AreasGeo CodesModerately well drained silty soils on uplands and in depressions formed in loessModerately well drained silty soils with clayey subsoils on uplandsWell drained silty soils formed in loess on uplandsWell drained silty soils formed in loess and alluvium on stream terracesWell to somewhat excessively drained loamy soils formed in weathered sandstone and eolian material on uplandsExcessively drained sandy soils formed in alluvium in valleys and eolian sand on uplands in sandhillsExcessively drained sandy soils formed in eolian sands on uplands in sandhillsSomewhat poorly drained soils formed in alluvium on bottom landsLakes and PondsIrrigationWells
Cherry County Map
§
16 Cherry Page 34

Tax Residential & Recreational (1)
Commercial & Industrial (1)
Total Agricultural Land (1)
Year Value Amnt Value Chg Ann.%chg Cmltv%chg Value Amnt Value Chg Ann.%chg Cmltv%chg Value Amnt Value Chg Ann.%chg Cmltv%chg
2007 121,571,266 -- -- -- 42,231,922 -- -- -- 657,343,776 -- -- --
2008 122,693,882 1,122,616 0.92% 0.92% 43,440,586 1,208,664 2.86% 2.86% 744,180,788 86,837,012 13.21% 13.21%
2009 125,251,246 2,557,364 2.08% 3.03% 43,310,508 -130,078 -0.30% 2.55% 790,342,476 46,161,688 6.20% 20.23%
2010 126,941,566 1,690,320 1.35% 4.42% 46,176,775 2,866,267 6.62% 9.34% 843,247,628 52,905,152 6.69% 28.28%
2011 130,250,713 3,309,147 2.61% 7.14% 60,412,028 14,235,253 30.83% 43.05% 843,174,486 -73,142 -0.01% 28.27%
2012 132,549,870 2,299,157 1.77% 9.03% 63,193,528 2,781,500 4.60% 49.63% 901,236,391 58,061,905 6.89% 37.10%
2013 147,742,868 15,192,998 11.46% 21.53% 65,418,696 2,225,168 3.52% 54.90% 971,587,346 70,350,955 7.81% 47.81%
2014 150,063,977 2,321,109 1.57% 23.44% 59,534,324 -5,884,372 -8.99% 40.97% 1,039,548,926 67,961,580 6.99% 58.14%
2015 152,513,265 2,449,288 1.63% 25.45% 71,641,461 12,107,137 20.34% 69.64% 1,248,627,499 209,078,573 20.11% 89.95%
2016 155,426,698 2,913,433 1.91% 27.85% 71,864,809 223,348 0.31% 70.17% 1,532,752,277 284,124,778 22.75% 133.17%
2017 157,831,856 2,405,158 1.55% 29.83% 73,453,950 1,589,141 2.21% 73.93% 1,692,506,684 159,754,407 10.42% 157.48%
Rate Annual %chg: Residential & Recreational 2.64% Commercial & Industrial 5.69% Agricultural Land 9.92%
Cnty# 16
County CHERRY CHART 1
(1) Residential & Recreational excludes Agric. dwelling & farm home site land. Commercial & Industrial excludes minerals. Agricultural land includes irrigated, dry, grass, waste, & other agland, excludes farm site land.
Source: 2007 - 2017 Certificate of Taxes Levied Reports CTL NE Dept. of Revenue, Property Assessment Division Prepared as of 03/01/2018
-60%-40%-20%0%20%40%60%80%100%120%140%160%180%200%220%240%260%280%300%320%340%360%380%400%420%440%460%480%500%
2007 2008 2009 2010 2011 2012 2013 2014 2015 2016 2017
CHART 1 - REAL PROPERTY VALUATIONS - Cumulative %Change 2007-2017ResRec
Comm&Indust
Total Agland
16 Cherry Page 35

Residential & Recreational (1)
Commercial & Industrial (1)
Tax Growth % growth Value Ann.%chg Cmltv%chg Growth % growth Value Ann.%chg Cmltv%chg
Year Value Value of value Exclud. Growth w/o grwth w/o grwth Value Value of value Exclud. Growth w/o grwth w/o grwth
2007 121,571,266 1,614,273 1.33% 119,956,993 -- -- 42,231,922 269,794 0.64% 41,962,128 -- --
2008 122,693,882 2,208,958 1.80% 120,484,924 -0.89% -0.89% 43,440,586 1,080,473 2.49% 42,360,113 0.30% 0.30%
2009 125,251,246 1,289,716 1.03% 123,961,530 1.03% 1.97% 43,310,508 369,459 0.85% 42,941,049 -1.15% 1.68%
2010 126,941,566 1,113,638 0.88% 125,827,928 0.46% 3.50% 46,176,775 1,095,400 2.37% 45,081,375 4.09% 6.75%
2011 130,250,713 2,478,313 1.90% 127,772,400 0.65% 5.10% 60,412,028 10,870,724 17.99% 49,541,304 7.29% 17.31%
2012 132,549,870 1,767,306 1.33% 130,782,564 0.41% 7.58% 63,193,528 2,276,698 3.60% 60,916,830 0.84% 44.24%
2013 147,742,868 969,061 0.66% 146,773,807 10.73% 20.73% 65,418,696 2,412,010 3.69% 63,006,686 -0.30% 49.19%
2014 150,063,977 1,556,695 1.04% 148,507,282 0.52% 22.16% 59,534,324 1,400,860 2.35% 58,133,464 -11.14% 37.65%
2015 152,513,265 2,572,357 1.69% 149,940,908 -0.08% 23.34% 71,641,461 484,969 0.68% 71,156,492 19.52% 68.49%
2016 155,426,698 2,127,835 1.37% 153,298,863 0.52% 26.10% 71,864,809 1,297,784 1.81% 70,567,025 -1.50% 67.09%
2017 157,831,856 1,844,613 1.17% 155,987,243 0.36% 28.31% 73,453,950 1,352,167 1.84% 72,101,783 0.33% 70.73%
Rate Ann%chg 2.64% 1.37% 5.69% C & I w/o growth 1.83%
Ag Improvements & Site Land (1)
Tax Agric. Dwelling & Agoutbldg & Ag Imprv&Site Growth % growth Value Ann.%chg Cmltv%chg (1) Residential & Recreational excludes AgDwelling
Year Homesite Value Farmsite Value Total Value Value of value Exclud. Growth w/o grwth w/o grwth & farm home site land; Comm. & Indust. excludes
2007 49,134,482 18,202,204 67,336,686 1,235,935 1.84% 66,100,751 -- -- minerals; Agric. land incudes irrigated, dry, grass,
2008 50,023,025 18,725,372 68,748,397 941,213 1.37% 67,807,184 0.70% 0.70% waste & other agland, excludes farm site land.
2009 50,341,187 18,813,470 69,154,657 746,667 1.08% 68,407,990 -0.50% 1.59% Real property growth is value attributable to new
2010 51,173,347 19,770,752 70,944,099 1,644,070 2.32% 69,300,029 0.21% 2.92% construction, additions to existing buildings,
2011 51,322,413 20,848,210 72,170,623 1,523,081 2.11% 70,647,542 -0.42% 4.92% and any improvements to real property which
2012 51,763,786 21,773,935 73,537,721 1,318,062 1.79% 72,219,659 0.07% 7.25% increase the value of such property.
2013 52,023,702 22,564,477 74,588,179 594,208 0.80% 73,993,971 0.62% 9.89% Sources:
2014 53,676,500 26,463,220 80,139,720 5,555,696 6.93% 74,584,024 -0.01% 10.76% Value; 2007 - 2017 CTL
2015 54,690,496 27,307,978 81,998,474 1,802,793 2.20% 80,195,681 0.07% 19.10% Growth Value; 2007-2017 Abstract of Asmnt Rpt.
2016 56,526,157 30,637,545 87,163,702 4,697,960 5.39% 82,465,742 0.57% 22.47%
2017 64,185,365 32,415,245 96,600,610 3,138,259 3.25% 93,462,351 7.23% 38.80% NE Dept. of Revenue, Property Assessment Division
Rate Ann%chg 2.71% 5.94% 3.67% Ag Imprv+Site w/o growth 0.85% Prepared as of 03/01/2018
Cnty# 16
County CHERRY CHART 2
-60%-40%-20%0%20%40%60%80%100%120%140%160%180%200%220%240%260%280%300%320%340%360%380%400%420%440%460%480%500%
2007 2008 2009 2010 2011 2012 2013 2014 2015 2016 2017
CHART 2 - REAL PROPERTY & GROWTH VALUATIONS - Cumulative %Change 2007-2017ResRec
Comm&Indust
Ag Imprv+SiteLand
16 Cherry Page 36

Tax Irrigated Land Dryland Grassland
Year Value Value Chg Ann%chg Cmltv%chg Value Value Chg Ann%chg Cmltv%chg Value Value Chg Ann%chg Cmltv%chg
2007 14,491,443 -- -- -- 9,311,141 -- -- -- 632,249,512 -- -- --
2008 16,371,422 1,879,979 12.97% 12.97% 9,309,126 -2,015 -0.02% -0.02% 717,208,385 84,958,873 13.44% 13.44%
2009 30,560,977 14,189,555 86.67% 110.89% 9,572,462 263,336 2.83% 2.81% 747,626,407 30,418,022 4.24% 18.25%
2010 36,551,064 5,990,087 19.60% 152.23% 10,531,426 958,964 10.02% 13.11% 793,589,008 45,962,601 6.15% 25.52%
2011 36,717,872 166,808 0.46% 153.38% 9,215,728 -1,315,698 -12.49% -1.02% 794,664,756 1,075,748 0.14% 25.69%
2012 43,007,939 6,290,067 17.13% 196.78% 9,222,254 6,526 0.07% -0.95% 846,430,067 51,765,311 6.51% 33.88%
2013 72,106,310 29,098,371 67.66% 397.58% 9,049,307 -172,947 -1.88% -2.81% 887,861,578 41,431,511 4.89% 40.43%
2014 79,135,535 7,029,225 9.75% 446.08% 9,619,114 569,807 6.30% 3.31% 948,224,326 60,362,748 6.80% 49.98%
2015 113,204,323 34,068,788 43.05% 681.18% 13,140,222 3,521,108 36.61% 41.12% 1,119,198,393 170,974,067 18.03% 77.02%
2016 123,062,551 9,858,228 8.71% 749.21% 12,164,264 -975,958 -7.43% 30.64% 1,393,669,717 274,471,324 24.52% 120.43%
2017 123,216,481 153,930 0.13% 750.27% 12,139,396 -24,868 -0.20% 30.37% 1,553,253,850 159,584,133 11.45% 145.67%
Rate Ann.%chg: Irrigated 23.87% Dryland 2.69% Grassland 9.40%
Tax Waste Land (1)
Other Agland (1)
Total Agricultural
Year Value Value Chg Ann%chg Cmltv%chg Value Value Chg Ann%chg Cmltv%chg Value Value Chg Ann%chg Cmltv%chg
2007 1,291,680 -- -- -- 0 -- -- -- 657,343,776 -- -- --
2008 1,291,855 175 0.01% 0.01% 0 0 744,180,788 86,837,012 13.21% 13.21%
2009 2,582,630 1,290,775 99.92% 99.94% 0 0 790,342,476 46,161,688 6.20% 20.23%
2010 2,576,130 -6,500 -0.25% 99.44% 0 0 843,247,628 52,905,152 6.69% 28.28%
2011 2,576,130 0 0.00% 99.44% 0 0 843,174,486 -73,142 -0.01% 28.27%
2012 2,576,131 1 0.00% 99.44% 0 0 901,236,391 58,061,905 6.89% 37.10%
2013 2,570,151 -5,980 -0.23% 98.98% 0 0 971,587,346 70,350,955 7.81% 47.81%
2014 2,569,951 -200 -0.01% 98.96% 0 0 1,039,548,926 67,961,580 6.99% 58.14%
2015 3,084,561 514,610 20.02% 138.80% 0 0 1,248,627,499 209,078,573 20.11% 89.95%
2016 3,855,745 771,184 25.00% 198.51% 0 0 1,532,752,277 284,124,778 22.75% 133.17%
2017 3,896,957 41,212 1.07% 201.70% 0 0 1,692,506,684 159,754,407 10.42% 157.48%
Cnty# 16 Rate Ann.%chg: Total Agric Land 9.92%
County CHERRY
Source: 2007 - 2017 Certificate of Taxes Levied Reports CTL NE Dept. of Revenue, Property Assessment Division Prepared as of 03/01/2018 CHART 3
-60%-40%-20%0%20%40%60%80%100%120%140%160%180%200%220%240%260%280%300%320%340%360%380%400%420%440%460%480%500%
2007 2008 2009 2010 2011 2012 2013 2014 2015 2016 2017
CHART 3 - AGRICULTURAL LAND VALUATIONS - Cumulative %Change 2007-2017Irrigated
Dryland
Total Agland
Grassland
16 Cherry Page 37

CHART 4 - AGRICULTURAL LAND - AVERAGE VALUE PER ACRE - Cumulative % Change 2007-2017 (from County Abstract Reports)(1)
IRRIGATED LAND DRYLAND GRASSLAND
Tax Avg Value Ann%chg Cmltv%chg Avg Value Ann%chg Cmltv%chg Avg Value Ann%chg Cmltv%chg
Year Value Acres per Acre AvgVal/acre AvgVal/Acre Value Acres per Acre AvgVal/acre AvgVal/Acre Value Acres per Acre AvgVal/acre AvgVal/Acre
2007 14,491,443 37,200 390 9,311,141 28,322 329 632,660,868 3,469,055 182
2008 15,792,928 38,635 409 4.93% 4.93% 9,682,776 27,682 350 6.39% 6.39% 717,306,595 3,465,995 207 13.48% 13.48%
2009 30,636,642 50,505 607 48.40% 55.72% 9,619,712 23,270 413 18.19% 25.75% 747,596,741 3,458,143 216 4.46% 18.54%
2010 36,551,064 50,188 728 20.06% 86.95% 10,531,426 22,725 463 12.10% 40.96% 793,589,505 3,458,936 229 6.13% 25.80%
2011 36,717,872 50,415 728 0.00% 86.96% 9,215,728 19,906 463 -0.10% 40.82% 794,666,029 3,462,572 230 0.03% 25.84%
2012 43,020,246 50,523 851 16.91% 118.58% 9,222,198 19,919 463 0.00% 40.83% 846,430,258 3,462,312 244 6.52% 34.05%
2013 72,253,109 50,839 1,421 66.91% 264.83% 9,093,408 19,362 470 1.44% 42.86% 888,119,849 3,462,086 257 4.93% 40.66%
2014 79,192,880 51,874 1,527 7.42% 291.90% 9,637,114 19,031 506 7.82% 54.03% 948,323,283 3,460,849 274 6.82% 50.25%
2015 113,514,073 53,169 2,135 39.85% 448.05% 13,168,922 18,671 705 39.28% 114.54% 1,119,118,685 3,459,262 324 18.06% 77.39%
2016 123,074,051 57,562 2,138 0.15% 448.86% 12,164,264 16,778 725 2.79% 120.53% 1,393,641,998 3,456,601 403 24.63% 121.08%
2017 123,216,481 57,631 2,138 0.00% 448.84% 12,139,396 16,744 725 0.00% 120.53% 1,553,247,294 3,455,885 449 11.48% 146.45%
Rate Annual %chg Average Value/Acre: 18.56% 8.23% 9.44%
WASTE LAND (2)
OTHER AGLAND (2)
TOTAL AGRICULTURAL LAND (1)
Tax Avg Value Ann%chg Cmltv%chg Avg Value Ann%chg Cmltv%chg Avg Value Ann%chg Cmltv%chg
Year Value Acres per Acre AvgVal/acre AvgVal/Acre Value Acres per Acre AvgVal/acre AvgVal/Acre Value Acres per Acre AvgVal/acre AvgVal/Acre
2007 1,291,680 52,959 24 0 0 657,755,132 3,587,536 183
2008 1,291,680 52,959 24 0.00% 0.00% 0 0 744,073,979 3,585,272 208 13.19% 13.19%
2009 2,582,630 52,946 49 99.99% 99.99% 0 0 790,435,725 3,584,864 220 6.24% 20.26%
2010 2,595,930 52,816 49 0.76% 101.52% 0 0 843,267,925 3,584,665 235 6.69% 28.31%
2011 2,576,130 52,816 49 -0.76% 99.98% 0 0 843,175,759 3,585,709 235 -0.04% 28.26%
2012 2,576,130 52,816 49 0.00% 99.98% 0 0 901,248,832 3,585,570 251 6.89% 37.09%
2013 2,576,131 52,816 49 0.00% 99.98% 0 0 972,042,497 3,585,103 271 7.87% 47.88%
2014 2,570,301 52,700 49 -0.01% 99.97% 0 0 1,039,723,578 3,584,453 290 6.98% 58.21%
2015 3,083,927 52,693 59 20.00% 139.96% 0 0 1,248,885,607 3,583,794 348 20.14% 90.07%
2016 3,855,745 52,743 73 24.91% 199.73% 0 0 1,532,736,058 3,583,684 428 22.73% 133.28%
2017 3,896,957 53,315 73 -0.02% 199.68% 0 0 1,692,500,128 3,583,575 472 10.43% 157.60%
16 Rate Annual %chg Average Value/Acre: 9.92%
CHERRY
(1) Valuations from County Abstracts vs Certificate of Taxes Levied Reports (CTL) will vary due to different reporting dates. Source: 2007 - 2017 County Abstract Reports
Agland Assessment Level 1998 to 2006 = 80%; 2007 & forward = 75% NE Dept. of Revenue, Property Assessment Division Prepared as of 03/01/2018 CHART 4
16 Cherry Page 38

CHART 5 - 2017 County and Municipal Valuations by Property Type
Pop. County: Personal Prop StateAsd PP StateAsdReal Residential Commercial Industrial Recreation Agland Agdwell&HS AgImprv&FS Minerals Total Value
5,713 CHERRY 78,649,894 6,960,720 1,606,375 157,831,856 73,453,950 0 0 1,692,506,684 64,185,365 32,415,245 6,405 2,107,616,494
cnty sectorvalue % of total value: 3.73% 0.33% 0.08% 7.49% 3.49% 80.30% 3.05% 1.54% 0.00% 100.00%
Pop. Municipality: Personal Prop StateAsd PP StateAsd Real Residential Commercial Industrial Recreation Agland Agdwell&HS AgImprv&FS Minerals Total Value
154 CODY 243,592 161,612 7,188 3,617,245 542,208 0 0 0 0 4,047 0 4,575,892
2.70% %sector of county sector 0.31% 2.32% 0.45% 2.29% 0.74% 0.01% 0.22% %sector of municipality 5.32% 3.53% 0.16% 79.05% 11.85% 0.09% 100.00%
69 CROOKSTON 44,957 166,873 7,422 974,206 2,029,827 0 0 0 0 0 0 3,223,285
1.21% %sector of county sector 0.06% 2.40% 0.46% 0.62% 2.76% 0.15% %sector of municipality 1.39% 5.18% 0.23% 30.22% 62.97% 100.00%
77 KILGORE 118,031 224,694 9,994 1,234,430 303,240 0 0 0 0 660 0 1,891,049
1.35% %sector of county sector 0.15% 3.23% 0.62% 0.78% 0.41% 0.00% 0.09% %sector of municipality 6.24% 11.88% 0.53% 65.28% 16.04% 0.03% 100.00%
128 MERRIMAN 49,373 102,194 4,545 1,121,594 621,169 0 0 0 0 0 0 1,898,875
2.24% %sector of county sector 0.06% 1.47% 0.28% 0.71% 0.85% 0.09% %sector of municipality 2.60% 5.38% 0.24% 59.07% 32.71% 100.00%
20 NENZEL 35,100 107 54 395,958 57,065 0 0 0 0 0 0 488,284
0.35% %sector of county sector 0.04% 0.00% 0.00% 0.25% 0.08% 0.02% %sector of municipality 7.19% 0.02% 0.01% 81.09% 11.69% 100.00%
2,737 VALENTINE 11,318,997 394,866 176,628 96,175,402 52,390,159 0 0 0 0 0 0 160,456,052
47.91% %sector of county sector 14.39% 5.67% 11.00% 60.94% 71.32% 7.61% %sector of municipality 7.05% 0.25% 0.11% 59.94% 32.65% 100.00%
63 WOOD LAKE 17,886 189,511 49,211 1,035,963 80,488 0 0 0 0 0 0 1,373,059
1.10% %sector of county sector 0.02% 2.72% 3.06% 0.66% 0.11% 0.07% %sector of municipality 1.30% 13.80% 3.58% 75.45% 5.86% 100.00%
3,248 Total Municipalities 11,827,936 1,239,857 255,042 104,554,798 56,024,156 0 0 0 0 4,707 0 173,906,496
56.85% %all municip.sectors of cnty 15.04% 17.81% 15.88% 66.24% 76.27% 0.01% 8.25%
16 CHERRY Sources: 2017 Certificate of Taxes Levied CTL, 2010 US Census; Dec. 2017 Municipality Population per Research Division NE Dept. of Revenue, Property Assessment Division Prepared as of 03/01/2018 CHART 5
16 Cherry Page 39
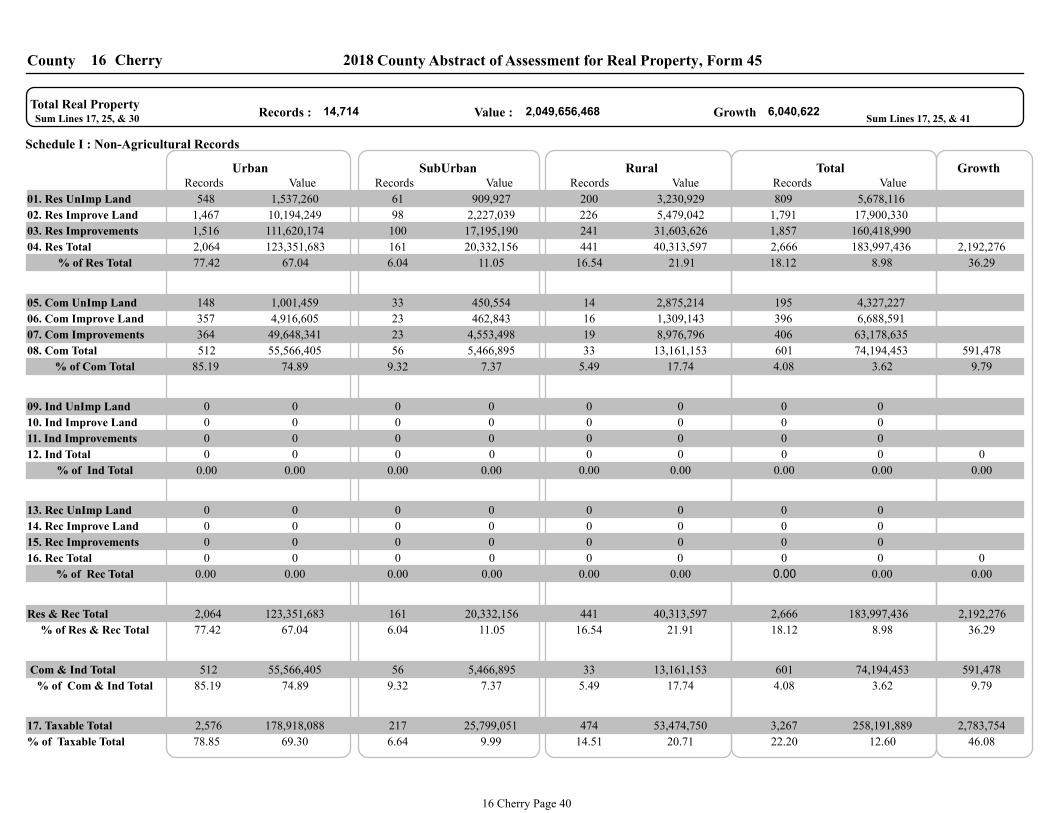
CherryCounty 16 2018 County Abstract of Assessment for Real Property, Form 45
01. Res UnImp Land
02. Res Improve Land
548 1,537,260 61 909,927 200 3,230,929 809 5,678,116
1,467 10,194,249 98 2,227,039 226 5,479,042 1,791 17,900,330
1,516 111,620,174 100 17,195,190 241 31,603,626 1,857 160,418,990
2,666 183,997,436 2,192,276
4,327,227 195 2,875,214 14 450,554 33 1,001,459 148
357 4,916,605 23 462,843 16 1,309,143 396 6,688,591
63,178,635 406 8,976,796 19 4,553,498 23 49,648,341 364
601 74,194,453 591,478
03. Res Improvements
04. Res Total
05. Com UnImp Land
06. Com Improve Land
07. Com Improvements
08. Com Total
14,714 2,049,656,468 6,040,622 Total Real Property
Growth Value : Records : Sum Lines 17, 25, & 30 Sum Lines 17, 25, & 41
09. Ind UnImp Land
10. Ind Improve Land
11. Ind Improvements
12. Ind Total
13. Rec UnImp Land
14. Rec Improve Land
15. Rec Improvements
16. Rec Total
17. Taxable Total
0 0 0 0 0 0 0 0
0 0 0 0 0 0 0 0
0 0 0 0 0 0 0 0
0 0 0
0 0 0 0 0 0 0 0
0 0 0 0 0 0 0 0
0 0 0 0 0 0 0 0
0 0 0
3,267 258,191,889 2,783,754
Urban SubUrban Rural Total GrowthRecords Value Records Value Records Value Records Value
Schedule I : Non-Agricultural Records
% of Res Total
% of Com Total
% of Ind Total
% of Rec Total
% of Taxable Total
% of Res & Rec Total
Res & Rec Total
% of Com & Ind Total
Com & Ind Total
77.42 67.04 6.04 11.05 16.54 21.91 18.12 8.98
14.51 20.71 22.20 12.60
512 55,566,405 56 5,466,895 33 13,161,153 601 74,194,453
2,666 183,997,436 2,064 123,351,683 441 40,313,597 161 20,332,156
67.04 77.42 8.98 18.12 11.05 6.04 21.91 16.54
0.00 0.00 0.00 0.00 0.00 0.00 0.00 0.00
74.89 85.19 3.62 4.08 7.37 9.32 17.74 5.49
0.00 0.00 0.00 0.00 0.00 0.00 0.00 0.00
74.89 85.19 3.62 4.08 7.37 9.32 17.74 5.49
9.99 6.64 69.30 78.85
441 40,313,597 161 20,332,156 2,064 123,351,683
33 13,161,153 56 5,466,895 512 55,566,405
0 0 0 0 0 0
0 0 0 0 0 0
2,576 178,918,088 217 25,799,051 474 53,474,750
9.79
0.00
0.00
36.29
46.08
9.79
36.29
591,478
2,192,276
16 Cherry Page 40
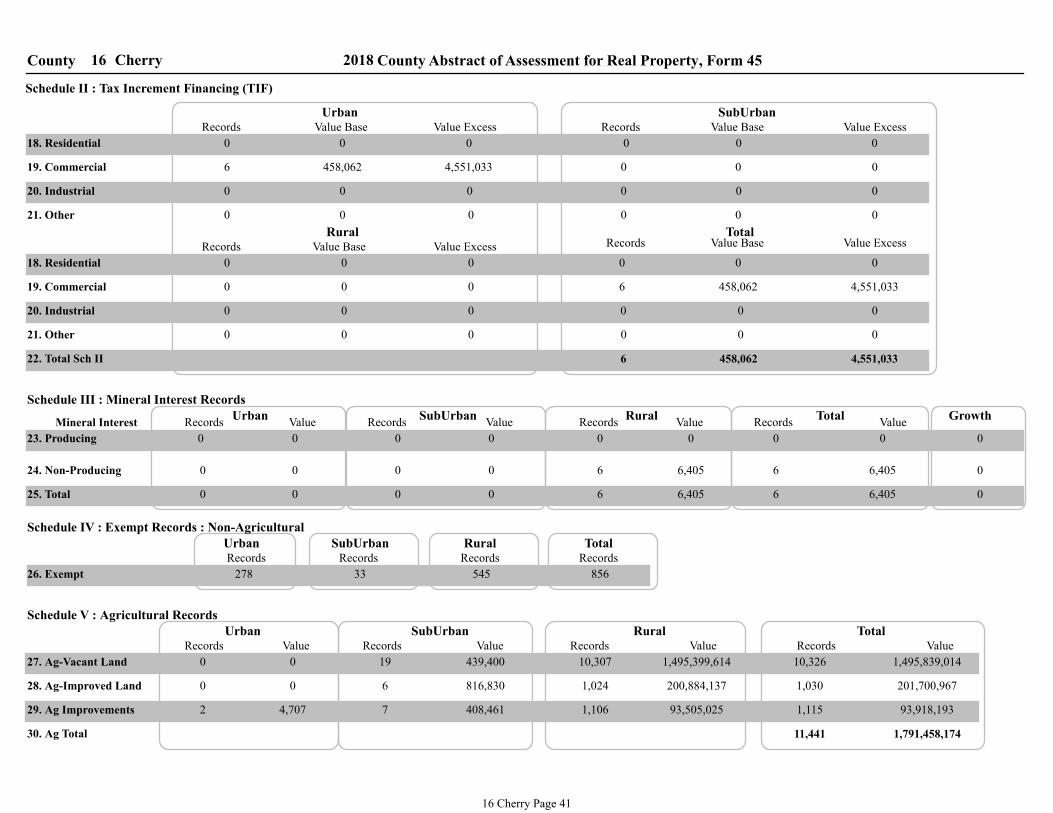
CherryCounty 16 2018 County Abstract of Assessment for Real Property, Form 45
18. Residential
Records
TotalRural
SubUrban Urban
Schedule II : Tax Increment Financing (TIF)
Value Base Value Excess Value ExcessValue BaseRecords
0 0 0 0 0 0
19. Commercial
20. Industrial
21. Other
22. Total Sch II
6 458,062 4,551,033
0 0 0
0 0 0 0 0 0
0 0 0
0 0 0
Value ExcessValue BaseRecordsValue ExcessValue BaseRecords
21. Other
20. Industrial
19. Commercial
18. Residential 0 0 0 0 0 0
0 0 0 6 458,062 4,551,033
0 0 0 0 0 0
0 0 0 0 0 0
6 458,062 4,551,033
23. Producing
GrowthValueRecords
TotalValueRecords
RuralValueRecords
SubUrbanValueRecords
UrbanSchedule III : Mineral Interest Records
0 0 0 0 0 0 0 0 0
0 0 0 0 6 6,405 6 6,405 0
0 0 0 0 6 6,405 6 6,405 0
Mineral Interest
24. Non-Producing
25. Total
Schedule IV : Exempt Records : Non-Agricultural
Schedule V : Agricultural Records
Records Records Records RecordsTotalRural SubUrban Urban
26. Exempt 278 33 545 856
30. Ag Total
29. Ag Improvements
28. Ag-Improved Land
ValueRecordsTotal
ValueRecordsRural
Records Value SubUrban
ValueRecords
27. Ag-Vacant Land
Urban
0 0 19 439,400 10,307 1,495,399,614 10,326 1,495,839,014
0 0 6 816,830 1,024 200,884,137 1,030 201,700,967
2 4,707 7 408,461 1,106 93,505,025 1,115 93,918,193
11,441 1,791,458,174
16 Cherry Page 41

CherryCounty 16 2018 County Abstract of Assessment for Real Property, Form 45
31. HomeSite UnImp Land
Records
TotalRural
SubUrban UrbanSchedule VI : Agricultural Records :Non-Agricultural Detail
Acres Value ValueAcresRecords
32. HomeSite Improv Land
33. HomeSite Improvements
34. HomeSite Total
ValueAcresRecordsValueAcres
34. HomeSite Total
33. HomeSite Improvements
32. HomeSite Improv Land
31. HomeSite UnImp Land
35. FarmSite UnImp Land
36. FarmSite Improv Land
37. FarmSite Improvements
38. FarmSite Total
37. FarmSite Improvements
36. FarmSite Improv Land
35. FarmSite UnImp Land
39. Road & Ditches
38. FarmSite Total
39. Road & Ditches
Records
40. Other- Non Ag Use
40. Other- Non Ag Use
41. Total Section VI
0 0.00 0 0 0.00 0
0 0.00 0
0 0.00 0 6
0 0.00 0 0
0 0.00 0 3
2 0.00 4,707 5
0 0.00 0 0
0 0.00 0 0 0.00 0
0 13.16
41,593 0.00
4,675 11.00
0.00 0
366,868 5.00
25,000 5.00 5
28 140,000 28.00 28 28.00 140,000
805 803.46 4,016,050 810 808.46 4,041,050
832 738.46 60,893,911 838 743.46 61,260,779
866 836.46 65,441,829
727.92 31 452,945 31 727.92 452,945
664 2,568.58 1,287,033 667 2,579.58 1,291,708
974 0.00 32,611,114 981 0.00 32,657,414
1,012 3,307.50 34,402,067
0 10,447.67 0 0 10,460.83 0
0 103.70 0 0 103.70 0
1,878 14,708.49 99,843,896
Growth
0
3,256,868
3,256,868
16 Cherry Page 42

CherryCounty 16 2018 County Abstract of Assessment for Real Property, Form 45
42. Game & Parks
ValueAcresRecords
SubUrban
ValueAcresRecords
Urban
0 0.00 0 0 0.00 0
42. Game & Parks
ValueAcresRecordsTotal
ValueAcresRecordsRural
Schedule VII : Agricultural Records :Ag Land Detail - Game & Parks
24 4,042.72 1,392,471 24 4,042.72 1,392,471
Schedule VIII : Agricultural Records : Special Value
43. Special Value
ValueAcresRecords SubUrban
ValueAcresRecords Urban
43. Special Value
ValueAcresRecordsTotal
ValueAcresRecordsRural
44. Recapture Value N/A
44. Market Value
0 0.00 0 0 0.00 0
0 0.00 0 0 0.00 0
0 0.00 0 0 0.00 0
* LB 968 (2006) for tax year 2009 and forward there will be no Recapture value.
0 0 0 0 0 0
16 Cherry Page 43

1Market AreaSchedule IX : Agricultural Records : Ag Land Market Area Detail
2018 County Abstract of Assessment for Real Property, Form 45Cherry16County
45. 1A1
ValueAcres
46. 1A
47. 2A1
48. 2A
49. 3A1
50. 3A
51. 4A1
52. 4A
53. Total
54. 1D1
55. 1D
56. 2D1
57. 2D
58. 3D1
59. 3D
60. 4D1
61. 4D
62. Total
63. 1G1
64. 1G
65. 2G1
66. 2G
67. 3G1
68. 3G
69. 4G1
70. 4G
71. Total
Waste
Other
Exempt
Irrigated
Dry
Grass
Market Area Total 1,691,614,278 3,583,350.11
0 7,436.36
0 0.00
3,896,957 53,315.18
1,553,350,514 3,456,137.09
831,187,547 1,956,091.77
415,285,799 976,904.48
132,512,731 240,983.71
102,361,518 170,778.53
68,527,661 106,256.92
2,516,718 3,753.23
958,540 1,368.45
0 0.00
12,139,396 16,743.96
271,527 374.52
3,185.30 2,309,350
1,290,272 1,779.68
487,419 672.30
6,650,956 9,173.72
681,872 940.51
448,000 617.93
0 0.00
122,227,411 57,153.88
4,777,962 2,275.22
53,792,430 25,708.95
21,742,473 10,502.73
9,931,635 4,756.41
24,873,979 10,819.73
6,131,846 2,666.02
977,086 424.82
0 0.00
% of Acres* % of Value*
0.00%
0.74%
3.69%
0.00%
0.00%
0.04%
18.93%
4.66%
54.79%
5.62%
3.07%
0.11%
8.32%
18.38%
10.63%
4.02%
4.94%
6.97%
3.98%
44.98%
19.02%
2.24%
56.60%
28.27%
100.00%
100.00%
100.00%
Grass Total
Dry Total
Irrigated Total 57,153.88
16,743.96
3,456,137.09
122,227,411
12,139,396
1,553,350,514
1.59%
0.47%
96.45%
1.49%
0.21%
0.00%
100.00%
Average Assessed Value*
0.80%
0.00%
20.35%
5.02%
8.13%
17.79%
44.01%
3.91%
100.00%
0.00%
3.69%
0.06%
0.00%
5.62%
54.79%
0.16%
4.41%
4.02%
10.63%
6.59%
8.53%
19.02%
2.24%
26.73%
53.51%
100.00%
100.00%
0.00
2,300.00
725.00
0.00
0.00
700.46
2,298.95
2,300.00
725.00
725.00
644.92
670.55
2,088.05
2,070.17
725.00
725.00
599.38
549.88
2,092.36
2,100.00
725.00
725.00
424.92
425.10
2,138.57
725.00
449.45
0.00% 0.00
0.00% 0.00
100.00% 472.08
725.00 0.72%
449.45 91.83%
2,138.57 7.23%
73.09 0.23%72.
73.
74.
75.
16 Cherry Page 44
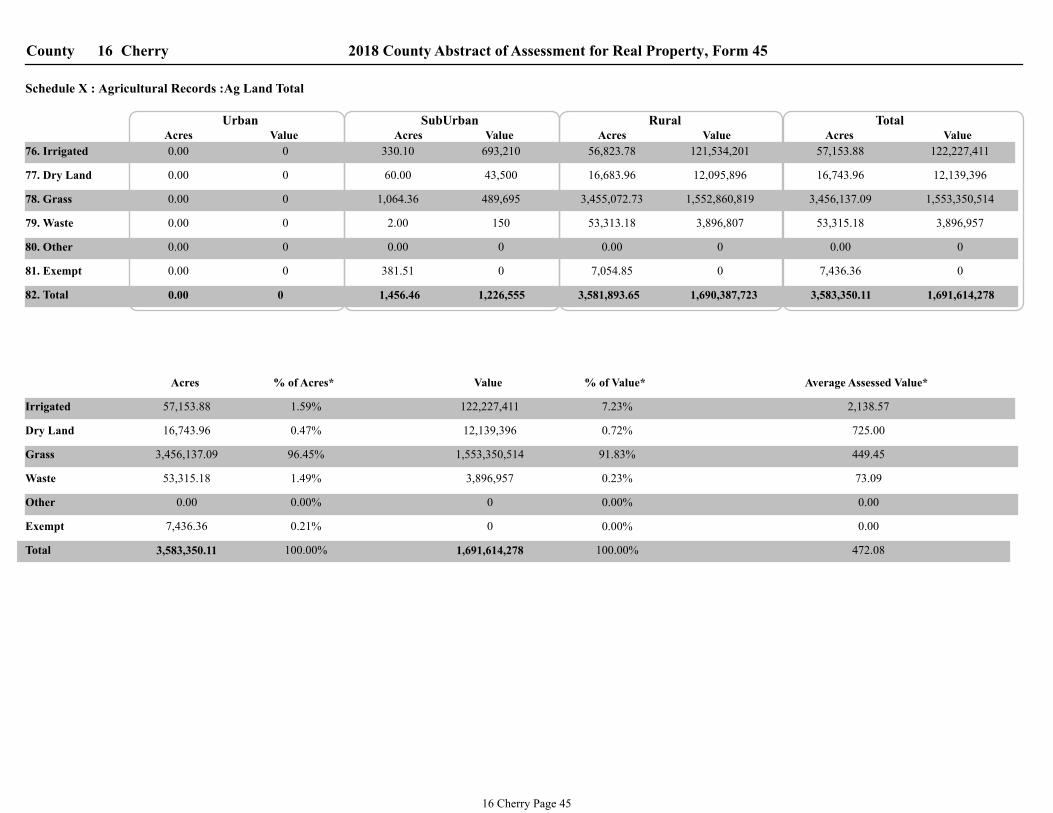
County 2018 County Abstract of Assessment for Real Property, Form 45Cherry16
Schedule X : Agricultural Records :Ag Land Total
76. Irrigated
TotalValueAcresAcres Value
RuralAcres Value ValueAcres
SubUrban Urban
77. Dry Land
78. Grass
79. Waste
80. Other
81. Exempt
82. Total
0.00 0 330.10 693,210 56,823.78 121,534,201 57,153.88 122,227,411
0.00 0 60.00 43,500 16,683.96 12,095,896 16,743.96 12,139,396
0.00 0 1,064.36 489,695 3,455,072.73 1,552,860,819 3,456,137.09 1,553,350,514
0.00 0 2.00 150 53,313.18 3,896,807 53,315.18 3,896,957
0.00 0 0.00 0 0.00 0 0.00 0
0.00 0
0.00 0 1,456.46 1,226,555
381.51 0 7,054.85 0 7,436.36 0
3,581,893.65 1,690,387,723 3,583,350.11 1,691,614,278
Irrigated
Dry Land
Grass
Waste
Other
Exempt
Total 1,691,614,278 3,583,350.11
0 7,436.36
0 0.00
3,896,957 53,315.18
1,553,350,514 3,456,137.09
12,139,396 16,743.96
122,227,411 57,153.88
% of Acres*Acres Value % of Value* Average Assessed Value*
725.00 0.47% 0.72%
0.00 0.21% 0.00%
449.45 96.45% 91.83%
2,138.57 1.59% 7.23%
0.00 0.00% 0.00%
472.08 100.00% 100.00%
73.09 1.49% 0.23%
16 Cherry Page 45

GrowthUnimproved Land Improved Land Improvements Total
2018 County Abstract of Assessment for Real Property, Form 45County 16 Cherry
Records Value Records Value Records Value Records Value
Schedule XI : Residential Records - Assessor Location Detail
Assessor LocationLine# L
52 59,183 96 81,161 96 3,469,436 148 3,609,780 5,03583.1 Cody
58 20,883 45 19,580 54 955,832 112 996,295 28,60583.2 Crookston
54 51,388 51 71,533 51 1,135,330 105 1,258,251 3,16383.3 Kilgore
81 26,525 83 40,657 87 1,062,204 168 1,129,386 50083.4 Merriman
11 10,468 9 31,050 9 355,003 20 396,521 083.5 Nenzel
199 3,220,575 224 5,400,728 238 31,028,359 437 39,649,662 855,78883.6 Rural
62 920,281 99 2,300,381 100 17,753,922 162 20,974,584 620,54483.7 Rural V
200 1,326,774 1,126 9,934,410 1,161 103,659,761 1,361 114,920,945 678,64183.8 Valentine
92 42,039 58 20,830 61 999,143 153 1,062,012 083.9 Wood Lake
809 5,678,116 1,791 17,900,330 1,857 160,418,990 2,666 183,997,436 2,192,27684 Residential Total
16 Cherry Page 46

GrowthUnimproved Land Improved Land Improvements Total
2018 County Abstract of Assessment for Real Property, Form 45County 16 Cherry
Records Value Records Value Records Value Records Value
Schedule XII : Commercial Records - Assessor Location Detail
Assessor LocationLine# L
13 9,226 23 5,453 23 527,529 36 542,208 085.1 Cody
16 3,013 6 2,763 7 2,024,051 23 2,029,827 085.2 Crookston
9 3,050 11 3,494 11 299,836 20 306,380 085.3 Kilgore
11 2,673 23 10,888 23 607,608 34 621,169 085.4 Merriman
1 270 3 803 3 55,992 4 57,065 085.5 Nenzel
14 2,875,214 17 1,319,778 20 9,001,161 34 13,196,153 085.6 Rural
32 444,020 19 361,577 19 3,659,942 51 4,465,539 144,46685.7 Rural V
92 988,474 291 4,983,069 297 46,924,081 389 52,895,624 447,01285.8 Valentine
7 1,287 3 766 3 78,435 10 80,488 085.9 Wood Lake
195 4,327,227 396 6,688,591 406 63,178,635 601 74,194,453 591,47886 Commercial Total
16 Cherry Page 47

1Market AreaSchedule XIII : Agricultural Records : Grass Land Detail By Market Area
2018 County Abstract of Assessment for Real Property, Form 45Cherry16County
87. 1G1
ValueAcres
88. 1G
89. 2G1
90. 2G
91. 3G1
92. 3G
93. 4G1
94. 4G
95. Total
96. 1C1
97. 1C
98. 2C1
99. 2C
100. 3C1
101. 3C
102. 4C1
103. 4C
104. Total
105. 1T1
106. 1T
107. 2T1
108. 2T
109. 3T1
110. 3T
111. 4T1
112. 4T
113. Total
Pure Grass
CRP
Timber
114. Market Area Total 1,553,350,514 3,456,137.09
1,552,725,127 3,455,274.49
831,183,777 1,956,086.57
414,994,856 976,503.18
132,464,953 240,917.81
102,361,518 170,778.53
68,289,933 105,929.02
2,489,675 3,715.93
940,415 1,343.45
0 0.00
% of Acres* % of Value*
0.00%
0.04%
3.07%
0.11%
4.94%
6.97%
56.61%
28.26%
100.00%
Grass TotalCRP Total
Timber Total
3,455,274.49 1,552,725,127 99.98%
100.00%
Average Assessed Value*
0.06%
0.00%
0.16%
4.40%
6.59%
8.53%
26.73%
53.53%
100.00%
0.00
700.00
644.68
670.00
599.38
549.83
424.92
424.98
449.38
100.00% 449.45
449.38 99.96%
0.00
0.00
25.00
37.30
327.90
0.00
65.90
401.30
5.20
862.60 625,387
3,770
290,943
47,778
0
237,728
27,043
18,125
0
0
0.00 0
0.00 0
0.00 0
0.00 0
0.00 0
0.00 0
0.00 0
0.00 0
2.90% 725.00 2.90%
0.00% 0.00 0.00%
0.00% 0.00 0.00% 0.00% 0.00 0.00%
38.01% 725.00 38.01%
4.32% 725.01 4.32%
0.00% 0.00 0.00% 0.00% 0.00 0.00%
7.64% 725.01 7.64% 0.00% 0.00 0.00%
0.00% 0.00 0.00%
0.00% 0.00 0.00%
0.60% 725.00 0.60%
46.52% 725.00 46.52%
0.00% 0.00 0.00%
0.00% 0.00 0.00%
100.00% 100.00% 725.00
0.00% 0.00%
0.02%
0.00% 0.00
0.00
725.00 0.04%
0.00% 0.00 0
862.60 625,387
16 Cherry Page 48

2018 County Abstract of Assessment for Real Property, Form 45
16 CherryCompared with the 2017 Certificate of Taxes Levied Report (CTL)
2017 CTL
County Total
2018 Form 45
County Total
Value Difference Percent
Change
2018 Growth Percent Change
excl. Growth
157,831,856
0
01. Residential
02. Recreational
03. Ag-Homesite Land, Ag-Res Dwelling
04. Total Residential (sum lines 1-3)
05. Commercial
06. Industrial
07. Total Commercial (sum lines 5-6)
08. Ag-Farmsite Land, Outbuildings
09. Minerals
10. Non Ag Use Land
11. Total Non-Agland (sum lines 8-10)
12. Irrigated
13. Dryland
14. Grassland
15. Wasteland
16. Other Agland
18. Total Value of all Real Property
(Locally Assessed)
(2018 form 45 - 2017 CTL) (New Construction Value)
64,185,365
222,017,221
73,453,950
0
73,453,950
32,415,245
6,405
0
32,421,650
123,216,481
12,139,396
1,553,253,850
3,896,957
0
1,692,506,684
183,997,436
0
65,441,829
249,439,265
74,194,453
0
74,194,453
34,402,067
6,405
0
34,408,472
122,227,411
12,139,396
1,553,350,514
3,896,957
0
1,691,614,278
26,165,580
0
1,256,464
27,422,044
740,503
0
740,503
1,986,822
0
0
1,986,822
-989,070
0
96,664
0
0
-892,406
16.58%
1.96%
12.35%
1.01%
1.01%
6.13%
0.00
6.13%
-0.80%
0.00%
0.01%
0.00%
-0.05%
2,192,276
0
5,449,144
591,478
0
591,478
0
0
15.19%
-3.12%
9.90%
0.20%
0.20%
6.13%
0.00%
3,256,868
17. Total Agricultural Land
2,020,399,505 2,049,656,468 29,256,963 1.45% 6,040,622 1.15%
0 6.13%
16 Cherry Page 49

2018 Assessment Survey for Cherry County
A. Staffing and Funding Information
Deputy(ies) on staff:1.
1
Appraiser(s) on staff:2.
0
Other full-time employees:3.
1
Other part-time employees:4.
1
Number of shared employees:5.
0
Assessor’s requested budget for current fiscal year:6.
$148,200
Adopted budget, or granted budget if different from above:7.
same
Amount of the total assessor’s budget set aside for appraisal work:8.
$94,980
If appraisal/reappraisal budget is a separate levied fund, what is that amount:9.
none
Part of the assessor’s budget that is dedicated to the computer system:10.
($30,860 line item in general fund - $10,980 GIS and $19,880 for TerraScan)
Amount of the assessor’s budget set aside for education/workshops:11.
$3,200
Other miscellaneous funds:12.
none
Amount of last year’s assessor’s budget not used:13.
$9,058
16 Cherry Page 50
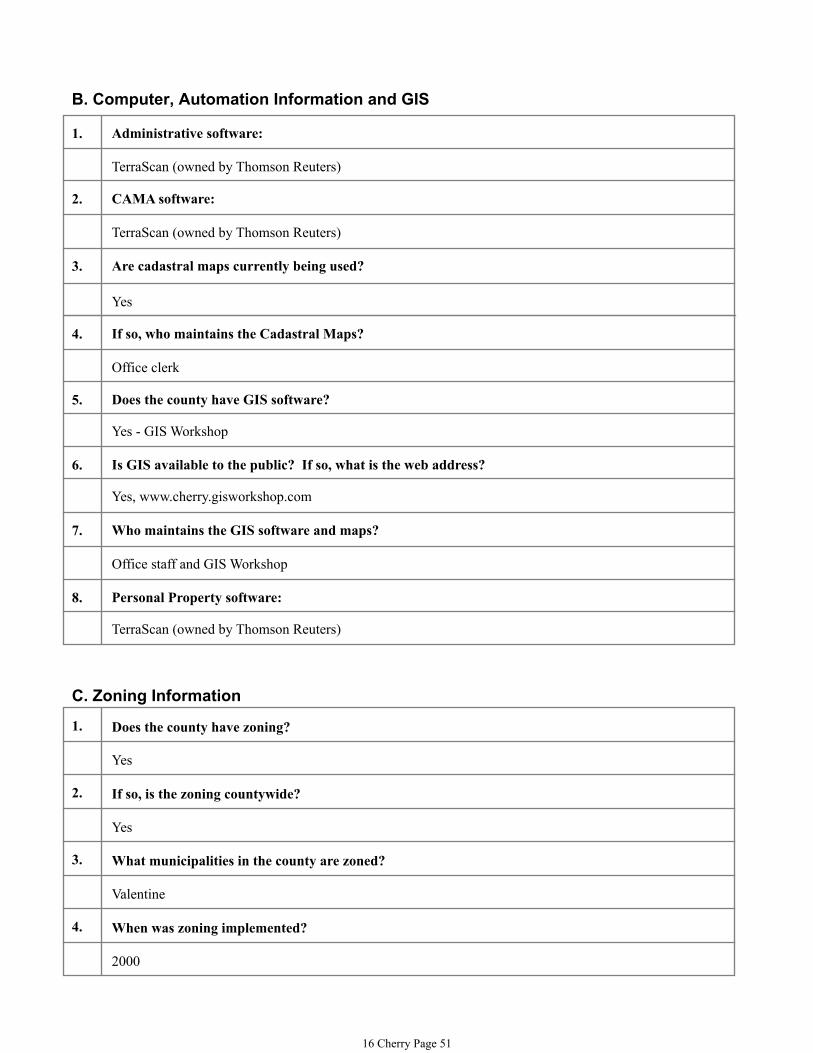
B. Computer, Automation Information and GIS
1. Administrative software:
TerraScan (owned by Thomson Reuters)
2. CAMA software:
TerraScan (owned by Thomson Reuters)
3. Are cadastral maps currently being used?
Yes
4. If so, who maintains the Cadastral Maps?
Office clerk
5. Does the county have GIS software?
Yes - GIS Workshop
6. Is GIS available to the public? If so, what is the web address?
Yes, www.cherry.gisworkshop.com
7. Who maintains the GIS software and maps?
Office staff and GIS Workshop
8. Personal Property software:
TerraScan (owned by Thomson Reuters)
C. Zoning Information
1. Does the county have zoning?
Yes
2. If so, is the zoning countywide?
Yes
3. What municipalities in the county are zoned?
Valentine
4. When was zoning implemented?
2000
16 Cherry Page 51

D. Contracted Services
1. Appraisal Services:
Tax Valuation Inc.
2. GIS Services:
GIS Workshop
3. Other services:
TerraScan (owned by Thomson Reuters)
E. Appraisal /Listing Services
1. Does the county employ outside help for appraisal or listing services?
Yes, Tax Valuation Inc.
2. If so, is the appraisal or listing service performed under contract?
Yes
3. What appraisal certifications or qualifications does the County require?
1) Ability to promote positive public relations.
2) Experience in ad valorem tax appraisal.
3) Familiarity with Nebraska Department of Revenue statutes and regulations.
4) Familiarity and appreciation of the area (county).
4. Have the existing contracts been approved by the PTA?
Yes
5. Does the appraisal or listing service providers establish assessed values for the county?
They provide estimates of value to the assessor for review.
16 Cherry Page 52
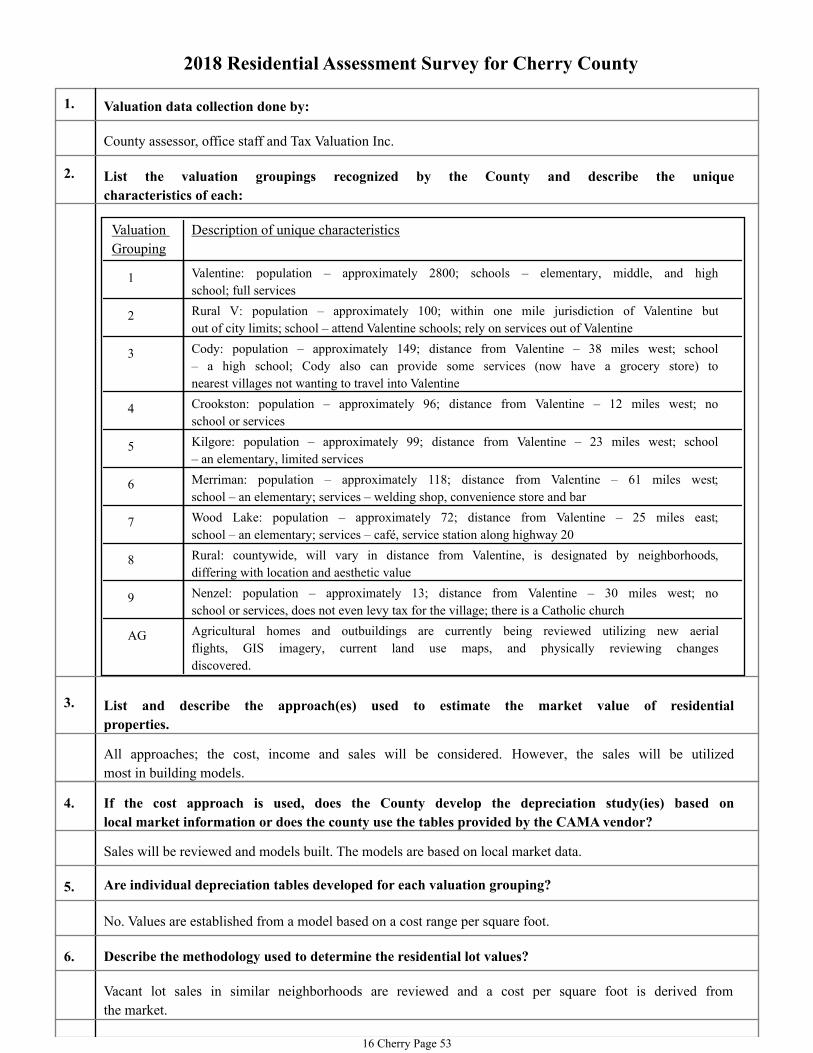
2018 Residential Assessment Survey for Cherry County
1. Valuation data collection done by:
County assessor, office staff and Tax Valuation Inc.
List the valuation groupings recognized by the County and describe the unique
characteristics of each:
2.
Description of unique characteristicsValuation
Grouping
1 Valentine: population – approximately 2800; schools – elementary, middle, and high
school; full services
2 Rural V: population – approximately 100; within one mile jurisdiction of Valentine but
out of city limits; school – attend Valentine schools; rely on services out of Valentine
3 Cody: population – approximately 149; distance from Valentine – 38 miles west; school
– a high school; Cody also can provide some services (now have a grocery store) to
nearest villages not wanting to travel into Valentine
4 Crookston: population – approximately 96; distance from Valentine – 12 miles west; no
school or services
5 Kilgore: population – approximately 99; distance from Valentine – 23 miles west; school
– an elementary, limited services
6 Merriman: population – approximately 118; distance from Valentine – 61 miles west;
school – an elementary; services – welding shop, convenience store and bar
7 Wood Lake: population – approximately 72; distance from Valentine – 25 miles east;
school – an elementary; services – café, service station along highway 20
8 Rural: countywide, will vary in distance from Valentine, is designated by neighborhoods,
differing with location and aesthetic value
9 Nenzel: population – approximately 13; distance from Valentine – 30 miles west; no
school or services, does not even levy tax for the village; there is a Catholic church
AG Agricultural homes and outbuildings are currently being reviewed utilizing new aerial
flights, GIS imagery, current land use maps, and physically reviewing changes
discovered.
3. List and describe the approach(es) used to estimate the market value of residential
properties.
All approaches; the cost, income and sales will be considered. However, the sales will be utilized
most in building models.
4. If the cost approach is used, does the County develop the depreciation study(ies) based on
local market information or does the county use the tables provided by the CAMA vendor?
Sales will be reviewed and models built. The models are based on local market data.
5. Are individual depreciation tables developed for each valuation grouping?
No. Values are established from a model based on a cost range per square foot.
6. Describe the methodology used to determine the residential lot values?
Vacant lot sales in similar neighborhoods are reviewed and a cost per square foot is derived from
the market.
16 Cherry Page 53

7. Describe the methodology used to determine value for vacant lots being held for sale or
resale?
All lots are treated the same, currently there is no difference.
8. Valuation
Grouping
Date of
Costing
Date of
Lot Value Study
Date of
Last Inspection
Date of
Depreciation Tables
1 2018 2017 2018 by sq ft 2017
2 2018 2017 2018 by sq ft 2017
3 2013 2012 2012 by sq ft 2012-2013
4 2013 2012 2012 by sq ft 2012-2013
5 2013 2012 2012 by sq ft 2012-2013
6 2013 2012 2012 by sq ft 2012-2013
7 2013 2012 2012 by sq ft 2012-2013
8 2013 2012 2012 by sq ft 2012-2013
9 2013 2012 2012 by sq ft 2012-2013
AG 2016 2015 2016 2015-16
A review of the agricultural homes and outbuildings was completed for the 2017 assessment year
with the help of Tax Valuation Inc. New costing and depreciation and lot study were applied.
16 Cherry Page 54

2018 Commercial Assessment Survey for Cherry County
1. Valuation data collection done by:
Office staff
List the valuation groupings recognized in the County and describe the unique characteristics
of each:
2.
Description of unique characteristicsValuation
Grouping
1 Valentine: population – approximately 2800; schools – elementary, middle, and high school;
full services
2 Rural V: population – approximately 100; within one mile jurisdiction of Valentine but out of
city limits; school – attend Valentine schools; rely on services out of Valentine
3 Small Villages- Cody, Crookston, Kilgore, Merriman, Nenzel, Wood Lake - amentiies and
distance vary by village with Cody being the largest with a population of 154.
8 Rural: countywide, will vary in distance from Valentine, is designated by neighborhoods,
differing with location
3. List and describe the approach(es) used to estimate the market value of commercial
properties.
All three approaches, the income, cost and sales, will be considered. However, a square foot
method and the income approach, if enough information exists, will be used the most.
3a. Describe the process used to determine the value of unique commercial properties.
Stanard Appraisal will determine the most appropriate process depending on the property and the
availability of market data.
4. If the cost approach is used, does the County develop the depreciation study(ies) based on
local market information or does the county use the tables provided by the CAMA vendor?
Sales will be reviewed and models built. The sales will be charted for a cost range per square foot
based on occupancy code, quality, condition and age. Plus or minus adjustments will be applied
when appropriate to arrive at estimated final values per square foot.
5. Are individual depreciation tables developed for each valuation grouping?
No
6. Describe the methodology used to determine the commercial lot values.
A square foot cost was derived from the market.
7. Date of
Depreciation Tables
Valuation
Grouping
Date of
Costing
Date of
Lot Value Study
Date of
Last Inspection
1 2015 2012 2014 by sq ft 2014
2 2015 2012 2014 by sq ft 2014
3 2015 2012 2014 by sq ft 2014
8 2015 2012 2014 by sq ft 2014
16 Cherry Page 55

The costing is predominantly by a square foot method unless enough income and expense
information exists to utilize an income approach.
16 Cherry Page 56

2018 Agricultural Assessment Survey for Cherry County
1. Valuation data collection done by:
Office staff and Tax Valuation Inc.
List each market area, and describe the location and the specific characteristics that make
each unique.
2.
Year Land Use
Completed
Description of unique characteristicsMarket
Area
0 There are no market areas. 2016
Land use is continually being reviewed with the aid of GIS, NRD cerifications and Google Earth.
The county completed the soil conversion for the 2017 assessment year along with a parcel by
parcel review. Parcels that appear to have a change will be physically inspected.
3. Describe the process used to determine and monitor market areas.
N/A
4. Describe the process used to identify rural residential land and recreational land in the
county apart from agricultural land.
Agricultural land has the ability to conform to statutes 77-l359 and 77-1363 and based upon the
standard agricultural practices of Cherry County. If it does not, it falls into the residential or
recreational category. Use aids in making the decision. For residential or recreational site,
amenities such as canyons, rivers, views, or lack of these bear differences in the market.
Groupings of similar properties with similar amenities in similar areas form neighborhoods, not
unlike other residential properties. It is the review of the market in these neighborhoods that form
the basis for valuing of these properties.
5. Do farm home sites carry the same value as rural residential home sites? If not, what are
the market differences?
Farm sites do not carry the same value as rural residential sites. Rural farm sites do not rely on
amenities like rural residential. Rural residential sites are valued like any other residential
property at a dollar per square foot value, based on the market. Farm sites are valued at $5,000
for the home site acre.
6. If applicable, describe the process used to develop assessed values for parcels enrolled in
the Wetland Reserve Program.
The process includes sales review consisting of interviews, inspections, and possibly
questionnaires. Current assessed values are then built up to 100% of market value.
If your county has special value applications, please answer the following
7a. How many special valuation applications are on file?
N/A
7b. What process was used to determine if non-agricultural influences exist in the county?
N/A
If your county recognizes a special value, please answer the following
7c. Describe the non-agricultural influences recognized within the county.
16 Cherry Page 57

N/A
7d. Where is the influenced area located within the county?
N/A
7e. Describe in detail how the special values were arrived at in the influenced area(s).
N/A
16 Cherry Page 58
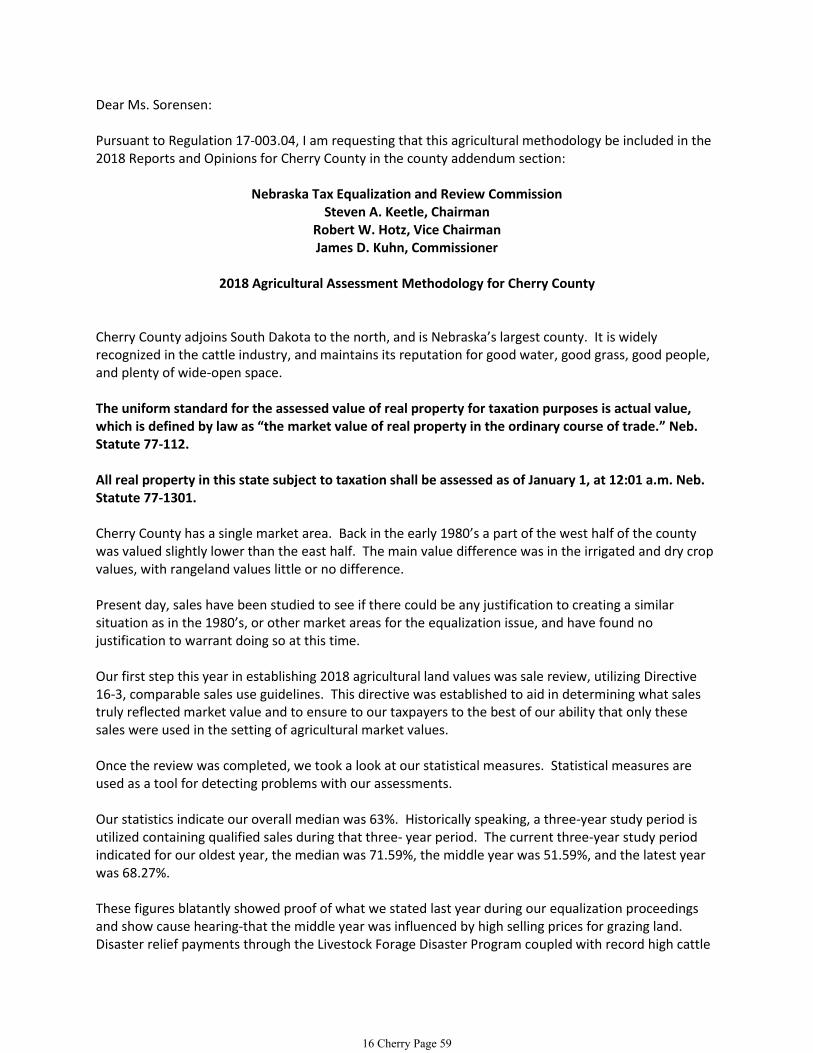
Dear Ms. Sorensen: Pursuant to Regulation 17-003.04, I am requesting that this agricultural methodology be included in the 2018 Reports and Opinions for Cherry County in the county addendum section:
Nebraska Tax Equalization and Review Commission
Steven A. Keetle, Chairman Robert W. Hotz, Vice Chairman James D. Kuhn, Commissioner
2018 Agricultural Assessment Methodology for Cherry County
Cherry County adjoins South Dakota to the north, and is Nebraska’s largest county. It is widely recognized in the cattle industry, and maintains its reputation for good water, good grass, good people, and plenty of wide-open space. The uniform standard for the assessed value of real property for taxation purposes is actual value, which is defined by law as “the market value of real property in the ordinary course of trade.” Neb. Statute 77-112. All real property in this state subject to taxation shall be assessed as of January 1, at 12:01 a.m. Neb. Statute 77-1301. Cherry County has a single market area. Back in the early 1980’s a part of the west half of the county was valued slightly lower than the east half. The main value difference was in the irrigated and dry crop values, with rangeland values little or no difference. Present day, sales have been studied to see if there could be any justification to creating a similar situation as in the 1980’s, or other market areas for the equalization issue, and have found no justification to warrant doing so at this time. Our first step this year in establishing 2018 agricultural land values was sale review, utilizing Directive 16-3, comparable sales use guidelines. This directive was established to aid in determining what sales truly reflected market value and to ensure to our taxpayers to the best of our ability that only these sales were used in the setting of agricultural market values. Once the review was completed, we took a look at our statistical measures. Statistical measures are used as a tool for detecting problems with our assessments. Our statistics indicate our overall median was 63%. Historically speaking, a three-year study period is utilized containing qualified sales during that three- year period. The current three-year study period indicated for our oldest year, the median was 71.59%, the middle year was 51.59%, and the latest year was 68.27%. These figures blatantly showed proof of what we stated last year during our equalization proceedings and show cause hearing-that the middle year was influenced by high selling prices for grazing land. Disaster relief payments through the Livestock Forage Disaster Program coupled with record high cattle
16 Cherry Page 59

prices produced an anomaly that artificially represented market value. During 2017 the Property Assessment Division’s Sandhill’s Analysis took into account these situations to prove that these influences no longer exist. Currently, without that middle year, the two remaining years, which are the oldest and the newest, average 69.93%.
“Taxes shall be levied by valuation uniformly and proportionately upon all real property and franchises as defined by Legislature except as otherwise provided in or permitted by this
Constitution…”-Article VII Revenue Sec. 1(1) & (6)-Constitution of Nebraska. Our second step of the value setting process is looking at the equalization issue. We network with surrounding counties discussing particulars with their county’s valuation situations. Nowhere in the State of Nebraska is there such an example of not just attempting equalizing across county lines, but having huge school districts that are shared on each side of our county to our south and west. Cherry County has always been a supporter of the extended agland analysis. This methodology was questioned and researched by a property taxation consulting firm. This firm upheld the practice. The main purpose of this analysis was to guarantee counties equalization by using comparable sales across county lines. It allowed counties that might not have many sales to “borrow sales”, enabling their sales base to “extend” for valuation setting purposes. For Cherry County, this concept can be necessary since we do share those huge districts that cross county lines. In reviewing the 2018 agricultural land values with surrounding counties, who also face the same objectives, it appears that they are keeping their values the same as the 2017 year, with the exception of Sheridan County, which is increasing their grass values minimally. In all fairness to the taxpayers of Cherry County, it would be disproportionate to increase the grass values for 2018, when other counties around us are not. The unfair tax burden the taxpayers of this county would bear would be enormous. There is a comparison that supports this. Please refer to the sheet “Cherry & Surrounding County 2018 Average Acre Value Comparison” included with Cherry County’s 2018 Reports and Opinions. This comparison illustrates that we are equalized with our surrounding counties that share these school districts. Another important element to consider, Cherry County raises their grass values incrementally, starting at $425/acre for 4G1 and 4G, and going to $700/acre for 1G groupings. Most of our surrounding counties that share these school districts have the same value from 4G to 1G, with the exception of Sheridan County. Through the years, Cherry County has made every effort, and spared no expense to provide equal and proportionate tax valuations for its taxpayers and followed directions as set forth by legislature and Department of Revenue. We have increased valuations when the market dictated us to do so. We have “stepped up to the plate” because it was justifiably the right thing to do, and looking back, maybe some of this at the expense of our taxpayers. Our two main grass groupings rose over 40% in the preceding three assessment years. Weighing the matter concerning the 2018 land values there were two choices: (1) increasing our agricultural land values substantially in an effort to bring that middle year, with its exaggerated influences, into compliance, and throwing the equalization factor out, or (2) accepting the middle study
16 Cherry Page 60

year for what it was, and doing our best at providing equalization to our taxpayers. Also remembering the fact that we are to determine market value as of January 1st, 2018, I chose the latter. The decision not take any action to increase the 2018 agricultural land valuations from the 2017 values is an unfamiliar one for me, although with all options considered, I feel it is the right action to take. I have also learned that statistics are a needed tool to analysis situations, but as in this case, don’t necessary tell the whole story. How long will this trend in land prices/values exist? It could last for years or maybe change overnight. Then we do as we have always done-explore the options, adhere to the law, and try to uncover the truest measure of market value. Thank you for your consideration. Respectfully submitted, Betty J. Daugherty Cherry County Assessor March 19, 2018
16 Cherry Page 61

CHERRY COUNTY
2017
PLAN OF ASSESSMENT
Cherry County adjoins South Dakota to the north, and is Nebraska’s largest county. It is widely known in the cattle industry, and the combination of scenic beauty, plentiful grazing land, and good water continue to appeal to buyers for Cherry County land. Tourism brings trade to the county contributing to making Valentine the hub for commercial growth for a large area in north-central Nebraska and south-central South Dakota. All property in the State of Nebraska is subject to property tax unless expressly exempt by Nebraska Constitution or is permitted by the constitution and enabling legislation adopted by the legislature. “Taxes shall be levied by valuation uniformly and proportionately upon all real property and
franchises as defined by the Legislature except as otherwise provided in or permitted by this
Constitution. The legislature may prescribe standards and methods for the determination of the
value of real property at uniform and proportionate values.”-Article VIII Revenue Sec. 1 (1) & (6)-
Constitution of Nebraska The standard for valuing certain classes of property for tax purposes is controversial in nature. Many feel a production basis would benefit our agricultural community. Nothing to date concerning tax valuation standards have been changed by legislature. Although much time and service has been allotted to changing this standard, the standard remains: The uniform standard for the assessed value of real property for taxation purposes is actual value,
which is defined by law as “the market value of real property in the ordinary course of trade.”
Our assessment levels are also defined by statute:
• 100% of actual value for all classes of real property excluding agricultural and horticultural land;
• 75% of actual value for agricultural and horticultural land;
• 75% of special valuation for agricultural and horticultural land which meets qualifications for special valuation
The assessor’s office consists of the assessor, deputy, one full-time clerk, and one part-time clerk. Currently, the assessor feels the office is at a minimum level of staffing needed for completing basic operations. Ideally, more appraiser services would benefit the county, but realistically due to location, this is not a good possibility. Unfortunately, several public service features of the office that are informative and enjoyable to our taxpayers cannot be updated simply because official demands consume the available time necessary to do these projects. The importance of continuing education is recognized by this office. The assessor, and her deputy, will attend assessor workshops that are offered by Property Assessment Division and the Nebraska Assessor Association. The cost is not prohibitive, and much information is derived through speakers and networking with other assessors throughout the state. This assessor would like to take some further IAAO courses in the near future.
16 Cherry Page 62

As far as record management, records in the Cherry County Assessor’s office are basically public
information. There are a few exceptions, which are labeled confidential, and admission to these files is carefully screened. Due to the size of Cherry County, various methods are utilized to access property information. Index cards give an alphabetical listing of all property owned under a particular name. Property record files (hard copy) are filed by legal description. Our computer system has the capability for CAMA services and administrative software. Now, due to the implementation of WebGIS services, the public has access 24/7 to property record information. This ability is frequently used by real estate agents, banks, appraisers, FSA office, and insurance companies. Cadastral maps continue to be kept current by office clerks. The maps are old, but property can readily be identified and located by using them. The office uses Terra Scan assessment and appraisal system for electronic property record files and appraisal assistance. Our server and other hardware have been recently upgraded. The office has installed wireless internet service to electronically file reports and to aid with e-mail. WebGIS services are implemented, and to defray some of the cost to our taxpayers, Cherry County offers an enhanced, sales-based subscription service available to the public upon request. This enhanced service includes scanned copies of deeds, Form 521’s, surveys, site plans, all photos that are connected to the included sales. Continually, we submit new subdivisions, parcel splits, and other changes to GIS Workshop so our site can be updated for the public. We receive excellent support and cooperation from GIS Workshop. Sales review is an important factor in establishing fair market values. Statistics are only as reliable as the sample they are derived from. Cherry County adheres to the minimum standards of sales review from the International Association of Assessing Officers, Standard of Ratio Studies, 2007. These standards include, but are not limited to:
• Cherry County recognizes all sales over $2.25 in Doc Stamps or $100 consideration as arms-length transactions, unless verification proves otherwise
• Verification is made on all sales, usually with a knowledgeable third party
• During verifications, a standard form of questions is used. For residential and commercial sales, sales are verified and the response noted on supplemental sheets.
• Adjustments are made through the verification process if not noted on the Form 521. Cherry County processed 384 real estate transfers in 2016. The real estate market in Cherry County has been active. Cherry County mailed over 1300 personal property returns last January. The office refers to Regulations-Chapter 20 for guidance in the assessment of personal property. Cherry County will process approximately 250 Homestead Exemption Applications. We make every effort to inform our taxpayers about homestead exemptions. This is one of the few forms of tax relief offered to our citizens, and this exemption loss is reimbursed to the county by the state. We personally visit the Valentine Senior Center, Northwest Community Action, Veteran’s Service Office, and publish notice in the local newspaper for new filers. We mail previous filers new application forms annually. As a courtesy, we mail and phone reminders for former applicants to timely file their applications. As a benefit to our public, recent legislative changes have broadened the income tables in 2014. In 2015, veterans with a 100% service-connected disability and unremarried spouses can exempt the entire valuation of their residence from taxation. There was also a category created for developmentally disabled individuals.
16 Cherry Page 63

In the area of property discovery, the biggest obstacle for Cherry County is its size. Cherry County encompasses 6000 square miles and is dissected by a time zone. Because of the size of this county, our office utilizes building and zoning permits. We can pinpoint new building projects with little cost or time allocation. In April 2009, we contracted with an aerial photography company to take pictures of all sites in rural Cherry County. The pictures were excellent, and provided us with a tool for discovering new construction. This office acquired a laptop during 2012, and it is taken to the field with us, which enables us to check property information as we come across it. Currently we use Google Earth and GIS Workshop aerial photography to compare with our property records to verify building status. If discrepancies are noted, a physical inspection is done. As with most all appraisal maintenance, an external physical inspection is done at the time of listing. To comply with the next 6-year review cycle for agricultural buildings and residences, we have entered into and completed a contract with Tax Valuation Services, Inc. to aid in the valuation of agricultural residences and outbuildings. Date of completion of this project was January 1, 2017. As far as land usage, FSA maps were a great tool. However, these records have now been closed to public access. During the certification of irrigated acres, a requirement from the local natural resource district was that irrigators were responsible to furnish us with a map so we could locate the irrigated area. This worked out ideally, and again gave us the information we needed with minimal time and expense. We also mail questionnaires to known CRP participants to verify if they are still in the program, and to verify acre amounts. Now, with GIS, we have another tool to use to verify land usage. Cherry County adhers to State Statute 77-1363: “Land classes shall be inventoried by subclasses of
real property based on soil classification standards developed by the Natural Resources
Conservation Service of the United States Department of Agriculture as converted into land
capability groups by the Property Tax Administrator. County Assessor’s shall utilize soil surveys
from the Natural Resources Conservation Service of the United States Department of Agriculture
as directed by the Property Tax Administrator. Nothing in this section shall be construed to limit
the classes and subclasses of real property that may be used by county assessors or the Tax
Equalization and Review Commission to achieve more uniform and proportionate valuations.”
Our office considers assessment/sale ratio studies supplied by the Property Assessment Division a tool in considering assessment actions. These studies work as a flag for detecting problems with our assessment practices. Many thanks to our field liaison, Chelsey Fessler, with the Property Assessment Division, for her efforts in aiding Cherry County work through their equalization issues. Also, a thank-you to Bryan Hill for his assistance with recent soil survey updates. Information concerning statistical measures such as level of values, office compliance of state-defined reports, etc. is contained in the 2017 Reports and Opinions, issued by the Property Tax Administrator, April 2017. Also available on the Nebraska Department of Property Assessment’s website is an annual calendar which depicts by date and by statute the annual responsibilities of the assessor’s office.
2018 ASSESSMENT ACTIONS
The focal point for the residential and commercial market is Valentine. Valentine currently is the only residential and commercial subclass with sufficient sales to measure. The market in smaller villages can depend on distance from Valentine and availability of services. Cherry County maintains its reputation for good water, good grass, good people, and plenty of wide- open space.
16 Cherry Page 64

Residential-In 2012, we completed a residential revaluation. We updated our costing and physically reviewed all residential properties in the county. Depreciation was based on the market. In 2017, no value adjustments were needed. For 2018, we have contracted with Tax Valuation, Inc. to perform a residential review/revalue. For tax year 2018 this will include Valentine City and surrounding subdivisions, the completion date of this is February 1, 2018. During this project all appraisal maintenance will be completed. Commercial- Our commercial market was active. In 2014, a contract was awarded to Stanard Appraisal Services, Inc. for a commercial revaluation. With this new revalue, we imported the 2012 Marshall Swift costing and used the three approaches to value. We also did physical inspections on each property and put new photos in our computer system. This revalue was completed by January 1, 2015. Informal hearings were held February 2015. No action was taken for tax year 2017 except commercial maintenance. However, due to recent “high dollar” sales, some type of valuation adjustment may have to be made for the 2018 tax year for Valentine City commercial properties. Agriculture- Cherry County has a single market area. Cherry County increased their three lower classes of agricultural land values for the 2017 year by approximately 13%. As our irrigated land stabilized in market, pasture ground is also indicating signs of softening. For the past several years, it has been cautioned about the inclusion of 1031 like-kind exchange transactions in our sales file due to their driving nature and financial interests of the transactions. These transactions were a driving force with our agricultural sales. In December 2016, the Property Assessment Division issued Directive 16-3 concerning guidelines for comparable sales use. Among “special conditions” were special financing, adjoining property, 1031 like kind exchanges, less than 40 acres, non-ag influences, family, or legal actions. In late 2016, we again performed sales review under the guidance of this directive. After the 2017 sales period ended on September 30, 2016 and close to the first of the year 2017, a “Sandhills Analysis” was performed between Cherry County south to northern Lincoln County, the “grass” counties. This analysis was an effort between the Property Assessment Division and the respective assessor’s offices. Counties were asked after the close of the sales period if there sales that indicated a weakening grass market. Cherry County, as well as other counties, submitted sales to this analysis. This analysis proved that the market as of January 1, 2017 had lowered. Also, during this time, Cherry County consulted with neighboring counties sharing large school districts to attempt to equalize values across county lines. On May 3, Cherry County was called to “show cause” why her values should not be increased an additional 21%. The hearing was well attended and several offered testimony. The result of this hearing ruled that no change be given to the values previously set. I felt this meeting was an educational opportunity for all involved. The Tax Equalization and Review Commission, Property Tax Administrator, and Cherry County all had the same goal in mind for fair and proportionate values for the taxpayers of Cherry County. This office also supports the use of “extended agland analysis” for agland property valuation. This methodology, utilized by the Department of Property Assessment termed “extended agland analysis”, was questioned and researched by Almy, Gloudemans, Jacobs & Denne, a property taxation consulting firm. The results of this study upheld the use of the extended agland analysis practice. The purpose of this extended analysis was to guarantee counties equalization by using comparable sales across county lines. It allowed counties that might not have had many sales to “borrow” sales, enabling their sales base to “extend” for valuation setting purposes. For Cherry County, this concept can be necessary, since we share huge school districts that cross county lines, but be careful the borrowed sales are actually comparable in every way. Going forward into 2018, we will have to monitor sales according to statute and directives set by the Property Assessment Division. We will be reviewing these sales for any adjustments. As previously mentioned, we entered into a contract with Tax Valuation Inc. to perform the six-year review cycle for rural improvements, which included an updated costing for the residences and outbuildings. We completed this project January 2017. Currently, in addition to zoning and building
16 Cherry Page 65

permits, we are utilizing Google Earth Pro and GIS Workshop to compare aerial photos for any building changes. All appraisal maintenance will be completed. Also, there have been updates to the USDA soil survey. Cherry County completed their soil updates for the 2017 tax year. Continue GIS Workshop maintenance in all classes.
2019 PLANNED ACTIONS
Residential - Complete appraisal maintenance. Cherry County has entered into a contract with Tax Valuation Inc. for a residential review/revalue for the villages and rural residential acreages. The deadline for this contract is February 1, 2019. Commercial –Review the 2015 appraisal review & revalue. Complete commercial appraisal maintenance. Adjustments to commercial property values are probable. Agricultural –Concentrate on improving sales review. Monitor the market. Keep aware of legislative changes. Complete appraisal maintenance. Continued GIS Workshop maintenance in all classes.
2020 PLANNED ACTIONS
Residential -Monitor sales in county and review for problem areas. Complete appraisal maintenance. If not already completed initiate residential review and revalue. Commercial -Do all appraisal maintenance. Review all subclasses of commercial properties to detect problem areas. If a commercial review has recently been completed, monitor to see how review fared. Agricultural – Concentrate on sales review. Monitor the market. Continue with appraisal maintenance. Continued GIS Workshop maintenance in all classes.
CONCLUSION
It is a common business practice to prepare a budget and plan a course of action. It is no different with county business. We do owe it to our taxpayers for proportionate assessments at the most economical/efficient means possible. Planning saves time, money, and can assure our taxpayers that they are being well- served. In our world of assessment practice, we can never let ourselves become satisfied that there is no room for improvement, that we are done researching alternate methods to accomplish accurate assessments, or our appraisal education is complete.
16 Cherry Page 66

Our county board has been co-operative with allocating adequate funding requested for appraisal needs. In the spirit of fairness, this county is committed to appropriate assessments, and that commitment comes at a cost. For this coming year, we look to spending in excess of $120,000 for appraisal fees. This county, during the past year, has spent $8,062.50 for its annual GIS fee, and $8,374.90 in the prior year. We also paid $23,469 in appraiser fees, and $57,330 in the prior year and more to anticipate next year. Our TerraScan software and CAMA provider is another $19,000-$20,000 roughly per year. The county has furnished this office a laptop and vehicle used for appraisal issues. Our board is a very informed, supportive board, and also answers to our taxpayers concerning assessment practices and expenditures of tax dollars. When county boards and county offices are able to work together for the public good, everyone gains from their efforts. That being said, it will continue to be the goal of this office to comply with state statute and regulations to provide uniform and proportionate assessments on all properties in Cherry County. And, as always, it is the utmost goal of this office to make every effort to promote good public relations and stay sensitive to the needs of its public. Respectfully submitted, Betty J. Daugherty, Cherry County Assessor July 25, 2017
16 Cherry Page 67