Embed Size (px)
Citation preview
2018WeAllCountRESULTS
WeAllCount2018
▸ Count Highlights & Summary
▹ Regional Trends▹ Demographics▹ Local Questions
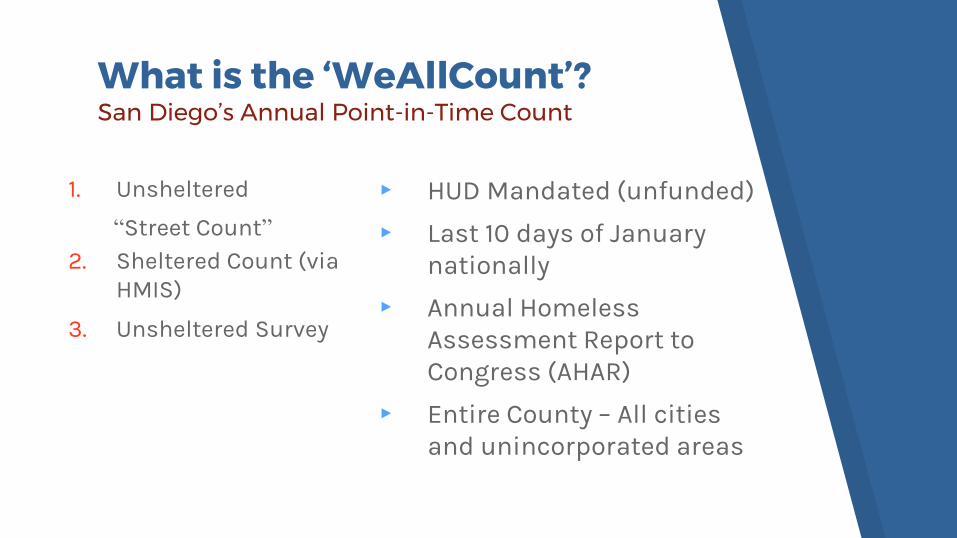
What is the ‘WeAllCount’?San Diego’s Annual Point-in-Time Count
1. Unsheltered
“Street Count”2. Sheltered Count (via
HMIS)
3. Unsheltered Survey
▸ HUD Mandated (unfunded)
▸ Last 10 days of January nationally
▸ Annual Homeless Assessment Report to Congress (AHAR)
▸ Entire County – All cities and unincorporated areas
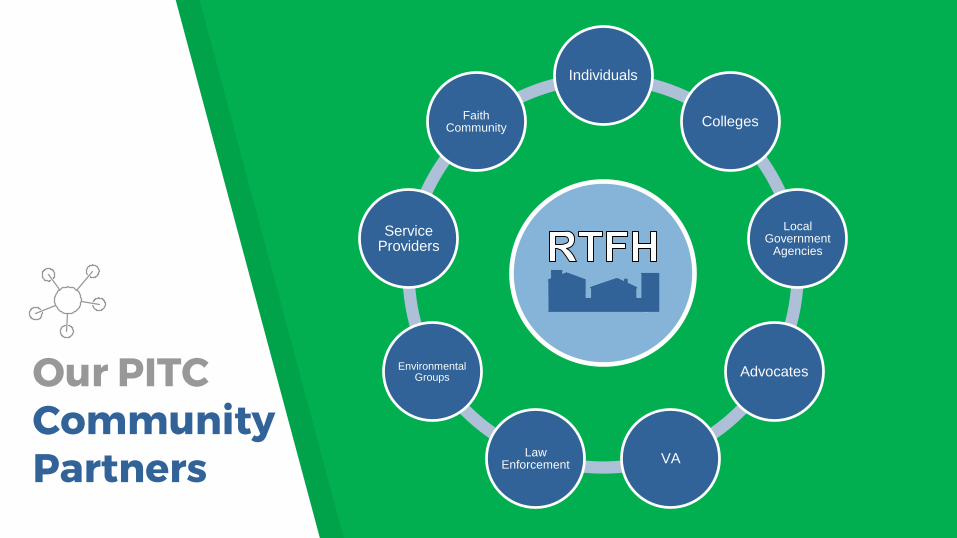
Our PITC Community Partners
Individuals
Colleges
Local Government
Agencies
Advocates
VALaw
Enforcement
Environmental Groups
Service Providers
Faith Community
Volunteeringby the Numbers
1,318Counters
318Interviewers
4,908Volunteer Hours
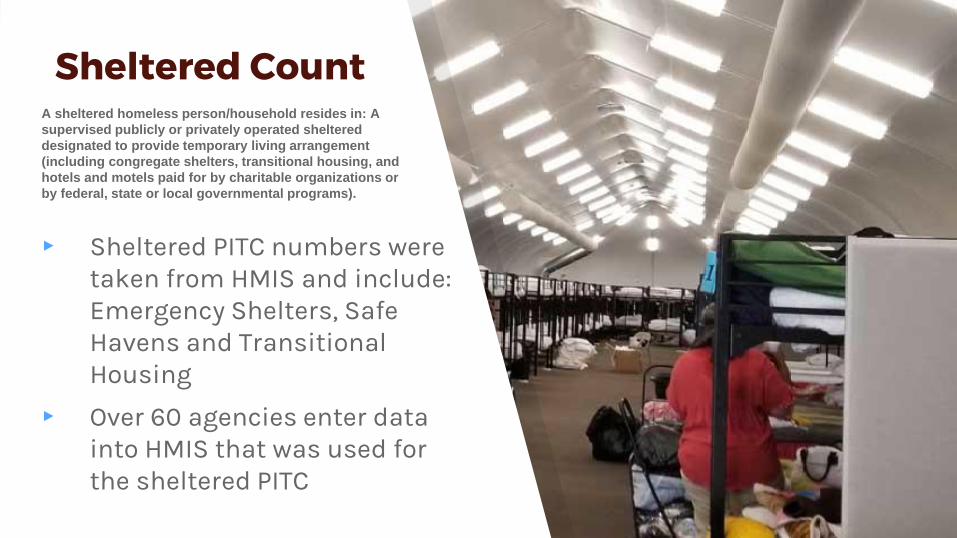
Sheltered Count
▸ Sheltered PITC numbers were taken from HMIS and include: Emergency Shelters, Safe Havens and Transitional Housing
▸ Over 60 agencies enter data into HMIS that was used for the sheltered PITC
A sheltered homeless person/household resides in: A
supervised publicly or privately operated sheltered
designated to provide temporary living arrangement
(including congregate shelters, transitional housing, and
hotels and motels paid for by charitable organizations or
by federal, state or local governmental programs).
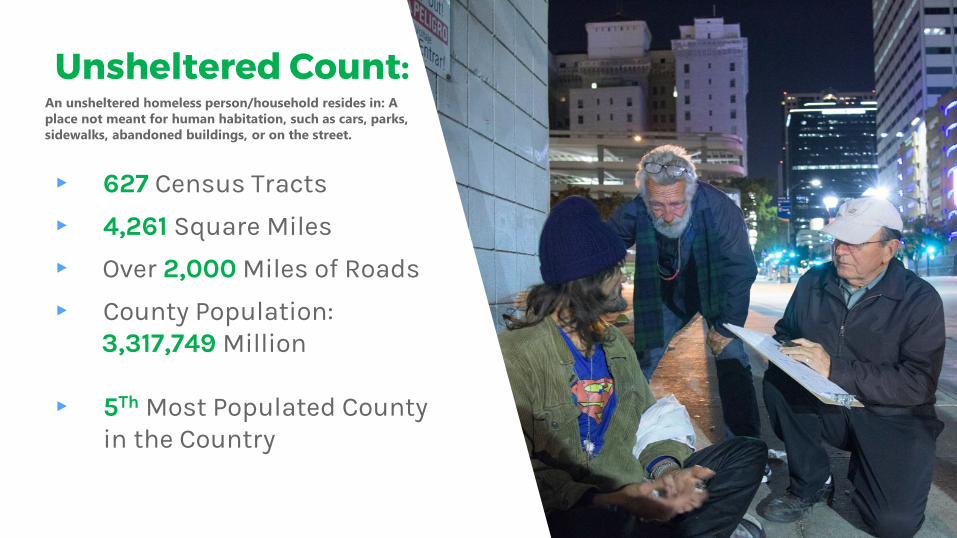
Unsheltered Count:
▸ 627 Census Tracts
▸ 4,261 Square Miles
▸ Over 2,000 Miles of Roads
▸ County Population: 3,317,749 Million
▸ 5Th Most Populated County in the Country
An unsheltered homeless person/household resides in: A
place not meant for human habitation, such as cars, parks,
sidewalks, abandoned buildings, or on the street.
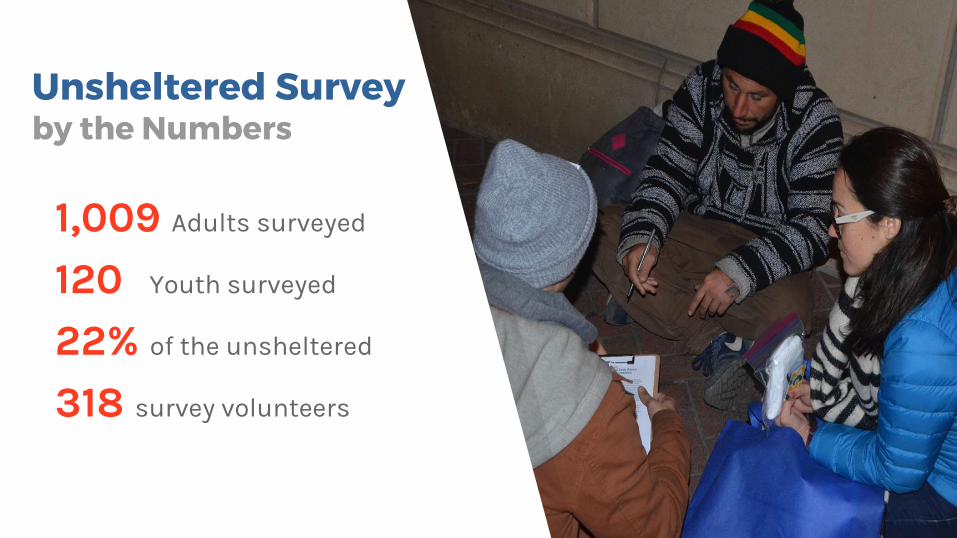
Unsheltered Surveyby the Numbers
1,009 Adults surveyed
120 Youth surveyed
22% of the unsheltered
318 survey volunteers
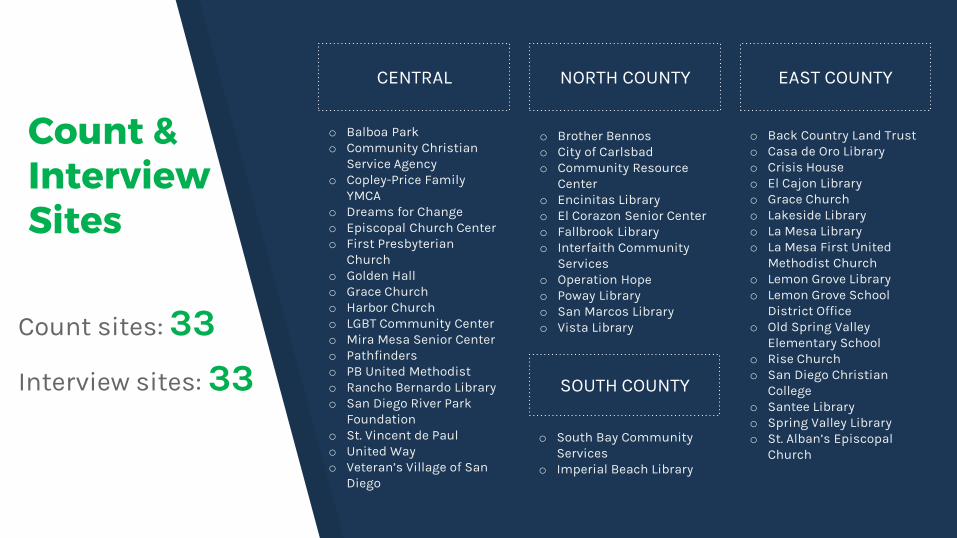
Count & Interview Sites
Count sites: 33
Interview sites: 33
CENTRAL EAST COUNTYNORTH COUNTY
SOUTH COUNTY
o Balboa Parko Community Christian
Service Agencyo Copley-Price Family
YMCAo Dreams for Changeo Episcopal Church Centero First Presbyterian
Churcho Golden Hallo Grace Churcho Harbor Churcho LGBT Community Centero Mira Mesa Senior Centero Pathfinderso PB United Methodisto Rancho Bernardo Libraryo San Diego River Park
Foundationo St. Vincent de Paulo United Way o Veteran’s Village of San
Diego
o Brother Bennoso City of Carlsbado Community Resource
Centero Encinitas Libraryo El Corazon Senior Centero Fallbrook Libraryo Interfaith Community
Serviceso Operation Hopeo Poway Libraryo San Marcos Libraryo Vista Library
o Back Country Land Trusto Casa de Oro Libraryo Crisis Houseo El Cajon Libraryo Grace Churcho Lakeside Libraryo La Mesa Libraryo La Mesa First United
Methodist Churcho Lemon Grove Libraryo Lemon Grove School
District Officeo Old Spring Valley
Elementary Schoolo Rise Churcho San Diego Christian
Collegeo Santee Libraryo Spring Valley Libraryo St. Alban’s Episcopal
Churcho South Bay Community
Serviceso Imperial Beach Library
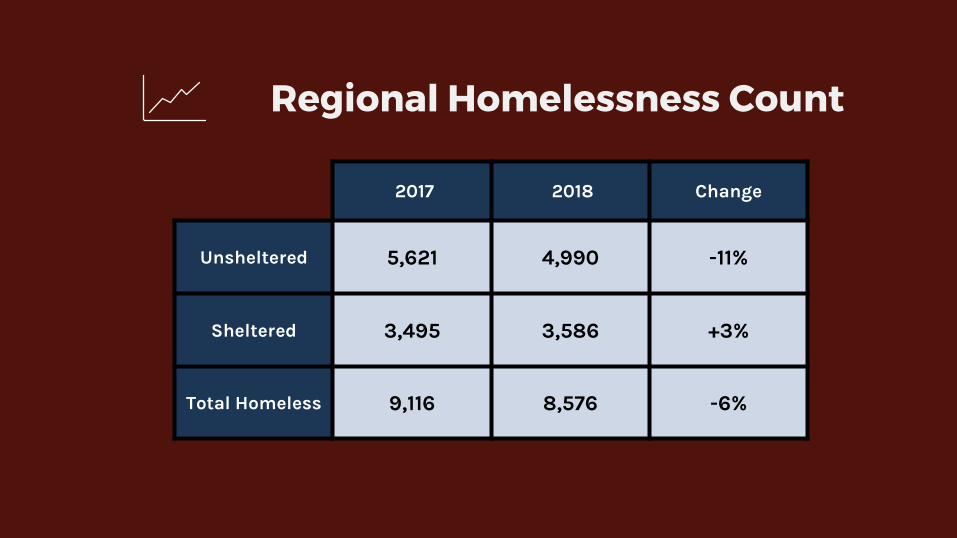
2017 2018 Change
Unsheltered 5,621 4,990 -11%
Sheltered 3,495 3,586 +3%
Total Homeless 9,116 8,576 -6%
Regional Homelessness Count
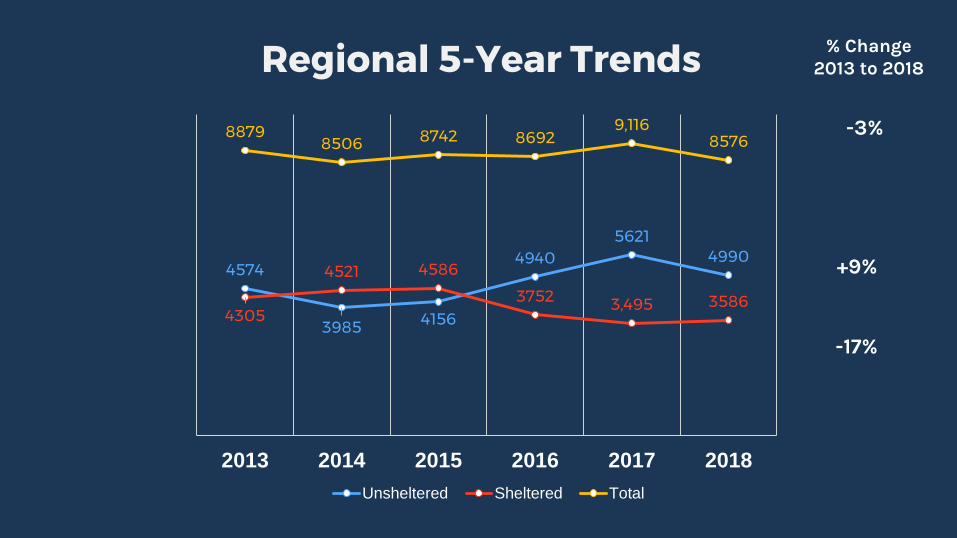
Regional 5-Year Trends
4574
3985 4156
49405621
4990
4305
4521 4586
3752 3,495 3586
88798506 8742 8692
9,1168576
2013 2014 2015 2016 2017 2018
Unsheltered Sheltered Total
-17%
+9%
-3%
% Change2013 to 2018
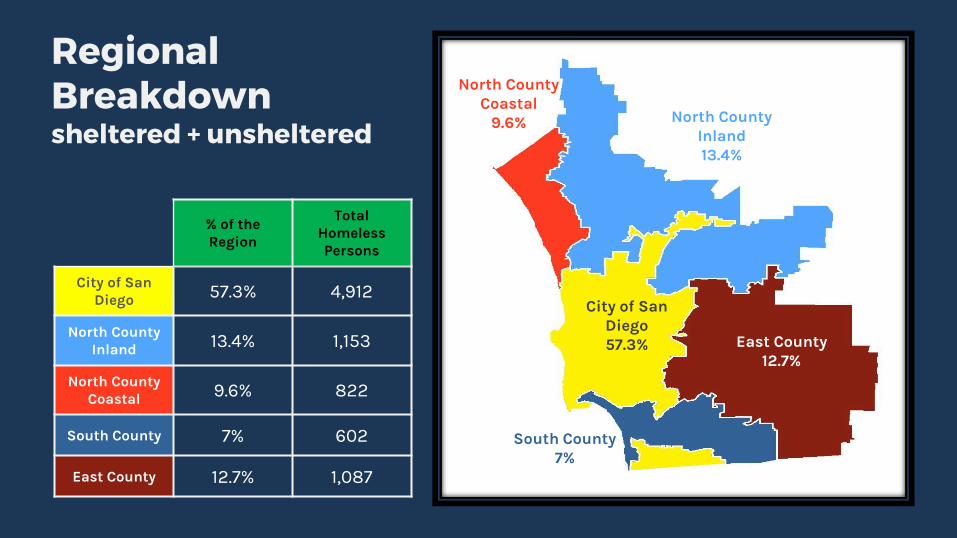
Regional Breakdown sheltered + unsheltered
North County Inland13.4%
East County12.7%
City of San Diego57.3%
South County7%
North County Coastal
9.6%
% of the Region
Total Homeless Persons
City of San Diego 57.3% 4,912
North County Inland 13.4% 1,153
North County Coastal 9.6% 822
South County 7% 602
East County 12.7% 1,087
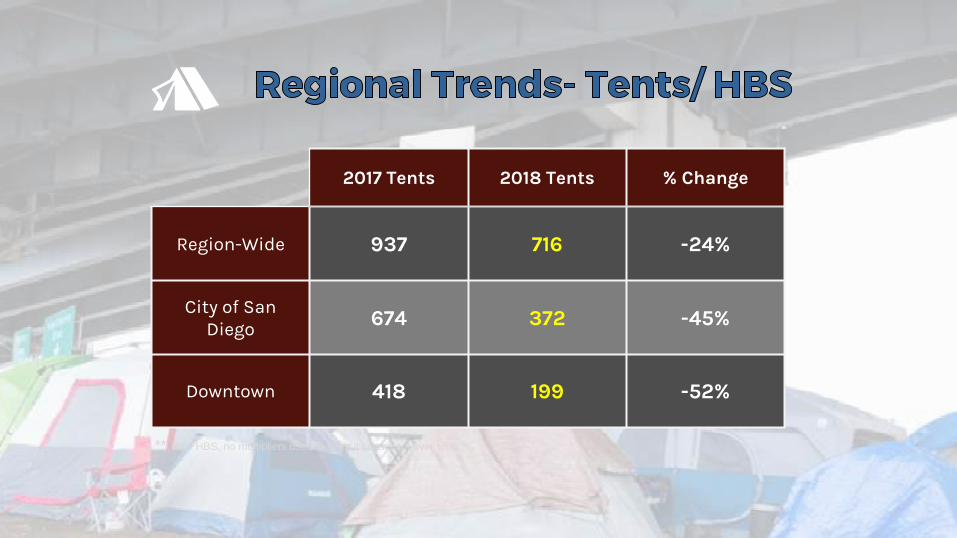
2017 Tents 2018 Tents % Change
Region-Wide 937 716 -24%
City of San Diego 674 372 -45%
Downtown 418 199 -52%
** Raw HBS, no multipliers used to keep it consistent over time
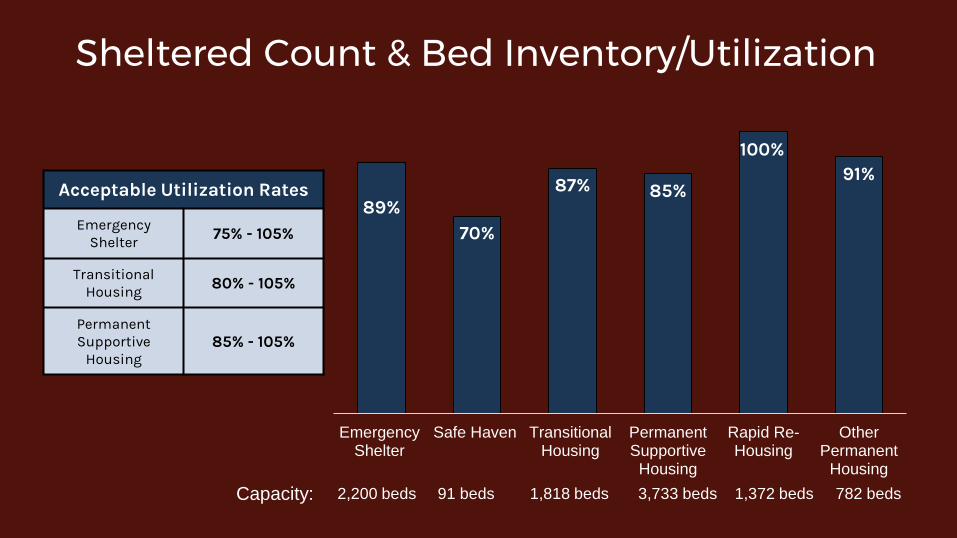
Sheltered Count & Bed Inventory/Utilization
Acceptable Utilization Rates
EmergencyShelter 75% - 105%
TransitionalHousing 80% - 105%
Permanent Supportive
Housing85% - 105%
89%70%
87% 85%
100%91%
EmergencyShelter
Safe Haven TransitionalHousing
PermanentSupportiveHousing
Rapid Re-Housing
OtherPermanent
Housing
2,200 beds 91 beds 1,818 beds 3,733 beds 1,372 beds 782 bedsCapacity:
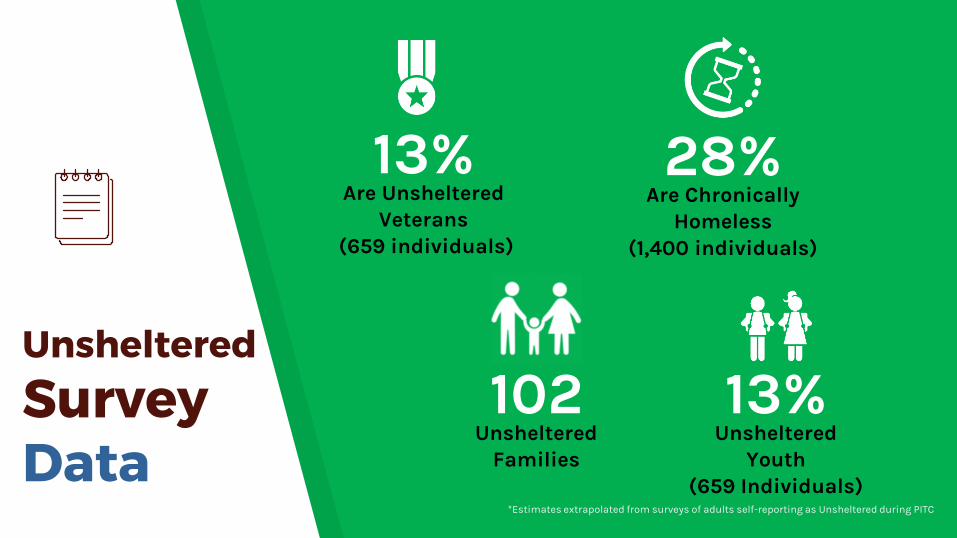
Unsheltered
SurveyData
13%Are Unsheltered
Veterans(659 individuals)
28%Are Chronically
Homeless(1,400 individuals)
102Unsheltered
Families
13%Unsheltered
Youth(659 Individuals)
*Estimates extrapolated from surveys of adults self-reporting as Unsheltered during PITC
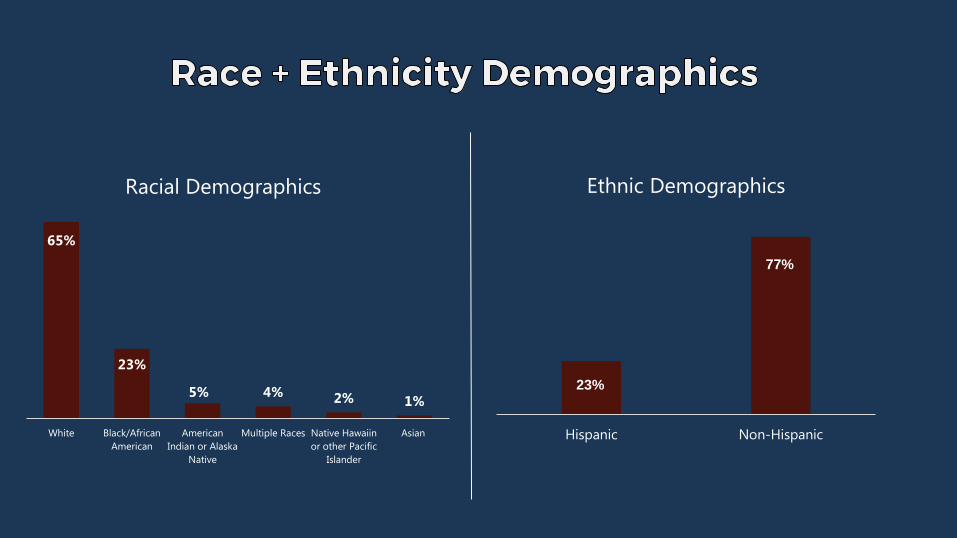
65%
23%
5% 4% 2% 1%
White Black/African
American
American
Indian or Alaska
Native
Multiple Races Native Hawaiin
or other Pacific
Islander
Asian
Racial Demographics
23%
77%
Hispanic Non-Hispanic
Ethnic Demographics
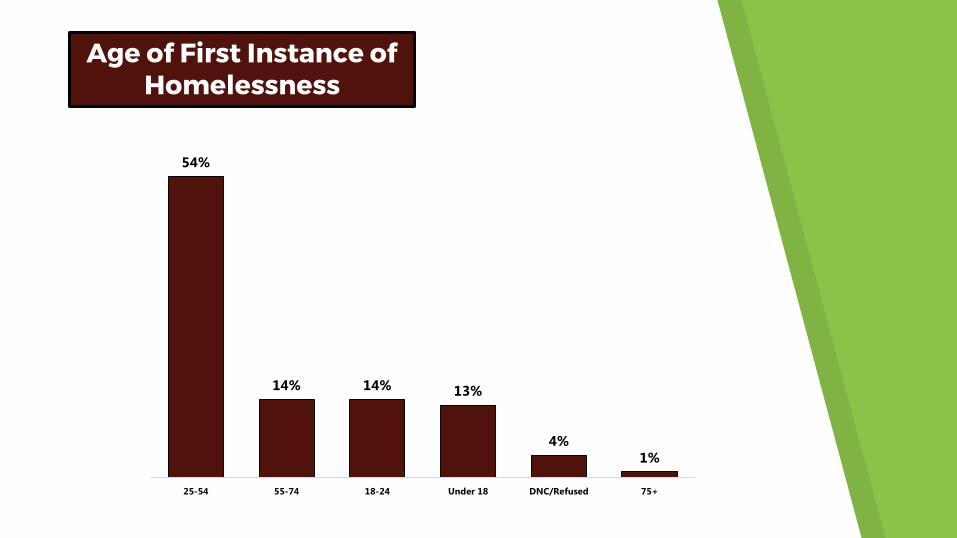
54%
14% 14% 13%
4%
1%
25-54 55-74 18-24 Under 18 DNC/Refused 75+
Age of First Instance of Homelessness
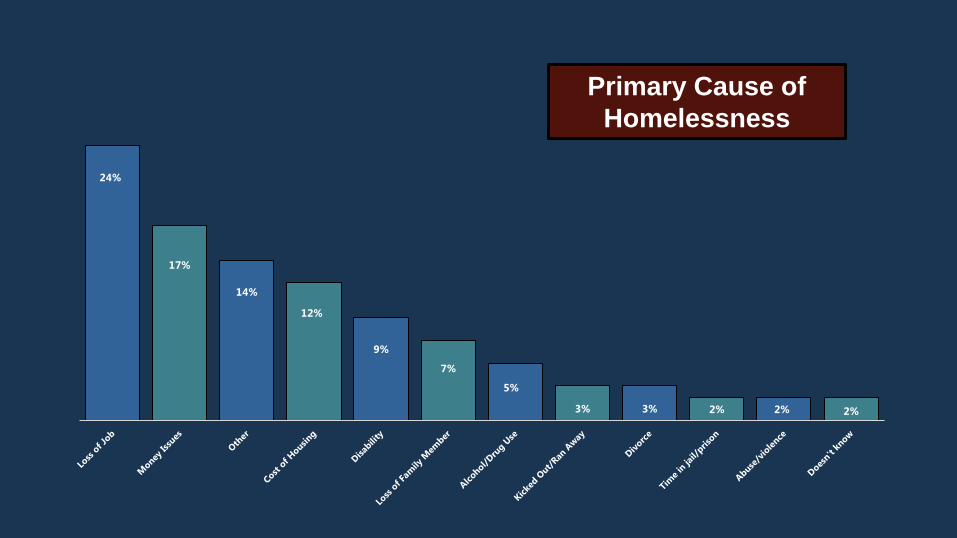
24%
17%
14%
12%
9%
7%
5%
3% 3% 2% 2% 2%
Primary Cause of
Homelessness
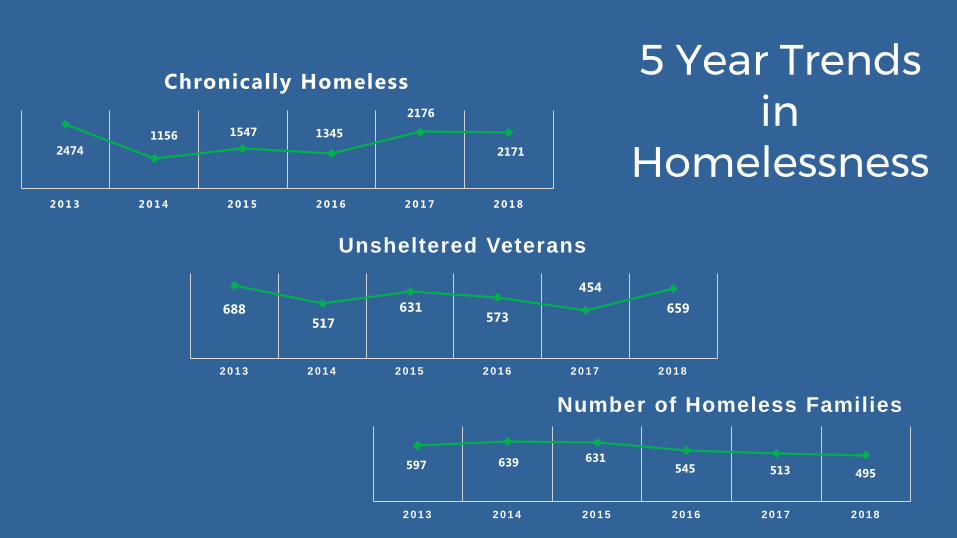
5 Year Trends in
Homelessness2474
1156 1547 1345
2176
2171
2 0 1 3 2 0 1 4 2 0 1 5 2 0 1 6 2 0 1 7 2 0 1 8
Chronically Homeless
688517
631573
454
659
2 0 1 3 2 0 1 4 2 0 1 5 2 0 1 6 2 0 1 7 2 0 1 8
Unsheltered Veterans
597 639 631545 513 495
2 0 1 3 2 0 1 4 2 0 1 5 2 0 1 6 2 0 1 7 2 0 1 8
Number of Homeless Families
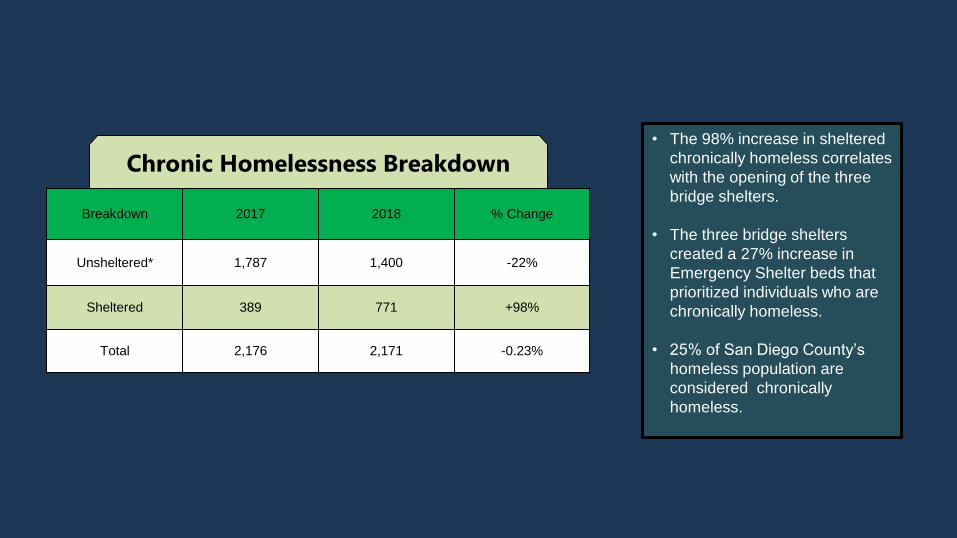
Breakdown 2017 2018 % Change
Unsheltered* 1,787 1,400 -22%
Sheltered 389 771 +98%
Total 2,176 2,171 -0.23%
Chronic Homelessness Breakdown• The 98% increase in sheltered
chronically homeless correlates
with the opening of the three
bridge shelters.
• The three bridge shelters
created a 27% increase in
Emergency Shelter beds that
prioritized individuals who are
chronically homeless.
• 25% of San Diego County’s
homeless population are
considered chronically
homeless.
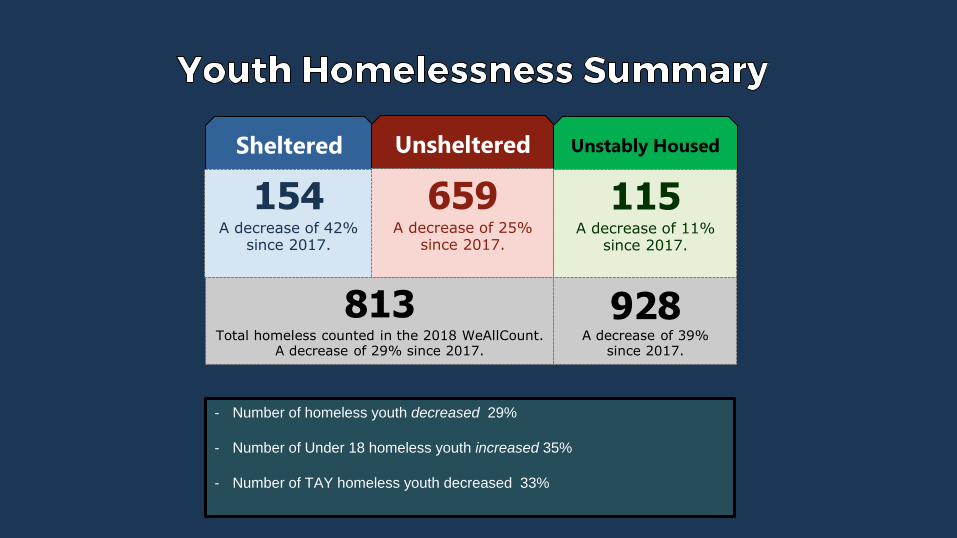
- Number of homeless youth decreased 29%
- Number of Under 18 homeless youth increased 35%
- Number of TAY homeless youth decreased 33%
Sheltered
154A decrease of 42%
since 2017.
Unsheltered Unstably Housed
659A decrease of 25%
since 2017.
115A decrease of 11%
since 2017.
813 Total homeless counted in the 2018 WeAllCount.
A decrease of 29% since 2017.
928 A decrease of 39%
since 2017.
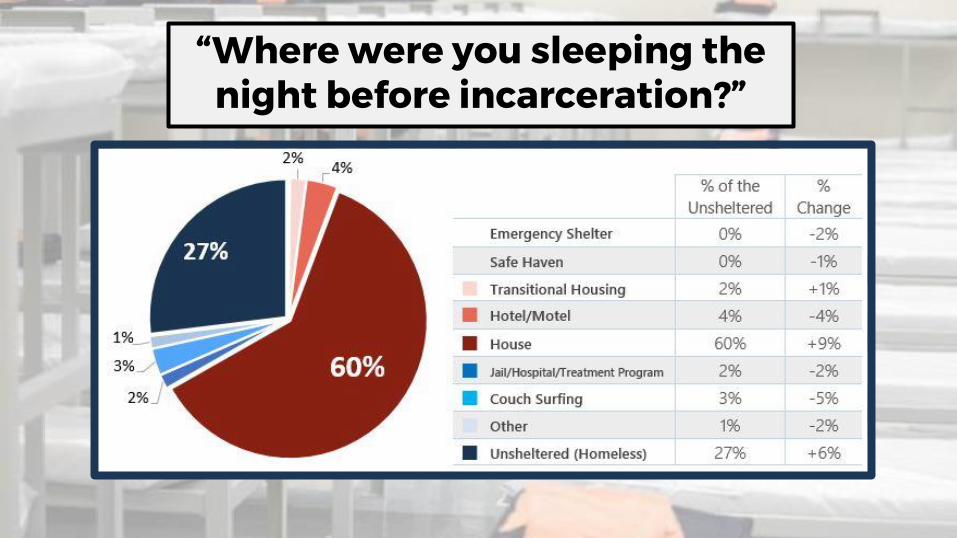
“Where were you sleeping the night before incarceration?”
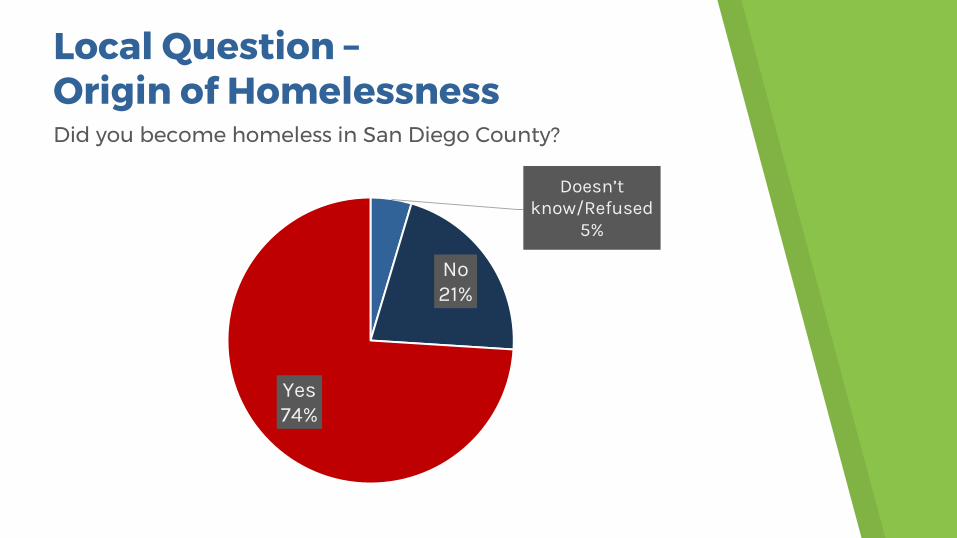
Local Question –Origin of HomelessnessDid you become homeless in San Diego County?
Doesn’t know/Refused
5%
No 21%
Yes 74%
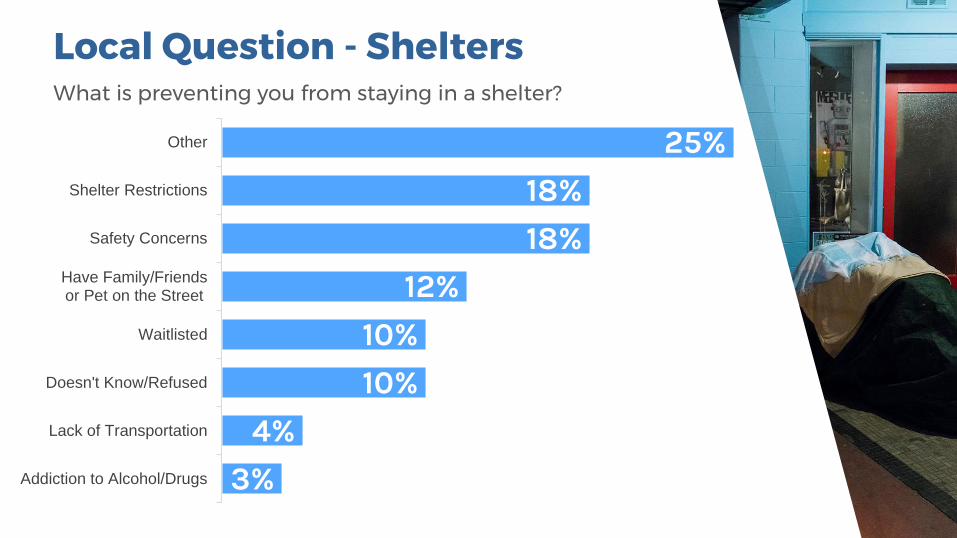
Local Question - SheltersWhat is preventing you from staying in a shelter?
3%
4%
10%
10%
12%
18%
18%
25%
Addiction to Alcohol/Drugs
Lack of Transportation
Doesn't Know/Refused
Waitlisted
Have Family/Friendsor Pet on the Street
Safety Concerns
Shelter Restrictions
Other
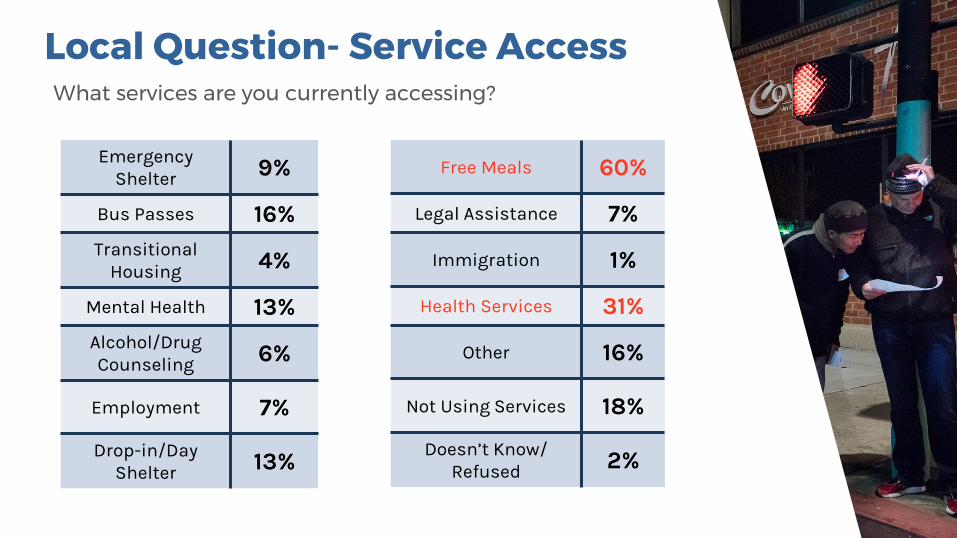
Local Question- Service AccessWhat services are you currently accessing?
Emergency Shelter 9%
Bus Passes 16%Transitional
Housing 4%
Mental Health 13%Alcohol/Drug Counseling 6%
Employment 7%
Drop-in/DayShelter 13%
Free Meals 60%
Legal Assistance 7%
Immigration 1%
Health Services 31%
Other 16%
Not Using Services 18%
Doesn’t Know/ Refused 2%
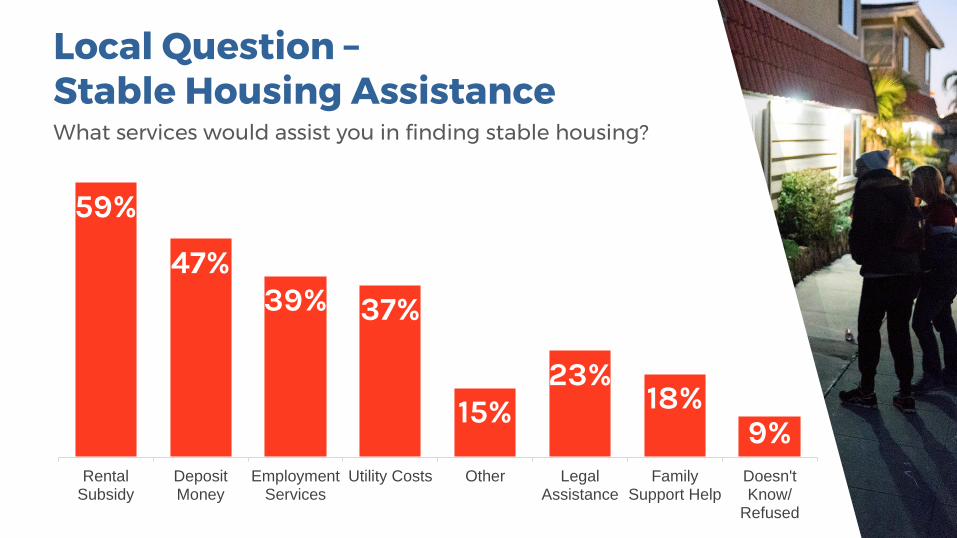
Local Question –Stable Housing AssistanceWhat services would assist you in finding stable housing?
59%
47%39% 37%
15%23%
18%9%
RentalSubsidy
DepositMoney
EmploymentServices
Utility Costs Other LegalAssistance
FamilySupport Help
Doesn'tKnow/
Refused
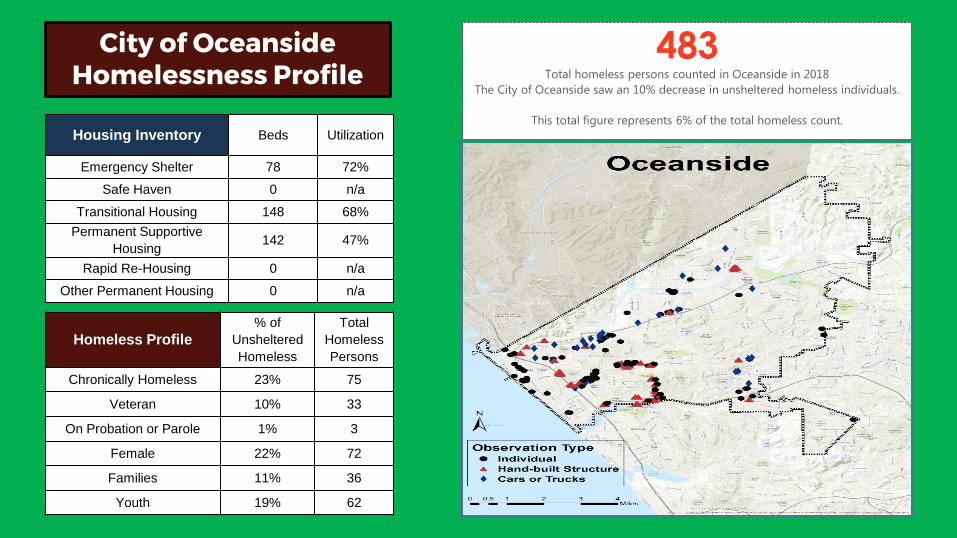
City of OceansideHomelessness Profile
483Total homeless persons counted in Oceanside in 2018
The City of Oceanside saw an 10% decrease in unsheltered homeless individuals.
This total figure represents 6% of the total homeless count.
Housing Inventory Beds Utilization
Emergency Shelter 78 72%
Safe Haven 0 n/a
Transitional Housing 148 68%
Permanent Supportive
Housing142 47%
Rapid Re-Housing 0 n/a
Other Permanent Housing 0 n/a
Homeless Profile
% of
Unsheltered
Homeless
Total
Homeless
Persons
Chronically Homeless 23% 75
Veteran 10% 33
On Probation or Parole 1% 3
Female 22% 72
Families 11% 36
Youth 19% 62
Moving Forward
Prioritize housing without barriers with a Housing First philosophy
Improve person centered model by engaging our clients through outreach
Increase technical assistance to providers in the region
Planned update of HMIS software
Support local government on best use of PITC data
To view the full WeAllCount report please access our website at RTFHSD.ORG.
SAVE THE DATE
January 25, 2019