Embed Size (px)
Citation preview

2020 Annual Forum
Innovative Practices to Mitigate "Shock" ClaimsMonday, November 9, 2020 | 3:45 PM – 4:45 PM ET
Chris SyversonMODERATOR
CEONevada Business Group on Health
Christine HaleVP, Clinical Consulting
Lockton Companies
Renzo Luzzatti President
US-Rx Care
Michael BaldzickiExecutive Vice
President, Growth & Strategy
AscellaHealth#NatAllForum
Complex Claims
Clinical Overview
Christine Hale, MD, MBA
Vice President, Clinical Consulting
Lockton Dunning Benefits

3LOCKTON COMPANIES |
What’s Really Driving Employer Health Plan Costs?
High-cost claimants
are made up of
cancers, kidney
failure, sepsis,
complex newborns
and hemophilia
Chronic conditions are the direct cause of less than a
quarter of medical and pharmacy claims over $50,000
(high-cost claims)
High-cost claims
are different
Health care
inflation is driven
by price increases,
not utilization, think
new medical and Rx
technologies.
Specialty Medicines,
especially injectables,
are the fastest-growing
driver of high-cost claimants
High-Cost Claimant
Predictive Analytics
can sometimes identify
these individuals and target
early interventions
of a population
drives
0.6%
35%of employers’
spend

4LOCKTON COMPANIES |
1. From 2016 to 2019, 27%
of people with claims
$1M and higher were
under age 2, 46% were
under age 20.
2. In 2019 members under
age 2 were 6% of total
stop loss claims however,
the were 26% of claims
$1M and over and 43%
of claims over $3M.
3. Infants are particularly
prevalent amongst the
highest cost claimants.
Members under age 2
represent 43% of
claimants over $3M.
Stop Loss $1M+
Claimant Risk Drivers

5LOCKTON COMPANIES |
Unusual pattern
of OON IONM claims
identified fraud – up
to $5M+ in restitution
in one carrier’s book
Case examples
Right Diagnosis
Right Treatment
Care SettingBilling and
Coding Accuracy
Claim ProcessingFraud, Waste
and Abuse
Patient admitted monthly
for blood transfusions
and off-label drug use.
Referred to Mayo
for diagnosis and treatment
Patient receiving
high-risk, high-cost
narcotic without diagnosis
of cancer switched to
appropriate medication
Patient treated
with high-cost
Soliris, site of
care moved to
home infusion
High paid charges for
Electrocardiogram;
billing error, so
engaged medical
administrator
Seven patients with
incorrectly
approved private
duty nursing due to
auto-adjudication system error
Est.
Savings
= $820K
Est.
Savings
= $300K
Est.
Savings
= $910K
Est.
Savings
= $240K
Est.
Savings
= $1M+
Est.
Savings
= $5M+

6LOCKTON COMPANIES |
Lockton as a
verb Podcast w/ Christine Hale
Your Logo Here
Leading Change
Innovative Practices to Mitigate “Shock” Claims

Your Logo Here

Your Logo Here
2019 Commercial Healthcare Costs
Source: Milliman

Your Logo Here
Coordination and Communication Across The Quality of Care Continuum

Your Logo Here
CLINICAL RIGOR AND COST-EFFECTIVE SOURCING
Proven, Efficient Cost-Control Solutions

Your Logo Here
$92,625 savings to the plan
Clinical Case Example
BD is a 35-year-old female diagnosed with severe
Stevens-Johnson syndrome and was ordered Acthar HP
80 units by injection every 24 hours for 3 days.
US-Rx spoke with MD and recommended methylprednisolone IV 250mg followed by oral Medrol
tapering dose. The cost of Acthar HP therapy would have
been $93,000. Methylprednisolone 250mg was $15.00/vial
and methylprednisolone IV infusions $110/day for a total
treatment cost of $375. The patient response was excellent.

Your Logo Here
Small Wins Can Quickly Add Up To Big Wins
Your Logo Here
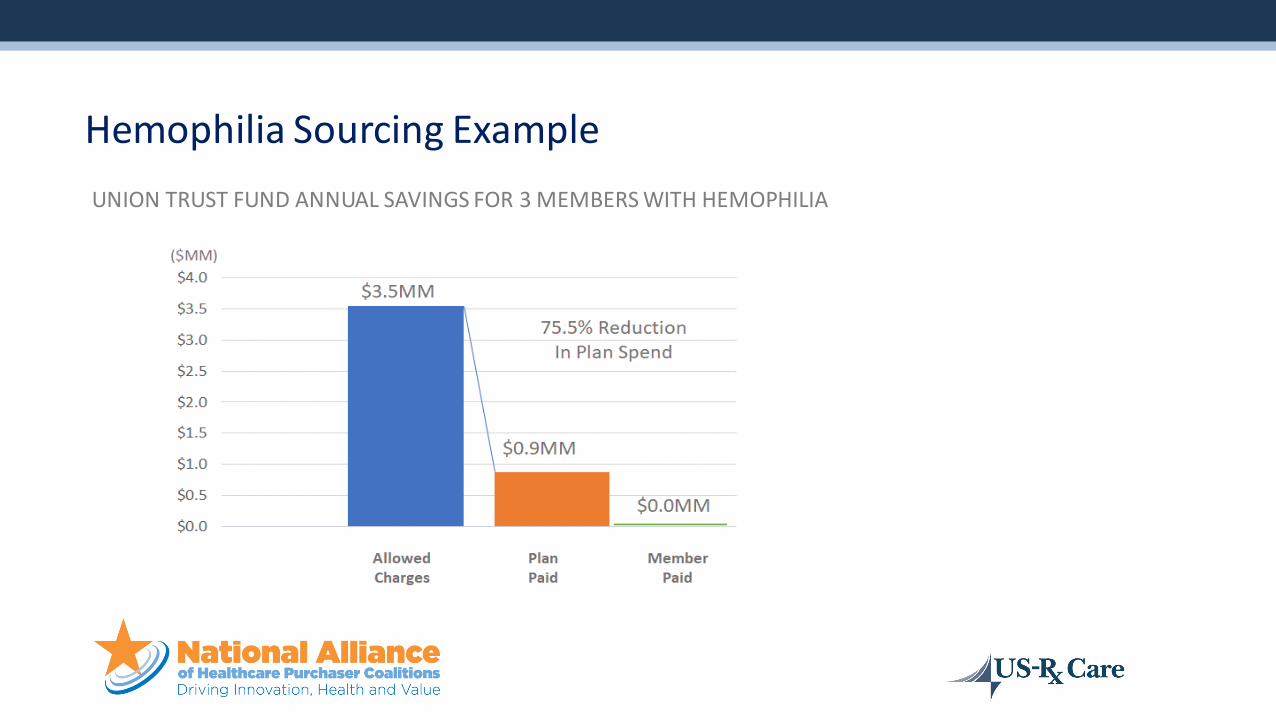
UNION TRUST FUND ANNUAL SAVINGS FOR 3 MEMBERS WITH HEMOPHILIA
Hemophilia Sourcing Example

Your Logo Here
ACTUAL PAID CLAIMS (2020)
Specialty Pharmacy vs. Retail Pharmacy Cost Comparison

Your Logo Here
Top Medication Targets for Low / No-Cost Dispensing ProgramsRECENT SELF FUNDED EMPLOYER EXAMPLE
Up to 40% of Total Plan Spend Eliminated

Your Logo Here
Savings by Reducing Cost Variations For J Code Meds

Your Logo Here
Savings by Reducing Cost Variations For J Code Meds

Your Logo Here
Pharmacy versus clinic sourcing

Your Logo Here
NO FIDUCIARY RESPONSIBILITY
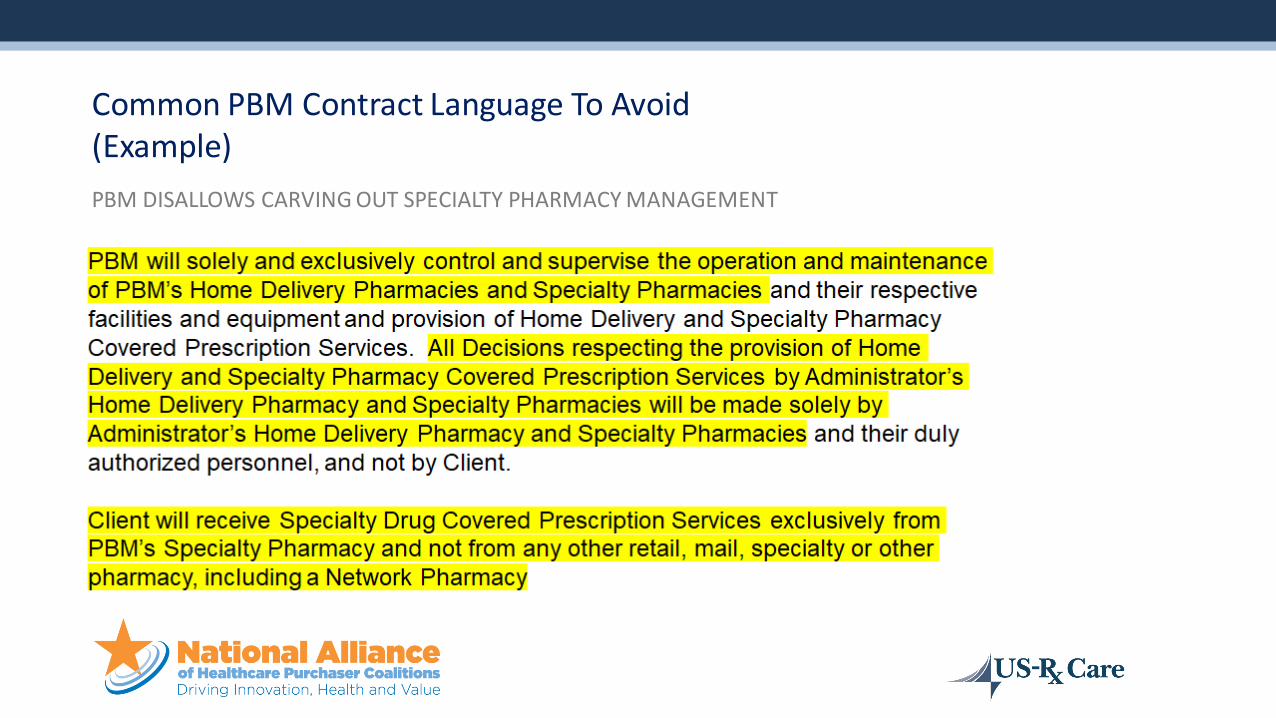
Common PBM Contract Language To Avoid(Example)
Your Logo Here
PBM DISALLOWS CARVING OUT SPECIALTY PHARMACY MANAGEMENT
Common PBM Contract Language To Avoid(Example)

Your Logo Here
Leading Change
Innovative Practices to Mitigate “Shock” Claims

CHALLENGES WE FACE
Distribution
models and
network
Coordination
across
stakeholders
Appropriate
data and
clinical
support
Cost to
payers
Cost to
patients

Specialty Pharmacy Spending in Billions (USD)
GROWTH OF SPECIALTY PHARMACY SPEND
$87.10
$192.20
$401.70
2012 2016 2020
121%Increase
The market is estimated to grow
from $336 billion in 2018 to around $500 billion by 2023
across developed markets
Sources:
PWC Health Research Institute. Medical Cost Trend: Behind the Numbers 2016
Diplomat Clinical Services. Specialty Drug Approvals, 2016 Highlights & 2017 Projections
PWC Health Research Institute. Medical Cost Trend: Behind the Numbers 2015
The 2018 – 2019 Economic Report on Pharmaceutical Wholesalers and Specialty Distributors, The Drug Channels
Institute
The Global Use of Medicine in 2019 and Outlook to 2023, IQVIA Institute
The Drug Channels Institute, Future Vision: The Top 10Drugs of 2020
Specialty drugs
will account for
47% of pharmacy
revenue by 2022109%Increase

Oncology
Infectious Disease
Neurology
Hematology
Endocrinology
Cardiovascular
Nephrology
Ophthalmology
Respiratory
Other
Source: IQVIA Institute, Mar2019
FDA First-in-Class
Existing Mechanism
Predictive Biomarker
No Predictive Biomarker
Biologics
Non-Biologics
3%3%
3%
12%
27%27%
20%
34%
3% 51%49%
7%
8%
12%
20%
73%
80%
66%
Orphan
Non-Orphan
New Actives Substances (NAS) Launched for the First Time in the United States in 2018
Therapy Area Orphan Designation Type of Molecule Predictive Biomarker FDA First-in-Class
N=59
NEW TREATMENT OPTIONS TO PATIENTS

TOP 20 INJECTABLES WITH MILLION-DOLLLAR+ CLAIMS
Cancer treatments make up most of the cost for the top 20 high-cost injectables overall. However, for the top 20 high-cost injectables associated with individuals with over $1 million in claims, medications used to treat blood disorders become dominant
2018 SUN LIFE STOP-LOSS RESEARCH REPORT
Frequency versus severity

SPECIALTY IS NOT JUST THE PHARMACY BENEFIT
Half of spend is under medical benefit which has limited visibility
36%of total drug spend
55%of total drug spend
Medical Benefit
Pharmacy Benefit
2015 2020
Data Source: Medicines Use and Spending in the U.S. IMS, April 2016. NHE, Artemetrix, CVS Health Internal Analysis, 2016.

50%
SpecialtyDrugs –MedicalBenefit
50%
Specialty Drugs –
Pharmacy Benefit
Drug Spend
Mail-Order
Pharmacy
Retail Pharmacy
Pharmacy Benefit Medical Benefit
Specialty
Pharmacy
Physician Office
Ambulatory Infusion
Centers
Home Infusion
Outpatient Hospital
Inpatient Hospital
DRUG SPEND SPLIT BETWEEN PHARMACY & MEDICAL
74%of Spend
Contribute to five conditions under the medical benefit

Medical Benefit Management Techniques:
Developing medical formularies
Increasing utilization management
Shifting medical benefit drugs to the
pharmacybenefit
Site-of-care management
NEW STRATEGIES TO MANAGE MEDICAL BENEFIT DRUGS

EMPLOYERS ARE AT A CROSSROAD
• Sponsors feel as though they are one specialty claim away from returning to fully insured
• It’s not the trend it’s whether you
are lucky or unlucky to absorb one of the patients
• Proactive responses required

TREND: EMPLOYERS MANAGING SPECIALTY
One popular solution: utilize a
Specialty Pharmacy Benefit Manager Carve-Out
Many employer groups
are now self-funded
Self-funded groups are
now >50% of heath
plans’ lines of business
50%
Employer groups are
demanding tighter
control and willing to
put up with abrasion

Why Specialty Is Ideal for Carve-Out
The Specialty Challenge
• Price, Price, Price
• Lack of cost transparency
• Overprescribing and
questions of value
• Vendor conflict of interest
• Payer owned PBM /
Specialty

Why Specialty Is Ideal for Car ve- Out
Small Cohort 1-2% of the population
High Cost $20k-$1 million/ year
ChronicYears to a lifetime for
many patients
Complex 1,000+ different diseases
Conflicted Vendor s
Easy for vendors to
maximize margin at the
expense of the pla n
sponsor
Areas of Opportunity
✓ Carve out Prior Authorization Management
from your PBM
▪ This is the single im portant step to
mitigate inappropriate use
✓ Implement a site of care program under
Medical
▪ Work with outside vendor
✓ Evaluate a Carve-Out Solution of
Specialty Drugs to maximize value
• Having the right PBM contract is key

Considerations for Optimal Specialty Distribution Channel & Services Assessment & Strategy Development
Specialty Distribution Channel & Services
Assessment
Patient Base
Reimbursement Mix
HIT / Data
Regulatory Factors
Sophistication of Comm. Ops
Product Type
Balance of Portfolio
Structure of Company
Manuf. Size & Capability Geographic Areas of
Influence
Channels & Capabilities

2020 Annual Forum
Innovative Practices to Mitigate "Shock" ClaimsMonday, November 9, 2020 | 3:45 PM – 4:45 PM ET
Chris SyversonMODERATOR
CEONevada Business Group on Health
Christine HaleVP, Clinical Consulting
Lockton Companies
Renzo Luzzatti President
US-Rx Care
Michael BaldzickiExecutive Vice
President, Growth & Strategy
AscellaHealth#NatAllForum