Embed Size (px)
Citation preview

2020 Annual Results Presentation
March 2021
2
Disclaimer
This presentation contains forward-looking statements that involve
risks and uncertainties. These statements are generally indicated by the
use of forward-looking terminology such as “believe”, “expect”,
“anticipate”, “estimate”, “plan”, “project”, “target”, “may”, “will” or other
similar words that express an indication of actions or results of actions
that may or are expected to occur in the future. You should not place
undue reliance on these forward-looking statements, which apply only
as of the date of this presentation. These forward-looking statements
are based on our own information and on information from other sources
we believe to be reliable. Our actual results may be materially less
favorable than those expressed or implied by these forward-looking
statements which could affect the market price of our shares.

3
Board and Management
Mr. CHAI Shouping
Chief Financial Officer
Secretary to the Board
Mr. HUANG Yongzhang
Director and President
Mr. TIAN Jinghui
Vice President
Mr. DAI Houliang
Chairman
Mr. DUAN Liangwei
Director and Ex-President
Mr. LI Luguang
Vice PresidentMr. YANG Jigang
Vice President

4
Agenda
2020 Financial Results Review1
2
3
4
2020 Operating Results and 2021 Outlook
Remarks by the Chairman
Q&A Session

2020 Financial Results Review
Mr. CHAI Shouping
Chief Financial Officer and
Secretary to the Board

6
*Basic EPS: RMB
Financial Highlights
RMB Million
2020 2019 Change
Revenue 1,933,836 2,516,810 -23.2%
Operating profit 75,937 121,762 -37.6%
Net Profit attributable to
owners of the Company19,006 45,682 -58.4%
Basic EPS* 0.10 0.25 -58.4%
Faced with the global pandemic of COVID-19, the plummeted international oil price, and the severe
contraction in oil and gas demand, the Company firmly seized the favorable opportunity of China as the
major economy taking the lead in realizing positive growth in the world, gave full play to the
complementary advantages of the oil and gas industry chain, promoted virus prevention and control,
resumed production, and vigorously implemented quality and efficiency improvement. The loss in the
first half of the year was reversed, the business performance improved quarter by quarter, and the
annual results was better than expected.

7
Capex
2020 Capex
Exploration & Production Natural Gas & Pipeline
Refining & Chemicals Marketing
Headquarters & Others
0.25%
75.71%
8.58%
8.85%
6.61%
Capex Comparison
RMB Million
83,954 74,761
212,822
171,732
2019 2020
1H Capex 2H Capex
296,776
246,493

8
Continued to Improve Quality and Efficiency
with Effective Cost Control
Average Realized Crude Oil PriceAverage Realized Natural Gas Price
USD/bbl USD/’000 cubic feet
60.96
40.33
2019 2020
5.39 4.80
2019 2020
Lifting Cost
USD/bbl
12.11 11.10
2019 2020
SG&A
RMB Million
68,596 64,345
2019 2020
Cash Processing Cost
RMB/ton
168.64 163.90
2019 2020

9
Healthy Financial Status with Stable Cash Flows
RMB Million
Total Assets
Debt-to-Capital Ratio
Debt-to-Asset Ratio
2,732,910 2,488,126
As of 31 Dec 2019 As of 31 Dec 2020
47.2% 45.1%
As of 31 Dec 2019 As of 31 Dec 2020
24.4%21.3%
As of 31 Dec 2019 As of 31 Dec 2020
359,610
39,924
318,575
70,199
Net Cash Flow fromOperating Activities
Free Cash Flow
Cash Flow
2019
2020
RMB Million

10
96,097
23,092
22,720
62,785
2019 Price Sales Volume Operating Expenses 2020
-158,510
Exploration and Production – Profits from Operations
During 2020, the Company imported 39.03 million tons of oil from Russia, Kazakhstan and other regions, decreased by 2.3%
compared to 39.95 million tons in 2019. Relevant sales revenue was RMB85.080 billion, decreased by 35.4% compared to
RMB131.723 billion in 2019. Purchasing cost was RMB86.388 billion, decreased by 34.0% compared to RMB130.941 billion in 2019.
RMB million
11
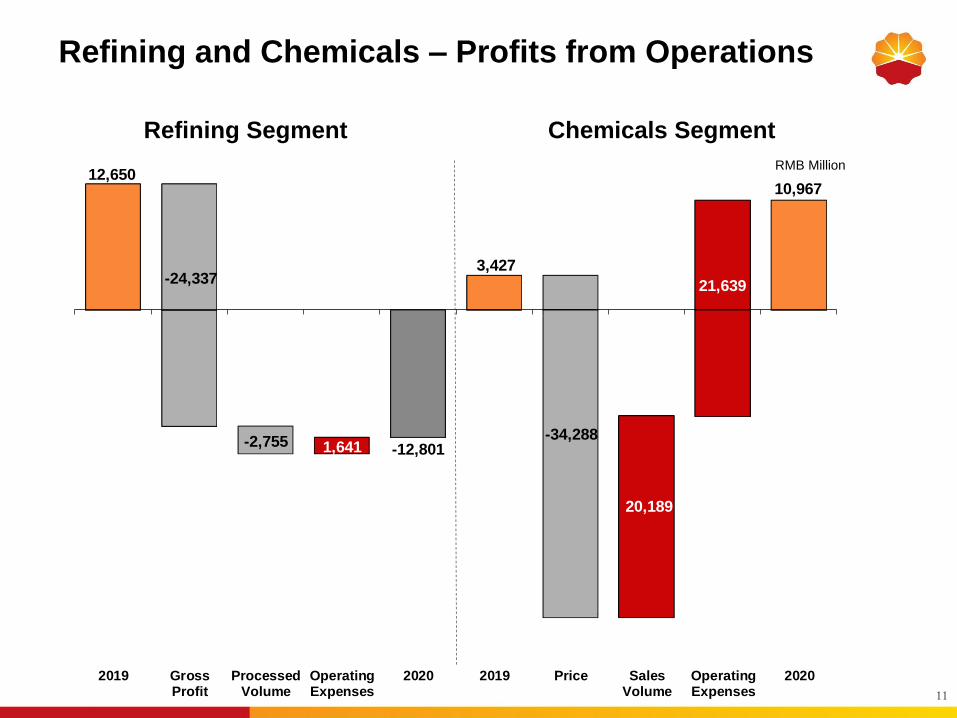
Refining and Chemicals – Profits from Operations
RMB Million
Refining Segment Chemicals Segment
12,650
-12,801
3,427
10,967
-2,755 1,641
21,639
2019 GrossProfit
ProcessedVolume
OperatingExpenses
2020 2019 Price SalesVolume
OperatingExpenses
2020
-24,337
-34,288
20,189

12
557
-2,878
-1,955
-3,996
1,755-2,906
2019 Gross Profit Sales Volume OperatingExpenses
InternationalTrade
2020
4,168
Marketing – Profits from Operations
RMB million

13
Natural Gas and Pipeline – Profits from Operations
RMB million
26,108
72,410
2019 Gross profit from sales ofnatural gas
Gross profit from pipelinetransmission
Gross profit from city gas Profit from pipelinerestructuring and others
2020
12,751 -11,002
-1,596
46,149

14
Shareholder Return
RMB
Dividend Comparison
After overall consideration of the Company's
operating performance, financial status, cash
flow, profit from pipeline restructuring, etc.
• Distribute a final dividend of RMB 0.08742
per share*
• Total final dividend of RMB16 billion
• 2020 full-year dividend of RMB 0.17484 per
share*
• Total dividend of RMB32 billion
* Applicable taxes included
0.07765 0.08742
0.066010.08742
2019 20201H 2H

2020 Operating Results
and 2021 Outlook
Mr. HUANG Yongzhang
Director and President

16
3.8
4.7
4.8
5.5
6.46.7
7.4
7.8
7.4
5.7
6.3
7.1
6.4
5.9
2007 2008 2009 2010 2011 2012 2013 2014 2015 2016 2017 2018 2019 2020
Average:71.07Average:66.09
Average:43.70
2020 Market Situation
Brent Crude Oil Spot Price Average Realized Crude Oil Price
USD/bbl
Average City Gate Natural Gas Price
USD/’000 cubic feet
Source: National Development and Reform Commission
China’s Natural Gas Consumption
’00 mcm
USD/bbl
Source: Bloomberg
224.2
231.0
266.3
277.4287.0
239.3
243.7
243.6
245.3
225.8
244.9
250.0 245.0
233.0
278.0
288.0296.5
230.5
258.0259.5
264.7
246.9
246.3
256.2
250.8
267.8
320.7
342.0
Average:72.36
Average:62.23
Average:42.20
65.3
87.6
53.9
72.9
104.2 103.7 100.4
94.8
48.4
38.0
50.6
68.3
61.0
40.3
2007 2008 2009 2010 2011 2012 2013 2014 2015 2016 2017 2018 2019 2020

17
Vigorously Implement Quality and Efficiency Improvement , Operating Results Better than Expected
Steady progress in overseas oil
and gas cooperation, with
healthy development maintained
Solid progress in refining and
chemicals’ structure adjustment.
Reduction of refining and
increase of chemicals achieved
positive results
Promoted natural gas sales and
enhanced efficiency,
materialized increase in both
volume and efficiency
Domestic exploration achieved
significant results, oil and gas
production reached a new level
Stabilized sales of oil products,
strengthened the steady operation
of the business chain
Operating Results better than expected

18
New progress
Discovery
Oil Gas
Luntan-1
Manshen-1Luchang-1
Southwest SichuanQisha-MaokouFormation
Pengtan-1
HuaqingChang-6 & Chang-8
GulongShale Oil
Linhua-1Xinghua-1
Jiaotan-1
Kangtan-1
Chai-9
Longdong Natural Gas
Kuche-BoziArea Jimusae
r Shale Oil
Domestic Exploration Achieved Significant Results, Oil and Gas Production Reached a New Level

19
Steady Progress in Overseas Oil and Gas Cooperation,
with Healthy Development Maintained
Abu Dhabi
Kazakhstan
Australia
Venezuela
Peru
Canada
Indonesia
Iraq Japan
Singapore • Risk exploration in Doseo
Basin of Chad
• Rolling exploration in
Aktobe Middle Block of
Kazakhstan
Chad
• Risk Exploration in Bilma Block of Niger
Niger
United Kingdom
FranceAzerbaijan
Oman

20
Exploration & Production - Key Indicators
2020 2019 Change
Crude Oil Output (MM bbl) 921.8 909.3 +1.4%
Domestic (MM bbl) 743.8 739.7 +0.6%
Overseas (MM bbl) 178.0 169.6 +4.9%
Marketable Natural Gas Output (bcf) 4,221.0 3,908.0 +8.0%
Domestic (bcf) 3,993.8 3,633.0 +9.9%
Overseas (bcf) 227.2 275.0 -17.4%
Oil & Gas Equivalent Output (MM boe) 1,625.5 1,560.8 +4.1%
Domestic (MM boe) 1,409.7 1,345.4 +4.8%
Overseas (MM boe) 215.8 215.4 +0.2%
Average Realized Price of Crude Oil (USD/bbl) 40.33 60.96 -33.8%
Average Realized Price of Natural Gas (USD/tcf) 4.80 5.39 -10.9%

21
25,756 28,853
2019 2020
1,228.4 1,177.5
2019 2020
‘000 tons
Production of Major Refined Oil Products
2020 2019 Change
Refined oil products 107,042 117,791 -9.1%
Gasoline 46,280 50,430 -8.2%
Kerosene 10,043 12,733 -21.1%
Diesel 50,719 54,628 -7.2%
2020 2019 Change
Ethylene 6,345 5,863 +8.2%
Synthetic resin 10,287 9,580 +7.4%
Synthetic fiber
materials and
polymers
1,278 1,309 -2.4%
Synthetic rubber 1,001 910 +10.0%
Urea 2,163 1,208 +79.1%
Production of Major Chemicals Products‘000 tons
Crude Processing VolumeMM bbl
Commercialization of Chemicals Products‘000 tons
Solid Progress in Refining and Chemicals’ Structure AdjustmentReduction of Refining and Increase of Chemicals Achieved Positive Results

22
53,546
8,696
56,753 49,188
8,331
48,377
Gasoline Kerosene Diesel
2019 2020
423 397
2019 2020
22,365 22,619
2019 2020
Stabilized the Sales of Oil Products
Strengthened the Steady Operation of the Business Chain
Sales Volume of Major Refined Oil Products
‘000 tons
Domestic Sales Volume of Refined Oil Products
‘000 tons
2020 2019 Change
Sales of Refined
Oil Products161,230 187,712 -14.1%
Gasoline 66,084 76,366 -13.5%
Kerosene 14,350 21,183 -32.3%
Diesel 80,796 90,163 -10.4%
Total Service Stations
Station
MM tons
International Trade

23
管道业务
259.1 248.7
2019 2020
171.4 172.6
2019 2020
Billion cubic meters
Sales of Natural Gas
Billion cubic meters
Domestic Sales of Natural Gas
• Optimized the resource portfolio and its flow, increased the development of high-end and
high-profitability markets, promoted online bidding transactions, operating profitability
significantly increased
• Orderly promoted the construction of key storage and transportation facilities such as
Tangshan and Jiangsu LNG terminals
Promoted Natural Gas Sales and Enhanced Efficiency
Materialized Increase in Both Volume and Efficiency
32.2 42.2
2019 2020
Sales Volume of Natural Gas to End-users
Billion cubic meters

24
Successfully Completed the Pipeline Restructuring Transaction
Gained Wide Support of Shareholders
Disposal of equites and assets*
Directly Affiliated
EntitiesPetroChina
Pipelines Co., Ltd.
Provincial
Network and other
Joint Ventures
The Initial Oil
and Gas
◼ The Company sold the equity of 12 joint venture companies including PetroChina Pipelines Co., Ltd., the assets of 8
subsidiaries of the Company under independent accounting including the Pipeline Branch, and the Initial Oil
and Gas, and obtained 29.9% equity of PipeChina and corresponding cash consideration
◼ The total assets sold in the Transaction amounted to RMB356.45 billion, the book value of net assets attributable to
the owners of the Company was RMB200.53 billion, profit before taxation of RMB46.95 billion and net profit after
taxation of RMB33.03 billion
Note:
* The Target Equity Assets include equities in certain branches, subsidiaries and associated companies of the Company
72.26% 100%
All Equity Holdings
(Ownership
percentage varies)100%
Equity interests and cash
consideration

25
Focused on Green and Low-Carbon Development
Sustainable Development Maintained Upward
The Health, Safety and Environment (HSE) Committee under the Board was upgraded as The Sustainable Development Committee
• Awarded by the Chinese government as the "National Poverty Alleviation Award -Organization Innovation Award"
• Domestic natural gas production accounted for 47.2% of total, proportion continued to increase
• Achieved zero infection in the workplace in 2020
• Awarded by the United Nations Global Compact as the "Enterprises for Best Practices in Achieving Sustainable Development Goals in 2020 (Eliminating Poverty and Promoting Prosperity)”
• Total greenhouse gas emissions decreased by 3.81% compared to 2019
Compared to 2015:• COD reduced by 17.35%• Ammonia nitrogen reduced by 28.90%• Sulfur dioxide reduced by 28.30%• Nitrogen oxides reduced by 36.76%

26
Outlook for 2021
Situation is still complicated
The global spread of COVID-19 pandemic led to a profound adjustment of world patterns and a more complicated geopolitical landscape
Surplus in domestic refined oil market intensified; Key players in domestic natural gas market further diversified, leading to increased market competition
Favorable conditions on development still exist
Global oil and gas demand gradually rebounded with economic recovery
China enters a new stage of development and its ultra-large-scale market advantages continue to release. The economy continues to improve, and the growth rate is expected to return to 6% or above, which will drive the continuous growth of domestic energy demand
China’s carbon peak and carbon neutral goals bring new opportunities for green and low-carbon transformation
China deepens the reform and openness, promotes domestic demand, improves business environment, and supports the real economy

27
Key Initiatives and Plans for 2021
1. Emphasize on high-efficiency exploration and profitable development, stabilize oil
production, speed up gas production and improve the overall efficiency of domestic
upstream business
2. Emphasize on structural adjustment and integrated coordination, and
improve the overall efficiency of refining, chemicals and marketing businesses
3. Emphasize on terminal market share, and promote the integrated development
of natural gas and new energy
4. Emphasize on risk control and structure optimization, foster the healthy
development of overseas business
5. Emphasize on the innovation strategy, continue
to improve independent innovation capabilities
6. Emphasize on accelerating the deployment of new energy,
and strive to promote ESG

28
2021 Operating Targets
2021
Target
2020
Achievement
Change
(%)
Output of crude oil
(mm bbl)923.5 921.8 +0.2%
Output of natural gas
(bcf)4,354.0 4,221.0 +3.2%
Oil &natural gas equivalent
output (mm boe)1,649.4 1,625.5 +1.5%
Processing volume of
crude oil (mm bbl)1,247.3 1,177.5 +5.9%
Capital Expenditure
(RMB billion)239.0 246.5 -3.0%

Mr. DAI Houliang
Chairman
Remarks by the Chairman

30
Important Strategic Opportunities
• Energy transformation towards green and low carbon
• The Chinese government puts forward the goal of “carbon peak” and “carbon neutrality”
• Global supply and demand of energy is changing rapidly
Innovation
Resources
Market
Internationalization
Green and Low-Carbon
Green Development and Energy Delivery
Facilitating the growth momentum of customers
and Empowering people to enjoy a better life
• Strengthen and optimize oil & gas business
• Actively expand non-fossil energy
• Accelerate the deployment of new energy, new materials and new business model
• Strive to build a new complementary and new multi-energy structure

31
Green and Low-Carbon Transition
Green
TransitionStrategic
ReplacementClean
AlternativeStage
2021-2025 2026-2035 2036-2050
• By around 2025,
endeavor to achieve
“carbon emissions peak”
• By 2035, endeavor to
achieve supply of green
and zero-carbon energy
exceeding self-consumed
fossil energy
• By around 2050,
endeavor to achieve
“Near-Zero” emissions,
Goal

32
Technological self-reliance and self-improvement
Improving the quality of oil and gas business development
Deepening reform and structural adjustment
Transforming towards green and low-carbon
Improving corporate governance
Prevention of risks
Strengthen talent
New Ambience in 2021

Media Relations
Tel: (852)2894-6231
Fax: (852)2576-1990
Email: [email protected]
Investor Relations
Tel: (852)2899-2010
Fax: (852)2899-2390
Email: [email protected]