Embed Size (px)
Citation preview

2020 VAESE The Alumni Relations Benchmarking Study Voluntary Alumni Engagement in Support of Education
Survey Conducted on behalf of: Alumni Access® A division of Access Development®
M15
551

VAESE • THE ALUMNI RELATIONS BENCHMARKING STUDY
This license permits remixing, repurposing and building upon this work, even for commercial purposes, providing proper attribution is given to: “Alumni Access®, VAESE Alumni Benchmarking Study.” Any new creation that references, or is derived, in whole or in part, from this work, must also be licensed using the identical terms, even if intended for commercial use. All other usage must contact: VAESE Study Permis-sions, 1012 W. Beardsley Place, Salt Lake City, Utah, USA, 84109, or call 866-714-7251.
Liability Limitations Disclaimer: The author, Alumni Access and Access Development have made every effort to collect and prepare this data with rigor and accuracy. However, the contents of this report are offered as is, with no warranties or representations either implied or inferred with regard to its accuracy or completeness. The author and/or publisher makes no claim of authority in regards to rendering legal advice, accounting advice, or any other advice associated with a licensed professional. If legal or profes-sional services are needed, please consult with a competent professional.
The VAESE is not affiliated with the VSE, (Voluntary Support of Education) survey or CASE (the Counsel for the Advancement and Support of Education.)
Author: Gary W. Toyn, Senior Researcher, Access Development
Cover and Interior Design: Sue Thurber
For more information, contact: Gary W. Toyn
[email protected] +1-866-714-7251
Voluntary Alumni Engagement in Support of Education (VAESE)
Creative Commons Attribution-ShareAlike (CC BY-SA)
© 2020 Alumni Access® Access Development® 1012 W. Beardsley Place, S.L.C., UT 84119
VAESE • THE ALUMNI RELATIONS BENCHMARKING STUDY
CONTENTSLetter from the Editor .......................................................................................................................................................1
About the 2020 VAESE Survey ........................................................................................................................................... 2
Included Cohorts: ............................................................................................................................................................ 3
ANALYSIS: The Risks of Integrating Alumni Relations and Development ................................................................................... 4
About Alumni Access: ..................................................................................................................................................... 31
GRAPHS AND ANALYSIS:Section 1: Institutional Demographics
1. Type of institutions participatingin this survey ...............................................................7
2. Independent/Inter-Dependent/Dependentwith Institution ............................................................7
3. Alumni Integration with Development/Fundraising ........... 84. Alumni Staffing as Measured
by FTE (Full Time Equivalent) .........................................95. Demographics: Trends in Alumni
Staffing Levels / Budgets ............................................. 106. Alumni Database Dashboard ....................................... 117. General Budgets Dashboard ........................................12
Section 2: Alumni Communication
8. Channels used to communication with alumni ............... 138. Channels used to communication
with alumni (continued) ..............................................149. Email Dashboard ...................................................... 1510. Obstacles preventing your
organization from sending more emails ........................ 1611. Tools used to measure alumni engagement ....................1712. Top goal for next year ................................................ 18
Section 3: Programming/Engagement
13. What would be the primary role of a new employee? ..... 1914. Percentage of your alumni listed as
“Do Not Solicit” or “Do Not Contact? ...........................2015. Most underutilized services, event or benefits .................2116. Rating benefits for their capacity
to attract and engage alumni ..................................... 2217. Level of investment in alumni benefits and services ........ 2318. How would alumni rate your benefits and services? ........ 2419. Roadblocks to increasing alumni engagement .............. 2520- Rating vendors for their return on investment ............... 2621. Rating programs for young alumni .............................. 2722. Soliciting New Graduates ........................................... 2823. Rating your organization’s technology solutions ............. 28
Section 4: Dues-paying Programs
24. Dues-paying or non-dues-paying membership model .... 2925. Growth in membership ..............................................3026. Number of active, dues-paying members .....................30

VAESE • THE ALUMNI RELATIONS BENCHMARKING STUDY 1
Dear Colleague,
The face of alumni relations continues to change at such a rapid pace, alumni professionals must adapt quickly or face obsolescence.
For more than a decade, alumni relations programs have dwindled in influence. Many have been stripped of their relevance because alumni no longer need a formal organization to connect themselves with each other. Yet despite the monumental shift in alumni atti-tudes and needs, many alumni organizations are still relying on the same old tools and programs. Without reliable data, these organiza-tions won’t know the degree to which they are behind their peers.
As alumni organizations adapt to the digital age, the vast majority of alumni offices have failed to keep up with technology. For example, many alumni professionals struggle to engage younger alumni, and this survey reveals that 91% of alumni professionals believe they do a “poor job” or they “need to do much more” to attract and engage young alumni.
Another handicap most alumni organizations face is a lack funding from administrators who are hesitant to invest in any tools necessary to incentivize alumni to engage. Our data reveals that successful alumni organizations offer some type of compelling alumni benefits, whether it be alumni career services, compelling digital content, consumer discounts, or a dedicated mobile app. Without offering value-added alumni benefits, your organization can’t compete against the endless stream of competing entities vying for the attention of your alumni.
The fight for relevance is not a losing battle, unless alumni profes-sionals acquiesce their primary role as cultivators and engagement experts. By giving in to the demands of over-aggressive fundraisers, (a phenomenon we address here in this study), alumni relations professionals will be complicit with these “relationships-be-damned” development directors who lack the patience for alumni cultivation.
This survey is provided as a tool for alumni relations professionals to make a case for greater investment in alumni relations. For many institutions, they need a change of culture because they are losing the battle to over-aggressive fundraisers. Unless alumni relations professionals are successful at reinstating the importance of alumni engagement and donor cultivation, alumni will opt-out permanently from contact with their alma mater. This will eventually prove to haunt institutions who chose to “eat their seed corn,” rather than plant it for the future.
I’m happy to discuss this report with alumni and advancement profes-sionals and answer specific questions about our data and analysis.
I invite you to connect with my professional network via LinkedIn, where you’ll find more information about this study, and you’ll also find related analysis that I publish on an ongoing basis.
Thank you for your interest.
Gary W. Toyn, Sr. Researcher, VAESE Alumni Relations Benchmarking Study [email protected] Linkedin.com/in/gary-toyn
LETTER FROM THE EDITOR

VAESE • THE ALUMNI RELATIONS BENCHMARKING STUDY 2
Survey background
This VAESE Alumni Benchmarking study is the third biennial study. We launched this study in 2015 primarily because very little research was available specifically for higher education alumni relations professionals. Nearly all the available research related to advance-ment and fundraising matters. We wanted to collect comparative data relating to things like alumni budgets, staffing levels, emails metrics, communication and engagement models, etc.
Our goal was to provide reliable data and analysis to those who participated in the study. Our last study has been viewed, downloaded or shared by more than ten thousand alumni professionals and board members. It has been cited in countless articles, research and presen-tations, and fills a need for many alumni relations programs.
This study is funded solely by Access Development, the parent company of Alumni Access, a value-added alumni benefit consisting of consumer retail, dining and travel discounts. Alumni Access uses this data to identify trends within the industry, and to better under-stand the issues facing our many clients.
Methodology
The survey was conducted by voice interview and online survey instrument conducted November 1, 2019 - January 15, 2020. A panel of alumni professionals collaborated to create the survey questions, aiming to ask the questions that are most relevant to them as they conduct the day to day tasks related to attracting, serving and engaging their alumni.
When compiling these results, we’ve rounded to the nearest full percentage. In some cases, percentages may not add up to 100. A total of 577 responses were received. All institutions of higher educa-tion were eligible, providing they have at least a one-half FTE dedicated to alumni relations. Overall, the margin of error is 3.67% +/-.
Participating institutions hail from four continents and sixteen countries. However, 91% are from the United States, with 86% representing private and public institutions offering two and four-year post-secondary undergraduate degrees. We saw 9% of respondents from outside the USA.
The most commonly used statistics involves the calculation of the average, or simple mean. In limited cases we provide a median, simply because the range of data is so varied, that providing the median is more relevant.
ABOUT THE 2020 VAESE SURVEY

VAESE • THE ALUMNI RELATIONS BENCHMARKING STUDY 3
In addition to offering the overall survey results, we have segmented the data into five pertinent cohorts. They include:
1: Type of Institution: USA Private, USA Public, Non-USA:
This segment identifies the type of institution, whether it be a private or non-government owned/funded institution; a publicly owned/funded institution; or any other institution of higher education outside the USA. This latter group accounts for roughly 9% of respondent institutions.
Type of Institution
USA Private USA Public Non-USA
2: Power 5 Conference vs. Non Power 5 Division 1 Conferences
The Power 5 Conference Schools represent 65 institutions that comprise the ACC, Big 10, Big 12, SEC and Pac-12 NCAA conferences. These organizations are unique because of their size, budgets, reach, and exposure. They are so different in comparison to most other alumni organizations, that data accuracy suggests we separate their data from all other organizations. Their responses are often statistical outliers for the general population of alumni organizations, and can skew overall results in ways that may be deceiving or confusing. The second category adjacent to the Power 5, includes all other NCAA Division 1 schools not affiliated with the Power 5 conferences.
Power 5 vs. Non Power 5 Division 1 Conference Schools
P-5 Division 1 Non P-5
3: Size of Alumni Programming Budget
In an effort to provide relevant data to alumni organizations of all sizes, we’ve also included segmented data based on programming budgets for the following cohorts: Under $50,000, $50,000 - $100,000; $100,000 - $200,000; $200,000 - $500,000, and above $500,000
Size of Alumni Programming Budget (Excluding Salaries)
<$50K $50K-$100K
$100K-$200K
$200K-$500K $500K+
4: Integrated Alumni/Development Organizations vs. Non-Inte-grated Organizations:
This segment identifies institutions that have integrated their alumni & development organizations, and those that have not.
Alumni Integrated vs. Not Integrated with Fundraising
Fully integrated Not integrated
5: Dues-Paying Organizations vs. Non Dues-Paying:
This cohort identifies institutions that offer benefits for alumni paying a membership fee, verses non dues-paying model in which alumni have equal access to alumni benefits/programming. For the purpose of this specific comparison, we’ve excluded the very small percentage of institutions offering a tiered benefits model for both donors and alumni.
Dues vs. Non-Dues
Dues Non-Dues
INCLUDED COHORTS:
VAESE • THE ALUMNI RELATIONS BENCHMARKING STUDY 4
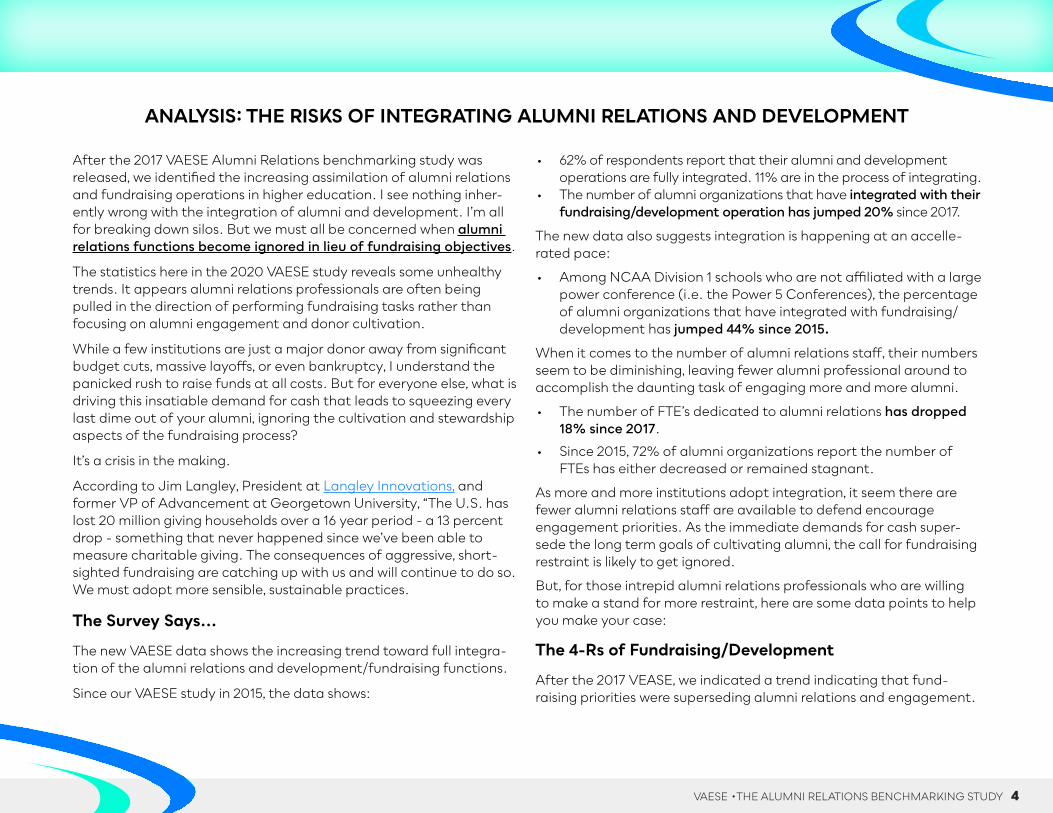
After the 2017 VAESE Alumni Relations benchmarking study was released, we identified the increasing assimilation of alumni relations and fundraising operations in higher education. I see nothing inher-ently wrong with the integration of alumni and development. I’m all for breaking down silos. But we must all be concerned when alumni relations functions become ignored in lieu of fundraising objectives.
The statistics here in the 2020 VAESE study reveals some unhealthy trends. It appears alumni relations professionals are often being pulled in the direction of performing fundraising tasks rather than focusing on alumni engagement and donor cultivation.
While a few institutions are just a major donor away from significant budget cuts, massive layoffs, or even bankruptcy, I understand the panicked rush to raise funds at all costs. But for everyone else, what is driving this insatiable demand for cash that leads to squeezing every last dime out of your alumni, ignoring the cultivation and stewardship aspects of the fundraising process?
It’s a crisis in the making.
According to Jim Langley, President at Langley Innovations, and former VP of Advancement at Georgetown University, “The U.S. has lost 20 million giving households over a 16 year period - a 13 percent drop - something that never happened since we’ve been able to measure charitable giving. The consequences of aggressive, short-sighted fundraising are catching up with us and will continue to do so. We must adopt more sensible, sustainable practices.
The Survey Says...
The new VAESE data shows the increasing trend toward full integra-tion of the alumni relations and development/fundraising functions.
Since our VAESE study in 2015, the data shows:
• 62% of respondents report that their alumni and developmentoperations are fully integrated. 11% are in the process of integrating.
• The number of alumni organizations that have integrated with theirfundraising/development operation has jumped 20% since 2017.
The new data also suggests integration is happening at an accelle-rated pace:
• Among NCAA Division 1 schools who are not affiliated with a largepower conference (i.e. the Power 5 Conferences), the percentageof alumni organizations that have integrated with fundraising/development has jumped 44% since 2015.
When it comes to the number of alumni relations staff, their numbers seem to be diminishing, leaving fewer alumni professional around to accomplish the daunting task of engaging more and more alumni.
• The number of FTE’s dedicated to alumni relations has dropped18% since 2017.
• Since 2015, 72% of alumni organizations report the number ofFTEs has either decreased or remained stagnant.
As more and more institutions adopt integration, it seem there are fewer alumni relations staff are available to defend encourage engagement priorities. As the immediate demands for cash super-sede the long term goals of cultivating alumni, the call for fundraising restraint is likely to get ignored.
But, for those intrepid alumni relations professionals who are willing to make a stand for more restraint, here are some data points to help you make your case:
The 4-Rs of Fundraising/Development
After the 2017 VEASE, we indicated a trend indicating that fund-raising priorities were superseding alumni relations and engagement.
ANALYSIS: THE RISKS OF INTEGRATING ALUMNI RELATIONS AND DEVELOPMENT
VAESE • THE ALUMNI RELATIONS BENCHMARKING STUDY 5
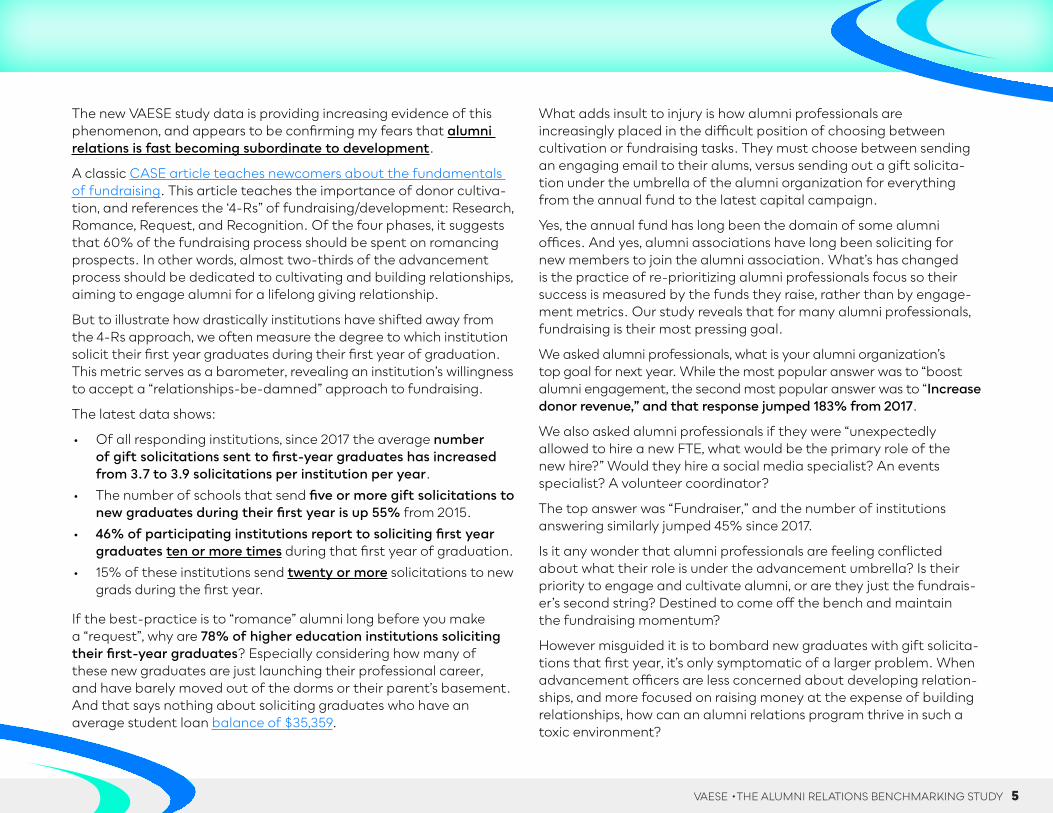
The new VAESE study data is providing increasing evidence of this phenomenon, and appears to be confirming my fears that alumni relations is fast becoming subordinate to development.
A classic CASE article teaches newcomers about the fundamentals of fundraising. This article teaches the importance of donor cultiva-tion, and references the ‘4-Rs” of fundraising/development: Research, Romance, Request, and Recognition. Of the four phases, it suggests that 60% of the fundraising process should be spent on romancing prospects. In other words, almost two-thirds of the advancement process should be dedicated to cultivating and building relationships, aiming to engage alumni for a lifelong giving relationship.
But to illustrate how drastically institutions have shifted away from the 4-Rs approach, we often measure the degree to which institution solicit their first year graduates during their first year of graduation. This metric serves as a barometer, revealing an institution’s willingness to accept a “relationships-be-damned” approach to fundraising.
The latest data shows:
• Of all responding institutions, since 2017 the average numberof gift solicitations sent to first-year graduates has increasedfrom 3.7 to 3.9 solicitations per institution per year.
• The number of schools that send five or more gift solicitations tonew graduates during their first year is up 55% from 2015.
• 46% of participating institutions report to soliciting first yeargraduates ten or more times during that first year of graduation.
• 15% of these institutions send twenty or more solicitations to newgrads during the first year.
If the best-practice is to “romance” alumni long before you make a “request”, why are 78% of higher education institutions soliciting their first-year graduates? Especially considering how many of these new graduates are just launching their professional career, and have barely moved out of the dorms or their parent’s basement. And that says nothing about soliciting graduates who have an average student loan balance of $35,359.
What adds insult to injury is how alumni professionals are increasingly placed in the difficult position of choosing between cultivation or fundraising tasks. They must choose between sending an engaging email to their alums, versus sending out a gift solicita-tion under the umbrella of the alumni organization for everything from the annual fund to the latest capital campaign.
Yes, the annual fund has long been the domain of some alumni offices. And yes, alumni associations have long been soliciting for new members to join the alumni association. What’s has changed is the practice of re-prioritizing alumni professionals focus so their success is measured by the funds they raise, rather than by engage-ment metrics. Our study reveals that for many alumni professionals, fundraising is their most pressing goal.
We asked alumni professionals, what is your alumni organization’s top goal for next year. While the most popular answer was to “boost alumni engagement, the second most popular answer was to “Increase donor revenue,” and that response jumped 183% from 2017.
We also asked alumni professionals if they were “unexpectedly allowed to hire a new FTE, what would be the primary role of the new hire?” Would they hire a social media specialist? An events specialist? A volunteer coordinator?
The top answer was “Fundraiser,” and the number of institutions answering similarly jumped 45% since 2017.
Is it any wonder that alumni professionals are feeling conflicted about what their role is under the advancement umbrella? Is their priority to engage and cultivate alumni, or are they just the fundrais-er’s second string? Destined to come off the bench and maintain the fundraising momentum?
However misguided it is to bombard new graduates with gift solicita-tions that first year, it’s only symptomatic of a larger problem. When advancement officers are less concerned about developing relation-ships, and more focused on raising money at the expense of building relationships, how can an alumni relations program thrive in such a toxic environment?
VAESE • THE ALUMNI RELATIONS BENCHMARKING STUDY 6
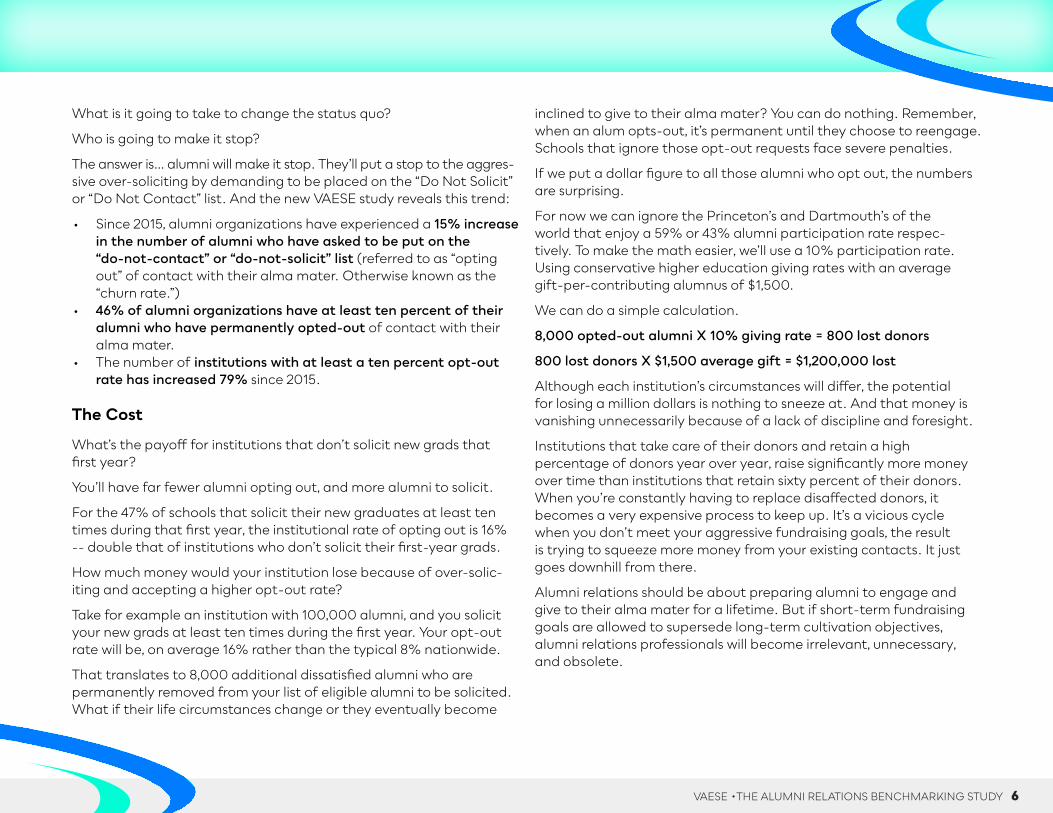
What is it going to take to change the status quo?
Who is going to make it stop?
The answer is… alumni will make it stop. They’ll put a stop to the aggres- sive over-soliciting by demanding to be placed on the “Do Not Solicit” or “Do Not Contact” list. And the new VAESE study reveals this trend:
• Since 2015, alumni organizations have experienced a 15% increasein the number of alumni who have asked to be put on the“do-not-contact” or “do-not-solicit” list (referred to as “optingout” of contact with their alma mater. Otherwise known as the“churn rate.”)
• 46% of alumni organizations have at least ten percent of theiralumni who have permanently opted-out of contact with theiralma mater.
• The number of institutions with at least a ten percent opt-outrate has increased 79% since 2015.
The Cost
What’s the payoff for institutions that don’t solicit new grads that first year?
You’ll have far fewer alumni opting out, and more alumni to solicit.
For the 47% of schools that solicit their new graduates at least ten times during that first year, the institutional rate of opting out is 16% -- double that of institutions who don’t solicit their first-year grads.
How much money would your institution lose because of over-solic-iting and accepting a higher opt-out rate?
Take for example an institution with 100,000 alumni, and you solicit your new grads at least ten times during the first year. Your opt-out rate will be, on average 16% rather than the typical 8% nationwide.
That translates to 8,000 additional dissatisfied alumni who are permanently removed from your list of eligible alumni to be solicited. What if their life circumstances change or they eventually become
inclined to give to their alma mater? You can do nothing. Remember, when an alum opts-out, it’s permanent until they choose to reengage. Schools that ignore those opt-out requests face severe penalties.
If we put a dollar figure to all those alumni who opt out, the numbers are surprising.
For now we can ignore the Princeton’s and Dartmouth’s of the world that enjoy a 59% or 43% alumni participation rate respec-tively. To make the math easier, we’ll use a 10% participation rate. Using conservative higher education giving rates with an average gift-per-contributing alumnus of $1,500.
We can do a simple calculation.
8,000 opted-out alumni X 10% giving rate = 800 lost donors
800 lost donors X $1,500 average gift = $1,200,000 lost
Although each institution’s circumstances will differ, the potential for losing a million dollars is nothing to sneeze at. And that money is vanishing unnecessarily because of a lack of discipline and foresight.
Institutions that take care of their donors and retain a high percentage of donors year over year, raise significantly more money over time than institutions that retain sixty percent of their donors. When you’re constantly having to replace disaffected donors, it becomes a very expensive process to keep up. It’s a vicious cycle when you don’t meet your aggressive fundraising goals, the result is trying to squeeze more money from your existing contacts. It just goes downhill from there.
Alumni relations should be about preparing alumni to engage and give to their alma mater for a lifetime. But if short-term fundraising goals are allowed to supersede long-term cultivation objectives, alumni relations professionals will become irrelevant, unnecessary, and obsolete.

7 | 2020 VAESE • The Alumni Relations Benchmarking Study
1. Type of institutions participatingin this survey
This study, more than in previous years, shows greater participation from institutions outside the U.S. Still 91% of participating institutions reside in the USA.
SECTION 1: INSTITUTIONAL DEMOGRAPHICS
2. Independent/Inter-Dependent/Dependent with Institution
Q: How would you describe your alumni organization’s connection with your institution/school?
Type of InstitutionPower 5 vs. Non
Power 5 Division 1 Conference Schools
Size of Alumni Programming Budget (Excluding Salaries)
Alumni Integrated vs. Not Integrated with
Fundraising
Dues vs.Non Dues
n=577 Overall 2020
Overall 2017
% differ-ence
USA Private
USA Public
Non- USA P-5 Division 1
Non-P-5 <$50K $50K- $100K
$100K- $200K
200K-$300K $500K+ Fully
IntegratedNot
Integrated Dues Non-Dues
Autonomous / Independent 9.7% 10.1% -4% 4% 14% 15% 35% 4% 7% 14% 7% 5% 26% 6% 17% 24% 6%
Semi-autonomous / Inter-dependent 35.3% 40.8% -14% 19% 49% 33% 37% 47% 27% 25% 46% 41% 35% 30% 42% 53% 26%
Not autonomous / Dependent 55% 49% 12% 76% 36% 52% 28% 49% 66% 60% 46% 54% 39% 63% 42% 24% 68%
It seems alumni organization are becoming less independent, and growing strong ties with their institution. The number of non-autono-mous/dependent institutions is up 12% from 2015.
Private/Independently funded school (K-12) NOT
in the USA
< 1%
Higher Education Institution NOT in the USA
8%
Private/Independently funded school (K-12) in the USA
< 1%Private/Independently funded College/University in the USA
43%
Two-year community college/junior
college in the USA
5%
For-profit college/university in the USA
< 1%
Publicly funded (majority or in-part) college/
university in the USA
42%
VAESE • THE ALUMNI RELATIONS BENCHMARKING STUDY 8
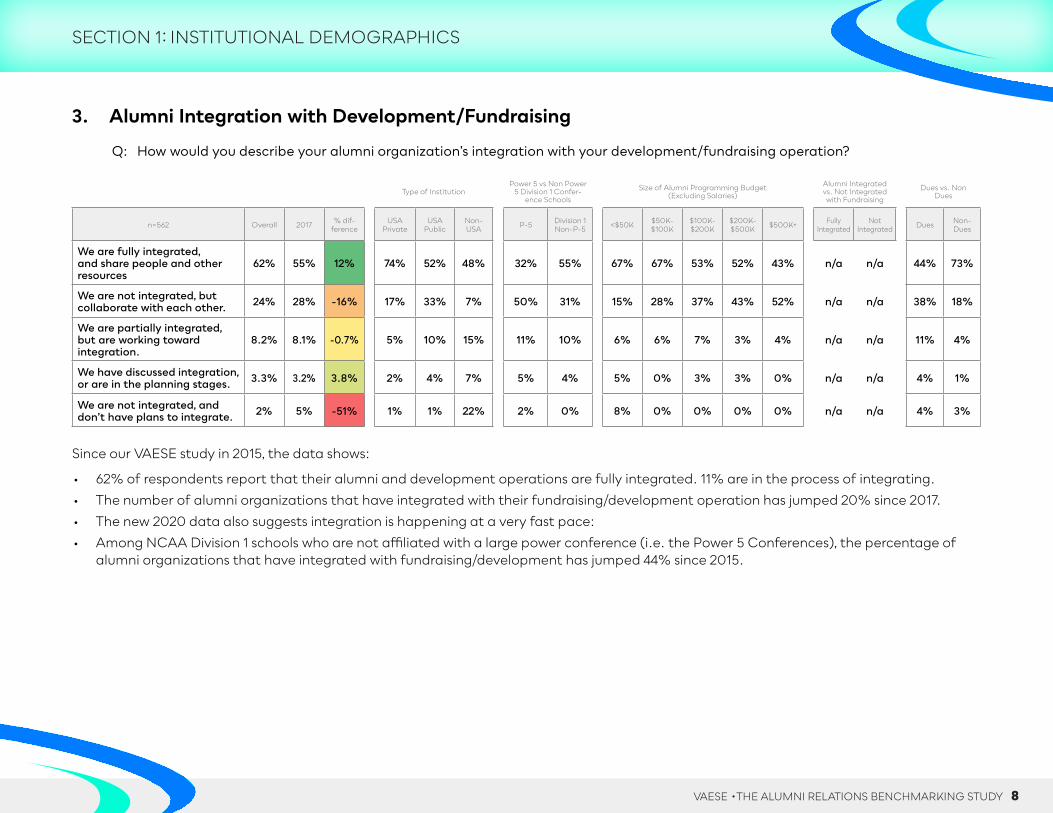
3. Alumni Integration with Development/Fundraising
Q: How would you describe your alumni organization’s integration with your development/fundraising operation?
Type of InstitutionPower 5 vs Non Power
5 Division 1 Confer-ence Schools
Size of Alumni Programming Budget (Excluding Salaries)
Alumni Integrated vs. Not Integrated with Fundraising
Dues vs. Non Dues
n=562 Overall 2017 % dif-ference
USA Private
USA Public
Non-USA P-5 Division 1
Non-P-5 <$50K $50K- $100K
$100K- $200K
$200K- $500K $500K+ Fully
IntegratedNot
Integrated Dues Non-Dues
We are fully integrated, and share people and other resources
62% 55% 12% 74% 52% 48% 32% 55% 67% 67% 53% 52% 43% n/a n/a 44% 73%
We are not integrated, but collaborate with each other. 24% 28% -16% 17% 33% 7% 50% 31% 15% 28% 37% 43% 52% n/a n/a 38% 18%
We are partially integrated, but are working toward integration.
8.2% 8.1% -0.7% 5% 10% 15% 11% 10% 6% 6% 7% 3% 4% n/a n/a 11% 4%
We have discussed integration, or are in the planning stages. 3.3% 3.2% 3.8% 2% 4% 7% 5% 4% 5% 0% 3% 3% 0% n/a n/a 4% 1%
We are not integrated, and don’t have plans to integrate. 2% 5% -51% 1% 1% 22% 2% 0% 8% 0% 0% 0% 0% n/a n/a 4% 3%
Since our VAESE study in 2015, the data shows:
• 62% of respondents report that their alumni and development operations are fully integrated. 11% are in the process of integrating.
• The number of alumni organizations that have integrated with their fundraising/development operation has jumped 20% since 2017.
• The new 2020 data also suggests integration is happening at a very fast pace:
• Among NCAA Division 1 schools who are not affiliated with a large power conference (i.e. the Power 5 Conferences), the percentage ofalumni organizations that have integrated with fundraising/development has jumped 44% since 2015.
SECTION 1: INSTITUTIONAL DEMOGRAPHICS
VAESE • THE ALUMNI RELATIONS BENCHMARKING STUDY 9
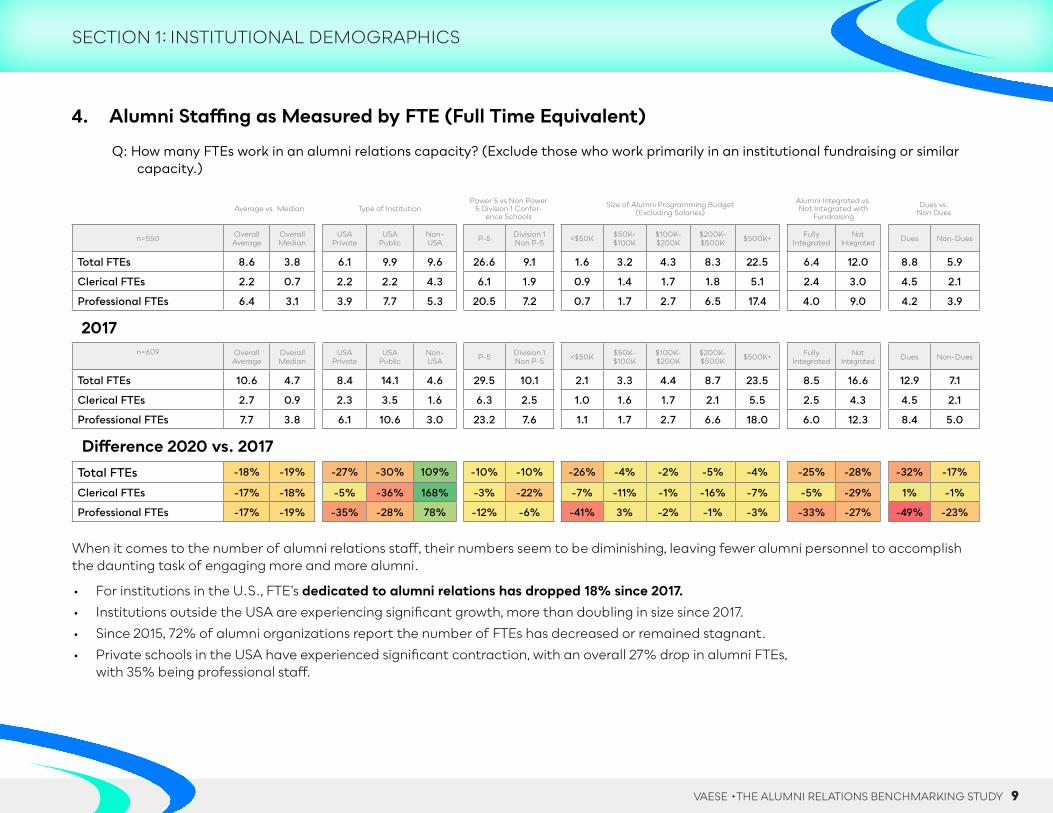
4. Alumni Staffing as Measured by FTE (Full Time Equivalent)
Q: How many FTEs work in an alumni relations capacity? (Exclude those who work primarily in an institutional fundraising or similar capacity.)
Average vs. Median Type of InstitutionPower 5 vs Non Power
5 Division 1 Confer-ence Schools
Size of Alumni Programming Budget (Excluding Salaries)
Alumni Integrated vs. Not Integrated with
Fundraising
Dues vs. Non Dues
n=550 Overall Average
Overall Median
USA Private
USA Public
Non-USA P-5 Division 1
Non P-5 <$50K $50K- $100K
$100K- $200K
$200K- $500K $500K+ Fully
IntegratedNot
Integrated Dues Non-Dues
Total FTEs 8.6 3.8 6.1 9.9 9.6 26.6 9.1 1.6 3.2 4.3 8.3 22.5 6.4 12.0 8.8 5.9
Clerical FTEs 2.2 0.7 2.2 2.2 4.3 6.1 1.9 0.9 1.4 1.7 1.8 5.1 2.4 3.0 4.5 2.1
Professional FTEs 6.4 3.1 3.9 7.7 5.3 20.5 7.2 0.7 1.7 2.7 6.5 17.4 4.0 9.0 4.2 3.9
2017n=609 Overall
AverageOverall Median
USA Private
USA Public
Non-USA P-5 Division 1
Non P-5 <$50K $50K- $100K
$100K- $200K
$200K- $500K $500K+ Fully
IntegratedNot
Integrated Dues Non-Dues
Total FTEs 10.6 4.7 8.4 14.1 4.6 29.5 10.1 2.1 3.3 4.4 8.7 23.5 8.5 16.6 12.9 7.1
Clerical FTEs 2.7 0.9 2.3 3.5 1.6 6.3 2.5 1.0 1.6 1.7 2.1 5.5 2.5 4.3 4.5 2.1
Professional FTEs 7.7 3.8 6.1 10.6 3.0 23.2 7.6 1.1 1.7 2.7 6.6 18.0 6.0 12.3 8.4 5.0
Difference 2020 vs. 2017Total FTEs -18% -19% -27% -30% 109% -10% -10% -26% -4% -2% -5% -4% -25% -28% -32% -17%
Clerical FTEs -17% -18% -5% -36% 168% -3% -22% -7% -11% -1% -16% -7% -5% -29% 1% -1%
Professional FTEs -17% -19% -35% -28% 78% -12% -6% -41% 3% -2% -1% -3% -33% -27% -49% -23%
When it comes to the number of alumni relations staff, their numbers seem to be diminishing, leaving fewer alumni personnel to accomplish the daunting task of engaging more and more alumni.
• For institutions in the U.S., FTE’s dedicated to alumni relations has dropped 18% since 2017.• Institutions outside the USA are experiencing significant growth, more than doubling in size since 2017.
• Since 2015, 72% of alumni organizations report the number of FTEs has decreased or remained stagnant.
• Private schools in the USA have experienced significant contraction, with an overall 27% drop in alumni FTEs,with 35% being professional staff.
SECTION 1: INSTITUTIONAL DEMOGRAPHICS
VAESE • THE ALUMNI RELATIONS BENCHMARKING STUDY 10
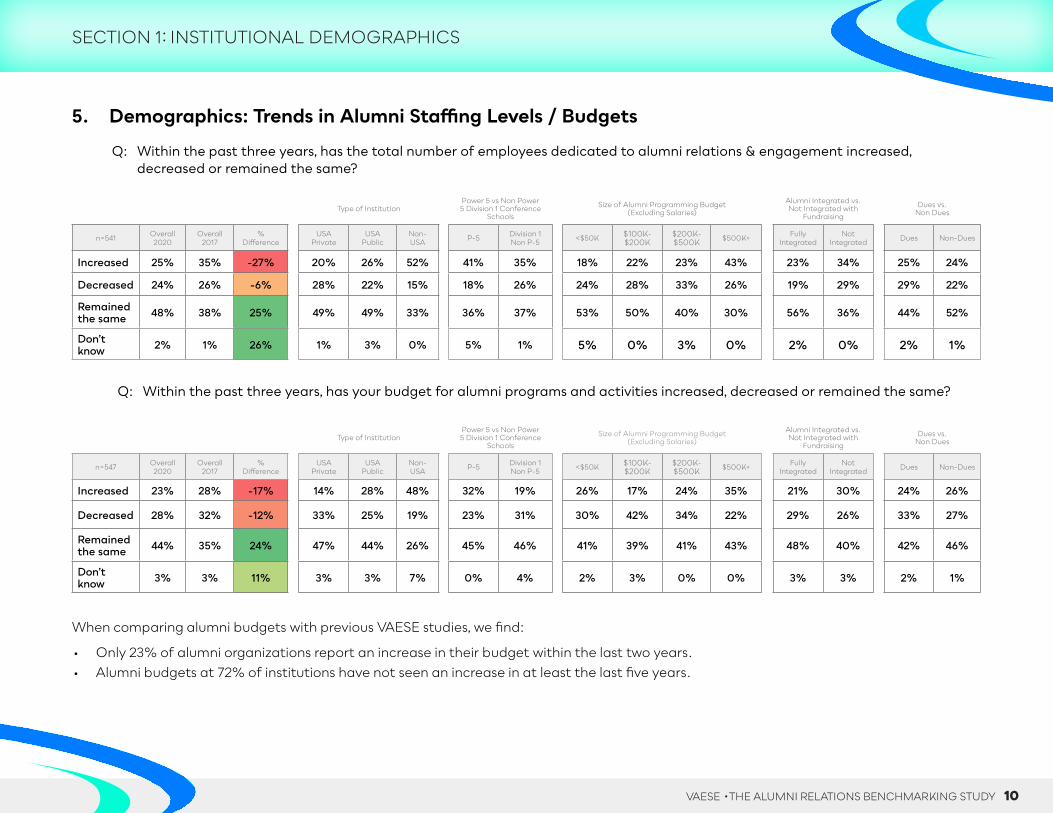
5. Demographics: Trends in Alumni Staffing Levels / Budgets
Q: Within the past three years, has the total number of employees dedicated to alumni relations & engagement increased, decreased or remained the same?
Type of InstitutionPower 5 vs Non Power 5 Division 1 Conference
Schools
Size of Alumni Programming Budget(Excluding Salaries)
Alumni Integrated vs. Not Integrated with
Fundraising
Dues vs. Non Dues
n=541 Overall 2020
Overall 2017
% Difference
USA Private
USA Public
Non-USA P-5 Division 1
Non P-5 <$50K $100K-$200K
$200K-$500K $500K+ Fully
IntegratedNot
Integrated Dues Non-Dues
Increased 25% 35% -27% 20% 26% 52% 41% 35% 18% 22% 23% 43% 23% 34% 25% 24%
Decreased 24% 26% -6% 28% 22% 15% 18% 26% 24% 28% 33% 26% 19% 29% 29% 22%
Remained the same 48% 38% 25% 49% 49% 33% 36% 37% 53% 50% 40% 30% 56% 36% 44% 52%
Don’t know 2% 1% 26% 1% 3% 0% 5% 1% 5% 0% 3% 0% 2% 0% 2% 1%
Q: Within the past three years, has your budget for alumni programs and activities increased, decreased or remained the same?
Type of InstitutionPower 5 vs Non Power 5 Division 1 Conference
Schools
Size of Alumni Programming Budget (Excluding Salaries)
Alumni Integrated vs. Not Integrated with
Fundraising
Dues vs. Non Dues
n=547 Overall 2020
Overall 2017
% Difference
USA Private
USA Public
Non-USA P-5 Division 1
Non P-5 <$50K $100K-$200K
$200K-$500K $500K+ Fully
IntegratedNot
Integrated Dues Non-Dues
Increased 23% 28% -17% 14% 28% 48% 32% 19% 26% 17% 24% 35% 21% 30% 24% 26%
Decreased 28% 32% -12% 33% 25% 19% 23% 31% 30% 42% 34% 22% 29% 26% 33% 27%
Remained the same 44% 35% 24% 47% 44% 26% 45% 46% 41% 39% 41% 43% 48% 40% 42% 46%
Don’t know 3% 3% 11% 3% 3% 7% 0% 4% 2% 3% 0% 0% 3% 3% 2% 1%
When comparing alumni budgets with previous VAESE studies, we find:
• Only 23% of alumni organizations report an increase in their budget within the last two years.• Alumni budgets at 72% of institutions have not seen an increase in at least the last five years.
SECTION 1: INSTITUTIONAL DEMOGRAPHICS

VAESE • THE ALUMNI RELATIONS BENCHMARKING STUDY 11
6. Alumni Database Dashboard
Average vs. Median Type of Institution
Power 5 vs Non Power 5 Division 1 Confer-
ence Schools
Size of Alumni Programming Budget (Excluding Salaries)
Alumni Integrated vs. Not Integrated with
Fundraising
Dues vs. Non Dues
n=489 Overall Average
Overall Median
USA Private
USA Public
Non- USA P-5 Division 1
Non P-5 <$50K $50K-$100K
$100K-$200K
$200K-$500K $500K+ Fully
IntegratedNot
Integrated Dues Non- Dues
Total Alumni of Record 94,233 41,815 37,431 157,290 77,012 311,474 122,813 42,645 62,443 81,638 186,09 216,304 69,536 31,750 138,273 69,609
Approximately how many living alumni/ae are addressable? (with a deliverable physical address)
64,745 34,451 26,040 109,971 49,800 238,424 96,087 24,050 39,709 58,483 147,770 181,932 53,963 95,903 107,222 50,668
% of all living alumni that are addressable 69% 82% 70% 70% 65% 77% 78% 56% 64% 72% 79% 84% 78% 73% 78% 73%
Approximately how many of your alumni/ae have a deliverable email address?
45,902 17,551 20,596 71,906 34,287 183,071 69,728 16,592 33,693 46,655 103,581 122,857 37,106 68,421 72,500 40,215
% of all living alumni with deliverable email 49% 42% 55% 46% 45% 59% 57% 39% 54% 57% 56% 57% 53% 52% 52% 58%
Number Total FTEs 8.6 3.1 6.1 9.9 12.6 26.6 9.1 1.6 3.2 4.3 8.3 22.5 6.4 12.0 8.8 5.9
Number Clerical FTEs 2.2 1.0 2.2 2.2 4.3 6.1 1.9 0.9 1.4 1.7 1.8 5.1 2.4 3.0 4.5 2.1
Number Professional Staff FTEs 6.4 2.1 3.9 7.7 8.3 20.5 7.2 0.7 1.7 2.7 6.5 17.4 4.0 9.0 4.2 3.9
Ratio of staff per alumni (overall) 1:X 10,940 13,445 6,101 15,906 6,109 11,694 13,494 27,063 19,689 18,840 22,449 9,605 10,880 10,969 15,753 11,754
This dashboard is designed to provide alumni organizations with benchmark data pertaining to 1) alumni of record, 2) addressable alumni; 3) deliverable email addresses on record. You’ll also see calculations for the typical number of FTEs per organization, broken down further by number of professional and clerical staff. The last section calculates the ratio of total alumni per staff member.
As an example, suppose your alumni organization has an annual programming budget (excluding salaries) of $150,000. The average number of alumni of record is 81,638. The number of addressable alumni is 58,483 or 72% of the total number of alumni. The average number of alumni with a deliverable email address is 46,655, or 57% of all alumni. The average number of FTE’s is 4.3, with 1.7 clerical/administrative staff, and 2.7 professional staff. The ratio of staff members to alumni is 1 staff member for every 18,840 alumni.
SECTION 1: INSTITUTIONAL DEMOGRAPHICS

VAESE • THE ALUMNI RELATIONS BENCHMARKING STUDY 12
7. General Budgets Dashboard
Alumni budget and related metrics
Alumni budget and related metrics Average vs. Median Type of Institution Power 5 vs Non Power 5 Di-
vision 1 Conference SchoolsSize of Alumni Programming Budget
(Excluding Salaries)Alumni Integrated vs. Not
Integrated with FundraisingDues vs.
Non Dues
n=412 Overall Average
Overall Median
USA Private
USA Public
Non- USA P-5 Division 1
Non P-5 <$50K $50K- $100K
$100K- $200K
$200K- 500K $500K+ Fully
IntegratedNot
Integrated Dues Non-Dues
General budget including salaries $719,700 $220,852 $411,214 $1,017,010 $196,242 $2,193,280 $775,406 $100,130 $279,203 $426,150 1,202,503 $2,940,580 478,003 $1,322,791 $977,167 $488,333
Programming-only budget (excluding salaries) $250,093 $74,982 $196,264 $500,327 $57,778 949,206 $240,310 $32,510 $75,886 $153,331 $319,737 $1,258,696 $159,840 $423,991 325,817 $265,333
% of overall budget that goes to programming 35% 34% 48% 49% 29% 43% 31% 32% 27% 36% 27% 43% 33% 32% 33% 54%
% of overall budget dedicated to salaries 65% 66% 52% 51% 71% 57% 69% 68% 73% 64% 73% 57% 67% 68% 67% 46%
Dollars spent Per Alumni (DPA overall budget) $7.64 $5.28 $10.99 $6.47 $2.55 $7.04 $6.31 $2.35 $4.47 $5.22 $6.46 $13.59 $6.87 $10.04 $7.07 $7.02
This dashboard is designed to provide benchmark data pertaining to 1) General budgets, including salaries, 2) Programming budgets, excluding salaries); 3) Percentage of overall budget for programming, 4) Percentage of budget dedicated to salaries; 5) DPA, a metric indicating “Dollars spent per Alumni,” calculated by using the organization’s total budget.
As an example, suppose your alumni organization has an annual programming budget (excluding salaries) of $250,000. The average general budget is shown to be $1,202,503. The average programming budget is $319,737. The percentage of the overall budget dedicated to program-ming is 27%, leaving 73% dedicated to salaries. The calculated DPA (Dollars spent per alumni) is $6.46.
As it relates to the 2017 study, we find:
• Overall general alumni budgets (to include both salaries and programming) decreased nationally 10% since 2017.• Overall programming budgets also dropped 9% overall since our previous study in 2017.• The biggest drop in alumni budgets are seen among alumni offices that are fully integrated with development, where
we see alumni budgets fell 23%.• Institutions outside the U.S. are in a growth period, as 42% of institutions report an increase in their overall budget.
SECTION 1: INSTITUTIONAL DEMOGRAPHICS
VAESE • THE ALUMNI RELATIONS BENCHMARKING STUDY 13
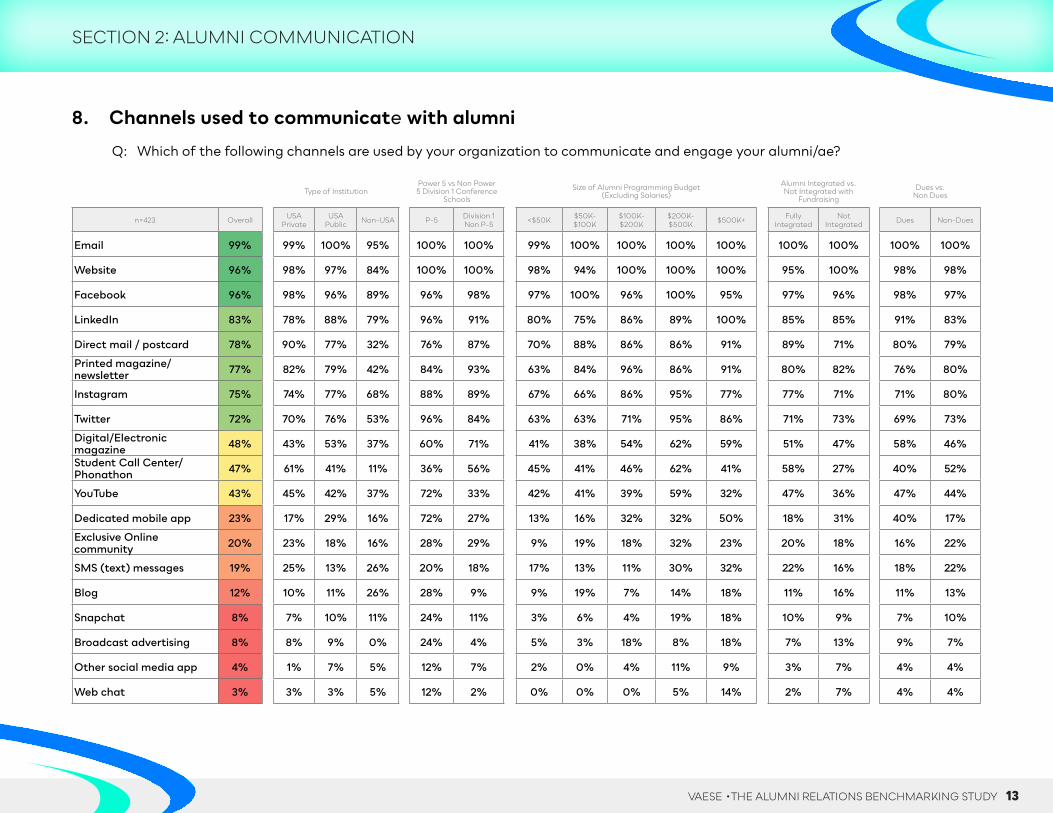
8. Channels used to communicate with alumni
Q: Which of the following channels are used by your organization to communicate and engage your alumni/ae?
Type of InstitutionPower 5 vs Non Power 5 Division 1 Conference
Schools
Size of Alumni Programming Budget (Excluding Salaries)
Alumni Integrated vs. Not Integrated with
Fundraising
Dues vs.Non Dues
n=423 Overall USA Private
USA Public Non-USA P-5 Division 1
Non P-5 <$50K $50K- $100K
$100K- $200K
$200K- $500K $500K+ Fully
IntegratedNot
Integrated Dues Non-Dues
Email 99% 99% 100% 95% 100% 100% 99% 100% 100% 100% 100% 100% 100% 100% 100%
Website 96% 98% 97% 84% 100% 100% 98% 94% 100% 100% 100% 95% 100% 98% 98%
Facebook 96% 98% 96% 89% 96% 98% 97% 100% 96% 100% 95% 97% 96% 98% 97%
LinkedIn 83% 78% 88% 79% 96% 91% 80% 75% 86% 89% 100% 85% 85% 91% 83%
Direct mail / postcard 78% 90% 77% 32% 76% 87% 70% 88% 86% 86% 91% 89% 71% 80% 79%
Printed magazine/newsletter 77% 82% 79% 42% 84% 93% 63% 84% 96% 86% 91% 80% 82% 76% 80%
Instagram 75% 74% 77% 68% 88% 89% 67% 66% 86% 95% 77% 77% 71% 71% 80%
Twitter 72% 70% 76% 53% 96% 84% 63% 63% 71% 95% 86% 71% 73% 69% 73%
Digital/Electronic magazine 48% 43% 53% 37% 60% 71% 41% 38% 54% 62% 59% 51% 47% 58% 46%
Student Call Center/ Phonathon 47% 61% 41% 11% 36% 56% 45% 41% 46% 62% 41% 58% 27% 40% 52%
YouTube 43% 45% 42% 37% 72% 33% 42% 41% 39% 59% 32% 47% 36% 47% 44%
Dedicated mobile app 23% 17% 29% 16% 72% 27% 13% 16% 32% 32% 50% 18% 31% 40% 17%
Exclusive Online community 20% 23% 18% 16% 28% 29% 9% 19% 18% 32% 23% 20% 18% 16% 22%
SMS (text) messages 19% 25% 13% 26% 20% 18% 17% 13% 11% 30% 32% 22% 16% 18% 22%
Blog 12% 10% 11% 26% 28% 9% 9% 19% 7% 14% 18% 11% 16% 11% 13%
Snapchat 8% 7% 10% 11% 24% 11% 3% 6% 4% 19% 18% 10% 9% 7% 10%
Broadcast advertising 8% 8% 9% 0% 24% 4% 5% 3% 18% 8% 18% 7% 13% 9% 7%
Other social media app 4% 1% 7% 5% 12% 7% 2% 0% 4% 11% 9% 3% 7% 4% 4%
Web chat 3% 3% 3% 5% 12% 2% 0% 0% 0% 5% 14% 2% 7% 4% 4%
SECTION 2: ALUMNI COMMUNICATION
VAESE • THE ALUMNI RELATIONS BENCHMARKING STUDY 14
8. Channels used to communicate with alumni (continued)Of the many types of communication channels alumni organizations use, Email, Facebook, and LinkedIn are used at
essentially the same levels as 2015. Email is used by 99% of organizations, Facebook by 96%, and LinkedIn by 83%.
But of all the other communication tools/channels alumni organizations are using, we’re seeing an upward trend in impact
and usage for the following:
• SMS (text messaging) has increased 233% (Going from 6% of institutions using this method in 2015 to 19% in 2020)
• Using a dedicated mobile app has increased 53% (from 15% in 2015 to 23% in 2020)
• Usage of Instagram has increased 30%, going from 56% in 2015 to 75% in 2020.
The following communication tools/channels are trending downward in their impact and usage:
• Offering a private online community has dropped by 56%. In 2015, 45% of alumni organizations reported havinga closed online community. Today that number has dropped to just 20% of reporting institutions.
• Publication of Digital/Electronic magazines has dropped 26% (Going from 65% in 2015 to 48% in 2020)
• Use of Twitter has dropped 12%, with 72% of organization now using that platform, as compared to 82% in 2015.
• Direct mail usage as also dropped 9%, where 78% of organizations now send direct mail pieces, as opposed to 87% in 2015.
SECTION 2: ALUMNI COMMUNICATION
VAESE • THE ALUMNI RELATIONS BENCHMARKING STUDY 15
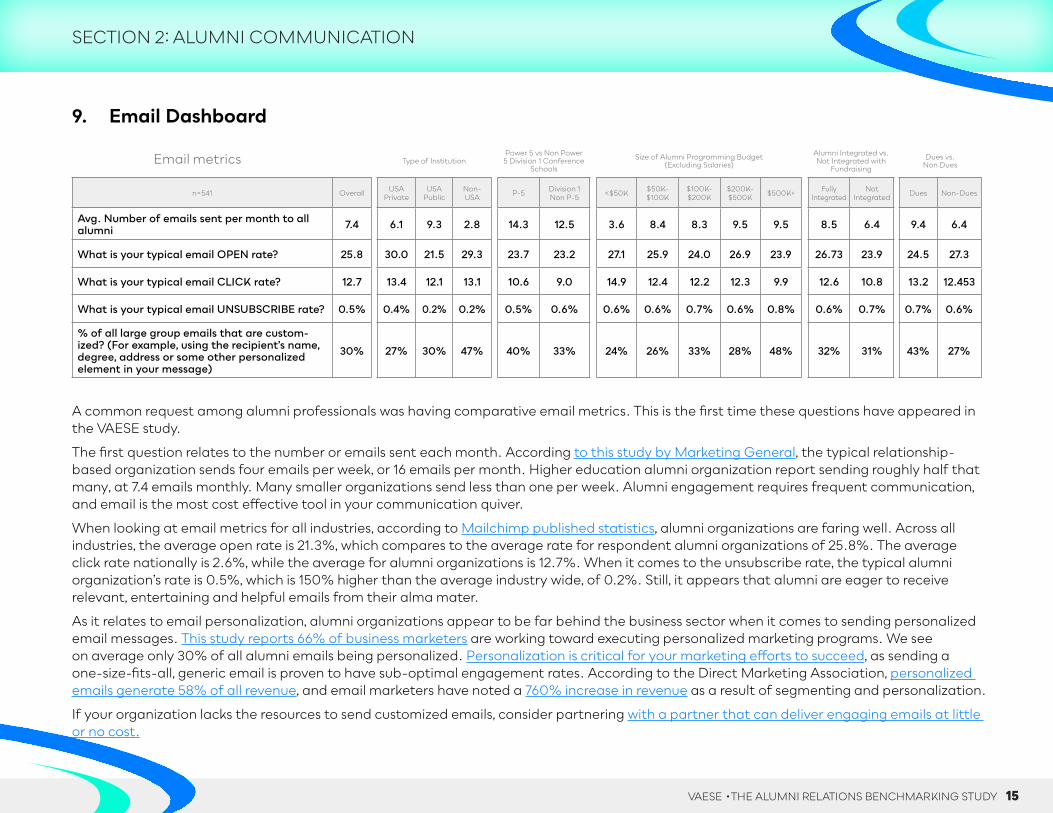
9. Email Dashboard
Email metrics Type of InstitutionPower 5 vs Non Power 5 Division 1 Conference
Schools
Size of Alumni Programming Budget (Excluding Salaries)
Alumni Integrated vs. Not Integrated with
Fundraising
Dues vs.Non Dues
n=541 Overall USA Private
USA Public
Non-USA P-5 Division 1
Non P-5 <$50K $50K- $100K
$100K- $200K
$200K- $500K $500K+ Fully
IntegratedNot
Integrated Dues Non-Dues
Avg. Number of emails sent per month to all alumni 7.4 6.1 9.3 2.8 14.3 12.5 3.6 8.4 8.3 9.5 9.5 8.5 6.4 9.4 6.4
What is your typical email OPEN rate? 25.8 30.0 21.5 29.3 23.7 23.2 27.1 25.9 24.0 26.9 23.9 26.73 23.9 24.5 27.3
What is your typical email CLICK rate? 12.7 13.4 12.1 13.1 10.6 9.0 14.9 12.4 12.2 12.3 9.9 12.6 10.8 13.2 12.453
What is your typical email UNSUBSCRIBE rate? 0.5% 0.4% 0.2% 0.2% 0.5% 0.6% 0.6% 0.6% 0.7% 0.6% 0.8% 0.6% 0.7% 0.7% 0.6%
% of all large group emails that are custom-ized? (For example, using the recipient’s name, degree, address or some other personalized element in your message)
30% 27% 30% 47% 40% 33% 24% 26% 33% 28% 48% 32% 31% 43% 27%
A common request among alumni professionals was having comparative email metrics. This is the first time these questions have appeared in the VAESE study.
The first question relates to the number or emails sent each month. According to this study by Marketing General, the typical relationship-based organization sends four emails per week, or 16 emails per month. Higher education alumni organization report sending roughly half that many, at 7.4 emails monthly. Many smaller organizations send less than one per week. Alumni engagement requires frequent communication, and email is the most cost effective tool in your communication quiver.
When looking at email metrics for all industries, according to Mailchimp published statistics, alumni organizations are faring well. Across all industries, the average open rate is 21.3%, which compares to the average rate for respondent alumni organizations of 25.8%. The average click rate nationally is 2.6%, while the average for alumni organizations is 12.7%. When it comes to the unsubscribe rate, the typical alumni organization’s rate is 0.5%, which is 150% higher than the average industry wide, of 0.2%. Still, it appears that alumni are eager to receive relevant, entertaining and helpful emails from their alma mater.
As it relates to email personalization, alumni organizations appear to be far behind the business sector when it comes to sending personalized email messages. This study reports 66% of business marketers are working toward executing personalized marketing programs. We see on average only 30% of all alumni emails being personalized. Personalization is critical for your marketing efforts to succeed, as sending a one-size-fits-all, generic email is proven to have sub-optimal engagement rates. According to the Direct Marketing Association, personalized emails generate 58% of all revenue, and email marketers have noted a 760% increase in revenue as a result of segmenting and personalization.
If your organization lacks the resources to send customized emails, consider partnering with a partner that can deliver engaging emails at little or no cost.
SECTION 2: ALUMNI COMMUNICATION
VAESE • THE ALUMNI RELATIONS BENCHMARKING STUDY 16
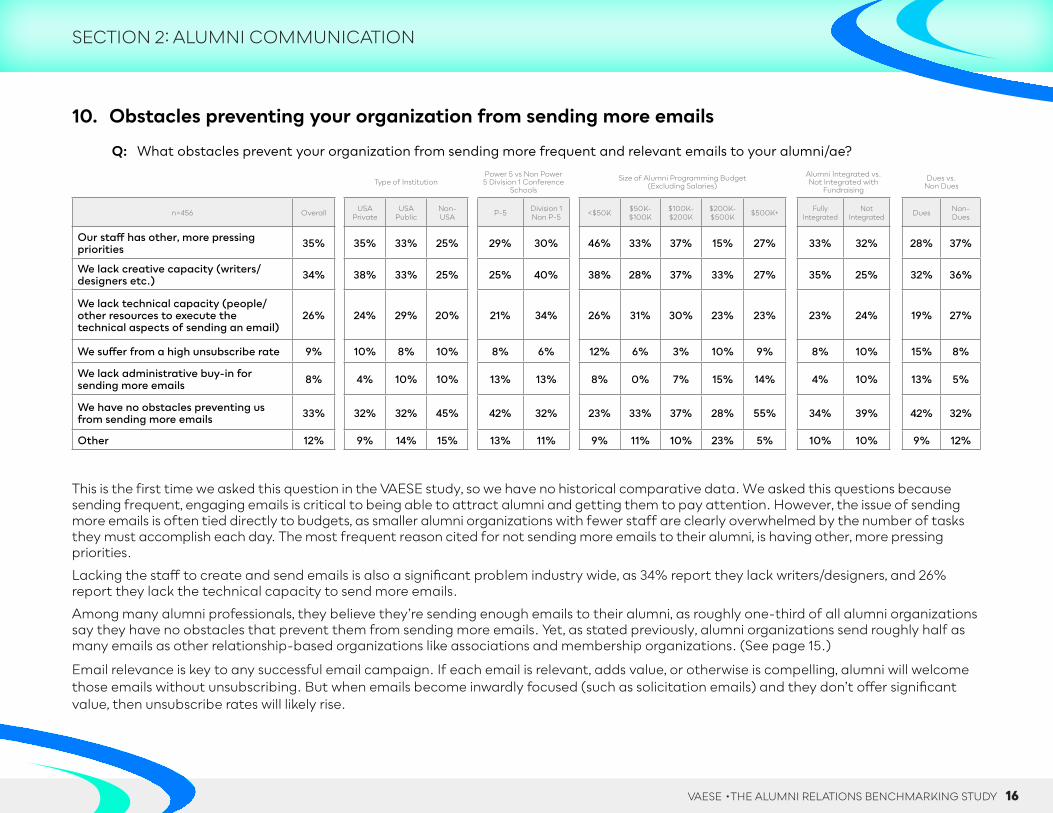
10. Obstacles preventing your organization from sending more emails
Q: What obstacles prevent your organization from sending more frequent and relevant emails to your alumni/ae?
Type of InstitutionPower 5 vs Non Power 5 Division 1 Conference
Schools
Size of Alumni Programming Budget (Excluding Salaries)
Alumni Integrated vs. Not Integrated with
Fundraising
Dues vs. Non Dues
n=456 Overall USA Private
USA Public
Non-USA P-5 Division 1
Non P-5 <$50K $50K- $100K
$100K- $200K
$200K- $500K $500K+ Fully
IntegratedNot
Integrated Dues Non-Dues
Our staff has other, more pressing priorities 35% 35% 33% 25% 29% 30% 46% 33% 37% 15% 27% 33% 32% 28% 37%
We lack creative capacity (writers/designers etc.) 34% 38% 33% 25% 25% 40% 38% 28% 37% 33% 27% 35% 25% 32% 36%
We lack technical capacity (people/other resources to execute the technical aspects of sending an email)
26% 24% 29% 20% 21% 34% 26% 31% 30% 23% 23% 23% 24% 19% 27%
We suffer from a high unsubscribe rate 9% 10% 8% 10% 8% 6% 12% 6% 3% 10% 9% 8% 10% 15% 8%
We lack administrative buy-in for sending more emails 8% 4% 10% 10% 13% 13% 8% 0% 7% 15% 14% 4% 10% 13% 5%
We have no obstacles preventing us from sending more emails 33% 32% 32% 45% 42% 32% 23% 33% 37% 28% 55% 34% 39% 42% 32%
Other 12% 9% 14% 15% 13% 11% 9% 11% 10% 23% 5% 10% 10% 9% 12%
This is the first time we asked this question in the VAESE study, so we have no historical comparative data. We asked this questions because sending frequent, engaging emails is critical to being able to attract alumni and getting them to pay attention. However, the issue of sending more emails is often tied directly to budgets, as smaller alumni organizations with fewer staff are clearly overwhelmed by the number of tasks they must accomplish each day. The most frequent reason cited for not sending more emails to their alumni, is having other, more pressing priorities.
Lacking the staff to create and send emails is also a significant problem industry wide, as 34% report they lack writers/designers, and 26% report they lack the technical capacity to send more emails.
Among many alumni professionals, they believe they’re sending enough emails to their alumni, as roughly one-third of all alumni organizations say they have no obstacles that prevent them from sending more emails. Yet, as stated previously, alumni organizations send roughly half as many emails as other relationship-based organizations like associations and membership organizations. (See page 15.)
Email relevance is key to any successful email campaign. If each email is relevant, adds value, or otherwise is compelling, alumni will welcome those emails without unsubscribing. But when emails become inwardly focused (such as solicitation emails) and they don’t offer significant value, then unsubscribe rates will likely rise.
SECTION 2: ALUMNI COMMUNICATION
VAESE • THE ALUMNI RELATIONS BENCHMARKING STUDY 17
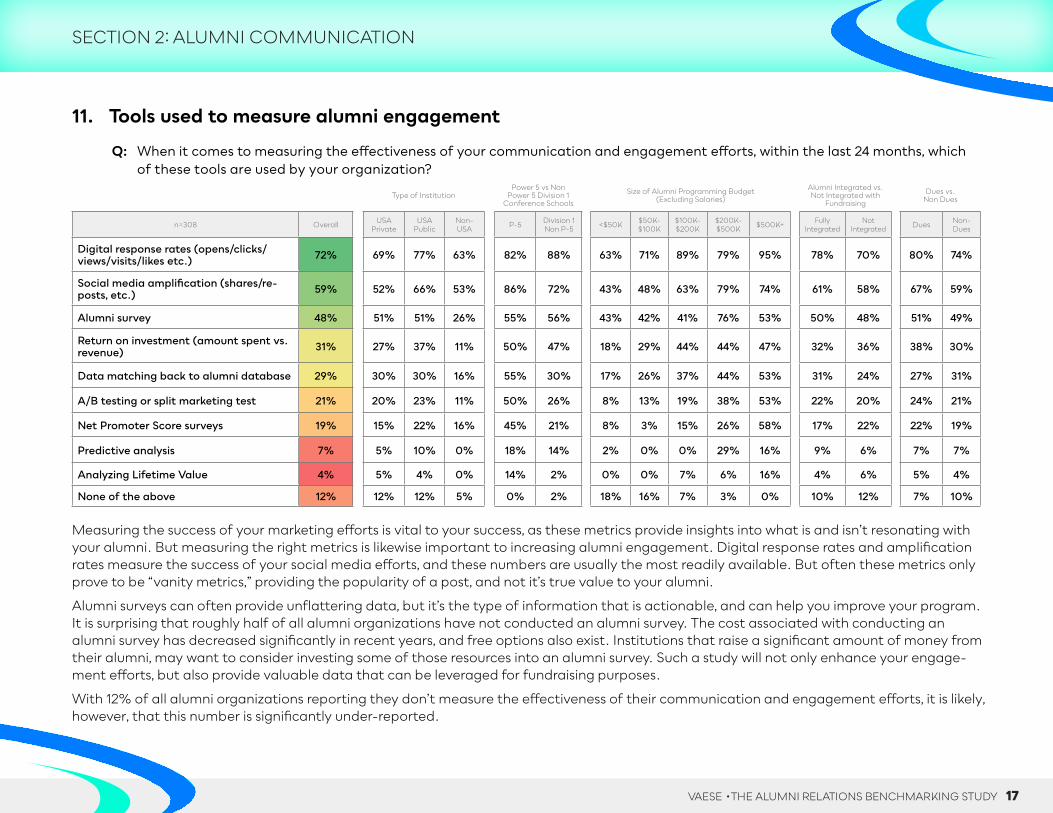
11. Tools used to measure alumni engagement
Q: When it comes to measuring the effectiveness of your communication and engagement efforts, within the last 24 months, whichof these tools are used by your organization?
Type of InstitutionPower 5 vs Non
Power 5 Division 1 Conference Schools
Size of Alumni Programming Budget (Excluding Salaries)
Alumni Integrated vs. Not Integrated with
Fundraising
Dues vs. Non Dues
n=308 Overall USA Private
USA Public
Non-USA P-5 Division 1
Non P-5 <$50K $50K- $100K
$100K- $200K
$200K- $500K $500K+ Fully
IntegratedNot
Integrated Dues Non-Dues
Digital response rates (opens/clicks/views/visits/likes etc.) 72% 69% 77% 63% 82% 88% 63% 71% 89% 79% 95% 78% 70% 80% 74%
Social media amplification (shares/re-posts, etc.) 59% 52% 66% 53% 86% 72% 43% 48% 63% 79% 74% 61% 58% 67% 59%
Alumni survey 48% 51% 51% 26% 55% 56% 43% 42% 41% 76% 53% 50% 48% 51% 49%
Return on investment (amount spent vs. revenue) 31% 27% 37% 11% 50% 47% 18% 29% 44% 44% 47% 32% 36% 38% 30%
Data matching back to alumni database 29% 30% 30% 16% 55% 30% 17% 26% 37% 44% 53% 31% 24% 27% 31%
A/B testing or split marketing test 21% 20% 23% 11% 50% 26% 8% 13% 19% 38% 53% 22% 20% 24% 21%
Net Promoter Score surveys 19% 15% 22% 16% 45% 21% 8% 3% 15% 26% 58% 17% 22% 22% 19%
Predictive analysis 7% 5% 10% 0% 18% 14% 2% 0% 0% 29% 16% 9% 6% 7% 7%
Analyzing Lifetime Value 4% 5% 4% 0% 14% 2% 0% 0% 7% 6% 16% 4% 6% 5% 4%
None of the above 12% 12% 12% 5% 0% 2% 18% 16% 7% 3% 0% 10% 12% 7% 10%
Measuring the success of your marketing efforts is vital to your success, as these metrics provide insights into what is and isn’t resonating with your alumni. But measuring the right metrics is likewise important to increasing alumni engagement. Digital response rates and amplification rates measure the success of your social media efforts, and these numbers are usually the most readily available. But often these metrics only prove to be “vanity metrics,” providing the popularity of a post, and not it’s true value to your alumni.
Alumni surveys can often provide unflattering data, but it’s the type of information that is actionable, and can help you improve your program. It is surprising that roughly half of all alumni organizations have not conducted an alumni survey. The cost associated with conducting an alumni survey has decreased significantly in recent years, and free options also exist. Institutions that raise a significant amount of money from their alumni, may want to consider investing some of those resources into an alumni survey. Such a study will not only enhance your engage-ment efforts, but also provide valuable data that can be leveraged for fundraising purposes.
With 12% of all alumni organizations reporting they don’t measure the effectiveness of their communication and engagement efforts, it is likely, however, that this number is significantly under-reported.
SECTION 2: ALUMNI COMMUNICATION

VAESE • THE ALUMNI RELATIONS BENCHMARKING STUDY 18
12. Top goal for next year
Q: What is your alumni organization’s top goal for next year?
Type of InstitutionPower 5 vs Non
Power 5 Division 1 Conference Schools
Size of Alumni Programming Budget Excluding Salaries)
Alumni Integrated vs. Not Integrated with
Fundraising
Dues vs. Non Dues
n=423 Overall USA Private
USA Public Non-USA P-5 Division 1
Non P-5 <$50K $50K- $100K
$100K- $200K
$200K- $500K $500K+ Fully
IntegratedNot
Integrated Dues Non- Dues
Increasing the number of alumni who engage 62% 58% 66% 60% 61% 59% 60% 71% 59% 59% 68% 58% 65% 46% 68%
Increasing donor revenue (i.e. non-dues related donations) 13% 14% 6% 15% 4% 4% 14% 9% 7% 8% 0% 18% 4% 12% 10%
Increasing dues-paying revenue, membership acquisition/retention 9% 2% 14% 10% 17% 17% 12% 6% 7% 3% 23% 5% 18% 29% 1%
Integrating with fundraising / development/ advancement 7% 10% 5% 5% 13% 4% 9% 0% 14% 5% 9% 7% 5% 8% 7%
Integrating with or expanding career services programs 4% 8% 1% 5% 0% 2% 5% 6% 0% 8% 0% 6% 2% 0% 7%
Increasing the degree/frequency of alumni who are already engaged 2% 3% 1% 5% 0% 0% 0% 3% 0% 8% 0% 1% 4% 0% 3%
Increasing diversity of alumni who engage 1% 1% 3% 0% 4% 2% 0% 3% 7% 0% 0% 2% 2% 4% 1%
Increasing our staff/organization size 1% 1% 2% 0% 0% 4% 0% 0% 3% 3% 0% 1% 0% 0% 2%
Increasing overall volunteer participation 0% 1% 0% 0% 0% 2% 0% 0% 0% 3% 0% 1% 0% 0% 1%
Most alumni organizations struggle with alumni engagement, as is evidence by the 62% of participating institutions who report their top goal for next year is to “increase the number of alumni who engage.” However, the number of institutions who report this as their highest priority is down 10% from 2017.
It’s worth pointing out that although alumni professionals report their goal is to increase engagement, the most effective tool to boost engagement is through email. As noted on page 16, the study shows 35% of alumni professionals say they have other, more pressing priorities than to send more emails.
Why is there a disconnect between alumni professionals who want more engaged alumni, and their ability to invest the time and resources necessary to accomplish that goal? The answer may lie in the second most popular answer. Since our study in 2017, the number of institutions indicating they top goal is to raise donor revenue jumped 183%.
As stated previously, we’re seeing a dramatic increase in the number of alumni organizations integrating with development/fundraising, with 73% of responding organizations reporting their alumni and development operations are fully integrated or in the process of integrating. We’re seeing evidence that alumni/development integration is having an impact on engagement, as the priorities of fundraising supersede engagement goals.
SECTION 2: ALUMNI COMMUNICATION
VAESE • THE ALUMNI RELATIONS BENCHMARKING STUDY 19
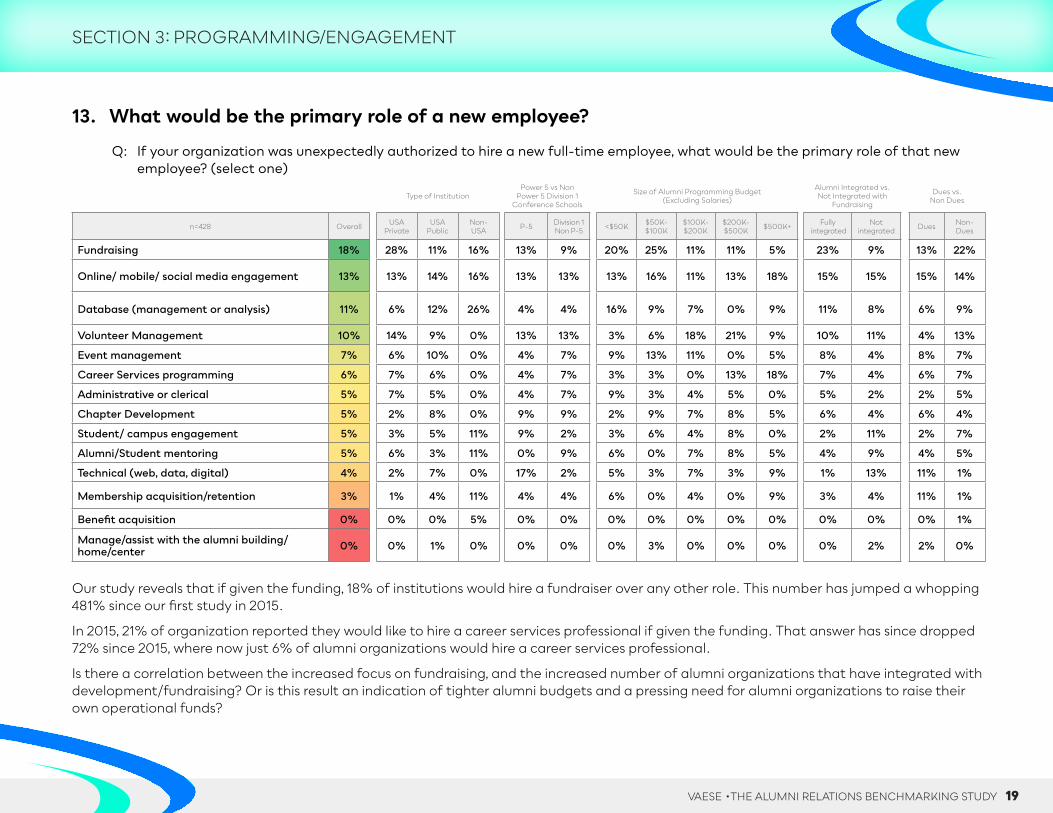
13. What would be the primary role of a new employee?
Q: If your organization was unexpectedly authorized to hire a new full-time employee, what would be the primary role of that newemployee? (select one)
Type of InstitutionPower 5 vs Non
Power 5 Division 1 Conference Schools
Size of Alumni Programming Budget (Excluding Salaries)
Alumni Integrated vs. Not Integrated with
Fundraising
Dues vs. Non Dues
n=428 Overall USA Private
USA Public
Non-USA P-5 Division 1
Non P-5 <$50K $50K- $100K
$100K- $200K
$200K- $500K $500K+ Fully
integratedNot
integrated Dues Non-Dues
Fundraising 18% 28% 11% 16% 13% 9% 20% 25% 11% 11% 5% 23% 9% 13% 22%
Online/ mobile/ social media engagement 13% 13% 14% 16% 13% 13% 13% 16% 11% 13% 18% 15% 15% 15% 14%
Database (management or analysis) 11% 6% 12% 26% 4% 4% 16% 9% 7% 0% 9% 11% 8% 6% 9%
Volunteer Management 10% 14% 9% 0% 13% 13% 3% 6% 18% 21% 9% 10% 11% 4% 13%
Event management 7% 6% 10% 0% 4% 7% 9% 13% 11% 0% 5% 8% 4% 8% 7%
Career Services programming 6% 7% 6% 0% 4% 7% 3% 3% 0% 13% 18% 7% 4% 6% 7%
Administrative or clerical 5% 7% 5% 0% 4% 7% 9% 3% 4% 5% 0% 5% 2% 2% 5%
Chapter Development 5% 2% 8% 0% 9% 9% 2% 9% 7% 8% 5% 6% 4% 6% 4%
Student/ campus engagement 5% 3% 5% 11% 9% 2% 3% 6% 4% 8% 0% 2% 11% 2% 7%
Alumni/Student mentoring 5% 6% 3% 11% 0% 9% 6% 0% 7% 8% 5% 4% 9% 4% 5%
Technical (web, data, digital) 4% 2% 7% 0% 17% 2% 5% 3% 7% 3% 9% 1% 13% 11% 1%
Membership acquisition/retention 3% 1% 4% 11% 4% 4% 6% 0% 4% 0% 9% 3% 4% 11% 1%
Benefit acquisition 0% 0% 0% 5% 0% 0% 0% 0% 0% 0% 0% 0% 0% 0% 1%
Manage/assist with the alumni building/ home/center 0% 0% 1% 0% 0% 0% 0% 3% 0% 0% 0% 0% 2% 2% 0%
Our study reveals that if given the funding, 18% of institutions would hire a fundraiser over any other role. This number has jumped a whopping 481% since our first study in 2015.
In 2015, 21% of organization reported they would like to hire a career services professional if given the funding. That answer has since dropped 72% since 2015, where now just 6% of alumni organizations would hire a career services professional.
Is there a correlation between the increased focus on fundraising, and the increased number of alumni organizations that have integrated with development/fundraising? Or is this result an indication of tighter alumni budgets and a pressing need for alumni organizations to raise their own operational funds?
SECTION 3: PROGRAMMING/ENGAGEMENT

VAESE • THE ALUMNI RELATIONS BENCHMARKING STUDY 20
14. Percentage of your alumni listed as “Do Not Solicit” or “Do Not Contact?
Q: Approximately what percentage of your alumni/ae and/or friends have asked to be listed as “Do Not Call,” “Do Not Contact,” “Do Not Solicit” or similar restriction (Opting out)
Type of InstitutionPower 5 vs Non
Power 5 Division 1 Conference Schools
Size of Alumni Programming Budget (Excluding Salaries)
Alumni Integrated vs. Not Integrated with
Fundraising
Dues vs. Non Dues
n=533 Overall USA Private
USA Public
Non-USA P-5 Division 1
Non P-5 <$50K $50K- $100K
$100K- $200K
$200K- $500K $500K+ Fully
IntegratedNot
Integrated Dues Non-Dues
Average Percent 9.7 10.0 9.5 6.5 11.6 9.6 9.2 9.2 10.0 10.1 11.7 9.9 10.2 10.5 9.1
Q: Within the past five years, has the number of alumni/ae who have asked to be listed as “Do Not Call,” “Do Not Contact,” “Do Not Solicit” etc., increased, decreased, or remained the same?
Increased 36% 31% 39% 40% 46% 40% 35% 39% 32% 47% 49% 40% 35% 40% 34%
Decreased 5% 3% 5% 15% 2% 7% 6% 3% 0% 3% 0% 4% 7% 10% 3%
Remained the same 32% 37% 27% 35% 14% 36% 37% 31% 52% 22% 15% 28% 39% 29% 35%
Do not know/ Do Not Track 27% 28% 30% 10% 38% 17% 22% 28% 16% 28% 36% 28% 19% 21% 28%
The new VAESE study reveals a trend toward a greater number of alumni “opting out” of contact with their alma mater:
• Since 2015, alumni organizations have experienced a 15% increase in the number of alumni who have asked to be put on the “do-not-contact” or “do-not-solicit” list (referred to as “opting out” of contact with their alma mater.”)
• 46% of alumni organizations have at least ten percent of their alumni who have permanently opted-out.• The number of institutions with at least a ten percent opt-out rate has increased 79% since 2015.
SECTION 3: PROGRAMMING/ENGAGEMENT
VAESE • THE ALUMNI RELATIONS BENCHMARKING STUDY 21
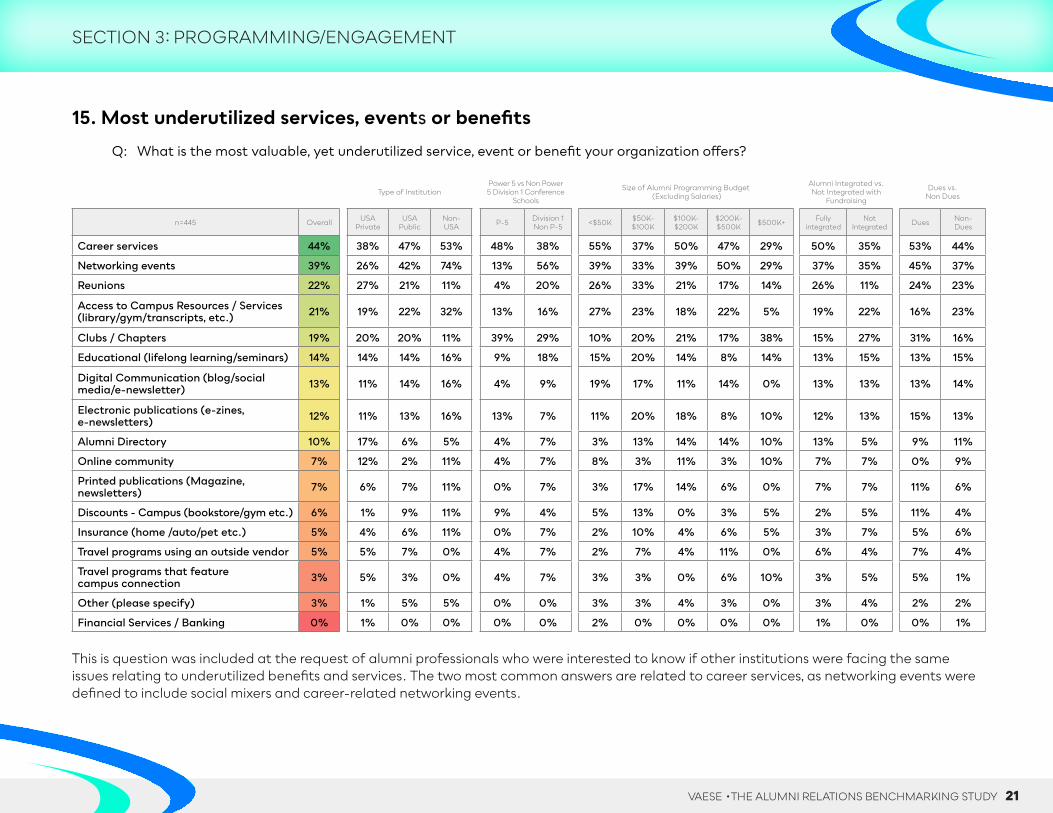
15. Most underutilized services, events or benefits
Q: What is the most valuable, yet underutilized service, event or benefit your organization offers?
Type of InstitutionPower 5 vs Non Power 5 Division 1 Conference
Schools
Size of Alumni Programming Budget (Excluding Salaries)
Alumni Integrated vs. Not Integrated with
Fundraising
Dues vs. Non Dues
n=445 Overall USA Private
USA Public
Non-USA P-5 Division 1
Non P-5 <$50K $50K- $100K
$100K-$200K
$200K- $500K $500K+ Fully
integratedNot
Integrated Dues Non-Dues
Career services 44% 38% 47% 53% 48% 38% 55% 37% 50% 47% 29% 50% 35% 53% 44%
Networking events 39% 26% 42% 74% 13% 56% 39% 33% 39% 50% 29% 37% 35% 45% 37%
Reunions 22% 27% 21% 11% 4% 20% 26% 33% 21% 17% 14% 26% 11% 24% 23%
Access to Campus Resources / Services (library/gym/transcripts, etc.) 21% 19% 22% 32% 13% 16% 27% 23% 18% 22% 5% 19% 22% 16% 23%
Clubs / Chapters 19% 20% 20% 11% 39% 29% 10% 20% 21% 17% 38% 15% 27% 31% 16%
Educational (lifelong learning/seminars) 14% 14% 14% 16% 9% 18% 15% 20% 14% 8% 14% 13% 15% 13% 15%
Digital Communication (blog/social media/e-newsletter) 13% 11% 14% 16% 4% 9% 19% 17% 11% 14% 0% 13% 13% 13% 14%
Electronic publications (e-zines, e-newsletters) 12% 11% 13% 16% 13% 7% 11% 20% 18% 8% 10% 12% 13% 15% 13%
Alumni Directory 10% 17% 6% 5% 4% 7% 3% 13% 14% 14% 10% 13% 5% 9% 11%
Online community 7% 12% 2% 11% 4% 7% 8% 3% 11% 3% 10% 7% 7% 0% 9%
Printed publications (Magazine, newsletters) 7% 6% 7% 11% 0% 7% 3% 17% 14% 6% 0% 7% 7% 11% 6%
Discounts - Campus (bookstore/gym etc.) 6% 1% 9% 11% 9% 4% 5% 13% 0% 3% 5% 2% 5% 11% 4%
Insurance (home /auto/pet etc.) 5% 4% 6% 11% 0% 7% 2% 10% 4% 6% 5% 3% 7% 5% 6%
Travel programs using an outside vendor 5% 5% 7% 0% 4% 7% 2% 7% 4% 11% 0% 6% 4% 7% 4%
Travel programs that feature campus connection 3% 5% 3% 0% 4% 7% 3% 3% 0% 6% 10% 3% 5% 5% 1%
Other (please specify) 3% 1% 5% 5% 0% 0% 3% 3% 4% 3% 0% 3% 4% 2% 2%
Financial Services / Banking 0% 1% 0% 0% 0% 0% 2% 0% 0% 0% 0% 1% 0% 0% 1%
This is question was included at the request of alumni professionals who were interested to know if other institutions were facing the same issues relating to underutilized benefits and services. The two most common answers are related to career services, as networking events were defined to include social mixers and career-related networking events.
SECTION 3: PROGRAMMING/ENGAGEMENT
VAESE • THE ALUMNI RELATIONS BENCHMARKING STUDY 22
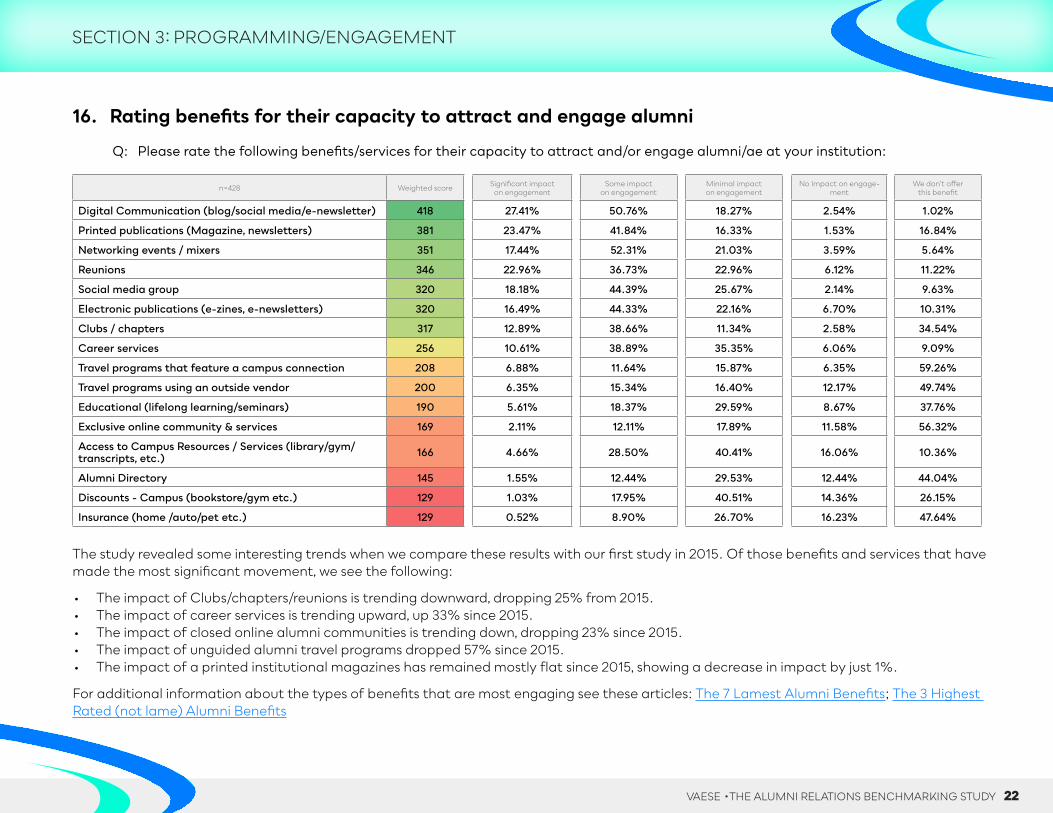
16. Rating benefits for their capacity to attract and engage alumni
Q: Please rate the following benefits/services for their capacity to attract and/or engage alumni/ae at your institution:
n=428 Weighted score Significant impact on engagement
Some impact on engagement
Minimal impact on engagement
No Impact on engage-ment
We don’t offer this benefit
Digital Communication (blog/social media/e-newsletter) 418 27.41% 50.76% 18.27% 2.54% 1.02%
Printed publications (Magazine, newsletters) 381 23.47% 41.84% 16.33% 1.53% 16.84%
Networking events / mixers 351 17.44% 52.31% 21.03% 3.59% 5.64%
Reunions 346 22.96% 36.73% 22.96% 6.12% 11.22%
Social media group 320 18.18% 44.39% 25.67% 2.14% 9.63%
Electronic publications (e-zines, e-newsletters) 320 16.49% 44.33% 22.16% 6.70% 10.31%
Clubs / chapters 317 12.89% 38.66% 11.34% 2.58% 34.54%
Career services 256 10.61% 38.89% 35.35% 6.06% 9.09%
Travel programs that feature a campus connection 208 6.88% 11.64% 15.87% 6.35% 59.26%
Travel programs using an outside vendor 200 6.35% 15.34% 16.40% 12.17% 49.74%
Educational (lifelong learning/seminars) 190 5.61% 18.37% 29.59% 8.67% 37.76%
Exclusive online community & services 169 2.11% 12.11% 17.89% 11.58% 56.32%
Access to Campus Resources / Services (library/gym/transcripts, etc.) 166 4.66% 28.50% 40.41% 16.06% 10.36%
Alumni Directory 145 1.55% 12.44% 29.53% 12.44% 44.04%
Discounts - Campus (bookstore/gym etc.) 129 1.03% 17.95% 40.51% 14.36% 26.15%
Insurance (home /auto/pet etc.) 129 0.52% 8.90% 26.70% 16.23% 47.64%
The study revealed some interesting trends when we compare these results with our first study in 2015. Of those benefits and services that have made the most significant movement, we see the following:
• The impact of Clubs/chapters/reunions is trending downward, dropping 25% from 2015.• The impact of career services is trending upward, up 33% since 2015.• The impact of closed online alumni communities is trending down, dropping 23% since 2015.• The impact of unguided alumni travel programs dropped 57% since 2015.• The impact of a printed institutional magazines has remained mostly flat since 2015, showing a decrease in impact by just 1%.
For additional information about the types of benefits that are most engaging see these articles: The 7 Lamest Alumni Benefits; The 3 Highest Rated (not lame) Alumni Benefits
SECTION 3: PROGRAMMING/ENGAGEMENT

VAESE • THE ALUMNI RELATIONS BENCHMARKING STUDY 23
17. Level of investment in alumni benefits and services
Q: When it comes to attracting and motivating alumni to engage, join or give, what approach best describes your institution?
Type of InstitutionPower 5 vs Non
Power 5 Division 1 Conference Schools
Size of Alumni Programming Budget (Excluding Salaries)
Alumni Integrated vs. Not Integrated with
Fundraising
Dues vs.Non Dues
n=308 Overall USA Private
USA Public
Non-USA P-5 Division 1
Non P-5 <$50K $50K- $100K
$100K- $200K
$200K- $500K
$500K+ Fully Integrated
Not Integrated Dues Non-
Dues
We invest a significant amount annually to procure benefits and services that will motivate our alumni to engage/join/give.
12% 10% 13% 11% 18% 19% 5% 13% 18% 22% 23% 12% 15% 15% 11%
We invest a limited amount annually to procure benefits and services that will motivate our alumni to engage/join/give.
41% 35% 47% 37% 36% 53% 40% 42% 36% 47% 41% 38% 50% 55% 38%
We invest nothing to procure benefits for alumni/ae, but only on select general programs to motivate our alumni to engage/join/give.
31% 38% 23% 37% 23% 21% 38% 29% 29% 28% 26% 34% 21% 16% 38%
We rely solely on alumni/ae loyalty, nostalgia, and philanthropic generosity to motivate them to engage/join/give
16% 15% 17% 16% 23% 7% 17% 16% 18% 3% 11% 16% 13% 15% 13%
In a competitive membership environment where business like Amazon are over-delivering on the value of their membership, it’s imperative for alumni organizations to at least try to offer some type of incentive to entice alumni to engage. The data from this survey is disconcerting:
• 88% of all alumni organizations invest little to nothing in alumni benefits• Only 12% of alumni organizations report to investing annually in procuring benefits and services for their alumni. (Whether dues-paying or not).
These stats are truly baffling as the number of institutions who refuse to offer their alumni any benefits has remained static for the last five years. In fact, we recently conducted research of all types of relationship based organizations, from membership groups, trade organizations, unions, etc. to identify the differences in how they engage their constituents, as compared to higher education alumni organizations.
The vast majority these organizations have much in common with higher education alumni organizations, and not just alumni groups that have a dues-paying structure. These non-alumni groups are struggling with engagement, acquisition and retention. However, of all compa-rable types of organizations, higher education alumni organizations were the least likely to offer benefits to their constituents, as the large percentage relied on “alumni loyalty and philanthropy” as their primary means of engagement. Here’s a link to the study: Bridging the Leader-ship/Membership Gap. Somehow the importance of offering incentivizing benefits isn’t resonating with alumni/advancement leaders.
SECTION 3: PROGRAMMING/ENGAGEMENT

VAESE • THE ALUMNI RELATIONS BENCHMARKING STUDY 24
18. How would alumni rate your benefits and services?
Q: On a scale of 1-5 (5 being very high value) how would the majority of your alumni/ae rate the value of the overall benefits and services they receive from your alumni organization?
Type of InstitutionPower 5 vs Non Power
5 Division 1 Confer-ence Schools
Size of Alumni Programming Budget (Excluding Salaries)
Alumni Integrated vs. Not Integrated with
Fundraising
Dues vs. Non Dues
n=308 Overall USA Private
USA Public
Non-USA P-5 Division 1
Non P-5 <$50K $50K- $100K
$100K- $200K
$200K- $500K $500K+ Fully
IntegratedNot
Integrated Dues Non-Dues
5 - Very high value 1% 0% 1% 5% 0% 2% 2% 0% 0% 1% 0% 1% 2% 2% 1%
4- Moderately high value 15% 16% 13% 21% 27% 17% 8% 16% 29% 6% 42% 16% 17% 22% 13%
3- Neither high nor low value 47% 44% 52% 32% 50% 57% 39% 55% 54% 58% 37% 44% 54% 49% 47%
2- Low value 18% 21% 15% 21% 14% 14% 26% 16% 4% 22% 11% 18% 15% 13% 21%
1- Very low value 19% 20% 19% 21% 9% 10% 26% 13% 14% 13% 11% 21% 12% 15% 18%
Given the number of alumni organizations that prefer to solicit their alumni instead of offering any type of benefit to incentivize them to engage, this study reveals:
• 84% of alumni professionals estimate their alumni would rate their benefits and services as having little or no value.
• 42% of organizations with budgets more than $500,000, were most likely to rate their benefits as either “moderately high”or “very high value.”
SECTION 3: PROGRAMMING/ENGAGEMENT
VAESE • THE ALUMNI RELATIONS BENCHMARKING STUDY 25
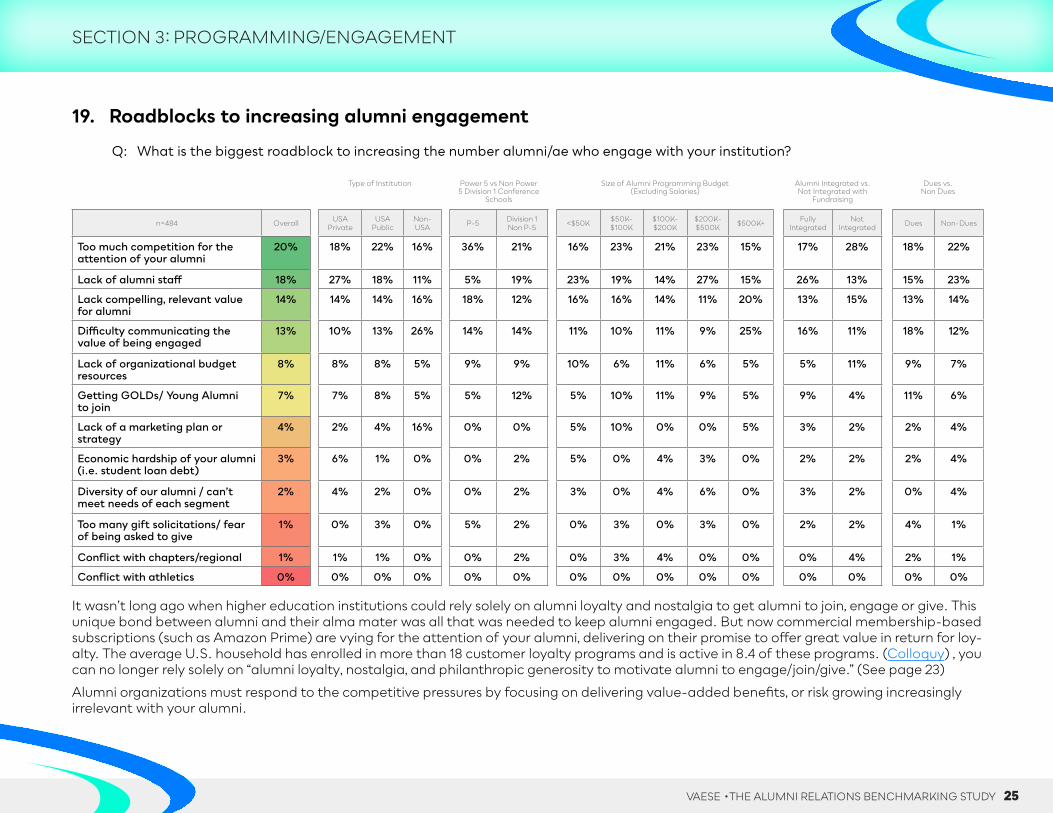
19. Roadblocks to increasing alumni engagement
Q: What is the biggest roadblock to increasing the number alumni/ae who engage with your institution?
Type of Institution Power 5 vs Non Power 5 Division 1 Conference
Schools
Size of Alumni Programming Budget (Excluding Salaries)
Alumni Integrated vs. Not Integrated with
Fundraising
Dues vs. Non Dues
n=484 Overall USA Private
USA Public
Non-USA P-5 Division 1
Non P-5 <$50K $50K- $100K
$100K- $200K
$200K- $500K $500K+ Fully
IntegratedNot
Integrated Dues Non-Dues
Too much competition for the attention of your alumni
20% 18% 22% 16% 36% 21% 16% 23% 21% 23% 15% 17% 28% 18% 22%
Lack of alumni staff 18% 27% 18% 11% 5% 19% 23% 19% 14% 27% 15% 26% 13% 15% 23%
Lack compelling, relevant value for alumni
14% 14% 14% 16% 18% 12% 16% 16% 14% 11% 20% 13% 15% 13% 14%
Difficulty communicating the value of being engaged
13% 10% 13% 26% 14% 14% 11% 10% 11% 9% 25% 16% 11% 18% 12%
Lack of organizational budget resources
8% 8% 8% 5% 9% 9% 10% 6% 11% 6% 5% 5% 11% 9% 7%
Getting GOLDs/ Young Alumni to join
7% 7% 8% 5% 5% 12% 5% 10% 11% 9% 5% 9% 4% 11% 6%
Lack of a marketing plan or strategy
4% 2% 4% 16% 0% 0% 5% 10% 0% 0% 5% 3% 2% 2% 4%
Economic hardship of your alumni (i.e. student loan debt)
3% 6% 1% 0% 0% 2% 5% 0% 4% 3% 0% 2% 2% 2% 4%
Diversity of our alumni / can’t meet needs of each segment
2% 4% 2% 0% 0% 2% 3% 0% 4% 6% 0% 3% 2% 0% 4%
Too many gift solicitations/ fear of being asked to give
1% 0% 3% 0% 5% 2% 0% 3% 0% 3% 0% 2% 2% 4% 1%
Conflict with chapters/regional 1% 1% 1% 0% 0% 2% 0% 3% 4% 0% 0% 0% 4% 2% 1%
Conflict with athletics 0% 0% 0% 0% 0% 0% 0% 0% 0% 0% 0% 0% 0% 0% 0%
It wasn’t long ago when higher education institutions could rely solely on alumni loyalty and nostalgia to get alumni to join, engage or give. This unique bond between alumni and their alma mater was all that was needed to keep alumni engaged. But now commercial membership-based subscriptions (such as Amazon Prime) are vying for the attention of your alumni, delivering on their promise to offer great value in return for loy-alty. The average U.S. household has enrolled in more than 18 customer loyalty programs and is active in 8.4 of these programs. (Colloquy) , you can no longer rely solely on “alumni loyalty, nostalgia, and philanthropic generosity to motivate alumni to engage/join/give.” (See page 23)
Alumni organizations must respond to the competitive pressures by focusing on delivering value-added benefits, or risk growing increasingly irrelevant with your alumni.
SECTION 3: PROGRAMMING/ENGAGEMENT

VAESE • THE ALUMNI RELATIONS BENCHMARKING STUDY 26
20- Rating vendors for their return on investment
Of the vendor/partners you pay to provide services for your alumni, please rate each vendor based on your return on investment.
n=418 weighted average
GoNext Travel 3.2 Other vendors mentioned:AlumniFireAlumnifyAlumnIQBenchmarkCampus GroupsCerkl Constant ContactGiveCampusGiving TreePublishing ConceptsTasslTalent Marks
Alumni Attitude Survey 3.0
Alumni Access 2.9
Sprout Social 2.8
Balfour 2.7
Switchboard 2.7
People Grove 2.6
Blackbaud Net Community 2.6
iModules 2.5
MobileUp 2.4
Brazen Careerist 2.2
Graduway 2.1
Augeo 2.0
360Alumni 2.0
Quadwrangle 1.9
Abenity 1.3
Vendors were rated on the following weight-ed scale: Excellent=4, Good=3, Fair=2, Poor=1, Horrible=0
A minimum of 3 votes required for scoring.
SECTION 3: PROGRAMMING/ENGAGEMENT

VAESE • THE ALUMNI RELATIONS BENCHMARKING STUDY 27
21. Rating programs for young alumni
Q: As it relates to programs designed to attract and engage young alumni, which sentence best describes your organization?
Type of InstitutionPower 5 vs Non Power 5 Division 1 Conference
Schools
Size of Alumni Programming Budget (Excluding Salaries)
Alumni Integrated vs. Not Integrated with
Fundraising
Dues vs. Non Dues
n=444 Overall USA Private
USA Public Non-USA P-5 Division 1
Non P-5 <$50K $50K- $100K
$100K- $200K
$200K- $500K $500K+ Fully
IntegratedNot
Integrated Dues Non-Dues
I believe we are doing well at attracting and engaging young alumni.
9% 9% 7% 21% 4% 16% 8% 10% 14% 17% 5% 9% 13% 9% 9%
I believe we need to do more to attract and engage young alumni.
72% 72% 75% 53% 78% 81% 62% 68% 79% 78% 80% 76% 70% 76% 73%
I believe we do a poor job of attracting and engaging young alumni.
18% 17% 17% 26% 17% 2% 29% 23% 7% 6% 15% 16% 15% 15% 18%
Engaging young alumni is a challenge facing most alumni organizations. With only 9% of institutions reporting they are “doing well,” at connecting with their young alumni, it behooves alumni organizations to find ways to be constantly adding value to this vital segment of your alumni. However, soliciting alumni is not adding value. See this article here: A Cockeyed Idea: Soliciting Alumni as a form of Cultivation.
SECTION 3: PROGRAMMING/ENGAGEMENT

VAESE • THE ALUMNI RELATIONS BENCHMARKING STUDY 28
22. Soliciting New Graduates
Q: Within the first 12 months of graduation, how many gift solicitations does your institution typically send to a new graduate?
Type of InstitutionPower 5 vs Non
Power 5 Division 1 Conference Schools
Size of Alumni Programming Budget (Excluding Salaries)
Alumni Integrated vs. Not Integrated with
Fundraising
Dues vs. Non Dues
n=408 Overall USA Private
USA Public
Non-USA P-5 Division 1
Non P-5 <$50K $50K- $100K
$100K- $200K
$200K- $500K $500K+ Fully
IntegratedNot
Integrated Dues Non-Dues
Number of Solicitations Annually 3.9 3.5 2.9 0.6 4.5 4.9 3.1 3.1 3.4 3.4 4.9 4.09 2.7 4.35 2.5
• Since 2017 the average number of gift solicitations sent to first-year graduates has increased 3.7 to 3.9 solicitations per institution per year.• The number of schools that send five or more gift solicitations to new graduates during their first year is up 55% from 2015.• 46% of participating institutions report to soliciting first year graduates ten or more times during that first year of graduation.• 15% of these institutions send twenty or more solicitations to new grads during the first year.
23. Rating your organization’s technology solutions
Q: True or False: I believe our organization needs to update the technology solutions/benefits we offer our alumni/ae
Type of InstitutionPower 5 vs Non Power 5 Division 1 Conference
Schools
Size of Alumni Programming Budget (Excluding Salaries)
Alumni Integrated vs. Not Integrated with
Fundraising
Dues vs. Non Dues
n=484 Overall USA Private
USA Public Non-USA P-5 Division 1
Non P-5 <$50K $50K- $100K
$100K- $200K
$200K- $500K $500K+ Fully
IntegratedNot
integrated Dues Non-Dues
True 75% 81% 70% 68% 70% 74% 79% 74% 64% 77% 70% 77% 70% 73% 76%
False 14% 7% 18% 21% 26% 9% 13% 13% 11% 17% 15% 11% 17% 16% 14%
No opinion 11% 10% 12% 11% 4% 16% 8% 13% 21% 6% 15% 11% 13% 11% 10%
SECTION 3: PROGRAMMING/ENGAGEMENT

VAESE • THE ALUMNI RELATIONS BENCHMARKING STUDY 29
24. Dues-paying or non-dues-paying membership model
Q: With regard to a dues-paying or non-dues-paying membership model, what model best describes your organization?
Type of InstitutionPower 5 vs Non Power 5 Division 1 Conference
Schools
Size of Alumni Programming Budget (Excluding Salaries)
Alumni Integrated vs. Not Integrated with
Fundraising
Dues vs. Non Dues
n=388 Overall USA Private
USA Public
Non-USA P-5 Division 1
Non P-5 <$50K $50K- $100K
$100K- $200K
$200K- $500K
$500K+Fully
IntegratedNot
integrated Dues Non-Dues
A dues-paying alumni association that offers benefits for a paid membership. 23% 2% 41% 21% 45% 40% 20% 29% 24% 14% 51% 15% 40% n/a n/a
A non-dues-paying organization where alumni have equal access to alumni benefits/programming
73% 95% 52% 78% 41% 56% 77% 68% 69% 81% 46% 81% 57% n/a n/a
A tiered benefits model where alumni and non-alumni donors receive benefits according to their contribution level.
4% 2% 6% 0% 14% 5% 3% 3% 7% 6% 3% 4% 4% n/a n/a
Since our first study, the percentage of dues-paying programs has remained flat, as the number dues paying schools has dropped 5% since 2015. Our study from 2017 revealed how unlikely it is for schools to succeed with a dues-paying alumni program, unless you’re at a large, Power 5 conference school. See the article here: Run Away From Your Dues-Paying Alumni Program
SECTION 4: DUES PAYING PROGRAMS

VAESE • THE ALUMNI RELATIONS BENCHMARKING STUDY 30
25. Growth in membership
Q: Within the past year, when it comes to your membership, would you say your membership has increased, decreased or remained the same?
Type of InstitutionPower 5 vs Non Power 5 Division 1 Conference
Schools
Size of Alumni Programming Budget (Excluding Salaries)
Alumni Integrated vs. Not Integrated with
Fundraising
Dues vs. Non Dues
n=104 Overall USA Private
USA Public Non-USA P-5 Division 1
Non P-5 <$50K $50K- $100K
$100K- $200K
$200K- $500K $500K+ Fully
IntegratedNot
Integrated Dues Non-Dues
Increased 32% 0% 33% 60% 30% 38% 29% 33% 14% 40% 60% 50% 27% n/a n/a
Decreased 25% 52% 26% 0% 40% 19% 21% 22% 14% 20% 40% 17% 27% n/a n/a
Remained the same 43% 48% 42% 40% 30% 44% 50% 44% 71% 40% 0% 33% 45% n/a n/a
Since 2017, the number of organizations seeing an increase in their membership has remained roughly the same. The number of organizations reporting their membership has remained stagnant has gone from 34% in 2017, to 43% in this study.
26. Number of active, dues- paying members
Q: As of July 1, 2019, how may active, dues- paying members were on your records?
Average vs. Median Type of Institution Power 5 vs Non Power 5 Division 1 Conference Schools
Size of Alumni Programming Budget (Excluding Salaries)
Alumni Integrated vs. Not Integrated with Fundraising
Dues vs. Non Dues
n=104 Overall Average
Overall Median
USA Private
USA Public
Non-USA P-5 Division 1
Non P-5 <$50K $50K- $100K
$100K- $200K
$200K- $500K $500K+ Fully
IntegratedNot
integrated Dues Non-Dues
Average # of dues paying members 37,308 5,300 506 41,498 1,720 163,542 6,671 1,195 8,319 9,132 46,697 95,016 8,907 56,706 n/a n/a
SECTION 4: DUES PAYING PROGRAMS
About Alumni Access:
Alumni Access is a turn-key alumni discount program, capable of engaging alumni wherever they live throughout North America and worldwide.
Delivering popular brands that consumers know and love, your alumni can choose from 700,000+ partic-ipating merchants. These discounts aren’t the same deals available to anyone online – these are private, in-store offers at popular national and local restaurants and retailers.
Many of the most recognizable alumni organizations hire Alumni Access to attract and engage their alumni, using our popular mobile app and white-labeled website. Using any mobile device, our app uses a proprietary geolocation service to find nearby discounts wherever your alumni live, work or travel. And because these retailers want to attract an educated and more affluent audience, like college alumni, they offer their deepest discounts… as long as we keep their private, VIP discounts behind our password-pro-tected platform.
Alumni Access also delivers always-on discounts of 15-30% on hotels, all-inclusive resorts, airfare from all the major airlines, car rentals and destination activities like broadways shows and city tours. Alumni will also find some of the deepest discounts available at popular theme parks like Walt Disney World® resort and Disneyland® Resort.
Best of all, it’s uniquely priced to be affordable for higher education alumni organizations of all sizes.
To learn how discount programs are successfully leveraged to attract and engage alumni, see this discount program buyers guide for more information.
GET CONNECTED
1-866-714-7251