Embed Size (px)
Citation preview
Budget Report
2021-22
PREPARE EACH STUDENTTO BE SUCCESSFUL
Visit us online at www.pointschools.net
TABLE OF CONTENTS Building Addresses and Phone Numbers .................................................................................................................. 4
Executive Summary ...................................................................................................................................................... 4
Letter From Th e Superintendent ................................................................................................................................ 5
Highlights Of Th e Budget ........................................................................................................................................... 6
Enrollment Breakdown (District Level) ................................................................................................................... 6
Where Th e Money Comes From - General Fund Revenue Sources........................................................................ 7
How Funds Are Spent - General Fund Expenditures............................................................................................... 7
Tax Levy And Rate Information................................................................................................................................. 8
Private School Voucher Tax Levy By Community................................................................................................... 8
School District Tax Levy By Community................................................................................................................... 9
School District Equalized Valuation (Pie Chart) .................................................................................................... 9
Membership History .................................................................................................................................................... 10
Change In Levy & Change In Equalized Value - TID OUT.................................................................................... 11
Budget And Tax Levy Highlights & Proposed Budget ........................................................................................... 12
Evaluation of the Energy Performance Indicator .................................................................................................... 14
Budget Revenue By Semi-Detailed Source ............................................................................................................... 14
Budget Expenditures By Semi-Detailed Function ................................................................................................... 15
Budget Expenditures By Major Object ..................................................................................................................... 15
How To Read Your Property Tax Bill ....................................................................................................................... 16
How Equalized And Assessed Mill Rates Compare ............................................................................................... 18
How Th e School District Budget Cycle Works ...................................................................................................... 20
WUFAR Fund Accounting ........................................................................................................................................ 21
Notice Of TID Equalized Valuation ......................................................................................................................... 22
Long-Term Debt Service Budget .............................................................................................................................. 22
Administration - Cabinet & Principals .................................................................................................................... 23
Fund Accounting And Fund Balances .................................................................................................................... 24
Nutrislice ..................................................................................................................................................................... 26
Transportation ............................................................................................................................................................. 27
School Board & Calendar Notes .............................................................................................................................. 28Stevens Point Area Public School District | 3
4 | Stevens Point Area Public School District
District Offi ceCraig Gerlach, Superintendent
Bliss Educational Center 1900 Polk Street Stevens Point, WI 54481 (715) 345-5444
Stevens Point Area Senior High School Jon Vollendorf, Ed.D., Principal
1201 North Point Drive Stevens Point, WI 54481 (715) 345-5400
Ben Franklin Junior High School
Steve Prokop, Principal 2000 Polk Street Stevens Point, WI 54481 (715) 345-5413
P.J. Jacobs Junior High School Dan Dobratz, Interim Principal
2400 Main Street Stevens Point, WI 54481 (715) 345-5422
Bannach Elementary School Jessica Champion, Principal
5400 Walter Street Stevens Point, WI 54482 (715) 345-5668
Jefferson Elementary School Molly Demrow, Principal
1800 East Avenue Stevens Point, WI 54481 (715) 345-5418
Kennedy Elementary School Jaimeson Granger, Principal 616 West Second Street Junction City, WI 54443 (715) 345-5614
Madison Elementary School Karl Banker, Principal 600 Maria Drive Stevens Point, WI 54481 (715) 345-5419
McDill Elementary School Joseph Sbertoli, Principal 2516 School Street Stevens Point, WI 54481 (715) 345-5420
McKinley Elementary School Amanda Mayo, Principal 2926 Blaine Street Stevens Point, WI 54481 (715) 345-5421
Plover-Whiting Elementary School Angela Hintz, Principal 1400 Hoover Avenue Plover, WI 54467 (715) 345-5424
Roosevelt Elementary School Kelly Snyder-Chase, Principal 2200 Wisconsin Avenue Plover, WI 54467 (715) 345-5425
Washington Elementary School Ryan Hinner, Principal 3500 Prais Street Stevens Point, WI 54481 (715) 345-5426
Charles Fernandez CenterJennifer Knecht, Principal 1025 Clark Street Stevens Point, WI 54481 (715) 345-5592
Point of Discovery School Dan Lathrop, Lead Teacher 1900 West Zinda Drive Stevens Point, WI 54481 (715) 345-5566
EXECUTIVE SUMMARY
1. The total proposed 2021-22 school year budget for all funds is $141,190,985. a. Removing the interfund transfer amount of $10,303,923 leaves the net total budget at $130,887,062, a 7.73% decrease from the prior year audited actual expenditures. Refer to pages 12 through 15 for information on revenue and expenditures included in this budget.
2. The Stevens Point Area Public School District is proposing property taxes for school purposes in the amount of $39,010,507 to help accomplish its educational goals. a. Th e proposed tax levy is $39,010,507 or 3.7% less than last year. b. An equalized levy rate of $7.45/$1,000 of equalized value is projected based on a 5.84% increase in proper-ty valuations. On a home valued at $100,000, this represents a decrease in school property tax of $73.00. c. Th is is the maximum levy allowed by law. Refer to pages 8 through11 for information on taxation, levy rates and equalized value.
3. The Third Friday enrollment, as of September 17, 2021, is 6,967 students.6,967 students. a. Th is is an increase of 57 students from the Th ird a. Th is is an increase of 57 students from the Th ird Friday enrollment of the previous year.Friday enrollment of the previous year. b. Th e Th ird Friday seat count of 6,967 when adjusted b. Th e Th ird Friday seat count of 6,967 when adjusted to exclude non-resident students and include resident to exclude non-resident students and include resident students attending other districts produces a resident students attending other districts produces a resident membership number of 7,236, an increase of 6 students.membership number of 7,236, an increase of 6 students. c. When the resident membership number is c. When the resident membership number is converted to resident full-time equivalence (FTE), the converted to resident full-time equivalence (FTE), the resulting net FTE membership is 7,018, a number used in resulting net FTE membership is 7,018, a number used in calculating the Revenue Limit.calculating the Revenue Limit. Refer to pages 6 and 10 for actual and historical enrollment information respectively.
Stevens Point Area Public School District | 5
LETTER FROM THE SUPERINTENDENT
Dear Community Members,
In this book, you will fi nd the 2021-22 Budget Report for the Stevens Point Area Public School District. Th e report contains information about how we use funds to provide a world-class education for our students, and how we maximize the community’s investments in our public schools; the next generation’s education.
Th e School Board, administration, teachers and staff all do their part to operate our schools and educate our students effi ciently and eff ectively.
We are charged with ensuring that each of our students receives an education that prepares them for success - whatever that success may look like. Success may come in the form of post-secondary education, military service, employment, or another path as unique as each of our students. Th at journey to success begins in our 4K program with our youngest learners. Each of our nine elementary schools are working toward a common goal of sustaining professional learning communities within our schools that focus on high impact culturally responsive instructional strategies. We are continually analyzing data to make informed decisions that will, in turn, result in an increase in student learning and achievement.
At our fi ve secondary schools, leaders and educators are focused on enhancing student achievement through Universal Design for Learning to assure that all students can access our instructional programs utilizing structured collaboration time to assure high-quality curric-ulum and assessment. We are also creating advisory programs to provide all students with information about post-secondary education, careers, access to resources, skills for success and character education.
As a District, our priorities for the 2021-22 school year include the following:
1. Improve student engagement and achievement in an inclusive environment focused on literacy and the development of the whole child in both an in-person and virtual classroom setting in response to the global pandemic.
2. Foster a united culture through communication, collaboration, and all-staff development focused on student outcomes
3. Prioritize and align resources that promote healthy, sustainable, and fi nancially stable learning environments in the midst of the global pandemic.
4. Develop and strengthen partnerships with families and community to collectively support students.
Our students are able to achieve at high levels because of strong leadership, talented and dedicated faculty and staff , unique programs, strong community partnerships, and a loyal, committed, and supportive community. Th ank you for your ongoing support of students and staff in our District.
Sincerely,
Craig Gerlach Ed.S.Superintendent
6 | Stevens Point Area Public School District
HIGHLIGHTS OF THE 2021-22 BUDGET
Th e Stevens Point Area Public School District is committed to upholding its long tradition of excellence. Th e District continually seeks to increase effi ciency, raise the bar for student achievement, and provide a world-class education to all of its students.
Th e District's budget keeps these goals in mind, maximizing the eff ectiveness of community member's investment in their schools.Th e following overview provides general information on the new budget.
Referendum approved construction, remodeling, and deferred maintenance activity began in the 2019-20 school year and continues through the 2022-2023 school year.
The Funding Formula:
Since the 1993-94 school year, Wisconsin public school districts operate under a legislatively mandated revenue limit. A district's revenue limit consists basically of general aid and the tax levy. Th e prior year's revenue limit is adjusted by legislative decree and formula factors that include a three-year rolling average membership. Once the new budget year's revenue limit is determined, the allowable levy limit is determined by subtracting the state controlled general aid certifi ed to a district on October 15th from that new revenue limit.
Th e only signifi cant way in which a district's revenue limit can be increased is through approval of a referendum that is eitherrecurring or non-recurring. A recurring referendum establishes a new revenue limit and is the appropriate option to address ongoing operational expenses. A non-recurring referendum establishes a temporary revenue limit only for the period of time specifi ed in the referendum and is the appropriate option when additional funds are only needed for a specifi c purpose over a specifi c time period.
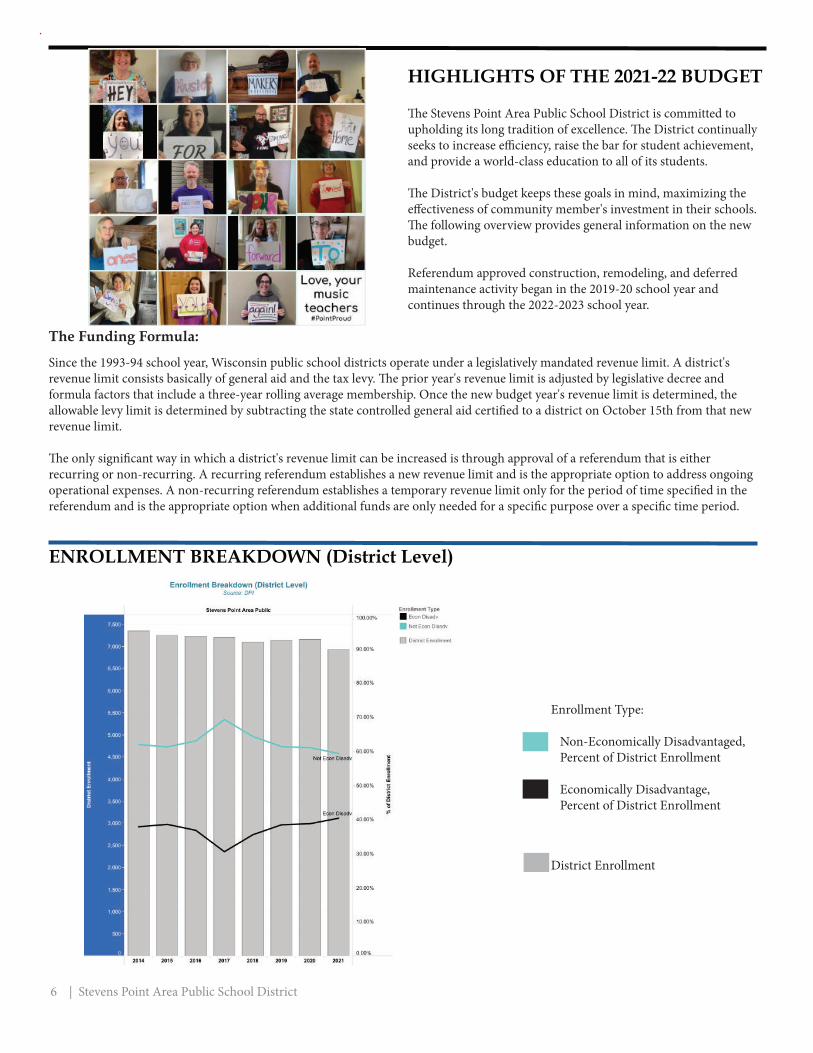
ENROLLMENT BREAKDOWN (District Level)
Enrollment Type:
Non-Economically Disadvantaged, Percent of District Enrollment
Economically Disadvantage, Percent of District Enrollment
District Enrollment
Stevens Point Area Public School District | 7
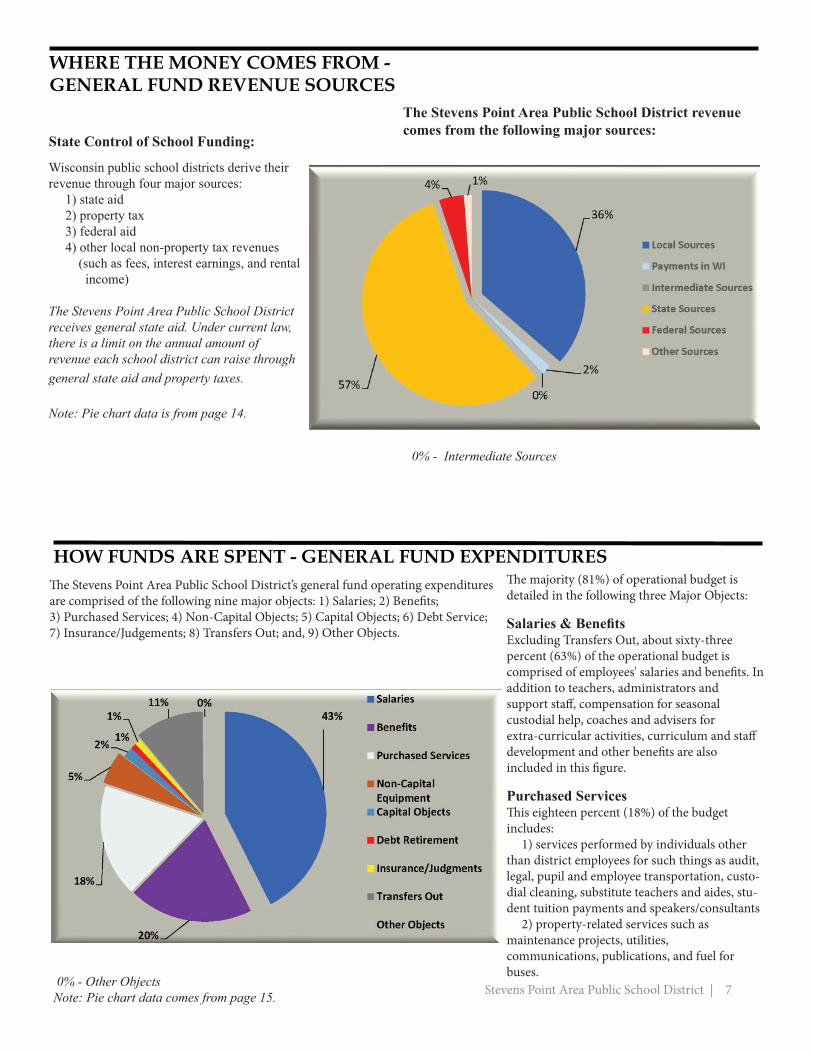
WHERE THE MONEY COMES FROM - GENERAL FUND REVENUE SOURCES
State Control of School Funding:
Wisconsin public school districts derive their revenue through four major sources: 1) state aid 2) property tax 3) federal aid 4) other local non-property tax revenues (such as fees, interest earnings, and rental income)
The Stevens Point Area Public School District receives general state aid. Under current law, there is a limit on the annual amount of revenue each school district can raise through general state aid and property taxes.
Note: Pie chart data is from page 14.
HOW FUNDS ARE SPENT - GENERAL FUND EXPENDITURES
The Stevens Point Area Public School District revenue comes from the following major sources:
0% - Intermediate Sources
Th e Stevens Point Area Public School District’s general fund operating expenditures are comprised of the following nine major objects: 1) Salaries; 2) Benefi ts; 3) Purchased Services; 4) Non-Capital Objects; 5) Capital Objects; 6) Debt Service; 7) Insurance/Judgements; 8) Transfers Out; and, 9) Other Objects.
0% - Other ObjectsNote: Pie chart data comes from page 15.
Th e majority (81%) of operational budget is detailed in the following three Major Objects:
Salaries & Benefi tsExcluding Transfers Out, about sixty-three percent (63%) of the operational budget is comprised of employees' salaries and benefi ts. In addition to teachers, administrators and support staff , compensation for seasonal custodial help, coaches and advisers for extra-curricular activities, curriculum and staff development and other benefi ts are also included in this fi gure.
Purchased ServicesTh is eighteen percent (18%) of the budget includes: 1) services performed by individuals other than district employees for such things as audit, legal, pupil and employee transportation, custo-dial cleaning, substitute teachers and aides, stu-dent tuition payments and speakers/consultants 2) property-related services such as maintenance projects, utilities, communications, publications, and fuel for buses.
8 | Stevens Point Area Public School District
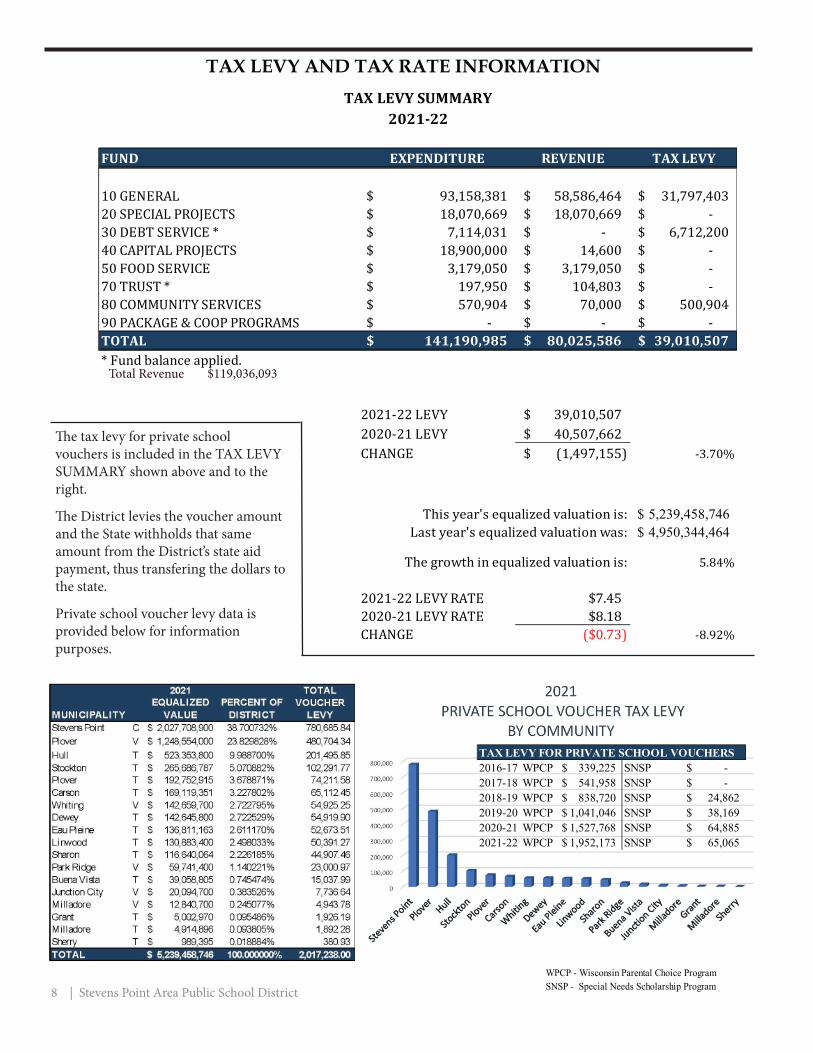
TAX LEVY AND TAX RATE INFORMATION
Th e tax levy for private school vouchers is included in the TAX LEVY SUMMARY shown above and to the right.
Th e District levies the voucher amount and the State withholds that same amount from the District’s state aid payment, thus transfering the dollars to the state.
Private school voucher levy data is provided below for information purposes.
WPCP - Wisconsin Parental Choice ProgramSNSP - Special Needs Scholarship Program
Total Revenue $119,036,093
TAX LEVY FOR PRIVATE SCHOOL VOUCHERS2016-17 WPCP 339,225$ SNSP -$ 2017-18 WPCP 541,958$ SNSP -$ 2018-19 WPCP 838,720$ SNSP 24,862$ 2019-20 WPCP 1,041,046$ SNSP 38,169$ 2020-21 WPCP 1,527,768$ SNSP 64,885$ 2021-22 WPCP 1,952,173$ SNSP 65,065$
FUND EXPENDITURE REVENUE TAX LEVY
10 GENERAL 93,158,381$ 58,586,464$ 31,797,403$ 20 SPECIAL PROJECTS 18,070,669$ 18,070,669$ -$ 30 DEBT SERVICE * 7,114,031$ -$ 6,712,200$ 40 CAPITAL PROJECTS 18,900,000$ 14,600$ -$ 50 FOOD SERVICE 3,179,050$ 3,179,050$ -$ 70 TRUST * 197,950$ 104,803$ -$ 80 COMMUNITY SERVICES 570,904$ 70,000$ 500,904$ 90 PACKAGE & COOP PROGRAMS -$ -$ -$ TOTAL 141,190,985$ 80,025,586$ 39,010,507$ * Fund balance applied.
2021-22 LEVY 39,010,507$ 2020-21 LEVY 40,507,662$ CHANGE (1,497,155)$ -3.70%
This year's equalized valuation is: 5,239,458,746$ Last year's equalized valuation was: 4,950,344,464$
The growth in equalized valuation is: 5.84%
2021-22 LEVY RATE $7.452020-21 LEVY RATE $8.18CHANGE ($0.73) -8.92%
TAX LEVY SUMMARY2021-22

Stevens Point Area Public School District | 9
SCHOOL DISTRICT TAX LEVY BY COMMUNITY
Equalized Value is the Fair Market Value of property within the school district as determined by the Department of Revenue. A school equalized levy is apportioned to a municipality, not directly to individual property owners.
Assessed Value is determined by a municipal assessor as of January 1st. A municipality’s assessed property value may be set greater than, equal to, or less than Equalized Value. A municipality levies businesses and individual property directly.
0% - Municipalities whose equalized valuation is less than 1% of the District total are the villages of Junction City and Milladore, and the towns of Buena Vista, Grant, Milladore, and Sherry.
SCHOOL DISTRICT EQUALIZED VALUATION
Th e Equalized Value pre-sented here is TID-OUT. Th is means that the value of any Tax Incremental District is excluded from the total Equalized Value shown to the left .
The District contains one city, Stevens Point; fi ve villages, Junction City, Milladore, Park Ridge, Plover, Whiting; and all or parts of the following towns, Buena Vista, Carson, Dewey, Eau Pleine, Grant, Hull, Linwood, Milladore, Plover, Sharon, Sherry, and Stockton.
2021EQUALIZED PERCENT OF
MUNICIPALITY VALUE DISTRICT TOTAL LEVYStevens Point C 2,027,708,900$ 38.700732% 15,097,351.84Plover V 1,248,554,000$ 23.829828% 9,296,136.67Hull T 523,353,800$ 9.988700% 3,896,642.40Stockton T 265,686,787$ 5.070882% 1,978,176.90Plover T 192,752,915$ 3.678871% 1,435,146.13Carson T 169,119,351$ 3.227802% 1,259,181.90Whiting V 142,659,700$ 2.722795% 1,062,175.98Dewey T 142,645,800$ 2.722529% 1,062,072.49Eau Pleine T 136,811,163$ 2.611170% 1,018,630.57Linwood T 130,883,400$ 2.498033% 974,495.28Sharon T 116,640,064$ 2.226185% 868,446.20Park Ridge V 59,741,400$ 1.140221% 444,805.93Buena Vista T 39,058,805$ 0.745474% 290,813.20Junction City V 20,094,700$ 0.383526% 149,615.54Milladore V 12,840,700$ 0.245077% 95,605.72Grant T 5,002,970$ 0.095486% 37,249.72Milladore T 4,914,896$ 0.093805% 36,593.97Sherry T 989,395$ 0.018884% 7,366.56TOTAL 5,239,458,746$ 100.000000% 39,010,507.00
10 | Stevens Point Area Public School District
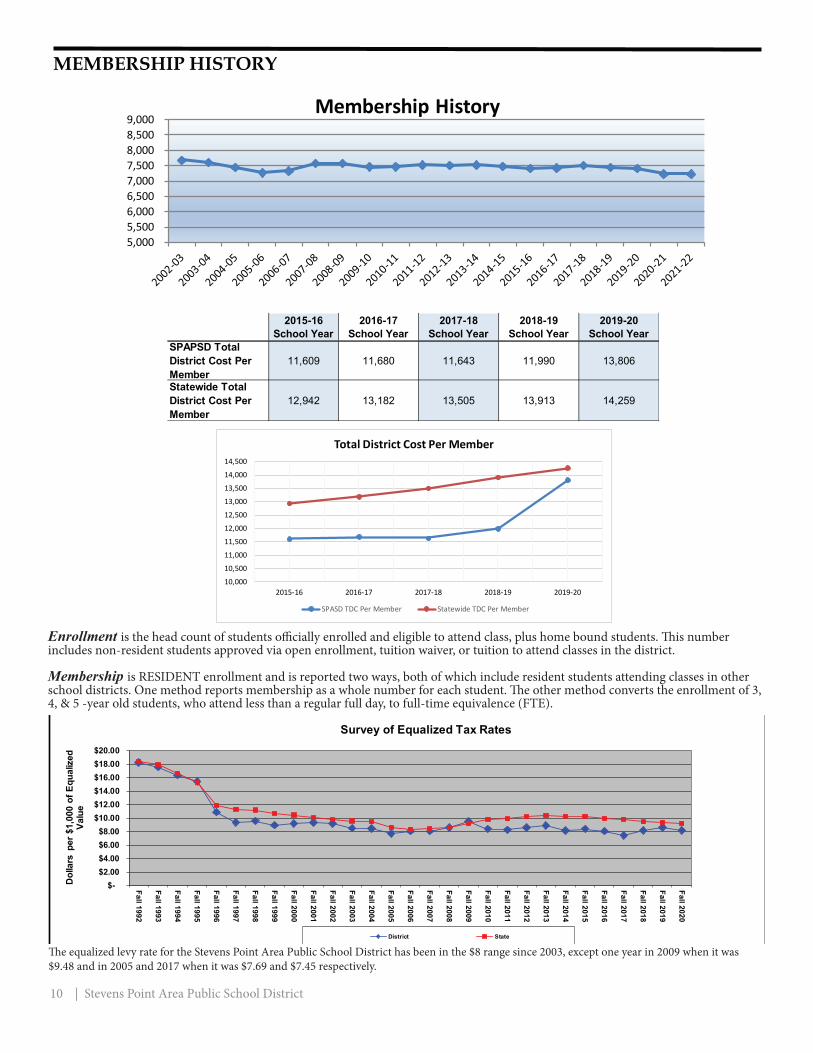
MEMBERSHIP HISTORY
Enrollment is the head count of students offi cially enrolled and eligible to attend class, plus home bound students. Th is number includes non-resident students approved via open enrollment, tuition waiver, or tuition to attend classes in the district.
Membership is RESIDENT enrollment and is reported two ways, both of which include resident students attending classes in other school districts. One method reports membership as a whole number for each student. Th e other method converts the enrollment of 3, 4, & 5 -year old students, who attend less than a regular full day, to full-time equivalence (FTE).
Th e equalized levy rate for the Stevens Point Area Public School District has been in the $8 range since 2003, except one year in 2009 when it was $9.48 and in 2005 and 2017 when it was $7.69 and $7.45 respectively.
$- $2.00 $4.00 $6.00 $8.00
$10.00 $12.00 $14.00 $16.00 $18.00 $20.00
Fall 1992
Fall 1993
Fall 1994
Fall 1995
Fall 1996
Fall 1997
Fall 1998
Fall 1999
Fall 2000
Fall 2001
Fall 2002
Fall 2003
Fall 2004
Fall 2005
Fall 2006
Fall 2007
Fall 2008
Fall 2009
Fall 2010
Fall 2011
Fall 2012
Fall 2013
Fall 2014
Fall 2015
Fall 2016
Fall 2017
Fall 2018
Fall 2019
Fall 2020
District State
Survey of Equalized Tax Rates
Dol
lars
per
$1,
000
of E
qual
ized
Va
lue
5,0005,5006,0006,5007,0007,5008,0008,5009,000
Membership History
2015-16 2016-17 2017-18 2018-19 2019-20School Year School Year School Year School Year School Year
14,259
SPAPSD Total District Cost Per Member
11,609 11,680 11,643 11,990 13,806
Statewide Total District Cost Per Member
12,942 13,182 13,505 13,913
10,00010,50011,00011,50012,00012,50013,00013,50014,00014,500
2015-16 2016-17 2017-18 2018-19 2019-20
Total District Cost Per Member
SPASD TDC Per Member Statewide TDC Per Member
Stevens Point Area Public School District | 11
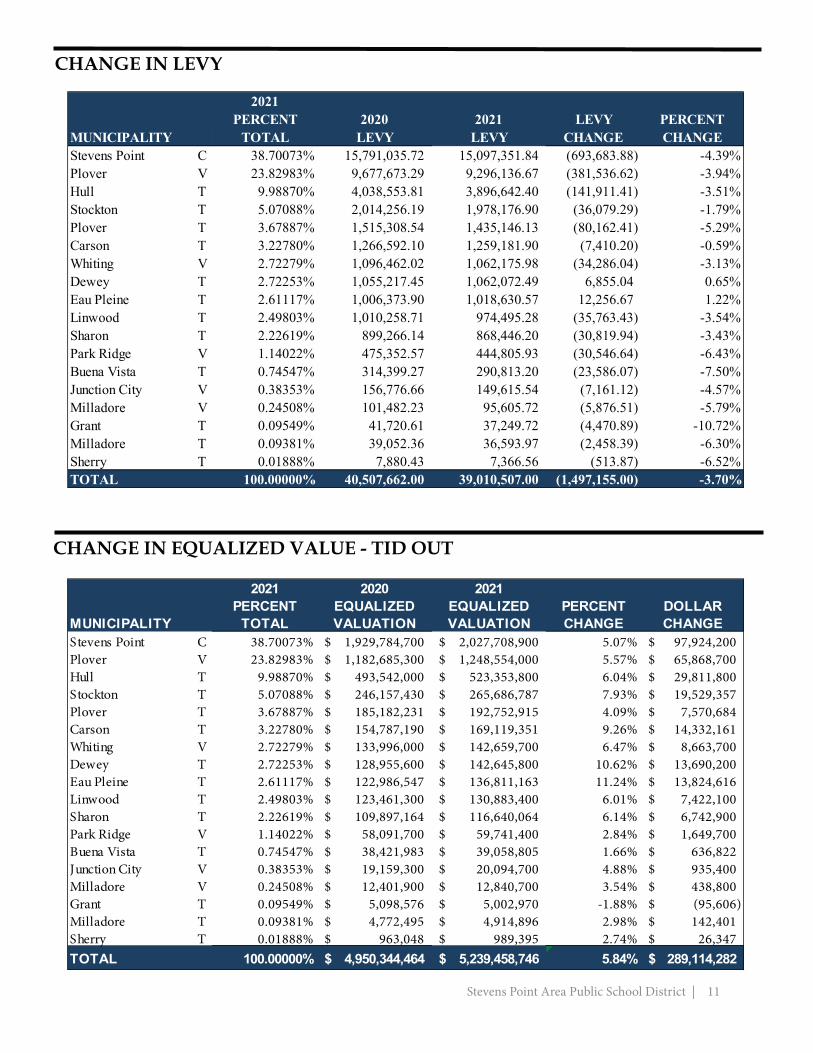
CHANGE IN LEVY
CHANGE IN EQUALIZED VALUE - TID OUT
2021 2020 2021PERCENT EQUALIZED EQUALIZED PERCENT DOLLAR
MUNICIPALITY TOTAL VALUATION VALUATION CHANGE CHANGEStevens Point C 38.70073% 1,929,784,700$ 2,027,708,900$ 5.07% 97,924,200$ Plover V 23.82983% 1,182,685,300$ 1,248,554,000$ 5.57% 65,868,700$ Hull T 9.98870% 493,542,000$ 523,353,800$ 6.04% 29,811,800$ Stockton T 5.07088% 246,157,430$ 265,686,787$ 7.93% 19,529,357$ Plover T 3.67887% 185,182,231$ 192,752,915$ 4.09% 7,570,684$ Carson T 3.22780% 154,787,190$ 169,119,351$ 9.26% 14,332,161$ Whiting V 2.72279% 133,996,000$ 142,659,700$ 6.47% 8,663,700$ Dewey T 2.72253% 128,955,600$ 142,645,800$ 10.62% 13,690,200$ Eau Pleine T 2.61117% 122,986,547$ 136,811,163$ 11.24% 13,824,616$ Linwood T 2.49803% 123,461,300$ 130,883,400$ 6.01% 7,422,100$ Sharon T 2.22619% 109,897,164$ 116,640,064$ 6.14% 6,742,900$ Park Ridge V 1.14022% 58,091,700$ 59,741,400$ 2.84% 1,649,700$ Buena Vista T 0.74547% 38,421,983$ 39,058,805$ 1.66% 636,822$ Junction City V 0.38353% 19,159,300$ 20,094,700$ 4.88% 935,400$ Milladore V 0.24508% 12,401,900$ 12,840,700$ 3.54% 438,800$ Grant T 0.09549% 5,098,576$ 5,002,970$ -1.88% (95,606)$ Milladore T 0.09381% 4,772,495$ 4,914,896$ 2.98% 142,401$ Sherry T 0.01888% 963,048$ 989,395$ 2.74% 26,347$ TOTAL 100.00000% 4,950,344,464$ 5,239,458,746$ 5.84% 289,114,282$
2021PERCENT 2020 2021 LEVY PERCENT
MUNICIPALITY TOTAL LEVY LEVY CHANGE CHANGEStevens Point C 38.70073% 15,791,035.72 15,097,351.84 (693,683.88) -4.39%Plover V 23.82983% 9,677,673.29 9,296,136.67 (381,536.62) -3.94%Hull T 9.98870% 4,038,553.81 3,896,642.40 (141,911.41) -3.51%Stockton T 5.07088% 2,014,256.19 1,978,176.90 (36,079.29) -1.79%Plover T 3.67887% 1,515,308.54 1,435,146.13 (80,162.41) -5.29%Carson T 3.22780% 1,266,592.10 1,259,181.90 (7,410.20) -0.59%Whiting V 2.72279% 1,096,462.02 1,062,175.98 (34,286.04) -3.13%Dewey T 2.72253% 1,055,217.45 1,062,072.49 6,855.04 0.65%Eau Pleine T 2.61117% 1,006,373.90 1,018,630.57 12,256.67 1.22%Linwood T 2.49803% 1,010,258.71 974,495.28 (35,763.43) -3.54%Sharon T 2.22619% 899,266.14 868,446.20 (30,819.94) -3.43%Park Ridge V 1.14022% 475,352.57 444,805.93 (30,546.64) -6.43%Buena Vista T 0.74547% 314,399.27 290,813.20 (23,586.07) -7.50%Junction City V 0.38353% 156,776.66 149,615.54 (7,161.12) -4.57%Milladore V 0.24508% 101,482.23 95,605.72 (5,876.51) -5.79%Grant T 0.09549% 41,720.61 37,249.72 (4,470.89) -10.72%Milladore T 0.09381% 39,052.36 36,593.97 (2,458.39) -6.30%Sherry T 0.01888% 7,880.43 7,366.56 (513.87) -6.52%TOTAL 100.00000% 40,507,662.00 39,010,507.00 (1,497,155.00) -3.70%
12 | Stevens Point Area Public School District
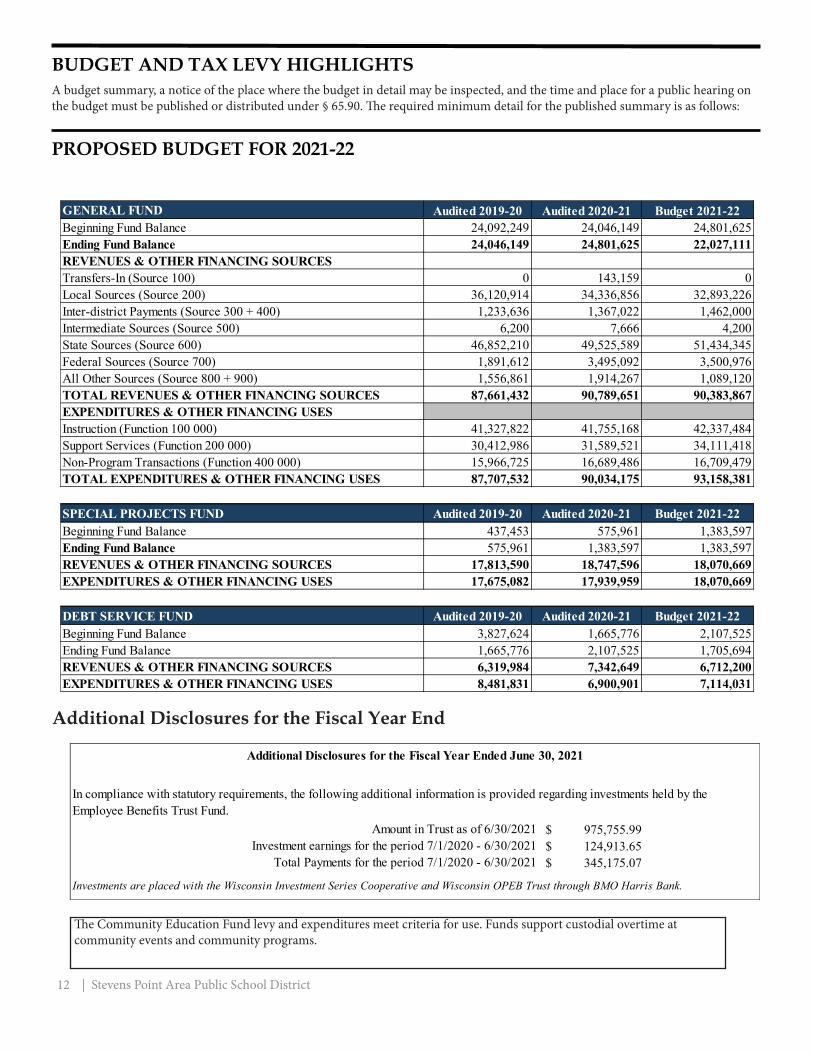
BUDGET AND TAX LEVY HIGHLIGHTSA budget summary, a notice of the place where the budget in detail may be inspected, and the time and place for a public hearing on the budget must be published or distributed under § 65.90. Th e required minimum detail for the published summary is as follows:
PROPOSED BUDGET FOR 2021-22
Additional Disclosures for the Fiscal Year End
Th e Community Education Fund levy and expenditures meet criteria for use. Funds support custodial overtime at community events and community programs.
975,755.99$ 124,913.65$ 345,175.07$
Investments are placed with the Wisconsin Investment Series Cooperative and Wisconsin OPEB Trust through BMO Harris Bank.
Total Payments for the period 7/1/2020 - 6/30/2021
Additional Disclosures for the Fiscal Year Ended June 30, 2021
In compliance with statutory requirements, the following additional information is provided regarding investments held by the Employee Benefits Trust Fund.
Amount in Trust as of 6/30/2021Investment earnings for the period 7/1/2020 - 6/30/2021
GENERAL FUND Audited 2019-20 Audited 2020-21 Budget 2021-22Beginning Fund Balance 24,092,249 24,046,149 24,801,625 Ending Fund Balance 24,046,149 24,801,625 22,027,111 REVENUES & OTHER FINANCING SOURCESTransfers-In (Source 100) 0 143,159 0 Local Sources (Source 200) 36,120,914 34,336,856 32,893,226 Inter-district Payments (Source 300 + 400) 1,233,636 1,367,022 1,462,000 Intermediate Sources (Source 500) 6,200 7,666 4,200 State Sources (Source 600) 46,852,210 49,525,589 51,434,345 Federal Sources (Source 700) 1,891,612 3,495,092 3,500,976 All Other Sources (Source 800 + 900) 1,556,861 1,914,267 1,089,120 TOTAL REVENUES & OTHER FINANCING SOURCES 87,661,432 90,789,651 90,383,867 EXPENDITURES & OTHER FINANCING USESInstruction (Function 100 000) 41,327,822 41,755,168 42,337,484 Support Services (Function 200 000) 30,412,986 31,589,521 34,111,418 Non-Program Transactions (Function 400 000) 15,966,725 16,689,486 16,709,479 TOTAL EXPENDITURES & OTHER FINANCING USES 87,707,532 90,034,175 93,158,381
SPECIAL PROJECTS FUND Audited 2019-20 Audited 2020-21 Budget 2021-22Beginning Fund Balance 437,453 575,961 1,383,597 Ending Fund Balance 575,961 1,383,597 1,383,597 REVENUES & OTHER FINANCING SOURCES 17,813,590 18,747,596 18,070,669 EXPENDITURES & OTHER FINANCING USES 17,675,082 17,939,959 18,070,669
DEBT SERVICE FUND Audited 2019-20 Audited 2020-21 Budget 2021-22Beginning Fund Balance 3,827,624 1,665,776 2,107,525 Ending Fund Balance 1,665,776 2,107,525 1,705,694 REVENUES & OTHER FINANCING SOURCES 6,319,984 7,342,649 6,712,200 EXPENDITURES & OTHER FINANCING USES 8,481,831 6,900,901 7,114,031
Stevens Point Area Public School District | 13
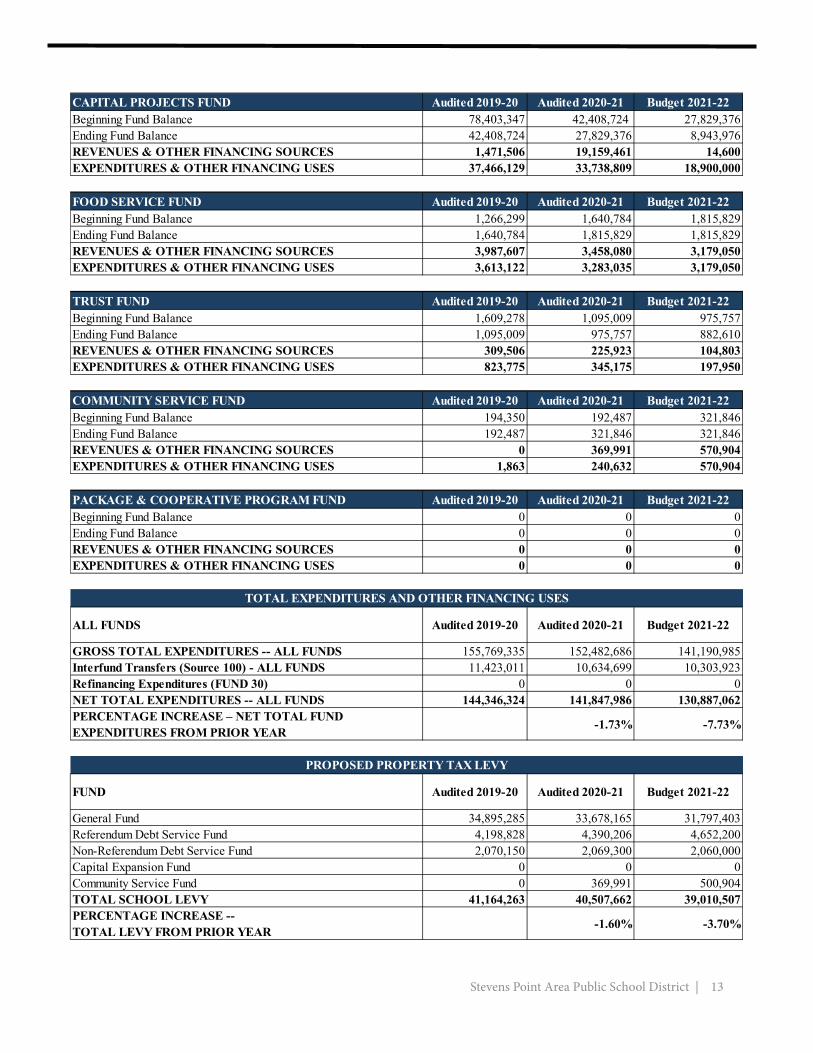
CAPITAL PROJECTS FUND Audited 2019-20 Audited 2020-21 Budget 2021-22Beginning Fund Balance 78,403,347 42,408,724 27,829,376 Ending Fund Balance 42,408,724 27,829,376 8,943,976 REVENUES & OTHER FINANCING SOURCES 1,471,506 19,159,461 14,600 EXPENDITURES & OTHER FINANCING USES 37,466,129 33,738,809 18,900,000
FOOD SERVICE FUND Audited 2019-20 Audited 2020-21 Budget 2021-22Beginning Fund Balance 1,266,299 1,640,784 1,815,829 Ending Fund Balance 1,640,784 1,815,829 1,815,829 REVENUES & OTHER FINANCING SOURCES 3,987,607 3,458,080 3,179,050 EXPENDITURES & OTHER FINANCING USES 3,613,122 3,283,035 3,179,050
TRUST FUND Audited 2019-20 Audited 2020-21 Budget 2021-22Beginning Fund Balance 1,609,278 1,095,009 975,757 Ending Fund Balance 1,095,009 975,757 882,610 REVENUES & OTHER FINANCING SOURCES 309,506 225,923 104,803 EXPENDITURES & OTHER FINANCING USES 823,775 345,175 197,950
COMMUNITY SERVICE FUND Audited 2019-20 Audited 2020-21 Budget 2021-22Beginning Fund Balance 194,350 192,487 321,846 Ending Fund Balance 192,487 321,846 321,846 REVENUES & OTHER FINANCING SOURCES 0 369,991 570,904 EXPENDITURES & OTHER FINANCING USES 1,863 240,632 570,904
PACKAGE & COOPERATIVE PROGRAM FUND Audited 2019-20 Audited 2020-21 Budget 2021-22Beginning Fund Balance 0 0 0 Ending Fund Balance 0 0 0 REVENUES & OTHER FINANCING SOURCES 0 0 0 EXPENDITURES & OTHER FINANCING USES 0 0 0
ALL FUNDS Audited 2019-20 Audited 2020-21 Budget 2021-22
GROSS TOTAL EXPENDITURES -- ALL FUNDS 155,769,335 152,482,686 141,190,985 Interfund Transfers (Source 100) - ALL FUNDS 11,423,011 10,634,699 10,303,923 Refinancing Expenditures (FUND 30) 0 0 0 NET TOTAL EXPENDITURES -- ALL FUNDS 144,346,324 141,847,986 130,887,062 PERCENTAGE INCREASE – NET TOTAL FUND EXPENDITURES FROM PRIOR YEAR -1.73% -7.73%
FUND Audited 2019-20 Audited 2020-21 Budget 2021-22
General Fund 34,895,285 33,678,165 31,797,403 Referendum Debt Service Fund 4,198,828 4,390,206 4,652,200 Non-Referendum Debt Service Fund 2,070,150 2,069,300 2,060,000 Capital Expansion Fund 0 0 0 Community Service Fund 0 369,991 500,904 TOTAL SCHOOL LEVY 41,164,263 40,507,662 39,010,507 PERCENTAGE INCREASE -- TOTAL LEVY FROM PRIOR YEAR -1.60% -3.70%
TOTAL EXPENDITURES AND OTHER FINANCING USES
PROPOSED PROPERTY TAX LEVY
14 | Stevens Point Area Public School District
EVALUATION OF ENERGY
PERFORMANCE INDICATORS
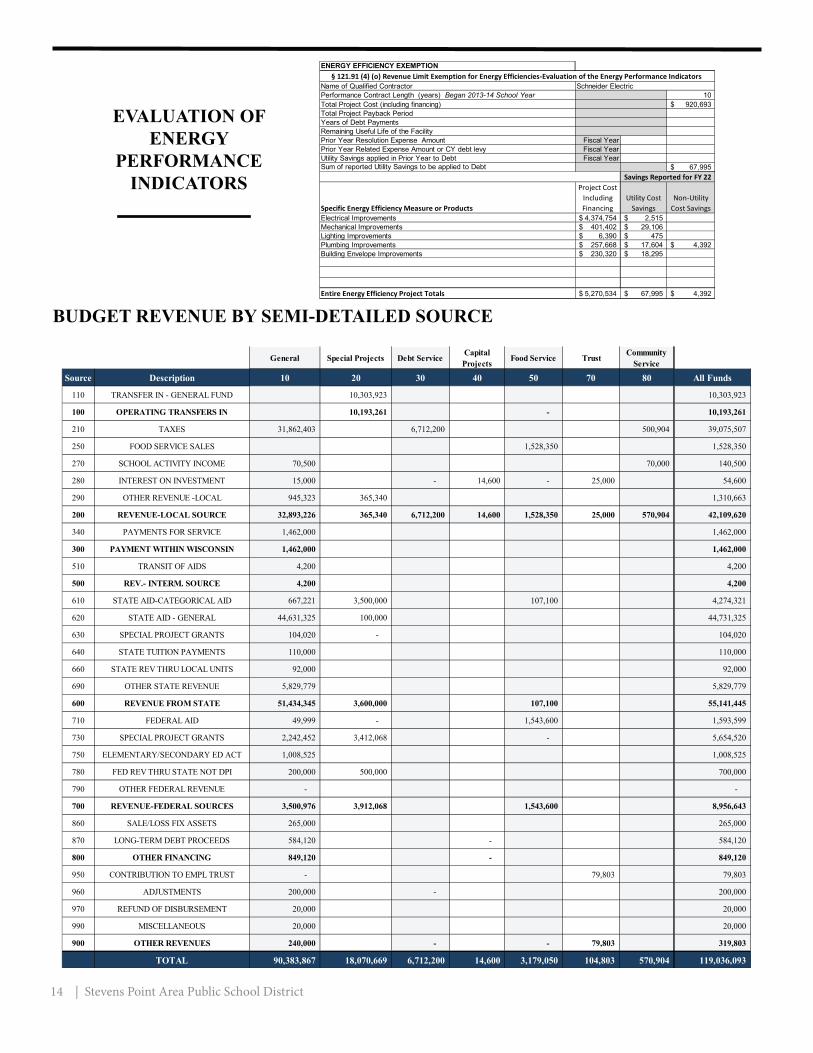
BUDGET REVENUE BY SEMI-DETAILED SOURCE
ENERGY EFFICIENCY EXEMPTION
Name of Qualified Contractor Performance Contract Length (years) Began 2013-14 School Year 10 Total Project Cost (including financing) 920,693$ Total Project Payback Period Years of Debt Payments Remaining Useful Life of the FacilityPrior Year Resolution Expense Amount Fiscal YearPrior Year Related Expense Amount or CY debt levy Fiscal YearUtility Savings applied in Prior Year to Debt Fiscal YearSum of reported Utility Savings to be applied to Debt 67,995$
Specific Energy Efficiency Measure or Products
Project Cost Including Financing
Utility Cost Savings
Non-Utility Cost Savings
Electrical Improvements 4,374,754$ 2,515$ Mechanical Improvements 401,402$ 29,106$ Lighting Improvements 6,390$ 475$ Plumbing Improvements 257,668$ 17,604$ 4,392$ Building Envelope Improvements 230,320$ 18,295$
Entire Energy Efficiency Project Totals 5,270,534$ 67,995$ 4,392$
§ 121.91 (4) (o) Revenue Limit Exemption for Energy Efficiencies-Evaluation of the Energy Performance Indicators Schneider Electric
Savings Reported for FY 22
General Special Projects Debt Service Capital Projects Food Service Trust Community
Service
Source Description 10 20 30 40 50 70 80 All Funds
110 TRANSFER IN - GENERAL FUND 10,303,923 10,303,923
100 OPERATING TRANSFERS IN 10,193,261 - 10,193,261
210 TAXES 31,862,403 6,712,200 500,904 39,075,507
250 FOOD SERVICE SALES 1,528,350 1,528,350
270 SCHOOL ACTIVITY INCOME 70,500 70,000 140,500
280 INTEREST ON INVESTMENT 15,000 - 14,600 - 25,000 54,600
290 OTHER REVENUE -LOCAL 945,323 365,340 1,310,663
200 REVENUE-LOCAL SOURCE 32,893,226 365,340 6,712,200 14,600 1,528,350 25,000 570,904 42,109,620
340 PAYMENTS FOR SERVICE 1,462,000 1,462,000
300 PAYMENT WITHIN WISCONSIN 1,462,000 1,462,000
510 TRANSIT OF AIDS 4,200 4,200
500 REV.- INTERM. SOURCE 4,200 4,200
610 STATE AID-CATEGORICAL AID 667,221 3,500,000 107,100 4,274,321
620 STATE AID - GENERAL 44,631,325 100,000 44,731,325
630 SPECIAL PROJECT GRANTS 104,020 - 104,020
640 STATE TUITION PAYMENTS 110,000 110,000
660 STATE REV THRU LOCAL UNITS 92,000 92,000
690 OTHER STATE REVENUE 5,829,779 5,829,779
600 REVENUE FROM STATE 51,434,345 3,600,000 107,100 55,141,445
710 FEDERAL AID 49,999 - 1,543,600 1,593,599
730 SPECIAL PROJECT GRANTS 2,242,452 3,412,068 - 5,654,520
750 ELEMENTARY/SECONDARY ED ACT 1,008,525 1,008,525
780 FED REV THRU STATE NOT DPI 200,000 500,000 700,000
790 OTHER FEDERAL REVENUE - -
700 REVENUE-FEDERAL SOURCES 3,500,976 3,912,068 1,543,600 8,956,643
860 SALE/LOSS FIX ASSETS 265,000 265,000
870 LONG-TERM DEBT PROCEEDS 584,120 - 584,120
800 OTHER FINANCING 849,120 - 849,120
950 CONTRIBUTION TO EMPL TRUST - 79,803 79,803
960 ADJUSTMENTS 200,000 - 200,000
970 REFUND OF DISBURSEMENT 20,000 20,000
990 MISCELLANEOUS 20,000 20,000
900 OTHER REVENUES 240,000 - - 79,803 319,803
TOTAL 90,383,867 18,070,669 6,712,200 14,600 3,179,050 104,803 570,904 119,036,093
Stevens Point Area Public School District | 15
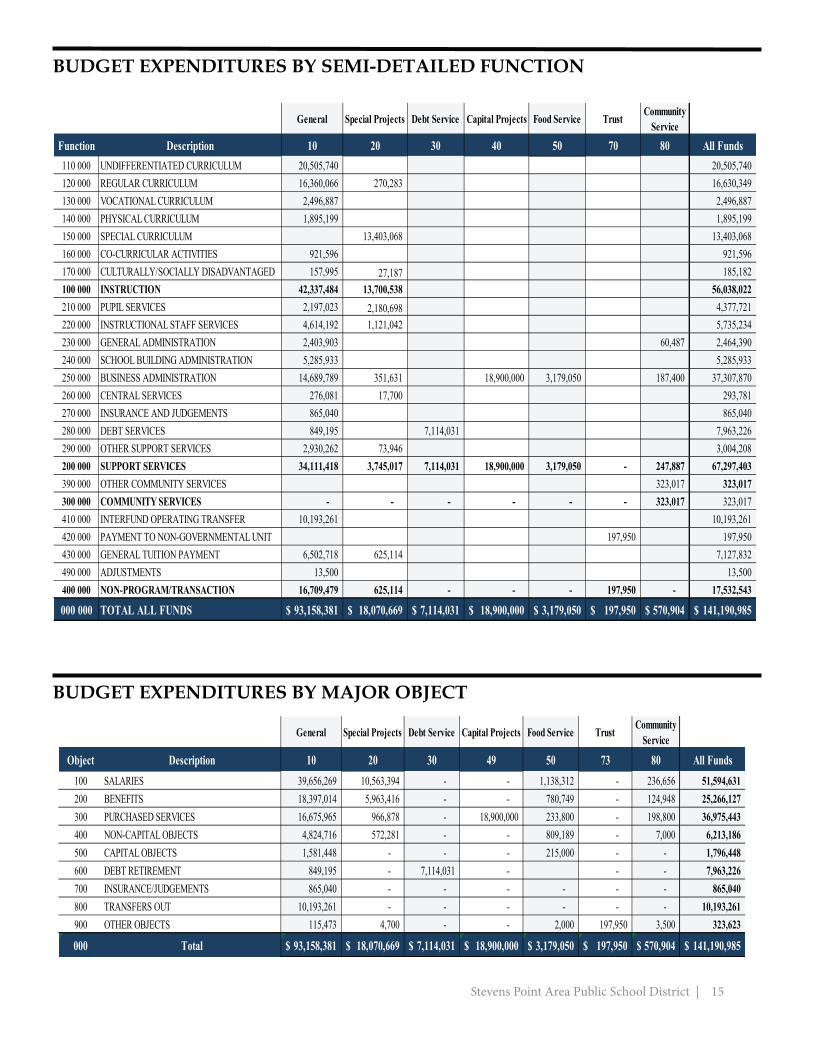
BUDGET EXPENDITURES BY SEMI-DETAILED FUNCTION
BUDGET EXPENDITURES BY MAJOR OBJECT
General Special Projects Debt Service Capital Projects Food Service Trust Community Service
Function Description 10 20 30 40 50 70 80 All Funds110 000 UNDIFFERENTIATED CURRICULUM 20,505,740 20,505,740 120 000 REGULAR CURRICULUM 16,360,066 270,283 16,630,349 130 000 VOCATIONAL CURRICULUM 2,496,887 2,496,887 140 000 PHYSICAL CURRICULUM 1,895,199 1,895,199 150 000 SPECIAL CURRICULUM 13,403,068 13,403,068 160 000 CO-CURRICULAR ACTIVITIES 921,596 921,596 170 000 CULTURALLY/SOCIALLY DISADVANTAGED 157,995 27,187 185,182 100 000 INSTRUCTION 42,337,484 13,700,538 56,038,022 210 000 PUPIL SERVICES 2,197,023 2,180,698 4,377,721 220 000 INSTRUCTIONAL STAFF SERVICES 4,614,192 1,121,042 5,735,234 230 000 GENERAL ADMINISTRATION 2,403,903 60,487 2,464,390 240 000 SCHOOL BUILDING ADMINISTRATION 5,285,933 5,285,933 250 000 BUSINESS ADMINISTRATION 14,689,789 351,631 18,900,000 3,179,050 187,400 37,307,870 260 000 CENTRAL SERVICES 276,081 17,700 293,781 270 000 INSURANCE AND JUDGEMENTS 865,040 865,040 280 000 DEBT SERVICES 849,195 7,114,031 7,963,226 290 000 OTHER SUPPORT SERVICES 2,930,262 73,946 3,004,208 200 000 SUPPORT SERVICES 34,111,418 3,745,017 7,114,031 18,900,000 3,179,050 - 247,887 67,297,403 390 000 OTHER COMMUNITY SERVICES 323,017 323,017 300 000 COMMUNITY SERVICES - - - - - - 323,017 323,017 410 000 INTERFUND OPERATING TRANSFER 10,193,261 10,193,261 420 000 PAYMENT TO NON-GOVERNMENTAL UNIT 197,950 197,950 430 000 GENERAL TUITION PAYMENT 6,502,718 625,114 7,127,832 490 000 ADJUSTMENTS 13,500 13,500 400 000 NON-PROGRAM/TRANSACTION 16,709,479 625,114 - - - 197,950 - 17,532,543
000 000 TOTAL ALL FUNDS 93,158,381$ 18,070,669$ 7,114,031$ 18,900,000$ 3,179,050$ 197,950$ 570,904$ 141,190,985$
General Special Projects Debt Service Capital Projects Food Service Trust Community Service
Object Description 10 20 30 49 50 73 80 All Funds100 SALARIES 39,656,269 10,563,394 - - 1,138,312 - 236,656 51,594,631 200 BENEFITS 18,397,014 5,963,416 - - 780,749 - 124,948 25,266,127 300 PURCHASED SERVICES 16,675,965 966,878 - 18,900,000 233,800 - 198,800 36,975,443 400 NON-CAPITAL OBJECTS 4,824,716 572,281 - - 809,189 - 7,000 6,213,186 500 CAPITAL OBJECTS 1,581,448 - - - 215,000 - - 1,796,448 600 DEBT RETIREMENT 849,195 - 7,114,031 - - - 7,963,226 700 INSURANCE/JUDGEMENTS 865,040 - - - - - - 865,040 800 TRANSFERS OUT 10,193,261 - - - - - - 10,193,261 900 OTHER OBJECTS 115,473 4,700 - - 2,000 197,950 3,500 323,623
000 Total 93,158,381$ 18,070,669$ 7,114,031$ 18,900,000$ 3,179,050$ 197,950$ 570,904$ 141,190,985$

16 | Stevens Point Area Public School District
HOW TO READ YOUR PROPERTY TAX BILLTh e following information explains the diff erent parts of your tax bill. Tax bills are mailed annually in mid-December and should look much like the image below; this version has personal information removed. Each letter corresponds to an explaination of that item on the bill.
A C DB
F
E
G H I
J K L
M
N
A) Assessed Value Land:Th e value of taxable land, as determined by the assessor for the purpose of taxation.
B) Assessed Value Improvements:Th e value of taxable buildings and improvements, as determined by the assessor for the purpose of taxation.
C) Total Assessed Value:Th e total value of land and buildings, as determined by the assessor for the purpose of taxation. Th is fi gure is the sum of A and B above, and may be equal to, greater than, or lower than the fair market value of the property. Th e Total Assessed Value is multiplied by the Net Assessed Value (tax rate) to determine the amount of tax that each property owner must pay before credits.
D) Average Assessment Ratio:Th e average assessment ratio is determined by the Wisconsin Department of Revenue and is used in calculating the estimated fair market value shown on the tax bill. Th e assessed value, divided by the average assessment ratio, equals the estimated fair market value. For example, if the assessment of a parcel of land, which sold for $150,000 (fair market value) was $140,000, the assessment ratio is said to be 93% (140,000 divided by 150,000).
Assessed Value Land Ass’d Value Improvements Total Assessed Value Avg. Assmt. Ratio 8,900 73,800 82,700 0.9643 Net Assessed Value 0.025194294 (Does NOT refl ect credits) Est. Fair Mkt. Land Est. Fair Mkt.Improvements Total Est. Fair Mkt A Star in this box School Taxes reduced by $ 113.16 9,200 76,500 85,700 means Unpaid Prior school levy tax credit Year Taxes.
2020 2021 2020 2021 % Tax Taxing Jurisdiction Est.State Aids Est.State Aids Net Tax Net Tax Change Allocated Tax Dist. Allocated Tax Dist. STATE OF WISCONSIN 14.48 14.55 0.5% PORTAGE COUNTY 1,064,448 1,086,033 448.54 459.72 2.5% CITY OF STEVENS POINT 5,028,948 5,067,374 814.01 812.21 -0.2% STEVENS POINT SCHOOL DIST 15,532,351 15,365,422 609.87 648.84 6.4% MIDSTATE VTAE DISTRICT 403,096 349,814 147.97 148.24 0.2%
Total 22,028,843 21,868,643 2,034.87 2,083.56 2.4% First Dollar Credit 56.74 56.87 0.2% Parcel #: 99-999999999 Lottery & Gaming Credit 79.09 96.85 22.5% Net Property Tax 1,899.04 1,929.84 1.6%
Make Check Payable To: Full Payment Due On or Before January 31, 2022 Net Property Tax 1,929.84 CITY OF STEVENS POINT $1,929.84 C/O TREASURER’S OFFICE 1515 STRONGS AVE Or pay the following installments to: STEVENS POINT WI 54481-3594 592.24 DUE BY 01/31/2022 715-346-1557 668,80 DUE BY 04/30/2022 668.80 DUE BY 07/31/2022 Corey Ladick, Stevens Point TOTAL DUE FOR FULL PAYMENT Comptroller-Treasurer PAY BY JANUARY 31, 2022 $ 1,929.84 Note: This tax bill is an example. Warning: If not paid by due dates, installment option is lost and total tax is delinquent subject to interest and, if applicable, penalty. Failure to Pay on time. See reverse.
Stevens Point Area Public School District | 17
E) Net Assessed Value Rate (Tax Rate): Th e tax rate is determined by dividing the amount of the tax levy -- that is, the total amount that is taxed in the entire district -- by the total assessed value of all of the property in the district. Th e tax rate is then multiplied by the total assessed value to determine the amount of tax that each property owner must pay.
F) Estimated Fair Market Land: Th is fi gure is the assessed value land, fi gure (A), divided by the average assessment ratio, fi gure (D).
G) Estimated Fair Market Improvements: Th is fi gure is the assessed value improvements, fi gure (B), divided by the average assessment ratio, fi gure (D).
H) Total Estimated Fair Market Value: Th is fi gure is the sum of the estimated fair market land, fi gure (F), and the estimated fair market improvements, fi gure (G).
I) School Levy Tax Credit: Th e school levy tax credit is a credit paid directly to municipalities, not to the school district, in an eff ort to directly off set property taxes. Despite the fact that this credit goes to municipalities, the state labels the school levy credit dollars as part of its commitment to funding education. School levy tax credits are distributed based on each municipality’s share of statewide levies for school purposes. Th ese amounts are based upon the value of individual property as a percentage of a district’s total value. Th is credit is automatically applied to all qualifi ed properties.
J) Taxing Jurisdictions: In many parts of the state, there are fi ve taxing jurisdictions that determine their own levy, the state; the county; the city or village; the school district; and, the local technical college. Th ose who have levied a tax are listed in this area of the tax bill.
K) State Aid: Th e amounts in these columns show state aid received for each jurisdiction, for the current and the prior tax year. It is important to note that the most recently passed state budget may increase or decrease the amount of aid provided to schools and would, inversely, decrease or increase public school property taxes.
L) Prior Year Net Taxes: Th e data shown here compares each jurisdiction’s net taxes from the prior year to the current year and provides the corresponding percent change.
M) First Dollar Credit and Lottery and Gaming Credit: Th e First Dollar Credit is another direct property tax credit. Th e money for this credit does not pass through school districts, however, the state considers it part of its commitment to education. Th e First Dollar Credit is automatically applied to all qualifying properties.
Th e Lottery and Gaming Credit is also a direct property tax credit, provided by the State, derived from lottery and gaming revenues. Th e lottery and gaming credit is determined each November and varies depending on annual revenue gained from lotteries, pari-mutuel on-track betting, and bingo. In most cases, the credit is applied automatically.
N) Net Property Tax: Th is amount is the total property tax due aft er subtracting lottery and gaming credits.
Boston School Forest Resident - Freddie the Frog
18 | Stevens Point Area Public School District
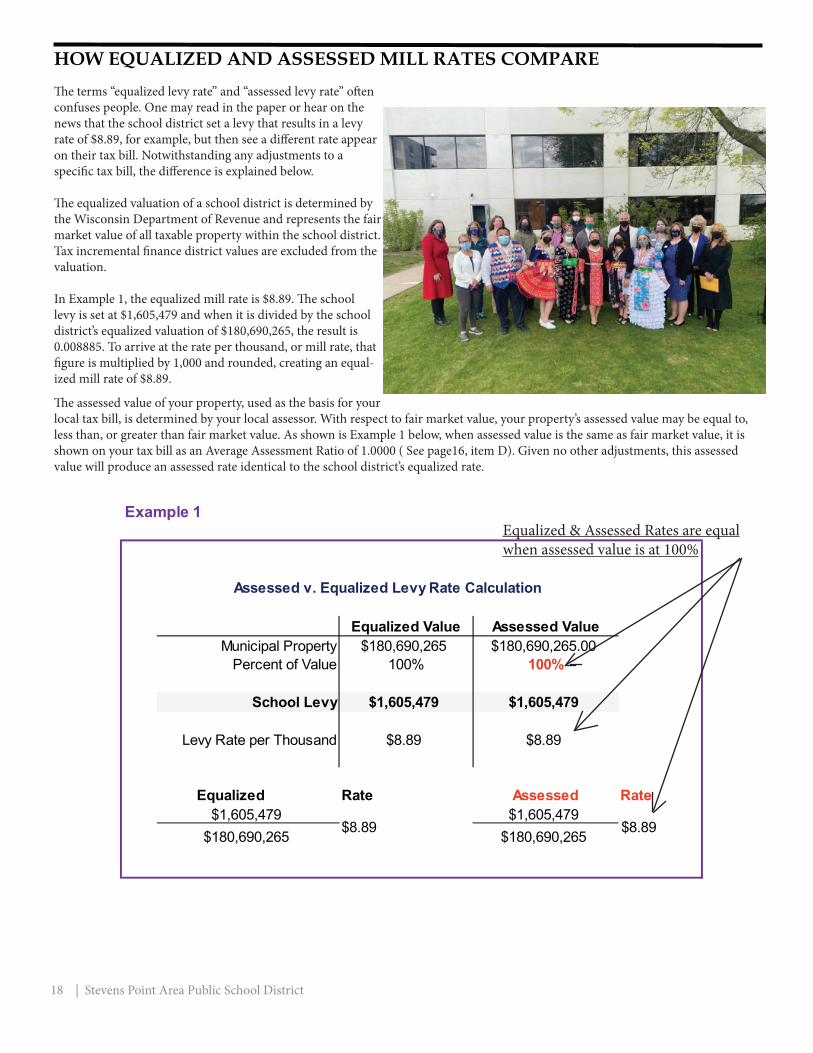
HOW EQUALIZED AND ASSESSED MILL RATES COMPARETh e terms “equalized levy rate” and “assessed levy rate” oft en confuses people. One may read in the paper or hear on the news that the school district set a levy that results in a levy rate of $8.89, for example, but then see a diff erent rate appear on their tax bill. Notwithstanding any adjustments to a specifi c tax bill, the diff erence is explained below.
Th e equalized valuation of a school district is determined by the Wisconsin Department of Revenue and represents the fair market value of all taxable property within the school district. Tax incremental fi nance district values are excluded from the valuation.
In Example 1, the equalized mill rate is $8.89. Th e school levy is set at $1,605,479 and when it is divided by the school district’s equalized valuation of $180,690,265, the result is 0.008885. To arrive at the rate per thousand, or mill rate, that fi gure is multiplied by 1,000 and rounded, creating an equal-ized mill rate of $8.89.
Th e assessed value of your property, used as the basis for your local tax bill, is determined by your local assessor. With respect to fair market value, your property’s assessed value may be equal to, less than, or greater than fair market value. As shown is Example 1 below, when assessed value is the same as fair market value, it is shown on your tax bill as an Average Assessment Ratio of 1.0000 ( See page16, item D). Given no other adjustments, this assessed value will produce an assessed rate identical to the school district’s equalized rate.
Example 1
Equalized Value Assessed ValueMunicipal Property $180,690,265 $180,690,265.00
Percent of Value 100% 100%
School Levy $1,605,479 $1,605,479
Levy Rate per Thousand $8.89 $8.89
Equalized Rate Assessed Rate$1,605,479 $1,605,479
$180,690,265 $180,690,265
Assessed v. Equalized Levy Rate Calculation
$8.89 $8.89
Equalized & Assessed Rates are equal when assessed value is at 100%
Stevens Point Area Public School District | 19
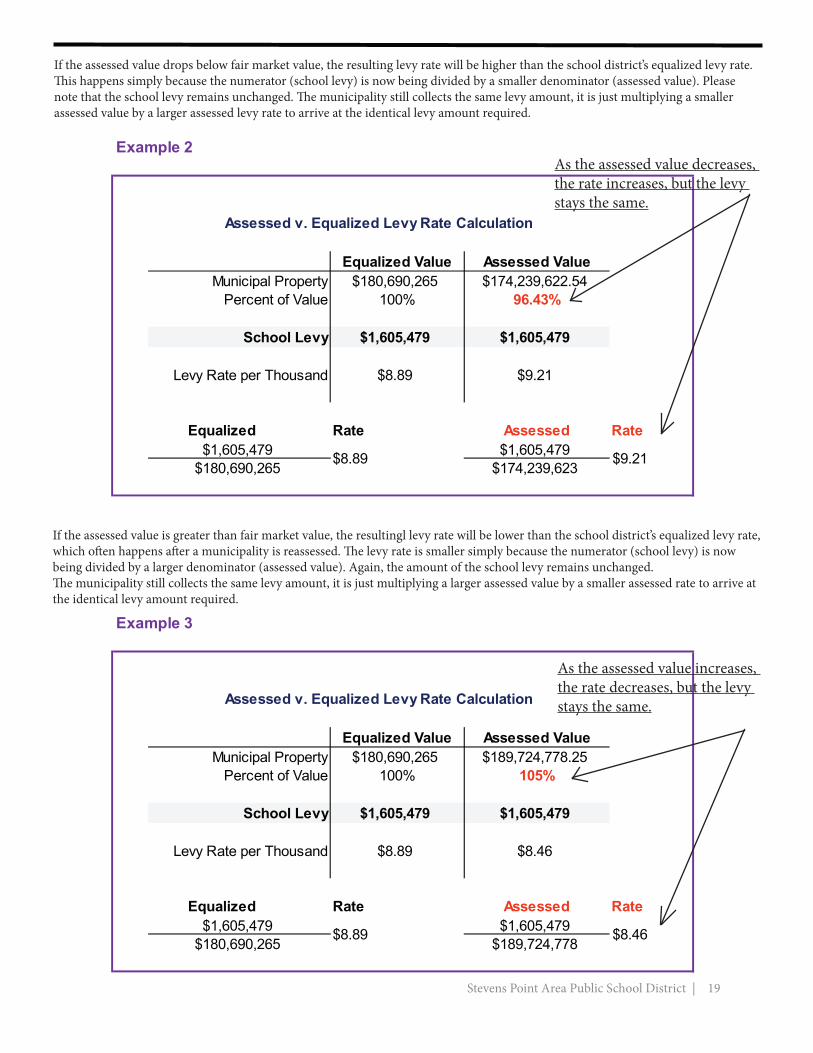
If the assessed value drops below fair market value, the resulting levy rate will be higher than the school district’s equalized levy rate. Th is happens simply because the numerator (school levy) is now being divided by a smaller denominator (assessed value). Please note that the school levy remains unchanged. Th e municipality still collects the same levy amount, it is just multiplying a smaller assessed value by a larger assessed levy rate to arrive at the identical levy amount required.
If the assessed value is greater than fair market value, the resultingl levy rate will be lower than the school district’s equalized levy rate, which oft en happens aft er a municipality is reassessed. Th e levy rate is smaller simply because the numerator (school levy) is now being divided by a larger denominator (assessed value). Again, the amount of the school levy remains unchanged. Th e municipality still collects the same levy amount, it is just multiplying a larger assessed value by a smaller assessed rate to arrive at the identical levy amount required.
Example 2
Equalized Value Assessed ValueMunicipal Property $180,690,265 $174,239,622.54
Percent of Value 100% 96.43%
School Levy $1,605,479 $1,605,479
Levy Rate per Thousand $8.89 $9.21
Equalized Rate Assessed Rate$1,605,479 $1,605,479
$180,690,265 $174,239,623
Assessed v. Equalized Levy Rate Calculation
$8.89 $9.21
Example 3
Equalized Value Assessed ValueMunicipal Property $180,690,265 $189,724,778.25
Percent of Value 100% 105%
School Levy $1,605,479 $1,605,479
Levy Rate per Thousand $8.89 $8.46
Equalized Rate Assessed Rate$1,605,479 $1,605,479
$180,690,265 $189,724,778
Assessed v. Equalized Levy Rate Calculation
$8.89 $8.46
As the assessed value decreases, the rate increases, but the levy stays the same.
As the assessed value increases, the rate decreases, but the levy stays the same.
20 | Stevens Point Area Public School District
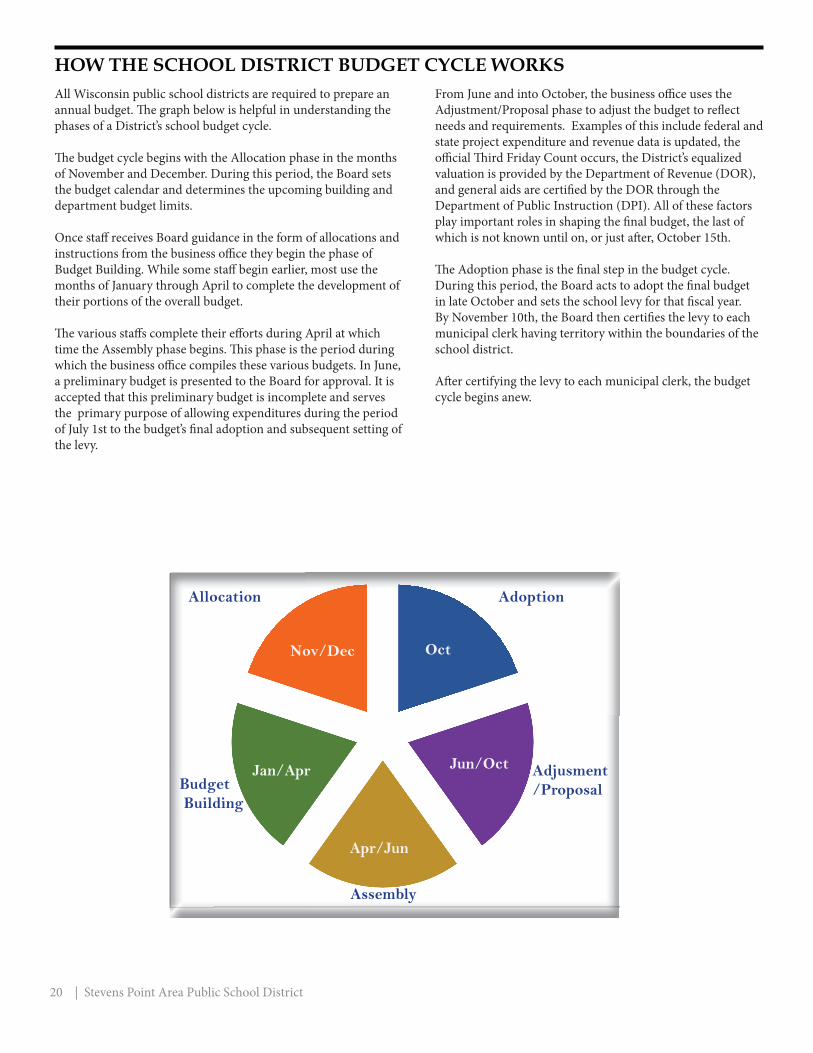
HOW THE SCHOOL DISTRICT BUDGET CYCLE WORKSAll Wisconsin public school districts are required to prepare an annual budget. Th e graph below is helpful in understanding the phases of a District’s school budget cycle.
Th e budget cycle begins with the Allocation phase in the months of November and December. During this period, the Board sets the budget calendar and determines the upcoming building and department budget limits.
Once staff receives Board guidance in the form of allocations and instructions from the business offi ce they begin the phase of Budget Building. While some staff begin earlier, most use the months of January through April to complete the development of their portions of the overall budget.
Th e various staff s complete their eff orts during April at which time the Assembly phase begins. Th is phase is the period during which the business offi ce compiles these various budgets. In June, a preliminary budget is presented to the Board for approval. It is accepted that this preliminary budget is incomplete and serves the primary purpose of allowing expenditures during the period of July 1st to the budget’s fi nal adoption and subsequent setting of the levy.
From June and into October, the business offi ce uses the Adjustment/Proposal phase to adjust the budget to refl ect needs and requirements. Examples of this include federal and state project expenditure and revenue data is updated, the offi cial Th ird Friday Count occurs, the District’s equalized valuation is provided by the Department of Revenue (DOR), and general aids are certifi ed by the DOR through the Department of Public Instruction (DPI). All of these factors play important roles in shaping the fi nal budget, the last of which is not known until on, or just aft er, October 15th.
Th e Adoption phase is the fi nal step in the budget cycle. During this period, the Board acts to adopt the fi nal budget in late October and sets the school levy for that fi scal year. By November 10th, the Board then certifi es the levy to each municipal clerk having territory within the boundaries of the school district.
Aft er certifying the levy to each municipal clerk, the budget cycle begins anew.
Nov/Dec Oct
Jun/OctJan/Apr
Apr/Jun
Allocation Adoption
Adjusment/ProposalBudget
Building
Assembly
Stevens Point Area Public School District | 21
WUFAR FUND ACCOUNTINGAll Wisconsin school districts are required to prepare budgets according to the Wisconsin Uniform Financial Accounting Requirements (WUFAR), which prescribes the use of modifi ed accrual fund accounting. A separate budget is established for each fund in which is recorded its own receipts, disbursements, and fund balance. Below is a brief description of funds used in this District.
Instructional Funds:Instructional funds are funds where elementary and secondary instruction (i.e. K - 12) activities are recorded. Th e following instructional funds are used in this District.
Fund 10 - General Fund Th e General Fund accounts for all fi nancial transactions relating to the District’s primary operations. Th e General Fund accounts for about three-quarters of all District expenditures.
Fund 21 - Special Revenue Trust FundTh is fund accounts for funds held in trust by the District. Revenue sources include gift s and donations from private parties. Cash and investments in this fund are expended pursuant to donor specifi cations. Th ere may be a fund balance in this fund.
Fund 27 - Special Education FundTh is fund accounts for special education and related services funded wholly or in part with state or federal special education aid or charges for services provided to other districts as a result of being a host district for a special education package or coopera-tive program. No fund balance or defi cit can exist in this fund.
Debt Service Funds:Th ese funds record transactions are related to repayment of the following general obligation debt: promissory notes (issued per statute 67.12(12)), bonds and state trust fund loans. Debt tax levies must be recorded in these funds.
Fund 38 - Non Referendum Approved Debt Service FundTh is fund accounts for transactions involving the repayment of debt issues not approved by referendum. A fund balance may exist in this fund.
Fund 39 - Referendum Approved Debt Service FundTh is fund accounts for transactions involving the repayment of debt issues approved by referendum. A fund balance may exist in this fund.
Capital Projects Funds:Th ese funds account for construction expenditures fi nanced through the use of bonds, promissory notes issued per statute67.12(12), state trust fund loans, land contracts, an expansion fund tax levy established per statute 120.10(10m).
Fund 46 - Long Term Capital Improvement Trust FundFunded with transfers from the General Fund for capital improvement plan activities.
Food and Community Service Funds:Th ese funds account for and report transactions of the District’s food and community service activities.
Fund 50 - Food Service FundAll revenues and expenditures related to pupil and elderly food service activities are recorded in this fund. No defi cit is allowed in the District’s Food Service Fund. A fund balance is permitted.
Fund 80 - Community Service FundTh is fund accounts for activities such as adult education, community recreation programs such as evening swimming pool operation and soft ball leagues, elderly food service pro-grams, non-special education preschool, day care services, and other programs which are not elementary and secondary educational programs but have the primary function of serving the community. Th e District may adopt a separate tax levy for this Fund.
Trust Funds:Th ese funds are used to account for assets held by the District in a trustee capacity for individuals, private organizations, other governments and/or other funds.
Fund 73 - Employee Benefi t Trust FundTh is fund accounts for resources held in trust for formally established defi ned benefi t pension plans, defi ned contribution plans, or employee benefi t plans. Such plans must be legally established in accordance with state and federal law.
Source: Wisconsin Department of Public Instruction, Wisconsin Uniform Financial Accounting Requirement (WUFAR) Handbook, and business offi ce edifi cation.
22 | Stevens Point Area Public School District
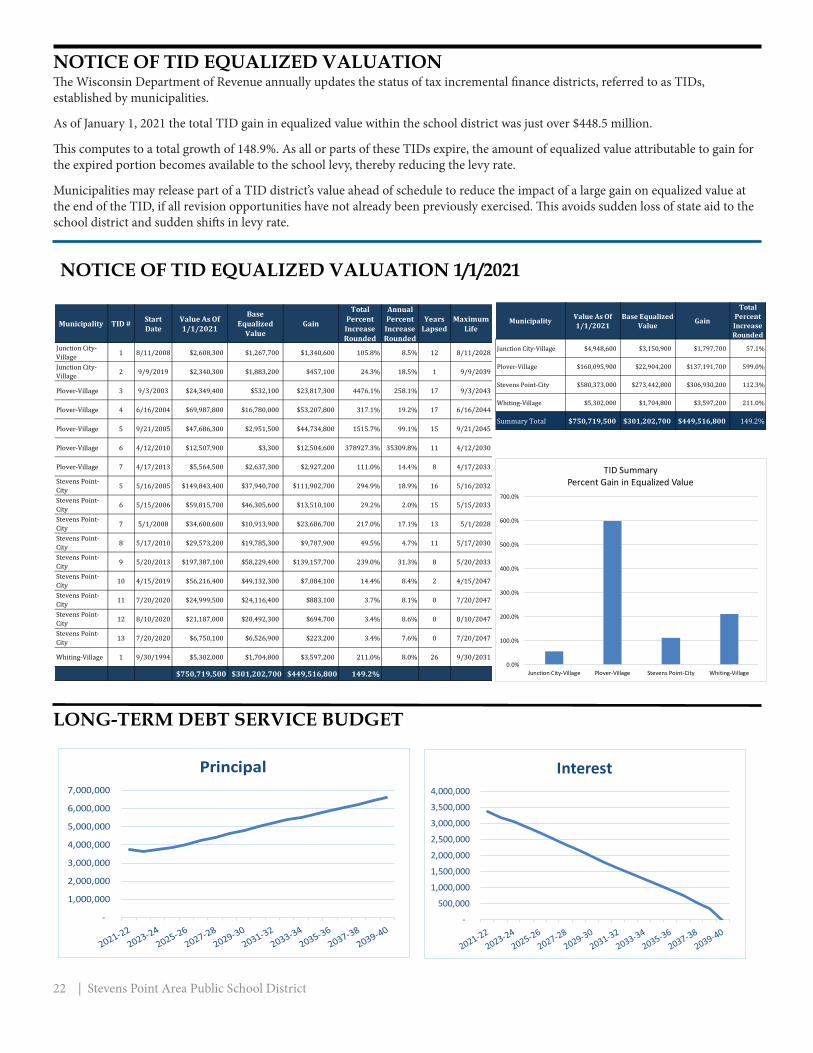
NOTICE OF TID EQUALIZED VALUATIONTh e Wisconsin Department of Revenue annually updates the status of tax incremental fi nance districts, referred to as TIDs, established by municipalities.
As of January 1, 2021 the total TID gain in equalized value within the school district was just over $448.5 million.
Th is computes to a total growth of 148.9%. As all or parts of these TIDs expire, the amount of equalized value attributable to gain for the expired portion becomes available to the school levy, thereby reducing the levy rate.
Municipalities may release part of a TID district’s value ahead of schedule to reduce the impact of a large gain on equalized value at the end of the TID, if all revision opportunities have not already been previously exercised. Th is avoids sudden loss of state aid to the school district and sudden shift s in levy rate.
NOTICE OF TID EQUALIZED VALUATION 1/1/2021
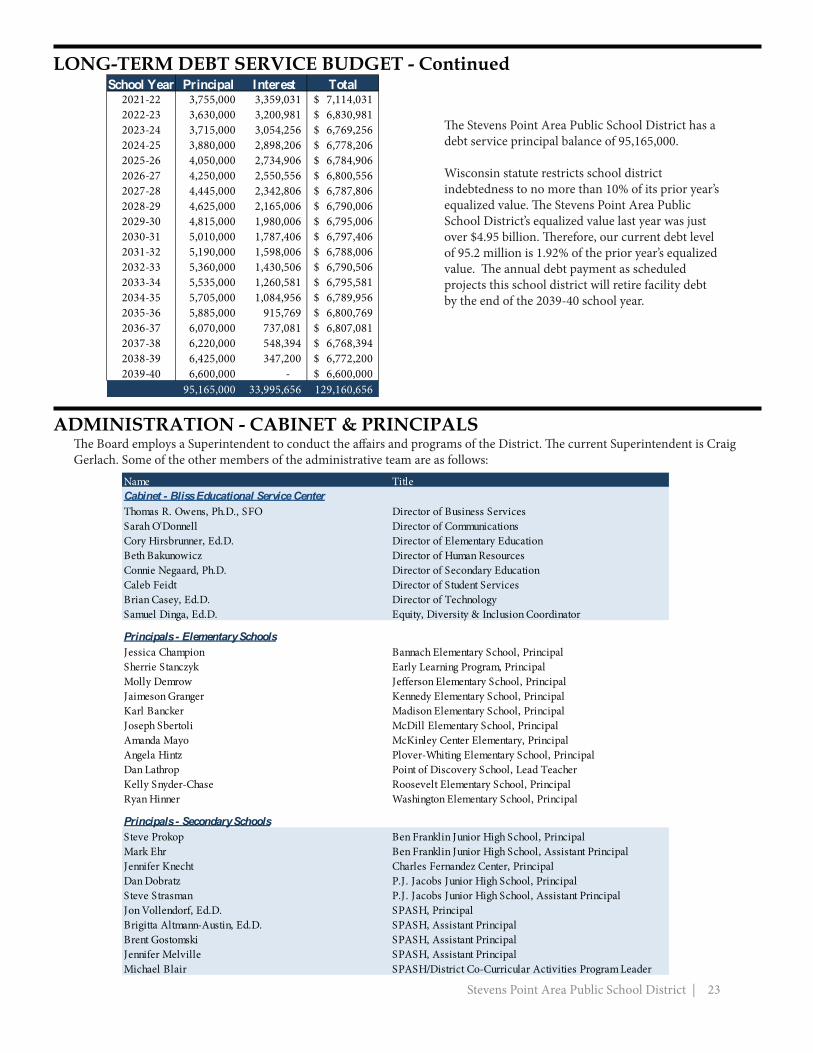
LONG-TERM DEBT SERVICE BUDGET
-
1,000,000
2,000,000
3,000,000
4,000,000
5,000,000
6,000,000
7,000,000
Principal
-
500,000
1,000,000
1,500,000
2,000,000
2,500,000
3,000,000
3,500,000
4,000,000
Interest
Municipality TID # Start Date
Value As Of 1/1/2021
Base Equalized
ValueGain
Total Percent Increase Rounded
Annual Percent Increase Rounded
Years Lapsed
Maximum Life
Junction City-Village 1 8/11/2008 $2,608,300 $1,267,700 $1,340,600 105.8% 8.5% 12 8/11/2028
Junction City-Village 2 9/9/2019 $2,340,300 $1,883,200 $457,100 24.3% 18.5% 1 9/9/2039
Plover-Village 3 9/3/2003 $24,349,400 $532,100 $23,817,300 4476.1% 258.1% 17 9/3/2043
Plover-Village 4 6/16/2004 $69,987,800 $16,780,000 $53,207,800 317.1% 19.2% 17 6/16/2044
Plover-Village 5 9/21/2005 $47,686,300 $2,951,500 $44,734,800 1515.7% 99.1% 15 9/21/2045
Plover-Village 6 4/12/2010 $12,507,900 $3,300 $12,504,600 378927.3% 35309.8% 11 4/12/2030
Plover-Village 7 4/17/2013 $5,564,500 $2,637,300 $2,927,200 111.0% 14.4% 8 4/17/2033
Stevens Point-City 5 5/16/2005 $149,843,400 $37,940,700 $111,902,700 294.9% 18.9% 16 5/16/2032
Stevens Point-City 6 5/15/2006 $59,815,700 $46,305,600 $13,510,100 29.2% 2.0% 15 5/15/2033
Stevens Point-City 7 5/1/2008 $34,600,600 $10,913,900 $23,686,700 217.0% 17.1% 13 5/1/2028
Stevens Point-City 8 5/17/2010 $29,573,200 $19,785,300 $9,787,900 49.5% 4.7% 11 5/17/2030
Stevens Point-City 9 5/20/2013 $197,387,100 $58,229,400 $139,157,700 239.0% 31.3% 8 5/20/2033
Stevens Point-City 10 4/15/2019 $56,216,400 $49,132,300 $7,084,100 14.4% 8.4% 2 4/15/2047
Stevens Point-City 11 7/20/2020 $24,999,500 $24,116,400 $883,100 3.7% 8.1% 0 7/20/2047
Stevens Point-City 12 8/10/2020 $21,187,000 $20,492,300 $694,700 3.4% 8.6% 0 8/10/2047
Stevens Point-City 13 7/20/2020 $6,750,100 $6,526,900 $223,200 3.4% 7.6% 0 7/20/2047
Whiting-Village 1 9/30/1994 $5,302,000 $1,704,800 $3,597,200 211.0% 8.0% 26 9/30/2031
$750,719,500 $301,202,700 $449,516,800 149.2%0.0%
100.0%
200.0%
300.0%
400.0%
500.0%
600.0%
700.0%
Junction City-Village Plover-Village Stevens Point-City Whiting-Village
TID SummaryPercent Gain in Equalized Value
Municipality Value As Of 1/1/2021
Base Equalized Value Gain
Total Percent Increase Rounded
Junction City-Village $4,948,600 $3,150,900 $1,797,700 57.1%
Plover-Village $160,095,900 $22,904,200 $137,191,700 599.0%
Stevens Point-City $580,373,000 $273,442,800 $306,930,200 112.3%
Whiting-Village $5,302,000 $1,704,800 $3,597,200 211.0%
Summary Total $750,719,500 $301,202,700 $449,516,800 149.2%
Stevens Point Area Public School District | 23
LONG-TERM DEBT SERVICE BUDGET - Continued
Th e Stevens Point Area Public School District has a debt service principal balance of 95,165,000.
Wisconsin statute restricts school district indebtedness to no more than 10% of its prior year’s equalized value. Th e Stevens Point Area Public School District’s equalized value last year was just over $4.95 billion. Th erefore, our current debt level of 95.2 million is 1.92% of the prior year’s equalized value. Th e annual debt payment as scheduled projects this school district will retire facility debt by the end of the 2039-40 school year.
ADMINISTRATION - CABINET & PRINCIPALSTh e Board employs a Superintendent to conduct the aff airs and programs of the District. Th e current Superintendent is Craig Gerlach. Some of the other members of the administrative team are as follows:
School Year Principal Interest Total2021-22 3,755,000 3,359,031 7,114,031$ 2022-23 3,630,000 3,200,981 6,830,981$ 2023-24 3,715,000 3,054,256 6,769,256$ 2024-25 3,880,000 2,898,206 6,778,206$ 2025-26 4,050,000 2,734,906 6,784,906$ 2026-27 4,250,000 2,550,556 6,800,556$ 2027-28 4,445,000 2,342,806 6,787,806$ 2028-29 4,625,000 2,165,006 6,790,006$ 2029-30 4,815,000 1,980,006 6,795,006$ 2030-31 5,010,000 1,787,406 6,797,406$ 2031-32 5,190,000 1,598,006 6,788,006$ 2032-33 5,360,000 1,430,506 6,790,506$ 2033-34 5,535,000 1,260,581 6,795,581$ 2034-35 5,705,000 1,084,956 6,789,956$ 2035-36 5,885,000 915,769 6,800,769$ 2036-37 6,070,000 737,081 6,807,081$ 2037-38 6,220,000 548,394 6,768,394$ 2038-39 6,425,000 347,200 6,772,200$ 2039-40 6,600,000 - 6,600,000$
95,165,000 33,995,656 129,160,656
Name TitleCabinet - Bliss Educational Service CenterThomas R. Owens, Ph.D., SFO Director of Business ServicesSarah O'Donnell Director of CommunicationsCory Hirsbrunner, Ed.D. Director of Elementary EducationBeth Bakunowicz Director of Human ResourcesConnie Negaard, Ph.D. Director of Secondary EducationCaleb Feidt Director of Student ServicesBrian Casey, Ed.D. Director of TechnologySamuel Dinga, Ed.D. Equity, Diversity & Inclusion Coordinator
Principals - Elementary SchoolsJessica Champion Bannach Elementary School, PrincipalSherrie Stanczyk Early Learning Program, PrincipalMolly Demrow Jefferson Elementary School, PrincipalJaimeson Granger Kennedy Elementary School, PrincipalKarl Bancker Madison Elementary School, PrincipalJoseph Sbertoli McDill Elementary School, PrincipalAmanda Mayo McKinley Center Elementary, PrincipalAngela Hintz Plover-Whiting Elementary School, PrincipalDan Lathrop Point of Discovery School, Lead TeacherKelly Snyder-Chase Roosevelt Elementary School, PrincipalRyan Hinner Washington Elementary School, Principal
Principals - Secondary SchoolsSteve Prokop Ben Franklin Junior High School, PrincipalMark Ehr Ben Franklin Junior High School, Assistant PrincipalJennifer Knecht Charles Fernandez Center, PrincipalDan Dobratz P.J. Jacobs Junior High School, PrincipalSteve Strasman P.J. Jacobs Junior High School, Assistant PrincipalJon Vollendorf, Ed.D. SPASH, PrincipalBrigitta Altmann-Austin, Ed.D. SPASH, Assistant PrincipalBrent Gostomski SPASH, Assistant PrincipalJennifer Melville SPASH, Assistant PrincipalMichael Blair SPASH/District Co-Curricular Activities Program Leader
24 | Stevens Point Area Public School District
FUND ACCOUNTING AND FUND BALANCESGovernments, such as public school districts, usually organize their accounting systems on a “fund” basis. A fund is a separate set of accounting records, segregated for the purpose of carrying on an activity. A fund is established for accountability purposes to demonstrate that fi nancial resources are being used only for permitted purposes. Th e Wisconsin Department of Public Instruction specifi es the various funds required to be used by Wisconsin school districts. All school districts have a General Fund, and may have one or more other funds to account for specifi c activities. For example, special education activities are accounted for in the Special Education Fund.
A fund will have “balance sheet” accounts consisting of: • Assets • Liabilities • Fund Balance (Equity) • Revenue Accounts • Expenditure Accounts
A fund balance is created or increased when fund revenues exceed fund expenditures for a fi scal period.
Correspondingly, a fund’s balance is decreased when fund expenditures exceed fund revenues. Th e diff erence between the fund’s assets and liabilities equals the fund balance.
A positive fund balance represents a fi nancial resource available to fi nance expenditures of a following fi scal period. A defi cit fund balance can only be recovered by having revenues exceed expenditures in a following fi scal period. In other words, a positive fund balance will allow payment of expenses going forward. A negative fund balance means going forward, assets will need to be incurred to repay the defi cit as well as cover current costs.
A fund balance represents the fund’s total assets minus its liabilities (what a fund owns minus what it owes). Cash is an asset, but it usually is not a fund’s only asset. Th e fund may also have liabilities, such as an accounts payable amount due a supplier that would result in a decrease in fund cash when they are paid.
A fund balance is usually comprised of: • Inventory • Prepaid items • Cash and other items
Administrators and board members need to understand what a fund balance is and its importance in budgeting decisions. A common misconception is that fund balance is a cash account, and therefore corresponds to the district’s bank balance.

Stevens Point Area Public School District | 25
How Large A Fund Balance?
Determination of an appropriate fund balance is a critical factor in district fi nancial planning and budgeting processes, but it is strictly a local matter. Th e Department of Public Instruction makes no recommendation regarding the amount a district should have as its General Fund Balance.
On 9/4/2020, S&P Global Ratings, assigned a rating of AA- to the Stevens Point Area Public School District. Th e District’s last audited unassigned general fund balance was about 26% of revenue, but will be going down due to retroactive salary payments. Both PMA and our audit fi rm, Clift onLarsonAllen LLP, acknowledge that a balance somewhere in the 20% to 29% range is reasonable. Board policy states at least 20% must be maintained. Th e fund balance is used to meet daily operational cash fl ow needs.
A district with an appropriate fund balance can:
• Avoid excessive short term borrowing thereby avoiding associated interest cost. • Accumulate suffi cient assets to make designated purchases or cover unforeseen expenditure needs. • Depending upon the scope of an unforeseen emergency, retain the ability to react. • Demonstrate fi nancial stability and therefore preserve or enhance its bond rating, thereby lowering debt issuance costs. • Th is District’s S&P bond rating is AA- (high quality, with low credit risk). • Th is District currently does not borrow short term to meet cash fl ow shortages.
The most commonly asked question regarding fund balance is how large should it be?
Perhaps the best answer would be: “an amount suffi cient to avoid short term borrowing for cash fl ow and allows the district to set aside suffi cient assets to realize long range goals.” Like one’s savings account, once cash is expended from fund balance it is a diffi cult and lengthy process to rebuild the balance.
Th e free Nutrislice app can be downloaded onto any smartphone making school menus quick and easy to access. Th ere is also a full site link to our webpage for your convenience.Nutrislice makes planning your day simple by giving accurate nutritional information as well as allergy information!
Look up carb counts, fats, sugars, proteins, etc., fast.
Th e Food Service Staff is committed to providing nutritious, quality school meals that meet U.S. Department of Agriculture’s school meal regulations and comply with Dietary Guidelines for Americans.
Th e Stevens Point Area Public School District Food Service Program is part of the National School Lunch Program, a federally assisted meal program that provides nutritionally balanced, low-cost or free lunches to school children.
All district schools off er the breakfast and lunch program. Th e senior high also off ers ala carte and aft er school meals.
School meals must meet the Dietary Guidelines for Americans, which recommend that no more than 30 percent of an individual’s calories come from fat, and less than 10 percent from saturated fat. Regulations also establish a standard for school lunches to provide one-third of the Recommended Dietary Allowances of protein, Vitamin A, Vitamin C, iron, calcium and calories.
BEAUTIFUL MENUS ON MOBILE APPS, WEB, EMAIL AND PRINT
Nutrislice Menus is a complete solution for helping us market our nutrition program. With the click of a button menus are published to smartphones, tablets, and computers. Nutrislice menus are easy to read, and are proven to increase participation and inspire healthy eating choices.
26 | Stevens Point Area Public School District
Download this free App !
Download this free App !
Nutrislice
TRANSPORTATION
Th e Transportation Department of the Stevens Point Area Public School District is dedicated to providing safe, effi cient, and on-time transportation to all eligible public and private school students in the district.
Safety is the top priority in transporting our students. "What is the safest way to do this?" Th is is the question forming our guiding principle in all decisions, from bus routing and driver training, to bus and equipment specifi cations.
Effi ciency is also important to us - district taxpayers need to know that the Transportation Department is providing necessary busing services in an economical and practical way. Route scheduling is another important aspect of transportation - parents should be able to have confi dence that the buses are where they are supposed to be, when they are supposed to be there.
Safety is not compromised in making our operations more effi cient, nor do we compromise safety to keep buses on schedule. Because in the fi nal analysis, if it is not done safely, the rest does not matter.
“My Stop” Application for Smart Phones
Parents can track their children’s school bus as it travels its route by using an App known as “My Stop.” Th is App assists parents in knowing when the bus arrives and where it is enroute, information especially helpful during cold weather.
Stevens Point Area Public School District | 27
Th is is what the Versatrans My Stop App looks like.

28 | Stevens Point Area Public School District
2021-22 SCHOOL BOARD
Meg ErlerPresident
Jeff Ebel Vice President
Barb Portzen Clerk
Mike WadeTreasurer
Judy Rannow Chris Scott Gee Pope Robert Manzke Ann Vang
2021-22 CALENDAR NOTES
September 2 - First day for students November 24-26 March 2 Th anksgiving Break, No School PD Day, E-LearningSeptember 6 - Labor Day December 23 - December 31 Winter Break, No SchoolOctober 6 January 21 March 21-25Professional Development (PD) Day, E-Learning PD Day, No School Spring Break, No School
November 3 February 2 April 6PD Day, No School PD Day, E-Learning PD Day, E-Learning November 11 February 10 April 15Parent/Teacher Conferences (P/T C), 4-8 pm JH P/T C, 4-8 pm HS Good Friday, No School November 15 February 17 May 30P/T C, No School P/T C, 4-8 pm Elem/Jr. Highs Memorial Day, No School
November 18 February 21 June 3P/T C, 4-8 pm Elementary and HS P/T C, No School Elementary Only Last day for students