Embed Size (px)
Citation preview
Budget Statement
2021-22
Budget Paper No. 1
Circulated by The Hon. Dominic Perrottet MP, Treasurer
ACKNOWLEDGEMENT OF COUNTRY
This Budget Paper was prepared by NSW Treasury on the traditional lands of the Gadigal people of the Eora Nation.
NSW Treasury acknowledges that Aboriginal and Torres Strait Islander peoples are the First Peoples and Traditional Custodians of Australia, and the oldest continuing culture in human history.
We pay respect to Elders past and present.
We recognise Aboriginal and Torres Strait Islanders’ continued custodianship of Country - land, seas and skies.
We celebrate the continuing connection of Aboriginal and Torres Strait Islander peoples to Country, language and culture.
We acknowledge the historical stewardship of Aboriginal and Torres Strait Islander peoples, and the important contribution they make to our communities and economies.
We reflect on the continuing impact of policies of the past and recognise our responsibility to work with and for Aboriginal and Torres Strait Islander peoples, families and communities, towards better economic, social and cultural outcomes.
STATEMENT OF THE SECRETARY
The 2021-22 Budget Papers are prepared in accordance with the requirements of the Government Sector Finance Act 2018 and the Fiscal Responsibility Act 2012.
The 2021-22 Budget builds on the successful decisions and actions the Government introduced in the last Budget. New South Wales can be proud of how the State steered through the health challenges and keeping the economy moving.
This Budget moves New South Wales past the recovery stage, with a clear focus on improving productivity growth and furthering economic reform. The Government has also taken the opportunity to invest in outcomes that improve New South Wales’ long-term outlook – as identified in the 2021 Intergenerational Report and Productivity White Paper.
Best available information
The Estimated Financial Statements have been prepared to reflect best estimates of existing operations and the impact of new Government policy decisions. They have also been prepared to take into account other economic and financial data available to Treasury up to 15 June 2021, including information provided in the 2021-22 Commonwealth Budget.
Any estimates or assumptions made in calculating revenues, expenses, other economic flows, assets or liabilities are based on the latest information available at the time.
Professional judgement
The Estimated Financial Statements contain projections for the Budget year (2021-22) and the three following years (2022-23 to 2024-25). The forward looking nature means it is necessary to apply professional judgement in their preparation. That judgement includes an informed assessment of the most likely economic and financial outcomes including spending and revenue profiles. Differences between underlying assumptions and eventual outcomes can reflect the reality of an uncertain operating environment and the impact of many variables over which the Government has little or no control.
In my opinion, the Estimated Financial Statements have been properly prepared in accordance with the Statement of Significant Accounting Policies and Forecast Assumptions and the methodologies used to determine those assumptions are reasonable.
Michael Pratt AM Secretary, NSW Treasury 22 June 2021

Budget Statement 2021-22
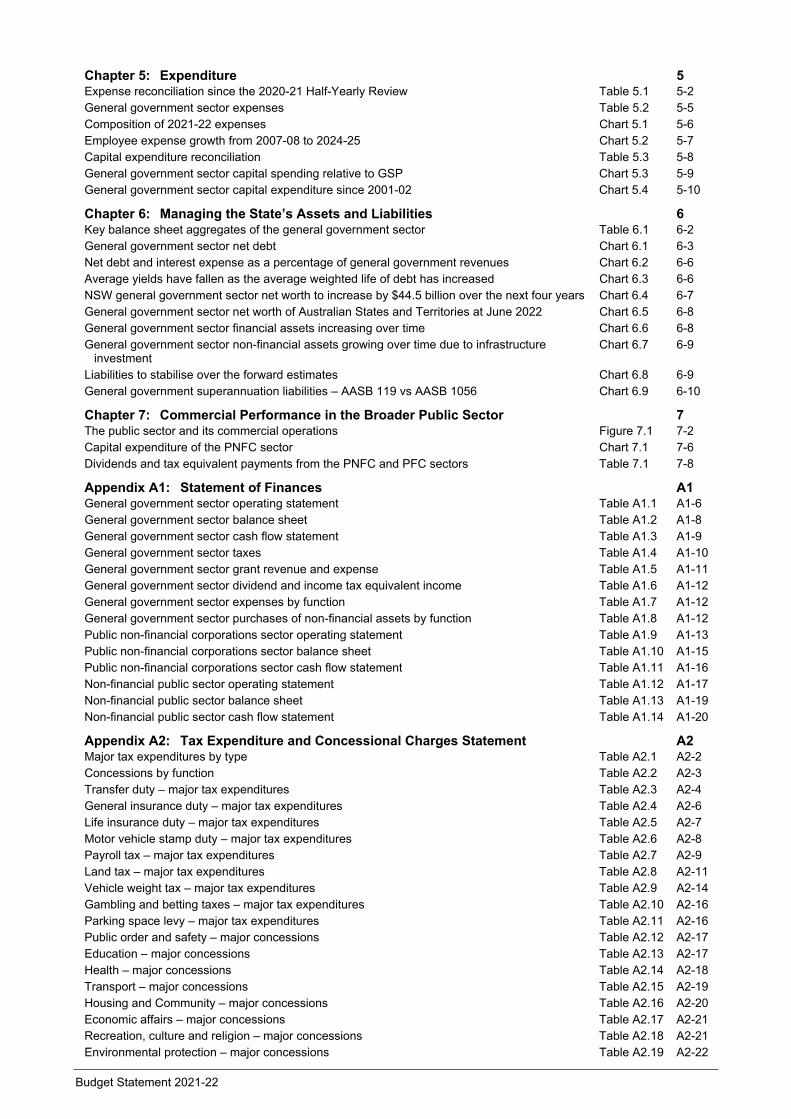
TABLE OF CONTENTS
Chart, Figure and Table List
Focus Box List
About this Budget Paper ........................................................................................... i
Chapter 1: Budget Overview
1.1 From recovery to reform .......................................................................... 1 - 1
1.2 Economic outlook .................................................................................... 1 - 3
1.3 An improved fiscal outlook ....................................................................... 1 - 5
1.4 A Budget that builds on the State’s success ........................................... 1 - 6
Chapter 2: The Economy
2.1 The economy is bouncing back faster than expected ............................. 2 - 1
2.2 Global outlook and implications for New South Wales ............................ 2 - 3
2.3 The NSW economic outlook .................................................................... 2 - 6
2.4 The role of policy support and the economic outlook .............................. 2 - 11
2.5 The state’s economic reform agenda ...................................................... 2 - 14
2.6 Key risks to the outlook ............................................................................ 2 - 16
Chapter 3: Fiscal Strategy and Outlook
3.1 Fiscal strategy .......................................................................................... 3 - 1
3.2 A measured return to surplus .................................................................. 3 - 3
3.3 Using the State’s strong balance sheet to support the economy ............ 3 - 6
Chapter 4: Revenue
4.1 Revenue ................................................................................................... 4 - 1
4.2 Revenue measures since 2020-21 Half-Yearly Review .......................... 4 - 4
4.3 Taxation revenue ..................................................................................... 4 - 8
4.4 Grant revenue .......................................................................................... 4 - 11
4.5 Non-tax revenues .................................................................................... 4 - 16
Chapter 5: Expenditure
5.1 Continuing response and recovery with a productivity focus ................... 5 - 1
5.2 Trends and outlook – expenses ............................................................... 5 - 5
5.3 Capital expenditure .................................................................................. 5 - 8
Budget Statement 2021-22
Chapter 6: Managing the State’s Assets and Liabilities
6.1 A strong balance sheet and further reform .............................................. 6 - 1
6.2 As the economy recovers the net debt outlook has improved ................. 6 - 3
Chapter 7: Commercial Performance in the Broader Public Sector
7.1 Overview of the broader public sector ..................................................... 7 - 1
7.2 Reforms and initiatives of government businesses ................................. 7 - 3
7.3 Capital expenditure .................................................................................. 7 - 6
7.4 Public financial corporation sector ........................................................... 7 - 6
7.5 Dividends and tax equivalent payments .................................................. 7 - 7
Appendices
A1. Statement of Finances ...................................................................... ....... A1 - 1
A2. Tax Expenditure and Concessional Charges Statement ................. ........ A2 - 1
A3. Variation Details of Appropriations during 2020-21................. .................. A3 - 1
A4. Classification of Agencies ......................................................................... A4 - 1
A5. Measures Statement ................................................................................. A5 - 1
B. Fiscal Risks and Budget Sensitivities ....................................................... B - 1
C. Contingent Assets and Liabilities....................................................... ....... C - 1
D. Historical Fiscal Indicators ................................................................. ...... D - 1
E. Performance and Reporting Under the Fiscal Responsibility Act 2012.... E - 1
F. Economic Scenario Analysis ............................................................. ....... F - 1
Budget Statement 2021-22
CHART, FIGURE AND TABLE LIST Page
Chapter 1: Budget Overview 1The NSW economy is returning to full employment within the forecast horizon Chart 1.1 1-3 Key Budget aggregates for the general government sector Table 1.1 1-5 Budget result: 2020-21 Half-Yearly Review compared to the 2021-22 Budget Chart 1.2 1-5
Chapter 2: The Economy 2NSW – economic performance and outlook Table 2.1 2-1 COVID-19 infection trends for selected MTPs Chart 2.1 2-4 World trade activity back above pre-COVID level Chart 2.2 2-4 NSW tourism trade deficit Chart 2.3 2-5 International student commencements and enrolments collapsing Chart 2.4 2-5 Spare capacity in the labour market Chart 2.5 2-7 Employment recovery by gender Chart 2.6 2-7 Labour force participation by gender (quarterly) Chart 2.7 2-8 NSW real per capita consumption Chart 2.8 2-9 NSW net household savings rate Chart 2.9 2-9 Sydney house prices Chart 2.10 2-10 Dwelling approvals Chart 2.11 2-10 Early indicators imply spikes in activity from HomeBuilder Chart 2.12 2-11 Low migration to impact underlying housing demand in NSW Chart 2.13 2-11 CBD movement (weekly) Chart 2.14 2-12 Domestic tourism in NSW Chart 2.15 2-12 Real Gross State Income Per Capita – how NSW growth has slowed Chart 2.16 2-15
Chapter 3: Fiscal Strategy and Outlook 3NSW Generations Fund projected balance over the medium-term Chart 3.1 3-2 NSW budget result comparison from 2020-21 Budget to 2021-22 Budget Chart 3.2 3-3 General government sector budget result aggregates Table 3.1 3-4 General government revenue (excluding tied grants) – current projection compared to pre-pandemic expectations Chart 3.3 3-4 Revenue and expenses from 2011-12 to 2024-25 Chart 3.4 3-5 Reconciliation of 2020-21 Budget to 2021-22 Budget Table 3.2 3-6 Projected net debt to GSP over the medium-term Chart 3.5 3-7 Impacts of asset recycling on the State’s net debt position Chart 3.6 3-8
Chapter 4: Revenue 4Composition of total revenue, 2021-22 Chart 4.1 4-2 General government sector – summary of revenue and its components Table 4.1 4-2 Percentage change in four-year forecasts for total revenue from previous Budget (excluding tied grants) – GFC and COVID-19
Chart 4.2 4-3
Expectations for level of key economic variables in 2020-21 (2019-20 HYR = 100) Chart 4.3 4-3 Revenue reconciliation Table 4.2 4-4 New revenue measures Table 4.3 4-6 Electric vehicles as a share of total vehicle sales in New South Wales Chart 4.4 4-8 Annual payroll tax Chart 4.5 4-9 General government sector – summary of taxation revenue Table 4.4 4-9 Residential transactions per 1,000 persons (quarterly) Chart 4.6 4-10 Grant revenue Table 4.5 4-12 GST (including ‘no worse off’) revenues to New South Wales – reconciliation statement Table 4.6 4-12 National Agreement payments to New South Wales Table 4.7 4-15 National Partnership payments to New South Wales Table 4.8 4-16 Sales of goods and services revenue Table 4.9 4-17 Fines, regulatory fees and other revenues Table 4.10 4-19
Budget Statement 2021-22
Chapter 5: Expenditure 5 Expense reconciliation since the 2020-21 Half-Yearly Review Table 5.1 5-2 General government sector expenses Table 5.2 5-5 Composition of 2021-22 expenses Chart 5.1 5-6 Employee expense growth from 2007-08 to 2024-25 Chart 5.2 5-7 Capital expenditure reconciliation Table 5.3 5-8 General government sector capital spending relative to GSP Chart 5.3 5-9 General government sector capital expenditure since 2001-02 Chart 5.4 5-10
Chapter 6: Managing the State’s Assets and Liabilities 6 Key balance sheet aggregates of the general government sector Table 6.1 6-2 General government sector net debt Chart 6.1 6-3 Net debt and interest expense as a percentage of general government revenues Chart 6.2 6-6 Average yields have fallen as the average weighted life of debt has increased Chart 6.3 6-6 NSW general government sector net worth to increase by $44.5 billion over the next four years Chart 6.4 6-7 General government sector net worth of Australian States and Territories at June 2022 Chart 6.5 6-8 General government sector financial assets increasing over time Chart 6.6 6-8 General government sector non-financial assets growing over time due to infrastructure
investment Chart 6.7 6-9
Liabilities to stabilise over the forward estimates Chart 6.8 6-9 General government superannuation liabilities – AASB 119 vs AASB 1056 Chart 6.9 6-10
Chapter 7: Commercial Performance in the Broader Public Sector 7 The public sector and its commercial operations Figure 7.1 7-2 Capital expenditure of the PNFC sector Chart 7.1 7-6 Dividends and tax equivalent payments from the PNFC and PFC sectors Table 7.1 7-8
Appendix A1: Statement of Finances A1 General government sector operating statement Table A1.1 A1-6 General government sector balance sheet Table A1.2 A1-8 General government sector cash flow statement Table A1.3 A1-9 General government sector taxes Table A1.4 A1-10 General government sector grant revenue and expense Table A1.5 A1-11 General government sector dividend and income tax equivalent income Table A1.6 A1-12 General government sector expenses by function Table A1.7 A1-12 General government sector purchases of non-financial assets by function Table A1.8 A1-12 Public non-financial corporations sector operating statement Table A1.9 A1-13 Public non-financial corporations sector balance sheet Table A1.10 A1-15 Public non-financial corporations sector cash flow statement Table A1.11 A1-16 Non-financial public sector operating statement Table A1.12 A1-17 Non-financial public sector balance sheet Table A1.13 A1-19 Non-financial public sector cash flow statement Table A1.14 A1-20
Appendix A2: Tax Expenditure and Concessional Charges Statement A2 Major tax expenditures by type Table A2.1 A2-2 Concessions by function Table A2.2 A2-3 Transfer duty – major tax expenditures Table A2.3 A2-4 General insurance duty – major tax expenditures Table A2.4 A2-6 Life insurance duty – major tax expenditures Table A2.5 A2-7 Motor vehicle stamp duty – major tax expenditures Table A2.6 A2-8 Payroll tax – major tax expenditures Table A2.7 A2-9 Land tax – major tax expenditures Table A2.8 A2-11 Vehicle weight tax – major tax expenditures Table A2.9 A2-14 Gambling and betting taxes – major tax expenditures Table A2.10 A2-16 Parking space levy – major tax expenditures Table A2.11 A2-16 Public order and safety – major concessions Table A2.12 A2-17 Education – major concessions Table A2.13 A2-17 Health – major concessions Table A2.14 A2-18 Transport – major concessions Table A2.15 A2-19 Housing and Community – major concessions Table A2.16 A2-20 Economic affairs – major concessions Table A2.17 A2-21 Recreation, culture and religion – major concessions Table A2.18 A2-21 Environmental protection – major concessions Table A2.19 A2-22
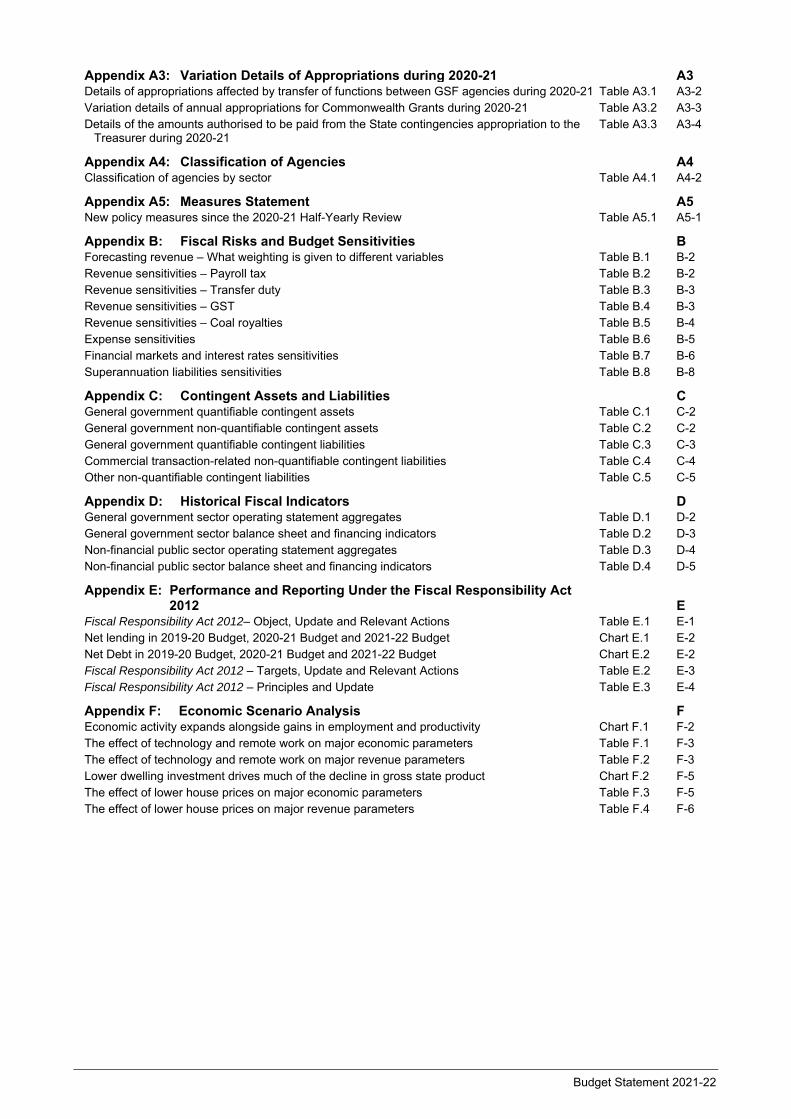
Budget Statement 2021-22
Appendix A3: Variation Details of Appropriations during 2020-21 A3 Details of appropriations affected by transfer of functions between GSF agencies during 2020-21 Table A3.1 A3-2 Variation details of annual appropriations for Commonwealth Grants during 2020-21 Table A3.2 A3-3 Details of the amounts authorised to be paid from the State contingencies appropriation to the
Treasurer during 2020-21 Table A3.3 A3-4
Appendix A4: Classification of Agencies A4Classification of agencies by sector Table A4.1 A4-2
Appendix A5: Measures Statement A5New policy measures since the 2020-21 Half-Yearly Review Table A5.1 A5-1
Appendix B: Fiscal Risks and Budget Sensitivities BForecasting revenue – What weighting is given to different variables Table B.1 B-2 Revenue sensitivities – Payroll tax Table B.2 B-2 Revenue sensitivities – Transfer duty Table B.3 B-3 Revenue sensitivities – GST Table B.4 B-3 Revenue sensitivities – Coal royalties Table B.5 B-4 Expense sensitivities Table B.6 B-5 Financial markets and interest rates sensitivities Table B.7 B-6 Superannuation liabilities sensitivities Table B.8 B-8
Appendix C: Contingent Assets and Liabilities CGeneral government quantifiable contingent assets Table C.1 C-2 General government non-quantifiable contingent assets Table C.2 C-2 General government quantifiable contingent liabilities Table C.3 C-3 Commercial transaction-related non-quantifiable contingent liabilities Table C.4 C-4 Other non-quantifiable contingent liabilities Table C.5 C-5
Appendix D: Historical Fiscal Indicators DGeneral government sector operating statement aggregates Table D.1 D-2 General government sector balance sheet and financing indicators Table D.2 D-3 Non-financial public sector operating statement aggregates Table D.3 D-4 Non-financial public sector balance sheet and financing indicators Table D.4 D-5
Appendix E: Performance and Reporting Under the Fiscal Responsibility Act 2012
E
Fiscal Responsibility Act 2012– Object, Update and Relevant Actions Table E.1 E-1 Net lending in 2019-20 Budget, 2020-21 Budget and 2021-22 Budget Chart E.1 E-2 Net Debt in 2019-20 Budget, 2020-21 Budget and 2021-22 Budget Chart E.2 E-2 Fiscal Responsibility Act 2012 – Targets, Update and Relevant Actions Table E.2 E-3 Fiscal Responsibility Act 2012 – Principles and Update Table E.3 E-4
Appendix F: Economic Scenario Analysis FEconomic activity expands alongside gains in employment and productivity Chart F.1 F-2 The effect of technology and remote work on major economic parameters Table F.1 F-3 The effect of technology and remote work on major revenue parameters Table F.2 F-3 Lower dwelling investment drives much of the decline in gross state product Chart F.2 F-5 The effect of lower house prices on major economic parameters Table F.3 F-5 The effect of lower house prices on major revenue parameters Table F.4 F-6
Budget Statement 2021-22
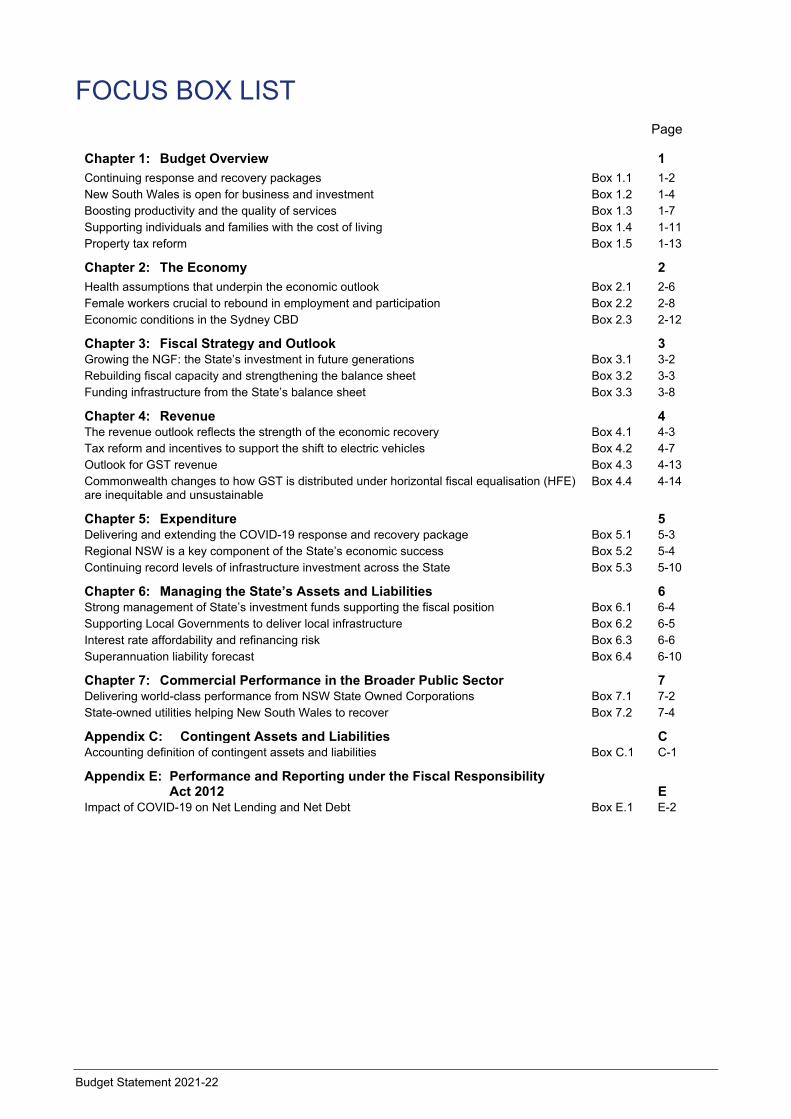
FOCUS BOX LIST Page
Chapter 1: Budget Overview 1
Continuing response and recovery packages Box 1.1 1-2 New South Wales is open for business and investment Box 1.2 1-4 Boosting productivity and the quality of services Box 1.3 1-7 Supporting individuals and families with the cost of living Box 1.4 1-11 Property tax reform Box 1.5 1-13
Chapter 2: The Economy 2
Health assumptions that underpin the economic outlook Box 2.1 2-6 Female workers crucial to rebound in employment and participation Box 2.2 2-8 Economic conditions in the Sydney CBD Box 2.3 2-12
Chapter 3: Fiscal Strategy and Outlook 3Growing the NGF: the State’s investment in future generations Box 3.1 3-2 Rebuilding fiscal capacity and strengthening the balance sheet Box 3.2 3-3 Funding infrastructure from the State’s balance sheet Box 3.3 3-8
Chapter 4: Revenue 4The revenue outlook reflects the strength of the economic recovery Box 4.1 4-3 Tax reform and incentives to support the shift to electric vehicles Box 4.2 4-7 Outlook for GST revenue Box 4.3 4-13 Commonwealth changes to how GST is distributed under horizontal fiscal equalisation (HFE) are inequitable and unsustainable
Box 4.4 4-14
Chapter 5: Expenditure 5Delivering and extending the COVID-19 response and recovery package Box 5.1 5-3 Regional NSW is a key component of the State’s economic success Box 5.2 5-4 Continuing record levels of infrastructure investment across the State Box 5.3 5-10
Chapter 6: Managing the State’s Assets and Liabilities 6Strong management of State’s investment funds supporting the fiscal position Box 6.1 6-4 Supporting Local Governments to deliver local infrastructure Box 6.2 6-5 Interest rate affordability and refinancing risk Box 6.3 6-6 Superannuation liability forecast Box 6.4 6-10
Chapter 7: Commercial Performance in the Broader Public Sector 7Delivering world-class performance from NSW State Owned Corporations Box 7.1 7-2 State-owned utilities helping New South Wales to recover Box 7.2 7-4
Appendix C: Contingent Assets and Liabilities C Accounting definition of contingent assets and liabilities Box C.1 C-1
Appendix E: Performance and Reporting under the Fiscal Responsibility Act 2012
E
Impact of COVID-19 on Net Lending and Net Debt Box E.1 E-2
Budget Statement 2021-22 i
ABOUT THIS BUDGET PAPER
Purpose and scope
Budget Paper No. 1 Budget Statement provides information on the State finances in aggregate. The objectives of this paper are to:
inform citizens of the State’s fiscal position and the Government’s fiscal strategy
meet requirements under the Government Sector Finance Act 2018, which prescribes the content of the budget papers, including providing four-year projections of all major economic and financial variables, revised estimates for the preceding budget year and explanations of any significant variations
meet requirements under s.8 of the Fiscal Responsibility Act 2012, including providing a statement of the Government’s fiscal strategy, a report on performance against the fiscal objectives, targets and principles contained in the Act and an assessment of the impact of any budget measures on the State’s long-term fiscal gap
enable interstate comparisons by reporting in line with the Australian Bureau of Statistics Government Finance Statistics framework.
The scope of the Budget is the general government sector. However, this budget paper also includes estimated financial statements for the public non-financial corporations (PNFC) and the non-financial public sector (NFPS). The statements provide a comprehensive picture of the State’s fiscal position and strategy.
Where comparisons are made to previously published estimates, unless otherwise stated, the comparison is to the 2020-21 Half-Yearly Review.
For a list of definitions used in the Budget Papers, please see How to Read the Budget Papers.
Reporting of Actual and Budget data
The actual results for 2019-20 reflect the audited financial statements for the GGS as presented in the Total State Sector Accounts 2019-20.
The Estimated Financial Statements of the general government sector (2021-22 to 2024-25) in these budget papers are prepared on an accrual basis of accounting, in accordance with Australian Accounting Standards, the Uniform Presentation Framework and the principles and rules contained in the Australia Bureau of Statistics, Australian System of Government Finance Statistics: Concepts, Sources and Methods 2015 (Cat. No. 5514) (ABS-GFS Manual).
Aggregated financial data is presented on an eliminated basis – that is, intra government transactions between entities are eliminated.
From 1 July 2020, the State applied the new accounting standard of AASB 1059 Service Concession Arrangements (AASB 1059).
About this Budget Paper
ii Budget Statement 2021-22
Notes
The budget year refers to 2021-22, while the forward estimates period refers to 2022-23, 2023-24 and 2024-25. Figures in tables, charts and text may have been rounded. Discrepancies between totals and the sum of components reflect rounding:
– estimates under $100,000 are rounded to the nearest thousand
– estimates midway between rounding points are rounded up
– percentages are based on the underlying unrounded values.
For the budget result, parentheses indicate a deficit, while no sign indicates a surplus.
One billion equals one thousand million.
The following notations are used:
– n.a. means data is not available
– N/A means not applicable
– no. means number
– 0 means not zero, but rounded to zero
– … means zero
– ‘000 means thousand
– $m means millions of dollars
– $b means billions of dollars.
Differences between harmonised government finance statistics (GFS) and generally accepted accounting principles (GAAP) information, as shown in the budget papers, and pure GFS information, as reported by the Australian Bureau of Statistics, are known as convergence differences. Such differences are not departures from Accounting Standards but merely variations in measurement or treatments between GAAP and GFS frameworks.
Unless otherwise indicated, the data source for tables and charts is NSW Treasury.
Budget Statement 2021-22 1 - 1
1. BUDGET OVERVIEW
1.1 From recovery to reform
Since the 2020-21 NSW Budget, handed down just seven months ago, the State’s recovery from last year’s recession – the deepest in almost 80 years – has far exceeded expectations. This outcome reflects the success of the NSW Government in safeguarding both the safety of citizens and the health of the economy, which has laid the foundations for the strong recovery.
Previous investment in critical services like public health, as well as a world-class digital government platform, have supported what is now considered the gold standard in contact tracing and containment of the pandemic. Getting the health outcomes right has meant the people of New South Wales have largely been able to continue their lives in a way that many around the world have not.
Confidence in the health system combined with economic stimulus have fuelled business and consumer confidence (the former having recently reached an all-time high, the latter having reached its highest level in over a decade) and generated significant momentum in the state’s economy. As a result, the state’s local economy is now larger than before the pandemic, an outcome achieved more than a year sooner than earlier forecast.
The State has recovered more than 300,000 jobs since the height of the pandemic in mid-2020. A return to full employment is now expected by 2024-25.
With the improved economic conditions, the State’s operating position has strengthened. This Budget contains decreasing deficits over the next three years, with a surplus now projected in 2024-25. The return to surplus is being achieved without relying on new taxes and while maintaining world class services, supported by the Government’s actions to support an open economy while at the same time containing expense growth.
Alongside an improving operating position, the Budget also forecasts a reduction in net debt relative to the 2020-21 Half-Yearly Review, confirming the State’s strong financial foundations.
New South Wales remains the only state in Australia to have a triple-A credit rating from Moody’s. With ongoing risks around the pandemic, the relative improvement in the fiscal position will ensure the Government is well placed to respond to any future need.
The 2020-21 Budget set out the roadmap for response, recovery and reform. This Budget aims to secure and build on the strong start to recovery, using the State’s stronger financial position to plot the economic journey beyond the pandemic.
In the short-term, this Budget reinforces public health safeguards against the ongoing threat of COVID-19, continuing investment in vaccination, pop-up clinics, testing and contact tracing. It also continues to direct resources to areas that support and create private sector-led growth, as well as supporting people and businesses in New South Wales still adversely affected by the pandemic and other natural disasters, including bushfires, storms and floods.
In the medium-to-longer term, the Budget directs resources towards the State’s services, families, and future economic growth and living standards through productivity and economic reform.
Budget Overview
1 - 2 Budget Statement 2021-22
Box 1.1: Continuing response and recovery packages
Since the start of the pandemic the NSW Government has committed over $29 billion in COVID-19 revenue and expenditure support. This is on top of the $4.5 billion in bushfire recovery support over 6 years since 2019-20 and drought and water security measures to date of $4.5 billion.
The economy will continue to be supported by stimulus measures in this Budget. Around $6 billion is projected to be spent in 2021-22 across a range of new and existing initiatives:
$3.6 billion in infrastructure and capital maintenance comprising:
– $1.2 billion through the Jobs and Infrastructure Acceleration Fund
– $2.4 billion across new capital works upgrades and maintenance projects, including over $360 million for the maintenance, upgrade and supply of new social housing
$1.7 billion to support business and the economy with measures including:
– $1,500 Small Business Fees and Charges Rebate
– Jobs Plus Program
– Dine & Discover NSW extension
– CBD Dine & Discover Voucher for Fridays
$400 million in education and skills programs, which include:
– Targeted Tutoring Program
– Skilling for Recovery Program
$160 million for social and community support programs.
Early and decisive action to constrain wage increases for public sector workers in 2020-21 has supported the Government’s efforts to balance short-term stimulus with long-term fiscal sustainability. With recovery well underway, this Budget can return wages growth to up to 2.5 per cent from 1 July 2021 for public sector employees, whose hard work has not gone unseen.
The NSW Government is building on the lessons from the COVID-19 pandemic to drive reform and set up an even stronger future for the people of New South Wales. The decade ahead will not look like the last. NSW Government policies and services will need to evolve in response to the enduring impact of the pandemic, as well as global trends such as digital transformation and environmental transition.
This Budget draws on two recent pieces of NSW Government analysis to inform investment decisions geared towards addressing long-term economic and demographic challenges: the 2021-22 NSW Intergenerational Report and the NSW Productivity Commission’s White Paper (refer to Box 1.3).
The NSW Generations Fund, established in late 2018, has achieved particularly strong returns over the last 12 months. The NSW Government is updating legislation so future mining royalties, along with dividends from TCorp and State Owned Corporations are also invested into this fund. Reporting and debt retirement requirements are also being strengthened. These reforms will bear benefits for generations to come.
This Budget is being handed down while the pandemic endures. That means events could still unfold that change the economic or fiscal trajectory of the State. For that reason, the forecasts in this Budget contain the same elevated degree of uncertainty as the last Budget, which is a consistent pattern observed by governments around the world. The Government continues its efforts to actively reduce risks, including the recent opening of a mass vaccination centre in Sydney Olympic Park that can administer up to 30,000 vaccinations per week. Work is underway to open another centre in Newcastle in July, further boosting the vaccine rollout across the state.
Budget Overview
Budget Statement 2021-22 1 - 3
1.2 Economic outlook
The New South Wales economy is continuing its strong recovery. The Government’s effective management of the pandemic and unprecedented levels of stimulus, from all levels of Government and the Reserve Bank, have substantially mitigated the effects of the largest recession in almost 80 years. Official data shows the state’s economy has rebounded back to the levels of activity seen at the end of 2019, prior to the arrival of the COVID-19 pandemic.
The timely removal of most social distancing measures, combined with effective monetary and government support programs for business and households, has significantly aided the strength of the rebound. Along with public confidence in the NSW health system to manage outbreaks of the virus without significant lockdowns, these factors have contributed to a recent record high reading for business confidence and an 11-year high for consumer sentiment.
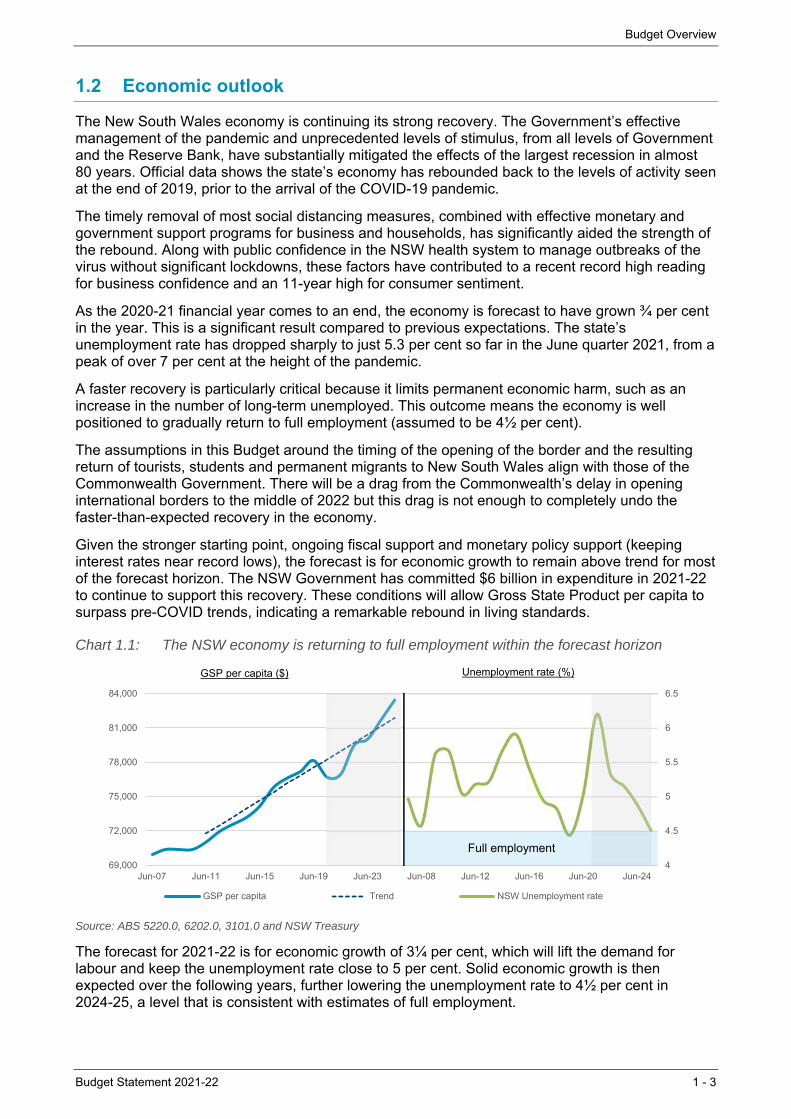
As the 2020-21 financial year comes to an end, the economy is forecast to have grown ¾ per cent in the year. This is a significant result compared to previous expectations. The state’s unemployment rate has dropped sharply to just 5.3 per cent so far in the June quarter 2021, from a peak of over 7 per cent at the height of the pandemic.
A faster recovery is particularly critical because it limits permanent economic harm, such as an increase in the number of long-term unemployed. This outcome means the economy is well positioned to gradually return to full employment (assumed to be 4½ per cent).
The assumptions in this Budget around the timing of the opening of the border and the resulting return of tourists, students and permanent migrants to New South Wales align with those of the Commonwealth Government. There will be a drag from the Commonwealth’s delay in opening international borders to the middle of 2022 but this drag is not enough to completely undo the faster-than-expected recovery in the economy.
Given the stronger starting point, ongoing fiscal support and monetary policy support (keeping interest rates near record lows), the forecast is for economic growth to remain above trend for most of the forecast horizon. The NSW Government has committed $6 billion in expenditure in 2021-22 to continue to support this recovery. These conditions will allow Gross State Product per capita to surpass pre-COVID trends, indicating a remarkable rebound in living standards.
Chart 1.1: The NSW economy is returning to full employment within the forecast horizon
Source: ABS 5220.0, 6202.0, 3101.0 and NSW Treasury
The forecast for 2021-22 is for economic growth of 3¼ per cent, which will lift the demand for labour and keep the unemployment rate close to 5 per cent. Solid economic growth is then expected over the following years, further lowering the unemployment rate to 4½ per cent in 2024-25, a level that is consistent with estimates of full employment.
4
4.5
5
5.5
6
6.5
69,000
72,000
75,000
78,000
81,000
84,000
Jun-07 Jun-11 Jun-15 Jun-19 Jun-23 Jun-08 Jun-12 Jun-16 Jun-20 Jun-24
GSP per capita Trend NSW Unemployment rate
Full employment
GSP per capita ($) Unemployment rate (%)
Budget Overview
1 - 4 Budget Statement 2021-22
The ongoing nature of the pandemic means the economic outlook is subject to risks and these are outlined in detail in Chapter 2. The Commonwealth Government’s assumed re-opening of international borders in mid-2022 presents a major uncertainty to the outlook.
With the recovery expected to continue at pace, and pre-pandemic economic challenges still remaining, it is appropriate for the Government to apply additional resources to shift the dial on the drivers of long-term economic growth – especially productivity and labour participation.
Box 1.2: New South Wales is open for business and investment
The economy has been at the forefront of the Government’s response during the COVID-19 pandemic. The Government’s determination to keep the economy open and focus on smart investments to achieve great health outcomes has contributed towards results that were recently inconceivable: the highest consumer confidence in over a decade and recent record high business confidence. All jobs lost in the early stages of the pandemic have been recovered.
The Government continues to deliver and is building on the existing measures in place to support businesses and create jobs.
International students – a pilot plan is in place for the return of these students into New South Wales. This will see the arrival of 250 students per fortnight, increasing to 500 by the end of the year. With most spending by international students comprising of housing and general goods and services, these students have large multiplier effects that can greatly benefit the economy and help to create new jobs in the state.
Payroll tax relief measures – continuation of the temporary reduction in the payroll tax rate from 5.45 per cent to 4.85 per cent for another year, together with a permanent increase in the tax threshold to $1.2 million. As a result of this change, payroll taxpaying businesses could save around $34,000 each year and around 3,500 more businesses are paying no payroll tax at all. This helps to free up cash flow, providing capacity to retain employees.
$250 million Jobs Plus Program – this attracts local and international companies into New South Wales and creates employment opportunities in the state. To date, the program is delivering around 280 jobs in the medical technology field. By June 2024, the program is expected to have supported the creation of up to 25,000 new jobs.
$200 million to secure future major events – this will help to rejuvenate the visitor economy, promoting New South Wales as the premier state to visit and do business. This will help to stimulate the economy and help to create local jobs.
Small business support – new and existing packages have provided a range of relief in the form of rebates, grants and fee waivers, to reduce the cost of running a business and allow small businesses to grow.
Budget Overview
Budget Statement 2021-22 1 - 5
1.3 An improved fiscal outlook
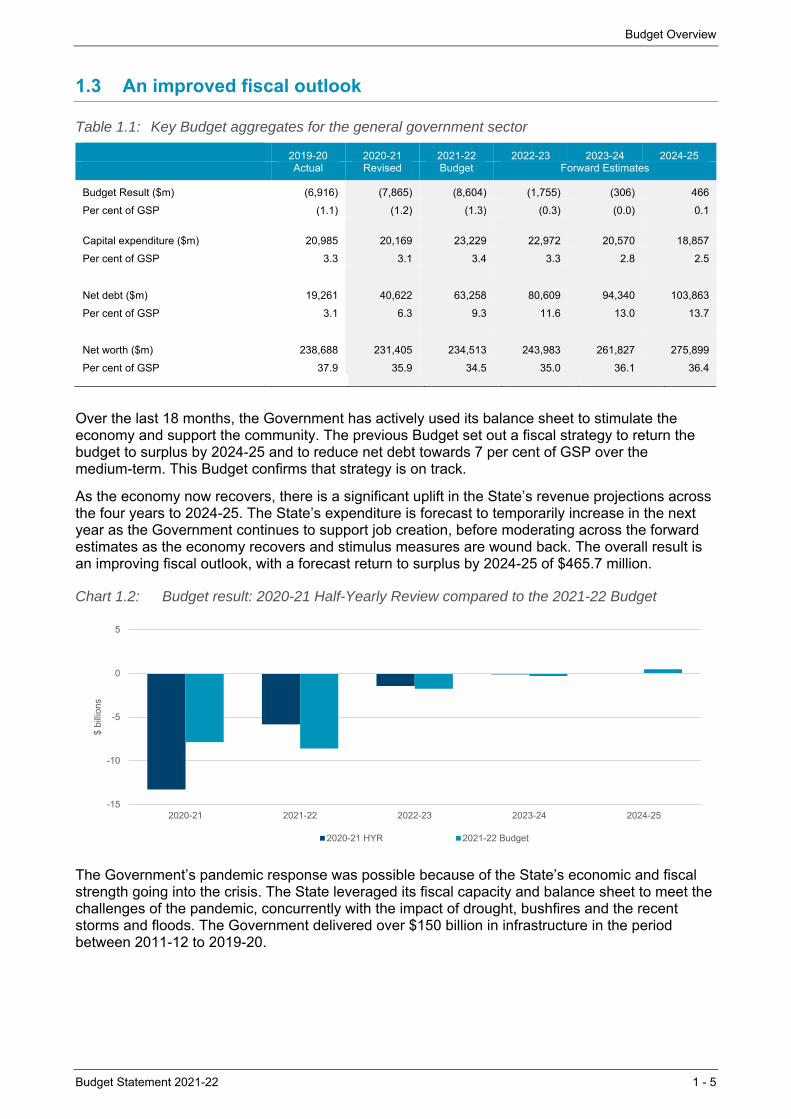
Table 1.1: Key Budget aggregates for the general government sector
2019-20 2020-21 2021-22 2022-23 2023-24 2024-25
Actual Revised Budget Forward Estimates
Budget Result ($m) (6,916) (7,865) (8,604) (1,755) (306) 466
Per cent of GSP (1.1) (1.2) (1.3) (0.3) (0.0) 0.1
Capital expenditure ($m) 20,985 20,169 23,229 22,972 20,570 18,857
Per cent of GSP 3.3 3.1 3.4 3.3 2.8 2.5
Net debt ($m) 19,261 40,622 63,258 80,609 94,340
103,863
Per cent of GSP 3.1 6.3 9.3 11.6 13.0 13.7
Net worth ($m) 238,688 231,405 234,513 243,983
261,827
275,899
Per cent of GSP 37.9 35.9 34.5 35.0 36.1 36.4
Over the last 18 months, the Government has actively used its balance sheet to stimulate the economy and support the community. The previous Budget set out a fiscal strategy to return the budget to surplus by 2024-25 and to reduce net debt towards 7 per cent of GSP over the medium-term. This Budget confirms that strategy is on track.
As the economy now recovers, there is a significant uplift in the State’s revenue projections across the four years to 2024-25. The State’s expenditure is forecast to temporarily increase in the next year as the Government continues to support job creation, before moderating across the forward estimates as the economy recovers and stimulus measures are wound back. The overall result is an improving fiscal outlook, with a forecast return to surplus by 2024-25 of $465.7 million.
Chart 1.2: Budget result: 2020-21 Half-Yearly Review compared to the 2021-22 Budget
The Government’s pandemic response was possible because of the State’s economic and fiscal strength going into the crisis. The State leveraged its fiscal capacity and balance sheet to meet the challenges of the pandemic, concurrently with the impact of drought, bushfires and the recent storms and floods. The Government delivered over $150 billion in infrastructure in the period between 2011-12 to 2019-20.
-15
-10
-5
0
5
2020-21 2021-22 2022-23 2023-24 2024-25
$ bi
llion
s
2020-21 HYR 2021-22 Budget
Budget Overview
1 - 6 Budget Statement 2021-22
This Budget continues the Government’s approach to delivering infrastructure that supports jobs and improves lives in our cities and regions. The Budget contains a $108.5 billion pipeline over the four years to 2024-25 (see Chapter 5 and Budget Paper No.3 Infrastructure Statement). With investments in schools, hospital redevelopments and the new Bradfield City Centre, the Government’s infrastructure program will continue to support employment, economic growth, improved living standards and productivity.
The State is using its balance sheet to support the significant investment in infrastructure and the ongoing economic and health response to the pandemic. The State’s net debt is projected to be 9.3 per cent of GSP as at June 2022, and peak at 13.7 per cent of GSP in June 2025.
The Government’s fiscal repair strategy is well underway. This will help rebuild fiscal capacity and ensure balance sheet resilience. Through the growth of the NSW Generations Fund (NGF), improved revenue outlook, and the continuation of the Government’s successful asset recycling program (e.g. WestConnex), net debt is expected to improve further, trending back down towards 7 per cent of GSP over the medium term.
The Government’s investment strategy for the NGF has seen strong returns to date. It has returned 8.6 per cent since inception in late 2018, outperforming its long-run investment objective of CPI plus 4.5 per cent.
The NGF is now projected to grow to over $90 billion by June 2031. Given the size and importance of the NGF, the Government is taking steps to strengthen the ringfencing of the fund and to improve its transparency and accountability (see Box 3.1 in Chapter 3).
Ensuring a sustainable debt position enables the Government to provide additional resources in priority areas such as targeted investments in frontline services, training and education, critical infrastructure, and other reforms as detailed below.
New South Wales is the only state in Australia to retain its triple-A credit rating with Moody’s. This is reflective of the State’s history of strong financial management and fiscal discipline. The Government will continue this approach and return its fiscal position to be consistent with a triple-A rating with S&P Global.
Budget Overview
Budget Statement 2021-22 1 - 7
1.4 A Budget that builds on the State’s success
To further build on the State’s success and to drive further growth, the NSW Government is investing in measures that boost labour participation and productivity.
Box 1.3: Boosting productivity and the quality of services
As highlighted by the NSW Productivity Commission White Paper – Rebooting the economy, productivity growth is needed to repeat the strong growth seen in the past. Key measures were identified that would boost the NSW economy by 2 per cent. This Budget provides funding to implement some of these measures. Investment is prioritised towards a suite of initiatives that will help drive productivity growth and boost the quality of Government services.
Tax Reform
To tackle an inefficient property tax system, a progress paper was released in June 2021 to continue engaging with the people of New South Wales to develop a proposal to replace transfer duty with a small annual property tax. The proposed reform has the potential to increase home ownership by 6 per cent and to add $3,300 to average annual household income (see Box 1.5)
Incentives to increase the take-up of electric vehicles, with a $489.5 million package that phases out economically costly vehicle stamp duty on zero and low emission vehicles and gradually phases in a distance-based road user charge.
Planning Reform
Additional $9.7 million, along with the introduction of legislation, to implement the package of 29 recommendations from the NSW Productivity Commission’s Infrastructure Contributions Review. These reforms will support the timely delivery of critical infrastructure as it is needed to meet population growth and unlock housing supply.
Education and Skills
$196.6 million to implement the Curriculum Reform Program, a program to create a new curriculum that will improve student performance and enhance future employment outcomes
$124.8 million to attract and retain high performing teachers under the Teacher Supply Strategy, to deliver a sustainable pipeline of teachers
$24.6 million to support implementation of recommendations in the Gonski Shergold Review, including pilot sites for the Institute of Applied Technology at three sites, and a pilot of a new Careers NSW platform which will partner with industry and young people to provide valuable and timely advice to match students with in-demand industries.
Energy and Resources
$379.6 million to deliver the Electricity Infrastructure Roadmap, including funding to establish for the Renewable Energy Zones across the State
$171 million investment in electric vehicle charging infrastructure over the next four years to ensure accessibility of ultra-fast chargers, especially on major commuter corridors and at regional tourist destinations
$12.5 million to identify and adopt more efficient operating models for water provision in the regions, focused on leakage reduction
$10 million for a Bus Electrification Program strategic business case that aims to transition all NSW buses to zero-emission buses.

Budget Overview
1 - 8 Budget Statement 2021-22
Health
Increasing spend on Digital Health initiatives to over $500 million over the next four years, to enhance the care coordination across hospital and care settings, including Virtual Care, Telehealth and Single Digital Patient Record
$109.5 million to develop 25 Child and Adolescent Mental Health Crisis Teams (‘Safeguards’) across New South Wales to provide support services to children and adolescents with moderate to severe mental health issues
$36.4 million for 57 mental health Response and Recovery Specialists across regional and rural New South Wales to provide assertive outreach support for communities.
Whole of Government
An additional $500 million for the Digital Restart Fund to continue driving investments in digital technologies across the NSW Government, increasing total funding to $2.1 billion
$5 million to fund the Productivity Reform Program to support the work of the NSW Productivity Commission to assist agencies with progressing White Paper reforms over the next four years
Lowering the cost for occupational licence holders that do business in multiple locations, with $2.5 million to support Automatic Mutual Recognition
Evaluating the relaxation of regulations established during COVID-19 and keeping the ones that work.
These measures are in addition to those arising from the Government’s record infrastructure investment program and the productivity enhancing measures announced in the 2020-21 Budget, including:
Implementation of a suite of planning reforms to deliver a more streamlined and timely planning system through the $520 million NSW Planning Reform Action Plan
Establishing a new $57.4 million Trades Skills Pathways Centre to develop and pilot new flexible pathways into the trades and support the participation of mature aged workers and women
A permanent increase in the payroll tax threshold to $1.2 million, expected to save businesses a further $744 million over four years from 2020-21 to 2023-24.
Continuing to keep New South Wales safe while accelerating our recovery
Safeguarding the health of our people
The past year has been a testament to the quality of the State’s health system. It was extensively tested, and the performance was profound. This Budget invests further in our world class health system, continuing the measures that have been a proven success and implementing new initiatives to make it even better. This includes:
$340 million for personal protective equipment and associated storage costs to keep our frontline health workers safe
$261.3 million to support the COVID-19 vaccination rollout across the State, including increasing capacity and ensuring accessibility to eligible people
$200 million to support COVID-19 pop-up clinics, testing and contact tracing
$145.4 million to provide medical care to returning travellers in quarantine.
Budget Overview
Budget Statement 2021-22 1 - 9
Accelerating our recovery
With the health response well supported to continue protecting the community, the Government is also investing in measures to accelerate the recovery already underway. Significant investments will be made into infrastructure and other initiatives to create jobs, drive economic activity, and build a better future. This includes:
$3.3 billion in new capital funding for 44 new and upgraded schools across the State
$2.7 billion to commence construction on the M6 Extension Stage 1
$2 billion to upgrade the Great Western Highway, co-funded by the NSW and Commonwealth Governments, to reduce congestion and deliver safer, more efficient and reliable journeys
more than $1 billion to activate Australia’s first 22nd century city, Bradfield, including:
– $870 million estimated total capital expenditure for Stage 1 enabling works to construct critical infrastructure and foundations for the Bradfield City Centre to align with the development of the Western Sydney International (Nancy-Bird Walton) Airport and the Sydney Metro - Western Sydney Airport
– $47.8 million for the construction of a high-tech facility as Bradfield’s First Building, housing shared-use equipment for research institutions and industry to collaborate
$168.7 million to continue planning, design and pre-constriction of the Muswellbrook bypass, improving safety on the New England Highway and reducing travel times for long haul freight movements
$115.6 million for the construction of Henry Lawson Drive widening between Tower Road, Georges Hall and Auld Avenue, Milperra (Stage 1) to double capacity and reduce congestion and to continue the development of Stage 2 between Keys Parade and the M5 Motorway
$50 million to continue planning and development of the Parramatta Light Rail Stage 2, which would connect to Stage 1 and continue north through Ermington, Melrose Park and Wentworth Point to Sydney Olympic Park
$50 million for a new Dine & Discover voucher to be used on Fridays in the CBD, to increase activity in the CBD and support small businesses
$20 million to provide 200,000 accommodation vouchers worth $100 each to encourage people back into the Sydney CBD.
Making New South Wales the best place to visit
Our communities help to make New South Wales be the best place to live and work. Our state should also be the best place to visit. This Budget puts resources into place to realise the vision and includes:
$119.3 million capital expenditure to create a cultural venue and public open space at the Registrar General’s Building, consistent with the Macquarie Street East Precinct Review
$80.4 million capital expenditure for signature multi-day walking experiences, including the Great Southern Walk (Illawarra)
$60 million for the Creative Capital program to deliver new cultural infrastructure projects in Greater Sydney and regional New South Wales to boost community participation in the arts, along with cultural tourism
$59.9 million for upgrades at 12 country race clubs across regional New South Wales, to provide improvements to racetracks and additional capacity for stabling thoroughbreds
$50 million to support regional tourism with a $30 million Regional Tourism Activation Fund and $20 million with a Regional Events Acceleration Fund
$40 million to attract major blockbuster art and museum exhibitions to New South Wales, showcasing the world’s finest cultural treasures in our world-renowned cultural institutions
Budget Overview
1 - 10 Budget Statement 2021-22
$24 million to expand the State’s Arts and Cultural Funding Program to incentivise innovation, vibrancy and creativity within the cultural sector. The uplift will focus on funding to small and medium arts companies, along with funding to enable additional regional touring
$15 million for a Cahill High Line inspired by the Manhattan High Line, temporarily transforming the Cahill Expressway into a contemporary landscape which will host a series of events and provide a viewing deck for New Year’s Eve fireworks and Sydney Harbour until the opening of the 2022 Sydney Festival
$5 million to establish the contemporary Heritage Blue Plaques Program that will identify heritage sites for communities to appreciate and connect with their historic surrounds
transformation of the Ultimo Powerhouse Museum, featuring the first dedicated design and fashion museum in Australia and an academy supporting 60 regional students to experience immersive education and exhibition programs.
Investing in families and their future
The strength of the State’s finances has enabled the Government to provide significant support to individuals and families.
Supporting families, including our most vulnerable
Support for families continues, particularly for the most vulnerable in our state. The Government is protecting the health and wellbeing of individuals, investing in measures to ensure appropriate care and services are available where and when they are needed. This includes:
$82.8 million to continue strengthening palliative care services, including improving community-based care, enhanced inpatient palliative care services in Western Sydney, and enhancements to the specialist palliative care workforce in regional and rural New South Wales
$57 million to build on the successful Together Home program which has assisted hundreds of rough sleepers or vulnerable individuals into accommodation
$34 million to transition 246 paramedics into intensive care paramedics, of which 203 will be in regional New South Wales
$33.9 million for the expansion of Staying Home Leaving Violence and continuation of Domestic Violence Pro-Active Support Services (DV Pass) to ensure victims of domestic and family violence are afforded the option to stay home safely with specialist case management support
$30 million over four years for social impact investments with a focus on women facing disadvantage and Indigenous youth
$12.2 million to fund Tresillian for a series of support measures to families experiencing difficulties in the critical first years of their child’s life, including six Regional Family Care Centres, five ‘Tresillian 2U’ vans, and staffing for the Macksville residential unit
$12 million to promote adoption and guardianship for children in out-of-home care, through increased awareness, a dedicated taskforce, and greater support
$8.6 million to support community care for people with movement disorders, such as Parkinson’s Disease, by delivering specialist nurses and allied health staff in 15 Local Health Districts. This package also includes funding for Parkinson’s NSW to support its InfoLine service as well as additional teaching, training and capacity building
NSW public sector employees’ access to new types of leave in the event that they experience a pre-term birth or suffer the tragedy of a miscarriage.
Budget Overview
Budget Statement 2021-22 1 - 11
Improving cost of living
For individuals and families more broadly, this Budget provides a range of new cost of living measures that build on the Government’s current extensive support program.
Box 1.4: Supporting individuals and families with the cost of living
The NSW Government provides a wide range of support to individuals and families across the state. In 2021-22 over $6 billion in new and existing rebates, concessions and cost of living measures are available to households to assist in reducing the impost of everyday living costs and encourage involvement in activities to support development and participation.
In this Budget, the Government is bolstering its existing support programs with a range of new and expanded measures including:
$333.2 million to continue the uplift in the Energy Social Programs (totalling $1.3 billion over four years) which delivers six energy rebates and one crisis support scheme, to assist low-income households in meeting their energy bills
$246.3 million to extend the Regional Seniors Transport Card for an additional two years, providing eligible seniors living in regional New South Wales with $250 each year for fuel, taxi travel, or NSW TrainLink tickets
$150 million to deliver the Free Preschool program for school year 2022 - to provide approximately two days of free preschool per week to all eligible preschool children
$43.9 million over two years to provide a $100 Learn to Swim Active Pre-Schooler Voucher for children aged 3 to 6 years not yet enrolled in school to develop important water safety and swimming skills
$14.2 million for a Cost of Living program and campaign to increase public awareness of NSW Government support available to individuals and families.
Existing measures include support to not only save our citizens thousands of dollars each year, but also to contribute to the delivery of social outcomes, including:
over $60 million saved by drivers in Toll Relief this year with an average saving of $347
Active Kids providing savings through two $100 vouchers to use towards sport and active recreation programs, with over 3.2 million vouchers redeemed since program inception
Creative Kids providing savings through one $100 voucher to help cover the cost of creative and cultural activities, with over 900,000 vouchers redeemed
more than 120 million free or subsidised trips taken by students each year to travel from home to school or TAFE under the School Student Transport Scheme
the Fee Free Vocational Education program saves students up to $1,000 per course through 100,000 free TAFE and VET courses, including 70,000 courses for young job-seekers combining work and study through a traineeship, and 30,000 free TAFE places for mature-aged workers seeking to retrain or re-enter the workforce
the Smart and Skilled program provides subsidised and fee free concessions to over 25,000 students commencing selected qualifications
Start Strong allows over 44,000 eligible children to participate in over 600 hours of quality preschool education to ensure children are equipped with the social, cognitive and emotional skills they need to engage in learning.
The Government will also keep Opal fare increases to 1.5 per cent and continue to provide customers with the benefits of off-peak discounts and weekend caps introduced in 2020.
The Cost of Living ‘One-Stop Shop’ Service provided by Service NSW has undertaken more than 70,000 cost of living appointments since July 2018. With the average saving per appointment almost $600, this means more money is being spent on the things that matter.
Budget Overview
1 - 12 Budget Statement 2021-22
Investing in our communities
This Budget also includes investment to enhance our communities. It puts in place important infrastructure upgrades to improve livelihoods, and also provides facilities to support people staying active and enjoying their local surrounds. This includes:
$205.1 million for the Multisport Community Infrastructure Fund that will support the development of local sporting facilities that can be used by multiple sporting codes, with a focus on increasing participation and maximising accessibility
$34.1 million to expand the Roads to Home Program to up to 10 Aboriginal communities
$18.6 million additional funding for the Community Building Partnerships program to promote increased investment in local communities
expanding the Surf Club Facility Program, bringing the total funding over four years to $16 million, to construct new and upgraded Surf Club facilities that are safe and inclusive.
Transforming New South Wales
The Government is in a strong position with the recent release of the 2021-22 NSW Intergenerational Report and Productivity Commission’s White Paper, both of which provide real insights into the areas of opportunity to transform Government services and stay ahead of emerging trends. This Budget invests in new initiatives and technologies to further drive productivity and improve services, including:
$719 million to complete the Critical Communications Enhancement Program that will expand and enhance the Public Safety Network and ensure there is radio coverage across the state for first responders
$139.3 million to deliver the Accelerated Infrastructure Fund 2, which will provide funding to councils in high growth areas to support construction activity and the release of new homes and employment areas in key greenfield sites
$35 million to deliver for an Entrepreneurship and Innovation Fund to promote new ideas, design and investment while creating sustainable jobs in targeted sectors, precincts and regional New South Wales
$24.6 million to continue to deliver the services of the Data Analytics Centre which provides cross-sector data-driven insights to inform policy decisions and citizen focused outcomes
$20 million to accelerate the delivery of strategic planning precincts to shape land use and rezoning outcomes
$19 million to provide an asset refresh to video conferencing and computer facilities in TAFE campuses across New South Wales, improving teaching delivery and student experience
$5.1 million to provide monthly home delivered books to children aged up to five years old to targeted communities, which has already demonstrated outcomes in improved engagement with reading
recurrent funding for the Treasurer’s Financial Literacy Program, which will encourage children to develop positive money habits and increase their financial literacy
a Bushfire Response Research Development Mission and Emerging Industry Infrastructure Fund as part of a $36 million investment into research and development, to plan, prepare and respond to bushfires in the state, aligned with the 2021 Accelerating Research and Development Plan
ongoing funding to ensure TAFE NSW is resourced to deliver quality vocational education and training.
Importantly, the Government is also progressing its proposal to reform property tax, removing significant financial barriers to buying a home.
Budget Overview
Budget Statement 2021-22 1 - 13
Box 1.5: Property tax reform
In November 2020, the NSW Government released a Consultation Paper outlining a proposal for a phased transition away from stamp duty. People buying a property would be able to choose between paying a large amount of stamp duty (and land tax where applicable), or alternatively to pay a small annual property tax based on unimproved land values.
The NSW Government is committed to making home ownership more achievable. Since the 1990s, average earnings have trebled, average home prices have increased around five times and average stamp duty on dwellings has increased more than seven times. Home ownership has declined from around 70 per cent of the private dwelling stock in the 1990s to around 64 per cent today.
The reform proposal is aimed at boosting home ownership, with a particular emphasis on first home ownership. Removing stamp duty, which is one of the principal barriers to home ownership, would lower the up-front cost of home purchases for all buyers. It would help to enhance household mobility, allowing more people to choose the right home for themselves and their families at every stage of life, without being penalised by stamp duty. And it would help to drive productivity growth, lifting the incomes of all residents of New South Wales. Over time, the reform could improve housing affordability, increase home ownership by 6 per cent, increase average household income by around $3,300 and create 70,000 additional jobs.
From November 2020 to March 2021, almost 24,000 people engaged in the consultation process. More than three quarters of people responding to a survey believed that the current stamp duty system needs to be changed. The proposal resonated particularly strongly with first home buyers, and many expert groups responded positively to the proposal.
The existing systems of stamp duty and land tax are complex, and the property tax proposal introduces new concepts. Many submissions and comments made to the Government expressed concern, or requested more detail, about various aspects of the proposal.
On 11 June 2021, the Government released a Property Tax Progress Paper (available at www.nsw.gov.au/initiative/property-tax-reform) outlining the findings from consultation, and providing more information on the topics most frequently raised through consultation.
The Government is committed to putting forward the best possible model to create the most effective tax system for the people of New South Wales. Comments on the Progress Paper received before 30 July 2021 will help to inform the Government as it considers its next steps for property tax reform.


Budget Statement 2021-22 2 - 1
2. THE ECONOMY
The New South Wales economy has rebounded strongly since the depths of the COVID-19 pandemic. This largely reflects progress in easing social distancing measures and effective government and monetary stimulus. Economic activity and employment have both rebounded, exceeding pre-COVID levels, around a year earlier than previously expected.
Above-trend growth is forecast on balance over the next four years as the economy returns to its full potential, with average growth of 2¾ per cent per annum.
Spare capacity in the labour market is now expected to dissipate much sooner than earlier forecast. All the jobs lost at the height of the pandemic have since returned, with 36,000 more people employed now than prior to the pandemic. An additional 200,000 workers are expected to be employed by June 2025 (relative to the March quarter 2021), when the unemployment rate is forecast to reach estimates of full employment (around 4½ per cent).
A tighter labour market will support wages growth and inflation, although growth in the wage price index is forecast to remain well below the historical average. Inflation is likely to remain low before eventually rising modestly to the lower half of the Reserve Bank of Australia’s 2-3 per cent target range. The NSW Government’s new wages policy will also support faster wages growth in the public sector.
The Commonwealth’s forecast for a delay in the opening of international borders (to the middle of 2022) represents a near-term constraint to the continued strong recovery in the economy.
While reopening the international border will lead to a rise in outbound travel, the loss of international students, inbound tourists and migrants represents a greater negative impact to the outlook. The ongoing border closure will continue to weigh on population growth, which is expected to be 0.7 per cent on average over the next four years, compared to a pre-COVID rate of 1.3 per cent (over 2018-19).
The unpredictable nature of the pandemic means that risks to the outlook will persist. Delays in the vaccine rollout could disrupt the recovery underway, especially if they result in a further delay in reopening the international border.
The Government’s infrastructure investment of $108.5 billion and targeted stimulus will continue to bolster the economy in the near-term, while productivity reforms in this Budget will help to shore up growth and prosperity for the future.
Table 2.1: NSW economic performance and outlook(a)
2019-20 2020-21 2021-22 2022-23 2023-24 2024-25
Outcome Forecasts Forecasts Forecasts Forecasts Forecasts
Real state final demand (1.9) 2¼ (½) 3½ (2) 1¼ (2) 2½ (3¼) 3
Real gross state product (0.7) ¾ (-½) 3¼ (2¾) 1 (2) 3¼ (2¾) 3¼
Employment 0.0 ¼ (-¼) 1¼ (¾) ½ (1) 1¼ (1) 1¾
Unemployment rate (b) 6.5 5¾ (6½) 5¼ (6) 5 (5¾) 4¾ (5) 4½
Sydney consumer price index 1.0 1½ (1¼) 1¾ (1½) 1¾ (1½) 2¼ (1¾) 2¼
Wage price index 2.0 1½ (1¼) 2 (1½) 2¼ (1½) 2¼ (1¾) 2½
Nominal gross state product 0.0 2¼ (1¾) 5½ (4) 2½ (3¼) 4 (4¼) 4½
Population (c) 1.0 0.0 -0.1 (0.2) 0.7 1.1 1.2
(a) Per cent change, annual average unless otherwise stated. Previous forecast (2020-21 Half-Yearly Review) in parenthesis where different.
(b) June quarter, per cent. (c) Per cent change through the year to 30 June. Forecasts are rounded to the nearest 0.1 percentage points. Sources: ABS 5206.0, 5220.0, 6202.0, 6401.0, 6345.0, 3101.0 and NSW Treasury
The Economy
2 - 2 Budget Statement 2021-22
2.1 The economy is bouncing back faster than expected
The NSW economy has outperformed expectations as at the time of the 2020-21 Half-Yearly Review (February 2021). State final demand (SFD) had surpassed pre-COVID levels by early 2021. Meanwhile, all the nearly 270,000 jobs shed between February and May of last year have been regained. Employment in May 2021 is around 36,000 higher than its pre-pandemic level, with the State’s unemployment rate in the June quarter so far dropping to 5.3 per cent.
The strength of the rebound has been heavily aided by:
the removal of most social distancing measures sooner than anticipated, supported by public confidence in the NSW health system to manage outbreaks of the virus without significant lockdowns
the effectiveness of monetary and government support programs for business and households.
These factors have contributed to a recent record high reading for business confidence and an 11-year high for consumer sentiment.
The speed of the bounce-back has substantially reduced (but not eliminated) the risk of more permanent impacts on economic activity and employment.
Stronger household spending and the buoyant housing market have driven much of the State’s recovery to date. Both have benefited significantly from economic stimulus and an easing of restrictions. Momentum from these sectors is expected to spill into other parts of the economy, driving up the demand for labour and further lowering the unemployment rate.
The primary factor preventing the economy’s return to its pre-COVID growth path is the ongoing closure of Australia’s international border. Based on current Commonwealth migration policies, the population in New South Wales will remain well below pre-COVID projections. This will remain the case even after international borders are reopened, which is now expected to occur around the middle of 2022, around six months later than previously thought.
The Commonwealth's delay in reopening Australia's international border will slow down economic and employment growth, but will not derail the recovery. The near-term loss in population growth reduces aggregate demand and cuts off an important source of skilled and unskilled labour. It also increases the risk of longer-term effects for industries reliant on international travel, such as education and Sydney CBD tourism.
There is potential for impacted industries to recovery quickly once borders open following the successful rollout of vaccines. In the meantime, very low interest rates and ongoing fiscal stimulus are helping to fill the void.
While part of the rebound in the economy reflects a bring forward of activity from future years, there also is an improvement in underlying economic conditions. Economic growth forecasts subsequently are revised higher across much of the budget horizon, with most years now expected to see above-trend growth. In addition to the support from policy, the stronger-than-expected economy has given businesses the confidence to rehire staff, reducing uncertainty and with it the need for precautionary saving by households. This is a significant turnaround in fortunes that should boost economic activity on a per capita basis beyond its pre-COVID trends in the coming years.
Given the revised outlook, the State’s unemployment rate is now expected to fall faster than previously forecast and reach a level consistent with full employment by 2024-25.1 This translates to an increase in employment of almost 450,000 since the depths of the COVID-19 pandemic in mid-2020.
1 Full employment is estimated to be around a 4½ per cent unemployment rate. This is considered the lowest rate of
unemployment that can be sustained without inflation becoming an issue.
The Economy
Budget Statement 2021-22 2 - 3
There is potential for the outlook to improve further over coming years. Despite the population constraints, there are other levers to drive growth, including:
higher labour participation, particularly for women and older age cohorts
faster growth in productivity, which in recent years has been well below the historical average.
The Government can play a key role in encouraging improvement in both these drivers, through an effective reform agenda (see Box 1.3 - Boosting productivity and the quality of services). Doing so will lift the economy’s potential, whilst increasing living standards of NSW residents.
Despite the stronger economy, risks will remain heightened while the global pandemic endures. Risks that could affect the recovery include the emergence of new strains of the virus, elevated rates of infection in some countries and further delays in the vaccine rollout. A fast and effective vaccine rollout is crucial to supporting public confidence and ensuring Australia (and New South Wales) can reopen to the world as quickly as possible.
While the recovery in the economy is expected to be strong enough to withstand the conclusion of the Commonwealth’s JobKeeper program back in late March, its cessation along with other measures (which have artificially suppressed business failures) could weigh on labour market conditions to a greater degree than expected.
Beyond the pandemic, other risks include disruptions to trade and a tightening in macroprudential policy in response to the strong housing market. These risks have heightened in recent months. See section 2.6 for further analysis on upside and downside risks.
2.2 Global outlook and implications for New South Wales
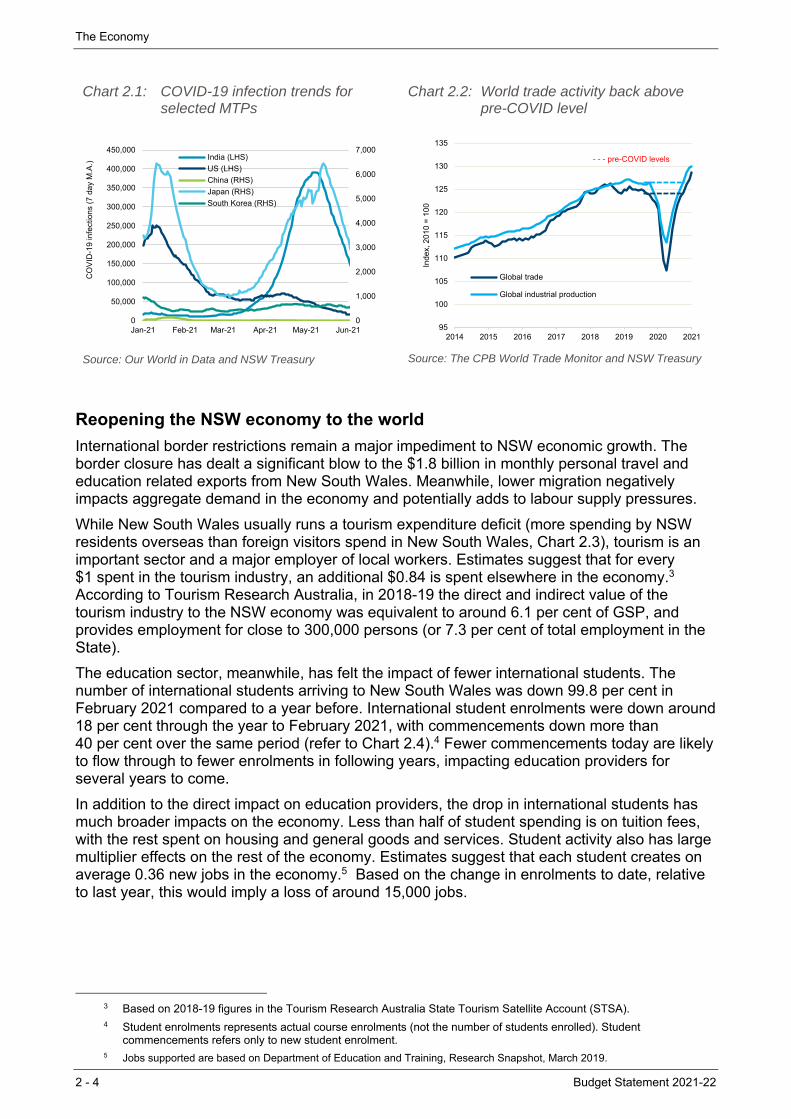
The International Monetary Fund (IMF) has upgraded its 2021 and 2022 global growth forecasts. These revisions reflect not only the stronger-than-expected rebound in activity to date, but optimism in the rollout of vaccines across the major developed economies and additional fiscal stimulus in the United States. In its April 2021 outlook, the IMF:
revised 2021 global growth up 0.5 percentage points since January to 6.0 per cent
revised 2022 growth up 0.2 percentage points to 4.4 per cent.
The upward revisions are most pronounced for advanced economies.
The growth outlook for NSW’s major trading partners (MTP)2 is slightly stronger in 2021 (at 6.3 per cent).
Despite the stronger forecasts, the international economic recovery will remain precarious while the pandemic is ongoing and until the vaccine rollout has progressed significantly further. A resurgence in COVID-19 infections, like what was seen earlier this year in India, could still impede the global recovery (Chart 2.1).
2 Major Trading Partner (MTP) growth is a trade weighted measure of global growth, using NSW trade weights. This
places more significance on growth in countries that currently demand more of the State’s exports.
The Economy
2 - 4 Budget Statement 2021-22
Chart 2.1: COVID-19 infection trends for selected MTPs
Source: Our World in Data and NSW Treasury
Chart 2.2: World trade activity back above pre-COVID level
Source: The CPB World Trade Monitor and NSW Treasury
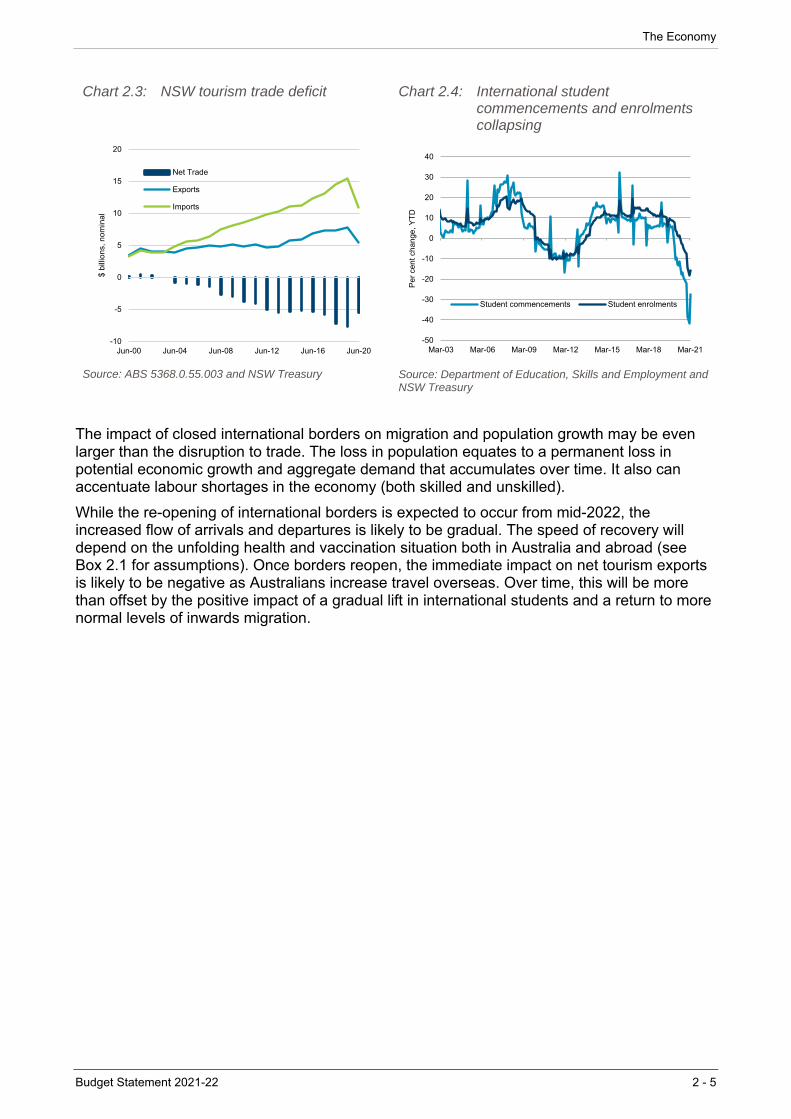
Reopening the NSW economy to the world
International border restrictions remain a major impediment to NSW economic growth. The border closure has dealt a significant blow to the $1.8 billion in monthly personal travel and education related exports from New South Wales. Meanwhile, lower migration negatively impacts aggregate demand in the economy and potentially adds to labour supply pressures.
While New South Wales usually runs a tourism expenditure deficit (more spending by NSW residents overseas than foreign visitors spend in New South Wales, Chart 2.3), tourism is an important sector and a major employer of local workers. Estimates suggest that for every $1 spent in the tourism industry, an additional $0.84 is spent elsewhere in the economy.3 According to Tourism Research Australia, in 2018-19 the direct and indirect value of the tourism industry to the NSW economy was equivalent to around 6.1 per cent of GSP, and provides employment for close to 300,000 persons (or 7.3 per cent of total employment in the State).
The education sector, meanwhile, has felt the impact of fewer international students. The number of international students arriving to New South Wales was down 99.8 per cent in February 2021 compared to a year before. International student enrolments were down around 18 per cent through the year to February 2021, with commencements down more than 40 per cent over the same period (refer to Chart 2.4).4 Fewer commencements today are likely to flow through to fewer enrolments in following years, impacting education providers for several years to come.
In addition to the direct impact on education providers, the drop in international students has much broader impacts on the economy. Less than half of student spending is on tuition fees, with the rest spent on housing and general goods and services. Student activity also has large multiplier effects on the rest of the economy. Estimates suggest that each student creates on average 0.36 new jobs in the economy.5 Based on the change in enrolments to date, relative to last year, this would imply a loss of around 15,000 jobs.
3 Based on 2018-19 figures in the Tourism Research Australia State Tourism Satellite Account (STSA). 4 Student enrolments represents actual course enrolments (not the number of students enrolled). Student
commencements refers only to new student enrolment. 5 Jobs supported are based on Department of Education and Training, Research Snapshot, March 2019.
0
1,000
2,000
3,000
4,000
5,000
6,000
7,000
0
50,000
100,000
150,000
200,000
250,000
300,000
350,000
400,000
450,000
Jan-21 Feb-21 Mar-21 Apr-21 May-21 Jun-21
CO
VID
-19
infe
ctio
ns
(7 d
ay
M.A
.)
India (LHS)
US (LHS)
China (RHS)
Japan (RHS)
South Korea (RHS)
95
100
105
110
115
120
125
130
135
2014 2015 2016 2017 2018 2019 2020 2021
Ind
ex,
20
10
= 1
00
Global trade
Global industrial production
- - - pre-COVID levels
The Economy
Budget Statement 2021-22 2 - 5
Chart 2.3: NSW tourism trade deficit Chart 2.4: International student commencements and enrolments collapsing
Source: ABS 5368.0.55.003 and NSW Treasury
Source: Department of Education, Skills and Employment and NSW Treasury
The impact of closed international borders on migration and population growth may be even larger than the disruption to trade. The loss in population equates to a permanent loss in potential economic growth and aggregate demand that accumulates over time. It also can accentuate labour shortages in the economy (both skilled and unskilled).
While the re-opening of international borders is expected to occur from mid-2022, the increased flow of arrivals and departures is likely to be gradual. The speed of recovery will depend on the unfolding health and vaccination situation both in Australia and abroad (see Box 2.1 for assumptions). Once borders reopen, the immediate impact on net tourism exports is likely to be negative as Australians increase travel overseas. Over time, this will be more than offset by the positive impact of a gradual lift in international students and a return to more normal levels of inwards migration.
-10
-5
0
5
10
15
20
Jun-00 Jun-04 Jun-08 Jun-12 Jun-16 Jun-20
$ b
illio
ns,
no
min
al
Net Trade
Exports
Imports
-50
-40
-30
-20
-10
0
10
20
30
40
Mar-03 Mar-06 Mar-09 Mar-12 Mar-15 Mar-18 Mar-21
Pe
r ce
nt c
ha
nge
, YT
D
Student commencements Student enrolments

The Economy
2 - 6 Budget Statement 2021-22
Box 2.1 Health assumptions that underpin the economic outlook
Closed international borders are the most significant restriction remaining in terms of economic costs.
The assumptions in the 2021-22 Budget regarding Australia’s international border align with those in the 2021-22 Commonwealth Budget. This reflects the fact that the Commonwealth Government controls the policy levers around Australia’s international borders and the vaccine rollout. The anticipated reopening of borders has been delayed another six months to mid-2022, following the assumed vaccination of most of the adult population by end-2021.
Thereafter, the return of international students and permanent migrants is assumed to be gradual.
Any material increase in outbound or inbound tourism is not anticipated until the second half of 2022. Some inbound travel of New Zealand tourists to NSW without quarantine restrictions has resumed, but are still well down on usual levels.
NSW tourists are now permitted to travel to New Zealand, although temporary disruptions already have occurred following localised COVID-19 outbreaks.
The Commonwealth has indicated the possibility of additional travel bubbles, although the economic benefit of these is expected to be marginal.
Similarly, the NSW Government has announced a pilot program to commence the return of some international students through the quarantine system from the middle of 2021.
No interstate border restrictions are assumed, although recent outbreaks of the virus suggest an ongoing risk that other states could continue to sporadically close borders in response to community COVID-19 transmissions.
The domestic economy is expected to remain largely free of restrictions. It is assumed that economic restrictions eased since the peak of the pandemic – such as limits on weddings, the 4sqm rule and capacity limits on theatres and sporting events – will not be reimposed.
2.3 The NSW economic outlook
Employment is already past pre-COVID levels
The labour market recovery was even better than had been expected earlier this year. The stronger rebound has been aided by the successful suppression of the COVID-19 virus, allowing for the removal of most social distancing measures much sooner than anticipated, and the effectiveness of government stimulus support for businesses and households.
By the middle of the June quarter 2021, the jobs lost between February and May 2020 had been more than regained, with the level of employment 0.9 per cent above its pre-COVID level.
Solid employment growth has meant that the unemployment rate has dropped sharply to 5.3 per cent so far in the June quarter, from a high of 7.1 per cent in July 2020 (Chart 2.5). Still, the unemployment rate remains higher than pre-COVID, and at a level suggesting that some degree of spare capacity remains in the labour market.
The participation rate is now above pre-COVID levels, with female participation reaching a record high of 61.7 per cent in May, while the participation of older age cohorts also has been elevated. This has helped to partially offset the labour supply pressures emanating from the lack of population growth due to closed international borders. Higher participation by these cohorts likely reflects a combination of both temporary and structural factors accelerated by COVID-19.
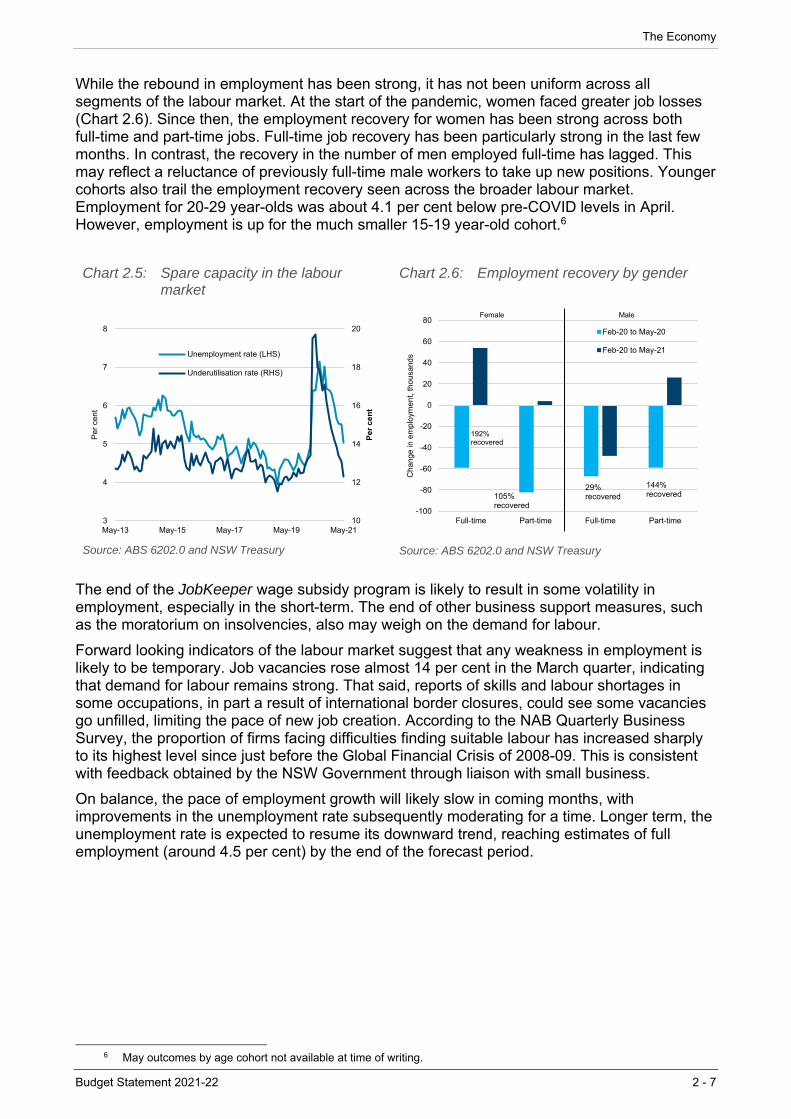
The Economy
Budget Statement 2021-22 2 - 7
While the rebound in employment has been strong, it has not been uniform across all segments of the labour market. At the start of the pandemic, women faced greater job losses (Chart 2.6). Since then, the employment recovery for women has been strong across both full-time and part-time jobs. Full-time job recovery has been particularly strong in the last few months. In contrast, the recovery in the number of men employed full-time has lagged. This may reflect a reluctance of previously full-time male workers to take up new positions. Younger cohorts also trail the employment recovery seen across the broader labour market. Employment for 20-29 year-olds was about 4.1 per cent below pre-COVID levels in April. However, employment is up for the much smaller 15-19 year-old cohort.6
Chart 2.5: Spare capacity in the labour market
Source: ABS 6202.0 and NSW Treasury
Chart 2.6: Employment recovery by gender
Source: ABS 6202.0 and NSW Treasury
The end of the JobKeeper wage subsidy program is likely to result in some volatility in employment, especially in the short-term. The end of other business support measures, such as the moratorium on insolvencies, also may weigh on the demand for labour.
Forward looking indicators of the labour market suggest that any weakness in employment is likely to be temporary. Job vacancies rose almost 14 per cent in the March quarter, indicating that demand for labour remains strong. That said, reports of skills and labour shortages in some occupations, in part a result of international border closures, could see some vacancies go unfilled, limiting the pace of new job creation. According to the NAB Quarterly Business Survey, the proportion of firms facing difficulties finding suitable labour has increased sharply to its highest level since just before the Global Financial Crisis of 2008-09. This is consistent with feedback obtained by the NSW Government through liaison with small business.
On balance, the pace of employment growth will likely slow in coming months, with improvements in the unemployment rate subsequently moderating for a time. Longer term, the unemployment rate is expected to resume its downward trend, reaching estimates of full employment (around 4.5 per cent) by the end of the forecast period.
6 May outcomes by age cohort not available at time of writing.
10
12
14
16
18
20
3
4
5
6
7
8
May-13 May-15 May-17 May-19 May-21
Pe
r c
en
t
Pe
r ce
nt
Unemployment rate (LHS)
Underutilisation rate (RHS)
-100
-80
-60
-40
-20
0
20
40
60
80
Full-time Part-time Full-time Part-time
Ch
an
ge in
em
plo
yme
nt,
tho
usa
nd
s
Feb-20 to May-20
Feb-20 to May-21
Female Male
192% recovered
105% recovered
29% recovered
144% recovered

The Economy
2 - 8 Budget Statement 2021-22
Box 2.2 Female workers crucial to rebound in employment and participation
Labour market outcomes have been much stronger than was anticipated at the start of the pandemic. This is especially the case for women. Female employment fell by more than 141,000 between February and May 2020, accounting for 53 per cent of the total decline in employment during the depths of the pandemic. Since then, female employment more than reversed the declines recorded during the worst of the pandemic, rebounding by more than 199,000 through to May 2021.
Increased female participation in the labour force has been critical to the rebound in the overall participation rate. The female participation rate experienced an accelerated step up since the worst of the pandemic (Chart 2.7), reaching a record high of 61.7 per cent in May 2021. This acceleration is likely due to a combination of structural and temporary factors brought on by COVID.
Chart 2.7: Labour force participation by gender (quarterly)
Source: ABS 6202.0 and NSW Treasury
Increases in the JobSeeker payment and the temporary removal of mutual obligation requirements (e.g. the need to look for work as part of an individual’s job plan) likely added to the number of women actively seeking employment.
Another likely driver of increased workforce participation among women is greater workplace flexibility and the accelerated digitisation of the economy. This is particularly beneficial for women, who may have a greater share of parenting or carer responsibilities and otherwise would be unable to enter or re-join the labour force.
While flexible working was gaining traction before COVID-19, there has been an accelerated uptake of the practice in the last 12-months. This has increased participation by those who otherwise would find it challenging to balance personal commitments alongside work.
The rise in female participation continues the long-run upward trend evident since well before COVID-19. Changes in societal norms, better access to childcare and increased educational attainment all have contributed to the rising trend over the last few decades. The female participation rate increased more than 4 percentage points in the decade to December 2019.
The female employment-to-population ratio has increased from less than 40 per cent in the late 1970s, to more than 59 per cent now. Women now make up almost 48 per cent of the State’s workforce, up from around 36 per cent in the late 1970s.
Despite these changes, the female participation rate remains about 10 percentage points below that of men. This suggests there are further opportunities to remove barriers to women entering or re-entering the workforce after extended time away.
56
58
60
62
66
68
70
72
Mar-15 Mar-17 Mar-19 Mar-21
Pe
r ce
nt
Pe
r ce
nt
Male LHS
Female RHS
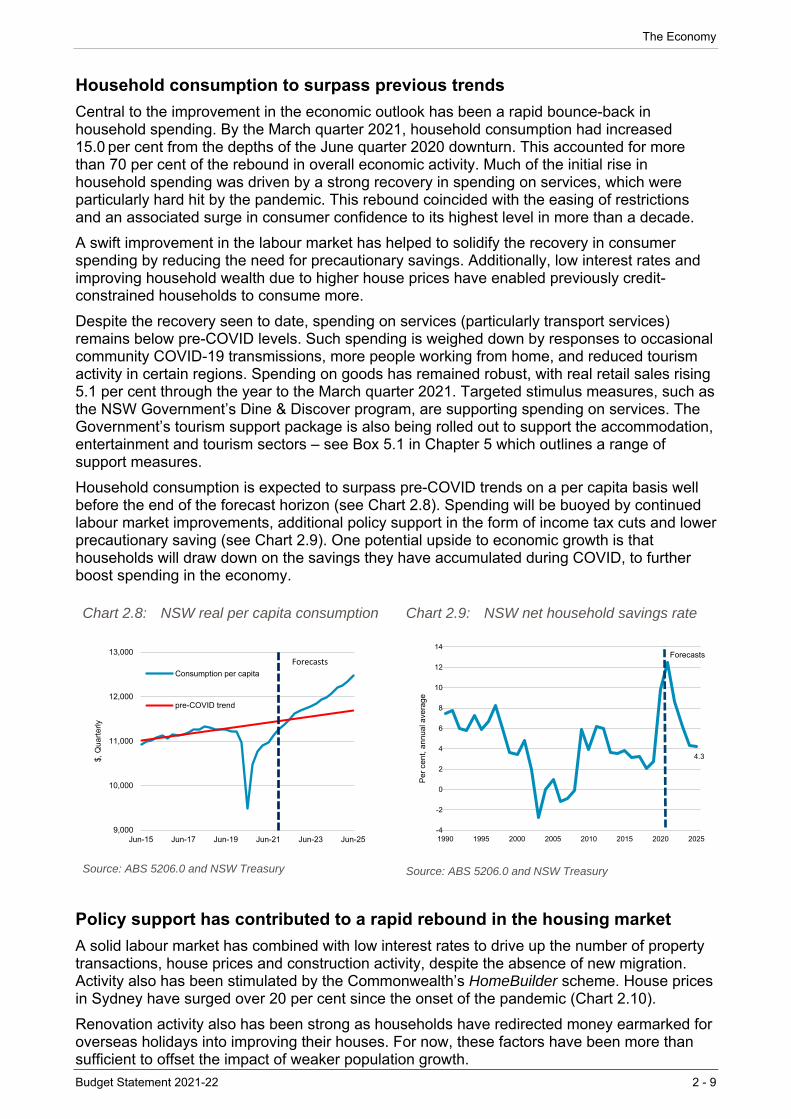
The Economy
Budget Statement 2021-22 2 - 9
Household consumption to surpass previous trends
Central to the improvement in the economic outlook has been a rapid bounce-back in household spending. By the March quarter 2021, household consumption had increased 15.0 per cent from the depths of the June quarter 2020 downturn. This accounted for more than 70 per cent of the rebound in overall economic activity. Much of the initial rise in household spending was driven by a strong recovery in spending on services, which were particularly hard hit by the pandemic. This rebound coincided with the easing of restrictions and an associated surge in consumer confidence to its highest level in more than a decade.
A swift improvement in the labour market has helped to solidify the recovery in consumer spending by reducing the need for precautionary savings. Additionally, low interest rates and improving household wealth due to higher house prices have enabled previously credit-constrained households to consume more.
Despite the recovery seen to date, spending on services (particularly transport services) remains below pre-COVID levels. Such spending is weighed down by responses to occasional community COVID-19 transmissions, more people working from home, and reduced tourism activity in certain regions. Spending on goods has remained robust, with real retail sales rising 5.1 per cent through the year to the March quarter 2021. Targeted stimulus measures, such as the NSW Government’s Dine & Discover program, are supporting spending on services. The Government’s tourism support package is also being rolled out to support the accommodation, entertainment and tourism sectors – see Box 5.1 in Chapter 5 which outlines a range of support measures.
Household consumption is expected to surpass pre-COVID trends on a per capita basis well before the end of the forecast horizon (see Chart 2.8). Spending will be buoyed by continued labour market improvements, additional policy support in the form of income tax cuts and lower precautionary saving (see Chart 2.9). One potential upside to economic growth is that households will draw down on the savings they have accumulated during COVID, to further boost spending in the economy.
Chart 2.8: NSW real per capita consumption Chart 2.9: NSW net household savings rate
Source: ABS 5206.0 and NSW Treasury
Source: ABS 5206.0 and NSW Treasury
Policy support has contributed to a rapid rebound in the housing market
A solid labour market has combined with low interest rates to drive up the number of property transactions, house prices and construction activity, despite the absence of new migration. Activity also has been stimulated by the Commonwealth’s HomeBuilder scheme. House prices in Sydney have surged over 20 per cent since the onset of the pandemic (Chart 2.10).
Renovation activity also has been strong as households have redirected money earmarked for overseas holidays into improving their houses. For now, these factors have been more than sufficient to offset the impact of weaker population growth.
9,000
10,000
11,000
12,000
13,000
Jun-15 Jun-17 Jun-19 Jun-21 Jun-23 Jun-25
$, Q
ua
rte
rly
Consumption per capita
pre-COVID trend
Forecasts
4.3
-4
-2
0
2
4
6
8
10
12
14
1990 1995 2000 2005 2010 2015 2020 2025
Pe
r ce
nt,
an
nu
al a
vera
ge
Forecasts

The Economy
2 - 10 Budget Statement 2021-22
The current strength in the housing market, in terms of price growth and new construction, is mainly reflected in houses rather than units. Until recently, it had mainly been underpinned by demand from owner-occupiers. Government policies are supporting first home buyers, with first home buyer activity surging in the second half of 2020. The number of transfer duty concessions to first home buyers was up by more than a third in the second half of 2020 (at nearly 25,000), compared to a year earlier.
Annual house price growth is expected to peak around late-2021. As higher prices encourage more owners to sell, this will work to limit house price growth over time. In addition, higher prices are expected to price out more potential buyers, weighing on demand.
Speculation has emerged around the potential for renewed macroprudential tightening by regulators in response to growing house prices. However, the concentration of lending growth in owner-occupier loans (rather than investors) suggests the current market conditions are less likely to evoke a response from regulators. For now, a significant macroprudential tightening is assumed to be unlikely, though this would change if speculative investor lending was to increase significantly. A major intervention would prompt a downward revision to house prices from baseline, with broad implications for the economic outlook (see Appendix F).
Chart 2.10: Sydney house prices Chart 2.11: Dwelling approvals
Source: CoreLogic and NSW Treasury
Source: ABS 8731.0 and NSW Treasury
Residential construction is expected to remain strong in the very near term, fuelled by higher house prices, ongoing policy support and low interest rates.
Activity for both new houses and renovations also is being supported by the HomeBuilder policy. NSW households lodged over 23,000 applications for the grants scheme, of which more than 16,000 were for new dwellings (equivalent to around 32 per cent of all building approvals in 2019). Building approvals issued by local councils spiked at the end of 2020 and the beginning of 2021, with approvals in April nearly 60 per cent larger than the average month in 2019 (Chart 2.11). At the same time, new home sales leapt more than 100 per cent in the final month of 2020 to record-high levels ahead of the phasing down of the HomeBuilder rebate in December, before surging again in March ahead of the program’s cessation in early April (Chart 2.12).
This pipeline of work is much larger than previously expected. The extension to the HomeBuilder commencement deadline to 18 months means that more projects will commence. This will provide further support for the residential construction industry into 2022, reducing the impact on economic growth from a drop in new dwelling construction. That said, building approvals are now running well ahead of the change in population, which is depressed due to the lack of inward migration. This suggests a potential oversupply in the near-term relative to the underlying demand for housing (Chart 2.13).
100
150
200
250
May-13 May-17 May-21
Str
atif
ied
Me
dia
n S
ale
s P
rice
Ind
ex
(se
aso
na
lly
ad
just
ed
, De
c 2
00
9 =
10
0)
House
Units
Dwellings
0
10
20
30
40
50
60
70
80
90
Apr-91 Apr-96 Apr-01 Apr-06 Apr-11 Apr-16 Apr-21
Th
ou
san
ds,
an
nu
al s
um
NSW VIC QLD WA
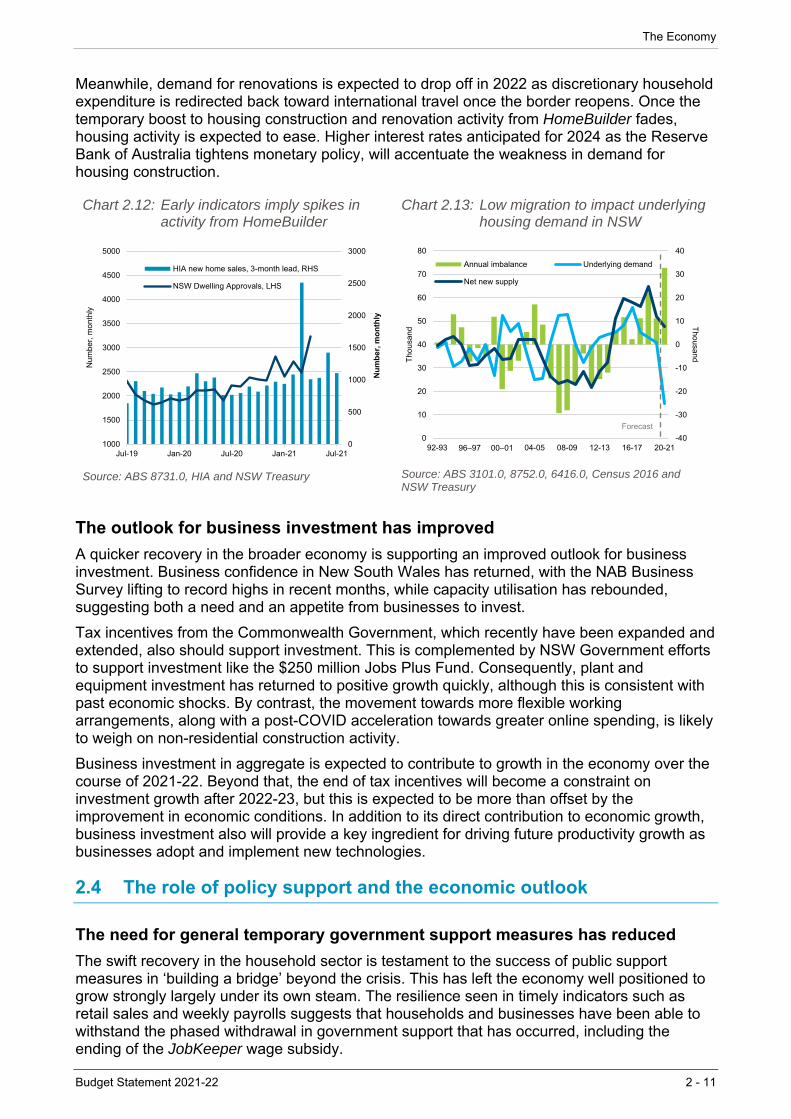
The Economy
Budget Statement 2021-22 2 - 11
Meanwhile, demand for renovations is expected to drop off in 2022 as discretionary household expenditure is redirected back toward international travel once the border reopens. Once the temporary boost to housing construction and renovation activity from HomeBuilder fades, housing activity is expected to ease. Higher interest rates anticipated for 2024 as the Reserve Bank of Australia tightens monetary policy, will accentuate the weakness in demand for housing construction.
Chart 2.12: Early indicators imply spikes in activity from HomeBuilder
Chart 2.13: Low migration to impact underlying housing demand in NSW
Source: ABS 8731.0, HIA and NSW Treasury Source: ABS 3101.0, 8752.0, 6416.0, Census 2016 and NSW Treasury
The outlook for business investment has improved
A quicker recovery in the broader economy is supporting an improved outlook for business investment. Business confidence in New South Wales has returned, with the NAB Business Survey lifting to record highs in recent months, while capacity utilisation has rebounded, suggesting both a need and an appetite from businesses to invest.
Tax incentives from the Commonwealth Government, which recently have been expanded and extended, also should support investment. This is complemented by NSW Government efforts to support investment like the $250 million Jobs Plus Fund. Consequently, plant and equipment investment has returned to positive growth quickly, although this is consistent with past economic shocks. By contrast, the movement towards more flexible working arrangements, along with a post-COVID acceleration towards greater online spending, is likely to weigh on non-residential construction activity.
Business investment in aggregate is expected to contribute to growth in the economy over the course of 2021-22. Beyond that, the end of tax incentives will become a constraint on investment growth after 2022-23, but this is expected to be more than offset by the improvement in economic conditions. In addition to its direct contribution to economic growth, business investment also will provide a key ingredient for driving future productivity growth as businesses adopt and implement new technologies.
2.4 The role of policy support and the economic outlook
The need for general temporary government support measures has reduced
The swift recovery in the household sector is testament to the success of public support measures in ‘building a bridge’ beyond the crisis. This has left the economy well positioned to grow strongly largely under its own steam. The resilience seen in timely indicators such as retail sales and weekly payrolls suggests that households and businesses have been able to withstand the phased withdrawal in government support that has occurred, including the ending of the JobKeeper wage subsidy.
0
500
1000
1500
2000
2500
3000
1000
1500
2000
2500
3000
3500
4000
4500
5000
Jul-19 Jan-20 Jul-20 Jan-21 Jul-21
Nu
mb
er, m
on
thly
Nu
mb
er,
mo
nth
ly
HIA new home sales, 3-month lead, RHS
NSW Dwelling Approvals, LHS
-40
-30
-20
-10
0
10
20
30
40
0
10
20
30
40
50
60
70
80
92-93 96–97 00–01 04-05 08-09 12-13 16-17 20-21
Th
ou
san
d
Th
ou
san
d
Annual imbalance Underlying demand
Net new supply
Forecast
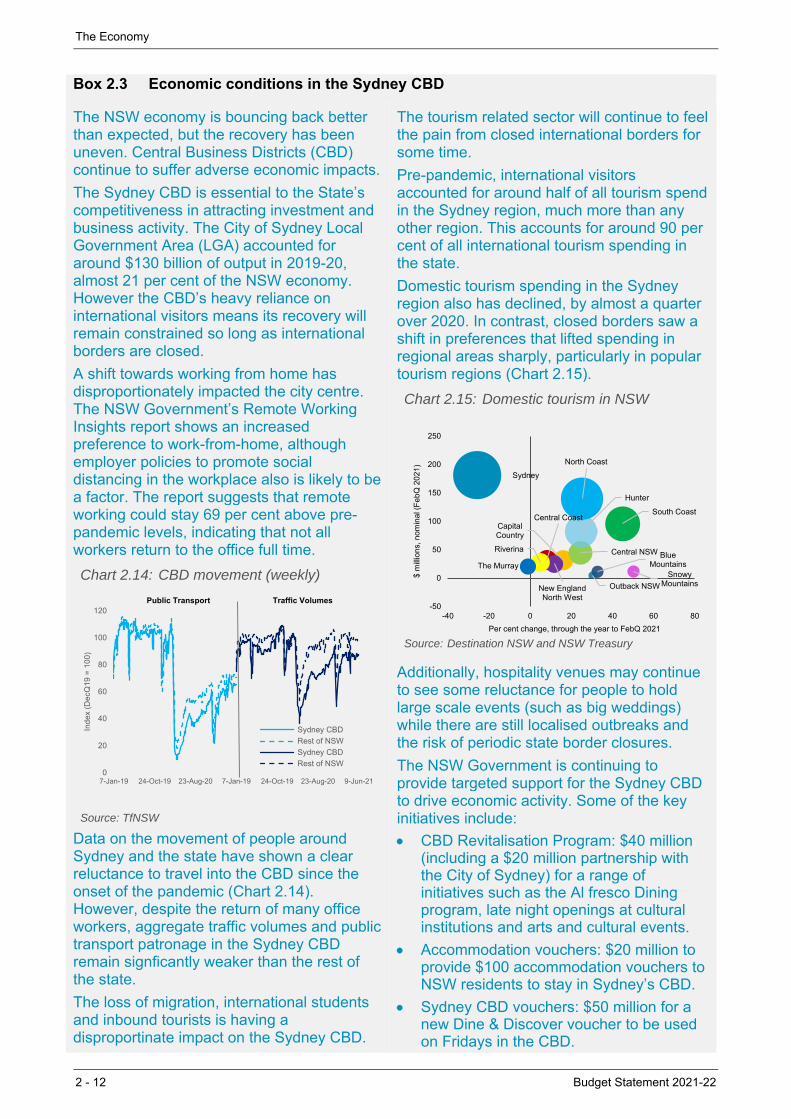
The Economy
2 - 12 Budget Statement 2021-22
Box 2.3 Economic conditions in the Sydney CBD
The NSW economy is bouncing back better than expected, but the recovery has been uneven. Central Business Districts (CBD) continue to suffer adverse economic impacts.
The Sydney CBD is essential to the State’s competitiveness in attracting investment and business activity. The City of Sydney Local Government Area (LGA) accounted for around $130 billion of output in 2019-20, almost 21 per cent of the NSW economy. However the CBD’s heavy reliance on international visitors means its recovery will remain constrained so long as international borders are closed.
A shift towards working from home has disproportionately impacted the city centre. The NSW Government’s Remote Working Insights report shows an increased preference to work-from-home, although employer policies to promote social distancing in the workplace also is likely to be a factor. The report suggests that remote working could stay 69 per cent above pre-pandemic levels, indicating that not all workers return to the office full time.
Chart 2.14: CBD movement (weekly)
Source: TfNSW
Data on the movement of people around Sydney and the state have shown a clear reluctance to travel into the CBD since the onset of the pandemic (Chart 2.14). However, despite the return of many office workers, aggregate traffic volumes and public transport patronage in the Sydney CBD remain signficantly weaker than the rest of the state.
The loss of migration, international students and inbound tourists is having a disproportinate impact on the Sydney CBD.
The tourism related sector will continue to feel the pain from closed international borders for some time.
Pre-pandemic, international visitors accounted for around half of all tourism spend in the Sydney region, much more than any other region. This accounts for around 90 per cent of all international tourism spending in the state.
Domestic tourism spending in the Sydney region also has declined, by almost a quarter over 2020. In contrast, closed borders saw a shift in preferences that lifted spending in regional areas sharply, particularly in popular tourism regions (Chart 2.15).
Chart 2.15: Domestic tourism in NSW
Source: Destination NSW and NSW Treasury
Additionally, hospitality venues may continue to see some reluctance for people to hold large scale events (such as big weddings) while there are still localised outbreaks and the risk of periodic state border closures.
The NSW Government is continuing to provide targeted support for the Sydney CBD to drive economic activity. Some of the key initiatives include:
CBD Revitalisation Program: $40 million (including a $20 million partnership with the City of Sydney) for a range of initiatives such as the Al fresco Dining program, late night openings at cultural institutions and arts and cultural events.
Accommodation vouchers: $20 million to provide $100 accommodation vouchers to NSW residents to stay in Sydney’s CBD.
Sydney CBD vouchers: $50 million for a new Dine & Discover voucher to be used on Fridays in the CBD.
0
20
40
60
80
100
120
7-Jan-19 24-Oct-19 23-Aug-20 7-Jan-19 24-Oct-19 23-Aug-20 9-Jun-21
Ind
ex
(De
cQ1
9 =
10
0)
Sydney CBD
Rest of NSW
Sydney CBD
Rest of NSW
Public Transport Traffic Volumes
Blue Mountains
Capital Country
Central Coast
Central NSW
Hunter
New England North West
North Coast
Outback NSW
Riverina
Snowy Mountains
South Coast
Sydney
The Murray
-50
0
50
100
150
200
250
-40 -20 0 20 40 60 80
$ m
illio
ns,
no
min
al (
Fe
bQ
20
21
)
Per cent change, through the year to FebQ 2021
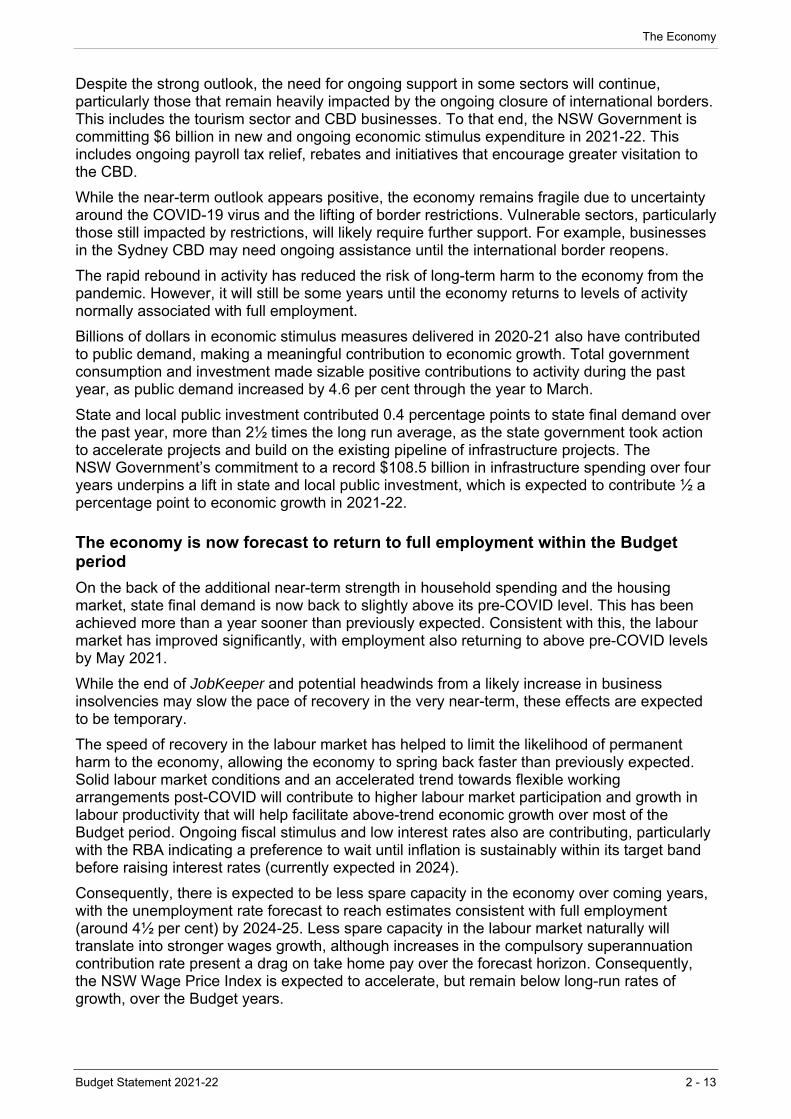
The Economy
Budget Statement 2021-22 2 - 13
Despite the strong outlook, the need for ongoing support in some sectors will continue, particularly those that remain heavily impacted by the ongoing closure of international borders. This includes the tourism sector and CBD businesses. To that end, the NSW Government is committing $6 billion in new and ongoing economic stimulus expenditure in 2021-22. This includes ongoing payroll tax relief, rebates and initiatives that encourage greater visitation to the CBD.
While the near-term outlook appears positive, the economy remains fragile due to uncertainty around the COVID-19 virus and the lifting of border restrictions. Vulnerable sectors, particularly those still impacted by restrictions, will likely require further support. For example, businesses in the Sydney CBD may need ongoing assistance until the international border reopens.
The rapid rebound in activity has reduced the risk of long-term harm to the economy from the pandemic. However, it will still be some years until the economy returns to levels of activity normally associated with full employment.
Billions of dollars in economic stimulus measures delivered in 2020-21 also have contributed to public demand, making a meaningful contribution to economic growth. Total government consumption and investment made sizable positive contributions to activity during the past year, as public demand increased by 4.6 per cent through the year to March.
State and local public investment contributed 0.4 percentage points to state final demand over the past year, more than 2½ times the long run average, as the state government took action to accelerate projects and build on the existing pipeline of infrastructure projects. The NSW Government’s commitment to a record $108.5 billion in infrastructure spending over four years underpins a lift in state and local public investment, which is expected to contribute ½ a percentage point to economic growth in 2021-22.
The economy is now forecast to return to full employment within the Budget period
On the back of the additional near-term strength in household spending and the housing market, state final demand is now back to slightly above its pre-COVID level. This has been achieved more than a year sooner than previously expected. Consistent with this, the labour market has improved significantly, with employment also returning to above pre-COVID levels by May 2021.
While the end of JobKeeper and potential headwinds from a likely increase in business insolvencies may slow the pace of recovery in the very near-term, these effects are expected to be temporary.
The speed of recovery in the labour market has helped to limit the likelihood of permanent harm to the economy, allowing the economy to spring back faster than previously expected. Solid labour market conditions and an accelerated trend towards flexible working arrangements post-COVID will contribute to higher labour market participation and growth in labour productivity that will help facilitate above-trend economic growth over most of the Budget period. Ongoing fiscal stimulus and low interest rates also are contributing, particularly with the RBA indicating a preference to wait until inflation is sustainably within its target band before raising interest rates (currently expected in 2024).
Consequently, there is expected to be less spare capacity in the economy over coming years, with the unemployment rate forecast to reach estimates consistent with full employment (around 4½ per cent) by 2024-25. Less spare capacity in the labour market naturally will translate into stronger wages growth, although increases in the compulsory superannuation contribution rate present a drag on take home pay over the forecast horizon. Consequently, the NSW Wage Price Index is expected to accelerate, but remain below long-run rates of growth, over the Budget years.
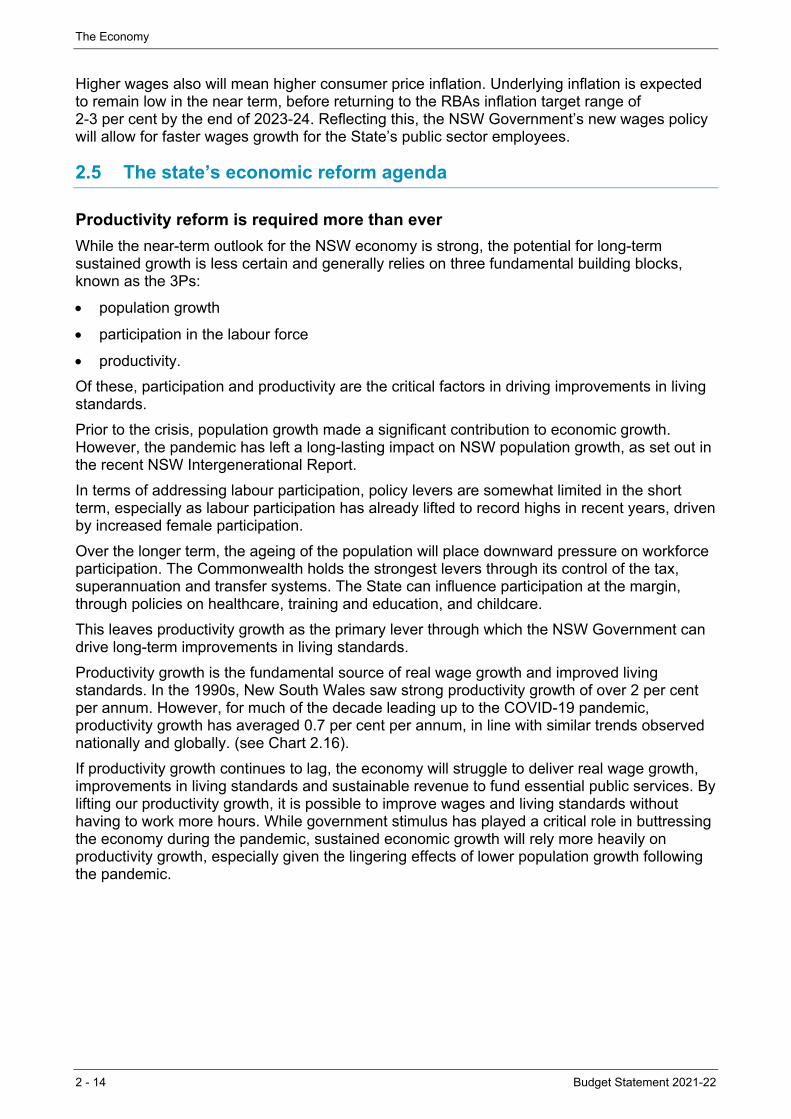
The Economy
2 - 14 Budget Statement 2021-22
Higher wages also will mean higher consumer price inflation. Underlying inflation is expected to remain low in the near term, before returning to the RBAs inflation target range of 2-3 per cent by the end of 2023-24. Reflecting this, the NSW Government’s new wages policy will allow for faster wages growth for the State’s public sector employees.
2.5 The state’s economic reform agenda
Productivity reform is required more than ever
While the near-term outlook for the NSW economy is strong, the potential for long-term sustained growth is less certain and generally relies on three fundamental building blocks, known as the 3Ps:
population growth
participation in the labour force
productivity.
Of these, participation and productivity are the critical factors in driving improvements in living standards.
Prior to the crisis, population growth made a significant contribution to economic growth. However, the pandemic has left a long-lasting impact on NSW population growth, as set out in the recent NSW Intergenerational Report.
In terms of addressing labour participation, policy levers are somewhat limited in the short term, especially as labour participation has already lifted to record highs in recent years, driven by increased female participation.
Over the longer term, the ageing of the population will place downward pressure on workforce participation. The Commonwealth holds the strongest levers through its control of the tax, superannuation and transfer systems. The State can influence participation at the margin, through policies on healthcare, training and education, and childcare.
This leaves productivity growth as the primary lever through which the NSW Government can drive long-term improvements in living standards.
Productivity growth is the fundamental source of real wage growth and improved living standards. In the 1990s, New South Wales saw strong productivity growth of over 2 per cent per annum. However, for much of the decade leading up to the COVID-19 pandemic, productivity growth has averaged 0.7 per cent per annum, in line with similar trends observed nationally and globally. (see Chart 2.16).
If productivity growth continues to lag, the economy will struggle to deliver real wage growth, improvements in living standards and sustainable revenue to fund essential public services. By lifting our productivity growth, it is possible to improve wages and living standards without having to work more hours. While government stimulus has played a critical role in buttressing the economy during the pandemic, sustained economic growth will rely more heavily on productivity growth, especially given the lingering effects of lower population growth following the pandemic.
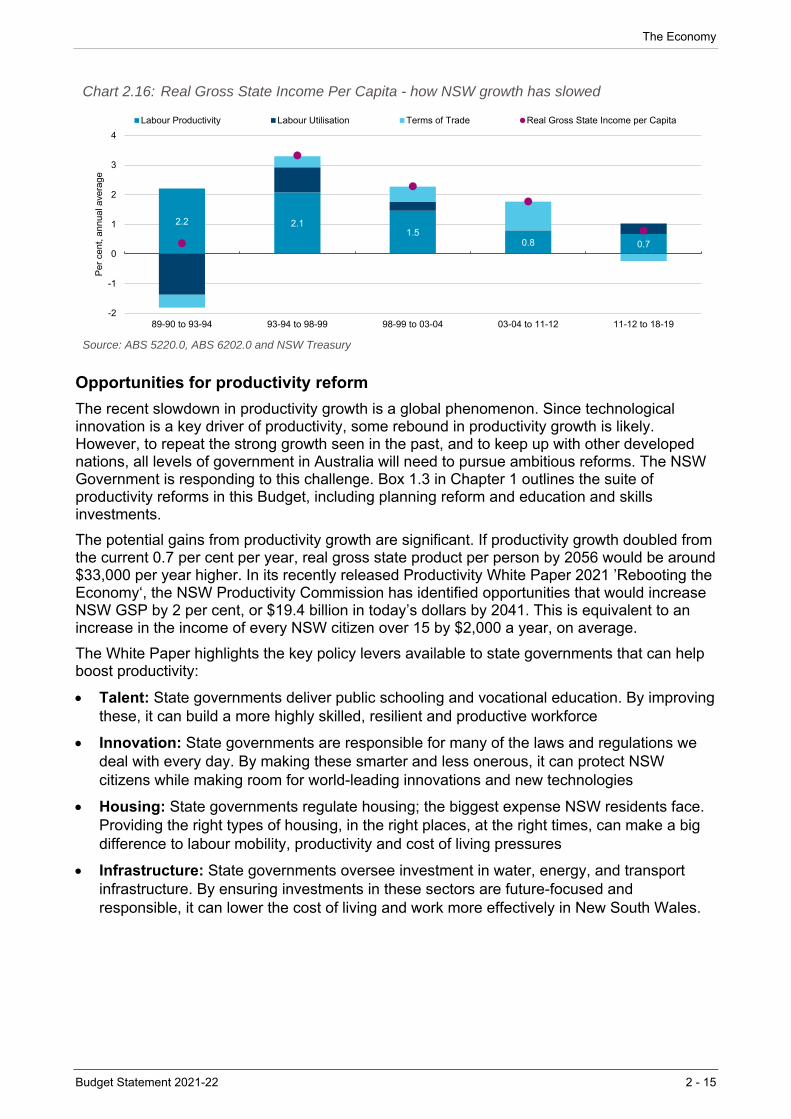
The Economy
Budget Statement 2021-22 2 - 15
Chart 2.16: Real Gross State Income Per Capita - how NSW growth has slowed
Source: ABS 5220.0, ABS 6202.0 and NSW Treasury
Opportunities for productivity reform
The recent slowdown in productivity growth is a global phenomenon. Since technological innovation is a key driver of productivity, some rebound in productivity growth is likely. However, to repeat the strong growth seen in the past, and to keep up with other developed nations, all levels of government in Australia will need to pursue ambitious reforms. The NSW Government is responding to this challenge. Box 1.3 in Chapter 1 outlines the suite of productivity reforms in this Budget, including planning reform and education and skills investments.
The potential gains from productivity growth are significant. If productivity growth doubled from the current 0.7 per cent per year, real gross state product per person by 2056 would be around $33,000 per year higher. In its recently released Productivity White Paper 2021 ’Rebooting the Economy‘, the NSW Productivity Commission has identified opportunities that would increase NSW GSP by 2 per cent, or $19.4 billion in today’s dollars by 2041. This is equivalent to an increase in the income of every NSW citizen over 15 by $2,000 a year, on average.
The White Paper highlights the key policy levers available to state governments that can help boost productivity:
Talent: State governments deliver public schooling and vocational education. By improving these, it can build a more highly skilled, resilient and productive workforce
Innovation: State governments are responsible for many of the laws and regulations we deal with every day. By making these smarter and less onerous, it can protect NSW citizens while making room for world-leading innovations and new technologies
Housing: State governments regulate housing; the biggest expense NSW residents face. Providing the right types of housing, in the right places, at the right times, can make a big difference to labour mobility, productivity and cost of living pressures
Infrastructure: State governments oversee investment in water, energy, and transport infrastructure. By ensuring investments in these sectors are future-focused and responsible, it can lower the cost of living and work more effectively in New South Wales.
2.2 2.11.5
0.8 0.7
-2
-1
0
1
2
3
4
89-90 to 93-94 93-94 to 98-99 98-99 to 03-04 03-04 to 11-12 11-12 to 18-19
Per
cen
t, an
nual
ave
rage
Labour Productivity Labour Utilisation Terms of Trade Real Gross State Income per Capita
The Economy
2 - 16 Budget Statement 2021-22
These reforms build on significant investments by the Government in progressing some of the NSW Productivity Commission’s Green Paper draft recommendations in the 2020-21 Budget. This includes:
the implementation of a suite of planning reforms to deliver on the NSW Planning Reform Action Plan includes:
– making planning processes more efficient to reduce assessment times
– simplifying the system to accommodate new business models and changing needs
– improving the interface between industry and the Government with a ‘one stop shop’
– investing in ePlanning to bring councils processes into the twenty-first century
– developing an integrated digital tool to transform the way stakeholders interact with the infrastructure contributions system.
the establishment of a new Trades Skills Pathways Centre to develop and pilot new flexible pathways into the trades, and support the participation of mature aged workers and women
implementing a new nation-wide scheme for the automatic mutual recognition of state based occupational licences
evaluating the relaxation of regulations announced at the onset of COVID-19 to assess their results in order to retain the ones that work.
2.6 Key risks to the outlook
Some near-term risks have reduced because of current economic momentum. This includes a reduced, but not eliminated, risk around the conclusion of the Commonwealth’s JobKeeper program.
The global pandemic continues to add uncertainty to the broader outlook. Significant risks remain that could postpone, if not derail, the recovery.
While New South Wales has effectively managed community outbreaks of COVID-19, the reimposition of economic restrictions in response to further outbreaks remains the most significant risk to the outlook. While Australia and New South Wales have secured sufficient vaccine supply for the entire population, risks remain around the availability and timing of distribution of the vaccine supply. Uncertainty about the effectiveness of vaccines against new variants could also affect the confidence of governments to reopen their economies.
Any slippage in the rollout of an effective vaccine to the population would likely see a further delay in the reopening of international borders, particularly if we continue to see periodic resurgences in COVID-19 infections globally. A further one-year delay in opening of the international border could see the economy 0.9 percentage point smaller and the unemployment rate 1 percentage point higher by 2022-23. In contrast, achieving an earlier vaccination of the population potentially would facilitate a faster reopening of international borders, with a consequent positive effect on the economy.
Geopolitical tensions with China remain a risk to the outlook. So far, trade disruptions have had a minimal impact on the State economy. However, ongoing tensions have a potential for further escalation, which will continue to cause uncertainty in the trade outlook. At the same time there may be prospects for wider trading opportunities with other nations (e.g. a UK-Australia Free Trade Agreement).

The Economy
Budget Statement 2021-22 2 - 17
A new risk that has emerged more recently is the potential for macroprudential policy tightening in response to soaring house prices, aiming to reduce any perceived risks to financial stability. Until recently, much of the strength in housing activity had been confined to owner-occupiers. This is a normal response to low interest rates, with no evidence of a material deterioration in lending standards. Such conditions were unlikely to elicit a response from prudential regulators. More recently, investor activity has begun to gather pace, meaning the risk of prudential tightening is not insignificant. Appendix F includes sensitivity analysis on the potential impacts of lower house prices, potentially driven by macroprudential tightening.
As highlighted earlier, there also are scenarios which could lead to a stronger recovery than currently forecast. The dominant upside risk relates to households. History suggests it takes some time before the household saving rate falls back to pre-recession levels. However, the record high level of saving seen during the recent downturn, combined with the much faster than anticipated recovery in employment and incomes, could incentivise consumers to reduce their saving rates faster and to a greater extent than envisaged. This could spur an even larger recovery in consumer spending.

Budget Statement 2021-22 3 - 1
3. FISCAL STRATEGY AND OUTLOOK
3.1 Fiscal strategy
This Budget’s fiscal priorities are to:
• continue to support the economic and health response to COVID-19
• rebuild a fiscal buffer and maintain a strong balance sheet over the medium-term
• continue economic and balance sheet reforms that increase the State’s long-term productivity.
This Budget directs resources to areas that support and create private sector employment and improve the overall productive capacity of the economy. This includes major investments in schools, hospitals, and transport.
Over the last decade, the NSW Government has led the nation in balance sheet management, pioneering reforms such as asset recycling, cash and investment optimisation, and the establishment of a state sovereign wealth fund. This Budget continues that momentum with a strategy to borrow at sustainable levels while interest rates are low, leverage asset recycling and implement further balance sheet reform (see Chapter 6 – Managing the State’s Assets and Liabilities for further detail on balance sheet reform).
• The Government’s COVID-19 response has helped contain the economic and fiscal impacts of the pandemic. The State’s fiscal outlook has improved relative to the 2020-21 Budget and the 2020-21 Half-Yearly Review.
• Improvements to the economy and the revenue outlook are flowing through to the budget result. The budget result over the four years to 2023-24 is projected to improve by $2.2 billion compared to the 2020-21 Half-Yearly Review. This Budget is projecting a return to surplus in 2024-25.
• The Government will invest $108.5 billion in infrastructure over the four years to 2024-25, including new investments in schools, hospital redevelopments and the new Bradfield City Centre. These investments will support employment and economic growth.
• Net debt has improved in line with the economic recovery, to 13.0 per cent of Gross State Product (GSP) in June 2024. This is below the 14.7 per cent that was forecast at the previous Budget just seven months ago. With growth in the NSW Generations Fund (NGF) and an ongoing asset recycling program, net debt is projected to trend back down towards 7 per cent of GSP over the medium-term.
• New South Wales remains the only Australian state to retain its triple-A credit rating with Moody’s. New South Wales’ double-A-plus rating with S&P Global is the equal highest of all states in Australia.
• This Budget strengthens the NGF with legislative amendments to ensure it truly remains an intergenerational fund. The NGF balance is forecast to grow to over $90.0 billion by June 2031.
• Similar to the economic outlook, the fiscal outlook remains subject to volatility as a result of the ongoing management of COVID-19.
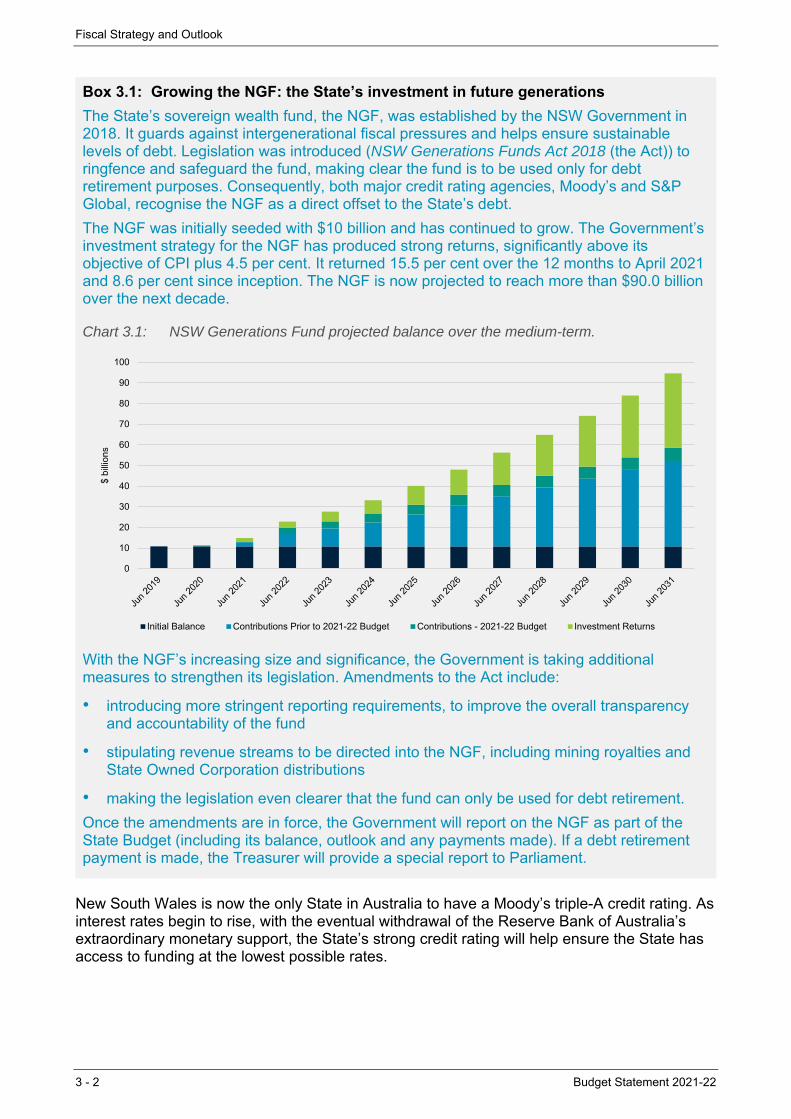
Fiscal Strategy and Outlook
3 - 2 Budget Statement 2021-22
New South Wales is now the only State in Australia to have a Moody’s triple-A credit rating. As interest rates begin to rise, with the eventual withdrawal of the Reserve Bank of Australia’s extraordinary monetary support, the State’s strong credit rating will help ensure the State has access to funding at the lowest possible rates.
Box 3.1: Growing the NGF: the State’s investment in future generations
The State’s sovereign wealth fund, the NGF, was established by the NSW Government in 2018. It guards against intergenerational fiscal pressures and helps ensure sustainable levels of debt. Legislation was introduced (NSW Generations Funds Act 2018 (the Act)) to ringfence and safeguard the fund, making clear the fund is to be used only for debt retirement purposes. Consequently, both major credit rating agencies, Moody’s and S&P Global, recognise the NGF as a direct offset to the State’s debt.
The NGF was initially seeded with $10 billion and has continued to grow. The Government’s investment strategy for the NGF has produced strong returns, significantly above its objective of CPI plus 4.5 per cent. It returned 15.5 per cent over the 12 months to April 2021 and 8.6 per cent since inception. The NGF is now projected to reach more than $90.0 billion over the next decade.
Chart 3.1: NSW Generations Fund projected balance over the medium-term.
With the NGF’s increasing size and significance, the Government is taking additional measures to strengthen its legislation. Amendments to the Act include:
• introducing more stringent reporting requirements, to improve the overall transparency and accountability of the fund
• stipulating revenue streams to be directed into the NGF, including mining royalties and State Owned Corporation distributions
• making the legislation even clearer that the fund can only be used for debt retirement.
Once the amendments are in force, the Government will report on the NGF as part of the State Budget (including its balance, outlook and any payments made). If a debt retirement payment is made, the Treasurer will provide a special report to Parliament.
0
10
20
30
40
50
60
70
80
90
100
$ bi
llion
s
Initial Balance Contributions Prior to 2021-22 Budget Contributions - 2021-22 Budget Investment Returns
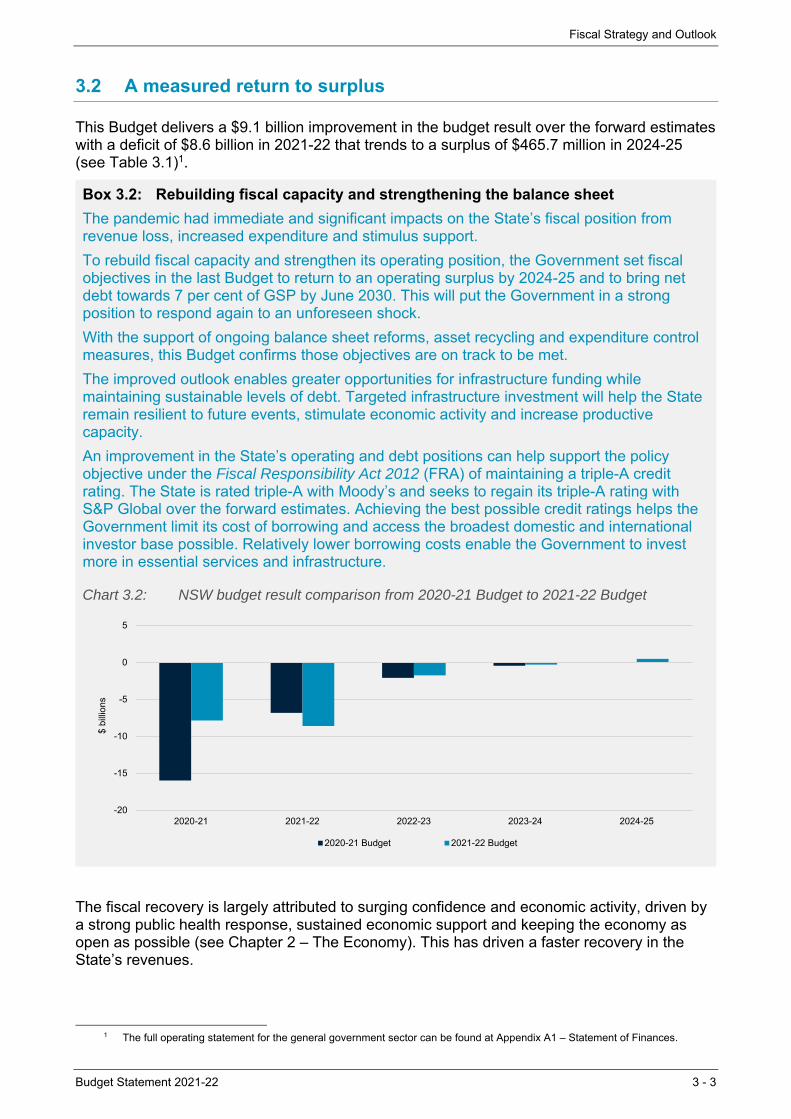
Fiscal Strategy and Outlook
Budget Statement 2021-22 3 - 3
3.2 A measured return to surplus
This Budget delivers a $9.1 billion improvement in the budget result over the forward estimates with a deficit of $8.6 billion in 2021-22 that trends to a surplus of $465.7 million in 2024-25 (see Table 3.1)1.
The fiscal recovery is largely attributed to surging confidence and economic activity, driven by a strong public health response, sustained economic support and keeping the economy as open as possible (see Chapter 2 – The Economy). This has driven a faster recovery in the State’s revenues.
1 The full operating statement for the general government sector can be found at Appendix A1 – Statement of Finances.
Box 3.2: Rebuilding fiscal capacity and strengthening the balance sheet
The pandemic had immediate and significant impacts on the State’s fiscal position from revenue loss, increased expenditure and stimulus support.
To rebuild fiscal capacity and strengthen its operating position, the Government set fiscal objectives in the last Budget to return to an operating surplus by 2024-25 and to bring net debt towards 7 per cent of GSP by June 2030. This will put the Government in a strong position to respond again to an unforeseen shock.
With the support of ongoing balance sheet reforms, asset recycling and expenditure control measures, this Budget confirms those objectives are on track to be met.
The improved outlook enables greater opportunities for infrastructure funding while maintaining sustainable levels of debt. Targeted infrastructure investment will help the State remain resilient to future events, stimulate economic activity and increase productive capacity.
An improvement in the State’s operating and debt positions can help support the policy objective under the Fiscal Responsibility Act 2012 (FRA) of maintaining a triple-A credit rating. The State is rated triple-A with Moody’s and seeks to regain its triple-A rating with S&P Global over the forward estimates. Achieving the best possible credit ratings helps the Government limit its cost of borrowing and access the broadest domestic and international investor base possible. Relatively lower borrowing costs enable the Government to invest more in essential services and infrastructure.
Chart 3.2: NSW budget result comparison from 2020-21 Budget to 2021-22 Budget
-20
-15
-10
-5
0
5
2020-21 2021-22 2022-23 2023-24 2024-25
$ bi
llion
s
2020-21 Budget 2021-22 Budget
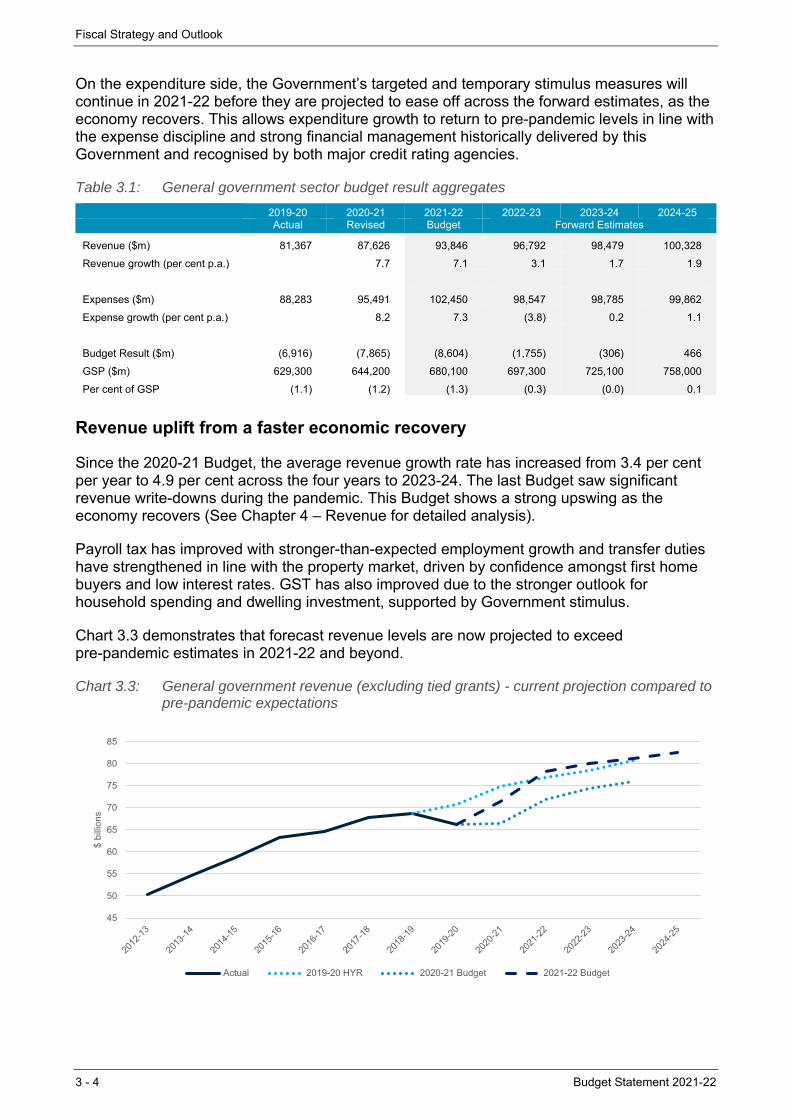
Fiscal Strategy and Outlook
3 - 4 Budget Statement 2021-22
On the expenditure side, the Government’s targeted and temporary stimulus measures will continue in 2021-22 before they are projected to ease off across the forward estimates, as the economy recovers. This allows expenditure growth to return to pre-pandemic levels in line with the expense discipline and strong financial management historically delivered by this Government and recognised by both major credit rating agencies.
Table 3.1: General government sector budget result aggregates
2019-20 2020-21 2021-22 2022-23 2023-24 2024-25 Actual Revised Budget Forward Estimates
Revenue ($m) 81,367 87,626 93,846 96,792 98,479 100,328
Revenue growth (per cent p.a.) 7.7 7.1 3.1 1.7 1.9
Expenses ($m) 88,283 95,491 102,450 98,547 98,785 99,862
Expense growth (per cent p.a.) 8.2 7.3 (3.8) 0.2 1.1
Budget Result ($m) (6,916) (7,865) (8,604) (1,755) (306) 466
GSP ($m) 629,300 644,200 680,100 697,300 725,100 758,000
Per cent of GSP (1.1) (1.2) (1.3) (0.3) (0.0) 0.1
Revenue uplift from a faster economic recovery
Since the 2020-21 Budget, the average revenue growth rate has increased from 3.4 per cent per year to 4.9 per cent across the four years to 2023-24. The last Budget saw significant revenue write-downs during the pandemic. This Budget shows a strong upswing as the economy recovers (See Chapter 4 – Revenue for detailed analysis).
Payroll tax has improved with stronger-than-expected employment growth and transfer duties have strengthened in line with the property market, driven by confidence amongst first home buyers and low interest rates. GST has also improved due to the stronger outlook for household spending and dwelling investment, supported by Government stimulus.
Chart 3.3 demonstrates that forecast revenue levels are now projected to exceed pre-pandemic estimates in 2021-22 and beyond.
Chart 3.3: General government revenue (excluding tied grants) - current projection compared to pre-pandemic expectations
45
50
55
60
65
70
75
80
85
$ bi
llion
s
Actual 2019-20 HYR 2020-21 Budget 2021-22 Budget
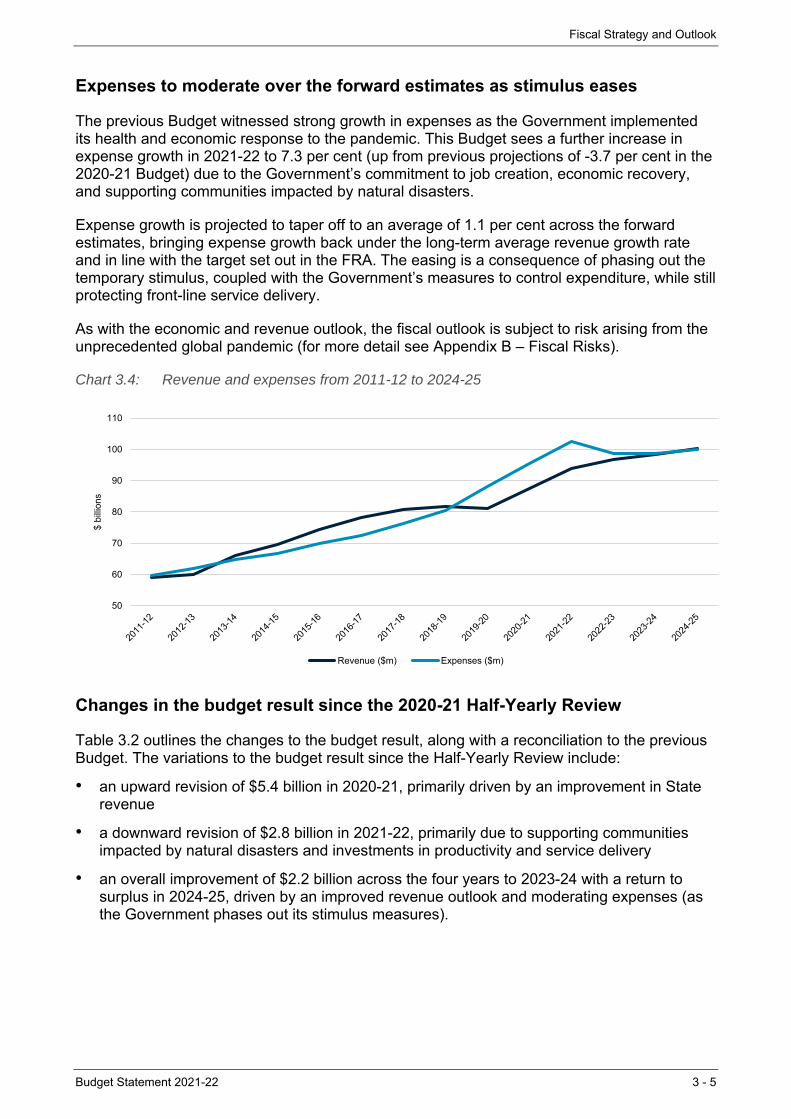
Fiscal Strategy and Outlook
Budget Statement 2021-22 3 - 5
Expenses to moderate over the forward estimates as stimulus eases
The previous Budget witnessed strong growth in expenses as the Government implemented its health and economic response to the pandemic. This Budget sees a further increase in expense growth in 2021-22 to 7.3 per cent (up from previous projections of -3.7 per cent in the 2020-21 Budget) due to the Government’s commitment to job creation, economic recovery, and supporting communities impacted by natural disasters.
Expense growth is projected to taper off to an average of 1.1 per cent across the forward estimates, bringing expense growth back under the long-term average revenue growth rate and in line with the target set out in the FRA. The easing is a consequence of phasing out the temporary stimulus, coupled with the Government’s measures to control expenditure, while still protecting front-line service delivery.
As with the economic and revenue outlook, the fiscal outlook is subject to risk arising from the unprecedented global pandemic (for more detail see Appendix B – Fiscal Risks).
Chart 3.4: Revenue and expenses from 2011-12 to 2024-25
Changes in the budget result since the 2020-21 Half-Yearly Review
Table 3.2 outlines the changes to the budget result, along with a reconciliation to the previous Budget. The variations to the budget result since the Half-Yearly Review include:
• an upward revision of $5.4 billion in 2020-21, primarily driven by an improvement in State revenue
• a downward revision of $2.8 billion in 2021-22, primarily due to supporting communities impacted by natural disasters and investments in productivity and service delivery
• an overall improvement of $2.2 billion across the four years to 2023-24 with a return to surplus in 2024-25, driven by an improved revenue outlook and moderating expenses (as the Government phases out its stimulus measures).
50
60
70
80
90
100
110
$ bi
llion
s
Revenue ($m) Expenses ($m)

Fiscal Strategy and Outlook
3 - 6 Budget Statement 2021-22
Table 3.2: Reconciliation of 2020-21 Budget to 2021-22 Budget(a)
(a) Positive amounts reflect a positive impact on the budget result e.g. an increase in revenue or a decrease in expenses.
3.3 Using the State’s strong balance sheet to support the economy
Continued investments to transform the State’s infrastructure landscape
This Budget2 includes $85.6 billion over four years in infrastructure investment for the general government sector, including:
• $2.7 billion over four years for the M6 stage 1 extension
• $2.1 billion over four years, as part of a total $3.3 billion investment, for 44 new and upgraded schools across the State
• $2.0 billion over four years for the Great Western Highway Upgrade
• $1.3 billion for the Bankstown-Lidcombe Hospital and Community Health Services Redevelopment
• $870.0 million for enabling works for the new Bradfield City Centre
• $168.7 million over four years for the Muswellbrook bypass, New England Highway.
When the investment of State Owned Corporations is taken into account3, capital expenditure is projected to reach $108.5 billion over the four years to 2024-25. Road, rail and other transport infrastructure account for 65.5 per cent of this investment, demonstrating the productivity enhancing nature of the infrastructure program. A detailed analysis of this infrastructure program is available in Budget Paper No. 3 Infrastructure Statement.
Delivering the State’s infrastructure program while rebuilding the State’s fiscal capacity is possible because of the Government’s strong financial management, utilising the NGF and asset recycling. The NGF acts as a direct offset to the State’s debt and will continue to grow over time. The continuation of the State’s successful asset recycling program (and its reinvestment) means the State will be able to deliver on its commitments by drawing upon a mix of cash operating surpluses, existing cash and financial assets, and borrowings.
2 The balance sheet for the general government sector can be found at Appendix A1 – Statement of Finances. 3 When combined, the general government sector and public non-financial corporations sector is known as the non-financial
public sector. See How to Read the Budget Papers for more information.
2019-20 2020-21 2021-22 2022-23 2023-24
Actual Revised Budget Forward Estimates $m $m $m $m $m
Budget result: 2020-21 Budget (6,916) (15,984) (6,830) (2,091) (460)
Changes from 2020-21 Budget to 2020-21 Half-Yearly Review
Revenues - 2,505 2,156 1,967 1,566
Expenses - (182) 1,165 1,337 1,227
Total budget result impact - 2,687 990 630 339
Budget result: 2020-21 Half-Yearly Review (6,916) (13,297) (5,840) (1,461) (121)
Changes from 2020-21 Half-Yearly Review to 2021-22 Budget
Revenues - 2,972 4,001 4,224 3,983
Expenses - (2,460) 6,766 4,518 4,168
Total budget result impact - 5,432 (2,764) (294) (185)
Budget result: 2021-22 Budget (6,916) (7,865) (8,604) (1,755) (306)
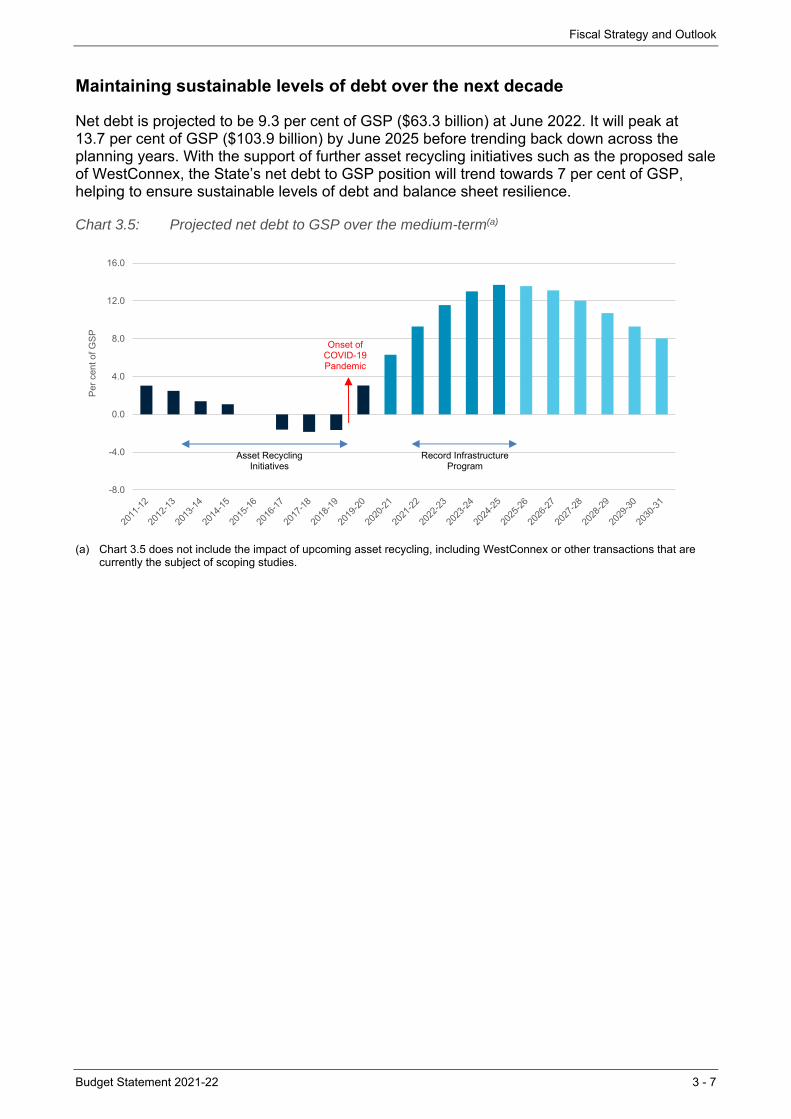
Fiscal Strategy and Outlook
Budget Statement 2021-22 3 - 7
Maintaining sustainable levels of debt over the next decade
Net debt is projected to be 9.3 per cent of GSP ($63.3 billion) at June 2022. It will peak at 13.7 per cent of GSP ($103.9 billion) by June 2025 before trending back down across the planning years. With the support of further asset recycling initiatives such as the proposed sale of WestConnex, the State’s net debt to GSP position will trend towards 7 per cent of GSP, helping to ensure sustainable levels of debt and balance sheet resilience.
Chart 3.5: Projected net debt to GSP over the medium-term(a)
(a) Chart 3.5 does not include the impact of upcoming asset recycling, including WestConnex or other transactions that are currently the subject of scoping studies.
-8.0
-4.0
0.0
4.0
8.0
12.0
16.0
Per
cen
t of G
SP
Record Infrastructure Program
Onset of COVID-19 Pandemic
Asset Recycling Initiatives
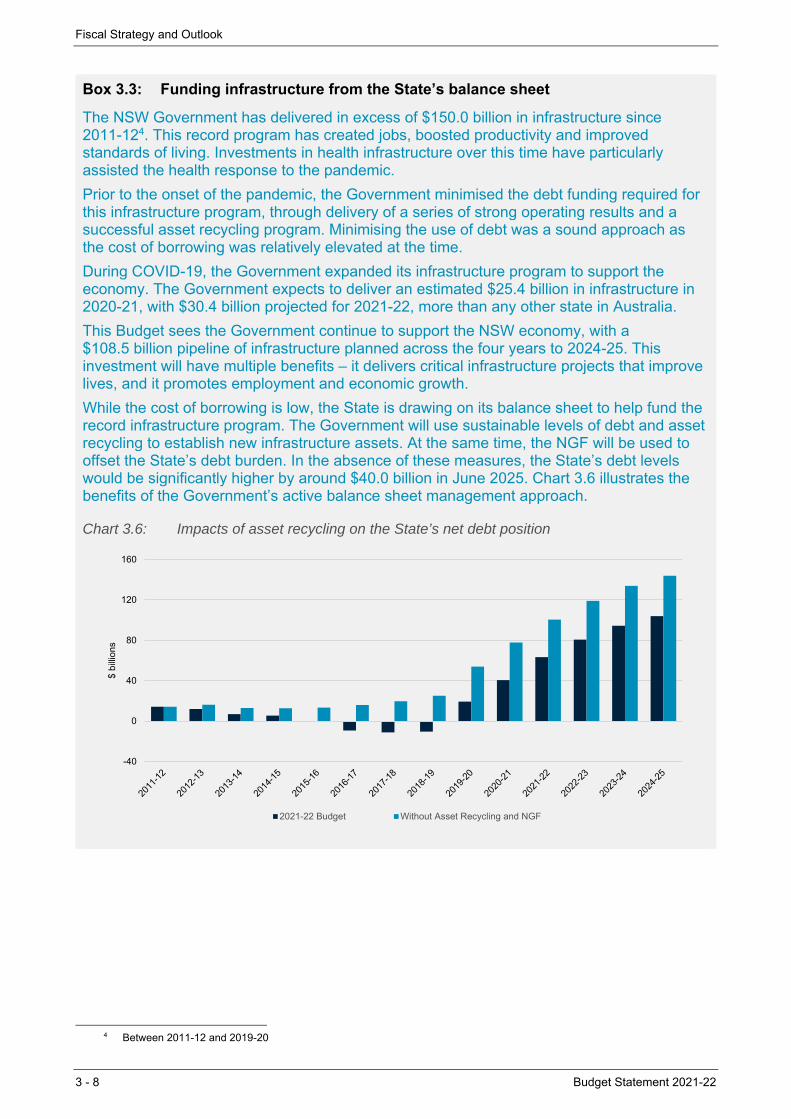
Fiscal Strategy and Outlook
3 - 8 Budget Statement 2021-22
Box 3.3: Funding infrastructure from the State’s balance sheet
The NSW Government has delivered in excess of $150.0 billion in infrastructure since 2011-124. This record program has created jobs, boosted productivity and improved standards of living. Investments in health infrastructure over this time have particularly assisted the health response to the pandemic.
Prior to the onset of the pandemic, the Government minimised the debt funding required for this infrastructure program, through delivery of a series of strong operating results and a successful asset recycling program. Minimising the use of debt was a sound approach as the cost of borrowing was relatively elevated at the time.
During COVID-19, the Government expanded its infrastructure program to support the economy. The Government expects to deliver an estimated $25.4 billion in infrastructure in 2020-21, with $30.4 billion projected for 2021-22, more than any other state in Australia.
This Budget sees the Government continue to support the NSW economy, with a $108.5 billion pipeline of infrastructure planned across the four years to 2024-25. This investment will have multiple benefits – it delivers critical infrastructure projects that improve lives, and it promotes employment and economic growth.
While the cost of borrowing is low, the State is drawing on its balance sheet to help fund the record infrastructure program. The Government will use sustainable levels of debt and asset recycling to establish new infrastructure assets. At the same time, the NGF will be used to offset the State’s debt burden. In the absence of these measures, the State’s debt levels would be significantly higher by around $40.0 billion in June 2025. Chart 3.6 illustrates the benefits of the Government’s active balance sheet management approach.
Chart 3.6: Impacts of asset recycling on the State’s net debt position
4 Between 2011-12 and 2019-20
-40
0
40
80
120
160
$ bi
llion
s
2021-22 Budget Without Asset Recycling and NGF
Budget Statement 2021-22 4 - 1
4. REVENUE
State revenue has been upgraded by $18.2 billion (4.9 per cent) over the four years to 2024-25 since the 2020-21 Half-Yearly Review. This is largely the result of improved economic activity, rather than new taxes or higher tax rates.
The State’s revenue upgrade is consistent with the recent pattern of revenue upgrades by other Australian governments, including the Commonwealth.
GST revenue is expected to be $6.4 billion (7.8 per cent) higher over the four years to 2024-25, due to the stronger outlook for household spending and dwelling investment, supported by government stimulus.
The outlook for non-tax revenues has similarly improved, with a $2.8 billion (25.5 per cent) upgrade to forecast revenue from other dividends and distributions over the four years to 2024-25, due to strong forecast investment returns.
For the financial year about to conclude (2020-21), forecast revenue, excluding tied grants, is projected to be $3.4 billion below what was forecast prior to the COVID-19 pandemic. However, this contraction is expected to be short-lived and from 2021-22 onwards, the forecast is set to exceed pre-pandemic expectations.
The temporary reduction in the payroll tax rate from 5.45 per cent to 4.85 per cent will continue in 2021-22, providing tax relief for thousands of businesses across the State and aiding the economic recovery.
This Budget builds on the Government’s tax reform agenda, with measures to abolish motor vehicle duty for electric vehicles and establish the foundations of a fairer and more efficient distance-based road user charge in the future. These reforms will help reduce the upfront costs of electric vehicles and better link road-related taxes to the use of publicly funded roads.
4.1 Revenue
The updated 2020-21 revenue position
After a decline in 2019-20, Government revenue is projected to increase by 7.7 per cent in 2020-21 to be $87.6 billion. This is $3.0 billion (3.5 per cent) higher than forecast at the 2020-21 Half-Yearly Review in February, although still below pre-COVID forecasts.1 The main drivers of the change since the Half-Yearly Review are an increase of $1.5 billion in GST revenue, an increase of $1.0 billion in transfer duty and a $542.1 million increase in sales of goods and services revenue.
Revenue for the 2021-22 Budget year
The State expects to generate $93.8 billion in revenue in 2021-22. As Chart 4.1 illustrates, the main sources are taxation revenue (38.6 per cent) and Commonwealth and other grants (41.3 per cent). The 2021-22 outlook for State revenue is $4.0 billion (4.5 per cent) higher than previously forecast.
1 All references to revenue within this chapter refer to General Government sector revenues. Unless stated otherwise, revisions
refer to the 2020-21 Half-Yearly Review, released in February 2021.
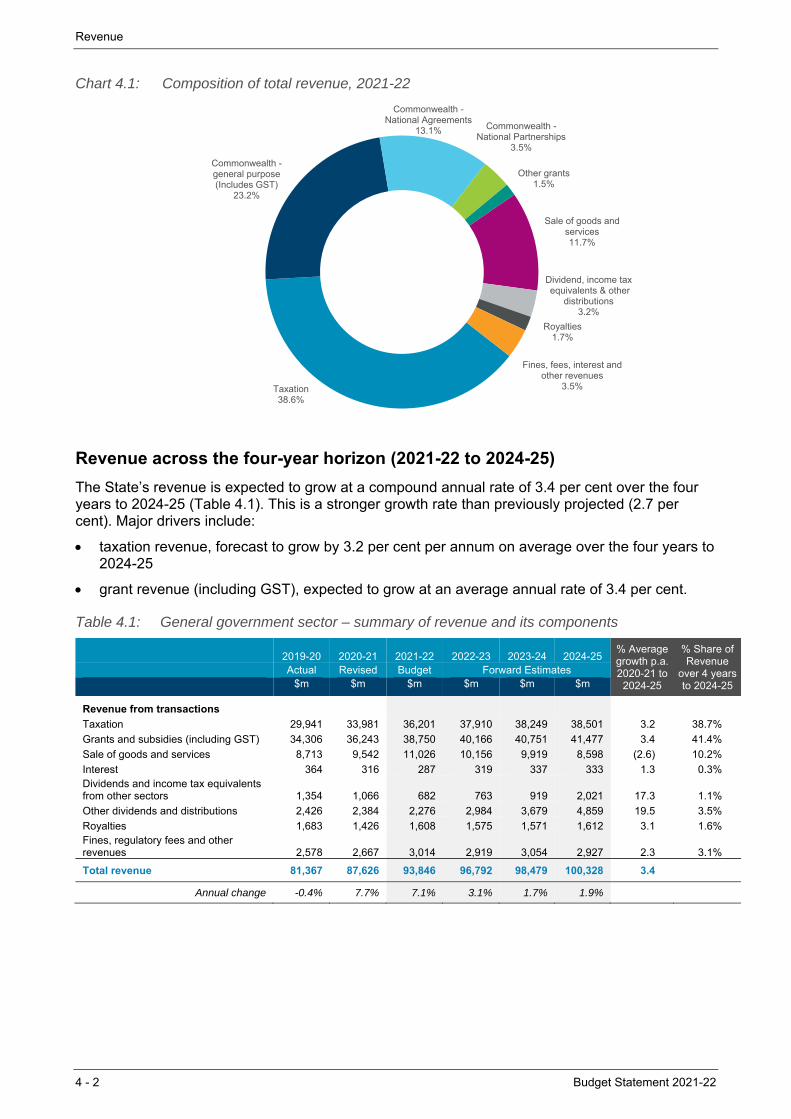
Revenue
4 - 2 Budget Statement 2021-22
Chart 4.1: Composition of total revenue, 2021-22
Revenue across the four-year horizon (2021-22 to 2024-25)
The State’s revenue is expected to grow at a compound annual rate of 3.4 per cent over the four years to 2024-25 (Table 4.1). This is a stronger growth rate than previously projected (2.7 per cent). Major drivers include:
taxation revenue, forecast to grow by 3.2 per cent per annum on average over the four years to 2024-25
grant revenue (including GST), expected to grow at an average annual rate of 3.4 per cent.
Table 4.1: General government sector – summary of revenue and its components
2019-20 2020-21 2021-22 2022-23 2023-24 2024-25
% Average growth p.a. 2020-21 to
2024-25
% Share of Revenue
over 4 years to 2024-25
Actual Revised Budget Forward Estimates $m $m $m $m $m $m
Revenue from transactions
Taxation 29,941 33,981 36,201 37,910 38,249 38,501 3.2 38.7%
Grants and subsidies (including GST) 34,306 36,243 38,750 40,166 40,751 41,477 3.4 41.4%
Sale of goods and services 8,713 9,542 11,026 10,156 9,919 8,598 (2.6) 10.2%
Interest 364 316 287 319 337 333 1.3 0.3%Dividends and income tax equivalents from other sectors 1,354 1,066 682 763 919 2,021 17.3 1.1%
Other dividends and distributions 2,426 2,384 2,276 2,984 3,679 4,859 19.5 3.5%
Royalties 1,683 1,426 1,608 1,575 1,571 1,612 3.1 1.6%Fines, regulatory fees and other revenues 2,578 2,667 3,014 2,919 3,054 2,927 2.3 3.1%
Total revenue 81,367 87,626 93,846 96,792 98,479 100,328 3.4
Annual change -0.4% 7.7% 7.1% 3.1% 1.7% 1.9%
Taxation38.6%
Commonwealth -general purpose(Includes GST)
23.2%
Commonwealth -National Agreements
13.1% Commonwealth -National Partnerships
3.5%
Other grants 1.5%
Sale of goods and services11.7%
Dividend, income taxequivalents & other
distributions 3.2%
Royalties 1.7%
Fines, fees, interest and other revenues
3.5%
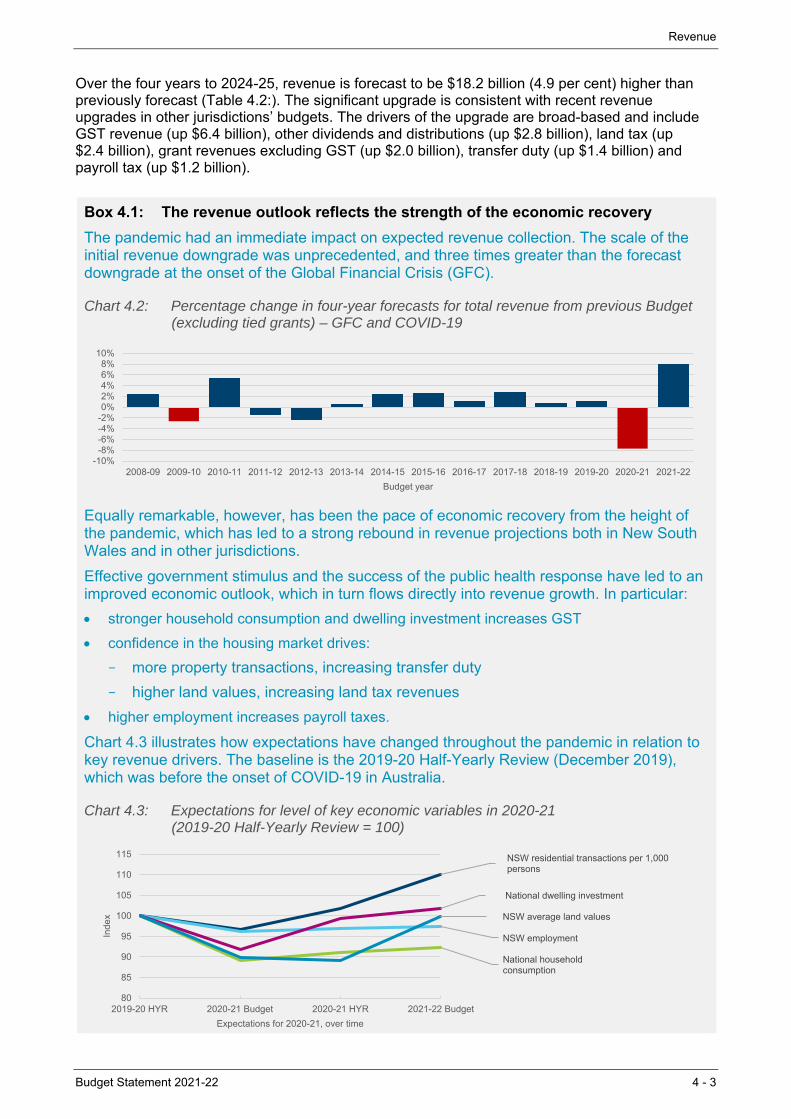
Revenue
Budget Statement 2021-22 4 - 3
Over the four years to 2024-25, revenue is forecast to be $18.2 billion (4.9 per cent) higher than previously forecast (Table 4.2:). The significant upgrade is consistent with recent revenue upgrades in other jurisdictions’ budgets. The drivers of the upgrade are broad-based and include GST revenue (up $6.4 billion), other dividends and distributions (up $2.8 billion), land tax (up $2.4 billion), grant revenues excluding GST (up $2.0 billion), transfer duty (up $1.4 billion) and payroll tax (up $1.2 billion).
Box 4.1: The revenue outlook reflects the strength of the economic recovery
The pandemic had an immediate impact on expected revenue collection. The scale of the initial revenue downgrade was unprecedented, and three times greater than the forecast downgrade at the onset of the Global Financial Crisis (GFC).
Chart 4.2: Percentage change in four-year forecasts for total revenue from previous Budget (excluding tied grants) – GFC and COVID-19
Equally remarkable, however, has been the pace of economic recovery from the height of the pandemic, which has led to a strong rebound in revenue projections both in New South Wales and in other jurisdictions.
Effective government stimulus and the success of the public health response have led to an improved economic outlook, which in turn flows directly into revenue growth. In particular:
stronger household consumption and dwelling investment increases GST
confidence in the housing market drives:
– more property transactions, increasing transfer duty
– higher land values, increasing land tax revenues
higher employment increases payroll taxes.
Chart 4.3 illustrates how expectations have changed throughout the pandemic in relation to key revenue drivers. The baseline is the 2019-20 Half-Yearly Review (December 2019), which was before the onset of COVID-19 in Australia.
Chart 4.3: Expectations for level of key economic variables in 2020-21 (2019-20 Half-Yearly Review = 100)
-10%-8%-6%-4%-2%0%2%4%6%8%
10%
2008-09 2009-10 2010-11 2011-12 2012-13 2013-14 2014-15 2015-16 2016-17 2017-18 2018-19 2019-20 2020-21 2021-22
Budget year
National household consumption
NSW residential transactions per 1,000 persons
NSW employment
National dwelling investment
NSW average land values
80
85
90
95
100
105
110
115
2019-20 HYR 2020-21 Budget 2020-21 HYR 2021-22 Budget
Inde
x
Expectations for 2020-21, over time
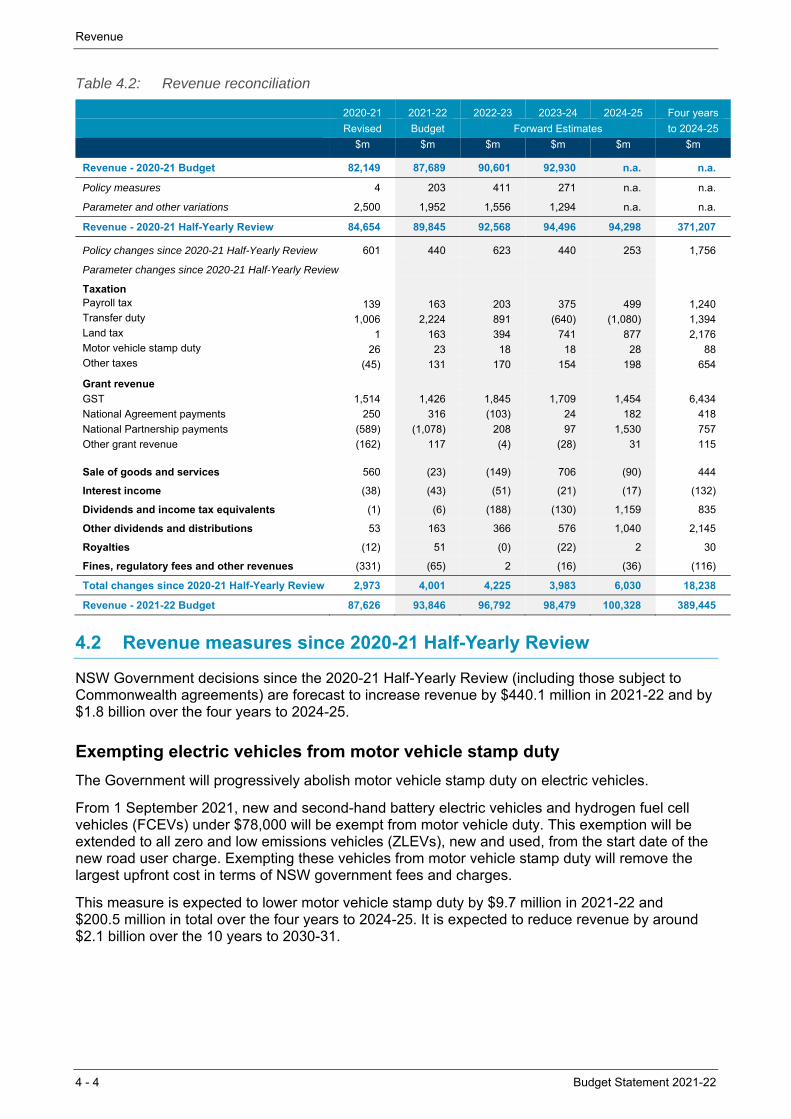
Revenue
4 - 4 Budget Statement 2021-22
Table 4.2: Revenue reconciliation
2020-21 2021-22 2022-23 2023-24 2024-25 Four years
Revised Budget Forward Estimates to 2024-25
$m $m $m $m $m $m
Revenue - 2020-21 Budget 82,149 87,689 90,601 92,930 n.a. n.a.
Policy measures 4 203 411 271 n.a. n.a.
Parameter and other variations 2,500 1,952 1,556 1,294 n.a. n.a.
Revenue - 2020-21 Half-Yearly Review 84,654 89,845 92,568 94,496 94,298 371,207
Policy changes since 2020-21 Half-Yearly Review 601 440 623 440 253 1,756
Parameter changes since 2020-21 Half-Yearly Review
Taxation
Payroll tax 139 163 203 375 499 1,240Transfer duty 1,006 2,224 891 (640) (1,080) 1,394Land tax 1 163 394 741 877 2,176Motor vehicle stamp duty 26 23 18 18 28 88Other taxes (45) 131 170 154 198 654
Grant revenue
GST 1,514 1,426 1,845 1,709 1,454 6,434
National Agreement payments 250 316 (103) 24 182 418
National Partnership payments (589) (1,078) 208 97 1,530 757
Other grant revenue (162) 117 (4) (28) 31 115
Sale of goods and services 560 (23) (149) 706 (90) 444
Interest income (38) (43) (51) (21) (17) (132)
Dividends and income tax equivalents (1) (6) (188) (130) 1,159 835
Other dividends and distributions 53 163 366 576 1,040 2,145
Royalties (12) 51 (0) (22) 2 30
Fines, regulatory fees and other revenues (331) (65) 2 (16) (36) (116)
Total changes since 2020-21 Half-Yearly Review 2,973 4,001 4,225 3,983 6,030 18,238
Revenue - 2021-22 Budget 87,626 93,846 96,792 98,479 100,328 389,445
4.2 Revenue measures since 2020-21 Half-Yearly Review
NSW Government decisions since the 2020-21 Half-Yearly Review (including those subject to Commonwealth agreements) are forecast to increase revenue by $440.1 million in 2021-22 and by $1.8 billion over the four years to 2024-25.
Exempting electric vehicles from motor vehicle stamp duty
The Government will progressively abolish motor vehicle stamp duty on electric vehicles.
From 1 September 2021, new and second-hand battery electric vehicles and hydrogen fuel cell vehicles (FCEVs) under $78,000 will be exempt from motor vehicle duty. This exemption will be extended to all zero and low emissions vehicles (ZLEVs), new and used, from the start date of the new road user charge. Exempting these vehicles from motor vehicle stamp duty will remove the largest upfront cost in terms of NSW government fees and charges.
This measure is expected to lower motor vehicle stamp duty by $9.7 million in 2021-22 and $200.5 million in total over the four years to 2024-25. It is expected to reduce revenue by around $2.1 billion over the 10 years to 2030-31.
Revenue
Budget Statement 2021-22 4 - 5
Establishing a distance-based road user charge for ZLEVs
The NSW Government will introduce a road user charge (RUC) on ZLEVs, to commence from the earlier of 1 July 2027 or such time as battery electric vehicles comprise 30 per cent of new vehicle sales in New South Wales. The charge will be levied at a rate of 2.5 cents per kilometre (in 2021-22 dollars) and indexed annually at Sydney Consumer Price Index.
Electric vehicles that receive a duty exemption will be subject to the RUC once it commences. The revenue from the RUC is not expected to be realised until 2027-28 and is expected to increase revenue by $1.2 billion over the 10 years to 2030-31.
Land tax surcharge compliance
Investment in system upgrades and improved data management in Revenue NSW will make it easier for taxpayers to manage their surcharge land tax obligations and facilitate improved compliance, increasing land tax revenue by $194.0 million over the four years to 2024-25.
NSW Generations Fund (NGF) distributions
Additional contributions will be made into the NGF, including redirecting surplus cash, TCorp dividends and income tax equivalents. This is expected to increase investment returns in the NGF by $655.6 million over the four years to 2024-25.
Natural Disaster Relief Arrangements
Under the joint Commonwealth Government-State Disaster Recovery Funding Arrangements, the NSW Government is expected to receive Commonwealth assistance of $362.1 million over the four years to 2024-25.
Extension of levy on point to point services
An extension of the Government’s existing $1 levy on all point to point transport trips is expected to raise an additional $154.2 million over the three years to 2024-25. In recognition of ongoing reforms in the point to point sector, this additional revenue will be used to fund an industry assistance package. The Minister administering the Point to Point Transport (Taxis and Hire Vehicles) Act 2016 may by order published in the Gazette specify the levy repeal day, after which the levy is not payable for any passenger service.
Deregulating the supply of taxi licenses
Removing supply restrictions on taxi licenses in New South Wales and introducing non-transferable taxi licenses available on request for an administrative fee will result in revenue loss of $13.1 million over the four years to 2024-25.
Government response to NSW Bushfire Inquiry - Insurers’ Emergency Services Levy and councils’ contribution
As a consequence of the Government adopting recommendations from the independent NSW Bushfire Inquiry, insurers’ Emergency Services Levy and council’s contributions are expected to increase revenue by $148.0 million over the four years to 2024-25 to fund the recommended initiatives. These initiatives provide fleet replacement, personal protective equipment, mental health support and aerial fire-fighting and training.
Domestic and Family Violence Funding
Under a Domestic Violence National Partnership announced in the 2021-22 Commonwealth Budget, the NSW Government is expected to receive an additional $80.0 million in grant revenue from the Commonwealth over the two years to 2022-23.
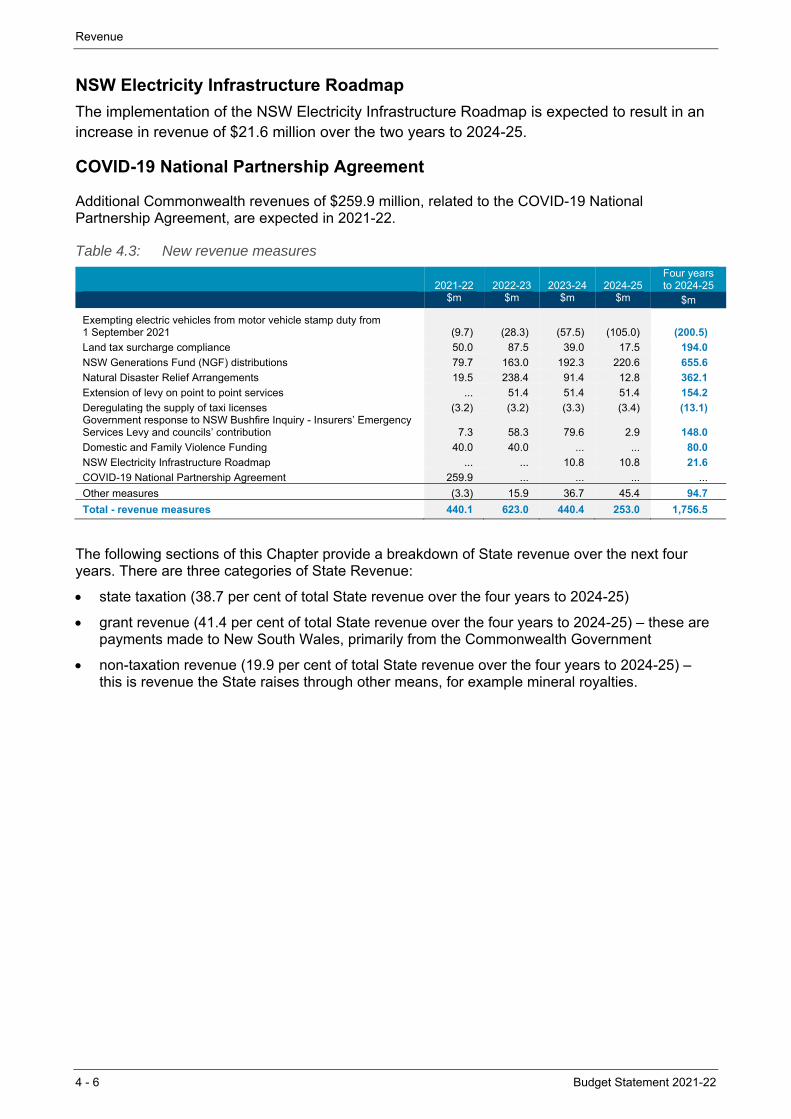
Revenue
4 - 6 Budget Statement 2021-22
NSW Electricity Infrastructure Roadmap
The implementation of the NSW Electricity Infrastructure Roadmap is expected to result in an increase in revenue of $21.6 million over the two years to 2024-25.
COVID-19 National Partnership Agreement
Additional Commonwealth revenues of $259.9 million, related to the COVID-19 National Partnership Agreement, are expected in 2021-22.
Table 4.3: New revenue measures
2021-22 2022-23 2023-24 2024-25
Four years to 2024-25
$m $m $m $m $m
Exempting electric vehicles from motor vehicle stamp duty from 1 September 2021 (9.7) (28.3) (57.5) (105.0) (200.5)
Land tax surcharge compliance 50.0 87.5 39.0 17.5 194.0
NSW Generations Fund (NGF) distributions 79.7 163.0 192.3 220.6 655.6
Natural Disaster Relief Arrangements 19.5 238.4 91.4 12.8 362.1
Extension of levy on point to point services ... 51.4 51.4 51.4 154.2
Deregulating the supply of taxi licenses (3.2) (3.2) (3.3) (3.4) (13.1) Government response to NSW Bushfire Inquiry - Insurers’ Emergency Services Levy and councils’ contribution 7.3 58.3 79.6 2.9 148.0
Domestic and Family Violence Funding 40.0 40.0 ... ... 80.0
NSW Electricity Infrastructure Roadmap ... ... 10.8 10.8 21.6
COVID-19 National Partnership Agreement 259.9 ... ... ... ...
Other measures (3.3) 15.9 36.7 45.4 94.7
Total - revenue measures 440.1 623.0 440.4 253.0 1,756.5
The following sections of this Chapter provide a breakdown of State revenue over the next four years. There are three categories of State Revenue:
state taxation (38.7 per cent of total State revenue over the four years to 2024-25)
grant revenue (41.4 per cent of total State revenue over the four years to 2024-25) – these are payments made to New South Wales, primarily from the Commonwealth Government
non-taxation revenue (19.9 per cent of total State revenue over the four years to 2024-25) – this is revenue the State raises through other means, for example mineral royalties.
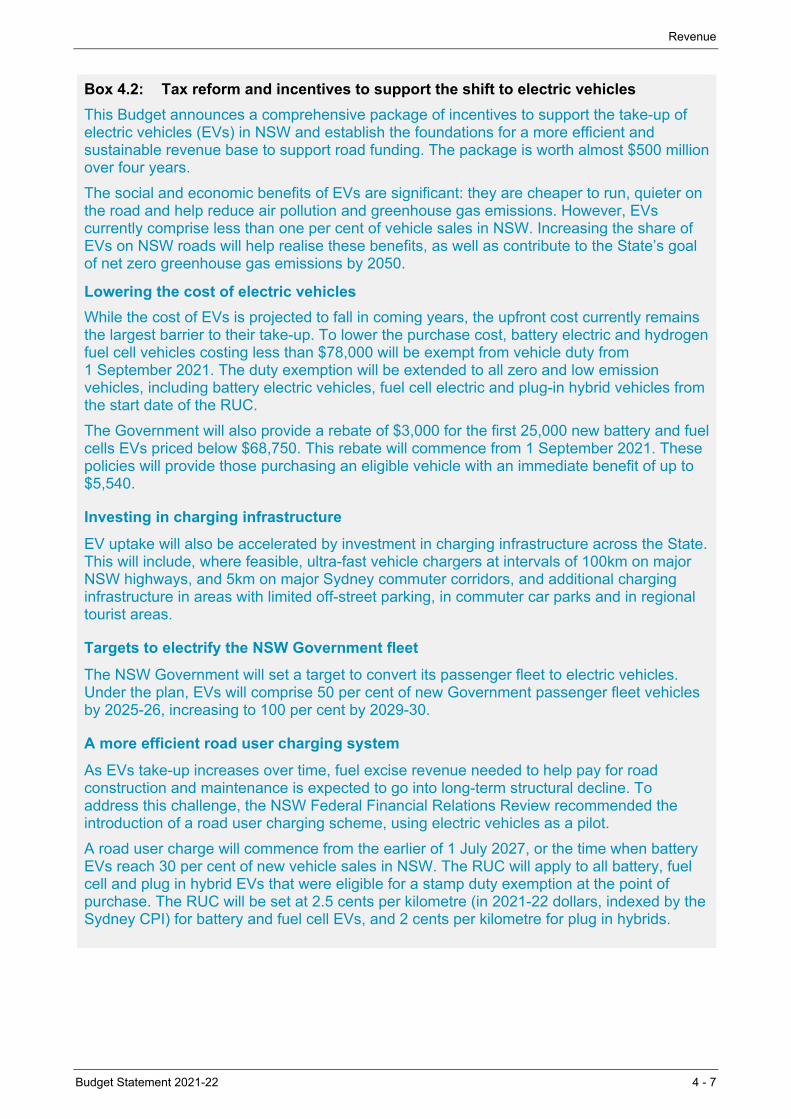
Revenue
Budget Statement 2021-22 4 - 7
Box 4.2: Tax reform and incentives to support the shift to electric vehicles
This Budget announces a comprehensive package of incentives to support the take-up of electric vehicles (EVs) in NSW and establish the foundations for a more efficient and sustainable revenue base to support road funding. The package is worth almost $500 million over four years.
The social and economic benefits of EVs are significant: they are cheaper to run, quieter on the road and help reduce air pollution and greenhouse gas emissions. However, EVs currently comprise less than one per cent of vehicle sales in NSW. Increasing the share of EVs on NSW roads will help realise these benefits, as well as contribute to the State’s goal of net zero greenhouse gas emissions by 2050.
Lowering the cost of electric vehicles
While the cost of EVs is projected to fall in coming years, the upfront cost currently remains the largest barrier to their take-up. To lower the purchase cost, battery electric and hydrogen fuel cell vehicles costing less than $78,000 will be exempt from vehicle duty from 1 September 2021. The duty exemption will be extended to all zero and low emission vehicles, including battery electric vehicles, fuel cell electric and plug-in hybrid vehicles from the start date of the RUC.
The Government will also provide a rebate of $3,000 for the first 25,000 new battery and fuel cells EVs priced below $68,750. This rebate will commence from 1 September 2021. These policies will provide those purchasing an eligible vehicle with an immediate benefit of up to $5,540.
Investing in charging infrastructure
EV uptake will also be accelerated by investment in charging infrastructure across the State. This will include, where feasible, ultra-fast vehicle chargers at intervals of 100km on major NSW highways, and 5km on major Sydney commuter corridors, and additional charging infrastructure in areas with limited off-street parking, in commuter car parks and in regional tourist areas.
Targets to electrify the NSW Government fleet
The NSW Government will set a target to convert its passenger fleet to electric vehicles. Under the plan, EVs will comprise 50 per cent of new Government passenger fleet vehicles by 2025-26, increasing to 100 per cent by 2029-30.
A more efficient road user charging system
As EVs take-up increases over time, fuel excise revenue needed to help pay for road construction and maintenance is expected to go into long-term structural decline. To address this challenge, the NSW Federal Financial Relations Review recommended the introduction of a road user charging scheme, using electric vehicles as a pilot.
A road user charge will commence from the earlier of 1 July 2027, or the time when battery EVs reach 30 per cent of new vehicle sales in NSW. The RUC will apply to all battery, fuel cell and plug in hybrid EVs that were eligible for a stamp duty exemption at the point of purchase. The RUC will be set at 2.5 cents per kilometre (in 2021-22 dollars, indexed by the Sydney CPI) for battery and fuel cell EVs, and 2 cents per kilometre for plug in hybrids.
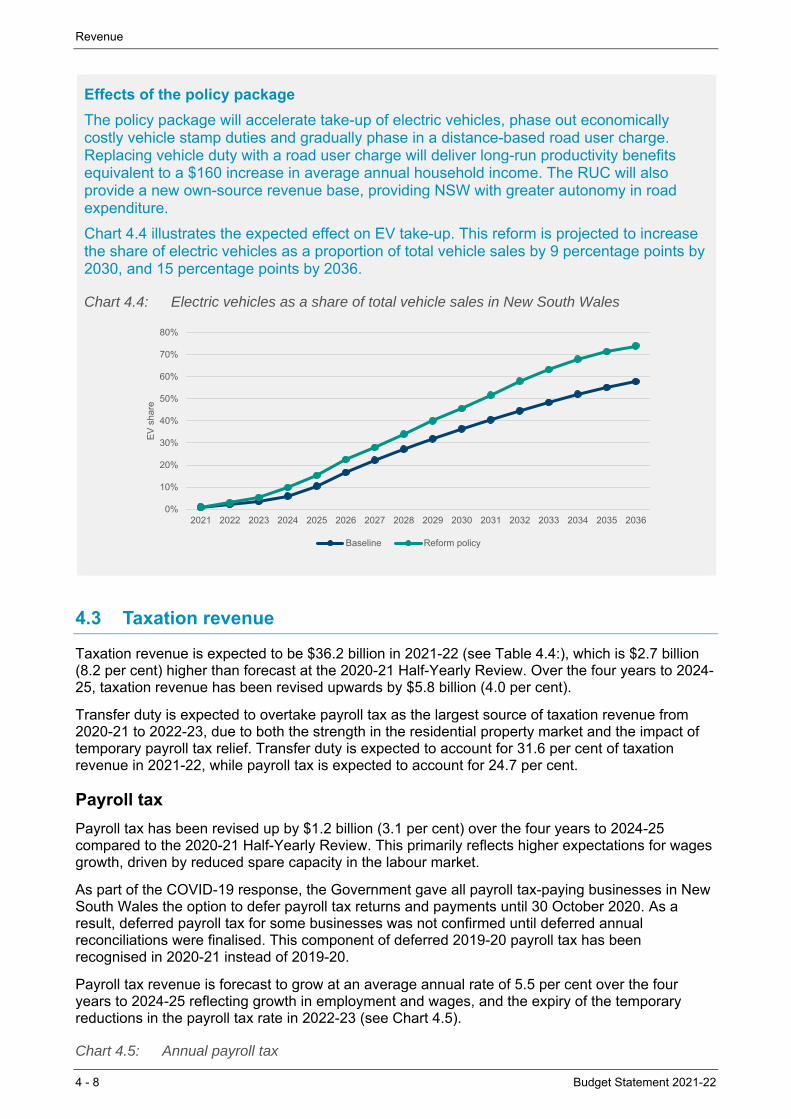
Revenue
4 - 8 Budget Statement 2021-22
Effects of the policy package
The policy package will accelerate take-up of electric vehicles, phase out economically costly vehicle stamp duties and gradually phase in a distance-based road user charge. Replacing vehicle duty with a road user charge will deliver long-run productivity benefits equivalent to a $160 increase in average annual household income. The RUC will also provide a new own-source revenue base, providing NSW with greater autonomy in road expenditure.
Chart 4.4 illustrates the expected effect on EV take-up. This reform is projected to increase the share of electric vehicles as a proportion of total vehicle sales by 9 percentage points by 2030, and 15 percentage points by 2036.
Chart 4.4: Electric vehicles as a share of total vehicle sales in New South Wales
4.3 Taxation revenue
Taxation revenue is expected to be $36.2 billion in 2021-22 (see Table 4.4:), which is $2.7 billion (8.2 per cent) higher than forecast at the 2020-21 Half-Yearly Review. Over the four years to 2024-25, taxation revenue has been revised upwards by $5.8 billion (4.0 per cent).
Transfer duty is expected to overtake payroll tax as the largest source of taxation revenue from 2020-21 to 2022-23, due to both the strength in the residential property market and the impact of temporary payroll tax relief. Transfer duty is expected to account for 31.6 per cent of taxation revenue in 2021-22, while payroll tax is expected to account for 24.7 per cent.
Payroll tax
Payroll tax has been revised up by $1.2 billion (3.1 per cent) over the four years to 2024-25 compared to the 2020-21 Half-Yearly Review. This primarily reflects higher expectations for wages growth, driven by reduced spare capacity in the labour market.
As part of the COVID-19 response, the Government gave all payroll tax-paying businesses in New South Wales the option to defer payroll tax returns and payments until 30 October 2020. As a result, deferred payroll tax for some businesses was not confirmed until deferred annual reconciliations were finalised. This component of deferred 2019-20 payroll tax has been recognised in 2020-21 instead of 2019-20.
Payroll tax revenue is forecast to grow at an average annual rate of 5.5 per cent over the four years to 2024-25 reflecting growth in employment and wages, and the expiry of the temporary reductions in the payroll tax rate in 2022-23 (see Chart 4.5).
Chart 4.5: Annual payroll tax
0%
10%
20%
30%
40%
50%
60%
70%
80%
2021 2022 2023 2024 2025 2026 2027 2028 2029 2030 2031 2032 2033 2034 2035 2036
EV
sha
re
Baseline Reform policy
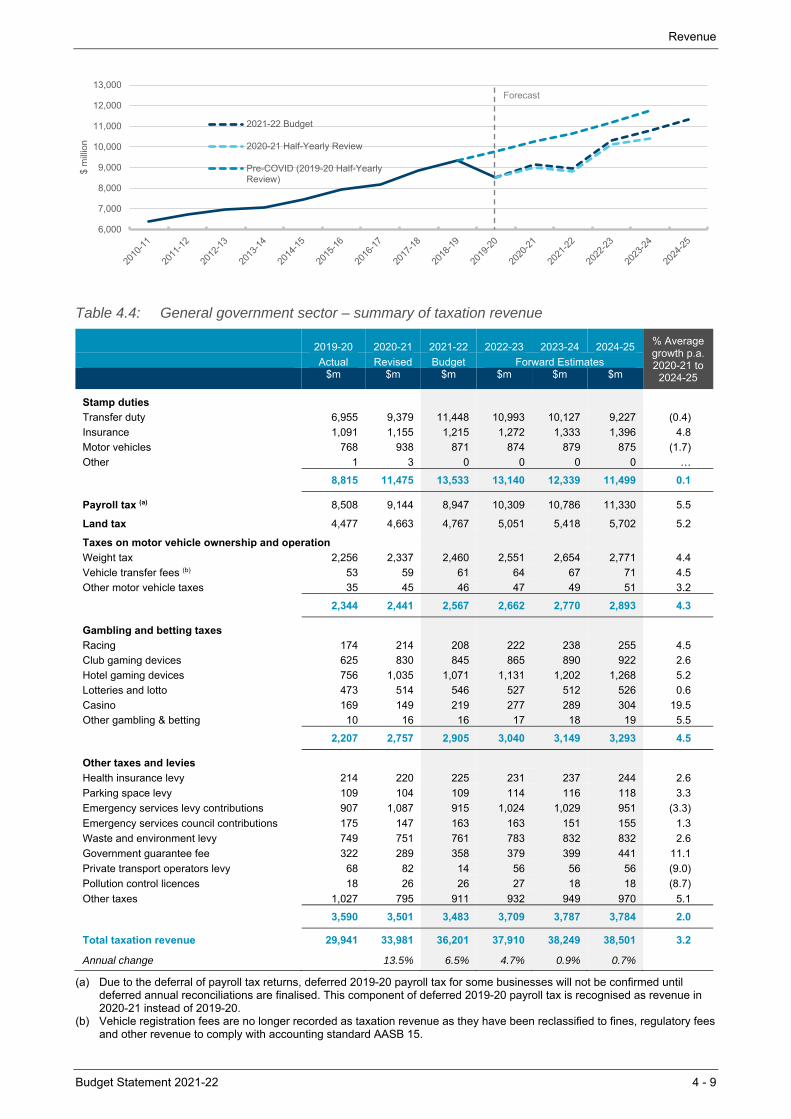
Revenue
Budget Statement 2021-22 4 - 9
Table 4.4: General government sector – summary of taxation revenue
2019-20 2020-21 2021-22 2022-23 2023-24 2024-25 % Average growth p.a. 2020-21 to
2024-25
Actual Revised Budget Forward Estimates $m $m $m $m $m $m
Stamp duties
Transfer duty 6,955 9,379 11,448 10,993 10,127 9,227 (0.4)
Insurance 1,091 1,155 1,215 1,272 1,333 1,396 4.8
Motor vehicles 768 938 871 874 879 875 (1.7)
Other 1 3 0 0 0 0 …
8,815 11,475 13,533 13,140 12,339 11,499 0.1
Payroll tax (a) 8,508 9,144 8,947 10,309 10,786 11,330 5.5
Land tax 4,477 4,663 4,767 5,051 5,418 5,702 5.2
Taxes on motor vehicle ownership and operation
Weight tax 2,256 2,337 2,460 2,551 2,654 2,771 4.4
Vehicle transfer fees (b) 53 59 61 64 67 71 4.5
Other motor vehicle taxes 35 45 46 47 49 51 3.2
2,344 2,441 2,567 2,662 2,770 2,893 4.3
Gambling and betting taxes
Racing 174 214 208 222 238 255 4.5
Club gaming devices 625 830 845 865 890 922 2.6
Hotel gaming devices 756 1,035 1,071 1,131 1,202 1,268 5.2
Lotteries and lotto 473 514 546 527 512 526 0.6
Casino 169 149 219 277 289 304 19.5
Other gambling & betting 10 16 16 17 18 19 5.5
2,207 2,757 2,905 3,040 3,149 3,293 4.5
Other taxes and levies
Health insurance levy 214 220 225 231 237 244 2.6
Parking space levy 109 104 109 114 116 118 3.3
Emergency services levy contributions 907 1,087 915 1,024 1,029 951 (3.3)
Emergency services council contributions 175 147 163 163 151 155 1.3
Waste and environment levy 749 751 761 783 832 832 2.6
Government guarantee fee 322 289 358 379 399 441 11.1
Private transport operators levy 68 82 14 56 56 56 (9.0)
Pollution control licences 18 26 26 27 18 18 (8.7)
Other taxes 1,027 795 911 932 949 970 5.1
3,590 3,501 3,483 3,709 3,787 3,784 2.0
Total taxation revenue 29,941 33,981 36,201 37,910 38,249 38,501 3.2
Annual change 13.5% 6.5% 4.7% 0.9% 0.7%
(a) Due to the deferral of payroll tax returns, deferred 2019-20 payroll tax for some businesses will not be confirmed until deferred annual reconciliations are finalised. This component of deferred 2019-20 payroll tax is recognised as revenue in 2020-21 instead of 2019-20.
(b) Vehicle registration fees are no longer recorded as taxation revenue as they have been reclassified to fines, regulatory fees and other revenue to comply with accounting standard AASB 15.
6,000
7,000
8,000
9,000
10,000
11,000
12,000
13,000$
mill
ion
2021-22 Budget
2020-21 Half-Yearly Review
Pre-COVID (2019-20 Half-YearlyReview)
Forecast
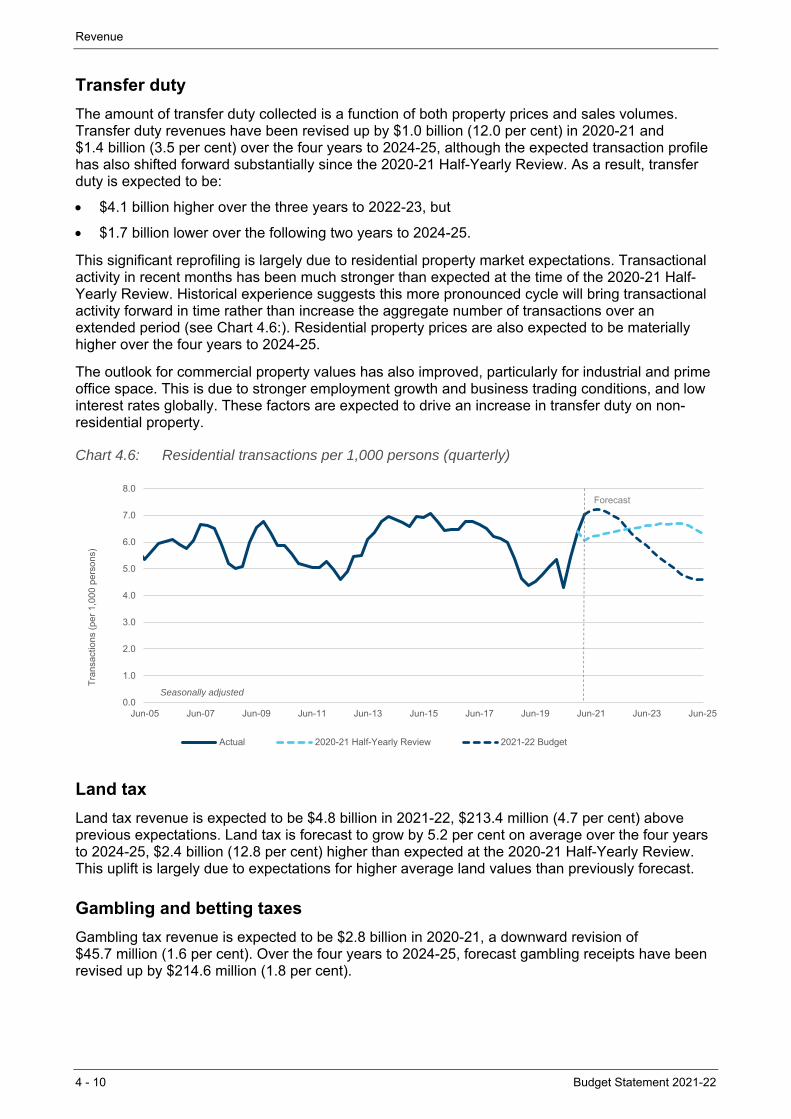
Revenue
4 - 10 Budget Statement 2021-22
Transfer duty
The amount of transfer duty collected is a function of both property prices and sales volumes. Transfer duty revenues have been revised up by $1.0 billion (12.0 per cent) in 2020-21 and $1.4 billion (3.5 per cent) over the four years to 2024-25, although the expected transaction profile has also shifted forward substantially since the 2020-21 Half-Yearly Review. As a result, transfer duty is expected to be:
$4.1 billion higher over the three years to 2022-23, but
$1.7 billion lower over the following two years to 2024-25.
This significant reprofiling is largely due to residential property market expectations. Transactional activity in recent months has been much stronger than expected at the time of the 2020-21 Half-Yearly Review. Historical experience suggests this more pronounced cycle will bring transactional activity forward in time rather than increase the aggregate number of transactions over an extended period (see Chart 4.6:). Residential property prices are also expected to be materially higher over the four years to 2024-25.
The outlook for commercial property values has also improved, particularly for industrial and prime office space. This is due to stronger employment growth and business trading conditions, and low interest rates globally. These factors are expected to drive an increase in transfer duty on non-residential property.
Chart 4.6: Residential transactions per 1,000 persons (quarterly)
Land tax
Land tax revenue is expected to be $4.8 billion in 2021-22, $213.4 million (4.7 per cent) above previous expectations. Land tax is forecast to grow by 5.2 per cent on average over the four years to 2024-25, $2.4 billion (12.8 per cent) higher than expected at the 2020-21 Half-Yearly Review. This uplift is largely due to expectations for higher average land values than previously forecast.
Gambling and betting taxes
Gambling tax revenue is expected to be $2.8 billion in 2020-21, a downward revision of $45.7 million (1.6 per cent). Over the four years to 2024-25, forecast gambling receipts have been revised up by $214.6 million (1.8 per cent).
0.0
1.0
2.0
3.0
4.0
5.0
6.0
7.0
8.0
Jun-05 Jun-07 Jun-09 Jun-11 Jun-13 Jun-15 Jun-17 Jun-19 Jun-21 Jun-23 Jun-25
Tra
nsac
tions
(pe
r 1,
000
pers
ons)
Actual 2020-21 Half-Yearly Review 2021-22 Budget
Forecast
Seasonally adjusted

Revenue
Budget Statement 2021-22 4 - 11
The downgrade in 2020-21 mostly reflects a $51.7 million reduction in hotel and club gaming device revenue, reflecting slightly softer levels of gaming activity relative to expectations at the 2020-21 Half-Yearly Review. From 2021-22, stronger household income is expected to increase forecast gaming device revenue by $127.2 million over the four years to 2024-25.
Racing and sports wagering revenue has been revised up by $141.8 million (18.2 per cent) over the four years to 2024-25. The upward revision reflects continued elevated levels of wagering receipts following the easing of COVID-related restrictions, with significant strength in online wagering.
Taxes on motor vehicle ownership and operation
Motor vehicle taxes are expected to be $2.6 billion in 2021-22, $102.6 million (4.2 per cent) higher than at the 2020-21 Half-Yearly Review. Forecast motor vehicle taxes have increased by $512.5 million (4.9 per cent) over the four years to 2024-25, reflecting lower tolling relief concession claims and higher vehicle fleet growth.
Other stamp duties
This category incorporates insurance duty and motor vehicle registration duty. Revenue is forecast to reach $2.1 billion in 2021-22 and has been revised downwards by $66.9 million (0.8 per cent) over the four years to 2024-25.
Motor vehicle registration duty has been revised downwards by $113.0 million (3.1 per cent) over the four years to 2024-25, due to the decision to remove stamp duty on electric vehicle purchases (see Box 4.2). This is partly offset by an uplift in expectations for stamp duty more broadly due to stronger-than-expected duty collections
Insurance duty revenue has been stronger than previously expected, resulting in an increase in forecast duty revenue of $46.1 million (0.9 per cent) over the four years to 2024-25.
Other taxes and levies
Other taxes and levies are expected to provide $3.5 billion in 2021-22, growing at an average annual rate of 2.0 per cent in the four years to 2024-25.
Revenue from the Emergency Services Levy (ESL), including insurer and council contributions, is forecast to be $1.1 billion in 2021-22 and $4.6 billion over the four years to 2024-25. This is $289.2 million (6.0 per cent) lower over the four years to 2024-25 compared to the 2020-21 Half-Yearly Review. The decrease reflects lower-than-expected claims associated with the workers compensation scheme to provide greater care and support for firefighters diagnosed with one of 12 prescribed cancers. This is partly offset by higher expenditure associated with new and continued measures to implement recommendations from the NSW Bushfire Inquiry. The downgrade in ESL revenue has been partly offset by the extension of the Passenger Services Levy.
4.4 Grant revenue
Most of the State’s grant revenue is from the Commonwealth, primarily consisting of:
general purpose grants (including GST)
specific purpose payments, in the form of National Agreements and Federation Funding Agreements (including National Partnerships and Project Agreements).
Commonwealth grant revenue is expected to grow by $2.5 billion in 2021-22 to $38.1 billion, and to reach $40.9 billion by 2024-25.
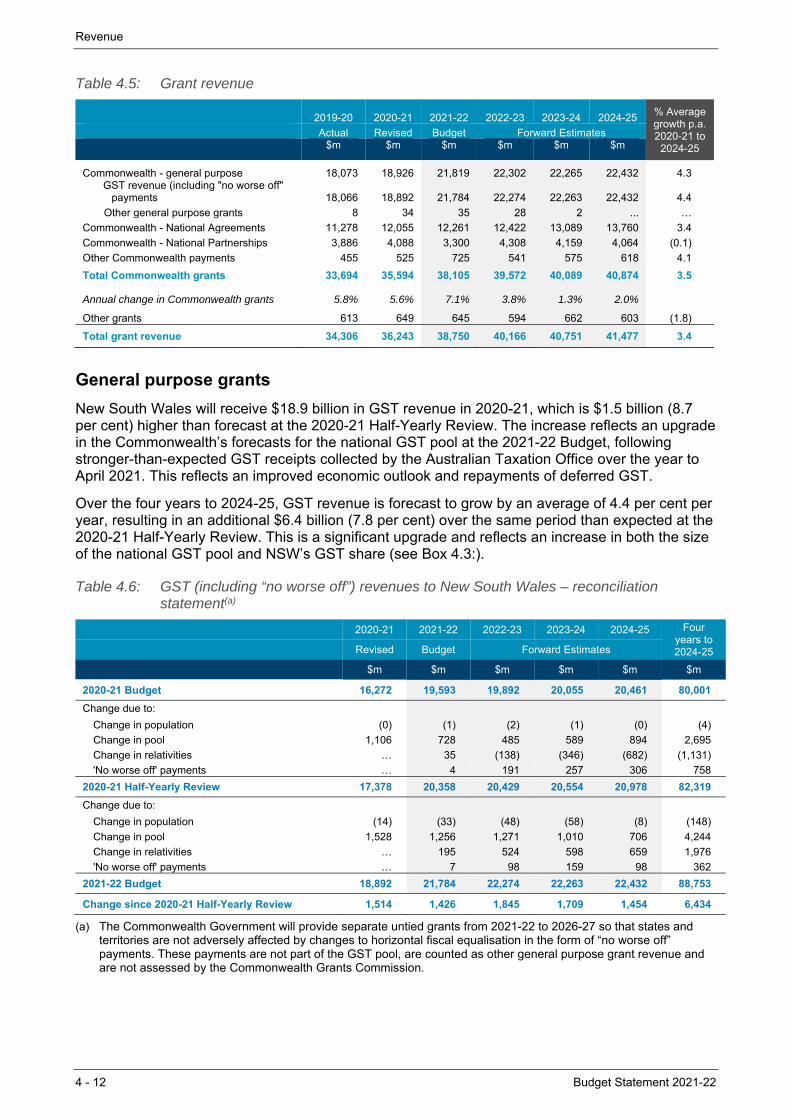
Revenue
4 - 12 Budget Statement 2021-22
Table 4.5: Grant revenue
2019-20 2020-21 2021-22 2022-23 2023-24 2024-25 % Average growth p.a.2020-21 to
2024-25
Actual Revised Budget Forward Estimates $m $m $m $m $m $m
Commonwealth - general purpose 18,073 18,926 21,819 22,302 22,265 22,432 4.3GST revenue (including "no worse off"
payments 18,066 18,892 21,784 22,274 22,263 22,432 4.4
Other general purpose grants 8 34 35 28 2 ... …
Commonwealth - National Agreements 11,278 12,055 12,261 12,422 13,089 13,760 3.4
Commonwealth - National Partnerships 3,886 4,088 3,300 4,308 4,159 4,064 (0.1)
Other Commonwealth payments 455 525 725 541 575 618 4.1
Total Commonwealth grants 33,694 35,594 38,105 39,572 40,089 40,874 3.5
Annual change in Commonwealth grants 5.8% 5.6% 7.1% 3.8% 1.3% 2.0%
Other grants 613 649 645 594 662 603 (1.8)
Total grant revenue 34,306 36,243 38,750 40,166 40,751 41,477 3.4
General purpose grants
New South Wales will receive $18.9 billion in GST revenue in 2020-21, which is $1.5 billion (8.7 per cent) higher than forecast at the 2020-21 Half-Yearly Review. The increase reflects an upgrade in the Commonwealth’s forecasts for the national GST pool at the 2021-22 Budget, following stronger-than-expected GST receipts collected by the Australian Taxation Office over the year to April 2021. This reflects an improved economic outlook and repayments of deferred GST.
Over the four years to 2024-25, GST revenue is forecast to grow by an average of 4.4 per cent per year, resulting in an additional $6.4 billion (7.8 per cent) over the same period than expected at the 2020-21 Half-Yearly Review. This is a significant upgrade and reflects an increase in both the size of the national GST pool and NSW’s GST share (see Box 4.3:).
Table 4.6: GST (including “no worse off”) revenues to New South Wales – reconciliation statement(a)
2020-21 2021-22 2022-23 2023-24 2024-25 Four years to 2024-25 Revised Budget Forward Estimates
$m $m $m $m $m $m
2020-21 Budget 16,272 19,593 19,892 20,055 20,461 80,001
Change due to:
Change in population (0) (1) (2) (1) (0) (4)
Change in pool 1,106 728 485 589 894 2,695
Change in relativities … 35 (138) (346) (682) (1,131)
'No worse off' payments … 4 191 257 306 758
2020-21 Half-Yearly Review 17,378 20,358 20,429 20,554 20,978 82,319
Change due to:
Change in population (14) (33) (48) (58) (8) (148)
Change in pool 1,528 1,256 1,271 1,010 706 4,244
Change in relativities … 195 524 598 659 1,976
'No worse off' payments … 7 98 159 98 362
2021-22 Budget 18,892 21,784 22,274 22,263 22,432 88,753
Change since 2020-21 Half-Yearly Review 1,514 1,426 1,845 1,709 1,454 6,434
(a) The Commonwealth Government will provide separate untied grants from 2021-22 to 2026-27 so that states and territories are not adversely affected by changes to horizontal fiscal equalisation in the form of “no worse off” payments. These payments are not part of the GST pool, are counted as other general purpose grant revenue and are not assessed by the Commonwealth Grants Commission.
Revenue
Budget Statement 2021-22 4 - 13
Box 4.3: Outlook for GST revenue
New South Wales’ share of GST is, in large part, driven by two factors – the size of the national pool and the share of the pool provided to New South Wales (the relativity).
Upgrades to the GST pool
The national GST pool is expected to be $20.6 billion higher over the five years to 2024-25 compared to the forecast at the 2020-21 Half-Yearly Review. The larger pool reflects a stronger outlook for Australia’s economy, as well as greater-than-expected repayments of GST debt.
The national GST pool is on track to return to its pre-COVID trajectory in 2020-21 and 2021-22, despite population remaining lower than pre-COVID expectations. This near-term strength is supported by:
a strengthened outlook for dwelling investment, supported by the Commonwealth’s HomeBuilder program
the impact of the closure of international borders – leading to consumers substituting overseas spending (which does not incur GST) with spending on domestic tourism and other discretionary spending.
While the continued improvement in the economy will continue to support GST collections, the effect of the factors mentioned above is likely to taper over time. This is expected to result in a smaller upgrade in the GST pool from 2023-24 relative to the prior two years.
NSW relative share of the GST pool
New South Wales’ relativity is expected to be higher over the forecast period. The Commonwealth Grants Commission’s (CGC) most recent recommendations for the State’s relativity in 2021-22 was higher than expected at the 2020-21 Half-Yearly Review. This has resulted in an upgrade in NSW Treasury’s forecasts for New South Wales’ GST relativity over the four years to 2023-24. This upward revision compounds the upgrade in NSW relativity following the CGC’s comprehensive five-yearly methodology review completed in 2020.
Looking forward, NSW GST revenue forecasts from 2022-23 onwards will be subject to heightened uncertainty because of differences in the way that the COVID-19 pandemic has affected each state and territory.
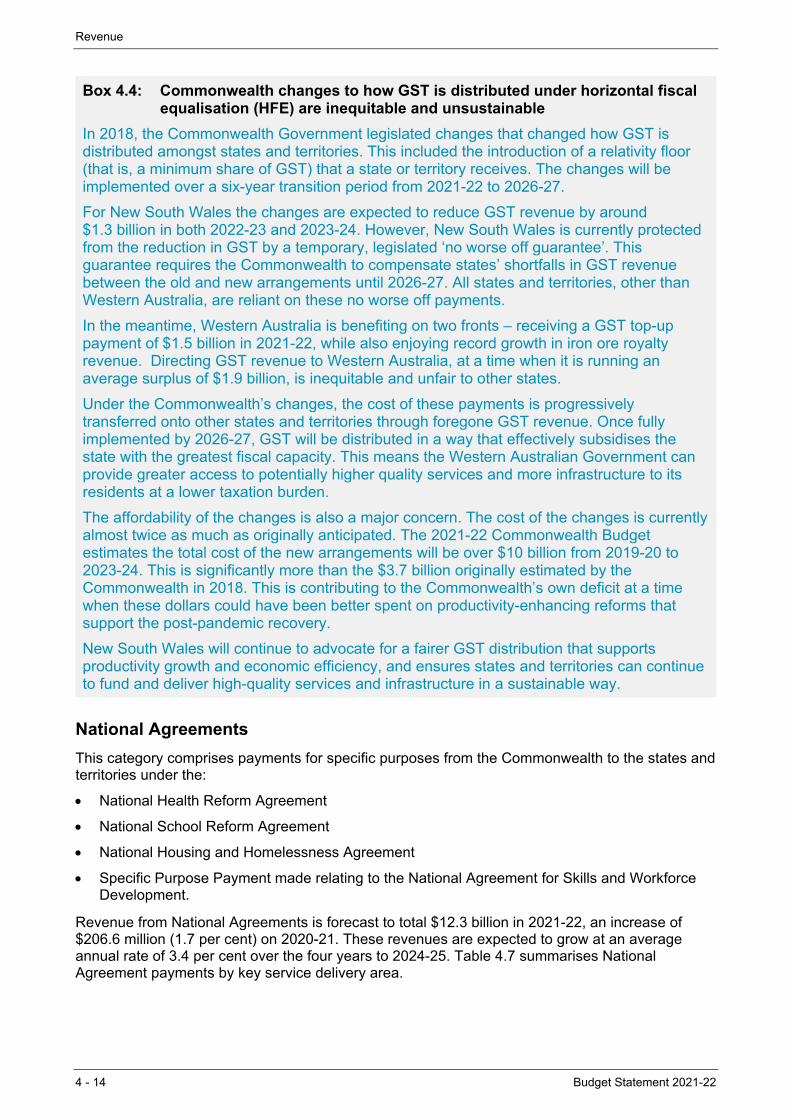
Revenue
4 - 14 Budget Statement 2021-22
Box 4.4: Commonwealth changes to how GST is distributed under horizontal fiscal equalisation (HFE) are inequitable and unsustainable
In 2018, the Commonwealth Government legislated changes that changed how GST is distributed amongst states and territories. This included the introduction of a relativity floor (that is, a minimum share of GST) that a state or territory receives. The changes will be implemented over a six-year transition period from 2021-22 to 2026-27.
For New South Wales the changes are expected to reduce GST revenue by around $1.3 billion in both 2022-23 and 2023-24. However, New South Wales is currently protected from the reduction in GST by a temporary, legislated ‘no worse off guarantee’. This guarantee requires the Commonwealth to compensate states’ shortfalls in GST revenue between the old and new arrangements until 2026-27. All states and territories, other than Western Australia, are reliant on these no worse off payments.
In the meantime, Western Australia is benefiting on two fronts – receiving a GST top-up payment of $1.5 billion in 2021-22, while also enjoying record growth in iron ore royalty revenue. Directing GST revenue to Western Australia, at a time when it is running an average surplus of $1.9 billion, is inequitable and unfair to other states.
Under the Commonwealth’s changes, the cost of these payments is progressively transferred onto other states and territories through foregone GST revenue. Once fully implemented by 2026-27, GST will be distributed in a way that effectively subsidises the state with the greatest fiscal capacity. This means the Western Australian Government can provide greater access to potentially higher quality services and more infrastructure to its residents at a lower taxation burden.
The affordability of the changes is also a major concern. The cost of the changes is currently almost twice as much as originally anticipated. The 2021-22 Commonwealth Budget estimates the total cost of the new arrangements will be over $10 billion from 2019-20 to 2023-24. This is significantly more than the $3.7 billion originally estimated by the Commonwealth in 2018. This is contributing to the Commonwealth’s own deficit at a time when these dollars could have been better spent on productivity-enhancing reforms that support the post-pandemic recovery.
New South Wales will continue to advocate for a fairer GST distribution that supports productivity growth and economic efficiency, and ensures states and territories can continue to fund and deliver high-quality services and infrastructure in a sustainable way.
National Agreements
This category comprises payments for specific purposes from the Commonwealth to the states and territories under the:
National Health Reform Agreement
National School Reform Agreement
National Housing and Homelessness Agreement
Specific Purpose Payment made relating to the National Agreement for Skills and Workforce Development.
Revenue from National Agreements is forecast to total $12.3 billion in 2021-22, an increase of $206.6 million (1.7 per cent) on 2020-21. These revenues are expected to grow at an average annual rate of 3.4 per cent over the four years to 2024-25. Table 4.7 summarises National Agreement payments by key service delivery area.
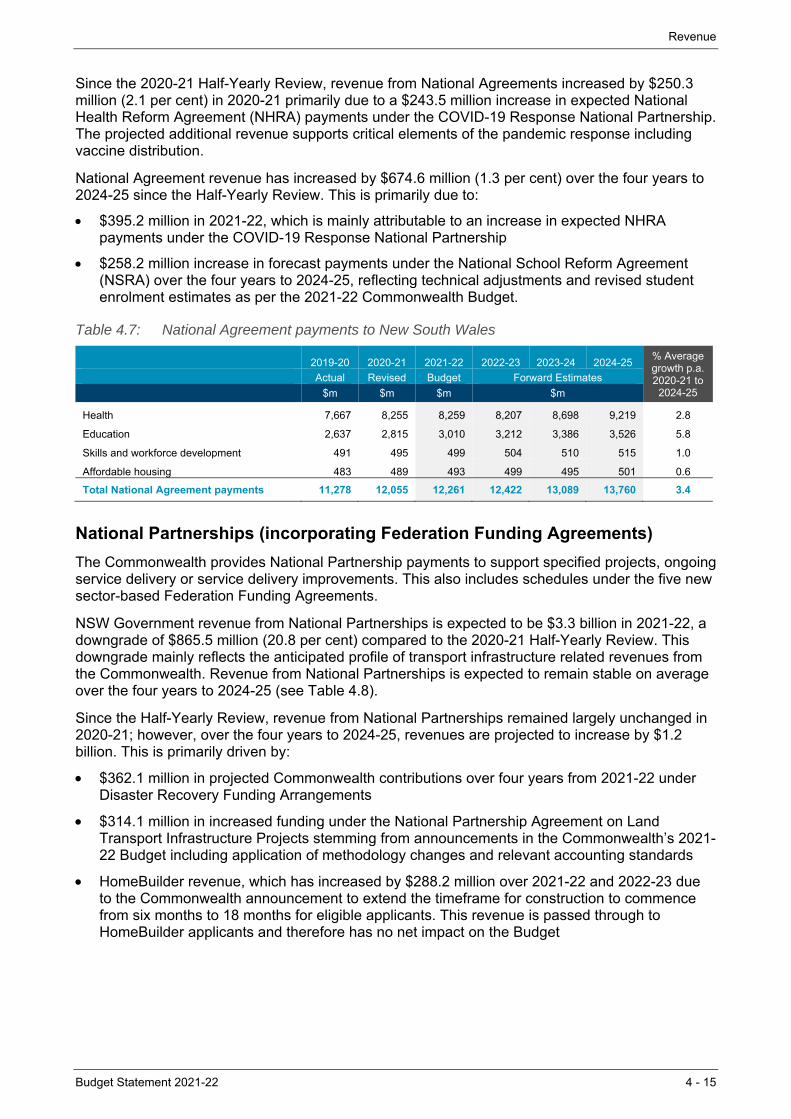
Revenue
Budget Statement 2021-22 4 - 15
Since the 2020-21 Half-Yearly Review, revenue from National Agreements increased by $250.3 million (2.1 per cent) in 2020-21 primarily due to a $243.5 million increase in expected National Health Reform Agreement (NHRA) payments under the COVID-19 Response National Partnership. The projected additional revenue supports critical elements of the pandemic response including vaccine distribution.
National Agreement revenue has increased by $674.6 million (1.3 per cent) over the four years to 2024-25 since the Half-Yearly Review. This is primarily due to:
$395.2 million in 2021-22, which is mainly attributable to an increase in expected NHRA payments under the COVID-19 Response National Partnership
$258.2 million increase in forecast payments under the National School Reform Agreement (NSRA) over the four years to 2024-25, reflecting technical adjustments and revised student enrolment estimates as per the 2021-22 Commonwealth Budget.
Table 4.7: National Agreement payments to New South Wales
2019-20 2020-21 2021-22 2022-23 2023-24 2024-25 % Average growth p.a.2020-21 to
2024-25
Actual Revised Budget Forward Estimates
$m $m $m $m
Health 7,667 8,255 8,259 8,207 8,698 9,219 2.8
Education 2,637 2,815 3,010 3,212 3,386 3,526 5.8
Skills and workforce development 491 495 499 504 510 515 1.0
Affordable housing 483 489 493 499 495 501 0.6
Total National Agreement payments 11,278 12,055 12,261 12,422 13,089 13,760 3.4
National Partnerships (incorporating Federation Funding Agreements)
The Commonwealth provides National Partnership payments to support specified projects, ongoing service delivery or service delivery improvements. This also includes schedules under the five new sector-based Federation Funding Agreements.
NSW Government revenue from National Partnerships is expected to be $3.3 billion in 2021-22, a downgrade of $865.5 million (20.8 per cent) compared to the 2020-21 Half-Yearly Review. This downgrade mainly reflects the anticipated profile of transport infrastructure related revenues from the Commonwealth. Revenue from National Partnerships is expected to remain stable on average over the four years to 2024-25 (see Table 4.8).
Since the Half-Yearly Review, revenue from National Partnerships remained largely unchanged in 2020-21; however, over the four years to 2024-25, revenues are projected to increase by $1.2 billion. This is primarily driven by:
$362.1 million in projected Commonwealth contributions over four years from 2021-22 under Disaster Recovery Funding Arrangements
$314.1 million in increased funding under the National Partnership Agreement on Land Transport Infrastructure Projects stemming from announcements in the Commonwealth’s 2021-22 Budget including application of methodology changes and relevant accounting standards
HomeBuilder revenue, which has increased by $288.2 million over 2021-22 and 2022-23 due to the Commonwealth announcement to extend the timeframe for construction to commence from six months to 18 months for eligible applicants. This revenue is passed through to HomeBuilder applicants and therefore has no net impact on the Budget
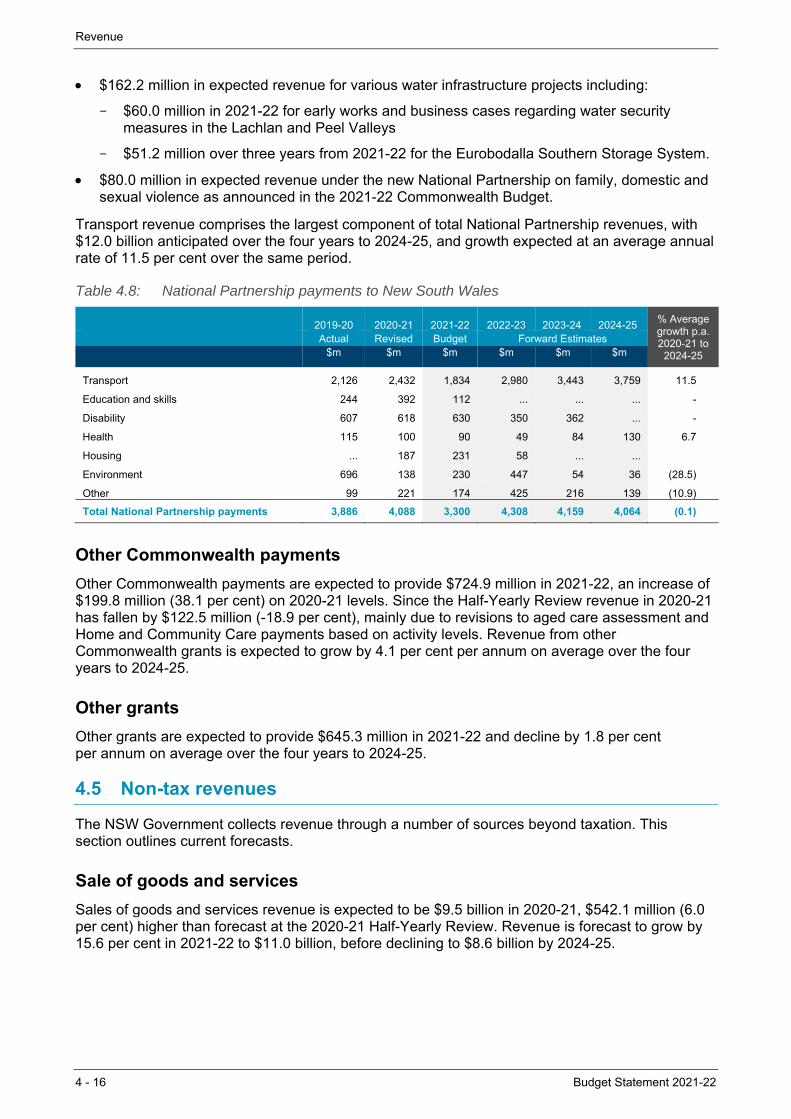
Revenue
4 - 16 Budget Statement 2021-22
$162.2 million in expected revenue for various water infrastructure projects including:
– $60.0 million in 2021-22 for early works and business cases regarding water security measures in the Lachlan and Peel Valleys
– $51.2 million over three years from 2021-22 for the Eurobodalla Southern Storage System.
$80.0 million in expected revenue under the new National Partnership on family, domestic and sexual violence as announced in the 2021-22 Commonwealth Budget.
Transport revenue comprises the largest component of total National Partnership revenues, with $12.0 billion anticipated over the four years to 2024-25, and growth expected at an average annual rate of 11.5 per cent over the same period.
Table 4.8: National Partnership payments to New South Wales
2019-20 2020-21 2021-22 2022-23 2023-24 2024-25 % Average growth p.a.2020-21 to
2024-25
Actual Revised Budget Forward Estimates $m $m $m $m $m $m
Transport 2,126 2,432 1,834 2,980 3,443 3,759 11.5
Education and skills 244 392 112 ... ... ... -
Disability 607 618 630 350 362 ... -
Health 115 100 90 49 84 130 6.7
Housing ... 187 231 58 ... ...
Environment 696 138 230 447 54 36 (28.5)
Other 99 221 174 425 216 139 (10.9)
Total National Partnership payments 3,886 4,088 3,300 4,308 4,159 4,064 (0.1)
Other Commonwealth payments
Other Commonwealth payments are expected to provide $724.9 million in 2021-22, an increase of $199.8 million (38.1 per cent) on 2020-21 levels. Since the Half-Yearly Review revenue in 2020-21 has fallen by $122.5 million (-18.9 per cent), mainly due to revisions to aged care assessment and Home and Community Care payments based on activity levels. Revenue from other Commonwealth grants is expected to grow by 4.1 per cent per annum on average over the four years to 2024-25.
Other grants
Other grants are expected to provide $645.3 million in 2021-22 and decline by 1.8 per cent per annum on average over the four years to 2024-25.
4.5 Non-tax revenues
The NSW Government collects revenue through a number of sources beyond taxation. This section outlines current forecasts.
Sale of goods and services
Sales of goods and services revenue is expected to be $9.5 billion in 2020-21, $542.1 million (6.0 per cent) higher than forecast at the 2020-21 Half-Yearly Review. Revenue is forecast to grow by 15.6 per cent in 2021-22 to $11.0 billion, before declining to $8.6 billion by 2024-25.
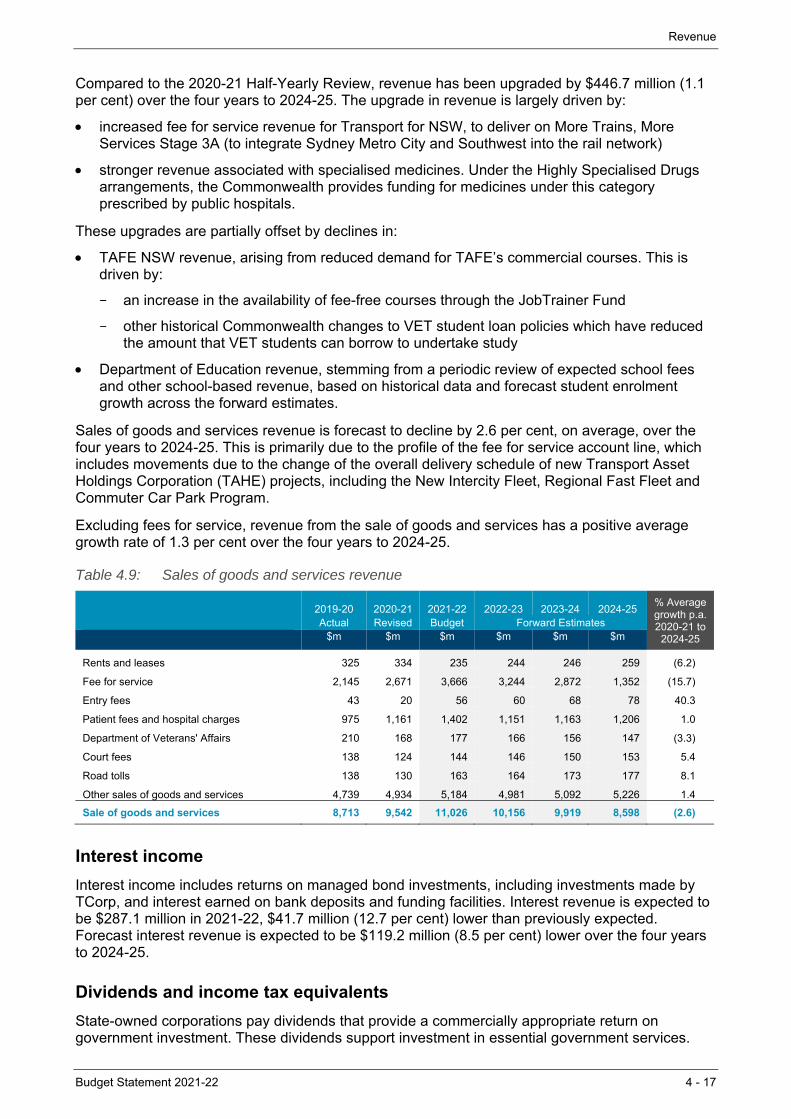
Revenue
Budget Statement 2021-22 4 - 17
Compared to the 2020-21 Half-Yearly Review, revenue has been upgraded by $446.7 million (1.1 per cent) over the four years to 2024-25. The upgrade in revenue is largely driven by:
increased fee for service revenue for Transport for NSW, to deliver on More Trains, More Services Stage 3A (to integrate Sydney Metro City and Southwest into the rail network)
stronger revenue associated with specialised medicines. Under the Highly Specialised Drugs arrangements, the Commonwealth provides funding for medicines under this category prescribed by public hospitals.
These upgrades are partially offset by declines in:
TAFE NSW revenue, arising from reduced demand for TAFE’s commercial courses. This is driven by:
– an increase in the availability of fee-free courses through the JobTrainer Fund
– other historical Commonwealth changes to VET student loan policies which have reduced the amount that VET students can borrow to undertake study
Department of Education revenue, stemming from a periodic review of expected school fees and other school-based revenue, based on historical data and forecast student enrolment growth across the forward estimates.
Sales of goods and services revenue is forecast to decline by 2.6 per cent, on average, over the four years to 2024-25. This is primarily due to the profile of the fee for service account line, which includes movements due to the change of the overall delivery schedule of new Transport Asset Holdings Corporation (TAHE) projects, including the New Intercity Fleet, Regional Fast Fleet and Commuter Car Park Program.
Excluding fees for service, revenue from the sale of goods and services has a positive average growth rate of 1.3 per cent over the four years to 2024-25.
Table 4.9: Sales of goods and services revenue
2019-20 2020-21 2021-22 2022-23 2023-24 2024-25 % Average growth p.a. 2020-21 to
2024-25
Actual Revised Budget Forward Estimates $m $m $m $m $m $m
Rents and leases 325 334 235 244 246 259 (6.2)
Fee for service 2,145 2,671 3,666 3,244 2,872 1,352 (15.7)
Entry fees 43 20 56 60 68 78 40.3
Patient fees and hospital charges 975 1,161 1,402 1,151 1,163 1,206 1.0
Department of Veterans' Affairs 210 168 177 166 156 147 (3.3)
Court fees 138 124 144 146 150 153 5.4
Road tolls 138 130 163 164 173 177 8.1
Other sales of goods and services 4,739 4,934 5,184 4,981 5,092 5,226 1.4
Sale of goods and services 8,713 9,542 11,026 10,156 9,919 8,598 (2.6)
Interest income
Interest income includes returns on managed bond investments, including investments made by TCorp, and interest earned on bank deposits and funding facilities. Interest revenue is expected to be $287.1 million in 2021-22, $41.7 million (12.7 per cent) lower than previously expected. Forecast interest revenue is expected to be $119.2 million (8.5 per cent) lower over the four years to 2024-25.
Dividends and income tax equivalents
State-owned corporations pay dividends that provide a commercially appropriate return on government investment. These dividends support investment in essential government services.
Revenue
4 - 18 Budget Statement 2021-22
Dividends and income tax equivalents are expected to be $682.0 million in 2021-22, $6.1 million (0.9 per cent) lower than expected at the 2020-21 Half-Yearly Review. Revenue is expected to be $834.7 million (23.5 per cent) higher over the four years to 2024-25 driven by a forecast increase in dividends from Sydney Water and TCorp, resulting from capital structure optimisation and other initiatives.
Other dividends and distributions
Other dividends and distributions are received from entities other than State-owned corporations and are expected to be $2.3 billion in 2021-22, $242.6 million (11.9 per cent) higher than forecast at the 2020-21 Half-Yearly Review. Over the four years to 2024-25, other dividends and distributions are expected to be $2.8 billion higher (25.5 per cent).
The upward revision reflects strong investment returns over 2020-21, which benefitted from improved financial markets following the COVID-induced downturn, and were supported by greater investor confidence in the economic outlook and interest rates remaining at historic lows. The better-than-expected performance in 2020-21 has resulted in higher fund balances, which are expected to drive higher returns going forward. Additional contributions into the NGF and upwardly revised investment return rates are also expected to contribute to higher fund growth and forecast returns relative to the 2020-21 Half-Yearly Review.
Higher forecast fund returns have been partially offset by a reduction in forecast distributions from the Government’s retained interest in Ausgrid and Endeavour, reflecting business decisions to prepay debt and retain cash to manage their credit ratings.
Fines, regulatory fees and other revenue (excluding royalties)
Total revenue from fines, regulatory fees, and other revenue is forecast to be $3.0 billion in 2021-22 and is forecast to grow at an average annual rate of 2.3 per cent over the four years to 2024-25.
Fines revenue is forecast to be $48.6 million higher over the four years to 2024-25 compared to the 2020-21 Half-Yearly Review. This reflects updated estimates of Victim Support Scheme revenues arising from Compensation Levies, Restitution Orders and Confiscation Proceeds, which are driven by the outcomes of court proceedings.2
Other revenues have been revised downwards by $103.7 million over the four years to 2024-25. Revenue from donations and contributions has been revised down due to lower voluntary parental education contributions, as a result of ongoing COVID-19 impacts. Downgrades in other revenues have been partly offset by an uplift in developer contributions paid to Transport for NSW.
2 Compensation paid to the Victims Compensation Tribunal is classified as fine revenue and is subsequently paid to the
victims.
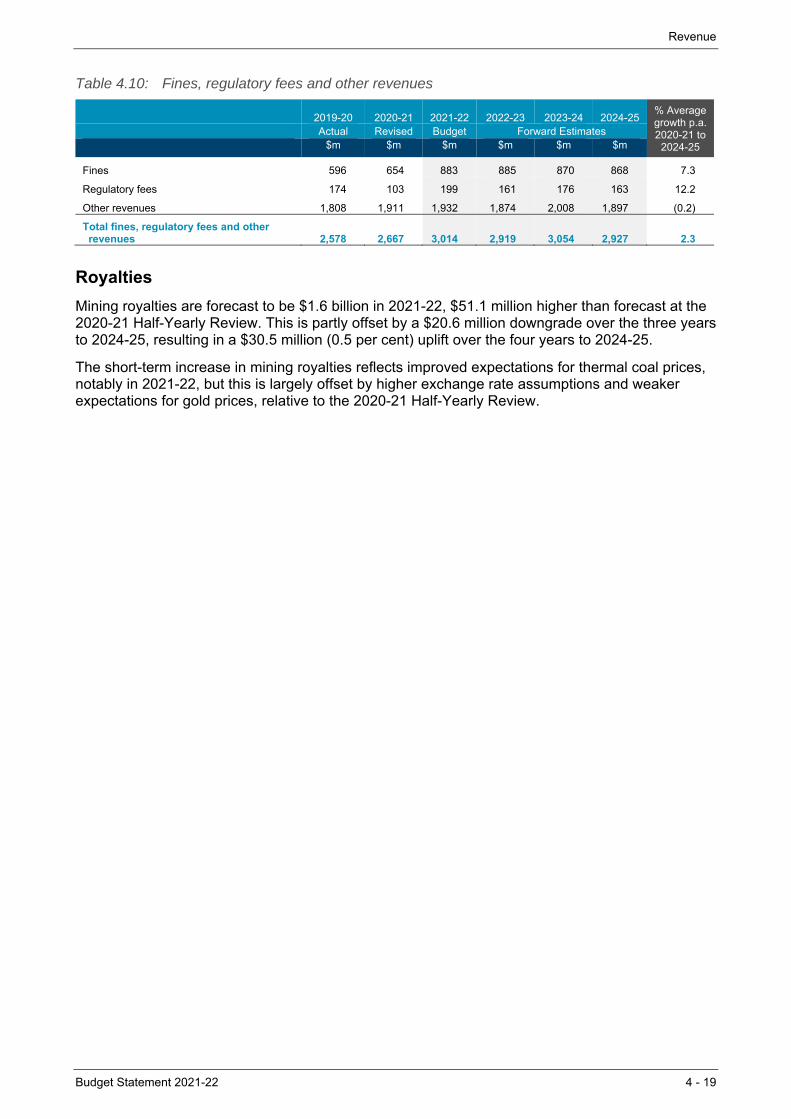
Revenue
Budget Statement 2021-22 4 - 19
Table 4.10: Fines, regulatory fees and other revenues
2019-20 2020-21 2021-22 2022-23 2023-24 2024-25
% Average growth p.a. 2020-21 to
2024-25 Actual Revised Budget Forward Estimates $m $m $m $m $m $m
Fines 596 654 883 885 870 868 7.3
Regulatory fees 174 103 199 161 176 163 12.2
Other revenues 1,808 1,911 1,932 1,874 2,008 1,897 (0.2)
Total fines, regulatory fees and other revenues 2,578 2,667 3,014 2,919 3,054 2,927 2.3
Royalties
Mining royalties are forecast to be $1.6 billion in 2021-22, $51.1 million higher than forecast at the 2020-21 Half-Yearly Review. This is partly offset by a $20.6 million downgrade over the three years to 2024-25, resulting in a $30.5 million (0.5 per cent) uplift over the four years to 2024-25.
The short-term increase in mining royalties reflects improved expectations for thermal coal prices, notably in 2021-22, but this is largely offset by higher exchange rate assumptions and weaker expectations for gold prices, relative to the 2020-21 Half-Yearly Review.

Budget Statement 2021-22 5 - 1
5. EXPENDITURE
Expenses in this Budget continue the State’s world-leading response to the pandemic whilst also responding to the 2021 flood and storm events, the mouse plague, and further investments in our bushfire response capabilities.
At the same time, new expenditure is being directed towards forward-looking economic reforms and delivering improved services across New South Wales.
Total general government expenses are projected to be $102.5 billion in 2021-22. This is 7.3 per cent higher than in the previous financial year due to continued economic stimulus and support programs, new policy measures and parameter adjustments.
The Government is making a range of additional investments, including in:
- Education, with curriculum reform and a teacher supply strategy
- Health, with a focus on mental health and palliative care
- Energy, with funding for the Energy Roadmap and incentives to support the transition to electric vehicles
- Transport, with funding for more trains and more services, and road safety.
Across the forward estimates, general government expense growth is projected to return to levels below revenue growth, in line with the Government’s approach to fiscal discipline as required by the Fiscal Responsibility Act 2012. This will allow the Government to rebuild fiscal buffers for any future events.
This Budget also includes a record infrastructure program of $108.5 billion over the four years to 2024-25 including a record investment of $7.9 billion in schools, $10.8 billion on hospitals and health infrastructure1, the new Bradfield City Centre and $71.5 billion for the State’s roads and public transport.
5.1 Continuing response and recovery with a productivity focus
The Government’s priorities in the 2021-22 Budget are to:
provide further health safeguards and support for communities impacted by COVID-19, bushfires and floods
continue the Government’s reform agenda, with long-term economic reforms to ensure the state’s prosperity into the future.
The expense measures in this Budget build on the successful implementation of stimulus and support since March 2020. Stimulus measures continue with $6.0 billion in expense measures (recurrent and capital) to be delivered in 2021-22. Box 5.1 provides more details and insights into the COVID-19 response and recovery measures to date.
The State has seen a need for further investment in disaster response with $590.4 million provided for the 2021 flood and storm events in partnership with the Commonwealth Government, and $150.0 million for the mouse plague across regional New South Wales. A further $268.2 million in recurrent and capital expenditure is provided for the Government’s second response to the NSW Bushfire Inquiry, in addition to the $192.2 million already provided in October 2020.
1 This includes $428.5 million of capital expenditure from the Ministry of Health’s expense budget. Further information is
provided at footnote C) of Table 1.2 in Budget Paper 3.
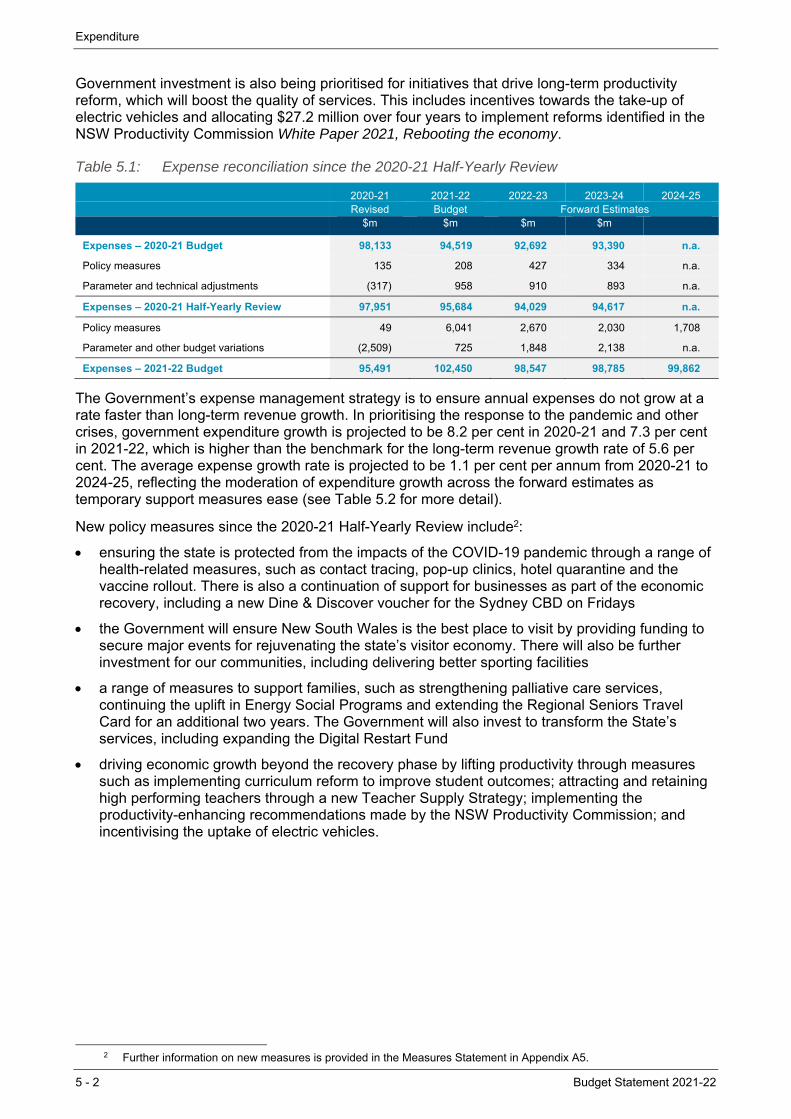
Expenditure
5 - 2 Budget Statement 2021-22
Government investment is also being prioritised for initiatives that drive long-term productivity reform, which will boost the quality of services. This includes incentives towards the take-up of electric vehicles and allocating $27.2 million over four years to implement reforms identified in the NSW Productivity Commission White Paper 2021, Rebooting the economy.
Table 5.1: Expense reconciliation since the 2020-21 Half-Yearly Review
2020-21 2021-22 2022-23 2023-24 2024-25 Revised Budget Forward Estimates
$m $m $m $m
Expenses – 2020-21 Budget 98,133 94,519 92,692 93,390 n.a.
Policy measures 135 208 427 334 n.a.
Parameter and technical adjustments (317) 958 910 893 n.a.
Expenses – 2020-21 Half-Yearly Review 97,951 95,684 94,029 94,617 n.a.
Policy measures 49 6,041 2,670 2,030 1,708
Parameter and other budget variations (2,509) 725 1,848 2,138 n.a.
Expenses – 2021-22 Budget 95,491 102,450 98,547 98,785 99,862
The Government’s expense management strategy is to ensure annual expenses do not grow at a rate faster than long-term revenue growth. In prioritising the response to the pandemic and other crises, government expenditure growth is projected to be 8.2 per cent in 2020-21 and 7.3 per cent in 2021-22, which is higher than the benchmark for the long-term revenue growth rate of 5.6 per cent. The average expense growth rate is projected to be 1.1 per cent per annum from 2020-21 to 2024-25, reflecting the moderation of expenditure growth across the forward estimates as temporary support measures ease (see Table 5.2 for more detail).
New policy measures since the 2020-21 Half-Yearly Review include2:
ensuring the state is protected from the impacts of the COVID-19 pandemic through a range of health-related measures, such as contact tracing, pop-up clinics, hotel quarantine and the vaccine rollout. There is also a continuation of support for businesses as part of the economic recovery, including a new Dine & Discover voucher for the Sydney CBD on Fridays
the Government will ensure New South Wales is the best place to visit by providing funding to secure major events for rejuvenating the state’s visitor economy. There will also be further investment for our communities, including delivering better sporting facilities
a range of measures to support families, such as strengthening palliative care services, continuing the uplift in Energy Social Programs and extending the Regional Seniors Travel Card for an additional two years. The Government will also invest to transform the State’s services, including expanding the Digital Restart Fund
driving economic growth beyond the recovery phase by lifting productivity through measures such as implementing curriculum reform to improve student outcomes; attracting and retaining high performing teachers through a new Teacher Supply Strategy; implementing the productivity-enhancing recommendations made by the NSW Productivity Commission; and incentivising the uptake of electric vehicles.
2 Further information on new measures is provided in the Measures Statement in Appendix A5.
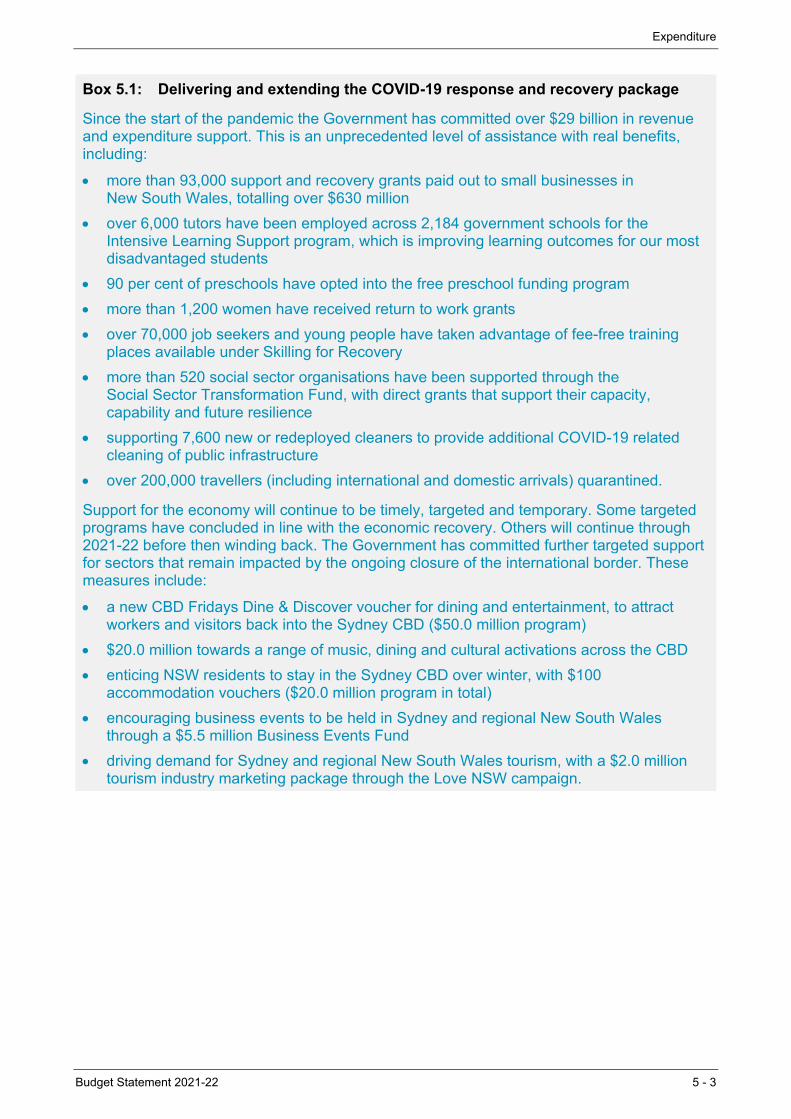
Expenditure
Budget Statement 2021-22 5 - 3
Box 5.1: Delivering and extending the COVID-19 response and recovery package
Since the start of the pandemic the Government has committed over $29 billion in revenue and expenditure support. This is an unprecedented level of assistance with real benefits, including:
more than 93,000 support and recovery grants paid out to small businesses in New South Wales, totalling over $630 million
over 6,000 tutors have been employed across 2,184 government schools for the Intensive Learning Support program, which is improving learning outcomes for our most disadvantaged students
90 per cent of preschools have opted into the free preschool funding program
more than 1,200 women have received return to work grants
over 70,000 job seekers and young people have taken advantage of fee-free training places available under Skilling for Recovery
more than 520 social sector organisations have been supported through the Social Sector Transformation Fund, with direct grants that support their capacity, capability and future resilience
supporting 7,600 new or redeployed cleaners to provide additional COVID-19 related cleaning of public infrastructure
over 200,000 travellers (including international and domestic arrivals) quarantined.
Support for the economy will continue to be timely, targeted and temporary. Some targeted programs have concluded in line with the economic recovery. Others will continue through 2021-22 before then winding back. The Government has committed further targeted support for sectors that remain impacted by the ongoing closure of the international border. These measures include:
a new CBD Fridays Dine & Discover voucher for dining and entertainment, to attract workers and visitors back into the Sydney CBD ($50.0 million program)
$20.0 million towards a range of music, dining and cultural activations across the CBD
enticing NSW residents to stay in the Sydney CBD over winter, with $100 accommodation vouchers ($20.0 million program in total)
encouraging business events to be held in Sydney and regional New South Wales through a $5.5 million Business Events Fund
driving demand for Sydney and regional New South Wales tourism, with a $2.0 million tourism industry marketing package through the Love NSW campaign.
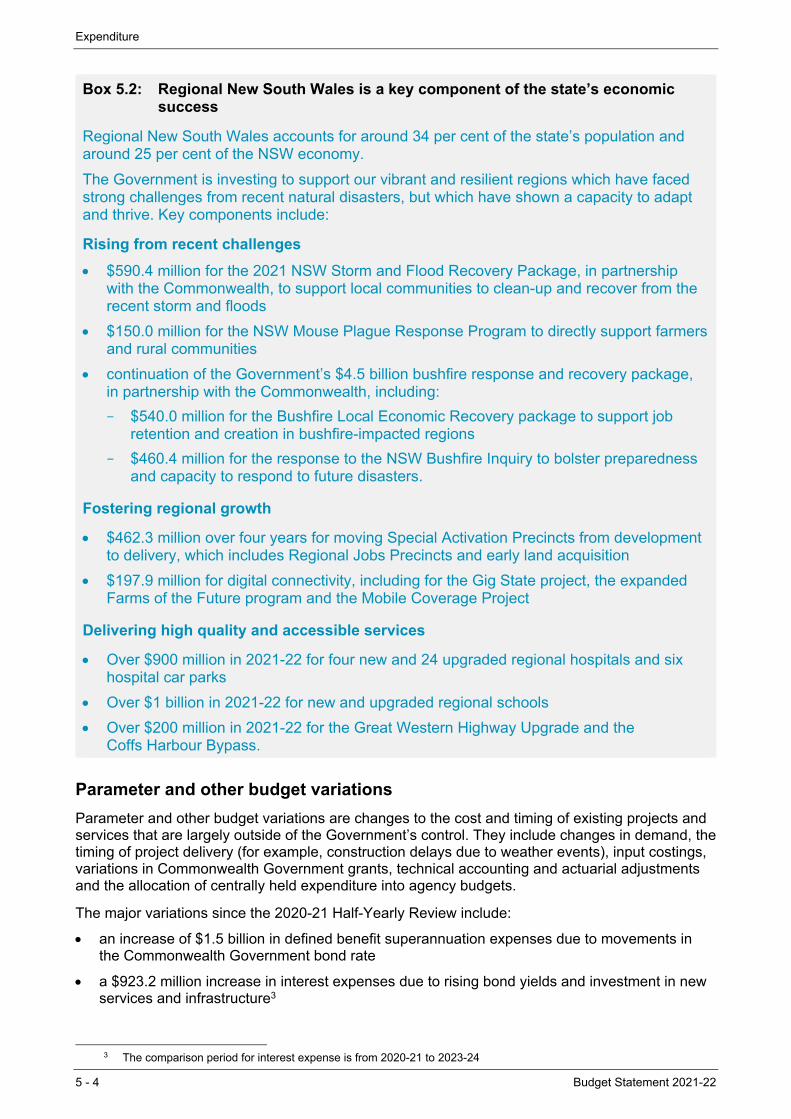
Expenditure
5 - 4 Budget Statement 2021-22
Box 5.2: Regional New South Wales is a key component of the state’s economic success
Regional New South Wales accounts for around 34 per cent of the state’s population and around 25 per cent of the NSW economy.
The Government is investing to support our vibrant and resilient regions which have faced strong challenges from recent natural disasters, but which have shown a capacity to adapt and thrive. Key components include:
Rising from recent challenges
$590.4 million for the 2021 NSW Storm and Flood Recovery Package, in partnership with the Commonwealth, to support local communities to clean-up and recover from the recent storm and floods
$150.0 million for the NSW Mouse Plague Response Program to directly support farmers and rural communities
continuation of the Government’s $4.5 billion bushfire response and recovery package, in partnership with the Commonwealth, including:
– $540.0 million for the Bushfire Local Economic Recovery package to support job retention and creation in bushfire-impacted regions
– $460.4 million for the response to the NSW Bushfire Inquiry to bolster preparedness and capacity to respond to future disasters.
Fostering regional growth
$462.3 million over four years for moving Special Activation Precincts from development to delivery, which includes Regional Jobs Precincts and early land acquisition
$197.9 million for digital connectivity, including for the Gig State project, the expanded Farms of the Future program and the Mobile Coverage Project
Delivering high quality and accessible services
Over $900 million in 2021-22 for four new and 24 upgraded regional hospitals and six hospital car parks
Over $1 billion in 2021-22 for new and upgraded regional schools
Over $200 million in 2021-22 for the Great Western Highway Upgrade and the Coffs Harbour Bypass.
Parameter and other budget variations
Parameter and other budget variations are changes to the cost and timing of existing projects and services that are largely outside of the Government’s control. They include changes in demand, the timing of project delivery (for example, construction delays due to weather events), input costings, variations in Commonwealth Government grants, technical accounting and actuarial adjustments and the allocation of centrally held expenditure into agency budgets.
The major variations since the 2020-21 Half-Yearly Review include:
an increase of $1.5 billion in defined benefit superannuation expenses due to movements in the Commonwealth Government bond rate
a $923.2 million increase in interest expenses due to rising bond yields and investment in new services and infrastructure3
3 The comparison period for interest expense is from 2020-21 to 2023-24
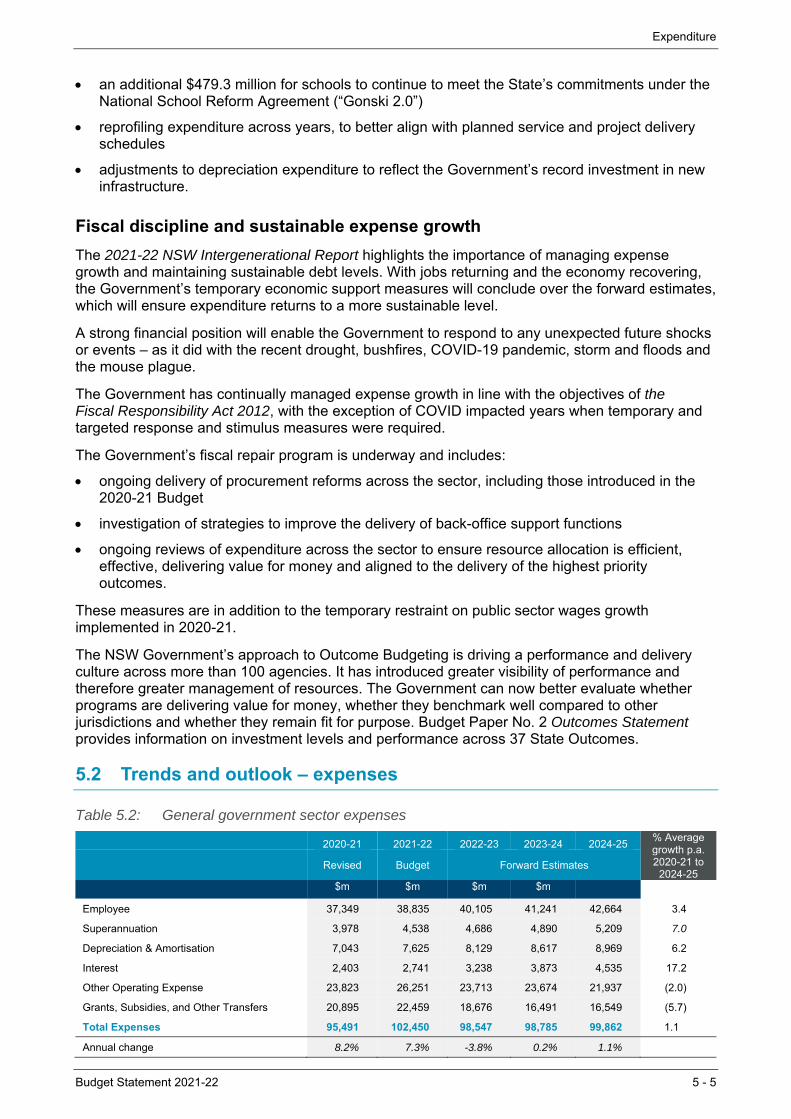
Expenditure
Budget Statement 2021-22 5 - 5
an additional $479.3 million for schools to continue to meet the State’s commitments under the National School Reform Agreement (“Gonski 2.0”)
reprofiling expenditure across years, to better align with planned service and project delivery schedules
adjustments to depreciation expenditure to reflect the Government’s record investment in new infrastructure.
Fiscal discipline and sustainable expense growth
The 2021-22 NSW Intergenerational Report highlights the importance of managing expense growth and maintaining sustainable debt levels. With jobs returning and the economy recovering, the Government’s temporary economic support measures will conclude over the forward estimates, which will ensure expenditure returns to a more sustainable level.
A strong financial position will enable the Government to respond to any unexpected future shocks or events – as it did with the recent drought, bushfires, COVID-19 pandemic, storm and floods and the mouse plague.
The Government has continually managed expense growth in line with the objectives of the Fiscal Responsibility Act 2012, with the exception of COVID impacted years when temporary and targeted response and stimulus measures were required.
The Government’s fiscal repair program is underway and includes:
ongoing delivery of procurement reforms across the sector, including those introduced in the 2020-21 Budget
investigation of strategies to improve the delivery of back-office support functions
ongoing reviews of expenditure across the sector to ensure resource allocation is efficient, effective, delivering value for money and aligned to the delivery of the highest priority outcomes.
These measures are in addition to the temporary restraint on public sector wages growth implemented in 2020-21.
The NSW Government’s approach to Outcome Budgeting is driving a performance and delivery culture across more than 100 agencies. It has introduced greater visibility of performance and therefore greater management of resources. The Government can now better evaluate whether programs are delivering value for money, whether they benchmark well compared to other jurisdictions and whether they remain fit for purpose. Budget Paper No. 2 Outcomes Statement provides information on investment levels and performance across 37 State Outcomes.
5.2 Trends and outlook – expenses
Table 5.2: General government sector expenses
2020-21 2021-22 2022-23 2023-24 2024-25
% Average growth p.a.2020-21 to
2024-25 Revised Budget Forward Estimates
$m $m $m $m
Employee 37,349 38,835 40,105 41,241 42,664 3.4
Superannuation 3,978 4,538 4,686 4,890 5,209 7.0
Depreciation & Amortisation 7,043 7,625 8,129 8,617 8,969 6.2
Interest 2,403 2,741 3,238 3,873 4,535 17.2
Other Operating Expense 23,823 26,251 23,713 23,674 21,937 (2.0)
Grants, Subsidies, and Other Transfers 20,895 22,459 18,676 16,491 16,549 (5.7)
Total Expenses 95,491 102,450 98,547 98,785 99,862 1.1
Annual change 8.2% 7.3% -3.8% 0.2% 1.1%
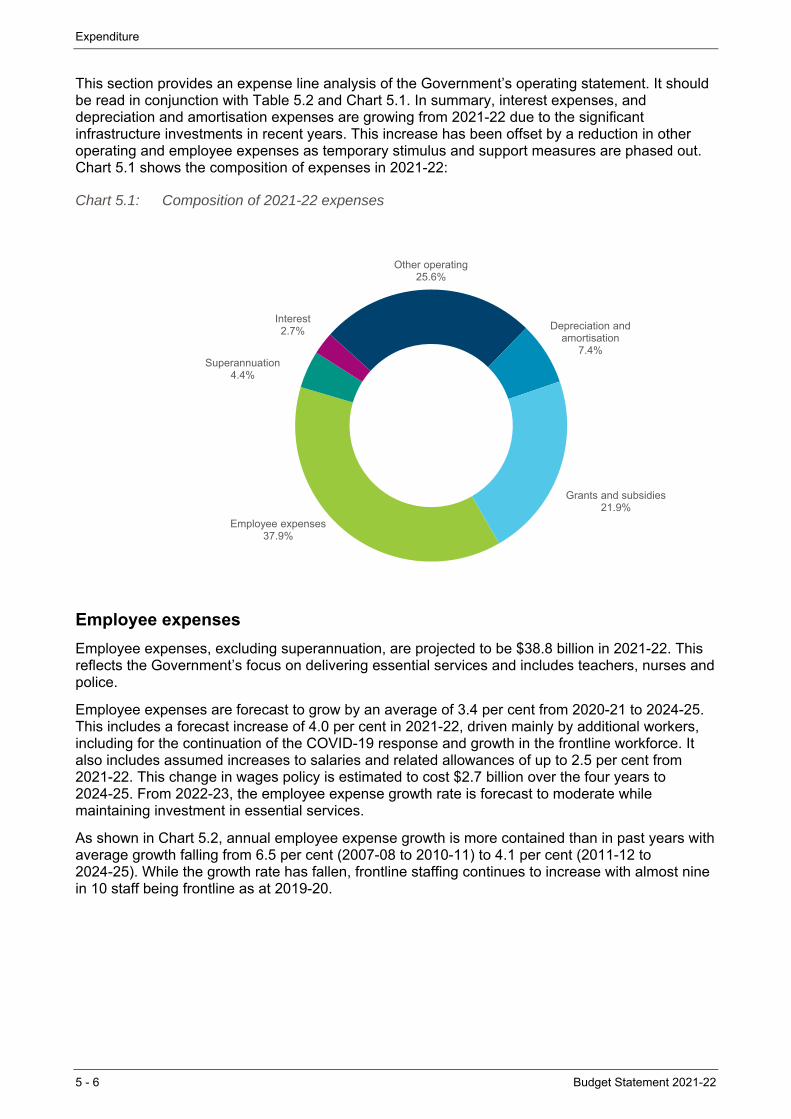
Expenditure
5 - 6 Budget Statement 2021-22
This section provides an expense line analysis of the Government’s operating statement. It should be read in conjunction with Table 5.2 and Chart 5.1. In summary, interest expenses, and depreciation and amortisation expenses are growing from 2021-22 due to the significant infrastructure investments in recent years. This increase has been offset by a reduction in other operating and employee expenses as temporary stimulus and support measures are phased out. Chart 5.1 shows the composition of expenses in 2021-22:
Chart 5.1: Composition of 2021-22 expenses
Employee expenses
Employee expenses, excluding superannuation, are projected to be $38.8 billion in 2021-22. This reflects the Government’s focus on delivering essential services and includes teachers, nurses and police.
Employee expenses are forecast to grow by an average of 3.4 per cent from 2020-21 to 2024-25. This includes a forecast increase of 4.0 per cent in 2021-22, driven mainly by additional workers, including for the continuation of the COVID-19 response and growth in the frontline workforce. It also includes assumed increases to salaries and related allowances of up to 2.5 per cent from 2021-22. This change in wages policy is estimated to cost $2.7 billion over the four years to 2024-25. From 2022-23, the employee expense growth rate is forecast to moderate while maintaining investment in essential services.
As shown in Chart 5.2, annual employee expense growth is more contained than in past years with average growth falling from 6.5 per cent (2007-08 to 2010-11) to 4.1 per cent (2011-12 to 2024-25). While the growth rate has fallen, frontline staffing continues to increase with almost nine in 10 staff being frontline as at 2019-20.
Employee expenses37.9%
Superannuation4.4%
Interest2.7%
Other operating25.6%
Depreciation and amortisation
7.4%
Grants and subsidies21.9%
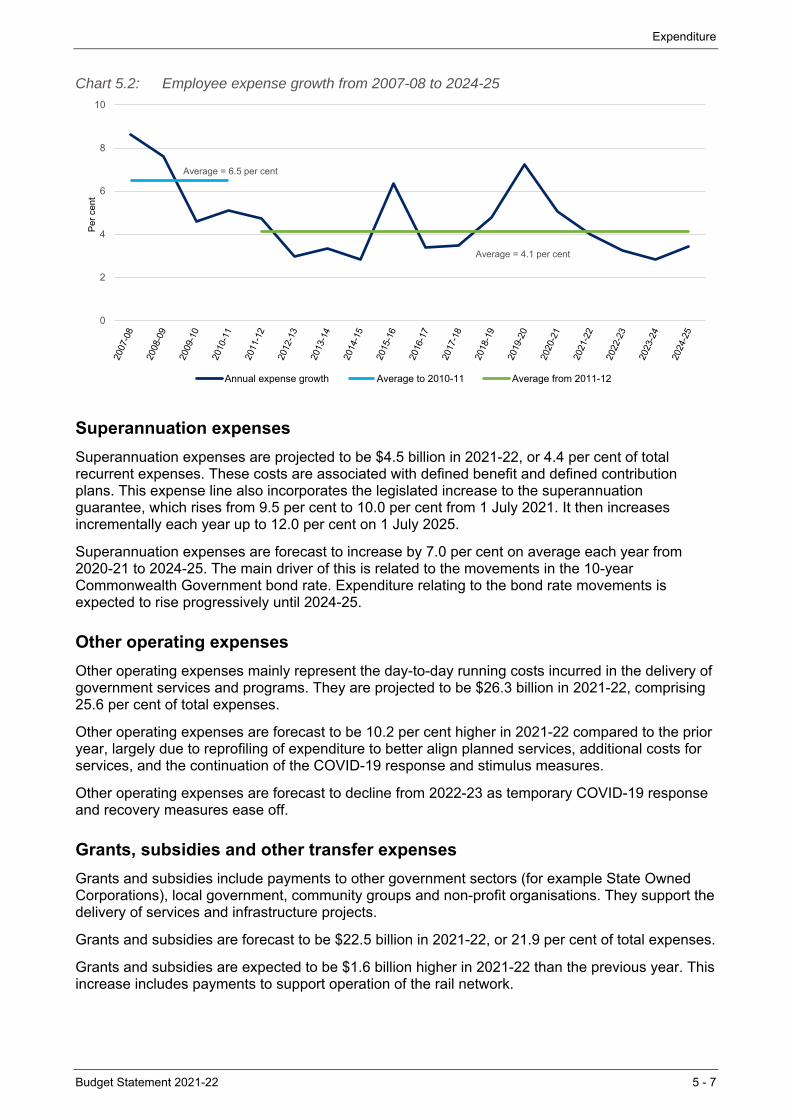
Expenditure
Budget Statement 2021-22 5 - 7
Chart 5.2: Employee expense growth from 2007-08 to 2024-25
Superannuation expenses
Superannuation expenses are projected to be $4.5 billion in 2021-22, or 4.4 per cent of total recurrent expenses. These costs are associated with defined benefit and defined contribution plans. This expense line also incorporates the legislated increase to the superannuation guarantee, which rises from 9.5 per cent to 10.0 per cent from 1 July 2021. It then increases incrementally each year up to 12.0 per cent on 1 July 2025.
Superannuation expenses are forecast to increase by 7.0 per cent on average each year from 2020-21 to 2024-25. The main driver of this is related to the movements in the 10-year Commonwealth Government bond rate. Expenditure relating to the bond rate movements is expected to rise progressively until 2024-25.
Other operating expenses
Other operating expenses mainly represent the day-to-day running costs incurred in the delivery of government services and programs. They are projected to be $26.3 billion in 2021-22, comprising 25.6 per cent of total expenses.
Other operating expenses are forecast to be 10.2 per cent higher in 2021-22 compared to the prior year, largely due to reprofiling of expenditure to better align planned services, additional costs for services, and the continuation of the COVID-19 response and stimulus measures.
Other operating expenses are forecast to decline from 2022-23 as temporary COVID-19 response and recovery measures ease off.
Grants, subsidies and other transfer expenses
Grants and subsidies include payments to other government sectors (for example State Owned Corporations), local government, community groups and non-profit organisations. They support the delivery of services and infrastructure projects.
Grants and subsidies are forecast to be $22.5 billion in 2021-22, or 21.9 per cent of total expenses.
Grants and subsidies are expected to be $1.6 billion higher in 2021-22 than the previous year. This increase includes payments to support operation of the rail network.
0
2
4
6
8
10
Per
cen
t
Annual expense growth Average to 2010-11 Average from 2011-12
Average = 6.5 per cent
Average = 4.1 per cent
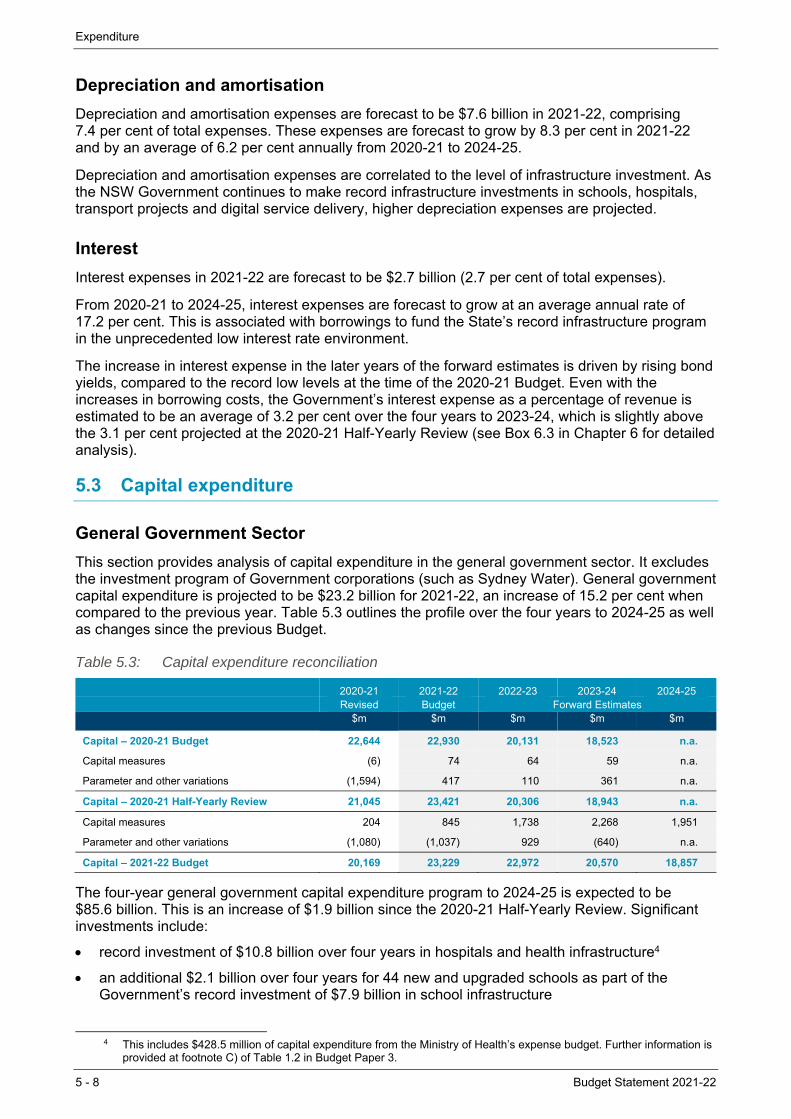
Expenditure
5 - 8 Budget Statement 2021-22
Depreciation and amortisation
Depreciation and amortisation expenses are forecast to be $7.6 billion in 2021-22, comprising 7.4 per cent of total expenses. These expenses are forecast to grow by 8.3 per cent in 2021-22 and by an average of 6.2 per cent annually from 2020-21 to 2024-25.
Depreciation and amortisation expenses are correlated to the level of infrastructure investment. As the NSW Government continues to make record infrastructure investments in schools, hospitals, transport projects and digital service delivery, higher depreciation expenses are projected.
Interest
Interest expenses in 2021-22 are forecast to be $2.7 billion (2.7 per cent of total expenses).
From 2020-21 to 2024-25, interest expenses are forecast to grow at an average annual rate of 17.2 per cent. This is associated with borrowings to fund the State’s record infrastructure program in the unprecedented low interest rate environment.
The increase in interest expense in the later years of the forward estimates is driven by rising bond yields, compared to the record low levels at the time of the 2020-21 Budget. Even with the increases in borrowing costs, the Government’s interest expense as a percentage of revenue is estimated to be an average of 3.2 per cent over the four years to 2023-24, which is slightly above the 3.1 per cent projected at the 2020-21 Half-Yearly Review (see Box 6.3 in Chapter 6 for detailed analysis).
5.3 Capital expenditure
General Government Sector
This section provides analysis of capital expenditure in the general government sector. It excludes the investment program of Government corporations (such as Sydney Water). General government capital expenditure is projected to be $23.2 billion for 2021-22, an increase of 15.2 per cent when compared to the previous year. Table 5.3 outlines the profile over the four years to 2024-25 as well as changes since the previous Budget.
Table 5.3: Capital expenditure reconciliation
2020-21 2021-22 2022-23 2023-24 2024-25 Revised Budget Forward Estimates
$m $m $m $m $m
Capital – 2020-21 Budget 22,644 22,930 20,131 18,523 n.a.
Capital measures (6) 74 64 59 n.a.
Parameter and other variations (1,594) 417 110 361 n.a.
Capital – 2020-21 Half-Yearly Review 21,045 23,421 20,306 18,943 n.a.
Capital measures 204 845 1,738 2,268 1,951
Parameter and other variations (1,080) (1,037) 929 (640) n.a.
Capital – 2021-22 Budget 20,169 23,229 22,972 20,570 18,857
The four-year general government capital expenditure program to 2024-25 is expected to be $85.6 billion. This is an increase of $1.9 billion since the 2020-21 Half-Yearly Review. Significant investments include:
record investment of $10.8 billion over four years in hospitals and health infrastructure4
an additional $2.1 billion over four years for 44 new and upgraded schools as part of the Government’s record investment of $7.9 billion in school infrastructure
4 This includes $428.5 million of capital expenditure from the Ministry of Health’s expense budget. Further information is
provided at footnote C) of Table 1.2 in Budget Paper 3.
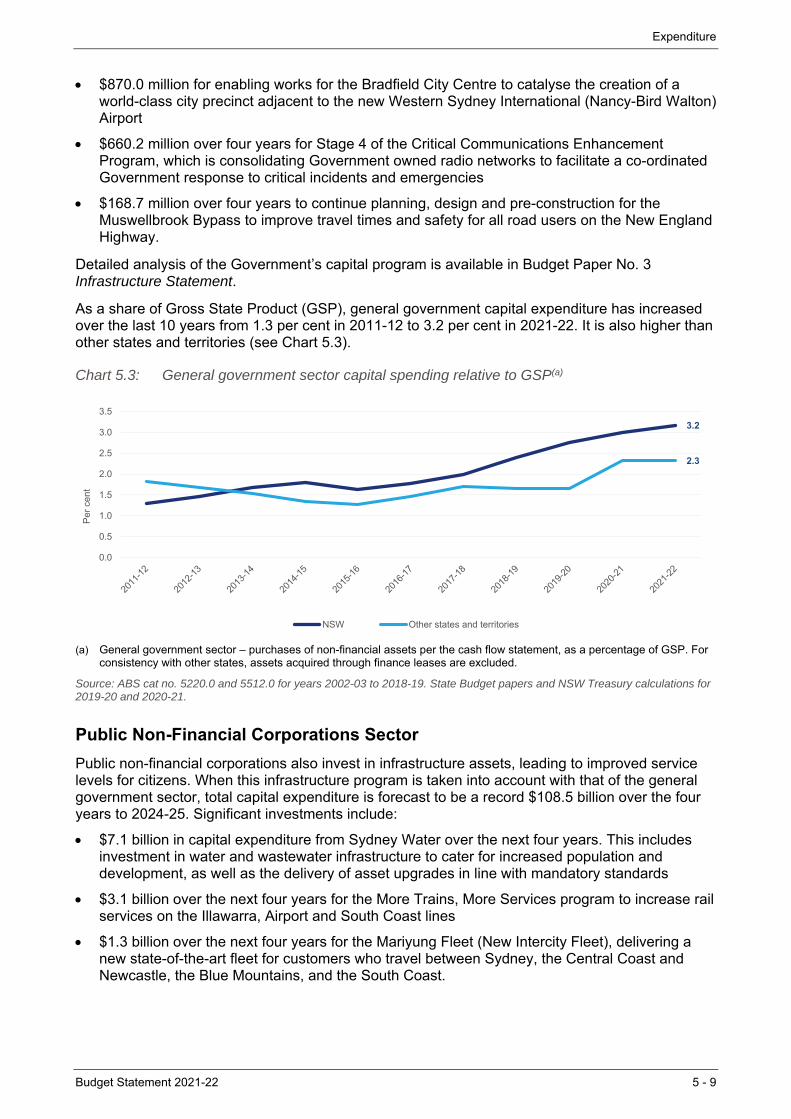
Expenditure
Budget Statement 2021-22 5 - 9
$870.0 million for enabling works for the Bradfield City Centre to catalyse the creation of a world-class city precinct adjacent to the new Western Sydney International (Nancy-Bird Walton) Airport
$660.2 million over four years for Stage 4 of the Critical Communications Enhancement Program, which is consolidating Government owned radio networks to facilitate a co-ordinated Government response to critical incidents and emergencies
$168.7 million over four years to continue planning, design and pre-construction for the Muswellbrook Bypass to improve travel times and safety for all road users on the New England Highway.
Detailed analysis of the Government’s capital program is available in Budget Paper No. 3 Infrastructure Statement.
As a share of Gross State Product (GSP), general government capital expenditure has increased over the last 10 years from 1.3 per cent in 2011-12 to 3.2 per cent in 2021-22. It is also higher than other states and territories (see Chart 5.3).
Chart 5.3: General government sector capital spending relative to GSP(a)
(a) General government sector – purchases of non-financial assets per the cash flow statement, as a percentage of GSP. For consistency with other states, assets acquired through finance leases are excluded.
Source: ABS cat no. 5220.0 and 5512.0 for years 2002-03 to 2018-19. State Budget papers and NSW Treasury calculations for 2019-20 and 2020-21.
Public Non-Financial Corporations Sector
Public non-financial corporations also invest in infrastructure assets, leading to improved service levels for citizens. When this infrastructure program is taken into account with that of the general government sector, total capital expenditure is forecast to be a record $108.5 billion over the four years to 2024-25. Significant investments include:
$7.1 billion in capital expenditure from Sydney Water over the next four years. This includes investment in water and wastewater infrastructure to cater for increased population and development, as well as the delivery of asset upgrades in line with mandatory standards
$3.1 billion over the next four years for the More Trains, More Services program to increase rail services on the Illawarra, Airport and South Coast lines
$1.3 billion over the next four years for the Mariyung Fleet (New Intercity Fleet), delivering a new state-of-the-art fleet for customers who travel between Sydney, the Central Coast and Newcastle, the Blue Mountains, and the South Coast.
3.2
2.3
0.0
0.5
1.0
1.5
2.0
2.5
3.0
3.5
Per
cen
t
NSW Other states and territories
Expenditure
5 - 10 Budget Statement 2021-22
Box 5.3: Continuing record levels of infrastructure investment across the state
The four-year investment program of $108.5 billion is a record for New South Wales. The unprecedented scale of the Government’s infrastructure investment is supporting tens of thousands of jobs each year, including direct and indirect jobs across the wide variety of industries supporting the construction supply chain. This investment will support high-quality services for many years to come.
There is a record investment across the health and education portfolios. The Budget includes $300.0 million for the Rouse Hill Health Service to provide a range of new health services to support the needs of the growing population in the North West of Sydney.
Transport investment continues to focus on efficiency and connectivity across the public transport and road networks, including $2.0 billion allocated over four years for the Great Western Highway Upgrade between Katoomba and Lithgow.
Investment in digital infrastructure is supporting the changing ways communities and businesses connect.
Funding is allocated to improve access to national parks, to make New South Wales a unique destination for domestic and international visitors. The Budget includes $80.4 million over three years for Great Walks: Multi-day Walking Experiences, creating new signature multi-day walking trails including the Great Southern Walk in the Illawarra
Investment will drive a cheaper, cleaner and more reliable energy network. The Government is allocating $164.4 million over four years5 for the Electricity Infrastructure Roadmap.
These projects add to the comprehensive suite of infrastructure coming online, including:
the Pacific Highway upgrade from Woolgoolga to Ballina, which opened to traffic in December 2020
the Wagga Wagga Base Hospital Redevelopment, comprising the Wagga Wagga Base Hospital, a 24-hour emergency department and a custom-built Health Services Hub which commenced its community-based services in March 2021
the iconic Australian Museum is being redeveloped, transforming the space with new public galleries, an exhibition hall and expanded educational facilities, with the final stage due for completion in 2022.
Chart 5.4: General government sector capital expenditure since 2001-02
5 Capital investment component
0
3,000
6,000
9,000
12,000
15,000
18,000
21,000
24,000
27,000
30,000
2001
-02
2002
-03
2003
-04
2004
-05
2005
-06
2006
-07
2007
-08
2008
-09
2009
-10
2010
-11
2011
-12
2012
-13
2013
-14
2014
-15
2015
-16
2016
-17
2017
-18
2018
-19
2019
-20
2020
-21
2021
-22
2022
-23
2023
-24
2024
-25
$ m
illio
ns
Average: $3.3 billion
Average: $4.5 billion
Average: $9.5 billionAverage:
$7.0 billion
Average: $21.4 billionAverage:
$17.5 billion
Budget Statement 2021-22 6 - 1
6. MANAGING THE STATE’S ASSETS AND LIABILITIES
New South Wales is the only Australian state to retain a triple-A credit rating with Moody’s, a position that is supported by the Government’s strong balance sheet management. New South Wales is rated double-A-plus by S&P Global, which is the equal highest of all Australian states.
New South Wales is using its balance sheet to support the State’s record $108.5 billion infrastructure program and deliver targeted short-term stimulus. Active management of interest rate risk is ensuring that the State’s cost of borrowings is kept sustainable.
The State’s investment funds have generated exceptionally strong investment returns in the year to April 2021, with the largest funds returning 15.5 per cent (NSW Generations Fund) and 17.0 per cent (Treasury Managed Fund).
The NSW Generations Fund (NGF) is forecast to grow to more than $90.0 billion by June 2031. This will help maintain the State’s net debt at sustainable levels.
The NSW Government is taking further steps to strengthen the NGF through the introduction of amendments to the NSW Generations Fund Act 2018. These amendments are designed to further protect intergenerational equity and improve the accountability of the Fund (see Box 3.1 in Chapter 3).
Net debt is projected to be $103.9 billion by June 2025 (13.7 per cent of GSP). The projection for net debt at June 2024 has improved by $2.3 billion since the 2020-21 Half-Yearly Review, due to the State’s improved revenue outlook and better-than-expected investment funds performance (including the NGF).
The NSW Government is leading by example in applying Environmental, Social and Governance (ESG) considerations to managing the State’s balance sheet. At $5.2 billion, the NSW Government is the largest semi-government issuer of Green and Sustainability Bonds in Australia.
6.1 A strong balance sheet and further reform
After the recent economic and fiscal challenges (including drought, bushfires, a pandemic and floods) the Government is improving the resilience of the balance sheet and managing financial risk.
The 2021-22 Budget includes a comprehensive suite of balance sheet measures:
strengthening the NGF by locking in future inflows and improving reporting transparency (see Box 3.1 in Chapter 3)
diversifying the State’s investor base through the issuance of new longer-dated bonds, floating rate notes, offshore notes and green and sustainability bonds
establishing the Snowy Hydro Legacy Fund, which will generate additional returns to fund Snowy Hydro Legacy Fund projects
ensuring the sustainable future of coal mining communities through the $300.0 million Royalties for Rejuvenation Fund.
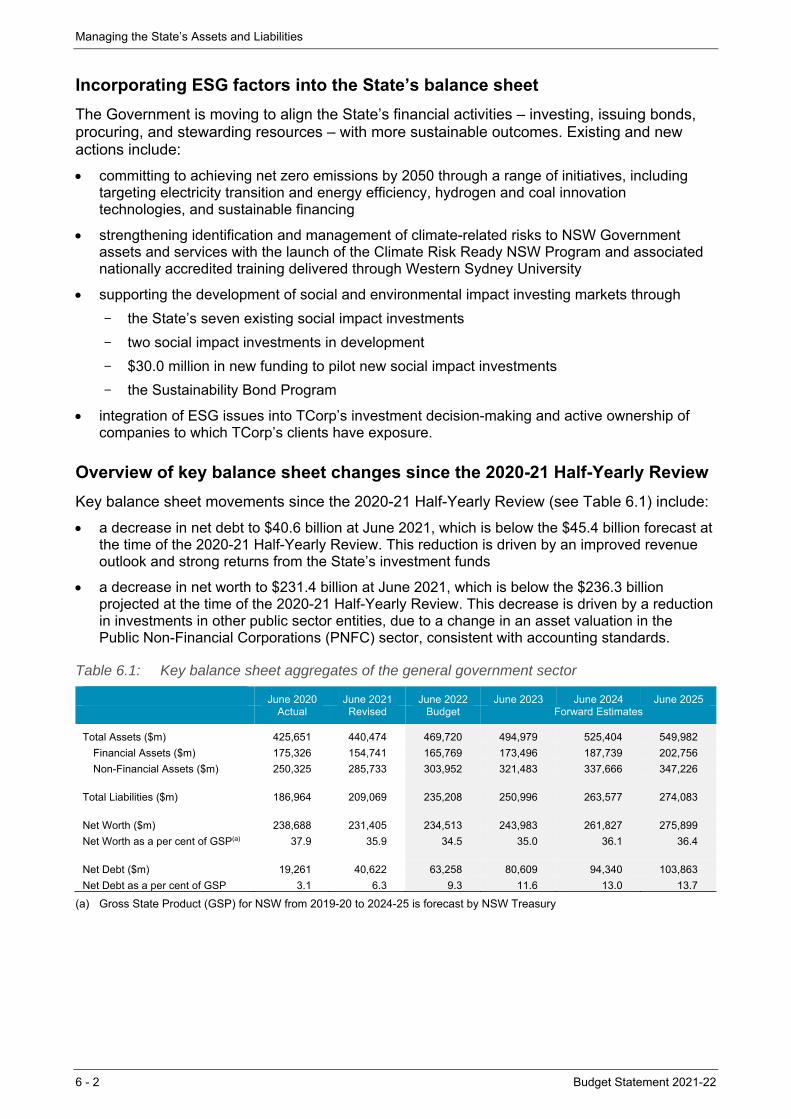
Managing the State’s Assets and Liabilities
6 - 2 Budget Statement 2021-22
Incorporating ESG factors into the State’s balance sheet
The Government is moving to align the State’s financial activities – investing, issuing bonds, procuring, and stewarding resources – with more sustainable outcomes. Existing and new actions include:
committing to achieving net zero emissions by 2050 through a range of initiatives, including targeting electricity transition and energy efficiency, hydrogen and coal innovation technologies, and sustainable financing
strengthening identification and management of climate-related risks to NSW Government assets and services with the launch of the Climate Risk Ready NSW Program and associated nationally accredited training delivered through Western Sydney University
supporting the development of social and environmental impact investing markets through
– the State’s seven existing social impact investments
– two social impact investments in development
– $30.0 million in new funding to pilot new social impact investments
– the Sustainability Bond Program
integration of ESG issues into TCorp’s investment decision-making and active ownership of companies to which TCorp’s clients have exposure.
Overview of key balance sheet changes since the 2020-21 Half-Yearly Review
Key balance sheet movements since the 2020-21 Half-Yearly Review (see Table 6.1) include:
a decrease in net debt to $40.6 billion at June 2021, which is below the $45.4 billion forecast at the time of the 2020-21 Half-Yearly Review. This reduction is driven by an improved revenue outlook and strong returns from the State’s investment funds
a decrease in net worth to $231.4 billion at June 2021, which is below the $236.3 billion projected at the time of the 2020-21 Half-Yearly Review. This decrease is driven by a reduction in investments in other public sector entities, due to a change in an asset valuation in the Public Non-Financial Corporations (PNFC) sector, consistent with accounting standards.
Table 6.1: Key balance sheet aggregates of the general government sector
June 2020 June 2021 June 2022 June 2023 June 2024 June 2025
Actual Revised Budget Forward Estimates
Total Assets ($m) 425,651 440,474 469,720 494,979 525,404 549,982
Financial Assets ($m) 175,326 154,741 165,769 173,496 187,739 202,756
Non-Financial Assets ($m) 250,325 285,733 303,952 321,483 337,666 347,226 Total Liabilities ($m) 186,964 209,069 235,208 250,996 263,577 274,083 Net Worth ($m) 238,688 231,405 234,513 243,983 261,827 275,899
Net Worth as a per cent of GSP(a) 37.9 35.9 34.5 35.0 36.1 36.4 Net Debt ($m) 19,261 40,622 63,258 80,609 94,340 103,863
Net Debt as a per cent of GSP 3.1 6.3 9.3 11.6 13.0 13.7
(a) Gross State Product (GSP) for NSW from 2019-20 to 2024-25 is forecast by NSW Treasury
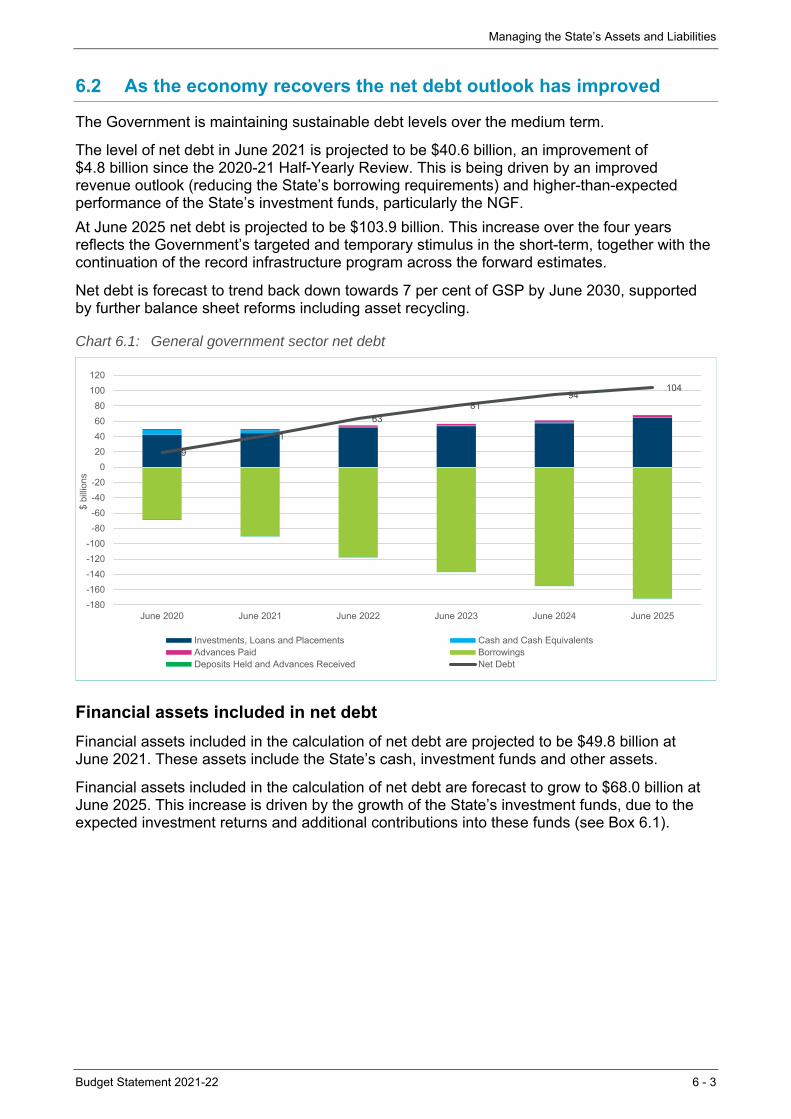
Managing the State’s Assets and Liabilities
Budget Statement 2021-22 6 - 3
6.2 As the economy recovers the net debt outlook has improved
The Government is maintaining sustainable debt levels over the medium term.
The level of net debt in June 2021 is projected to be $40.6 billion, an improvement of $4.8 billion since the 2020-21 Half-Yearly Review. This is being driven by an improved revenue outlook (reducing the State’s borrowing requirements) and higher-than-expected performance of the State’s investment funds, particularly the NGF.
At June 2025 net debt is projected to be $103.9 billion. This increase over the four years reflects the Government’s targeted and temporary stimulus in the short-term, together with the continuation of the record infrastructure program across the forward estimates.
Net debt is forecast to trend back down towards 7 per cent of GSP by June 2030, supported by further balance sheet reforms including asset recycling.
Chart 6.1: General government sector net debt
Financial assets included in net debt
Financial assets included in the calculation of net debt are projected to be $49.8 billion at June 2021. These assets include the State’s cash, investment funds and other assets.
Financial assets included in the calculation of net debt are forecast to grow to $68.0 billion at June 2025. This increase is driven by the growth of the State’s investment funds, due to the expected investment returns and additional contributions into these funds (see Box 6.1).
19
41
63
81 94
104
-180
-160
-140
-120
-100
-80
-60
-40
-20
0
20
40
60
80
100
120
June 2020 June 2021 June 2022 June 2023 June 2024 June 2025
$ bi
llion
s
Investments, Loans and Placements Cash and Cash EquivalentsAdvances Paid BorrowingsDeposits Held and Advances Received Net Debt
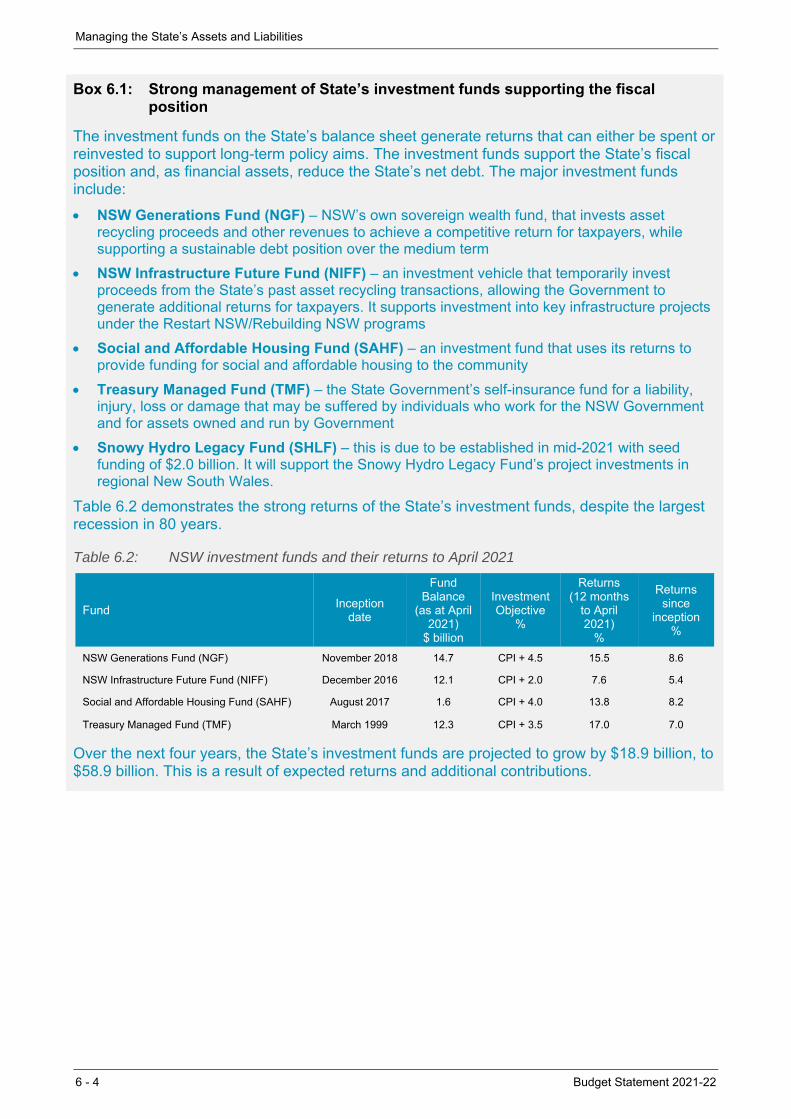
Managing the State’s Assets and Liabilities
6 - 4 Budget Statement 2021-22
Box 6.1: Strong management of State’s investment funds supporting the fiscal position
The investment funds on the State’s balance sheet generate returns that can either be spent or reinvested to support long-term policy aims. The investment funds support the State’s fiscal position and, as financial assets, reduce the State’s net debt. The major investment funds include:
NSW Generations Fund (NGF) – NSW’s own sovereign wealth fund, that invests asset recycling proceeds and other revenues to achieve a competitive return for taxpayers, while supporting a sustainable debt position over the medium term
NSW Infrastructure Future Fund (NIFF) – an investment vehicle that temporarily invest proceeds from the State’s past asset recycling transactions, allowing the Government to generate additional returns for taxpayers. It supports investment into key infrastructure projects under the Restart NSW/Rebuilding NSW programs
Social and Affordable Housing Fund (SAHF) – an investment fund that uses its returns to provide funding for social and affordable housing to the community
Treasury Managed Fund (TMF) – the State Government’s self-insurance fund for a liability, injury, loss or damage that may be suffered by individuals who work for the NSW Government and for assets owned and run by Government
Snowy Hydro Legacy Fund (SHLF) – this is due to be established in mid-2021 with seed funding of $2.0 billion. It will support the Snowy Hydro Legacy Fund’s project investments in regional New South Wales.
Table 6.2 demonstrates the strong returns of the State’s investment funds, despite the largest recession in 80 years.
Table 6.2: NSW investment funds and their returns to April 2021
Fund Inception
date
Fund Balance
(as at April 2021)
$ billion
Investment Objective
%
Returns (12 months
to April 2021)
%
Returns since
inception %
NSW Generations Fund (NGF) November 2018 14.7 CPI + 4.5 15.5 8.6
NSW Infrastructure Future Fund (NIFF) December 2016 12.1 CPI + 2.0 7.6 5.4
Social and Affordable Housing Fund (SAHF) August 2017 1.6 CPI + 4.0 13.8 8.2
Treasury Managed Fund (TMF) March 1999 12.3 CPI + 3.5 17.0 7.0
Over the next four years, the State’s investment funds are projected to grow by $18.9 billion, to $58.9 billion. This is a result of expected returns and additional contributions.
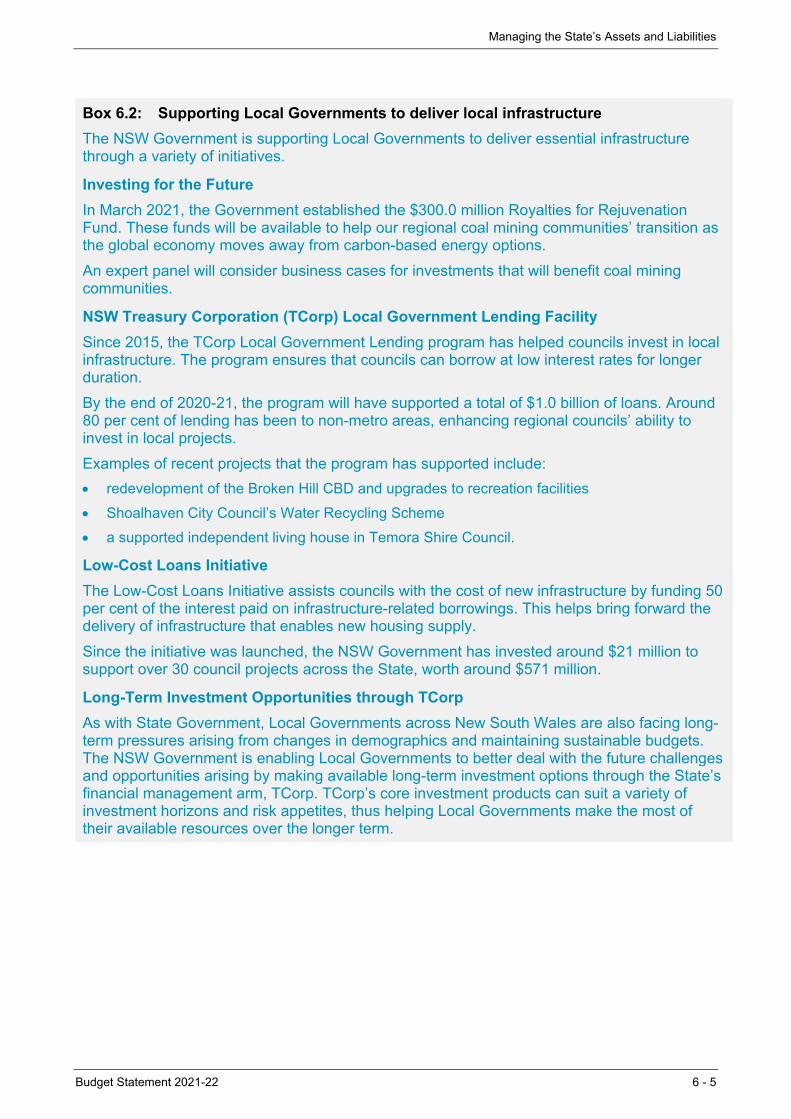
Managing the State’s Assets and Liabilities
Budget Statement 2021-22 6 - 5
Box 6.2: Supporting Local Governments to deliver local infrastructure
The NSW Government is supporting Local Governments to deliver essential infrastructure through a variety of initiatives.
Investing for the Future
In March 2021, the Government established the $300.0 million Royalties for Rejuvenation Fund. These funds will be available to help our regional coal mining communities’ transition as the global economy moves away from carbon-based energy options.
An expert panel will consider business cases for investments that will benefit coal mining communities.
NSW Treasury Corporation (TCorp) Local Government Lending Facility
Since 2015, the TCorp Local Government Lending program has helped councils invest in local infrastructure. The program ensures that councils can borrow at low interest rates for longer duration.
By the end of 2020-21, the program will have supported a total of $1.0 billion of loans. Around 80 per cent of lending has been to non-metro areas, enhancing regional councils’ ability to invest in local projects.
Examples of recent projects that the program has supported include:
redevelopment of the Broken Hill CBD and upgrades to recreation facilities
Shoalhaven City Council’s Water Recycling Scheme
a supported independent living house in Temora Shire Council.
Low-Cost Loans Initiative
The Low-Cost Loans Initiative assists councils with the cost of new infrastructure by funding 50 per cent of the interest paid on infrastructure-related borrowings. This helps bring forward the delivery of infrastructure that enables new housing supply.
Since the initiative was launched, the NSW Government has invested around $21 million to support over 30 council projects across the State, worth around $571 million.
Long-Term Investment Opportunities through TCorp
As with State Government, Local Governments across New South Wales are also facing long-term pressures arising from changes in demographics and maintaining sustainable budgets. The NSW Government is enabling Local Governments to better deal with the future challenges and opportunities arising by making available long-term investment options through the State’s financial management arm, TCorp. TCorp’s core investment products can suit a variety of investment horizons and risk appetites, thus helping Local Governments make the most of their available resources over the longer term.

Managing the State’s Assets and Liabilities
6 - 6 Budget Statement 2021-22
Box 6.3: Interest rate affordability and refinancing risk
In the first quarter of 2021 global and Australian bond yields have risen from near historic lows. TCorp 10-year bond yields have followed this broader trend, rising from around 1.0 per cent in November 2020 (a record low) to above 1.8 per cent at June 2021. The movement in bond yields has been primarily due to investor expectations of a stronger economic recovery, lower unemployment and a rise in inflation.
The NSW Government’s interest expense as a percentage of revenue is estimated to be an average of 3.2 per cent over the four years to 2023-24, which is slightly above the 3.1 per cent projected at the 2020-21 Half-Yearly Review (see Chart 6.2). Even with the increase in yields, the Government’s cost of borrowing remains manageable.
Chart 6.2: Net debt and interest expense as a percentage of revenues
Chart 6.3: Average yields have fallen as the average weighted life of debt has increased
Debt issued since 1 January 2020
The NSW Government is managing both interest rate risk and refinancing risk by issuing longer tenor debt that locks in low rates for an extended period. Since 1 January 2020 the NSW Government has borrowed $33.0 billion at an average rate of 1.48 per cent. The weighted average life of these new borrowings is 11.3 years. A component of that debt has been issued with a maturity of 30 years.
The Government’s borrowing portfolio
The average yield across the entire $72.9 billion general government borrowing portfolio is 2.4 per cent, a record low. The weighted average life (the period for which that record low weighted average yield is locked in) has also been extended over the past decade to nearly 8.4 years (see Chart 6.3).This means the Government has locked in a lower average interest rate for a longer period, ensuring interest costs are kept as low as possible.
Financial liabilities included in net debt
The liabilities included in the calculation of net debt are projected to be $90.4 billion at June 2021 and $171.8 billion at June 20251. This position reflects the Government’s approach of borrowing during the low interest rate environment to support the economy and invest in infrastructure.
1 These liabilities include advances received, borrowings and deposits held.
0.0%
0.5%
1.0%
1.5%
2.0%
2.5%
3.0%
3.5%
4.0%
4.5%
5.0%
(20)
-
20
40
60
80
100
120p
er
cen
t
$ b
illio
ns
Net Debt (LHS) Interest Expense / Revenue (RHS)
0.0%
2.0%
4.0%
6.0%
5
5.5
6
6.5
7
7.5
8
8.5
9
Jan
13
Jul-1
3Ja
n-14
Jul-1
4Ja
n-15
Jul-1
5Ja
n-16
Jul-1
6Ja
n-17
Jul-1
7Ja
n-18
Jul-1
8Ja
n-19
Jul-1
9Ja
n-20
Jul-2
0Ja
n-21
Ma
y-2
1
Yie
ld
Ye
ars
Weighted Average Life (WAL), LHS
Weighted Average Yield (WAY), RHS
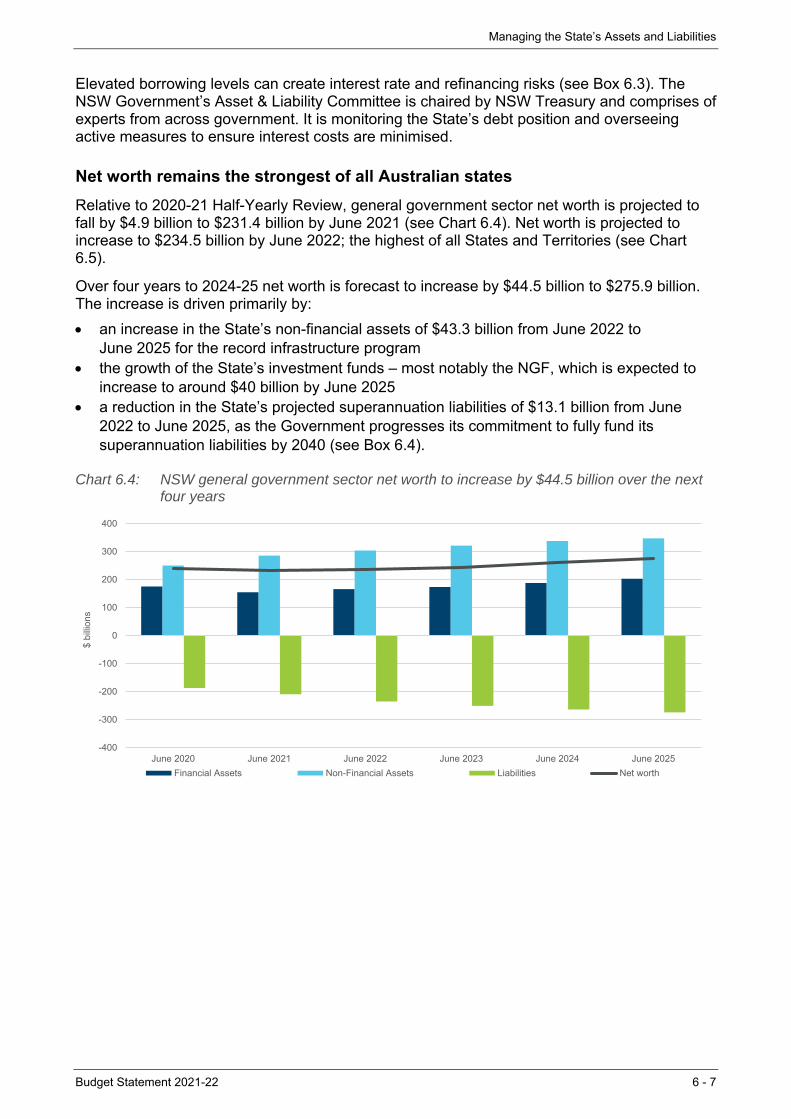
Managing the State’s Assets and Liabilities
Budget Statement 2021-22 6 - 7
Elevated borrowing levels can create interest rate and refinancing risks (see Box 6.3). The NSW Government’s Asset & Liability Committee is chaired by NSW Treasury and comprises of experts from across government. It is monitoring the State’s debt position and overseeing active measures to ensure interest costs are minimised.
Net worth remains the strongest of all Australian states
Relative to 2020-21 Half-Yearly Review, general government sector net worth is projected to fall by $4.9 billion to $231.4 billion by June 2021 (see Chart 6.4). Net worth is projected to increase to $234.5 billion by June 2022; the highest of all States and Territories (see Chart 6.5).
Over four years to 2024-25 net worth is forecast to increase by $44.5 billion to $275.9 billion. The increase is driven primarily by:
an increase in the State’s non-financial assets of $43.3 billion from June 2022 to June 2025 for the record infrastructure program
the growth of the State’s investment funds – most notably the NGF, which is expected to increase to around $40 billion by June 2025
a reduction in the State’s projected superannuation liabilities of $13.1 billion from June 2022 to June 2025, as the Government progresses its commitment to fully fund its superannuation liabilities by 2040 (see Box 6.4).
Chart 6.4: NSW general government sector net worth to increase by $44.5 billion over the next four years
-400
-300
-200
-100
0
100
200
300
400
June 2020 June 2021 June 2022 June 2023 June 2024 June 2025
$ bi
llion
s
Financial Assets Non-Financial Assets Liabilities Net worth

Managing the State’s Assets and Liabilities
6 - 8 Budget Statement 2021-22
Chart 6.5: General government sector net worth of Australian States and Territories at June 2022(a)
(a) Net worth for SA, TAS and ACT as per their 2020-21 Budget. WA as per their 2020-21 Half-Yearly Review.
Financial assets included in net worth
The State’s total financial assets are projected to decline to $154.7 billion at June 2021 driven by a decrease in investments in other public sector entities, due to a change in an asset valuation in the PNFC sector, consistent with accounting standards.
Financial assets are forecast to reach $202.8 billion by June 2025 due to the growth in the NGF, the forecast performance of the State’s other investment funds, and the increase in the PNFC sector assets (see Chart 6.6).
Chart 6.6: General government sector financial assets increasing over time
Non-financial assets included in net worth
The State’s non-financial assets are projected to reach $285.7 billion by June 2021 (a $0.2 billion increase relative to the 2020-21 Half-Yearly Review) and $347.2 billion by June 2025 (see Chart 6.7). This expected increase to June 2025 is primarily due to:
the Government’s investment in productive infrastructure systems (e.g. public transport infrastructure) – projected to increase from $158.9 billion at June 2021 to $207.6 billion by June 2025
0
50
100
150
200
250
NSW VIC QLD SA WA TAS ACT NT
$ bi
llion
s
0
20
40
60
80
100
120
140
160
180
200
June 2020 June 2021 June 2022 June 2023 June 2024 June 2025
$ bi
llion
s
Equity Investments Financial Assets at Fair Value Receivables Cash and Cash Equivalents Other Financial Assets
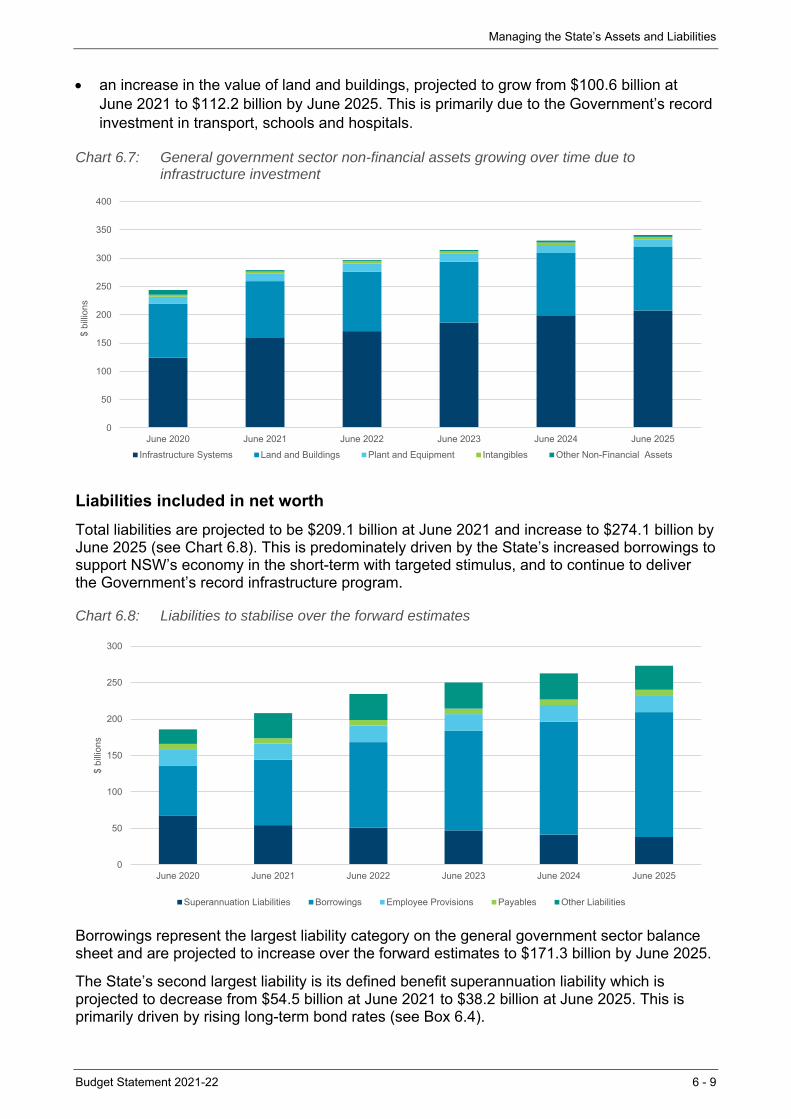
Managing the State’s Assets and Liabilities
Budget Statement 2021-22 6 - 9
an increase in the value of land and buildings, projected to grow from $100.6 billion at June 2021 to $112.2 billion by June 2025. This is primarily due to the Government’s record investment in transport, schools and hospitals.
Chart 6.7: General government sector non-financial assets growing over time due to infrastructure investment
Liabilities included in net worth
Total liabilities are projected to be $209.1 billion at June 2021 and increase to $274.1 billion by June 2025 (see Chart 6.8). This is predominately driven by the State’s increased borrowings to support NSW’s economy in the short-term with targeted stimulus, and to continue to deliver the Government’s record infrastructure program.
Chart 6.8: Liabilities to stabilise over the forward estimates
Borrowings represent the largest liability category on the general government sector balance sheet and are projected to increase over the forward estimates to $171.3 billion by June 2025.
The State’s second largest liability is its defined benefit superannuation liability which is projected to decrease from $54.5 billion at June 2021 to $38.2 billion at June 2025. This is primarily driven by rising long-term bond rates (see Box 6.4).
0
50
100
150
200
250
300
350
400
June 2020 June 2021 June 2022 June 2023 June 2024 June 2025
$ bi
llion
s
Infrastructure Systems Land and Buildings Plant and Equipment Intangibles Other Non-Financial Assets
0
50
100
150
200
250
300
June 2020 June 2021 June 2022 June 2023 June 2024 June 2025
$ bi
llion
s
Superannuation Liabilities Borrowings Employee Provisions Payables Other Liabilities
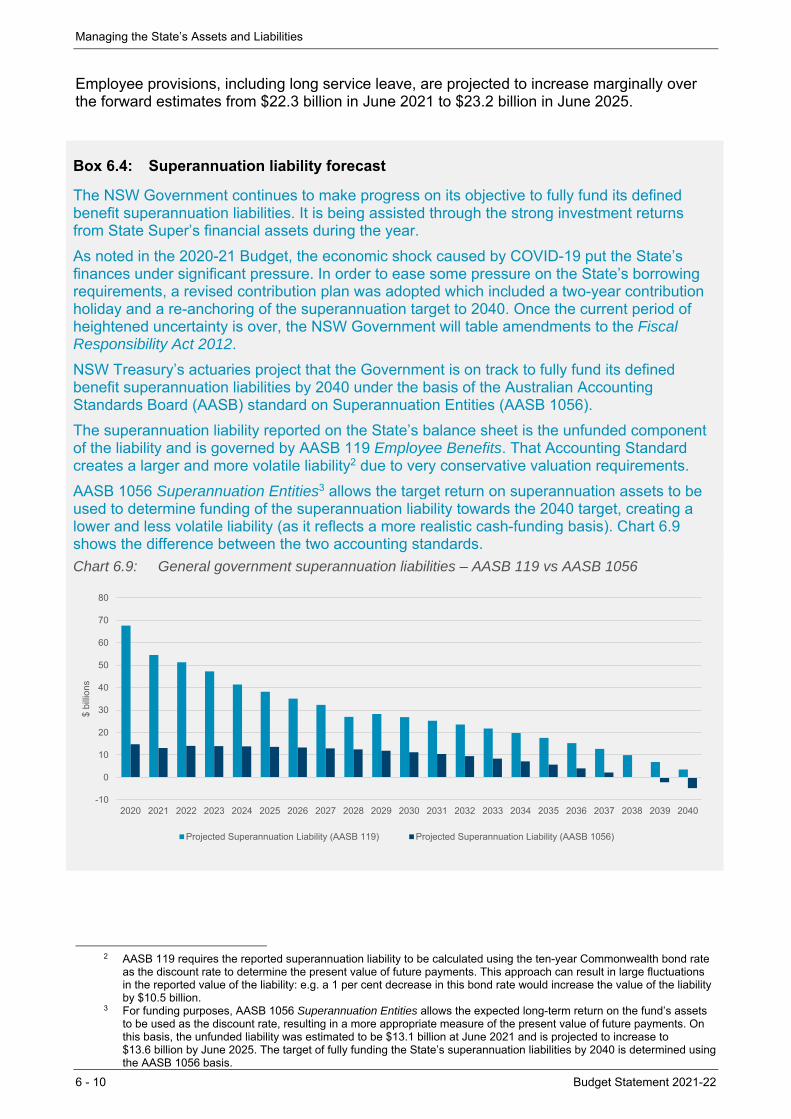
Managing the State’s Assets and Liabilities
6 - 10 Budget Statement 2021-22
Employee provisions, including long service leave, are projected to increase marginally over the forward estimates from $22.3 billion in June 2021 to $23.2 billion in June 2025.
Box 6.4: Superannuation liability forecast
The NSW Government continues to make progress on its objective to fully fund its defined benefit superannuation liabilities. It is being assisted through the strong investment returns from State Super’s financial assets during the year.
As noted in the 2020-21 Budget, the economic shock caused by COVID-19 put the State’s finances under significant pressure. In order to ease some pressure on the State’s borrowing requirements, a revised contribution plan was adopted which included a two-year contribution holiday and a re-anchoring of the superannuation target to 2040. Once the current period of heightened uncertainty is over, the NSW Government will table amendments to the Fiscal Responsibility Act 2012.
NSW Treasury’s actuaries project that the Government is on track to fully fund its defined benefit superannuation liabilities by 2040 under the basis of the Australian Accounting Standards Board (AASB) standard on Superannuation Entities (AASB 1056).
The superannuation liability reported on the State’s balance sheet is the unfunded component of the liability and is governed by AASB 119 Employee Benefits. That Accounting Standard creates a larger and more volatile liability2 due to very conservative valuation requirements.
AASB 1056 Superannuation Entities3 allows the target return on superannuation assets to be used to determine funding of the superannuation liability towards the 2040 target, creating a lower and less volatile liability (as it reflects a more realistic cash-funding basis). Chart 6.9 shows the difference between the two accounting standards.
Chart 6.9: General government superannuation liabilities – AASB 119 vs AASB 1056
2 AASB 119 requires the reported superannuation liability to be calculated using the ten-year Commonwealth bond rate
as the discount rate to determine the present value of future payments. This approach can result in large fluctuations in the reported value of the liability: e.g. a 1 per cent decrease in this bond rate would increase the value of the liability by $10.5 billion.
3 For funding purposes, AASB 1056 Superannuation Entities allows the expected long-term return on the fund’s assets to be used as the discount rate, resulting in a more appropriate measure of the present value of future payments. On this basis, the unfunded liability was estimated to be $13.1 billion at June 2021 and is projected to increase to $13.6 billion by June 2025. The target of fully funding the State’s superannuation liabilities by 2040 is determined using the AASB 1056 basis.
-10
0
10
20
30
40
50
60
70
80
2020 2021 2022 2023 2024 2025 2026 2027 2028 2029 2030 2031 2032 2033 2034 2035 2036 2037 2038 2039 2040
$ bi
llion
s
Projected Superannuation Liability (AASB 119) Projected Superannuation Liability (AASB 1056)
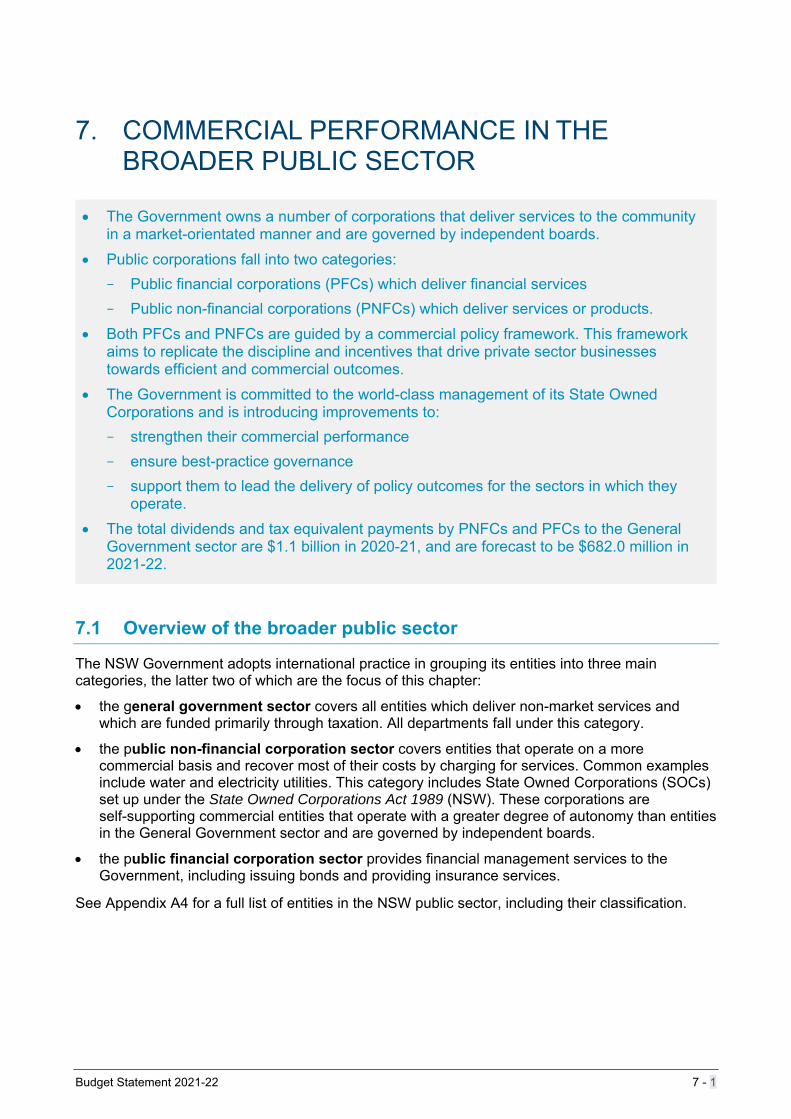
Budget Statement 2021-22 7 - 1
7. COMMERCIAL PERFORMANCE IN THE BROADER PUBLIC SECTOR
The Government owns a number of corporations that deliver services to the community in a market-orientated manner and are governed by independent boards.
Public corporations fall into two categories:
– Public financial corporations (PFCs) which deliver financial services
– Public non-financial corporations (PNFCs) which deliver services or products.
Both PFCs and PNFCs are guided by a commercial policy framework. This framework aims to replicate the discipline and incentives that drive private sector businesses towards efficient and commercial outcomes.
The Government is committed to the world-class management of its State Owned Corporations and is introducing improvements to:
– strengthen their commercial performance
– ensure best-practice governance
– support them to lead the delivery of policy outcomes for the sectors in which they operate.
The total dividends and tax equivalent payments by PNFCs and PFCs to the General Government sector are $1.1 billion in 2020-21, and are forecast to be $682.0 million in 2021-22.
7.1 Overview of the broader public sector
The NSW Government adopts international practice in grouping its entities into three main categories, the latter two of which are the focus of this chapter:
the general government sector covers all entities which deliver non-market services and which are funded primarily through taxation. All departments fall under this category.
the public non-financial corporation sector covers entities that operate on a more commercial basis and recover most of their costs by charging for services. Common examples include water and electricity utilities. This category includes State Owned Corporations (SOCs) set up under the State Owned Corporations Act 1989 (NSW). These corporations are self-supporting commercial entities that operate with a greater degree of autonomy than entities in the General Government sector and are governed by independent boards.
the public financial corporation sector provides financial management services to the Government, including issuing bonds and providing insurance services.
See Appendix A4 for a full list of entities in the NSW public sector, including their classification.
Commercial Performance in the Broader Public Sector
7 - 2 Budget Statement 2021-22
Figure 7.1: The public sector and its commercial operations
Delivering world-class performance from NSW State Owned Corporations
Following the economic shocks of the bushfires and COVID-19 in 2020, the role played by Government businesses in providing efficient and effective services has never been more important. To this end, the Government is committed to strengthening the commercial performance and policy outcomes delivered by the State’s eight SOCs.
Optimising the capital structure of the SOCs to better align with industry best practice will provide these businesses with an opportunity to strengthen commercial performance and incentivise their efficient allocation of resources. This will deliver stronger returns on investment and ultimately place downward pressure on the businesses’ prices.
The Government also recognises the important role played by independent boards in driving the performance of the SOCs and supporting these businesses to deliver essential services for the people of New South Wales. The NSW Government is updating its governance policies for SOCs to better reflect outcomes from the Financial Services Royal Commission and the latest edition of the ASX Corporate Governance Principles and Recommendations.
The NSW Government is also developing Statements of Expectations to clearly communicate the service delivery and policy outcomes it is seeking from the SOCs. The Statement of Expectations will help to better align SOCs with government policy, while maintaining their independence over operational and commercial decisions.
These initiatives will ensure that the SOCs continue to deliver world-class essential services, infrastructure and commercial outcomes for New South Wales.
Commercial Performance in the Broader Public Sector
Budget Statement 2021-22 7 - 3
7.2 Reforms and initiatives of government businesses
Water
Sydney Water, WaterNSW and Hunter Water supply water to metropolitan and regional areas, respond to the impact of drought and promote sustainable water management. Sydney Water and Hunter Water are also responsible for wastewater management.
The State-owned water utilities continue their focus on water conservation in partnership with the community. Demand for water has reduced across Greater Sydney stemming from Sydney Water’s WaterWise water saving measures, and in the Lower Hunter as a result of Hunter Water’s ongoing engagement with the community. The National performance report 2019-20: urban water utilities confirmed that Lower Hunter household water consumption fell by 11 per cent for the year, which is equivalent to 2,000 Olympic-size swimming pools and was the largest reduction by any major Australian water utility.
The Government is working with the State-owned water utilities to develop coordinated approaches to the State’s water planning. The Department of Planning, Industry and Environment is working with Sydney Water and WaterNSW to develop the Greater Sydney Water Strategy and Hunter Water to develop the Lower Hunter Water Security Plan. These strategies outline future investments and ways of operating to ensure a resilient, adaptable and sustainable water supply now and for the longer term. Hunter Water is also leading the development of a Hunter River Estuary Wastewater Masterplan to understand factors impacting the health of the Hunter River. This includes developing a strategy for the upgrade of wastewater treatment plants that release treated wastewater into the Hunter River.
Innovation and digitisation form key parts of the State-owned water utilities’ strategies. In November 2020, Hunter Water delivered its billing system, Velocity, which acts as a single system for billing all its customers, including trade waste customers and liquid waste carriers. Velocity will also be used as a platform to enhance customer experience more broadly, offering digital services like e-billing, self-service and online complaints lodgement.
Similarly, WaterNSW continues to develop its online water information hub, the Water Insights portal. The portal uses the latest technology to bring transparency to water management information, including river flows, dam storages, water availability, weather outlooks and more.
Renewable energy remains a focus of Sydney Water and Hunter Water. Initiatives include solar power generation, organic waste-to-energy schemes and generating renewable energy from biosolids at wastewater treatment plants.
WaterNSW continues to support Water Infrastructure NSW, the lead agency in the delivery of new water infrastructure projects, to progress several major projects for long-term water security. These include planning and business cases for:
water security measures in the Lachlan Valley, Peel Valley and Border Rivers regions
options for mitigating flood risk in the Hawkesbury-Nepean Valley
re-regulating structures and fishways along the Barwon-Darling river system and Macquarie River
a pipeline between Lake Rowlands to Carcoar Dam.
Commercial Performance in the Broader Public Sector
7 - 4 Budget Statement 2021-22
Energy
Essential Energy operates and maintains one of Australia's largest electricity networks, covering 95 per cent of New South Wales. The business services more than 865,000 customers, including homes, hospitals, schools, businesses and community services, and is an economic enabler for regional, rural and remote communities.
Essential Energy is focused on continuing to drive network charges down, while delivering safe and reliable electricity to customers. In real terms, network charges for a typical residential customer have decreased by 40 per cent since their peak in 2012-13 and by 43 per cent for a typical business customer. By 2023-24, these charges are forecast to fall by a further 4 per cent for residential customers and 6 per cent for business customers. The fall in prices has not compromised reliability of supply, however, with a 20 per cent improvement compared to 15 years ago.
Essential Energy is investing in the development of new capabilities with an expanded apprenticeship program. Over 2019-20 and 2020-21, 58 apprentices and 26 trainees were recruited across various disciplines, including electrical technicians, asset inspections and other field operations. In 2021 the inaugural Aboriginal and Torres Strait Islander trainees will complete their apprenticeship and become trade qualified. In 2022 an additional 43 trainees and apprentices will commence with the organisation.
State-owned utilities helping New South Wales to recover
The State-owned water utilities have continued to deliver essential services amid COVID-19 and the recent floods, in addition to supporting the Government’s response to these challenges.
In March 2021, extreme rain across metropolitan Sydney generated a major spill event at Warragamba Dam and other Sydney metropolitan dams. WaterNSW successfully discharged its functions during the event in line with strict operating protocols and worked closely with the State Emergency Service and the Bureau of Meteorology to monitor weather and dam inflows. WaterNSW also worked closely with Sydney Water and NSW Health throughout the rain event to manage water quality impacts on untreated supply.
Essential Energy assisted emergency response agencies with drones and helicopters to scope network flood damage and support network repair in inaccessible areas. They also deployed over 30 small generators to assist residential customers while their power was restored and provided over 5,000 litres of fuel for rescue efforts.
On the back of the Government’s COVID-19 stimulus initiatives and the State-owned utilities’ support of customers experiencing hardship amidst the pandemic, the COVID-19 response effort continues in various forms. Sydney Water is implementing a routine wastewater testing program for COVID-19. This program provides surveillance data to NSW Health and is an important part of managing the pandemic and understanding the prevalence of the COVID-19 virus in the community. Sydney Water, NSW Health and Water Research Australia were recently recognised by the NSW Water Industry for this work.
Commercial Performance in the Broader Public Sector
Budget Statement 2021-22 7 - 5
Transport
On 1 July 2020, Rail Corporation NSW (RailCorp) was renamed Transport Asset Holding Entity of NSW (TAHE) and converted to a statutory SOC. TAHE has a majority independent board, which also includes the Secretary of Transport for NSW.
TAHE owns heavy-rail property assets, rolling stock and rail infrastructure across the Sydney metropolitan area, the country rail network and other regional locations. In implementing its operating model, TAHE will enter into agreements with Transport for NSW agencies covering rail access, project delivery and licensing for non-regulated assets.
Ports
The Port Authority of NSW (Port Authority) is responsible for commercial marine functions in the ports of Sydney Harbour, Port Botany, Newcastle Harbour, Port Kembla, Port of Eden and Port of Yamba. Port Authority also has responsibility for the management of business activities and related assets in Sydney Harbour. These include cruise activities at the Overseas Passenger Terminal and White Bay Cruise Terminal, as well as management of the dry bulk facilities at Glebe Island.
Despite the impact of COVID-19, Port Authority continues to deliver its services. As part of its pandemic response, Port Authority accelerated its capital program to support service delivery, whilst generating jobs and economic stimulus. These projects include:
refurbishment of Newcastle’s Macquarie Pier (completed and reopened to the public in December 2020)
construction of the Eden Welcome Centre to support regional cruises and development (completed in April 2021)
ongoing construction of the Multi-User Facility on Glebe Island, following a pause for design improvements in 2020.
Property
Landcom is the Government’s land and property development organisation which aims to increase the supply of housing. Landcom’s role includes unlocking surplus or underutilised Government-owned sites, or large institutional land holdings, to create vibrant urban spaces.
The Government is committed to ensuring an adequate supply of new dwellings that are affordable, diverse and sustainable. To achieve this, Landcom will invest $2 billion in the development and delivery of new housing over the four years to 2024-25, including delivering 14,755 dwellings to the market.
Landcom purchased an 872 hectare site at North Wilton in December 2020. The project is expected to yield 5,600 dwellings and offer a variety of housing products at several price points. Early infrastructure works are set to commence in 2021-22, with the project expected to deliver environmental conservation land, sports recreation space and a new primary school to the area, amongst other community features.
Forestry
Forestry Corporation of NSW (Forestry Corporation) manages over 2 million hectares of State forests, including the State’s largest renewable timber production and plantation estate.
Forestry Corporation undertook salvage harvesting of the softwood plantations following the 2019-20 bushfires, with over 4 million tonnes of fire-affected timber recovered and delivered to local timber mills for processing. Production ran at twice the normal level over the last year with salvage operations boosting local employment in timber regions such as Tumut and Bombala.
The NSW Government provided a $46.0 million equity injection to Forestry Corporation last year to accelerate bushfire recovery efforts. This has been utilised to repair fire-damaged infrastructure, replant fire affected plantations and expand the seedling nurseries, with 14 million seedlings to be planted in 2021.
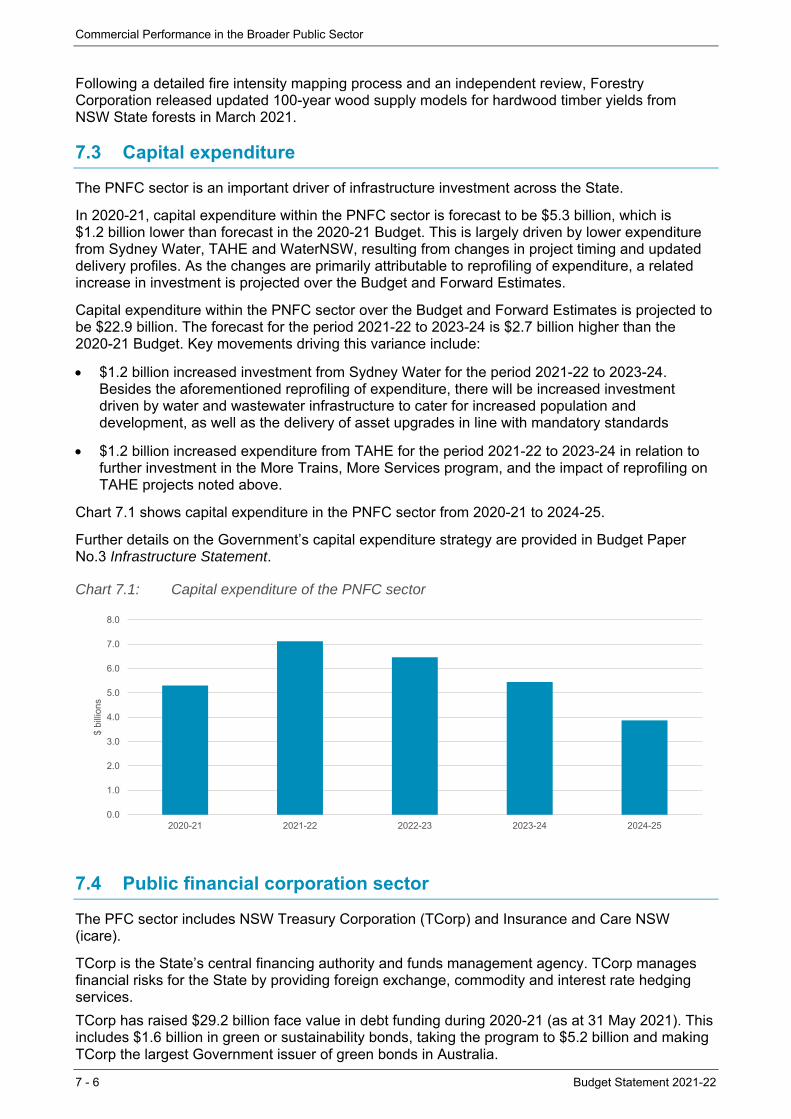
Commercial Performance in the Broader Public Sector
7 - 6 Budget Statement 2021-22
Following a detailed fire intensity mapping process and an independent review, Forestry Corporation released updated 100-year wood supply models for hardwood timber yields from NSW State forests in March 2021.
7.3 Capital expenditure
The PNFC sector is an important driver of infrastructure investment across the State.
In 2020-21, capital expenditure within the PNFC sector is forecast to be $5.3 billion, which is $1.2 billion lower than forecast in the 2020-21 Budget. This is largely driven by lower expenditure from Sydney Water, TAHE and WaterNSW, resulting from changes in project timing and updated delivery profiles. As the changes are primarily attributable to reprofiling of expenditure, a related increase in investment is projected over the Budget and Forward Estimates.
Capital expenditure within the PNFC sector over the Budget and Forward Estimates is projected to be $22.9 billion. The forecast for the period 2021-22 to 2023-24 is $2.7 billion higher than the 2020-21 Budget. Key movements driving this variance include:
$1.2 billion increased investment from Sydney Water for the period 2021-22 to 2023-24. Besides the aforementioned reprofiling of expenditure, there will be increased investment driven by water and wastewater infrastructure to cater for increased population and development, as well as the delivery of asset upgrades in line with mandatory standards
$1.2 billion increased expenditure from TAHE for the period 2021-22 to 2023-24 in relation to further investment in the More Trains, More Services program, and the impact of reprofiling on TAHE projects noted above.
Chart 7.1 shows capital expenditure in the PNFC sector from 2020-21 to 2024-25.
Further details on the Government’s capital expenditure strategy are provided in Budget Paper No.3 Infrastructure Statement.
Chart 7.1: Capital expenditure of the PNFC sector
7.4 Public financial corporation sector
The PFC sector includes NSW Treasury Corporation (TCorp) and Insurance and Care NSW (icare).
TCorp is the State’s central financing authority and funds management agency. TCorp manages financial risks for the State by providing foreign exchange, commodity and interest rate hedging services.
TCorp has raised $29.2 billion face value in debt funding during 2020-21 (as at 31 May 2021). This includes $1.6 billion in green or sustainability bonds, taking the program to $5.2 billion and making TCorp the largest Government issuer of green bonds in Australia.
0.0
1.0
2.0
3.0
4.0
5.0
6.0
7.0
8.0
2020-21 2021-22 2022-23 2023-24 2024-25
$ bi
llion
s
Commercial Performance in the Broader Public Sector
Budget Statement 2021-22 7 - 7
TCorp’s total funds under management increased by $5.7 billion to $108.6 billion over the year to 31 May 2021, making it one of Australia’s largest fund managers. This change primarily reflects $10.4 billion of positive market movements, partly offset by $4.7 billion in net cash outflows. Cash outflows included $3.6 billion from SAS Trustee Corporation to fund the Government’s defined benefit superannuation payments and $2.5 billion from the NSW Infrastructure Future Fund to meet Government infrastructure spending. Total absolute investment returns since 1 July 2015 are $35.3 billion as of 31 May 2021.
icare is the Government’s social insurer with the purpose to protect, insure and care for the State’s people, businesses and assets. icare insures, supports and cares for over 3 million NSW workers and more than 328,000 employers, including over 100 NSW Government agencies. In addition, icare manages almost 1,600 Lifetime Care and 350 Workers Care participants, and over 5,000 people with a dust disease and their dependents. icare also supports homeowners and protects more than $267 billion in NSW Government-owned assets.
icare’s remediation program to address the accuracy of workers compensation benefit payments has continued throughout 2020-21. NSW Treasury and the State Insurance Regulatory Authority (SIRA) continue to work with icare to remediate historical underpayments resulting from the calculation of statutory Pre-Injury Average Weekly Earnings requirements that were in place before icare’s inception. Deloitte’s Workplace Integrity Team has been engaged to support the review and speed up the remediation process for injured workers.
The Government welcomed the recommendations of the Independent Review of icare and the State Insurance and Care Governance Act 2015 (NSW), handed down by retired Supreme Court Judge The Hon Robert McDougall QC on 30 April 2021. The Government immediately accepted 35 recommendations, which are being implemented operationally by icare and SIRA. Additionally, icare has commenced a program of organisational reform to address the recommendations for which it is responsible.
7.5 Dividends and tax equivalent payments
As a shareholder, the NSW Government receives dividends from entities in the PNFC and PFC sectors.
PNFCs and PFCs also pay the Government tax equivalent payments and debt neutrality charges (government guarantee fees) to ensure they are not placed at a competitive advantage over private sector businesses that compete against them.
For 2021-22, the dividend and tax equivalent payments from the PNFC and PFC sectors are forecast at $682.0 million and government guarantee fees at $358.1 million. Over the Budget and forward estimates, dividends and tax equivalent payments are forecast to be $4.4 billion.
Dividends and tax equivalent payments are forecast to increase by $1.1 billion from 2023-24 to 2024-25. This is primarily attributable to:
increase in dividends from capital structure optimisation and other initiatives undertaken by Sydney Water ($489.5 million increase) and TCorp ($225.5 million increase). Similar initiatives of Sydney Water also resulted in increased dividends in 2020-21, as forecast in the previous Budget
increase in dividends from Landcom of $269.1 million, driven by reprofiling of forecast Landcom dividends from the 2020-21 Budget. Dividends previously forecast between 2021-22 and 2023-24, were realigned to 2024-25.
Capital structure optimisation is pursued on an ongoing basis by SOCs alongside NSW Treasury. This is undertaken in accordance with NSW Treasury’s policies and frameworks. Capital structure reviews seek to achieve the efficient use of the State’s debt and equity capital in line with world-class commercial performance while maintaining investment grade credit ratings. Financing decisions arising out of capital structure reviews do not have an impact on the businesses’ prices, capital investment levels or quality of services to the people of New South Wales.
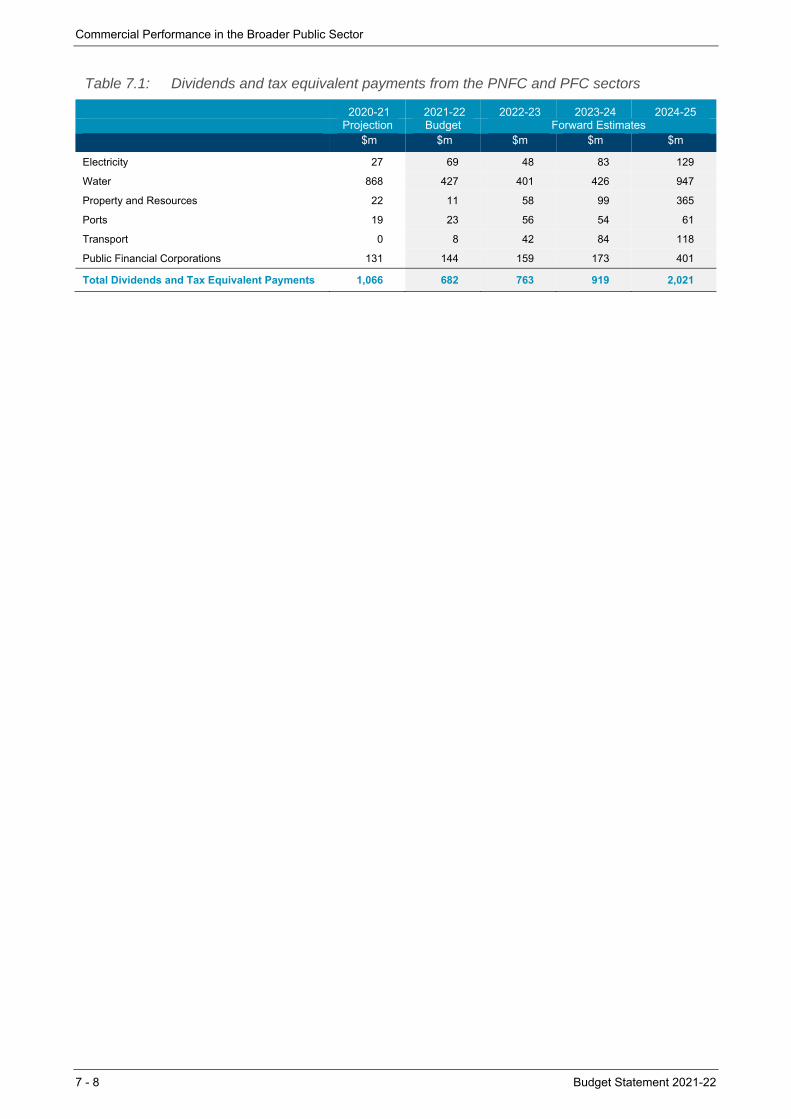
Commercial Performance in the Broader Public Sector
7 - 8 Budget Statement 2021-22
Table 7.1: Dividends and tax equivalent payments from the PNFC and PFC sectors
2020-21 2021-22 2022-23 2023-24 2024-25 Projection Budget Forward Estimates $m $m $m $m $m
Electricity 27 69 48 83 129
Water 868 427 401 426 947
Property and Resources 22 11 58 99 365
Ports 19 23 56 54 61
Transport 0 8 42 84 118
Public Financial Corporations 131 144 159 173 401
Total Dividends and Tax Equivalent Payments 1,066 682 763 919 2,021
Budget Statement 2021-22 A1 - 1
A1. STATEMENT OF FINANCES
This appendix presents the financial aggregates for the 2021-22 Budget.
Financial aggregates in this appendix are prepared in line with:
the Uniform Presentation Framework (UPF) administered by the Council on Federal Financial Relations (CFFR)
Australian Accounting Standard AASB 1049 Whole of Government and General Government Sector Financial Reporting, which adopts a harmonised Government Finance Statistics (GFS)/Generally Accepted Accounting Principles (GAAP) reporting basis.
A six-year time series is provided from 2019-20 to 2024-25 for the general government sector (GGS), public non-financial corporations (PNFC) sector, and consolidated non-financial public sector (NFPS).
An analysis of general government expenses is presented in Chapter 5 Expenditure.
How to Read the Budget Papers outlines the accounting policies and forecast assumptions adopted in the Budget. The UPF tables quantify the impact of these policies and assumptions on the forward estimates from 2021-22 to 2024-25. These forecasts include the impact from the adoption of new accounting standard from 2020-21 in accordance with AASB 1059 Service Concession Arrangements: Grantor
Statement of Finances
A1 - 2 Budget Statement 2021-22
A1.1 Introduction
This appendix presents financial aggregates for the GGS, PNFC sector and NFPS. These aggregates are prepared in line with the revised UPF agreed by the Council on Federal Financial Relations in February 2019.
The objective of the UPF is to facilitate a better understanding of individual government’s budget and provide for more meaningful comparisons of each government’s financial results and projections.
The format of the aggregates is based on reporting standards set out by the Australian Accounting Standards Board – AASB 1049 Whole of Government and General Government Sector Financial Reporting, which adopts a harmonised GFS-GAAP reporting basis.
The UPF financial aggregates:
allow consistent comparisons between the financial position of Australian governments
facilitate time series comparisons since they are relatively unaffected by changes in public sector administrative structures
permit an assessment of how public sector transactions affect the economy by providing data classified by economic type.
A1.2 Uniform Presentation Framework
The NSW Government financial tables in this appendix are prepared under the UPF1. Additional disclosures explain matters specific to New South Wales.
Framework
The UPF tables are in line with AASB 1049 which:
adopts generally accepted accounting principles (GAAP) definitions, including recognition and measurement principles in almost all cases
amends presentation requirements to encompass a comprehensive result that retains the GAAP classification system but overlays it with the transactions and other economic flows classification system based on GFS
expands the disclosure requirements to include key fiscal aggregates required by GFS.
Due to differences in reporting classifications, GFS financial aggregates released by the ABS will differ from UPF aggregates. For more information on other differences, see the primary financial statements later in this appendix. For details of the key 2019-20 convergence differences, refer to Note 36: Key Fiscal Aggregates and Reconciliations to Government Finance Statistics in the 2019-20 Report on State Finances.
1 The complete Uniform Presentation Framework is available on the Commonwealth Treasury website
www.treasury.gov.au. Extracts from the manual are included in this appendix to explain key concepts while the glossary to “How to Read the Budget Papers” also includes key UPF terms.
Statement of Finances
Budget Statement 2021-22 A1 - 3
Historical Series
To ensure a consistent historical series of fiscal aggregates, all jurisdictions have agreed to back cast published historical data on a best endeavours basis. For example, historic information in the consolidated operating statements has been recast on the basis of available dissections between GFS transactions and other economic flows.
Fiscal measures
UPF reporting measures evaluate the soundness of a government’s fiscal position and the fiscal policy effect on the economy. The fiscal measures in the UPF framework are:
net operating balance
net lending/borrowing (fiscal balance)
net worth
change in net worth (comprehensive result)
net debt
net financial worth
net financial liabilities
cash surplus/(deficit).
Definitions of these measures are set out in the glossary in the “How to Read the Budget Papers” guide.
Flow measures (net operating balance, net lending/borrowing and change in net worth) show changes in the fiscal position during the reporting period, reflecting the impact of government decisions and actions, and re-measurement effects during that time. Flows represent the creation, transformation, exchange, transfer or extinction of economic value.
Stock measures (net worth, net debt, net financial worth and net financial liabilities) highlight a government’s fiscal position at a point in time, providing information on the aggregate results of past decisions.
Statement of Finances
A1 - 4 Budget Statement 2021-22
A1.3 Primary Financial Statements
UPF Presentation
Public sector estimates and outcomes are presented on an accrual accounting basis in three AASB 1049 based primary statements: the operating statement, including other economic flows; the balance sheet; and the cash flow statement. AASB 1049 adopts GFS principles where this does not conflict with GAAP. Details of key convergence differences between GFS and GAAP are explained in this appendix. The following statements form the UPF’s core reporting requirements.
Operating Statement
The operating statement:
presents information on transactions (revenue and expenses) and other economic flows (revaluations and adjustments)
captures the composition of revenues and expenses and the net cost of government activities within a fiscal year
shows the full cost of resources consumed by the government in achieving its objectives and the extent that these costs are met from various revenue sources
shows information on capital expenditure and asset sales to derive a net lending/borrowing position.
The operating statement also reports three major fiscal measures:
net operating balance which is calculated as revenue minus expenses from transactions. New South Wales recognises its budget result as the net operating balance for the general government sector
total change in net worth (comprehensive result) which starts with the net operating balance and includes other economic flows such as revaluations
net lending/borrowing (fiscal balance) which starts with the net operating balance and includes net capital expenditure but excludes depreciation, giving the best indicator of a jurisdiction’s call on financial markets.
The balance sheet:
records the value of financial and non-financial assets and liabilities of the State, at the end of each financial year
shows the resources at the State’s disposal and the type and valuation of its liabilities
reveals the make-up of the State’s financial assets, its fixed asset holdings, and the extent of liabilities such as borrowings and unfunded superannuation.
The UPF balance sheet fiscal aggregates include net worth, net financial worth, net financial liabilities and net debt.

Statement of Finances
Budget Statement 2021-22 A1 - 5
Cash Flow Statement
The cash flow statement reveals how a government obtains and expends cash. It shows how government cash inflows and outflows are allocated between various activities, and their net impact on cash held.
This statement requires cash flows to be categorised into:
operating activities comprising activities linked to collecting taxes, distributing grants, and providing goods and services
investing activities comprising activities linked to acquiring and disposing financial and non-financial assets
financing activities comprising activities linked to changing the size and composition of a government’s financial structure.
The sign convention within the cash flow statement is that all inflows carry a positive sign and all outflows carry a negative sign (regardless of whether they are gross or net cash flows).
The cash flow statement reports two fiscal measures:
net increase in cash held which is the sum of net cash flows from all operating, investing and financing activities
cash surplus/(deficit) which comprises net cash from operating activities, plus sales and less purchases of non-financial assets.
New South Wales uses the AASB 1049 cash result as its headline cash result.
Institutional sectors
Appendix A4 lists entities within the NSW public sector. These NSW-controlled entities have been classified according to their government sector. These sectors are defined in the ABS GFS manual.
A1.4 Uniform Presentation Tables
These tables are set out by institutional sectors showing the order of operating statement, balance sheet and cash flow statement.
In addition to the UPF minimum disclosure requirements, these tables include a historical and forward year time series. The tables for general government sector also include:
tax revenues by type
a dissection of grant revenue and expense
dividend and income tax equivalent income by sector
total expenses by function (COFOG-A)
purchases of non-financial assets by function (COFOG-A).
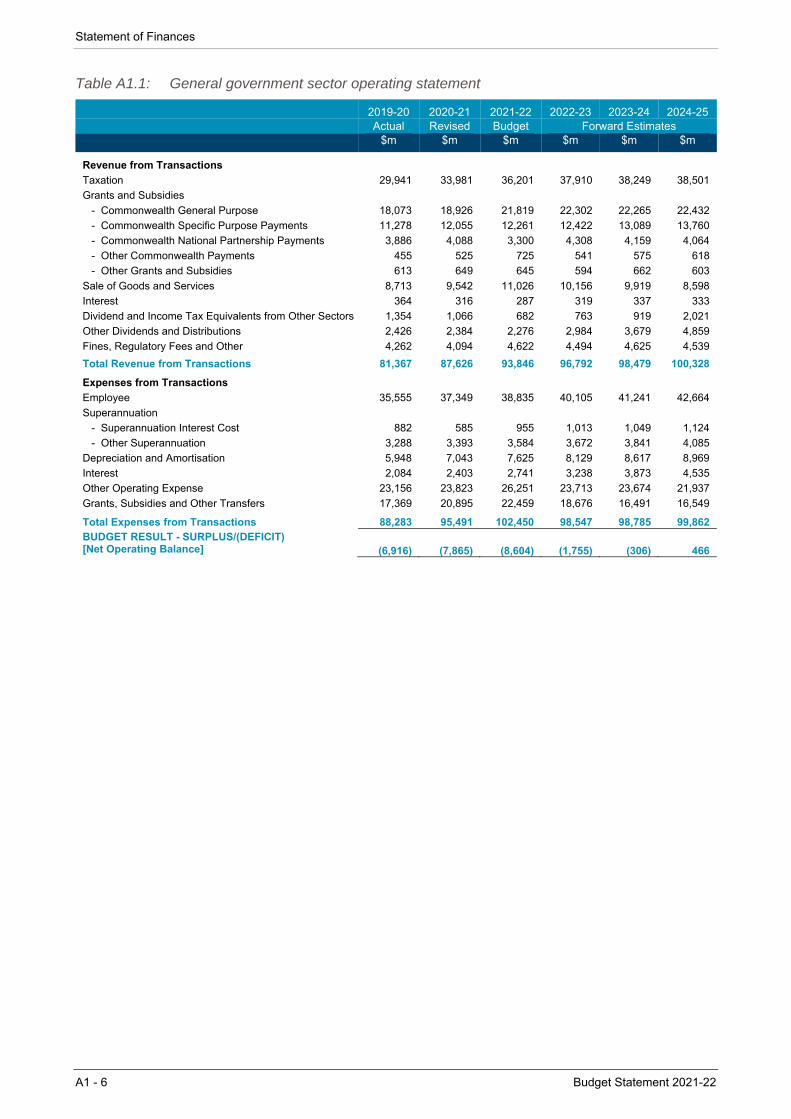
Statement of Finances
A1 - 6 Budget Statement 2021-22
Table A1.1: General government sector operating statement
2019-20 2020-21 2021-22 2022-23 2023-24 2024-25 Actual Revised Budget Forward Estimates
$m $m $m $m $m $m
Revenue from Transactions Taxation 29,941 33,981 36,201 37,910 38,249 38,501
Grants and Subsidies - Commonwealth General Purpose 18,073 18,926 21,819 22,302 22,265 22,432
- Commonwealth Specific Purpose Payments 11,278 12,055 12,261 12,422 13,089 13,760
- Commonwealth National Partnership Payments 3,886 4,088 3,300 4,308 4,159 4,064
- Other Commonwealth Payments 455 525 725 541 575 618
- Other Grants and Subsidies 613 649 645 594 662 603
Sale of Goods and Services 8,713 9,542 11,026 10,156 9,919 8,598
Interest 364 316 287 319 337 333
Dividend and Income Tax Equivalents from Other Sectors 1,354 1,066 682 763 919 2,021
Other Dividends and Distributions 2,426 2,384 2,276 2,984 3,679 4,859
Fines, Regulatory Fees and Other 4,262 4,094 4,622 4,494 4,625 4,539
Total Revenue from Transactions 81,367 87,626 93,846 96,792 98,479 100,328
Expenses from Transactions Employee 35,555 37,349 38,835 40,105 41,241 42,664
Superannuation - Superannuation Interest Cost 882 585 955 1,013 1,049 1,124
- Other Superannuation 3,288 3,393 3,584 3,672 3,841 4,085
Depreciation and Amortisation 5,948 7,043 7,625 8,129 8,617 8,969
Interest 2,084 2,403 2,741 3,238 3,873 4,535
Other Operating Expense 23,156 23,823 26,251 23,713 23,674 21,937
Grants, Subsidies and Other Transfers 17,369 20,895 22,459 18,676 16,491 16,549
Total Expenses from Transactions 88,283 95,491 102,450 98,547 98,785 99,862BUDGET RESULT - SURPLUS/(DEFICIT) [Net Operating Balance] (6,916) (7,865) (8,604) (1,755) (306) 466
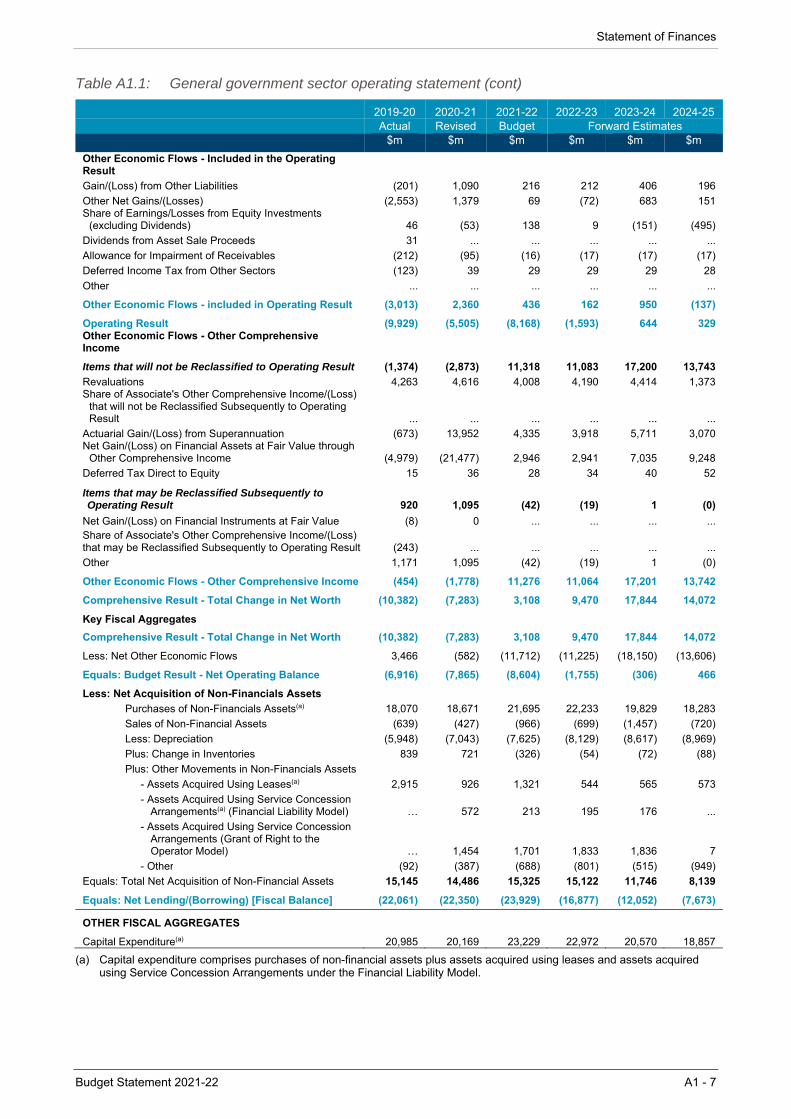
Statement of Finances
Budget Statement 2021-22 A1 - 7
Table A1.1: General government sector operating statement (cont)
2019-20 2020-21 2021-22 2022-23 2023-24 2024-25 Actual Revised Budget Forward Estimates
$m $m $m $m $m $m
Other Economic Flows - Included in the Operating Result
Gain/(Loss) from Other Liabilities (201) 1,090 216 212 406 196
Other Net Gains/(Losses) (2,553) 1,379 69 (72) 683 151Share of Earnings/Losses from Equity Investments
(excluding Dividends) 46 (53) 138 9 (151) (495)
Dividends from Asset Sale Proceeds 31 ... ... ... ... ...
Allowance for Impairment of Receivables (212) (95) (16) (17) (17) (17)
Deferred Income Tax from Other Sectors (123) 39 29 29 29 28
Other ... ... ... ... ... ...
Other Economic Flows - included in Operating Result (3,013) 2,360 436 162 950 (137)
Operating Result (9,929) (5,505) (8,168) (1,593) 644 329Other Economic Flows - Other Comprehensive Income
Items that will not be Reclassified to Operating Result (1,374) (2,873) 11,318 11,083 17,200 13,743
Revaluations 4,263 4,616 4,008 4,190 4,414 1,373Share of Associate's Other Comprehensive Income/(Loss)
that will not be Reclassified Subsequently to Operating Result ... ... ... ... ... ...
Actuarial Gain/(Loss) from Superannuation (673) 13,952 4,335 3,918 5,711 3,070Net Gain/(Loss) on Financial Assets at Fair Value through
Other Comprehensive Income (4,979) (21,477) 2,946 2,941 7,035 9,248
Deferred Tax Direct to Equity 15 36 28 34 40 52
Items that may be Reclassified Subsequently to Operating Result 920 1,095 (42) (19) 1 (0)
Net Gain/(Loss) on Financial Instruments at Fair Value (8) 0 ... ... ... ...Share of Associate's Other Comprehensive Income/(Loss) that may be Reclassified Subsequently to Operating Result (243) ... ... ... ... ...
Other 1,171 1,095 (42) (19) 1 (0)
Other Economic Flows - Other Comprehensive Income (454) (1,778) 11,276 11,064 17,201 13,742
Comprehensive Result - Total Change in Net Worth (10,382) (7,283) 3,108 9,470 17,844 14,072
Key Fiscal Aggregates Comprehensive Result - Total Change in Net Worth (10,382) (7,283) 3,108 9,470 17,844 14,072
Less: Net Other Economic Flows 3,466 (582) (11,712) (11,225) (18,150) (13,606)
Equals: Budget Result - Net Operating Balance (6,916) (7,865) (8,604) (1,755) (306) 466
Less: Net Acquisition of Non-Financials Assets Purchases of Non-Financials Assets(a) 18,070 18,671 21,695 22,233 19,829 18,283
Sales of Non-Financial Assets (639) (427) (966) (699) (1,457) (720)
Less: Depreciation (5,948) (7,043) (7,625) (8,129) (8,617) (8,969)
Plus: Change in Inventories 839 721 (326) (54) (72) (88)
Plus: Other Movements in Non-Financials Assets - Assets Acquired Using Leases(a) 2,915 926 1,321 544 565 573
- Assets Acquired Using Service Concession Arrangements(a) (Financial Liability Model) … 572 213 195 176 ...
- Assets Acquired Using Service Concession Arrangements (Grant of Right to the Operator Model) … 1,454 1,701 1,833 1,836 7
- Other (92) (387) (688) (801) (515) (949)
Equals: Total Net Acquisition of Non-Financial Assets 15,145 14,486 15,325 15,122 11,746 8,139
Equals: Net Lending/(Borrowing) [Fiscal Balance] (22,061) (22,350) (23,929) (16,877) (12,052) (7,673) OTHER FISCAL AGGREGATES
Capital Expenditure(a) 20,985 20,169 23,229 22,972 20,570 18,857
(a) Capital expenditure comprises purchases of non-financial assets plus assets acquired using leases and assets acquired using Service Concession Arrangements under the Financial Liability Model.
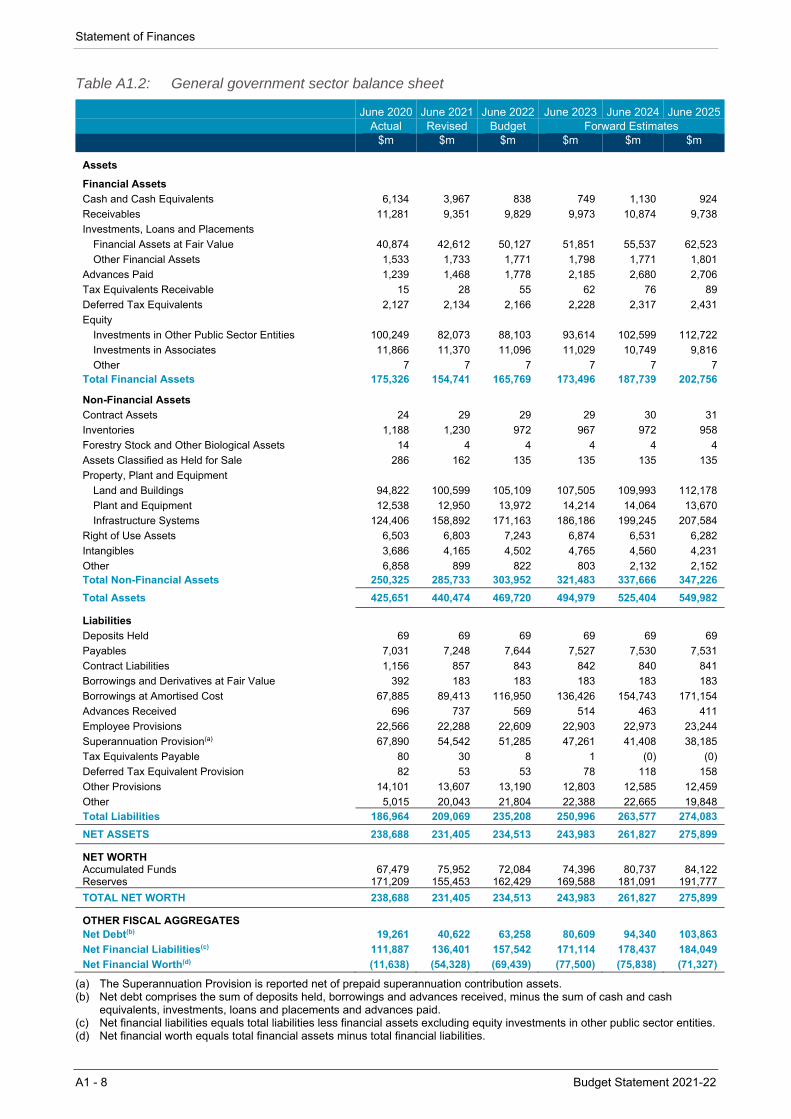
Statement of Finances
A1 - 8 Budget Statement 2021-22
Table A1.2: General government sector balance sheet
June 2020 June 2021 June 2022 June 2023 June 2024 June 2025 Actual Revised Budget Forward Estimates
$m $m $m $m $m $m
Assets Financial Assets Cash and Cash Equivalents 6,134 3,967 838 749 1,130 924
Receivables 11,281 9,351 9,829 9,973 10,874 9,738
Investments, Loans and Placements Financial Assets at Fair Value 40,874 42,612 50,127 51,851 55,537 62,523
Other Financial Assets 1,533 1,733 1,771 1,798 1,771 1,801
Advances Paid 1,239 1,468 1,778 2,185 2,680 2,706
Tax Equivalents Receivable 15 28 55 62 76 89
Deferred Tax Equivalents 2,127 2,134 2,166 2,228 2,317 2,431
Equity Investments in Other Public Sector Entities 100,249 82,073 88,103 93,614 102,599 112,722
Investments in Associates 11,866 11,370 11,096 11,029 10,749 9,816
Other 7 7 7 7 7 7Total Financial Assets 175,326 154,741 165,769 173,496 187,739 202,756
Non-Financial Assets Contract Assets 24 29 29 29 30 31
Inventories 1,188 1,230 972 967 972 958
Forestry Stock and Other Biological Assets 14 4 4 4 4 4
Assets Classified as Held for Sale 286 162 135 135 135 135
Property, Plant and Equipment Land and Buildings 94,822 100,599 105,109 107,505 109,993 112,178
Plant and Equipment 12,538 12,950 13,972 14,214 14,064 13,670
Infrastructure Systems 124,406 158,892 171,163 186,186 199,245 207,584
Right of Use Assets 6,503 6,803 7,243 6,874 6,531 6,282
Intangibles 3,686 4,165 4,502 4,765 4,560 4,231
Other 6,858 899 822 803 2,132 2,152Total Non-Financial Assets 250,325 285,733 303,952 321,483 337,666 347,226
Total Assets 425,651 440,474 469,720 494,979 525,404 549,982
Liabilities
Deposits Held 69 69 69 69 69 69
Payables 7,031 7,248 7,644 7,527 7,530 7,531
Contract Liabilities 1,156 857 843 842 840 841
Borrowings and Derivatives at Fair Value 392 183 183 183 183 183
Borrowings at Amortised Cost 67,885 89,413 116,950 136,426 154,743 171,154
Advances Received 696 737 569 514 463 411
Employee Provisions 22,566 22,288 22,609 22,903 22,973 23,244
Superannuation Provision(a) 67,890 54,542 51,285 47,261 41,408 38,185
Tax Equivalents Payable 80 30 8 1 (0) (0)
Deferred Tax Equivalent Provision 82 53 53 78 118 158
Other Provisions 14,101 13,607 13,190 12,803 12,585 12,459
Other 5,015 20,043 21,804 22,388 22,665 19,848Total Liabilities 186,964 209,069 235,208 250,996 263,577 274,083
NET ASSETS 238,688 231,405 234,513 243,983 261,827 275,899
NET WORTH
Accumulated Funds 67,479 75,952 72,084 74,396 80,737 84,122Reserves 171,209 155,453 162,429 169,588 181,091 191,777
TOTAL NET WORTH 238,688 231,405 234,513 243,983 261,827 275,899
OTHER FISCAL AGGREGATES Net Debt(b) 19,261 40,622 63,258 80,609 94,340 103,863
Net Financial Liabilities(c) 111,887 136,401 157,542 171,114 178,437 184,049
Net Financial Worth(d) (11,638) (54,328) (69,439) (77,500) (75,838) (71,327)
(a) The Superannuation Provision is reported net of prepaid superannuation contribution assets. (b) Net debt comprises the sum of deposits held, borrowings and advances received, minus the sum of cash and cash
equivalents, investments, loans and placements and advances paid. (c) Net financial liabilities equals total liabilities less financial assets excluding equity investments in other public sector entities. (d) Net financial worth equals total financial assets minus total financial liabilities.
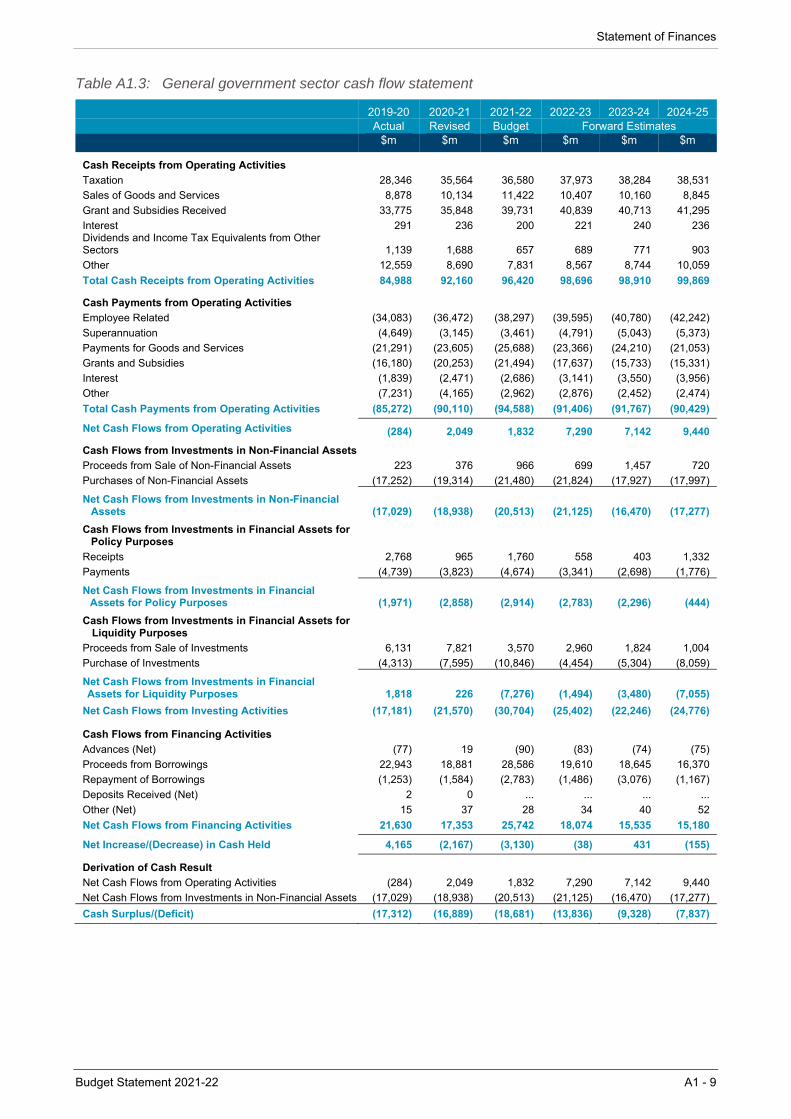
Statement of Finances
Budget Statement 2021-22 A1 - 9
Table A1.3: General government sector cash flow statement
2019-20 2020-21 2021-22 2022-23 2023-24 2024-25 Actual Revised Budget Forward Estimates
$m $m $m $m $m $m
Cash Receipts from Operating Activities Taxation 28,346 35,564 36,580 37,973 38,284 38,531
Sales of Goods and Services 8,878 10,134 11,422 10,407 10,160 8,845
Grant and Subsidies Received 33,775 35,848 39,731 40,839 40,713 41,295
Interest 291 236 200 221 240 236 Dividends and Income Tax Equivalents from Other Sectors 1,139 1,688 657 689 771 903
Other 12,559 8,690 7,831 8,567 8,744 10,059
Total Cash Receipts from Operating Activities 84,988 92,160 96,420 98,696 98,910 99,869
Cash Payments from Operating Activities Employee Related (34,083) (36,472) (38,297) (39,595) (40,780) (42,242)
Superannuation (4,649) (3,145) (3,461) (4,791) (5,043) (5,373)
Payments for Goods and Services (21,291) (23,605) (25,688) (23,366) (24,210) (21,053)
Grants and Subsidies (16,180) (20,253) (21,494) (17,637) (15,733) (15,331)
Interest (1,839) (2,471) (2,686) (3,141) (3,550) (3,956)
Other (7,231) (4,165) (2,962) (2,876) (2,452) (2,474)
Total Cash Payments from Operating Activities (85,272) (90,110) (94,588) (91,406) (91,767) (90,429)
Net Cash Flows from Operating Activities (284) 2,049 1,832 7,290 7,142 9,440
Cash Flows from Investments in Non-Financial Assets Proceeds from Sale of Non-Financial Assets 223 376 966 699 1,457 720
Purchases of Non-Financial Assets (17,252) (19,314) (21,480) (21,824) (17,927) (17,997)
Net Cash Flows from Investments in Non-Financial Assets (17,029) (18,938) (20,513) (21,125) (16,470) (17,277)
Cash Flows from Investments in Financial Assets for Policy Purposes
Receipts 2,768 965 1,760 558 403 1,332
Payments (4,739) (3,823) (4,674) (3,341) (2,698) (1,776)
Net Cash Flows from Investments in Financial Assets for Policy Purposes (1,971) (2,858) (2,914) (2,783) (2,296) (444)
Cash Flows from Investments in Financial Assets for Liquidity Purposes
Proceeds from Sale of Investments 6,131 7,821 3,570 2,960 1,824 1,004
Purchase of Investments (4,313) (7,595) (10,846) (4,454) (5,304) (8,059)
Net Cash Flows from Investments in Financial Assets for Liquidity Purposes 1,818 226 (7,276) (1,494) (3,480) (7,055)
Net Cash Flows from Investing Activities (17,181) (21,570) (30,704) (25,402) (22,246) (24,776)
Cash Flows from Financing Activities Advances (Net) (77) 19 (90) (83) (74) (75)
Proceeds from Borrowings 22,943 18,881 28,586 19,610 18,645 16,370
Repayment of Borrowings (1,253) (1,584) (2,783) (1,486) (3,076) (1,167)
Deposits Received (Net) 2 0 ... ... ... ...
Other (Net) 15 37 28 34 40 52
Net Cash Flows from Financing Activities 21,630 17,353 25,742 18,074 15,535 15,180
Net Increase/(Decrease) in Cash Held 4,165 (2,167) (3,130) (38) 431 (155)
Derivation of Cash Result Net Cash Flows from Operating Activities (284) 2,049 1,832 7,290 7,142 9,440
Net Cash Flows from Investments in Non-Financial Assets (17,029) (18,938) (20,513) (21,125) (16,470) (17,277)
Cash Surplus/(Deficit) (17,312) (16,889) (18,681) (13,836) (9,328) (7,837)
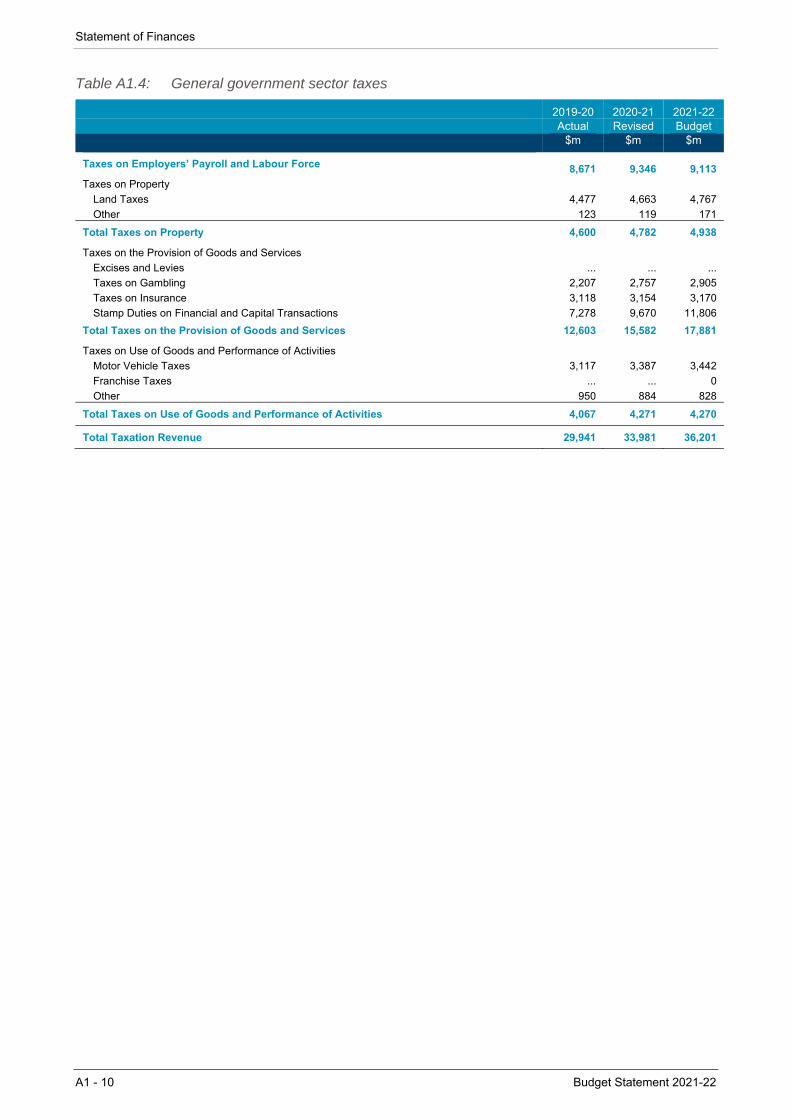
Statement of Finances
A1 - 10 Budget Statement 2021-22
Table A1.4: General government sector taxes
2019-20 2020-21 2021-22 Actual Revised Budget
$m $m $m
Taxes on Employers’ Payroll and Labour Force 8,671 9,346 9,113
Taxes on Property Land Taxes 4,477 4,663 4,767
Other 123 119 171
Total Taxes on Property 4,600 4,782 4,938
Taxes on the Provision of Goods and Services Excises and Levies ... ... ...
Taxes on Gambling 2,207 2,757 2,905
Taxes on Insurance 3,118 3,154 3,170
Stamp Duties on Financial and Capital Transactions 7,278 9,670 11,806
Total Taxes on the Provision of Goods and Services 12,603 15,582 17,881
Taxes on Use of Goods and Performance of Activities Motor Vehicle Taxes 3,117 3,387 3,442
Franchise Taxes ... ... 0
Other 950 884 828
Total Taxes on Use of Goods and Performance of Activities 4,067 4,271 4,270
Total Taxation Revenue 29,941 33,981 36,201
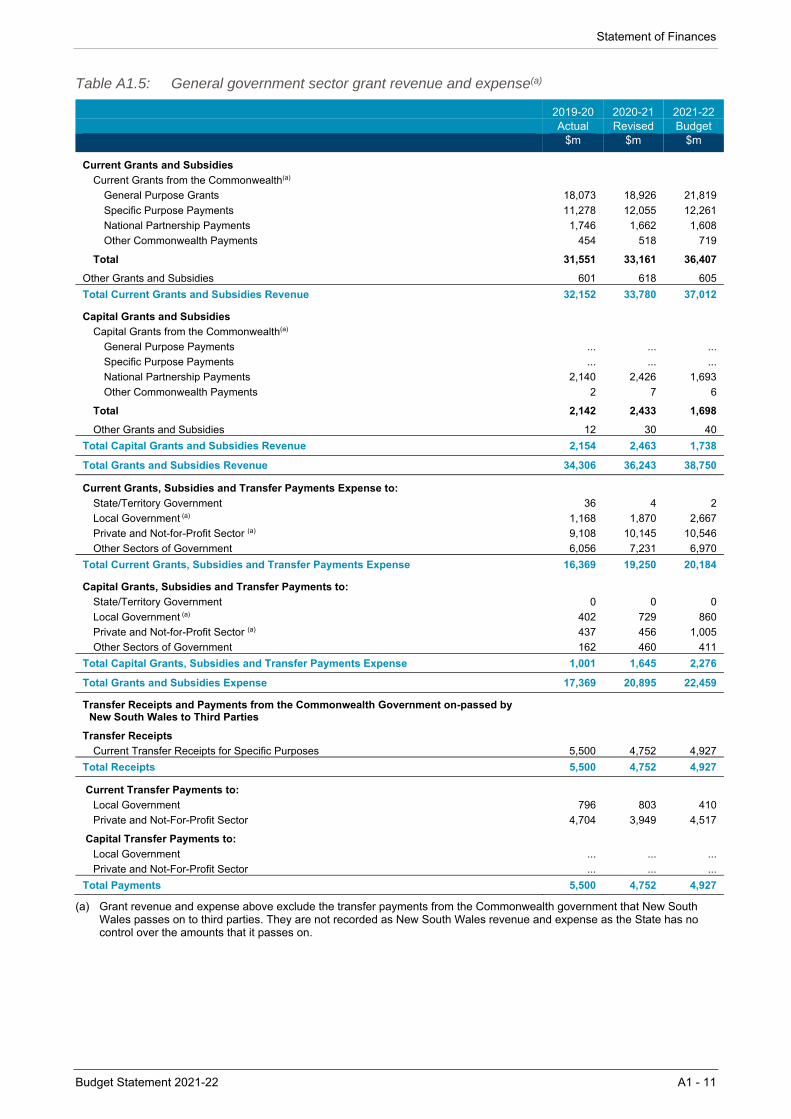
Statement of Finances
Budget Statement 2021-22 A1 - 11
Table A1.5: General government sector grant revenue and expense(a)
2019-20 2020-21 2021-22 Actual Revised Budget $m $m $m
Current Grants and Subsidies Current Grants from the Commonwealth(a)
General Purpose Grants 18,073 18,926 21,819
Specific Purpose Payments 11,278 12,055 12,261
National Partnership Payments 1,746 1,662 1,608
Other Commonwealth Payments 454 518 719
Total 31,551 33,161 36,407
Other Grants and Subsidies 601 618 605
Total Current Grants and Subsidies Revenue 32,152 33,780 37,012
Capital Grants and Subsidies Capital Grants from the Commonwealth(a)
General Purpose Payments ... ... ...
Specific Purpose Payments ... ... ...
National Partnership Payments 2,140 2,426 1,693
Other Commonwealth Payments 2 7 6
Total 2,142 2,433 1,698
Other Grants and Subsidies 12 30 40
Total Capital Grants and Subsidies Revenue 2,154 2,463 1,738
Total Grants and Subsidies Revenue 34,306 36,243 38,750
Current Grants, Subsidies and Transfer Payments Expense to: State/Territory Government 36 4 2
Local Government (a) 1,168 1,870 2,667
Private and Not-for-Profit Sector (a) 9,108 10,145 10,546
Other Sectors of Government 6,056 7,231 6,970
Total Current Grants, Subsidies and Transfer Payments Expense 16,369 19,250 20,184
Capital Grants, Subsidies and Transfer Payments to: State/Territory Government 0 0 0
Local Government (a) 402 729 860
Private and Not-for-Profit Sector (a) 437 456 1,005
Other Sectors of Government 162 460 411
Total Capital Grants, Subsidies and Transfer Payments Expense 1,001 1,645 2,276
Total Grants and Subsidies Expense 17,369 20,895 22,459
Transfer Receipts and Payments from the Commonwealth Government on-passed by New South Wales to Third Parties
Transfer Receipts Current Transfer Receipts for Specific Purposes 5,500 4,752 4,927
Total Receipts 5,500 4,752 4,927
Current Transfer Payments to: Local Government 796 803 410
Private and Not-For-Profit Sector 4,704 3,949 4,517
Capital Transfer Payments to: Local Government ... ... ...
Private and Not-For-Profit Sector ... ... ...
Total Payments 5,500 4,752 4,927
(a) Grant revenue and expense above exclude the transfer payments from the Commonwealth government that New South Wales passes on to third parties. They are not recorded as New South Wales revenue and expense as the State has no control over the amounts that it passes on.
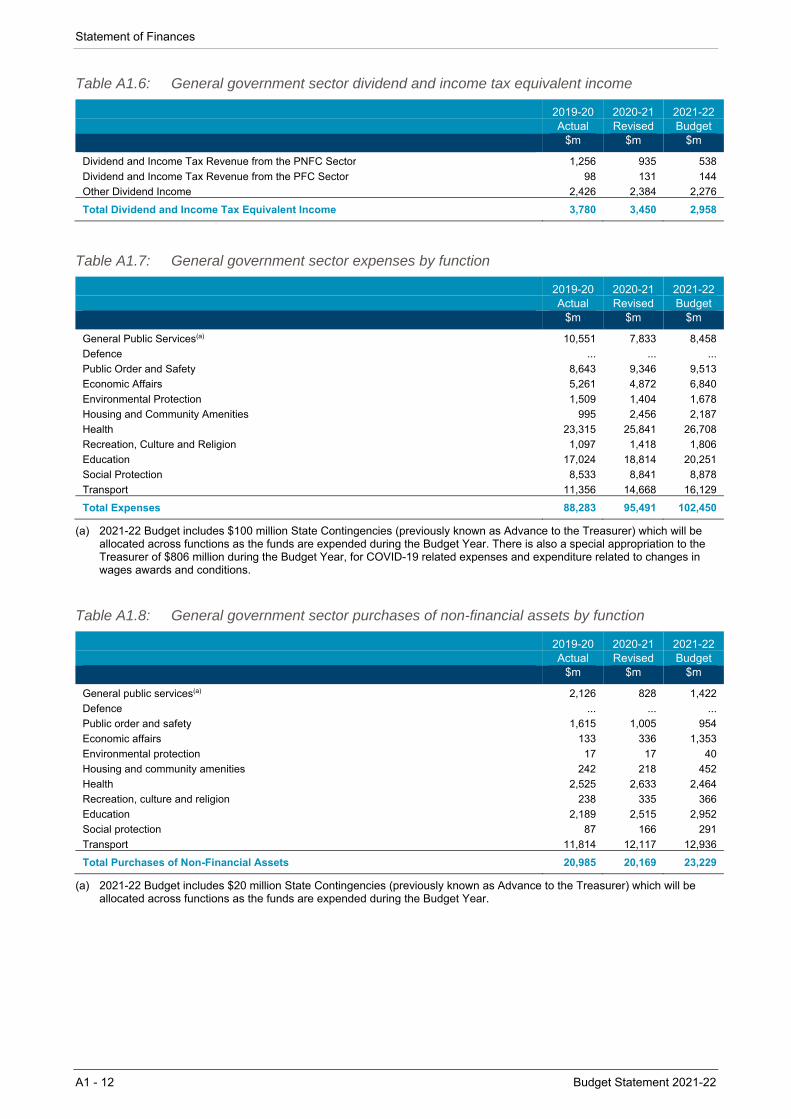
Statement of Finances
A1 - 12 Budget Statement 2021-22
Table A1.6: General government sector dividend and income tax equivalent income
2019-20 2020-21 2021-22 Actual Revised Budget
$m $m $m
Dividend and Income Tax Revenue from the PNFC Sector 1,256 935 538
Dividend and Income Tax Revenue from the PFC Sector 98 131 144
Other Dividend Income 2,426 2,384 2,276
Total Dividend and Income Tax Equivalent Income 3,780 3,450 2,958
Table A1.7: General government sector expenses by function
2019-20 2020-21 2021-22 Actual Revised Budget $m $m $m
General Public Services(a) 10,551 7,833 8,458
Defence ... ... ...
Public Order and Safety 8,643 9,346 9,513
Economic Affairs 5,261 4,872 6,840
Environmental Protection 1,509 1,404 1,678
Housing and Community Amenities 995 2,456 2,187
Health 23,315 25,841 26,708
Recreation, Culture and Religion 1,097 1,418 1,806
Education 17,024 18,814 20,251
Social Protection 8,533 8,841 8,878
Transport 11,356 14,668 16,129
Total Expenses 88,283 95,491 102,450
(a) 2021-22 Budget includes $100 million State Contingencies (previously known as Advance to the Treasurer) which will be allocated across functions as the funds are expended during the Budget Year. There is also a special appropriation to the Treasurer of $806 million during the Budget Year, for COVID-19 related expenses and expenditure related to changes in wages awards and conditions.
Table A1.8: General government sector purchases of non-financial assets by function
2019-20 2020-21 2021-22 Actual Revised Budget $m $m $m
General public services(a) 2,126 828 1,422
Defence ... ... ...
Public order and safety 1,615 1,005 954
Economic affairs 133 336 1,353
Environmental protection 17 17 40
Housing and community amenities 242 218 452
Health 2,525 2,633 2,464
Recreation, culture and religion 238 335 366
Education 2,189 2,515 2,952
Social protection 87 166 291
Transport 11,814 12,117 12,936
Total Purchases of Non-Financial Assets 20,985 20,169 23,229
(a) 2021-22 Budget includes $20 million State Contingencies (previously known as Advance to the Treasurer) which will be allocated across functions as the funds are expended during the Budget Year.
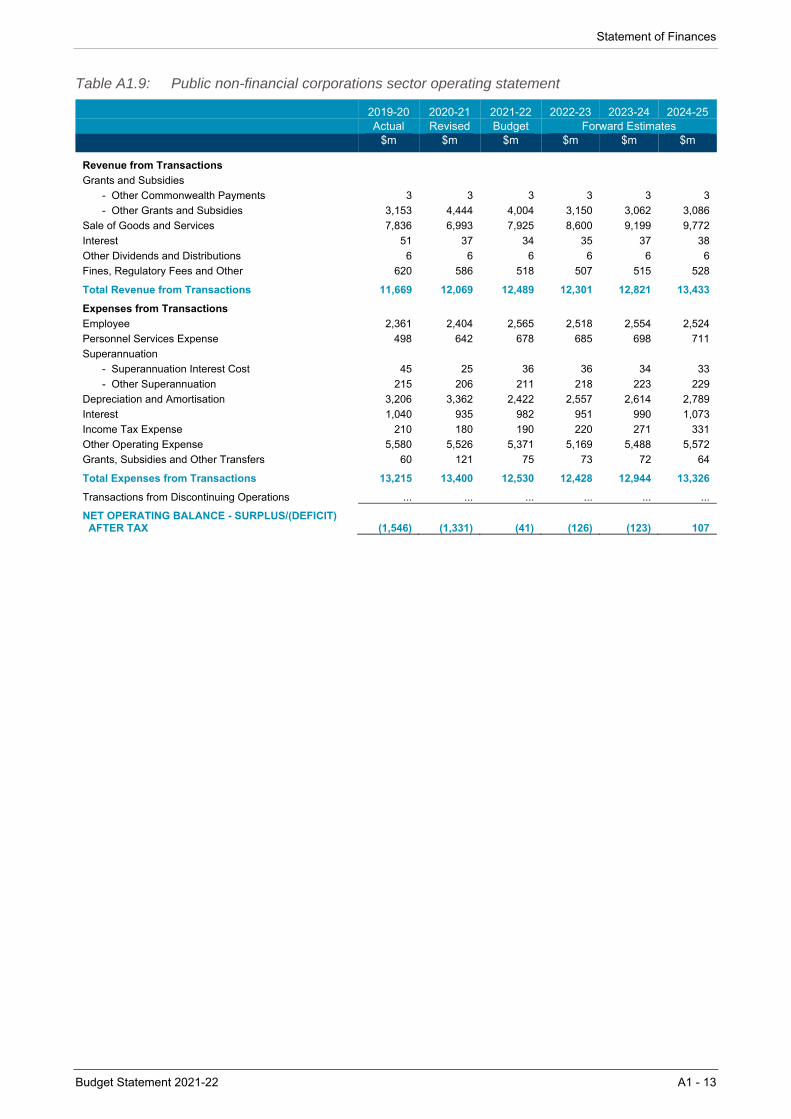
Statement of Finances
Budget Statement 2021-22 A1 - 13
Table A1.9: Public non-financial corporations sector operating statement
2019-20 2020-21 2021-22 2022-23 2023-24 2024-25 Actual Revised Budget Forward Estimates
$m $m $m $m $m $m
Revenue from Transactions Grants and Subsidies
- Other Commonwealth Payments 3 3 3 3 3 3
- Other Grants and Subsidies 3,153 4,444 4,004 3,150 3,062 3,086
Sale of Goods and Services 7,836 6,993 7,925 8,600 9,199 9,772
Interest 51 37 34 35 37 38
Other Dividends and Distributions 6 6 6 6 6 6
Fines, Regulatory Fees and Other 620 586 518 507 515 528
Total Revenue from Transactions 11,669 12,069 12,489 12,301 12,821 13,433
Expenses from Transactions Employee 2,361 2,404 2,565 2,518 2,554 2,524
Personnel Services Expense 498 642 678 685 698 711
Superannuation - Superannuation Interest Cost 45 25 36 36 34 33
- Other Superannuation 215 206 211 218 223 229
Depreciation and Amortisation 3,206 3,362 2,422 2,557 2,614 2,789
Interest 1,040 935 982 951 990 1,073
Income Tax Expense 210 180 190 220 271 331
Other Operating Expense 5,580 5,526 5,371 5,169 5,488 5,572
Grants, Subsidies and Other Transfers 60 121 75 73 72 64
Total Expenses from Transactions 13,215 13,400 12,530 12,428 12,944 13,326
Transactions from Discontinuing Operations ... ... ... ... ... ...
NET OPERATING BALANCE - SURPLUS/(DEFICIT) AFTER TAX (1,546) (1,331) (41) (126) (123) 107
Statement of Finances
A1 - 14 Budget Statement 2021-22
Table A1.9: Public non-financial corporations sector operating statement (cont)
2019-20 2020-21 2021-22 2022-23 2023-24 2024-25 Actual Revised Budget Forward Estimates
$m $m $m $m $m $m
Other Economic Flows - Included in the Operating Result Gain/(Loss) from Other Liabilities (7) 6 ... ... ... ...
Other Net Gains/(Losses) (655) (14) (143) (99) (217) (210)
Allowance for Impairment of Receivables (6) (4) (5) (5) (5) (5)
Deferred Income Tax 120 (37) (29) (29) (29) (28)
Discontinuing Operations - Other Economic Flows ... ... ... ... ... ...
Other Economic Flows - included in Operating Result (547) (50) (177) (132) (251) (244)
Operating Result (2,094) (1,381) (217) (259) (373) (136)Other Economic Flows - Other Comprehensive Income Items that will not be Reclassified to Operating Result 245 (21,462) 2,138 1,959 2,350 4,015
Revaluations 278 (22,443) 1,883 1,737 2,044 3,881 Share of Associate's Other Comprehensive
Income/(Loss) that will not be Reclassified Subsequently to Operating Result ... ... ... ... ... ...
Actuarial Gain/(Loss) from Superannuation (17) 1,018 283 256 345 186
Deferred Tax Direct to Equity (15) (36) (28) (34) (40) (52)
Items that may be Reclassified Subsequently to Operating Result (103) (459) 0 0 0 ...
Net Gain/(Loss) on Financial Instruments at Fair Value (6) (0) ... ... ... ...
Other (96) (459) 0 0 0 ...
Other Economic Flows - Other Comprehensive Income 142 (21,921) 2,138 1,959 2,350 4,015
Comprehensive Result - Before Transactions with Owners in their capacity as Owners (1,951) (23,303) 1,921 1,701 1,976 3,879
Dividends Distributed (1,077) (756) (347) (385) (474) (1,289)
Net Equity Injections 6,654 3,301 3,084 2,570 1,950 869
Total Change in Net Worth 3,626 (20,757) 4,657 3,886 3,452 3,458
Key Fiscal Aggregates Comprehensive Result - Before Transactions with
Owners in their capacity as Owners (1,951) (23,303) 1,921 1,701 1,976 3,879
Less: Net Other Economic Flows 405 21,971 (1,961) (1,827) (2,099) (3,771)
Equals: Budget Result - Net Operating Balance (1,546) (1,331) (41) (126) (123) 107
Less: Net Acquisition of Non-Financials Assets Purchases of Non-Financials Assets(a) 4,205 5,232 7,051 6,374 5,384 3,786
Sales of Non-Financial Assets (264) (198) (403) (673) (390) (376)
Less: Depreciation (3,206) (3,362) (2,422) (2,557) (2,614) (2,789)
Plus: Change in Inventories 108 85 131 104 (33) 106
Plus: Other Movements in Non-Financials Assets - Assets Acquired Using Leases(a) 75 71 71 90 64 86 - Assets Acquired Using Service Concession
Arrangements(a) (Financial Liability Model) ... ... ... ... ... ... - Assets Acquired Using Service Concession
Arrangements (Grant of Right to the Operator Model) ... ... ... ... ... ...
- Other 357 281 306 313 318 324
Equals: Total Net Acquisition of Non-Financial Assets 1,275 2,111 4,734 3,649 2,729 1,136
Equals: Net Lending/(Borrowing) [Fiscal Balance] (2,821) (3,442) (4,774) (3,775) (2,852) (1,029)
OTHER FISCAL AGGREGATES
Capital Expenditure(a) 4,280 5,304 7,122 6,463 5,448 3,872
Dividends Accrued(b) 1,077 376 342 359 422 1,216
(a) Capital expenditure comprises purchases of non-financial assets plus assets acquired using leases and assets acquired using Service Concession Arrangements under the Financial Liability Model.
(b) Net borrowing for the PNFC sector excludes the impact of dividends accrued, and so may not fully reflect the sector’s call on the financial markets.
Statement of Finances
Budget Statement 2021-22 A1 - 15
Table A1.10: Public non-financial corporations sector balance sheet
June 2020 June 2021 June 2022 June 2023 June 2024 June 2025 Actual Revised Budget Forward Estimates
$m $m $m $m $m $m
Assets
Financial Assets
Cash and Cash Equivalents 2,110 1,608 1,758 2,042 2,519 3,047
Receivables 1,295 1,235 1,147 1,167 1,221 1,257
Investments, Loans and Placements Financial Assets at Fair Value 243 243 243 243 243 243
Other Financial Assets 421 464 477 476 471 477
Advances Paid 0 0 0 0 0 0
Tax Equivalents Receivable 77 30 8 1 ... ...
Deferred Tax Equivalents 84 53 53 78 118 158
Equity Other 181 181 181 181 181 181
Total Financial Assets 4,411 3,813 3,867 4,189 4,752 5,364
Non-Financial Assets
Contract Assets ... ... ... ... ... ...
Inventories 576 661 792 896 863 969
Forestry Stock and Other Biological Assets 827 825 825 825 825 825
Assets Classified as Held for Sale 49 53 54 54 55 55
Investment Properties 676 688 621 621 622 622
Property, Plant and Equipment Land and Buildings 73,668 74,581 76,047 76,857 77,916 79,308
Plant and Equipment 4,106 4,651 5,847 6,876 7,669 7,874
Infrastructure Systems 55,792 34,298 38,082 41,572 44,834 48,040
Right of Use Assets 2,969 2,889 2,721 2,582 2,408 2,259
Intangibles 1,070 1,211 1,247 1,202 1,135 1,015
Other 629 525 513 508 395 396 Total Non-Financial Assets 140,363 120,383 126,748 131,991 136,720 141,363
Total Assets 144,774 124,197 130,616 136,180 141,473 146,726
Liabilities
Deposits Held 21 38 55 25 25 25
Payables 2,005 1,984 2,337 2,650 3,071 3,148
Contract Liabilities 108 160 129 85 86 88
Liabilities Directly Associated with Assets Held for Sale ... ... ... ... ... ...
Borrowings and Derivatives at Fair Value 7 8 8 8 8 8
Borrowings at Amortised Cost 26,707 28,441 30,176 31,953 33,578 34,593
Advances Received 463 448 432 297 282 267
Employee Provisions 1,227 1,262 1,267 1,274 1,289 1,298
Superannuation Provision(a) 3,057 2,092 1,809 1,546 1,188 982
Tax Equivalents Payable 0 17 44 50 63 75
Deferred Tax Equivalent Provision 2,129 2,134 2,166 2,228 2,317 2,431
Other Provisions 1,664 933 864 857 916 1,709
Other 192 246 235 229 221 215 Total Liabilities 37,580 37,761 39,523 41,201 43,042 44,838
NET ASSETS 107,193 86,436 91,093 94,979 98,431 101,889
NET WORTH
Accumulated Funds 47,004 33,380 33,244 33,111 32,744 31,668
Reserves 60,190 53,056 57,849 61,868 65,687 70,220 TOTAL NET WORTH 107,193 86,436 91,093 94,979 98,431 101,889
OTHER FISCAL AGGREGATES
Net Debt(b) 24,424 26,618 28,192 29,520 30,659 31,124
Net Financial Liabilities(c) 33,170 33,947 35,655 37,012 38,290 39,474
Net Financial Worth(d) (33,170) (33,947) (35,655) (37,012) (38,290) (39,474)
(a) The Superannuation Provision is reported net of prepaid superannuation contribution assets. (b) Net debt comprises the sum of deposits held, borrowings and advances received, minus the sum of cash and cash
equivalents, investments, loans and placements and advances paid. (c) Net financial liabilities equals total liabilities less financial assets excluding equity investments in other public sector entities. (d) Net financial worth equals total financial assets minus total financial liabilities.
Statement of Finances
A1 - 16 Budget Statement 2021-22
Table A1.11: Public non-financial corporations sector cash flow statement
2019-20 2020-21 2021-22 2022-23 2023-24 2024-25
Actual Revised Budget Forward Estimates
$m $m $m $m $m $m
Cash Receipts from Operating Activities Sales of Goods and Services 7,728 7,041 8,019 8,563 9,207 9,778
Grant and Subsidies 3,151 4,451 3,997 3,150 3,062 3,086
Interest 51 17 13 13 14 14
Other 1,119 826 739 777 764 833
Total Cash Receipts from Operating Activities 12,049 12,335 12,767 12,503 13,046 13,711
Cash Payments from Operating Activities Employee Related (2,420) (2,503) (2,697) (2,662) (2,692) (2,669)
Personnel Services (644) (642) (678) (685) (698) (711)
Superannuation (229) (178) (246) (260) (269) (280)
Payments for Goods and Services (5,380) (5,513) (5,393) (5,165) (5,353) (5,571)
Grants and Subsidies (60) (109) (75) (73) (72) (63)
Interest (946) (859) (900) (863) (921) (1,002)
Distributions Paid (301) (148) (138) (173) (198) (233)
Other (1,067) (596) (203) (240) (117) (518)
Total Cash Payments from Operating Activities (11,046) (10,548) (10,331) (10,121) (10,319) (11,048)
Net Cash Flows from Operating Activities 1,003 1,787 2,437 2,382 2,727 2,663
Cash Flows from Investments in Non-Financial Assets Proceeds from Sale of Non-Financial Assets 264 196 403 673 390 376
Purchases of Non-Financial Assets (4,258) (5,168) (7,054) (6,406) (5,447) (3,820)Net Cash Flows from Investments in Non-Financial
Assets (3,994) (4,972) (6,651) (5,733) (5,056) (3,444)Cash Flows from Investments in Financial Assets for Policy Purposes Receipts (26) 0 0 0 0 0
Payments 0 0 (0) 0 0 0
Net Cash Flows from Investments in Financial Assets for Policy Purposes (26) 0 (0) ... ... ...
Cash Flows from Investments in Financial Assets for Liquidity Purposes Proceeds from Sale of Investments 192 4 75 23 28 18
Purchase of Investments (5) (39) ... ... ... ...
Net Cash Flows from Investments in Financial Assets for Liquidity Purposes 186 (34) 75 23 28 18
Net Cash Flows from Investing Activities (3,834) (5,006) (6,575) (5,710) (5,029) (3,426)
Cash Flows from Financing Activities Advances (Net) 1,933 3,270 3,053 2,419 1,919 838
Proceeds from Borrowings 1,841 1,491 2,003 2,045 1,736 1,440
Repayment of Borrowings (643) (345) (375) (394) (386) (399)
Dividends Paid (727) (1,426) (381) (368) (411) (495)
Deposits Received (Net) (49) 17 17 (30) ... ...
Other (Net) 9 (7) (28) (60) (79) (92)
Net Cash Flows from Financing Activities 2,364 3,000 4,289 3,612 2,778 1,292
Net Increase/(Decrease) in Cash Held (468) (219) 151 284 477 528
Derivation of Cash Result Net Cash Flows from Operating Activities 1,003 1,787 2,437 2,382 2,727 2,663
Net Cash Flows from Investments in Non-Financial Assets (3,994) (4,972) (6,651) (5,733) (5,056) (3,444)
Dividends Paid (727) (1,426) (381) (368) (411) (495)
Cash Surplus/(Deficit) (3,718) (4,611) (4,595) (3,719) (2,741) (1,276)
Statement of Finances
Budget Statement 2021-22 A1 - 17
Table A1.12: Non-financial public sector operating statement
2019-20 2020-21 2021-22 2022-23 2023-24 2024-25
Actual Revised Budget Forward Estimates
$m $m $m $m $m $m
Revenue from Transactions Taxation 29,419 33,527 35,650 37,324 37,558 37,770
Grants and Subsidies - Commonwealth General Purpose 18,073 18,926 21,819 22,302 22,265 22,432
- Commonwealth Specific Purpose Payments 11,278 12,055 12,261 12,422 13,089 13,760
- Commonwealth National Partnership Payments 3,886 4,088 3,300 4,308 4,159 4,064
- Other Commonwealth Payments 458 528 728 544 578 620
- Other Grants and Subsidies 531 548 540 496 558 484
Sale of Goods and Services 13,525 13,118 14,731 14,915 15,581 16,233
Interest. 361 306 270 291 292 282 Dividend and Income Tax Equivalents from Other Sectors 98 131 144 159 173 401
Other Dividends and Distributions 2,432 2,391 2,283 2,990 3,685 4,865
Fines, Regulatory Fees and Other 4,729 4,533 5,094 4,973 5,112 5,039
Total Revenue from Transactions 84,791 90,151 96,821 100,722 103,051 105,950
Expenses from Transactions Employee 37,905 39,742 41,389 42,612 43,783 45,176
Superannuation - Superannuation Interest Cost 927 610 990 1,049 1,083 1,157
- Other Superannuation 3,502 3,598 3,794 3,890 4,063 4,313
Depreciation and Amortisation 9,139 10,384 10,030 10,669 11,212 11,739
Interest 3,069 3,291 3,672 4,125 4,781 5,518
Other Operating Expense 25,654 26,006 27,519 25,221 25,808 25,630
Grants, Subsidies and Other Transfers 14,124 16,443 18,405 15,409 13,210 13,119
Total Expenses from Transactions 94,320 100,074 105,799 102,975 103,940 106,653
Transactions from Discontinuing Operations ... ... ... ... ... ...
NET OPERATING BALANCE - SURPLUS/(DEFICIT) (9,529) (9,923) (8,979) (2,253) (889) (703)
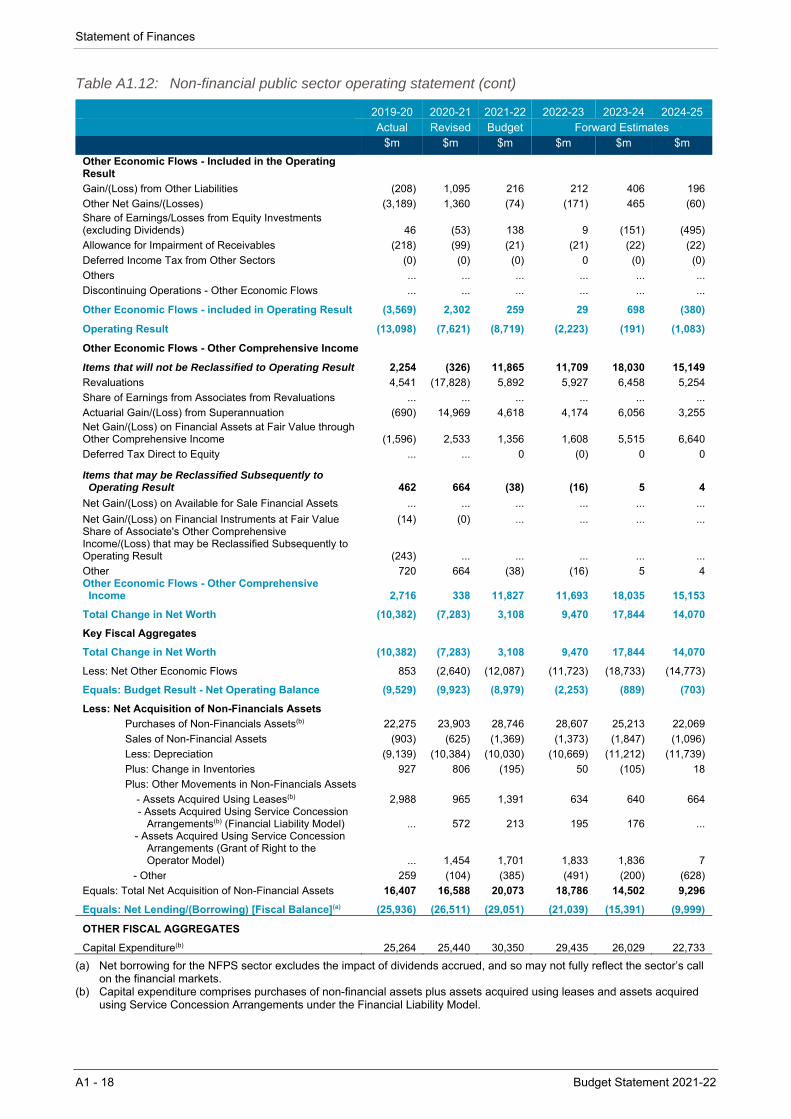
Statement of Finances
A1 - 18 Budget Statement 2021-22
Table A1.12: Non-financial public sector operating statement (cont)
2019-20 2020-21 2021-22 2022-23 2023-24 2024-25
Actual Revised Budget Forward Estimates
$m $m $m $m $m $m
Other Economic Flows - Included in the Operating Result
Gain/(Loss) from Other Liabilities (208) 1,095 216 212 406 196
Other Net Gains/(Losses) (3,189) 1,360 (74) (171) 465 (60)Share of Earnings/Losses from Equity Investments (excluding Dividends) 46 (53) 138 9 (151) (495)
Allowance for Impairment of Receivables (218) (99) (21) (21) (22) (22)
Deferred Income Tax from Other Sectors (0) (0) (0) 0 (0) (0)
Others ... ... ... ... ... ...
Discontinuing Operations - Other Economic Flows ... ... ... ... ... ...
Other Economic Flows - included in Operating Result (3,569) 2,302 259 29 698 (380)
Operating Result (13,098) (7,621) (8,719) (2,223) (191) (1,083)
Other Economic Flows - Other Comprehensive Income Items that will not be Reclassified to Operating Result 2,254 (326) 11,865 11,709 18,030 15,149
Revaluations 4,541 (17,828) 5,892 5,927 6,458 5,254
Share of Earnings from Associates from Revaluations ... ... ... ... ... ...
Actuarial Gain/(Loss) from Superannuation (690) 14,969 4,618 4,174 6,056 3,255Net Gain/(Loss) on Financial Assets at Fair Value through Other Comprehensive Income (1,596) 2,533 1,356 1,608 5,515 6,640
Deferred Tax Direct to Equity ... ... 0 (0) 0 0
Items that may be Reclassified Subsequently to Operating Result 462 664 (38) (16) 5 4
Net Gain/(Loss) on Available for Sale Financial Assets ... ... ... ... ... ...
Net Gain/(Loss) on Financial Instruments at Fair Value (14) (0) ... ... ... ...Share of Associate's Other Comprehensive Income/(Loss) that may be Reclassified Subsequently to Operating Result (243) ... ... ... ... ...
Other 720 664 (38) (16) 5 4 Other Economic Flows - Other Comprehensive Income 2,716 338 11,827 11,693 18,035 15,153
Total Change in Net Worth (10,382) (7,283) 3,108 9,470 17,844 14,070
Key Fiscal Aggregates Total Change in Net Worth (10,382) (7,283) 3,108 9,470 17,844 14,070
Less: Net Other Economic Flows 853 (2,640) (12,087) (11,723) (18,733) (14,773)
Equals: Budget Result - Net Operating Balance (9,529) (9,923) (8,979) (2,253) (889) (703)
Less: Net Acquisition of Non-Financials Assets Purchases of Non-Financials Assets(b) 22,275 23,903 28,746 28,607 25,213 22,069
Sales of Non-Financial Assets (903) (625) (1,369) (1,373) (1,847) (1,096)
Less: Depreciation (9,139) (10,384) (10,030) (10,669) (11,212) (11,739)
Plus: Change in Inventories 927 806 (195) 50 (105) 18
Plus: Other Movements in Non-Financials Assets - Assets Acquired Using Leases(b) 2,988 965 1,391 634 640 664 - Assets Acquired Using Service Concession
Arrangements(b) (Financial Liability Model) ... 572 213 195 176 ... - Assets Acquired Using Service Concession
Arrangements (Grant of Right to the Operator Model) ... 1,454 1,701 1,833 1,836 7
- Other 259 (104) (385) (491) (200) (628)
Equals: Total Net Acquisition of Non-Financial Assets 16,407 16,588 20,073 18,786 14,502 9,296
Equals: Net Lending/(Borrowing) [Fiscal Balance](a) (25,936) (26,511) (29,051) (21,039) (15,391) (9,999)
OTHER FISCAL AGGREGATES
Capital Expenditure(b) 25,264 25,440 30,350 29,435 26,029 22,733
(a) Net borrowing for the NFPS sector excludes the impact of dividends accrued, and so may not fully reflect the sector’s call on the financial markets.
(b) Capital expenditure comprises purchases of non-financial assets plus assets acquired using leases and assets acquired using Service Concession Arrangements under the Financial Liability Model.
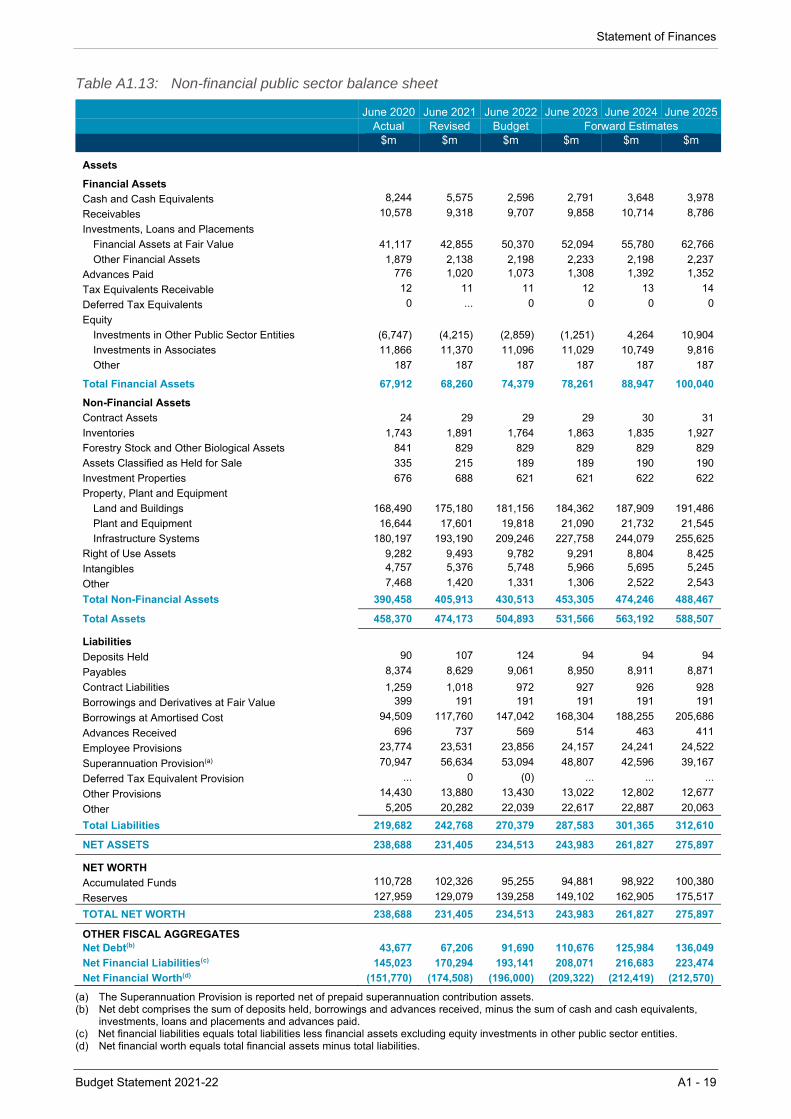
Statement of Finances
Budget Statement 2021-22 A1 - 19
Table A1.13: Non-financial public sector balance sheet
June 2020 June 2021 June 2022 June 2023 June 2024 June 2025 Actual Revised Budget Forward Estimates
$m $m $m $m $m $m
Assets
Financial Assets
Cash and Cash Equivalents 8,244 5,575 2,596 2,791 3,648 3,978
Receivables 10,578 9,318 9,707 9,858 10,714 8,786
Investments, Loans and Placements
Financial Assets at Fair Value 41,117 42,855 50,370 52,094 55,780 62,766
Other Financial Assets 1,879 2,138 2,198 2,233 2,198 2,237
Advances Paid 776 1,020 1,073 1,308 1,392 1,352
Tax Equivalents Receivable 12 11 11 12 13 14
Deferred Tax Equivalents 0 ... 0 0 0 0
Equity
Investments in Other Public Sector Entities (6,747) (4,215) (2,859) (1,251) 4,264 10,904
Investments in Associates 11,866 11,370 11,096 11,029 10,749 9,816
Other 187 187 187 187 187 187
Total Financial Assets 67,912 68,260 74,379 78,261 88,947 100,040
Non-Financial Assets Contract Assets 24 29 29 29 30 31
Inventories 1,743 1,891 1,764 1,863 1,835 1,927
Forestry Stock and Other Biological Assets 841 829 829 829 829 829
Assets Classified as Held for Sale 335 215 189 189 190 190
Investment Properties 676 688 621 621 622 622
Property, Plant and Equipment Land and Buildings 168,490 175,180 181,156 184,362 187,909 191,486
Plant and Equipment 16,644 17,601 19,818 21,090 21,732 21,545
Infrastructure Systems 180,197 193,190 209,246 227,758 244,079 255,625
Right of Use Assets 9,282 9,493 9,782 9,291 8,804 8,425
Intangibles 4,757 5,376 5,748 5,966 5,695 5,245
Other 7,468 1,420 1,331 1,306 2,522 2,543
Total Non-Financial Assets 390,458 405,913 430,513 453,305 474,246 488,467
Total Assets 458,370 474,173 504,893 531,566 563,192 588,507
Liabilities
Deposits Held 90 107 124 94 94 94
Payables 8,374 8,629 9,061 8,950 8,911 8,871
Contract Liabilities 1,259 1,018 972 927 926 928
Borrowings and Derivatives at Fair Value 399 191 191 191 191 191
Borrowings at Amortised Cost 94,509 117,760 147,042 168,304 188,255 205,686
Advances Received 696 737 569 514 463 411
Employee Provisions 23,774 23,531 23,856 24,157 24,241 24,522
Superannuation Provision(a) 70,947 56,634 53,094 48,807 42,596 39,167
Deferred Tax Equivalent Provision ... 0 (0) ... ... ...
Other Provisions 14,430 13,880 13,430 13,022 12,802 12,677
Other 5,205 20,282 22,039 22,617 22,887 20,063
Total Liabilities 219,682 242,768 270,379 287,583 301,365 312,610
NET ASSETS 238,688 231,405 234,513 243,983 261,827 275,897
NET WORTH
Accumulated Funds 110,728 102,326 95,255 94,881 98,922 100,380
Reserves 127,959 129,079 139,258 149,102 162,905 175,517
TOTAL NET WORTH 238,688 231,405 234,513 243,983 261,827 275,897
OTHER FISCAL AGGREGATES
Net Debt(b) 43,677 67,206 91,690 110,676 125,984 136,049
Net Financial Liabilities(c) 145,023 170,294 193,141 208,071 216,683 223,474
Net Financial Worth(d) (151,770) (174,508) (196,000) (209,322) (212,419) (212,570)
(a) The Superannuation Provision is reported net of prepaid superannuation contribution assets. (b) Net debt comprises the sum of deposits held, borrowings and advances received, minus the sum of cash and cash equivalents,
investments, loans and placements and advances paid. (c) Net financial liabilities equals total liabilities less financial assets excluding equity investments in other public sector entities. (d) Net financial worth equals total financial assets minus total liabilities.
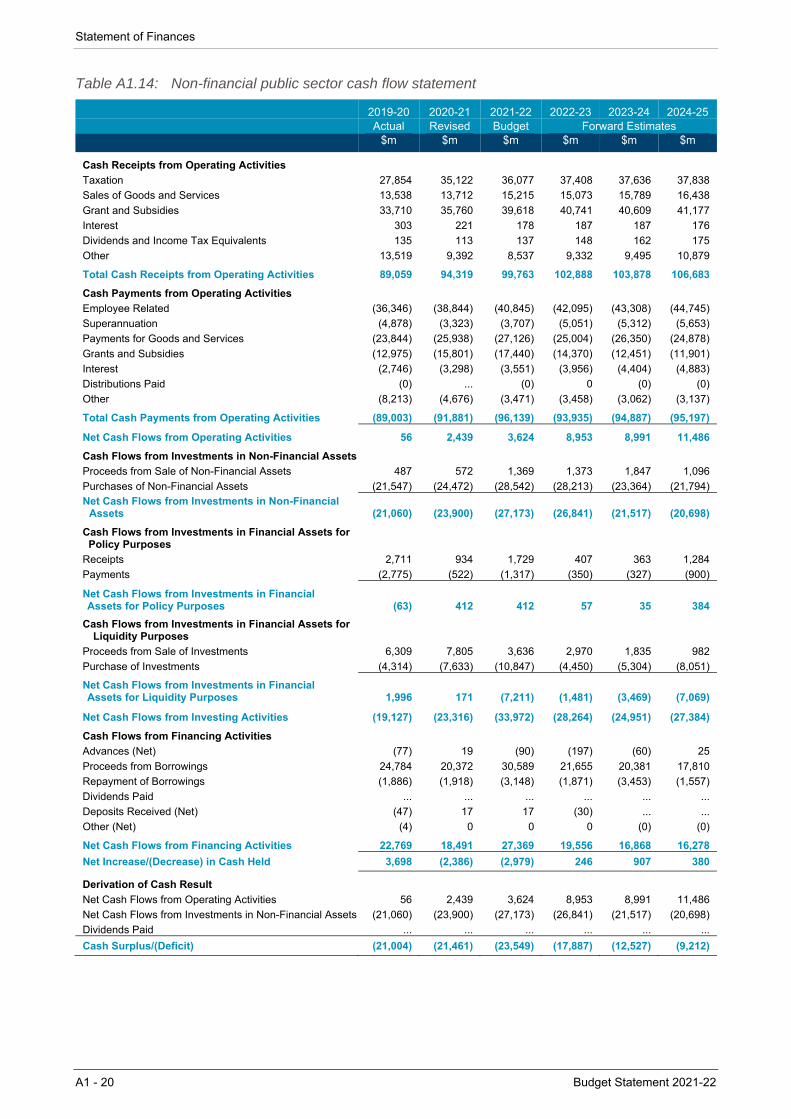
Statement of Finances
A1 - 20 Budget Statement 2021-22
Table A1.14: Non-financial public sector cash flow statement
2019-20 2020-21 2021-22 2022-23 2023-24 2024-25 Actual Revised Budget Forward Estimates
$m $m $m $m $m $m
Cash Receipts from Operating Activities Taxation 27,854 35,122 36,077 37,408 37,636 37,838
Sales of Goods and Services 13,538 13,712 15,215 15,073 15,789 16,438
Grant and Subsidies 33,710 35,760 39,618 40,741 40,609 41,177
Interest 303 221 178 187 187 176
Dividends and Income Tax Equivalents 135 113 137 148 162 175
Other 13,519 9,392 8,537 9,332 9,495 10,879
Total Cash Receipts from Operating Activities 89,059 94,319 99,763 102,888 103,878 106,683
Cash Payments from Operating Activities Employee Related (36,346) (38,844) (40,845) (42,095) (43,308) (44,745)
Superannuation (4,878) (3,323) (3,707) (5,051) (5,312) (5,653)
Payments for Goods and Services (23,844) (25,938) (27,126) (25,004) (26,350) (24,878)
Grants and Subsidies (12,975) (15,801) (17,440) (14,370) (12,451) (11,901)
Interest (2,746) (3,298) (3,551) (3,956) (4,404) (4,883)
Distributions Paid (0) ... (0) 0 (0) (0)
Other (8,213) (4,676) (3,471) (3,458) (3,062) (3,137)
Total Cash Payments from Operating Activities (89,003) (91,881) (96,139) (93,935) (94,887) (95,197)
Net Cash Flows from Operating Activities 56 2,439 3,624 8,953 8,991 11,486
Cash Flows from Investments in Non-Financial Assets Proceeds from Sale of Non-Financial Assets 487 572 1,369 1,373 1,847 1,096
Purchases of Non-Financial Assets (21,547) (24,472) (28,542) (28,213) (23,364) (21,794)
Net Cash Flows from Investments in Non-Financial Assets (21,060) (23,900) (27,173) (26,841) (21,517) (20,698)
Cash Flows from Investments in Financial Assets for Policy Purposes Receipts 2,711 934 1,729 407 363 1,284
Payments (2,775) (522) (1,317) (350) (327) (900)
Net Cash Flows from Investments in Financial Assets for Policy Purposes (63) 412 412 57 35 384
Cash Flows from Investments in Financial Assets for Liquidity Purposes
Proceeds from Sale of Investments 6,309 7,805 3,636 2,970 1,835 982
Purchase of Investments (4,314) (7,633) (10,847) (4,450) (5,304) (8,051)
Net Cash Flows from Investments in Financial Assets for Liquidity Purposes 1,996 171 (7,211) (1,481) (3,469) (7,069)
Net Cash Flows from Investing Activities (19,127) (23,316) (33,972) (28,264) (24,951) (27,384)
Cash Flows from Financing Activities Advances (Net) (77) 19 (90) (197) (60) 25
Proceeds from Borrowings 24,784 20,372 30,589 21,655 20,381 17,810
Repayment of Borrowings (1,886) (1,918) (3,148) (1,871) (3,453) (1,557)
Dividends Paid ... ... ... ... ... ...
Deposits Received (Net) (47) 17 17 (30) ... ...
Other (Net) (4) 0 0 0 (0) (0)
Net Cash Flows from Financing Activities 22,769 18,491 27,369 19,556 16,868 16,278
Net Increase/(Decrease) in Cash Held 3,698 (2,386) (2,979) 246 907 380
Derivation of Cash Result Net Cash Flows from Operating Activities 56 2,439 3,624 8,953 8,991 11,486
Net Cash Flows from Investments in Non-Financial Assets (21,060) (23,900) (27,173) (26,841) (21,517) (20,698)
Dividends Paid ... ... ... ... ... ...
Cash Surplus/(Deficit) (21,004) (21,461) (23,549) (17,887) (12,527) (9,212)
Budget Statement 2021-22 A2 - 1
A2. TAX EXPENDITURE AND CONCESSIONAL CHARGES STATEMENT
Favourable tax treatment or lower fees or service charges may be granted to certain individuals, groups or organisations to support policy objectives. This tax expenditure and concessional charges statement recognises that such special treatment is economically equivalent to increasing expenses and has the same effect on the budget outcome.
Tax expenditure estimates measure the additional tax that would have been payable if ‘benchmark’ (or standard) tax structures had been applied to all taxpayers and economic behaviour had remained unchanged. Tax expenditures arise from deviations from the benchmarks and include specific tax exemptions, allowances and deductions, reduced tax rates, deferral of tax liabilities and tax credits.
Concessional charges are included for government agencies that provide goods and services to certain users at a lower fee or charge than to the wider community, in pursuit of economic or social policy goals, such as reducing the cost of living. The provision of these concessions may be supported directly from the Budget or indirectly through a reduction in agency obligations to make dividend or other payments, or a reduction in agency retained earnings. These concessions have a budget cost, regardless of whether they are the subject of a specific intra-government transfer.
Judgement is required in delineating the ‘concessional’ and ‘structural’ features of a particular tax or service delivery scheme. The approach adopted is to treat the general application of a tiered tax schedule or charging regime as a structural element of the benchmark, rather than a concession to those paying less than the highest marginal rate of tax. For example, providing lower public transport fares for all children is included in the benchmark rather than as a concession. However, subsidised travel for eligible school children and senior citizens is treated as a concession. Provisions to prevent double taxation or to otherwise support the conceptual structure of a tax, rather than provide a benefit to a particular group of taxpayers, are generally excluded.
Caution should be exercised when using these estimates. They may not be comparable to estimates in other jurisdictions, which may use different definitions of the ‘structural’ and ‘concessional’ elements of taxes and charges. Similarly, changes to the benchmark definition and the classification of concessions may limit the comparability of some estimates to those in earlier Budgets. Importantly, the estimates do not measure the amount of revenue that could be expected if the relevant concessional treatment were abolished, nor do they provide a reliable indication of the economic costs and benefits. This is because the concessions themselves influence behaviour patterns and levels of activity, which could be quite different in their absence.
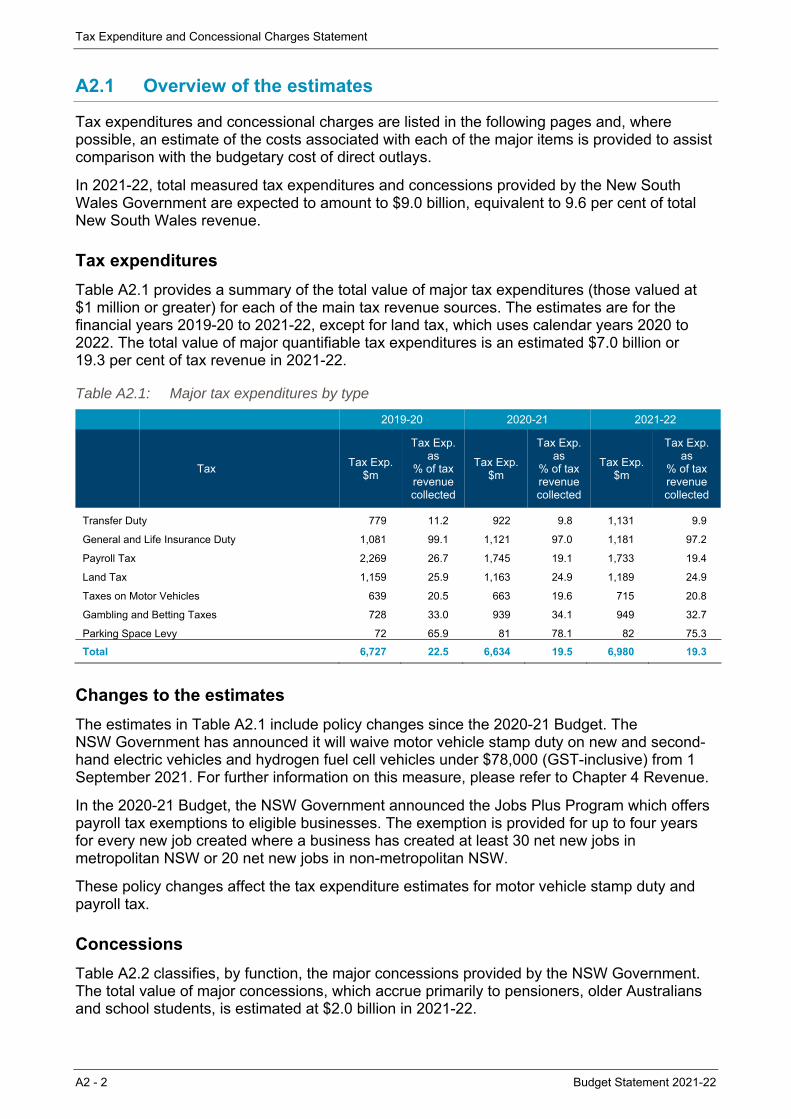
Tax Expenditure and Concessional Charges Statement
A2 - 2 Budget Statement 2021-22
A2.1 Overview of the estimates
Tax expenditures and concessional charges are listed in the following pages and, where possible, an estimate of the costs associated with each of the major items is provided to assist comparison with the budgetary cost of direct outlays.
In 2021-22, total measured tax expenditures and concessions provided by the New South Wales Government are expected to amount to $9.0 billion, equivalent to 9.6 per cent of total New South Wales revenue.
Tax expenditures
Table A2.1 provides a summary of the total value of major tax expenditures (those valued at $1 million or greater) for each of the main tax revenue sources. The estimates are for the financial years 2019-20 to 2021-22, except for land tax, which uses calendar years 2020 to 2022. The total value of major quantifiable tax expenditures is an estimated $7.0 billion or 19.3 per cent of tax revenue in 2021-22.
Table A2.1: Major tax expenditures by type
2019-20 2020-21 2021-22
Tax Tax Exp.
$m
Tax Exp. as
% of taxrevenuecollected
Tax Exp.$m
Tax Exp. as
% of tax revenue collected
Tax Exp. $m
Tax Exp. as
% of tax revenue collected
Transfer Duty 779 11.2 922 9.8 1,131 9.9
General and Life Insurance Duty 1,081 99.1 1,121 97.0 1,181 97.2
Payroll Tax 2,269 26.7 1,745 19.1 1,733 19.4
Land Tax 1,159 25.9 1,163 24.9 1,189 24.9
Taxes on Motor Vehicles 639 20.5 663 19.6 715 20.8
Gambling and Betting Taxes 728 33.0 939 34.1 949 32.7
Parking Space Levy 72 65.9 81 78.1 82 75.3
Total 6,727 22.5 6,634 19.5 6,980 19.3
Changes to the estimates
The estimates in Table A2.1 include policy changes since the 2020-21 Budget. The NSW Government has announced it will waive motor vehicle stamp duty on new and second-hand electric vehicles and hydrogen fuel cell vehicles under $78,000 (GST-inclusive) from 1 September 2021. For further information on this measure, please refer to Chapter 4 Revenue.
In the 2020-21 Budget, the NSW Government announced the Jobs Plus Program which offers payroll tax exemptions to eligible businesses. The exemption is provided for up to four years for every new job created where a business has created at least 30 net new jobs in metropolitan NSW or 20 net new jobs in non-metropolitan NSW.
These policy changes affect the tax expenditure estimates for motor vehicle stamp duty and payroll tax.
Concessions
Table A2.2 classifies, by function, the major concessions provided by the NSW Government. The total value of major concessions, which accrue primarily to pensioners, older Australians and school students, is estimated at $2.0 billion in 2021-22.

Tax Expenditure and Concessional Charges Statement
Budget Statement 2021-22 A2 - 3
Table A2.2: Concessions by function
Function 2019-20 2020-21 2021-22$m $m $m
Public Order and Safety 12 12 14
Education 623 627 697
Health 286 294 288
Transport 512 445 460
Housing and Community 527 597 541
Economic Affairs 13 15 11
Recreation, Culture and Religion 4 4 4
Environmental Protection 12 13 14
Total 1,989 2,007 2,029
The following sections provide a breakdown by taxation line. Tax expenditure measures and concessions that have an impact over $1 million are itemised in a table. Those with an impact less than $1 million are then summarised.
A2.2 Transfer duty (including landholder duty)
The benchmark tax base includes all transfers of dutiable property as defined in Chapter 2 of the Duties Act 1997, including New South Wales land, land use entitlements, transferable floor space, and partnership interests. Indirect acquisition of land under Chapter 4 of the Duties Act 1997 (landholder duty) is also included.
The benchmark tax structure comprises a tiered rate scale with marginal tax rates varying from 1.25 to 5.5 per cent over six steps. A premium marginal rate of 7 per cent applies for residential property valued above $3.1 million.
The basis for determining the value of land that establishes the threshold for the purposes of triggering landholder duty on the acquisition of an interest in a landholder was changed so that unencumbered value is used instead of unimproved land value, effective from 24 June 2020.
Surcharge purchaser duty applies to purchases of residential land by foreign persons at a rate of 8 per cent.
From 1 August 2020 to 31 July 2021, transfer duty thresholds for first home buyer exemptions or concessions have been temporarily increased for the purchase of a new home up to a value of $1 million, or vacant land for homebuilding up to $500,000.
The Duties Act 1997 includes a number of exemptions designed to exclude the application of duty (apart from a nominal charge) to transactions where:
duty has already been applied to an associated legal instrument or
the change in legal ownership does not produce a change in beneficial ownership.
Exemptions that fall under the first of these two categories are not included as a tax expenditure, as exemptions of this nature are designed to avoid the double taxation that could occur if the exemption were not provided. Exemptions that fall under the second of these two categories are also not included, as they are designed to support the underlying structure of transfer duty, rather than to provide a benefit to a particular group of taxpayers. Examples of this second category include exemptions for changes in trustees, and the rearranging of assets within subsidiaries of the same corporate group.
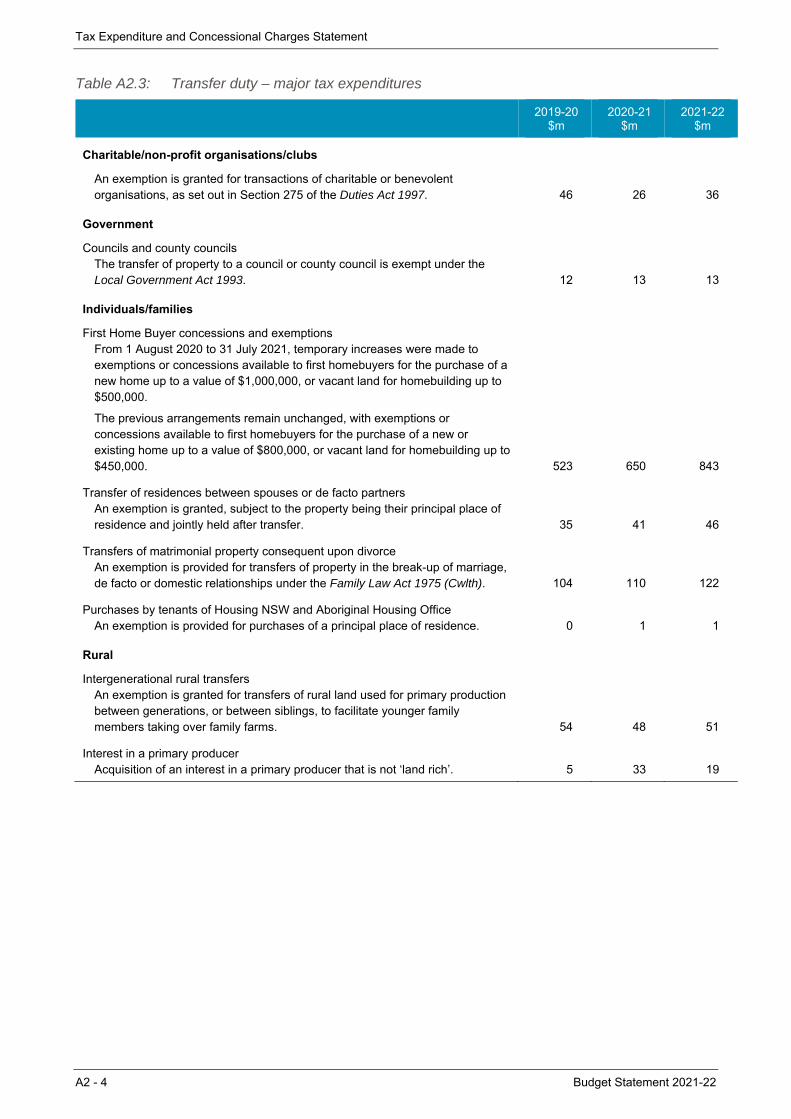
Tax Expenditure and Concessional Charges Statement
A2 - 4 Budget Statement 2021-22
Table A2.3: Transfer duty – major tax expenditures
2019-20
$m 2020-21
$m 2021-22
$m
Charitable/non-profit organisations/clubs
An exemption is granted for transactions of charitable or benevolent organisations, as set out in Section 275 of the Duties Act 1997. 46 26 36
Government
Councils and county councils The transfer of property to a council or county council is exempt under the Local Government Act 1993. 12 13 13
Individuals/families
First Home Buyer concessions and exemptions From 1 August 2020 to 31 July 2021, temporary increases were made to exemptions or concessions available to first homebuyers for the purchase of a new home up to a value of $1,000,000, or vacant land for homebuilding up to $500,000.
The previous arrangements remain unchanged, with exemptions or concessions available to first homebuyers for the purchase of a new or existing home up to a value of $800,000, or vacant land for homebuilding up to $450,000. 523 650 843
Transfer of residences between spouses or de facto partners An exemption is granted, subject to the property being their principal place of residence and jointly held after transfer. 35 41 46
Transfers of matrimonial property consequent upon divorce An exemption is provided for transfers of property in the break-up of marriage, de facto or domestic relationships under the Family Law Act 1975 (Cwlth). 104 110 122
Purchases by tenants of Housing NSW and Aboriginal Housing Office An exemption is provided for purchases of a principal place of residence. 0 1 1
Rural
Intergenerational rural transfers An exemption is granted for transfers of rural land used for primary production between generations, or between siblings, to facilitate younger family members taking over family farms. 54 48 51
Interest in a primary producer Acquisition of an interest in a primary producer that is not ‘land rich’. 5 33 19
Tax Expenditure and Concessional Charges Statement
Budget Statement 2021-22 A2 - 5
Transfer duty – other major tax expenditures (> $1 million)1
Only nominal duty is charged on transfers of property to a beneficiary entitled to it under the will of a deceased person
For ‘off the plan’ purchases by owner occupiers, duty may be deferred until completion of the sale or 12 months after the contract, whichever occurs first.
Transfer duty – minor tax expenditures (< $1 million)
The following are exempt from transfer duty:
approved equity release schemes for aged home owners
certain purchases of manufactured relocatable homes (caravans)
certain transfers of property granted in other legislation
call option assignments, subject to certain conditions
transfer of a liquor licence in certain circumstances under the Liquor Act 2007
transfer of property related to a joint government enterprise that has the function of allocating funds for water savings projects
transfers where public hospitals are the liable party
transfer of properties gifted to a special disability trust
instruments executed by or on behalf of a council or county council under the Local Government Act 1993, not connected with a trading undertaking
transfers for the purpose of amalgamation or de-amalgamation of clubs under the Registered Clubs Act 1976
instruments executed by or on behalf of agencies within the meaning of the Convention on the Privileges and Immunities of the Specialised Agencies approved by the General Assembly of the United Nations in 1947
transfers between associations of employees or employers registered under the Workplace Relations Act 1996 (Cwlth) for the purpose of amalgamation
transfer of property to the NSW Aboriginal Land Council or Local Aboriginal Land Councils
transfers of property between licensed insurers, and between the State Insurance Regulatory Authority (SIRA) and licensed insurers, under the Workers Compensation Act 1987.
Concessional duty is charged in relation to:
acquisitions in unit trust schemes, private companies or listed companies with land holdings in New South Wales of $2 million or more, where the acquisition is for the purpose of securing financial accommodation
buy-back arrangements of widely held unit trust schemes for the purpose of re-issuing or re-offering the units for sale, subject to certain criteria
amalgamations of certain Western Lands leases under the Western Lands Act 1901 where transfer duty has been paid on the transfer of other such leases in the previous three years.
The following are exempt from surcharge purchaser duty:
1 Items listed under the ‘other major tax expenditures’ headings are those where the value of the tax expenditure is
estimated to be more than $1 million in at least one year, but there is insufficient data available on which to base a reliable estimate.
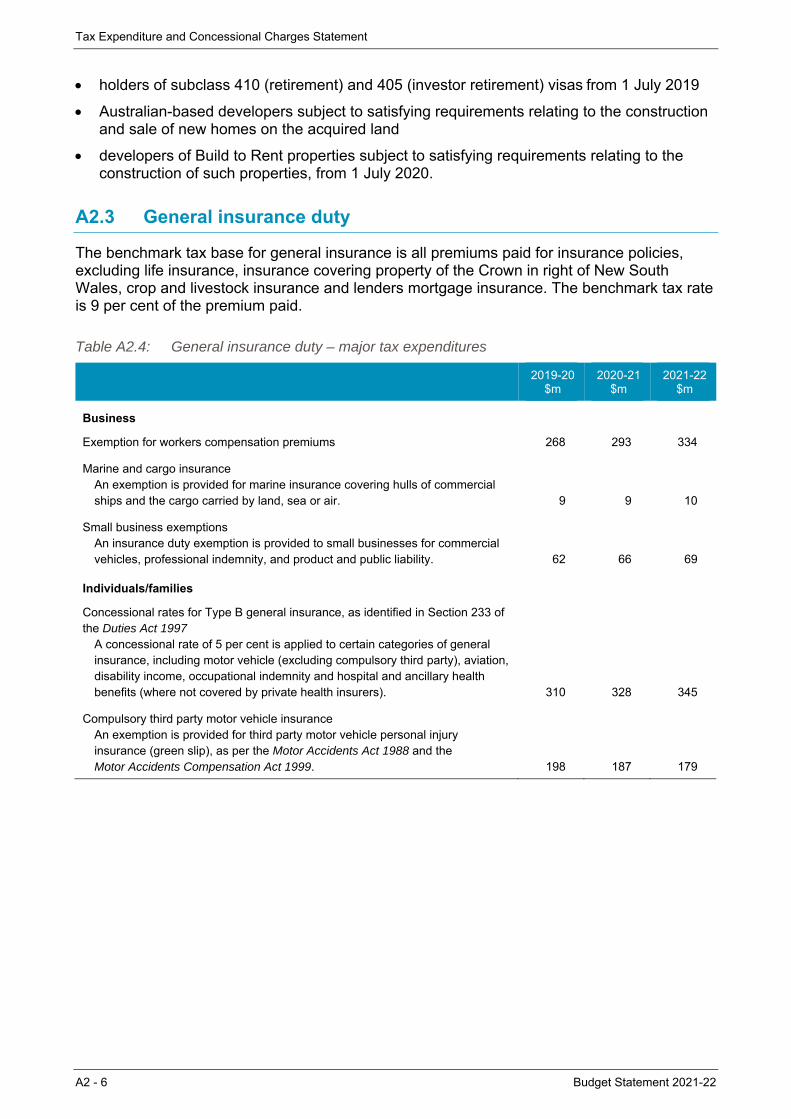
Tax Expenditure and Concessional Charges Statement
A2 - 6 Budget Statement 2021-22
holders of subclass 410 (retirement) and 405 (investor retirement) visas from 1 July 2019
Australian-based developers subject to satisfying requirements relating to the construction and sale of new homes on the acquired land
developers of Build to Rent properties subject to satisfying requirements relating to the construction of such properties, from 1 July 2020.
A2.3 General insurance duty
The benchmark tax base for general insurance is all premiums paid for insurance policies, excluding life insurance, insurance covering property of the Crown in right of New South Wales, crop and livestock insurance and lenders mortgage insurance. The benchmark tax rate is 9 per cent of the premium paid.
Table A2.4: General insurance duty – major tax expenditures
2019-20
$m 2020-21
$m 2021-22
$m
Business
Exemption for workers compensation premiums 268 293 334
Marine and cargo insurance An exemption is provided for marine insurance covering hulls of commercial ships and the cargo carried by land, sea or air. 9 9 10
Small business exemptions An insurance duty exemption is provided to small businesses for commercial vehicles, professional indemnity, and product and public liability. 62 66 69
Individuals/families
Concessional rates for Type B general insurance, as identified in Section 233 of the Duties Act 1997
A concessional rate of 5 per cent is applied to certain categories of general insurance, including motor vehicle (excluding compulsory third party), aviation, disability income, occupational indemnity and hospital and ancillary health benefits (where not covered by private health insurers). 310 328 345
Compulsory third party motor vehicle insurance An exemption is provided for third party motor vehicle personal injury insurance (green slip), as per the Motor Accidents Act 1988 and the Motor Accidents Compensation Act 1999. 198 187 179
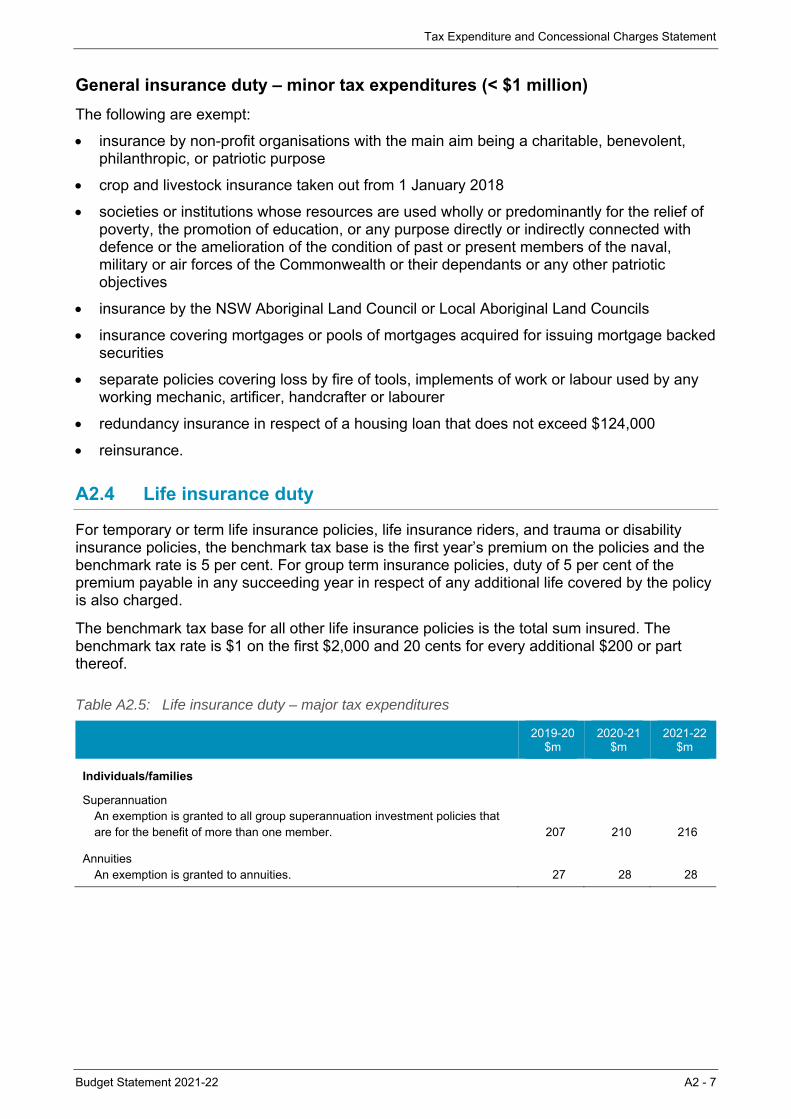
Tax Expenditure and Concessional Charges Statement
Budget Statement 2021-22 A2 - 7
General insurance duty – minor tax expenditures (< $1 million)
The following are exempt:
insurance by non-profit organisations with the main aim being a charitable, benevolent, philanthropic, or patriotic purpose
crop and livestock insurance taken out from 1 January 2018
societies or institutions whose resources are used wholly or predominantly for the relief of poverty, the promotion of education, or any purpose directly or indirectly connected with defence or the amelioration of the condition of past or present members of the naval, military or air forces of the Commonwealth or their dependants or any other patriotic objectives
insurance by the NSW Aboriginal Land Council or Local Aboriginal Land Councils
insurance covering mortgages or pools of mortgages acquired for issuing mortgage backed securities
separate policies covering loss by fire of tools, implements of work or labour used by any working mechanic, artificer, handcrafter or labourer
redundancy insurance in respect of a housing loan that does not exceed $124,000
reinsurance.
A2.4 Life insurance duty
For temporary or term life insurance policies, life insurance riders, and trauma or disability insurance policies, the benchmark tax base is the first year’s premium on the policies and the benchmark rate is 5 per cent. For group term insurance policies, duty of 5 per cent of the premium payable in any succeeding year in respect of any additional life covered by the policy is also charged.
The benchmark tax base for all other life insurance policies is the total sum insured. The benchmark tax rate is $1 on the first $2,000 and 20 cents for every additional $200 or part thereof.
Table A2.5: Life insurance duty – major tax expenditures
2019-20
$m 2020-21
$m 2021-22
$m
Individuals/families
Superannuation An exemption is granted to all group superannuation investment policies that are for the benefit of more than one member. 207 210 216
Annuities An exemption is granted to annuities. 27 28 28
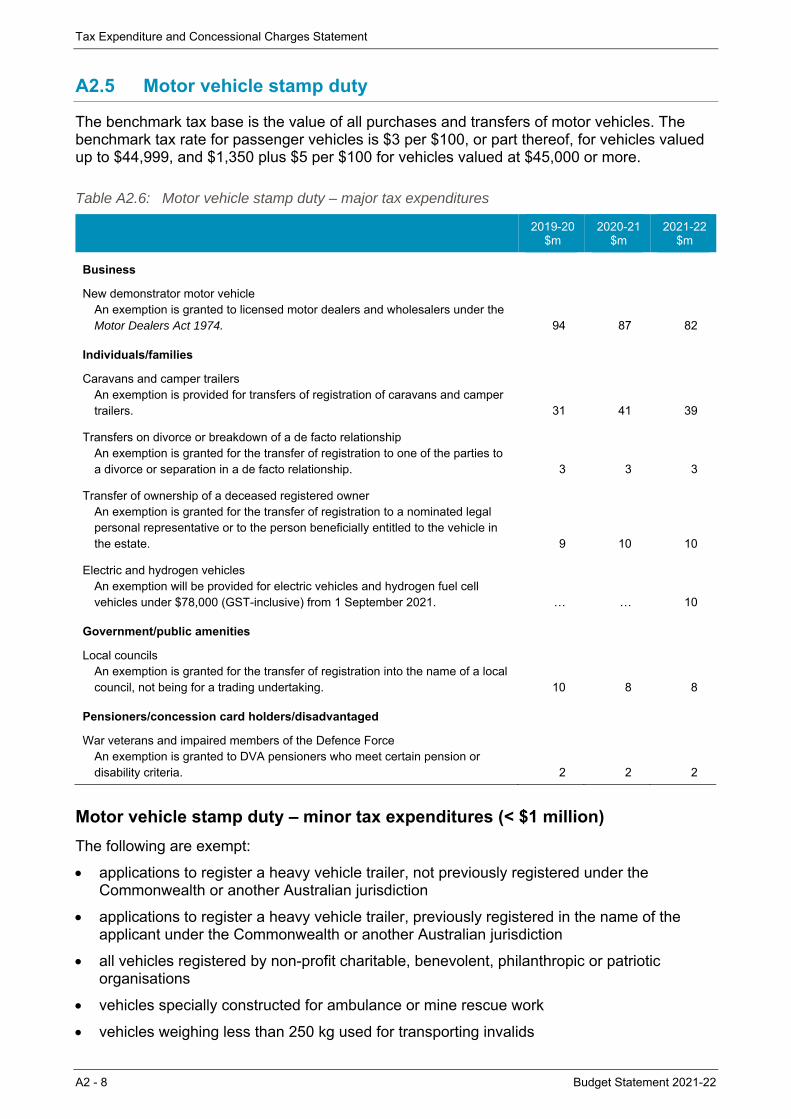
Tax Expenditure and Concessional Charges Statement
A2 - 8 Budget Statement 2021-22
A2.5 Motor vehicle stamp duty
The benchmark tax base is the value of all purchases and transfers of motor vehicles. The benchmark tax rate for passenger vehicles is $3 per $100, or part thereof, for vehicles valued up to $44,999, and $1,350 plus $5 per $100 for vehicles valued at $45,000 or more.
Table A2.6: Motor vehicle stamp duty – major tax expenditures
2019-20 $m
2020-21 $m
2021-22 $m
Business
New demonstrator motor vehicle An exemption is granted to licensed motor dealers and wholesalers under the Motor Dealers Act 1974. 94 87 82
Individuals/families
Caravans and camper trailers An exemption is provided for transfers of registration of caravans and camper trailers. 31 41 39
Transfers on divorce or breakdown of a de facto relationship An exemption is granted for the transfer of registration to one of the parties to a divorce or separation in a de facto relationship. 3 3 3
Transfer of ownership of a deceased registered owner An exemption is granted for the transfer of registration to a nominated legal personal representative or to the person beneficially entitled to the vehicle in the estate. 9 10 10
Electric and hydrogen vehicles An exemption will be provided for electric vehicles and hydrogen fuel cell vehicles under $78,000 (GST-inclusive) from 1 September 2021. … … 10
Government/public amenities
Local councils An exemption is granted for the transfer of registration into the name of a local council, not being for a trading undertaking. 10 8 8
Pensioners/concession card holders/disadvantaged
War veterans and impaired members of the Defence Force An exemption is granted to DVA pensioners who meet certain pension or disability criteria. 2 2 2
Motor vehicle stamp duty – minor tax expenditures (< $1 million)
The following are exempt:
applications to register a heavy vehicle trailer, not previously registered under the Commonwealth or another Australian jurisdiction
applications to register a heavy vehicle trailer, previously registered in the name of the applicant under the Commonwealth or another Australian jurisdiction
all vehicles registered by non-profit charitable, benevolent, philanthropic or patriotic organisations
vehicles specially constructed for ambulance or mine rescue work
vehicles weighing less than 250 kg used for transporting invalids
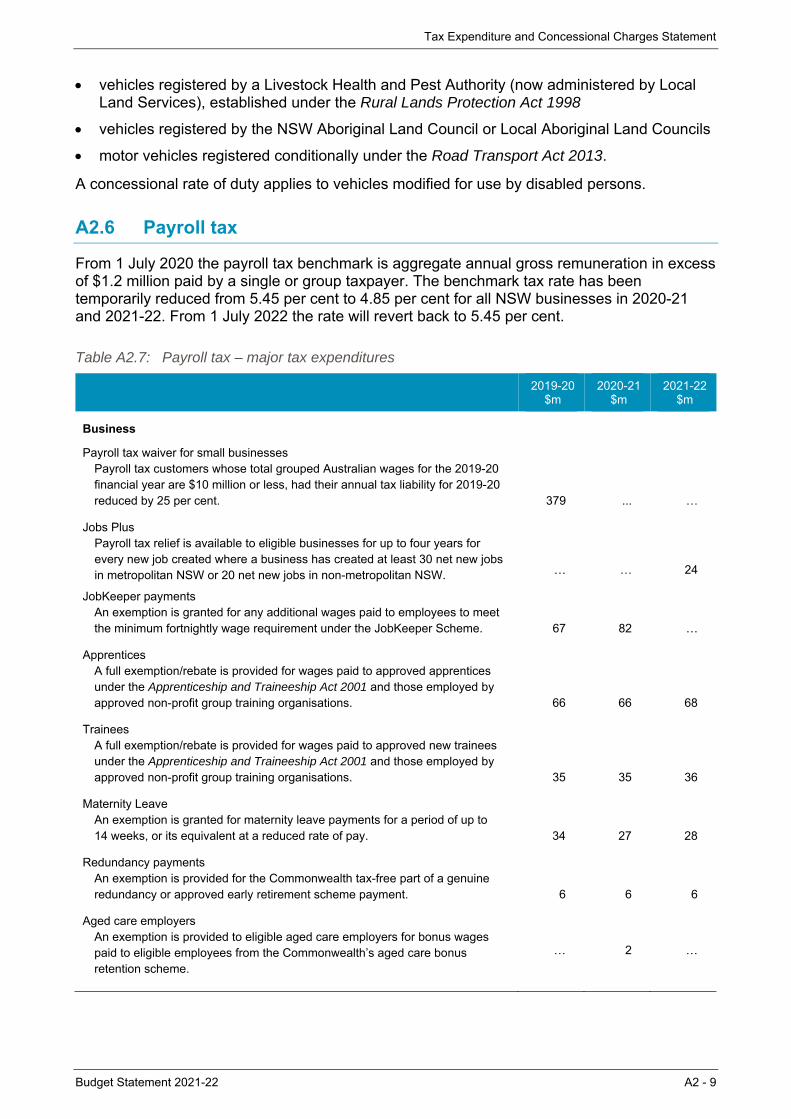
Tax Expenditure and Concessional Charges Statement
Budget Statement 2021-22 A2 - 9
vehicles registered by a Livestock Health and Pest Authority (now administered by Local Land Services), established under the Rural Lands Protection Act 1998
vehicles registered by the NSW Aboriginal Land Council or Local Aboriginal Land Councils
motor vehicles registered conditionally under the Road Transport Act 2013.
A concessional rate of duty applies to vehicles modified for use by disabled persons.
A2.6 Payroll tax
From 1 July 2020 the payroll tax benchmark is aggregate annual gross remuneration in excess of $1.2 million paid by a single or group taxpayer. The benchmark tax rate has been temporarily reduced from 5.45 per cent to 4.85 per cent for all NSW businesses in 2020-21 and 2021-22. From 1 July 2022 the rate will revert back to 5.45 per cent.
Table A2.7: Payroll tax – major tax expenditures
2019-20
$m 2020-21
$m 2021-22
$m
Business
Payroll tax waiver for small businesses Payroll tax customers whose total grouped Australian wages for the 2019-20 financial year are $10 million or less, had their annual tax liability for 2019-20 reduced by 25 per cent. 379 ... …
Jobs Plus Payroll tax relief is available to eligible businesses for up to four years for every new job created where a business has created at least 30 net new jobs in metropolitan NSW or 20 net new jobs in non-metropolitan NSW.
… … 24
JobKeeper payments An exemption is granted for any additional wages paid to employees to meet the minimum fortnightly wage requirement under the JobKeeper Scheme. 67 82 …
Apprentices A full exemption/rebate is provided for wages paid to approved apprentices under the Apprenticeship and Traineeship Act 2001 and those employed by approved non-profit group training organisations. 66 66 68
Trainees A full exemption/rebate is provided for wages paid to approved new trainees under the Apprenticeship and Traineeship Act 2001 and those employed by approved non-profit group training organisations. 35 35 36
Maternity Leave An exemption is granted for maternity leave payments for a period of up to 14 weeks, or its equivalent at a reduced rate of pay. 34 27 28
Redundancy payments An exemption is provided for the Commonwealth tax-free part of a genuine redundancy or approved early retirement scheme payment. 6 6 6
Aged care employers An exemption is provided to eligible aged care employers for bonus wages paid to eligible employees from the Commonwealth’s aged care bonus retention scheme.
… 2 …
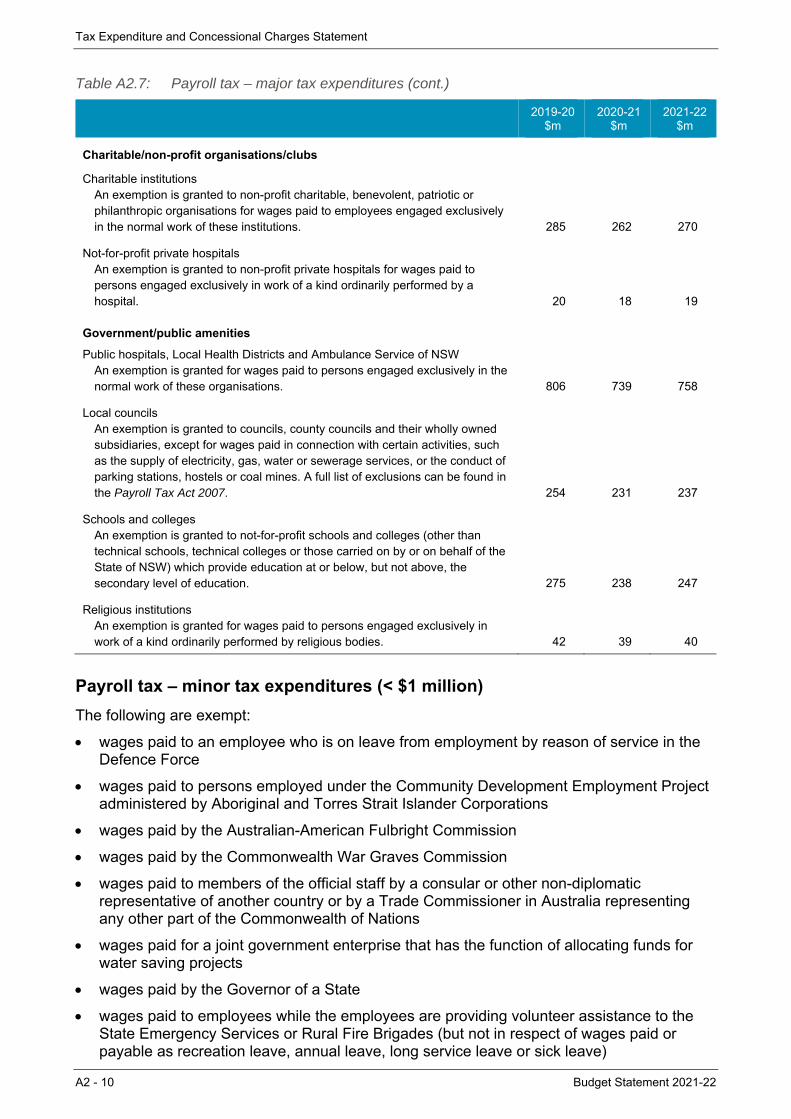
Tax Expenditure and Concessional Charges Statement
A2 - 10 Budget Statement 2021-22
Table A2.7: Payroll tax – major tax expenditures (cont.)
2019-20
$m 2020-21
$m 2021-22
$m
Charitable/non-profit organisations/clubs
Charitable institutions An exemption is granted to non-profit charitable, benevolent, patriotic or philanthropic organisations for wages paid to employees engaged exclusively in the normal work of these institutions. 285 262 270
Not-for-profit private hospitals An exemption is granted to non-profit private hospitals for wages paid to persons engaged exclusively in work of a kind ordinarily performed by a hospital. 20 18 19
Government/public amenities
Public hospitals, Local Health Districts and Ambulance Service of NSW An exemption is granted for wages paid to persons engaged exclusively in the normal work of these organisations. 806 739 758
Local councils An exemption is granted to councils, county councils and their wholly owned subsidiaries, except for wages paid in connection with certain activities, such as the supply of electricity, gas, water or sewerage services, or the conduct of parking stations, hostels or coal mines. A full list of exclusions can be found in the Payroll Tax Act 2007. 254 231 237
Schools and colleges An exemption is granted to not-for-profit schools and colleges (other than technical schools, technical colleges or those carried on by or on behalf of the State of NSW) which provide education at or below, but not above, the secondary level of education. 275 238 247
Religious institutions An exemption is granted for wages paid to persons engaged exclusively in work of a kind ordinarily performed by religious bodies. 42 39 40
Payroll tax – minor tax expenditures (< $1 million)
The following are exempt:
wages paid to an employee who is on leave from employment by reason of service in the Defence Force
wages paid to persons employed under the Community Development Employment Project administered by Aboriginal and Torres Strait Islander Corporations
wages paid by the Australian-American Fulbright Commission
wages paid by the Commonwealth War Graves Commission
wages paid to members of the official staff by a consular or other non-diplomatic representative of another country or by a Trade Commissioner in Australia representing any other part of the Commonwealth of Nations
wages paid for a joint government enterprise that has the function of allocating funds for water saving projects
wages paid by the Governor of a State
wages paid to employees while the employees are providing volunteer assistance to the State Emergency Services or Rural Fire Brigades (but not in respect of wages paid or payable as recreation leave, annual leave, long service leave or sick leave)
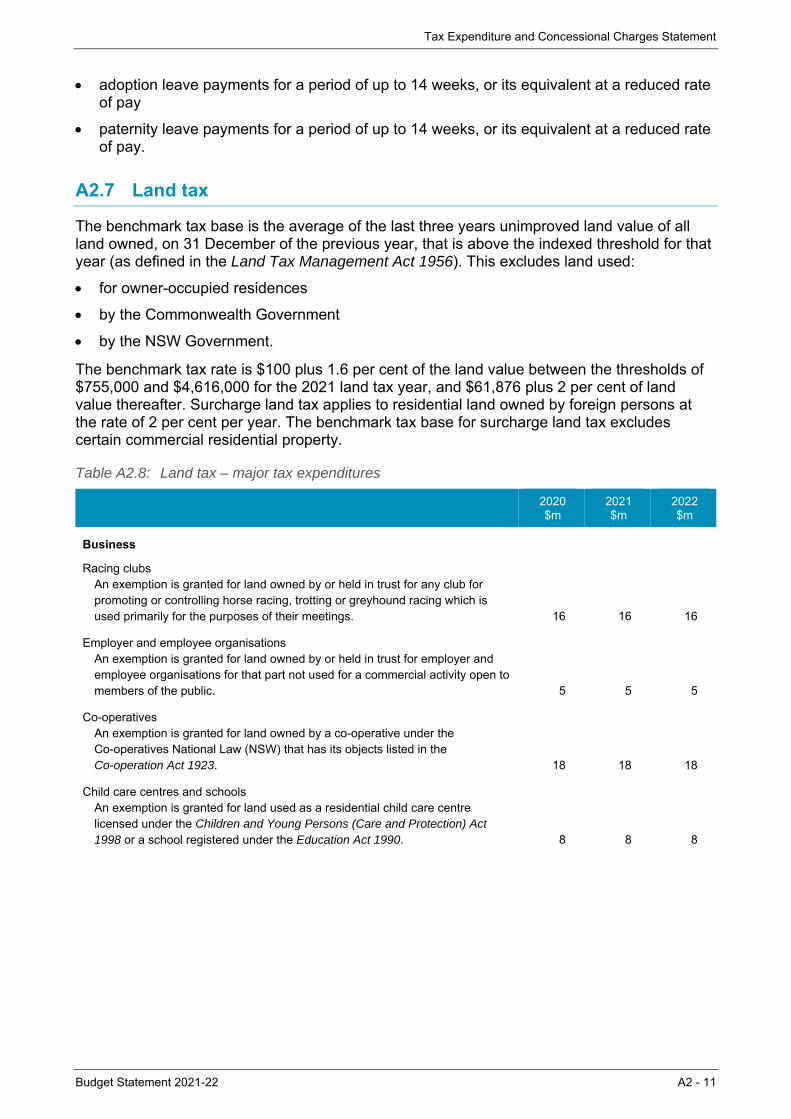
Tax Expenditure and Concessional Charges Statement
Budget Statement 2021-22 A2 - 11
adoption leave payments for a period of up to 14 weeks, or its equivalent at a reduced rate of pay
paternity leave payments for a period of up to 14 weeks, or its equivalent at a reduced rate of pay.
A2.7 Land tax
The benchmark tax base is the average of the last three years unimproved land value of all land owned, on 31 December of the previous year, that is above the indexed threshold for that year (as defined in the Land Tax Management Act 1956). This excludes land used:
for owner-occupied residences
by the Commonwealth Government
by the NSW Government.
The benchmark tax rate is $100 plus 1.6 per cent of the land value between the thresholds of $755,000 and $4,616,000 for the 2021 land tax year, and $61,876 plus 2 per cent of land value thereafter. Surcharge land tax applies to residential land owned by foreign persons at the rate of 2 per cent per year. The benchmark tax base for surcharge land tax excludes certain commercial residential property.
Table A2.8: Land tax – major tax expenditures
2020 $m
2021 $m
2022 $m
Business
Racing clubs An exemption is granted for land owned by or held in trust for any club for promoting or controlling horse racing, trotting or greyhound racing which is used primarily for the purposes of their meetings. 16 16 16
Employer and employee organisations An exemption is granted for land owned by or held in trust for employer and employee organisations for that part not used for a commercial activity open to members of the public. 5 5 5
Co-operatives An exemption is granted for land owned by a co-operative under the Co-operatives National Law (NSW) that has its objects listed in the Co-operation Act 1923. 18 18 18
Child care centres and schools An exemption is granted for land used as a residential child care centre licensed under the Children and Young Persons (Care and Protection) Act 1998 or a school registered under the Education Act 1990. 8 8 8
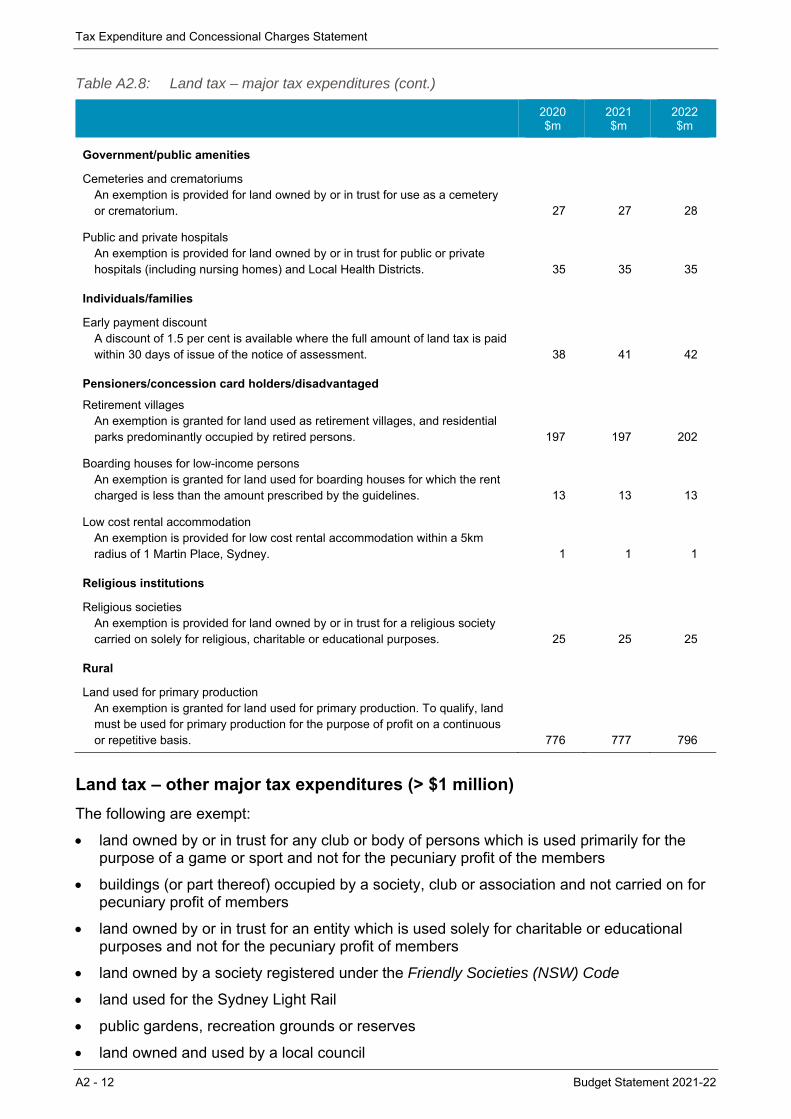
Tax Expenditure and Concessional Charges Statement
A2 - 12 Budget Statement 2021-22
Table A2.8: Land tax – major tax expenditures (cont.)
2020 $m
2021 $m
2022 $m
Government/public amenities
Cemeteries and crematoriums An exemption is provided for land owned by or in trust for use as a cemetery or crematorium. 27 27 28
Public and private hospitals An exemption is provided for land owned by or in trust for public or private hospitals (including nursing homes) and Local Health Districts. 35 35 35
Individuals/families
Early payment discount A discount of 1.5 per cent is available where the full amount of land tax is paid within 30 days of issue of the notice of assessment. 38 41 42
Pensioners/concession card holders/disadvantaged
Retirement villages An exemption is granted for land used as retirement villages, and residential parks predominantly occupied by retired persons. 197 197 202
Boarding houses for low-income persons An exemption is granted for land used for boarding houses for which the rent charged is less than the amount prescribed by the guidelines. 13 13 13
Low cost rental accommodation An exemption is provided for low cost rental accommodation within a 5km radius of 1 Martin Place, Sydney. 1 1 1
Religious institutions
Religious societies An exemption is provided for land owned by or in trust for a religious society carried on solely for religious, charitable or educational purposes. 25 25 25
Rural
Land used for primary production An exemption is granted for land used for primary production. To qualify, land must be used for primary production for the purpose of profit on a continuous or repetitive basis. 776 777 796
Land tax – other major tax expenditures (> $1 million)
The following are exempt:
land owned by or in trust for any club or body of persons which is used primarily for the purpose of a game or sport and not for the pecuniary profit of the members
buildings (or part thereof) occupied by a society, club or association and not carried on for pecuniary profit of members
land owned by or in trust for an entity which is used solely for charitable or educational purposes and not for the pecuniary profit of members
land owned by a society registered under the Friendly Societies (NSW) Code
land used for the Sydney Light Rail
public gardens, recreation grounds or reserves
land owned and used by a local council
Tax Expenditure and Concessional Charges Statement
Budget Statement 2021-22 A2 - 13
public authorities representing the Crown
New South Wales State and Local Aboriginal Land Councils
fire brigades, ambulances or mines rescue stations
religious societies’ places of worship and residences of clergy, ministers or orders of the society
land used to hold agricultural shows, which is owned by, or held in trust for, a society established for the purpose of holding, promoting and funding such shows.
A concession in the form of a 50 per cent reduction in land value for land tax purposes is available to eligible Build to Rent properties.
The following are exempt from surcharge land tax:
Australian based developers subject to satisfying requirements relating to the construction and sale of new homes on the acquired land
Developers of Build to Rent properties subject to satisfying requirements relating to the construction of such properties, from 1 July 2020
holders of subclass 410 (retirement) and 405 (investor retirement) visas.
Land tax – minor tax expenditures (< $1 million)
The following are exempt:
Primary Products Marketing Boards, Local Land Services and Agricultural Industry Service committees
community land development
land subject to a conservation agreement in perpetuity under the National Parks and Wildlife Act 1974 or a trust registered under the Nature Conservation Trust Act 2001
land owned, held in trust or leased by the Nature Conservation Trust of NSW, or land subject to a permanent conservation or trust agreement
land that is the subject of a BioBanking agreement
land owned by a joint government enterprise that has the function of allocating funds for water saving projects
land used solely as a police station
land owned by RSL (NSW Branch), being Anzac House
principal place of residence of a person with a disability, in a Special Disability Trust.
A concession is provided for unoccupied flood-liable land.
A2.8 Vehicle weight tax
The benchmark tax base is all vehicles (except Commonwealth vehicles) intended for on-road use. The benchmark tax rates, which vary by vehicle type, weight, usage and other factors, are updated annually by the NSW Government.
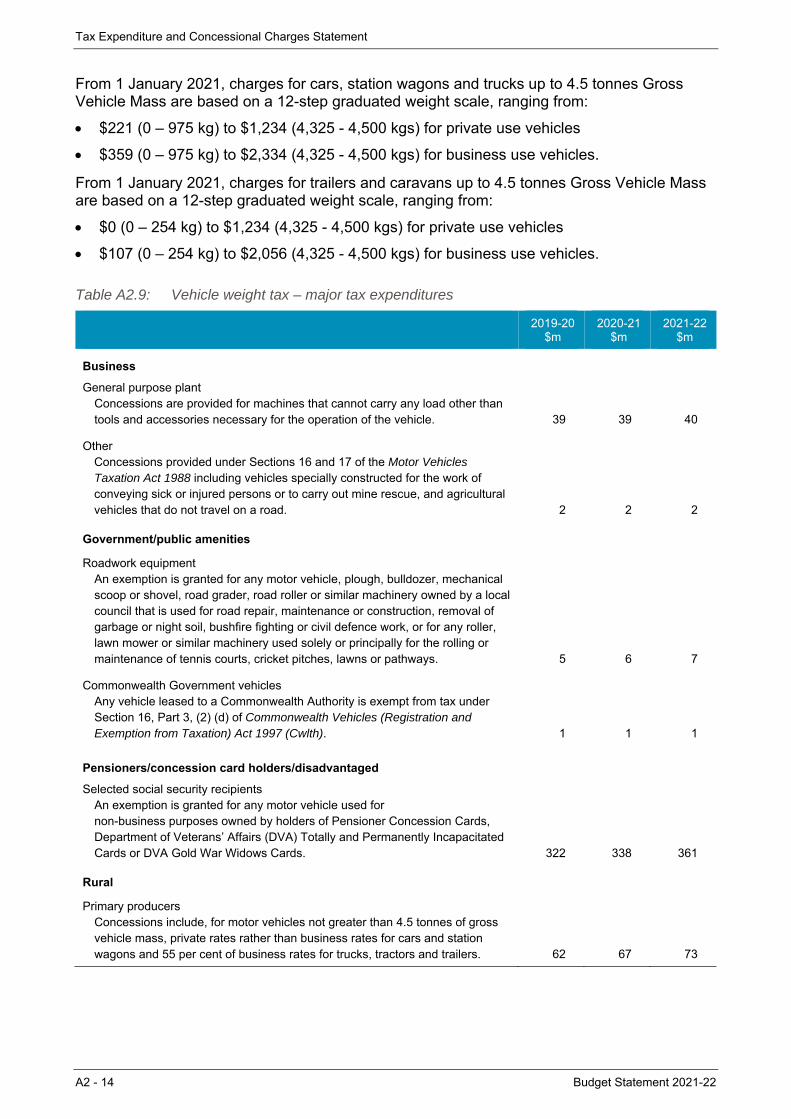
Tax Expenditure and Concessional Charges Statement
A2 - 14 Budget Statement 2021-22
From 1 January 2021, charges for cars, station wagons and trucks up to 4.5 tonnes Gross Vehicle Mass are based on a 12-step graduated weight scale, ranging from:
$221 (0 – 975 kg) to $1,234 (4,325 - 4,500 kgs) for private use vehicles
$359 (0 – 975 kg) to $2,334 (4,325 - 4,500 kgs) for business use vehicles.
From 1 January 2021, charges for trailers and caravans up to 4.5 tonnes Gross Vehicle Mass are based on a 12-step graduated weight scale, ranging from:
$0 (0 – 254 kg) to $1,234 (4,325 - 4,500 kgs) for private use vehicles
$107 (0 – 254 kg) to $2,056 (4,325 - 4,500 kgs) for business use vehicles.
Table A2.9: Vehicle weight tax – major tax expenditures
2019-20
$m 2020-21
$m 2021-22
$m
Business
General purpose plant Concessions are provided for machines that cannot carry any load other than tools and accessories necessary for the operation of the vehicle. 39 39 40
Other Concessions provided under Sections 16 and 17 of the Motor Vehicles Taxation Act 1988 including vehicles specially constructed for the work of conveying sick or injured persons or to carry out mine rescue, and agricultural vehicles that do not travel on a road. 2 2 2
Government/public amenities
Roadwork equipment An exemption is granted for any motor vehicle, plough, bulldozer, mechanical scoop or shovel, road grader, road roller or similar machinery owned by a local council that is used for road repair, maintenance or construction, removal of garbage or night soil, bushfire fighting or civil defence work, or for any roller, lawn mower or similar machinery used solely or principally for the rolling or maintenance of tennis courts, cricket pitches, lawns or pathways. 5 6 7
Commonwealth Government vehicles Any vehicle leased to a Commonwealth Authority is exempt from tax under Section 16, Part 3, (2) (d) of Commonwealth Vehicles (Registration and Exemption from Taxation) Act 1997 (Cwlth). 1 1 1
Pensioners/concession card holders/disadvantaged
Selected social security recipients An exemption is granted for any motor vehicle used for non-business purposes owned by holders of Pensioner Concession Cards, Department of Veterans’ Affairs (DVA) Totally and Permanently Incapacitated Cards or DVA Gold War Widows Cards. 322 338 361
Rural
Primary producers Concessions include, for motor vehicles not greater than 4.5 tonnes of gross vehicle mass, private rates rather than business rates for cars and station wagons and 55 per cent of business rates for trucks, tractors and trailers. 62 67 73
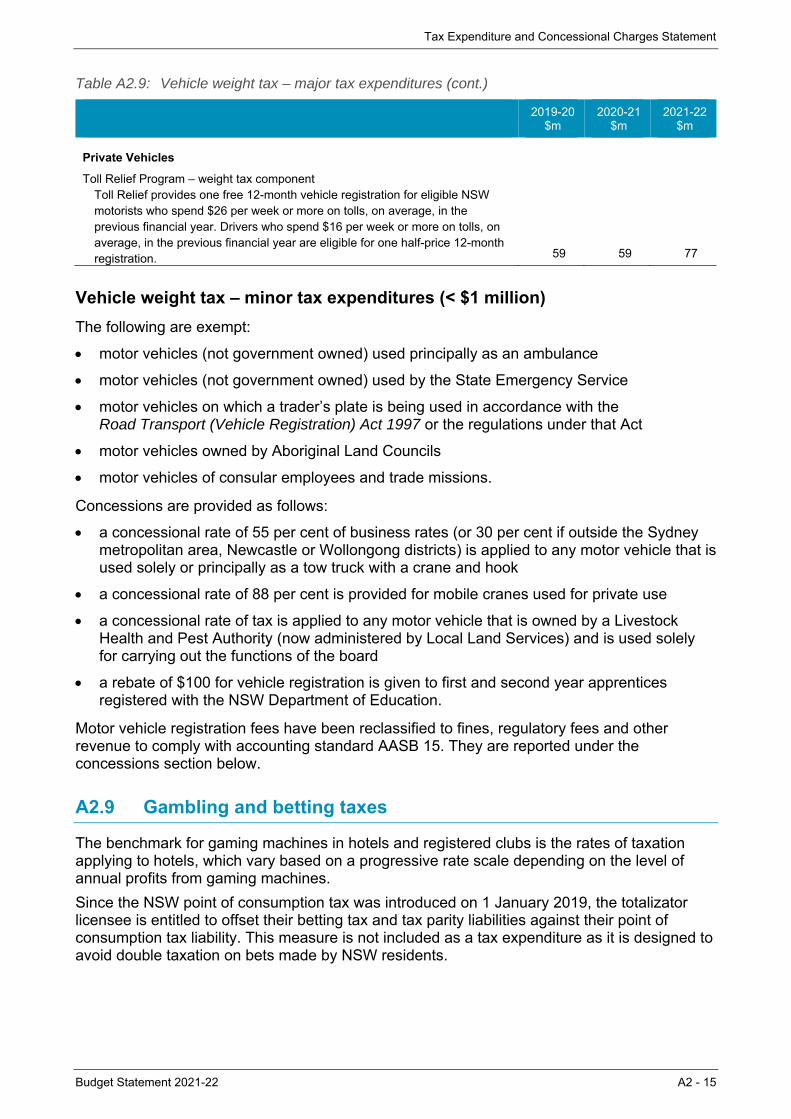
Tax Expenditure and Concessional Charges Statement
Budget Statement 2021-22 A2 - 15
Table A2.9: Vehicle weight tax – major tax expenditures (cont.)
2019-20
$m 2020-21
$m 2021-22
$m
Private Vehicles
Toll Relief Program – weight tax component Toll Relief provides one free 12-month vehicle registration for eligible NSW motorists who spend $26 per week or more on tolls, on average, in the previous financial year. Drivers who spend $16 per week or more on tolls, on average, in the previous financial year are eligible for one half-price 12-month registration. 59 59 77
Vehicle weight tax – minor tax expenditures (< $1 million)
The following are exempt:
motor vehicles (not government owned) used principally as an ambulance
motor vehicles (not government owned) used by the State Emergency Service
motor vehicles on which a trader’s plate is being used in accordance with the Road Transport (Vehicle Registration) Act 1997 or the regulations under that Act
motor vehicles owned by Aboriginal Land Councils
motor vehicles of consular employees and trade missions.
Concessions are provided as follows:
a concessional rate of 55 per cent of business rates (or 30 per cent if outside the Sydney metropolitan area, Newcastle or Wollongong districts) is applied to any motor vehicle that is used solely or principally as a tow truck with a crane and hook
a concessional rate of 88 per cent is provided for mobile cranes used for private use
a concessional rate of tax is applied to any motor vehicle that is owned by a Livestock Health and Pest Authority (now administered by Local Land Services) and is used solely for carrying out the functions of the board
a rebate of $100 for vehicle registration is given to first and second year apprentices registered with the NSW Department of Education.
Motor vehicle registration fees have been reclassified to fines, regulatory fees and other revenue to comply with accounting standard AASB 15. They are reported under the concessions section below.
A2.9 Gambling and betting taxes
The benchmark for gaming machines in hotels and registered clubs is the rates of taxation applying to hotels, which vary based on a progressive rate scale depending on the level of annual profits from gaming machines.
Since the NSW point of consumption tax was introduced on 1 January 2019, the totalizator licensee is entitled to offset their betting tax and tax parity liabilities against their point of consumption tax liability. This measure is not included as a tax expenditure as it is designed to avoid double taxation on bets made by NSW residents.
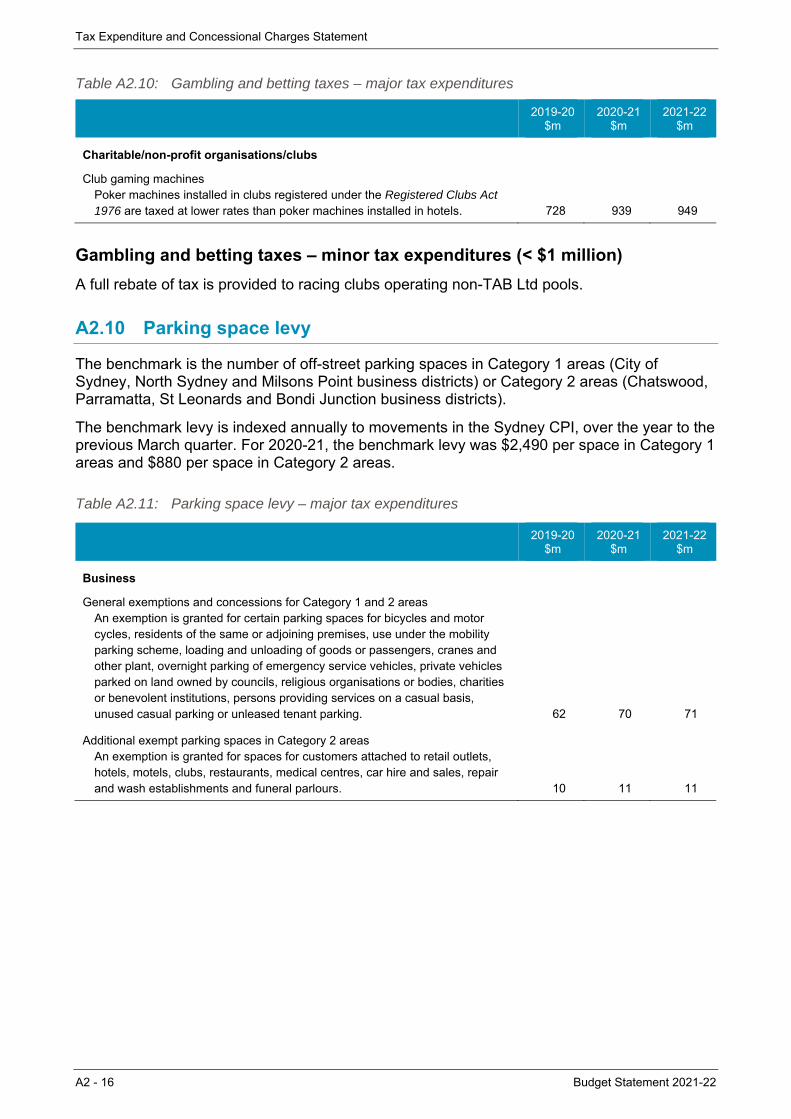
Tax Expenditure and Concessional Charges Statement
A2 - 16 Budget Statement 2021-22
Table A2.10: Gambling and betting taxes – major tax expenditures
2019-20
$m 2020-21
$m 2021-22
$m
Charitable/non-profit organisations/clubs
Club gaming machines Poker machines installed in clubs registered under the Registered Clubs Act 1976 are taxed at lower rates than poker machines installed in hotels. 728 939 949
Gambling and betting taxes – minor tax expenditures (< $1 million)
A full rebate of tax is provided to racing clubs operating non-TAB Ltd pools.
A2.10 Parking space levy
The benchmark is the number of off-street parking spaces in Category 1 areas (City of Sydney, North Sydney and Milsons Point business districts) or Category 2 areas (Chatswood, Parramatta, St Leonards and Bondi Junction business districts).
The benchmark levy is indexed annually to movements in the Sydney CPI, over the year to the previous March quarter. For 2020-21, the benchmark levy was $2,490 per space in Category 1 areas and $880 per space in Category 2 areas.
Table A2.11: Parking space levy – major tax expenditures
2019-20
$m 2020-21
$m 2021-22
$m
Business
General exemptions and concessions for Category 1 and 2 areas An exemption is granted for certain parking spaces for bicycles and motor cycles, residents of the same or adjoining premises, use under the mobility parking scheme, loading and unloading of goods or passengers, cranes and other plant, overnight parking of emergency service vehicles, private vehicles parked on land owned by councils, religious organisations or bodies, charities or benevolent institutions, persons providing services on a casual basis, unused casual parking or unleased tenant parking. 62 70 71
Additional exempt parking spaces in Category 2 areas An exemption is granted for spaces for customers attached to retail outlets, hotels, motels, clubs, restaurants, medical centres, car hire and sales, repair and wash establishments and funeral parlours. 10 11 11
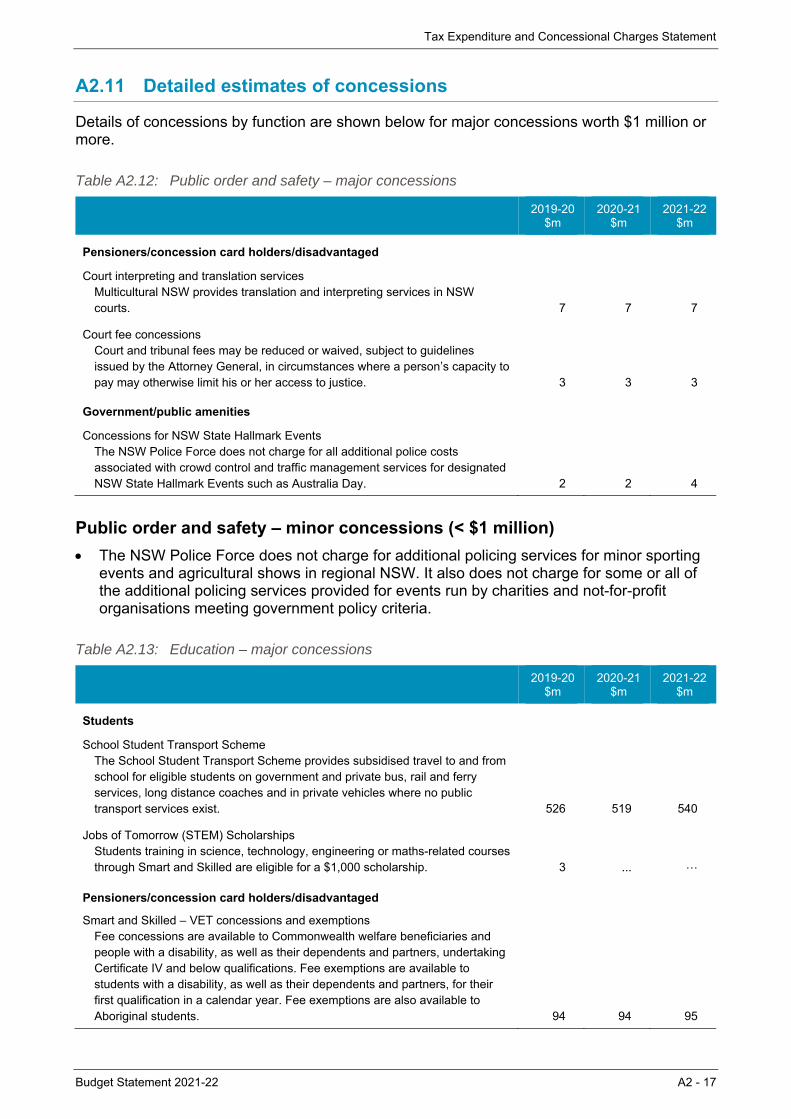
Tax Expenditure and Concessional Charges Statement
Budget Statement 2021-22 A2 - 17
A2.11 Detailed estimates of concessions
Details of concessions by function are shown below for major concessions worth $1 million or more.
Table A2.12: Public order and safety – major concessions
2019-20
$m 2020-21
$m 2021-22
$m
Pensioners/concession card holders/disadvantaged
Court interpreting and translation services Multicultural NSW provides translation and interpreting services in NSW courts. 7 7 7
Court fee concessions Court and tribunal fees may be reduced or waived, subject to guidelines issued by the Attorney General, in circumstances where a person’s capacity to pay may otherwise limit his or her access to justice. 3 3 3
Government/public amenities
Concessions for NSW State Hallmark Events The NSW Police Force does not charge for all additional police costs associated with crowd control and traffic management services for designated NSW State Hallmark Events such as Australia Day. 2 2 4
Public order and safety – minor concessions (< $1 million)
The NSW Police Force does not charge for additional policing services for minor sporting events and agricultural shows in regional NSW. It also does not charge for some or all of the additional policing services provided for events run by charities and not-for-profit organisations meeting government policy criteria.
Table A2.13: Education – major concessions
2019-20
$m 2020-21
$m 2021-22
$m
Students
School Student Transport Scheme The School Student Transport Scheme provides subsidised travel to and from school for eligible students on government and private bus, rail and ferry services, long distance coaches and in private vehicles where no public transport services exist. 526 519 540
Jobs of Tomorrow (STEM) Scholarships Students training in science, technology, engineering or maths-related courses through Smart and Skilled are eligible for a $1,000 scholarship. 3 ... …
Pensioners/concession card holders/disadvantaged
Smart and Skilled – VET concessions and exemptions Fee concessions are available to Commonwealth welfare beneficiaries and people with a disability, as well as their dependents and partners, undertaking Certificate IV and below qualifications. Fee exemptions are available to students with a disability, as well as their dependents and partners, for their first qualification in a calendar year. Fee exemptions are also available to Aboriginal students. 94 94 95
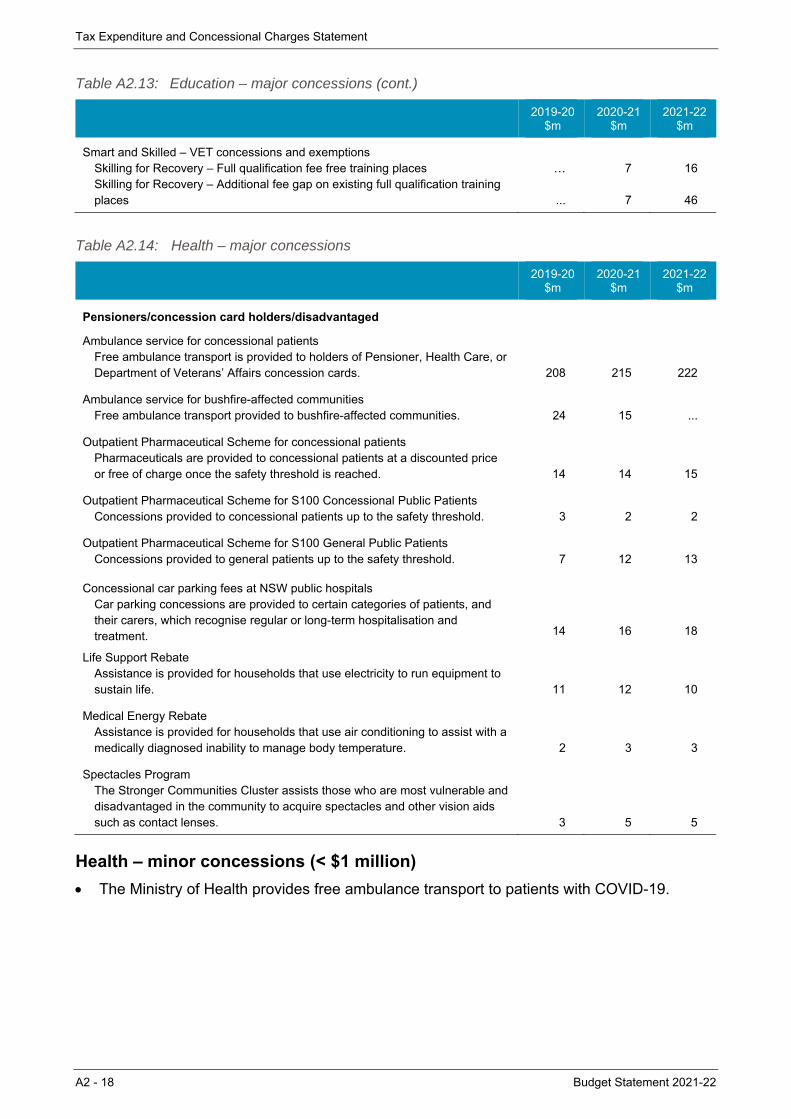
Tax Expenditure and Concessional Charges Statement
A2 - 18 Budget Statement 2021-22
Table A2.13: Education – major concessions (cont.)
2019-20
$m 2020-21
$m 2021-22
$m
Smart and Skilled – VET concessions and exemptions Skilling for Recovery – Full qualification fee free training places Skilling for Recovery – Additional fee gap on existing full qualification training places
…
...
7
7
16
46
Table A2.14: Health – major concessions
2019-20
$m 2020-21
$m 2021-22
$m
Pensioners/concession card holders/disadvantaged
Ambulance service for concessional patients Free ambulance transport is provided to holders of Pensioner, Health Care, or Department of Veterans’ Affairs concession cards. 208 215 222
Ambulance service for bushfire-affected communities Free ambulance transport provided to bushfire-affected communities. 24 15 ...
Outpatient Pharmaceutical Scheme for concessional patients Pharmaceuticals are provided to concessional patients at a discounted price or free of charge once the safety threshold is reached. 14 14 15
Outpatient Pharmaceutical Scheme for S100 Concessional Public Patients Concessions provided to concessional patients up to the safety threshold. 3 2 2
Outpatient Pharmaceutical Scheme for S100 General Public Patients Concessions provided to general patients up to the safety threshold. 7 12 13
Concessional car parking fees at NSW public hospitals Car parking concessions are provided to certain categories of patients, and their carers, which recognise regular or long-term hospitalisation and treatment. 14 16 18
Life Support Rebate Assistance is provided for households that use electricity to run equipment to sustain life. 11 12 10
Medical Energy Rebate Assistance is provided for households that use air conditioning to assist with a medically diagnosed inability to manage body temperature. 2 3 3
Spectacles Program The Stronger Communities Cluster assists those who are most vulnerable and disadvantaged in the community to acquire spectacles and other vision aids such as contact lenses. 3 5 5
Health – minor concessions (< $1 million)
The Ministry of Health provides free ambulance transport to patients with COVID-19.

Tax Expenditure and Concessional Charges Statement
Budget Statement 2021-22 A2 - 19
Table A2.15: Transport – major concessions
2019-20
$m 2020-21
$m 2021-22
$m
Pensioners/concession card holders/disadvantaged
Public transport concessions Pensioners, seniors, welfare beneficiaries and students travel for less than full fare on bus, rail, taxi and ferry services (excluding School Student Transport Scheme). 290 230 254
Home and Community Care Program & Community Transport Program Transport for NSW provides community transport services to frail aged and younger people with disabilities, and their carers, under the Home and Community Care Transport Sub-program. Transport for NSW also provides subsidised transport for people with special needs due to physical conditions, significant social disadvantages or geographical isolation under the Community Transport Program. 87 91 94
Driver’s licence fee exemption Transport for NSW provide a driver’s licence fee exemption to holders of Pensioner Concession Cards, DVA Totally and Permanently Incapacitated Cards and DVA Gold War Widows Cards, subject to income and disability rate thresholds, where the vehicle owned by the licence holder is used substantially for social and domestic purposes. 64 50 32
Pensioners/concession card holders/disadvantaged
Selected social security recipients – registration fees An exemption is granted to holders of Pensioner Concession Cards, DVA Totally and Permanently Incapacitated Cards and DVA Gold War Widows Cards (subject to income and disability pension rate thresholds) for a single vehicle used substantially for social or domestic purposes. 60 63 66
Private Vehicles
Toll Relief Program – registration fees component Toll Relief provides one free 12-month vehicle registration for eligible NSW motorists who spend $26 per week or more on tolls, on average, in the previous financial year. Drivers who spend $16 per week or more on tolls, on average, in the previous financial year are eligible for one half-price 12-month registration. 11 11 14
Transport – minor concessions (< $1 million)
Transport for NSW offers a concession on private mooring licences to holders of Pensioner Concession Cards and Repatriation Health Cards.
A motor vehicle registration fee exemption is provided for Mobile Disability Conveyance.
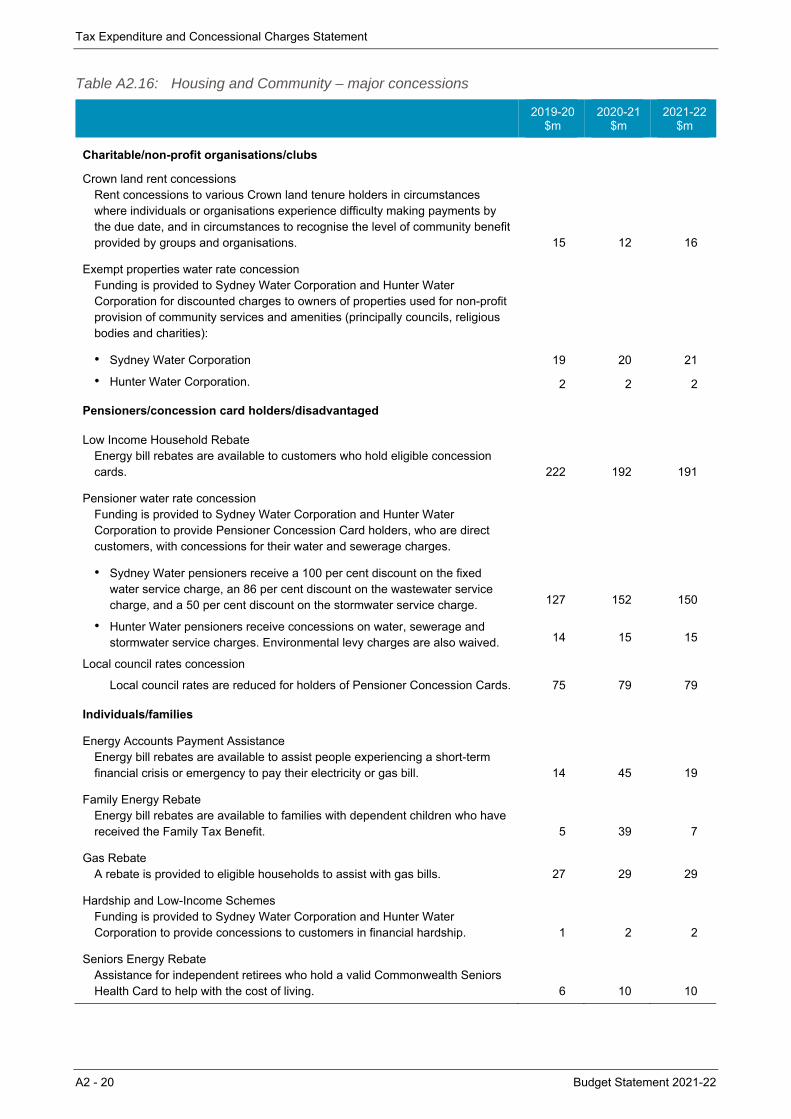
Tax Expenditure and Concessional Charges Statement
A2 - 20 Budget Statement 2021-22
Table A2.16: Housing and Community – major concessions
2019-20
$m 2020-21
$m 2021-22
$m
Charitable/non-profit organisations/clubs
Crown land rent concessions Rent concessions to various Crown land tenure holders in circumstances where individuals or organisations experience difficulty making payments by the due date, and in circumstances to recognise the level of community benefit provided by groups and organisations. 15 12 16
Exempt properties water rate concession Funding is provided to Sydney Water Corporation and Hunter Water Corporation for discounted charges to owners of properties used for non-profit provision of community services and amenities (principally councils, religious bodies and charities):
• Sydney Water Corporation 19 20 21
• Hunter Water Corporation. 2 2 2
Pensioners/concession card holders/disadvantaged
Low Income Household Rebate Energy bill rebates are available to customers who hold eligible concession cards. 222 192 191
Pensioner water rate concession Funding is provided to Sydney Water Corporation and Hunter Water Corporation to provide Pensioner Concession Card holders, who are direct customers, with concessions for their water and sewerage charges.
• Sydney Water pensioners receive a 100 per cent discount on the fixed water service charge, an 86 per cent discount on the wastewater service charge, and a 50 per cent discount on the stormwater service charge. 127 152 150
• Hunter Water pensioners receive concessions on water, sewerage and stormwater service charges. Environmental levy charges are also waived. 14 15 15
Local council rates concession
Local council rates are reduced for holders of Pensioner Concession Cards. 75 79 79
Individuals/families
Energy Accounts Payment Assistance Energy bill rebates are available to assist people experiencing a short-term financial crisis or emergency to pay their electricity or gas bill. 14 45 19
Family Energy Rebate Energy bill rebates are available to families with dependent children who have received the Family Tax Benefit. 5 39 7
Gas Rebate A rebate is provided to eligible households to assist with gas bills. 27 29 29
Hardship and Low-Income Schemes Funding is provided to Sydney Water Corporation and Hunter Water Corporation to provide concessions to customers in financial hardship. 1 2 2
Seniors Energy Rebate Assistance for independent retirees who hold a valid Commonwealth Seniors Health Card to help with the cost of living. 6 10 10
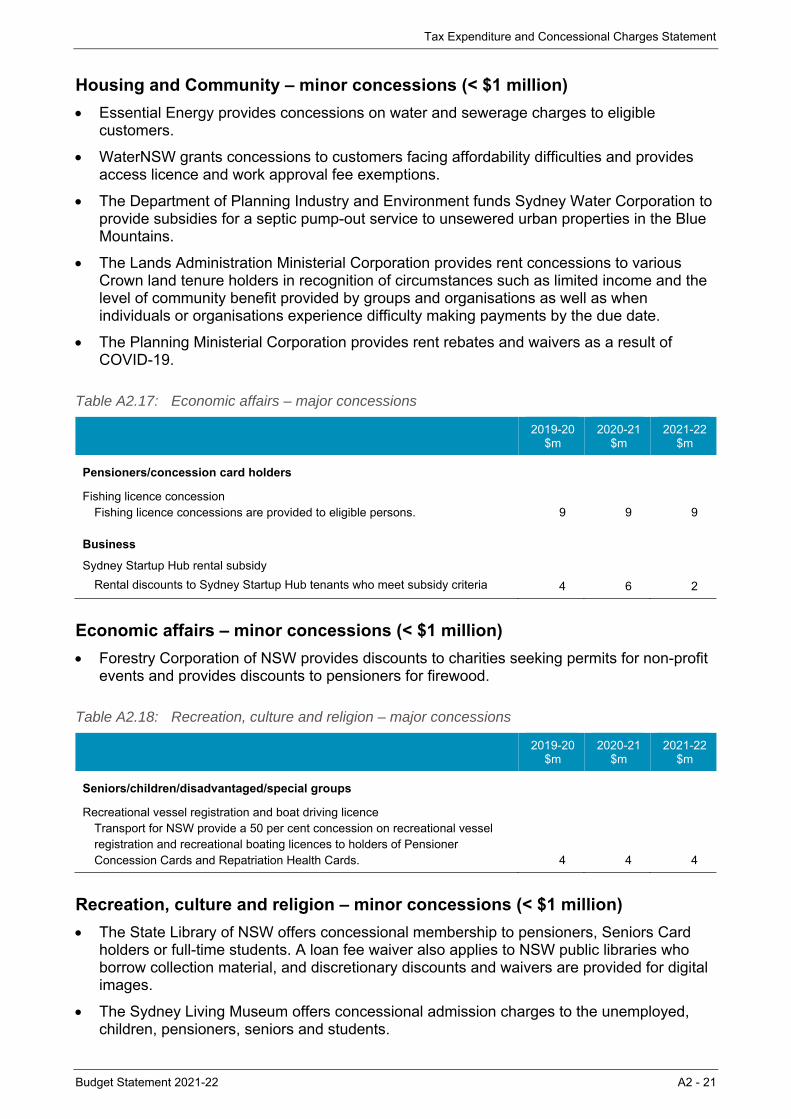
Tax Expenditure and Concessional Charges Statement
Budget Statement 2021-22 A2 - 21
Housing and Community – minor concessions (< $1 million)
Essential Energy provides concessions on water and sewerage charges to eligible customers.
WaterNSW grants concessions to customers facing affordability difficulties and provides access licence and work approval fee exemptions.
The Department of Planning Industry and Environment funds Sydney Water Corporation to provide subsidies for a septic pump-out service to unsewered urban properties in the Blue Mountains.
The Lands Administration Ministerial Corporation provides rent concessions to various Crown land tenure holders in recognition of circumstances such as limited income and the level of community benefit provided by groups and organisations as well as when individuals or organisations experience difficulty making payments by the due date.
The Planning Ministerial Corporation provides rent rebates and waivers as a result of COVID-19.
Table A2.17: Economic affairs – major concessions
2019-20
$m 2020-21
$m 2021-22
$m
Pensioners/concession card holders
Fishing licence concession Fishing licence concessions are provided to eligible persons. 9 9 9
Business
Sydney Startup Hub rental subsidy
Rental discounts to Sydney Startup Hub tenants who meet subsidy criteria 4 6 2
Economic affairs – minor concessions (< $1 million)
Forestry Corporation of NSW provides discounts to charities seeking permits for non-profit events and provides discounts to pensioners for firewood.
Table A2.18: Recreation, culture and religion – major concessions
2019-20
$m 2020-21
$m 2021-22
$m
Seniors/children/disadvantaged/special groups
Recreational vessel registration and boat driving licence Transport for NSW provide a 50 per cent concession on recreational vessel registration and recreational boating licences to holders of Pensioner Concession Cards and Repatriation Health Cards. 4 4 4
Recreation, culture and religion – minor concessions (< $1 million)
The State Library of NSW offers concessional membership to pensioners, Seniors Card holders or full-time students. A loan fee waiver also applies to NSW public libraries who borrow collection material, and discretionary discounts and waivers are provided for digital images.
The Sydney Living Museum offers concessional admission charges to the unemployed, children, pensioners, seniors and students.
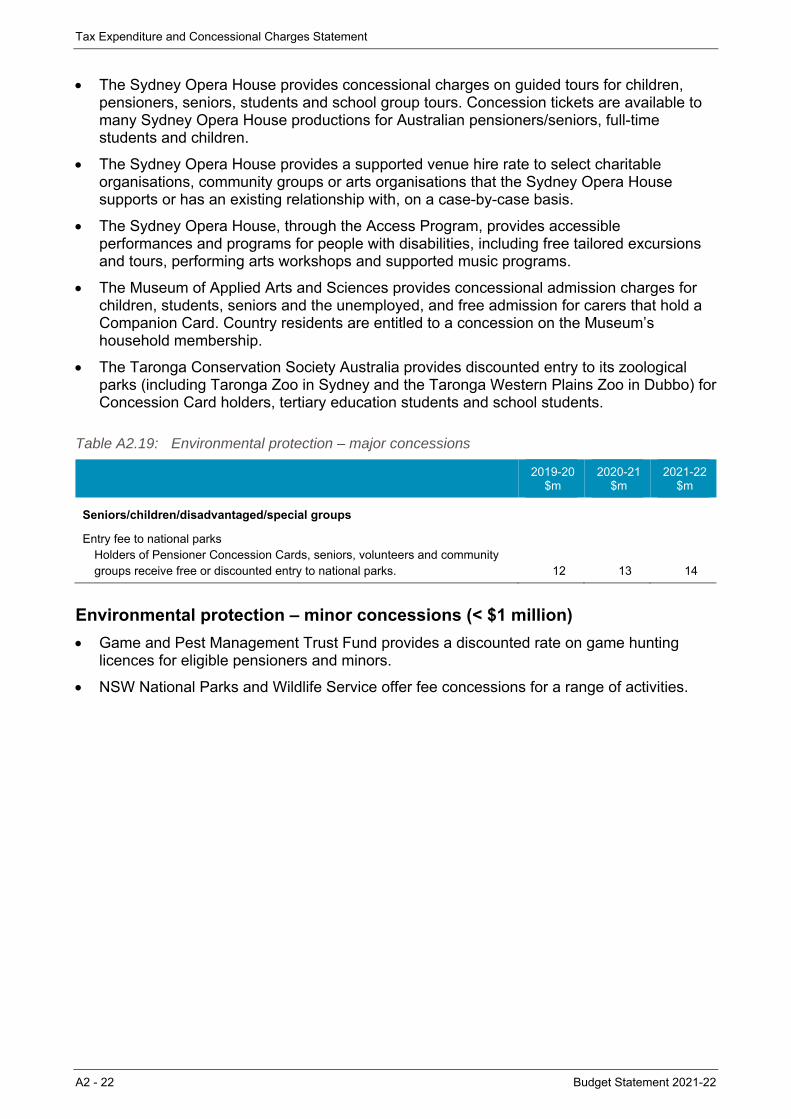
Tax Expenditure and Concessional Charges Statement
A2 - 22 Budget Statement 2021-22
The Sydney Opera House provides concessional charges on guided tours for children, pensioners, seniors, students and school group tours. Concession tickets are available to many Sydney Opera House productions for Australian pensioners/seniors, full-time students and children.
The Sydney Opera House provides a supported venue hire rate to select charitable organisations, community groups or arts organisations that the Sydney Opera House supports or has an existing relationship with, on a case-by-case basis.
The Sydney Opera House, through the Access Program, provides accessible performances and programs for people with disabilities, including free tailored excursions and tours, performing arts workshops and supported music programs.
The Museum of Applied Arts and Sciences provides concessional admission charges for children, students, seniors and the unemployed, and free admission for carers that hold a Companion Card. Country residents are entitled to a concession on the Museum’s household membership.
The Taronga Conservation Society Australia provides discounted entry to its zoological parks (including Taronga Zoo in Sydney and the Taronga Western Plains Zoo in Dubbo) for Concession Card holders, tertiary education students and school students.
Table A2.19: Environmental protection – major concessions
2019-20
$m 2020-21
$m 2021-22
$m
Seniors/children/disadvantaged/special groups
Entry fee to national parks Holders of Pensioner Concession Cards, seniors, volunteers and community groups receive free or discounted entry to national parks. 12 13 14
Environmental protection – minor concessions (< $1 million)
Game and Pest Management Trust Fund provides a discounted rate on game hunting licences for eligible pensioners and minors.
NSW National Parks and Wildlife Service offer fee concessions for a range of activities.
Budget Statement 2021-22 A3 - 1
A3. VARIATION DETAILS OF APPROPRIATIONS DURING 2020-21
Each year, an Appropriation Act, and an Appropriation (Parliament) Act, are passed in the NSW Parliament which appropriate out of the Consolidated Fund sums to Ministers, and the Legislature, for the services of the Government for that annual reporting period.
In certain circumstances, the Government Sector Finance Act 2018 (GSF Act) enables the sum of appropriated money to be varied to meet the service objectives of the Government. For example, where an urgent need for additional funds arises during a financial year, section 4.13 of the GSF Act provides that the “Treasurer may, with the approval of the Governor, determine that additional money is to be paid out of the Consolidated Fund during the annual reporting period for the NSW Government in anticipation of appropriation by Parliament if it is required to meet any exigencies of Government.”
Where there is a variation to appropriations, the GSF Act requires the details of these payment variations to be included in the Budget Papers for the next annual reporting year.
As per the reporting requirements of the GSF Act, the following tables provide the variation details of annual appropriations during the 2020-21 reporting period.
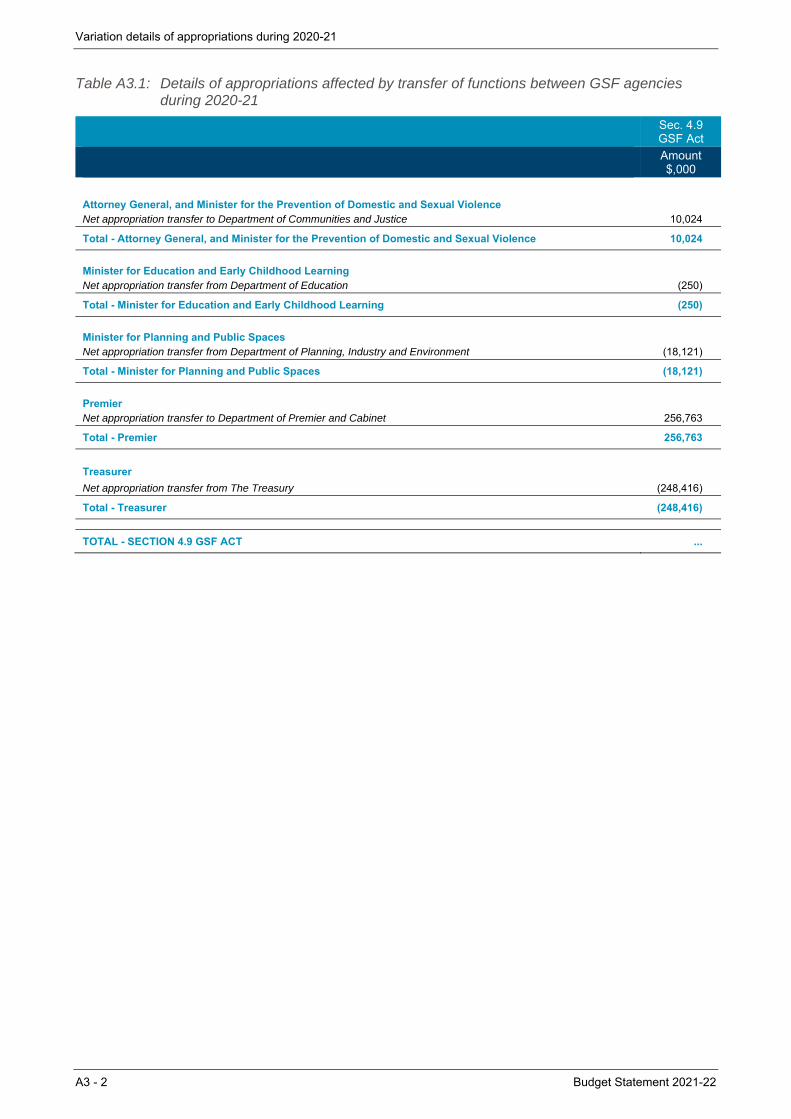
Variation details of appropriations during 2020-21
A3 - 2 Budget Statement 2021-22
Table A3.1: Details of appropriations affected by transfer of functions between GSF agencies during 2020-21
Sec. 4.9 GSF Act
Amount $,000
Attorney General, and Minister for the Prevention of Domestic and Sexual Violence Net appropriation transfer to Department of Communities and Justice 10,024
Total - Attorney General, and Minister for the Prevention of Domestic and Sexual Violence 10,024
Minister for Education and Early Childhood Learning Net appropriation transfer from Department of Education (250)
Total - Minister for Education and Early Childhood Learning (250)
Minister for Planning and Public Spaces Net appropriation transfer from Department of Planning, Industry and Environment (18,121)
Total - Minister for Planning and Public Spaces (18,121)
Premier Net appropriation transfer to Department of Premier and Cabinet 256,763
Total - Premier 256,763
Treasurer Net appropriation transfer from The Treasury (248,416)
Total - Treasurer (248,416)
TOTAL - SECTION 4.9 GSF ACT ...
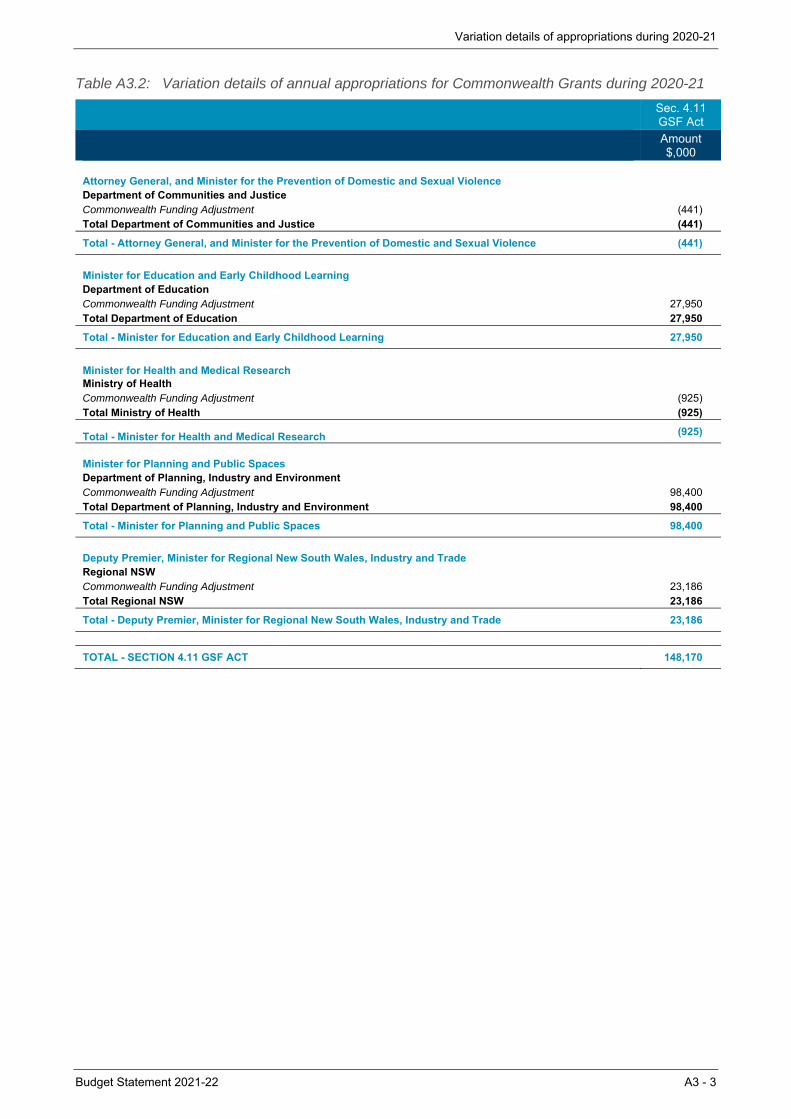
Variation details of appropriations during 2020-21
Budget Statement 2021-22 A3 - 3
Table A3.2: Variation details of annual appropriations for Commonwealth Grants during 2020-21
Sec. 4.11 GSF Act
Amount $,000
Attorney General, and Minister for the Prevention of Domestic and Sexual Violence Department of Communities and Justice Commonwealth Funding Adjustment (441) Total Department of Communities and Justice (441)
Total - Attorney General, and Minister for the Prevention of Domestic and Sexual Violence (441)
Minister for Education and Early Childhood Learning
Department of Education
Commonwealth Funding Adjustment 27,950 Total Department of Education 27,950
Total - Minister for Education and Early Childhood Learning 27,950
Minister for Health and Medical Research
Ministry of Health
Commonwealth Funding Adjustment (925) Total Ministry of Health (925)
Total - Minister for Health and Medical Research (925)
Minister for Planning and Public Spaces
Department of Planning, Industry and Environment
Commonwealth Funding Adjustment 98,400 Total Department of Planning, Industry and Environment 98,400
Total - Minister for Planning and Public Spaces 98,400
Deputy Premier, Minister for Regional New South Wales, Industry and Trade
Regional NSW
Commonwealth Funding Adjustment 23,186 Total Regional NSW 23,186
Total - Deputy Premier, Minister for Regional New South Wales, Industry and Trade 23,186
TOTAL - SECTION 4.11 GSF ACT 148,170
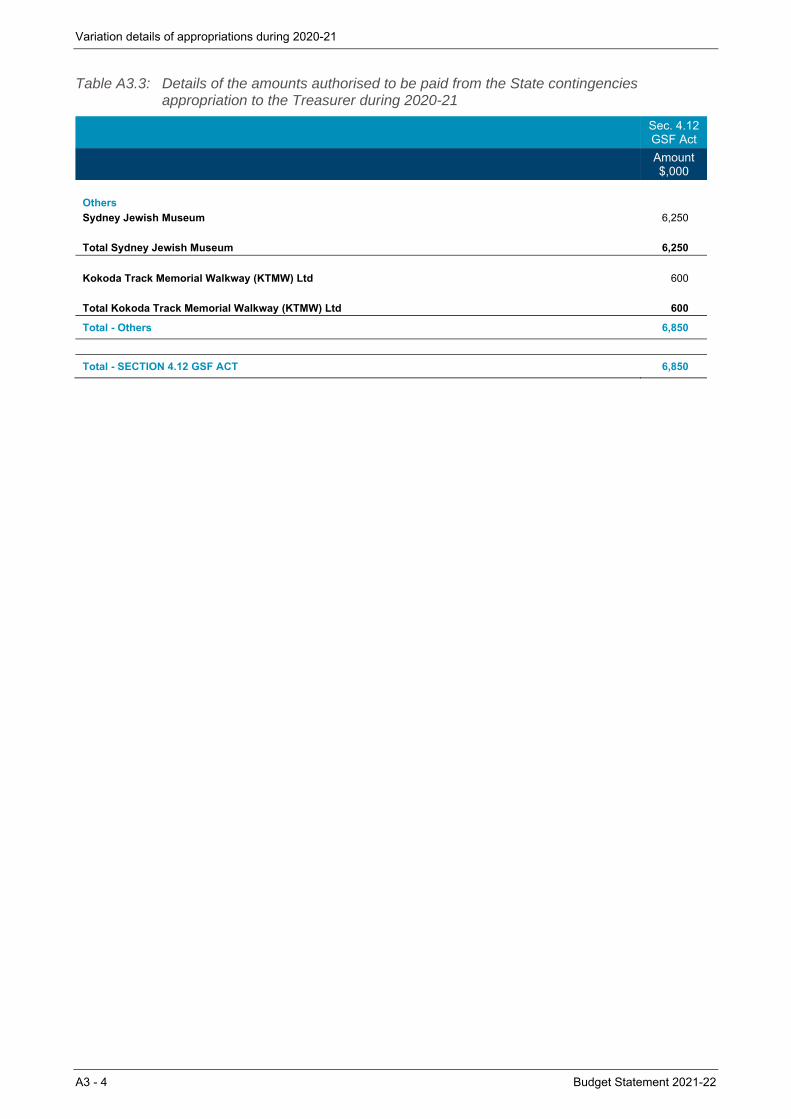
Variation details of appropriations during 2020-21
A3 - 4 Budget Statement 2021-22
Table A3.3: Details of the amounts authorised to be paid from the State contingencies appropriation to the Treasurer during 2020-21
Sec. 4.12 GSF Act
Amount $,000
Others
Sydney Jewish Museum 6,250
Total Sydney Jewish Museum 6,250
Kokoda Track Memorial Walkway (KTMW) Ltd 600
Total Kokoda Track Memorial Walkway (KTMW) Ltd 600
Total - Others 6,850
Total - SECTION 4.12 GSF ACT 6,850
Budget Statement 2021-22 A4 - 1
A4. CLASSIFICATION OF AGENCIES
The financial activities of all governments are measured using the government finance statistics (GFS) framework.1 All entities controlled by governments are classified into sectors according to the nature of their activities and funding arrangements.
For financial reporting and policy framework purposes, NSW Treasury classifies each NSW Government entity under one of three sectors:
general government sector
public non-financial corporations
public financial corporations.
Together, these sectors make up the total state sector. This is not a GFS term, but it is used to describe the scope of all government activities representing the total state.
The nature of each sector as it relates to NSW Government entities is as follows:
General
government sector
The general government sector represents the scope of the Budget. Agencies in this sector
generally operate under the Financial Management Framework and carry out policy,
regulatory and service delivery functions. This sector includes agencies such as the Ministry
of Health, Department of Education, NSW Police Force, Rental Bond Board and Independent
Pricing and Regulatory Tribunal.
‘General government sector’ is defined under GFS as the institutional sector comprising all
government units and non-profit institutions controlled by the Government.
Public non-financial
corporations sector
Agencies in this sector are either commercial or non-commercial.
Commercial enterprises generally operate under the Commercial Policy Framework, which
aims to replicate disciplines and incentives that drive the efficient commercial practices of
private sector businesses. They deliver services to a customer base from which they receive
their income. They generally pay dividends and tax-equivalent payments to the general
government sector. These agencies include State-owned Corporations such as Sydney Water
and Hunter Water Corporations.
Non-commercial enterprises address important social objectives and levy charges for
services to client groups on a subsidised basis. This includes the New South Wales Land and
Housing Corporation, which receives substantial grants from the general government sector
to provide these services.
‘Public non-financial corporations sector’ is defined under GFS as resident government
controlled corporations and quasi-corporations mainly engaged in the production of market
goods and/or non-financial services.
Public financial
corporations sector
These agencies are involved in financial services and generally operate under the
Commercial Policy Framework. They include the New South Wales Treasury Corporation and
Insurance and Care NSW.
‘Public financial corporations sector’ is defined under GFS as resident government controlled
operations and quasi-corporations mainly engaged in financial intermediation or provision of
auxiliary financial services.
1 Australian Bureau of Statistics, Australian System of Government Finance Statistics: Concepts, Sources and Methods,
2015 Cat No. 5514.0, ABS, Canberra.
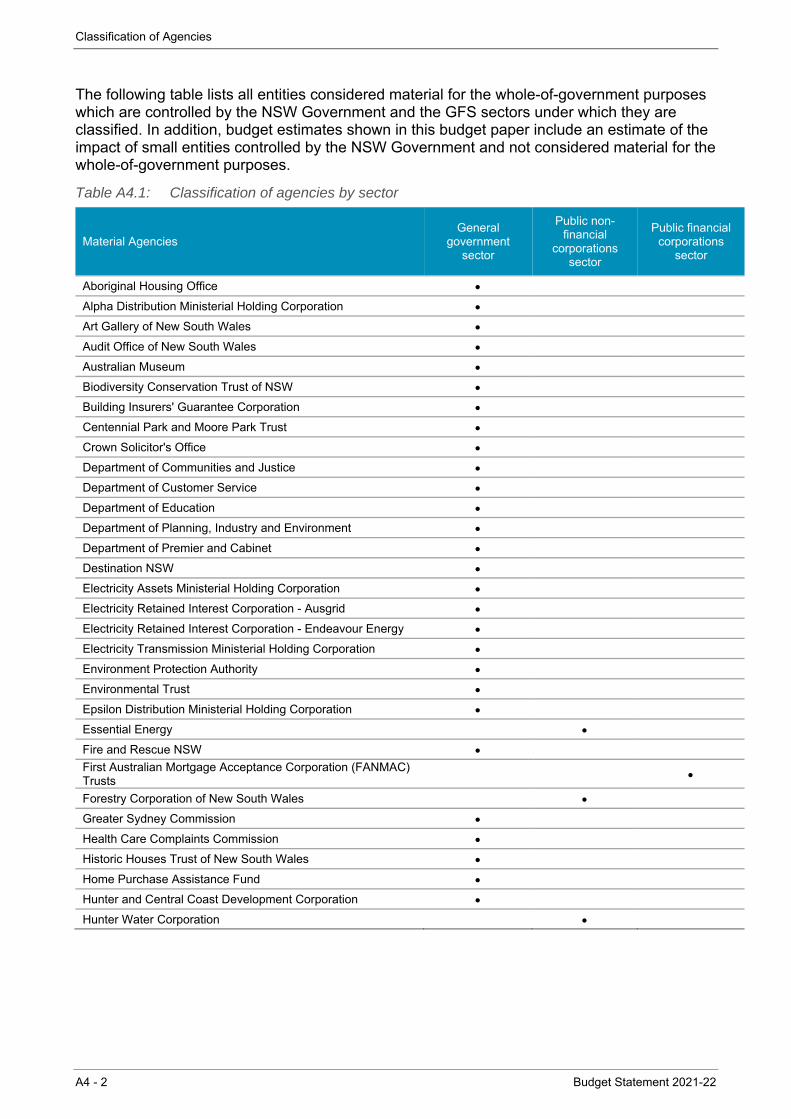
Classification of Agencies
A4 - 2 Budget Statement 2021-22
The following table lists all entities considered material for the whole-of-government purposes which are controlled by the NSW Government and the GFS sectors under which they are classified. In addition, budget estimates shown in this budget paper include an estimate of the impact of small entities controlled by the NSW Government and not considered material for the whole-of-government purposes.
Table A4.1: Classification of agencies by sector
Material Agencies General
government sector
Public non-financial
corporations sector
Public financial corporations
sector
Aboriginal Housing Office
Alpha Distribution Ministerial Holding Corporation
Art Gallery of New South Wales
Audit Office of New South Wales
Australian Museum
Biodiversity Conservation Trust of NSW
Building Insurers' Guarantee Corporation
Centennial Park and Moore Park Trust
Crown Solicitor's Office
Department of Communities and Justice
Department of Customer Service
Department of Education
Department of Planning, Industry and Environment
Department of Premier and Cabinet
Destination NSW
Electricity Assets Ministerial Holding Corporation
Electricity Retained Interest Corporation - Ausgrid
Electricity Retained Interest Corporation - Endeavour Energy
Electricity Transmission Ministerial Holding Corporation
Environment Protection Authority
Environmental Trust
Epsilon Distribution Ministerial Holding Corporation
Essential Energy
Fire and Rescue NSW
First Australian Mortgage Acceptance Corporation (FANMAC) Trusts
Forestry Corporation of New South Wales
Greater Sydney Commission
Health Care Complaints Commission
Historic Houses Trust of New South Wales
Home Purchase Assistance Fund
Hunter and Central Coast Development Corporation
Hunter Water Corporation
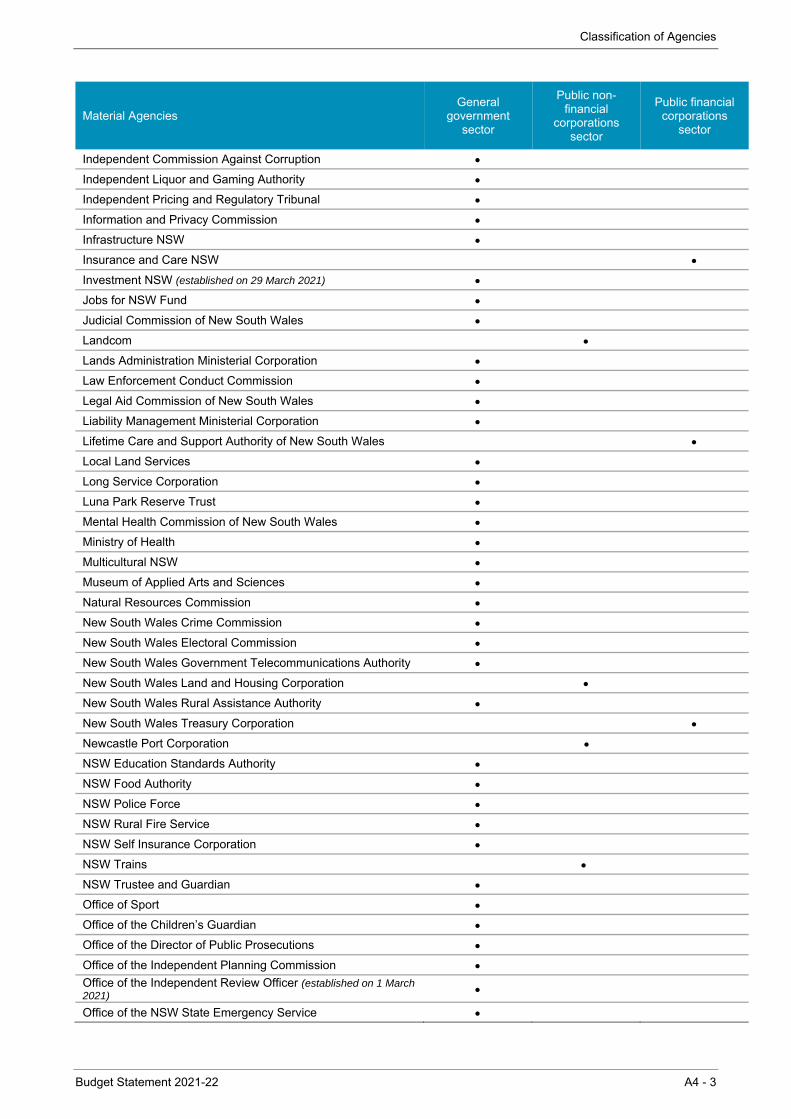
Classification of Agencies
Budget Statement 2021-22 A4 - 3
Independent Commission Against Corruption
Independent Liquor and Gaming Authority
Independent Pricing and Regulatory Tribunal
Information and Privacy Commission
Infrastructure NSW
Insurance and Care NSW
Investment NSW (established on 29 March 2021)
Jobs for NSW Fund
Judicial Commission of New South Wales
Landcom
Lands Administration Ministerial Corporation
Law Enforcement Conduct Commission
Legal Aid Commission of New South Wales
Liability Management Ministerial Corporation
Lifetime Care and Support Authority of New South Wales
Local Land Services
Long Service Corporation
Luna Park Reserve Trust
Mental Health Commission of New South Wales
Ministry of Health
Multicultural NSW
Museum of Applied Arts and Sciences
Natural Resources Commission
New South Wales Crime Commission
New South Wales Electoral Commission
New South Wales Government Telecommunications Authority
New South Wales Land and Housing Corporation
New South Wales Rural Assistance Authority
New South Wales Treasury Corporation
Newcastle Port Corporation
NSW Education Standards Authority
NSW Food Authority
NSW Police Force
NSW Rural Fire Service
NSW Self Insurance Corporation
NSW Trains
NSW Trustee and Guardian
Office of Sport
Office of the Children’s Guardian
Office of the Director of Public Prosecutions
Office of the Independent Planning Commission
Office of the Independent Review Officer (established on 1 March 2021)
Office of the NSW State Emergency Service
Material Agencies General
government sector
Public non-financial
corporations sector
Public financial corporations
sector
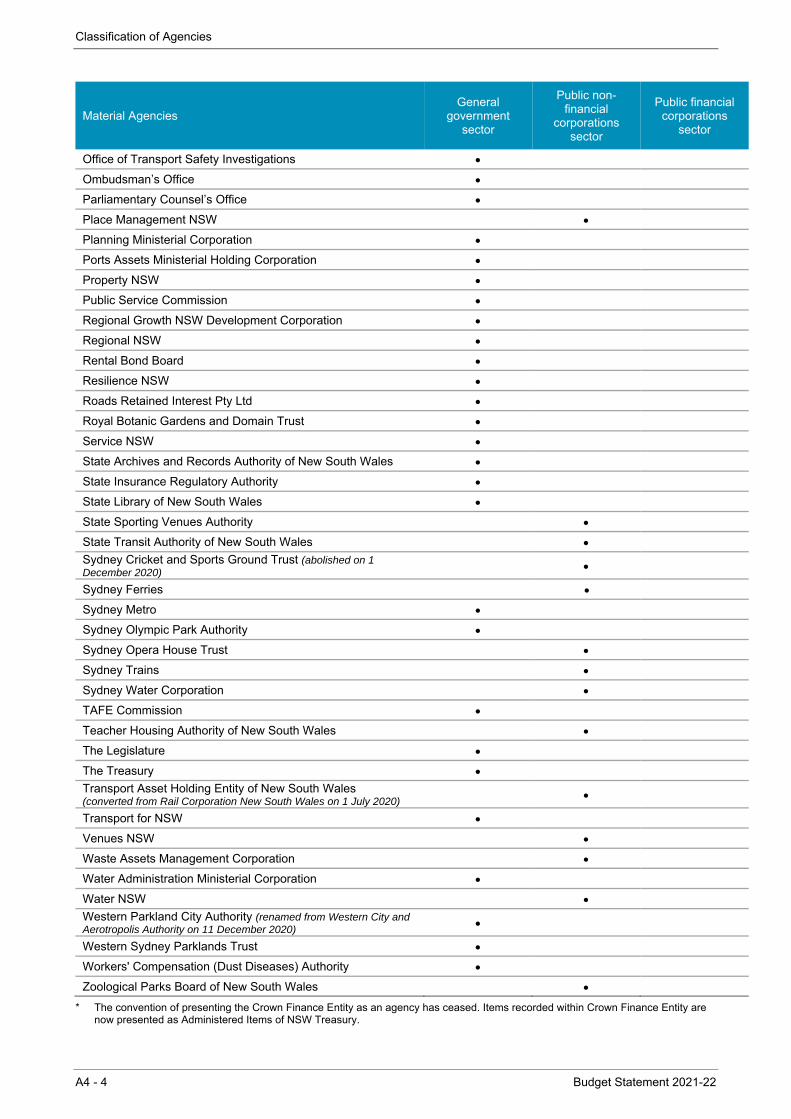
Classification of Agencies
A4 - 4 Budget Statement 2021-22
Office of Transport Safety Investigations
Ombudsman’s Office
Parliamentary Counsel’s Office
Place Management NSW
Planning Ministerial Corporation
Ports Assets Ministerial Holding Corporation
Property NSW
Public Service Commission
Regional Growth NSW Development Corporation
Regional NSW
Rental Bond Board
Resilience NSW
Roads Retained Interest Pty Ltd
Royal Botanic Gardens and Domain Trust
Service NSW
State Archives and Records Authority of New South Wales
State Insurance Regulatory Authority
State Library of New South Wales
State Sporting Venues Authority
State Transit Authority of New South Wales
Sydney Cricket and Sports Ground Trust (abolished on 1 December 2020)
Sydney Ferries
Sydney Metro
Sydney Olympic Park Authority
Sydney Opera House Trust
Sydney Trains
Sydney Water Corporation
TAFE Commission
Teacher Housing Authority of New South Wales
The Legislature
The Treasury
Transport Asset Holding Entity of New South Wales (converted from Rail Corporation New South Wales on 1 July 2020)
Transport for NSW
Venues NSW
Waste Assets Management Corporation
Water Administration Ministerial Corporation
Water NSW
Western Parkland City Authority (renamed from Western City and Aerotropolis Authority on 11 December 2020)
Western Sydney Parklands Trust
Workers' Compensation (Dust Diseases) Authority
Zoological Parks Board of New South Wales
* The convention of presenting the Crown Finance Entity as an agency has ceased. Items recorded within Crown Finance Entity are now presented as Administered Items of NSW Treasury.
Material Agencies General
government sector
Public non-financial
corporations sector
Public financial corporations
sector
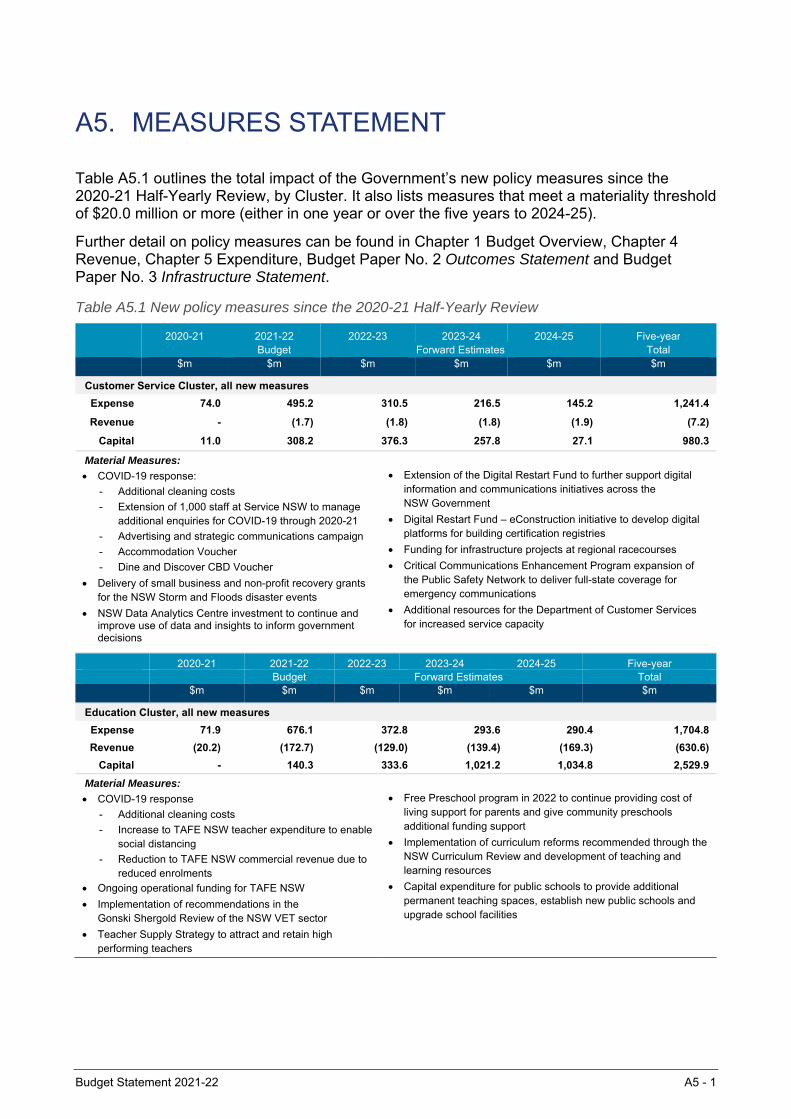
Budget Statement 2021-22 A5 - 1
A5. MEASURES STATEMENT
Table A5.1 outlines the total impact of the Government’s new policy measures since the 2020-21 Half-Yearly Review, by Cluster. It also lists measures that meet a materiality threshold of $20.0 million or more (either in one year or over the five years to 2024-25).
Further detail on policy measures can be found in Chapter 1 Budget Overview, Chapter 4 Revenue, Chapter 5 Expenditure, Budget Paper No. 2 Outcomes Statement and Budget Paper No. 3 Infrastructure Statement.
Table A5.1 New policy measures since the 2020-21 Half-Yearly Review
2020-21 2021-22 2022-23 2023-24 2024-25 Five-year Budget Forward Estimates Total $m $m $m $m $m $m
Customer Service Cluster, all new measures
Expense 74.0 495.2 310.5 216.5 145.2 1,241.4
Revenue - (1.7) (1.8) (1.8) (1.9) (7.2)
Capital 11.0 308.2 376.3 257.8 27.1 980.3
Material Measures:
COVID-19 response:
- Additional cleaning costs
- Extension of 1,000 staff at Service NSW to manage additional enquiries for COVID-19 through 2020-21
- Advertising and strategic communications campaign
- Accommodation Voucher
- Dine and Discover CBD Voucher
Delivery of small business and non-profit recovery grants for the NSW Storm and Floods disaster events
NSW Data Analytics Centre investment to continue and improve use of data and insights to inform government decisions
Extension of the Digital Restart Fund to further support digital
information and communications initiatives across the NSW Government
Digital Restart Fund – eConstruction initiative to develop digital platforms for building certification registries
Funding for infrastructure projects at regional racecourses
Critical Communications Enhancement Program expansion of the Public Safety Network to deliver full-state coverage for emergency communications
Additional resources for the Department of Customer Services for increased service capacity
2020-21 2021-22 2022-23 2023-24 2024-25 Five-year Budget Forward Estimates Total $m $m $m $m $m $m
Education Cluster, all new measures
Expense 71.9 676.1 372.8 293.6 290.4 1,704.8
Revenue (20.2) (172.7) (129.0) (139.4) (169.3) (630.6)
Capital - 140.3 333.6 1,021.2 1,034.8 2,529.9
Material Measures:
COVID-19 response
- Additional cleaning costs
- Increase to TAFE NSW teacher expenditure to enable social distancing
- Reduction to TAFE NSW commercial revenue due to reduced enrolments
Ongoing operational funding for TAFE NSW
Implementation of recommendations in the Gonski Shergold Review of the NSW VET sector
Teacher Supply Strategy to attract and retain high performing teachers
Free Preschool program in 2022 to continue providing cost of
living support for parents and give community preschools additional funding support
Implementation of curriculum reforms recommended through the NSW Curriculum Review and development of teaching and learning resources
Capital expenditure for public schools to provide additional permanent teaching spaces, establish new public schools and upgrade school facilities
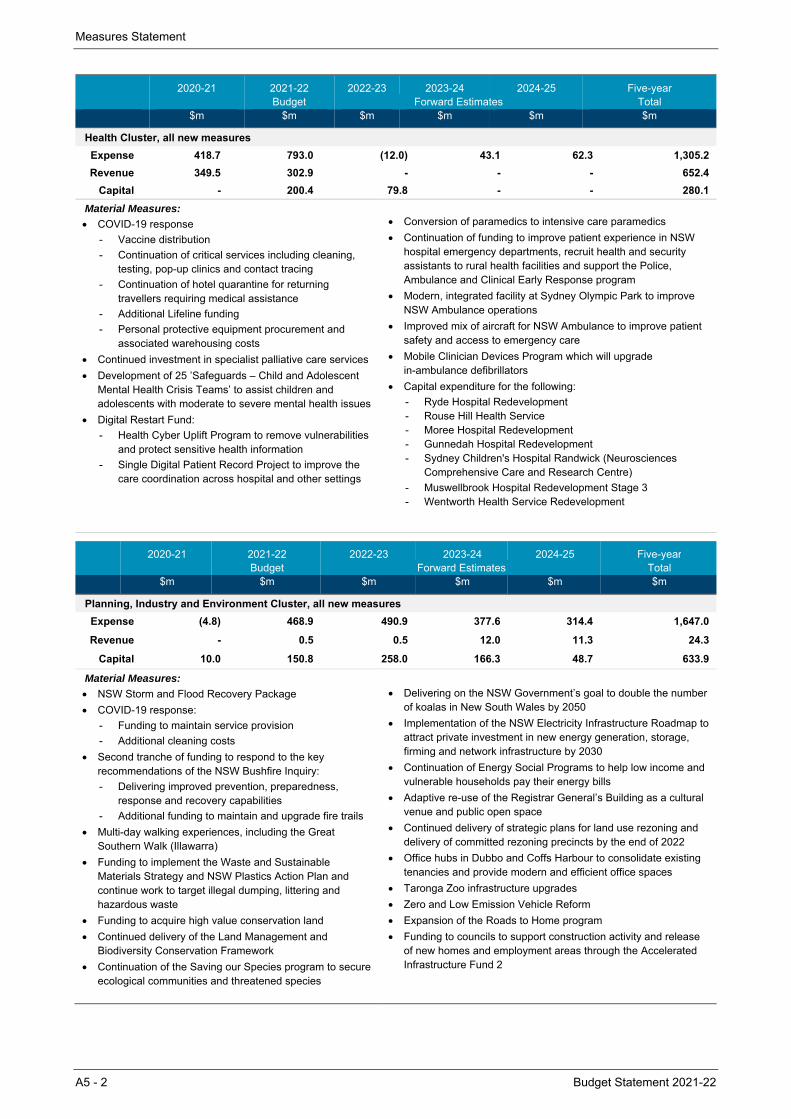
Measures Statement
A5 - 2 Budget Statement 2021-22
2020-21 2021-22 2022-23 2023-24 2024-25 Five-year Budget Forward Estimates Total $m $m $m $m $m $m
Health Cluster, all new measures
Expense 418.7 793.0 (12.0) 43.1 62.3 1,305.2
Revenue 349.5 302.9 - - - 652.4
Capital - 200.4 79.8 - - 280.1
Material Measures:
COVID-19 response
- Vaccine distribution
- Continuation of critical services including cleaning, testing, pop-up clinics and contact tracing
- Continuation of hotel quarantine for returning travellers requiring medical assistance
- Additional Lifeline funding
- Personal protective equipment procurement and associated warehousing costs
Continued investment in specialist palliative care services
Development of 25 ’Safeguards – Child and Adolescent Mental Health Crisis Teams’ to assist children and adolescents with moderate to severe mental health issues
Digital Restart Fund:
- Health Cyber Uplift Program to remove vulnerabilities and protect sensitive health information
- Single Digital Patient Record Project to improve the care coordination across hospital and other settings
Conversion of paramedics to intensive care paramedics
Continuation of funding to improve patient experience in NSW hospital emergency departments, recruit health and security assistants to rural health facilities and support the Police, Ambulance and Clinical Early Response program
Modern, integrated facility at Sydney Olympic Park to improve NSW Ambulance operations
Improved mix of aircraft for NSW Ambulance to improve patient safety and access to emergency care
Mobile Clinician Devices Program which will upgrade in-ambulance defibrillators
Capital expenditure for the following:
- Ryde Hospital Redevelopment - Rouse Hill Health Service - Moree Hospital Redevelopment - Gunnedah Hospital Redevelopment - Sydney Children's Hospital Randwick (Neurosciences
Comprehensive Care and Research Centre)
- Muswellbrook Hospital Redevelopment Stage 3 - Wentworth Health Service Redevelopment
2020-21 2021-22 2022-23 2023-24 2024-25 Five-year Budget Forward Estimates Total $m $m $m $m $m $m
Planning, Industry and Environment Cluster, all new measures
Expense (4.8) 468.9 490.9 377.6 314.4 1,647.0
Revenue - 0.5 0.5 12.0 11.3 24.3
Capital 10.0 150.8 258.0 166.3 48.7 633.9
Material Measures:
NSW Storm and Flood Recovery Package
COVID-19 response:
- Funding to maintain service provision
- Additional cleaning costs
Second tranche of funding to respond to the key recommendations of the NSW Bushfire Inquiry:
- Delivering improved prevention, preparedness, response and recovery capabilities
- Additional funding to maintain and upgrade fire trails
Multi-day walking experiences, including the Great Southern Walk (Illawarra)
Funding to implement the Waste and Sustainable Materials Strategy and NSW Plastics Action Plan and continue work to target illegal dumping, littering and hazardous waste
Funding to acquire high value conservation land
Continued delivery of the Land Management and Biodiversity Conservation Framework
Continuation of the Saving our Species program to secure ecological communities and threatened species
Delivering on the NSW Government’s goal to double the number
of koalas in New South Wales by 2050
Implementation of the NSW Electricity Infrastructure Roadmap to attract private investment in new energy generation, storage, firming and network infrastructure by 2030
Continuation of Energy Social Programs to help low income and vulnerable households pay their energy bills
Adaptive re-use of the Registrar General’s Building as a cultural venue and public open space
Continued delivery of strategic plans for land use rezoning and delivery of committed rezoning precincts by the end of 2022
Office hubs in Dubbo and Coffs Harbour to consolidate existing tenancies and provide modern and efficient office spaces
Taronga Zoo infrastructure upgrades
Zero and Low Emission Vehicle Reform
Expansion of the Roads to Home program
Funding to councils to support construction activity and release of new homes and employment areas through the Accelerated Infrastructure Fund 2
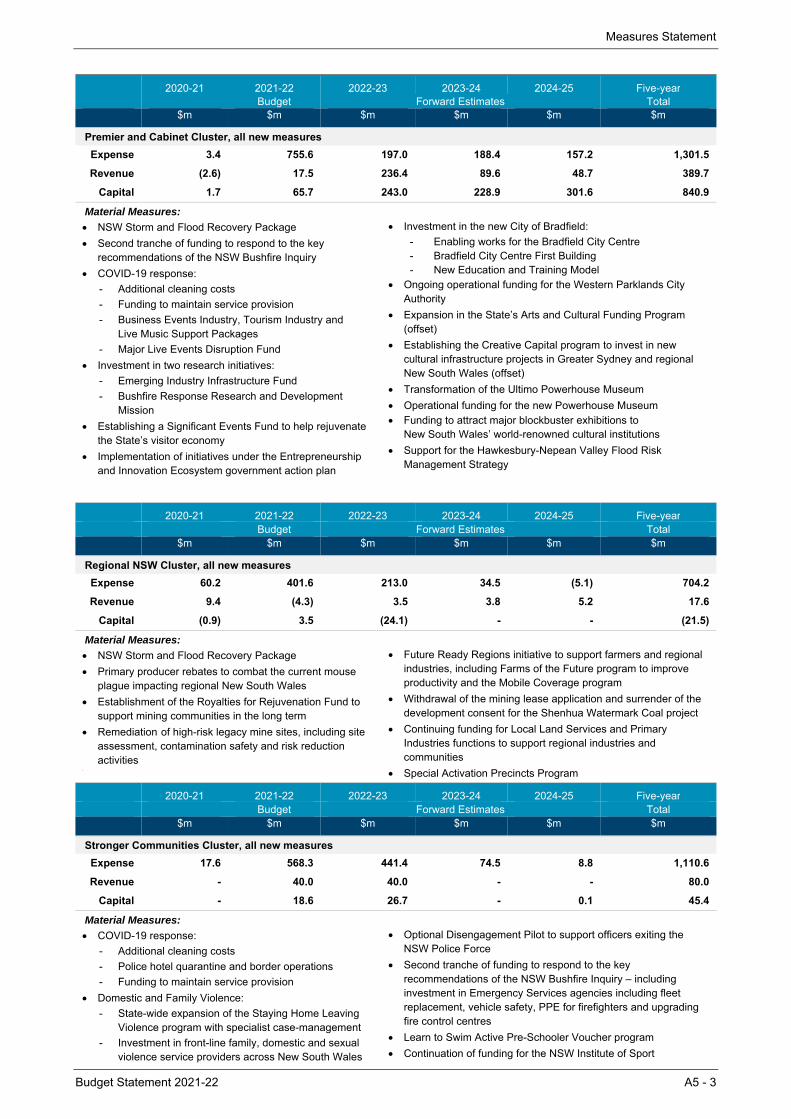
Measures Statement
Budget Statement 2021-22 A5 - 3
2020-21 2021-22 2022-23 2023-24 2024-25 Five-year Budget Forward Estimates Total $m $m $m $m $m $m
Premier and Cabinet Cluster, all new measures
Expense 3.4 755.6 197.0 188.4 157.2 1,301.5
Revenue (2.6) 17.5 236.4 89.6 48.7 389.7
Capital 1.7 65.7 243.0 228.9 301.6 840.9
Material Measures:
NSW Storm and Flood Recovery Package
Second tranche of funding to respond to the key recommendations of the NSW Bushfire Inquiry
COVID-19 response:
- Additional cleaning costs
- Funding to maintain service provision
- Business Events Industry, Tourism Industry and Live Music Support Packages
- Major Live Events Disruption Fund
Investment in two research initiatives:
- Emerging Industry Infrastructure Fund
- Bushfire Response Research and Development Mission
Establishing a Significant Events Fund to help rejuvenate the State’s visitor economy
Implementation of initiatives under the Entrepreneurship and Innovation Ecosystem government action plan
Investment in the new City of Bradfield:
- Enabling works for the Bradfield City Centre - Bradfield City Centre First Building - New Education and Training Model
Ongoing operational funding for the Western Parklands City Authority
Expansion in the State’s Arts and Cultural Funding Program (offset)
Establishing the Creative Capital program to invest in new cultural infrastructure projects in Greater Sydney and regional New South Wales (offset)
Transformation of the Ultimo Powerhouse Museum
Operational funding for the new Powerhouse Museum Funding to attract major blockbuster exhibitions to
New South Wales’ world-renowned cultural institutions
Support for the Hawkesbury-Nepean Valley Flood Risk Management Strategy
2020-21 2021-22 2022-23 2023-24 2024-25 Five-year Budget Forward Estimates Total $m $m $m $m $m $m
Regional NSW Cluster, all new measures
Expense 60.2 401.6 213.0 34.5 (5.1) 704.2
Revenue 9.4 (4.3) 3.5 3.8 5.2 17.6
Capital (0.9) 3.5 (24.1) - - (21.5)
Material Measures:
NSW Storm and Flood Recovery Package
Primary producer rebates to combat the current mouse plague impacting regional New South Wales
Establishment of the Royalties for Rejuvenation Fund to support mining communities in the long term
Remediation of high-risk legacy mine sites, including site assessment, contamination safety and risk reduction activities
Future Ready Regions initiative to support farmers and regional
industries, including Farms of the Future program to improve productivity and the Mobile Coverage program
Withdrawal of the mining lease application and surrender of the development consent for the Shenhua Watermark Coal project
Continuing funding for Local Land Services and Primary Industries functions to support regional industries and communities
Special Activation Precincts Program
2020-21 2021-22 2022-23 2023-24 2024-25 Five-year Budget Forward Estimates Total $m $m $m $m $m $m
Stronger Communities Cluster, all new measures
Expense 17.6 568.3 441.4 74.5 8.8 1,110.6
Revenue - 40.0 40.0 - - 80.0
Capital - 18.6 26.7 - 0.1 45.4
Material Measures:
COVID-19 response:
- Additional cleaning costs
- Police hotel quarantine and border operations
- Funding to maintain service provision
Domestic and Family Violence:
- State-wide expansion of the Staying Home Leaving Violence program with specialist case-management
- Investment in front-line family, domestic and sexual violence service providers across New South Wales
Optional Disengagement Pilot to support officers exiting the
NSW Police Force
Second tranche of funding to respond to the key recommendations of the NSW Bushfire Inquiry – including investment in Emergency Services agencies including fleet replacement, vehicle safety, PPE for firefighters and upgrading fire control centres
Learn to Swim Active Pre-Schooler Voucher program
Continuation of funding for the NSW Institute of Sport
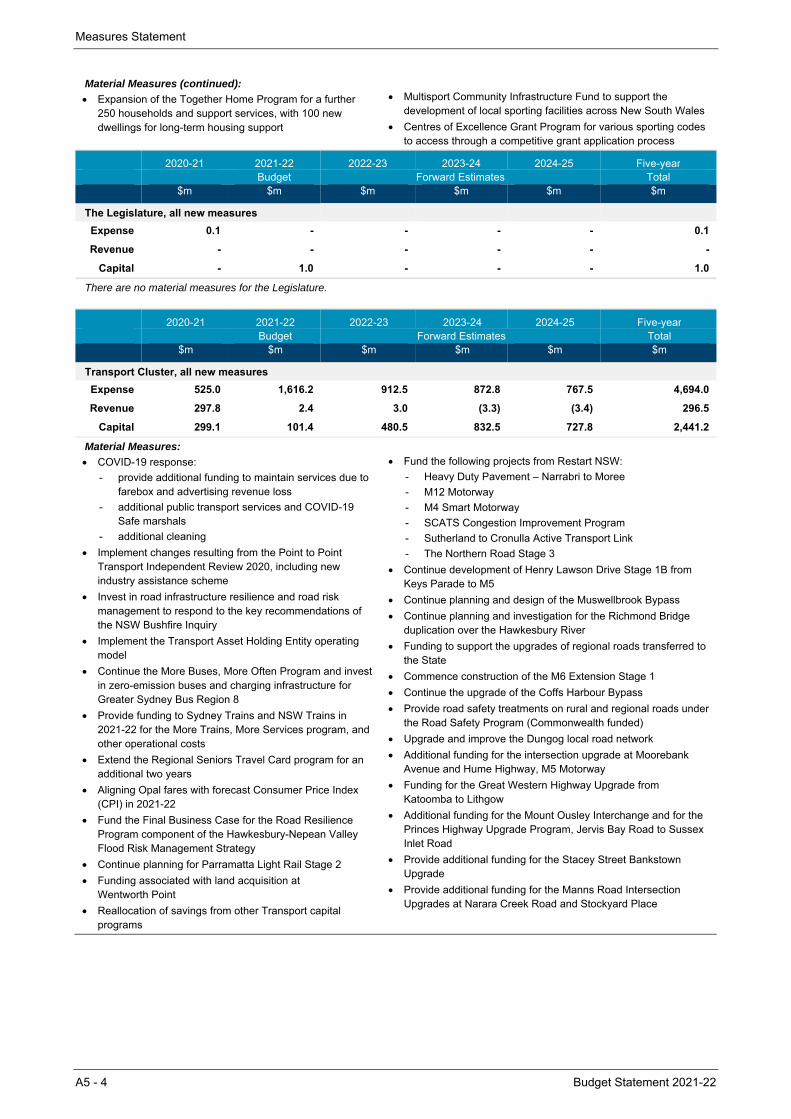
Measures Statement
A5 - 4 Budget Statement 2021-22
Material Measures (continued):
Expansion of the Together Home Program for a further 250 households and support services, with 100 new dwellings for long-term housing support
Multisport Community Infrastructure Fund to support the
development of local sporting facilities across New South Wales
Centres of Excellence Grant Program for various sporting codes to access through a competitive grant application process
2020-21 2021-22 2022-23 2023-24 2024-25 Five-year Budget Forward Estimates Total $m $m $m $m $m $m
The Legislature, all new measures
Expense 0.1 - - - - 0.1
Revenue - - - - - -
Capital - 1.0 - - - 1.0
There are no material measures for the Legislature.
2020-21 2021-22 2022-23 2023-24 2024-25 Five-year Budget Forward Estimates Total
$m $m $m $m $m $m
Transport Cluster, all new measures
Expense 525.0 1,616.2 912.5 872.8 767.5 4,694.0
Revenue 297.8 2.4 3.0 (3.3) (3.4) 296.5
Capital 299.1 101.4 480.5 832.5 727.8 2,441.2
Material Measures:
COVID-19 response:
- provide additional funding to maintain services due to farebox and advertising revenue loss
- additional public transport services and COVID-19 Safe marshals
- additional cleaning
Implement changes resulting from the Point to Point Transport Independent Review 2020, including new industry assistance scheme
Invest in road infrastructure resilience and road risk management to respond to the key recommendations of the NSW Bushfire Inquiry
Implement the Transport Asset Holding Entity operating model
Continue the More Buses, More Often Program and invest in zero-emission buses and charging infrastructure for Greater Sydney Bus Region 8
Provide funding to Sydney Trains and NSW Trains in 2021-22 for the More Trains, More Services program, and other operational costs
Extend the Regional Seniors Travel Card program for an additional two years
Aligning Opal fares with forecast Consumer Price Index (CPI) in 2021-22
Fund the Final Business Case for the Road Resilience Program component of the Hawkesbury-Nepean Valley Flood Risk Management Strategy
Continue planning for Parramatta Light Rail Stage 2
Funding associated with land acquisition at Wentworth Point
Reallocation of savings from other Transport capital programs
Fund the following projects from Restart NSW:
- Heavy Duty Pavement – Narrabri to Moree
- M12 Motorway
- M4 Smart Motorway
- SCATS Congestion Improvement Program
- Sutherland to Cronulla Active Transport Link
- The Northern Road Stage 3
Continue development of Henry Lawson Drive Stage 1B from Keys Parade to M5
Continue planning and design of the Muswellbrook Bypass
Continue planning and investigation for the Richmond Bridge duplication over the Hawkesbury River
Funding to support the upgrades of regional roads transferred to the State
Commence construction of the M6 Extension Stage 1
Continue the upgrade of the Coffs Harbour Bypass
Provide road safety treatments on rural and regional roads under the Road Safety Program (Commonwealth funded)
Upgrade and improve the Dungog local road network
Additional funding for the intersection upgrade at Moorebank Avenue and Hume Highway, M5 Motorway
Funding for the Great Western Highway Upgrade from Katoomba to Lithgow
Additional funding for the Mount Ousley Interchange and for the Princes Highway Upgrade Program, Jervis Bay Road to Sussex Inlet Road
Provide additional funding for the Stacey Street Bankstown Upgrade
Provide additional funding for the Manns Road Intersection Upgrades at Narara Creek Road and Stockyard Place
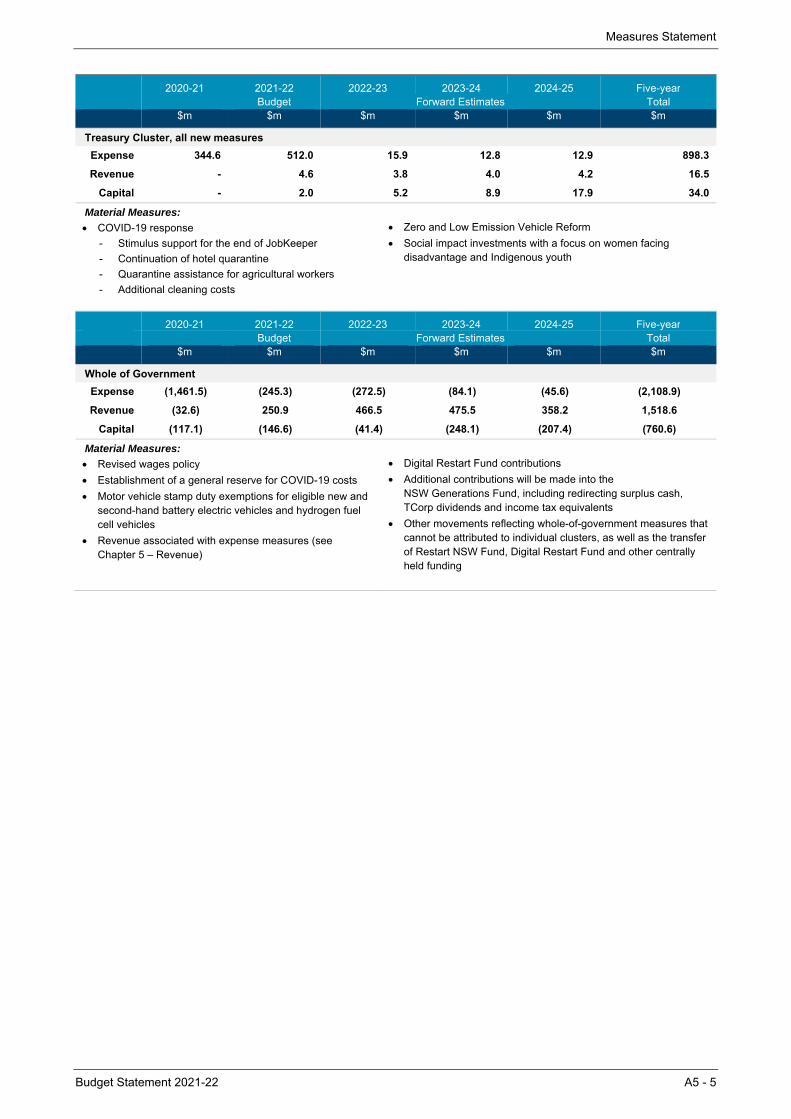
Measures Statement
Budget Statement 2021-22 A5 - 5
2020-21 2021-22 2022-23 2023-24 2024-25 Five-year Budget Forward Estimates Total $m $m $m $m $m $m
Treasury Cluster, all new measures
Expense 344.6 512.0 15.9 12.8 12.9 898.3
Revenue - 4.6 3.8 4.0 4.2 16.5
Capital - 2.0 5.2 8.9 17.9 34.0
Material Measures:
COVID-19 response
- Stimulus support for the end of JobKeeper
- Continuation of hotel quarantine
- Quarantine assistance for agricultural workers
- Additional cleaning costs
Zero and Low Emission Vehicle Reform
Social impact investments with a focus on women facing disadvantage and Indigenous youth
2020-21 2021-22 2022-23 2023-24 2024-25 Five-year Budget Forward Estimates Total $m $m $m $m $m $m
Whole of Government
Expense (1,461.5) (245.3) (272.5) (84.1) (45.6) (2,108.9)
Revenue (32.6) 250.9 466.5 475.5 358.2 1,518.6
Capital (117.1) (146.6) (41.4) (248.1) (207.4) (760.6)
Material Measures:
Revised wages policy
Establishment of a general reserve for COVID-19 costs
Motor vehicle stamp duty exemptions for eligible new and second-hand battery electric vehicles and hydrogen fuel cell vehicles
Revenue associated with expense measures (see Chapter 5 – Revenue)
Digital Restart Fund contributions
Additional contributions will be made into the NSW Generations Fund, including redirecting surplus cash, TCorp dividends and income tax equivalents
Other movements reflecting whole-of-government measures that cannot be attributed to individual clusters, as well as the transfer of Restart NSW Fund, Digital Restart Fund and other centrally held funding

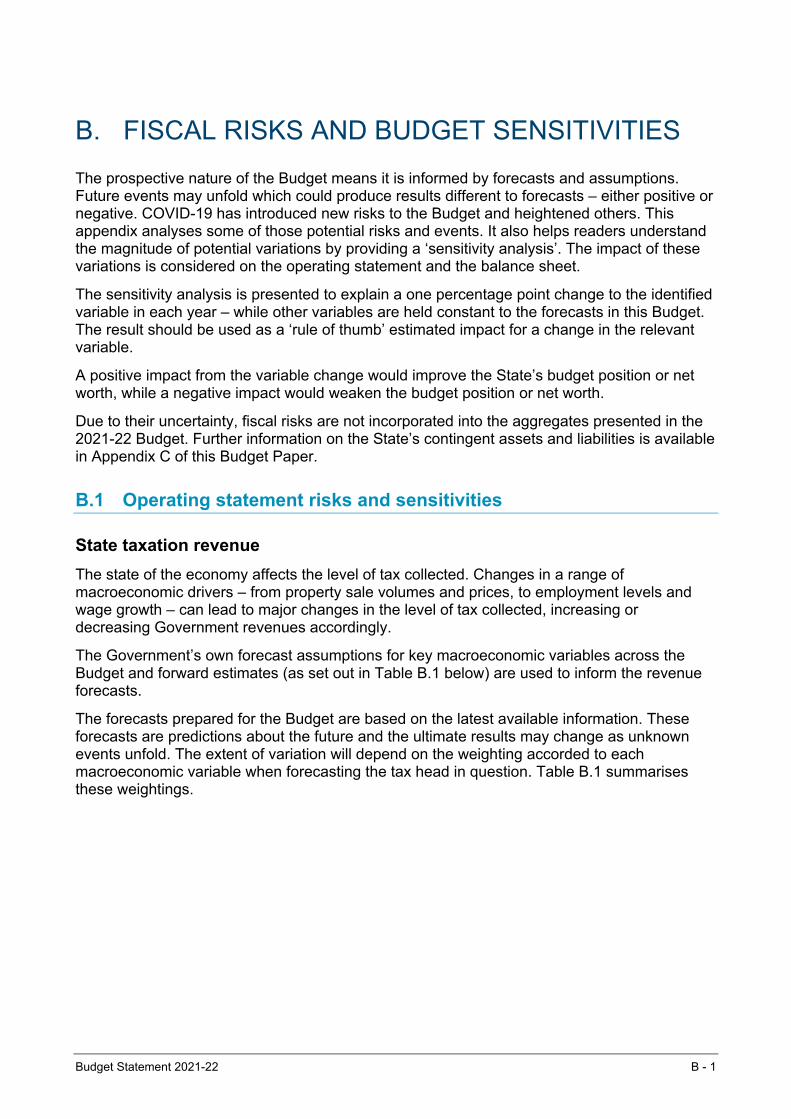
Budget Statement 2021-22 B - 1
B. FISCAL RISKS AND BUDGET SENSITIVITIES
The prospective nature of the Budget means it is informed by forecasts and assumptions. Future events may unfold which could produce results different to forecasts – either positive or negative. COVID-19 has introduced new risks to the Budget and heightened others. This appendix analyses some of those potential risks and events. It also helps readers understand the magnitude of potential variations by providing a ‘sensitivity analysis’. The impact of these variations is considered on the operating statement and the balance sheet.
The sensitivity analysis is presented to explain a one percentage point change to the identified variable in each year – while other variables are held constant to the forecasts in this Budget. The result should be used as a ‘rule of thumb’ estimated impact for a change in the relevant variable.
A positive impact from the variable change would improve the State’s budget position or net worth, while a negative impact would weaken the budget position or net worth.
Due to their uncertainty, fiscal risks are not incorporated into the aggregates presented in the 2021-22 Budget. Further information on the State’s contingent assets and liabilities is available in Appendix C of this Budget Paper.
B.1 Operating statement risks and sensitivities
State taxation revenue
The state of the economy affects the level of tax collected. Changes in a range of macroeconomic drivers – from property sale volumes and prices, to employment levels and wage growth – can lead to major changes in the level of tax collected, increasing or decreasing Government revenues accordingly.
The Government’s own forecast assumptions for key macroeconomic variables across the Budget and forward estimates (as set out in Table B.1 below) are used to inform the revenue forecasts.
The forecasts prepared for the Budget are based on the latest available information. These forecasts are predictions about the future and the ultimate results may change as unknown events unfold. The extent of variation will depend on the weighting accorded to each macroeconomic variable when forecasting the tax head in question. Table B.1 summarises these weightings.
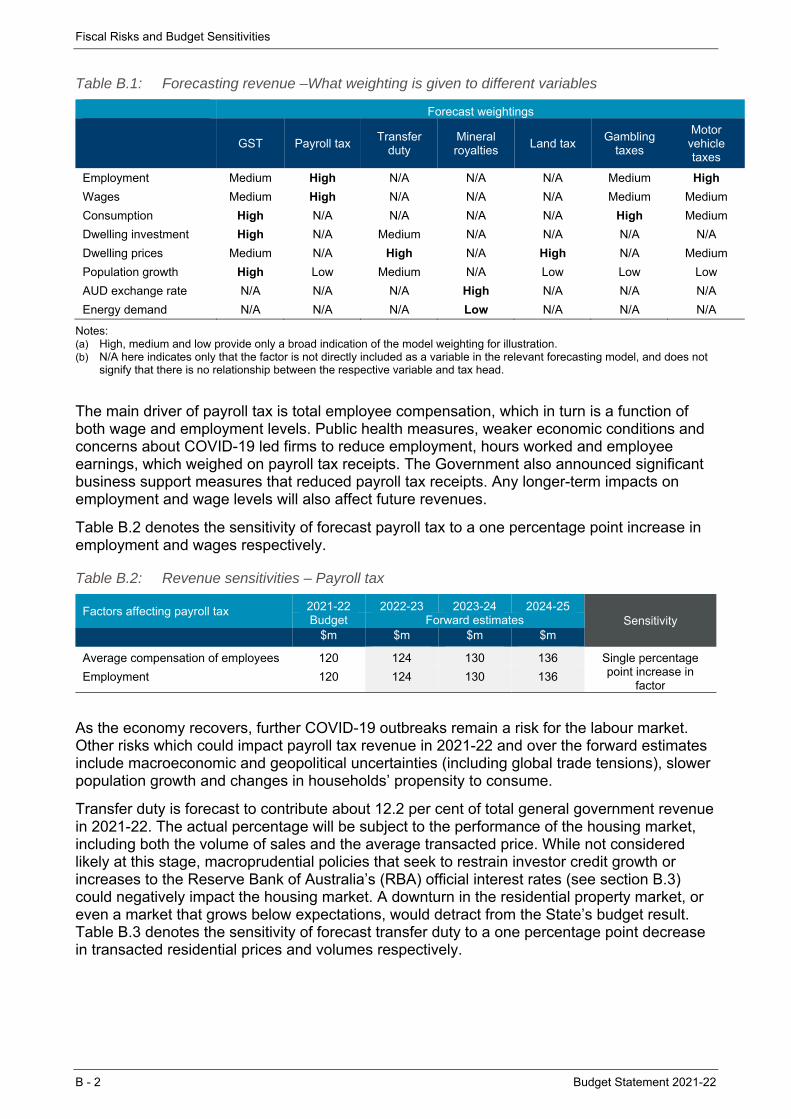
Fiscal Risks and Budget Sensitivities
B - 2 Budget Statement 2021-22
Table B.1: Forecasting revenue –What weighting is given to different variables
Forecast weightings
GST Payroll tax Transfer
duty Mineral royalties
Land tax Gambling
taxes
Motor vehicle taxes
Employment Medium High N/A N/A N/A Medium High
Wages Medium High N/A N/A N/A Medium Medium
Consumption High N/A N/A N/A N/A High Medium
Dwelling investment High N/A Medium N/A N/A N/A N/A
Dwelling prices Medium N/A High N/A High N/A Medium
Population growth High Low Medium N/A Low Low Low
AUD exchange rate N/A N/A N/A High N/A N/A N/A
Energy demand N/A N/A N/A Low N/A N/A N/A
Notes: (a) High, medium and low provide only a broad indication of the model weighting for illustration. (b) N/A here indicates only that the factor is not directly included as a variable in the relevant forecasting model, and does not
signify that there is no relationship between the respective variable and tax head.
The main driver of payroll tax is total employee compensation, which in turn is a function of both wage and employment levels. Public health measures, weaker economic conditions and concerns about COVID-19 led firms to reduce employment, hours worked and employee earnings, which weighed on payroll tax receipts. The Government also announced significant business support measures that reduced payroll tax receipts. Any longer-term impacts on employment and wage levels will also affect future revenues.
Table B.2 denotes the sensitivity of forecast payroll tax to a one percentage point increase in employment and wages respectively.
Table B.2: Revenue sensitivities – Payroll tax
Factors affecting payroll tax 2021-22 2022-23 2023-24 2024-25 Sensitivity Budget Forward estimates
$m $m $m $m
Average compensation of employees 120 124 130 136 Single percentage point increase in
factorEmployment 120 124 130 136
As the economy recovers, further COVID-19 outbreaks remain a risk for the labour market. Other risks which could impact payroll tax revenue in 2021-22 and over the forward estimates include macroeconomic and geopolitical uncertainties (including global trade tensions), slower population growth and changes in households’ propensity to consume.
Transfer duty is forecast to contribute about 12.2 per cent of total general government revenue in 2021-22. The actual percentage will be subject to the performance of the housing market, including both the volume of sales and the average transacted price. While not considered likely at this stage, macroprudential policies that seek to restrain investor credit growth or increases to the Reserve Bank of Australia’s (RBA) official interest rates (see section B.3) could negatively impact the housing market. A downturn in the residential property market, or even a market that grows below expectations, would detract from the State’s budget result. Table B.3 denotes the sensitivity of forecast transfer duty to a one percentage point decrease in transacted residential prices and volumes respectively.
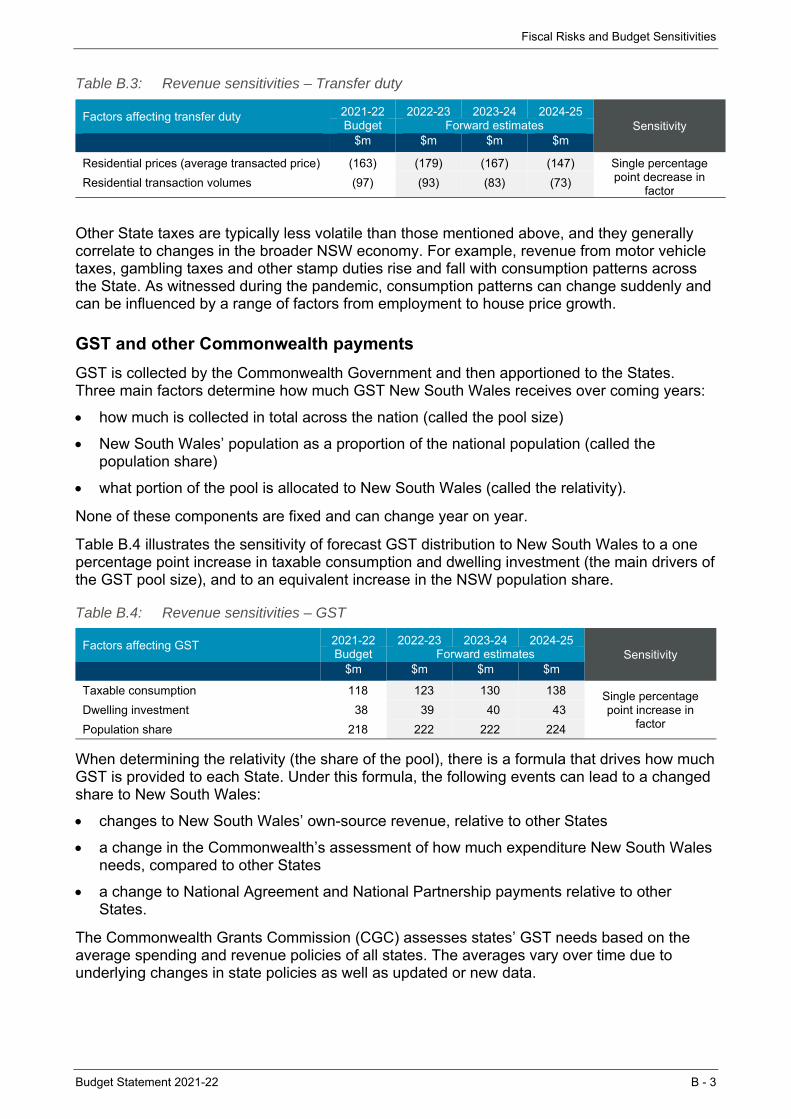
Fiscal Risks and Budget Sensitivities
Budget Statement 2021-22 B - 3
Table B.3: Revenue sensitivities – Transfer duty
Factors affecting transfer duty 2021-22 2022-23 2023-24 2024-25 Sensitivity Budget Forward estimates
$m $m $m $m
Residential prices (average transacted price) (163) (179) (167) (147) Single percentage point decrease in
factorResidential transaction volumes (97) (93) (83) (73)
Other State taxes are typically less volatile than those mentioned above, and they generally correlate to changes in the broader NSW economy. For example, revenue from motor vehicle taxes, gambling taxes and other stamp duties rise and fall with consumption patterns across the State. As witnessed during the pandemic, consumption patterns can change suddenly and can be influenced by a range of factors from employment to house price growth.
GST and other Commonwealth payments
GST is collected by the Commonwealth Government and then apportioned to the States. Three main factors determine how much GST New South Wales receives over coming years:
how much is collected in total across the nation (called the pool size)
New South Wales’ population as a proportion of the national population (called the population share)
what portion of the pool is allocated to New South Wales (called the relativity).
None of these components are fixed and can change year on year.
Table B.4 illustrates the sensitivity of forecast GST distribution to New South Wales to a one percentage point increase in taxable consumption and dwelling investment (the main drivers of the GST pool size), and to an equivalent increase in the NSW population share.
Table B.4: Revenue sensitivities – GST
When determining the relativity (the share of the pool), there is a formula that drives how much GST is provided to each State. Under this formula, the following events can lead to a changed share to New South Wales:
changes to New South Wales’ own-source revenue, relative to other States
a change in the Commonwealth’s assessment of how much expenditure New South Wales needs, compared to other States
a change to National Agreement and National Partnership payments relative to other States.
The Commonwealth Grants Commission (CGC) assesses states’ GST needs based on the average spending and revenue policies of all states. The averages vary over time due to underlying changes in state policies as well as updated or new data.
Factors affecting GST 2021-22 2022-23 2023-24 2024-25 Sensitivity Budget Forward estimates
$m $m $m $m
Taxable consumption 118 123 130 138 Single percentage point increase in
factor Dwelling investment 38 39 40 43
Population share 218 222 222 224
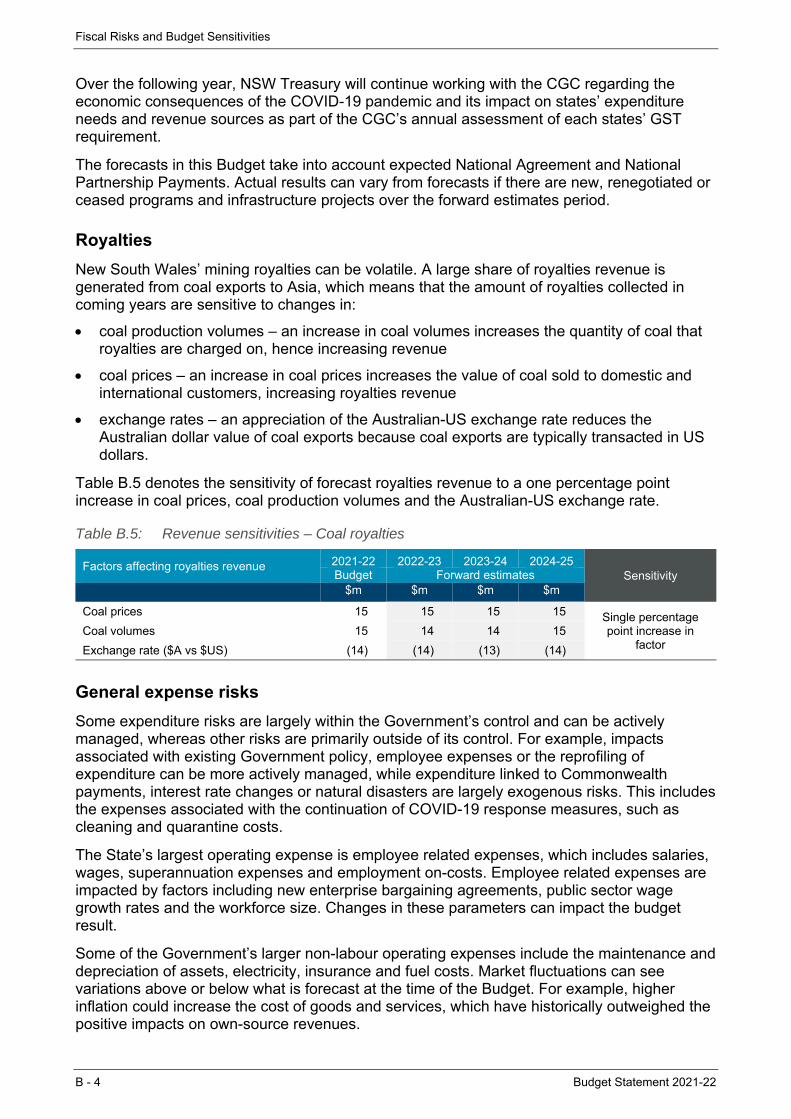
Fiscal Risks and Budget Sensitivities
B - 4 Budget Statement 2021-22
Over the following year, NSW Treasury will continue working with the CGC regarding the economic consequences of the COVID-19 pandemic and its impact on states’ expenditure needs and revenue sources as part of the CGC’s annual assessment of each states’ GST requirement.
The forecasts in this Budget take into account expected National Agreement and National Partnership Payments. Actual results can vary from forecasts if there are new, renegotiated or ceased programs and infrastructure projects over the forward estimates period.
Royalties
New South Wales’ mining royalties can be volatile. A large share of royalties revenue is generated from coal exports to Asia, which means that the amount of royalties collected in coming years are sensitive to changes in:
coal production volumes – an increase in coal volumes increases the quantity of coal that royalties are charged on, hence increasing revenue
coal prices – an increase in coal prices increases the value of coal sold to domestic and international customers, increasing royalties revenue
exchange rates – an appreciation of the Australian-US exchange rate reduces the Australian dollar value of coal exports because coal exports are typically transacted in US dollars.
Table B.5 denotes the sensitivity of forecast royalties revenue to a one percentage point increase in coal prices, coal production volumes and the Australian-US exchange rate.
Table B.5: Revenue sensitivities – Coal royalties
General expense risks
Some expenditure risks are largely within the Government’s control and can be actively managed, whereas other risks are primarily outside of its control. For example, impacts associated with existing Government policy, employee expenses or the reprofiling of expenditure can be more actively managed, while expenditure linked to Commonwealth payments, interest rate changes or natural disasters are largely exogenous risks. This includes the expenses associated with the continuation of COVID-19 response measures, such as cleaning and quarantine costs.
The State’s largest operating expense is employee related expenses, which includes salaries, wages, superannuation expenses and employment on-costs. Employee related expenses are impacted by factors including new enterprise bargaining agreements, public sector wage growth rates and the workforce size. Changes in these parameters can impact the budget result.
Some of the Government’s larger non-labour operating expenses include the maintenance and depreciation of assets, electricity, insurance and fuel costs. Market fluctuations can see variations above or below what is forecast at the time of the Budget. For example, higher inflation could increase the cost of goods and services, which have historically outweighed the positive impacts on own-source revenues.
Factors affecting royalties revenue 2021-22 2022-23 2023-24 2024-25 Sensitivity Budget Forward estimates
$m $m $m $m
Coal prices 15 15 15 15 Single percentage point increase in
factor Coal volumes 15 14 14 15
Exchange rate ($A vs $US) (14) (14) (13) (14)
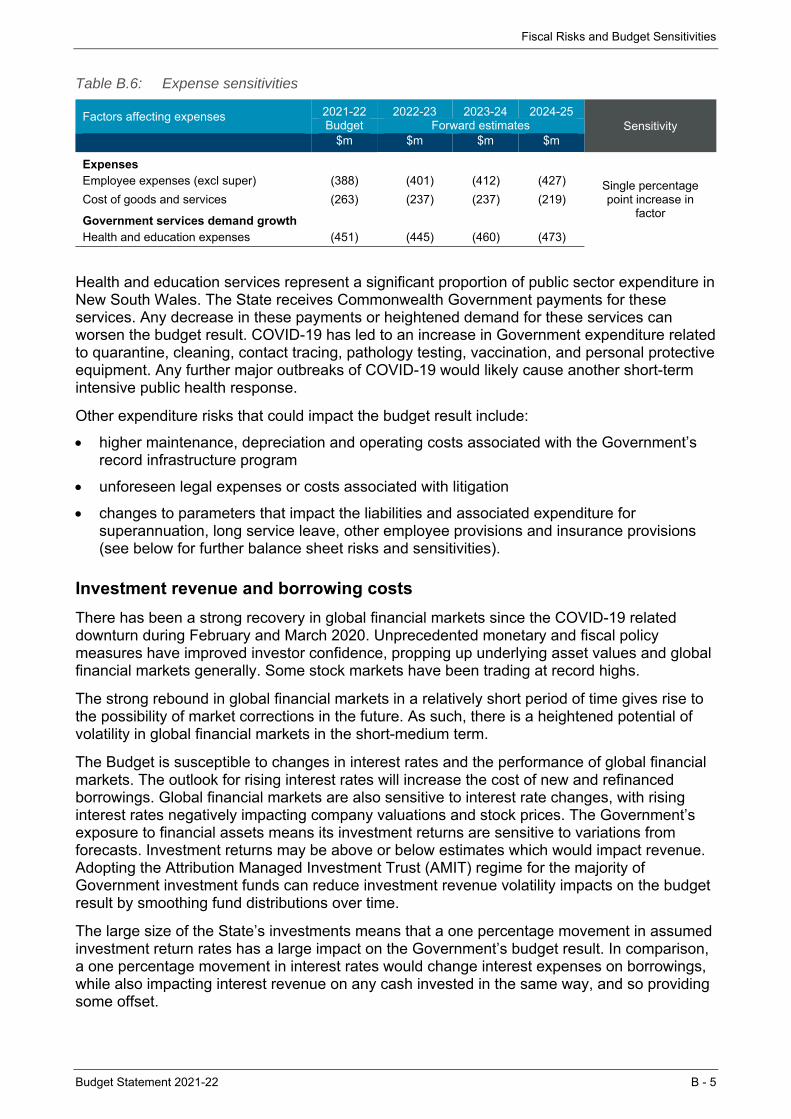
Fiscal Risks and Budget Sensitivities
Budget Statement 2021-22 B - 5
Table B.6: Expense sensitivities
Factors affecting expenses 2021-22 2022-23 2023-24 2024-25 Sensitivity Budget Forward estimates
$m $m $m $m
Expenses
Single percentage point increase in
factor
Employee expenses (excl super) (388) (401) (412) (427)
Cost of goods and services (263) (237) (237) (219)
Government services demand growth
Health and education expenses (451) (445) (460) (473)
Health and education services represent a significant proportion of public sector expenditure in New South Wales. The State receives Commonwealth Government payments for these services. Any decrease in these payments or heightened demand for these services can worsen the budget result. COVID-19 has led to an increase in Government expenditure related to quarantine, cleaning, contact tracing, pathology testing, vaccination, and personal protective equipment. Any further major outbreaks of COVID-19 would likely cause another short-term intensive public health response.
Other expenditure risks that could impact the budget result include:
higher maintenance, depreciation and operating costs associated with the Government’s record infrastructure program
unforeseen legal expenses or costs associated with litigation
changes to parameters that impact the liabilities and associated expenditure for superannuation, long service leave, other employee provisions and insurance provisions (see below for further balance sheet risks and sensitivities).
Investment revenue and borrowing costs
There has been a strong recovery in global financial markets since the COVID-19 related downturn during February and March 2020. Unprecedented monetary and fiscal policy measures have improved investor confidence, propping up underlying asset values and global financial markets generally. Some stock markets have been trading at record highs.
The strong rebound in global financial markets in a relatively short period of time gives rise to the possibility of market corrections in the future. As such, there is a heightened potential of volatility in global financial markets in the short-medium term.
The Budget is susceptible to changes in interest rates and the performance of global financial markets. The outlook for rising interest rates will increase the cost of new and refinanced borrowings. Global financial markets are also sensitive to interest rate changes, with rising interest rates negatively impacting company valuations and stock prices. The Government’s exposure to financial assets means its investment returns are sensitive to variations from forecasts. Investment returns may be above or below estimates which would impact revenue. Adopting the Attribution Managed Investment Trust (AMIT) regime for the majority of Government investment funds can reduce investment revenue volatility impacts on the budget result by smoothing fund distributions over time.
The large size of the State’s investments means that a one percentage movement in assumed investment return rates has a large impact on the Government’s budget result. In comparison, a one percentage movement in interest rates would change interest expenses on borrowings, while also impacting interest revenue on any cash invested in the same way, and so providing some offset.
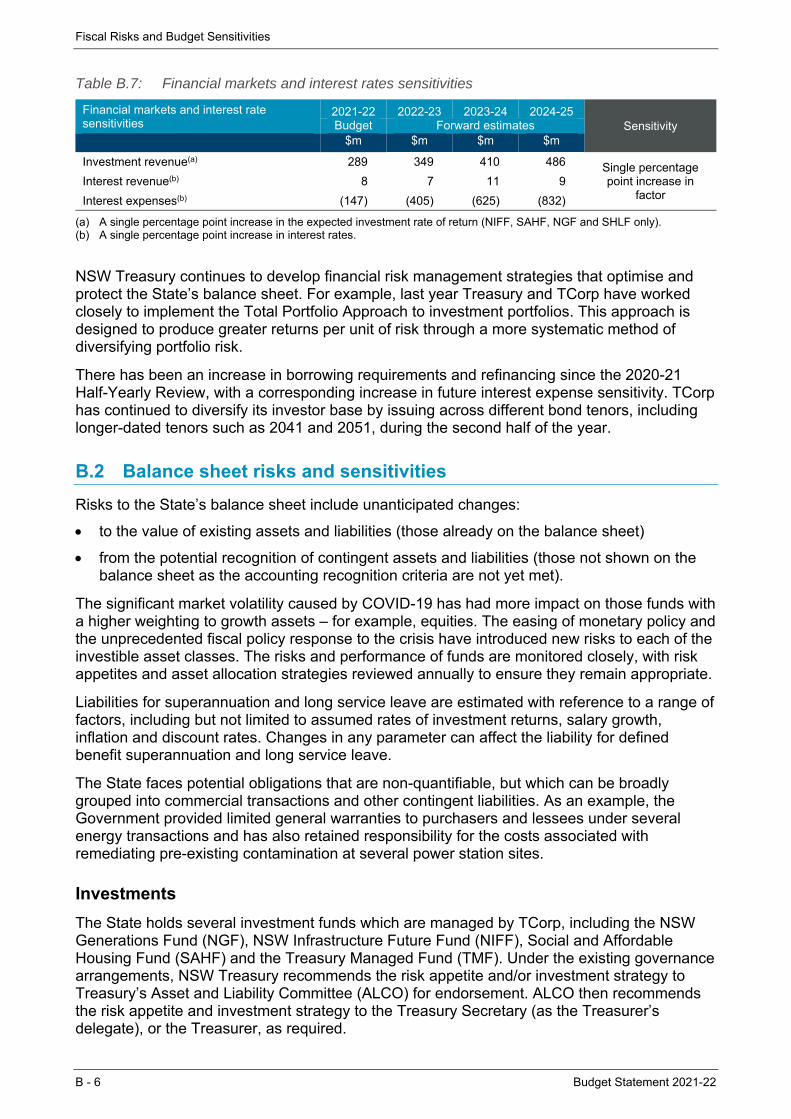
Fiscal Risks and Budget Sensitivities
B - 6 Budget Statement 2021-22
Table B.7: Financial markets and interest rates sensitivities
Financial markets and interest rate sensitivities
2021-22 2022-23 2023-24 2024-25 Sensitivity Budget Forward estimates
$m $m $m $m
Investment revenue(a) 289 349 410 486 Single percentage point increase in
factor Interest revenue(b) 8 7 11 9
Interest expenses(b) (147) (405) (625) (832)
(a) A single percentage point increase in the expected investment rate of return (NIFF, SAHF, NGF and SHLF only). (b) A single percentage point increase in interest rates.
NSW Treasury continues to develop financial risk management strategies that optimise and protect the State’s balance sheet. For example, last year Treasury and TCorp have worked closely to implement the Total Portfolio Approach to investment portfolios. This approach is designed to produce greater returns per unit of risk through a more systematic method of diversifying portfolio risk.
There has been an increase in borrowing requirements and refinancing since the 2020-21 Half-Yearly Review, with a corresponding increase in future interest expense sensitivity. TCorp has continued to diversify its investor base by issuing across different bond tenors, including longer-dated tenors such as 2041 and 2051, during the second half of the year.
B.2 Balance sheet risks and sensitivities
Risks to the State’s balance sheet include unanticipated changes:
to the value of existing assets and liabilities (those already on the balance sheet)
from the potential recognition of contingent assets and liabilities (those not shown on the balance sheet as the accounting recognition criteria are not yet met).
The significant market volatility caused by COVID-19 has had more impact on those funds with a higher weighting to growth assets – for example, equities. The easing of monetary policy and the unprecedented fiscal policy response to the crisis have introduced new risks to each of the investible asset classes. The risks and performance of funds are monitored closely, with risk appetites and asset allocation strategies reviewed annually to ensure they remain appropriate.
Liabilities for superannuation and long service leave are estimated with reference to a range of factors, including but not limited to assumed rates of investment returns, salary growth, inflation and discount rates. Changes in any parameter can affect the liability for defined benefit superannuation and long service leave.
The State faces potential obligations that are non-quantifiable, but which can be broadly grouped into commercial transactions and other contingent liabilities. As an example, the Government provided limited general warranties to purchasers and lessees under several energy transactions and has also retained responsibility for the costs associated with remediating pre-existing contamination at several power station sites.
Investments
The State holds several investment funds which are managed by TCorp, including the NSW Generations Fund (NGF), NSW Infrastructure Future Fund (NIFF), Social and Affordable Housing Fund (SAHF) and the Treasury Managed Fund (TMF). Under the existing governance arrangements, NSW Treasury recommends the risk appetite and/or investment strategy to Treasury’s Asset and Liability Committee (ALCO) for endorsement. ALCO then recommends the risk appetite and investment strategy to the Treasury Secretary (as the Treasurer’s delegate), or the Treasurer, as required.

Fiscal Risks and Budget Sensitivities
Budget Statement 2021-22 B - 7
These Funds have varying levels of exposure to growth assets (assets with higher levels of risk). The NIFF, for instance, has a relatively small allocation to equities (at 24 per cent) and keeps around half of its portfolio in liquid cash and bonds, which are defensive assets, so it can meet the State’s short- to medium-term infrastructure expenditure. On the other hand, the NGF has a high allocation of growth assets because of its long-term investment horizon, with about 40 per cent of its portfolio invested in Australian and internationally listed shares. This is in line with its strategic policy objective of helping ease the debt burden on the State’s future generations.
NSW Treasury, through the ALCO, continues to monitor the size of the NGF and consider the Budget and balance sheet risks involved as the Fund grows. This enables the development of risk management strategies to both help mitigate impacts and take advantage of opportunities arising from a growing NGF.
Under the NSW Generations Funds Act 2018, funds in the NGF can only be directed towards the repayment of the State’s debt. Both Moody’s and S&P Global recognise the balance of the NGF Debt Retirement Fund as an offset to the State’s debt metrics. Accordingly, market volatility that impacts the balance of the NGF carries additional risks to the State’s debt metrics. NSW Treasury manages this risk through the NGF investment strategy (the mix of assets it is invested in) which remains aligned to a long-term investment horizon. The NGF is invested in a diverse range of assets including domestic and international equities, bonds, property and infrastructure.
The outlook for financial markets remains highly uncertain. While the recovery in financial markets has been strong since the COVID-19 related downturn, there is a heightened potential of market volatility in the future. Market sensitivity to rising interest rates and the potential of market corrections in the future can impact business and investor confidence and therefore asset values.
During this period of increased uncertainty, NSW Treasury continues to work alongside TCorp to closely monitor and manage the risk exposures of the State’s investment funds. TCorp continues the transition of its funds management to using a Total Portfolio Approach to optimise the construction and management of these portfolios. The NGF, NIFF and SAHF have now transitioned to the Total Portfolio Approach. This approach facilitates a more systematic diversification of risk within each portfolio, allowing the State to better manage its total risk exposure across the various asset classes under investment.
Superannuation and long service leave liabilities
Forecast liabilities for superannuation and long service leave are based on a wide range of parameters. These include assumptions around salary growth, inflation, investment returns and discount rates. A change in any of these parameters may affect the actual liabilities of superannuation and long service leave. The long service leave liability is also subject to variations in the rate of employee retention.
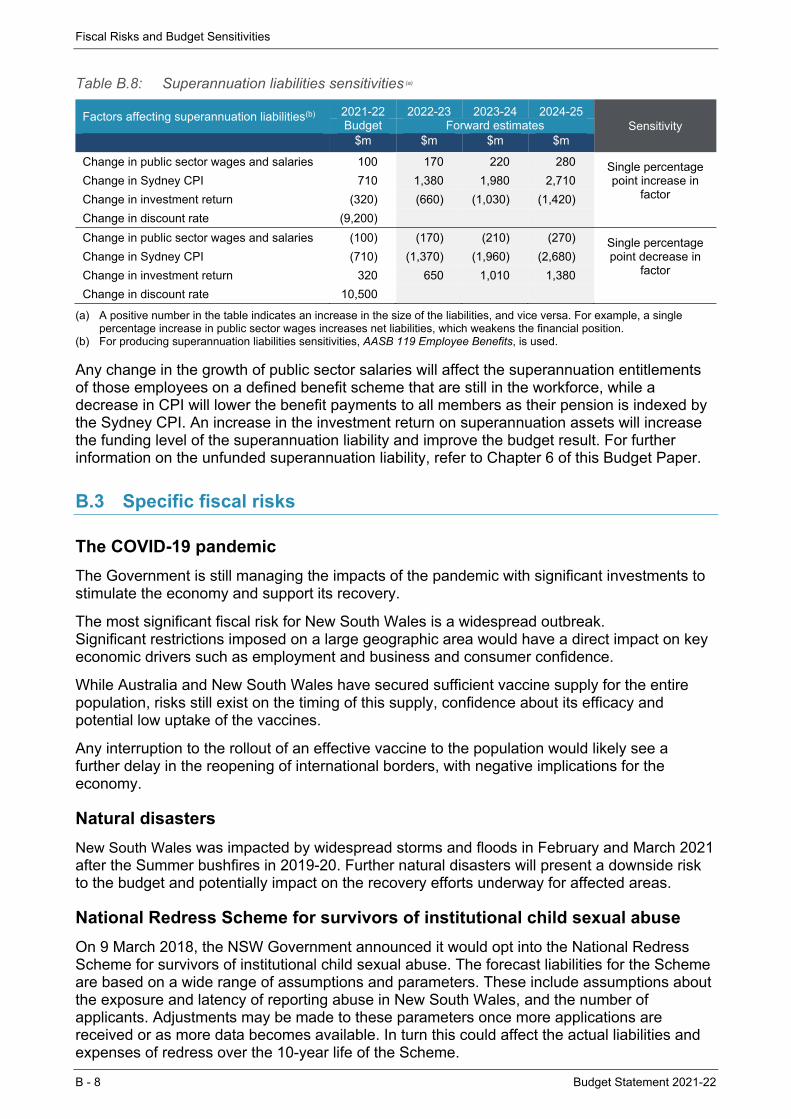
Fiscal Risks and Budget Sensitivities
B - 8 Budget Statement 2021-22
Table B.8: Superannuation liabilities sensitivities (a)
Factors affecting superannuation liabilities(b) 2021-22 2022-23 2023-24 2024-25 Sensitivity Budget Forward estimates
$m $m $m $m
Change in public sector wages and salaries 100 170 220 280 Single percentage point increase in
factor Change in Sydney CPI 710 1,380 1,980 2,710
Change in investment return (320) (660) (1,030) (1,420)
Change in discount rate (9,200)
Change in public sector wages and salaries (100) (170) (210) (270) Single percentage point decrease in
factor Change in Sydney CPI (710) (1,370) (1,960) (2,680)
Change in investment return 320 650 1,010 1,380
Change in discount rate 10,500
(a) A positive number in the table indicates an increase in the size of the liabilities, and vice versa. For example, a single percentage increase in public sector wages increases net liabilities, which weakens the financial position.
(b) For producing superannuation liabilities sensitivities, AASB 119 Employee Benefits, is used.
Any change in the growth of public sector salaries will affect the superannuation entitlements of those employees on a defined benefit scheme that are still in the workforce, while a decrease in CPI will lower the benefit payments to all members as their pension is indexed by the Sydney CPI. An increase in the investment return on superannuation assets will increase the funding level of the superannuation liability and improve the budget result. For further information on the unfunded superannuation liability, refer to Chapter 6 of this Budget Paper.
B.3 Specific fiscal risks
The COVID-19 pandemic
The Government is still managing the impacts of the pandemic with significant investments to stimulate the economy and support its recovery.
The most significant fiscal risk for New South Wales is a widespread outbreak. Significant restrictions imposed on a large geographic area would have a direct impact on key economic drivers such as employment and business and consumer confidence.
While Australia and New South Wales have secured sufficient vaccine supply for the entire population, risks still exist on the timing of this supply, confidence about its efficacy and potential low uptake of the vaccines.
Any interruption to the rollout of an effective vaccine to the population would likely see a further delay in the reopening of international borders, with negative implications for the economy.
Natural disasters
New South Wales was impacted by widespread storms and floods in February and March 2021 after the Summer bushfires in 2019-20. Further natural disasters will present a downside risk to the budget and potentially impact on the recovery efforts underway for affected areas.
National Redress Scheme for survivors of institutional child sexual abuse
On 9 March 2018, the NSW Government announced it would opt into the National Redress Scheme for survivors of institutional child sexual abuse. The forecast liabilities for the Scheme are based on a wide range of assumptions and parameters. These include assumptions about the exposure and latency of reporting abuse in New South Wales, and the number of applicants. Adjustments may be made to these parameters once more applications are received or as more data becomes available. In turn this could affect the actual liabilities and expenses of redress over the 10-year life of the Scheme.
Fiscal Risks and Budget Sensitivities
Budget Statement 2021-22 B - 9
Global trade tensions
In the last year, a range of formal and informal international trade limitations were implemented on Australian goods which included coal, beef and copper exports.
Further restrictions enforced on a broader range of exported goods and services (including education and tourism) pose a significant fiscal risk.
Interest rate risk
The RBA’s monetary policy measures played an important role in supporting New South Wales’ economic recovery from COVID-19. Lower interest rates and other monetary policy stimulus measures, such as purchases of government bonds and term funding facilities for financial institutions, have further lowered borrowing costs and provided liquidity to the financial sector, supporting house price growth and consumer spending.
The RBA has stated that it would not raise interest rates until actual inflation is sustainably within the 2 to 3 per cent target range. However, there is a possibility that the RBA changes its policy stance and starts to withdraw stimulus earlier than expected, which could hinder New South Wales’ economic recovery.
Higher interest rates could pose a significant fiscal risk to New South Wales as it would increase interest payments on Government debt. In addition, higher borrowing costs could restrict household spending and may cause an appreciation of the Australian dollar, which could weaken demand for New South Wales’ exports, ultimately leading to higher unemployment and declining tax revenue.
Infrastructure related risks
Infrastructure projects
The cost of the State’s total estimated infrastructure program is $108.5 billion over four years but this could vary as individual projects proceed through their lifecycles, particularly if there are renewed COVID-19 restrictions. Factors such as availability and capacity of expert labour and capital equipment in the market, adverse weather conditions, and supply constraints with key construction materials can impact on cost estimates as well as the delivery schedule of projects.
Restart NSW
The Budget includes the estimated impact of expensing funds from the Restart NSW Fund to Government agencies (capital expenditure) and non-government proponents, principally local councils (recurrent expenditure in the form of grants). These estimates are informed by assumptions around the expenditure profiles of approved projects and unapproved projects (on the assumption that a formal approval will be forthcoming).
Changes to the timing of these approvals and project delivery schedules may affect the profile of actual expenditure. Unreserved balances in Restart NSW are not reflected in the Budget until a reservation or commitment is made. See Chapter 3 of Budget Paper No. 3 Infrastructure Statement for more information.


Budget Statement 2021-22 C - 1
C. CONTINGENT ASSETS AND LIABILITIES
To support its underlying practice of strong financial management, the NSW Government monitors and reports on its contingent assets and liabilities. Unlike recognised assets and liabilities, contingent assets and liabilities are uncertain and depend on a particular event occurring before being realised (see Box C.1 for technical definitions of contingent assets and liabilities). For a number of the State’s contingent liabilities, an equal but offsetting contingent asset may also exist.
If a contingent asset or liability becomes likely to materialise, then the asset or liability would be recognised on the balance sheet and cease to be considered contingent. The recognition of a contingent asset or liability on the State’s balance sheet could have a significant impact on the State’s finances. By identifying and, where possible, quantifying these contingent assets and liabilities, the Government can better manage its risks and opportunities.
Contingent assets and liabilities are classified as either:
quantifiable, where their financial value is known or can be reasonably estimated, or
non-quantifiable, where their financial value cannot be reasonably determined.
This Appendix provides analysis on both categories.
Box C.1: Accounting definition of contingent assets and liabilities
Accounting standard AASB 137 Provisions, Contingent Liabilities and Contingent Assets defines:
A contingent asset as:
a possible asset that arises from past events and whose existence will be confirmed only by the occurrence or non-occurrence of one or more uncertain future events not wholly within the control of the entity.
A contingent liability as:
a possible obligation that arises from past events and whose existence will be confirmed only by the occurrence or non-occurrence of one or more uncertain future events not wholly within the control of the entity; or
a present obligation that arises from past events but is not recognised because:
– it is not probable that an outflow of resources embodying economic benefits will be required to settle the obligation; or
– the amount of the obligation cannot be measured with sufficient reliability.
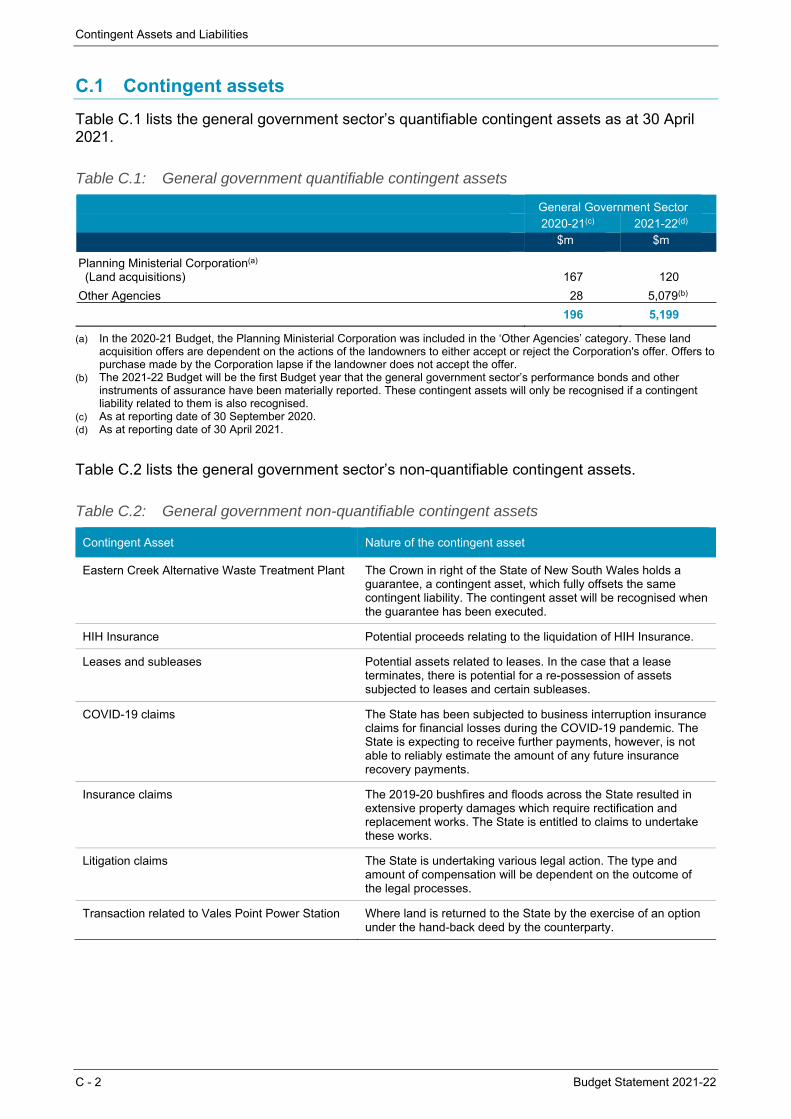
Contingent Assets and Liabilities
C - 2 Budget Statement 2021-22
C.1 Contingent assets
Table C.1 lists the general government sector’s quantifiable contingent assets as at 30 April 2021.
Table C.1: General government quantifiable contingent assets
General Government Sector 2020-21(c) 2021-22(d)
$m $m
Planning Ministerial Corporation(a) (Land acquisitions) 167 120
Other Agencies 28 5,079(b)
196 5,199
(a) In the 2020-21 Budget, the Planning Ministerial Corporation was included in the ‘Other Agencies’ category. These land acquisition offers are dependent on the actions of the landowners to either accept or reject the Corporation's offer. Offers to purchase made by the Corporation lapse if the landowner does not accept the offer.
(b) The 2021-22 Budget will be the first Budget year that the general government sector’s performance bonds and other instruments of assurance have been materially reported. These contingent assets will only be recognised if a contingent liability related to them is also recognised.
(c) As at reporting date of 30 September 2020. (d) As at reporting date of 30 April 2021.
Table C.2 lists the general government sector’s non-quantifiable contingent assets.
Table C.2: General government non-quantifiable contingent assets
Contingent Asset Nature of the contingent asset
Eastern Creek Alternative Waste Treatment Plant The Crown in right of the State of New South Wales holds a guarantee, a contingent asset, which fully offsets the same contingent liability. The contingent asset will be recognised when the guarantee has been executed.
HIH Insurance Potential proceeds relating to the liquidation of HIH Insurance.
Leases and subleases Potential assets related to leases. In the case that a lease terminates, there is potential for a re-possession of assets subjected to leases and certain subleases.
COVID-19 claims The State has been subjected to business interruption insurance claims for financial losses during the COVID-19 pandemic. The State is expecting to receive further payments, however, is not able to reliably estimate the amount of any future insurance recovery payments.
Insurance claims The 2019-20 bushfires and floods across the State resulted in extensive property damages which require rectification and replacement works. The State is entitled to claims to undertake these works.
Litigation claims The State is undertaking various legal action. The type and amount of compensation will be dependent on the outcome of the legal processes.
Transaction related to Vales Point Power Station Where land is returned to the State by the exercise of an option under the hand-back deed by the counterparty.

Contingent Assets and Liabilities
Budget Statement 2021-22 C - 3
C.2 Contingent liabilities
Table C.3 lists the general government’s quantifiable contingent liabilities as at 30 April 2021.
Table C.3: General government quantifiable contingent liabilities
General Government Sector 2020-21(h) 2021-22(i)
$m $m
Department of Communities and Justice(a)
(Claims in Respect of Compensation and Others) 670 933
Department of Customer Service(b) 13 13
Department of Planning, Industry and Environment(c) 0 100Planning Ministerial Corporation(d) (Land acquisitions) 167 120 Roads Retained Interest Pty Ltd(e) (Equity Commitment Deed) 604 0 Transport for NSW(f)
(Land acquisitions, contractual disputes) 1,435 828
Other Agencies 42 25 2,931(g) 2,019
(a) The Victims’ Support Scheme (VSS) was created on 3 June 2013 through legislation known as the Victims’ Rights and Support Act 2013.
(b) The Torrens Assurance Fund is a statutory compensation scheme designed to compensate people who, through no fault of their own, suffer loss or damage as a result of the operation of the Real Property Act 1900 (RPA) operated by the Department of Customer Service. This has been amended to reflect updated information in the 2020-21 Budget figures.
(c) The Department of Planning, Industry and Environment has provided support for the obligations of a third party where it may be called upon to settle a debt obligation in the future. This may occur if the borrower is not able to service its debt.
(d) In the 2020-21 Budget, the Planning Ministerial Corporation was included in the ‘Other Agencies’ category. These land acquisition offers are dependent on the actions of the landowners to either accept or reject the Corporation's offer. Offers to purchase made by the Corporation lapse if the landowner does not accept the offer.
(e) No contingent liability for Roads Retained Interest Pty Ltd is reported in 2021-22, as all commitments have been recognised in Budget forecasts.
(f) Transport for NSW has several contractual disputes with an estimated contingent liability of $568 million and an estimated $259 million contingent liabilities due to a number of compulsory property acquisition matters currently under litigation where claims differ from the Valuer General’s determined amount.
(g) The 2020-21 Budget reporting year has been amended to reflect updated information provided to the State. (h) As at reporting date of 30 September 2020. (i) As at reporting date of 30 April 2021.
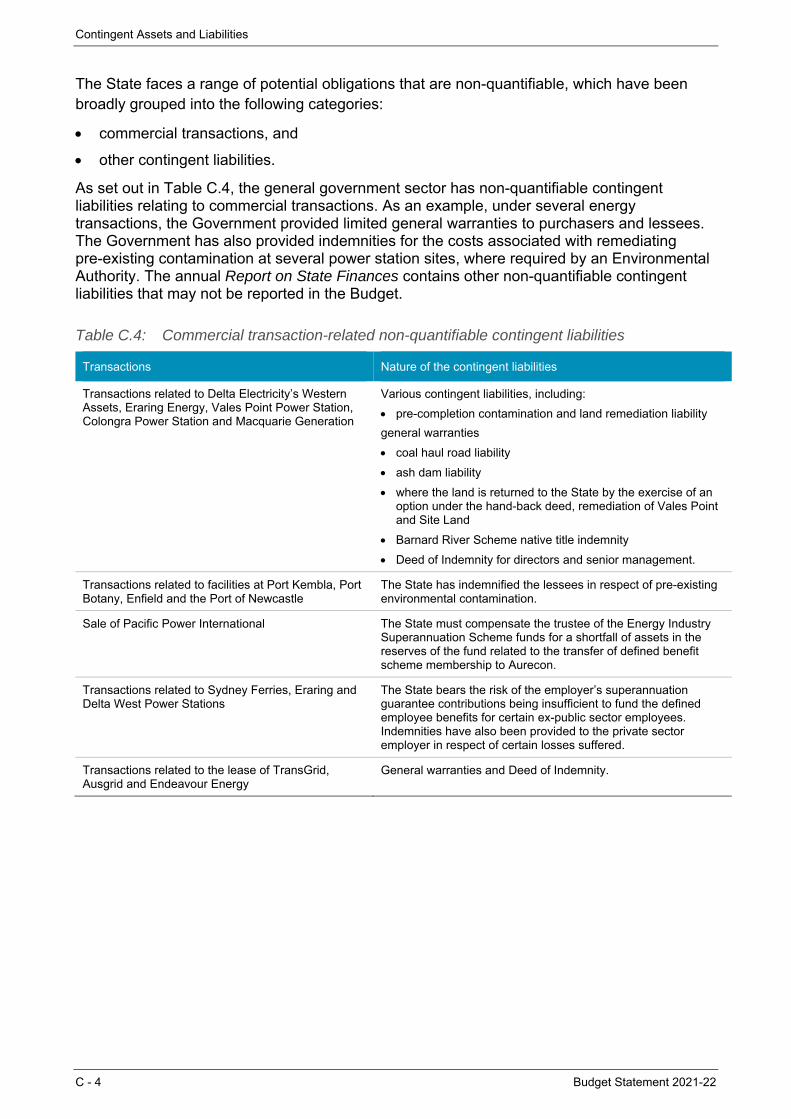
Contingent Assets and Liabilities
C - 4 Budget Statement 2021-22
The State faces a range of potential obligations that are non-quantifiable, which have been broadly grouped into the following categories:
commercial transactions, and
other contingent liabilities.
As set out in Table C.4, the general government sector has non-quantifiable contingent liabilities relating to commercial transactions. As an example, under several energy transactions, the Government provided limited general warranties to purchasers and lessees. The Government has also provided indemnities for the costs associated with remediating pre-existing contamination at several power station sites, where required by an Environmental Authority. The annual Report on State Finances contains other non-quantifiable contingent liabilities that may not be reported in the Budget.
Table C.4: Commercial transaction-related non-quantifiable contingent liabilities
Transactions Nature of the contingent liabilities
Transactions related to Delta Electricity’s Western Assets, Eraring Energy, Vales Point Power Station, Colongra Power Station and Macquarie Generation
Various contingent liabilities, including:
pre-completion contamination and land remediation liability
general warranties
coal haul road liability
ash dam liability
where the land is returned to the State by the exercise of an option under the hand-back deed, remediation of Vales Point and Site Land
Barnard River Scheme native title indemnity
Deed of Indemnity for directors and senior management.
Transactions related to facilities at Port Kembla, Port Botany, Enfield and the Port of Newcastle
The State has indemnified the lessees in respect of pre-existing environmental contamination.
Sale of Pacific Power International The State must compensate the trustee of the Energy Industry Superannuation Scheme funds for a shortfall of assets in the reserves of the fund related to the transfer of defined benefit scheme membership to Aurecon.
Transactions related to Sydney Ferries, Eraring and Delta West Power Stations
The State bears the risk of the employer’s superannuation guarantee contributions being insufficient to fund the defined employee benefits for certain ex-public sector employees. Indemnities have also been provided to the private sector employer in respect of certain losses suffered.
Transactions related to the lease of TransGrid, Ausgrid and Endeavour Energy
General warranties and Deed of Indemnity.
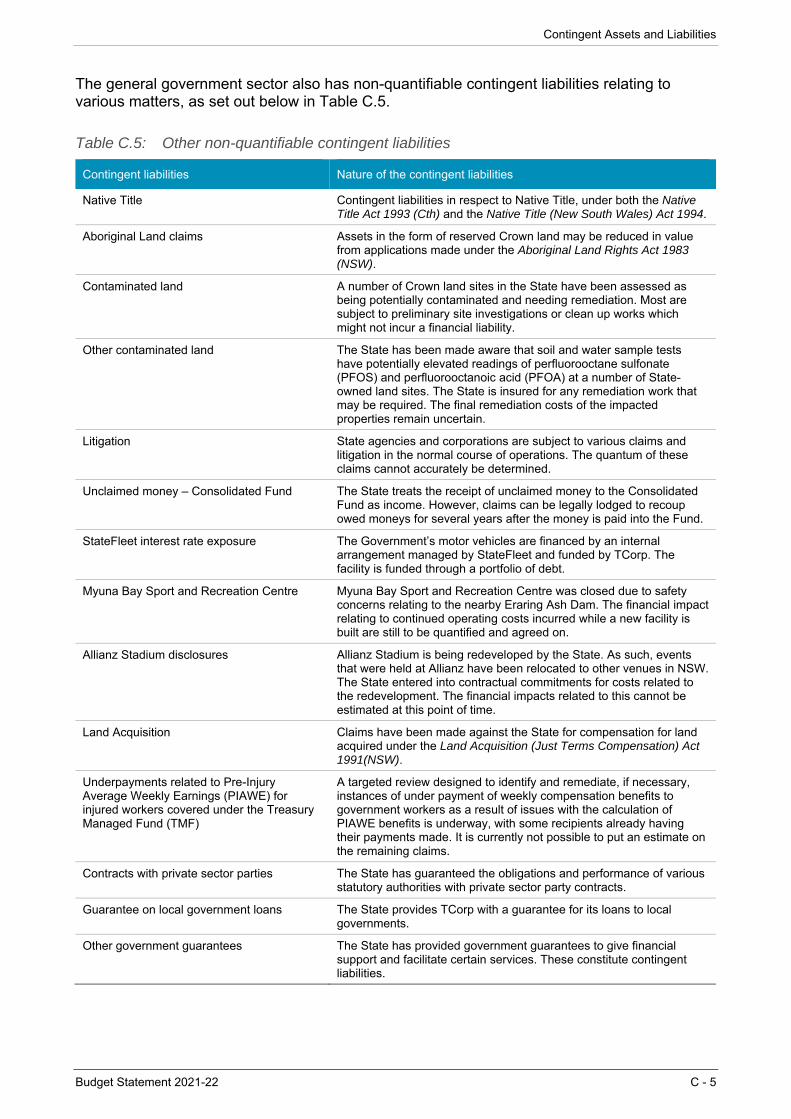
Contingent Assets and Liabilities
Budget Statement 2021-22 C - 5
The general government sector also has non-quantifiable contingent liabilities relating to various matters, as set out below in Table C.5.
Table C.5: Other non-quantifiable contingent liabilities
Contingent liabilities Nature of the contingent liabilities
Native Title Contingent liabilities in respect to Native Title, under both the Native Title Act 1993 (Cth) and the Native Title (New South Wales) Act 1994.
Aboriginal Land claims Assets in the form of reserved Crown land may be reduced in value from applications made under the Aboriginal Land Rights Act 1983 (NSW).
Contaminated land A number of Crown land sites in the State have been assessed as being potentially contaminated and needing remediation. Most are subject to preliminary site investigations or clean up works which might not incur a financial liability.
Other contaminated land The State has been made aware that soil and water sample tests have potentially elevated readings of perfluorooctane sulfonate (PFOS) and perfluorooctanoic acid (PFOA) at a number of State-owned land sites. The State is insured for any remediation work that may be required. The final remediation costs of the impacted properties remain uncertain.
Litigation State agencies and corporations are subject to various claims and litigation in the normal course of operations. The quantum of these claims cannot accurately be determined.
Unclaimed money – Consolidated Fund The State treats the receipt of unclaimed money to the Consolidated Fund as income. However, claims can be legally lodged to recoup owed moneys for several years after the money is paid into the Fund.
StateFleet interest rate exposure The Government’s motor vehicles are financed by an internal arrangement managed by StateFleet and funded by TCorp. The facility is funded through a portfolio of debt.
Myuna Bay Sport and Recreation Centre Myuna Bay Sport and Recreation Centre was closed due to safety concerns relating to the nearby Eraring Ash Dam. The financial impact relating to continued operating costs incurred while a new facility is built are still to be quantified and agreed on.
Allianz Stadium disclosures Allianz Stadium is being redeveloped by the State. As such, events that were held at Allianz have been relocated to other venues in NSW. The State entered into contractual commitments for costs related to the redevelopment. The financial impacts related to this cannot be estimated at this point of time.
Land Acquisition Claims have been made against the State for compensation for land acquired under the Land Acquisition (Just Terms Compensation) Act 1991(NSW).
Underpayments related to Pre-Injury Average Weekly Earnings (PIAWE) for injured workers covered under the Treasury Managed Fund (TMF)
A targeted review designed to identify and remediate, if necessary, instances of under payment of weekly compensation benefits to government workers as a result of issues with the calculation of PIAWE benefits is underway, with some recipients already having their payments made. It is currently not possible to put an estimate on the remaining claims.
Contracts with private sector parties The State has guaranteed the obligations and performance of various statutory authorities with private sector party contracts.
Guarantee on local government loans The State provides TCorp with a guarantee for its loans to local governments.
Other government guarantees
The State has provided government guarantees to give financial support and facilitate certain services. These constitute contingent liabilities.

Budget Statement 2021-22 D - 1
D. HISTORICAL FISCAL INDICATORS This appendix reports the key fiscal indicators for the general government and non-financial public sectors from 1996-97. Datasets are presented in accordance with Australian Accounting Standard AASB 1049 Whole of Government and General Government Sector Financial Reporting, consistent with the financial statements presented in Appendix A1 Statement of Finances.
The below tables are contained in this appendix.
Table D.1 General government sector operating statement aggregates
Table D.2 General government sector balance sheet and financing indicators
Table D.3 Non-financial public sector operating statement aggregates
Table D.4 Non-financial public sector balance sheet and financing indicators
Historical data from 2008-09 are consistent with data published in annual Outcomes Reports and Budget Papers. As Outcomes Reports and Budget Papers prior to 2008-09 were prepared in accordance with Government Finance Statistics, historical data prior to 2008-09 reflect data that have been backcast to be consistent with AASB 1049. The historical series have also been adjusted from 2005-06 to incorporate:
the retrospective application of amended AASB 119 Employee Benefits
the recognition of a share of assets and liabilities of Law Courts Limited and the Murray-Darling Basin Authority, in accordance with AASB 11 Joint Arrangements.
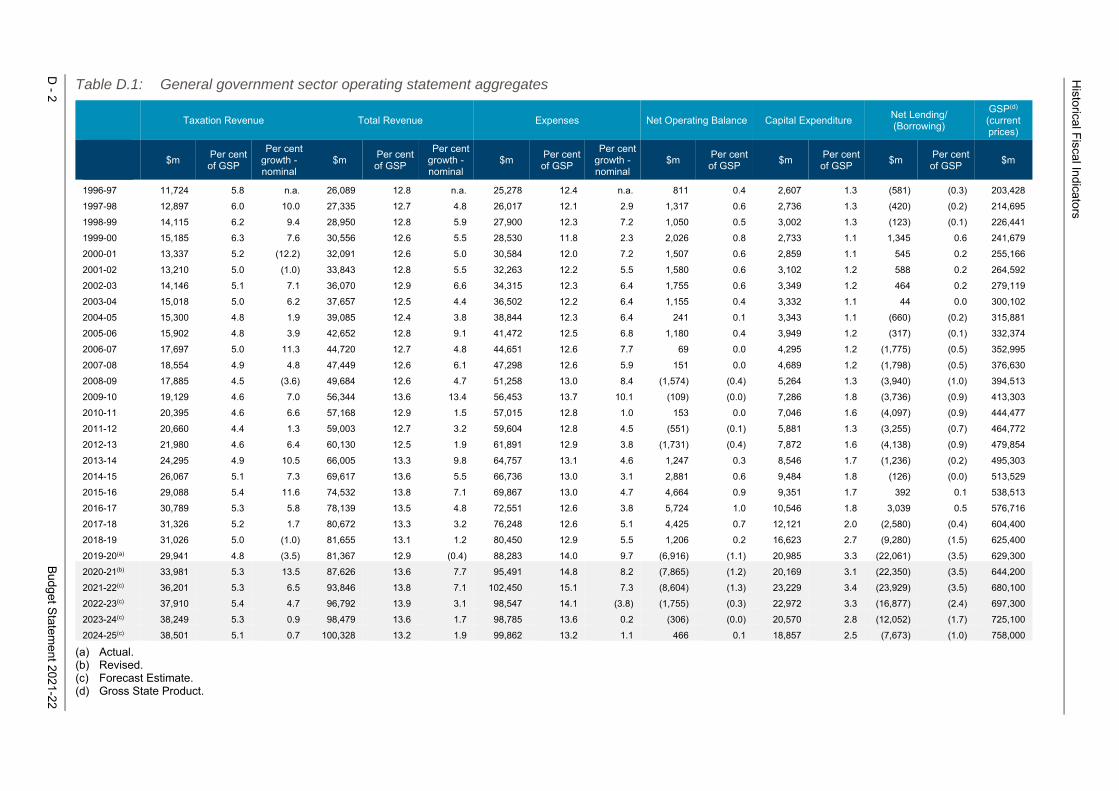
D - 2
Budg
et Statem
ent 2021-2
2
Historical F
iscal Indicators
Table D.1: General government sector operating statement aggregates
Taxation Revenue Total Revenue Expenses Net Operating Balance Capital Expenditure Net Lending/ (Borrowing)
GSP(d) (current prices)
$m Per cent of GSP
Per cent growth - nominal
$m Per cent of GSP
Per cent growth - nominal
$m Per cent of GSP
Per cent growth - nominal
$m Per cent of GSP
$m Per cent of GSP
$m Per cent of GSP
$m
1996-97 11,724 5.8 n.a. 26,089 12.8 n.a. 25,278 12.4 n.a. 811 0.4 2,607 1.3 (581) (0.3) 203,428
1997-98 12,897 6.0 10.0 27,335 12.7 4.8 26,017 12.1 2.9 1,317 0.6 2,736 1.3 (420) (0.2) 214,695
1998-99 14,115 6.2 9.4 28,950 12.8 5.9 27,900 12.3 7.2 1,050 0.5 3,002 1.3 (123) (0.1) 226,441
1999-00 15,185 6.3 7.6 30,556 12.6 5.5 28,530 11.8 2.3 2,026 0.8 2,733 1.1 1,345 0.6 241,679
2000-01 13,337 5.2 (12.2) 32,091 12.6 5.0 30,584 12.0 7.2 1,507 0.6 2,859 1.1 545 0.2 255,166
2001-02 13,210 5.0 (1.0) 33,843 12.8 5.5 32,263 12.2 5.5 1,580 0.6 3,102 1.2 588 0.2 264,592
2002-03 14,146 5.1 7.1 36,070 12.9 6.6 34,315 12.3 6.4 1,755 0.6 3,349 1.2 464 0.2 279,119
2003-04 15,018 5.0 6.2 37,657 12.5 4.4 36,502 12.2 6.4 1,155 0.4 3,332 1.1 44 0.0 300,102
2004-05 15,300 4.8 1.9 39,085 12.4 3.8 38,844 12.3 6.4 241 0.1 3,343 1.1 (660) (0.2) 315,881
2005-06 15,902 4.8 3.9 42,652 12.8 9.1 41,472 12.5 6.8 1,180 0.4 3,949 1.2 (317) (0.1) 332,374
2006-07 17,697 5.0 11.3 44,720 12.7 4.8 44,651 12.6 7.7 69 0.0 4,295 1.2 (1,775) (0.5) 352,995
2007-08 18,554 4.9 4.8 47,449 12.6 6.1 47,298 12.6 5.9 151 0.0 4,689 1.2 (1,798) (0.5) 376,630
2008-09 17,885 4.5 (3.6) 49,684 12.6 4.7 51,258 13.0 8.4 (1,574) (0.4) 5,264 1.3 (3,940) (1.0) 394,513
2009-10 19,129 4.6 7.0 56,344 13.6 13.4 56,453 13.7 10.1 (109) (0.0) 7,286 1.8 (3,736) (0.9) 413,303
2010-11 20,395 4.6 6.6 57,168 12.9 1.5 57,015 12.8 1.0 153 0.0 7,046 1.6 (4,097) (0.9) 444,477
2011-12 20,660 4.4 1.3 59,003 12.7 3.2 59,604 12.8 4.5 (551) (0.1) 5,881 1.3 (3,255) (0.7) 464,772
2012-13 21,980 4.6 6.4 60,130 12.5 1.9 61,891 12.9 3.8 (1,731) (0.4) 7,872 1.6 (4,138) (0.9) 479,854
2013-14 24,295 4.9 10.5 66,005 13.3 9.8 64,757 13.1 4.6 1,247 0.3 8,546 1.7 (1,236) (0.2) 495,303
2014-15 26,067 5.1 7.3 69,617 13.6 5.5 66,736 13.0 3.1 2,881 0.6 9,484 1.8 (126) (0.0) 513,529
2015-16 29,088 5.4 11.6 74,532 13.8 7.1 69,867 13.0 4.7 4,664 0.9 9,351 1.7 392 0.1 538,513
2016-17 30,789 5.3 5.8 78,139 13.5 4.8 72,551 12.6 3.8 5,724 1.0 10,546 1.8 3,039 0.5 576,716
2017-18 31,326 5.2 1.7 80,672 13.3 3.2 76,248 12.6 5.1 4,425 0.7 12,121 2.0 (2,580) (0.4) 604,400
2018-19 31,026 5.0 (1.0) 81,655 13.1 1.2 80,450 12.9 5.5 1,206 0.2 16,623 2.7 (9,280) (1.5) 625,400
2019-20(a) 29,941 4.8 (3.5) 81,367 12.9 (0.4) 88,283 14.0 9.7 (6,916) (1.1) 20,985 3.3 (22,061) (3.5) 629,300
2020-21(b) 33,981 5.3 13.5 87,626 13.6 7.7 95,491 14.8 8.2 (7,865) (1.2) 20,169 3.1 (22,350) (3.5) 644,200
2021-22(c) 36,201 5.3 6.5 93,846 13.8 7.1 102,450 15.1 7.3 (8,604) (1.3) 23,229 3.4 (23,929) (3.5) 680,100
2022-23(c) 37,910 5.4 4.7 96,792 13.9 3.1 98,547 14.1 (3.8) (1,755) (0.3) 22,972 3.3 (16,877) (2.4) 697,300
2023-24(c) 38,249 5.3 0.9 98,479 13.6 1.7 98,785 13.6 0.2 (306) (0.0) 20,570 2.8 (12,052) (1.7) 725,100
2024-25(c) 38,501 5.1 0.7 100,328 13.2 1.9 99,862 13.2 1.1 466 0.1 18,857 2.5 (7,673) (1.0) 758,000
(a) Actual. (b) Revised. (c) Forecast Estimate. (d) Gross State Product.
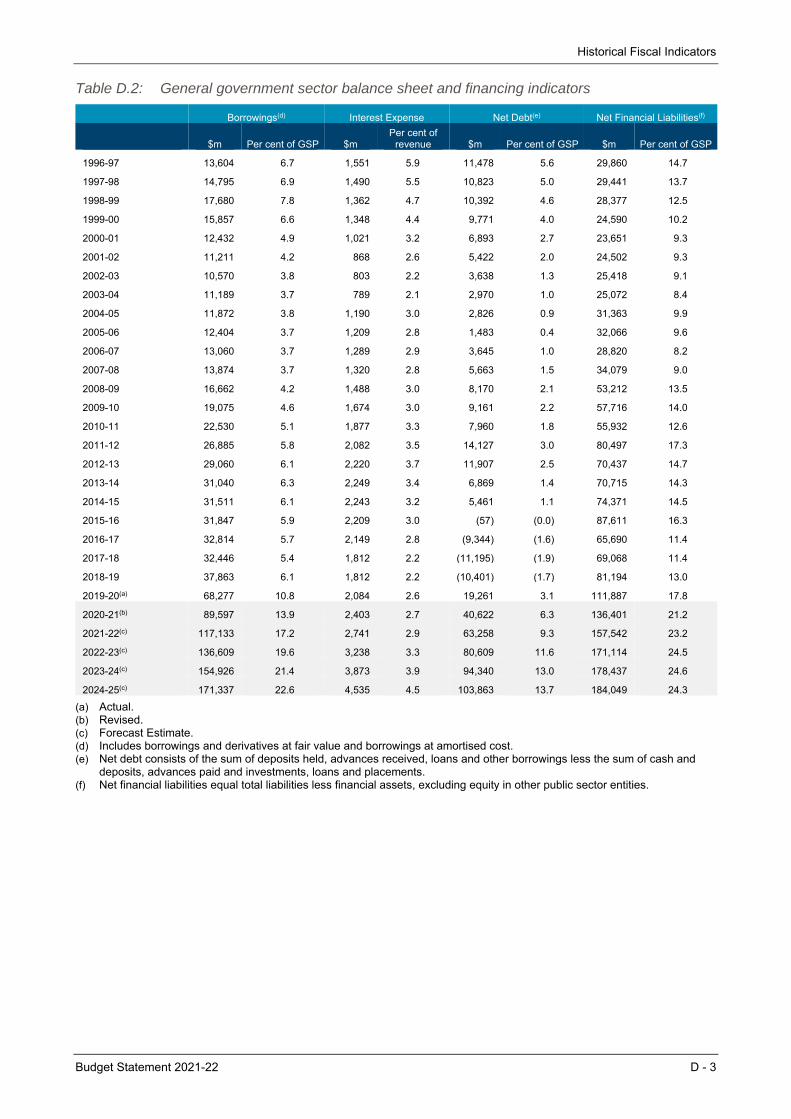
Historical Fiscal Indicators
Budget Statement 2021-22 D - 3
Table D.2: General government sector balance sheet and financing indicators
Borrowings(d) Interest Expense Net Debt(e) Net Financial Liabilities(f)
$m Per cent of GSP $mPer cent of
revenue $m Per cent of GSP $m Per cent of GSP
1996-97 13,604 6.7 1,551 5.9 11,478 5.6 29,860 14.7
1997-98 14,795 6.9 1,490 5.5 10,823 5.0 29,441 13.7
1998-99 17,680 7.8 1,362 4.7 10,392 4.6 28,377 12.5
1999-00 15,857 6.6 1,348 4.4 9,771 4.0 24,590 10.2
2000-01 12,432 4.9 1,021 3.2 6,893 2.7 23,651 9.3
2001-02 11,211 4.2 868 2.6 5,422 2.0 24,502 9.3
2002-03 10,570 3.8 803 2.2 3,638 1.3 25,418 9.1
2003-04 11,189 3.7 789 2.1 2,970 1.0 25,072 8.4
2004-05 11,872 3.8 1,190 3.0 2,826 0.9 31,363 9.9
2005-06 12,404 3.7 1,209 2.8 1,483 0.4 32,066 9.6
2006-07 13,060 3.7 1,289 2.9 3,645 1.0 28,820 8.2
2007-08 13,874 3.7 1,320 2.8 5,663 1.5 34,079 9.0
2008-09 16,662 4.2 1,488 3.0 8,170 2.1 53,212 13.5
2009-10 19,075 4.6 1,674 3.0 9,161 2.2 57,716 14.0
2010-11 22,530 5.1 1,877 3.3 7,960 1.8 55,932 12.6
2011-12 26,885 5.8 2,082 3.5 14,127 3.0 80,497 17.3
2012-13 29,060 6.1 2,220 3.7 11,907 2.5 70,437 14.7
2013-14 31,040 6.3 2,249 3.4 6,869 1.4 70,715 14.3
2014-15 31,511 6.1 2,243 3.2 5,461 1.1 74,371 14.5
2015-16 31,847 5.9 2,209 3.0 (57) (0.0) 87,611 16.3
2016-17 32,814 5.7 2,149 2.8 (9,344) (1.6) 65,690 11.4
2017-18 32,446 5.4 1,812 2.2 (11,195) (1.9) 69,068 11.4
2018-19 37,863 6.1 1,812 2.2 (10,401) (1.7) 81,194 13.0
2019-20(a) 68,277 10.8 2,084 2.6 19,261 3.1 111,887 17.8
2020-21(b) 89,597 13.9 2,403 2.7 40,622 6.3 136,401 21.2
2021-22(c) 117,133 17.2 2,741 2.9 63,258 9.3 157,542 23.2
2022-23(c) 136,609 19.6 3,238 3.3 80,609 11.6 171,114 24.5
2023-24(c) 154,926 21.4 3,873 3.9 94,340 13.0 178,437 24.6
2024-25(c) 171,337 22.6 4,535 4.5 103,863 13.7 184,049 24.3
(a) Actual. (b) Revised. (c) Forecast Estimate. (d) Includes borrowings and derivatives at fair value and borrowings at amortised cost. (e) Net debt consists of the sum of deposits held, advances received, loans and other borrowings less the sum of cash and
deposits, advances paid and investments, loans and placements. (f) Net financial liabilities equal total liabilities less financial assets, excluding equity in other public sector entities.
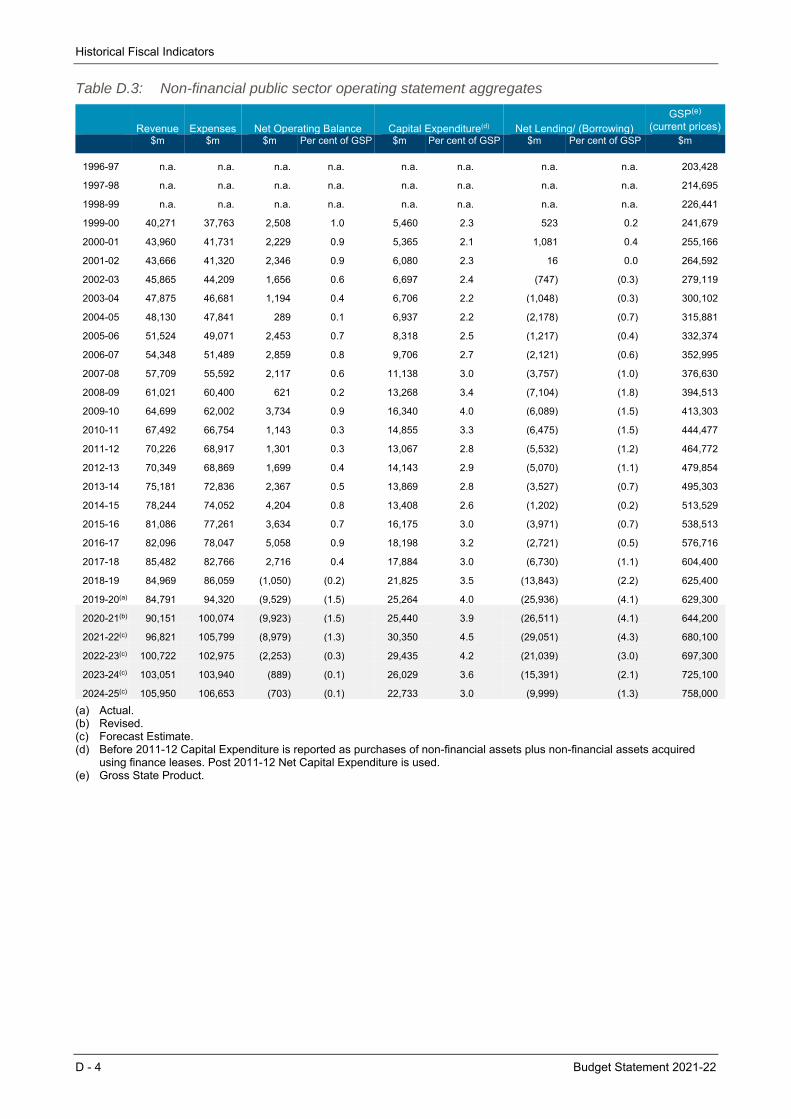
Historical Fiscal Indicators
D - 4 Budget Statement 2021-22
Table D.3: Non-financial public sector operating statement aggregates
Revenue Expenses Net Operating Balance Capital Expenditure(d) Net Lending/ (Borrowing) GSP(e)
(current prices) $m $m $m Per cent of GSP $m Per cent of GSP $m Per cent of GSP $m
1996-97 n.a. n.a. n.a. n.a. n.a. n.a. n.a. n.a. 203,428
1997-98 n.a. n.a. n.a. n.a. n.a. n.a. n.a. n.a. 214,695
1998-99 n.a. n.a. n.a. n.a. n.a. n.a. n.a. n.a. 226,441
1999-00 40,271 37,763 2,508 1.0 5,460 2.3 523 0.2 241,679
2000-01 43,960 41,731 2,229 0.9 5,365 2.1 1,081 0.4 255,166
2001-02 43,666 41,320 2,346 0.9 6,080 2.3 16 0.0 264,592
2002-03 45,865 44,209 1,656 0.6 6,697 2.4 (747) (0.3) 279,119
2003-04 47,875 46,681 1,194 0.4 6,706 2.2 (1,048) (0.3) 300,102
2004-05 48,130 47,841 289 0.1 6,937 2.2 (2,178) (0.7) 315,881
2005-06 51,524 49,071 2,453 0.7 8,318 2.5 (1,217) (0.4) 332,374
2006-07 54,348 51,489 2,859 0.8 9,706 2.7 (2,121) (0.6) 352,995
2007-08 57,709 55,592 2,117 0.6 11,138 3.0 (3,757) (1.0) 376,630
2008-09 61,021 60,400 621 0.2 13,268 3.4 (7,104) (1.8) 394,513
2009-10 64,699 62,002 3,734 0.9 16,340 4.0 (6,089) (1.5) 413,303
2010-11 67,492 66,754 1,143 0.3 14,855 3.3 (6,475) (1.5) 444,477
2011-12 70,226 68,917 1,301 0.3 13,067 2.8 (5,532) (1.2) 464,772
2012-13 70,349 68,869 1,699 0.4 14,143 2.9 (5,070) (1.1) 479,854
2013-14 75,181 72,836 2,367 0.5 13,869 2.8 (3,527) (0.7) 495,303
2014-15 78,244 74,052 4,204 0.8 13,408 2.6 (1,202) (0.2) 513,529
2015-16 81,086 77,261 3,634 0.7 16,175 3.0 (3,971) (0.7) 538,513
2016-17 82,096 78,047 5,058 0.9 18,198 3.2 (2,721) (0.5) 576,716
2017-18 85,482 82,766 2,716 0.4 17,884 3.0 (6,730) (1.1) 604,400
2018-19 84,969 86,059 (1,050) (0.2) 21,825 3.5 (13,843) (2.2) 625,400
2019-20(a) 84,791 94,320 (9,529) (1.5) 25,264 4.0 (25,936) (4.1) 629,300
2020-21(b) 90,151 100,074 (9,923) (1.5) 25,440 3.9 (26,511) (4.1) 644,200
2021-22(c) 96,821 105,799 (8,979) (1.3) 30,350 4.5 (29,051) (4.3) 680,100
2022-23(c) 100,722 102,975 (2,253) (0.3) 29,435 4.2 (21,039) (3.0) 697,300
2023-24(c) 103,051 103,940 (889) (0.1) 26,029 3.6 (15,391) (2.1) 725,100
2024-25(c) 105,950 106,653 (703) (0.1) 22,733 3.0 (9,999) (1.3) 758,000
(a) Actual. (b) Revised. (c) Forecast Estimate. (d) Before 2011-12 Capital Expenditure is reported as purchases of non-financial assets plus non-financial assets acquired
using finance leases. Post 2011-12 Net Capital Expenditure is used. (e) Gross State Product.
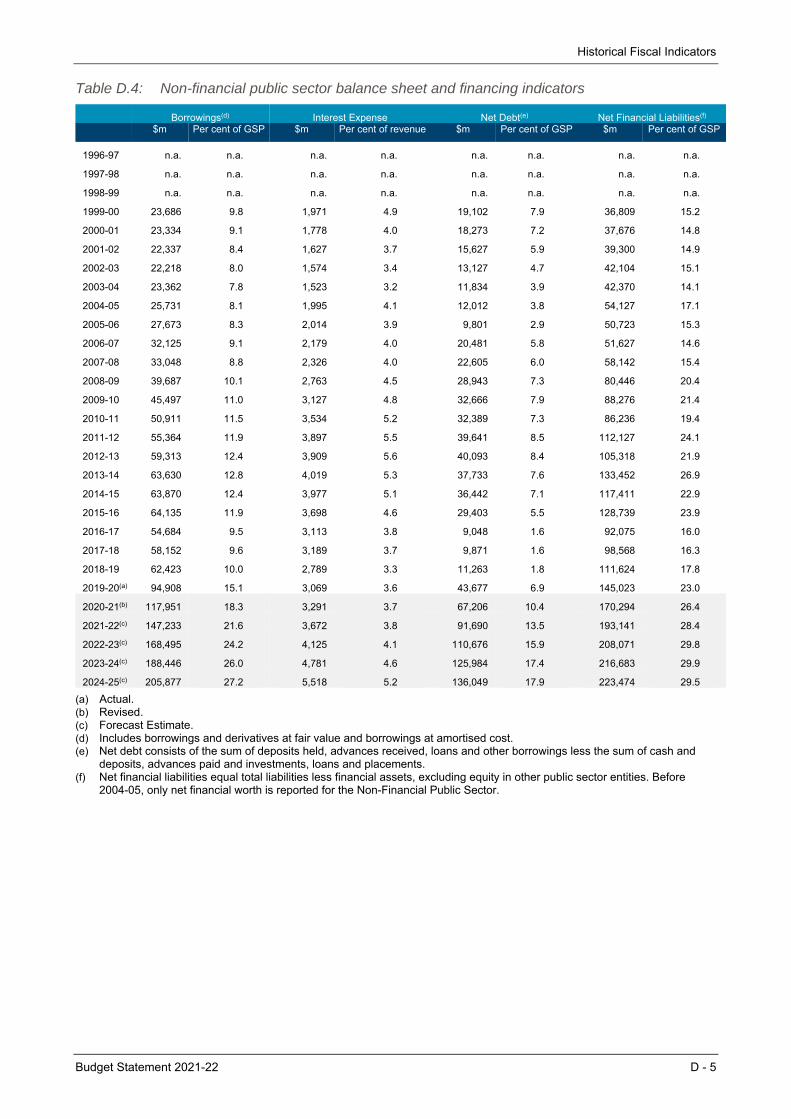
Historical Fiscal Indicators
Budget Statement 2021-22 D - 5
Table D.4: Non-financial public sector balance sheet and financing indicators
Borrowings(d) Interest Expense Net Debt(e) Net Financial Liabilities(f) $m Per cent of GSP $m Per cent of revenue $m Per cent of GSP $m Per cent of GSP
1996-97 n.a. n.a. n.a. n.a. n.a. n.a. n.a. n.a.
1997-98 n.a. n.a. n.a. n.a. n.a. n.a. n.a. n.a.
1998-99 n.a. n.a. n.a. n.a. n.a. n.a. n.a. n.a.
1999-00 23,686 9.8 1,971 4.9 19,102 7.9 36,809 15.2
2000-01 23,334 9.1 1,778 4.0 18,273 7.2 37,676 14.8
2001-02 22,337 8.4 1,627 3.7 15,627 5.9 39,300 14.9
2002-03 22,218 8.0 1,574 3.4 13,127 4.7 42,104 15.1
2003-04 23,362 7.8 1,523 3.2 11,834 3.9 42,370 14.1
2004-05 25,731 8.1 1,995 4.1 12,012 3.8 54,127 17.1
2005-06 27,673 8.3 2,014 3.9 9,801 2.9 50,723 15.3
2006-07 32,125 9.1 2,179 4.0 20,481 5.8 51,627 14.6
2007-08 33,048 8.8 2,326 4.0 22,605 6.0 58,142 15.4
2008-09 39,687 10.1 2,763 4.5 28,943 7.3 80,446 20.4
2009-10 45,497 11.0 3,127 4.8 32,666 7.9 88,276 21.4
2010-11 50,911 11.5 3,534 5.2 32,389 7.3 86,236 19.4
2011-12 55,364 11.9 3,897 5.5 39,641 8.5 112,127 24.1
2012-13 59,313 12.4 3,909 5.6 40,093 8.4 105,318 21.9
2013-14 63,630 12.8 4,019 5.3 37,733 7.6 133,452 26.9
2014-15 63,870 12.4 3,977 5.1 36,442 7.1 117,411 22.9
2015-16 64,135 11.9 3,698 4.6 29,403 5.5 128,739 23.9
2016-17 54,684 9.5 3,113 3.8 9,048 1.6 92,075 16.0
2017-18 58,152 9.6 3,189 3.7 9,871 1.6 98,568 16.3
2018-19 62,423 10.0 2,789 3.3 11,263 1.8 111,624 17.8
2019-20(a) 94,908 15.1 3,069 3.6 43,677 6.9 145,023 23.0
2020-21(b) 117,951 18.3 3,291 3.7 67,206 10.4 170,294 26.4
2021-22(c) 147,233 21.6 3,672 3.8 91,690 13.5 193,141 28.4
2022-23(c) 168,495 24.2 4,125 4.1 110,676 15.9 208,071 29.8
2023-24(c) 188,446 26.0 4,781 4.6 125,984 17.4 216,683 29.9
2024-25(c) 205,877 27.2 5,518 5.2 136,049 17.9 223,474 29.5
(a) Actual. (b) Revised. (c) Forecast Estimate. (d) Includes borrowings and derivatives at fair value and borrowings at amortised cost. (e) Net debt consists of the sum of deposits held, advances received, loans and other borrowings less the sum of cash and
deposits, advances paid and investments, loans and placements. (f) Net financial liabilities equal total liabilities less financial assets, excluding equity in other public sector entities. Before
2004-05, only net financial worth is reported for the Non-Financial Public Sector.

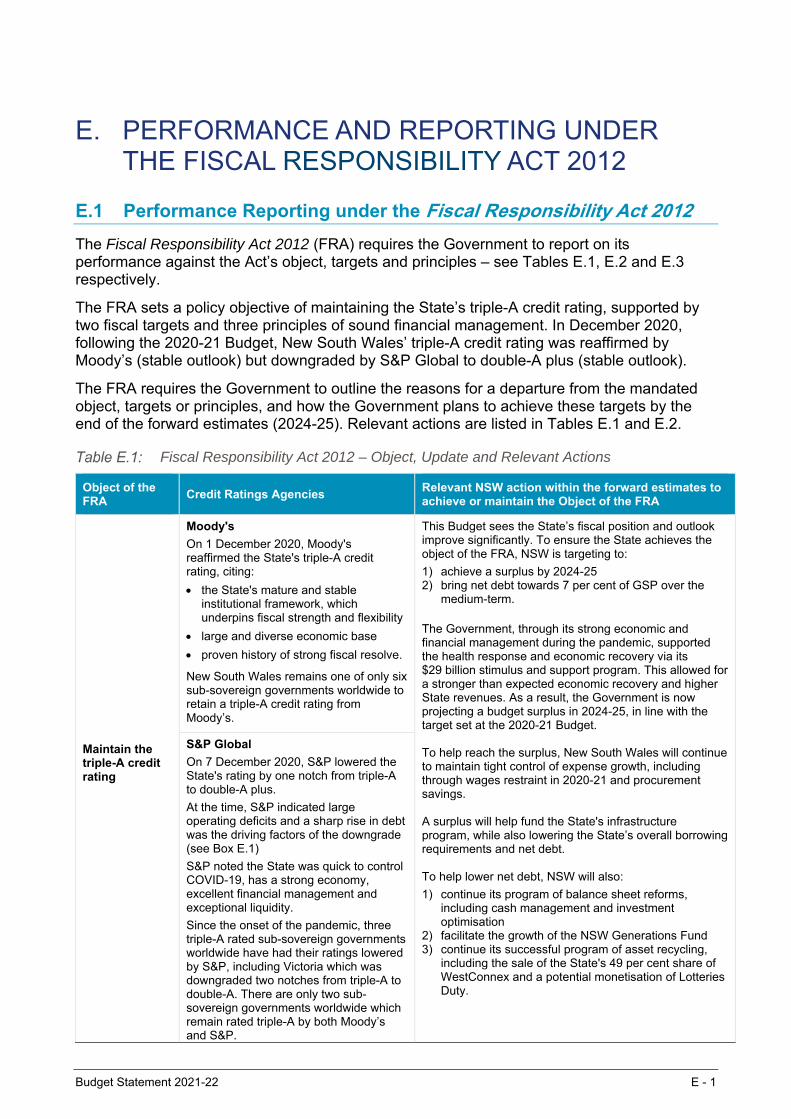
Budget Statement 2021-22 E - 1
E. PERFORMANCE AND REPORTING UNDER THE FISCAL RESPONSIBILITY ACT 2012
E.1 Performance Reporting under the Fiscal Responsibility Act 2012
The Fiscal Responsibility Act 2012 (FRA) requires the Government to report on its performance against the Act’s object, targets and principles – see Tables E.1, E.2 and E.3 respectively.
The FRA sets a policy objective of maintaining the State’s triple-A credit rating, supported by two fiscal targets and three principles of sound financial management. In December 2020, following the 2020-21 Budget, New South Wales’ triple-A credit rating was reaffirmed by Moody’s (stable outlook) but downgraded by S&P Global to double-A plus (stable outlook).
The FRA requires the Government to outline the reasons for a departure from the mandated object, targets or principles, and how the Government plans to achieve these targets by the end of the forward estimates (2024-25). Relevant actions are listed in Tables E.1 and E.2.
Fiscal Responsibility Act 2012 – Object, Update and Relevant Actions
Object of the FRA
Credit Ratings Agencies Relevant NSW action within the forward estimates to achieve or maintain the Object of the FRA
Maintain the triple-A credit rating
Moody's
On 1 December 2020, Moody's reaffirmed the State's triple-A credit rating, citing:
the State's mature and stable institutional framework, which underpins fiscal strength and flexibility
large and diverse economic base
proven history of strong fiscal resolve.
New South Wales remains one of only six sub-sovereign governments worldwide to retain a triple-A credit rating from Moody’s.
This Budget sees the State’s fiscal position and outlook improve significantly. To ensure the State achieves the object of the FRA, NSW is targeting to:
1) achieve a surplus by 2024-25 2) bring net debt towards 7 per cent of GSP over the
medium-term.
The Government, through its strong economic and financial management during the pandemic, supported the health response and economic recovery via its $29 billion stimulus and support program. This allowed for a stronger than expected economic recovery and higher State revenues. As a result, the Government is now projecting a budget surplus in 2024-25, in line with the target set at the 2020-21 Budget. To help reach the surplus, New South Wales will continue to maintain tight control of expense growth, including through wages restraint in 2020-21 and procurement savings. A surplus will help fund the State's infrastructure program, while also lowering the State’s overall borrowing requirements and net debt. To help lower net debt, NSW will also:
1) continue its program of balance sheet reforms, including cash management and investment optimisation
2) facilitate the growth of the NSW Generations Fund 3) continue its successful program of asset recycling,
including the sale of the State's 49 per cent share of WestConnex and a potential monetisation of Lotteries Duty.
S&P Global
On 7 December 2020, S&P lowered the State's rating by one notch from triple-A to double-A plus.
At the time, S&P indicated large operating deficits and a sharp rise in debt was the driving factors of the downgrade (see Box E.1)
S&P noted the State was quick to control COVID-19, has a strong economy, excellent financial management and exceptional liquidity.
Since the onset of the pandemic, three triple-A rated sub-sovereign governments worldwide have had their ratings lowered by S&P, including Victoria which was downgraded two notches from triple-A to double-A. There are only two sub-sovereign governments worldwide which remain rated triple-A by both Moody’s and S&P.
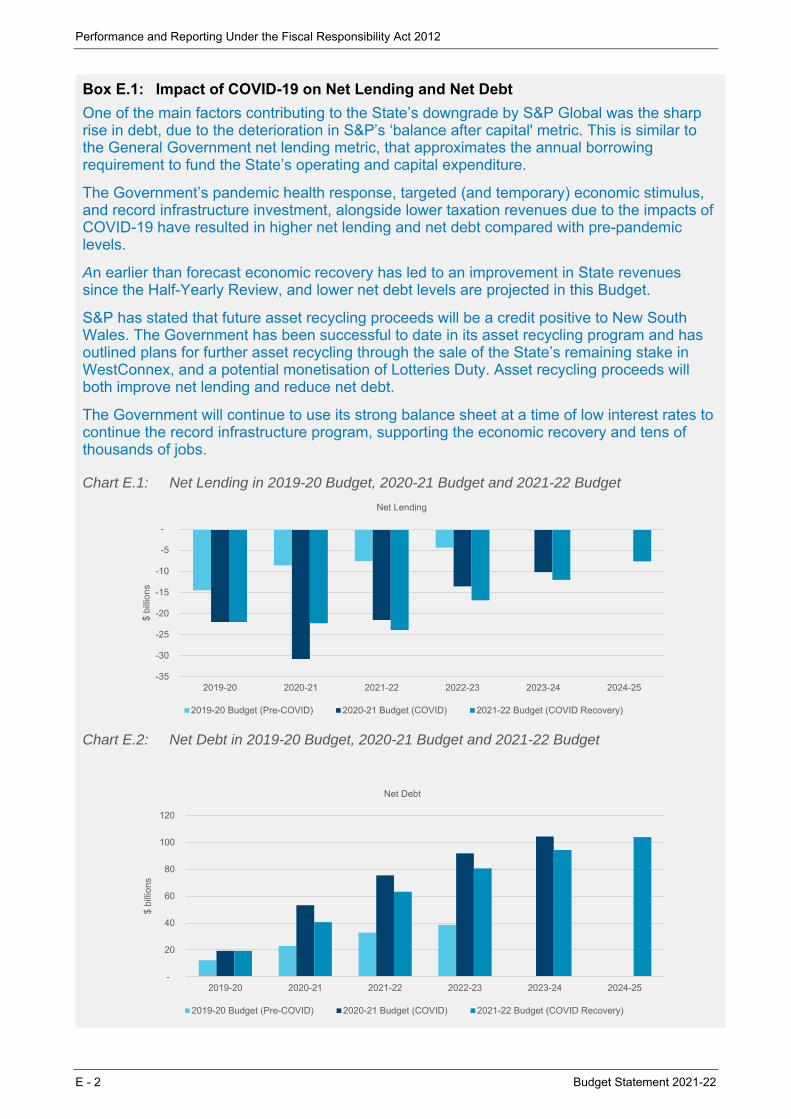
Performance and Reporting Under the Fiscal Responsibility Act 2012
E - 2 Budget Statement 2021-22
Box E.1: Impact of COVID-19 on Net Lending and Net Debt
One of the main factors contributing to the State’s downgrade by S&P Global was the sharp rise in debt, due to the deterioration in S&P’s ‘balance after capital' metric. This is similar to the General Government net lending metric, that approximates the annual borrowing requirement to fund the State’s operating and capital expenditure.
The Government’s pandemic health response, targeted (and temporary) economic stimulus, and record infrastructure investment, alongside lower taxation revenues due to the impacts of COVID-19 have resulted in higher net lending and net debt compared with pre-pandemic levels.
An earlier than forecast economic recovery has led to an improvement in State revenues since the Half-Yearly Review, and lower net debt levels are projected in this Budget.
S&P has stated that future asset recycling proceeds will be a credit positive to New South Wales. The Government has been successful to date in its asset recycling program and has outlined plans for further asset recycling through the sale of the State’s remaining stake in WestConnex, and a potential monetisation of Lotteries Duty. Asset recycling proceeds will both improve net lending and reduce net debt.
The Government will continue to use its strong balance sheet at a time of low interest rates to continue the record infrastructure program, supporting the economic recovery and tens of thousands of jobs.
Chart E.1: Net Lending in 2019-20 Budget, 2020-21 Budget and 2021-22 Budget
Chart E.2: Net Debt in 2019-20 Budget, 2020-21 Budget and 2021-22 Budget
-35
-30
-25
-20
-15
-10
-5
-
2019-20 2020-21 2021-22 2022-23 2023-24 2024-25
$ bi
llion
s
Net Lending
2019-20 Budget (Pre-COVID) 2020-21 Budget (COVID) 2021-22 Budget (COVID Recovery)
-
20
40
60
80
100
120
2019-20 2020-21 2021-22 2022-23 2023-24 2024-25
$ bi
llion
s
Net Debt
2019-20 Budget (Pre-COVID) 2020-21 Budget (COVID) 2021-22 Budget (COVID Recovery)
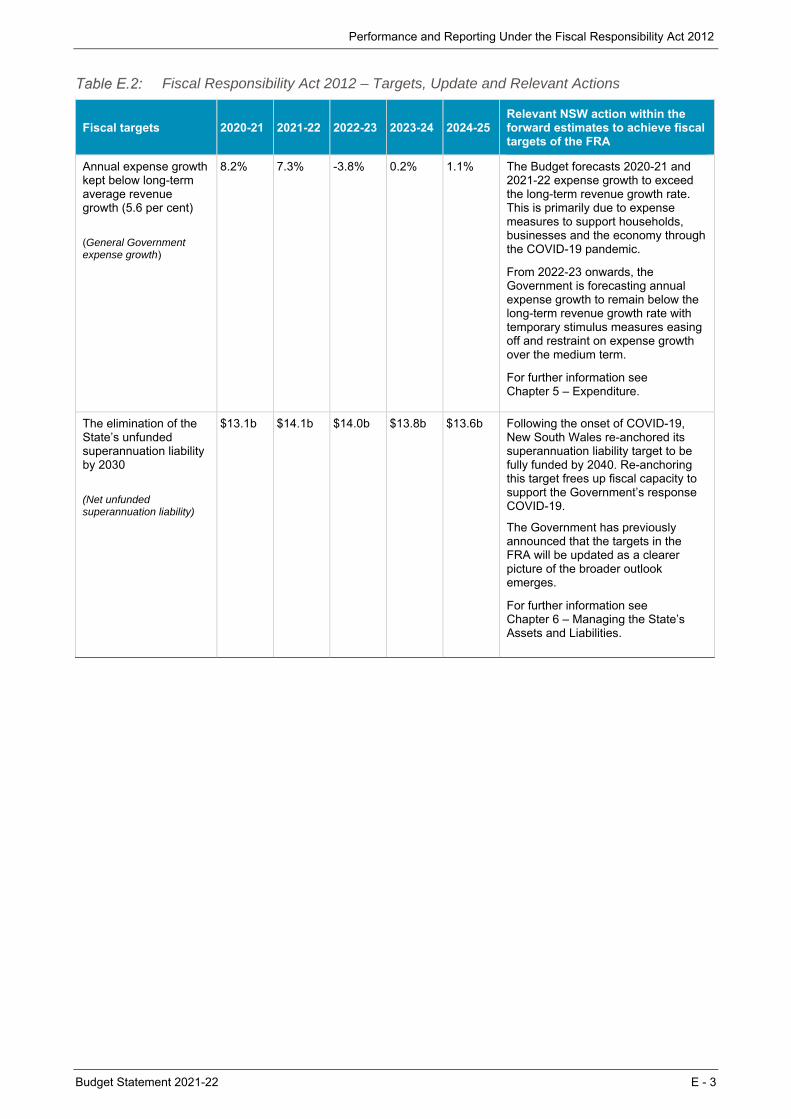
Performance and Reporting Under the Fiscal Responsibility Act 2012
Budget Statement 2021-22 E - 3
Fiscal Responsibility Act 2012 – Targets, Update and Relevant Actions
Fiscal targets 2020-21 2021-22 2022-23 2023-24 2024-25 Relevant NSW action within the forward estimates to achieve fiscal targets of the FRA
Annual expense growth kept below long-term average revenue growth (5.6 per cent)
(General Government expense growth)
8.2% 7.3% -3.8% 0.2% 1.1% The Budget forecasts 2020-21 and 2021-22 expense growth to exceed the long-term revenue growth rate. This is primarily due to expense measures to support households, businesses and the economy through the COVID-19 pandemic.
From 2022-23 onwards, the Government is forecasting annual expense growth to remain below the long-term revenue growth rate with temporary stimulus measures easing off and restraint on expense growth over the medium term.
For further information see Chapter 5 – Expenditure.
The elimination of the State’s unfunded superannuation liability by 2030
(Net unfunded superannuation liability)
$13.1b $14.1b $14.0b $13.8b $13.6b Following the onset of COVID-19, New South Wales re-anchored its superannuation liability target to be fully funded by 2040. Re-anchoring this target frees up fiscal capacity to support the Government’s response COVID-19.
The Government has previously announced that the targets in the FRA will be updated as a clearer picture of the broader outlook emerges.
For further information see Chapter 6 – Managing the State’s Assets and Liabilities.
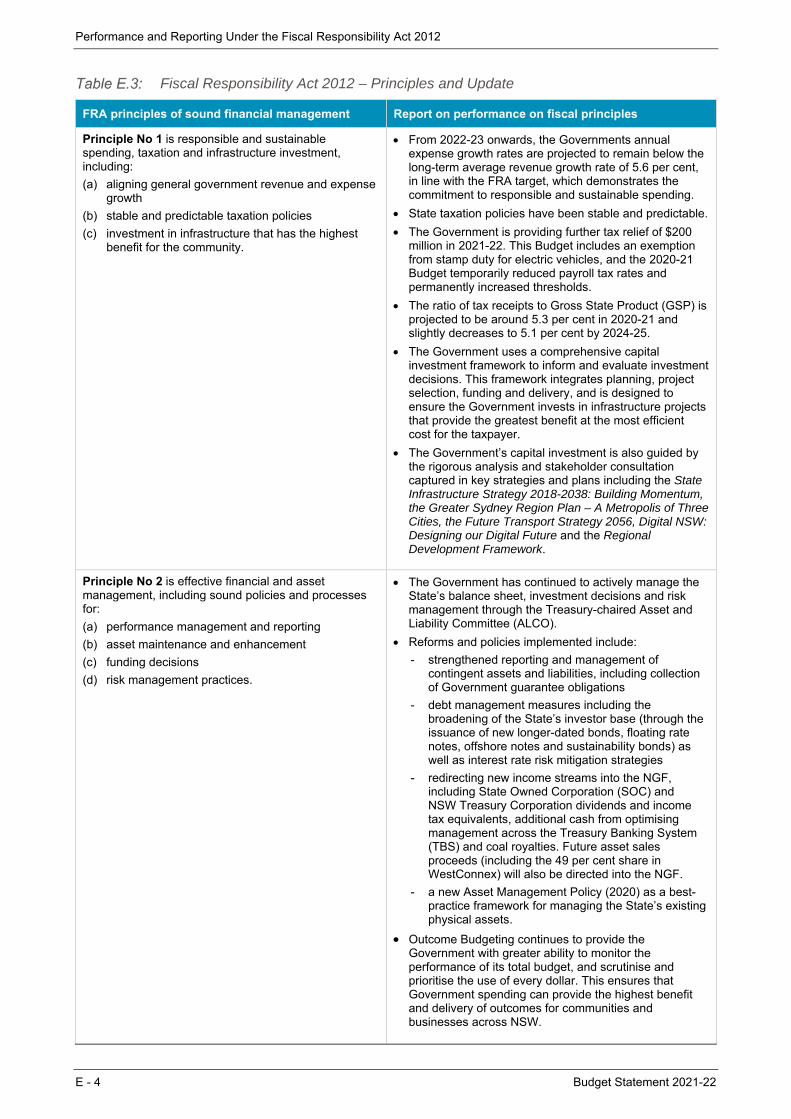
Performance and Reporting Under the Fiscal Responsibility Act 2012
E - 4 Budget Statement 2021-22
Fiscal Responsibility Act 2012 – Principles and Update
FRA principles of sound financial management Report on performance on fiscal principles
Principle No 1 is responsible and sustainable spending, taxation and infrastructure investment, including:
(a) aligning general government revenue and expense growth
(b) stable and predictable taxation policies
(c) investment in infrastructure that has the highest benefit for the community.
From 2022-23 onwards, the Governments annual expense growth rates are projected to remain below the long-term average revenue growth rate of 5.6 per cent, in line with the FRA target, which demonstrates the commitment to responsible and sustainable spending.
State taxation policies have been stable and predictable.
The Government is providing further tax relief of $200 million in 2021-22. This Budget includes an exemption from stamp duty for electric vehicles, and the 2020-21 Budget temporarily reduced payroll tax rates and permanently increased thresholds.
The ratio of tax receipts to Gross State Product (GSP) is projected to be around 5.3 per cent in 2020-21 and slightly decreases to 5.1 per cent by 2024-25.
The Government uses a comprehensive capital investment framework to inform and evaluate investment decisions. This framework integrates planning, project selection, funding and delivery, and is designed to ensure the Government invests in infrastructure projects that provide the greatest benefit at the most efficient cost for the taxpayer.
The Government’s capital investment is also guided by the rigorous analysis and stakeholder consultation captured in key strategies and plans including the State Infrastructure Strategy 2018-2038: Building Momentum, the Greater Sydney Region Plan – A Metropolis of Three Cities, the Future Transport Strategy 2056, Digital NSW: Designing our Digital Future and the Regional Development Framework.
Principle No 2 is effective financial and asset management, including sound policies and processes for:
(a) performance management and reporting
(b) asset maintenance and enhancement
(c) funding decisions
(d) risk management practices.
The Government has continued to actively manage the State’s balance sheet, investment decisions and risk management through the Treasury-chaired Asset and Liability Committee (ALCO).
Reforms and policies implemented include:
- strengthened reporting and management of contingent assets and liabilities, including collection of Government guarantee obligations
- debt management measures including the broadening of the State’s investor base (through the issuance of new longer-dated bonds, floating rate notes, offshore notes and sustainability bonds) as well as interest rate risk mitigation strategies
- redirecting new income streams into the NGF, including State Owned Corporation (SOC) and NSW Treasury Corporation dividends and income tax equivalents, additional cash from optimising management across the Treasury Banking System (TBS) and coal royalties. Future asset sales proceeds (including the 49 per cent share in WestConnex) will also be directed into the NGF.
- a new Asset Management Policy (2020) as a best-practice framework for managing the State’s existing physical assets.
Outcome Budgeting continues to provide the Government with greater ability to monitor the performance of its total budget, and scrutinise and prioritise the use of every dollar. This ensures that Government spending can provide the highest benefit and delivery of outcomes for communities and businesses across NSW.
Performance and Reporting Under the Fiscal Responsibility Act 2012
Budget Statement 2021-22 E - 5
Table E.3: Fiscal Responsibility Act 2012 – Principles and Update (cont.)
FRA principles of sound financial management Report on performance on fiscal principles
Principle No 3 is achieving intergenerational equity, including ensuring that:
(a) policy decisions are made having regard to their financial effects on future generations
(b) the current generation funds the cost of its services.
The 2021-22 NSW Intergenerational Report (IGR) provides an update on the State’s long-term fiscal gap, which is the expected build-up of fiscal pressures over the long-term on the basis there would be no change in current government policy, no corrective measures taken, and economic and demographic trends persist.
The 2021 IGR projects that as a result of the long-term structural imbalance between growth in Government revenues and expenditure, the fiscal gap will reach 2.6 per cent of GSP by 2060-61.
The fiscal gap is lower than the 2016 IGR (3.4 per cent in 2055-56). A number of factors account for this – in particular, changes to modelling methods to better estimate both health expenses as we age, and account for growth in health funding from the Commonwealth (which is now projected to be more in line with hospital expenses). Updated economic and demographic assumptions since the previous Report have also impacted the fiscal gap.
The measures announced in this budget are projected to lead to a 0.1 percentage point deterioration in the fiscal gap, to 2.7 per cent of GSP by 2060-61, compared to 2.6 per cent of GSP announced in the 2021 IGR.
The build-up in debt as a result of the fiscal gap can be partially addressed by the growing NSW Generations Fund (NGF), which is forecast to grow to more than $90 billion by 2031 and will help bring net debt down towards 7 per cent of GSP over the medium term.

Budget Statement 2021-22 F - 1
F. ECONOMIC SCENARIO ANALYSIS
The 2021-22 Budget relies on forecasts and judgements about the future of the economy, based on information available at the time of preparation. These forecasts are subject to inherent uncertainties, such as changes in behaviours, evolving relationships between variables and unexpected events or shocks.
This appendix explores the impact of variations in key economic parameters on other areas of the economy, the overall macroeconomic outlook and general government tax revenues. This is intended to provide greater insight into the interdependencies within our complex economy, that a partial sensitivity analysis does not capture.
This scenario analysis was selected to cover a plausible economic event that could affect New South Wales over the forecast horizon. The modelling takes account of linkages between key international, Australian and New South Wales economic aggregates, but does not account for any monetary policy or fiscal policy response.
The summary of the results should be interpreted with care because economic events tend to be unique in nature – the scenario presented in this appendix is unlikely to completely reflect any future shock to the State economy. Any departures from the specified scenario would result in different impacts on the economic and revenue outlook.
F.1 Impact of variations in key forecast assumptions
This scenario analysis is intended to complement the central economic outlook as presented in Chapter 2 The Economy by quantifying some of the key risks to the overall narrative. The scenario considers the ongoing impacts of technology and remote work that occurred due to the pandemic within businesses and households.
The economic and revenue impact of this scenario was modelled using the Centre of Policy Studies (CoPS) Victoria University Regional Model Tax (VURMTAX)1 and presented as a deviation from baseline.
Scenario 1: Technology enabled remote working
The COVID-19 pandemic has accelerated the digital shift in the economy. To prevent physical transmission of the virus, households and businesses adapted to conducting many operations remotely. Post the initial outbreak, these changes are assumed to have long lasting effects. Many businesses have invested in the technology platform required for remote work and cultural attitudes have changed. An increase in the availability of remote and flexible work is expected to increase participation in the labour force, particularly for women and older workers. Investment in technology is also expected to lift productivity over time.
The scenario assumes that some of the behavioural changes that have been adopted during the pandemic will continue at a greater rate than assumed in the current baseline forecast. Assumptions in the scenario include:
more remote workers, which slightly increases the number of hours worked in a day, based on NSW Government surveys conducted during the pandemic
increased use of technology and computer services
1 VURMTAX is a dynamic computable general equilibrium model of Australia’s six states and two territories, with each
region modelled as an economy in its own right. See Adams, Philip, Dixon, Janine and Horridge, Mark (2015), ‘The Victoria University Regional Model (VURM): Technical Documentation, Version 1.0’, CoPS/IMPACT Working Paper Number G-254 for more detail on the model.
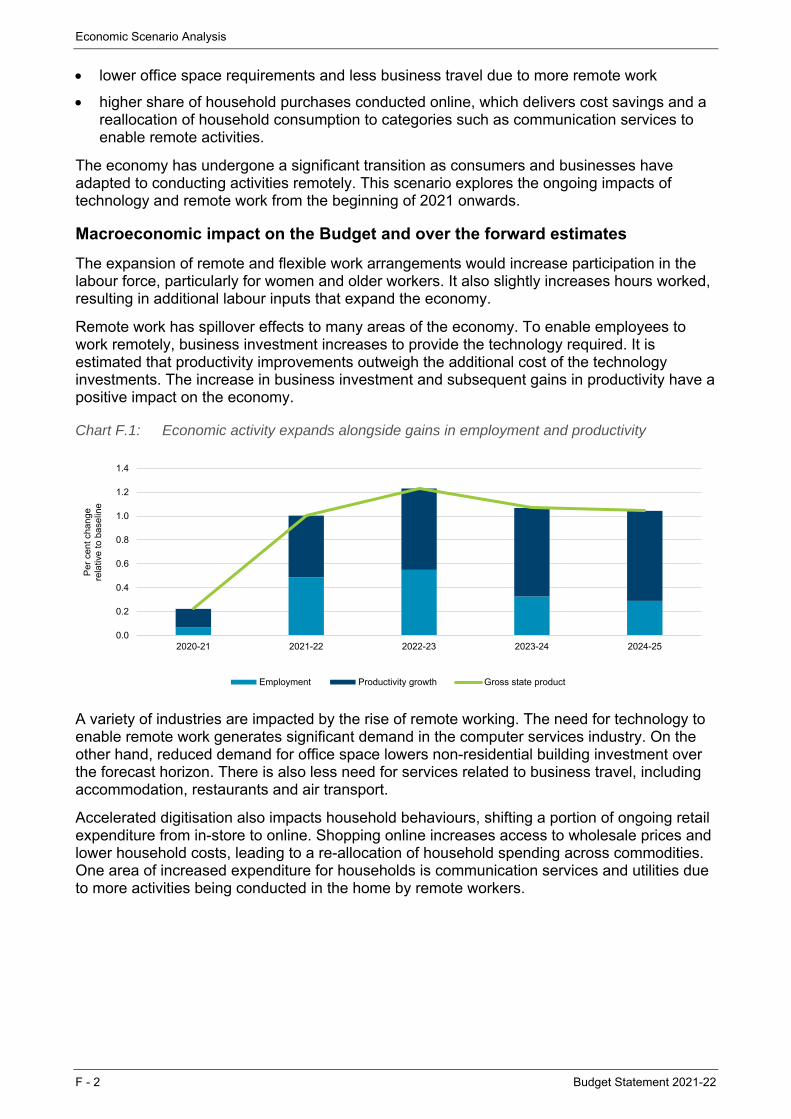
Economic Scenario Analysis
F - 2 Budget Statement 2021-22
lower office space requirements and less business travel due to more remote work
higher share of household purchases conducted online, which delivers cost savings and a reallocation of household consumption to categories such as communication services to enable remote activities.
The economy has undergone a significant transition as consumers and businesses have adapted to conducting activities remotely. This scenario explores the ongoing impacts of technology and remote work from the beginning of 2021 onwards.
Macroeconomic impact on the Budget and over the forward estimates
The expansion of remote and flexible work arrangements would increase participation in the labour force, particularly for women and older workers. It also slightly increases hours worked, resulting in additional labour inputs that expand the economy.
Remote work has spillover effects to many areas of the economy. To enable employees to work remotely, business investment increases to provide the technology required. It is estimated that productivity improvements outweigh the additional cost of the technology investments. The increase in business investment and subsequent gains in productivity have a positive impact on the economy.
Chart F.1: Economic activity expands alongside gains in employment and productivity
A variety of industries are impacted by the rise of remote working. The need for technology to enable remote work generates significant demand in the computer services industry. On the other hand, reduced demand for office space lowers non-residential building investment over the forecast horizon. There is also less need for services related to business travel, including accommodation, restaurants and air transport.
Accelerated digitisation also impacts household behaviours, shifting a portion of ongoing retail expenditure from in-store to online. Shopping online increases access to wholesale prices and lower household costs, leading to a re-allocation of household spending across commodities. One area of increased expenditure for households is communication services and utilities due to more activities being conducted in the home by remote workers.
0.0
0.2
0.4
0.6
0.8
1.0
1.2
1.4
2020-21 2021-22 2022-23 2023-24 2024-25
Per
cen
t cha
nge
rela
tive
to b
asel
ine
Employment Productivity growth Gross state product
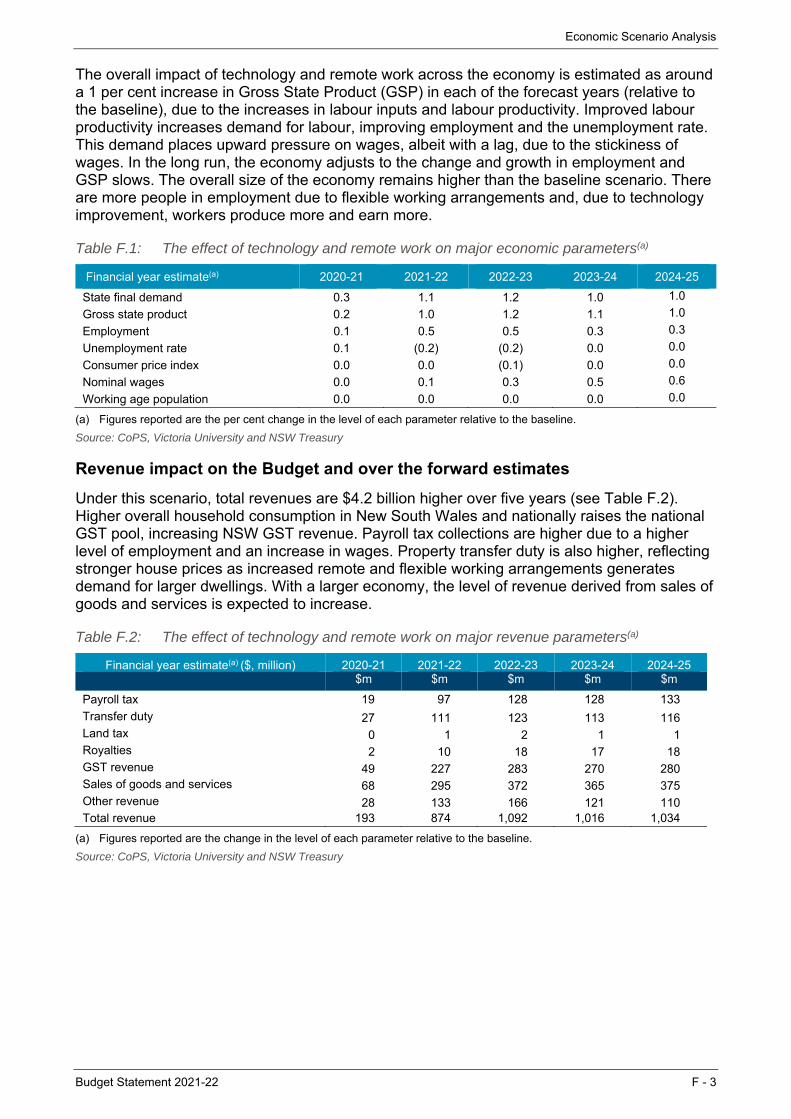
Economic Scenario Analysis
Budget Statement 2021-22 F - 3
The overall impact of technology and remote work across the economy is estimated as around a 1 per cent increase in Gross State Product (GSP) in each of the forecast years (relative to the baseline), due to the increases in labour inputs and labour productivity. Improved labour productivity increases demand for labour, improving employment and the unemployment rate. This demand places upward pressure on wages, albeit with a lag, due to the stickiness of wages. In the long run, the economy adjusts to the change and growth in employment and GSP slows. The overall size of the economy remains higher than the baseline scenario. There are more people in employment due to flexible working arrangements and, due to technology improvement, workers produce more and earn more.
Table F.1: The effect of technology and remote work on major economic parameters(a)
Financial year estimate(a) 2020-21 2021-22 2022-23 2023-24 2024-25
State final demand 0.3 1.1 1.2 1.0 1.0
Gross state product 0.2 1.0 1.2 1.1 1.0
Employment 0.1 0.5 0.5 0.3 0.3
Unemployment rate 0.1 (0.2) (0.2) 0.0 0.0
Consumer price index 0.0 0.0 (0.1) 0.0 0.0
Nominal wages 0.0 0.1 0.3 0.5 0.6
Working age population 0.0 0.0 0.0 0.0 0.0
(a) Figures reported are the per cent change in the level of each parameter relative to the baseline.
Source: CoPS, Victoria University and NSW Treasury
Revenue impact on the Budget and over the forward estimates
Under this scenario, total revenues are $4.2 billion higher over five years (see Table F.2). Higher overall household consumption in New South Wales and nationally raises the national GST pool, increasing NSW GST revenue. Payroll tax collections are higher due to a higher level of employment and an increase in wages. Property transfer duty is also higher, reflecting stronger house prices as increased remote and flexible working arrangements generates demand for larger dwellings. With a larger economy, the level of revenue derived from sales of goods and services is expected to increase.
Table F.2: The effect of technology and remote work on major revenue parameters(a)
Financial year estimate(a) ($, million) 2020-21 2021-22 2022-23 2023-24 2024-25 $m $m $m $m $m
Payroll tax 19 97 128 128 133
Transfer duty 27 111 123 113 116 Land tax 0 1 2 1 1Royalties 2 10 18 17 18 GST revenue 49 227 283 270 280Sales of goods and services 68 295 372 365 375 Other revenue 28 133 166 121 110Total revenue 193 874 1,092 1,016 1,034
(a) Figures reported are the change in the level of each parameter relative to the baseline.
Source: CoPS, Victoria University and NSW Treasury
Economic Scenario Analysis
F - 4 Budget Statement 2021-22
Scenario 2: Lower New South Wales and national house prices
Sydney house prices have risen sharply during COVID-19, rising more than 20 per cent since the outset of the pandemic. Price pressures have been buoyed by expansionary monetary policy which has supported historically low interest rates, with both variable and fixed mortgage rates declining since the start of the pandemic. The Commonwealth and NSW Governments have also implemented policies targeted at housing, including HomeBuilder and allowances for first home buyers. In conjunction, the economy has been recovering from the pandemic faster than widely anticipated and consumer sentiment is at record highs. This combination of factors has led to significant heat in the housing market, which in turn has generated speculation around events that could arrest price momentum.
There are a number of events that could put downward pressure on house prices. An increase in housing supply supported by higher prices and government incentives such as HomeBuilder could put downward pressure on prices in the future. To some extent, this adjustment is captured in the baseline forecast, but an unexpectedly large increase in housing supply could have a negative impact on housing prices relative to the baseline forecast.
Another possibility is intervention by regulatory agencies to restrain credit growth. Past instances of macroprudential tightening have coincided with negative shocks to house prices of around 10 per cent, such as the intervention to regulate lending to investors in 2017. The baseline forecast assumes that there will be no macroprudential tightening in response to higher house prices and growth in housing credit. Macroprudential interventions are not considered likely in the current circumstances of accelerating house prices with predominantly owner-occupier housing loans, unless credit exposure risks were to escalate.
This scenario considers the impact of a fall in house prices, relative to the baseline forecast, on the broader economy. The adjustment is general in nature and is not modelled on any of the specific possibilities considered above. Under this scenario, New South Wales house prices are reduced by 10 per cent, while the rest of Australia experiences a fall of 7 per cent, roughly matching relativities seen in past downturns.
CoPS modelled this scenario for NSW Treasury in 2019. The results from this modelling inform the results below as an illustrative guide to the possible impact on the NSW economy and tax revenues from a fall in house prices relative to the baseline forecast. Tax revenue impacts have been recalibrated to reflect current economic conditions.
Macroeconomic impact over the Budget and forward estimates
A fall in house prices has a negative impact on the NSW economy (see Table F.3). GSP is about three-quarters of a percentage point lower after four years (see Chart F.2). This is the result of falls in dwelling investment and household consumption, slightly offset by improved international and interstate trade.
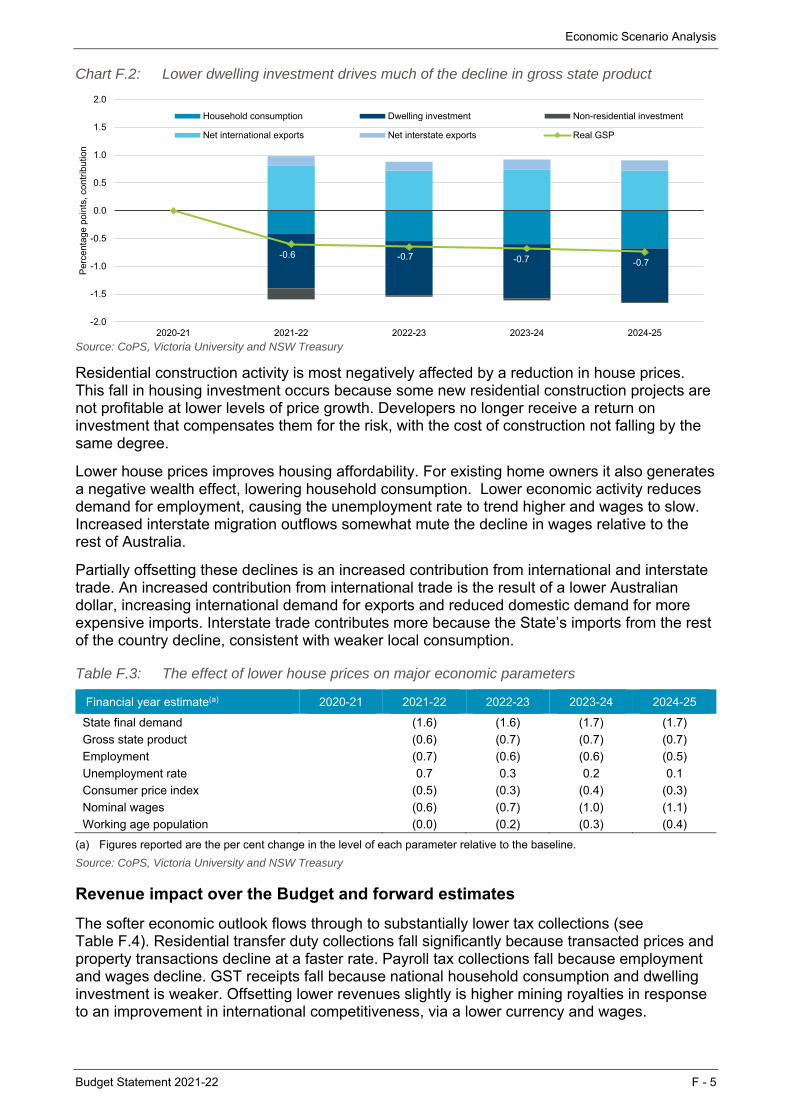
Economic Scenario Analysis
Budget Statement 2021-22 F - 5
Chart F.2: Lower dwelling investment drives much of the decline in gross state product
Source: CoPS, Victoria University and NSW Treasury
Residential construction activity is most negatively affected by a reduction in house prices. This fall in housing investment occurs because some new residential construction projects are not profitable at lower levels of price growth. Developers no longer receive a return on investment that compensates them for the risk, with the cost of construction not falling by the same degree.
Lower house prices improves housing affordability. For existing home owners it also generates a negative wealth effect, lowering household consumption. Lower economic activity reduces demand for employment, causing the unemployment rate to trend higher and wages to slow. Increased interstate migration outflows somewhat mute the decline in wages relative to the rest of Australia.
Partially offsetting these declines is an increased contribution from international and interstate trade. An increased contribution from international trade is the result of a lower Australian dollar, increasing international demand for exports and reduced domestic demand for more expensive imports. Interstate trade contributes more because the State’s imports from the rest of the country decline, consistent with weaker local consumption.
Table F.3: The effect of lower house prices on major economic parameters
Financial year estimate(a) 2020-21 2021-22 2022-23 2023-24 2024-25
State final demand (1.6) (1.6) (1.7) (1.7)
Gross state product (0.6) (0.7) (0.7) (0.7)
Employment (0.7) (0.6) (0.6) (0.5)
Unemployment rate 0.7 0.3 0.2 0.1
Consumer price index (0.5) (0.3) (0.4) (0.3)
Nominal wages (0.6) (0.7) (1.0) (1.1)
Working age population (0.0) (0.2) (0.3) (0.4)
(a) Figures reported are the per cent change in the level of each parameter relative to the baseline.
Source: CoPS, Victoria University and NSW Treasury
Revenue impact over the Budget and forward estimates
The softer economic outlook flows through to substantially lower tax collections (see Table F.4). Residential transfer duty collections fall significantly because transacted prices and property transactions decline at a faster rate. Payroll tax collections fall because employment and wages decline. GST receipts fall because national household consumption and dwelling investment is weaker. Offsetting lower revenues slightly is higher mining royalties in response to an improvement in international competitiveness, via a lower currency and wages.
-0.6 -0.7 -0.7 -0.7
-2.0
-1.5
-1.0
-0.5
0.0
0.5
1.0
1.5
2.0
2020-21 2021-22 2022-23 2023-24 2024-25
Per
cent
age
poin
ts, c
ontr
ibut
ion
Household consumption Dwelling investment Non-residential investment
Net international exports Net interstate exports Real GSP
Economic Scenario Analysis
F - 6 Budget Statement 2021-22
Table F.4: The effect of lower house prices on major revenue parameters
Financial year estimate(a) ($, million) 2020-21 2021-22 2022-23 2023-24 2024-25 $m $m $m $m $m
Payroll tax (127) (144) (179) (196)
Land tax ... (95) (144) (181)
Transfer duty (793) (735) (644) (573)
Mining royalties 33 26 26 25
Other tax revenue (86) (78) (98) (103)
GST revenue (402) (410) (406) (411)
Total revenue (1,375) (1,435) (1,446) (1,439)
(a) Figures reported are the change in the level of each parameter relative to the baseline.
Source: CoPS, Victoria University and NSW Treasury