Embed Size (px)
Citation preview
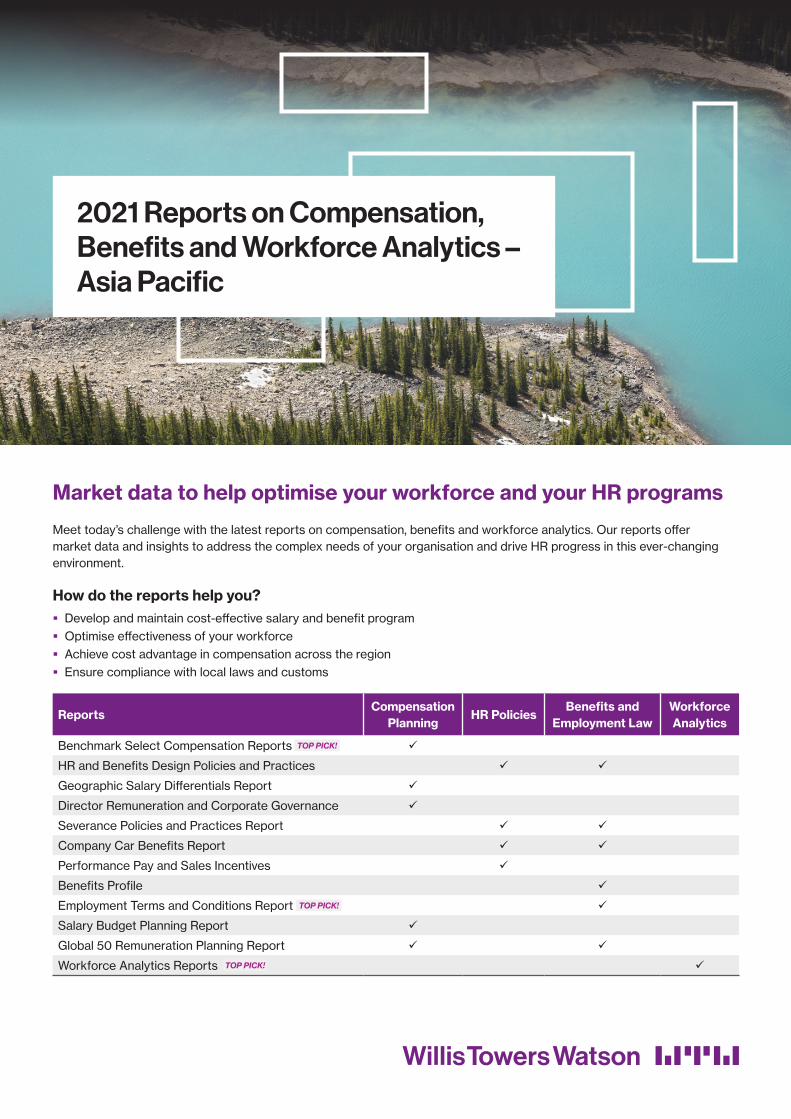
Market data to help optimise your workforce and your HR programs
Meet today’s challenge with the latest reports on compensation, benefits and workforce analytics. Our reports offer market data and insights to address the complex needs of your organisation and drive HR progress in this ever-changing environment.
How do the reports help you? � Develop and maintain cost-effective salary and benefit program � Optimise effectiveness of your workforce � Achieve cost advantage in compensation across the region � Ensure compliance with local laws and customs
ReportsCompensation
PlanningHR Policies
Benefits and Employment Law
Workforce Analytics
Benchmark Select Compensation Reports
HR and Benefits Design Policies and Practices
Geographic Salary Differentials Report
Director Remuneration and Corporate Governance
Severance Policies and Practices Report
Company Car Benefits Report
Performance Pay and Sales Incentives
Benefits Profile
Employment Terms and Conditions Report
Salary Budget Planning Report
Global 50 Remuneration Planning Report
Workforce Analytics Reports
TOP PICK!
TOP PICK!
TOP PICK!
2021 Reports on Compensation, Benefits and Workforce Analytics – Asia Pacific

2 willistowerswatson.com
The most comprehensive benchmarking solution for your total rewards needs – access Compensation, HR and Benefits Practices at a fingertip and without the need to submit data
Positions � Functions and Global Grade � Job Title and Job description
summary
Data elements* � Years of service � 12-month base salary � Fixed/guaranteed bonus � Base salary � Fixed cash allowance � Total guaranteed compensation � Eligibility for annual incentive � Target annual incentives � Target annual compensation � Actual annual incentives � Actual annual compensation
Job functions from 60 disciplines � General management � Administrative services � Corporate services, legal � Product development � Marketing and sales � Customer services � Technical support � Finance and accounting � Information technology � Human resources � Manufacturing and operations � Engineering � Project management � Health and safety � Supply chain and logistics
Positions Levels250 positions available at all levels:
� Executive � Senior and Middle Manager � Supervisor, Professional � Business and Technical Support � Production/Manual Labour
Our HR and Benefits Design Policies and Practices reports serve as a comprehensive global policies benchmarking solution and present market best practices and prevalent designs.
HR Policies
� Compensation policies � Starting salaries � Variable pay � Car benefits � Guaranteed payment and allowances � Business travel � Education, training and development � Attraction and retention � Working hours
Benefits Design
� Retirement plan � Healthcare benefits � Employee wellness � Flexible benefits � Insurance plan � Paid time off � Meal benefits
Online output � PDF and Excel download from online delivery tool � Geographic salary index on domestic pay differentials across city/region
*Data elements varies by country
Benchmark Select Compensation Reports
HR and Benefits Design Policies and Practices
The following local reports are available in both titles
� Asia Pacific: Australia, China (Beijing, Shanghai, Guangzhou/Shenzhen, 2nd tier cities), Hong Kong, India, Indonesia, Japan, Malaysia, Philippines, Singapore, South Korea, Taiwan, Thailand and Vietnam
� Europe, Middle East and Africa: Austria, Belgium, Bulgaria, Croatia, Czech Republic, Denmark, Egypt, Finland, France, Germany, Greece, Hungary, Ireland, Israel, Italy, Kazakhstan, Luxembourg, Morocco, Netherlands, Norway, Poland, Portugal, Romania, Russia, Saudi Arabia, Serbia, Slovakia, Slovenia, South Africa, Spain, Sweden, Switzerland, Turkey, Ukraine, United Arab Emirates and United Kingdom
� Latin America: Argentina, Brazil, Chile, Colombia, Costa Rica, Ecuador, Mexico, Panama and Peru � North America: Canada and United States
Average 25th Percentile
50th Percentile
75th Percentile
1,118,617 865,054 1,081,486 1,282,112
141,971 87,506 108,123 187,583
1,258,909 1,001,078 1,204,419 1,473,870
55,802 24,995 37,867 67,249
1,297,575 1,068,899 1,248,011 1,495,266
11 8 10 15
1,378,512 1,081,558 1,353,761 1,626,636
124,197 58,777 98,872 157,200
1,376,413 1,084,480 1,336,840 1,615,142
6 3 5 8
Yes No65% 35%
12-Month Base Salary
Fixed/Guaranteed Bonus
Senior IT Administration Professional
Market Data
Descriptive Statistics
Administers the IT infrastructure within an organization, including the physical network (e.g., LANs/WANs, servers, terminals) as well as server applications and software (e.g., PeopleSoft, Oracle). Works independently with minimal guidance on complex problems. Has in-depth knowledge in own discipline, basic understanding of related disciplines, and may lead projects or act as a resource for colleagues. Typically requires university degree.
Job Summary
Target Total Annual Compensation
Actual Total Annual Incentives
Total Guaranteed Compensation
Target Total Annual Incentives % of Base Salary
Base Salary
Total Fixed Cash Allowances
Eligibility for Performance Bonus
©2021 Willis Towers WatsonReported in local currency | Organization-weighted Effective Date: 01 January 2021
This report and any data it contains may only be used by Willis Towers Watson clients to support their internal human resources and management organizations. Use of this report or any data it contains for any other purpose (including employee newsletters and other internal publications) or by any other party is strictly prohibited without Willis Towers Watson’s prior written consent. This report may not, in any manner, be reproduced, forwarded, sold or distributed without the written permission of Willis Towers Watson. This report and the data analysis and know-how embodied in it are the confidential and proprietary work product of Willis Towers Watson which owns all related intellectual property rights.
Willis Towers Watson Data Services
Actual Total Annual Compensation
Years of Service
768,480
5
IT AdministrationAdministers the Information Technology (IT) infrastructure within an organization, including the physical network (e.g., LANs/WANs, servers, terminals) as well as server applications and software (e.g., PeopleSoft, Oracle). Configures, installs and maintains server applications and hardware.
90th Percentile
10th Percentile
699,775
59,175
738,976
11,312
645,946
AIT-P3-11|12
Alternative Title/s: Senior IT Administrator; Senior IT Support Analyst
34,217
778,559
2
2020/2021 Benchmark Select Compensation Report
1,497,622
1,755,794
251,168
141,896
1,796,651
17
1,979,817
242,109
1,949,665
12
Function

2021 All Asia Pacific Report Catalogue 3
The Workforce Analytics Reports analyse relationships within organisational structure, talent distribution and compensation allocation. It provides industry benchmark data that helps you to identify areas of inefficiency and redundancy, and to support your restructuring decisions.
With this report, you can:
Local Reports available
Workforce Analytics Reports
� Asia Pacific: Australia, China, Hong Kong, India, Indonesia, Japan,Malaysia, Philippines, Singapore, South Korea, Taiwan, Thailand and Vietnam
� Europe: Belgium, France, Germany, Ireland, Italy, Netherlands, Portugal, Russia, Spain, Switzerland, Turkey and United Kingdom � Latin America: Brazil and Mexico � North America: Canada and United States
Ensure right-sizing of organisation through benchmarking distribution of job functions that represent core capabilities of your industry
Achieve cost efficiency through effective allocation of compensation cost among function and employee levels
Streamlining spans of control and reporting layers by comparing distribution of level, and ratio of management to individual contributors
Succeed in attraction, retention and succession through understanding of employee demographics
Talent Structure
� Employee distribution by function � Employee distribution by function and by
employee category � Employee ratio by function � Employee ratio by function and by employee
category
Employee Demographics
� Employee distribution by age � Employee distribution by years of service � Employee distribution by employee category � Employees approaching retirement age
Organisation Effectiveness
� Organisation’s revenue vs. compensation cost and number of employees
� Compensation cost allocation by employee category
� Compensation cost allocation by function � Fixed v. variable pay allocation by employee
category � Fixed v. variable pay allocation by function
Gender Diversity and Pay Comparison
� Gender distribution by level � Gender distribution by function � Gender distributions by years of service � Gender pay differentials by level � Gender pay differentials by function
Report Features The report consists of four modules with consistent set of analytics across all countries, including:
TOP PICK!
Each module includes guidelines on how to use the data

4 willistowerswatson.com
In today’s uncertain economic situation, HR professionals are expected to be well-prepared in situations of involuntary attrition and formulation of severance packages. The latest Severance Policies and Practices Report is designed to help you:
� Formulate fair and effective severance pay policies � Rationalise cost by comparing severance requirement
and market practice across the region
Content � Organisations’ policy on remote work and impact on pay � Business outlook and economic key data � Actual and projected salary increase by employee group
and by industry � Merit increases, Variable pay � Salary review status and budget allocation by
performance rating � Staff turnover � Headcount planning and recruitment � Regional reports present data with industry breakdown
This report presents the actual salary increase trends for the current year and the budgeted increase forecast for the subsequent year. The latest report comes with a Special Feature highlighting organisations’ policy on remote working and impact on pay.
Salary Budget Planning Survey Report
Severance Policies and Practices Report
Local reports available
� Asia Pacific: China, Hong Kong, India, Malaysia, Philippines and Singapore
� Europe: Germany, Italy, Netherlands, Poland, Switzerland and United Kingdom
� Latin America: Mexico � North America: Canada and United States
Region and global reports available � Asia Pacific � Europe, Middle East and Africa � Latin America � North America � Global
Report features
� Business outlook and headcount planning � Individual and collective severance pay program
� Severance pay in excess of legal minimum � Factors used to consider amount payable � Approach taken in severance pay � Prevalence of formal policy � Policy review � Alternative practices � Local adjustment in global/regional policies
� Severance pay market practices � Statutory requirement � Payment calculation for individual and collective � Payment above statutory requirement � Factors used to determine severance pay � Salary and benefits element used for calculation � Formula of payment calculation � Minimum and maximum limit of payment
� Treatment of unpaid cash and unused benefits � Bonus, sales commissions and long-term incentives � Annual leave � Extension of medical benefits and insurance
� Other practices � Signing of claim waiver � Outplacement support
TOP PICK!
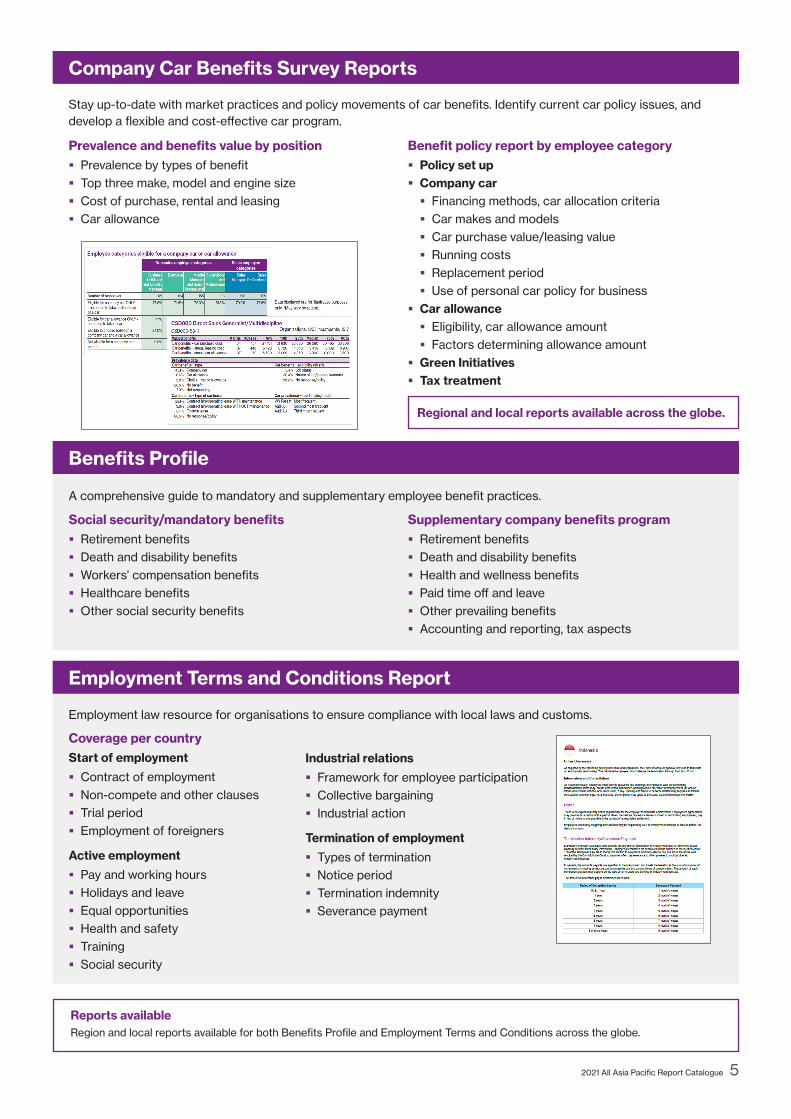
Stay up-to-date with market practices and policy movements of car benefits. Identify current car policy issues, and develop a flexible and cost-effective car program.
A comprehensive guide to mandatory and supplementary employee benefit practices.
Employment law resource for organisations to ensure compliance with local laws and customs.
Company Car Benefits Survey Reports
Employment Terms and Conditions Report
Benefits Profile
Prevalence and benefits value by position � Prevalence by types of benefit � Top three make, model and engine size � Cost of purchase, rental and leasing � Car allowance
Social security/mandatory benefits � Retirement benefits � Death and disability benefits � Workers’ compensation benefits � Healthcare benefits � Other social security benefits
Benefit policy report by employee category � Policy set up � Company car
� Financing methods, car allocation criteria � Car makes and models � Car purchase value/leasing value � Running costs � Replacement period � Use of personal car policy for business
� Car allowance � Eligibility, car allowance amount � Factors determining allowance amount
� Green Initiatives � Tax treatment
Coverage per countryStart of employment
� Contract of employment � Non-compete and other clauses � Trial period � Employment of foreigners
Active employment
� Pay and working hours � Holidays and leave � Equal opportunities � Health and safety � Training � Social security
Industrial relations
� Framework for employee participation � Collective bargaining � Industrial action
Termination of employment
� Types of termination � Notice period � Termination indemnity � Severance payment
Supplementary company benefits program � Retirement benefits � Death and disability benefits � Health and wellness benefits � Paid time off and leave � Other prevailing benefits � Accounting and reporting, tax aspects
Regional and local reports available across the globe.
Reports availableRegion and local reports available for both Benefits Profile and Employment Terms and Conditions across the globe.
2021 All Asia Pacific Report Catalogue 5

6 willistowerswatson.com
This report is an essential tool for reviewing and structuring your Executive Directors’ pay from Base Salary to Annual Bonuses and from Long Term Incentive Awards to Retirement Benefits. The report contains two in-depth sections on Stock Incentives and Corporate Governance, including an analysis of Director Fees and Board and Board Committee Structures.
More Regional and Global Reports
Executive and Director Remuneration and Corporate Governance
Reports Available
The reports for Performance Pay and Sales Incentives and Geographic Differentials are available for Asia Pacific, Europe, Middle East and Africa, Latin America, North America and Global.
Contents and Key Sections
The Performance Pay and Sales Incentive Report presents an in-depth analysis of plan design and structure to help organisations to develop effective incentive plans.
Gain insights into pay dynamics through salary differentials across country for organization expansion and staff relocation.
User benefits:
� Manage cost effectiveness by understanding how salary differ among regions and cities.
� Achieve cost advantage in selecting location for expansion
� Rationalize salary difference in staff relocation
Performance Pay and Sales Incentives Report
Geographic Salary Differentials Report
Report features Performance based bonus plan
� Eligibility by employee category � Prevalence of types of plan � Maximum, actual and target bonus amounts
Sales incentive plans
� Eligibility by employee category � Target awards by percentage of achievement
of objectives � Typical sales incentive payouts � Threshold and maximum payments
Compensation Analysis � By Industry � By Stock Market Capitalisation � By Revenue Size
Stock Compensation Analysis � Vehicles � Vesting Schedule � Stock Option Term � Stock Option Overhang � Stock Option Run Rate � Shareholders’ Value Transfer
Analysis
Corporate Governance Analysis � Structure of Board of Directors � Director Fees � Director Stock Compensation � Types and Structures of Board
Committees � No. of Board and Committee
Meetings Held
Reports available for Hong Kong and Malaysia
Report features � Salary differentials among key cities/regions
domestically relative to capital city and to national average
� Data breakdown by employee categories

Global 50 Remuneration Planning Report
This report is a comprehensive global compensation and benefit planning tool for companies operating in disparate markets and multicultural legislative environments. The report provides a snapshot of the local economy, reward environment and compensation practices for 60 countries worldwide.
User benefits � Develop a global compensation strategy � Compare salaries across the globe � Ensure compliance to local practices
Report features per country � Employment environment � Economic data and labour market indicator � Reward environment � Compensation trends, including salary increases,
variable pay � Statutory and supplementary benefits and perquisites � Public holidays and leaves � Salary structure presents guaranteed compensation
and variable pay by Willis Towers Watson’s Global Grading System
In addition, the report provides:
� Regional and country comparisons on net and gross salaries
� Inter-country wealth comparisons showing the relative buying power across certain regions and countries
60 countries/markets are covered in the report
Asia Pacific: Australia, China, Hong Kong, India, Indonesia, Japan, Malaysia, Philippines, Singapore, South Korea, Taiwan, Thailand and Vietnam
Europe, Middle East and Africa: Algeria, Austria, Belgium, Bulgaria, Czech Republic, Denmark, Egypt, Finland, France, Germany, Greece, Hungary, Ireland, Israel, Italy, Kazakhstan, Luxembourg, Morocco, Netherlands, Nigeria, Norway, Poland, Portugal, Romania, Russia, Saudi Arabia, Slovakia, Slovenia, South Africa, Spain, Sweden, Switzerland, Tunisia, Turkey, Ukraine, United Arab Emirates and United Kingdom
Latin America: Argentina, Brazil, Chile, Colombia, Mexico, Peru, Puerto Rico and Venezuela
North America: Canada and United States
About Willis Towers WatsonWillis Towers Watson (NASDAQ: WLTW) is a leading global advisory, broking and solutions company that helps clients around the world turn risk into a path for growth. With roots dating to 1828, Willis Towers Watson has 45,000 employees serving more than 140 countries and markets. We design and deliver solutions that manage risk, optimise benefits, cultivate talent, and expand the power of capital to protect and strengthen institutions and individuals. Our unique perspective allows us to see the critical intersections between talent, assets and ideas — the dynamic formula that drives business performance. Together, we unlock potential. Learn more at willistowerswatson.com.
Willis Towers Watson Data ServicesWillis Towers Watson Data Services is a leading provider of compensation, benefit and employment practice information to the global employer community. Our databases are recognised worldwide as a premier source of current data for compensation planning.
Willis Towers Watson Data Services [email protected] wtwdataservices.com
willistowerswatson.com/social-media
Copyright © 2021 Willis Towers Watson. All rights reserved.
willistowerswatson.com

wtwdataservices.com
Order Form 2020/2021 Reports on Compensation, Benefits and Workforce Analytics - Asia Pacific
Report Title Fee in USD
2020/2021 Benchmark Select Compensation Report – Asia Pacific [Published in Jan 2021]
Please select below local report/s: Standard Price
Australia Hong Kong India Indonesia Japan Malaysia
USD 2,700 per report Philippines Singapore South Korea Taiwan Thailand Vietnam
China - Please select city report/s Beijing Shanghai Guangzhou/Shenzhen 2nd Tier Cities
❑ Any 1 report - USD 2,700 ❑ Any 2 reports - USD 3,700 ❑ All 4 reports – USD 5,700
2020/2021 Benchmark Select Compensation Report + HR and Benefits Design Practices Report Package Fee
Australia China Hong Kong India Indonesia Japan
USD 3,400 per report Malaysia Philippines Singapore South Korea Taiwan Thailand
Vietnam
2020/2021 Benchmark Select Compensation Report – EMEA, Americas [Published in Feb 2021] Fee per report
Europe, Middle East and Africa (Please indicate country report/s _______________________________________) Euro 2,400 per report
Latin America and North America (Please indicate country report/s ______________________________________) USD 2,700 per report
2021 Severance Policies and Practices Report – Asia Pacific [Publish by April 2021] Fee per report
Select local reports
Asia Pacific: China Hong Kong India Malaysia Philippines Singapore 1,900 any 1 report
Europe, Middle East and Africa (Please indicate country report/s ________________________________________) 1,800 any 2-6 reports
1,700 any 7-11 reports
Latin America and North America (Please indicate country report/s ______________________________________)
2021 Company Car Benefits Survey Report – Asia Pacific [Publish by April 2021]
Asia Pacific - All 14 local reports USD 3,750
Local reports:
Australia China Hong Kong India Indonesia Japan
USD 2,000 per report Malaysia New Zealand Philippines Singapore South Korea Taiwan
Thailand Vietnam
Europe, Middle East and Africa (Please indicate country report/s ________________________________________)
Latin America and North America (Please indicate country report/s ______________________________________)
2020 Benefits and Employment Terms Reports in Asia Pacific* [Published in Aug 2020]
Benefits Profile - Asia Pacific USD 2,600
Employment Terms and Conditions Report - Asia Pacific USD 2,600
Benefits Profile and Employment Terms and Conditions Report - Asia Pacific (Both reports above) USD 4,800
* Country report available upon request
2020/2021 Global 50 Remuneration Planning Report [Published in Nov 2020]
2020/2021 Global 50 Remuneration Planning Report USD 4,600

wtwdataservices.com
Order Form
2020/2021 Reports on Compensation, Benefits and Workforce Analytics - Asia Pacific
2021 Workforce Analytics Report (Fee in USD)
Please select module(s) Participant Non-Participant Custom Report
All of the following 4 modules
Talent Structure
Organization Effectiveness
Employee Demographics
Gender Diversity and Pay Comparison
2,500
1,250
1,250
1,250
1,250
5,000
2,500
2,500
2,500
2,500
Custom workforce analyses may include custom metrics
by job family or job level, peer group by revenue size or
selected companies and your data compared to the
market.
Check the box for us to contact you to discuss your
specific data requirements.
Multiple reports Discount: 2-6 reports: 5% | 7-10 reports: 10% | 11 reports and above: 15%
Asia Pacific [Published in Feb 2021]
Select market and industry Australia China HK India Indonesia Japan S Korea Malaysia Philippines Singapore Taiwan Thailand Vietnam
General Industry
Energy and Natural Resources
Financial Services
High Tech
Insurance
Pharmaceutical and Health Sciences
Retail
Shared Services and Outsourcing
EMEA, Americas [Published in April 2021]
Europe, Middle East and Africa (Please indicate country and industry report/s _________________________________________________)
Latin America and North America (Please indicate country and industry report/s ________________________________________________)
2020 Performance Pay and Sales Incentive Report [Published in Aug 2020] Fee in USD
Global (All regions) 1,600
Asia Pacific Europe, Middle East and Africa Latin America
800 per region
North America 850 per region
2020 Geographic Salary Differentials Report [Published in Aug 2020] Fee in USD
Global (All regions) 1,650
Asia Pacific Europe, Middle East and Africa Latin America 800 per region
North America 850 per region
2020 Salary Budget Planning Survey Report (Q4) [Published in Dec 2020] Fee in USD
2020 Salary Budget Planning Survey Report - Asia Pacific (Q4) 750
2020 Salary Budget Planning Survey Report – Global (Q4) – without industry breakdown 1,500
2020 Salary Budget Planning Survey Report (Q4) – Asia Pacific (Custom Analysis)*
Please indicate market and industry: ________________________________________________________________
1,000 per analysis
*Contact us for peer group selection, a minimum of 15 companies is required.
2020/2021 Executive and Director Remuneration and Corporate Governance Report Hong Kong [published in October 2020] USD 3,300
Malaysia [published in November 2020] USD 3,300

wtwdataservices.com
Order Form
2020/2021 Reports on Compensation, Benefits and Workforce Analytics - Asia Pacific
Contact Details
Mr./Ms./Mrs.: Job title:
Company name: Company website:
Tel: (General) (Direct): Email:
Mailing address:
Signature:
Please return this order form by email, or visit us at: https://www.wtwdataservices.com for more information.
Willis Towers Watson Contacts
Australia Leigh Tongco E: [email protected] T: +61 3 9698 9326
China Iris Liu E: [email protected] T: +86 21 2211 5455
Hong Kong Karen Nip E: [email protected] T: +852 2195 5635
Daisy Chan E: [email protected] T: +852 2195 5634
India Vibhuti Sinha E: [email protected] T: +91 838 002 4560
Indonesia Ario Erlangga E: [email protected] T: +62 21 3044 7976
Japan Kyusin Kim E: [email protected] T: +81 3 6833 4606
Malaysia Lim Chun Hong E: [email protected] T: +603 2723 0534
Philippines Tina Tong E: [email protected] T: +632 8877 5119
Marianne Katigbak E: [email protected] T: +632 8465 2051
Singapore Kurt Tan E: [email protected] T: +65 6958 2832
Betty Chan E: [email protected] T: +65 6958 2862
South. Korea Dahin Lee E: [email protected] T: +822 3430 2541
Taiwan Sandy Sun E: [email protected] T: +886 2 8726 2938
Thailand Tawan Puchakanit E: [email protected] T: +662 239 9029
Vietnam Andy Quoc Anh Bach E: [email protected] T: +66 623 130 692
wtwdataservices.com
Terms and Conditions Willis Towers Watson’s surveys and the results of such surveys, including participation materials and related reports (collectively, “surveys”) are made available by local Willis Towers Watson affiliated companies which are directly or indirectly controlled by Willis Towers Watson PLC (collectively referred to as “Willis Towers Watson” or the “Willis Towers Watson group”) on the following terms and conditions. Service Quality. Willis Towers Watson will collect relevant data and conduct the surveys with reasonable care. While Willis Towers Watson cannot be responsible for verifying the accuracy and completeness of each data submission, a Willis Towers Watson associate will review each data submission for overall reasonableness. Willis Towers Watson provides the surveys on an “as is” basis and does not provide a warranty or guarantee of any kind as to the accuracy or completeness of the surveys or the data or information contained therein. Survey results will be available only if there are sufficient participants in the applicable survey. Intellectual Property Rights. Willis Towers Watson retains all intellectual property rights in the surveys. Unauthorized use or duplication without prior written permission from Willis Towers Watson is prohibited. You shall not refer to us or include any of our work product (including, without limitation, the surveys and the information they contain) in any shareholder communication or in any offering materials (or fairness opinion provided by your professional advisers) prepared in connection with the public offering or private placement of any security, unless otherwise agreed in writing. Use of Surveys. You may use the surveys only within your own organization for internal human resources planning and may not modify, sell or transfer such surveys. Surveys may not be reproduced in employee newsletters or posted on your company’s intranet. If you desire to share the surveys (in whole or in part) with a third party (including any entity controlling, controlled by, or under common control with your company, Willis Towers Watson’s competitors and/or independent contractors working solely for your company), you must first obtain the written consent of Willis Towers Watson. Any use of the information contained in the surveys is not a substitute for seeking expert legal, consulting or other advice on the reasonableness or appropriateness of compensation and/or benefits levels and practices. Limitation of Liability. The aggregate liability of Willis Towers Watson and its employees, directors, officers, agents and subcontractors (the “related persons”) whether in contract, tort (including negligence), breach of statutory duty or otherwise for any losses relating to the surveys provided hereunder shall not exceed in aggregate the greater of (a) $25,000 USD or (b) the total fees paid to Willis Towers Watson for the particular survey(s) and/or custom report(s) related to such survey(s), unless otherwise agreed in writing. Nothing in these terms shall exclude or limit the liability of Willis Towers Watson or our related persons in the case of: (a) death or personal injury resulting from Willis Towers Watson’s or Willis Towers Watson’s related person’s negligence; (b) willful misconduct; (c) fraud; or (d) other liability to the extent that the same may not be excluded or limited as a matter of law. In no event shall Willis Towers Watson or any of our related persons be liable for any incidental, special, punitive, or consequential damages of any kind (including, without limitation, loss of income, loss of profits, or other pecuniary loss). General. The validity and interpretation of these terms will be governed by the laws of the State of New York, United States of America, excluding its conflict of law rules. The parties submit to the exclusive jurisdiction of the State of New York, United States of America Courts to resolve any dispute between them, provided that Willis Towers Watson shall have the right to initiate proceedings in any court of competent jurisdiction in the event of breach of Willis Towers Watson’s proprietary rights. The parties hereby waive any right they may have to demand a jury trial. These terms will apply to purchase orders generated by your company for survey results provided hereunder. In the event of a conflict or inconsistency between the terms and conditions of such purchase orders and these terms, these terms will prevail. Separate terms and conditions apply to use and access of online tools. You shall not assign or otherwise transfer any rights or obligations under these terms without Willis Towers Watson's prior written consent. Participation Terms By participating in Willis Towers Watson’s surveys, you will be deemed to have agreed to the following participation terms on behalf of your company and you represent that you have authority to submit data. As a participant, your company's name will be included on survey participant lists. Survey participants must submit data on a timely basis and provide an accurate and complete data submission, including completion of all sections of the participant materials (e.g., HR Policies & Practices (“HRP”) sections, Benefits Design Practices (”BDP”) sections, individual employee compensation data and long-term incentive information). Benefits and HRP data submitted may be used in current and future BDP and HRP surveys. Data may be submitted directly via the Willis Towers Watson portal hosted in the USA where such data will be stored. If your
company’s data submission is late or does not meet the requirements for a particular survey, Willis Towers Watson may, at its discretion, limit/deny access to such survey results. For select surveys, participants must submit executive data to purchase executive products, middle management, professional and support data to purchase non-executive products and industry-specific functions/disciplines/positions to purchase associated industry-specific survey products. Confidentiality and Use of Data. Participant data submitted to the surveys will be held in confidence. Willis Towers Watson takes reasonable security precautions, including the same precautions Willis Towers Watson takes to protect its own confidential information, to prevent unauthorized access. Participant data will be used by Willis Towers Watson for purposes of creating aggregated compensation survey results and/or anonymized benefits survey results which are presented in a manner that protects individual company confidentiality. Willis Towers Watson reserves the right to use participant data in multiple surveys, where relevant, which may be available to participants and non-participants. Participant data and survey results may be used by Willis Towers Watson for training, quality assurance, research and development, general promotional activities such as trends analysis and consulting services (e.g., market/job pricings) that are provided to survey participants and other selected clients of Willis Towers Watson. Data Protection. Willis Towers Watson may pass participant data, which may include individually identifiable information, within our global network of offices and affiliates (including the Willis Towers Watson Global Resource Center) and to subcontractors and providers of IT outsourcing who will be subject to appropriate data protection standards. The Global Resource Center is located in Manila, The Philippines, and will be used to analyze such data in connection with the surveys. The Manila corporate entity is a wholly owned subsidiary in the Willis Towers Watson group, and Willis Towers Watson’s operations in Manila are certified to the ISO27001 standard covering information security, including data confidentiality, integrity and availability; and are also certified to the ISO9001 standard covering quality management practices. Irrespective of where Willis Towers Watson receives or stores such data, Willis Towers Watson confirms that, acting as data processor, Willis Towers Watson will take appropriate technical, physical and organizational/administrative measures to protect such data against accidental or unlawful destruction or accidental loss or unauthorized alteration, disclosure or access. Willis Towers Watson will use such data only for the purposes described above unless a participant instructs Willis Towers Watson otherwise. Participant and Willis Towers Watson shall each comply with applicable data privacy legislation and regulations.
Willis Towers Watson Data Services
Willis Towers Watson Data Services is a leading provider of compensation, benefit and employment practice information to the global employer community. Our databases are recognised worldwide as a premier source of current data for compensation planning.
Willis Towers Watson Data Services [email protected] wtwdataservices.com
About Willis Towers Watson
Willis Towers Watson (NASDAQ: WLTW) is a leading global advisory, broking and solutions company that helps clients around the world turn risk into a path for growth. With roots dating to 1828, Willis Towers Watson has 45,000 employees serving more than 140 countries and markets. We design and deliver solutions that manage risk, optimize benefits, cultivate talent, and expand the power of capital to protect and strengthen institutions and individuals. Our unique perspective allows us to see the critical intersections between talent, assets and ideas – the dynamic formula that drives business performance. Together, we unlock potential. Learn more at willistowerswatson.com.


![Compensation & Benefits[1]](https://img.pdfslide.net/doc/110x75/577d369f1a28ab3a6b938bc4/compensation-benefits1.jpg)