Embed Size (px)
Citation preview

Traffic Management and Control (ENGC 6340)
2.1 Traffic Stream Characteristics

Traffic Management and Control (ENGC 6340)
2.1 Traffic Stream Characteristics
Time Space Diagram and Measurement
Procedures
Variables of Interest
Traffic Stream Models

Traffic Management and Control (ENGC 6340)
Traffic Management and Control (ENGC 6340)
2.1 Traffic Stream Characteristics
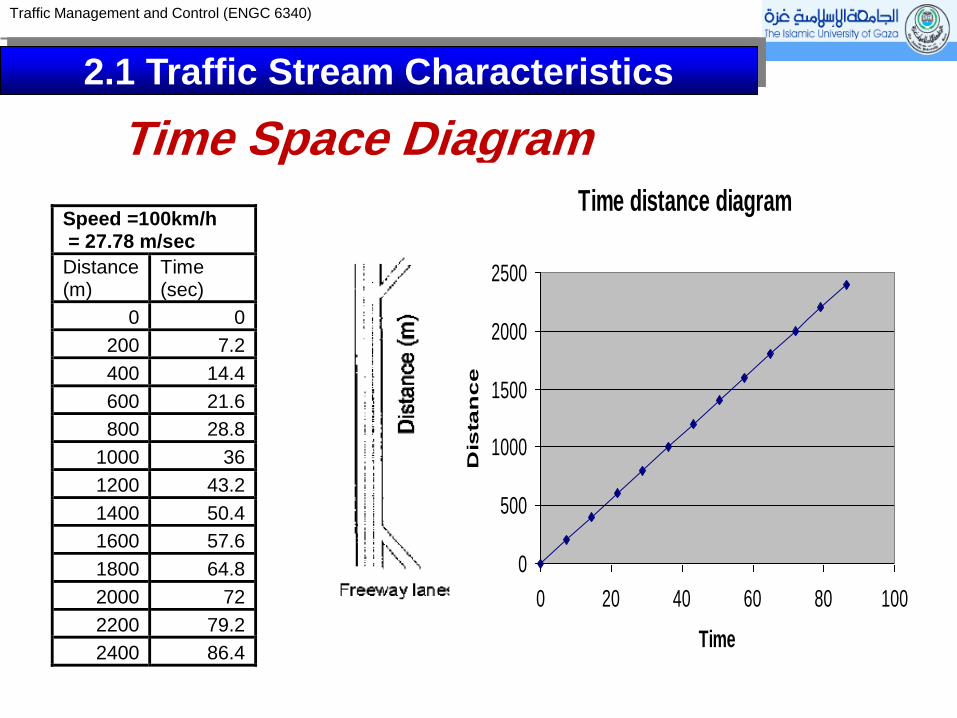
Time Space Diagram
Speed =100km/h = 27.78 m/sec
Distance (m)
Time (sec)
0 0
200 7.2
400 14.4
600 21.6
800 28.8
1000 36
1200 43.2
1400 50.4
1600 57.6
1800 64.8
2000 72
2200 79.2
2400 86.4
Time distance diagram
0
500
1000
1500
2000
2500
0 20 40 60 80 100
Time
Dis
tan
ce

Traffic Management and Control (ENGC 6340)
Time distance diagram
0
500
1000
1500
2000
2500
0 50 100 150 200
Time
Distan
ce
V= 100 km/hr V=150km/hr V=50km/hr
Time Space Diagram

Traffic Management and Control (ENGC 6340)
Speed =150km/h = 41.67 m/sec
Distance (m)
Time (sec)
0 0
0 5
208 10
417 15
625 20
833 25
1042 30
1250 35
1458 40
1667 45
1875 50
2083 55
2292 60
2500 65
Time distance diagram
0
500
1000
1500
2000
2500
0 20 40 60 80Time
Dis
tan
ce
Time Space Diagram

Traffic Management and Control (ENGC 6340)
Speed =150km/h = 41.67 m/sec
Distance (m)
Time (sec)
0 0
0 5
0 10
208 15
417 20
625 25
833 30
1042 35
1250 40
1458 45
1667 50
1875 55
2083 60
2292 65
2500 70
Time distance diagram
0
500
1000
1500
2000
2500
0 20 40 60 80Time
Dis
tan
ce
Time Space Diagram

Dr. Essam almasri Traffic Management and Control (ENGC 6340)
Time-space diagram (Single vehicle )

Dr. Essam almasri Traffic Management and Control (ENGC 6340)
Time-space diagram (Multiple vehicle )

Dr. Essam almasri Traffic Management and Control (ENGC 6340)
Assignment
Question 1
Assuming the distance of a free way is
2400m, draw the time space diagram given
the following conditions:
A vehicle in lane one starts at time 0 and
moves with a speed of 60 km/hr.
A vehicle at lane 2 starts at time 15 sec
and moves with a speed of 110km/hr

Dr. Essam almasri Traffic Management and Control (ENGC 6340)
Assignment
Question 2
When a driver (moving with 55 km/hr) was at
point A (100 m from the intersection), as shown in
the figure, he saw a yield sign, so he decided to
decelerate with a constant deceleration rate 1.5
m/s2. When he was 40 m from the intersection he
realized that the intersection is clear, so he
decided to re-accelerate with a constant
acceleration 2 m/s2. Knowing that the maximum
allowable speed in the road is 55 km/hr, draw the
time distance diagram.

Dr. Essam almasri Traffic Management and Control (ENGC 6340)
Measurement Procedures
Measurement at a point;
Measurement over a short section ( by which is meant less than about 10 meters);
Measurement over a length of road ( usually at least 0.5 kilometers);
The use of an observer moving in the traffic stream; and
Wide-area samples obtained simultaneously from a number of vehicles, as part of Intelligent Transportation Systems ( ITS);

Dr. Essam almasri Traffic Management and Control (ENGC 6340)
Measurement
at a point
Measurement
at a time

Dr. Essam almasri Traffic Management and Control (ENGC 6340)
Measurement at a Point
Provide volume counts and therefore flow rates directly, and with care can also provide time headways.
Speeds at a „point‟ can be obtained only by radar or microwave detectors. Otherwise, a second observation location is necessary to obtain speeds(measurements over a short section)
Dr. Essam almasri Traffic Management and Control (ENGC 6340)
Measurement at a Point
Density, which is defined as vehicles per unit length, does not make sense for a point measurement, because no length is involved.
Hence volume( or flow rate), headways, and speeds are the only direct measurements at a point.

Dr. Essam almasri Traffic Management and Control (ENGC 6340)
Measurement Over a Short Section
Occupancy is defined as the percentage of time that the detection zone of the instrument is occupied by a vehicle.
As with point measurements, short-section data acquisition does not permit direct measurement of density. Where studies based on short-section measurements have used density, it has been calculated.

Dr. Essam almasri Traffic Management and Control (ENGC 6340)
Measurement Along a Length of Road
It is suggested that at least 0.5 km of road be observed.
On the basis of a single frame from such sources, only density can be measured.
The single frame gives no sense of time, so neither volumes nor speed can be measured.

Dr. Essam almasri Traffic Management and Control (ENGC 6340)
Measurement Along a Length of Road
Once several frames are available, speeds can be measured, often over a distance approximating the entire section length over which densities have been calculated.
Flow and density refer to different measurement frameworks: flow over time at a point in space; density over space at a point in time.

Dr. Essam almasri Traffic Management and Control (ENGC 6340)
Moving Observer Method
Two approaches: The first is a simple floating car procedure in which speed and travel times are recorded as a function of time and location along the road.
The other approach was developed by Wardrop and Charlesworth (1954) for urban traffic measurements and is meant to obtain both speed and volume measurement simultaneously.

Dr. Essam almasri Traffic Management and Control (ENGC 6340)
Wardrop and Charlesworth method Based on a survey vehicle that travels in both directions on the road.
Dr. Essam almasri Traffic Management and Control (ENGC 6340)
ITS Wide-Area Measurements
Involve the use of communications from specially-equipped vehicles to a central system. All of them provide for transmission of information on the vehicles‟speeds.
The major difficulty with implementing this approach is that of establishing location precisely. Global positioning systems have almost achieved the capability for doing this well, but they would add considerably to the expense of this approach.

Dr. Essam almasri Traffic Management and Control (ENGC 6340)
Variables of Interest
In general, traffic streams are not uniform, but vary over both space and time. Because of that, measurement of the variables of interest for traffic flow theory is in fact the sampling of a random variable.
In reality, the traffic characteristics that are labeled as flow, speed, and concentration are parameters of statistical distributions, not absolute numbers.

Dr. Essam almasri Traffic Management and Control (ENGC 6340)
Time headway between vehicles (time per vehicles) Spacing, or space headway between vehicles (distance per vehicle); and Rates of flow (vehicles per unit time) Speeds (distance per unit time) Travel time over a know length of road (or sometimes the inverse of speed, “tardity”)
Occupancy (percent of time a point on the road is occupied by vehicles) Density (vehicles per unit distance)
Concentration ( measured by density or occupancy)
Variables of Interest

Dr. Essam almasri Traffic Management and Control (ENGC 6340)
Time Headway
The time headway or headway is the average time interval between the arrival of vehicles at a point.
It is the inverse of flow (q)
E.g. If flow is 1200 veh/hr, then
sec31200
3600h

Dr. Essam almasri Traffic Management and Control (ENGC 6340)
Spacing
Spacing or the distance headway is the average distance between the front of one vehicle and the front of the next
It is the inverse of density (k)
E.g: If density is 120 veh/km then
3.8120
1000s m

Dr. Essam almasri Traffic Management and Control (ENGC 6340)
Time-space diagram /Trajectory

Dr. Essam almasri Traffic Management and Control (ENGC 6340)
Time-space diagram /Trajectory

Dr. Essam almasri Traffic Management and Control (ENGC 6340)
Flow Rates Flow rates are collected directly through point measurements, and by definition require measurement over time.
Flow rates are usually expressed in terms of vehicles per hour,
Flow rate, q, is the number of vehicles counted, divided by the elapsed time, T(or T) :

Dr. Essam almasri Traffic Management and Control (ENGC 6340)
Time Space Diagram

Dr. Essam almasri Traffic Management and Control (ENGC 6340)
Flow Rates The total elapsed study time is made up of the sum
of the headways recorded for each vehicle:
If the sum of the headways is substituted in
Equation for total time, T, then it can be seen that
the flow rate and the average headway have a
reciprocal relationship with each other:

Dr. Essam almasri Traffic Management and Control (ENGC 6340)
Density is the number of vehicles occupying a given length of a lane or roadway at a particular instant expressed as vehicles per kilometer.
It is a measure of the quality of traffic operation
Drivers behavior significantly depends on density
Density
Dr. Essam almasri Traffic Management and Control (ENGC 6340)
Speeds
Measurement of the speed of an individual
vehicle requires observation over both time
and space. The instantaneous speed of an
individual vehicle is defined as
Dr. Essam almasri Traffic Management and Control (ENGC 6340)
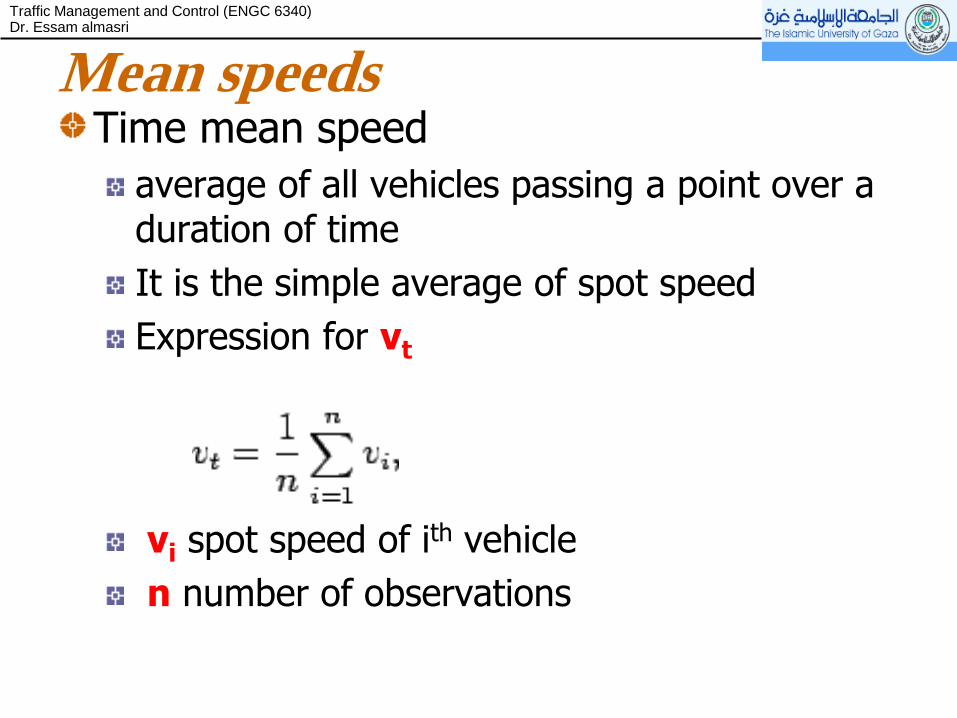
Mean speeds Time mean speed
average of all vehicles passing a point over a duration of time
It is the simple average of spot speed
Expression for vt
vi spot speed of ith vehicle
n number of observations

Dr. Essam almasri Traffic Management and Control (ENGC 6340)
Mean speeds Time mean speed
Speeds may be in the form of frequency table
then vt
qi number of vehicles having speed vi
n number of such speed categories

Dr. Essam almasri Traffic Management and Control (ENGC 6340)
Mean speeds Space mean speed
average speed in a stretch at an instant
It also averages the spot speed
But spatial weightage instead of temporal

Dr. Essam almasri Traffic Management and Control (ENGC 6340)
Mean speeds Space mean speed - derivation
Consider unit length of a road
let vi is the spot speed of ith vehicle
let ti is the time taken to complete unit distance
ti=1/ vi
If there are n such vehicles, then the average travel
time ts is given by

Dr. Essam almasri Traffic Management and Control (ENGC 6340)
Mean speeds Space mean speed - derivation
If average travel time is ts then
average speed vs is 1/ts
the harmonic mean of the spot speed
If speeds are in a frequency table

Dr. Essam almasri Traffic Management and Control (ENGC 6340)
Mean speeds Space mean speed
If speeds are in a frequency table
then vs
qi number of vehicles having speed vi
n number of such speed categories
Dr. Essam almasri Traffic Management and Control (ENGC 6340)
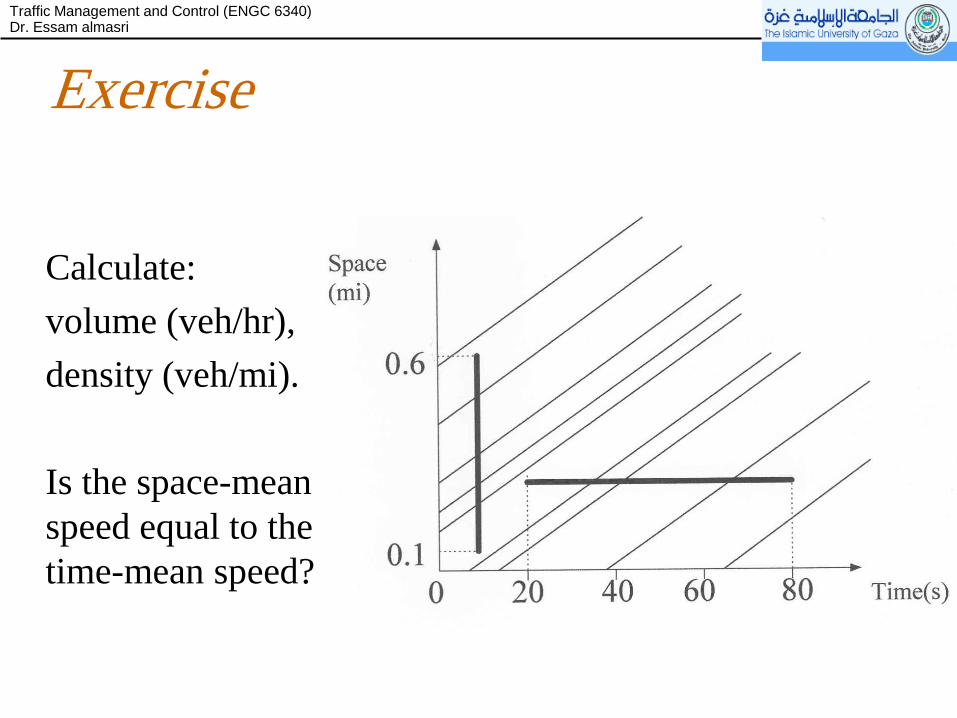
Exercise
Calculate:
volume (veh/hr),
density (veh/mi).
Is the space-mean
speed equal to the
time-mean speed?

Dr. Essam almasri Traffic Management and Control (ENGC 6340)
Mean speeds: Illustration
Calculate:
1- the time mean speed over 60 sec time period
2- space mean speed over a 1km road length?

Dr. Essam almasri Traffic Management and Control (ENGC 6340)
Mean speeds: Illustration
Lane s
Lane f
Time Headway # of Vehs in 60 s # of Vehs in 1 km
Lane s
Lane f
sec/12
20
10
10
20
30mVs

Dr. Essam almasri Traffic Management and Control (ENGC 6340)
Space-mean Speed from Spot
Observations Let’s assume that N speed
measurements have been
collected over some period of
time at some spot. N
U
U
N
i
i
t
1
N
i i
s
UN
U
1
11
1
t
tts
U
UUU
var
The space-mean speed is:
The space-mean speed in the
vicinity of the spot can be
approximated as follows:

Dr. Essam almasri Traffic Management and Control (ENGC 6340)
Assignment: Mean speeds
Example 1 If the spot speeds (at one point) are 51, 41, 61,55 and 46, then find the TMS and SMS
Example 2 The results of a speed study (at one point) is given in the form of a frequency distribution table. Find the TMS and SMS
speed range frequency
2-5 2
6-9 5
10-13 1
14-17 8

Dr. Essam almasri Traffic Management and Control (ENGC 6340)
Occupancy Occupancy is the fraction of time that
vehicles are over the detector. For each
individual vehicle, the time spent over the
detector is determined by the vehicle's
speed, u , and its length, L , plus the length
of the detector itself, d.
Dr. Essam almasri Traffic Management and Control (ENGC 6340)
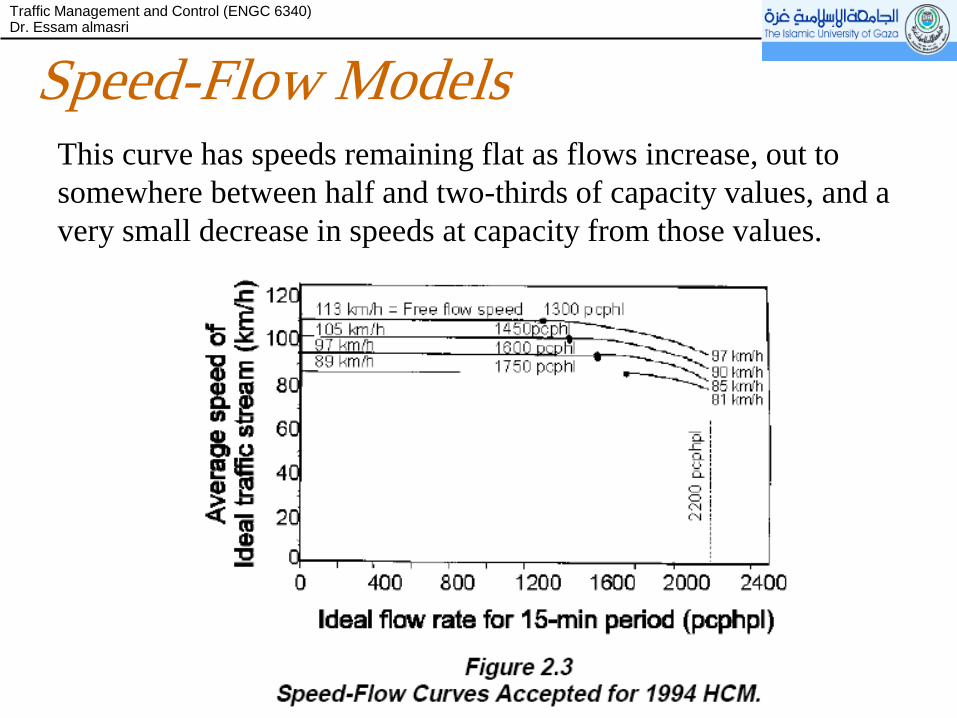
Speed-Flow Models This curve has speeds remaining flat as flows increase, out to
somewhere between half and two-thirds of capacity values, and a
very small decrease in speeds at capacity from those values.

Dr. Essam almasri Traffic Management and Control (ENGC 6340)

Dr. Essam almasri Traffic Management and Control (ENGC 6340)
where u is the free-flow
speed, and k is the jam
density.

Dr. Essam almasri Traffic Management and Control (ENGC 6340)
Speed-Density Models The most interesting aspect of this particular model is that its
empirical basis consisted of half a dozen points in tone cluster near
free-flow speed, and a single observation under congested conditions.
(1935) There are other advanced research lately.

Dr. Essam almasri Traffic Management and Control (ENGC 6340)
Fundamental Diagram
q, v, k – Greenshield’s
Jam Density
(measured)
Free flow
(measured)
v
k
kk
vvv
j
f
f

Dr. Essam almasri Traffic Management and Control (ENGC 6340)
q, v, k – Greenshield’s
Jam Density
(measured)
Free flow
(measured)
q
v v
k
Max
Flow
2vv
kvkq
f
j
j

Dr. Essam almasri Traffic Management and Control (ENGC 6340)
q, v, k – Greenshield’s
Jam Density
(measured)
Free flow
(measured)
q
k Density at
Capacity
m
m
m vk
qtan
v
k
Max Flow
q
v
Max
Flow
2kk
vkvq
j
f
f

Dr. Essam almasri Traffic Management and Control (ENGC 6340)
Combined
Fundamental diagrams

Dr. Essam almasri Traffic Management and Control (ENGC 6340)
Assignment
Describe at least 2 other speed density relationships?
Draw the fundamental diagram of these relationships ?


![01 - Traffic Stream Characteristics [120809]](https://img.pdfslide.net/doc/110x75/577d2cad1a28ab4e1eac95de/01-traffic-stream-characteristics-120809.jpg)