Embed Size (px)
Citation preview

21WATER QUALITY MONITORING
Lyttelton Port Company
Channel Deepening Project
Environmental Monitoring
Water Quality Environmental Monitoring
Services – Methodology
July 2016
Phone: 61 7 4972 7530 | Unit 3, 165 Auckland St | PO Box 1267, Gladstone QLD 4680 | www.visionenvironment.com.au
A21 - 1
Capital Dredge Water Quality Environmental Monitoring Methodology
Page i
DOCUMENT CONTROL
Document draft Originated by Edit and review Date
Draft for internal review LA FM 25/07/2016
Version 1 Draft for Client review MJ LA 27/07/2014
Version 2 Draft for Client review LA MJ 28/07/2016
Version 3 to Client LA FM 23/08/2016
Version 4 to Client LA FM 16/09/2016
CITATION
This report should be cited as:
Vision Environment (2016). Lyttelton Port Company Channel Deepening Project Water
Quality Environmental Monitoring Methodology – August 2016. Vision Environment,
Gladstone, QLD, Australia.
DISCLAIMER
Every care is taken to ensure the accuracy of the data and interpretation provided. Vision
Environment makes no representation or warranties about the accuracy, reliability,
completeness or suitability for any particular purpose, and disclaims all responsibility and all
liability for all expenses, losses, damages which may be incurred as a result of this product
being inaccurate.
FILE REFERENCE
16092016_LPC Water Quality Environmental Monitoring Methodology_VE
A21 - 2
Capital Dredge Water Quality Environmental Monitoring Methodology
Page ii
Table of Contents
1 INTRODUCTION ........................................................................................................... 1
2 MONITORING DESIGN ................................................................................................. 1
2.1 Sites ....................................................................................................................... 1
2.2 Monitoring Parameters ............................................................................................ 5
3 METHODOLOGY ........................................................................................................... 9
3.1 Telemetered Field Instrumentation .......................................................................... 9
3.1.1 Real Time Data Delivery .................................................................................. 9
3.1.2 WatchKeeper ................................................................................................... 9
3.1.3 Continuous Subsurface Telemetered Data Loggers ......................................... 9
3.1.4 Continuous Subsurface Telemetered Data Loggers with ADCP ..................... 11
3.1.5 Continuous Benthic data logging.................................................................... 11
3.1.5.1 Physicochemistry .................................................................................... 11
3.1.5.2 Benthic Photosynthetic Active Radiation (BPAR) .................................... 12
3.1.5.3 Sedimentation rates ................................................................................ 12
3.2 Discrete Water Sampling ...................................................................................... 13
3.2.1 Depth profiling ................................................................................................ 14
3.2.1.1 Photosynthetic Active Radiation or Light Attenuation .............................. 14
3.2.1.2 Physicochemical Parameters .................................................................. 14
3.2.2 Water sample collection ................................................................................. 15
3.2.2.1 Total suspended solids ........................................................................... 16
3.2.2.2 Metal Concentrations .............................................................................. 16
3.2.2.3 Nutrients and Chlorophyll a Concentrations ............................................ 16
3.2.2.4 Organics ................................................................................................. 16
3.3 Data Management ................................................................................................ 16
3.3.1 Continuous Data Loggers .............................................................................. 17
3.3.2 Continuous BPAR .......................................................................................... 18
3.3.3 Continuous Altimeter ...................................................................................... 18
4 REFERENCES ............................................................................................................ 20
A21 - 3
Capital Dredge Water Quality Environmental Monitoring Methodology
Page iii
List of Figures
Figure 1 Monitoring locations for the LPC Channel Deepening Project, displaying sites within each
location. ................................................................................................................................................... 3
Figure 2 Example of WatchKeeper buoy to be deployed at site SG2a. ............................................... 10
Figure 3 Continuous subsurface telemetered monitoring buoy. ........................................................... 10
Figure 4 Continuous subsurface telemetered monitoring buoy with ADCP under construction. .......... 11
Figure 5 Benthic frame incorporating all three forms of benthic data logging and deployed buoy. ...... 13
Figure 6 Measurement of physicochemical parameters using the YSI 6820 and LI-COR light meter. 14
Figure 7 Collection of water samples for analysis using Perspex Pole sampler. ................................. 15
Figure 8 Filtering of water samples. ...................................................................................................... 15
ANZECC. 1992. Australian water quality guidelines for fresh and marine waters. Australian and New
Zealand Environment and Conservation Council, Canberra. ................. Error! Bookmark not defined.
ANZECC. 1998. Interim ocean disposal guidelines. Australian and New Zealand Environment and
Conservation Council, Canberra. ............................................................ Error! Bookmark not defined.
ANZECC/ARMCANZ. 2000. National Water Quality Management Strategy: Australian Guidelines for
Water Quality Monitoring and Reporting. Australia and New Zealand Environment and Conservation
Council & Agriculture and Resource Management Council of Australia and New Zealand. .......... Error!
Bookmark not defined.
APHA. 2005. Standard Methods for the Examination of Water and Wastewater. 21st edition. Port City
Press, Baltimore, Maryland. .................................................................... Error! Bookmark not defined.
AS/NZS. 1998a. 5667.1:1998 Water Quality - Sampling. Part 1: Guidance on the design of sampling
programs, sampling techniques and the preservation and handling of samples. Joint Standards
Australia/Standards New Zealand. ......................................................... Error! Bookmark not defined.
AS/NZS. 1998b. 5667.4:1998 Water Quality - Sampling. Part 4: Guidance on sampling from lakes,
natural and man-made. Joint Standards Australia/Standards New Zealand. ........ Error! Bookmark not
defined.
AS/NZS. 1998c. 5667.6:1998 Water Quality - Sampling. Part 6: Guidance on sampling of rivers and
streams. Joint Standards Australia/Standards New Zealand. ................ Error! Bookmark not defined.
Atalah, J. and R. Sneddon. 2016. Lyttelton Harbour and Banks Peninsula shoreline reef ecology:
Field survey data report (February 2016). Cawthron Institute, Nelson, New Zealand. Error! Bookmark
not defined.
DERM. 2010. Monitoring and sampling manual 2009, Version 2 September 2010. Water and
Corporate Services Division, Department of Environment and Resource Management. ............... Error!
Bookmark not defined.
Tonkin & Taylor. 2016. LPC Channel Deepening Environmental Monitoring and Management Plan.
Christchurch, New Zealand. .................................................................... Error! Bookmark not defined.
Vision Environment. 2013. WBDDP Water Quality Monitoring - September 2013., Gladstone,
Australia. ................................................................................................. Error! Bookmark not defined.
A21 - 4
Capital Dredge Water Quality Environmental Monitoring Methodology
Page iv
List of Tables
Table 1 Summary of monitoring sites and deployment equipment for the LPC Channel Deepening
Project. .................................................................................................................................................... 2
Table 2 Background rationale as to the selection of sites and equipment for the LPC Channel
Deepening Project. .................................................................................................................................. 4
Table 3 List of water quality monitoring parameters, definitions, justification and supporting
documentation for the LPC Channel Deepening Project. ....................................................................... 6
Table 4 Summary of discrete grab sampling approach at 15 locations. ............................................. 14
A21 - 5
Capital Dredge Water Quality Environmental Monitoring Methodology
Page v
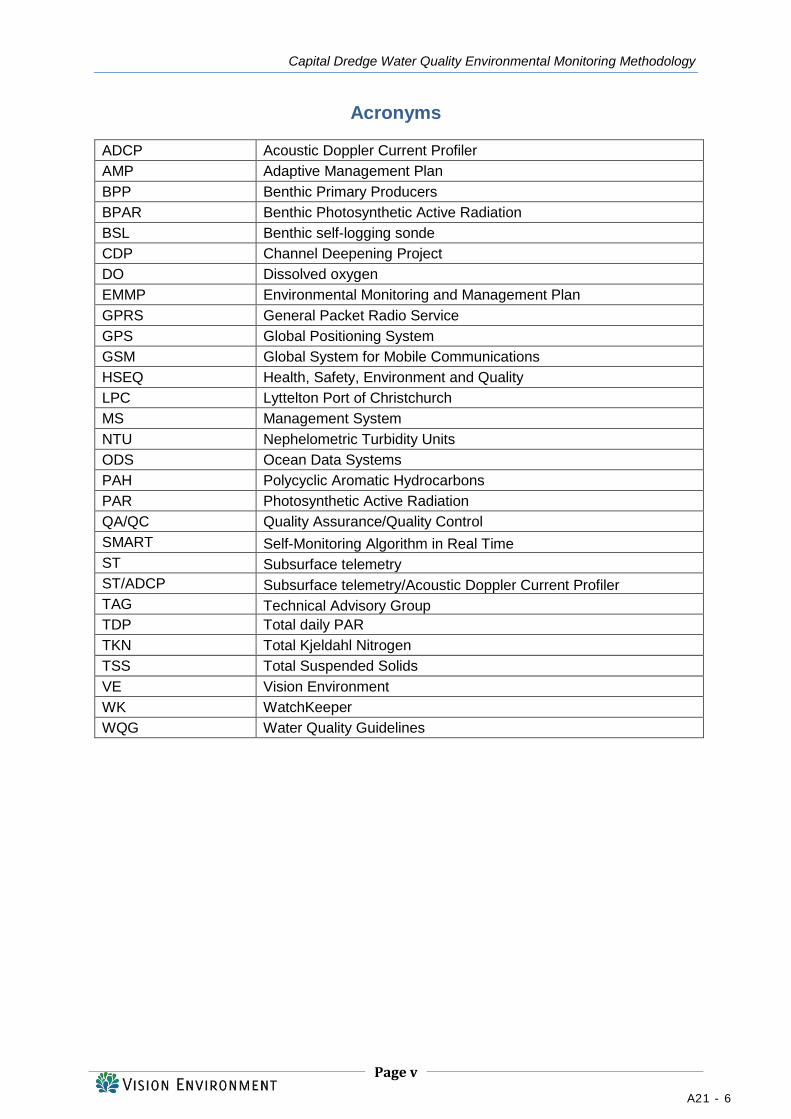
Acronyms
ADCP Acoustic Doppler Current Profiler
AMP Adaptive Management Plan
BPP Benthic Primary Producers
BPAR Benthic Photosynthetic Active Radiation
BSL Benthic self-logging sonde
CDP Channel Deepening Project
DO Dissolved oxygen
EMMP Environmental Monitoring and Management Plan
GPRS General Packet Radio Service
GPS Global Positioning System
GSM Global System for Mobile Communications
HSEQ Health, Safety, Environment and Quality
LPC Lyttelton Port of Christchurch
MS Management System
NTU Nephelometric Turbidity Units
ODS Ocean Data Systems
PAH Polycyclic Aromatic Hydrocarbons
PAR Photosynthetic Active Radiation
QA/QC Quality Assurance/Quality Control
SMART Self-Monitoring Algorithm in Real Time
ST Subsurface telemetry
ST/ADCP Subsurface telemetry/Acoustic Doppler Current Profiler
TAG Technical Advisory Group
TDP Total daily PAR
TKN Total Kjeldahl Nitrogen
TSS Total Suspended Solids
VE Vision Environment
WK WatchKeeper
WQG Water Quality Guidelines
A21 - 6
Capital Dredge Water Quality Environmental Monitoring Methodology
Page 1
1 INTRODUCTION
Water quality monitoring and data collection undertaken by Vision Environment (VE) for
Lyttelton Port of Christchurch, the South Island’s largest port, commenced in August 2016.
Lyttelton Port Company (LPC) is proposing a Channel Deepening Project (CDP) to widen,
deepen and extend the existing navigational channel to allow larger vessels access to the
Port. The marine water quality environmental monitoring services will provide interpreted
baseline data to support the process of the Environmental Monitoring and Management Plan
(EMMP) for the LPC CDP (Tonkin & Taylor, 2016) and ascertain the potential impacts of the
project.
The aim of the CDP is to deepen, widen and lengthen the existing approach channel and
turning basin, to accommodate increasing cargo capacity requirements and ensure LPC
continues to provide efficient shipping services for the local and regional economy. LPC is
committed to environmentally responsible and safe port operations and development and, in
particular, ensuring the protection of mahinga kai values and the health of Lyttelton
Harbour/Whakaraupō and Port Levy/Koukourārata. Utilising background information
provided by LPC and advice from the Technical Advisory Group (TAG) in relation to ambient
conditions, location of sensitive habitats and dredge impact hydrodynamic modelling
scenarios, a water quality monitoring design was proposed for the initial 12 month baseline
monitoring phase. It is noted this report only covers the water quality and metocean
monitoring and that other forms of monitoring are proposed and outlined in the EMMP.
This report outlines the water quality monitoring methodology to be implemented for the
CDP, including the sites/locations monitored, a description and rationale of the monitoring
parameters, and data processing protocols. As per the VE Health, Safety, Environment and
Quality (HSEQ) Management System (MS), protocols are continually reviewed, refined and
improved. Thus the methodology document may be revised over the course of the project.
2 MONITORING DESIGN
2.1 Sites
Guided by the results of preliminary hydrodynamic modelling (MetOcean, 2016a, b) in
addition to advice from the TAG, baseline monitoring sites were located outside the area of
predicted direct impact (i.e. dredge footprint and offshore disposal ground), within the zone
of dredging and dredge material placement influence, in addition to being in the vicinity of
sensitive receptors (e.g. mussels farms and important mahinga kai sites). For ease of
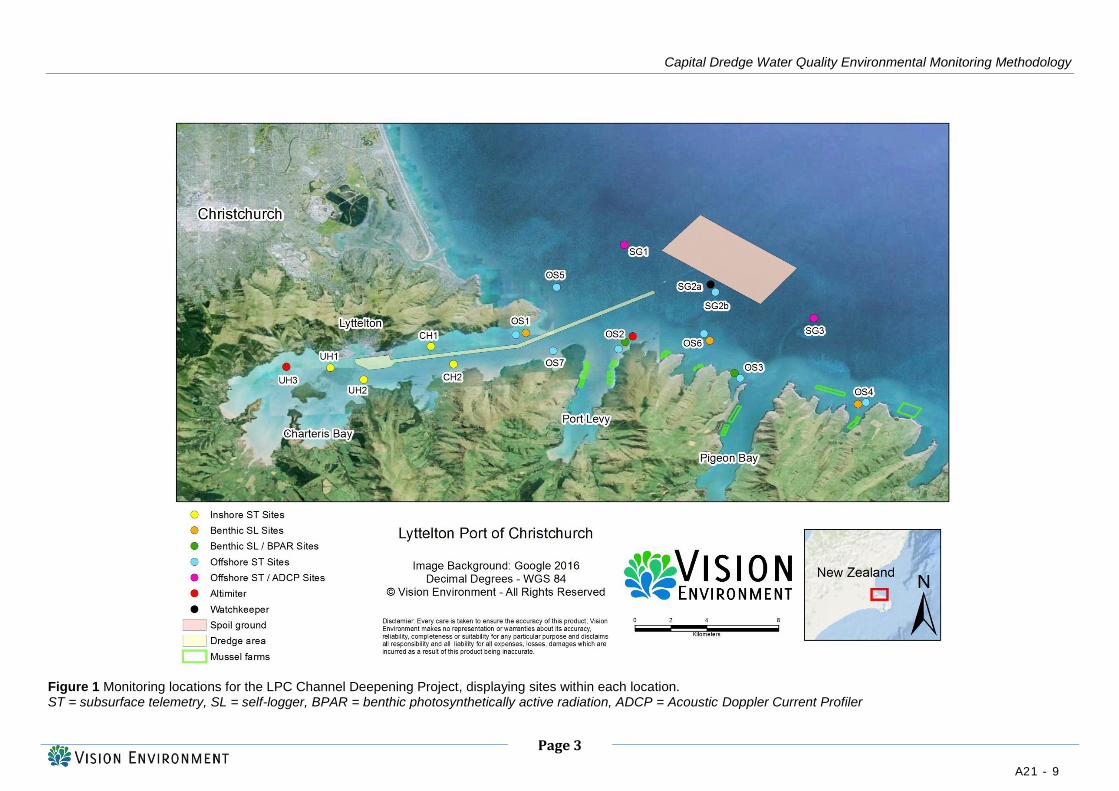
identification the harbour was divided into four areas: spoil ground (SG); offshore (OS)
central harbour (CH); and upper harbour (UH), in which 15 locations were selected for
monitoring (Figure 1). At each area, one to three monitoring sites were selected for the
deployment of the various individual types of equipment, which are identified in Table 2. A
detailed description of the capabilities of each piece of monitoring equipment can be found in
section 3. A background rationale as to the selection of the locations is described in Table 2.
A total of 22 monitoring units were deployed across the 15 locations. Final Global Positioning
System (GPS) marks will be advised.
Monitoring sites are indicative and may be subject to change prior to deployment. As the site
selection is based on best available knowledge, there is the possibility adjustment of sites
post-deployment may be required in order for the monitoring to best represent overall water
quality conditions in the harbour and offshore.
A21 - 7
Capital Dredge Water Quality Environmental Monitoring Methodology
Page 2
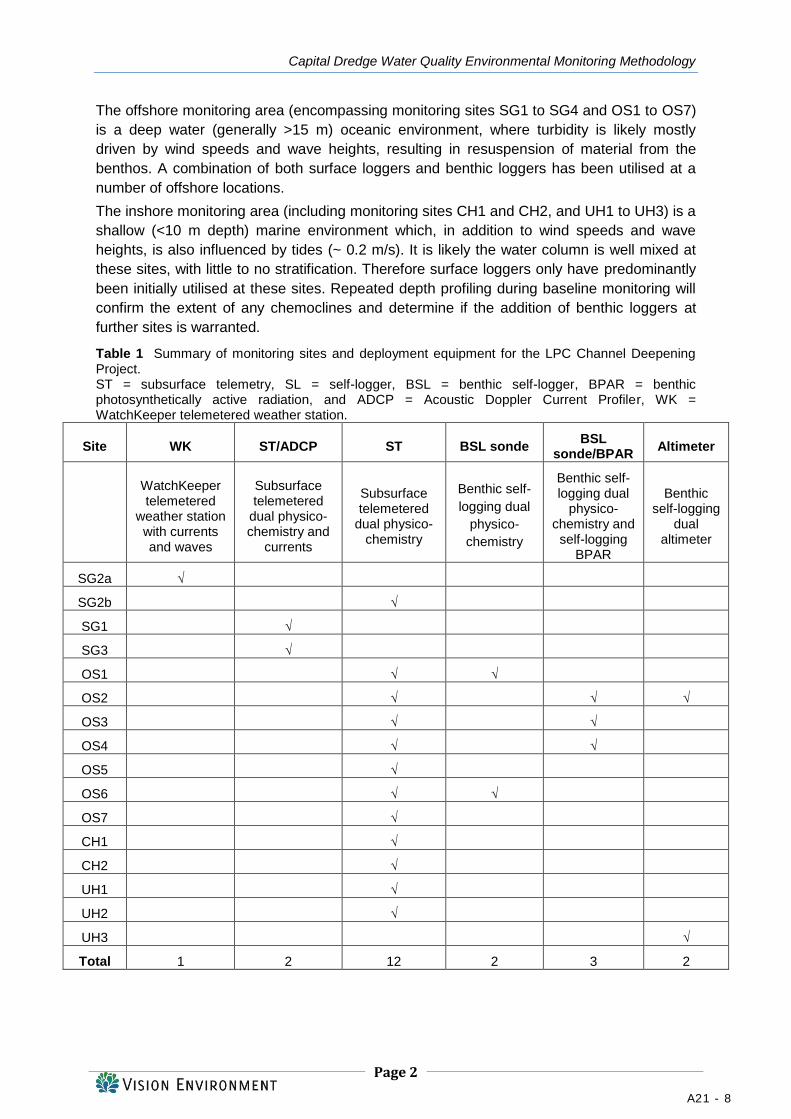
The offshore monitoring area (encompassing monitoring sites SG1 to SG4 and OS1 to OS7)
is a deep water (generally >15 m) oceanic environment, where turbidity is likely mostly
driven by wind speeds and wave heights, resulting in resuspension of material from the
benthos. A combination of both surface loggers and benthic loggers has been utilised at a
number of offshore locations.
The inshore monitoring area (including monitoring sites CH1 and CH2, and UH1 to UH3) is a
shallow (<10 m depth) marine environment which, in addition to wind speeds and wave
heights, is also influenced by tides (~ 0.2 m/s). It is likely the water column is well mixed at
these sites, with little to no stratification. Therefore surface loggers only have predominantly
been initially utilised at these sites. Repeated depth profiling during baseline monitoring will
confirm the extent of any chemoclines and determine if the addition of benthic loggers at
further sites is warranted.
Table 1 Summary of monitoring sites and deployment equipment for the LPC Channel Deepening Project. ST = subsurface telemetry, SL = self-logger, BSL = benthic self-logger, BPAR = benthic photosynthetically active radiation, and ADCP = Acoustic Doppler Current Profiler, WK = WatchKeeper telemetered weather station.
Site WK ST/ADCP ST BSL sonde BSL
sonde/BPAR Altimeter
WatchKeeper telemetered
weather station with currents and waves
Subsurface telemetered
dual physico-chemistry and
currents
Subsurface telemetered
dual physico-chemistry
Benthic self-
logging dual
physico-
chemistry
Benthic self-logging dual
physico-chemistry and self-logging
BPAR
Benthic self-logging
dual altimeter
SG2a √
SG2b
√
SG1
√
SG3
√
OS1
√ √
OS2
√
√ √
OS3
√
√
OS4
√
√
OS5
√
OS6
√ √
OS7
√
CH1
√
CH2
√
UH1
√
UH2
√
UH3
√
Total 1 2 12 2 3 2
A21 - 8
Capital Dredge Water Quality Environmental Monitoring Methodology
Page 3
Figure 1 Monitoring locations for the LPC Channel Deepening Project, displaying sites within each location. ST = subsurface telemetry, SL = self-logger, BPAR = benthic photosynthetically active radiation, ADCP = Acoustic Doppler Current Profiler
A21 - 9
Capital Dredge Water Quality Environmental Monitoring Methodology
Page 4
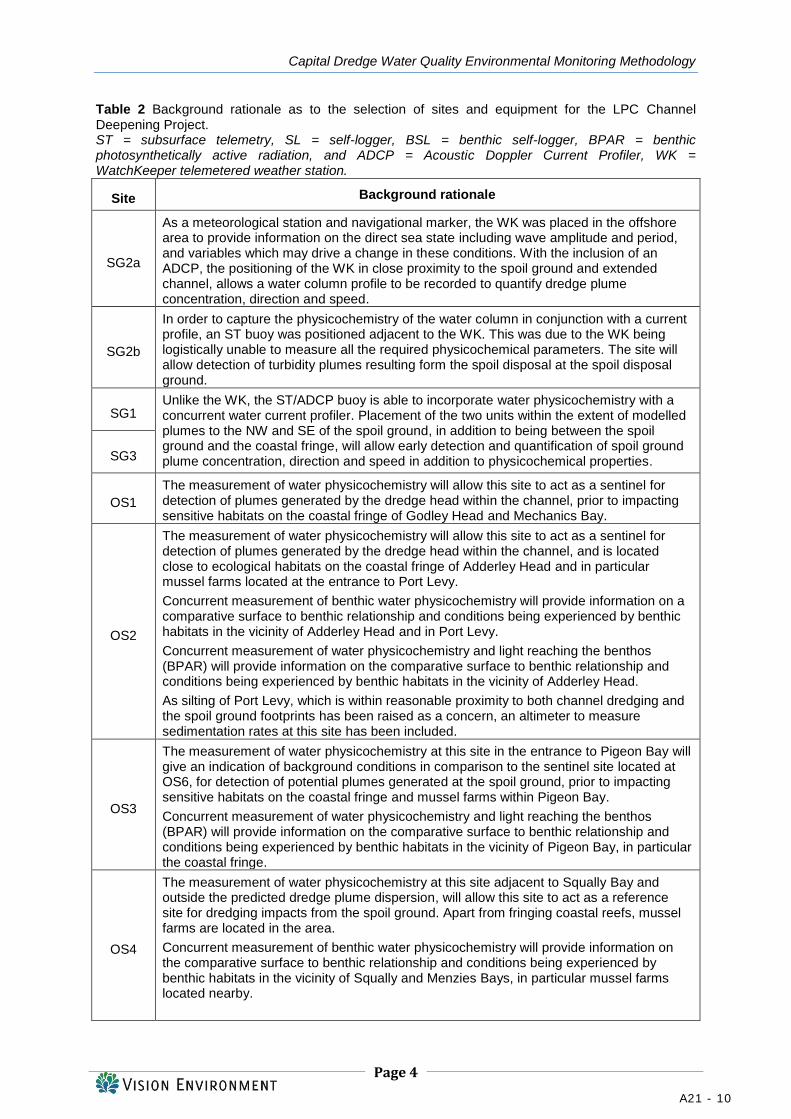
Table 2 Background rationale as to the selection of sites and equipment for the LPC Channel Deepening Project. ST = subsurface telemetry, SL = self-logger, BSL = benthic self-logger, BPAR = benthic photosynthetically active radiation, and ADCP = Acoustic Doppler Current Profiler, WK = WatchKeeper telemetered weather station.
Site Background rationale
SG2a
As a meteorological station and navigational marker, the WK was placed in the offshore area to provide information on the direct sea state including wave amplitude and period, and variables which may drive a change in these conditions. With the inclusion of an ADCP, the positioning of the WK in close proximity to the spoil ground and extended channel, allows a water column profile to be recorded to quantify dredge plume concentration, direction and speed.
SG2b
In order to capture the physicochemistry of the water column in conjunction with a current profile, an ST buoy was positioned adjacent to the WK. This was due to the WK being logistically unable to measure all the required physicochemical parameters. The site will allow detection of turbidity plumes resulting form the spoil disposal at the spoil disposal ground.
SG1 Unlike the WK, the ST/ADCP buoy is able to incorporate water physicochemistry with a concurrent water current profiler. Placement of the two units within the extent of modelled plumes to the NW and SE of the spoil ground, in addition to being between the spoil ground and the coastal fringe, will allow early detection and quantification of spoil ground plume concentration, direction and speed in addition to physicochemical properties. SG3
OS1
The measurement of water physicochemistry will allow this site to act as a sentinel for detection of plumes generated by the dredge head within the channel, prior to impacting sensitive habitats on the coastal fringe of Godley Head and Mechanics Bay.
OS2
The measurement of water physicochemistry will allow this site to act as a sentinel for detection of plumes generated by the dredge head within the channel, and is located close to ecological habitats on the coastal fringe of Adderley Head and in particular mussel farms located at the entrance to Port Levy.
Concurrent measurement of benthic water physicochemistry will provide information on a comparative surface to benthic relationship and conditions being experienced by benthic habitats in the vicinity of Adderley Head and in Port Levy.
Concurrent measurement of water physicochemistry and light reaching the benthos (BPAR) will provide information on the comparative surface to benthic relationship and conditions being experienced by benthic habitats in the vicinity of Adderley Head.
As silting of Port Levy, which is within reasonable proximity to both channel dredging and the spoil ground footprints has been raised as a concern, an altimeter to measure sedimentation rates at this site has been included.
OS3
The measurement of water physicochemistry at this site in the entrance to Pigeon Bay will give an indication of background conditions in comparison to the sentinel site located at OS6, for detection of potential plumes generated at the spoil ground, prior to impacting sensitive habitats on the coastal fringe and mussel farms within Pigeon Bay.
Concurrent measurement of water physicochemistry and light reaching the benthos (BPAR) will provide information on the comparative surface to benthic relationship and conditions being experienced by benthic habitats in the vicinity of Pigeon Bay, in particular the coastal fringe.
OS4
The measurement of water physicochemistry at this site adjacent to Squally Bay and outside the predicted dredge plume dispersion, will allow this site to act as a reference site for dredging impacts from the spoil ground. Apart from fringing coastal reefs, mussel farms are located in the area.
Concurrent measurement of benthic water physicochemistry will provide information on the comparative surface to benthic relationship and conditions being experienced by benthic habitats in the vicinity of Squally and Menzies Bays, in particular mussel farms located nearby.
A21 - 10
Capital Dredge Water Quality Environmental Monitoring Methodology
Page 5
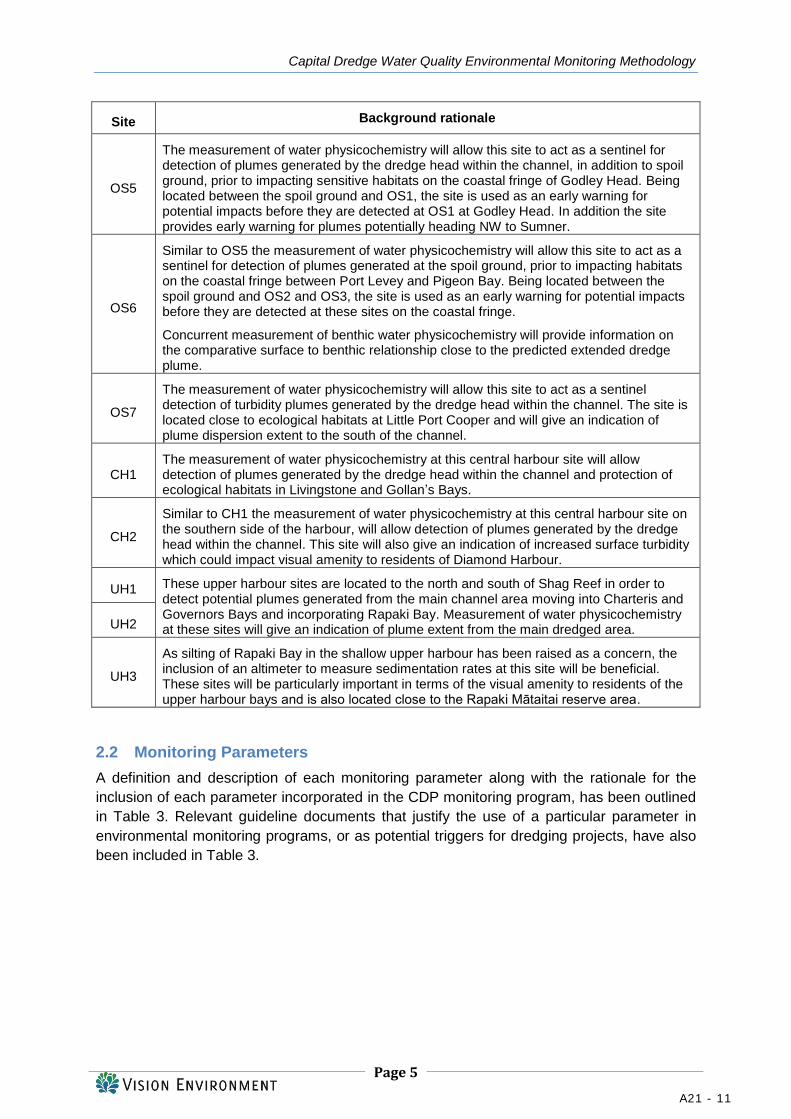
Site Background rationale
OS5
The measurement of water physicochemistry will allow this site to act as a sentinel for detection of plumes generated by the dredge head within the channel, in addition to spoil ground, prior to impacting sensitive habitats on the coastal fringe of Godley Head. Being located between the spoil ground and OS1, the site is used as an early warning for potential impacts before they are detected at OS1 at Godley Head. In addition the site provides early warning for plumes potentially heading NW to Sumner.
OS6
Similar to OS5 the measurement of water physicochemistry will allow this site to act as a sentinel for detection of plumes generated at the spoil ground, prior to impacting habitats on the coastal fringe between Port Levey and Pigeon Bay. Being located between the spoil ground and OS2 and OS3, the site is used as an early warning for potential impacts before they are detected at these sites on the coastal fringe.
Concurrent measurement of benthic water physicochemistry will provide information on the comparative surface to benthic relationship close to the predicted extended dredge plume.
OS7
The measurement of water physicochemistry will allow this site to act as a sentinel detection of turbidity plumes generated by the dredge head within the channel. The site is located close to ecological habitats at Little Port Cooper and will give an indication of plume dispersion extent to the south of the channel.
CH1 The measurement of water physicochemistry at this central harbour site will allow detection of plumes generated by the dredge head within the channel and protection of ecological habitats in Livingstone and Gollan’s Bays.
CH2
Similar to CH1 the measurement of water physicochemistry at this central harbour site on the southern side of the harbour, will allow detection of plumes generated by the dredge head within the channel. This site will also give an indication of increased surface turbidity which could impact visual amenity to residents of Diamond Harbour.
UH1 These upper harbour sites are located to the north and south of Shag Reef in order to detect potential plumes generated from the main channel area moving into Charteris and Governors Bays and incorporating Rapaki Bay. Measurement of water physicochemistry at these sites will give an indication of plume extent from the main dredged area. UH2
UH3
As silting of Rapaki Bay in the shallow upper harbour has been raised as a concern, the inclusion of an altimeter to measure sedimentation rates at this site will be beneficial. These sites will be particularly important in terms of the visual amenity to residents of the upper harbour bays and is also located close to the Rapaki Mātaitai reserve area.
2.2 Monitoring Parameters
A definition and description of each monitoring parameter along with the rationale for the
inclusion of each parameter incorporated in the CDP monitoring program, has been outlined
in Table 3. Relevant guideline documents that justify the use of a particular parameter in
environmental monitoring programs, or as potential triggers for dredging projects, have also
been included in Table 3.
A21 - 11
Capital Dredge Water Quality Environmental Monitoring Methodology
Page 6
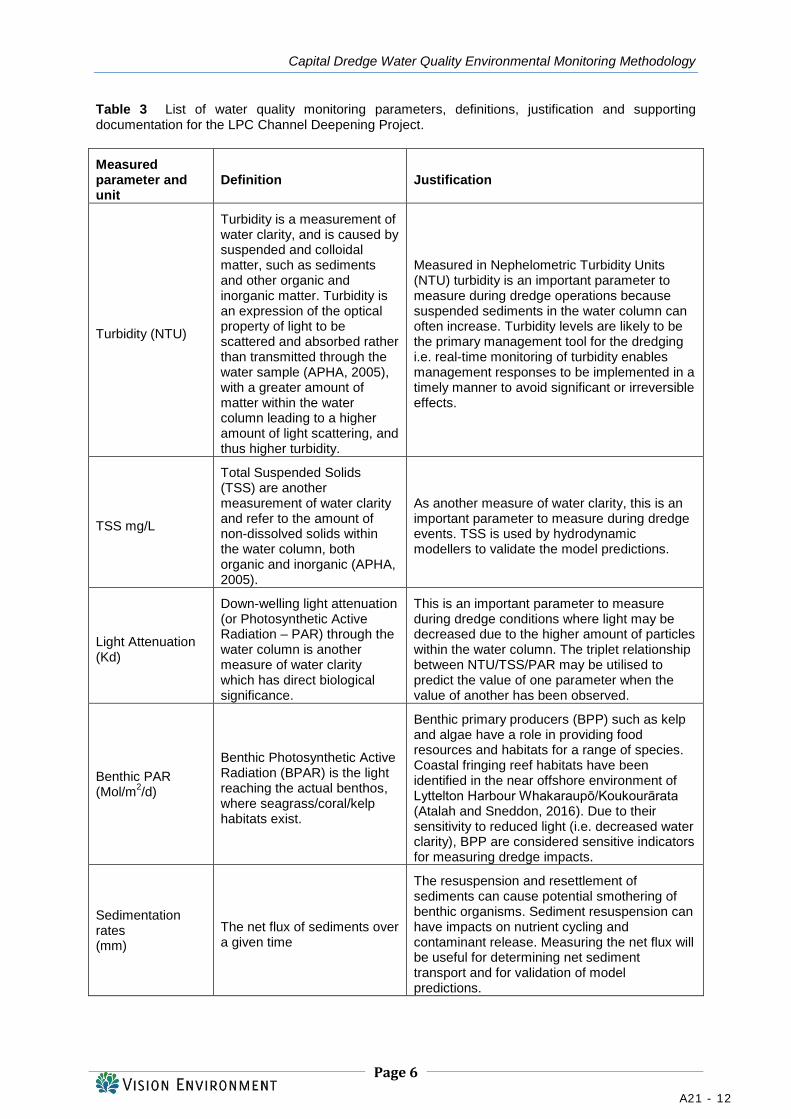
Table 3 List of water quality monitoring parameters, definitions, justification and supporting documentation for the LPC Channel Deepening Project.
Measured parameter and unit
Definition Justification
Turbidity (NTU)
Turbidity is a measurement of water clarity, and is caused by suspended and colloidal matter, such as sediments and other organic and inorganic matter. Turbidity is an expression of the optical property of light to be scattered and absorbed rather than transmitted through the water sample (APHA, 2005), with a greater amount of matter within the water column leading to a higher amount of light scattering, and thus higher turbidity.
Measured in Nephelometric Turbidity Units (NTU) turbidity is an important parameter to measure during dredge operations because suspended sediments in the water column can often increase. Turbidity levels are likely to be the primary management tool for the dredging
i.e. real-time monitoring of turbidity enables management responses to be implemented in a timely manner to avoid significant or irreversible effects.
TSS mg/L
Total Suspended Solids (TSS) are another measurement of water clarity and refer to the amount of non-dissolved solids within the water column, both organic and inorganic (APHA, 2005).
As another measure of water clarity, this is an important parameter to measure during dredge events. TSS is used by hydrodynamic modellers to validate the model predictions.
Light Attenuation (Kd)
Down-welling light attenuation (or Photosynthetic Active Radiation – PAR) through the water column is another measure of water clarity which has direct biological significance.
This is an important parameter to measure during dredge conditions where light may be decreased due to the higher amount of particles within the water column. The triplet relationship between NTU/TSS/PAR may be utilised to predict the value of one parameter when the value of another has been observed.
Benthic PAR (Mol/m
2/d)
Benthic Photosynthetic Active Radiation (BPAR) is the light reaching the actual benthos, where seagrass/coral/kelp habitats exist.
Benthic primary producers (BPP) such as kelp and algae have a role in providing food resources and habitats for a range of species. Coastal fringing reef habitats have been identified in the near offshore environment of Lyttelton Harbour Whakaraupō/Koukourārata (Atalah and Sneddon, 2016). Due to their sensitivity to reduced light (i.e. decreased water clarity), BPP are considered sensitive indicators for measuring dredge impacts.
Sedimentation rates (mm)
The net flux of sediments over a given time
The resuspension and resettlement of sediments can cause potential smothering of benthic organisms. Sediment resuspension can have impacts on nutrient cycling and contaminant release. Measuring the net flux will be useful for determining net sediment transport and for validation of model predictions.
A21 - 12
Capital Dredge Water Quality Environmental Monitoring Methodology
Page 7
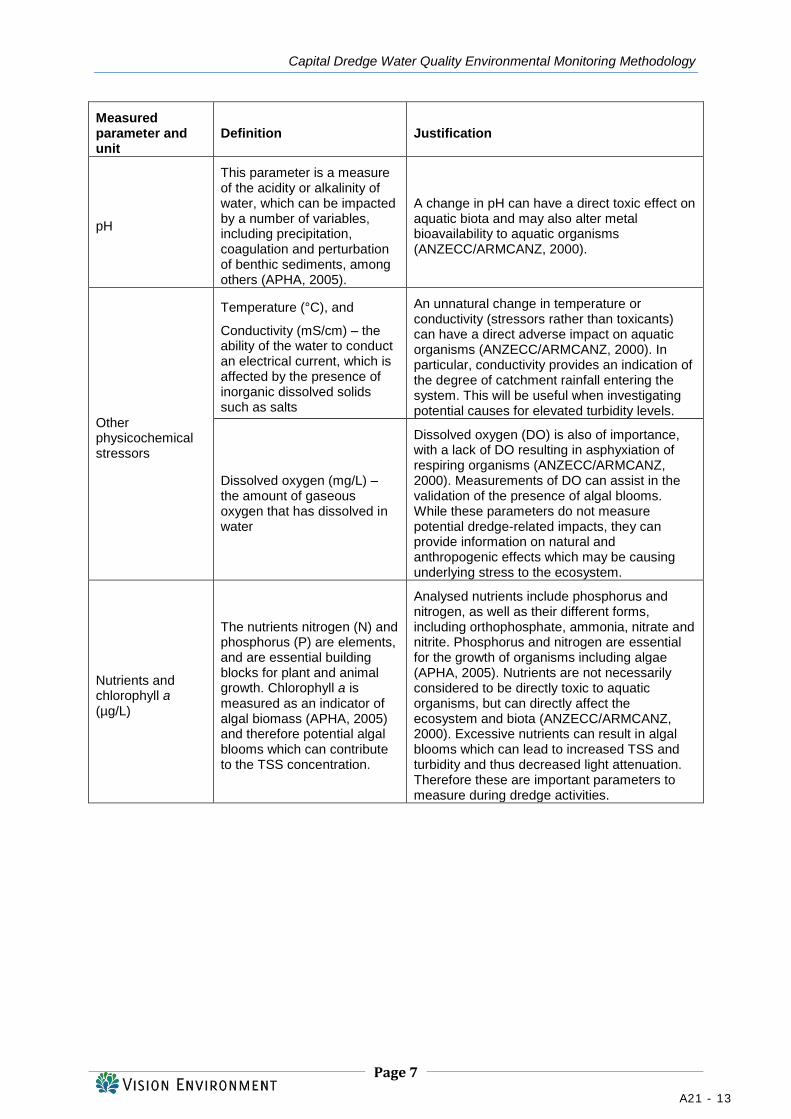
Measured parameter and unit
Definition Justification
pH
This parameter is a measure of the acidity or alkalinity of water, which can be impacted by a number of variables, including precipitation, coagulation and perturbation of benthic sediments, among others (APHA, 2005).
A change in pH can have a direct toxic effect on aquatic biota and may also alter metal bioavailability to aquatic organisms (ANZECC/ARMCANZ, 2000).
Other physicochemical stressors
Temperature (°C), and
Conductivity (mS/cm) – the ability of the water to conduct an electrical current, which is affected by the presence of inorganic dissolved solids such as salts
An unnatural change in temperature or conductivity (stressors rather than toxicants) can have a direct adverse impact on aquatic organisms (ANZECC/ARMCANZ, 2000). In particular, conductivity provides an indication of the degree of catchment rainfall entering the system. This will be useful when investigating potential causes for elevated turbidity levels.
Dissolved oxygen (mg/L) – the amount of gaseous oxygen that has dissolved in water
Dissolved oxygen (DO) is also of importance, with a lack of DO resulting in asphyxiation of respiring organisms (ANZECC/ARMCANZ, 2000). Measurements of DO can assist in the validation of the presence of algal blooms. While these parameters do not measure potential dredge-related impacts, they can provide information on natural and anthropogenic effects which may be causing underlying stress to the ecosystem.
Nutrients and chlorophyll a (µg/L)
The nutrients nitrogen (N) and phosphorus (P) are elements, and are essential building blocks for plant and animal growth. Chlorophyll a is measured as an indicator of algal biomass (APHA, 2005) and therefore potential algal blooms which can contribute to the TSS concentration.
Analysed nutrients include phosphorus and nitrogen, as well as their different forms, including orthophosphate, ammonia, nitrate and nitrite. Phosphorus and nitrogen are essential for the growth of organisms including algae (APHA, 2005). Nutrients are not necessarily considered to be directly toxic to aquatic organisms, but can directly affect the ecosystem and biota (ANZECC/ARMCANZ, 2000). Excessive nutrients can result in algal blooms which can lead to increased TSS and turbidity and thus decreased light attenuation. Therefore these are important parameters to measure during dredge activities.
A21 - 13
Capital Dredge Water Quality Environmental Monitoring Methodology
Page 8
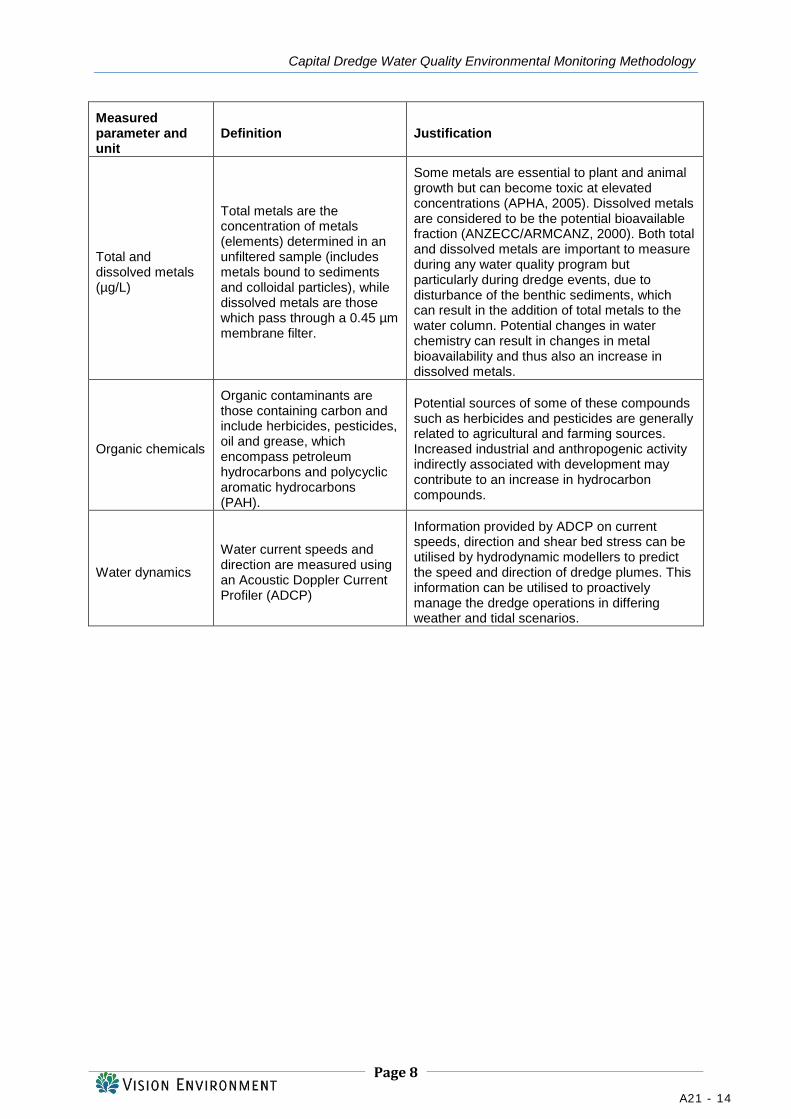
Measured parameter and unit
Definition Justification
Total and dissolved metals (µg/L)
Total metals are the concentration of metals (elements) determined in an unfiltered sample (includes metals bound to sediments and colloidal particles), while dissolved metals are those which pass through a 0.45 µm membrane filter.
Some metals are essential to plant and animal growth but can become toxic at elevated concentrations (APHA, 2005). Dissolved metals are considered to be the potential bioavailable fraction (ANZECC/ARMCANZ, 2000). Both total and dissolved metals are important to measure during any water quality program but particularly during dredge events, due to disturbance of the benthic sediments, which can result in the addition of total metals to the water column. Potential changes in water chemistry can result in changes in metal bioavailability and thus also an increase in dissolved metals.
Organic chemicals
Organic contaminants are those containing carbon and include herbicides, pesticides, oil and grease, which encompass petroleum hydrocarbons and polycyclic aromatic hydrocarbons (PAH).
Potential sources of some of these compounds such as herbicides and pesticides are generally related to agricultural and farming sources. Increased industrial and anthropogenic activity indirectly associated with development may contribute to an increase in hydrocarbon compounds.
Water dynamics
Water current speeds and direction are measured using an Acoustic Doppler Current Profiler (ADCP)
Information provided by ADCP on current speeds, direction and shear bed stress can be utilised by hydrodynamic modellers to predict the speed and direction of dredge plumes. This information can be utilised to proactively manage the dredge operations in differing weather and tidal scenarios.
A21 - 14
Capital Dredge Water Quality Environmental Monitoring Methodology
Page 9
3 METHODOLOGY
All field sampling, equipment calibration and data protocols are outlined in the VE HSEQ
Management System (MS).
3.1 Telemetered Field Instrumentation
3.1.1 Real Time Data Delivery
Real time data provided every 15 minutes by an array of deployed telemetered units is sent
via General Packet Radio Service (GPRS), available through Global System for Mobile
Communication (GSM), i.e. a standard mobile phone network service provider. Data is
pushed to VECloud, a customised database designed for automated data processing. Within
VECloud multiple manual and automated data processes occur e.g.:
Data import or exportation:
Importation and reporting of real time meteorological data;
Data processing including QA/QC, application of data deconfounding protocols and
smoothing techniques;
Calculation of statistical indices and trigger values;
Custom report generation to specified email recipients; and
Automated SMS or email alerts to custom lists in case of trigger value exceedance.
Data is also pushed from VECloud to Visual KPI (Transpara), a custom designed secure
viewing platform, for access by the LPC dredge environmental management team, providing
real time information to assist in managing and mitigating dredge activities. The interactive
site, which can be accessed from a PC or mobile-device, provides a clickable map with a
traffic light alert system for immediate status updates, in addition to accessing individual site
data. Data can then be viewed either in a table or plotted, and/or downloaded in excel.
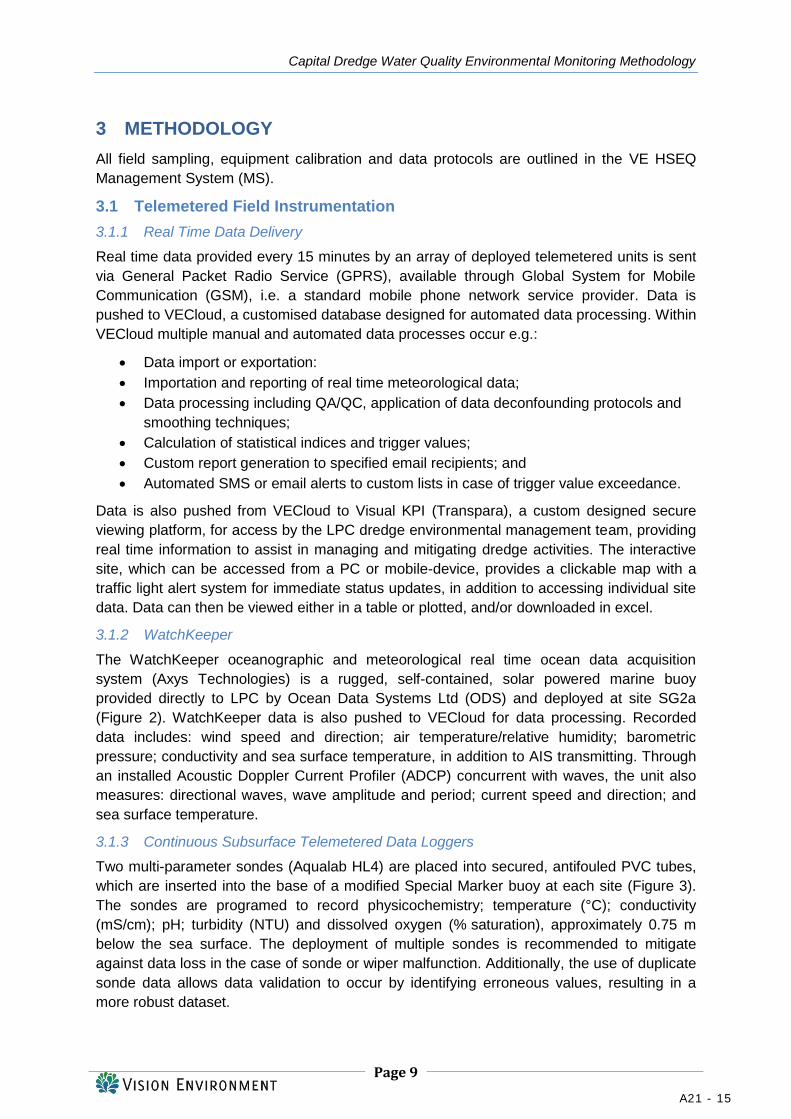
3.1.2 WatchKeeper
The WatchKeeper oceanographic and meteorological real time ocean data acquisition
system (Axys Technologies) is a rugged, self-contained, solar powered marine buoy
provided directly to LPC by Ocean Data Systems Ltd (ODS) and deployed at site SG2a
(Figure 2). WatchKeeper data is also pushed to VECloud for data processing. Recorded
data includes: wind speed and direction; air temperature/relative humidity; barometric
pressure; conductivity and sea surface temperature, in addition to AIS transmitting. Through
an installed Acoustic Doppler Current Profiler (ADCP) concurrent with waves, the unit also
measures: directional waves, wave amplitude and period; current speed and direction; and
sea surface temperature.
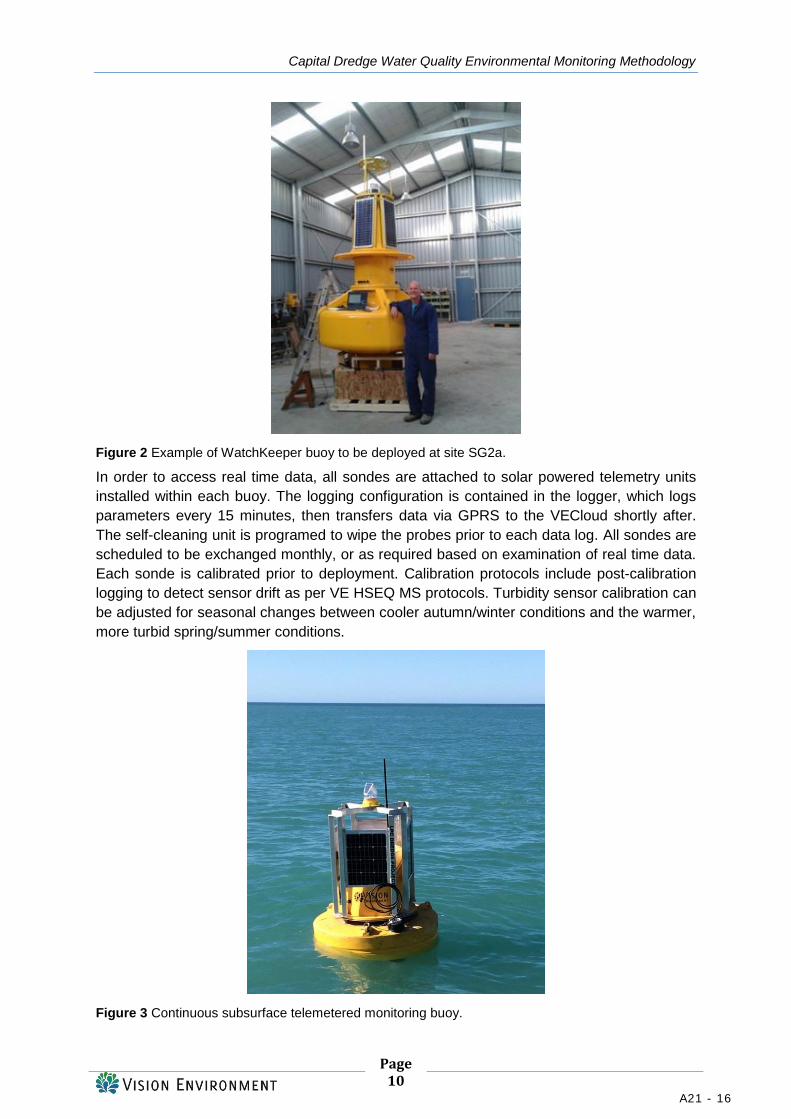
3.1.3 Continuous Subsurface Telemetered Data Loggers
Two multi-parameter sondes (Aqualab HL4) are placed into secured, antifouled PVC tubes,
which are inserted into the base of a modified Special Marker buoy at each site (Figure 3).
The sondes are programed to record physicochemistry; temperature (°C); conductivity
(mS/cm); pH; turbidity (NTU) and dissolved oxygen (% saturation), approximately 0.75 m
below the sea surface. The deployment of multiple sondes is recommended to mitigate
against data loss in the case of sonde or wiper malfunction. Additionally, the use of duplicate
sonde data allows data validation to occur by identifying erroneous values, resulting in a
more robust dataset.
A21 - 15
Capital Dredge Water Quality Environmental Monitoring Methodology
Page 10
Figure 2 Example of WatchKeeper buoy to be deployed at site SG2a.
In order to access real time data, all sondes are attached to solar powered telemetry units
installed within each buoy. The logging configuration is contained in the logger, which logs
parameters every 15 minutes, then transfers data via GPRS to the VECloud shortly after.
The self-cleaning unit is programed to wipe the probes prior to each data log. All sondes are
scheduled to be exchanged monthly, or as required based on examination of real time data.
Each sonde is calibrated prior to deployment. Calibration protocols include post-calibration
logging to detect sensor drift as per VE HSEQ MS protocols. Turbidity sensor calibration can
be adjusted for seasonal changes between cooler autumn/winter conditions and the warmer,
more turbid spring/summer conditions.
Figure 3 Continuous subsurface telemetered monitoring buoy.
A21 - 16
Capital Dredge Water Quality Environmental Monitoring Methodology
Page 11
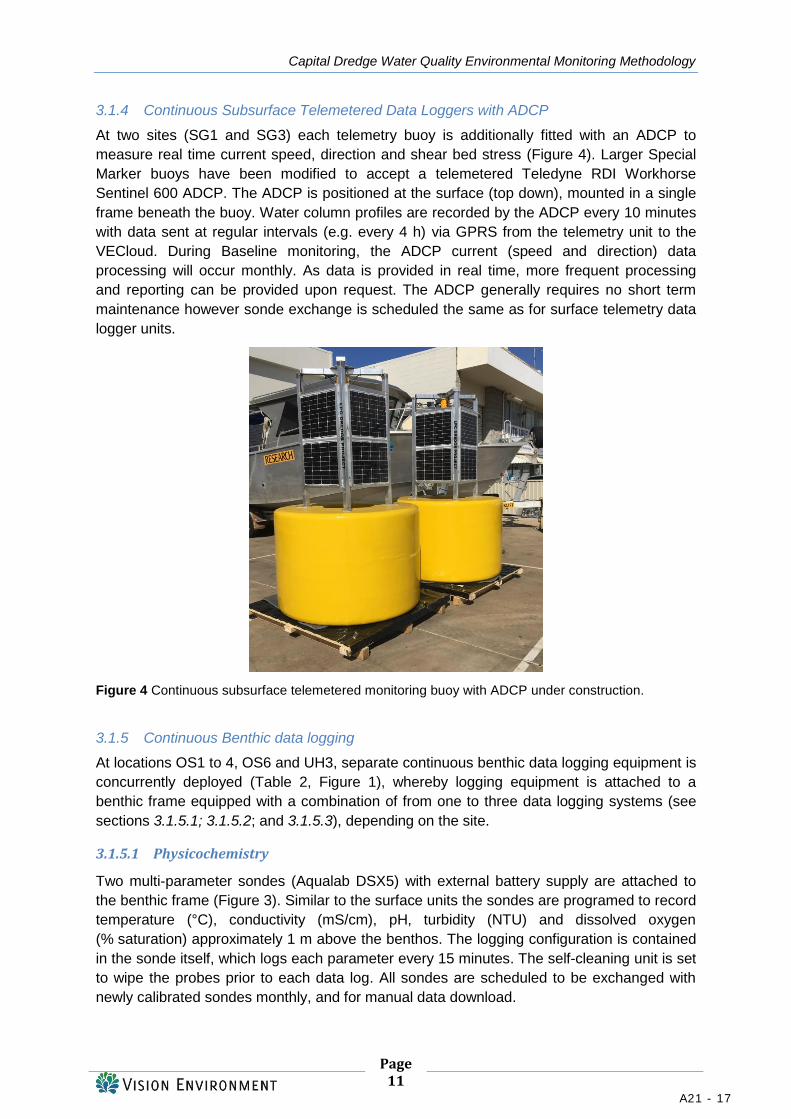
3.1.4 Continuous Subsurface Telemetered Data Loggers with ADCP
At two sites (SG1 and SG3) each telemetry buoy is additionally fitted with an ADCP to
measure real time current speed, direction and shear bed stress (Figure 4). Larger Special
Marker buoys have been modified to accept a telemetered Teledyne RDI Workhorse
Sentinel 600 ADCP. The ADCP is positioned at the surface (top down), mounted in a single
frame beneath the buoy. Water column profiles are recorded by the ADCP every 10 minutes
with data sent at regular intervals (e.g. every 4 h) via GPRS from the telemetry unit to the
VECloud. During Baseline monitoring, the ADCP current (speed and direction) data
processing will occur monthly. As data is provided in real time, more frequent processing
and reporting can be provided upon request. The ADCP generally requires no short term
maintenance however sonde exchange is scheduled the same as for surface telemetry data
logger units.
Figure 4 Continuous subsurface telemetered monitoring buoy with ADCP under construction.
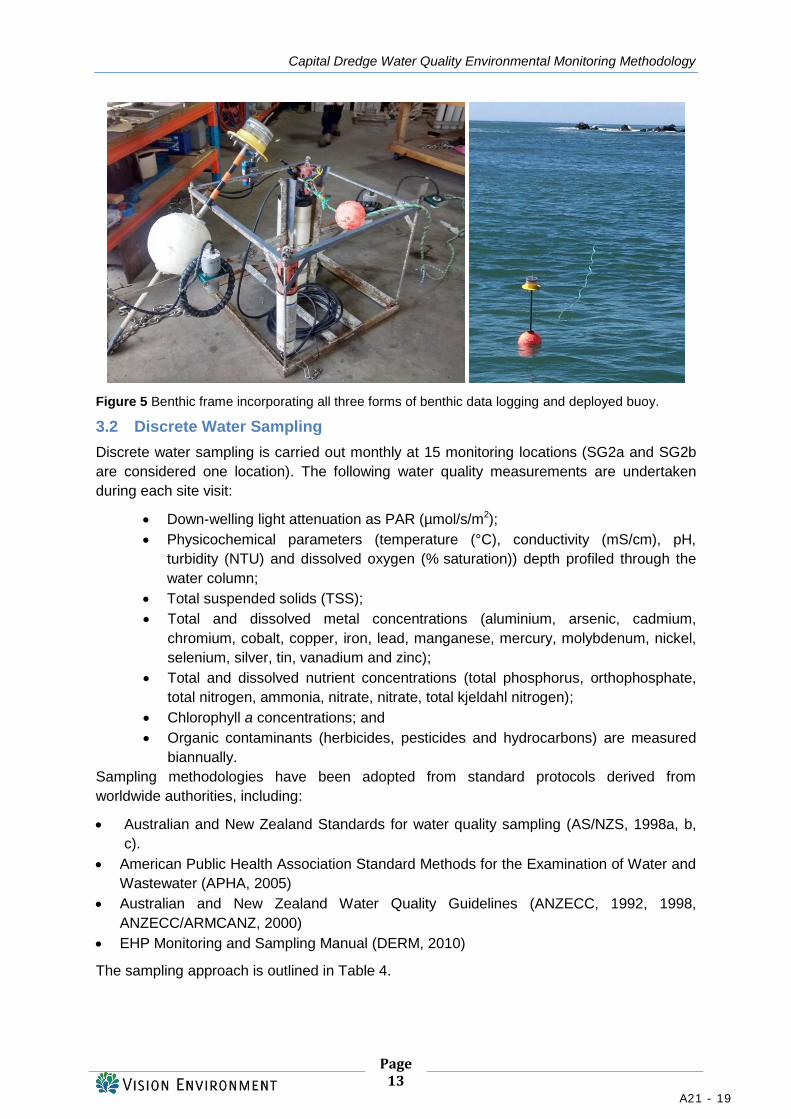
3.1.5 Continuous Benthic data logging
At locations OS1 to 4, OS6 and UH3, separate continuous benthic data logging equipment is
concurrently deployed (Table 2, Figure 1), whereby logging equipment is attached to a
benthic frame equipped with a combination of from one to three data logging systems (see
sections 3.1.5.1; 3.1.5.2; and 3.1.5.3), depending on the site.
3.1.5.1 Physicochemistry
Two multi-parameter sondes (Aqualab DSX5) with external battery supply are attached to
the benthic frame (Figure 3). Similar to the surface units the sondes are programed to record
temperature (°C), conductivity (mS/cm), pH, turbidity (NTU) and dissolved oxygen
(% saturation) approximately 1 m above the benthos. The logging configuration is contained
in the sonde itself, which logs each parameter every 15 minutes. The self-cleaning unit is set
to wipe the probes prior to each data log. All sondes are scheduled to be exchanged with
newly calibrated sondes monthly, and for manual data download.
A21 - 17
Capital Dredge Water Quality Environmental Monitoring Methodology
Page 12
3.1.5.2 Benthic Photosynthetic Active Radiation (BPAR)
Photosynthetically Active Radiation (PAR) or light measured at the benthos (BPAR) is
measured using PAR loggers. The Odyssey submersible photosynthetic irradiance
autonomous recording system provides high resolution data in the required wavelength
range of 400 to 700 nm. Duplicate Odyssey loggers are placed on the benthic frame
alongside the sondes (Figure 5) and programed to record at 15 minute intervals. A single
self-cleaning wiper (Hydro-Wiper) is programed to clean both sensors at regular intervals to
prevent fouling.
In order to record daily ambient changes in total available PAR, duplicate telemetered LiCor
loggers are operating at Vision Base (Christchurch). Solar powered dual LI-COR LI192SA
Underwater Quantum Sensors log the mean ambient PAR every 15 minutes (averaged from
1 min readings), with data transferred via GPRS to the VECloud every 30 minutes. The
inclusion of the Vision Base data allows for variation in daily ambient PAR (e.g. due to cloud
cover) to be accounted for, thus aiding in the interpretation of benthic PAR levels and acting
as a ‘control’ PAR. While small scale daily weather patterns such as scattered cloud would
not be consistent throughout the harbour, substantial overall daily changes are recorded and
significant reductions in PAR can be accounted for in this manner.
3.1.5.3 Sedimentation rates
The Altus altimeter (NKE Instrumentation) is an autonomous instrument that obtains very
high precision bed level measurements (millimetre scale) every 15 minutes using a high
frequency acoustic sensor and an inbuilt data logging device. Distance to seabed data is
recorded on four separate channels, each with unique detection threshold settings (11%,
23%, 39% and 70%). Threshold 1 (11%) is considered most useful in measurement of a
non-homogenous medium such as that likely to be found in Lyttelton Harbour/Whakaraupō
(mix of silt, sand and gravel sediment fractions). Additional channels measure depth using
an inbuilt pressure sensor to aid in data interpretation, and max echo to aid in data
validation. Thus sedimentation rates can be measured over time.
There are two forms of information provided by the altimeters:
Instantaneous bed level change indicating the amount of sediment flux occurring at a set
point in time; and
Net cumulative change in bed level over a given period.
Continuous bed level measurements are obtained using duplicate acoustic altimeters
mounted on the benthic frame, designed to minimise turbulence (Figure 5). Altimeters are
mounted on gimbals to ensure they are level at approximately 300 to 500 mm above the
benthos. Units are retrieved monthly by vessel capstan and exchanged with replacement
units for redeployment. Retrieved units are then downloaded and prepared for subsequent
deployment, or exchanged.
A21 - 18
Capital Dredge Water Quality Environmental Monitoring Methodology
Page 13
Figure 5 Benthic frame incorporating all three forms of benthic data logging and deployed buoy.
3.2 Discrete Water Sampling
Discrete water sampling is carried out monthly at 15 monitoring locations (SG2a and SG2b
are considered one location). The following water quality measurements are undertaken
during each site visit:
Down-welling light attenuation as PAR (µmol/s/m2);
Physicochemical parameters (temperature (°C), conductivity (mS/cm), pH,
turbidity (NTU) and dissolved oxygen (% saturation)) depth profiled through the
water column;
Total suspended solids (TSS);
Total and dissolved metal concentrations (aluminium, arsenic, cadmium,
chromium, cobalt, copper, iron, lead, manganese, mercury, molybdenum, nickel,
selenium, silver, tin, vanadium and zinc);
Total and dissolved nutrient concentrations (total phosphorus, orthophosphate,
total nitrogen, ammonia, nitrate, nitrate, total kjeldahl nitrogen);
Chlorophyll a concentrations; and
Organic contaminants (herbicides, pesticides and hydrocarbons) are measured
biannually.
Sampling methodologies have been adopted from standard protocols derived from
worldwide authorities, including:
Australian and New Zealand Standards for water quality sampling (AS/NZS, 1998a, b,
c).
American Public Health Association Standard Methods for the Examination of Water and
Wastewater (APHA, 2005)
Australian and New Zealand Water Quality Guidelines (ANZECC, 1992, 1998,
ANZECC/ARMCANZ, 2000)
EHP Monitoring and Sampling Manual (DERM, 2010)
The sampling approach is outlined in Table 4.
A21 - 19
Capital Dredge Water Quality Environmental Monitoring Methodology
Page 14
Table 4 Summary of discrete grab sampling approach at 15 locations.
Sites Depth profiling
Sub-surface metals & nutrients
Sub-surface organics
Sub-surface TSS
Mid-column & benthic TSS
SG1 SG2 SG3 OS1 OS2 OS3 OS4 OS5 OS6 OS7
Monthly Monthly Biannually Monthly Monthly
CH1 CH2 UH1 UH2 UH3
Monthly Monthly Biannually Monthly -
Due to the requirement to validate the water column profile early in the project, the frequency
of depth profiling and TSS sampling at each site was increased in the first month to 14
occasions in total.
3.2.1 Depth profiling
3.2.1.1 Photosynthetic Active Radiation or Light Attenuation
Down-welling Photosynthetic Active Radiation (PAR) (µmol/s/m2) is measured for a depth
profile at 0.5 to 1.0 m depth intervals using a LI-COR LI192SA Underwater Quantum Sensor
in a lowering frame and a LI-1500 Quantum Radiometer Photometer until light is <10
µmol/s/m2 or at least five readings have been recorded (Figure 6). The vertical light
attenuation coefficient (Kd) is calculated in order to compare light attenuation (the rate at
which light diminishes), through the water column at different sites and on different sampling
occasions.
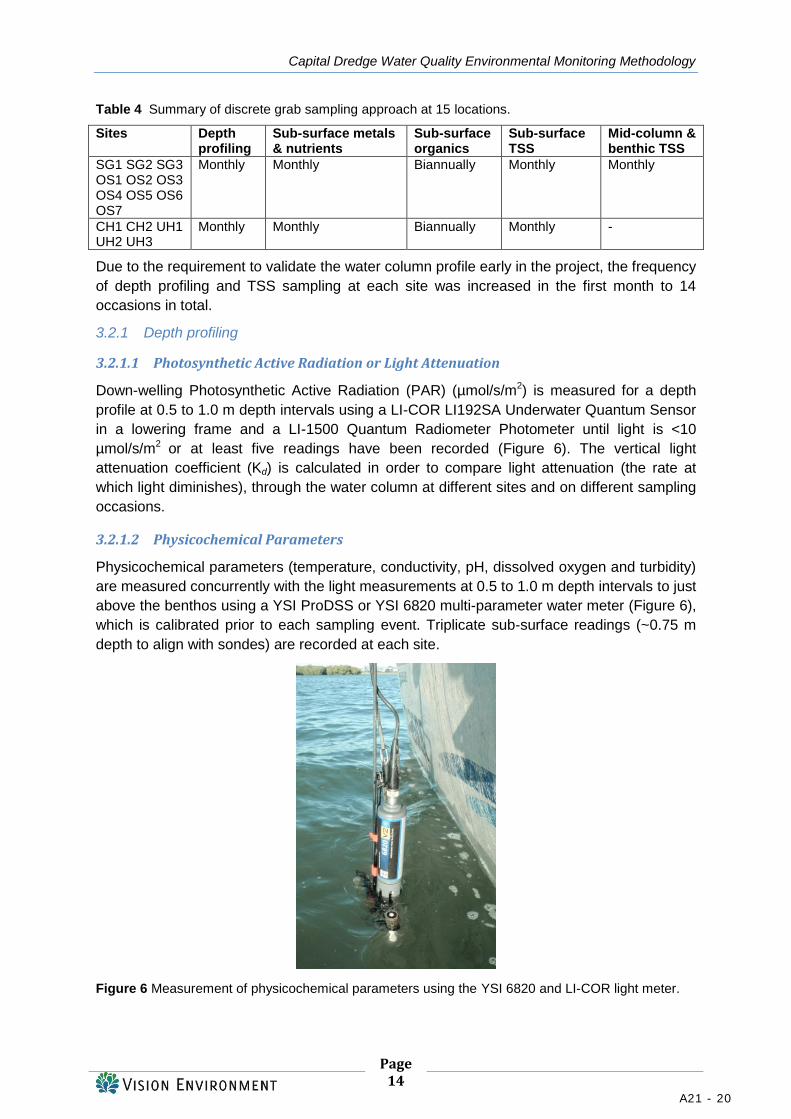
3.2.1.2 Physicochemical Parameters
Physicochemical parameters (temperature, conductivity, pH, dissolved oxygen and turbidity)
are measured concurrently with the light measurements at 0.5 to 1.0 m depth intervals to just
above the benthos using a YSI ProDSS or YSI 6820 multi-parameter water meter (Figure 6),
which is calibrated prior to each sampling event. Triplicate sub-surface readings (~0.75 m
depth to align with sondes) are recorded at each site.
Figure 6 Measurement of physicochemical parameters using the YSI 6820 and LI-COR light meter.
A21 - 20
Capital Dredge Water Quality Environmental Monitoring Methodology
Page 15
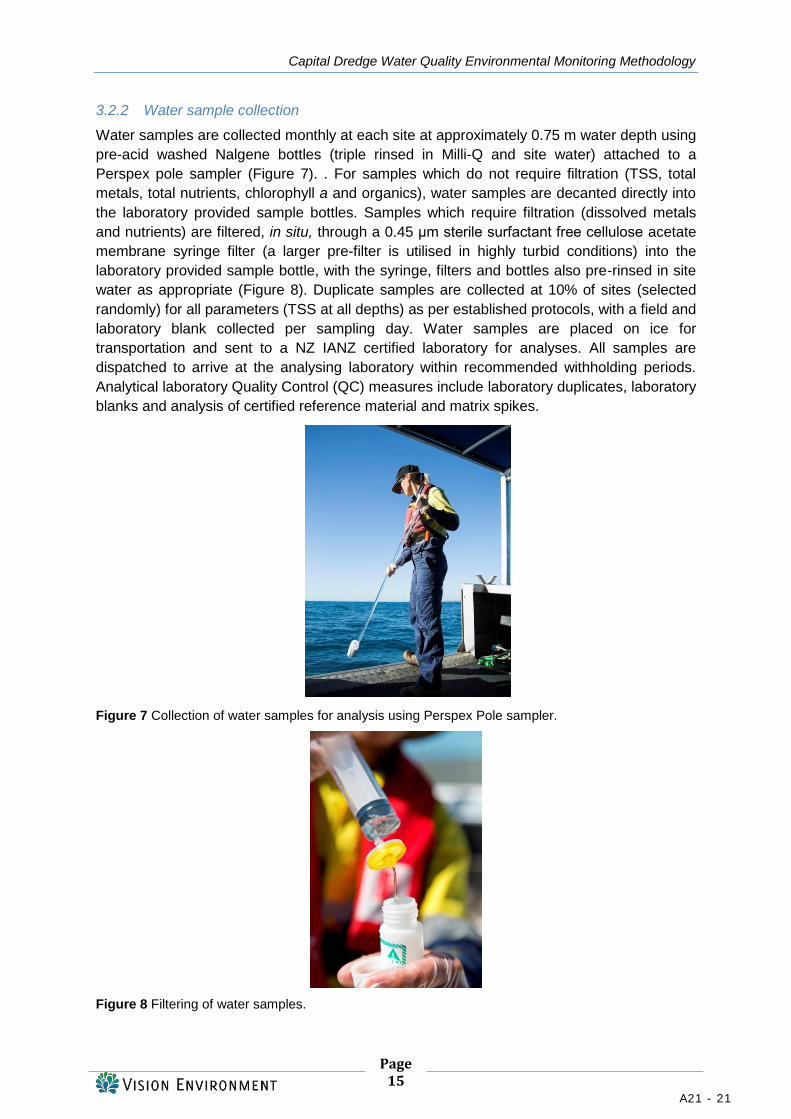
3.2.2 Water sample collection
Water samples are collected monthly at each site at approximately 0.75 m water depth using
pre-acid washed Nalgene bottles (triple rinsed in Milli-Q and site water) attached to a
Perspex pole sampler (Figure 7). . For samples which do not require filtration (TSS, total
metals, total nutrients, chlorophyll a and organics), water samples are decanted directly into
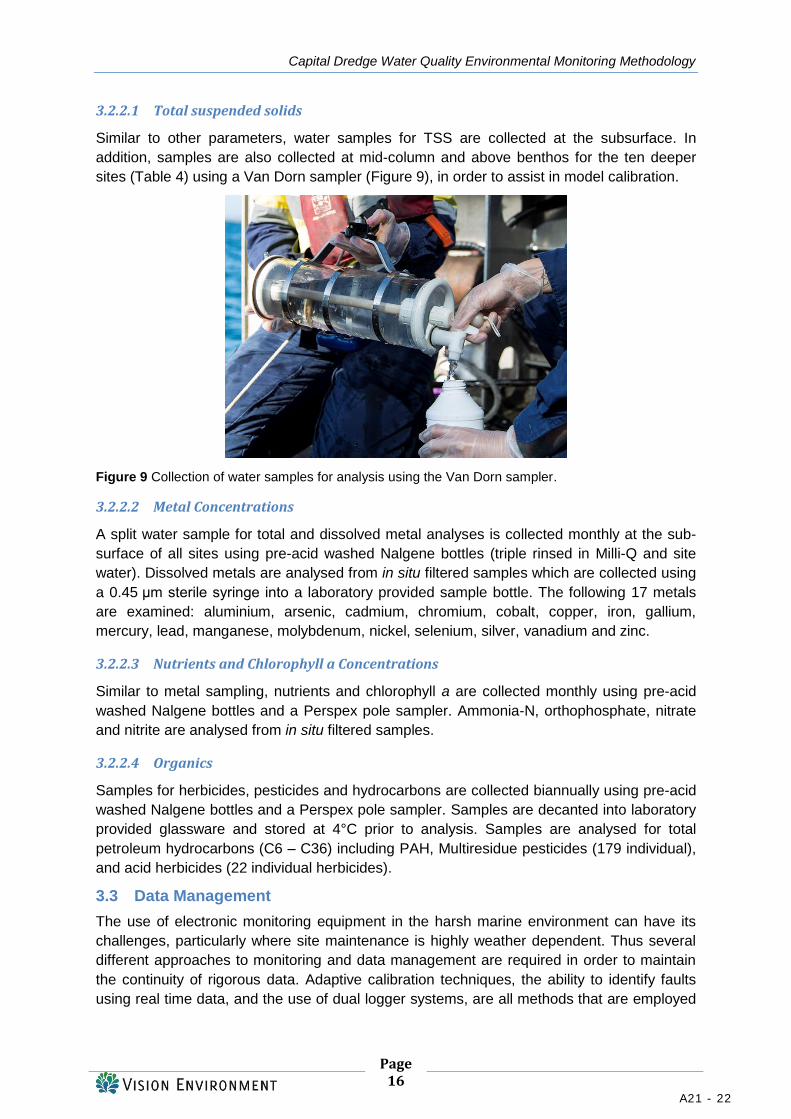
the laboratory provided sample bottles. Samples which require filtration (dissolved metals
and nutrients) are filtered, in situ, through a 0.45 μm sterile surfactant free cellulose acetate
membrane syringe filter (a larger pre-filter is utilised in highly turbid conditions) into the
laboratory provided sample bottle, with the syringe, filters and bottles also pre-rinsed in site
water as appropriate (Figure 8). Duplicate samples are collected at 10% of sites (selected
randomly) for all parameters (TSS at all depths) as per established protocols, with a field and
laboratory blank collected per sampling day. Water samples are placed on ice for
transportation and sent to a NZ IANZ certified laboratory for analyses. All samples are
dispatched to arrive at the analysing laboratory within recommended withholding periods.
Analytical laboratory Quality Control (QC) measures include laboratory duplicates, laboratory
blanks and analysis of certified reference material and matrix spikes.
Figure 7 Collection of water samples for analysis using Perspex Pole sampler.
Figure 8 Filtering of water samples.
A21 - 21
Capital Dredge Water Quality Environmental Monitoring Methodology
Page 16
3.2.2.1 Total suspended solids
Similar to other parameters, water samples for TSS are collected at the subsurface. In
addition, samples are also collected at mid-column and above benthos for the ten deeper
sites (Table 4) using a Van Dorn sampler (Figure 9), in order to assist in model calibration.
Figure 9 Collection of water samples for analysis using the Van Dorn sampler.
3.2.2.2 Metal Concentrations
A split water sample for total and dissolved metal analyses is collected monthly at the sub-
surface of all sites using pre-acid washed Nalgene bottles (triple rinsed in Milli-Q and site
water). Dissolved metals are analysed from in situ filtered samples which are collected using
a 0.45 μm sterile syringe into a laboratory provided sample bottle. The following 17 metals
are examined: aluminium, arsenic, cadmium, chromium, cobalt, copper, iron, gallium,
mercury, lead, manganese, molybdenum, nickel, selenium, silver, vanadium and zinc.
3.2.2.3 Nutrients and Chlorophyll a Concentrations
Similar to metal sampling, nutrients and chlorophyll a are collected monthly using pre-acid
washed Nalgene bottles and a Perspex pole sampler. Ammonia-N, orthophosphate, nitrate
and nitrite are analysed from in situ filtered samples.
3.2.2.4 Organics
Samples for herbicides, pesticides and hydrocarbons are collected biannually using pre-acid
washed Nalgene bottles and a Perspex pole sampler. Samples are decanted into laboratory
provided glassware and stored at 4°C prior to analysis. Samples are analysed for total
petroleum hydrocarbons (C6 – C36) including PAH, Multiresidue pesticides (179 individual),
and acid herbicides (22 individual herbicides).
3.3 Data Management
The use of electronic monitoring equipment in the harsh marine environment can have its
challenges, particularly where site maintenance is highly weather dependent. Thus several
different approaches to monitoring and data management are required in order to maintain
the continuity of rigorous data. Adaptive calibration techniques, the ability to identify faults
using real time data, and the use of dual logger systems, are all methods that are employed
A21 - 22
Capital Dredge Water Quality Environmental Monitoring Methodology
Page 17
during the Baseline water quality monitoring period to ensure an extensive and consistent
dataset is collected. If one of the loggers record erroneous readings, the data obtained from
this logger is removed from the analyses, and only data from the functioning logger is used
until the faulty logger is exchanged or the problem is resolved.
Management of logged water quality data is undertaken as per VE HSEQ MS protocols,
developed and peer reviewed during the three year Western Basin Dredge and Disposal
Project, and Narrows Crossing project (Vision Environment, 2013).
3.3.1 Continuous Data Loggers
All physicochemical data is uploaded to VECloud either automatically for real time data or
manually for autonomous data. A Self-Monitoring Algorithm in Real Time (SMART) was
developed by VE as an initial automatic data deconfounding process in order to filter out
erroneous raw real time data from multiple instruments and provide a more accurate and
instantly usable data set. Following automated deconfounding, SMART data is manually
validated and reissued by VE personnel for final reporting after having undergone VE Quality
Assurance/Quality Control (QA/QC) review. In most cases, the SMART data does not need
altering. However, there are some instances where data is incorrectly removed from the
utilised dataset, in which case it is re-entered into the dataset. Parameter statistics are
reported using the validated mean data from duplicate sondes. Subsequently, smoothing
techniques to reduce noise in the data (such as moving averages) can then be applied to
SMART mean site values.
Erroneous data can be identified, for example, if the difference between duplicate loggers is
consistently above (>50% of the time) the designated values as described using the
following procedures according to VE HSEQ MS protocols:
Turbidity
- Continually increasing turbidity values (suggesting fouling);
- Large drop or increase in turbidity on subsequent logger exchange;
- Continuous zeros recorded indicating probe malfunction. Note that continuous zero
readings are often recorded in clear waters, as the low turbidity at some sites is often
at the lower limit of instrument capability. Data is compared to other loggers, other
sites and weather conditions to confirm this reading; and
- Intermittent, erratic values, either markedly higher or lower than the majority of values
recorded at that time and inconsistent with previous trends.
pH
- pH values outside the typical lower estuarine and marine conditions (7.3 to 8.4),
unless both loggers were showing pH outside this range, indicating a valid result; and
- Where a logger has a conductivity result of zero (e.g. logger having been removed
from the water during logger exchange), SMART will automatically move the pH data
from the dataset.
Conductivity
- Conductivity values outside the typical lower estuarine and marine conditions (50 to
58mS/cm), unless both loggers were showing conductivity outside this range,
indicating a valid result (e.g. during a rain event) are moved by SMART; and
- If the difference between two of the loggers is 5mS/cm or greater, the value closest
to 55mS/cm is kept, and the alternate values moved by SMART and identified as
erroneous. However, this is manually checked and confirmed by VE personnel. Note
that the 5mS/cm difference is based on ± 5% difference between readings, which is
A21 - 23
Capital Dredge Water Quality Environmental Monitoring Methodology
Page 18
slightly higher than the Hydrolab DS5X or HL4 sensor accuracy, which is reported at
0.5 to 1%.
Dissolved oxygen
- Oxygen values outside the typical lower estuarine and marine conditions (70 to
120%), unless both loggers are showing DO outside this range, indicating a valid
result;
- If the difference between two of the loggers is 5% or greater, the value closest to
100% saturation is kept, and the alternate values are moved by SMART and
identified as erroneous. However, this is manually checked and confirmed by VE
personnel. Note that the 5% difference is slightly higher than the Hydrolab DS5X or
HL4 sensor accuracy, which is reported at 1 to 1.25% at concentrations < 8mg/L (or
100% saturation at 25ºC); and
- Where a logger has a conductivity result of zero (e.g. logger has been removed from
the water during logger exchange), SMART automatically moves the DO data from
the dataset.
Temperature
- Where a logger has a temperature result of zero (e.g. logger has been removed from
the water during logger exchange), SMART automatically moves the temperature
data from the dataset.
Note that a Lyttelton harbour specific SMART, cannot be developed until ambient conditions
within the harbour have been established, which will occur during several months of baseline
data collection. Data will be processed manually until a sufficient dataset has been gained to
establish natural variability allowing the development and application of an automated
algorithm.
3.3.2 Continuous BPAR
PAR values from each Odyssey logger during the non-daylight period (according to sunrise
and sunset times reported by MetService New Zealand), are zeroed. Subsequent
calculations are based on the mean PAR recorded from both Odyssey loggers. The mean
Odyssey readings (average of 15 individual µmol/m2/second readings over a 15 minute
period) are multiplied by 60 to gain µmol/m2/minute readings. These values are then
summed to calculate total daily PAR (TDP) (mol/m²/day).
Erroneously high Odyssey values are flagged when they exceed 3,000 µmol, and
may be moved depending on the values recorded by the second Odyssey;
When the data from the two Odysseys is greater than 20%, data from both Odysseys
is flagged and examined. If the difference between the Odysseys remains above
20% for a number of hours, or values are inconsistent with other PAR sites, the data
is considered erroneous and is removed. A value of 20% has been assigned
assuming that a variance of ±10% is acceptable between Odysseys; and
When daily totals for each site are inconsistent with other neighbouring sites and with
previous trends, data is further investigated to determine if this is due to telemetry
unit error or other extraneous factors.
3.3.3 Continuous Altimeter
Management of altimeter data is undertaken as per VE HSEQ MS protocols. Altitude data is
produced every 15 minutes from threshold outputs. When insufficient echo is received back
A21 - 24
Capital Dredge Water Quality Environmental Monitoring Methodology
Page 19
from the seafloor to produce a valid altitude reading, negative readings are logged. These
readings are removed prior to further examination of the data.
Altitude data provides sediment flux dynamics and is used to analyse surficial sediment
deposition and erosion. Cumulative bed level change (change from original ‘baseline’
reading) is calculated every 15 minutes, in order to gain long-term sediment erosion or
deposition patterns.
Erroneous data is removed from the dataset using the following identifiers:
Instantaneous sediment change > 50 mm in 15 minutes;
Rapid cumulative change beyond an acceptable level expected to be triggered by
environmental factors; and
Problems with the deployed unit observed upon altimeter retrieval and download (e.g.
stake bent, fallen over, rope entanglement). The date upon which this occurred could
usually be identified in the dataset using the points above.
When interference with marine organisms occurs, the period of erroneous data removal is
often small, with data returning to expected levels within a short period. Longer term
interferences, such as deployment unit problems, generally result in the data being removed
for the remaining deployment period. The use of duplicate altimeters assists in validating
data. The protocol for duplicate altimeter data validation is currently being developed.
A21 - 25
Capital Dredge Water Quality Environmental Monitoring Methodology
Page 20
4 REFERENCES
ANZECC. 1992. Australian water quality guidelines for fresh and marine waters. Australian and New Zealand Environment and Conservation Council, Canberra.
ANZECC. 1998. Interim ocean disposal guidelines. Australian and New Zealand Environment and Conservation Council, Canberra.
ANZECC/ARMCANZ. 2000. National Water Quality Management Strategy: Australian Guidelines for Water Quality Monitoring and Reporting. Australia and New Zealand Environment and Conservation Council & Agriculture and Resource Management Council of Australia and New Zealand.
APHA. 2005. Standard Methods for the Examination of Water and Wastewater. 21st edition. Port City Press, Baltimore, Maryland.
AS/NZS. 1998a. 5667.1:1998 Water Quality - Sampling. Part 1: Guidance on the design of sampling programs, sampling techniques and the preservation and handling of samples. Joint Standards Australia/Standards New Zealand.
AS/NZS. 1998b. 5667.4:1998 Water Quality - Sampling. Part 4: Guidance on sampling from lakes, natural and man-made. Joint Standards Australia/Standards New Zealand.
AS/NZS. 1998c. 5667.6:1998 Water Quality - Sampling. Part 6: Guidance on sampling of rivers and streams. Joint Standards Australia/Standards New Zealand.
Atalah, J. and R. Sneddon. 2016. Lyttelton Harbour and Banks Peninsula shoreline reef ecology: Field survey data report (February 2016). Cawthron Institute, Nelson, New Zealand.
DERM. 2010. Monitoring and sampling manual 2009, Version 2 September 2010. Water and Corporate Services Division, Department of Environment and Resource Management.
MetOcean. 2016a. Lyttelton Port Company Channel Deepening Project – Simulations of Dredge Plumes from Dredging Activities in the Channel. MetOcean Solutions Ltd, New Plymouth, New Zealand.
MetOcean. 2016b. Lyttelton Port Company Channel Deepening Project – Simulations of suspended sediment plumes generated from the deposition of spoil at the offshore capital disposal site. MetOcean Solutions Ltd, New Plymouth, New Zealand.
Tonkin & Taylor. 2016. LPC Channel Deepening Environmental Monitoring and Management Plan. Christchurch, New Zealand.
Vision Environment. 2013. WBDDP Water Quality Monitoring - September 2013., Gladstone, Australia.
A21 - 26