Embed Size (px)
Citation preview

THE HEART-ECG
1
2.2 The Heart- ECG
Room 23-H-24 (entrance H25)
Table of Contents 1. INTRODUCTION .............................................................................. 3
1.1. COURSE AIMS: .............................................................................. 4
2. ECHOCARDIOGRAM (DEMONSTRATION) .................................... 5
2.1. INTRODUCTION .............................................................................. 5
2.2. AIMS ............................................................................................ 5 The Cardiac Cycle (Timing Diagram) .................................................................. 6
3. AUSCULTATION OF HEART SOUNDS AND PHONOCARDIOGRAM .......................................................................... 7
3.1. INTRODUCTION .............................................................................. 7
3.2. AIMS ............................................................................................ 8
3.3. METHOD ....................................................................................... 8 Auscultation ......................................................................................................... 8
Results and Interpretation ................................................................................... 8
4. ELECTROCARDIOGRAM (ECG) ..................................................... 9
4.1. INTRODUCTION .............................................................................. 9 Schematic account of the depolarization and repolarization of the heart with the
correlating ECG ................................................................................................... 9
ECG................................................................................................................... 10

THE HEART-ECG
2
ECG electrode positions and ECG measurements ........................................... 10
What are the deflections (peaks and curves) seen on an ECG readout? .......... 11
Determining the mean electric axis of the heart ................................................ 12
Conclusions ....................................................................................................... 13
4.2. AIMS .......................................................................................... 13
4.3. METHOD ..................................................................................... 13 Standard ECG ................................................................................................... 14
Respiratory sinus arrhythmia ............................................................................. 14
Results and Interpretations/ calculations ........................................................... 15
5. GLOSSARY .................................................................................... 17

THE HEART-ECG
3
1. Introduction The heart is a dual pump made up of two functionally sequential and anatomically
parallel pumps. An interruption of about 10 seconds in the circulation of blood to
the brain can lead to loss of consciousness. A break of more than a few minutes
can lead to irreversible brain damage. Hence it is of vital importance that the heart
functions stably and continuously.
In this course you will have the opportunity to examine and carry out important
noninvasive methods used to examine heart function and to assess their rele-
vance.
How well a particular heart is functioning is first examined by careful study of the
patients’ case history, physical inspection of the patient, palpation, and ausculta-
tion. If abnormal heart sounds, heart murmurs, or arrhythmias are detected during
auscultation, this may indicate a congenital or acquired functional and/or morpho-
logical defect (i.e. defective valve or other heart problems).
The ECG registers differences in electrical currents on the body’s surface. These
differences generated by the depolarization and repolarization of the heart spread
to surrounding tissues and to the body’s surface. The ECG provides details about
heart rhythm and allows investigation of the spread of cardiac excitation. ECGs
are also used to judge myocardial ischemias and heart attacks.
Echocardiography (ultrasound for the heart) is used to examine the mechanics of
the heart (valve movement, chamber volumes) with a high resolution in space
and time. At the same time a Doppler can be employed to measure the direction
and speed with which the blood is traveling through the heart.
The more invasive ways in which the heart can be examined (i.e. catheters) will
not be discussed in this course. However, catheters are used to determining in-
tracardial pressure and blood flow, visualizing the coronary arteries, and for in-
tracardial ECGs.
THE HEART-ECG
4
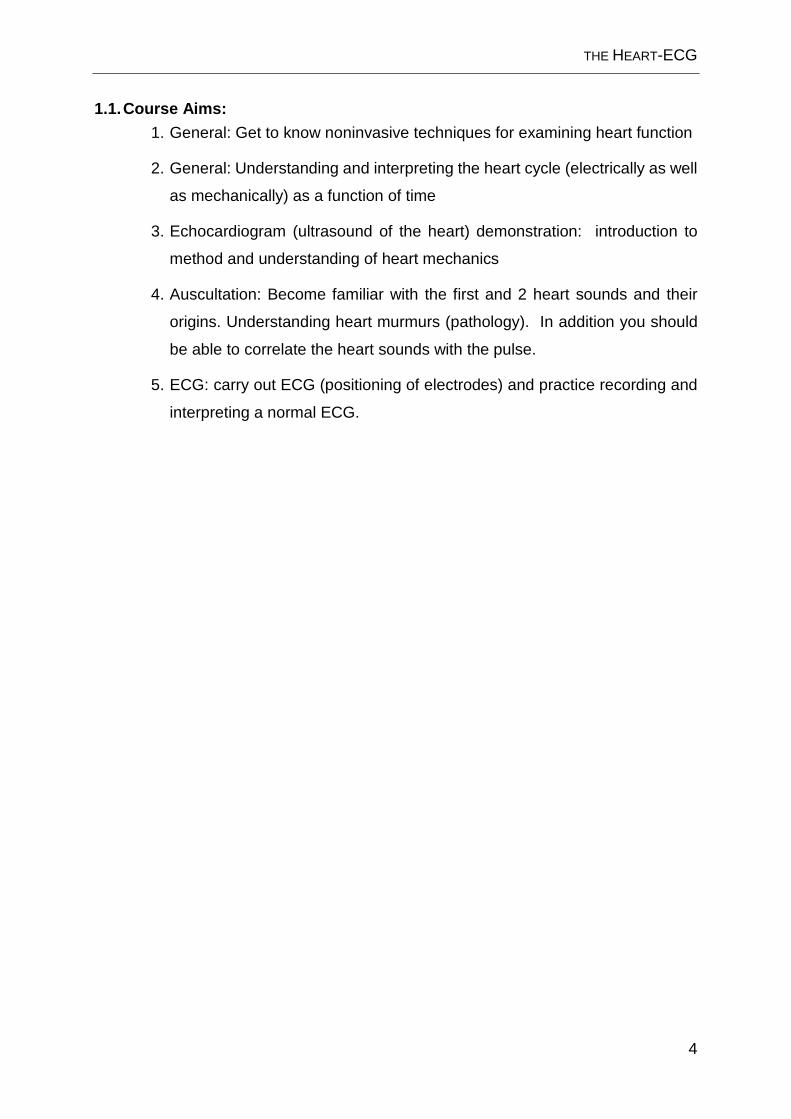
1.1. Course Aims: 1. General: Get to know noninvasive techniques for examining heart function
2. General: Understanding and interpreting the heart cycle (electrically as well
as mechanically) as a function of time
3. Echocardiogram (ultrasound of the heart) demonstration: introduction to
method and understanding of heart mechanics
4. Auscultation: Become familiar with the first and 2 heart sounds and their
origins. Understanding heart murmurs (pathology). In addition you should
be able to correlate the heart sounds with the pulse.
5. ECG: carry out ECG (positioning of electrodes) and practice recording and
interpreting a normal ECG.
THE HEART-ECG
5
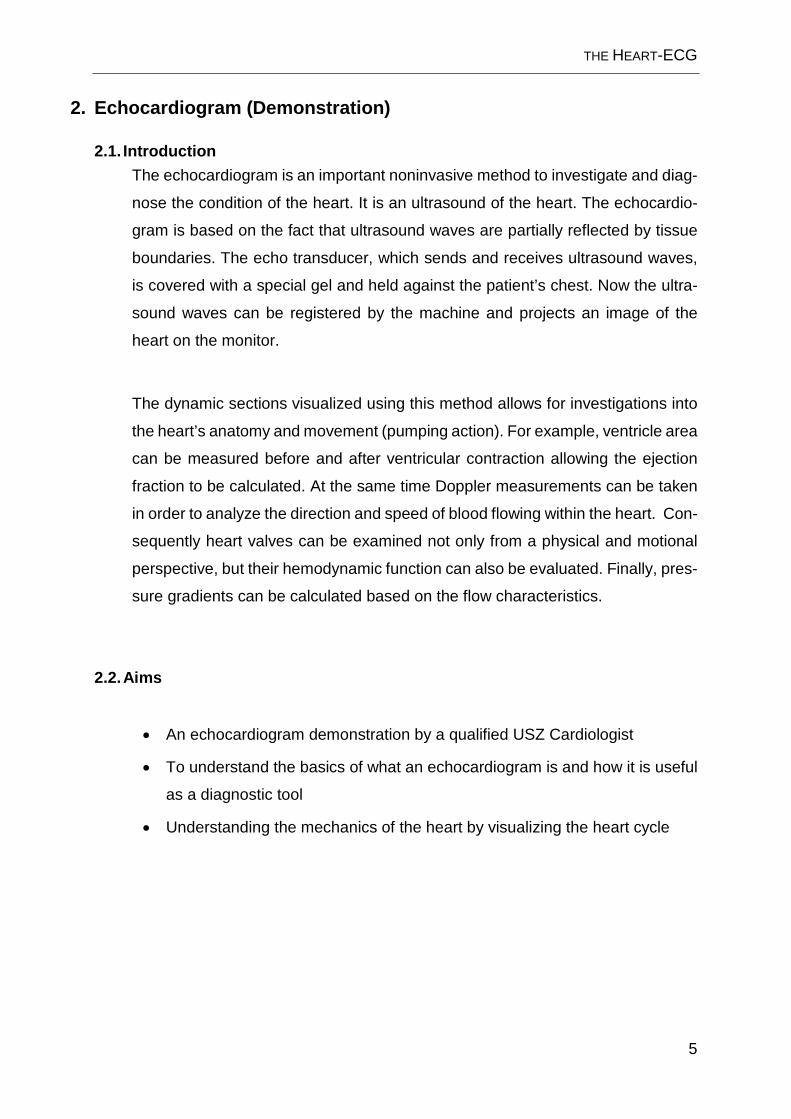
2. Echocardiogram (Demonstration)
2.1. Introduction The echocardiogram is an important noninvasive method to investigate and diag-
nose the condition of the heart. It is an ultrasound of the heart. The echocardio-
gram is based on the fact that ultrasound waves are partially reflected by tissue
boundaries. The echo transducer, which sends and receives ultrasound waves,
is covered with a special gel and held against the patient’s chest. Now the ultra-
sound waves can be registered by the machine and projects an image of the
heart on the monitor.
The dynamic sections visualized using this method allows for investigations into
the heart’s anatomy and movement (pumping action). For example, ventricle area
can be measured before and after ventricular contraction allowing the ejection
fraction to be calculated. At the same time Doppler measurements can be taken
in order to analyze the direction and speed of blood flowing within the heart. Con-
sequently heart valves can be examined not only from a physical and motional
perspective, but their hemodynamic function can also be evaluated. Finally, pres-
sure gradients can be calculated based on the flow characteristics.
2.2. Aims
• An echocardiogram demonstration by a qualified USZ Cardiologist
• To understand the basics of what an echocardiogram is and how it is useful
as a diagnostic tool
• Understanding the mechanics of the heart by visualizing the heart cycle
THE HEART-ECG
6
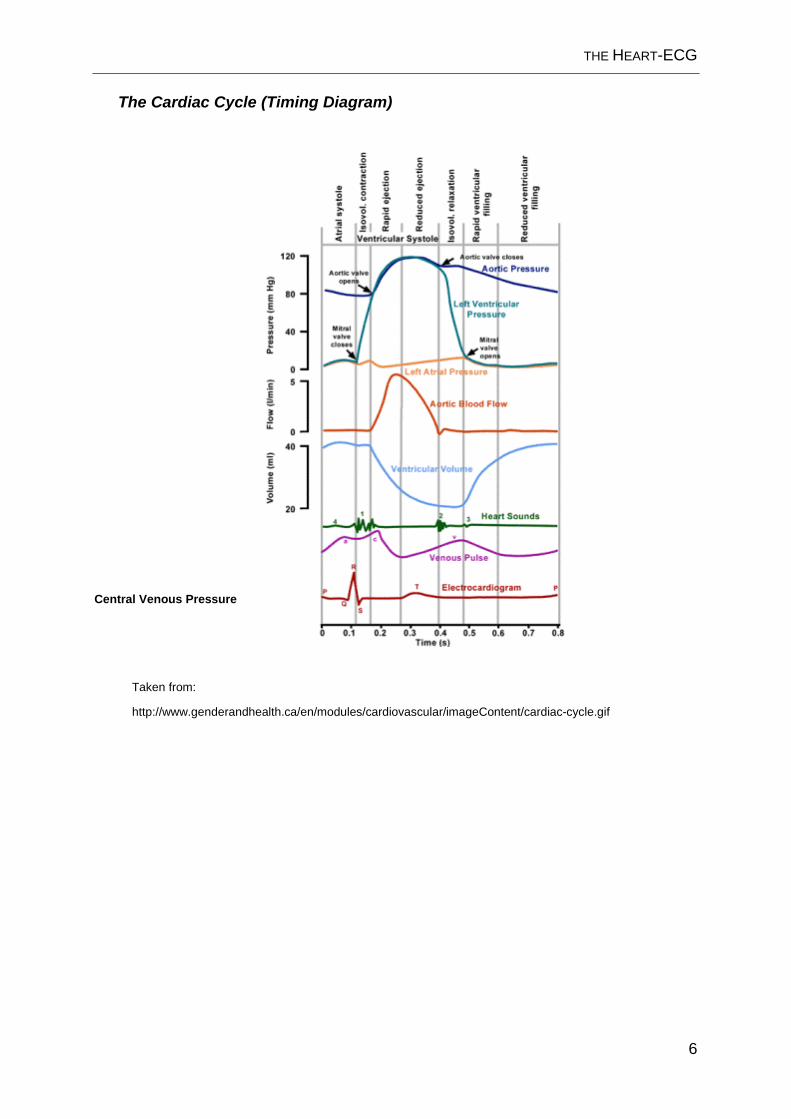
The Cardiac Cycle (Timing Diagram)
Central Venous Pressure
Taken from:
http://www.genderandhealth.ca/en/modules/cardiovascular/imageContent/cardiac-cycle.gif

THE HEART-ECG
7
3. Auscultation of heart sounds and phonocardiogram
3.1. Introduction Heart sounds (physical sounds) are strictly defined vibrations (≤ 50 Hz) in the
heart. These vibrations can be transmitted to the thorax, and can then be heard
or registered using a stethoscope or phonocardiogram. The first heart sound (S1)
results from the closure of the atrioventricular valves, mitral and tricuspid, at the
beginning of ventricular contraction, or systole. The second heart sound (S2) is
caused by the closure of the aortic valve and pulmonary valve at the end of ven-
tricular systole. As the left ventricle empties, its pressure falls below the pressure
in the aorta, and the aortic valve closes. Similarly, as the pressure in the right
ventricle falls below the pressure in the pulmonary artery, the pulmonary valve
closes.
During inspiration, negative intrathoracic pressure causes increased blood return
into the right side of the heart. The increased blood volume in the right ventricle
causes the pulmonic valve to stay open longer during ventricular systole. This
causes an increased delay in the P2 component of S2. During expiration, the pos-
itive intrathoracic pressure causes decreased blood return to the right side of the
heart. The reduced volume in the right ventricle allows the pulmonic valve to close
earlier at the end of ventricular systole, causing P2 to occur earlier, and "closer"
to A2. It is physiological to hear the splitting of the second heart sound by younger
people and during inspiration. During expiration normally the interval between the
two components shortens and the sound becomes merged. A third (rapid filling
of the ventricle) and/or fourth heart sound (atrium contraction) are usually only
audible in pathological cases.
Pathological heart murmurs (between sounds, at higher frequency) are the result
of turbulences in blood flow. Systolic noise is usually only heard in aortic or pul-
monary valve stenosis (restriction) or insufficiencies of the atrioventricular valves.
Diastolic noise is audible in patients with stenosis of the atrioventricular valves
and insufficiencies of the aortic or pulmonary valves. In the case of anemia, the
decrease in blood viscosity (due to low hematocrit) and increase in the cardiac
output leads to the development of turbulences.
THE HEART-ECG
8
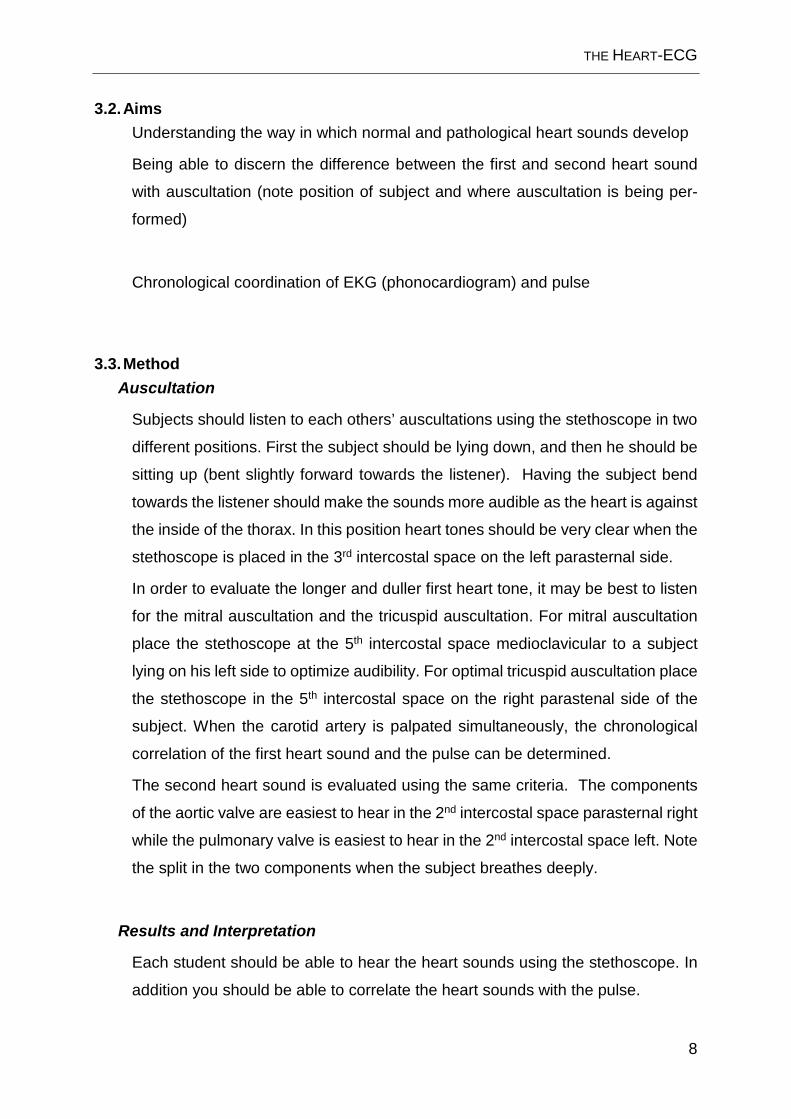
3.2. Aims Understanding the way in which normal and pathological heart sounds develop
Being able to discern the difference between the first and second heart sound
with auscultation (note position of subject and where auscultation is being per-
formed)
Chronological coordination of EKG (phonocardiogram) and pulse
3.3. Method Auscultation
Subjects should listen to each others’ auscultations using the stethoscope in two
different positions. First the subject should be lying down, and then he should be
sitting up (bent slightly forward towards the listener). Having the subject bend
towards the listener should make the sounds more audible as the heart is against
the inside of the thorax. In this position heart tones should be very clear when the
stethoscope is placed in the 3rd intercostal space on the left parasternal side.
In order to evaluate the longer and duller first heart tone, it may be best to listen
for the mitral auscultation and the tricuspid auscultation. For mitral auscultation
place the stethoscope at the 5th intercostal space medioclavicular to a subject
lying on his left side to optimize audibility. For optimal tricuspid auscultation place
the stethoscope in the 5th intercostal space on the right parastenal side of the
subject. When the carotid artery is palpated simultaneously, the chronological
correlation of the first heart sound and the pulse can be determined.
The second heart sound is evaluated using the same criteria. The components
of the aortic valve are easiest to hear in the 2nd intercostal space parasternal right
while the pulmonary valve is easiest to hear in the 2nd intercostal space left. Note
the split in the two components when the subject breathes deeply.
Results and Interpretation
Each student should be able to hear the heart sounds using the stethoscope. In
addition you should be able to correlate the heart sounds with the pulse.

THE HEART-ECG
9
4. Electrocardiogram (ECG)
4.1. Introduction The ECG registers differences in potential on the body’s surface which are gen-
erated by the heart’s activity.
General Information on the generation of the measured potentials:
The progressive stimulation (depolarization) of individual myocardial cells leads
to a progression of electronegativity on their surfaces. This causes an electric
dipole to develop between those cells or regions which are stimulated (electro-
negative) and those which are not yet stimulated (electropositive). These differ-
ences can be described or interpreted as vectors which move from the stimulated
(negative) areas to the not yet stimulated (positive) areas. The sum of all these
single vectors gives rise to a sum or integral vector throughout heart stimulation.
A large portion of these vectors cancel each other out. During repolarization the
surface electronegativity has to be reverted so that the next dipole vector can
again move from the stimulated (negative) to the unstimulated (positive) areas of
the heart. When this integral vector meets with a positive or unipolar electrode it
leads to a positive deflection.
Schematic account of the depolarization and repolarization of the heart with the correlating ECG
Electrode (-)
Electrode (+)
Depolarization vec-tor (from – to +)
Progression of
the dipolarization
R peak T-wave
T
THE HEART-ECG
10
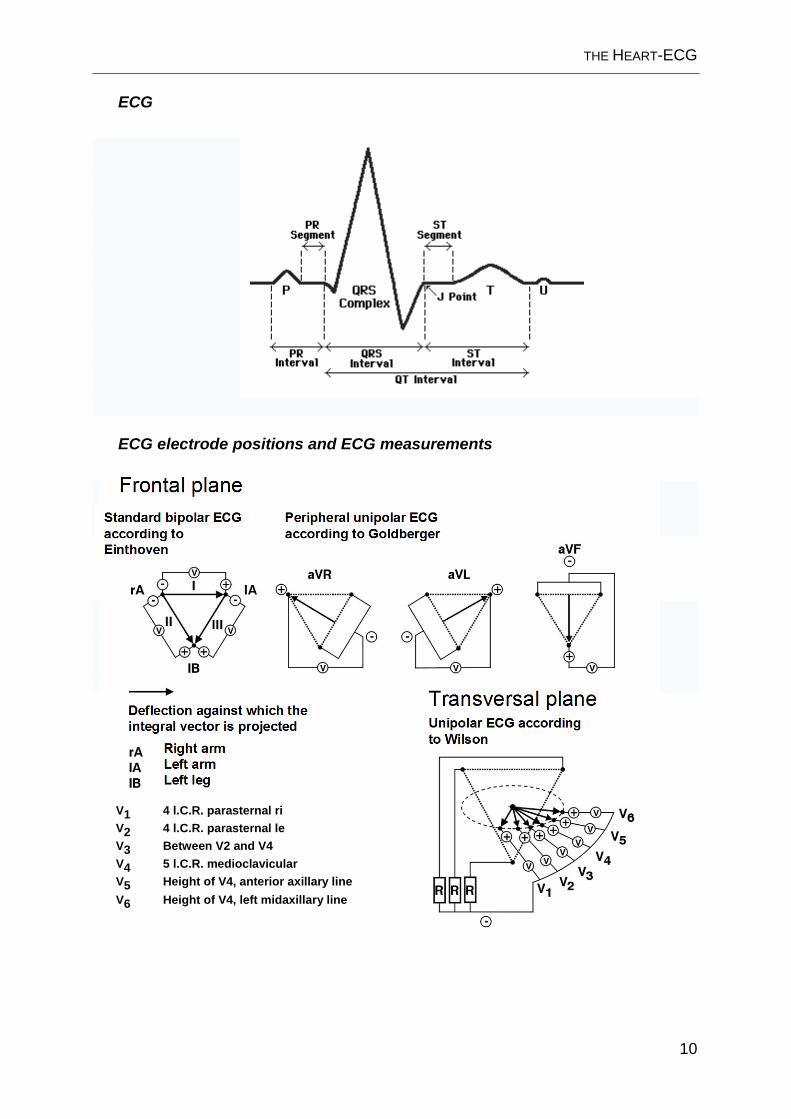
ECG
ECG electrode positions and ECG measurements
V1 4 l.C.R. parasternal ri V2 4 l.C.R. parasternal le V3 Between V2 and V4 V4 5 l.C.R. medioclavicular V5 Height of V4, anterior axillary line V6 Height of V4, left midaxillary line

THE HEART-ECG
11
What are the deflections (peaks and curves) seen on an ECG readout?
P-wave: represents the wave of depolarization that spreads from the SA node
throughout the atria, and is usually 0.08 to 0.1 seconds (80-100 ms) in duration.
The brief isoelectric (zero voltage) period after the P wave represents the time in
which the impulse is traveling within the AV node (where the conduction velocity
is greatly retarded) and the bundle of His. Note that the repolarization of the
atrium is not visible because it correlates chronologically with the QRS complex.
P-Q (P-R interval): This interval represents the time between the onset of atrial
depolarization and the onset of ventricular depolarization. Since the mass of cells
which are depolarizing at this time point is small (AV node and His bundles) the
P-R segment is isoelectric. If the P-R interval is >0.2 sec, there is an AV conduc-
tion block, which is also termed a first-degree atrioventricular block if every im-
pulse is still able to be conducted into the ventricles.
QRS Complex: This complex represents ventricular depolarization. By definition
a negative peak is called Q when it precedes a positive peak (R). A positive peak
following a positive peak is referred to as R’ and a negative peak following a
positive peak is S. First the upper septum muscles are stimulated from the left
side. This can lead to a small Q peak if we interpret it ‘from the left perspective’
(I, II, AVL, V4-V6). The stimulation then proceeds down to the cardiac apex and
beyond by moving along the chamber walls until it reaches the level of the valves.
In order to understand the direction of the integral vector that makes up the QRS
complex one must remember that chamber myocardial tissue is always stimu-
lated from the inside out. Since, under normal circumstances the integral vector
is mostly defined by the left ventricle (bigger muscle), the vector usually points
downwards and/or slightly to the left (between -30º and 120º). The angle at which
the mean electric axis of the heart is positioned in the chest can be determined
based on ECG peaks (see figure below). Several parameters can effect the po-
sition of the heart including age, physical build, thorax shape, and physical fit-
ness. Pathological changes can result from things like cardiac hypertrophy, re-
duction in physical performance, or a heart attack.
THE HEART-ECG
12
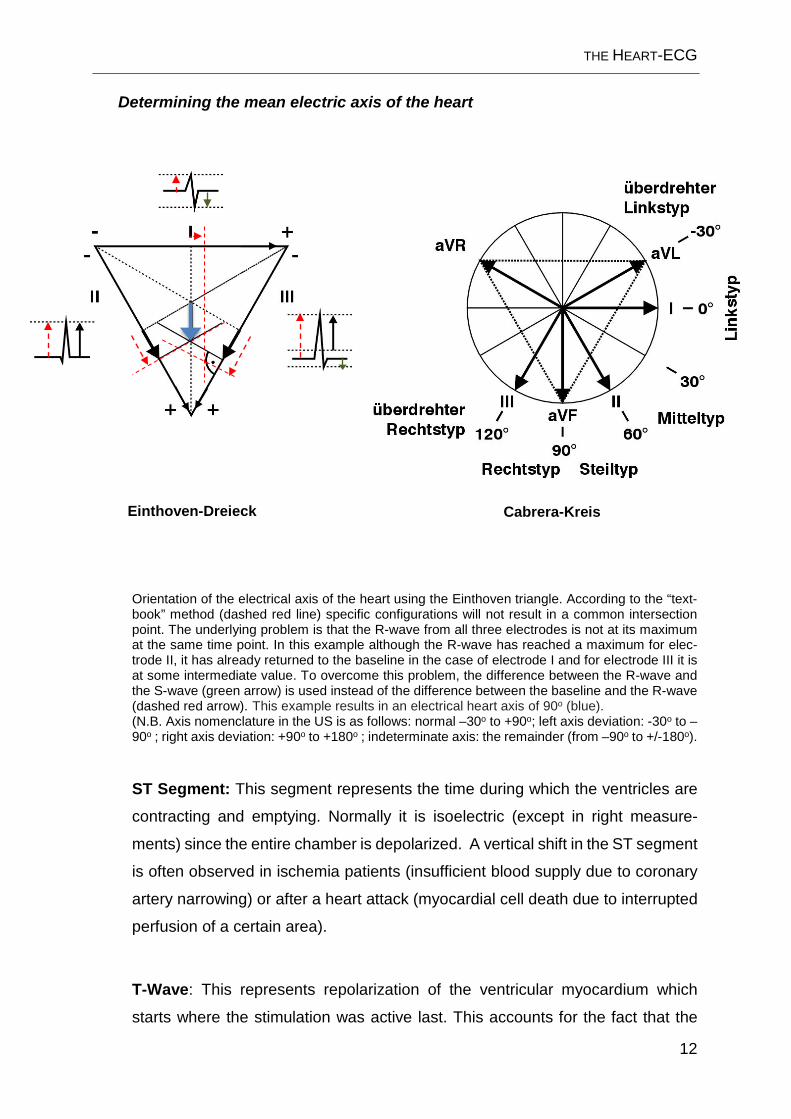
Determining the mean electric axis of the heart
Orientation of the electrical axis of the heart using the Einthoven triangle. According to the “text-book” method (dashed red line) specific configurations will not result in a common intersection point. The underlying problem is that the R-wave from all three electrodes is not at its maximum at the same time point. In this example although the R-wave has reached a maximum for elec-trode II, it has already returned to the baseline in the case of electrode I and for electrode III it is at some intermediate value. To overcome this problem, the difference between the R-wave and the S-wave (green arrow) is used instead of the difference between the baseline and the R-wave (dashed red arrow). This example results in an electrical heart axis of 90o (blue). (N.B. Axis nomenclature in the US is as follows: normal –30o to +90o; left axis deviation: -30o to –90o ; right axis deviation: +90o to +180o ; indeterminate axis: the remainder (from –90o to +/-180o).
ST Segment: This segment represents the time during which the ventricles are
contracting and emptying. Normally it is isoelectric (except in right measure-
ments) since the entire chamber is depolarized. A vertical shift in the ST segment
is often observed in ischemia patients (insufficient blood supply due to coronary
artery narrowing) or after a heart attack (myocardial cell death due to interrupted
perfusion of a certain area).
T-Wave: This represents repolarization of the ventricular myocardium which
starts where the stimulation was active last. This accounts for the fact that the
Einthoven-Dreieck Cabrera-Kreis

THE HEART-ECG
13
peak is generally concordant (deflecting in the same direction) with the QRS com-
plex. Possible exceptions to this are measurements taken at V1 and V2.
QT interval: The stimulation of the entire chamber lasts from the beginning of the
QRS complex to the end of the T wave. The time this takes depends on the heart
rate (~0.25 – 0.45 sec) and, to a lesser extent, on the mass of the electric diastole
in the chamber.
Conclusions
The ECG can provide important clues about heart rhythm and the dipole stimula-
tion and conduction from the sino-atrial node via the AV node to the myocardium
in the ventricle. Additionally, diagnosis of coronary insufficiencies leading to my-
ocardial ischemia) and heart attacks are possible with information provided by
the ECG. The role of the ECG has become secondary, however, to an echocar-
diogram when diagnosing hypertrophy and other morphological pathologies of
the heart.
4.2. Aims Each experimenter should perform an ECG on a test subject and be able to an-
alyze the results.
4.3. Method The electrodes are fixed to the subject according to the scheme provided and
attached to the recording apparatus. Please remember to decrease the re-
sistance between the electrodes and the skin by applying a small amount of sa-
line solution at the contact areas.
Recording: The following measurements can all be made at once and will come
as a printed ECG at the end of each measurement.
1. Einthoven (standard bipolar) 2. Goldberg (peripheral unipolar) 3. Wilson (unipolar chest)

THE HEART-ECG
14
Standard ECG
1. turn on with green key 2. enter data of patient with patient data/ECG-shift key 3. go back with same key 4. place electrodes 5. check ECG-curves on monitor. When ok start recording with green START-key
Respiratory sinus arrhythmia
1. with key choose Einthoven (I, II, III)
2. press manual start (2nd key from right, below the screen)
3. reduce paper speed to 10 mm/sec (key 7, first row) 4. breathe slowly and deeply in and out 5. Press red STOP-key shortly before the end of the page 6. press red STOP-key again => perforates the paper
1
v
THE HEART-ECG
15
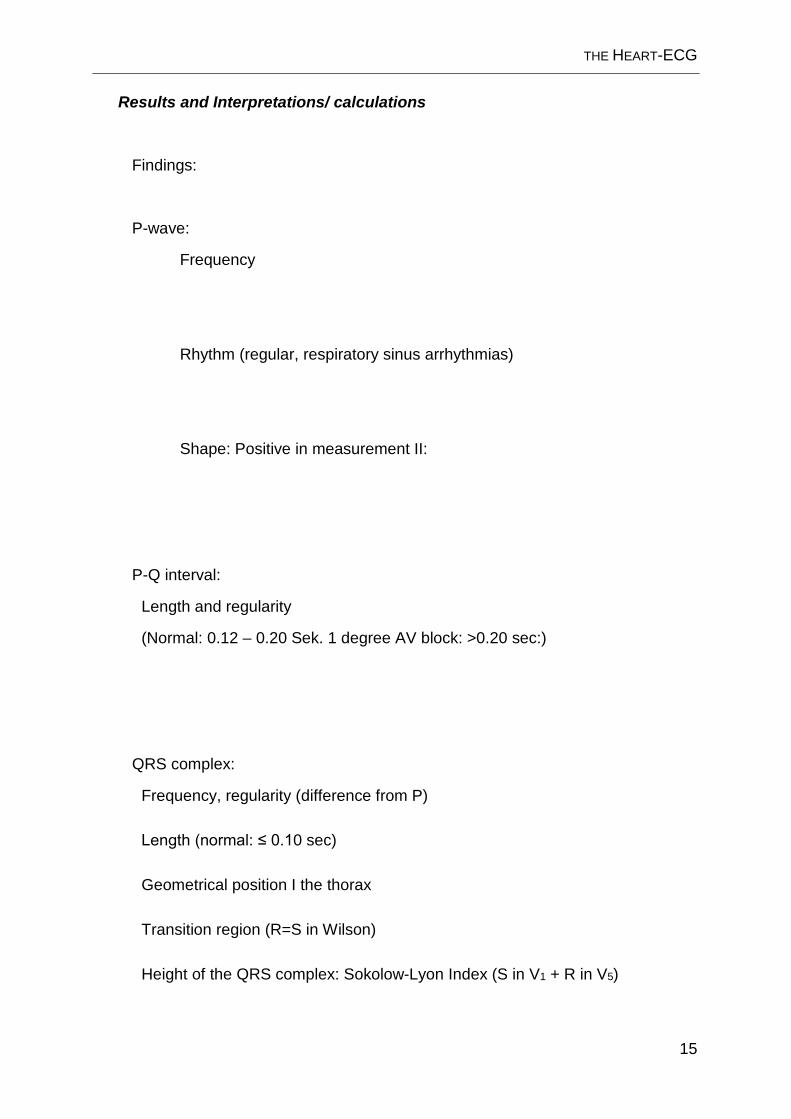
Results and Interpretations/ calculations
Findings:
P-wave:
Frequency
Rhythm (regular, respiratory sinus arrhythmias)
Shape: Positive in measurement II:
P-Q interval:
Length and regularity
(Normal: 0.12 – 0.20 Sek. 1 degree AV block: >0.20 sec:)
QRS complex:
Frequency, regularity (difference from P) Length (normal: ≤ 0.10 sec) Geometrical position I the thorax Transition region (R=S in Wilson) Height of the QRS complex: Sokolow-Lyon Index (S in V1 + R in V5)
THE HEART-ECG
16
ST-segment
Is it isoelectric?
T-waves:
Are they concordant (except V1 and V2)?
Are there extrasystoles?
Comments:
Observe the relationship of the Q-T segment and the distance between T and the
next Q in a few patients with varying heart frequencies.

THE HEART-ECG
17
5. Glossary Anemia
decreased hemoglobin concentration in the blood
Auscultation
listening to sound from the body with a stethoscope
Doppler Measurement
exploiting the change in frequency measured by the ultrasound to determine the
movement (flow) of the erythrocytes
Echocardiography
using ultrasound to visualize the heart
ECG
an electrocardiogram, used to measure the difference in potential (differences in
electrical voltage) which are caused by the heart’s activity
Ejection fraction
the portion (in %) of the enddiastolic ventricular volume which is ejected during
the systole
Heart murmurs
bruits caused by turbulence in the heart which are at higher frequency than nor-
mal heart sounds
Heart rhythm generation
Pace maker activity in the sino-atrial node
THE HEART-ECG
18
Heart sounds
sounds at low frequency (< 100 Hz) that occur at regular intervals which arise
form the oscillation of the heart and/or the large arteries and from the tension of
the myocardium and/or the closure of valves
Ischemia
deficiency in blood circulation
Mean electric axis
(cardiac vector) graphical representation of QRS complex from 6 frontal plane
leads (I, II, III, aVR, aVL, aVF) reconstructed from the instantaneous vectors rep-
resenting ventricular depolarization.
Myocardial Infarct
necrosis of myocardium due to interruption of blood supply to a certain area
Phonocardiogram
measurement of heart oscillations using a mechanic-electrical transducer (micro-
phone)
Sokolow-Lyon Index
electrocardiographic index used in diagnosis of left ventricular hypertrophy
Stenosis
restriction or narrowing in a blood vessel or heart valve
Transition zone
in the Wilson measurement, the time when S=R (normally between V2 and V5.
Valvular regurgitation
the inability of a valve to close properly leading to a back current


![Right heart failure secondary to traumatic tricuspid flail ... · Tricuspid Valve, and Complete Heart Block Due to Nonpenetrating Chest Trauma. Ann Thorac Surg 83: 2207-2210. [Crossref]](https://img.pdfslide.net/doc/110x75/60c5a184afc46946e429c7c8/right-heart-failure-secondary-to-traumatic-tricuspid-flail-tricuspid-valve.jpg)