Embed Size (px)
Citation preview
ARM® DS-5Version 5.26
Debugger User Guide
Copyright © 2010-2016 ARM Limited or its affiliates. All rights reserved.ARM DUI0446Z
ARM® DS-5Debugger User GuideCopyright © 2010-2016 ARM Limited or its affiliates. All rights reserved.
Release Information
Document History
Issue Date Confidentiality Change
A 30 June 2010 Non-Confidential First release
B 30 September 2010 Non-Confidential Update for DS-5 version 5.2
C 30 November 2010 Non-Confidential Update for DS-5 version 5.3
D 30 January 2011 Non-Confidential Update for DS-5 version 5.4
E 30 May 2011 Non-Confidential Update for DS-5 version 5.5
F 30 July 2011 Non-Confidential Update for DS-5 version 5.6
G 30 September 2011 Non-Confidential Update for DS-5 version 5.7
H 30 November 2012 Non-Confidential Update for DS-5 version 5.8
I 28 February 2012 Non-Confidential Update for DS-5 version 5.9
J 30 May 2012 Non-Confidential Update for DS-5 version 5.10
K 30 July 2012 Non-Confidential Update for DS-5 version 5.11
L 30 October 2012 Non-Confidential Update for DS-5 version 5.12
M 15 December 2012 Non-Confidential Update for DS-5 version 5.13
N 15 March 2013 Non-Confidential Update for DS-5 version 5.14
O 14 June 2013 Non-Confidential Update for DS-5 version 5.15
P 13 September 2013 Non-Confidential Update for DS-5 version 5.16
Q 13 December 2013 Non-Confidential Update for DS-5 version 5.17
R 14 March 2014 Non-Confidential Update for DS-5 version 5.18
S 27 June 2014 Non-Confidential Update for DS-5 version 5.19
T 17 October 2014 Non-Confidential Update for DS-5 version 5.20
U 20 March 2015 Non-Confidential Update for DS-5 version 5.21
V 15 July 2015 Non-Confidential Update for DS-5 version 5.22
W 15 October 2015 Non-Confidential Update for DS-5 version 5.23
X 15 March 2016 Non-Confidential Update for DS-5 version 5.24
Y 15 July 2016 Non-Confidential Update for DS-5 version 5.25
Z 18 November 2016 Non-Confidential Update for DS-5 version 5.26
Non-Confidential Proprietary Notice
This document is protected by copyright and other related rights and the practice or implementation of the information contained inthis document may be protected by one or more patents or pending patent applications. No part of this document may bereproduced in any form by any means without the express prior written permission of ARM. No license, express or implied, byestoppel or otherwise to any intellectual property rights is granted by this document unless specifically stated.
Your access to the information in this document is conditional upon your acceptance that you will not use or permit others to usethe information for the purposes of determining whether implementations infringe any third party patents.
ARM® DS-5
ARM DUI0446Z Copyright © 2010-2016 ARM Limited or its affiliates. All rightsreserved.
2
Non-Confidential
THIS DOCUMENT IS PROVIDED “AS IS”. ARM PROVIDES NO REPRESENTATIONS AND NO WARRANTIES,EXPRESS, IMPLIED OR STATUTORY, INCLUDING, WITHOUT LIMITATION, THE IMPLIED WARRANTIES OFMERCHANTABILITY, SATISFACTORY QUALITY, NON-INFRINGEMENT OR FITNESS FOR A PARTICULAR PURPOSEWITH RESPECT TO THE DOCUMENT. For the avoidance of doubt, ARM makes no representation with respect to, and hasundertaken no analysis to identify or understand the scope and content of, third party patents, copyrights, trade secrets, or otherrights.
This document may include technical inaccuracies or typographical errors.
TO THE EXTENT NOT PROHIBITED BY LAW, IN NO EVENT WILL ARM BE LIABLE FOR ANY DAMAGES,INCLUDING WITHOUT LIMITATION ANY DIRECT, INDIRECT, SPECIAL, INCIDENTAL, PUNITIVE, ORCONSEQUENTIAL DAMAGES, HOWEVER CAUSED AND REGARDLESS OF THE THEORY OF LIABILITY, ARISINGOUT OF ANY USE OF THIS DOCUMENT, EVEN IF ARM HAS BEEN ADVISED OF THE POSSIBILITY OF SUCHDAMAGES.
This document consists solely of commercial items. You shall be responsible for ensuring that any use, duplication or disclosure ofthis document complies fully with any relevant export laws and regulations to assure that this document or any portion thereof isnot exported, directly or indirectly, in violation of such export laws. Use of the word “partner” in reference to ARM’s customers isnot intended to create or refer to any partnership relationship with any other company. ARM may make changes to this document atany time and without notice.
If any of the provisions contained in these terms conflict with any of the provisions of any signed written agreement covering thisdocument with ARM, then the signed written agreement prevails over and supersedes the conflicting provisions of these terms.This document may be translated into other languages for convenience, and you agree that if there is any conflict between theEnglish version of this document and any translation, the terms of the English version of the Agreement shall prevail.
Words and logos marked with ® or ™ are registered trademarks or trademarks of ARM Limited or its affiliates in the EU and/orelsewhere. All rights reserved. Other brands and names mentioned in this document may be the trademarks of their respectiveowners. Please follow ARM’s trademark usage guidelines at http://www.arm.com/about/trademark-usage-guidelines.php
Copyright © 2010-2016, ARM Limited or its affiliates. All rights reserved.
ARM Limited. Company 02557590 registered in England.
110 Fulbourn Road, Cambridge, England CB1 9NJ.
LES-PRE-20349
Confidentiality Status
This document is Non-Confidential. The right to use, copy and disclose this document may be subject to license restrictions inaccordance with the terms of the agreement entered into by ARM and the party that ARM delivered this document to.
Unrestricted Access is an ARM internal classification.
Product Status
The information in this document is Final, that is for a developed product.
Web Address
http://www.arm.com
ARM® DS-5
ARM DUI0446Z Copyright © 2010-2016 ARM Limited or its affiliates. All rightsreserved.
3
Non-Confidential
ContentsARM® DS-5 Debugger User Guide
PrefaceAbout this book ..................................................... ..................................................... 17
Chapter 1 Introduction to DS-5 Debugger1.1 Overview: DS-5 Debugger and important concepts ........................ ........................ 1-211.2 Overview: ARM® CoreSight™ debug and trace components .................................... 1-221.3 Overview: Debugging multi-core (SMP and AMP), big.LITTLE™ , and multi-cluster
targets ...................................................................................................................... 1-231.4 Overview: Debugging ARM®-based Linux applications ..................... ..................... 1-271.5 Overview: Linux application rewind .................................... .................................... 1-281.6 Debugger concepts ................................................ ................................................ 1-30
Chapter 2 Configuring debug connections in DS-5 Debugger2.1 Overview: Debug connections in DS-5 Debugger ......................... ......................... 2-342.2 Launching DS-5 and connecting to DS-5 Debugger ....................... ....................... 2-362.3 Configuring a connection to a bare-metal hardware target .................. .................. 2-382.4 Configuring trace for bare-metal or Linux kernel targets .................... .................... 2-432.5 Configuring a connection to a Linux application using gdbserver ............. ............. 2-462.6 Configuring a connection to a Linux kernel .............................. .............................. 2-482.7 Using Fixed Virtual Platform (FVP)s with DS-5 ........................... ........................... 2-502.8 Configuring application rewind for Linux .................................................................. 2-572.9 Configuring an Events view connection to a bare-metal target ............... ............... 2-632.10 Exporting or importing an existing launch configuration .......................................... 2-652.11 Disconnecting from a target .......................................... .......................................... 2-68
ARM DUI0446Z Copyright © 2010-2016 ARM Limited or its affiliates. All rightsreserved.
4
Non-Confidential
Chapter 3 Controlling Target Execution3.1 Overview: Breakpoints and Watchpoints ................................ ................................ 3-703.2 Running, stopping, and stepping through an application .................... .................... 3-723.3 Working with breakpoints ............................................ ............................................ 3-743.4 Working with watchpoints ........................................................................................ 3-753.5 Importing and exporting breakpoints and watchpoints ...................... ...................... 3-773.6 Viewing the properties of a breakpoint or a watchpoint ..................... ..................... 3-783.7 Associating debug scripts to breakpoints ................................ ................................ 3-803.8 Conditional breakpoints ............................................. ............................................. 3-813.9 Assigning conditions to an existing breakpoint ........................................................ 3-823.10 Conditional watchpoints ............................................. ............................................. 3-843.11 Assigning conditions to an existing watchpoint ........................... ........................... 3-853.12 Pending breakpoints and watchpoints .................................. .................................. 3-873.13 Setting a tracepoint .................................................................................................. 3-893.14 Handling UNIX signals .............................................. .............................................. 3-903.15 Handling processor exceptions ....................................... ....................................... 3-923.16 Cross-trigger configuration ........................................... ........................................... 3-943.17 Using semihosting to access resources on the host computer ............... ............... 3-953.18 Working with semihosting ........................................................................................ 3-973.19 Configuring the debugger path substitution rules .................................................... 3-99
Chapter 4 Working with the Target Configuration Editor4.1 About the Target Configuration Editor ................................. ................................. 4-1034.2 Target configuration editor - Overview tab .............................. .............................. 4-1044.3 Target configuration editor - Memory tab ............................... ............................... 4-1064.4 Target configuration editor - Peripherals tab .......................................................... 4-1084.5 Target configuration editor - Registers tab .............................. .............................. 4-1104.6 Target configuration editor - Group View tab ............................ ............................ 4-1124.7 Target configuration editor - Enumerations tab ...................................................... 4-1144.8 Target configuration editor - Configurations tab .......................... .......................... 4-1154.9 Scenario demonstrating how to create a new target configuration file ......... ......... 4-1174.10 Creating a power domain for a target .................................................................... 4-1284.11 Creating a Group list .............................................................................................. 4-1294.12 Importing an existing target configuration file ........................................................ 4-1314.13 Exporting a target configuration file ................................... ................................... 4-133
Chapter 5 Examining the Target5.1 Examining the target execution environment ............................ ............................ 5-1365.2 Examining the call stack ........................................................................................ 5-1375.3 About trace support ............................................... ............................................... 5-1385.4 About post-mortem debugging of trace data ............................ ............................ 5-141
Chapter 6 Debugging Embedded Systems6.1 About endianness .................................................................................................. 6-1436.2 About accessing AHB, APB, and AXI buses ............................ ............................ 6-1446.3 About virtual and physical memory ........................................................................ 6-1456.4 About address spaces ............................................. ............................................. 6-1466.5 About debugging hypervisors ................................................................................ 6-1486.6 About debugging big.LITTLE systems ................................. ................................. 6-1496.7 About debugging bare-metal symmetric multiprocessing systems ........................ 6-150
ARM DUI0446Z Copyright © 2010-2016 ARM Limited or its affiliates. All rightsreserved.
5
Non-Confidential
6.8 About debugging multi-threaded applications ........................... ........................... 6-1526.9 About debugging shared libraries .......................................................................... 6-1536.10 About OS awareness .............................................. .............................................. 6-1556.11 About debugging TrustZone enabled targets ............................ ............................ 6-1606.12 About debugging a Unified Extensible Firmware Interface (UEFI) ........................ 6-1626.13 About debugging MMUs ........................................................................................ 6-1636.14 About Debug and Trace Services Layer (DTSL) ......................... ......................... 6-1656.15 About CoreSight™ Target Access Library ............................... ............................... 6-1666.16 About debugging caches ........................................... ........................................... 6-1676.17 About DS-5 Debugger support for overlays ............................. ............................. 6-170
Chapter 7 Debugging with Scripts7.1 Exporting DS-5 Debugger commands generated during a debug session ..... ..... 7-1727.2 Creating a DS-5 Debugger script ..................................... ..................................... 7-1737.3 Creating a CMM-style script ......................................... ......................................... 7-1747.4 Support for importing and translating CMM scripts ....................... ....................... 7-1757.5 About Jython scripts ............................................... ............................................... 7-1777.6 Jython script concepts and interfaces ................................. ................................. 7-1797.7 Creating Jython projects in Eclipse for DS-5 ............................ ............................ 7-1807.8 Creating a Jython script ............................................ ............................................ 7-1837.9 Running a script .................................................. .................................................. 7-1857.10 Use case scripts .................................................. .................................................. 7-1877.11 Metadata for use case scripts ................................................................................ 7-1887.12 Definition block for use case scripts ................................... ................................... 7-1897.13 Defining the Run method for use case scripts ........................... ........................... 7-1917.14 Defining the options for use case scripts ............................... ............................... 7-1927.15 Defining the validation method for use case scripts ....................... ....................... 7-1957.16 Example use case script definition .................................... .................................... 7-1967.17 Multiple use cases in a single script ................................... ................................... 7-1977.18 usecase list command ............................................. ............................................. 7-1987.19 usecase help command ............................................ ............................................ 7-1997.20 usecase run command ............................................. ............................................. 7-200
Chapter 8 Running DS-5 Debugger from the operating system command-line orfrom a script8.1 Overview: Running DS-5 Debugger from the command-line or from a script ... ... 8-2038.2 Command-line debugger options ..................................... ..................................... 8-2048.3 Running a debug session from a script ................................ ................................ 8-2098.4 Specifying a custom configuration database using the command-line .................. 8-2118.5 Capturing trace data using the command-line debugger ................... ................... 8-2138.6 DS-5 Debugger command-line console keyboard shortcuts ................ ................ 8-215
Chapter 9 Working with the Snapshot Viewer9.1 About the Snapshot Viewer ......................................... ......................................... 9-2179.2 Components of a Snapshot Viewer initialization file .............................................. 9-2199.3 Connecting to the Snapshot Viewer ................................... ................................... 9-2229.4 Considerations when creating debugger scripts for the Snapshot Viewer ...... ...... 9-223
Chapter 10 Platform Configuration10.1 DS-5 Configuration perspective ..................................... ..................................... 10-225
ARM DUI0446Z Copyright © 2010-2016 ARM Limited or its affiliates. All rightsreserved.
6
Non-Confidential
10.2 About importing platform and model configurations ...................... ...................... 10-22610.3 About platform bring-up in DS-5 .......................................................................... 10-22810.4 ARM debug and trace architecture ...................................................................... 10-22910.5 About the Platform Configuration Editor view ...................................................... 10-23010.6 Creating a platform configuration .................................... .................................... 10-23110.7 Editing a platform configuration in the PCE ............................ ............................ 10-23610.8 About the device hierarchy in the PCE view ........................................................ 10-24210.9 Manual platform configuration ...................................... ...................................... 10-24410.10 Configuring your debug hardware unit for platform autodetection ........... ........... 10-24610.11 Creating a new model configuration .................................................................... 10-24810.12 Importing a custom model ......................................... ......................................... 10-25010.13 Model Devices and Cluster Configuration ............................. ............................. 10-25210.14 Adding a configuration database to DS-5 ............................................................ 10-25310.15 Configuration Database panel ...................................... ...................................... 10-25510.16 Extending your configuration database ............................... ............................... 10-257
Chapter 11 DS-5 Debug Perspectives and Views11.1 App Console view ................................................................................................ 11-26311.2 ARM Asm Info view .............................................. .............................................. 11-26511.3 ARM assembler editor ............................................ ............................................ 11-26611.4 Breakpoints view .................................................................................................. 11-26811.5 C/C++ editor .................................................... .................................................... 11-27211.6 Commands view ................................................. ................................................. 11-27511.7 Debug Control view .............................................. .............................................. 11-27811.8 Stack view ............................................................................................................ 11-28211.9 Disassembly view ................................................ ................................................ 11-28511.10 Events view .......................................................................................................... 11-28911.11 Event Viewer Settings dialog box .................................... .................................... 11-29111.12 Expressions view ................................................ ................................................ 11-29411.13 Functions view .................................................. .................................................. 11-29811.14 History view .................................................... .................................................... 11-30011.15 Memory view ........................................................................................................ 11-30211.16 MMU view ............................................................................................................ 11-30811.17 Modules view ................................................... ................................................... 11-31211.18 Registers view .................................................. .................................................. 11-31411.19 OS Data view ................................................... ................................................... 11-31911.20 Overlays view ................................................... ................................................... 11-32011.21 Cache Data view .................................................................................................. 11-32111.22 Screen view .................................................... .................................................... 11-32311.23 Scripts view .......................................................................................................... 11-32611.24 Target Console view .............................................. .............................................. 11-32811.25 Target view ..................................................... ..................................................... 11-32911.26 Trace view ............................................................................................................ 11-33111.27 Trace Control view ............................................... ............................................... 11-33411.28 Variables view ...................................................................................................... 11-33711.29 Timed Auto-Refresh Properties dialog box .......................................................... 11-34311.30 Memory Exporter dialog box ................................................................................ 11-34411.31 Memory Importer dialog box ................................................................................ 11-34511.32 Fill Memory dialog box ............................................ ............................................ 11-34611.33 Export Trace Report dialog box ..................................... ..................................... 11-347
ARM DUI0446Z Copyright © 2010-2016 ARM Limited or its affiliates. All rightsreserved.
7
Non-Confidential
11.34 Breakpoint Properties dialog box .................................... .................................... 11-34911.35 Watchpoint Properties dialog box ........................................................................ 11-35211.36 Tracepoint Properties dialog box .................................... .................................... 11-35311.37 Manage Signals dialog box .................................................................................. 11-35411.38 Functions Filter dialog box ......................................... ......................................... 11-35611.39 Script Parameters dialog box ....................................... ....................................... 11-35711.40 Debug Configurations - Connection tab ............................... ............................... 11-35811.41 Debug Configurations - Files tab .................................... .................................... 11-36111.42 Debug Configurations - Debugger tab ................................ ................................ 11-36411.43 Debug Configurations - OS Awareness tab ............................ ............................ 11-36711.44 Debug Configurations - Arguments tab ............................... ............................... 11-36811.45 Debug Configurations - Environment tab .............................. .............................. 11-37011.46 DTSL Configuration Editor dialog box ................................ ................................ 11-37211.47 About the Remote System Explorer .................................. .................................. 11-37411.48 Remote Systems view ............................................ ............................................ 11-37511.49 Remote System Details view ....................................... ....................................... 11-37611.50 Target management terminal for serial and SSH connections .............. .............. 11-37711.51 Remote Scratchpad view .......................................... .......................................... 11-37811.52 Remote Systems terminal for SSH connections .................................................. 11-37911.53 Terminal Settings dialog box ................................................................................ 11-38011.54 Debug Hardware Configure IP view .................................. .................................. 11-38211.55 Debug Hardware Firmware Installer view ............................................................ 11-38411.56 Connection Browser dialog box ..................................... ..................................... 11-38711.57 DS-5 Debugger menu and toolbar icons .............................. .............................. 11-388
Chapter 12 Troubleshooting12.1 ARM Linux problems and solutions .................................. .................................. 12-39212.2 Enabling internal logging from the debugger ........................... ........................... 12-39312.3 Target connection problems and solutions .......................................................... 12-394
Chapter 13 File-based Flash Programming in ARM DS-513.1 About file-based flash programming in ARM® DS-5 ..................... ..................... 13-39613.2 Flash programming configuration ........................................................................ 13-39813.3 Creating an extension database for flash programming ...................................... 13-40013.4 About using or extending the supplied ARM® Keil® flash method ........................ 13-40113.5 About creating a new flash method .................................. .................................. 13-40313.6 About testing the flash configuration ................................. ................................. 13-40713.7 About flash method parameters ..................................... ..................................... 13-40813.8 About getting data to the flash algorithm .............................. .............................. 13-40913.9 About interacting with the target .......................................................................... 13-410
Chapter 14 Writing OS Awareness for DS-5 Debugger14.1 About Writing operating system awareness for DS-5 Debugger ............ ............ 14-41814.2 Creating an OS awareness extension ................................ ................................ 14-41914.3 Implementing the OS awareness API .................................................................. 14-42314.4 Enabling the OS awareness ................................................................................ 14-42514.5 Implementing thread awareness .................................... .................................... 14-43014.6 Implementing data views .......................................... .......................................... 14-43314.7 Advanced OS awareness extension .................................................................... 14-43614.8 Programming advice and noteworthy information ....................... ....................... 14-438
ARM DUI0446Z Copyright © 2010-2016 ARM Limited or its affiliates. All rightsreserved.
8
Non-Confidential
Chapter 15 Debug and Trace Services Layer (DTSL)15.1 Additional DTSL documentation and files ............................................................ 15-44015.2 Need for DTSL .................................................. .................................................. 15-44115.3 DS-5 configuration database ....................................... ....................................... 15-44615.4 DTSL as used by DS-5 Debugger ................................... ................................... 15-45215.5 Main DTSL classes and hierarchy ................................... ................................... 15-45415.6 DTSL options ................................................... ................................................... 15-46215.7 DTSL support for SMP and AMP configurations ........................ ........................ 15-46815.8 DTSL Trace .................................................... .................................................... 15-47215.9 Extending the DTSL object model ................................... ................................... 15-47915.10 Debugging DTSL Jython code within DS-5 Debugger .................... .................... 15-48415.11 DTSL in stand-alone mode .................................................................................. 15-488
Chapter 16 Reference16.1 Standards compliance in DS-5 Debugger ............................. ............................. 16-49516.2 DS-5 Debug perspective keyboard shortcuts ...................................................... 16-49616.3 About loading an image on to the target .............................................................. 16-49716.4 About loading debug information into the debugger ............................................ 16-49916.5 About passing arguments to main() .................................. .................................. 16-50116.6 Running an image ............................................... ............................................... 16-50216.7 Updating multiple debug hardware units .............................. .............................. 16-503
ARM DUI0446Z Copyright © 2010-2016 ARM Limited or its affiliates. All rightsreserved.
9
Non-Confidential
List of FiguresARM® DS-5 Debugger User Guide
Figure 1-1 Versatile Express A9x4 SMP configuration ........................................................................... 1-23Figure 1-2 Core 1 stopped on stepi command ........................................................................................ 1-24Figure 2-1 MyBareMetalConfig - Connection tab .................................................................................... 2-39Figure 2-2 MyBareMetalConfig - Files tab .............................................................................................. 2-40Figure 2-3 MyBareMetalConfig - Debugger tab ...................................................................................... 2-41Figure 2-4 Select the debug configuration .............................................................................................. 2-43Figure 2-5 Select Trace capture method ................................................................................................. 2-44Figure 2-6 Select the processors you want to trace ................................................................................ 2-45Figure 2-7 Debug Configurations - ARM FVP - Base_AEMv8A_AEMv8A ............................................. 2-51Figure 2-8 My_BareMetal_Model_Configuration - Debug Control view .................................................. 2-53Figure 2-9 Debug Configurations - ARM FVP (Installed with DS-5) ....................................................... 2-54Figure 2-10 Application Debug with Rewind Support - Connect to already running application ............... 2-59Figure 2-11 Events view with data from the ITM source ........................................................................... 2-64Figure 2-12 Export launch configuration dialog box .................................................................................. 2-65Figure 2-13 Launch configuration selection panels .................................................................................. 2-66Figure 2-14 Launch configuration file selection panels ............................................................................. 2-67Figure 2-15 Disconnecting from a target ................................................................................................... 2-68Figure 3-1 Debug Control view ............................................................................................................... 3-72Figure 3-2 Viewing breakpoints ............................................................................................................... 3-74Figure 3-3 Setting a data watchpoint on a data symbol .......................................................................... 3-75Figure 3-4 Import and export breakpoints and watchpoints .................................................................... 3-77Figure 3-5 Viewing the properties of a breakpoint ................................................................................. 3-78Figure 3-6 Viewing the properties of a data watchpoint .......................................................................... 3-79
ARM DUI0446Z Copyright © 2010-2016 ARM Limited or its affiliates. All rightsreserved.
10
Non-Confidential
Figure 3-7 Breakpoint Properties dialog ................................................................................................. 3-82Figure 3-8 Watchpoint Properties dialog ................................................................................................. 3-85Figure 3-9 Manage signals dialog (UNIX signals) ................................................................................... 3-90Figure 3-10 Manage Signals dialog .......................................................................................................... 3-92Figure 3-11 Typical layout between top of memory, stack, and heap ....................................................... 3-95Figure 3-12 Set Path Substitution ............................................................................................................. 3-99Figure 3-13 Path Substitution dialog box ................................................................................................ 3-100Figure 3-14 Edit Substitute Path dialog box ............................................................................................ 3-100Figure 4-1 Specifying TCF files in the Debug Configurations window .................................................. 4-103Figure 4-2 Target configuration editor - Overview tab ........................................................................... 4-105Figure 4-3 Target configuration editor - Memory tab ............................................................................. 4-107Figure 4-4 Target configuration editor - Peripherals tab ........................................................................ 4-109Figure 4-5 Target configuration editor - Registers tab ........................................................................... 4-111Figure 4-6 Target configuration editor - Group View tab ....................................................................... 4-112Figure 4-7 Target configuration editor - Configuration tab ..................................................................... 4-116Figure 4-8 LED register and bitfields ..................................................................................................... 4-117Figure 4-9 Core module and LCD control register ............................................................................... 4-117Figure 4-10 Creating a Memory map ...................................................................................................... 4-118Figure 4-11 Creating a peripheral ........................................................................................................... 4-119Figure 4-12 Creating a standalone register ............................................................................................ 4-120Figure 4-13 Creating a peripheral register .............................................................................................. 4-121Figure 4-14 Creating enumerations ........................................................................................................ 4-122Figure 4-15 Assigning enumerations ...................................................................................................... 4-123Figure 4-16 Creating remapping rules .................................................................................................... 4-124Figure 4-17 Creating a memory region for remapping by a control register ........................................... 4-125Figure 4-18 Applying the Remap_RAM_block1 map rule ....................................................................... 4-126Figure 4-19 Applying the Remap_ROM map rule ................................................................................... 4-127Figure 4-20 Power Domain Configurations ............................................................................................. 4-128Figure 4-21 Creating a group list ............................................................................................................ 4-129Figure 4-22 Selecting an existing target configuration file ...................................................................... 4-131Figure 4-23 Importing the target configuration file .................................................................................. 4-132Figure 4-24 Exporting to C header file .................................................................................................... 4-133Figure 4-25 Selecting the files ............................................................................................................... 4-134Figure 5-1 Target execution environment ............................................................................................. 5-136Figure 5-2 Stack view showing information for a selected core ............................................................ 5-137Figure 6-1 Threading call stacks in the Debug Control view ................................................................. 6-152Figure 6-2 Adding individual shared library files ................................................................................... 6-153Figure 6-3 Modifying the shared library search paths ........................................................................... 6-154Figure 6-4 Cache Data view (showing L1 TLB cache) .......................................................................... 6-167Figure 6-5 DTSL Configuration Editor (Cache RAMs configuration tab) .............................................. 6-168Figure 7-1 Commands generated during a debug session ................................................................... 7-172Figure 7-2 PyDev project wizard ........................................................................................................... 7-180Figure 7-3 PyDev project settings ......................................................................................................... 7-181Figure 7-4 Jython auto-completion and help ......................................................................................... 7-183Figure 7-5 Scripts view ......................................................................................................................... 7-185Figure 8-1 Enable trace in the DTSL options ........................................................................................ 8-213Figure 8-2 Command-line debugger connection with DTSL option enabled ........................................ 8-214Figure 10-1 New PCE project ............................................................................................................... 10-231Figure 10-2 Platform creation options ................................................................................................... 10-232Figure 10-3 Enter CMM script parameters ............................................................................................ 10-233
ARM DUI0446Z Copyright © 2010-2016 ARM Limited or its affiliates. All rightsreserved.
11
Non-Confidential
Figure 10-4 Debug hardware firmware update notification during platform configuration .................... 10-233Figure 10-5 Create new configuration database ................................................................................... 10-234Figure 10-6 New platform information ................................................................................................... 10-235Figure 10-7 Component Connections ................................................................................................... 10-236Figure 10-8 Missing slaves ................................................................................................................... 10-236Figure 10-9 Device hierarchy ................................................................................................................ 10-237Figure 10-10 Add Core Trace .................................................................................................................. 10-237Figure 10-11 Add CTI Trigger ................................................................................................................. 10-238Figure 10-12 User added component connections ................................................................................. 10-239Figure 10-13 Project Explorer ................................................................................................................. 10-239Figure 10-14 Full debug and trace .......................................................................................................... 10-240Figure 10-15 Debug Activities ................................................................................................................. 10-240Figure 10-16 DTSL Options .................................................................................................................... 10-241Figure 10-17 Device hierarchy ................................................................................................................ 10-242Figure 10-18 Devices Panel .................................................................................................................... 10-243Figure 10-19 Autodetect settings ............................................................................................................ 10-246Figure 10-20 Configuration Database ..................................................................................................... 10-249Figure 10-21 Model Devices and Cluster Configuration tab ................................................................... 10-252Figure 10-22 Adding a configuration database ....................................................................................... 10-253Figure 10-23 Configuration Database panel .......................................................................................... 10-256Figure 11-1 App Console view .............................................................................................................. 11-263Figure 11-2 ARM Asm Info view ............................................................................................................ 11-265Figure 11-3 ARM assembler editor ....................................................................................................... 11-266Figure 11-4 Breakpoints view showing breakpoints and sub-breakpoints ............................................ 11-268Figure 11-5 C/C++ editor ....................................................................................................................... 11-272Figure 11-6 Show disassembly for selected source line ....................................................................... 11-274Figure 11-7 Commands view ................................................................................................................ 11-275Figure 11-8 Debug Control view ............................................................................................................ 11-278Figure 11-9 Show in Stack option ......................................................................................................... 11-282Figure 11-10 Stack view showing information for a selected core .......................................................... 11-282Figure 11-11 Stack view locked to a selected context ............................................................................ 11-283Figure 11-12 Disassembly view .............................................................................................................. 11-285Figure 11-13 Events view (Shown with all ports enabled for an ETB:ITM trace source) ....................... 11-289Figure 11-14 Event Viewer Settings (Shown with all Masters and Channels enabled for an ETR:STM trace
source) ............................................................................................................................... 11-291Figure 11-15 Expressions view ............................................................................................................... 11-294Figure 11-16 Functions view ................................................................................................................... 11-298Figure 11-17 History view ........................................................................................................................ 11-300Figure 11-18 Memory view ...................................................................................................................... 11-302Figure 11-19 Memory view with Show Cache option enabled ................................................................ 11-304Figure 11-20 Memory view preferences .................................................................................................. 11-306Figure 11-21 MMU Translation tab view .................................................................................................. 11-308Figure 11-22 MMU Tables tab view ......................................................................................................... 11-309Figure 11-23 Memory Map tab view ........................................................................................................ 11-310Figure 11-24 MMU settings ..................................................................................................................... 11-310Figure 11-25 Modules view showing shared libraries ............................................................................. 11-312Figure 11-26 Registers view (with all columns displayed) ....................................................................... 11-314Figure 11-27 Search for registers ............................................................................................................ 11-315Figure 11-28 Registers access rights ...................................................................................................... 11-316Figure 11-29 OS Data view (showing Keil CMSIS-RTOS RTX Tasks) ................................................... 11-319
ARM DUI0446Z Copyright © 2010-2016 ARM Limited or its affiliates. All rightsreserved.
12
Non-Confidential
Figure 11-30 Overlays view ..................................................................................................................... 11-320Figure 11-31 Cache Data view (showing L1 TLB cache) ........................................................................ 11-321Figure 11-32 Screen buffer parameters .................................................................................................. 11-323Figure 11-33 Screen view ....................................................................................................................... 11-324Figure 11-34 Scripts view ........................................................................................................................ 11-326Figure 11-35 Target view ......................................................................................................................... 11-329Figure 11-36 Trace view with a scale of 100:1 ........................................................................................ 11-331Figure 11-37 Trace Control view ............................................................................................................. 11-334Figure 11-38 Variables view .................................................................................................................... 11-337Figure 11-39 Timed Auto-Refresh Properties dialog box ........................................................................ 11-343Figure 11-40 Memory Exporter dialog box .............................................................................................. 11-344Figure 11-41 Memory Importer dialog box .............................................................................................. 11-345Figure 11-42 Fill Memory dialog box ....................................................................................................... 11-346Figure 11-43 Export Trace Report dialog box ......................................................................................... 11-348Figure 11-44 Breakpoint properties dialog box ....................................................................................... 11-349Figure 11-45 Watchpoint Properties dialog box ...................................................................................... 11-352Figure 11-46 Tracepoint Properties dialog box ....................................................................................... 11-353Figure 11-47 Manage Signals dialog box ................................................................................................ 11-354Figure 11-48 Function filter dialog box .................................................................................................... 11-356Figure 11-49 Script Parameters dialog box ............................................................................................. 11-357Figure 11-50 Connection tab (Shown with connection configuration for an FVP with virtual file system support
enabled) ............................................................................................................................. 11-360Figure 11-51 Files tab (Shown with file system configuration for an application on an FVP) ................. 11-362Figure 11-52 Debugger tab (Shown with settings for application starting point and search paths) ........ 11-366Figure 11-53 OS Awareness tab ............................................................................................................. 11-367Figure 11-54 Arguments tab ................................................................................................................... 11-369Figure 11-55 New Environment Variable dialog box ............................................................................... 11-370Figure 11-56 Environment tab (Shown with environment variables configured for an FVP) .................. 11-371Figure 11-57 DTSL Configuration Editor (Shown with Trace capture method set to DSTREAM) ........... 11-372Figure 11-58 Remote Systems view ....................................................................................................... 11-375Figure 11-59 Remote System Details view ............................................................................................. 11-376Figure 11-60 Terminal view ..................................................................................................................... 11-377Figure 11-61 Remote Scratchpad ........................................................................................................... 11-378Figure 11-62 Remote Systems terminal .................................................................................................. 11-379Figure 11-63 Terminal Settings dialog box .............................................................................................. 11-380Figure 11-64 Debug Hardware Configure IP view ................................................................................... 11-382Figure 11-65 Debug Hardware Firmware Installer view .......................................................................... 11-384Figure 11-66 Connection Browser (Showing a USB connected DSTREAM) .......................................... 11-387Figure 13-1 DS-5 File Flash Architecture .............................................................................................. 13-397Figure 14-1 Eclipse preferences for mydb ............................................................................................ 14-420Figure 14-2 Custom OS awareness displayed in Eclipse Debug Configurations dialog ....................... 14-422Figure 14-3 myos waiting for symbols to be loaded .............................................................................. 14-426Figure 14-4 myos waiting for the target to stop .................................................................................... 14-427Figure 14-5 myos Enabled .................................................................................................................... 14-428Figure 14-6 myos waiting for the OS to be initialised ............................................................................ 14-429Figure 14-7 myos Debug Control view data .......................................................................................... 14-431Figure 14-8 myos Empty Tasks table .................................................................................................... 14-434Figure 14-9 myos populated Tasks table .............................................................................................. 14-435Figure 14-10 OS awareness with parameters ........................................................................................ 14-437Figure 15-1 A simple CoreSight Design ................................................................................................ 15-441
ARM DUI0446Z Copyright © 2010-2016 ARM Limited or its affiliates. All rightsreserved.
13
Non-Confidential
Figure 15-2 Initial DS-5 Debugger SW Stack ....................................................................................... 15-443Figure 15-3 Post DTSL DS-5 Debugger SW Stack .............................................................................. 15-444Figure 15-4 DTSL Configuration class hierarchy .................................................................................. 15-454Figure 15-5 DTSL Device object hierarchy ........................................................................................... 15-455Figure 15-6 DTSL Trace Source class hierarchy .................................................................................. 15-457Figure 15-7 DTSL Trace Capture Objects ............................................................................................. 15-458Figure 15-8 MEM-AP Access Ports ...................................................................................................... 15-459Figure 15-9 MEM-AP Class Hierarchy .................................................................................................. 15-460Figure 15-10 DTSL Option Classes ........................................................................................................ 15-462Figure 15-11 DSTREAM Trace Options .................................................................................................. 15-464Figure 15-12 Example use of CTI for H/W execution synchronization ................................................... 15-471Figure 15-13 Trace Generation ............................................................................................................... 15-472Figure 15-14 DTSL Trace Decoding Stages for DSTREAM ................................................................... 15-473Figure 15-15 DTSL Trace Pipeline Hierarchy ......................................................................................... 15-474Figure 15-16 ETB Trace Decode Pipeline Stages .................................................................................. 15-474Figure 15-17 Example of Multiple Trace Capture Devices ...................................................................... 15-475Figure 15-18 STM Object Model ............................................................................................................. 15-478Figure 15-19 Launcher panel reporting DTSL Jython script error ........................................................... 15-484Figure 15-20 Connection Error Dialog .................................................................................................... 15-485Figure 16-1 Load File dialog box .......................................................................................................... 16-497Figure 16-2 Load additional debug information dialog box ................................................................... 16-500
ARM DUI0446Z Copyright © 2010-2016 ARM Limited or its affiliates. All rightsreserved.
14
Non-Confidential
List of TablesARM® DS-5 Debugger User Guide
Table 3-1 Semihosting trap instructions and encodings ........................................................................ 3-96Table 4-1 DMA map register SYS_DMAPSR0 .................................................................................... 4-117Table 4-2 Control bit that remaps an area of memory ......................................................................... 4-118Table 10-1 Elements used in the components.xml file ........................................................................ 10-257Table 11-1 Function icons .................................................................................................................... 11-298Table 11-2 Files tab options available for each Debug operation ........................................................ 11-361Table 11-3 DS-5 Debugger icons ........................................................................................................ 11-388Table 11-4 Perspective icons .............................................................................................................. 11-389Table 11-5 View icons ......................................................................................................................... 11-389Table 11-6 View markers .................................................................................................................... 11-389Table 11-7 Miscellaneous icons .......................................................................................................... 11-390Table 15-1 CTI Signal Connections ..................................................................................................... 15-470
ARM DUI0446Z Copyright © 2010-2016 ARM Limited or its affiliates. All rightsreserved.
15
Non-Confidential
Preface
This preface introduces the ARM® DS-5 Debugger User Guide.
It contains the following:• About this book on page 17.
ARM DUI0446Z Copyright © 2010-2016 ARM Limited or its affiliates. All rightsreserved.
16
Non-Confidential
About this bookThis book describes how to use the debugger to debug Linux applications, bare-metal, Real-TimeOperating System (RTOS), and Linux platforms.
Using this book
This book is organized into the following chapters:
Chapter 1 Introduction to DS-5 DebuggerIntroduces DS-5 Debugger and some important debugger concepts.
Chapter 2 Configuring debug connections in DS-5 DebuggerDescribes how to configure and connect to a debug target using ARM DS-5 Debugger.
Chapter 3 Controlling Target ExecutionDescribes how to control the target when certain events occur or when certain conditions are met.
Chapter 4 Working with the Target Configuration EditorDescribes how to use the editor when developing a project for an ARM target.
Chapter 5 Examining the TargetThis chapter describes how to examine registers, variables, memory, and the call stack.
Chapter 6 Debugging Embedded SystemsGives an introduction to debugging embedded systems.
Chapter 7 Debugging with ScriptsDescribes how to use scripts containing debugger commands to enable you to automatedebugging operations.
Chapter 8 Running DS-5 Debugger from the operating system command-line or from ascript
This chapter describes how to use DS-5 Debugger from the operating system command-line orfrom a script.
Chapter 9 Working with the Snapshot ViewerThis chapter describes how to work with the Snapshot Viewer.
Chapter 10 Platform ConfigurationYou can configure models and hardware platforms using DS-5.
Chapter 11 DS-5 Debug Perspectives and ViewsDescribes the DS-5 Debug perspective and related views in the Eclipse Integrated DevelopmentEnvironment (IDE).
Chapter 12 TroubleshootingDescribes how to diagnose problems when debugging applications using DS-5 Debugger.
Chapter 13 File-based Flash Programming in ARM DS-5Describes the file-based flash programming options available in DS-5.
Chapter 14 Writing OS Awareness for DS-5 DebuggerDescribes the OS awareness feature available in DS-5.
Chapter 15 Debug and Trace Services Layer (DTSL)Describes the DS-5 Debugger Debug and Trace Services Layer (DTSL).
Chapter 16 ReferenceLists other information that might be useful when working with DS-5 Debugger.
Preface About this book
ARM DUI0446Z Copyright © 2010-2016 ARM Limited or its affiliates. All rightsreserved.
17
Non-Confidential
Glossary
The ARM Glossary is a list of terms used in ARM documentation, together with definitions for thoseterms. The ARM Glossary does not contain terms that are industry standard unless the ARM meaningdiffers from the generally accepted meaning.
See the ARM Glossary for more information.
Typographic conventions
italicIntroduces special terminology, denotes cross-references, and citations.
boldHighlights interface elements, such as menu names. Denotes signal names. Also used for termsin descriptive lists, where appropriate.
monospaceDenotes text that you can enter at the keyboard, such as commands, file and program names,and source code.
monospaceDenotes a permitted abbreviation for a command or option. You can enter the underlined textinstead of the full command or option name.
monospace italicDenotes arguments to monospace text where the argument is to be replaced by a specific value.
monospace boldDenotes language keywords when used outside example code.
<and>Encloses replaceable terms for assembler syntax where they appear in code or code fragments.For example:
MRC p15, 0, <Rd>, <CRn>, <CRm>, <Opcode_2>
SMALL CAPITALS
Used in body text for a few terms that have specific technical meanings, that are defined in theARM glossary. For example, IMPLEMENTATION DEFINED, IMPLEMENTATION SPECIFIC, UNKNOWN, andUNPREDICTABLE.
Feedback
Feedback on this product
If you have any comments or suggestions about this product, contact your supplier and give:• The product name.• The product revision or version.• An explanation with as much information as you can provide. Include symptoms and diagnostic
procedures if appropriate.
Feedback on content
If you have comments on content then send an e-mail to [email protected]. Give:
• The title ARM® DS-5 Debugger User Guide.• The number ARM DUI0446Z.• If applicable, the page number(s) to which your comments refer.• A concise explanation of your comments.
ARM also welcomes general suggestions for additions and improvements. Note
ARM tests the PDF only in Adobe Acrobat and Acrobat Reader, and cannot guarantee the quality of therepresented document when used with any other PDF reader.
Preface About this book
ARM DUI0446Z Copyright © 2010-2016 ARM Limited or its affiliates. All rightsreserved.
18
Non-Confidential

Other information
• ARM Information Center.• ARM Technical Support Knowledge Articles.• Support and Maintenance.• ARM Glossary.
Preface About this book
ARM DUI0446Z Copyright © 2010-2016 ARM Limited or its affiliates. All rightsreserved.
19
Non-Confidential
Chapter 1Introduction to DS-5 Debugger
Introduces DS-5 Debugger and some important debugger concepts.
It contains the following sections:• 1.1 Overview: DS-5 Debugger and important concepts on page 1-21.• 1.2 Overview: ARM® CoreSight™ debug and trace components on page 1-22.• 1.3 Overview: Debugging multi-core (SMP and AMP), big.LITTLE™ , and multi-cluster targets
on page 1-23.• 1.4 Overview: Debugging ARM®-based Linux applications on page 1-27.• 1.5 Overview: Linux application rewind on page 1-28.• 1.6 Debugger concepts on page 1-30.
ARM DUI0446Z Copyright © 2010-2016 ARM Limited or its affiliates. All rightsreserved.
1-20
Non-Confidential
1.1 Overview: DS-5 Debugger and important conceptsDS-5 Debugger is part of ARM® DS-5 Development Studio and helps you find the cause of softwarebugs on ARM processor-based targets and Fixed Virtual Platform (FVP) targets.
From device bring-up to application debug, it can be used to develop code on an RTL simulator, virtualplatform, and hardware, to help get your products to market quickly.
DS-5 Debugger supports:
• Loading images and symbols.• Running images.• Breakpoints and watchpoints.• Source and instruction level stepping.• CoreSight and non-CoreSight trace (Embedded Trace Macrocell Architecture Specification v3.0 and
above).• Accessing variables and register values.• Viewing the contents of memory.• Navigating the call stack.• Handling exceptions and Linux signals.• Debugging bare-metal code.• Debugging multi-threaded Linux applications.• Debugging the Linux kernel and Linux kernel modules.• Debugging multicore and multi-cluster systems, including big.LITTLE.• Debugging Real-Time Operating Systems (RTOSs).• Debugging from the command-line.• Performance analysis using Streamline.• A comprehensive set of debugger commands that can be executed in the Eclipse Integrated
Development Environment (IDE), script files, or a command-line console.• GDB debugger commands, making the transition from open source tools easier.• A small subset of third party CMM-style commands sufficient for running target initialization scripts.
Using DS-5 Debugger, you can debug bare-metal and Linux applications with comprehensive andintuitive views, including synchronized source and disassembly, call stack, memory, registers,expressions, variables, threads, breakpoints, and trace.
To help you get started, follow these tutorials which show you how to run and debug applications inDS-5:• Getting Started with ARM® DS-5.• Debugging bare-metal applications on an FVP using DS-5 and GCC compiler.• Linux application debugging using ARM® DS-5.
1 Introduction to DS-5 Debugger1.1 Overview: DS-5 Debugger and important concepts
ARM DUI0446Z Copyright © 2010-2016 ARM Limited or its affiliates. All rightsreserved.
1-21
Non-Confidential
1.2 Overview: ARM® CoreSight™ debug and trace componentsCoreSight™ defines a set of hardware components for ARM-based SoCs. DS-5 Debugger uses theCoreSight components in your SoC to provide debug and performance analysis features.
Examples of common CoreSight components include:
• DAP: Debug Access Port• ECT: Embedded Cross Trigger• TMC: Trace Memory Controller
— ETB: Embedded Trace Buffer— ETF: Embedded Trace FIFO— ETR: Embedded Trace Router
• ETM: Embedded Trace Macrocell• PTM: Program Trace Macrocell• ITM: Instrumentation Trace Macrocell• STM: System Trace Macrocell
Examples of how these components are used by DS-5 Debugger include:• The Trace view displays data collected from PTM and ETM components.• The Events view displays data collected from ITM and STM components.• Debug connections can make use of the ECT to provide synchronized starting and stopping of groups
of cores, for example, stop all the cores in an SMP group simultaneously, or halt heterogeneous coressimultaneously to allow whole system debug at a particular point in time.
If you are using an SoC that is supported out-of-the-box with DS-5 Debugger, then you just need toselect the correct platform (SoC) in the Debug Configuration dialog to configure a debug connection. Ifyou are using an SoC that is not supported by DS-5 Debugger by default, then you must first define acustom platform in DS-5 Debugger's configuration database using the Platform Configuration Editortool.
For all platforms, whether built-in or manually created, you can use the Platform Configuration Editor(PCE) to easily define the debug topology between various components available on the platform. Seethe Platform Configuration Editor on page 10-230 for details.
1 Introduction to DS-5 Debugger1.2 Overview: ARM® CoreSight™ debug and trace components
ARM DUI0446Z Copyright © 2010-2016 ARM Limited or its affiliates. All rightsreserved.
1-22
Non-Confidential
1.3 Overview: Debugging multi-core (SMP and AMP), big.LITTLE™ , and multi-cluster targets
DS-5 Debugger is developed with multicore debug in mind for bare-metal, Linux kernel, or application-level software development.
Awareness for Symmetric Multi-Processing (SMP), Asymmetric Multi-Processing (AMP), andbig.LITTLE™ configurations is embedded in DS-5 Debugger, allowing you to see which core, or cluster athread is executing on.
When debugging applications in DS-5 Debugger, multicore configurations such as SMP or big.LITTLErequire no special setup process. DS-5 Debugger includes predefined configurations, backed up by thePlatform Configuration Editor on page 10-230 which enables further customization. The nature of theconnection determines how DS-5 Debugger behaves, for example stopping and starting all coressimultaneously in a SMP system.
1.3.1 Debugging SMP systems
From the point of view of DS-5 Debugger, Symmetric Multi Processing (SMP) refers to a set ofarchitecturally identical cores that are tightly coupled together and used as a single multi-core executionblock. Also, from the point of view of the debugger, they must be started and halted together.
DS-5 Debugger expects an SMP system to meet the following requirements:• The same ELF image running on all processors.• All processors must have identical debug hardware. For example, the number of hardware breakpoint
and watchpoint resources must be identical.• Breakpoints and watchpoints must only be set in regions where all processors have identical physical
and virtual memory maps. Processors with separate instances of identical peripherals mapped to thesame address are considered to meet this requirement. Private peripherals of ARM multicoreprocessors is a typical example.
Configuring and connecting
To enable SMP support in the debugger, you must first configure a debug session in the DebugConfigurations dialog. Configuring a single SMP connection is all that you require to enable SMPsupport in the debugger.
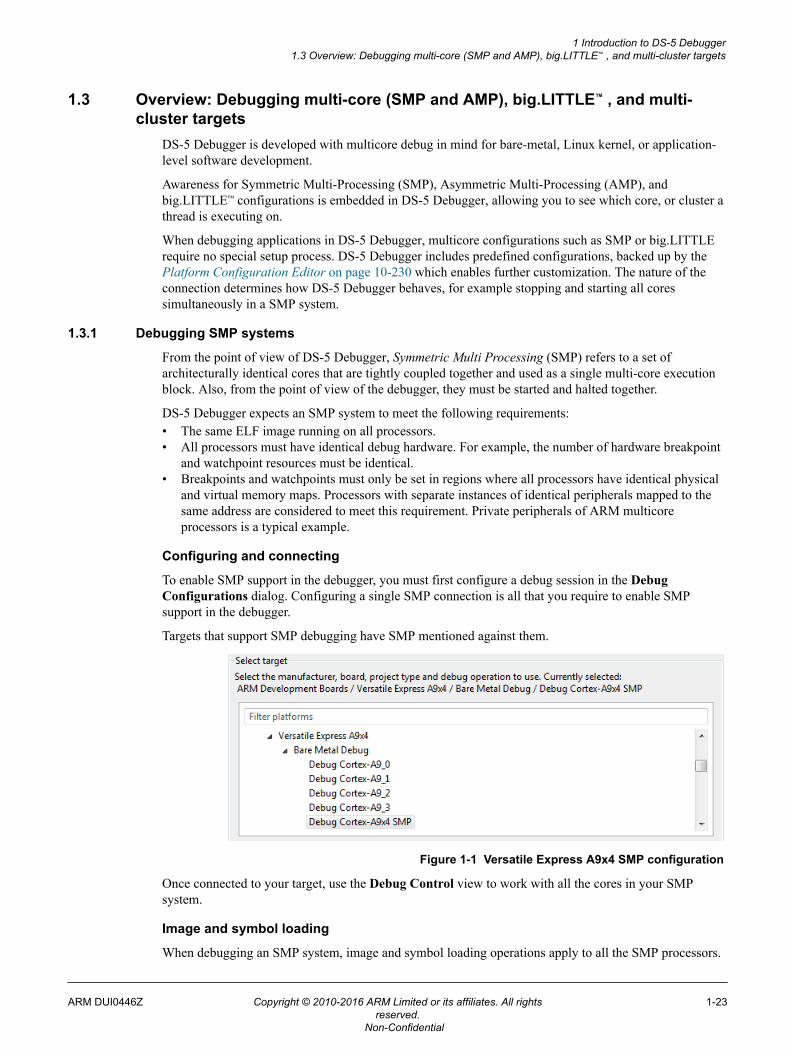
Targets that support SMP debugging have SMP mentioned against them.
Figure 1-1 Versatile Express A9x4 SMP configuration
Once connected to your target, use the Debug Control view to work with all the cores in your SMPsystem.
Image and symbol loading
When debugging an SMP system, image and symbol loading operations apply to all the SMP processors.
1 Introduction to DS-5 Debugger1.3 Overview: Debugging multi-core (SMP and AMP), big.LITTLE™ , and multi-cluster targets
ARM DUI0446Z Copyright © 2010-2016 ARM Limited or its affiliates. All rightsreserved.
1-23
Non-Confidential
For image loading, this means that the image code and data are written to memory once, through one ofthe processors, and are assumed to be accessible through the other processors at the same addressbecause they share the same memory.
For symbol loading, this means that debug information is loaded once and is available when debuggingany of the processors.
Running, stepping, and stopping
When debugging an SMP system, attempting to run one processor automatically starts running all theother processors in the system. Similarly, when one processor stops, either because you requested it orbecause of an event such as a breakpoint being hit, then all the other processors in the system stop.
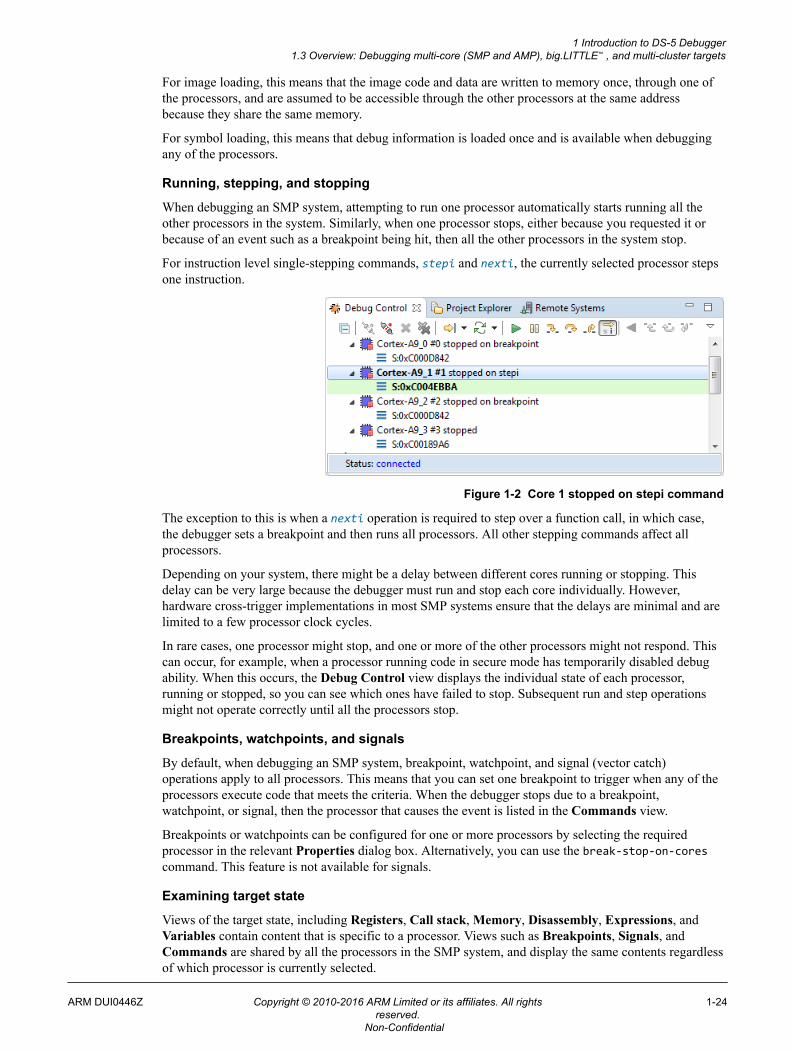
For instruction level single-stepping commands, stepi and nexti, the currently selected processor stepsone instruction.
Figure 1-2 Core 1 stopped on stepi command
The exception to this is when a nexti operation is required to step over a function call, in which case,the debugger sets a breakpoint and then runs all processors. All other stepping commands affect allprocessors.
Depending on your system, there might be a delay between different cores running or stopping. Thisdelay can be very large because the debugger must run and stop each core individually. However,hardware cross-trigger implementations in most SMP systems ensure that the delays are minimal and arelimited to a few processor clock cycles.
In rare cases, one processor might stop, and one or more of the other processors might not respond. Thiscan occur, for example, when a processor running code in secure mode has temporarily disabled debugability. When this occurs, the Debug Control view displays the individual state of each processor,running or stopped, so you can see which ones have failed to stop. Subsequent run and step operationsmight not operate correctly until all the processors stop.
Breakpoints, watchpoints, and signals
By default, when debugging an SMP system, breakpoint, watchpoint, and signal (vector catch)operations apply to all processors. This means that you can set one breakpoint to trigger when any of theprocessors execute code that meets the criteria. When the debugger stops due to a breakpoint,watchpoint, or signal, then the processor that causes the event is listed in the Commands view.
Breakpoints or watchpoints can be configured for one or more processors by selecting the requiredprocessor in the relevant Properties dialog box. Alternatively, you can use the break-stop-on-corescommand. This feature is not available for signals.
Examining target state
Views of the target state, including Registers, Call stack, Memory, Disassembly, Expressions, andVariables contain content that is specific to a processor. Views such as Breakpoints, Signals, andCommands are shared by all the processors in the SMP system, and display the same contents regardlessof which processor is currently selected.
1 Introduction to DS-5 Debugger1.3 Overview: Debugging multi-core (SMP and AMP), big.LITTLE™ , and multi-cluster targets
ARM DUI0446Z Copyright © 2010-2016 ARM Limited or its affiliates. All rightsreserved.
1-24
Non-Confidential
Trace
If you are using a connection that enables trace support, you can view trace for each of the processors inyour system using the Trace view.
By default, the Trace view shows trace for the processor that is currently selected in the Debug Controlview. Alternatively, you can choose to link a Trace view to a specific processor by using the Linked:context toolbar option for that Trace view. Creating multiple Trace views linked to specific processorsenables you to view the trace from multiple processors at the same time.
Note
The indexes in the different Trace views do not necessarily represent the same point in time for differentprocessors.
1.3.2 Debugging AMP Systems
From the point of view of DS-5 Debugger, Asymmetric Multi Processing (AMP) refers to a set of coreswhich operate in an uncoupled manner. The cores can be of different architectures or of the samearchitecture but not operating in an SMP configuration. Also, from the point of view of the debugger, itdepends on the implementation whether the cores need to be started or halted together.
An example of this might be a Cortex-A5 device coupled with a Cortex-M4, combining the benefits ofan MCU running an RTOS which provides low-latency interrupt with an application processor runningLinux. These are often found in industrial applications where a rich user-interface might need to interactclosely with a safety-critical control system, combining multiple cores into an integrated SoC forefficiency gains.
Bare metal debug on AMP Systems
DS-5 Debugger supports simultaneous debug of the cores in AMP devices. In this case, you need tolaunch a debugger connection to each one of the cores and clusters in the system. Each one of theseconnections is treated independently, so images, debug symbols, and OS awareness are kept separate foreach connection. For instance, you will normally load an image and its debug symbols for each AMPprocessor. With multiple debug sessions active, you can compare content in the Registers, Disassembly,and Memory views by opening multiple views and linking them to multiple connections, allowing youto view the state of each processor at the same time.
It is possible to connect to a system in which there is a cluster or big.LITTLE subsystem working in SMPmode, for example, running Linux, with extra processors working in AMP mode for example, runningtheir own bare-metal software or an RTOS. DS-5 Debugger is capable of supporting these devices by justconnecting the debugger to each core or subsystem separately.
1.3.3 Debugging big.LITTLE™ Systems
A big.LITTLE system optimizes for both high performance and low power consumption over a widevariety of workloads. It achieves this by including one or more high performance processors alongsideone or more low power processors.
Awareness for big.LITTLE configurations is built into DS-5 Debugger, allowing you to establish a bare-metal, Linux kernel, or Linux application debug connection, just as you would for a single coreprocessor.
Note
For the software required to enable big.LITTLE support in your own OS, visit the big.LITTLE Linaro gitrepository.
1 Introduction to DS-5 Debugger1.3 Overview: Debugging multi-core (SMP and AMP), big.LITTLE™ , and multi-cluster targets
ARM DUI0446Z Copyright © 2010-2016 ARM Limited or its affiliates. All rightsreserved.
1-25
Non-Confidential
Bare-metal debug on big.LITTLE™ systems
For bare-metal debugging on big.LITTLE systems, you can establish an SMP connection within DS-5Debugger. In this case, all the processors in the big.LITTLE system are brought under the control of thedebugger. The debugger monitors the power state of each processor as it runs and displays it in theDebug Control view and on the command -line. Processors that are powered-down are visible to thedebugger, but cannot be accessed. The remaining functionality of the debugger is equivalent to an SMPconnection to a homogenous cluster of cores.
Linux application debug on big.LITTLE™ systems
For Linux application debugging on big.LITTLE systems, you can establish a gdbserver connectionwithin DS-5 Debugger. Linux applications are typically unaware of whether they are running on a bigprocessor or a LITTLE processor because this is hidden by the operating system. Therefore, there is nodifference when debugging a Linux application on a big.LITTLE system as compared to applicationdebug on any other system.
1 Introduction to DS-5 Debugger1.3 Overview: Debugging multi-core (SMP and AMP), big.LITTLE™ , and multi-cluster targets
ARM DUI0446Z Copyright © 2010-2016 ARM Limited or its affiliates. All rightsreserved.
1-26
Non-Confidential
1.4 Overview: Debugging ARM®-based Linux applicationsDS-5 Debugger supports debugging Linux applications and libraries that are written in C, C++, andARM assembly.
The integrated suite of tools in DS-5 facilitates rapid development of optimal code for your target device.
For Linux applications, communication between the debugger and the debugged application is achievedusing gdbserver. As an alternative to Linux application debug, you also can use undodb-server insteadof gdbserver. undodb-server provides the ability to debug backwards as well as forwards, and isknown as Application Rewind. See Application Rewind on page 1-28 for more information.
Related concepts6.9 About debugging shared libraries on page 6-153.
Related tasks2.5 Configuring a connection to a Linux application using gdbserver on page 2-46.2.7.2 Configuring a connection to a built-in Fixed Virtual Platform (FVP) model for Linux applicationdebug on page 2-53.2.6 Configuring a connection to a Linux kernel on page 2-48.
1 Introduction to DS-5 Debugger1.4 Overview: Debugging ARM®-based Linux applications
ARM DUI0446Z Copyright © 2010-2016 ARM Limited or its affiliates. All rightsreserved.
1-27
Non-Confidential
1.5 Overview: Linux application rewindApplication rewind is a DS-5 Debugger feature that allows you to debug backwards as well as forwards,through the execution of Linux applications.
Using this feature, you can both run and step, including hitting breakpoints and watchpoints. You canalso view the contents of recorded memory, registers, and variables at any point in your application'sexecution. Debugging backwards, can cut down the time it takes to find a bug from hours to minutessince you do not have to recreate the same steps that caused a crash, which can be difficult in the case ofnon-deterministic bugs.
For errors as simple as an uninitialized or out-of-range array index, or application crashes caused by nullpointers, the application rewind feature can prove extremely useful, especially since a crash might noteven occur in the same source file as the one with the bug.
Note
Application Rewind is only supported in DS-5 Professional Edition and DS-5 Ultimate Edition.
Application rewind versus conventional debugging techniques
Trace is an extremely effective tool for debugging system issues as it can record a complete picture ofexecution and is non-intrusive. Bare-metal or kernel debugging uses trace for this purpose by recordinginstructions that are executed on a processor over a period of time.
However, from the debugger's view, it is not practical to use trace on Linux applications, because:• In production systems, trace might not be exposed, so cannot be accessed.• It can be time-consuming to track an application that migrates between cores.• On a multicore SoC, a trace buffer can fill rapidly, limiting the amount of time available for recording
program execution. Also, in situations where a bug occurs long before the application crash, the tracebuffer might not be large enough to capture the full event.
Classic printf debugging techniques present a different set of challenges. It is difficult to know howoften you need to stage printf statements and the statement might have a “probe-effect” on your code.Also, rebuilding an application every time an annotation is added can be time-consuming.
For these reasons, when debugging user-space applications over TCP/IP or USB, a different approach isrequired.
How does application rewind work?
Application rewind debug sessions are launched from the debug configurations panel and can be eithercontrolled from the graphical debugger or the command line debugger.
Application rewind works in a similar way to standard debugging of Linux applications using a TCP/IPor USB connection, though instead of using gdbserver, it uses a custom debug agent. This customdebug agent records a copy-on-write snapshot of the application being debugged, along with non-deterministic inputs. This allows the debugger to reconstruct a complete picture of program execution.
Note
Debugging your application using application rewind results in increased memory consumption on yourtarget and might slow down your application. The exact impact is dependent on the behavior of yourapplication. Applications that perform large amounts of I/O are likely to experience increased memoryconsumption during the recording process.
Once a bug is recorded, replay is deterministic, with exactly the same behavior observed with eachrewind and play.
1 Introduction to DS-5 Debugger1.5 Overview: Linux application rewind
ARM DUI0446Z Copyright © 2010-2016 ARM Limited or its affiliates. All rightsreserved.
1-28
Non-Confidential
Related concepts2.8 Configuring application rewind for Linux on page 2-57.
Related tasks2.8.1 Connecting to an existing application and starting an application rewind session on page 2-58.2.8.2 Downloading your application and application rewind server to the target system on page 2-60.2.8.3 Starting the application rewind server and debugging the target-resident applicationon page 2-61.2.8.1 Connecting to an existing application and starting an application rewind session on page 2-58.2.8.2 Downloading your application and application rewind server to the target system on page 2-60.2.8.3 Starting the application rewind server and debugging the target-resident applicationon page 2-61.
Related references2.1 Overview: Debug connections in DS-5 Debugger on page 2-34.
1 Introduction to DS-5 Debugger1.5 Overview: Linux application rewind
ARM DUI0446Z Copyright © 2010-2016 ARM Limited or its affiliates. All rightsreserved.
1-29
Non-Confidential
1.6 Debugger conceptsLists some of the useful concepts to be aware of when working with DS-5 Debugger.
AMPAsymmetric Multi-Processing (AMP) system has multiple processors that may be differentarchitectures. See 1.3.2 Debugging AMP Systems on page 1-25 for more information.
Bare-metalA bare-metal embedded application is one which does not run on an OS.
BBBThe old name for the MTB.
CADIComponent Architecture Debug Interface. This is the API used by debuggers to control models.
Configuration databaseThe configuration database is where DS-5 Debugger stores information about the processors,devices, and boards it can connect to.
The database exists as a series of .xml files, python scripts, .rvc files, .rcf files, and othermiscellaneous files within the <DS-5 installation directory>/sw/debugger/configdb/directory.
DS-5 comes pre-configured with support for a wide variety of devices out-of-the-box, and youcan view these within the Debug Configuration dialog within Eclipse IDE.
You can also add support for your own devices using the Platform Configuration Editor (PCE)tool.
ContextsEach processor in the target can run more than one process. However, the processor onlyexecutes one process at any given time. Each process uses values stored in variables, registers,and other memory locations. These values can change during the execution of the process.
The context of a process describes its current state, as defined principally by the call stack thatlists all the currently active calls.
The context changes when:• A function is called.• A function returns.• An interrupt or an exception occurs.
Because variables can have class, local, or global scope, the context determines which variablesare currently accessible. Every process has its own context. When execution of a process stops,you can examine and change values in its current context.
CTIThe Cross Trigger Interface (CTI) combines and maps trigger requests, and broadcasts them toall other interfaces on the Embedded Cross Trigger (ECT) sub-system. See 3.16 Cross-triggerconfiguration on page 3-94 for more information.
DAPThe Debug Access Port (DAP) is a control and access component that enables debug access tothe complete SoC through system master ports. See Debug Access Port for more information.
DebuggerA debugger is software running on a host computer that enables you to make use of a debugadapter to examine and control the execution of software running on a debug target.
1 Introduction to DS-5 Debugger1.6 Debugger concepts
ARM DUI0446Z Copyright © 2010-2016 ARM Limited or its affiliates. All rightsreserved.
1-30
Non-Confidential
Debug agentA debug agent is hardware or software, or both, that enables a host debugger to interact with atarget. For example, a debug agent enables you to read from and write to registers, read fromand write to memory, set breakpoints, download programs, run and single-step programs,program flash memory, and so on.
gdbserver is an example of a software debug agent.
Debug sessionA debug session begins when you connect the debugger to a target for debugging softwarerunning on the target and ends when you disconnect the debugger from the target.
Debug targetA debug target is an environment where your program runs. This environment can be hardware,software that simulates hardware, or a hardware emulator.
A hardware target can be anything from a mass-produced development board or electronicequipment to a prototype product, or a printed circuit board.
During the early stages of product development, if no hardware is available, a simulation orsoftware target might be used to simulate hardware behavior. A Fixed Virtual Platform (FVP) isa software model from ARM that provides functional behavior equivalent to real hardware.
Note
Even though you might run an FVP on the same host as the debugger, it is useful to think of it asa separate piece of hardware.
Also, during the early stages of product development, hardware emulators are used to verifyhardware and software designs for pre-silicon testing.
Debug adapterA debug adapter is a physical interface between the host debugger and hardware target. It acts asa debug agent. A debug adapter is normally required for bare-metal start/stop debugging realtarget hardware, for example, using JTAG.
Examples include DSTREAM and the ULINK family of debug and trace adapters.
DSTREAMARM DSTREAM combined debug and trace unit. See DSTREAM for more information..
DTSLDebug and Trace Services Layer (DTSL) is a software layer within the DS-5 Debugger stack.DTSL is implemented as a set of Java classes which are typically implemented (and possiblyextended) by Jython scripts. A typical DTSL instance is a combination of Java and Jython.ARM has made DTSL available for your own use so that you can create programs (Java orJython) to access/control the target platform.
DWARFDWARF is a debugging format used to describe programs in C and other similar programminglanguages. It is most widely associated with the ELF object format but it has been used withother object file formats.
ELFExecutable and Linkable Format (ELF) is a common standard file format for executables, objectcode, shared libraries, and core dumps.
ETBEmbedded Trace Buffer (ETB) is an optional on-chip buffer that stores trace data from differenttrace sources. You can use a debugger to retrieve captured trace data.
ETFEmbedded Trace FIFO (ETF) is a trace buffer that uses a dedicated SRAM as either a circularcapture buffer, or as a FIFO. The trace stream is captured by an ATB input that can then beoutput over an ATB output or the Debug APB interface. The ETF is a configuration option ofthe Trace Memory Controller (TMC).
1 Introduction to DS-5 Debugger1.6 Debugger concepts
ARM DUI0446Z Copyright © 2010-2016 ARM Limited or its affiliates. All rightsreserved.
1-31
Non-Confidential
ETMEmbedded Trace Macrocell (ETM) is an optional debug component that enables reconstructionof program execution. The ETM is designed to be a high-speed, low-power debug tool thatsupports trace.
ETREmbedded Trace Router (ETR) is a CoreSight component which routes trace data to systemmemory or other trace sinks, such as HSSTP.
FVPFixed Virtual Platform (FVP) enables development of software without the requirement foractual hardware. The functional behavior of the FVP is equivalent to real hardware from aprogrammers view.
ITMInstruction Trace Macrocell (ITM) is a CoreSight component which delivers codeinstrumentation output and specific hardware data streams.
jRDDIThe Java API implementation of RDDI.
JythonAn implementation of the Python language which is closely integrated with Java.
MTBMicro Trace Buffer. This is used in the Cortex-M0 and Cortex-M0+.
PTMProgram Trace Macrocell (PTM) is a CoreSight component which is paired with a core todeliver instruction only program flow trace data.
RDDIRealView Device Debug Interface (RDDI) is a C-level API which allows access to target debugand trace functionality, typically through a DSTREAM box, or a CADI model.
RVIARM Realview ICE unit, predecessor to DSTREAM.
ScopeThe scope of a variable is determined by the point within an application at which it is defined.Variables can have values that are relevant within:• A specific class only (class).• A specific function only (local).• A specific file only (static global).• The entire application (global).
SMPA Symmetric Multi-Processing (SMP) system has multiple processors with the samearchitecture. See 1.3.1 Debugging SMP systems on page 1-23 for more information.
STMSystem Trace Macrocell (STM) is a CoreSight component which delivers code instrumentationoutput and other hardware generated data streams.
TPIUTrace Port Interface Unit (TPIU) is a CoreSight component which delivers trace data to anexternal trace capture device.
TMCThe Trace Memory Controller (TMC) enables you to capture trace using:• The debug interface such as 2-pin serial wire debug.• The system memory such as a dynamic Random Access Memory (RAM)• The high-speed links that already exist in the System-on-Chip (SoC) peripheral.
1 Introduction to DS-5 Debugger1.6 Debugger concepts
ARM DUI0446Z Copyright © 2010-2016 ARM Limited or its affiliates. All rightsreserved.
1-32
Non-Confidential
Chapter 2Configuring debug connections in DS-5 Debugger
Describes how to configure and connect to a debug target using ARM DS-5 Debugger.
It contains the following sections:• 2.1 Overview: Debug connections in DS-5 Debugger on page 2-34.• 2.2 Launching DS-5 and connecting to DS-5 Debugger on page 2-36.• 2.3 Configuring a connection to a bare-metal hardware target on page 2-38.• 2.4 Configuring trace for bare-metal or Linux kernel targets on page 2-43.• 2.5 Configuring a connection to a Linux application using gdbserver on page 2-46.• 2.6 Configuring a connection to a Linux kernel on page 2-48.• 2.7 Using Fixed Virtual Platform (FVP)s with DS-5 on page 2-50.• 2.8 Configuring application rewind for Linux on page 2-57.• 2.9 Configuring an Events view connection to a bare-metal target on page 2-63.• 2.10 Exporting or importing an existing launch configuration on page 2-65.• 2.11 Disconnecting from a target on page 2-68.
ARM DUI0446Z Copyright © 2010-2016 ARM Limited or its affiliates. All rightsreserved.
2-33
Non-Confidential
2.1 Overview: Debug connections in DS-5 DebuggerYou can set up connections to debug bare-metal targets, Linux kernel, and Linux applications. You canalso use the Snapshot Viewer feature to view previously captured application states.
Bare-metal debug connectionsBare-metal targets run without an underlying operating system. To debug bare-metal targets using DS-5Debugger:• If debugging on hardware, use a debug hardware adapter connected to the host workstation and the
debug target.• If debugging on a model, use a CADI-compliant connection between the debugger and a model.• For RTL simulators and hardware emulators, use VSTREAM to create connections.
Linux kernel debug connections
DS-5 Debugger supports source-level debugging of a Linux kernel. For example, you can set breakpointsin the kernel code, step through the source, inspect the call stack, and watch variables. The connectionmethodology is similar to bare-metal debug connections.
Linux application debug connections
For Linux application debugging in DS-5 Debugger, you can connect to your target using TCP/IP orserial connection.
Before attempting to connect to your target, you need to ensure that:• gdbserver is present on the target.
Note
— If gdbserver is not installed on the target, either see the documentation for your Linuxdistribution or check with your provider.
— See the Debug System Requirements section in the latest DS-5 Release Notes for informationabout the minimum required version of gdbserver.
— For ARMv8 AArch64 targets, you need to use the AArch64 gdbserver.
• ssh daemon (sshd) must be running on the target to use the Remote System Explorer (RSE) inDS-5.
• sftp-server must be present on the target to use RSE for file transfers.• Application rewind server running on the target if you are planning to use application rewind.
Note
The application rewind server file undodb-server can be found in the DS-5_install_directory\arm\undodb\linux folder.
Snapshot Viewer
Use the Snapshot Viewer to analyze and debug a read-only representation of the application state ofyour processor using previously captured data. For more information, see Chapter 9 Working with theSnapshot Viewer on page 9-216.
This is useful in scenarios where interactive debugging with a target is not possible.
Related concepts1.4 Overview: Debugging ARM®-based Linux applications on page 1-27.9.1 About the Snapshot Viewer on page 9-217.1.5 Overview: Linux application rewind on page 1-28.
2 Configuring debug connections in DS-5 Debugger2.1 Overview: Debug connections in DS-5 Debugger
ARM DUI0446Z Copyright © 2010-2016 ARM Limited or its affiliates. All rightsreserved.
2-34
Non-Confidential
Related tasks2.3 Configuring a connection to a bare-metal hardware target on page 2-38.2.6 Configuring a connection to a Linux kernel on page 2-48.2.5 Configuring a connection to a Linux application using gdbserver on page 2-46.2.7.2 Configuring a connection to a built-in Fixed Virtual Platform (FVP) model for Linux applicationdebug on page 2-53.2.8.1 Connecting to an existing application and starting an application rewind session on page 2-58.2.8.2 Downloading your application and application rewind server to the target system on page 2-60.2.8.3 Starting the application rewind server and debugging the target-resident applicationon page 2-61.
Related referencesChapter 9 Working with the Snapshot Viewer on page 9-216.
2 Configuring debug connections in DS-5 Debugger2.1 Overview: Debug connections in DS-5 Debugger
ARM DUI0446Z Copyright © 2010-2016 ARM Limited or its affiliates. All rightsreserved.
2-35
Non-Confidential
2.2 Launching DS-5 and connecting to DS-5 DebuggerAfter installing DS-5, use the options relevant to your operating system to launch Eclipse for DS-5.Then, create a debug configuration to connect to DS-5 Debugger.
Procedure1. Launch Eclipse for DS-5:
• On Windows, select Start > All Programs > ARM DS-5 > Eclipse for DS-5.• On Linux:
— If you installed the DS-5 shortcut during installation, you can select Eclipse for DS-5 fromyour list of applications.
— To run DS-5 from the command-line:1. Open a command-line terminal.
Note
Ensure that DS-5_install_directory/bin/ is available in your PATH environmentvariable.
2. Enter eclipse at the prompt. Tip
On Linux, you can also use suite_exec to configure the environment variablescorrectly for DS-5. Run DS-5_install_directory/bin/suite_exec <shell> to open
a shell with the PATH and other environment variables correctly configured. Run suite_execwith no arguments for help. For more information, see Installing DS-5.
2. Select Window > Open Perspective > DS-5 Debug from the main menu.3. To connect to a target:
• If you have not run a debug session previously, then you must configure a connection between thedebugger and the target before you can start any debugging tasks.
• If you have run a debug session previously, then you can select a target connection in the DebugControl view and click on the Connect to Target toolbar icon.
Related tasks8.2 Command-line debugger options on page 8-204.2.8.1 Connecting to an existing application and starting an application rewind session on page 2-58.2.8.2 Downloading your application and application rewind server to the target system on page 2-60.2.8.3 Starting the application rewind server and debugging the target-resident applicationon page 2-61.2.7.2 Configuring a connection to a built-in Fixed Virtual Platform (FVP) model for Linux applicationdebug on page 2-53.2.5 Configuring a connection to a Linux application using gdbserver on page 2-46.2.6 Configuring a connection to a Linux kernel on page 2-48.2.3 Configuring a connection to a bare-metal hardware target on page 2-38.2.9 Configuring an Events view connection to a bare-metal target on page 2-63.
Related references2.1 Overview: Debug connections in DS-5 Debugger on page 2-34.11.40 Debug Configurations - Connection tab on page 11-358.11.41 Debug Configurations - Files tab on page 11-361.11.42 Debug Configurations - Debugger tab on page 11-364.11.44 Debug Configurations - Arguments tab on page 11-368.
2 Configuring debug connections in DS-5 Debugger2.2 Launching DS-5 and connecting to DS-5 Debugger
ARM DUI0446Z Copyright © 2010-2016 ARM Limited or its affiliates. All rightsreserved.
2-36
Non-Confidential

11.45 Debug Configurations - Environment tab on page 11-370.Chapter 11 DS-5 Debug Perspectives and Views on page 11-261.
2 Configuring debug connections in DS-5 Debugger2.2 Launching DS-5 and connecting to DS-5 Debugger
ARM DUI0446Z Copyright © 2010-2016 ARM Limited or its affiliates. All rightsreserved.
2-37
Non-Confidential
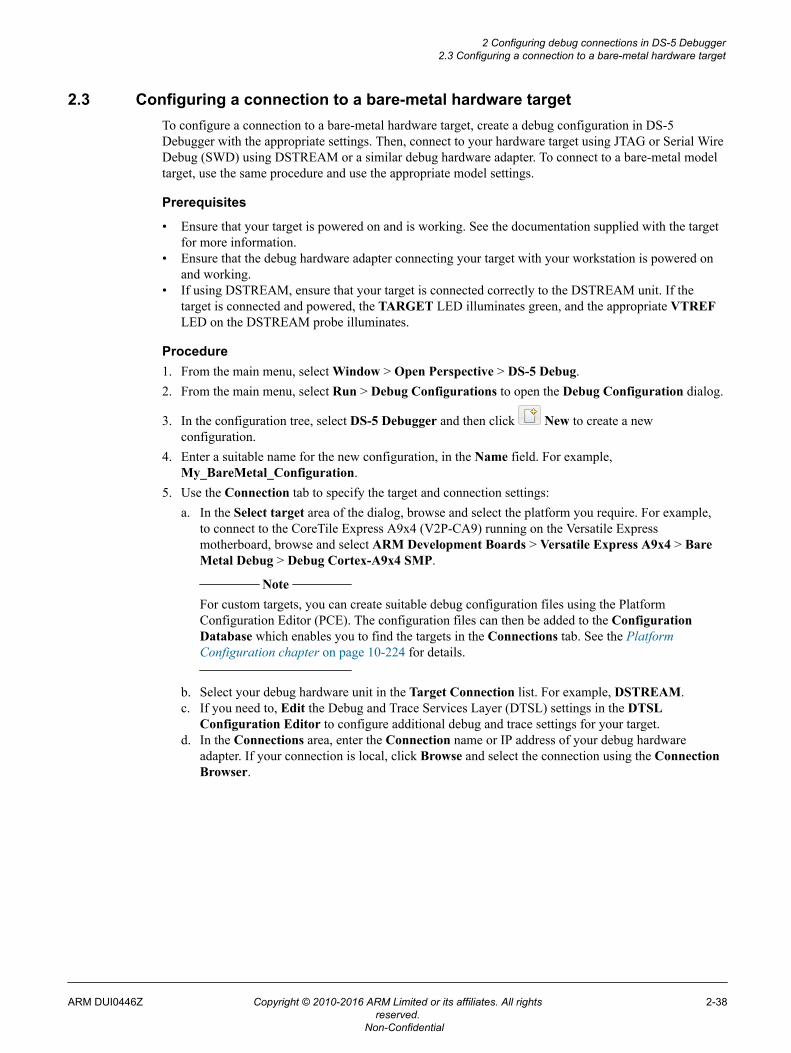
2.3 Configuring a connection to a bare-metal hardware targetTo configure a connection to a bare-metal hardware target, create a debug configuration in DS-5Debugger with the appropriate settings. Then, connect to your hardware target using JTAG or Serial WireDebug (SWD) using DSTREAM or a similar debug hardware adapter. To connect to a bare-metal modeltarget, use the same procedure and use the appropriate model settings.
Prerequisites
• Ensure that your target is powered on and is working. See the documentation supplied with the targetfor more information.
• Ensure that the debug hardware adapter connecting your target with your workstation is powered onand working.
• If using DSTREAM, ensure that your target is connected correctly to the DSTREAM unit. If thetarget is connected and powered, the TARGET LED illuminates green, and the appropriate VTREFLED on the DSTREAM probe illuminates.
Procedure1. From the main menu, select Window > Open Perspective > DS-5 Debug.2. From the main menu, select Run > Debug Configurations to open the Debug Configuration dialog.
3. In the configuration tree, select DS-5 Debugger and then click New to create a newconfiguration.
4. Enter a suitable name for the new configuration, in the Name field. For example,My_BareMetal_Configuration.
5. Use the Connection tab to specify the target and connection settings:a. In the Select target area of the dialog, browse and select the platform you require. For example,
to connect to the CoreTile Express A9x4 (V2P-CA9) running on the Versatile Expressmotherboard, browse and select ARM Development Boards > Versatile Express A9x4 > BareMetal Debug > Debug Cortex-A9x4 SMP.
Note
For custom targets, you can create suitable debug configuration files using the PlatformConfiguration Editor (PCE). The configuration files can then be added to the ConfigurationDatabase which enables you to find the targets in the Connections tab. See the PlatformConfiguration chapter on page 10-224 for details.
b. Select your debug hardware unit in the Target Connection list. For example, DSTREAM.c. If you need to, Edit the Debug and Trace Services Layer (DTSL) settings in the DTSL
Configuration Editor to configure additional debug and trace settings for your target.d. In the Connections area, enter the Connection name or IP address of your debug hardware
adapter. If your connection is local, click Browse and select the connection using the ConnectionBrowser.
2 Configuring debug connections in DS-5 Debugger2.3 Configuring a connection to a bare-metal hardware target
ARM DUI0446Z Copyright © 2010-2016 ARM Limited or its affiliates. All rightsreserved.
2-38
Non-Confidential
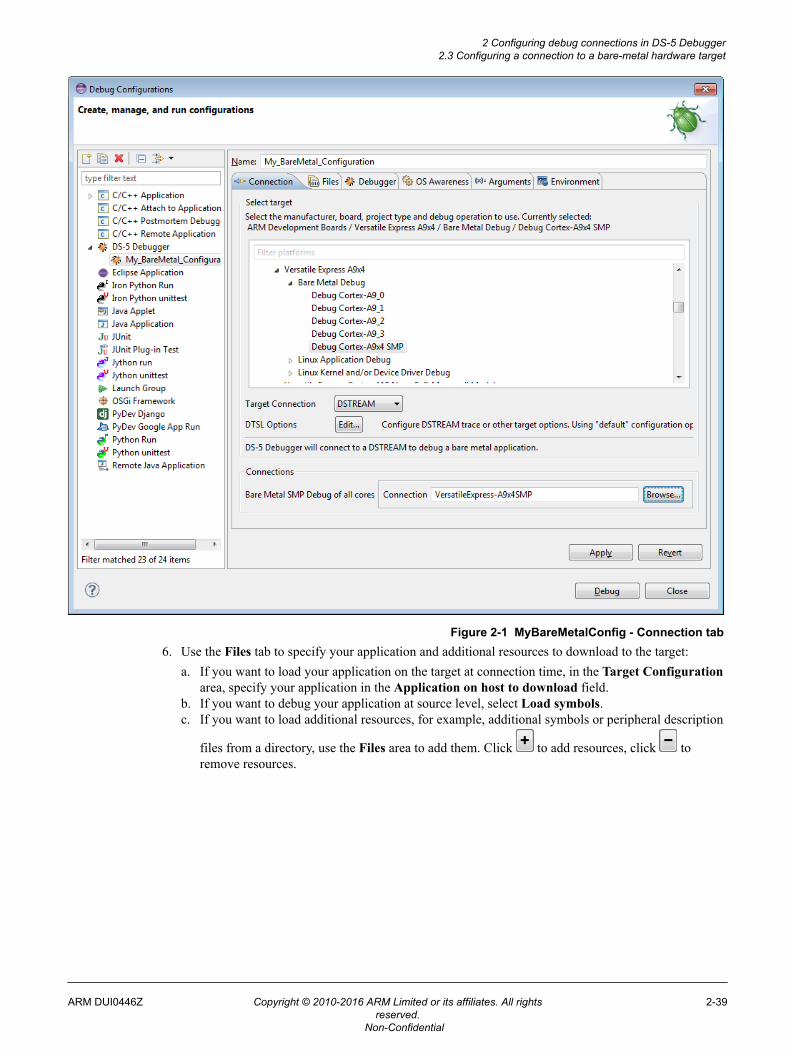
Figure 2-1 MyBareMetalConfig - Connection tab6. Use the Files tab to specify your application and additional resources to download to the target:
a. If you want to load your application on the target at connection time, in the Target Configurationarea, specify your application in the Application on host to download field.
b. If you want to debug your application at source level, select Load symbols.c. If you want to load additional resources, for example, additional symbols or peripheral description
files from a directory, use the Files area to add them. Click to add resources, click toremove resources.
2 Configuring debug connections in DS-5 Debugger2.3 Configuring a connection to a bare-metal hardware target
ARM DUI0446Z Copyright © 2010-2016 ARM Limited or its affiliates. All rightsreserved.
2-39
Non-Confidential
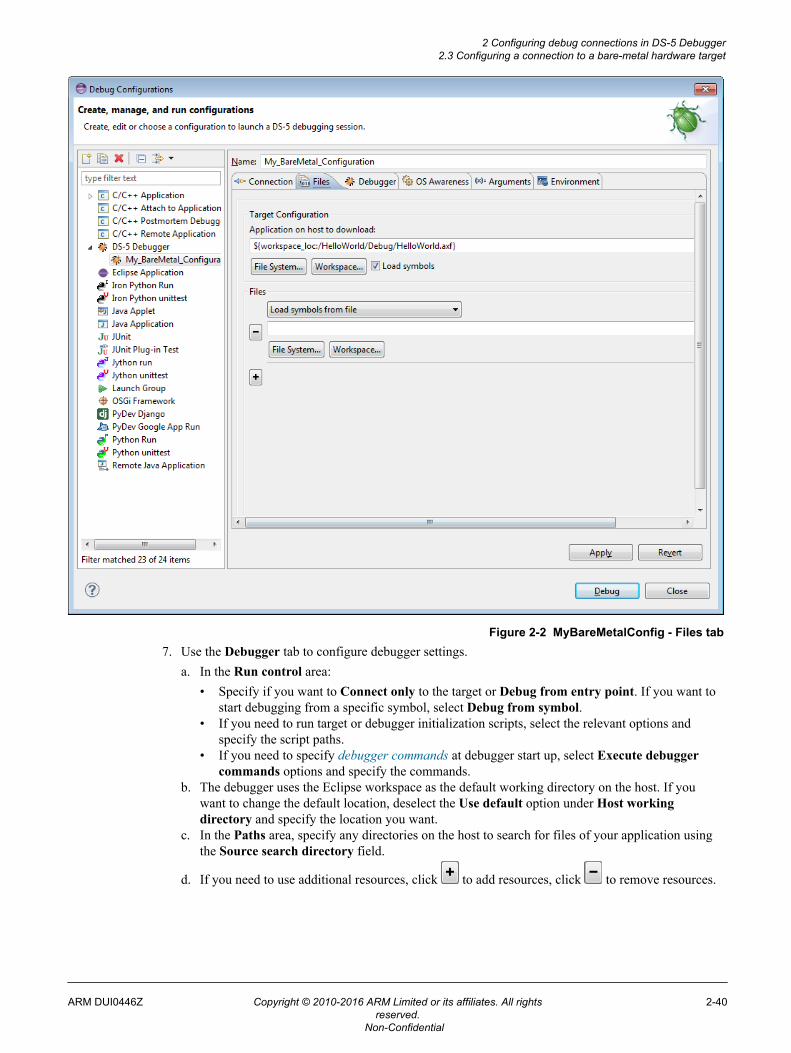
Figure 2-2 MyBareMetalConfig - Files tab7. Use the Debugger tab to configure debugger settings.
a. In the Run control area:• Specify if you want to Connect only to the target or Debug from entry point. If you want to
start debugging from a specific symbol, select Debug from symbol.• If you need to run target or debugger initialization scripts, select the relevant options and
specify the script paths.• If you need to specify debugger commands at debugger start up, select Execute debugger
commands options and specify the commands.b. The debugger uses the Eclipse workspace as the default working directory on the host. If you
want to change the default location, deselect the Use default option under Host workingdirectory and specify the location you want.
c. In the Paths area, specify any directories on the host to search for files of your application usingthe Source search directory field.
d. If you need to use additional resources, click to add resources, click to remove resources.
2 Configuring debug connections in DS-5 Debugger2.3 Configuring a connection to a bare-metal hardware target
ARM DUI0446Z Copyright © 2010-2016 ARM Limited or its affiliates. All rightsreserved.
2-40
Non-Confidential
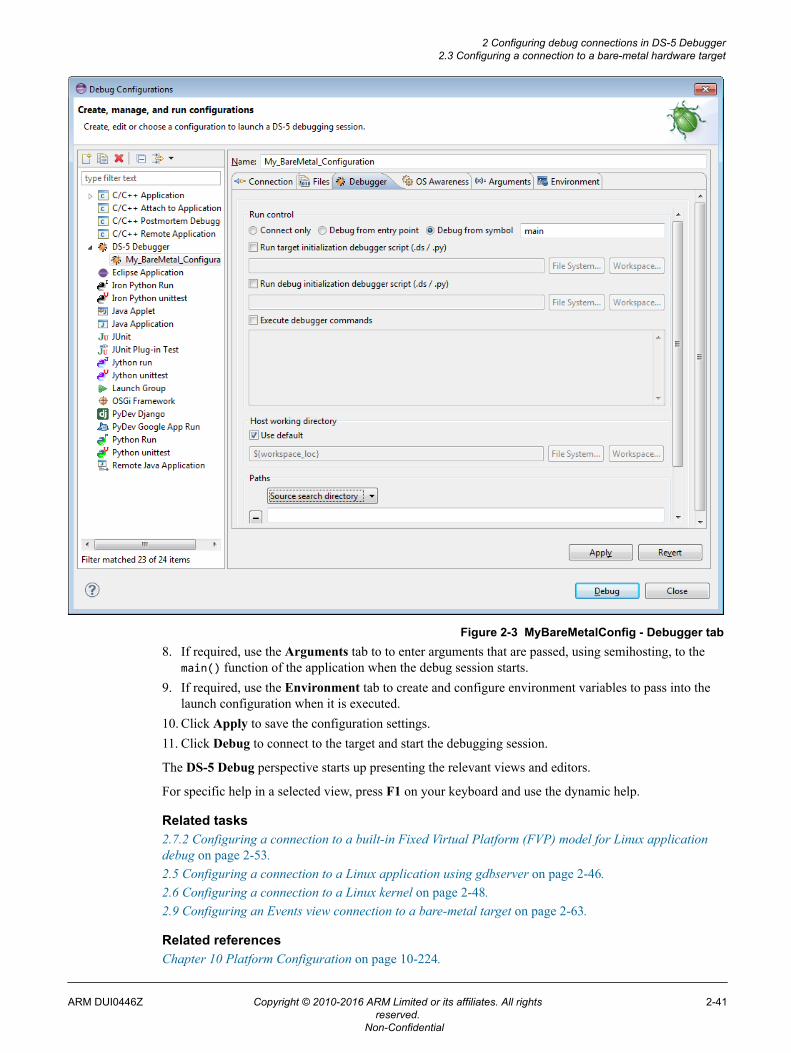
Figure 2-3 MyBareMetalConfig - Debugger tab8. If required, use the Arguments tab to to enter arguments that are passed, using semihosting, to the
main() function of the application when the debug session starts.9. If required, use the Environment tab to create and configure environment variables to pass into the
launch configuration when it is executed.10. Click Apply to save the configuration settings.11. Click Debug to connect to the target and start the debugging session.
The DS-5 Debug perspective starts up presenting the relevant views and editors.
For specific help in a selected view, press F1 on your keyboard and use the dynamic help.
Related tasks2.7.2 Configuring a connection to a built-in Fixed Virtual Platform (FVP) model for Linux applicationdebug on page 2-53.2.5 Configuring a connection to a Linux application using gdbserver on page 2-46.2.6 Configuring a connection to a Linux kernel on page 2-48.2.9 Configuring an Events view connection to a bare-metal target on page 2-63.
Related referencesChapter 10 Platform Configuration on page 10-224.
2 Configuring debug connections in DS-5 Debugger2.3 Configuring a connection to a bare-metal hardware target
ARM DUI0446Z Copyright © 2010-2016 ARM Limited or its affiliates. All rightsreserved.
2-41
Non-Confidential

11.40 Debug Configurations - Connection tab on page 11-358.11.41 Debug Configurations - Files tab on page 11-361.11.42 Debug Configurations - Debugger tab on page 11-364.11.43 Debug Configurations - OS Awareness tab on page 11-367.11.44 Debug Configurations - Arguments tab on page 11-368.11.45 Debug Configurations - Environment tab on page 11-370.
2 Configuring debug connections in DS-5 Debugger2.3 Configuring a connection to a bare-metal hardware target
ARM DUI0446Z Copyright © 2010-2016 ARM Limited or its affiliates. All rightsreserved.
2-42
Non-Confidential
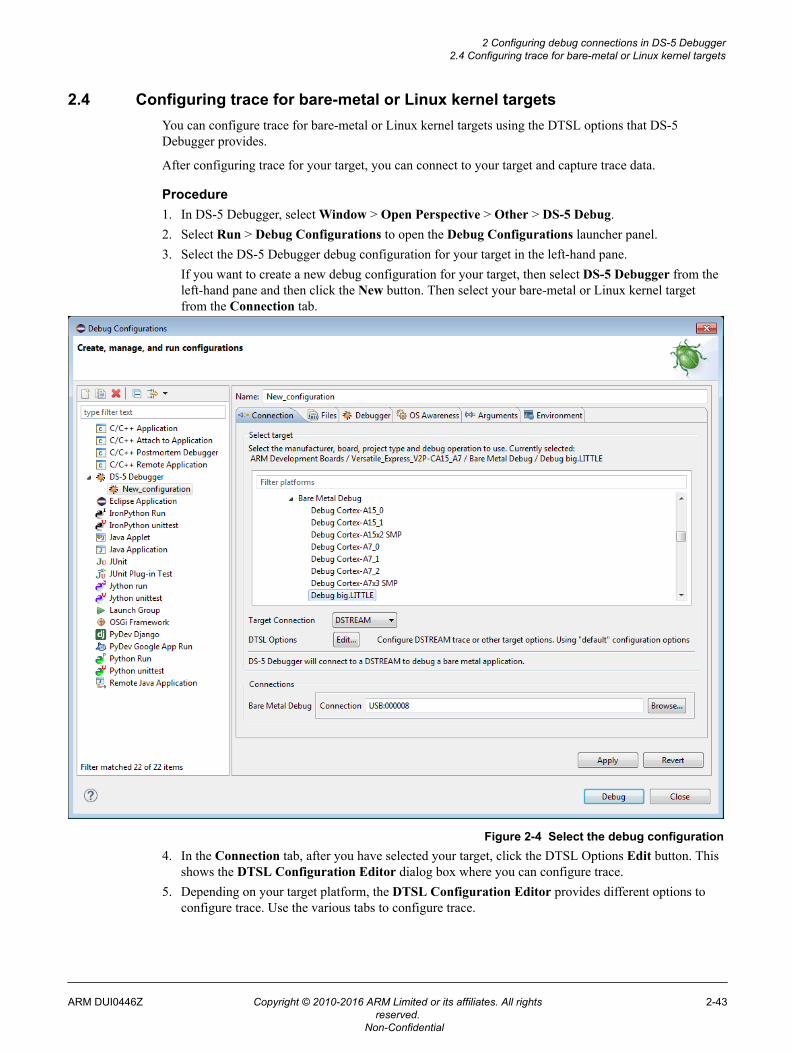
2.4 Configuring trace for bare-metal or Linux kernel targetsYou can configure trace for bare-metal or Linux kernel targets using the DTSL options that DS-5Debugger provides.
After configuring trace for your target, you can connect to your target and capture trace data.
Procedure1. In DS-5 Debugger, select Window > Open Perspective > Other > DS-5 Debug.2. Select Run > Debug Configurations to open the Debug Configurations launcher panel.3. Select the DS-5 Debugger debug configuration for your target in the left-hand pane.
If you want to create a new debug configuration for your target, then select DS-5 Debugger from theleft-hand pane and then click the New button. Then select your bare-metal or Linux kernel targetfrom the Connection tab.
Figure 2-4 Select the debug configuration4. In the Connection tab, after you have selected your target, click the DTSL Options Edit button. This
shows the DTSL Configuration Editor dialog box where you can configure trace.5. Depending on your target platform, the DTSL Configuration Editor provides different options to
configure trace. Use the various tabs to configure trace.
2 Configuring debug connections in DS-5 Debugger2.4 Configuring trace for bare-metal or Linux kernel targets
ARM DUI0446Z Copyright © 2010-2016 ARM Limited or its affiliates. All rightsreserved.
2-43
Non-Confidential
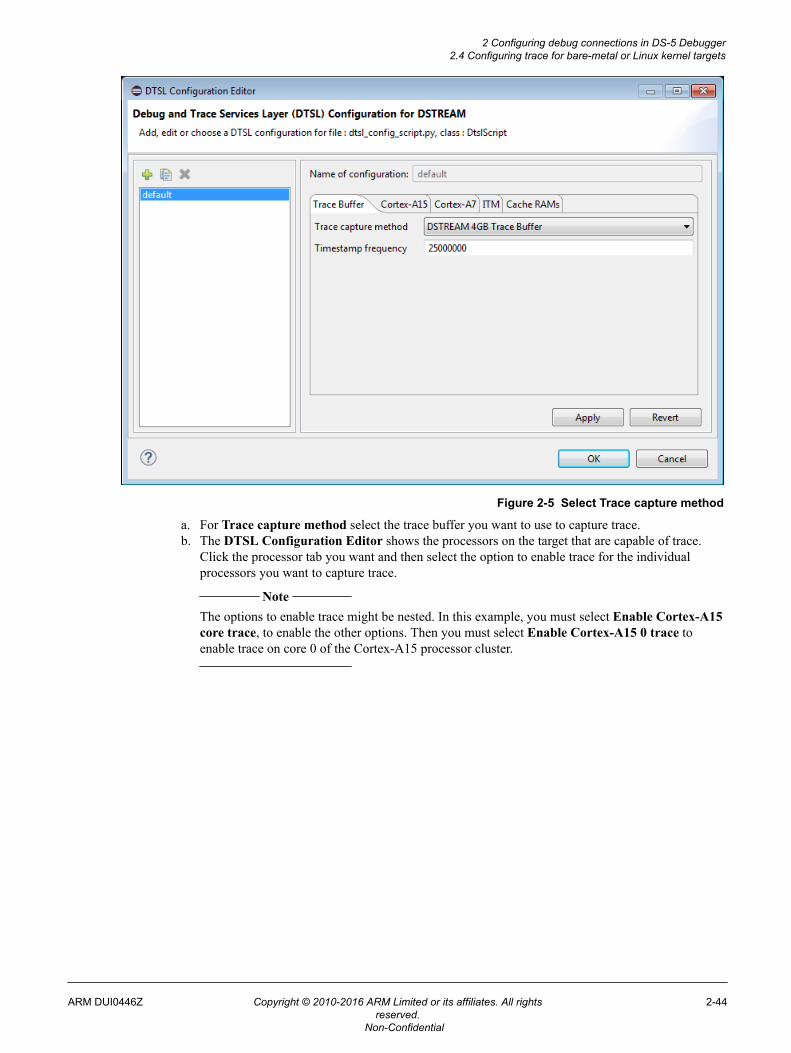
Figure 2-5 Select Trace capture method
a. For Trace capture method select the trace buffer you want to use to capture trace.b. The DTSL Configuration Editor shows the processors on the target that are capable of trace.
Click the processor tab you want and then select the option to enable trace for the individualprocessors you want to capture trace.
Note
The options to enable trace might be nested. In this example, you must select Enable Cortex-A15core trace, to enable the other options. Then you must select Enable Cortex-A15 0 trace toenable trace on core 0 of the Cortex-A15 processor cluster.
2 Configuring debug connections in DS-5 Debugger2.4 Configuring trace for bare-metal or Linux kernel targets
ARM DUI0446Z Copyright © 2010-2016 ARM Limited or its affiliates. All rightsreserved.
2-44
Non-Confidential
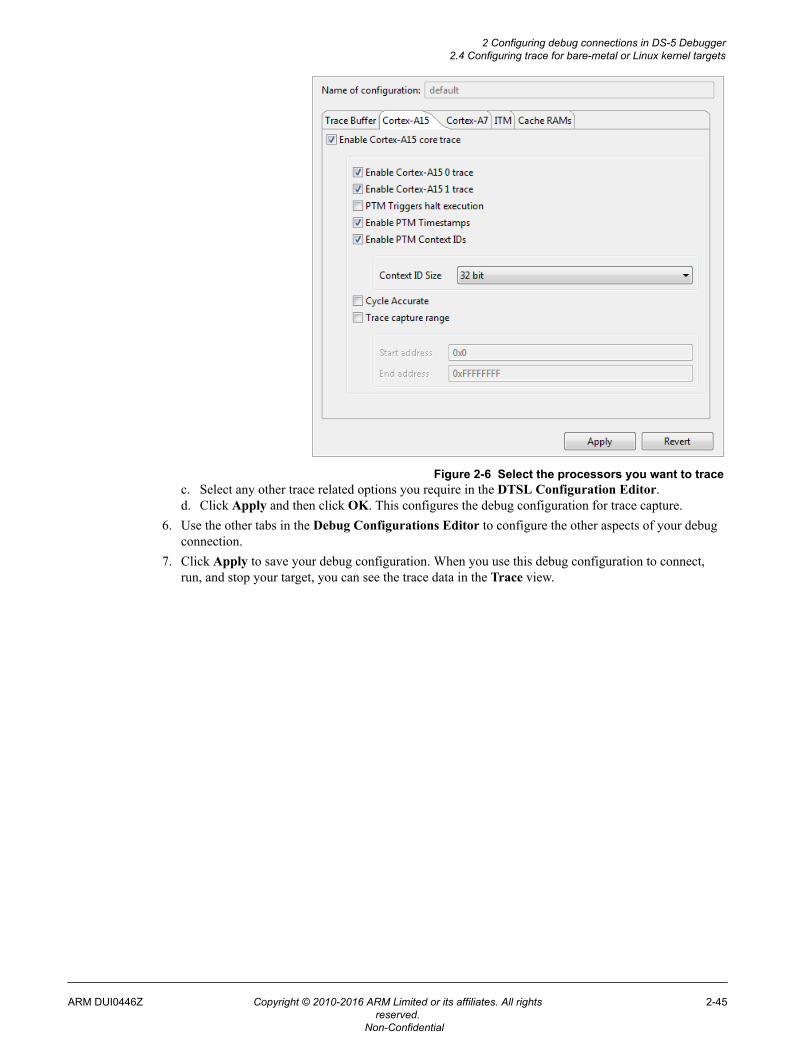
Figure 2-6 Select the processors you want to tracec. Select any other trace related options you require in the DTSL Configuration Editor.d. Click Apply and then click OK. This configures the debug configuration for trace capture.
6. Use the other tabs in the Debug Configurations Editor to configure the other aspects of your debugconnection.
7. Click Apply to save your debug configuration. When you use this debug configuration to connect,run, and stop your target, you can see the trace data in the Trace view.
2 Configuring debug connections in DS-5 Debugger2.4 Configuring trace for bare-metal or Linux kernel targets
ARM DUI0446Z Copyright © 2010-2016 ARM Limited or its affiliates. All rightsreserved.
2-45
Non-Confidential
2.5 Configuring a connection to a Linux application using gdbserverFor Linux application debugging, you can configure DS-5 Debugger to connect to a Linux applicationusing gdbserver.
Prerequisites
Before connecting, you must:• Set up the target with an Operating System (OS) installed and booted. See the documentation
supplied with the target for more information.• Obtain the target IP address or name for the connection between the debugger and the debug
hardware adapter. If the target is in your local subnet, click Browse and select your target.• If required, set up a Remote Systems Explorer (RSE) on page 11-374 connection to the target.
Note
If you are connecting to an already running gdbserver, then you must ensure that it is installed andrunning on the target.
To run gdbserver and the application on the target use: gdbserver port path/myApplication
Where:• port is the connection port between gdbserver and the application.• path/myApplication is the application that you want to debug.
Procedure1. Select Window > Open Perspective > DS-5 Debug from the main menu.2. Select Debug Configurations... from the Run menu.3. Select DS-5 Debugger from the configuration tree and then click on New to create a new
configuration.4. In the Name field, enter a suitable name for the new configuration.5. Click on the Connection tab to configure a DS-5 Debugger target connection:
a. Select the required platform, Linux Application Debug project type and the required debugoperation.
b. Configure the connection between the debugger and gdbserver.6. Click on the Files tab to define the target environment and select debug versions of the application
file and libraries on the host that you want the debugger to use.a. In the Target Configuration panel, select the application on the host that you want to download
to the target and specify the location on the target where you want to store the selected file.b. In the Files panel, select the files on the host that you want the debugger to use to load the debug
information. If required, you can also specify other files on the host that you want to download tothe target.
Note
Options in the Files tab are dependent on the type of debug operation that you select.
7. Click on the Debugger tab to configure the debugger settings.a. In the Run control panel, specify the actions that you want the debugger to do after connecting to
the target.b. Configure the host working directory or use the default.c. In the Paths panel, specify any source or library search directories on the host that the debugger
uses when it displays source code.
2 Configuring debug connections in DS-5 Debugger2.5 Configuring a connection to a Linux application using gdbserver
ARM DUI0446Z Copyright © 2010-2016 ARM Limited or its affiliates. All rightsreserved.
2-46
Non-Confidential
8. If required, click on the Arguments tab to enter arguments that are passed to the application when thedebug session starts.
9. If required, click on the Environment tab to create and configure the target environment variablesthat are passed to the application when the debug session starts.
10. Click on Apply to save the configuration settings.11. Click on Debug to connect to the target.12. Debugging requires the DS-5 Debug perspective. If the Confirm Perspective Switch dialog box
opens, click Yes to switch perspective.
When connected and the DS-5 Debug perspective opens you are presented with all the relevant viewsand editors.
For more information on these options, press F1 on your keyboard to display dynamic context help.
Related tasks2.7.2 Configuring a connection to a built-in Fixed Virtual Platform (FVP) model for Linux applicationdebug on page 2-53.2.6 Configuring a connection to a Linux kernel on page 2-48.2.3 Configuring a connection to a bare-metal hardware target on page 2-38.2.9 Configuring an Events view connection to a bare-metal target on page 2-63.
Related references11.40 Debug Configurations - Connection tab on page 11-358.11.41 Debug Configurations - Files tab on page 11-361.11.42 Debug Configurations - Debugger tab on page 11-364.11.43 Debug Configurations - OS Awareness tab on page 11-367.11.44 Debug Configurations - Arguments tab on page 11-368.11.45 Debug Configurations - Environment tab on page 11-370.11.50 Target management terminal for serial and SSH connections on page 11-377.12.1 ARM Linux problems and solutions on page 12-392.12.3 Target connection problems and solutions on page 12-394.
2 Configuring debug connections in DS-5 Debugger2.5 Configuring a connection to a Linux application using gdbserver
ARM DUI0446Z Copyright © 2010-2016 ARM Limited or its affiliates. All rightsreserved.
2-47
Non-Confidential
2.6 Configuring a connection to a Linux kernelUse these steps to configure a connection to a Linux target and load the Linux kernel into memory. Thesteps also describe how to add a pre-built loadable module to the target.
Prerequisites
Before connecting, you must:• Obtain the target IP address or name for the connection between the debugger and the debug
hardware adapter.• If required, set up a Remote Systems Explorer (RSE) on page 11-374 connection to the target.
Procedure1. Select Window > Open Perspective > DS-5 Debug from the main menu.2. Select Debug Configurations... from the Run menu.3. Select DS-5 Debugger from the configuration tree and then click on New to create a new debug
configuration.4. In the Name field, enter a suitable name for the new debug configuration.5. Click on the Connection tab to configure a DS-5 Debugger target connection:
a. Select the required platform, Linux Kernel and/or Devices Driver Debug project type and therequired debug operation.
b. Configure the connection between the debugger and the debug hardware adapter.6. Click on the Debugger tab to configure the debugger settings.
a. In the Run control panel, select Connect only and set up initialization scripts as required. Note
Operating System (OS) support is automatically enabled when a Linux kernel vmlinux symbolfile is loaded into the debugger from the DS-5 Debugger launch configuration. However, you canmanually control this using the set os command.
For example, if you want to delay the activation of operating system support until after the kernelhas booted and the Memory Management Unit (MMU) is initialized, then you can configure aconnection that uses a target initialization script to disable operating system support.
b. Select the Execute debugger commands option.c. In the field provided, enter commands to load debug symbols for the kernel and any kernel
modules that you want to debug, for example:
add-symbol-file <path>/vmlinux S:0 add-symbol-file <path>/modex.ko
Note
• The path to the vmlinux must be the same as your build environment.• In the above example, the kernel image is called vmlinux, but this could be named differently
depending on your kernel image.• In the above example, S:0 loads the symbols for secure space with 0 offset. The offset and
memory space prefix is dependent on your target. When working with multiple memoryspaces, ensure that you load the symbols for each memory space.
d. Configure the host working directory or use the default.e. In the Paths panel, specify any source search directories on the host that the debugger uses when
it displays source code.7. Click on Apply to save the configuration settings.8. Click on Debug to connect to the target.
2 Configuring debug connections in DS-5 Debugger2.6 Configuring a connection to a Linux kernel
ARM DUI0446Z Copyright © 2010-2016 ARM Limited or its affiliates. All rightsreserved.
2-48
Non-Confidential
9. Debugging requires the DS-5 Debug perspective. If the Confirm Perspective Switch dialog boxopens, click Yes to switch perspective.
When connected and the DS-5 Debug perspective opens, you are presented with all the relevant viewsand editors.
For more information on these options, press F1 on your keyboard to display dynamic context help. Tip
By default, for this type of connection, all processor exceptions are handled by Linux on thetarget. Once connected, you can use the Manage Signals dialog box in the Breakpoints view
menu to modify the default handler settings.
Related concepts6.10.2 About debugging a Linux kernel on page 6-156.6.10.3 About debugging Linux kernel modules on page 6-158.6.7 About debugging bare-metal symmetric multiprocessing systems on page 6-150.
Related tasks2.7.2 Configuring a connection to a built-in Fixed Virtual Platform (FVP) model for Linux applicationdebug on page 2-53.2.5 Configuring a connection to a Linux application using gdbserver on page 2-46.2.3 Configuring a connection to a bare-metal hardware target on page 2-38.2.9 Configuring an Events view connection to a bare-metal target on page 2-63.
Related references11.40 Debug Configurations - Connection tab on page 11-358.11.41 Debug Configurations - Files tab on page 11-361.11.42 Debug Configurations - Debugger tab on page 11-364.11.43 Debug Configurations - OS Awareness tab on page 11-367.11.44 Debug Configurations - Arguments tab on page 11-368.11.45 Debug Configurations - Environment tab on page 11-370.11.50 Target management terminal for serial and SSH connections on page 11-377.12.1 ARM Linux problems and solutions on page 12-392.12.3 Target connection problems and solutions on page 12-394.
Related informationDebugging a loadable kernel module.
2 Configuring debug connections in DS-5 Debugger2.6 Configuring a connection to a Linux kernel
ARM DUI0446Z Copyright © 2010-2016 ARM Limited or its affiliates. All rightsreserved.
2-49
Non-Confidential
2.7 Using Fixed Virtual Platform (FVP)s with DS-5A Fixed Virtual Platform (FVP) is a software model of a development platform, including processors andperipherals.
FVPs are provided as executables, and some are included in DS-5.
Depending on your requirements, you can:• Configure a connection to an FVP model for bare-metal application debug. on page 2-50• Configure a connection to an FVP model for Linux application debug. on page 2-53• From the command-line, configure a connection to an FVP model for bare-metal application debug
on page 2-55.• Import your custom FVP model into DS-5. on page 10-250
Note
ARM FVPs not provided with DS-5 installation must be defined in the PATH environment variable ofyour OS to be available for DS-5.
You must add the DS-5_install_directory/bin directory to your PATH environment variable andrestart Eclipse.
• For Windows, enter set PATH=<your model path>\bin;%PATH%• For Linux, enter export PATH=<your model path>/bin:$PATH
To ensure that the modified path is available in future sessions:• For Windows, right-click My Computer > Properties > Advanced system settings > Environment
Variables and under User Variables, create a PATH variable with the value <your model path>\bin, or else append ;<your model path>\bin to any existing PATH variable.
• For Linux, set up the PATH in the appropriate shell configuration file. For example, in .bashrc, addthe line export PATH=<your model path>/bin:$PATH
2.7.1 Configuring a connection to an external Fixed Virtual Platform (FVP) for bare-metalapplication debug
You can use DS-5 to connect to an external Fixed Virtual Platform (FVP) model for bare-metaldebugging.
This topic explains how to:• Create a debug configuration to connect to the Base_AEMv8A_AEMv8A FVP model and load your
application on the model.• Start up the Base_AEMv8A_AEMv8A FVP model separately with the appropriate settings.• Start a debug session in DS-5 to connect and attach to the running Base_AEMv8A_AEMv8A FVP
model.
Tip
• Configuring a connection to a built-in FVP model follows a similar sequence of steps. DS-5launches built-in FVPs automatically when you start up a debug connection.
• FVPs installed with your edition of DS-5 are listed under the ARM FVP (Installed with DS-5) tree.To see which FVPs are available with your license, compare DS-5 editions.
2 Configuring debug connections in DS-5 Debugger2.7 Using Fixed Virtual Platform (FVP)s with DS-5
ARM DUI0446Z Copyright © 2010-2016 ARM Limited or its affiliates. All rightsreserved.
2-50
Non-Confidential
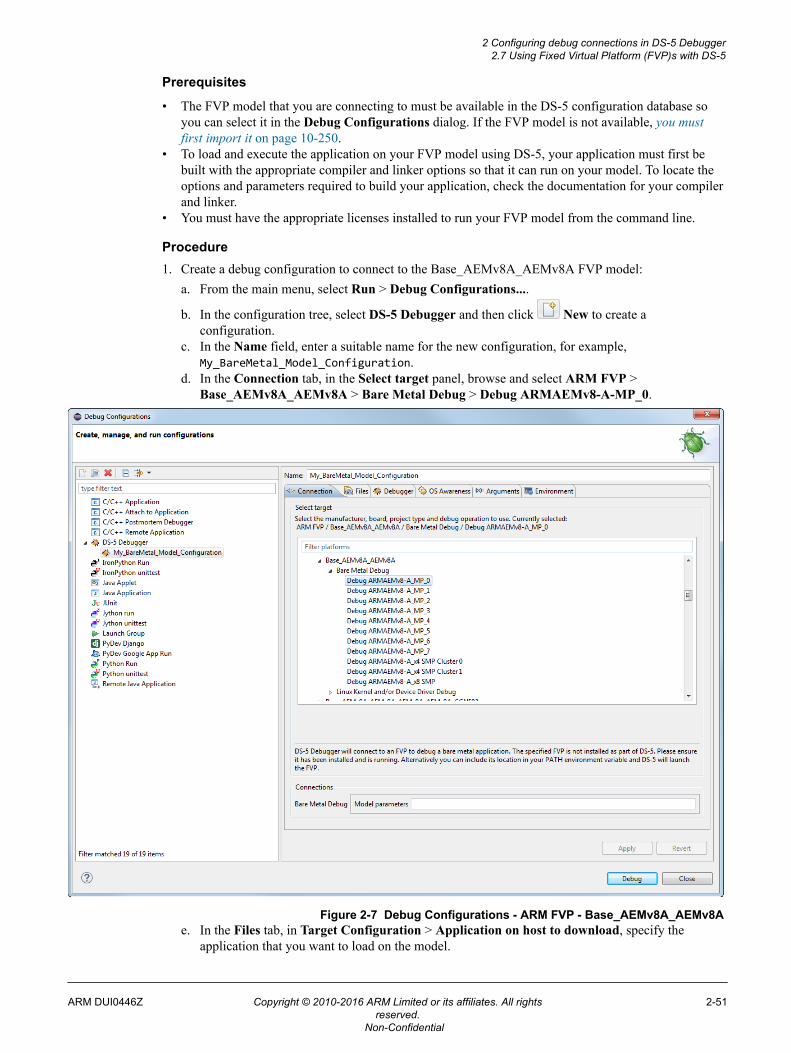
Prerequisites
• The FVP model that you are connecting to must be available in the DS-5 configuration database soyou can select it in the Debug Configurations dialog. If the FVP model is not available, you mustfirst import it on page 10-250.
• To load and execute the application on your FVP model using DS-5, your application must first bebuilt with the appropriate compiler and linker options so that it can run on your model. To locate theoptions and parameters required to build your application, check the documentation for your compilerand linker.
• You must have the appropriate licenses installed to run your FVP model from the command line.
Procedure1. Create a debug configuration to connect to the Base_AEMv8A_AEMv8A FVP model:
a. From the main menu, select Run > Debug Configurations....
b. In the configuration tree, select DS-5 Debugger and then click New to create aconfiguration.
c. In the Name field, enter a suitable name for the new configuration, for example,My_BareMetal_Model_Configuration.
d. In the Connection tab, in the Select target panel, browse and select ARM FVP >Base_AEMv8A_AEMv8A > Bare Metal Debug > Debug ARMAEMv8-A-MP_0.
Figure 2-7 Debug Configurations - ARM FVP - Base_AEMv8A_AEMv8Ae. In the Files tab, in Target Configuration > Application on host to download, specify the
application that you want to load on the model.
2 Configuring debug connections in DS-5 Debugger2.7 Using Fixed Virtual Platform (FVP)s with DS-5
ARM DUI0446Z Copyright © 2010-2016 ARM Limited or its affiliates. All rightsreserved.
2-51
Non-Confidential
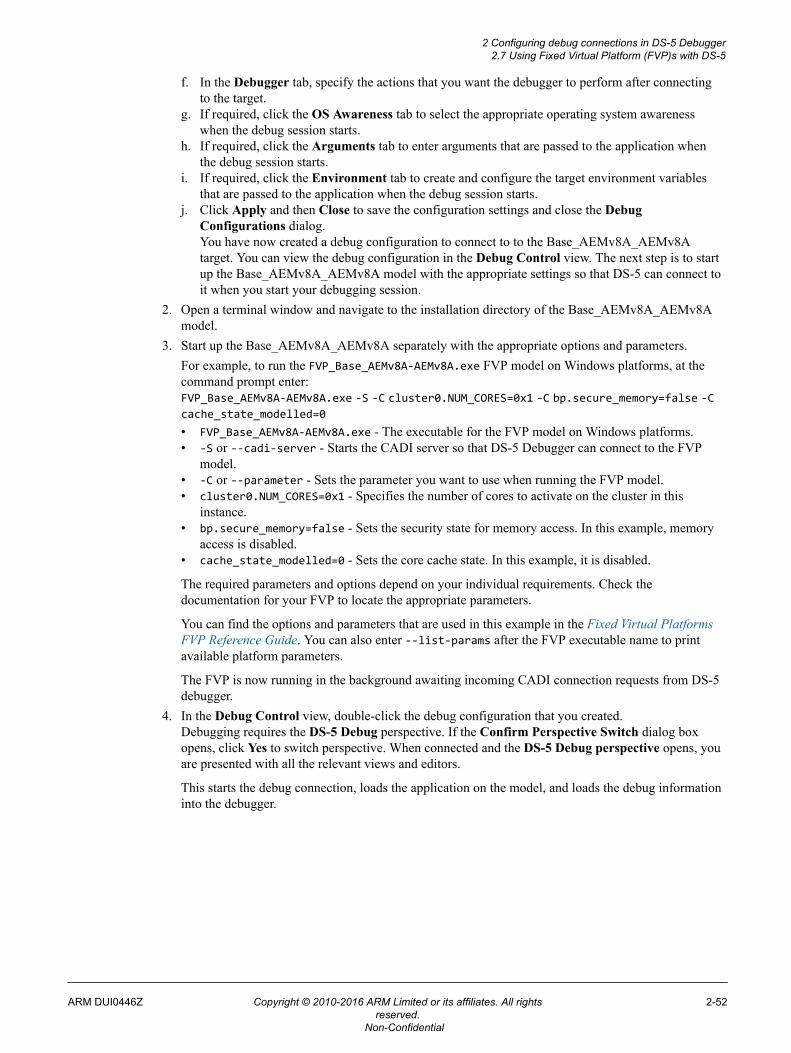
f. In the Debugger tab, specify the actions that you want the debugger to perform after connectingto the target.
g. If required, click the OS Awareness tab to select the appropriate operating system awarenesswhen the debug session starts.
h. If required, click the Arguments tab to enter arguments that are passed to the application whenthe debug session starts.
i. If required, click the Environment tab to create and configure the target environment variablesthat are passed to the application when the debug session starts.
j. Click Apply and then Close to save the configuration settings and close the DebugConfigurations dialog.You have now created a debug configuration to connect to to the Base_AEMv8A_AEMv8Atarget. You can view the debug configuration in the Debug Control view. The next step is to startup the Base_AEMv8A_AEMv8A model with the appropriate settings so that DS-5 can connect toit when you start your debugging session.
2. Open a terminal window and navigate to the installation directory of the Base_AEMv8A_AEMv8Amodel.
3. Start up the Base_AEMv8A_AEMv8A separately with the appropriate options and parameters.For example, to run the FVP_Base_AEMv8A-AEMv8A.exe FVP model on Windows platforms, at thecommand prompt enter:FVP_Base_AEMv8A-AEMv8A.exe -S -C cluster0.NUM_CORES=0x1 -C bp.secure_memory=false -Ccache_state_modelled=0
• FVP_Base_AEMv8A-AEMv8A.exe - The executable for the FVP model on Windows platforms.• -S or --cadi-server - Starts the CADI server so that DS-5 Debugger can connect to the FVP
model.• -C or --parameter - Sets the parameter you want to use when running the FVP model.• cluster0.NUM_CORES=0x1 - Specifies the number of cores to activate on the cluster in this
instance.• bp.secure_memory=false - Sets the security state for memory access. In this example, memory
access is disabled.• cache_state_modelled=0 - Sets the core cache state. In this example, it is disabled.
The required parameters and options depend on your individual requirements. Check thedocumentation for your FVP to locate the appropriate parameters.
You can find the options and parameters that are used in this example in the Fixed Virtual PlatformsFVP Reference Guide. You can also enter --list-params after the FVP executable name to printavailable platform parameters.
The FVP is now running in the background awaiting incoming CADI connection requests from DS-5debugger.
4. In the Debug Control view, double-click the debug configuration that you created.Debugging requires the DS-5 Debug perspective. If the Confirm Perspective Switch dialog boxopens, click Yes to switch perspective. When connected and the DS-5 Debug perspective opens, youare presented with all the relevant views and editors.
This starts the debug connection, loads the application on the model, and loads the debug informationinto the debugger.
2 Configuring debug connections in DS-5 Debugger2.7 Using Fixed Virtual Platform (FVP)s with DS-5
ARM DUI0446Z Copyright © 2010-2016 ARM Limited or its affiliates. All rightsreserved.
2-52
Non-Confidential
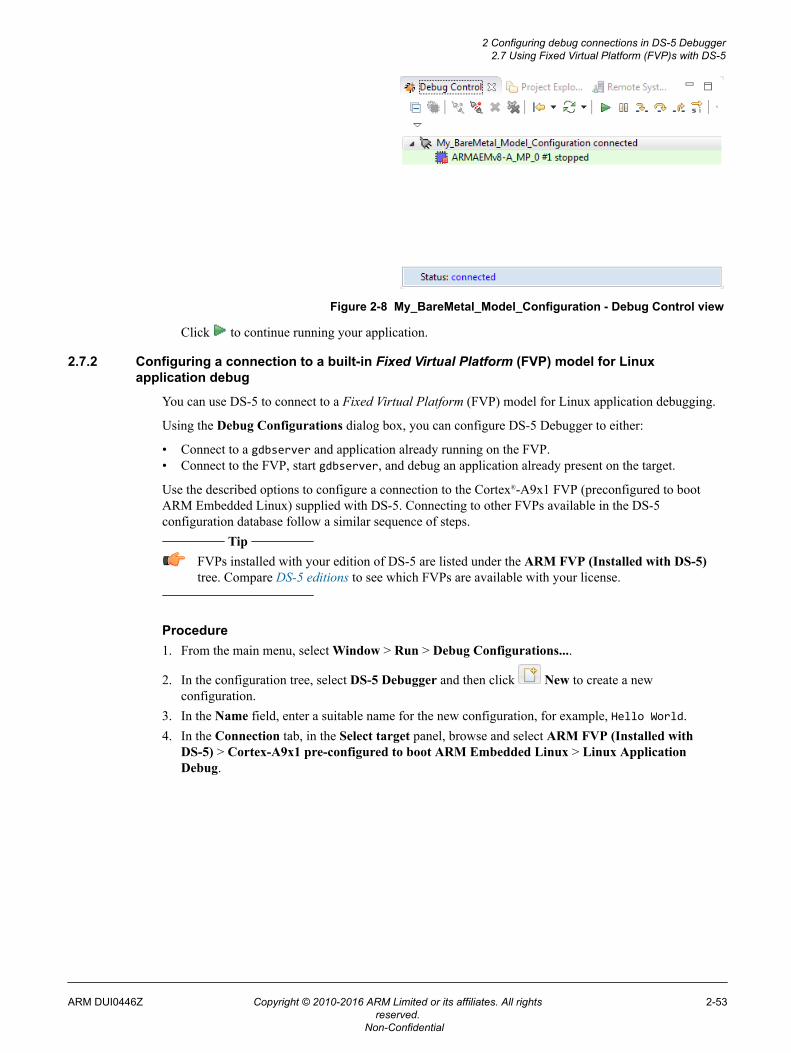
Figure 2-8 My_BareMetal_Model_Configuration - Debug Control view
Click to continue running your application.
2.7.2 Configuring a connection to a built-in Fixed Virtual Platform (FVP) model for Linuxapplication debug
You can use DS-5 to connect to a Fixed Virtual Platform (FVP) model for Linux application debugging.
Using the Debug Configurations dialog box, you can configure DS-5 Debugger to either:
• Connect to a gdbserver and application already running on the FVP.• Connect to the FVP, start gdbserver, and debug an application already present on the target.
Use the described options to configure a connection to the Cortex®-A9x1 FVP (preconfigured to bootARM Embedded Linux) supplied with DS-5. Connecting to other FVPs available in the DS-5configuration database follow a similar sequence of steps.
Tip
FVPs installed with your edition of DS-5 are listed under the ARM FVP (Installed with DS-5)tree. Compare DS-5 editions to see which FVPs are available with your license.
Procedure1. From the main menu, select Window > Run > Debug Configurations....
2. In the configuration tree, select DS-5 Debugger and then click New to create a newconfiguration.
3. In the Name field, enter a suitable name for the new configuration, for example, Hello World.4. In the Connection tab, in the Select target panel, browse and select ARM FVP (Installed with
DS-5) > Cortex-A9x1 pre-configured to boot ARM Embedded Linux > Linux ApplicationDebug.
2 Configuring debug connections in DS-5 Debugger2.7 Using Fixed Virtual Platform (FVP)s with DS-5
ARM DUI0446Z Copyright © 2010-2016 ARM Limited or its affiliates. All rightsreserved.
2-53
Non-Confidential
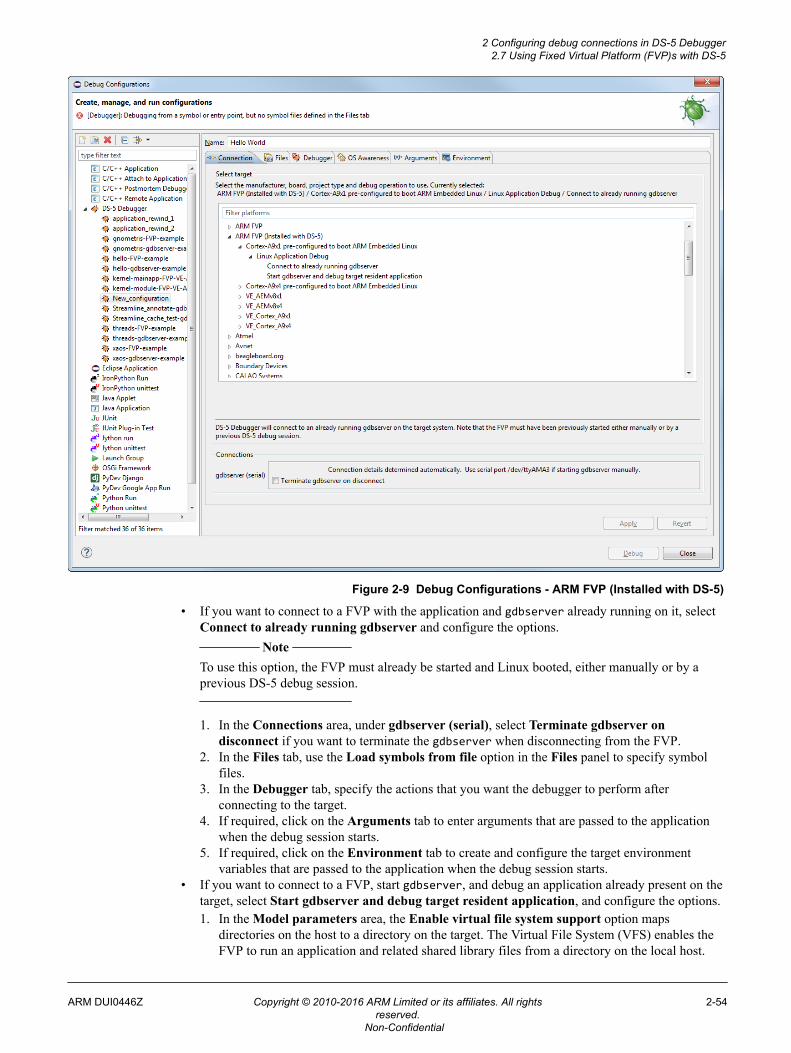
Figure 2-9 Debug Configurations - ARM FVP (Installed with DS-5)
• If you want to connect to a FVP with the application and gdbserver already running on it, selectConnect to already running gdbserver and configure the options.
Note
To use this option, the FVP must already be started and Linux booted, either manually or by aprevious DS-5 debug session.
1. In the Connections area, under gdbserver (serial), select Terminate gdbserver ondisconnect if you want to terminate the gdbserver when disconnecting from the FVP.
2. In the Files tab, use the Load symbols from file option in the Files panel to specify symbolfiles.
3. In the Debugger tab, specify the actions that you want the debugger to perform afterconnecting to the target.
4. If required, click on the Arguments tab to enter arguments that are passed to the applicationwhen the debug session starts.
5. If required, click on the Environment tab to create and configure the target environmentvariables that are passed to the application when the debug session starts.
• If you want to connect to a FVP, start gdbserver, and debug an application already present on thetarget, select Start gdbserver and debug target resident application, and configure the options.1. In the Model parameters area, the Enable virtual file system support option maps
directories on the host to a directory on the target. The Virtual File System (VFS) enables theFVP to run an application and related shared library files from a directory on the local host.
2 Configuring debug connections in DS-5 Debugger2.7 Using Fixed Virtual Platform (FVP)s with DS-5
ARM DUI0446Z Copyright © 2010-2016 ARM Limited or its affiliates. All rightsreserved.
2-54
Non-Confidential
— The Enable virtual file system support option is selected by default. Deselect the optionif you do not want virtual file system support.
— If the Enable virtual file system support option is enabled, by default, your currentworkspace location is used as the directory on the host that will be seen by the target as thewritable mount point. If you want to specify a different location, specify it here.
2. In the Files tab, specify the location of the Application on target and the Target workingdirectory. If you need to load symbols, use the Load symbols from file option in the Filespanel.
3. In the Debugger tab, specify the actions that you want the debugger to perform afterconnecting to the target.
4. If required, click on the Arguments tab to enter arguments that are passed to the applicationwhen the debug session starts.
5. If required, click on the Environment tab to create and configure the target environmentvariables that are passed to the application when the debug session starts.
5. Either click Apply to save the configuration settings or click Debug if you want to connect to thetarget and begin debugging immediately. Alternatively, click Close to close the DebugConfigurations dialog box. Use the Debug Control view to connect to the target associated with thisdebug configuration.
Debugging requires the DS-5 Debug perspective. If the Confirm Perspective Switch dialog box opens,click Yes to switch perspective. When connected and the DS-5 Debug perspective opens, you arepresented with all the relevant views and editors.
For more information on these options, press F1 on your keyboard to display dynamic context help.
Related tasks2.5 Configuring a connection to a Linux application using gdbserver on page 2-46.2.6 Configuring a connection to a Linux kernel on page 2-48.2.3 Configuring a connection to a bare-metal hardware target on page 2-38.2.9 Configuring an Events view connection to a bare-metal target on page 2-63.
Related references11.40 Debug Configurations - Connection tab on page 11-358.11.41 Debug Configurations - Files tab on page 11-361.11.42 Debug Configurations - Debugger tab on page 11-364.11.43 Debug Configurations - OS Awareness tab on page 11-367.11.44 Debug Configurations - Arguments tab on page 11-368.11.45 Debug Configurations - Environment tab on page 11-370.
Related informationModel Shell options for Fast Models.
2.7.3 Configuring a connection from the command-line to a built-in Fixed Virtual Platform (FVP)
You can configure a connection to a Fixed Virtual Platform (FVP) using the command-line only modeavailable in DS-5.
Using the command-line only mode, you can automate debug and trace activities. By automating a debugsession, you can save significant time and avoid repetitive tasks such as stepping through code at sourcelevel.
This example shows you how to configure a connection to a built-in FVP model in DS-5.
2 Configuring debug connections in DS-5 Debugger2.7 Using Fixed Virtual Platform (FVP)s with DS-5
ARM DUI0446Z Copyright © 2010-2016 ARM Limited or its affiliates. All rightsreserved.
2-55
Non-Confidential
Prerequisites
• The FVP model that you are connecting to must be available in the DS-5 configuration database soyou can select it. If the FVP model is not available, you must first import it. See 10.12 Importing acustom model on page 10-250 for information about importing a CADI-compliant model.
• To load and execute the application on your FVP model using DS-5, your application must first bebuilt with the appropriate compiler and linker options so that it can run on your model. To locate theoptions and parameters required to build your application, check the documentation for your compilerand linker.
• You must have the appropriate licenses installed to run your FVP model from the command line.
Procedure1. Open a DS-5command prompt:
• On Windows, select Start > All Programs > ARM DS-5 > DS-5 Command Prompt.• On Linux, add the DS-5_install_directory/bin location to your PATH environment variable
and then open a UNIX bash shell.2. To connect to the ARM FVP Cortex-A9x4 FVP model and specify an image to load from your
workspace, at the command prompt, enter:
debugger --cdb-entry "ARM FVP::VE_Cortex_A9x4::Bare Metal Debug::Bare Metal Debug::Debug Cortex-A9x4 SMP" --image "C:\DS-5_Workspace\HelloWorld\Debug\HelloWorld.axf"
DS-5 starts the ARM FVP Cortex-A9x4 FVP and loads the image. When connected to your target,use any of the DS-5 Debugger commands to access the target and start debugging.
For example, info registers displays all application level registers.
See Chapter 8 Running DS-5 Debugger from the operating system command-line or from a scripton page 8-202 for more information about how to use DS-5 Debugger from the operating systemcommand-line or from a script.
2 Configuring debug connections in DS-5 Debugger2.7 Using Fixed Virtual Platform (FVP)s with DS-5
ARM DUI0446Z Copyright © 2010-2016 ARM Limited or its affiliates. All rightsreserved.
2-56
Non-Confidential
2.8 Configuring application rewind for LinuxApplication rewind uses a custom debug agent, undodb-server, that records the execution of yourapplication as it runs. Use the options available under Application Debug with Rewind Support in theDebug Configurations dialog to connect to Linux targets.
Note
• Application rewind does not follow forked processes.• When debugging backwards, you can only view the contents of recorded memory, registers, or
variables. You cannot edit or change them.• Application rewind supports architecture ARMv5TE targets and later.
The connection options are:• Connect to already running application.
This option requires you to load your application and the application rewind server on your target andstart the application rewind server manually before attempting a connection between DS-5 and yourtarget.
undodb-server is the custom debug agent used by application rewind. This option requires you to loadyour application and the application rewind server on your target manually. When a connection isestablished, DS-5 starts a new application rewind server session on your target to debug yourapplication.
• Start undodb-server and debug target-resident application.
undodb-server is the custom debug agent used by application rewind. This option requires you to loadyour application and the application rewind server on your target manually. When a connection isestablished, DS-5 starts a new application rewind server session on your target to debug yourapplication.
• Download and debug application.
When a connection is established using this option, DS-5 downloads your application and theapplication rewind server on to the target system, and starts a new application rewind server sessionto debug your application.
Note
Application rewind custom debug agent implements a buffer on the target to store history for recordedexecutions. The default is a straight buffer, which records events until the buffer limit is reached, andthen stops the execution. At this point, you can either increase the size of the buffer or change the bufferto be circular. When using a circular buffer, once the limit of the circular buffer is reached, instead ofstopping execution, the data wraps around and overwrites old content. A circular buffer ensures thatexecution does not stop when the buffer limit is reached, but you lose the execution history beyond thepoint where data wrapped around.• To change buffer limits, use the command set debug-agent history-buffer-size "size"
Where size specifies the amount of memory. You can specify the value in kilobytes (K), megabytes(M), or gigabytes (G).
For example, set debug-agent history-buffer-size "256.00 M".
Since the buffer is implemented in the target RAM, increasing the buffer size can also hinderperformance by affecting memory usage. For this reason, when increasing the buffer size, set thebuffer to a value that also provides maximum performance.
• To change buffer type, use the command set debug-agent history-buffer-type "type"
Where type specifies the type of buffer, which is either straight or circular.
2 Configuring debug connections in DS-5 Debugger2.8 Configuring application rewind for Linux
ARM DUI0446Z Copyright © 2010-2016 ARM Limited or its affiliates. All rightsreserved.
2-57
Non-Confidential
For example, set debug-agent history-buffer-type "circular".
2.8.1 Connecting to an existing application and starting an application rewind session
Use the Connect to already running application option to set up a connection to an existing applicationrewind server session on your target.
Prerequisites
Before connecting to an existing application rewind server session, you must:• Set up the target with an Operating System (OS) installed and booted. See the documentation
supplied with the target for more information.• Ensure that the undodb-server file found in the DS-5_install_directory\arm\undodb\linux
folder is copied to your target.• Ensure that the application that you want to debug is copied to the target.• Ensure that the application rewind server session is running and connected to your application.
Note
To run the application rewind server and the application on the target, use:
undodb-server --connect-port port path/myApplication
Where:
port is a TCP/IP port number of your choice that is used by application rewind server to communicatewith DS-5 Debugger.
path/myApplication is the application that you want to debug.
Procedure1. From the main menu, select Window > Open Perspective > Other > DS-5 Debug to switch to the
DS-5 Debug perspective.2. From the Run menu, select Debug Configurations....3. Select DS-5 Debugger from the configuration tree and then click New launch configuration to
create a new configuration.4. In the Name field, enter a suitable name for the new configuration.5. Select the Connection tab to configure the target connection:
a. In the Select target panel, select Linux Application Debug > Application Debug with RewindSupport > Connections via undodb-server > Connect to already running application.
2 Configuring debug connections in DS-5 Debugger2.8 Configuring application rewind for Linux
ARM DUI0446Z Copyright © 2010-2016 ARM Limited or its affiliates. All rightsreserved.
2-58
Non-Confidential
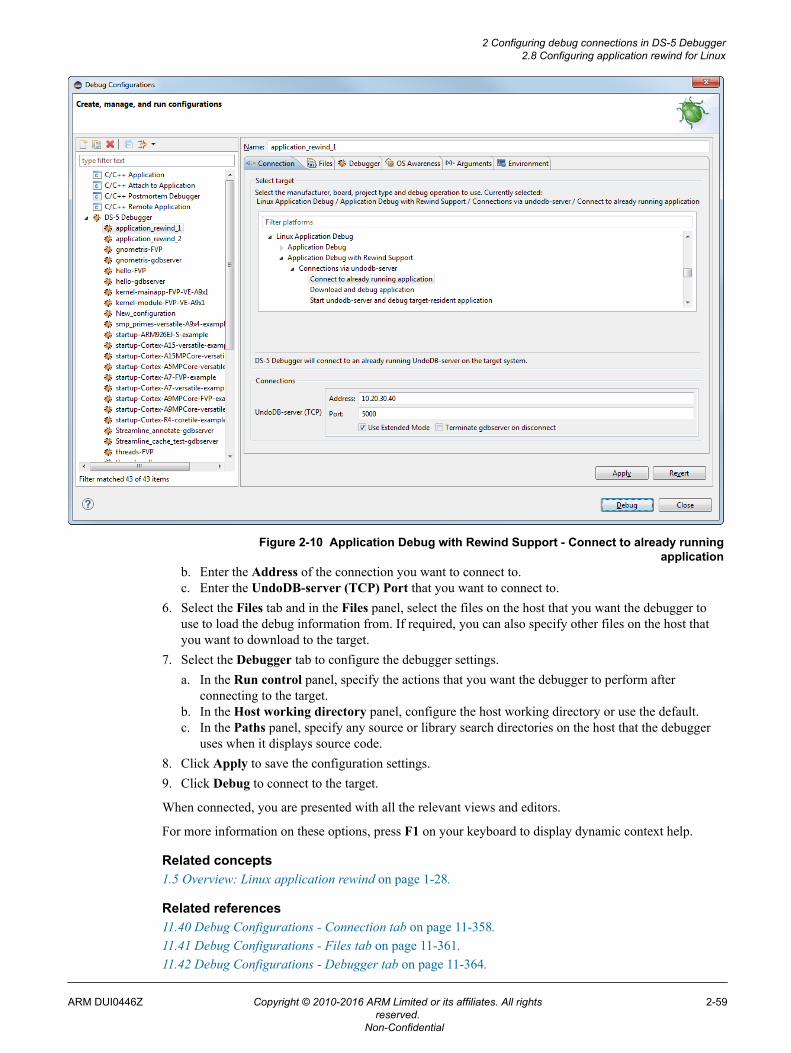
Figure 2-10 Application Debug with Rewind Support - Connect to already runningapplication
b. Enter the Address of the connection you want to connect to.c. Enter the UndoDB-server (TCP) Port that you want to connect to.
6. Select the Files tab and in the Files panel, select the files on the host that you want the debugger touse to load the debug information from. If required, you can also specify other files on the host thatyou want to download to the target.
7. Select the Debugger tab to configure the debugger settings.a. In the Run control panel, specify the actions that you want the debugger to perform after
connecting to the target.b. In the Host working directory panel, configure the host working directory or use the default.c. In the Paths panel, specify any source or library search directories on the host that the debugger
uses when it displays source code.8. Click Apply to save the configuration settings.9. Click Debug to connect to the target.
When connected, you are presented with all the relevant views and editors.
For more information on these options, press F1 on your keyboard to display dynamic context help.
Related concepts1.5 Overview: Linux application rewind on page 1-28.
Related references11.40 Debug Configurations - Connection tab on page 11-358.11.41 Debug Configurations - Files tab on page 11-361.11.42 Debug Configurations - Debugger tab on page 11-364.
2 Configuring debug connections in DS-5 Debugger2.8 Configuring application rewind for Linux
ARM DUI0446Z Copyright © 2010-2016 ARM Limited or its affiliates. All rightsreserved.
2-59
Non-Confidential
11.43 Debug Configurations - OS Awareness tab on page 11-367.11.44 Debug Configurations - Arguments tab on page 11-368.11.45 Debug Configurations - Environment tab on page 11-370.2.1 Overview: Debug connections in DS-5 Debugger on page 2-34.
2.8.2 Downloading your application and application rewind server to the target system
Use the Download and debug application option to download your application and application rewindserver to the target system and start a new application rewind session.
Prerequisites
Before connecting, you must:• Set up the target with an Operating System (OS) installed and booted. See the documentation
supplied with the target for more information.• Obtain the IP address or name of the target.• Set up a Remote Systems Explorer (RSE) connection to the target.
Procedure1. From the main menu, select Window > Open Perspective > Other > DS-5 Debug to switch to the
DS-5 Debug perspective.2. From the Run menu, select Debug Configurations....3. Select DS-5 Debugger from the configuration tree and then click New launch configuration to
create a new configuration.4. In the Name field, enter a suitable name for the new configuration.5. Select the Connection tab to configure the target connection:
a. In the Select target panel, select Linux Application Debug > Application Debug with RewindSupport > Connections via undodb-server > Download and debug application.
b. Select your RSE connection from the list.c. Accept the default values for the UndoDB-server (TCP) Port.
6. Select the Files tab to define the application file and libraries.a. In the Target Configuration panel, select the application on the host that you want to download
to the target and specify the location on the target where you want to store the selected file.b. In the Files panel, select the files on the host that you want the debugger to use to load the debug
information. If required, you can also specify other files on the host that you want to download tothe target.
Note
Options in the Files tab are dependent on the type of debug operation that you select.
7. Select the Debugger tab to configure the debugger settings.a. In the Run control panel, specify the actions that you want the debugger to perform after
connecting to the target.b. In the Host working directory panel, configure the host working directory or use the default.c. In the Paths panel, specify any source or library search directories on the host that the debugger
uses when it displays source code.8. If required, use the Arguments tab to enter arguments that are passed to the application when the
debug session starts.9. If required, use the Environment tab to create and configure the target environment variables that are
passed to the application when the debug session starts.10. Click Apply to save the configuration settings.11. Click Debug to connect to the target.
When connected, you are presented with all the relevant views and editors.
2 Configuring debug connections in DS-5 Debugger2.8 Configuring application rewind for Linux
ARM DUI0446Z Copyright © 2010-2016 ARM Limited or its affiliates. All rightsreserved.
2-60
Non-Confidential
For more information on these options, press F1 on your keyboard to display dynamic context help.
Related concepts1.5 Overview: Linux application rewind on page 1-28.
Related references11.40 Debug Configurations - Connection tab on page 11-358.11.41 Debug Configurations - Files tab on page 11-361.11.42 Debug Configurations - Debugger tab on page 11-364.11.43 Debug Configurations - OS Awareness tab on page 11-367.11.44 Debug Configurations - Arguments tab on page 11-368.11.45 Debug Configurations - Environment tab on page 11-370.2.1 Overview: Debug connections in DS-5 Debugger on page 2-34.
2.8.3 Starting the application rewind server and debugging the target-resident application
Use the Start undodb-server and debug target-resident application option to start the applicationrewind server on the target system and debug an existing application.
Prerequisites
Before connecting, you must:• Set up the target with an Operating System (OS) installed and booted. See the documentation
supplied with the target for more information.• Obtain the IP address or name of the target.• Set up a Remote Systems Explorer (RSE) connection to the target.• Ensure that the application rewind server is available on your target and is added to your PATH
environment variable.• Ensure that the application you want to debug is available on the target.
Procedure1. From the main menu, select Window > Open Perspective > Other > DS-5 Debug to switch to the
DS-5 debug perspective.2. From the Run menu, select Debug Configurations....3. Select DS-5 Debugger from the configuration tree and then click New launch configuration to
create a new configuration.4. In the Name field, enter a suitable name for the new configuration.5. Select the Connection tab to configure the target connection:
a. In the Select target panel, select Linux Application Debug > Application Debug with RewindSupport > Connections via undodb-server > Start undodb-server and debug target-residentapplication.
b. Select your RSE connection from the list.c. Accept the default values for the UndoDB-server (TCP) Port.
6. Select the Files tab to define the location of the Application on target, Target working directory, andadditional Files.a. In the Target Configuration panel, enter the location of the Application on target and the Target
working directory.b. In the Files panel, enter or select the location of the files on the target that you want the debugger
to use to load additional debug information. If required, you can also specify other files on thehost that you want to download to the target.
Note
Options in the Files tab are dependent on the type of debug operation that you select.
2 Configuring debug connections in DS-5 Debugger2.8 Configuring application rewind for Linux
ARM DUI0446Z Copyright © 2010-2016 ARM Limited or its affiliates. All rightsreserved.
2-61
Non-Confidential
7. Select the Debugger tab to configure the debugger settings.a. In the Run control panel, specify the actions that you want the debugger to perform after
connecting to the target.b. In the Host working directory panel, configure the host working directory or use the default.c. In the Paths panel, specify any source or library search directories on the host that the debugger
uses when it displays source code.8. If required, use the Arguments tab to enter arguments that are passed to the application when the
debug session starts.9. If required, use the Environment tab to create and configure the target environment variables that are
passed to the application when the debug session starts.10. Click Apply to save the configuration settings.11. Click Debug to connect to the target.
When connected, you are presented with all the relevant views and editors.
For more information on these options, press F1 on your keyboard to display dynamic context help.
Related concepts1.5 Overview: Linux application rewind on page 1-28.
Related references11.40 Debug Configurations - Connection tab on page 11-358.11.41 Debug Configurations - Files tab on page 11-361.11.42 Debug Configurations - Debugger tab on page 11-364.11.43 Debug Configurations - OS Awareness tab on page 11-367.11.44 Debug Configurations - Arguments tab on page 11-368.11.45 Debug Configurations - Environment tab on page 11-370.2.1 Overview: Debug connections in DS-5 Debugger on page 2-34.
2 Configuring debug connections in DS-5 Debugger2.8 Configuring application rewind for Linux
ARM DUI0446Z Copyright © 2010-2016 ARM Limited or its affiliates. All rightsreserved.
2-62
Non-Confidential
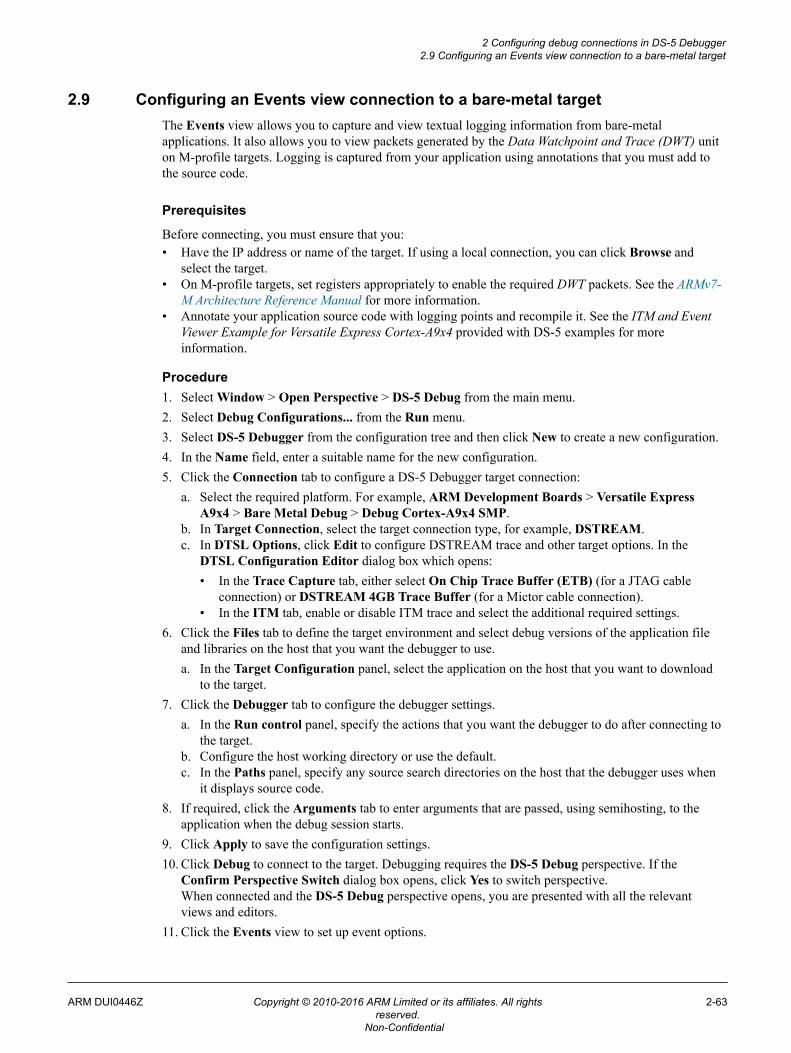
2.9 Configuring an Events view connection to a bare-metal targetThe Events view allows you to capture and view textual logging information from bare-metalapplications. It also allows you to view packets generated by the Data Watchpoint and Trace (DWT) uniton M-profile targets. Logging is captured from your application using annotations that you must add tothe source code.
Prerequisites
Before connecting, you must ensure that you:• Have the IP address or name of the target. If using a local connection, you can click Browse and
select the target.• On M-profile targets, set registers appropriately to enable the required DWT packets. See the ARMv7-
M Architecture Reference Manual for more information.• Annotate your application source code with logging points and recompile it. See the ITM and Event
Viewer Example for Versatile Express Cortex-A9x4 provided with DS-5 examples for moreinformation.
Procedure1. Select Window > Open Perspective > DS-5 Debug from the main menu.2. Select Debug Configurations... from the Run menu.3. Select DS-5 Debugger from the configuration tree and then click New to create a new configuration.4. In the Name field, enter a suitable name for the new configuration.5. Click the Connection tab to configure a DS-5 Debugger target connection:
a. Select the required platform. For example, ARM Development Boards > Versatile ExpressA9x4 > Bare Metal Debug > Debug Cortex-A9x4 SMP.
b. In Target Connection, select the target connection type, for example, DSTREAM.c. In DTSL Options, click Edit to configure DSTREAM trace and other target options. In the
DTSL Configuration Editor dialog box which opens:• In the Trace Capture tab, either select On Chip Trace Buffer (ETB) (for a JTAG cable
connection) or DSTREAM 4GB Trace Buffer (for a Mictor cable connection).• In the ITM tab, enable or disable ITM trace and select the additional required settings.
6. Click the Files tab to define the target environment and select debug versions of the application fileand libraries on the host that you want the debugger to use.a. In the Target Configuration panel, select the application on the host that you want to download
to the target.7. Click the Debugger tab to configure the debugger settings.
a. In the Run control panel, specify the actions that you want the debugger to do after connecting tothe target.
b. Configure the host working directory or use the default.c. In the Paths panel, specify any source search directories on the host that the debugger uses when
it displays source code.8. If required, click the Arguments tab to enter arguments that are passed, using semihosting, to the
application when the debug session starts.9. Click Apply to save the configuration settings.10. Click Debug to connect to the target. Debugging requires the DS-5 Debug perspective. If the
Confirm Perspective Switch dialog box opens, click Yes to switch perspective.When connected and the DS-5 Debug perspective opens, you are presented with all the relevantviews and editors.
11. Click the Events view to set up event options.
2 Configuring debug connections in DS-5 Debugger2.9 Configuring an Events view connection to a bare-metal target
ARM DUI0446Z Copyright © 2010-2016 ARM Limited or its affiliates. All rightsreserved.
2-63
Non-Confidential
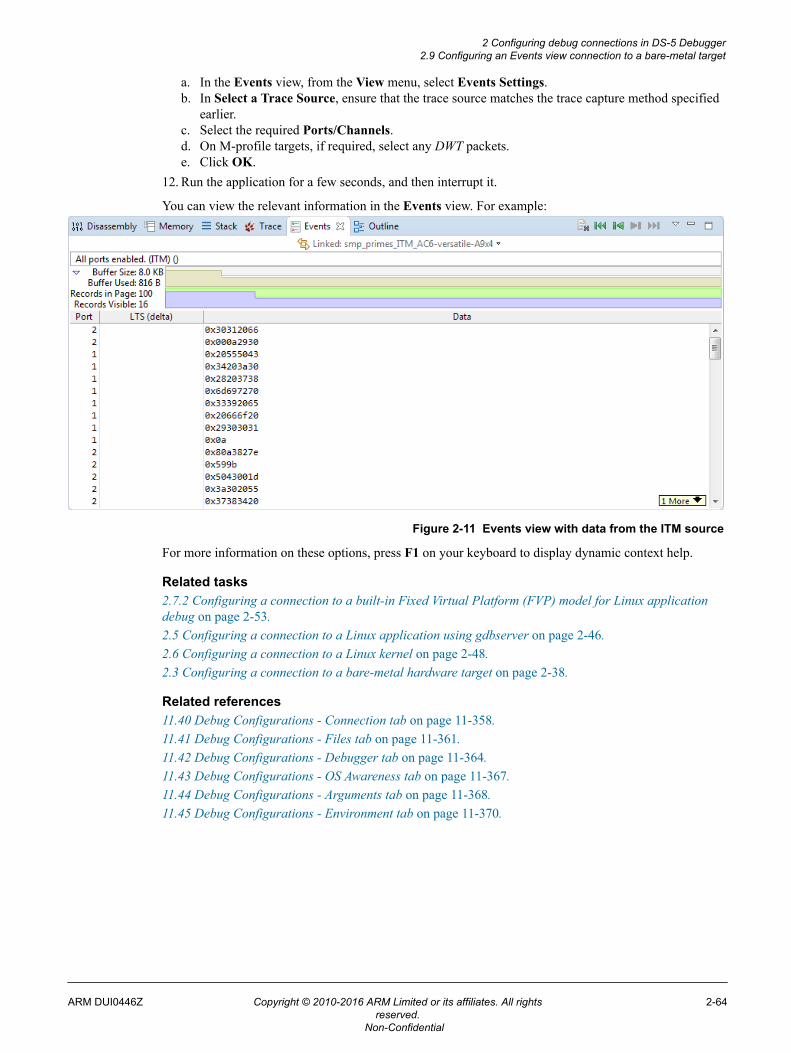
a. In the Events view, from the View menu, select Events Settings.b. In Select a Trace Source, ensure that the trace source matches the trace capture method specified
earlier.c. Select the required Ports/Channels.d. On M-profile targets, if required, select any DWT packets.e. Click OK.
12. Run the application for a few seconds, and then interrupt it.
You can view the relevant information in the Events view. For example:
Figure 2-11 Events view with data from the ITM source
For more information on these options, press F1 on your keyboard to display dynamic context help.
Related tasks2.7.2 Configuring a connection to a built-in Fixed Virtual Platform (FVP) model for Linux applicationdebug on page 2-53.2.5 Configuring a connection to a Linux application using gdbserver on page 2-46.2.6 Configuring a connection to a Linux kernel on page 2-48.2.3 Configuring a connection to a bare-metal hardware target on page 2-38.
Related references11.40 Debug Configurations - Connection tab on page 11-358.11.41 Debug Configurations - Files tab on page 11-361.11.42 Debug Configurations - Debugger tab on page 11-364.11.43 Debug Configurations - OS Awareness tab on page 11-367.11.44 Debug Configurations - Arguments tab on page 11-368.11.45 Debug Configurations - Environment tab on page 11-370.
2 Configuring debug connections in DS-5 Debugger2.9 Configuring an Events view connection to a bare-metal target
ARM DUI0446Z Copyright © 2010-2016 ARM Limited or its affiliates. All rightsreserved.
2-64
Non-Confidential
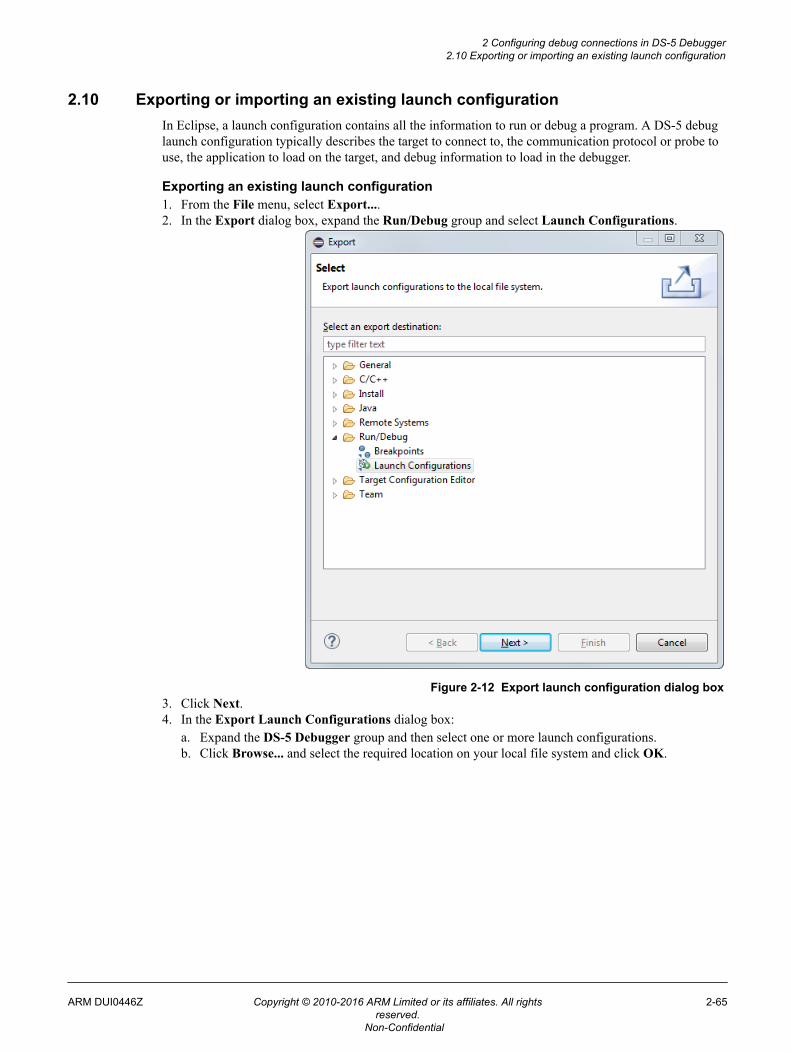
2.10 Exporting or importing an existing launch configurationIn Eclipse, a launch configuration contains all the information to run or debug a program. A DS-5 debuglaunch configuration typically describes the target to connect to, the communication protocol or probe touse, the application to load on the target, and debug information to load in the debugger.
Exporting an existing launch configuration1. From the File menu, select Export....2. In the Export dialog box, expand the Run/Debug group and select Launch Configurations.
Figure 2-12 Export launch configuration dialog box3. Click Next.4. In the Export Launch Configurations dialog box:
a. Expand the DS-5 Debugger group and then select one or more launch configurations.b. Click Browse... and select the required location on your local file system and click OK.
2 Configuring debug connections in DS-5 Debugger2.10 Exporting or importing an existing launch configuration
ARM DUI0446Z Copyright © 2010-2016 ARM Limited or its affiliates. All rightsreserved.
2-65
Non-Confidential
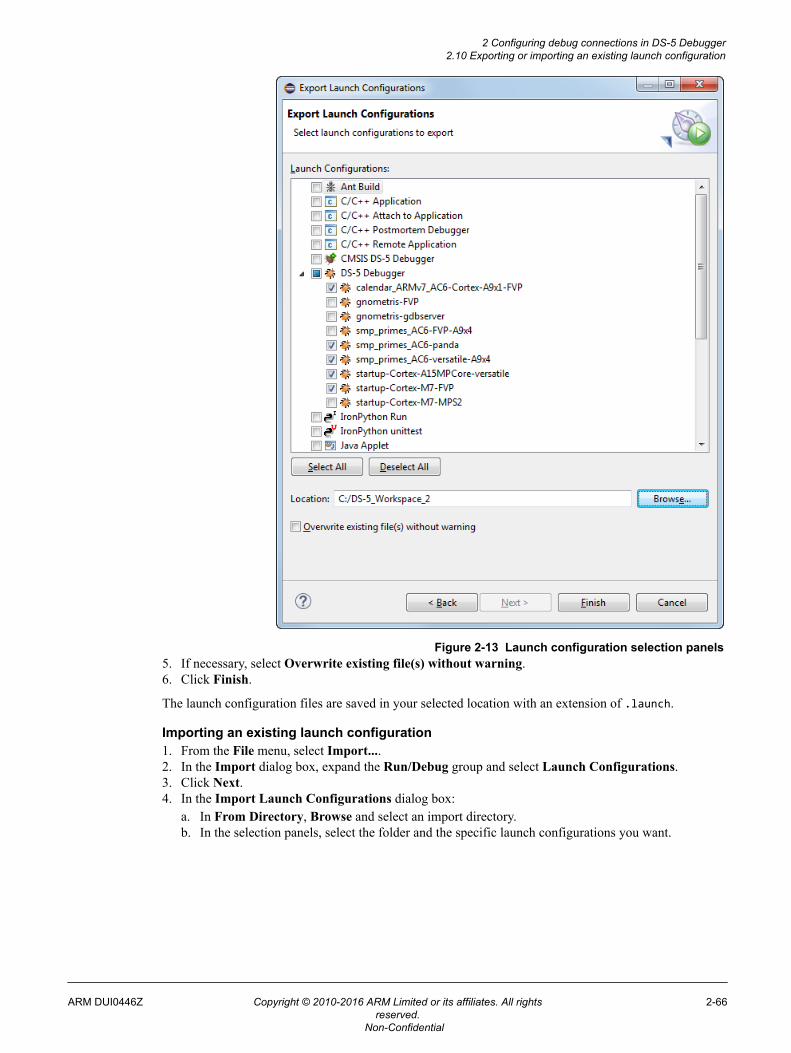
Figure 2-13 Launch configuration selection panels5. If necessary, select Overwrite existing file(s) without warning.6. Click Finish.
The launch configuration files are saved in your selected location with an extension of .launch.
Importing an existing launch configuration1. From the File menu, select Import....2. In the Import dialog box, expand the Run/Debug group and select Launch Configurations.3. Click Next.4. In the Import Launch Configurations dialog box:
a. In From Directory, Browse and select an import directory.b. In the selection panels, select the folder and the specific launch configurations you want.
2 Configuring debug connections in DS-5 Debugger2.10 Exporting or importing an existing launch configuration
ARM DUI0446Z Copyright © 2010-2016 ARM Limited or its affiliates. All rightsreserved.
2-66
Non-Confidential
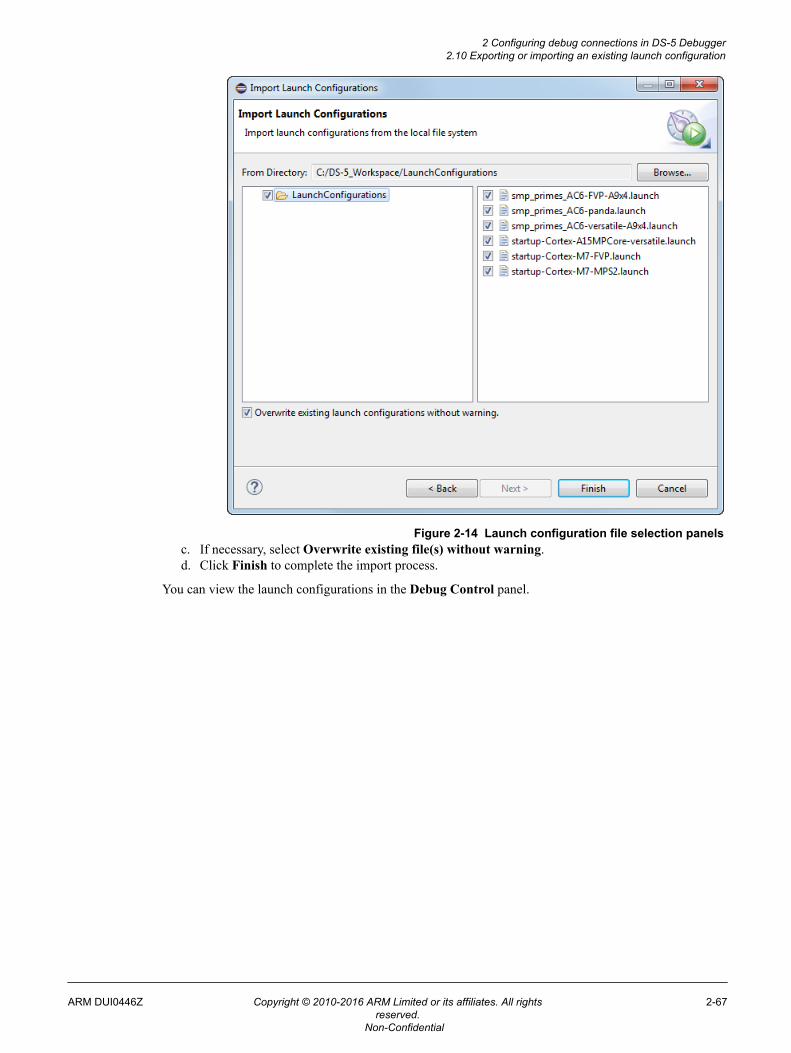
Figure 2-14 Launch configuration file selection panelsc. If necessary, select Overwrite existing file(s) without warning.d. Click Finish to complete the import process.
You can view the launch configurations in the Debug Control panel.
2 Configuring debug connections in DS-5 Debugger2.10 Exporting or importing an existing launch configuration
ARM DUI0446Z Copyright © 2010-2016 ARM Limited or its affiliates. All rightsreserved.
2-67
Non-Confidential
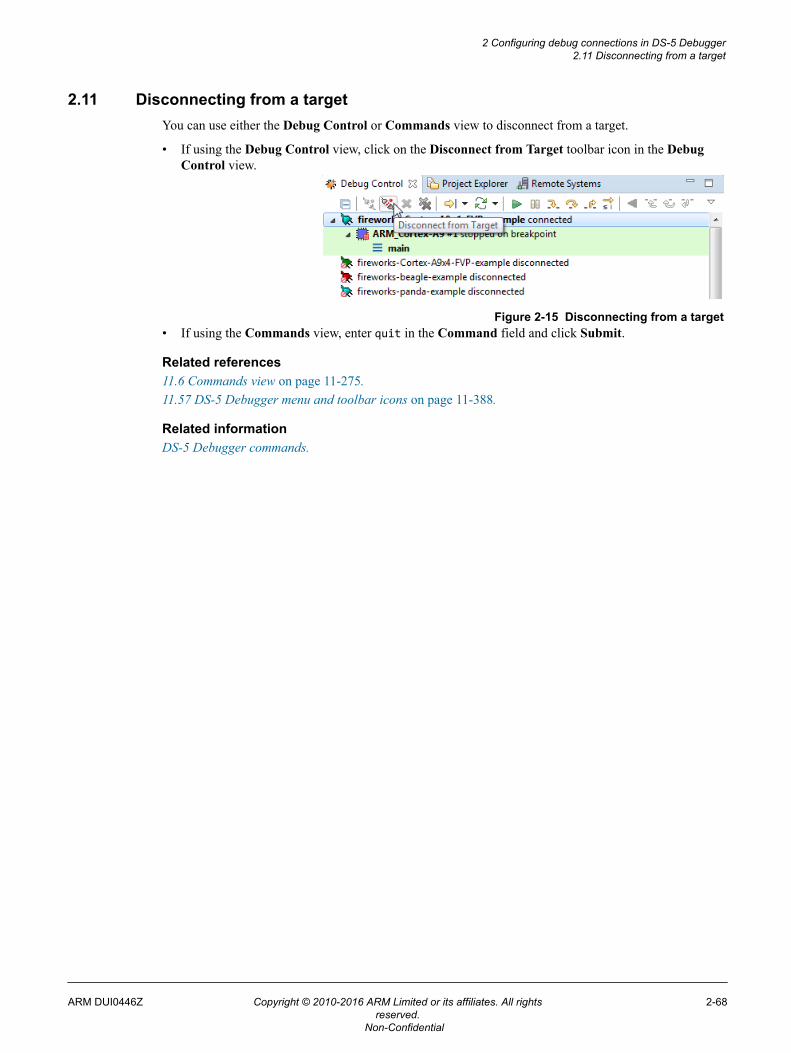
2.11 Disconnecting from a targetYou can use either the Debug Control or Commands view to disconnect from a target.
• If using the Debug Control view, click on the Disconnect from Target toolbar icon in the DebugControl view.
Figure 2-15 Disconnecting from a target• If using the Commands view, enter quit in the Command field and click Submit.
Related references11.6 Commands view on page 11-275.11.57 DS-5 Debugger menu and toolbar icons on page 11-388.
Related informationDS-5 Debugger commands.
2 Configuring debug connections in DS-5 Debugger2.11 Disconnecting from a target
ARM DUI0446Z Copyright © 2010-2016 ARM Limited or its affiliates. All rightsreserved.
2-68
Non-Confidential
Chapter 3Controlling Target Execution
Describes how to control the target when certain events occur or when certain conditions are met.
It contains the following sections:• 3.1 Overview: Breakpoints and Watchpoints on page 3-70.• 3.2 Running, stopping, and stepping through an application on page 3-72.• 3.3 Working with breakpoints on page 3-74.• 3.4 Working with watchpoints on page 3-75.• 3.5 Importing and exporting breakpoints and watchpoints on page 3-77.• 3.6 Viewing the properties of a breakpoint or a watchpoint on page 3-78.• 3.7 Associating debug scripts to breakpoints on page 3-80.• 3.8 Conditional breakpoints on page 3-81.• 3.9 Assigning conditions to an existing breakpoint on page 3-82.• 3.10 Conditional watchpoints on page 3-84.• 3.11 Assigning conditions to an existing watchpoint on page 3-85.• 3.12 Pending breakpoints and watchpoints on page 3-87.• 3.13 Setting a tracepoint on page 3-89.• 3.14 Handling UNIX signals on page 3-90.• 3.15 Handling processor exceptions on page 3-92.• 3.16 Cross-trigger configuration on page 3-94.• 3.17 Using semihosting to access resources on the host computer on page 3-95.• 3.18 Working with semihosting on page 3-97.• 3.19 Configuring the debugger path substitution rules on page 3-99.
ARM DUI0446Z Copyright © 2010-2016 ARM Limited or its affiliates. All rightsreserved.
3-69
Non-Confidential
3.1 Overview: Breakpoints and WatchpointsBreakpoints and watchpoints enable you to stop the target when certain events occur and when certainconditions are met. When execution stops, you can choose to examine the contents of memory, registers,or variables, or you can specify other actions to take before resuming execution.
Breakpoints
A breakpoint enables you to interrupt your application when execution reaches a specific address. Whenexecution reaches the breakpoint, normal execution stops before any instruction stored there is executed.
Types of breakpoints:
• Software breakpoints stop your program when execution reaches a specific address.
Software breakpoints are implemented by the debugger replacing the instruction at the breakpointaddress with a special instruction. Software breakpoints can only be set in RAM.
• Hardware breakpoints use special processor hardware to interrupt application execution. Hardwarebreakpoints are a limited resource.
You can configure breakpoint properties to make them:• Conditional
Conditional breakpoints trigger when an expression evaluates to true or when an ignore counter isreached. See Conditional breakpoints on page 3-81 for more information.
• Temporary
Temporary breakpoints can be hit only once and are automatically deleted afterwards.
• Scripted
A script file is assigned to a specific breakpoint. When the breakpoint is triggered, then the scriptassigned to it is executed.
Note
• Memory region and the related access attributes.• Hardware support provided by your target processor.• Debug interface used to maintain the target connection.• Running state if you are debugging an OS-aware application.
The Target view shows the breakpoint capabilities of the target.
Considerations when setting breakpointsBe aware of the following when setting breakpoints:• The number of hardware breakpoints available depends on your processor. Also, there is a
dependency between the number of hardware breakpoints and watchpoints because they use the sameprocessor hardware.
• If an image is compiled with a high optimization level or contains C++ templates, then the effect ofsetting a breakpoint in the source code depends on where you set the breakpoint. For example, if youset a breakpoint on an inlined function in a C++ template, then a breakpoint is created for eachinstance of that function or template. Therefore the target can run out of breakpoint resources.
• Enabling a Memory Management Unit (MMU) might set a memory region to read-only. If thatmemory region contains a software breakpoint, then that software breakpoint cannot be removed.Therefore, make sure you clear software breakpoints before enabling the MMU.
• When debugging an application that uses shared objects, breakpoints that are set within a sharedobject are re-evaluated when the shared object is unloaded. Those with addresses that can be resolvedare set and the others remain pending.
• If a breakpoint is set by function name, then only inline instances that have been already demandloaded on page 16-499 are found.
3 Controlling Target Execution3.1 Overview: Breakpoints and Watchpoints
ARM DUI0446Z Copyright © 2010-2016 ARM Limited or its affiliates. All rightsreserved.
3-70
Non-Confidential
Watchpoints
A watchpoint is similar to a breakpoint, but it is the address of a data access that is monitored rather thanan instruction being executed. You specify a global variable or a memory address to monitor.Watchpoints are sometimes known as data breakpoints, emphasizing that they are data dependent.Execution of your application stops when the address being monitored is accessed by your application.You can set read, write, or read/write watchpoints.
Considerations when setting watchpointsBe aware of the following when setting watchpoints:• Depending on the target, it is possible that a few additional instructions, after the instruction that
accessed the variable, might also be executed. This is because of pipelining effects in the processor.This means that the address that your program stops at might not exactly correspond with theinstruction that caused the watchpoint to trigger.
• Watchpoints are only supported on scalar values.• Watchpoints are only supported on global or static data symbols because they are always in scope and
at the same address. Local variables are no longer available when you step out of a particularfunction.
• The number of watchpoints that can be set at the same time depends on the target and the debugconnection being used.
• Some targets do not support watchpoints.
Related tasks3.3 Working with breakpoints on page 3-74.3.4 Working with watchpoints on page 3-75.
Related references3.8 Conditional breakpoints on page 3-81.3.12 Pending breakpoints and watchpoints on page 3-87.
3 Controlling Target Execution3.1 Overview: Breakpoints and Watchpoints
ARM DUI0446Z Copyright © 2010-2016 ARM Limited or its affiliates. All rightsreserved.
3-71
Non-Confidential
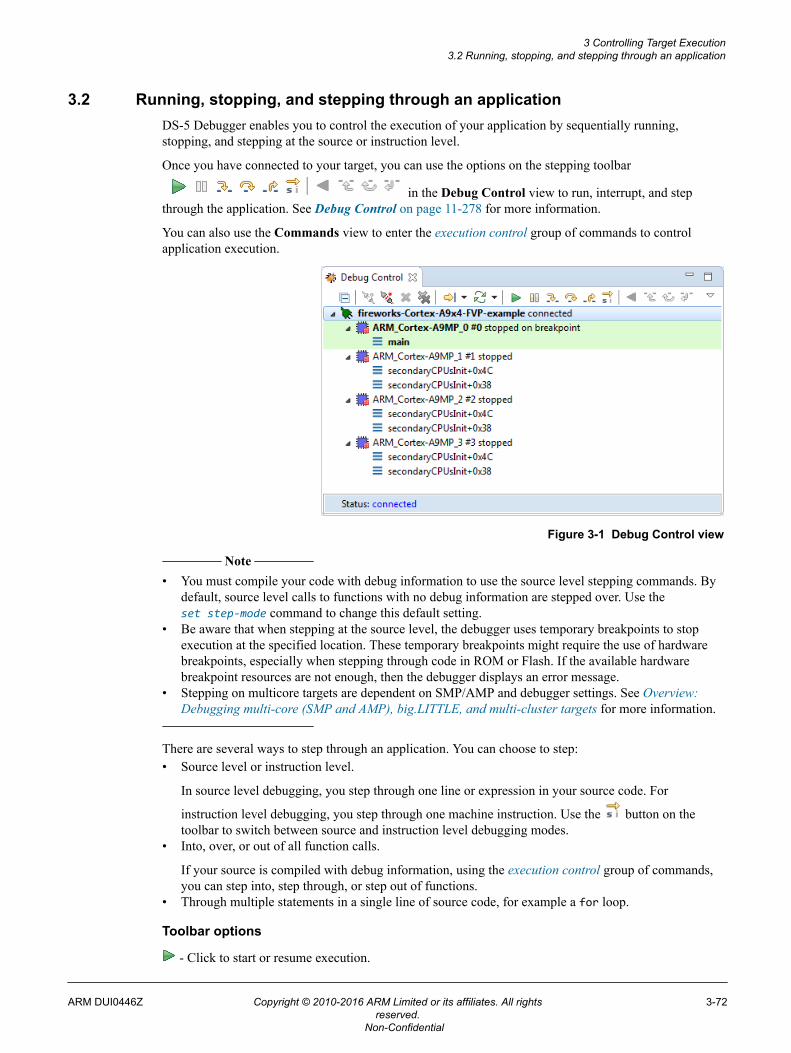
3.2 Running, stopping, and stepping through an applicationDS-5 Debugger enables you to control the execution of your application by sequentially running,stopping, and stepping at the source or instruction level.
Once you have connected to your target, you can use the options on the stepping toolbar
in the Debug Control view to run, interrupt, and stepthrough the application. See Debug Control on page 11-278 for more information.
You can also use the Commands view to enter the execution control group of commands to controlapplication execution.
Figure 3-1 Debug Control view
Note
• You must compile your code with debug information to use the source level stepping commands. Bydefault, source level calls to functions with no debug information are stepped over. Use theset step-mode command to change this default setting.
• Be aware that when stepping at the source level, the debugger uses temporary breakpoints to stopexecution at the specified location. These temporary breakpoints might require the use of hardwarebreakpoints, especially when stepping through code in ROM or Flash. If the available hardwarebreakpoint resources are not enough, then the debugger displays an error message.
• Stepping on multicore targets are dependent on SMP/AMP and debugger settings. See Overview:Debugging multi-core (SMP and AMP), big.LITTLE, and multi-cluster targets for more information.
There are several ways to step through an application. You can choose to step:• Source level or instruction level.
In source level debugging, you step through one line or expression in your source code. For
instruction level debugging, you step through one machine instruction. Use the button on thetoolbar to switch between source and instruction level debugging modes.
• Into, over, or out of all function calls.
If your source is compiled with debug information, using the execution control group of commands,you can step into, step through, or step out of functions.
• Through multiple statements in a single line of source code, for example a for loop.
Toolbar options
- Click to start or resume execution.
3 Controlling Target Execution3.2 Running, stopping, and stepping through an application
ARM DUI0446Z Copyright © 2010-2016 ARM Limited or its affiliates. All rightsreserved.
3-72
Non-Confidential
- Click to pause execution.
- Click to step through the code.
- Click to step over code.
- Click to continue running to the next line of code after the selected stack frame finishes.
- Click to change the stepping mode between source line and instruction.
Application rewind-specific options:
- Click to continue running backwards through the code.
- Click to step backwards through the code.
- Click to step backwards over a line of code.
- Click to continue running to the next line of code backwards after the selected stack frame finishes.
Example 3-1 Stepping commands example
To step a specified number of times you must use the Commands view to manually execute one of thestepping commands with a number.
For example:
steps 5 # Execute five source statementsstepi 5 # Execute five instructions
See Commands view on page 11-275 for more information.
Related concepts6.9 About debugging shared libraries on page 6-153.6.10.2 About debugging a Linux kernel on page 6-156.6.10.3 About debugging Linux kernel modules on page 6-158.
Related references5.1 Examining the target execution environment on page 5-136.5.2 Examining the call stack on page 5-137.3.14 Handling UNIX signals on page 3-90.3.15 Handling processor exceptions on page 3-92.
3 Controlling Target Execution3.2 Running, stopping, and stepping through an application
ARM DUI0446Z Copyright © 2010-2016 ARM Limited or its affiliates. All rightsreserved.
3-73
Non-Confidential
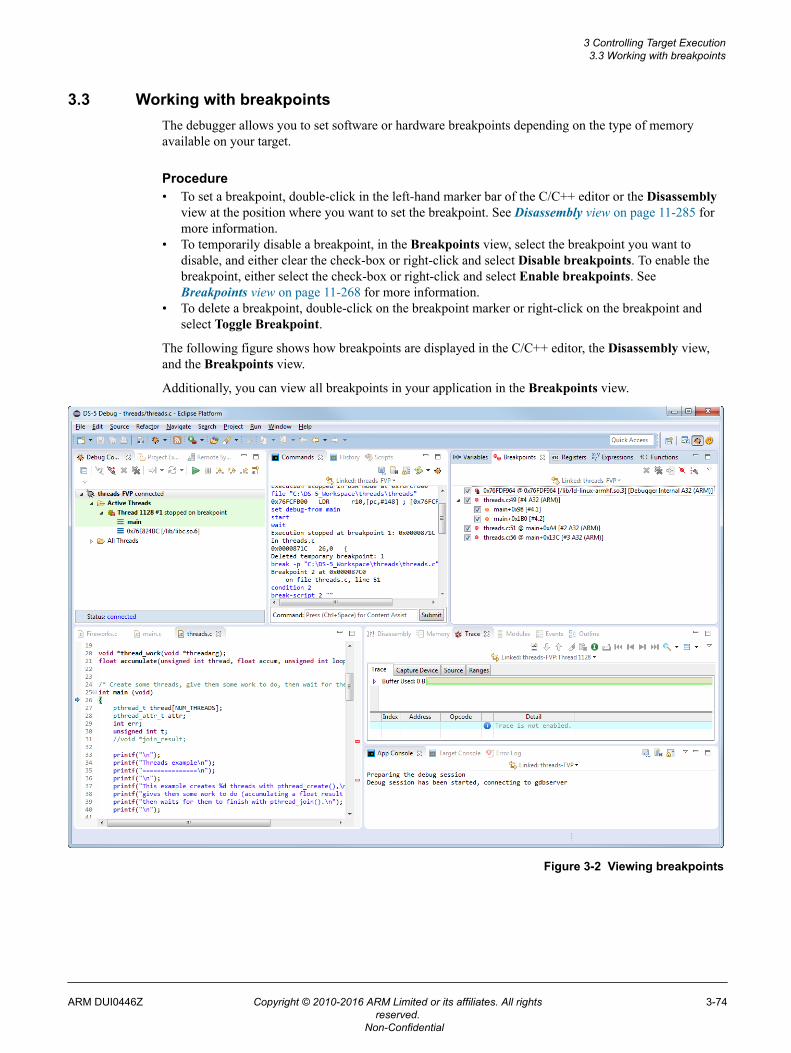
3.3 Working with breakpointsThe debugger allows you to set software or hardware breakpoints depending on the type of memoryavailable on your target.
Procedure• To set a breakpoint, double-click in the left-hand marker bar of the C/C++ editor or the Disassembly
view at the position where you want to set the breakpoint. See Disassembly view on page 11-285 formore information.
• To temporarily disable a breakpoint, in the Breakpoints view, select the breakpoint you want todisable, and either clear the check-box or right-click and select Disable breakpoints. To enable thebreakpoint, either select the check-box or right-click and select Enable breakpoints. SeeBreakpoints view on page 11-268 for more information.
• To delete a breakpoint, double-click on the breakpoint marker or right-click on the breakpoint andselect Toggle Breakpoint.
The following figure shows how breakpoints are displayed in the C/C++ editor, the Disassembly view,and the Breakpoints view.
Additionally, you can view all breakpoints in your application in the Breakpoints view.
Figure 3-2 Viewing breakpoints
3 Controlling Target Execution3.3 Working with breakpoints
ARM DUI0446Z Copyright © 2010-2016 ARM Limited or its affiliates. All rightsreserved.
3-74
Non-Confidential
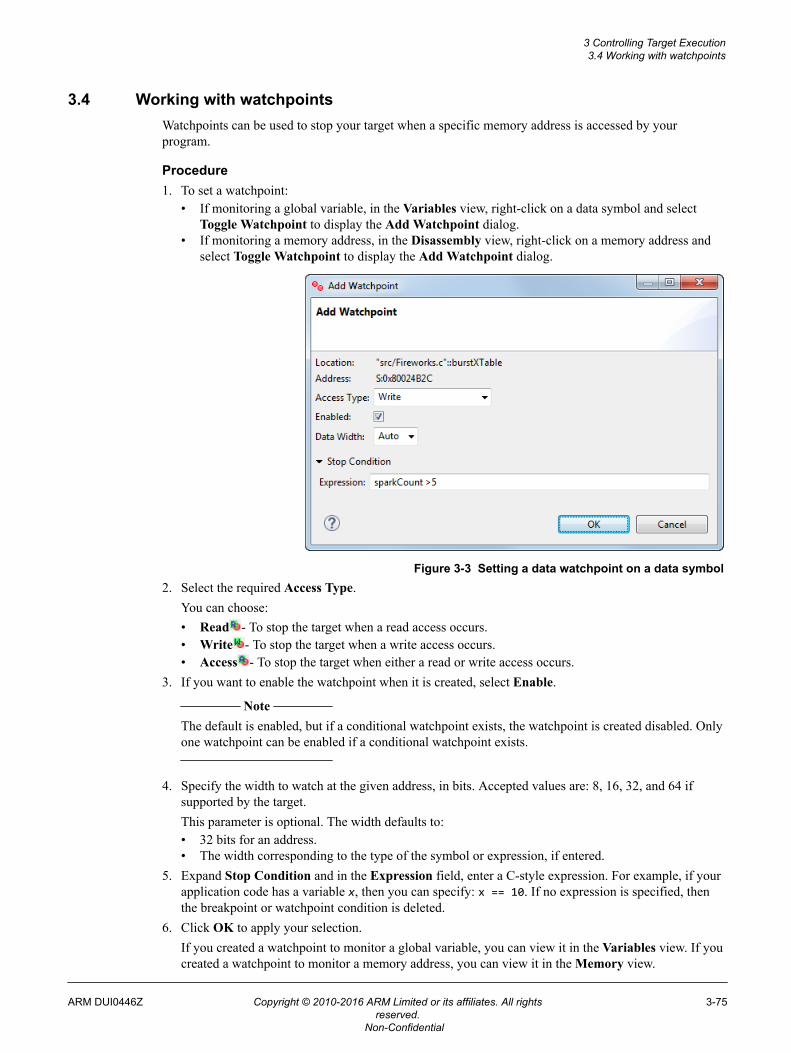
3.4 Working with watchpointsWatchpoints can be used to stop your target when a specific memory address is accessed by yourprogram.
Procedure1. To set a watchpoint:
• If monitoring a global variable, in the Variables view, right-click on a data symbol and selectToggle Watchpoint to display the Add Watchpoint dialog.
• If monitoring a memory address, in the Disassembly view, right-click on a memory address andselect Toggle Watchpoint to display the Add Watchpoint dialog.
Figure 3-3 Setting a data watchpoint on a data symbol2. Select the required Access Type.
You can choose:• Read - To stop the target when a read access occurs.• Write - To stop the target when a write access occurs.• Access - To stop the target when either a read or write access occurs.
3. If you want to enable the watchpoint when it is created, select Enable. Note
The default is enabled, but if a conditional watchpoint exists, the watchpoint is created disabled. Onlyone watchpoint can be enabled if a conditional watchpoint exists.
4. Specify the width to watch at the given address, in bits. Accepted values are: 8, 16, 32, and 64 ifsupported by the target.This parameter is optional. The width defaults to:• 32 bits for an address.• The width corresponding to the type of the symbol or expression, if entered.
5. Expand Stop Condition and in the Expression field, enter a C-style expression. For example, if yourapplication code has a variable x, then you can specify: x == 10. If no expression is specified, thenthe breakpoint or watchpoint condition is deleted.
6. Click OK to apply your selection.If you created a watchpoint to monitor a global variable, you can view it in the Variables view. If youcreated a watchpoint to monitor a memory address, you can view it in the Memory view.
3 Controlling Target Execution3.4 Working with watchpoints
ARM DUI0446Z Copyright © 2010-2016 ARM Limited or its affiliates. All rightsreserved.
3-75
Non-Confidential
Also, you can view all watchpoints and breakpoints in your application in the Breakpoints view.• To delete a watchpoint, right-click a watchpoint and either select Remove Watchpoint or select
Toggle Watchpoint.• To disable a watchpoint, right-click a watchpoint and select Disable Watchpoint to temporarily
disable it. To re-enable it, select Enable Watchpoint.
Related tasks3.11 Assigning conditions to an existing watchpoint on page 3-85.
Related references11.35 Watchpoint Properties dialog box on page 11-352.
Related informationDS-5 Debugger command: awatch.DS-5 Debugger command: rwatch.DS-5 Debugger command: watch.DS-5 Debugger command: watch.DS-5 Debugger command: watch-set-property.
3 Controlling Target Execution3.4 Working with watchpoints
ARM DUI0446Z Copyright © 2010-2016 ARM Limited or its affiliates. All rightsreserved.
3-76
Non-Confidential
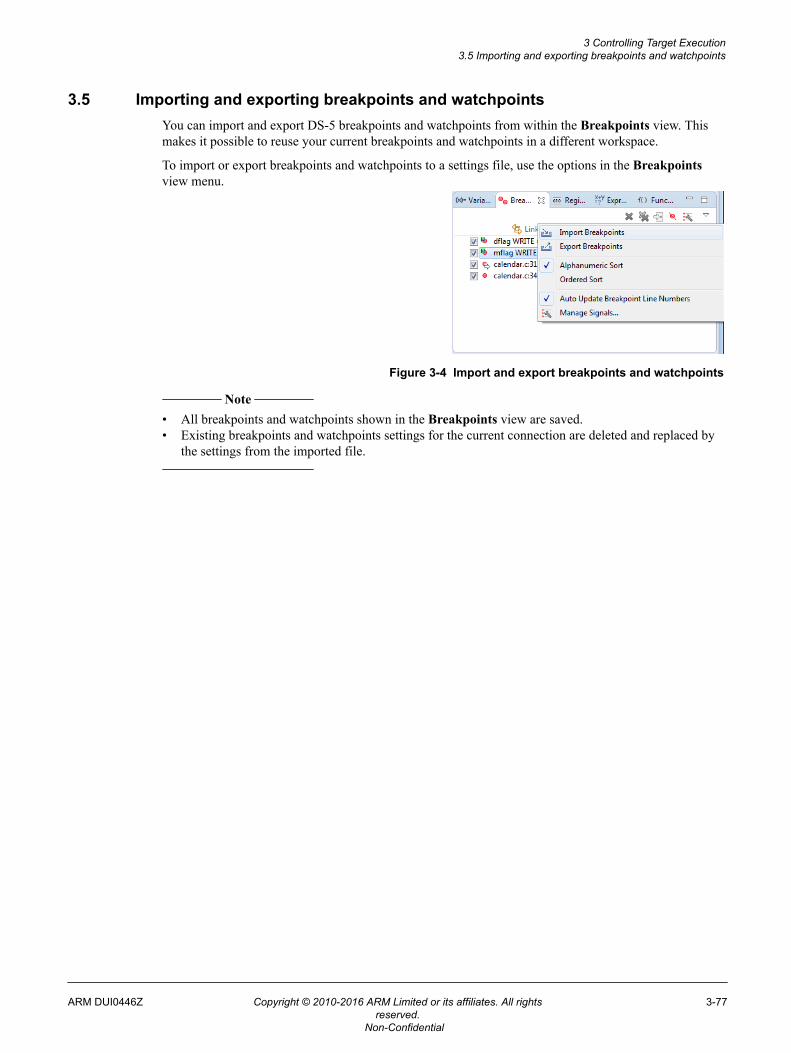
3.5 Importing and exporting breakpoints and watchpointsYou can import and export DS-5 breakpoints and watchpoints from within the Breakpoints view. Thismakes it possible to reuse your current breakpoints and watchpoints in a different workspace.
To import or export breakpoints and watchpoints to a settings file, use the options in the Breakpointsview menu.
Figure 3-4 Import and export breakpoints and watchpoints
Note
• All breakpoints and watchpoints shown in the Breakpoints view are saved.• Existing breakpoints and watchpoints settings for the current connection are deleted and replaced by
the settings from the imported file.
3 Controlling Target Execution3.5 Importing and exporting breakpoints and watchpoints
ARM DUI0446Z Copyright © 2010-2016 ARM Limited or its affiliates. All rightsreserved.
3-77
Non-Confidential
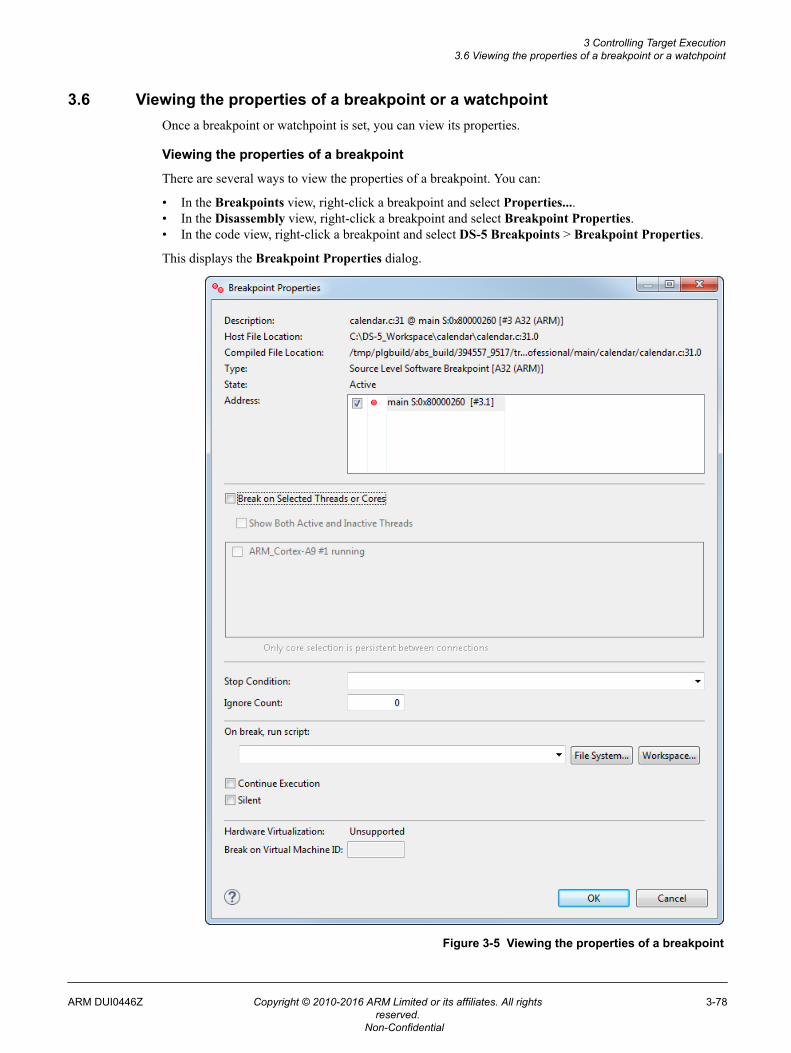
3.6 Viewing the properties of a breakpoint or a watchpointOnce a breakpoint or watchpoint is set, you can view its properties.
Viewing the properties of a breakpoint
There are several ways to view the properties of a breakpoint. You can:
• In the Breakpoints view, right-click a breakpoint and select Properties....• In the Disassembly view, right-click a breakpoint and select Breakpoint Properties.• In the code view, right-click a breakpoint and select DS-5 Breakpoints > Breakpoint Properties.
This displays the Breakpoint Properties dialog.
Figure 3-5 Viewing the properties of a breakpoint
3 Controlling Target Execution3.6 Viewing the properties of a breakpoint or a watchpoint
ARM DUI0446Z Copyright © 2010-2016 ARM Limited or its affiliates. All rightsreserved.
3-78
Non-Confidential
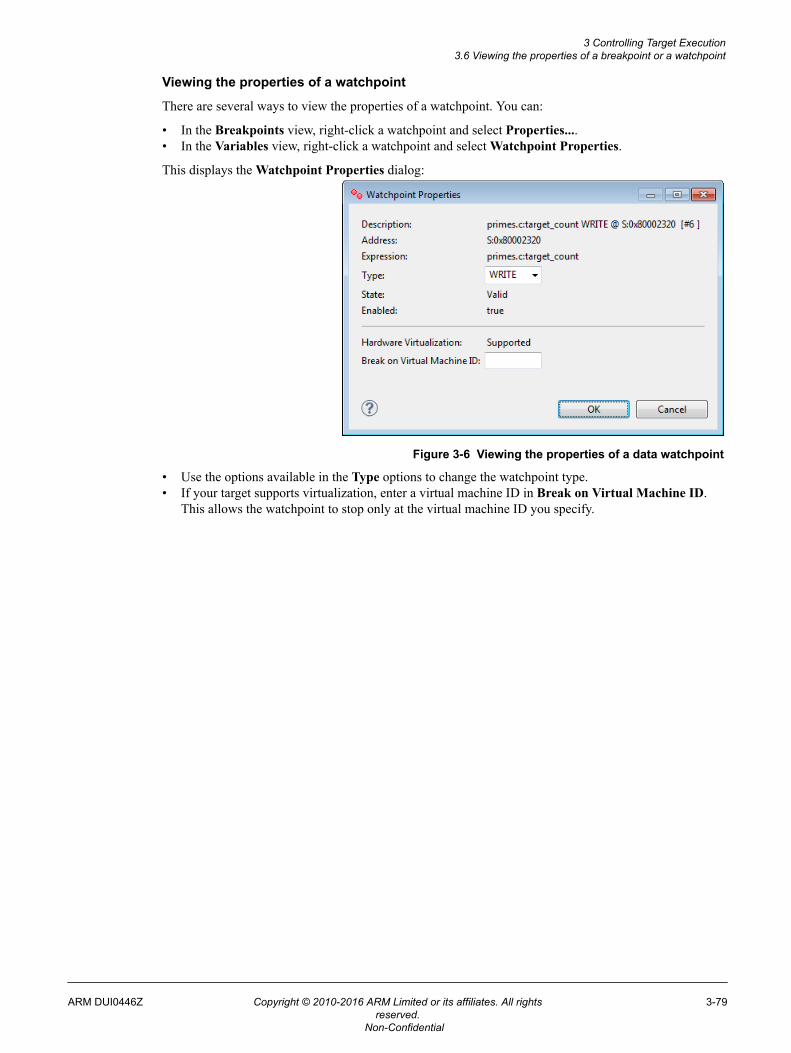
Viewing the properties of a watchpoint
There are several ways to view the properties of a watchpoint. You can:
• In the Breakpoints view, right-click a watchpoint and select Properties....• In the Variables view, right-click a watchpoint and select Watchpoint Properties.
This displays the Watchpoint Properties dialog:
Figure 3-6 Viewing the properties of a data watchpoint
• Use the options available in the Type options to change the watchpoint type.• If your target supports virtualization, enter a virtual machine ID in Break on Virtual Machine ID.
This allows the watchpoint to stop only at the virtual machine ID you specify.
3 Controlling Target Execution3.6 Viewing the properties of a breakpoint or a watchpoint
ARM DUI0446Z Copyright © 2010-2016 ARM Limited or its affiliates. All rightsreserved.
3-79
Non-Confidential
3.7 Associating debug scripts to breakpointsUsing conditional breakpoints, you can run a script each time the selected breakpoint is triggered. Youassign a script file to a specific breakpoint, and when the breakpoint is hit, the script executes.
If using the user interface, use the Breakpoint Properties dialog box to specify your script. SeeBreakpoint Properties on page 11-349 for more information.
If using the command-line, use the break-script command to specify your script.
Be aware of the following when using scripts with breakpoints:• If you assign a script to a breakpoint that has sub-breakpoints, the debugger attempts to execute the
script for each sub-breakpoint. If this happens, an error message is displayed. For an example of sub-breakpoints, see Breakpoints view on page 11-268.
• Take care with commands you use in a script that is attached to a breakpoint. For example, if you usethe quit command in a script, the debugger disconnects from the target when the breakpoint is hit.
• If you put the continue command at the end of a script, this has the same effect as setting theContinue Execution option on the Breakpoint Properties dialog box.
3 Controlling Target Execution3.7 Associating debug scripts to breakpoints
ARM DUI0446Z Copyright © 2010-2016 ARM Limited or its affiliates. All rightsreserved.
3-80
Non-Confidential
3.8 Conditional breakpointsConditional breakpoints have properties assigned to test for conditions that must be satisfied to triggerthe breakpoint. When the underlying breakpoint is hit, the specified condition is checked and if itevaluates to true, then the target remains in the stopped state, otherwise execution resumes.
For example, using conditional breakpoints, you can:
• Test a variable for a given value.• Execute a function a set number of times.• Trigger a breakpoint only on a specific thread or processor.
Breakpoints that are set on a single line of source code with multiple statements are assigned as sub-breakpoints to a parent breakpoint. You can enable, disable, and view the properties of each sub-breakpoint in the same way as a single statement breakpoint. Conditions are assigned to top levelbreakpoints only and therefore affect both the parent breakpoint and sub-breakpoints.
See Assigning conditions to an existing breakpoint on page 3-82 for an example. Also, see the detailsof the break command to see how it is used to specify conditional breakpoints.
Note
• Conditional breakpoints can be very intrusive and lower the performance if they are hit frequentlysince the debugger stops the target every time the breakpoint triggers.
• If you assign a script to a breakpoint that has sub-breakpoints, the debugger attempts to execute thescript for each sub-breakpoint. If this happens, an error message is displayed. For an example of sub-breakpoints, see Breakpoints view on page 11-268.
Considerations when setting multiple conditions on a breakpointBe aware of the following when setting multiple conditions on a breakpoint:• If you set a Stop Condition and an Ignore Count, then the Ignore Count is not decremented until
the Stop Condition is met. For example, you might have a breakpoint in a loop that is controlled bythe variable c and has 10 iterations. If you set the Stop Condition c==5 and the Ignore Count to 3,then the breakpoint might not activate until it has been hit with c==5 for the fourth time. Itsubsequently activates every time it is hit with c==5.
• If you choose to break on a selected thread or processor, then the Stop Condition and Ignore Countare checked only for the selected thread or processor.
• Conditions are evaluated in the following order:1. Thread or processor.2. Condition.3. Ignore count.
Related references11.3 ARM assembler editor on page 11-266.11.4 Breakpoints view on page 11-268.11.5 C/C++ editor on page 11-272.11.6 Commands view on page 11-275.11.9 Disassembly view on page 11-285.11.12 Expressions view on page 11-294.11.15 Memory view on page 11-302.11.18 Registers view on page 11-314.11.28 Variables view on page 11-337.
3 Controlling Target Execution3.8 Conditional breakpoints
ARM DUI0446Z Copyright © 2010-2016 ARM Limited or its affiliates. All rightsreserved.
3-81
Non-Confidential
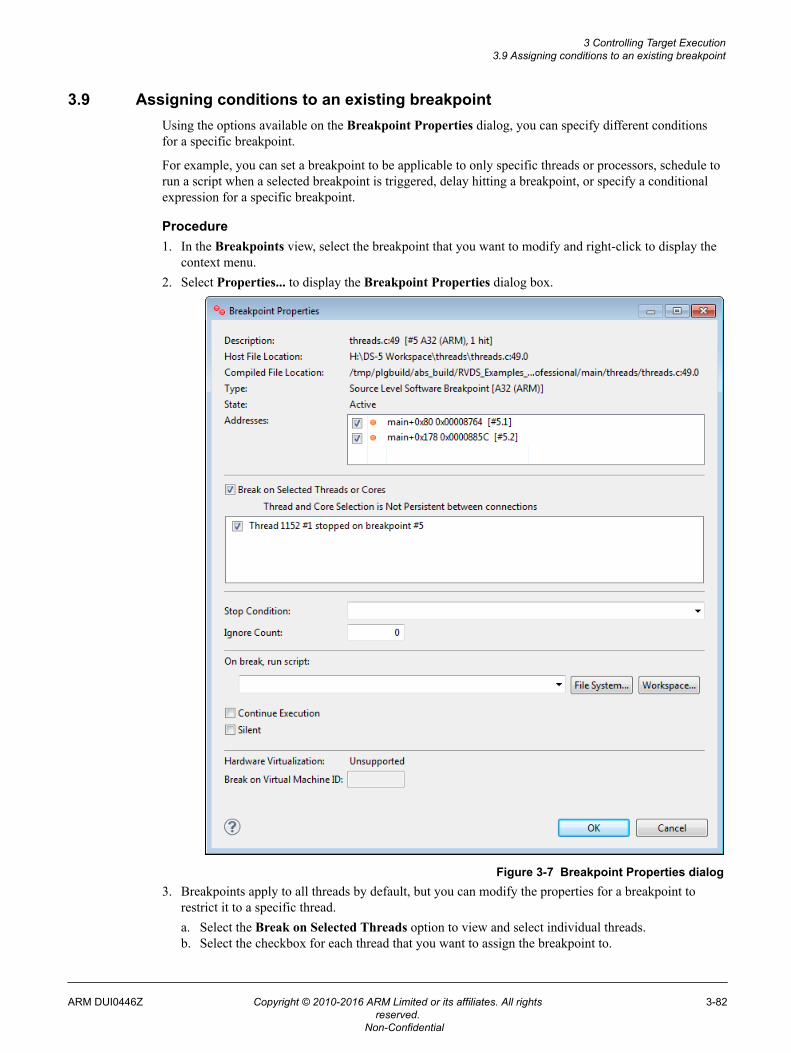
3.9 Assigning conditions to an existing breakpointUsing the options available on the Breakpoint Properties dialog, you can specify different conditionsfor a specific breakpoint.
For example, you can set a breakpoint to be applicable to only specific threads or processors, schedule torun a script when a selected breakpoint is triggered, delay hitting a breakpoint, or specify a conditionalexpression for a specific breakpoint.
Procedure1. In the Breakpoints view, select the breakpoint that you want to modify and right-click to display the
context menu.2. Select Properties... to display the Breakpoint Properties dialog box.
Figure 3-7 Breakpoint Properties dialog3. Breakpoints apply to all threads by default, but you can modify the properties for a breakpoint to
restrict it to a specific thread.a. Select the Break on Selected Threads option to view and select individual threads.b. Select the checkbox for each thread that you want to assign the breakpoint to.
3 Controlling Target Execution3.9 Assigning conditions to an existing breakpoint
ARM DUI0446Z Copyright © 2010-2016 ARM Limited or its affiliates. All rightsreserved.
3-82
Non-Confidential
Note
If you set a breakpoint for a specific thread, then any conditions you set for the breakpoint arechecked only for that thread.
4. If you want to set a conditional expression for a specific breakpoint, then:a. In the Stop Condition field, enter a C-style expression. For example, if your application code has
a variable x, then you can specify: x == 10 Tip
See the break command to see how it is used to specify conditional breakpoints.
5. If you want the debugger to delay hitting the breakpoint until a specific number of passes hasoccurred, then:a. In the Ignore Count field, enter the number of passes. For example, if you have a loop that
performs 100 iterations, and you want a breakpoint in that loop to be hit after 50 passes, then enter50.
6. If you want to run a script when the selected breakpoint is triggered, then:a. In the On break, run script field, specify the script file.
Click File System... to locate the file in an external directory from the workspace or clickWorkspace... to locate the file within the workspace.
Note
Take care with commands used in a script file that is attached to a breakpoint. For example, if thescript file contains the quit command, the debugger disconnects from the target when thebreakpoint is hit.
7. Select Continue Execution if you want to enable the debugger to automatically continue running theapplication on completion of all the breakpoint actions. Alternatively, you can enter the continuecommand as the last command in a script file, that is attached to a breakpoint.
8. Select Silent if you want to hide breakpoint information in the Commands view.9. If required, specify a Virtual Machine ID (VMID).
Note
You can only specify a Virtual Machine ID (VMID) if hardware virtualization is supported by yourtarget.
10. Once you have selected the required options, click OK to save your changes.
Related references11.3 ARM assembler editor on page 11-266.11.4 Breakpoints view on page 11-268.11.5 C/C++ editor on page 11-272.11.6 Commands view on page 11-275.11.9 Disassembly view on page 11-285.11.12 Expressions view on page 11-294.11.15 Memory view on page 11-302.11.18 Registers view on page 11-314.11.28 Variables view on page 11-337.
3 Controlling Target Execution3.9 Assigning conditions to an existing breakpoint
ARM DUI0446Z Copyright © 2010-2016 ARM Limited or its affiliates. All rightsreserved.
3-83
Non-Confidential
3.10 Conditional watchpointsConditional watchpoints have properties that are assigned to test for conditions that must be satisfied totrigger the watchpoint. When the conditional watchpoint is hit, the specified condition is checked and ifit evaluates to true, the watchpoint is triggered, and the target stops.
For example, using conditional watchpoints you can:• Set a watchpoint to stop when accessing data from a memory region, but only when a variable
evaluates to a given value.• On processors that implement virtualization extensions, you can set a watchpoint to trigger only when
running within a specific virtual machine (determined through its Virtual Machine ID (VMID)).• On all ARMv7 and ARMv8 processors, you can set a watchpoint to trigger only when a specific
process is running, as defined by the current Context ID.
Note
• Conditional watchpoints are not supported on gdbserver connections currently.• You can create several conditional watchpoints, but when a conditional watchpoint is enabled, no
other watchpoints (regardless of whether they are conditional) can be enabled.• Conditional watchpoints can be intrusive and lower performance if they are hit frequently since the
debugger stops the target every time the watchpoint triggers.
See 3.4 Working with watchpoints on page 3-75 for details about assigning a condition to watchpointwhen creating it. See 3.11 Assigning conditions to an existing watchpoint on page 3-85 for details aboutassigning conditions to an existing watchpoint.
You can also use the awatch, rwatch, and watch commands to assign conditions to a watchpoint.
Considerations when creating conditional watchpoints• If the instruction causing the trap occurred synchronously, then to evaluate a condition after any state
has changed (for example, a store to an address), the debugger steps the instruction that caused thetrap. The debugger then proceeds to evaluate the condition to see whether to stop on the watchpoint.This is required so that a specific address can be watched and trap immediately after a specific valueis written to that address.
• Ignore count or core/thread specific watchpoints are not supported.
3 Controlling Target Execution3.10 Conditional watchpoints
ARM DUI0446Z Copyright © 2010-2016 ARM Limited or its affiliates. All rightsreserved.
3-84
Non-Confidential
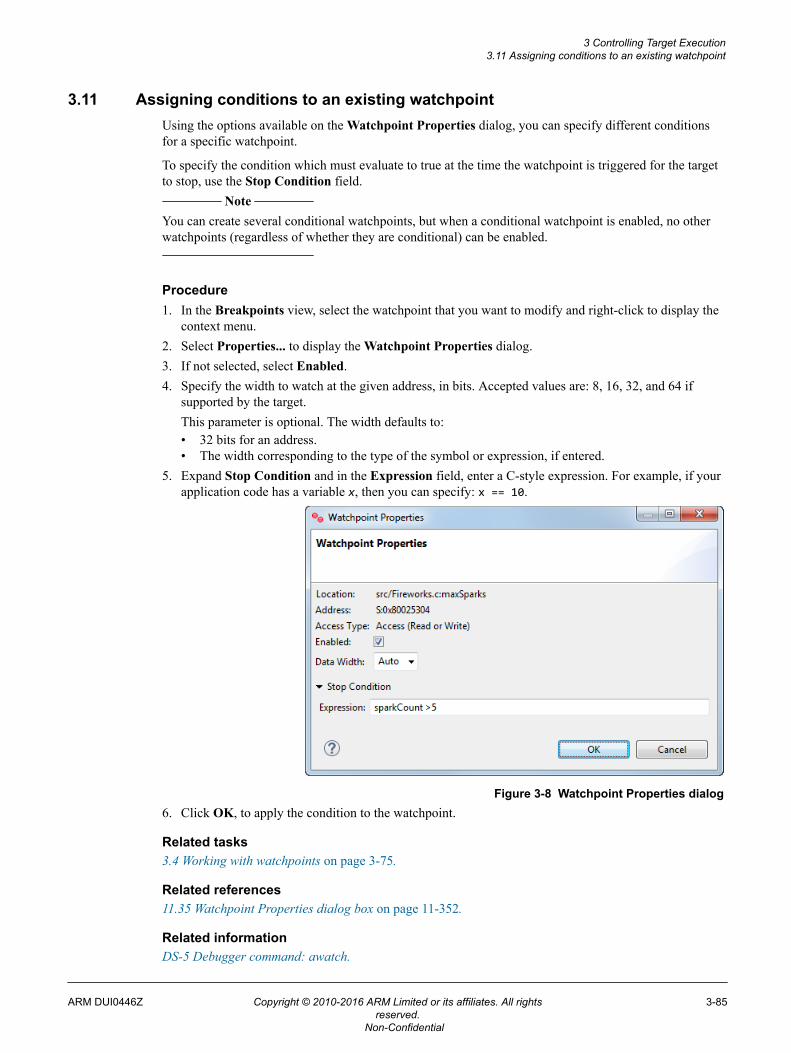
3.11 Assigning conditions to an existing watchpointUsing the options available on the Watchpoint Properties dialog, you can specify different conditionsfor a specific watchpoint.
To specify the condition which must evaluate to true at the time the watchpoint is triggered for the targetto stop, use the Stop Condition field.
Note
You can create several conditional watchpoints, but when a conditional watchpoint is enabled, no otherwatchpoints (regardless of whether they are conditional) can be enabled.
Procedure1. In the Breakpoints view, select the watchpoint that you want to modify and right-click to display the
context menu.2. Select Properties... to display the Watchpoint Properties dialog.3. If not selected, select Enabled.4. Specify the width to watch at the given address, in bits. Accepted values are: 8, 16, 32, and 64 if
supported by the target.This parameter is optional. The width defaults to:• 32 bits for an address.• The width corresponding to the type of the symbol or expression, if entered.
5. Expand Stop Condition and in the Expression field, enter a C-style expression. For example, if yourapplication code has a variable x, then you can specify: x == 10.
Figure 3-8 Watchpoint Properties dialog6. Click OK, to apply the condition to the watchpoint.
Related tasks3.4 Working with watchpoints on page 3-75.
Related references11.35 Watchpoint Properties dialog box on page 11-352.
Related informationDS-5 Debugger command: awatch.
3 Controlling Target Execution3.11 Assigning conditions to an existing watchpoint
ARM DUI0446Z Copyright © 2010-2016 ARM Limited or its affiliates. All rightsreserved.
3-85
Non-Confidential

DS-5 Debugger command: rwatch.DS-5 Debugger command: watch.DS-5 Debugger command: watch.DS-5 Debugger command: watch-set-property.
3 Controlling Target Execution3.11 Assigning conditions to an existing watchpoint
ARM DUI0446Z Copyright © 2010-2016 ARM Limited or its affiliates. All rightsreserved.
3-86
Non-Confidential
3.12 Pending breakpoints and watchpointsA pending breakpoint or watchpoint is one that exists in the debugger but is not active on the target untilsome precondition is met, such as a shared library being loaded.
Breakpoints and watchpoints are typically set when debug information is available. Pending breakpointsand watchpoints, however, enable you to set breakpoints and watchpoints before the associated debuginformation is available.
When a new shared library is loaded, the debugger re-evaluates all pending breakpoints and watchpoints.Breakpoints or watchpoints with addresses that can be resolved are set as standard execution breakpointsor watchpoints and those with unresolved addresses remain pending. The debugger automaticallychanges any breakpoints or watchpoints in a shared library to a pending one when the library is unloadedby your application.
Manually setting a pending breakpoint or watchpoint
To manually set a pending breakpoint or watchpoint, you can use the -p option with any of thesecommands:
advance
break
hbreak
tbreak
thbreak
watch
awatch
rwatch Tip
You can enter debugger commands in the Commands view. See Commands view on page 11-275for more information.
Example 3-2 Pending breakpoint/watchpoint example
break -p lib.c:20 # Sets a pending breakpoint at line 20 in lib.cawatch -p *0x80D4 # Sets a pending read/write watchpoint on address 0x80D4
Resolving a pending breakpoint or watchpoint
You can force the resolution of a pending breakpoint or watchpoint. This might be useful, for example, ifyou have manually modified the shared library search paths.
To resolve a pending breakpoint or watchpoint:• If using the user interface, right-click on the pending breakpoint or watchpoint that you want to
resolve, and select Resolve.• If using the command-line, use the resolve command.
Related references11.3 ARM assembler editor on page 11-266.11.4 Breakpoints view on page 11-268.11.5 C/C++ editor on page 11-272.
3 Controlling Target Execution3.12 Pending breakpoints and watchpoints
ARM DUI0446Z Copyright © 2010-2016 ARM Limited or its affiliates. All rightsreserved.
3-87
Non-Confidential

11.6 Commands view on page 11-275.11.9 Disassembly view on page 11-285.11.12 Expressions view on page 11-294.11.15 Memory view on page 11-302.11.18 Registers view on page 11-314.11.28 Variables view on page 11-337.
3 Controlling Target Execution3.12 Pending breakpoints and watchpoints
ARM DUI0446Z Copyright © 2010-2016 ARM Limited or its affiliates. All rightsreserved.
3-88
Non-Confidential
3.13 Setting a tracepointTracepoints are memory locations that are used to trigger behavior in a trace capture device whenrunning an application. A tracepoint is hit when the processor executes an instruction at a specificaddress. Depending on the tracepoint type, trace capture is either enabled or disabled.
Tracepoints can be set from the following:• ARM Assembler editor.• C/C++ editor.• Disassembly view.• Functions view.• Memory view.• The instruction execution history panel in the Trace view.
To set a tracepoint, right-click in the left-hand marker bar at the position where you want to set thetracepoint and select either Toggle Trace Start Point, Toggle Trace Stop Point, or Toggle TraceTrigger Point from the context menu. To remove a tracepoint, repeat this procedure on the sametracepoint or delete it from the Breakpoints view. See About trace support on page 5-138 for moreinformation about Trace Start, Stop, and Trigger Point.
Tracepoints are stored on a per connection basis. If the active connection is disconnected then tracepointscan only be created from the source editor.
All tracepoints are visible in the Breakpoints view.
Related references11.3 ARM assembler editor on page 11-266.11.4 Breakpoints view on page 11-268.11.5 C/C++ editor on page 11-272.11.6 Commands view on page 11-275.11.9 Disassembly view on page 11-285.11.12 Expressions view on page 11-294.11.15 Memory view on page 11-302.11.18 Registers view on page 11-314.11.28 Variables view on page 11-337.
3 Controlling Target Execution3.13 Setting a tracepoint
ARM DUI0446Z Copyright © 2010-2016 ARM Limited or its affiliates. All rightsreserved.
3-89
Non-Confidential
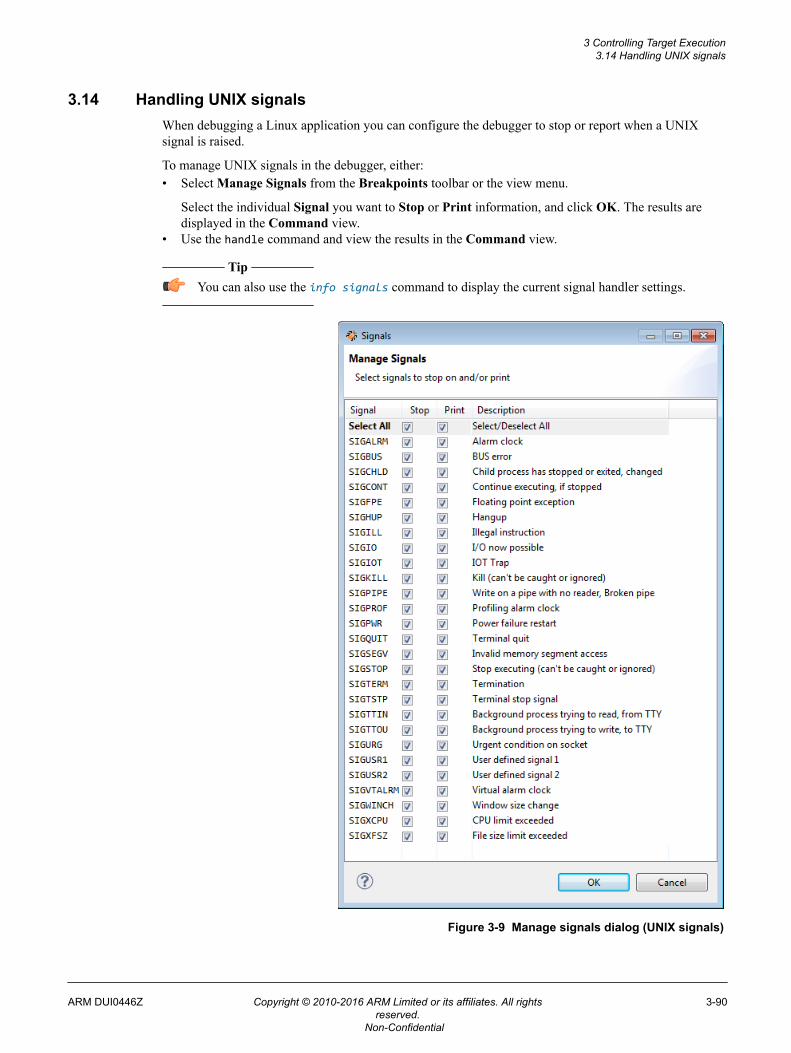
3.14 Handling UNIX signalsWhen debugging a Linux application you can configure the debugger to stop or report when a UNIXsignal is raised.
To manage UNIX signals in the debugger, either:• Select Manage Signals from the Breakpoints toolbar or the view menu.
Select the individual Signal you want to Stop or Print information, and click OK. The results aredisplayed in the Command view.
• Use the handle command and view the results in the Command view.
Tip
You can also use the info signals command to display the current signal handler settings.
Figure 3-9 Manage signals dialog (UNIX signals)
3 Controlling Target Execution3.14 Handling UNIX signals
ARM DUI0446Z Copyright © 2010-2016 ARM Limited or its affiliates. All rightsreserved.
3-90
Non-Confidential
Note
UNIX signals SIGINT and SIGTRAP cannot be debugged in the same way as other signals because theyare used internally by the debugger for asynchronous stopping of the process and breakpointsrespectively.
Example 3-3 Managing signals
If you want the application to ignore a signal, but log the event when it is triggered, then you must enablestopping on a signal.
Ignoring a SIGHUP signalIn the following example, a SIGHUP signal occurs causing the debugger to stop and print amessage. No signal handler is invoked when using this setting and the debugged applicationignores the signal and continues to operate.
handle SIGHUP stop print # Enable stop and print on SIGHUP signal
Debugging a SIGHUP signalThe following example shows how to debug a signal handler.
To do this you must disable stopping on a signal and then set a breakpoint in the signal handler.This is because if stopping on a signal is disabled then the handling of that signal is performedby the process that passes signal to the registered handler. If no handler is registered then thedefault handler runs and the application generally exits.
handle SIGHUP nostop noprint # Disable stop and print on SIGHUP signal
Related concepts6.9 About debugging shared libraries on page 6-153.6.10.2 About debugging a Linux kernel on page 6-156.6.10.3 About debugging Linux kernel modules on page 6-158.
Related references3.2 Running, stopping, and stepping through an application on page 3-72.5.1 Examining the target execution environment on page 5-136.5.2 Examining the call stack on page 5-137.3.15 Handling processor exceptions on page 3-92.11.4 Breakpoints view on page 11-268.11.6 Commands view on page 11-275.11.37 Manage Signals dialog box on page 11-354.
Related informationDS-5 Debugger commands.
3 Controlling Target Execution3.14 Handling UNIX signals
ARM DUI0446Z Copyright © 2010-2016 ARM Limited or its affiliates. All rightsreserved.
3-91
Non-Confidential
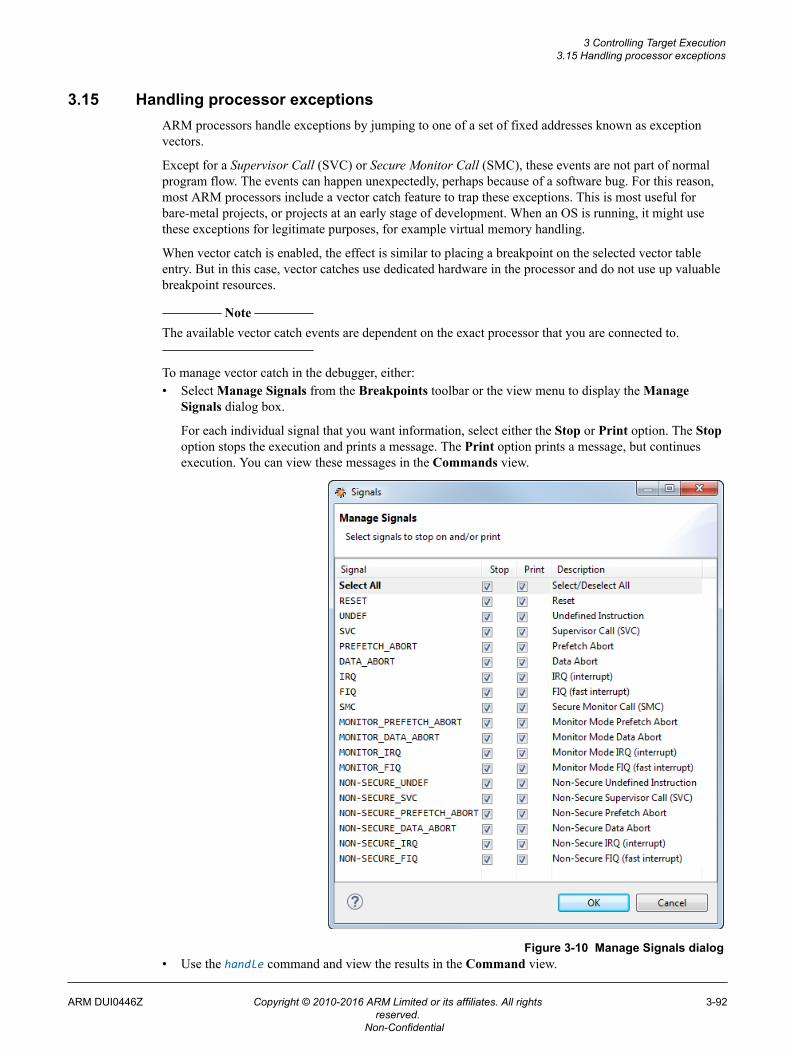
3.15 Handling processor exceptionsARM processors handle exceptions by jumping to one of a set of fixed addresses known as exceptionvectors.
Except for a Supervisor Call (SVC) or Secure Monitor Call (SMC), these events are not part of normalprogram flow. The events can happen unexpectedly, perhaps because of a software bug. For this reason,most ARM processors include a vector catch feature to trap these exceptions. This is most useful forbare-metal projects, or projects at an early stage of development. When an OS is running, it might usethese exceptions for legitimate purposes, for example virtual memory handling.
When vector catch is enabled, the effect is similar to placing a breakpoint on the selected vector tableentry. But in this case, vector catches use dedicated hardware in the processor and do not use up valuablebreakpoint resources.
Note
The available vector catch events are dependent on the exact processor that you are connected to.
To manage vector catch in the debugger, either:• Select Manage Signals from the Breakpoints toolbar or the view menu to display the Manage
Signals dialog box.
For each individual signal that you want information, select either the Stop or Print option. The Stopoption stops the execution and prints a message. The Print option prints a message, but continuesexecution. You can view these messages in the Commands view.
Figure 3-10 Manage Signals dialog• Use the handle command and view the results in the Command view.
3 Controlling Target Execution3.15 Handling processor exceptions
ARM DUI0446Z Copyright © 2010-2016 ARM Limited or its affiliates. All rightsreserved.
3-92
Non-Confidential
Tip
You can also use the info signals command to display the current handler settings.
Example 3-4 Examples
Debugging an exception handlerIf you want the debugger to catch the exception, log the event, and stop the application when theexception occurs, then you must enable stopping on an exception. In the following example, aNON-SECURE_FIQ exception occurs causing the debugger to stop and print a message in theCommands view. You can then step or run to the handler, if present.
handle NON-SECURE_FIQ stop # Enable stop and print on a NON-SECURE_FIQ exception
Ignoring an exceptionIf you want the exception to invoke the handler without stopping, then you must disablestopping on an exception.
handle NON-SECURE_FIQ nostop # Disable stop on a NON-SECURE_FIQ exception
Related concepts6.9 About debugging shared libraries on page 6-153.6.10.2 About debugging a Linux kernel on page 6-156.6.10.3 About debugging Linux kernel modules on page 6-158.
Related references3.2 Running, stopping, and stepping through an application on page 3-72.5.1 Examining the target execution environment on page 5-136.5.2 Examining the call stack on page 5-137.3.14 Handling UNIX signals on page 3-90.11.4 Breakpoints view on page 11-268.11.6 Commands view on page 11-275.11.37 Manage Signals dialog box on page 11-354.
Related informationDS-5 Debugger commands.
3 Controlling Target Execution3.15 Handling processor exceptions
ARM DUI0446Z Copyright © 2010-2016 ARM Limited or its affiliates. All rightsreserved.
3-93
Non-Confidential
3.16 Cross-trigger configurationIn a multiprocessor system, when debug events from one processor are used to affect the debug sessionsof other processors, it is called cross-triggering. It is sometimes useful to control all processors with asingle debugger command. For example, stopping all cores when a single core hits a breakpoint.
• Hardware cross-triggering
A hardware cross-triggering mechanism uses the cross-trigger network (composed of Cross TriggerInterface (CTI) and Cross Trigger Matrix (CTM) devices) present in a multiprocessor system. Theadvantage of using a hardware-based cross-triggering mechanism is low latency performance.
• Software cross-triggering
In a software cross-triggering scenario, the mechanism is performed and managed by the debugger.Using a software cross-triggering mechanism results in increased latency.
In DS-5, the Platform Configuration Editor (PCE) generates support for CTI-synchronized SMP andbig.LITTLE debug operations platforms provided that sufficient and appropriate cores, and CTI areavailable in the SoC. PCE also supports for transporting trace trigger notifications across the cross-trigger network between trace sources and trace sinks.
CTI interfaces need to be programmed using the Debug and Trace Services Layer (DTSL) capabilities inDS-5. See the DTSL documentation on page 15-439 or contact your support representative for moreinformation.
3 Controlling Target Execution3.16 Cross-trigger configuration
ARM DUI0446Z Copyright © 2010-2016 ARM Limited or its affiliates. All rightsreserved.
3-94
Non-Confidential
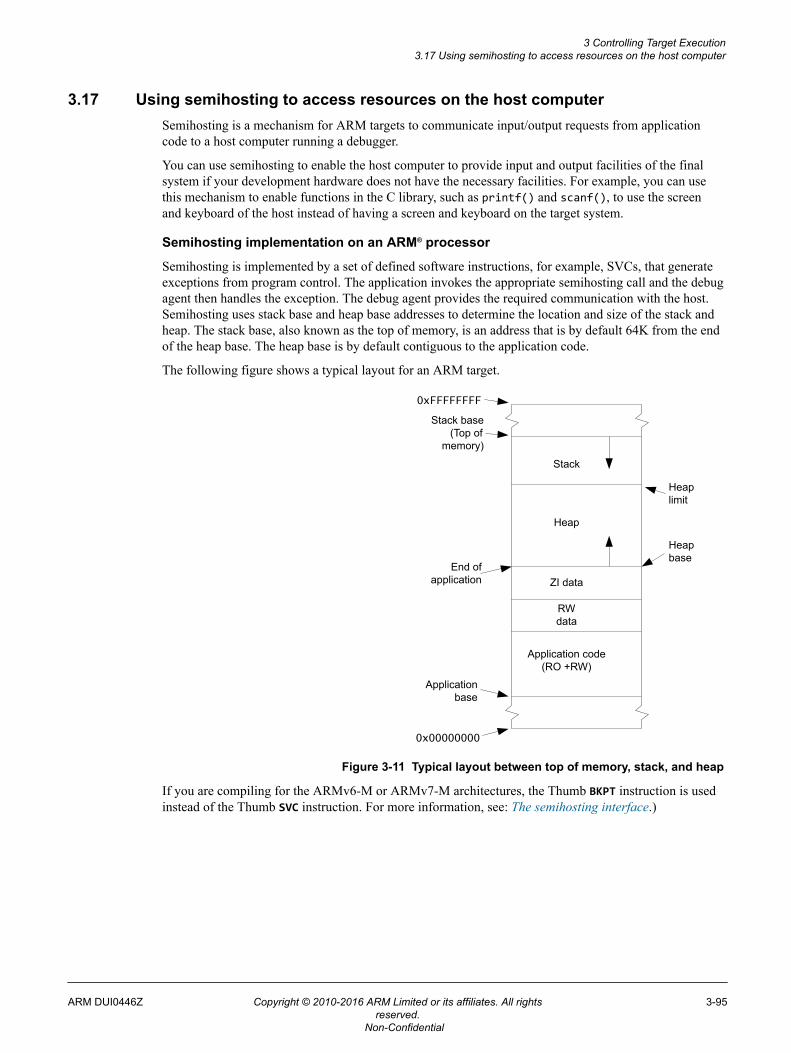
3.17 Using semihosting to access resources on the host computerSemihosting is a mechanism for ARM targets to communicate input/output requests from applicationcode to a host computer running a debugger.
You can use semihosting to enable the host computer to provide input and output facilities of the finalsystem if your development hardware does not have the necessary facilities. For example, you can usethis mechanism to enable functions in the C library, such as printf() and scanf(), to use the screenand keyboard of the host instead of having a screen and keyboard on the target system.
Semihosting implementation on an ARM® processor
Semihosting is implemented by a set of defined software instructions, for example, SVCs, that generateexceptions from program control. The application invokes the appropriate semihosting call and the debugagent then handles the exception. The debug agent provides the required communication with the host.Semihosting uses stack base and heap base addresses to determine the location and size of the stack andheap. The stack base, also known as the top of memory, is an address that is by default 64K from the endof the heap base. The heap base is by default contiguous to the application code.
The following figure shows a typical layout for an ARM target.
Stack
Heap
ZI data
RW data
Application code(RO +RW)
End of application
Application base
Heap base
Heap limit
0xFFFFFFFFStack base
(Top of memory)
0x00000000
Figure 3-11 Typical layout between top of memory, stack, and heap
If you are compiling for the ARMv6-M or ARMv7-M architectures, the Thumb BKPT instruction is usedinstead of the Thumb SVC instruction. For more information, see: The semihosting interface.)
3 Controlling Target Execution3.17 Using semihosting to access resources on the host computer
ARM DUI0446Z Copyright © 2010-2016 ARM Limited or its affiliates. All rightsreserved.
3-95
Non-Confidential
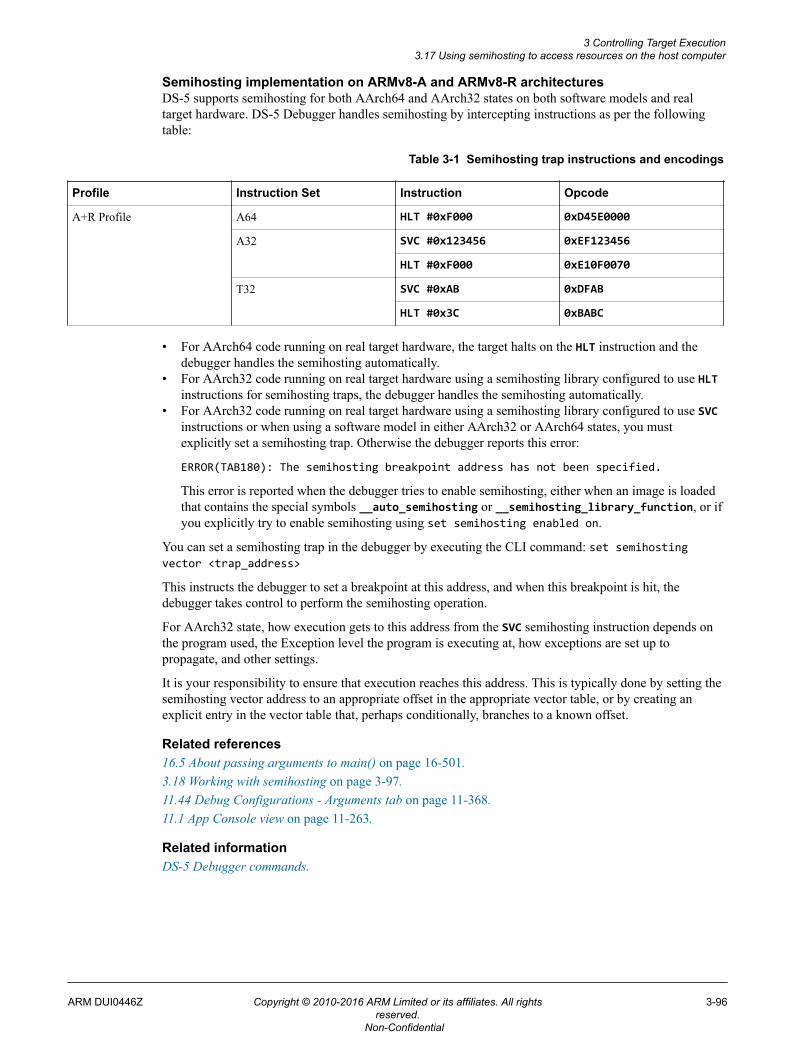
Semihosting implementation on ARMv8-A and ARMv8-R architecturesDS-5 supports semihosting for both AArch64 and AArch32 states on both software models and realtarget hardware. DS-5 Debugger handles semihosting by intercepting instructions as per the followingtable:
Table 3-1 Semihosting trap instructions and encodings
Profile Instruction Set Instruction Opcode
A+R Profile A64 HLT #0xF000 0xD45E0000
A32 SVC #0x123456 0xEF123456
HLT #0xF000 0xE10F0070
T32 SVC #0xAB 0xDFAB
HLT #0x3C 0xBABC
• For AArch64 code running on real target hardware, the target halts on the HLT instruction and thedebugger handles the semihosting automatically.
• For AArch32 code running on real target hardware using a semihosting library configured to use HLTinstructions for semihosting traps, the debugger handles the semihosting automatically.
• For AArch32 code running on real target hardware using a semihosting library configured to use SVCinstructions or when using a software model in either AArch32 or AArch64 states, you mustexplicitly set a semihosting trap. Otherwise the debugger reports this error:
ERROR(TAB180): The semihosting breakpoint address has not been specified.
This error is reported when the debugger tries to enable semihosting, either when an image is loadedthat contains the special symbols __auto_semihosting or __semihosting_library_function, or ifyou explicitly try to enable semihosting using set semihosting enabled on.
You can set a semihosting trap in the debugger by executing the CLI command: set semihostingvector <trap_address>
This instructs the debugger to set a breakpoint at this address, and when this breakpoint is hit, thedebugger takes control to perform the semihosting operation.
For AArch32 state, how execution gets to this address from the SVC semihosting instruction depends onthe program used, the Exception level the program is executing at, how exceptions are set up topropagate, and other settings.
It is your responsibility to ensure that execution reaches this address. This is typically done by setting thesemihosting vector address to an appropriate offset in the appropriate vector table, or by creating anexplicit entry in the vector table that, perhaps conditionally, branches to a known offset.
Related references16.5 About passing arguments to main() on page 16-501.3.18 Working with semihosting on page 3-97.11.44 Debug Configurations - Arguments tab on page 11-368.11.1 App Console view on page 11-263.
Related informationDS-5 Debugger commands.
3 Controlling Target Execution3.17 Using semihosting to access resources on the host computer
ARM DUI0446Z Copyright © 2010-2016 ARM Limited or its affiliates. All rightsreserved.
3-96
Non-Confidential
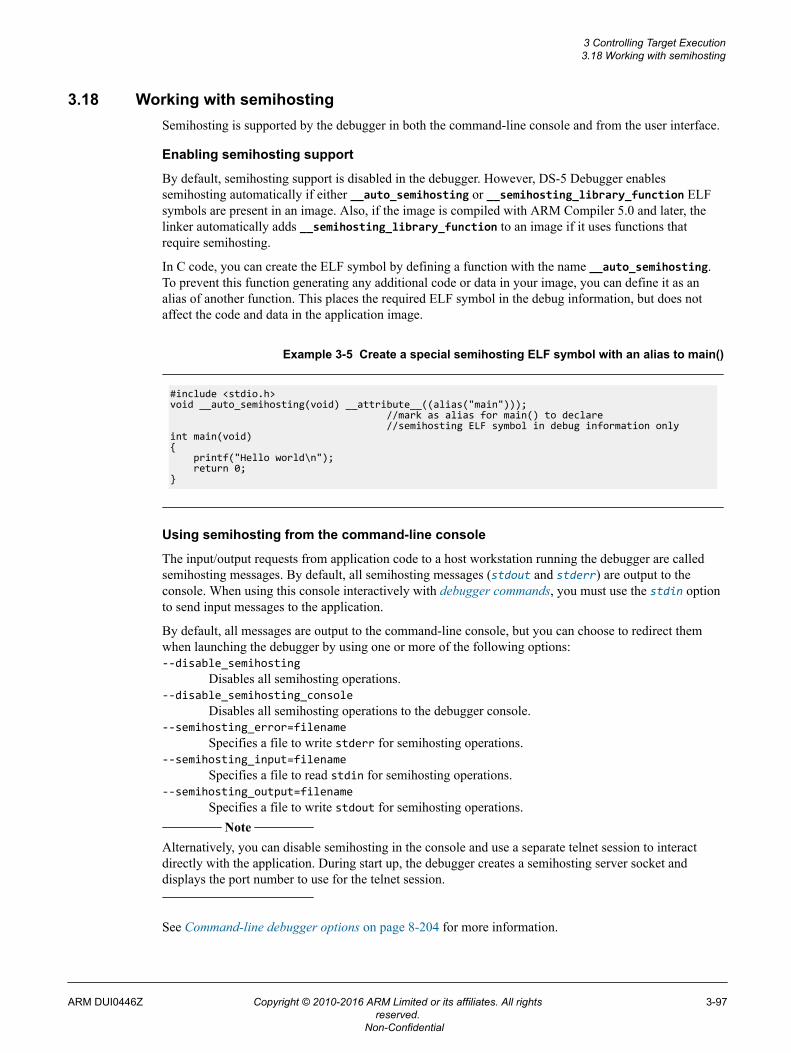
3.18 Working with semihostingSemihosting is supported by the debugger in both the command-line console and from the user interface.
Enabling semihosting support
By default, semihosting support is disabled in the debugger. However, DS-5 Debugger enablessemihosting automatically if either __auto_semihosting or __semihosting_library_function ELFsymbols are present in an image. Also, if the image is compiled with ARM Compiler 5.0 and later, thelinker automatically adds __semihosting_library_function to an image if it uses functions thatrequire semihosting.
In C code, you can create the ELF symbol by defining a function with the name __auto_semihosting.To prevent this function generating any additional code or data in your image, you can define it as analias of another function. This places the required ELF symbol in the debug information, but does notaffect the code and data in the application image.
Example 3-5 Create a special semihosting ELF symbol with an alias to main()
#include <stdio.h>void __auto_semihosting(void) __attribute__((alias("main"))); //mark as alias for main() to declare //semihosting ELF symbol in debug information onlyint main(void){ printf("Hello world\n"); return 0;}
Using semihosting from the command-line console
The input/output requests from application code to a host workstation running the debugger are calledsemihosting messages. By default, all semihosting messages (stdout and stderr) are output to theconsole. When using this console interactively with debugger commands, you must use the stdin optionto send input messages to the application.
By default, all messages are output to the command-line console, but you can choose to redirect themwhen launching the debugger by using one or more of the following options:--disable_semihosting
Disables all semihosting operations.--disable_semihosting_console
Disables all semihosting operations to the debugger console.--semihosting_error=filename
Specifies a file to write stderr for semihosting operations.--semihosting_input=filename
Specifies a file to read stdin for semihosting operations.--semihosting_output=filename
Specifies a file to write stdout for semihosting operations. Note
Alternatively, you can disable semihosting in the console and use a separate telnet session to interactdirectly with the application. During start up, the debugger creates a semihosting server socket anddisplays the port number to use for the telnet session.
See Command-line debugger options on page 8-204 for more information.
3 Controlling Target Execution3.18 Working with semihosting
ARM DUI0446Z Copyright © 2010-2016 ARM Limited or its affiliates. All rightsreserved.
3-97
Non-Confidential
Using semihosting from the user interface
The App Console view in the DS-5 Debug perspective controls all the semihosting input/output requests(stdin, stdout, and stderr) between the application code and the debugger.
Related references16.5 About passing arguments to main() on page 16-501.3.17 Using semihosting to access resources on the host computer on page 3-95.11.44 Debug Configurations - Arguments tab on page 11-368.11.1 App Console view on page 11-263.
Related informationDS-5 Debugger commands.
3 Controlling Target Execution3.18 Working with semihosting
ARM DUI0446Z Copyright © 2010-2016 ARM Limited or its affiliates. All rightsreserved.
3-98
Non-Confidential
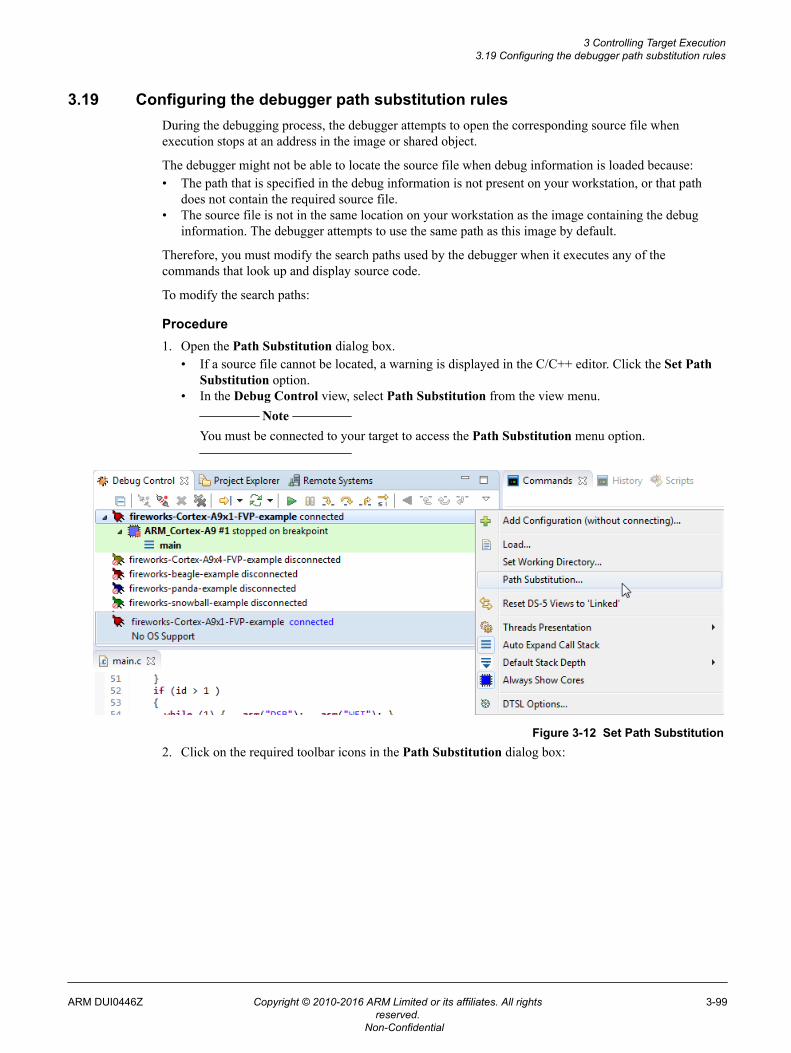
3.19 Configuring the debugger path substitution rulesDuring the debugging process, the debugger attempts to open the corresponding source file whenexecution stops at an address in the image or shared object.
The debugger might not be able to locate the source file when debug information is loaded because:• The path that is specified in the debug information is not present on your workstation, or that path
does not contain the required source file.• The source file is not in the same location on your workstation as the image containing the debug
information. The debugger attempts to use the same path as this image by default.
Therefore, you must modify the search paths used by the debugger when it executes any of thecommands that look up and display source code.
To modify the search paths:
Procedure1. Open the Path Substitution dialog box.
• If a source file cannot be located, a warning is displayed in the C/C++ editor. Click the Set PathSubstitution option.
• In the Debug Control view, select Path Substitution from the view menu. Note
You must be connected to your target to access the Path Substitution menu option.
Figure 3-12 Set Path Substitution2. Click on the required toolbar icons in the Path Substitution dialog box:
3 Controlling Target Execution3.19 Configuring the debugger path substitution rules
ARM DUI0446Z Copyright © 2010-2016 ARM Limited or its affiliates. All rightsreserved.
3-99
Non-Confidential
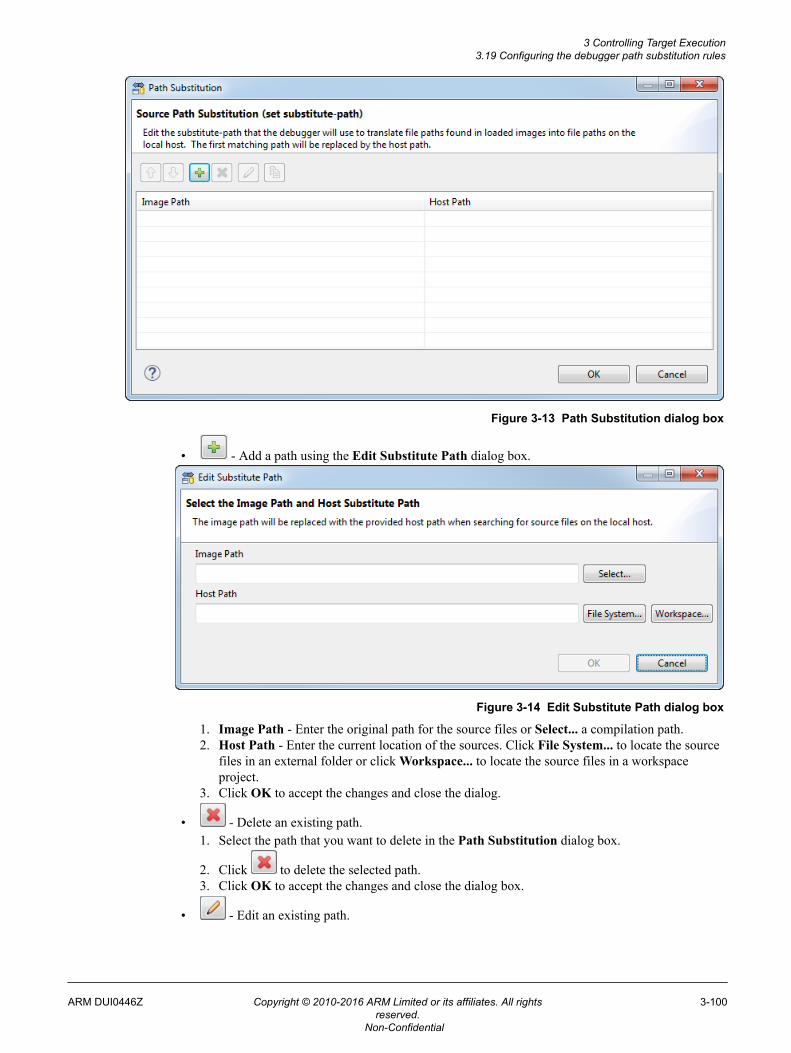
Figure 3-13 Path Substitution dialog box
• - Add a path using the Edit Substitute Path dialog box.
Figure 3-14 Edit Substitute Path dialog box
1. Image Path - Enter the original path for the source files or Select... a compilation path.2. Host Path - Enter the current location of the sources. Click File System... to locate the source
files in an external folder or click Workspace... to locate the source files in a workspaceproject.
3. Click OK to accept the changes and close the dialog.
• - Delete an existing path.1. Select the path that you want to delete in the Path Substitution dialog box.
2. Click to delete the selected path.3. Click OK to accept the changes and close the dialog box.
• - Edit an existing path.
3 Controlling Target Execution3.19 Configuring the debugger path substitution rules
ARM DUI0446Z Copyright © 2010-2016 ARM Limited or its affiliates. All rightsreserved.
3-100
Non-Confidential
1. Select the path that you want to edit in the Path Substitution dialog box.
2. Click to edit the path in the Edit Substitute Path dialog box.3. Make your changes and click OK to accept the changes and close the dialog box.
• - Duplicate substitution rules.1. Select the path that you want to duplicate in the Path Substitution dialog box.
2. Click to display the Edit Substitute Path dialog box.3. Make your changes and click OK to accept the changes and close the dialog box.
• If required, you can change the order of the substitution rules.3. Click OK to pass the substitution rules to the debugger and close the Path Substitution dialog box.
Related concepts16.4 About loading debug information into the debugger on page 16-499.
3 Controlling Target Execution3.19 Configuring the debugger path substitution rules
ARM DUI0446Z Copyright © 2010-2016 ARM Limited or its affiliates. All rightsreserved.
3-101
Non-Confidential
Chapter 4Working with the Target Configuration Editor
Describes how to use the editor when developing a project for an ARM target.
It contains the following sections:• 4.1 About the Target Configuration Editor on page 4-103.• 4.2 Target configuration editor - Overview tab on page 4-104.• 4.3 Target configuration editor - Memory tab on page 4-106.• 4.4 Target configuration editor - Peripherals tab on page 4-108.• 4.5 Target configuration editor - Registers tab on page 4-110.• 4.6 Target configuration editor - Group View tab on page 4-112.• 4.7 Target configuration editor - Enumerations tab on page 4-114.• 4.8 Target configuration editor - Configurations tab on page 4-115.• 4.9 Scenario demonstrating how to create a new target configuration file on page 4-117.• 4.10 Creating a power domain for a target on page 4-128.• 4.11 Creating a Group list on page 4-129.• 4.12 Importing an existing target configuration file on page 4-131.• 4.13 Exporting a target configuration file on page 4-133.
ARM DUI0446Z Copyright © 2010-2016 ARM Limited or its affiliates. All rightsreserved.
4-102
Non-Confidential
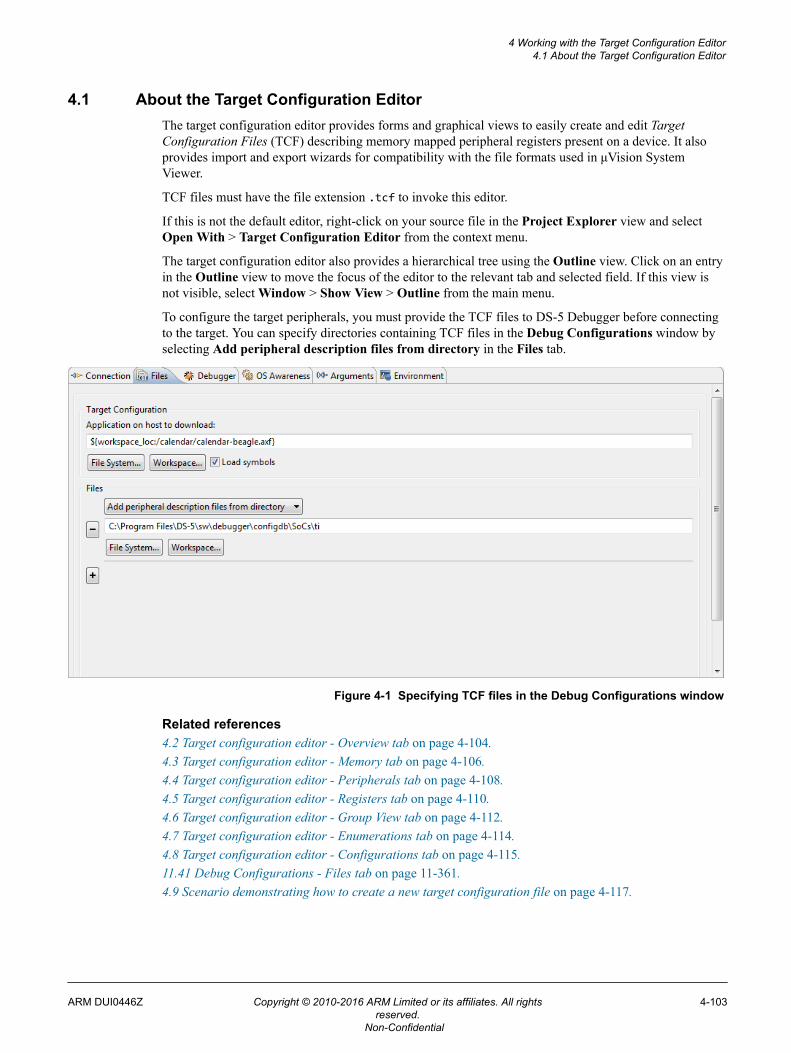
4.1 About the Target Configuration EditorThe target configuration editor provides forms and graphical views to easily create and edit TargetConfiguration Files (TCF) describing memory mapped peripheral registers present on a device. It alsoprovides import and export wizards for compatibility with the file formats used in μVision SystemViewer.
TCF files must have the file extension .tcf to invoke this editor.
If this is not the default editor, right-click on your source file in the Project Explorer view and selectOpen With > Target Configuration Editor from the context menu.
The target configuration editor also provides a hierarchical tree using the Outline view. Click on an entryin the Outline view to move the focus of the editor to the relevant tab and selected field. If this view isnot visible, select Window > Show View > Outline from the main menu.
To configure the target peripherals, you must provide the TCF files to DS-5 Debugger before connectingto the target. You can specify directories containing TCF files in the Debug Configurations window byselecting Add peripheral description files from directory in the Files tab.
Figure 4-1 Specifying TCF files in the Debug Configurations window
Related references4.2 Target configuration editor - Overview tab on page 4-104.4.3 Target configuration editor - Memory tab on page 4-106.4.4 Target configuration editor - Peripherals tab on page 4-108.4.5 Target configuration editor - Registers tab on page 4-110.4.6 Target configuration editor - Group View tab on page 4-112.4.7 Target configuration editor - Enumerations tab on page 4-114.4.8 Target configuration editor - Configurations tab on page 4-115.11.41 Debug Configurations - Files tab on page 11-361.4.9 Scenario demonstrating how to create a new target configuration file on page 4-117.
4 Working with the Target Configuration Editor4.1 About the Target Configuration Editor
ARM DUI0446Z Copyright © 2010-2016 ARM Limited or its affiliates. All rightsreserved.
4-103
Non-Confidential
4.2 Target configuration editor - Overview tab
A graphical view showing general information about the current target and summary information for allthe tabs.
General Information
Unique NameUnique board name (mandatory).
CategoryName of the manufacturer.
InheritsName of the board, memory region or peripheral to inherit data from. You must use theIncludes panel to populate this drop-down menu.
EndiannessByte order of the target.
TrustZoneTrustZone support for the target. If supported, the Memory and Peripheral tabs aredisplayed with a TrustZone Address Type field.
Power DomainPower Domain support for the target. If supported, the Memory and Peripheral tabsare displayed with a Power Domain Address Type field. Also, the Configurations tabincludes an additional Power Domain Configurations group.
DescriptionBoard description.
IncludesInclude files for use when inheriting target data that is defined in an external file. Populates theInherits drop-down menu.
The Overview tab also provides a summary of the other tabs available in this view, together with thetotal number of items defined in that view.
4 Working with the Target Configuration Editor4.2 Target configuration editor - Overview tab
ARM DUI0446Z Copyright © 2010-2016 ARM Limited or its affiliates. All rightsreserved.
4-104
Non-Confidential
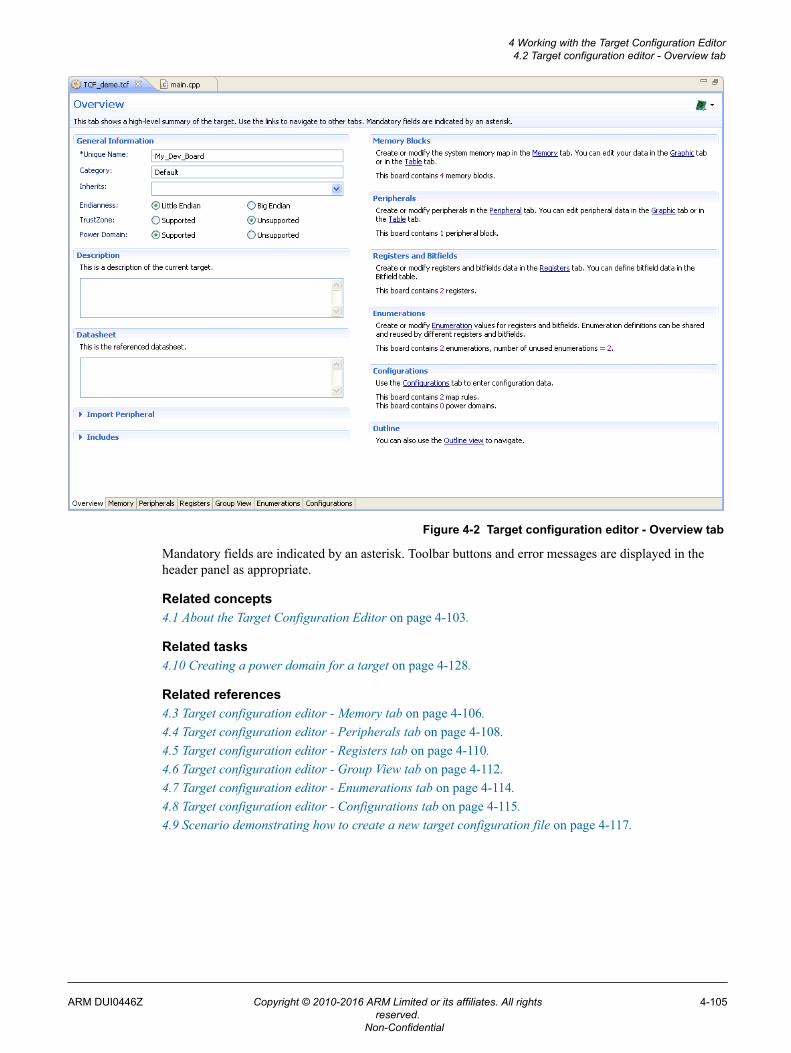
Figure 4-2 Target configuration editor - Overview tab
Mandatory fields are indicated by an asterisk. Toolbar buttons and error messages are displayed in theheader panel as appropriate.
Related concepts4.1 About the Target Configuration Editor on page 4-103.
Related tasks4.10 Creating a power domain for a target on page 4-128.
Related references4.3 Target configuration editor - Memory tab on page 4-106.4.4 Target configuration editor - Peripherals tab on page 4-108.4.5 Target configuration editor - Registers tab on page 4-110.4.6 Target configuration editor - Group View tab on page 4-112.4.7 Target configuration editor - Enumerations tab on page 4-114.4.8 Target configuration editor - Configurations tab on page 4-115.4.9 Scenario demonstrating how to create a new target configuration file on page 4-117.
4 Working with the Target Configuration Editor4.2 Target configuration editor - Overview tab
ARM DUI0446Z Copyright © 2010-2016 ARM Limited or its affiliates. All rightsreserved.
4-105
Non-Confidential
4.3 Target configuration editor - Memory tab
A graphical view or tabular view that enables you to define the attributes for each of the block ofmemory on your target. These memory blocks are used to ensure that your debugger accesses thememory on your target in the right way.
Graphical view
In the graphical view, the following options are available:
View by Map RuleFilter the graphical view based on the selected rule.
View by Address TypeFilter the graphical view based on secure or non-secure addresses. Available only whenTrustZone is supported. You can select TrustZone support in the Overview tab.
View by Power DomainFilter the graphical view based on the power domain. Available only when Power Domain issupported. You can select Power Domain support in the Overview tab.
Add buttonAdd a new memory region.
Remove buttonRemove the selected memory region.
Graphical and tabular views
In both the graphical view and the tabular view, the following settings are available:
Unique NameName of the selected memory region (mandatory).
NameUser-friendly name for the selected memory region.
DescriptionDetailed description of the selected memory region.
Base AddressAbsolute address or the Name of the memory region to use as a base address. The default is anabsolute starting address of 0x0.
OffsetOffset that is added to the base address (mandatory).
SizeSize of the selected memory region in bytes (mandatory).
WidthAccess width of the selected memory region.
AccessAccess mode for the selected memory region.
Apply Map Rule (graphical view) Map Rule (tabular view)Mapping rule to be applied to the selected memory region. You can use the Map Rules tab tocreate and modify rules for control registers.
More... (tabular view)In the tabular view, the ... button is displayed when you select More... cell. Click the ... button todisplay the Context and Parameters dialog box.
ContextDebugger plug-in. If you want to pass parameters to a specific debugger, select a plug-in andenter the associated parameters.
ParametersParameters associated with the selected debugger plug-in. Select the required debugger plug-infrom the Context drop-down menu to enter parameters for that debugger plug-in.
4 Working with the Target Configuration Editor4.3 Target configuration editor - Memory tab
ARM DUI0446Z Copyright © 2010-2016 ARM Limited or its affiliates. All rightsreserved.
4-106
Non-Confidential
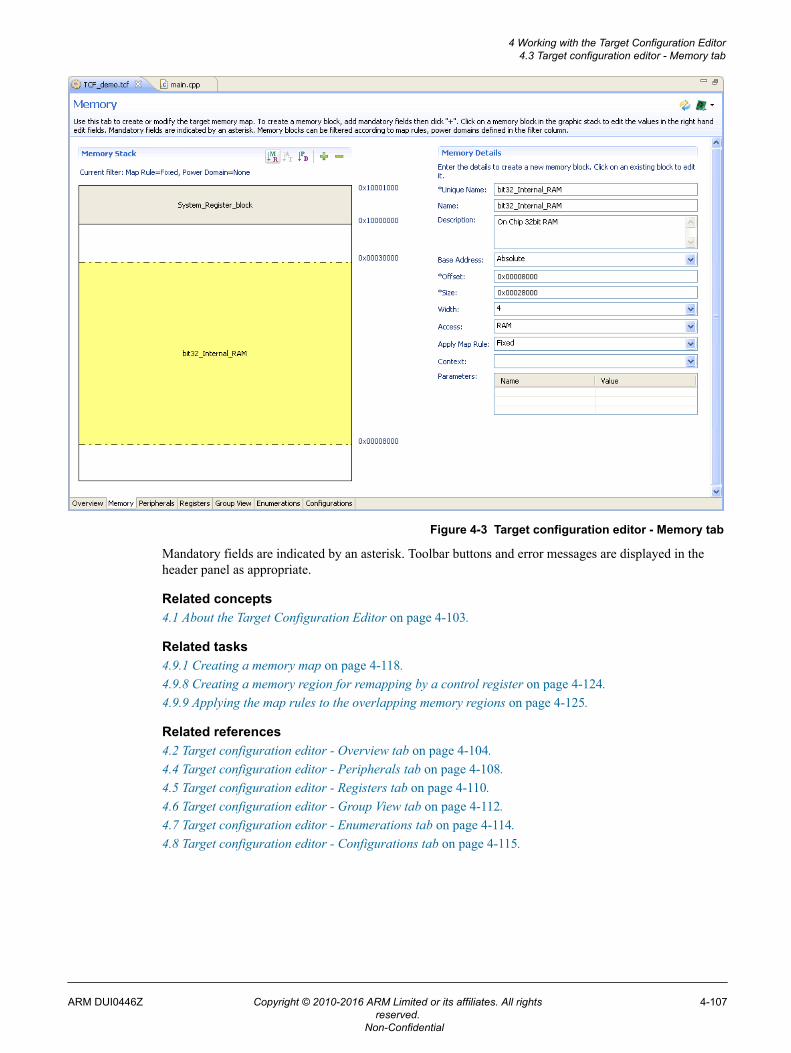
Figure 4-3 Target configuration editor - Memory tab
Mandatory fields are indicated by an asterisk. Toolbar buttons and error messages are displayed in theheader panel as appropriate.
Related concepts4.1 About the Target Configuration Editor on page 4-103.
Related tasks4.9.1 Creating a memory map on page 4-118.4.9.8 Creating a memory region for remapping by a control register on page 4-124.4.9.9 Applying the map rules to the overlapping memory regions on page 4-125.
Related references4.2 Target configuration editor - Overview tab on page 4-104.4.4 Target configuration editor - Peripherals tab on page 4-108.4.5 Target configuration editor - Registers tab on page 4-110.4.6 Target configuration editor - Group View tab on page 4-112.4.7 Target configuration editor - Enumerations tab on page 4-114.4.8 Target configuration editor - Configurations tab on page 4-115.
4 Working with the Target Configuration Editor4.3 Target configuration editor - Memory tab
ARM DUI0446Z Copyright © 2010-2016 ARM Limited or its affiliates. All rightsreserved.
4-107
Non-Confidential
4.4 Target configuration editor - Peripherals tab
A graphical view or tabular view that enables you to define peripherals on your target. They can then bemapped in memory, for display and control, and accessed for block data, when available. You define theperipheral in terms of the area of memory it occupies.
Graphical view
In the graphical view, the following options are available:
View by Address TypeFilter the graphical view based on secure or non-secure addresses. Available only whenTrustZone is supported. You can select TrustZone support in the Overview tab.
View by Power DomainFilter the graphical view based on the power domain. Available only when Power Domain issupported. You can select Power Domain support in the Overview tab.
Add buttonAdd a new peripheral.
Remove buttonRemove the selected peripheral and, if required, the associated registers.
Graphical and tabular views
In both the graphical view and the tabular view, the following settings are available:
Unique NameName of the selected peripheral (mandatory).
NameUser-friendly name for the selected peripheral.
DescriptionDetailed description of the selected peripheral.
Base AddressAbsolute address or the Name of the memory region to use as a base address. The default is anabsolute starting address of 0x0.
OffsetOffset that is added to the base address (mandatory).
SizeSize of the selected peripheral in bytes.
WidthAccess width of the selected peripheral in bytes.
AccessAccess mode for the selected peripheral.
4 Working with the Target Configuration Editor4.4 Target configuration editor - Peripherals tab
ARM DUI0446Z Copyright © 2010-2016 ARM Limited or its affiliates. All rightsreserved.
4-108
Non-Confidential
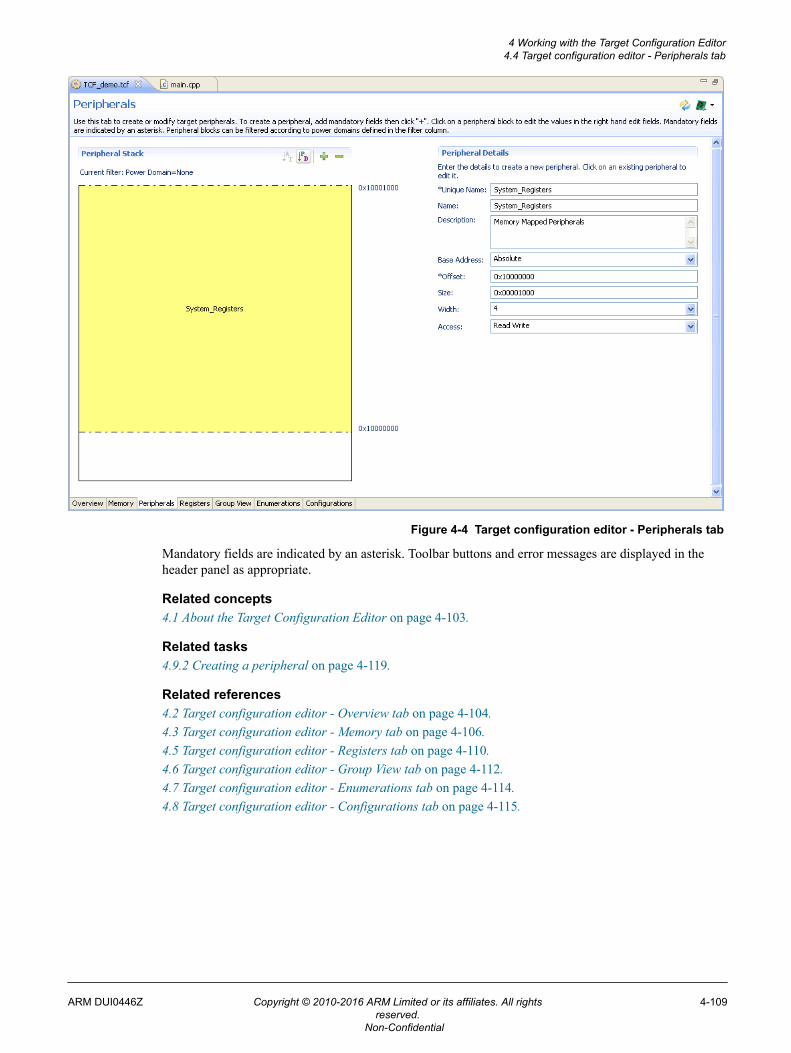
Figure 4-4 Target configuration editor - Peripherals tab
Mandatory fields are indicated by an asterisk. Toolbar buttons and error messages are displayed in theheader panel as appropriate.
Related concepts4.1 About the Target Configuration Editor on page 4-103.
Related tasks4.9.2 Creating a peripheral on page 4-119.
Related references4.2 Target configuration editor - Overview tab on page 4-104.4.3 Target configuration editor - Memory tab on page 4-106.4.5 Target configuration editor - Registers tab on page 4-110.4.6 Target configuration editor - Group View tab on page 4-112.4.7 Target configuration editor - Enumerations tab on page 4-114.4.8 Target configuration editor - Configurations tab on page 4-115.
4 Working with the Target Configuration Editor4.4 Target configuration editor - Peripherals tab
ARM DUI0446Z Copyright © 2010-2016 ARM Limited or its affiliates. All rightsreserved.
4-109
Non-Confidential
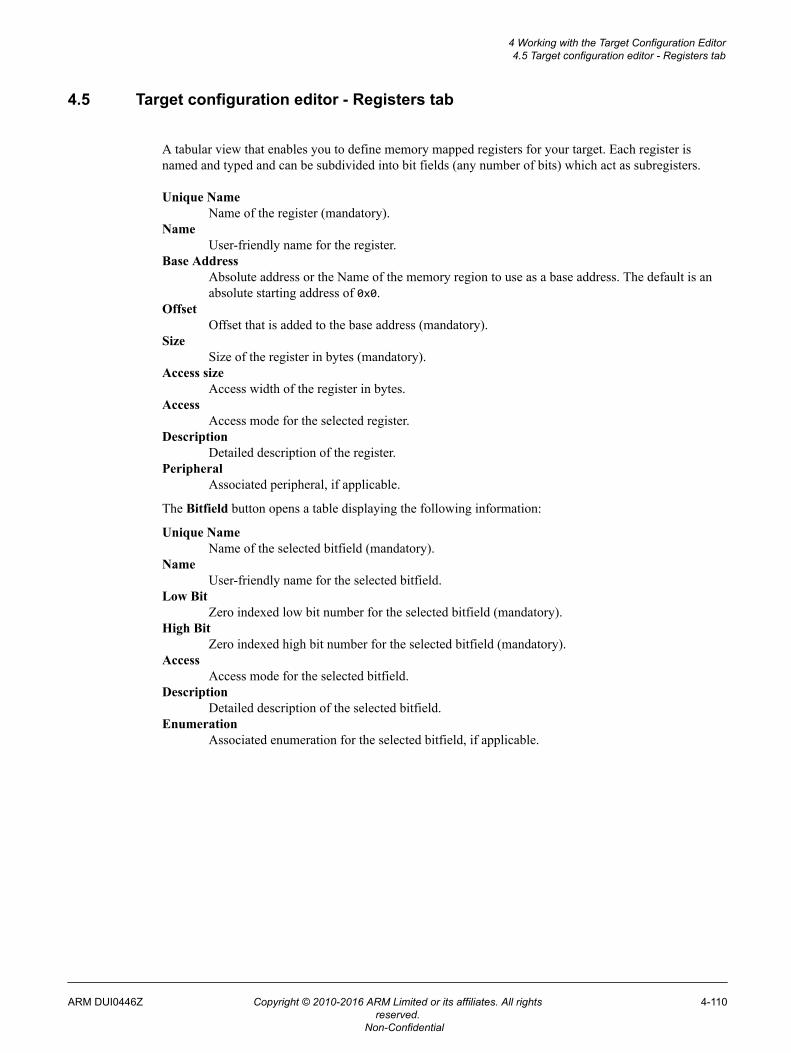
4.5 Target configuration editor - Registers tab
A tabular view that enables you to define memory mapped registers for your target. Each register isnamed and typed and can be subdivided into bit fields (any number of bits) which act as subregisters.
Unique NameName of the register (mandatory).
NameUser-friendly name for the register.
Base AddressAbsolute address or the Name of the memory region to use as a base address. The default is anabsolute starting address of 0x0.
OffsetOffset that is added to the base address (mandatory).
SizeSize of the register in bytes (mandatory).
Access sizeAccess width of the register in bytes.
AccessAccess mode for the selected register.
DescriptionDetailed description of the register.
PeripheralAssociated peripheral, if applicable.
The Bitfield button opens a table displaying the following information:
Unique NameName of the selected bitfield (mandatory).
NameUser-friendly name for the selected bitfield.
Low BitZero indexed low bit number for the selected bitfield (mandatory).
High BitZero indexed high bit number for the selected bitfield (mandatory).
AccessAccess mode for the selected bitfield.
DescriptionDetailed description of the selected bitfield.
EnumerationAssociated enumeration for the selected bitfield, if applicable.
4 Working with the Target Configuration Editor4.5 Target configuration editor - Registers tab
ARM DUI0446Z Copyright © 2010-2016 ARM Limited or its affiliates. All rightsreserved.
4-110
Non-Confidential
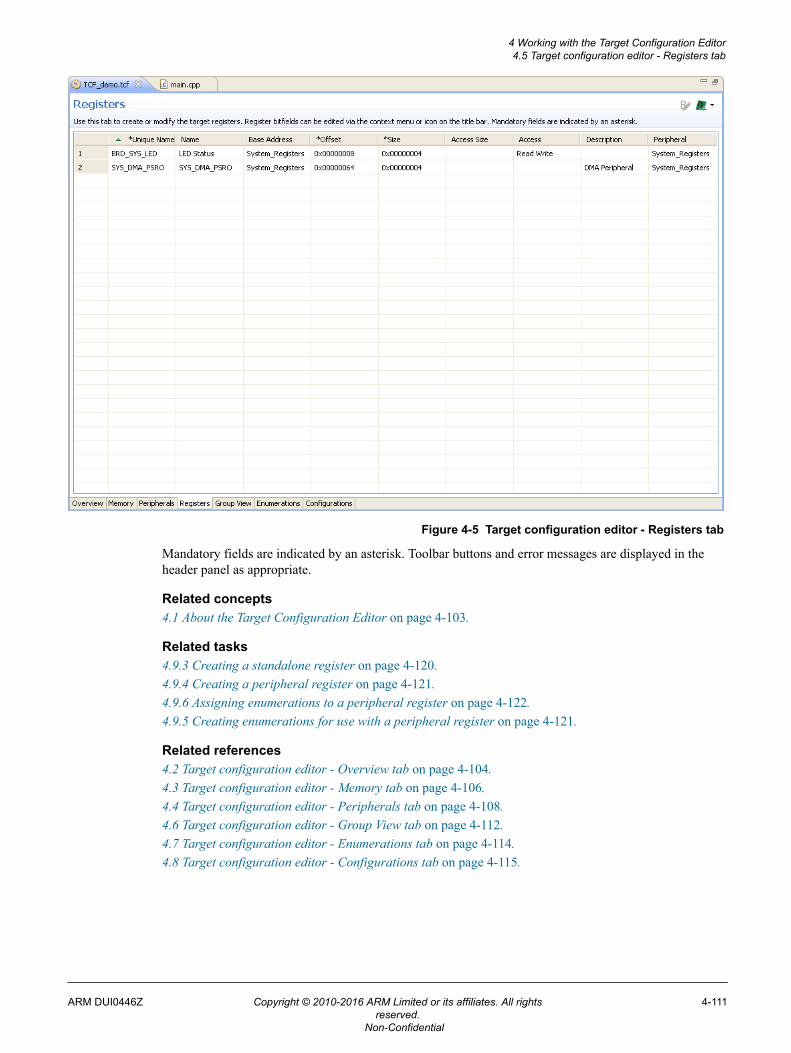
Figure 4-5 Target configuration editor - Registers tab
Mandatory fields are indicated by an asterisk. Toolbar buttons and error messages are displayed in theheader panel as appropriate.
Related concepts4.1 About the Target Configuration Editor on page 4-103.
Related tasks4.9.3 Creating a standalone register on page 4-120.4.9.4 Creating a peripheral register on page 4-121.4.9.6 Assigning enumerations to a peripheral register on page 4-122.4.9.5 Creating enumerations for use with a peripheral register on page 4-121.
Related references4.2 Target configuration editor - Overview tab on page 4-104.4.3 Target configuration editor - Memory tab on page 4-106.4.4 Target configuration editor - Peripherals tab on page 4-108.4.6 Target configuration editor - Group View tab on page 4-112.4.7 Target configuration editor - Enumerations tab on page 4-114.4.8 Target configuration editor - Configurations tab on page 4-115.
4 Working with the Target Configuration Editor4.5 Target configuration editor - Registers tab
ARM DUI0446Z Copyright © 2010-2016 ARM Limited or its affiliates. All rightsreserved.
4-111
Non-Confidential
4.6 Target configuration editor - Group View tab
A list view that enables you to select peripherals for use by the debugger.
Group View ListEmpty list that enables you to add frequently used peripherals to the debugger.
Add a new groupCreates a group that you can personalize with peripherals.
Remove the selected groupRemoves a group from the list.
Available Peripheral ListA list of the available peripherals. You can select peripherals from this view to add to the GroupView List.
Figure 4-6 Target configuration editor - Group View tab
4 Working with the Target Configuration Editor4.6 Target configuration editor - Group View tab
ARM DUI0446Z Copyright © 2010-2016 ARM Limited or its affiliates. All rightsreserved.
4-112
Non-Confidential
Mandatory fields are indicated by an asterisk. Toolbar buttons and error messages are displayed in theheader panel as appropriate.
Related concepts4.1 About the Target Configuration Editor on page 4-103.
Related tasks4.11 Creating a Group list on page 4-129.
Related references4.2 Target configuration editor - Overview tab on page 4-104.4.3 Target configuration editor - Memory tab on page 4-106.4.4 Target configuration editor - Peripherals tab on page 4-108.4.5 Target configuration editor - Registers tab on page 4-110.4.7 Target configuration editor - Enumerations tab on page 4-114.4.8 Target configuration editor - Configurations tab on page 4-115.
4 Working with the Target Configuration Editor4.6 Target configuration editor - Group View tab
ARM DUI0446Z Copyright © 2010-2016 ARM Limited or its affiliates. All rightsreserved.
4-113
Non-Confidential
4.7 Target configuration editor - Enumerations tab
A tabular view that enables you to assign values to meaningful names for use by registers you havedefined. Enumerations can be used, instead of values, when a register is displayed in the Registers view.This setting enables you to define the names associated with different values. Names defined in thisgroup are displayed in the Registers view, and can be used to change register values.
Register bit fields are numbered 0, 1, 2,... regardless of their position in the register.
For example, you might want to define ENABLED as 1 and DISABLED as 0.
The following settings are available:
Unique NameName of the selected enumeration (mandatory).
ValueDefinitions specified as comma separated values for selection in the Registers tab (mandatory).
DescriptionDetailed description of the selected enumeration.
Mandatory fields are indicated by an asterisk. Toolbar buttons and error messages are displayed in theheader panel as appropriate.
Related concepts4.1 About the Target Configuration Editor on page 4-103.
Related tasks4.9.5 Creating enumerations for use with a peripheral register on page 4-121.4.9.6 Assigning enumerations to a peripheral register on page 4-122.
Related references4.2 Target configuration editor - Overview tab on page 4-104.4.3 Target configuration editor - Memory tab on page 4-106.4.4 Target configuration editor - Peripherals tab on page 4-108.4.5 Target configuration editor - Registers tab on page 4-110.4.6 Target configuration editor - Group View tab on page 4-112.4.8 Target configuration editor - Configurations tab on page 4-115.
4 Working with the Target Configuration Editor4.7 Target configuration editor - Enumerations tab
ARM DUI0446Z Copyright © 2010-2016 ARM Limited or its affiliates. All rightsreserved.
4-114
Non-Confidential
4.8 Target configuration editor - Configurations tab
A tabular view that enables you to:• Define rules to control the enabling and disabling of memory blocks using target registers. You
specify a register to be monitored, and when the contents match a given value, a set of memoryblocks is enabled. You can define several map rules, one for each of several memory blocks.
• Define power domains that are supported on your target.
Memory Map Configurations group
The following settings are available in the Memory Map Configurations group:
Unique NameName of the rule (mandatory).
NameUser-friendly name for the rule.
RegisterAssociated control register (mandatory).
MaskMask value (mandatory).
ValueValue for a condition (mandatory).
TriggerCondition that changes the control register mapping (mandatory).
Power Domain Configurations group
The Power Domain Configurations group
The following settings are available in this group, and all are mandatory:
Unique NameName of the power domain.
Wake-up ConditionsUser-friendly name for the rule:
RegisterAn associated control register that you have previously created.
MaskMask value.
ValueValue for a condition.
Power StateThe power state of the power domain:• Active.• Inactive.• Retention.• Off.
4 Working with the Target Configuration Editor4.8 Target configuration editor - Configurations tab
ARM DUI0446Z Copyright © 2010-2016 ARM Limited or its affiliates. All rightsreserved.
4-115
Non-Confidential
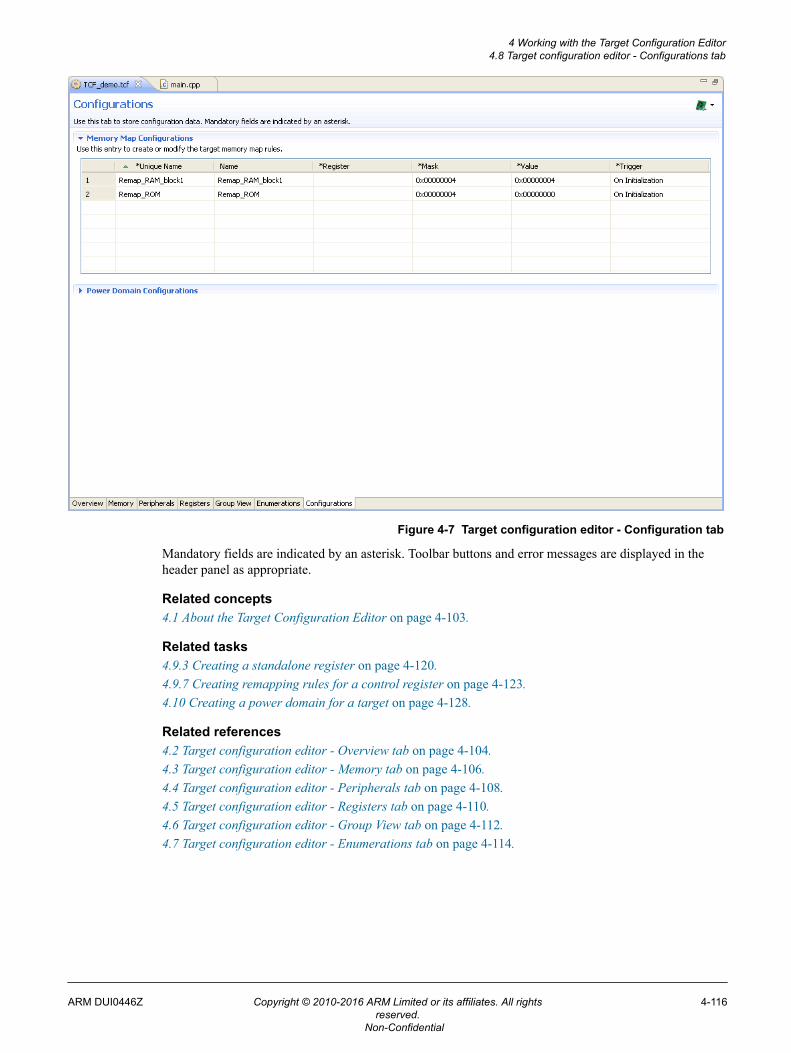
Figure 4-7 Target configuration editor - Configuration tab
Mandatory fields are indicated by an asterisk. Toolbar buttons and error messages are displayed in theheader panel as appropriate.
Related concepts4.1 About the Target Configuration Editor on page 4-103.
Related tasks4.9.3 Creating a standalone register on page 4-120.4.9.7 Creating remapping rules for a control register on page 4-123.4.10 Creating a power domain for a target on page 4-128.
Related references4.2 Target configuration editor - Overview tab on page 4-104.4.3 Target configuration editor - Memory tab on page 4-106.4.4 Target configuration editor - Peripherals tab on page 4-108.4.5 Target configuration editor - Registers tab on page 4-110.4.6 Target configuration editor - Group View tab on page 4-112.4.7 Target configuration editor - Enumerations tab on page 4-114.
4 Working with the Target Configuration Editor4.8 Target configuration editor - Configurations tab
ARM DUI0446Z Copyright © 2010-2016 ARM Limited or its affiliates. All rightsreserved.
4-116
Non-Confidential
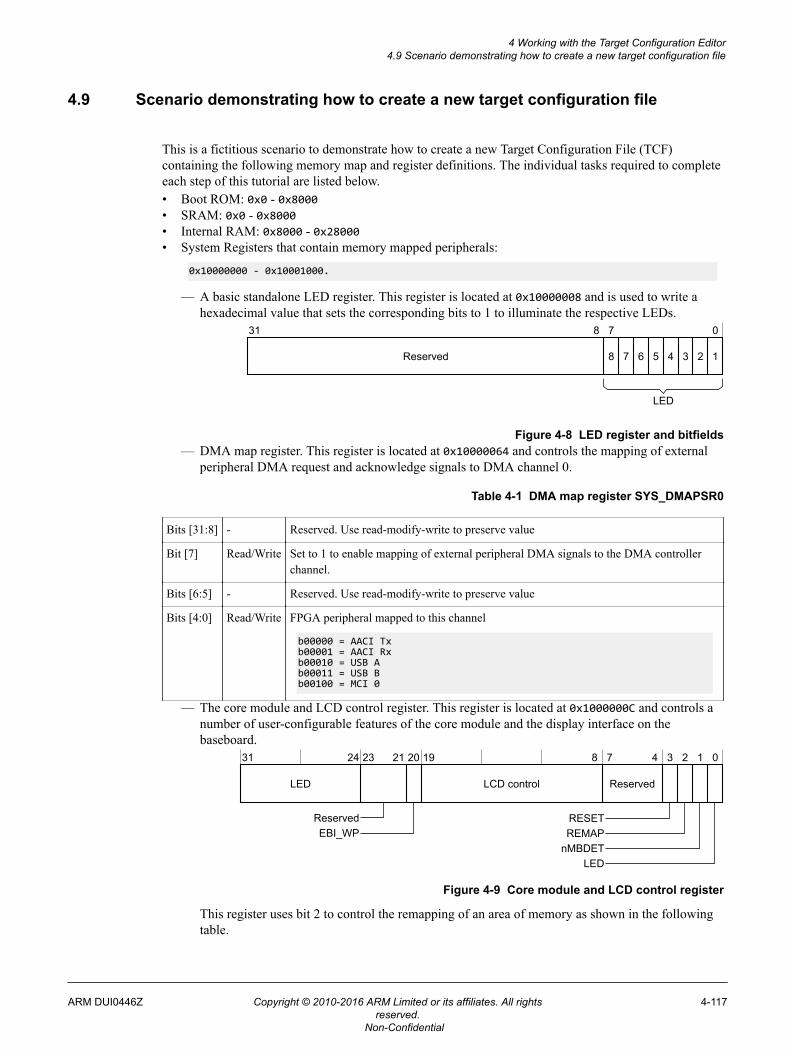
4.9 Scenario demonstrating how to create a new target configuration file
This is a fictitious scenario to demonstrate how to create a new Target Configuration File (TCF)containing the following memory map and register definitions. The individual tasks required to completeeach step of this tutorial are listed below.• Boot ROM: 0x0 - 0x8000• SRAM: 0x0 - 0x8000• Internal RAM: 0x8000 - 0x28000• System Registers that contain memory mapped peripherals:
0x10000000 - 0x10001000.
— A basic standalone LED register. This register is located at 0x10000008 and is used to write ahexadecimal value that sets the corresponding bits to 1 to illuminate the respective LEDs.
1Reserved
31 8 7 0
8 7 6 5 4 3 2
LED
Figure 4-8 LED register and bitfields— DMA map register. This register is located at 0x10000064 and controls the mapping of external
peripheral DMA request and acknowledge signals to DMA channel 0.
Table 4-1 DMA map register SYS_DMAPSR0
Bits [31:8] - Reserved. Use read-modify-write to preserve value
Bit [7] Read/Write Set to 1 to enable mapping of external peripheral DMA signals to the DMA controllerchannel.
Bits [6:5] - Reserved. Use read-modify-write to preserve value
Bits [4:0] Read/Write FPGA peripheral mapped to this channel
b00000 = AACI Txb00001 = AACI Rxb00010 = USB Ab00011 = USB Bb00100 = MCI 0
— The core module and LCD control register. This register is located at 0x1000000C and controls anumber of user-configurable features of the core module and the display interface on thebaseboard.
LED
31 24 23 21 20 19 8 7 4 3 2 1 0
LCD control Reserved
ReservedEBI_WP
RESETREMAP
nMBDETLED
Figure 4-9 Core module and LCD control register
This register uses bit 2 to control the remapping of an area of memory as shown in the followingtable.
4 Working with the Target Configuration Editor4.9 Scenario demonstrating how to create a new target configuration file
ARM DUI0446Z Copyright © 2010-2016 ARM Limited or its affiliates. All rightsreserved.
4-117
Non-Confidential
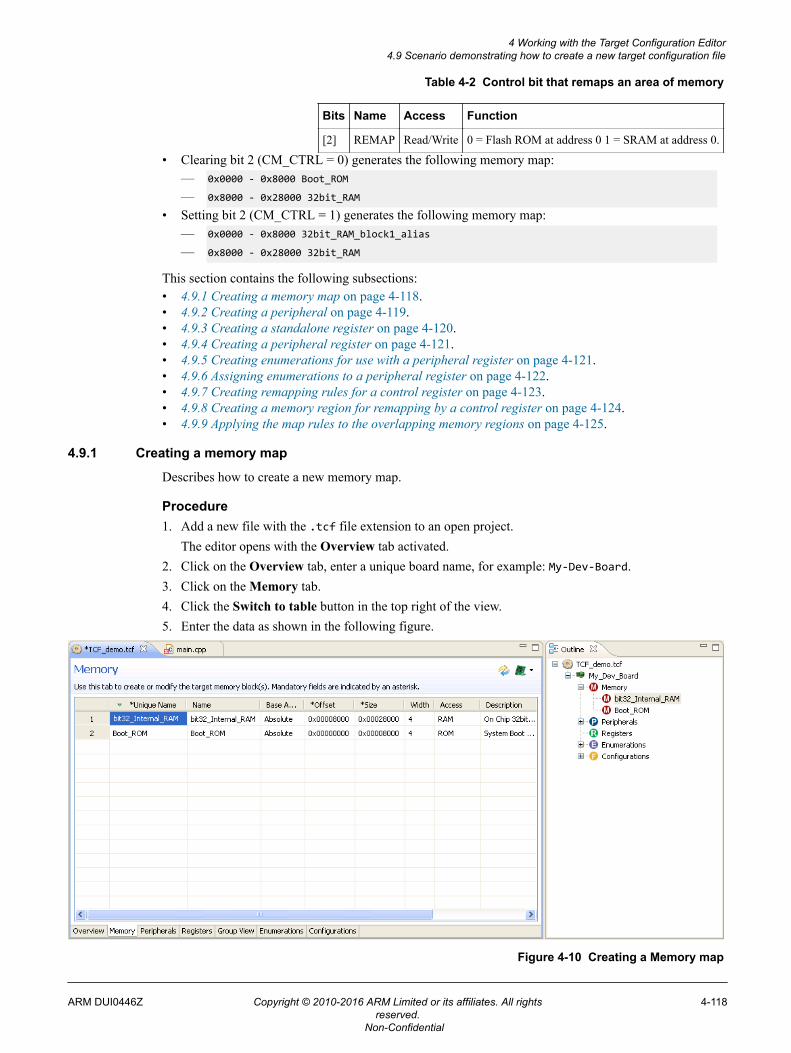
Table 4-2 Control bit that remaps an area of memory
Bits Name Access Function
[2] REMAP Read/Write 0 = Flash ROM at address 0 1 = SRAM at address 0.
• Clearing bit 2 (CM_CTRL = 0) generates the following memory map:— 0x0000 - 0x8000 Boot_ROM
— 0x8000 - 0x28000 32bit_RAM
• Setting bit 2 (CM_CTRL = 1) generates the following memory map:— 0x0000 - 0x8000 32bit_RAM_block1_alias
— 0x8000 - 0x28000 32bit_RAM
This section contains the following subsections:• 4.9.1 Creating a memory map on page 4-118.• 4.9.2 Creating a peripheral on page 4-119.• 4.9.3 Creating a standalone register on page 4-120.• 4.9.4 Creating a peripheral register on page 4-121.• 4.9.5 Creating enumerations for use with a peripheral register on page 4-121.• 4.9.6 Assigning enumerations to a peripheral register on page 4-122.• 4.9.7 Creating remapping rules for a control register on page 4-123.• 4.9.8 Creating a memory region for remapping by a control register on page 4-124.• 4.9.9 Applying the map rules to the overlapping memory regions on page 4-125.
4.9.1 Creating a memory map
Describes how to create a new memory map.
Procedure1. Add a new file with the .tcf file extension to an open project.
The editor opens with the Overview tab activated.2. Click on the Overview tab, enter a unique board name, for example: My-Dev-Board.3. Click on the Memory tab.4. Click the Switch to table button in the top right of the view.5. Enter the data as shown in the following figure.
Figure 4-10 Creating a Memory map
4 Working with the Target Configuration Editor4.9 Scenario demonstrating how to create a new target configuration file
ARM DUI0446Z Copyright © 2010-2016 ARM Limited or its affiliates. All rightsreserved.
4-118
Non-Confidential
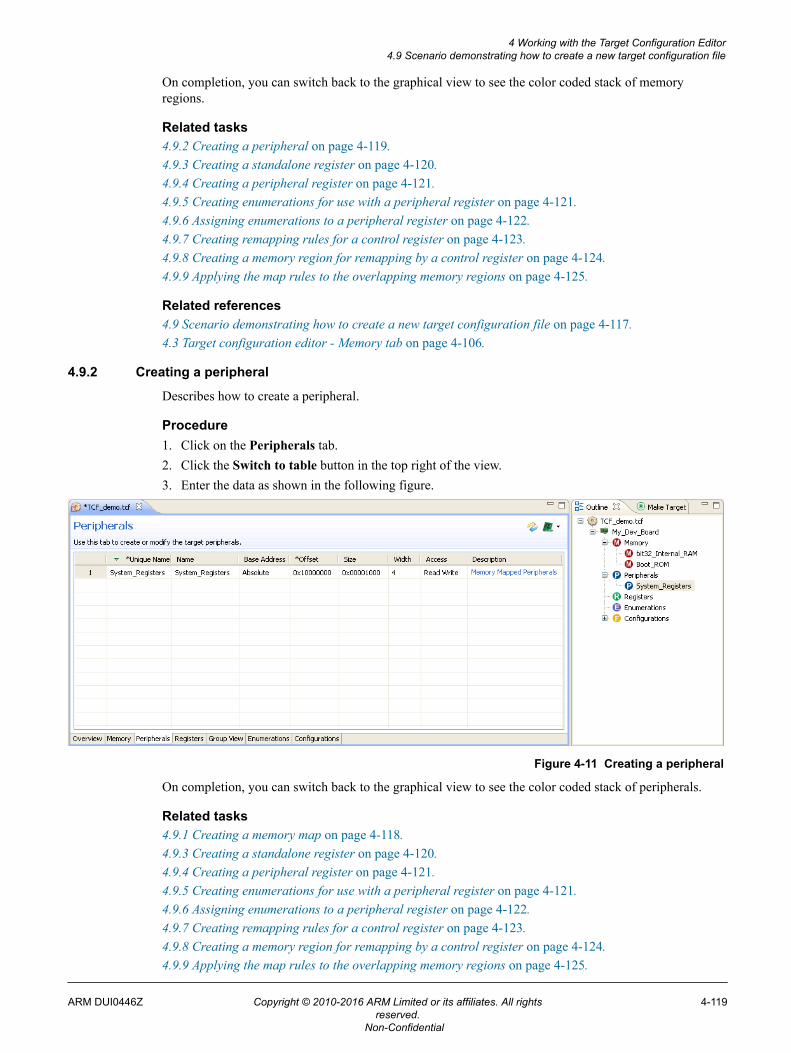
On completion, you can switch back to the graphical view to see the color coded stack of memoryregions.
Related tasks4.9.2 Creating a peripheral on page 4-119.4.9.3 Creating a standalone register on page 4-120.4.9.4 Creating a peripheral register on page 4-121.4.9.5 Creating enumerations for use with a peripheral register on page 4-121.4.9.6 Assigning enumerations to a peripheral register on page 4-122.4.9.7 Creating remapping rules for a control register on page 4-123.4.9.8 Creating a memory region for remapping by a control register on page 4-124.4.9.9 Applying the map rules to the overlapping memory regions on page 4-125.
Related references4.9 Scenario demonstrating how to create a new target configuration file on page 4-117.4.3 Target configuration editor - Memory tab on page 4-106.
4.9.2 Creating a peripheral
Describes how to create a peripheral.
Procedure1. Click on the Peripherals tab.2. Click the Switch to table button in the top right of the view.3. Enter the data as shown in the following figure.
Figure 4-11 Creating a peripheral
On completion, you can switch back to the graphical view to see the color coded stack of peripherals.
Related tasks4.9.1 Creating a memory map on page 4-118.4.9.3 Creating a standalone register on page 4-120.4.9.4 Creating a peripheral register on page 4-121.4.9.5 Creating enumerations for use with a peripheral register on page 4-121.4.9.6 Assigning enumerations to a peripheral register on page 4-122.4.9.7 Creating remapping rules for a control register on page 4-123.4.9.8 Creating a memory region for remapping by a control register on page 4-124.4.9.9 Applying the map rules to the overlapping memory regions on page 4-125.
4 Working with the Target Configuration Editor4.9 Scenario demonstrating how to create a new target configuration file
ARM DUI0446Z Copyright © 2010-2016 ARM Limited or its affiliates. All rightsreserved.
4-119
Non-Confidential
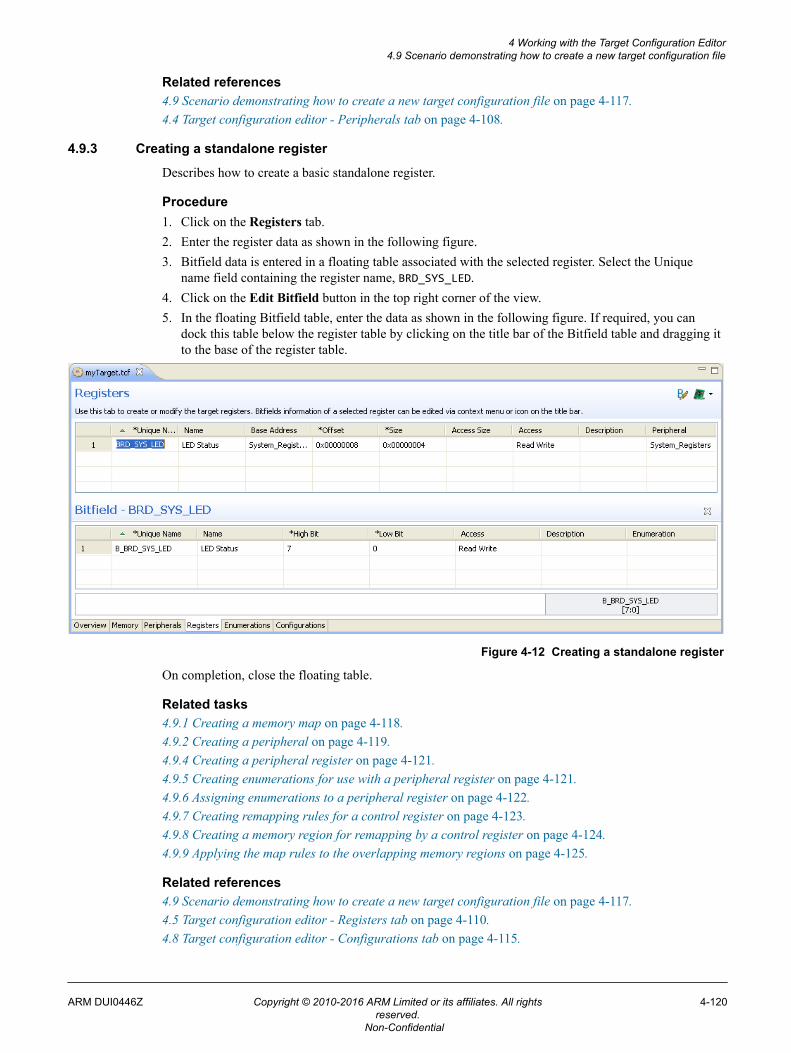
Related references4.9 Scenario demonstrating how to create a new target configuration file on page 4-117.4.4 Target configuration editor - Peripherals tab on page 4-108.
4.9.3 Creating a standalone register
Describes how to create a basic standalone register.
Procedure1. Click on the Registers tab.2. Enter the register data as shown in the following figure.3. Bitfield data is entered in a floating table associated with the selected register. Select the Unique
name field containing the register name, BRD_SYS_LED.4. Click on the Edit Bitfield button in the top right corner of the view.5. In the floating Bitfield table, enter the data as shown in the following figure. If required, you can
dock this table below the register table by clicking on the title bar of the Bitfield table and dragging itto the base of the register table.
Figure 4-12 Creating a standalone register
On completion, close the floating table.
Related tasks4.9.1 Creating a memory map on page 4-118.4.9.2 Creating a peripheral on page 4-119.4.9.4 Creating a peripheral register on page 4-121.4.9.5 Creating enumerations for use with a peripheral register on page 4-121.4.9.6 Assigning enumerations to a peripheral register on page 4-122.4.9.7 Creating remapping rules for a control register on page 4-123.4.9.8 Creating a memory region for remapping by a control register on page 4-124.4.9.9 Applying the map rules to the overlapping memory regions on page 4-125.
Related references4.9 Scenario demonstrating how to create a new target configuration file on page 4-117.4.5 Target configuration editor - Registers tab on page 4-110.4.8 Target configuration editor - Configurations tab on page 4-115.
4 Working with the Target Configuration Editor4.9 Scenario demonstrating how to create a new target configuration file
ARM DUI0446Z Copyright © 2010-2016 ARM Limited or its affiliates. All rightsreserved.
4-120
Non-Confidential
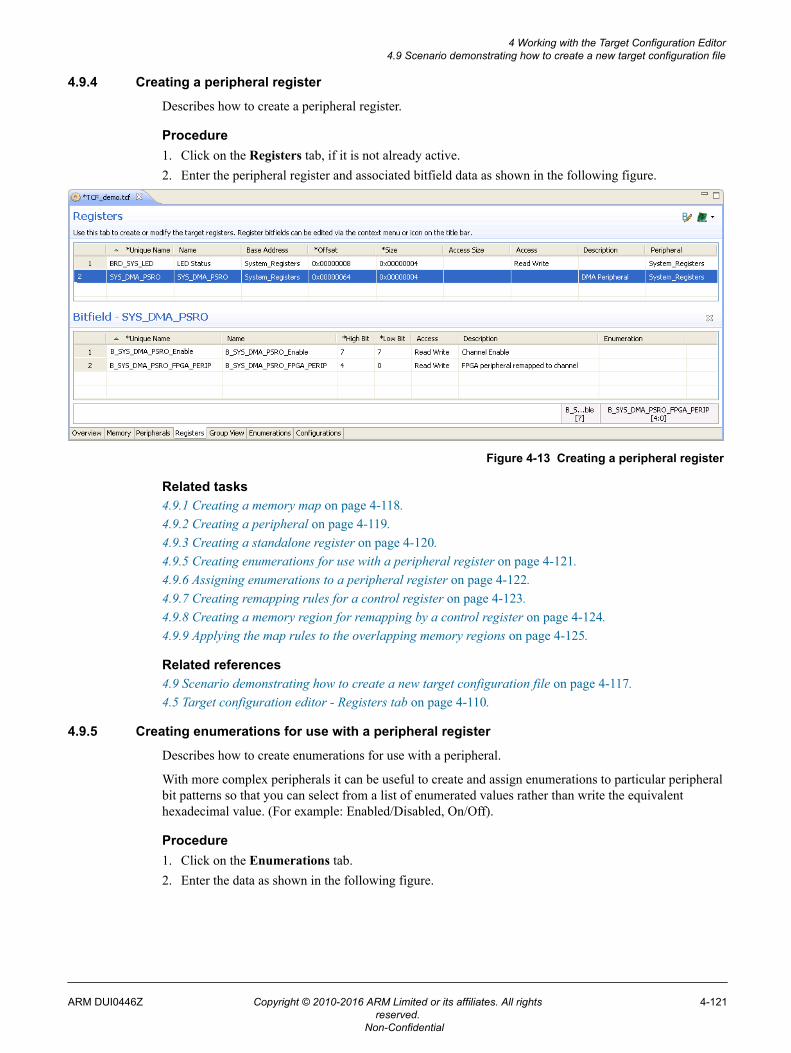
4.9.4 Creating a peripheral register
Describes how to create a peripheral register.
Procedure1. Click on the Registers tab, if it is not already active.2. Enter the peripheral register and associated bitfield data as shown in the following figure.
Figure 4-13 Creating a peripheral register
Related tasks4.9.1 Creating a memory map on page 4-118.4.9.2 Creating a peripheral on page 4-119.4.9.3 Creating a standalone register on page 4-120.4.9.5 Creating enumerations for use with a peripheral register on page 4-121.4.9.6 Assigning enumerations to a peripheral register on page 4-122.4.9.7 Creating remapping rules for a control register on page 4-123.4.9.8 Creating a memory region for remapping by a control register on page 4-124.4.9.9 Applying the map rules to the overlapping memory regions on page 4-125.
Related references4.9 Scenario demonstrating how to create a new target configuration file on page 4-117.4.5 Target configuration editor - Registers tab on page 4-110.
4.9.5 Creating enumerations for use with a peripheral register
Describes how to create enumerations for use with a peripheral.
With more complex peripherals it can be useful to create and assign enumerations to particular peripheralbit patterns so that you can select from a list of enumerated values rather than write the equivalenthexadecimal value. (For example: Enabled/Disabled, On/Off).
Procedure1. Click on the Enumerations tab.2. Enter the data as shown in the following figure.
4 Working with the Target Configuration Editor4.9 Scenario demonstrating how to create a new target configuration file
ARM DUI0446Z Copyright © 2010-2016 ARM Limited or its affiliates. All rightsreserved.
4-121
Non-Confidential
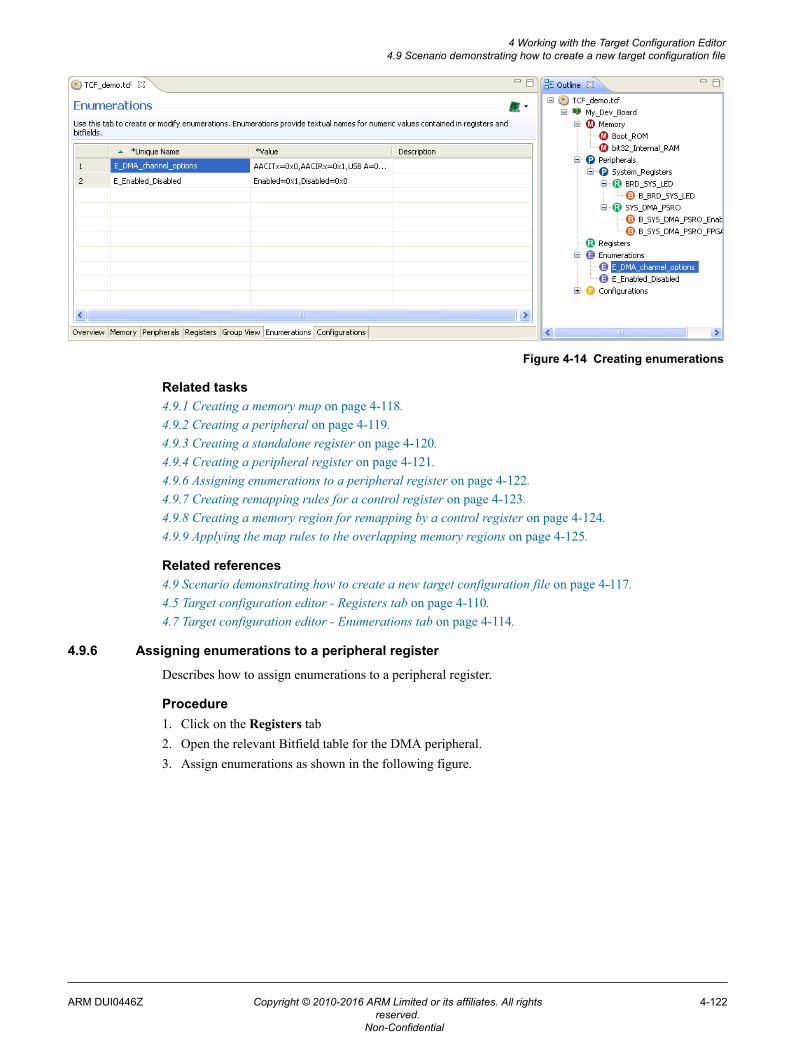
Figure 4-14 Creating enumerations
Related tasks4.9.1 Creating a memory map on page 4-118.4.9.2 Creating a peripheral on page 4-119.4.9.3 Creating a standalone register on page 4-120.4.9.4 Creating a peripheral register on page 4-121.4.9.6 Assigning enumerations to a peripheral register on page 4-122.4.9.7 Creating remapping rules for a control register on page 4-123.4.9.8 Creating a memory region for remapping by a control register on page 4-124.4.9.9 Applying the map rules to the overlapping memory regions on page 4-125.
Related references4.9 Scenario demonstrating how to create a new target configuration file on page 4-117.4.5 Target configuration editor - Registers tab on page 4-110.4.7 Target configuration editor - Enumerations tab on page 4-114.
4.9.6 Assigning enumerations to a peripheral register
Describes how to assign enumerations to a peripheral register.
Procedure1. Click on the Registers tab2. Open the relevant Bitfield table for the DMA peripheral.3. Assign enumerations as shown in the following figure.
4 Working with the Target Configuration Editor4.9 Scenario demonstrating how to create a new target configuration file
ARM DUI0446Z Copyright © 2010-2016 ARM Limited or its affiliates. All rightsreserved.
4-122
Non-Confidential
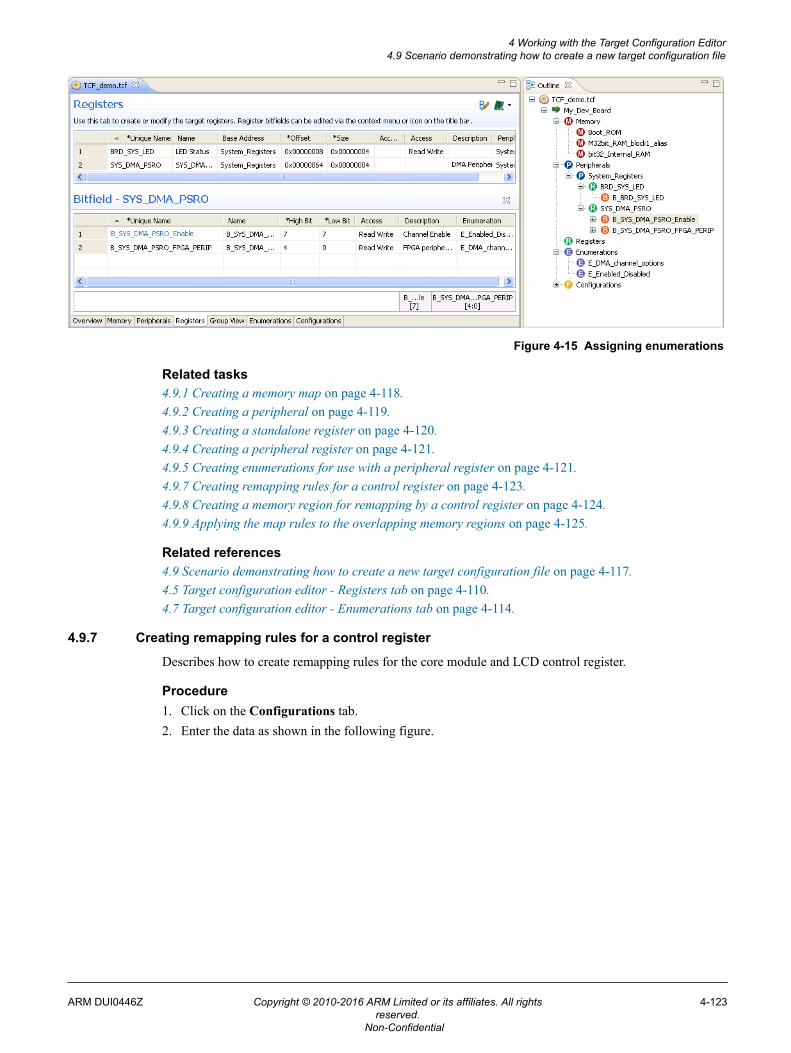
Figure 4-15 Assigning enumerations
Related tasks4.9.1 Creating a memory map on page 4-118.4.9.2 Creating a peripheral on page 4-119.4.9.3 Creating a standalone register on page 4-120.4.9.4 Creating a peripheral register on page 4-121.4.9.5 Creating enumerations for use with a peripheral register on page 4-121.4.9.7 Creating remapping rules for a control register on page 4-123.4.9.8 Creating a memory region for remapping by a control register on page 4-124.4.9.9 Applying the map rules to the overlapping memory regions on page 4-125.
Related references4.9 Scenario demonstrating how to create a new target configuration file on page 4-117.4.5 Target configuration editor - Registers tab on page 4-110.4.7 Target configuration editor - Enumerations tab on page 4-114.
4.9.7 Creating remapping rules for a control register
Describes how to create remapping rules for the core module and LCD control register.
Procedure1. Click on the Configurations tab.2. Enter the data as shown in the following figure.
4 Working with the Target Configuration Editor4.9 Scenario demonstrating how to create a new target configuration file
ARM DUI0446Z Copyright © 2010-2016 ARM Limited or its affiliates. All rightsreserved.
4-123
Non-Confidential
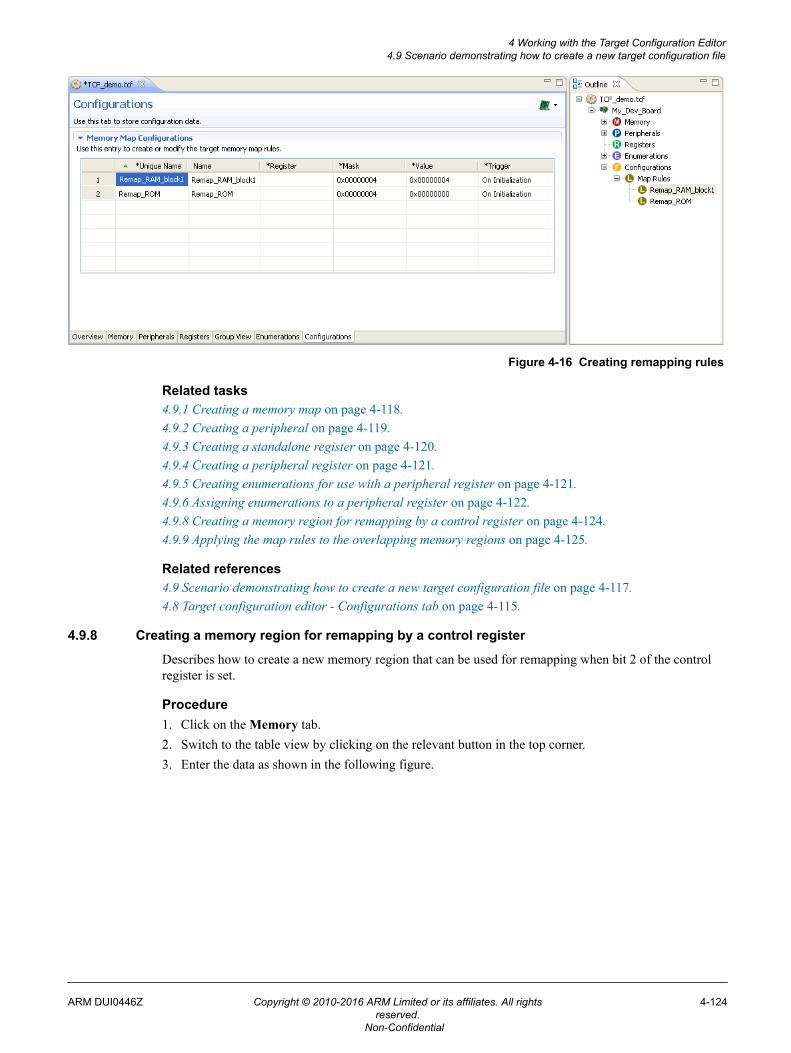
Figure 4-16 Creating remapping rules
Related tasks4.9.1 Creating a memory map on page 4-118.4.9.2 Creating a peripheral on page 4-119.4.9.3 Creating a standalone register on page 4-120.4.9.4 Creating a peripheral register on page 4-121.4.9.5 Creating enumerations for use with a peripheral register on page 4-121.4.9.6 Assigning enumerations to a peripheral register on page 4-122.4.9.8 Creating a memory region for remapping by a control register on page 4-124.4.9.9 Applying the map rules to the overlapping memory regions on page 4-125.
Related references4.9 Scenario demonstrating how to create a new target configuration file on page 4-117.4.8 Target configuration editor - Configurations tab on page 4-115.
4.9.8 Creating a memory region for remapping by a control register
Describes how to create a new memory region that can be used for remapping when bit 2 of the controlregister is set.
Procedure1. Click on the Memory tab.2. Switch to the table view by clicking on the relevant button in the top corner.3. Enter the data as shown in the following figure.
4 Working with the Target Configuration Editor4.9 Scenario demonstrating how to create a new target configuration file
ARM DUI0446Z Copyright © 2010-2016 ARM Limited or its affiliates. All rightsreserved.
4-124
Non-Confidential
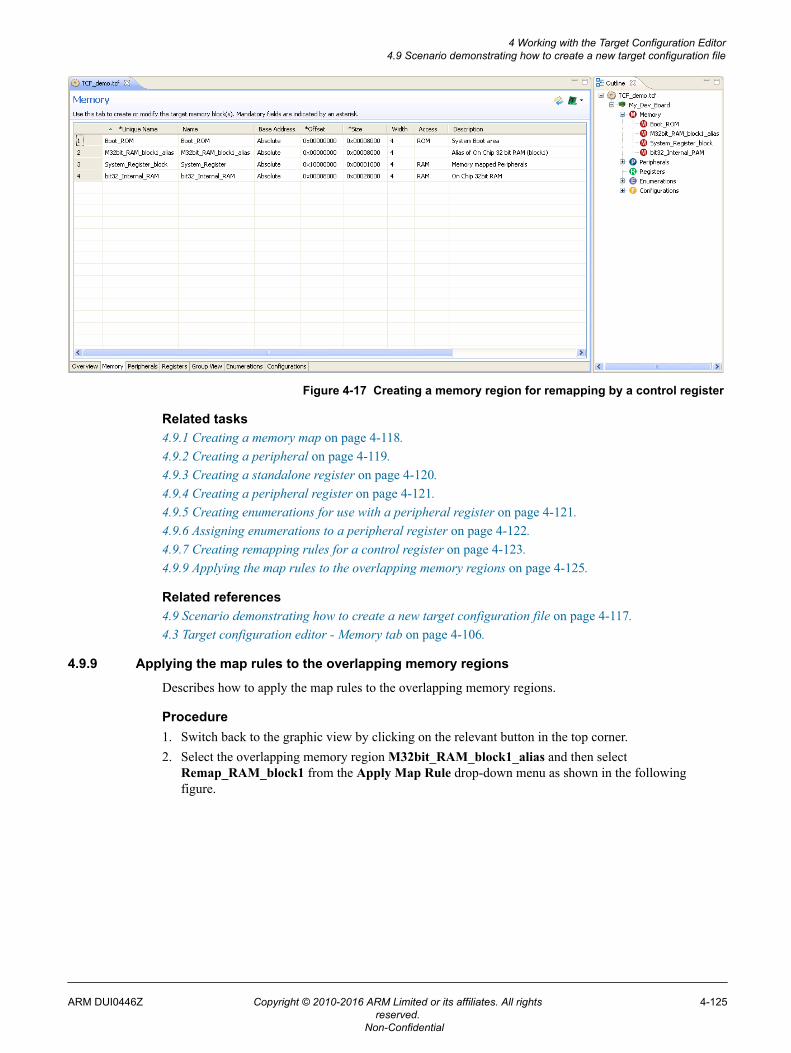
Figure 4-17 Creating a memory region for remapping by a control register
Related tasks4.9.1 Creating a memory map on page 4-118.4.9.2 Creating a peripheral on page 4-119.4.9.3 Creating a standalone register on page 4-120.4.9.4 Creating a peripheral register on page 4-121.4.9.5 Creating enumerations for use with a peripheral register on page 4-121.4.9.6 Assigning enumerations to a peripheral register on page 4-122.4.9.7 Creating remapping rules for a control register on page 4-123.4.9.9 Applying the map rules to the overlapping memory regions on page 4-125.
Related references4.9 Scenario demonstrating how to create a new target configuration file on page 4-117.4.3 Target configuration editor - Memory tab on page 4-106.
4.9.9 Applying the map rules to the overlapping memory regions
Describes how to apply the map rules to the overlapping memory regions.
Procedure1. Switch back to the graphic view by clicking on the relevant button in the top corner.2. Select the overlapping memory region M32bit_RAM_block1_alias and then select
Remap_RAM_block1 from the Apply Map Rule drop-down menu as shown in the followingfigure.
4 Working with the Target Configuration Editor4.9 Scenario demonstrating how to create a new target configuration file
ARM DUI0446Z Copyright © 2010-2016 ARM Limited or its affiliates. All rightsreserved.
4-125
Non-Confidential
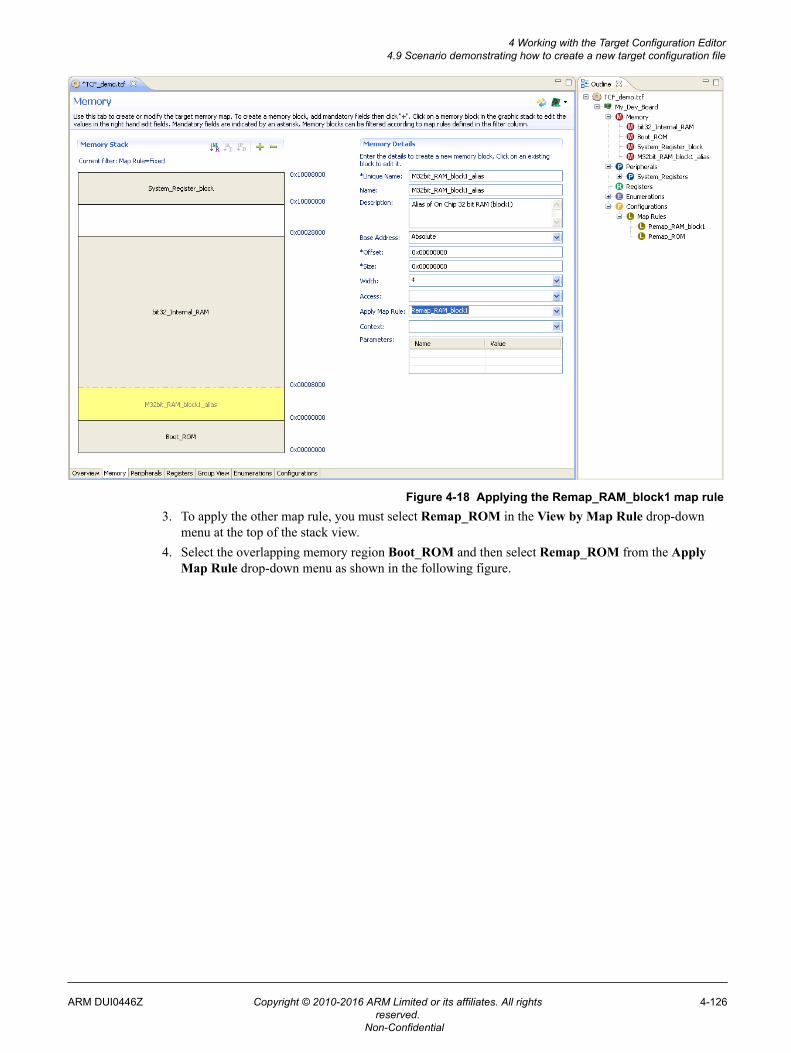
Figure 4-18 Applying the Remap_RAM_block1 map rule3. To apply the other map rule, you must select Remap_ROM in the View by Map Rule drop-down
menu at the top of the stack view.4. Select the overlapping memory region Boot_ROM and then select Remap_ROM from the Apply
Map Rule drop-down menu as shown in the following figure.
4 Working with the Target Configuration Editor4.9 Scenario demonstrating how to create a new target configuration file
ARM DUI0446Z Copyright © 2010-2016 ARM Limited or its affiliates. All rightsreserved.
4-126
Non-Confidential
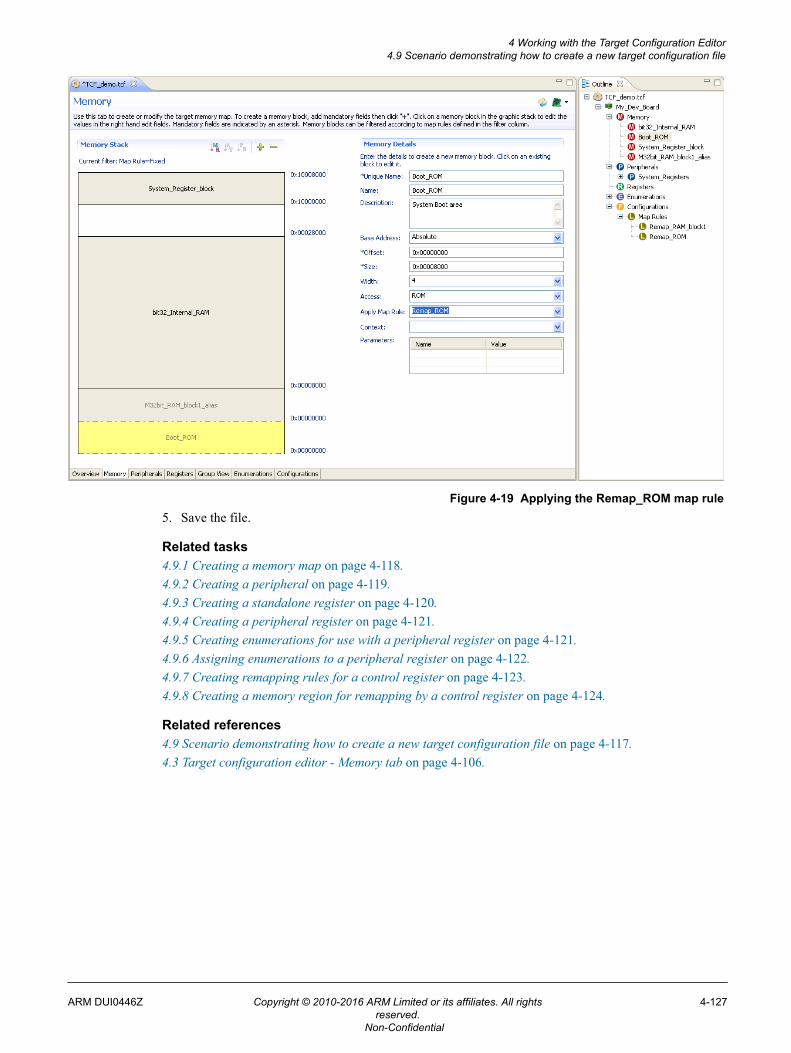
Figure 4-19 Applying the Remap_ROM map rule5. Save the file.
Related tasks4.9.1 Creating a memory map on page 4-118.4.9.2 Creating a peripheral on page 4-119.4.9.3 Creating a standalone register on page 4-120.4.9.4 Creating a peripheral register on page 4-121.4.9.5 Creating enumerations for use with a peripheral register on page 4-121.4.9.6 Assigning enumerations to a peripheral register on page 4-122.4.9.7 Creating remapping rules for a control register on page 4-123.4.9.8 Creating a memory region for remapping by a control register on page 4-124.
Related references4.9 Scenario demonstrating how to create a new target configuration file on page 4-117.4.3 Target configuration editor - Memory tab on page 4-106.
4 Working with the Target Configuration Editor4.9 Scenario demonstrating how to create a new target configuration file
ARM DUI0446Z Copyright © 2010-2016 ARM Limited or its affiliates. All rightsreserved.
4-127
Non-Confidential
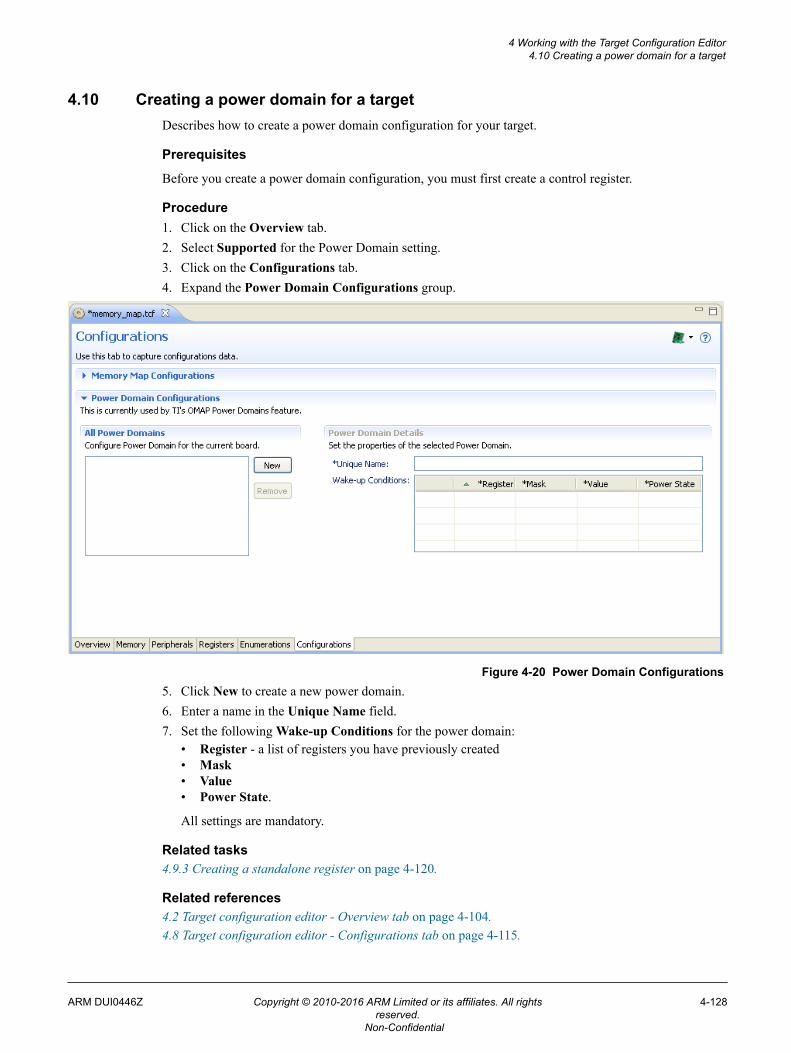
4.10 Creating a power domain for a targetDescribes how to create a power domain configuration for your target.
Prerequisites
Before you create a power domain configuration, you must first create a control register.
Procedure1. Click on the Overview tab.2. Select Supported for the Power Domain setting.3. Click on the Configurations tab.4. Expand the Power Domain Configurations group.
Figure 4-20 Power Domain Configurations5. Click New to create a new power domain.6. Enter a name in the Unique Name field.7. Set the following Wake-up Conditions for the power domain:
• Register - a list of registers you have previously created• Mask• Value• Power State.
All settings are mandatory.
Related tasks4.9.3 Creating a standalone register on page 4-120.
Related references4.2 Target configuration editor - Overview tab on page 4-104.4.8 Target configuration editor - Configurations tab on page 4-115.
4 Working with the Target Configuration Editor4.10 Creating a power domain for a target
ARM DUI0446Z Copyright © 2010-2016 ARM Limited or its affiliates. All rightsreserved.
4-128
Non-Confidential
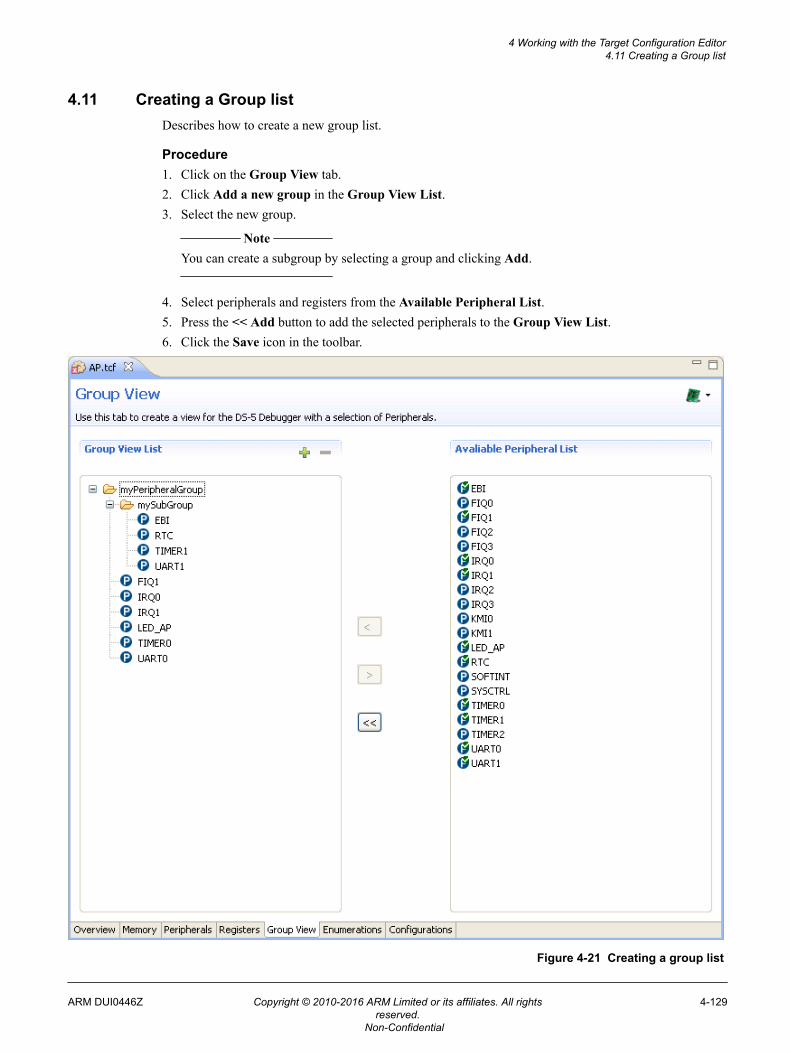
4.11 Creating a Group listDescribes how to create a new group list.
Procedure1. Click on the Group View tab.2. Click Add a new group in the Group View List.3. Select the new group.
Note
You can create a subgroup by selecting a group and clicking Add.
4. Select peripherals and registers from the Available Peripheral List.5. Press the << Add button to add the selected peripherals to the Group View List.6. Click the Save icon in the toolbar.
Figure 4-21 Creating a group list
4 Working with the Target Configuration Editor4.11 Creating a Group list
ARM DUI0446Z Copyright © 2010-2016 ARM Limited or its affiliates. All rightsreserved.
4-129
Non-Confidential

Related references4.6 Target configuration editor - Group View tab on page 4-112.
4 Working with the Target Configuration Editor4.11 Creating a Group list
ARM DUI0446Z Copyright © 2010-2016 ARM Limited or its affiliates. All rightsreserved.
4-130
Non-Confidential
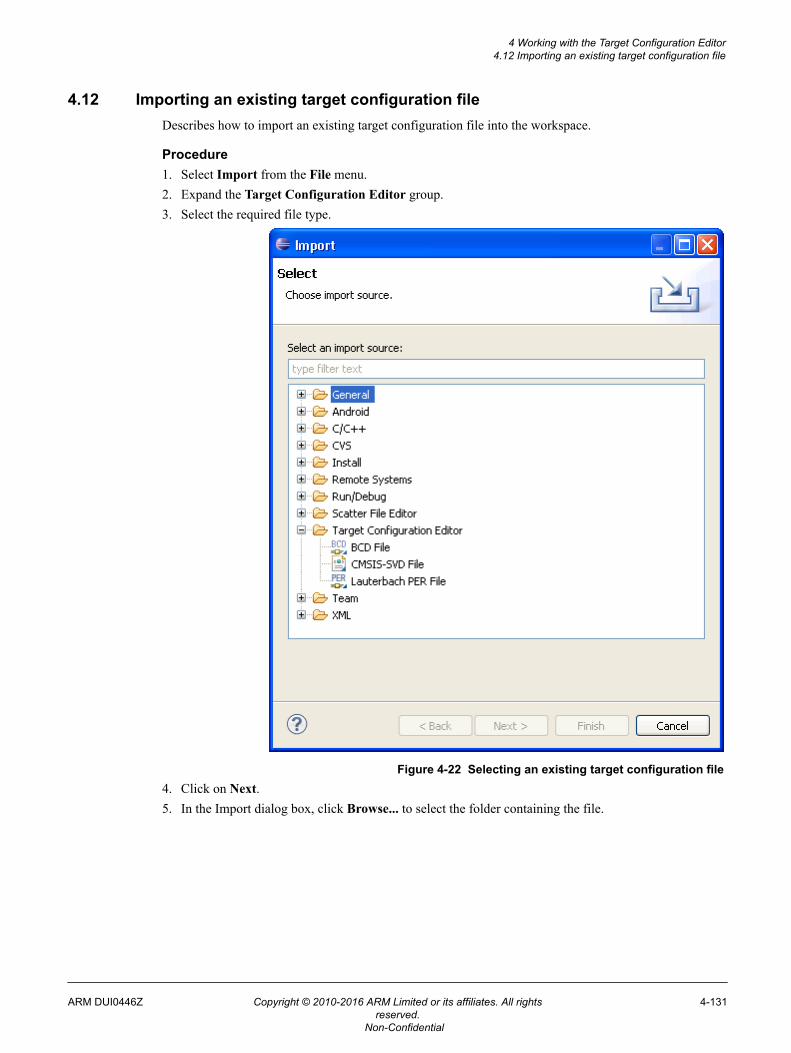
4.12 Importing an existing target configuration fileDescribes how to import an existing target configuration file into the workspace.
Procedure1. Select Import from the File menu.2. Expand the Target Configuration Editor group.3. Select the required file type.
Figure 4-22 Selecting an existing target configuration file4. Click on Next.5. In the Import dialog box, click Browse... to select the folder containing the file.
4 Working with the Target Configuration Editor4.12 Importing an existing target configuration file
ARM DUI0446Z Copyright © 2010-2016 ARM Limited or its affiliates. All rightsreserved.
4-131
Non-Confidential
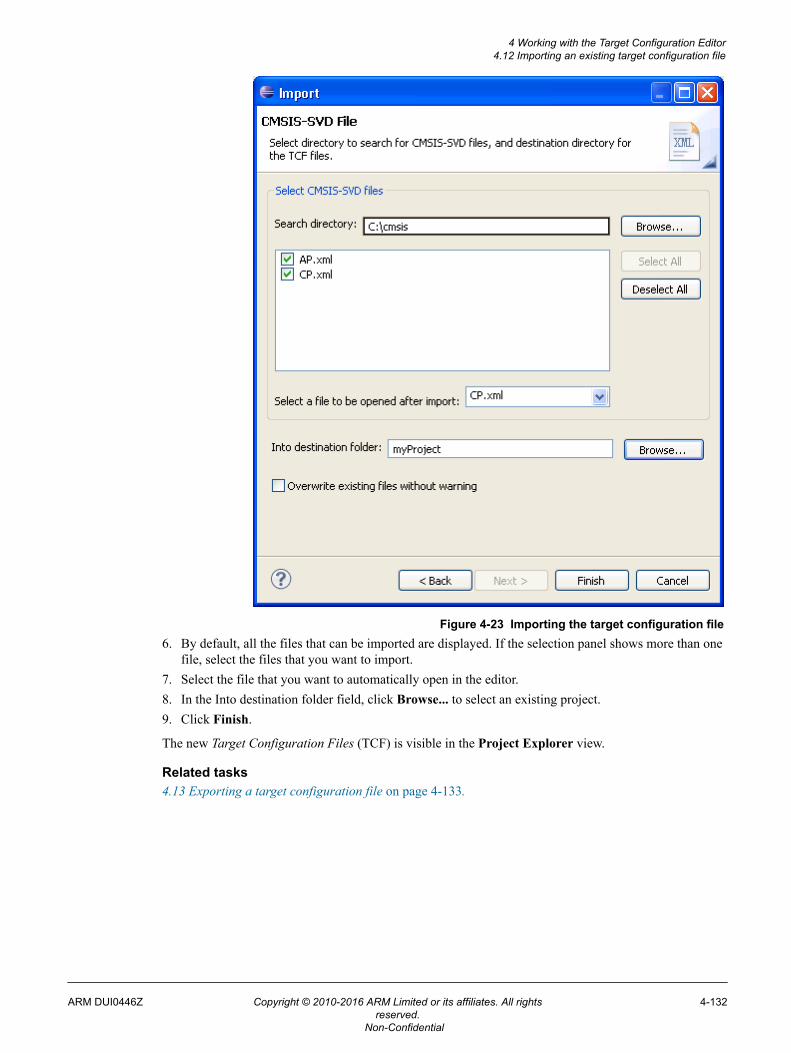
Figure 4-23 Importing the target configuration file6. By default, all the files that can be imported are displayed. If the selection panel shows more than one
file, select the files that you want to import.7. Select the file that you want to automatically open in the editor.8. In the Into destination folder field, click Browse... to select an existing project.9. Click Finish.
The new Target Configuration Files (TCF) is visible in the Project Explorer view.
Related tasks4.13 Exporting a target configuration file on page 4-133.
4 Working with the Target Configuration Editor4.12 Importing an existing target configuration file
ARM DUI0446Z Copyright © 2010-2016 ARM Limited or its affiliates. All rightsreserved.
4-132
Non-Confidential
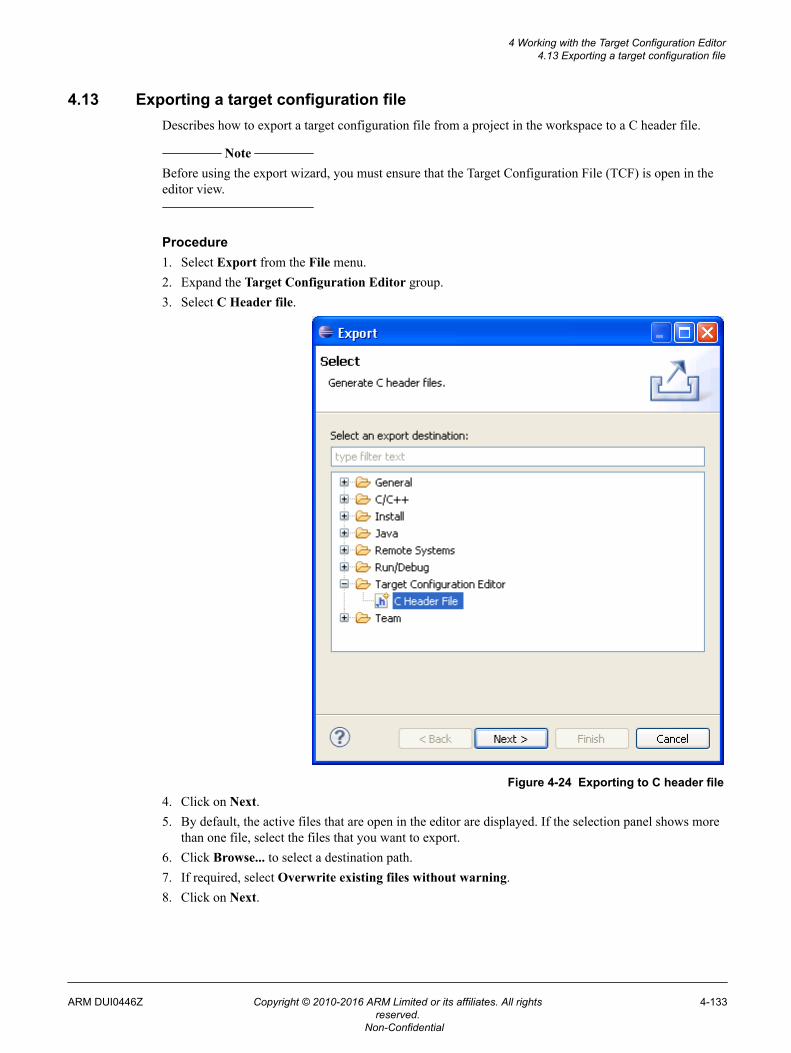
4.13 Exporting a target configuration fileDescribes how to export a target configuration file from a project in the workspace to a C header file.
Note
Before using the export wizard, you must ensure that the Target Configuration File (TCF) is open in theeditor view.
Procedure1. Select Export from the File menu.2. Expand the Target Configuration Editor group.3. Select C Header file.
Figure 4-24 Exporting to C header file4. Click on Next.5. By default, the active files that are open in the editor are displayed. If the selection panel shows more
than one file, select the files that you want to export.6. Click Browse... to select a destination path.7. If required, select Overwrite existing files without warning.8. Click on Next.
4 Working with the Target Configuration Editor4.13 Exporting a target configuration file
ARM DUI0446Z Copyright © 2010-2016 ARM Limited or its affiliates. All rightsreserved.
4-133
Non-Confidential
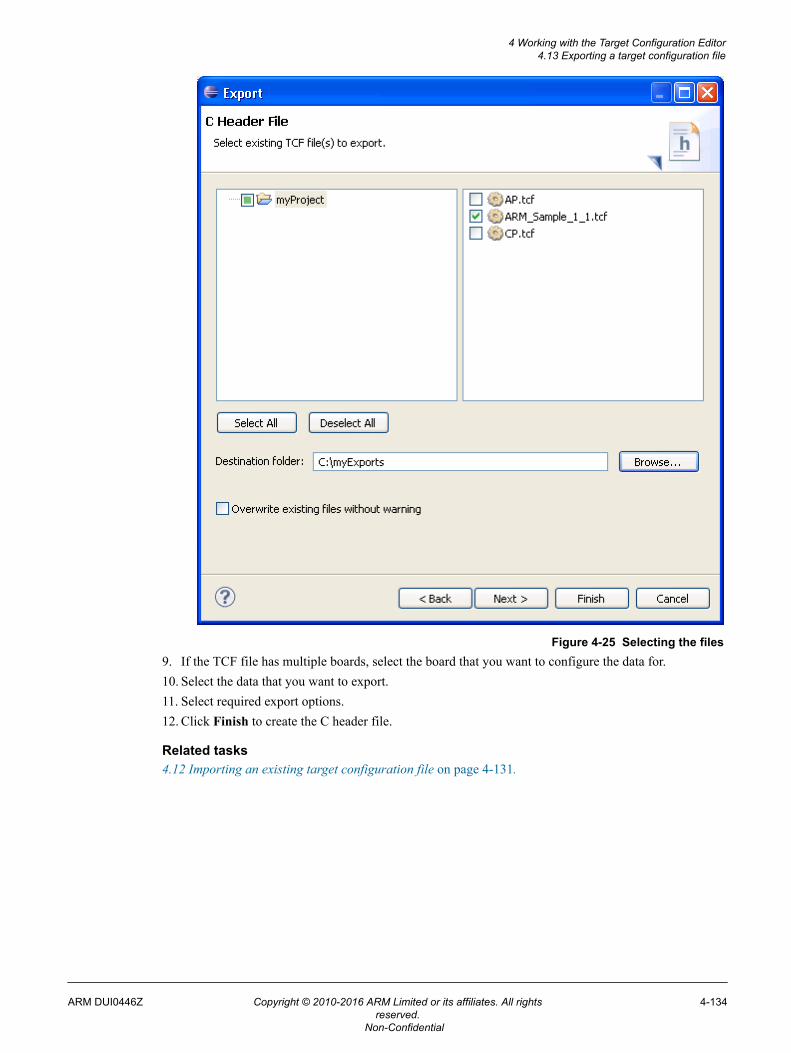
Figure 4-25 Selecting the files9. If the TCF file has multiple boards, select the board that you want to configure the data for.10. Select the data that you want to export.11. Select required export options.12. Click Finish to create the C header file.
Related tasks4.12 Importing an existing target configuration file on page 4-131.
4 Working with the Target Configuration Editor4.13 Exporting a target configuration file
ARM DUI0446Z Copyright © 2010-2016 ARM Limited or its affiliates. All rightsreserved.
4-134
Non-Confidential
Chapter 5Examining the Target
This chapter describes how to examine registers, variables, memory, and the call stack.
It contains the following sections:• 5.1 Examining the target execution environment on page 5-136.• 5.2 Examining the call stack on page 5-137.• 5.3 About trace support on page 5-138.• 5.4 About post-mortem debugging of trace data on page 5-141.
ARM DUI0446Z Copyright © 2010-2016 ARM Limited or its affiliates. All rightsreserved.
5-135
Non-Confidential
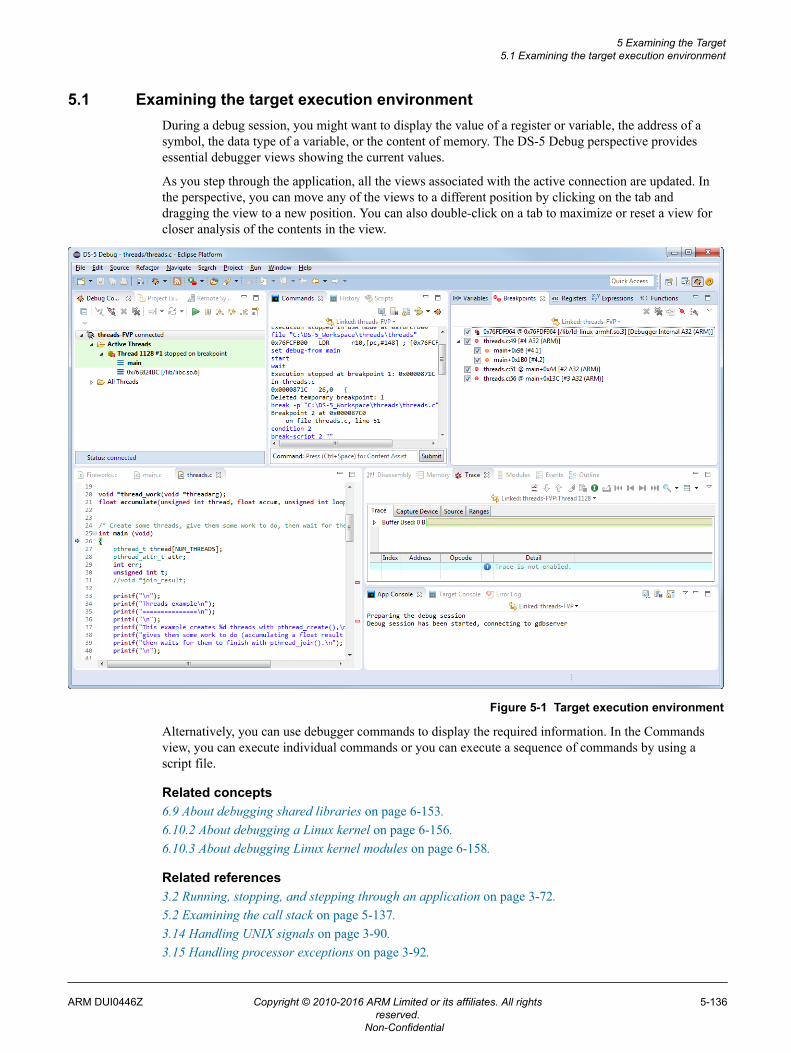
5.1 Examining the target execution environmentDuring a debug session, you might want to display the value of a register or variable, the address of asymbol, the data type of a variable, or the content of memory. The DS-5 Debug perspective providesessential debugger views showing the current values.
As you step through the application, all the views associated with the active connection are updated. Inthe perspective, you can move any of the views to a different position by clicking on the tab anddragging the view to a new position. You can also double-click on a tab to maximize or reset a view forcloser analysis of the contents in the view.
Figure 5-1 Target execution environment
Alternatively, you can use debugger commands to display the required information. In the Commandsview, you can execute individual commands or you can execute a sequence of commands by using ascript file.
Related concepts6.9 About debugging shared libraries on page 6-153.6.10.2 About debugging a Linux kernel on page 6-156.6.10.3 About debugging Linux kernel modules on page 6-158.
Related references3.2 Running, stopping, and stepping through an application on page 3-72.5.2 Examining the call stack on page 5-137.3.14 Handling UNIX signals on page 3-90.3.15 Handling processor exceptions on page 3-92.
5 Examining the Target5.1 Examining the target execution environment
ARM DUI0446Z Copyright © 2010-2016 ARM Limited or its affiliates. All rightsreserved.
5-136
Non-Confidential
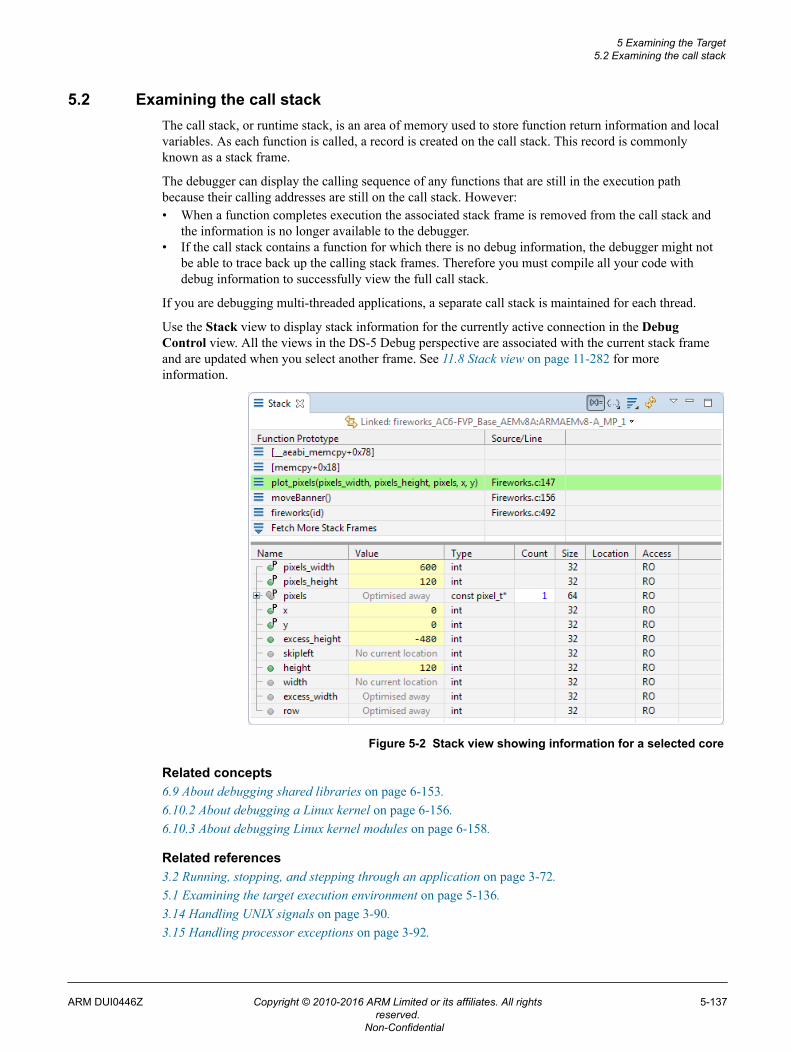
5.2 Examining the call stackThe call stack, or runtime stack, is an area of memory used to store function return information and localvariables. As each function is called, a record is created on the call stack. This record is commonlyknown as a stack frame.
The debugger can display the calling sequence of any functions that are still in the execution pathbecause their calling addresses are still on the call stack. However:• When a function completes execution the associated stack frame is removed from the call stack and
the information is no longer available to the debugger.• If the call stack contains a function for which there is no debug information, the debugger might not
be able to trace back up the calling stack frames. Therefore you must compile all your code withdebug information to successfully view the full call stack.
If you are debugging multi-threaded applications, a separate call stack is maintained for each thread.
Use the Stack view to display stack information for the currently active connection in the DebugControl view. All the views in the DS-5 Debug perspective are associated with the current stack frameand are updated when you select another frame. See 11.8 Stack view on page 11-282 for moreinformation.
Figure 5-2 Stack view showing information for a selected core
Related concepts6.9 About debugging shared libraries on page 6-153.6.10.2 About debugging a Linux kernel on page 6-156.6.10.3 About debugging Linux kernel modules on page 6-158.
Related references3.2 Running, stopping, and stepping through an application on page 3-72.5.1 Examining the target execution environment on page 5-136.3.14 Handling UNIX signals on page 3-90.3.15 Handling processor exceptions on page 3-92.
5 Examining the Target5.2 Examining the call stack
ARM DUI0446Z Copyright © 2010-2016 ARM Limited or its affiliates. All rightsreserved.
5-137
Non-Confidential
5.3 About trace support
ARM DS-5 enables you to perform tracing on your application or system. Tracing enables you to non-invasively capture, in real-time, the instructions and data accesses that were executed. It is a powerfultool that enables you to investigate problems while the system runs at full speed. These problems can beintermittent, and are difficult to identify through traditional debugging methods that require starting andstopping the processor. Tracing is also useful when trying to identify potential bottlenecks or to improveperformance-critical areas of your application.
When a program fails, and the trace buffer is enabled, you can see the program history associated withthe captured trace. With this program history, it is easier to walk back through your program to see whathappened just before the point of failure. This is particularly useful for investigating intermittent andreal-time failures, which can be difficult to identify through traditional debug methods that requirestopping and starting the processor. The use of hardware tracing can significantly reduce the amount oftime required to find these failures, because the trace shows exactly what was executed.
Before the debugger can trace your platform, you must ensure that:• you have a debug hardware agent, such as an ARM DSTREAM unit or a software debug agent such
as ARM VSTREAM, with a connection to a trace stream.• the debugger is connected to the debug hardware agent.
Trace hardware
Trace is typically provided by an external hardware block connected to the processor. This is known asan Embedded Trace Macrocell (ETM) or Program Trace Macrocell (PTM) and is an optional part of anARM architecture-based system. System-on-chip designers might omit this block from their silicon toreduce costs. These blocks observe (but do not affect) the processor behavior and are able to monitorinstruction execution and data accesses.
There are two main problems with capturing trace. The first is that with very high processor clockspeeds, even a few seconds of operation can mean billions of cycles of execution. Clearly, to look at thisvolume of information would be extremely difficult. The second problem is that data trace requires veryhigh bandwidth as every load or store operation generates trace information. This is a problem becausetypically only a few pins are provided on the chip and these outputs might be able to be switched atsignificantly lower rates than the processor can be clocked at. It is very easy to exceed the capacity of thetrace port. To solve this latter problem, the trace macrocell tries to compress information to reduce thebandwidth required. However, the main method to deal with these issues is to control the trace block sothat only selected trace information is gathered. For example, trace only execution, without recordingdata values, or trace only data accesses to a particular peripheral or during execution of a particularfunction.
In addition, it is common to store trace information in an on-chip memory buffer, the Embedded TraceBuffer (ETB). This alleviates the problem of getting information off-chip at speed, but has an additionalcost in terms of silicon area and also provides a fixed limit on the amount of trace that can be captured.
The ETB stores the compressed trace information in a circular fashion, continuously capturing traceinformation until stopped. The size of the ETB varies between chip implementations, but a buffer of 8 or16kB is typically enough to hold a several thousand lines of program trace.
Trace Ranges
Trace ranges enable you to restrict the capture of trace to a linear range of memory. A trace range has astart and end address in virtual memory, and any execution within this address range is captured. Incontrast to trace start and end points, any function calls made within a trace range are only captured if thetarget of the function call is also within the specified address range. The number of trace ranges that canbe enabled is determined by the debug hardware in your processor.
5 Examining the Target5.3 About trace support
ARM DUI0446Z Copyright © 2010-2016 ARM Limited or its affiliates. All rightsreserved.
5-138
Non-Confidential
Trace capture is enabled by default when no trace ranges are set. Trace capture is disabled by defaultwhen any trace ranges are set, and is only enabled when within the defined ranges.
You can configure trace ranges using the Ranges tab in the Trace view. The start and end address foreach range can either be an absolute address or an expression, such as the name of a function. Be awarethat optimizing compilers might rearrange or minimize code in memory from that in the associatedsource code. This can lead to code being unexpectedly included or excluded from the trace capture.
Trace Points
Trace points enable you to control precisely where in your program trace is captured. Trace points arenon-intrusive and do not require stopping the system to process. The maximum number of trace pointsthat can be set is determined by the debug hardware in your processor. The following types of tracepoints are available:To set trace points in the source view, right-click in the margin and select therequired option from the DS-5 Breakpoints context menu. To set trace points in the Disassembly view,right-click on an instruction and select the required option from the DS-5 Breakpoints context menu.Trace points are listed in the Breakpoints view.
Trace Start PointEnables trace capture when execution reaches the selected address.
Trace Stop PointDisables trace capture when execution reaches the selected address
Trace Trigger PointMarks this point in your source code so that you can more easily locate it in the Trace view.
Trace Start Points and Trace Stop Points enable and disable capture of trace respectively. Trace points donot take account of nesting. For example, if you hit two Trace Start Points in a row, followed by twoTrace Stop Points, then the trace is disabled immediately when the first Trace Stop Point is reached, notthe second. With no Trace Start Points set then trace is enabled all the time by default. If you have anyTrace Start Points set, then trace is disabled by default and is only enabled when the first Trace StartPoint is hit.
Trace trigger points enable you to mark interesting locations in your source code so that you can easilyfind them later in the Trace view. The first time a Trigger Point is hit a Trace Trigger Event record isinserted into the trace buffer. Only the first Trigger Point to be hit inserts the trigger event record. Toconfigure the debugger so that it stops collecting trace when a trace trigger point is hit, use the StopTrace Capture On Trigger checkbox in the Properties tab of the Trace view.
Note
This does not stop the target. It only stops the trace capture. The target continues running normally untilit hits a breakpoint or until you click the Interrupt icon in the Debug Control view.
When this is set you can configure the amount of trace that is captured before and after a trace triggerpoint using the Post-Trigger Capture Size field in the Properties tab of the Trace view. If you set thisfield to:
0%The trace capture stops as soon as possible after the first trigger point is hit. The trigger eventrecord can be found towards the end of the trace buffer.
50%The trace capture stops after the first trigger point is hit and an additional 50% of the buffer isfilled. The trigger event record can be found towards the middle of the trace buffer.
5 Examining the Target5.3 About trace support
ARM DUI0446Z Copyright © 2010-2016 ARM Limited or its affiliates. All rightsreserved.
5-139
Non-Confidential
99%The trace capture stops after the first trigger point is hit and an additional 99% of the buffer isfilled. The trigger event record can be found towards the beginning of the trace buffer.
Note
Due to target timing constraints the trigger event record might get pushed out of the trace buffer.
Being able to limit trace capture to the precise areas of interest is especially helpful when using a capturedevice such as an ETB, where the quantity of trace that can be captured is very small.
Select the Find Trigger Event record option in the view menu to locate Trigger Event record in thetrace buffer.
Note
Trace trigger functionality is dependent on the target platform being able to signal to the trace capturehardware, such as ETB or DSTREAM, that a trigger condition has occurred. If this hardware signal isnot present or not configured correctly then it might not be possible to automatically stop trace capturearound trigger points.
Related concepts5.4 About post-mortem debugging of trace data on page 5-141.8.1 Overview: Running DS-5 Debugger from the command-line or from a script on page 8-203.
Related tasks8.4 Specifying a custom configuration database using the command-line on page 8-211.
Related references8.2 Command-line debugger options on page 8-204.
5 Examining the Target5.3 About trace support
ARM DUI0446Z Copyright © 2010-2016 ARM Limited or its affiliates. All rightsreserved.
5-140
Non-Confidential
5.4 About post-mortem debugging of trace dataYou can decode previously captured trace data. You must have files available containing the capturedtrace, as well as any other files, such as configuration and images, that are needed to process and decodethat trace data.
Once the trace data and other files are ready, you configure the headless command-line debugger toconnect to the post-mortem debug configuration from the configuration database.
You can then inspect the state of the data at the time of the trace capture. Note
• The memory and registers are read-only.• You can add more debug information using additional files.• You can also decode trace and dump the output to files.
The basic steps for post-mortem debugging using the headless command-line debugger are:1. Generate trace data files.2. Use --cdb-list to list the platforms and parameters available in the configuration database.3. Use --cdb-entry to specify a platform entry in the configuration database.4. If you need to specify additional parameters, use the --cdb-entry-param option to specify the
parameters. Note
At the DS-5 command prompt, enter debugger --help to view the list of available options.
Related concepts5.3 About trace support on page 5-138.8.1 Overview: Running DS-5 Debugger from the command-line or from a script on page 8-203.
Related tasks8.4 Specifying a custom configuration database using the command-line on page 8-211.
Related references8.2 Command-line debugger options on page 8-204.
5 Examining the Target5.4 About post-mortem debugging of trace data
ARM DUI0446Z Copyright © 2010-2016 ARM Limited or its affiliates. All rightsreserved.
5-141
Non-Confidential
Chapter 6Debugging Embedded Systems
Gives an introduction to debugging embedded systems.
It contains the following sections:• 6.1 About endianness on page 6-143.• 6.2 About accessing AHB, APB, and AXI buses on page 6-144.• 6.3 About virtual and physical memory on page 6-145.• 6.4 About address spaces on page 6-146.• 6.5 About debugging hypervisors on page 6-148.• 6.6 About debugging big.LITTLE systems on page 6-149.• 6.7 About debugging bare-metal symmetric multiprocessing systems on page 6-150.• 6.8 About debugging multi-threaded applications on page 6-152.• 6.9 About debugging shared libraries on page 6-153.• 6.10 About OS awareness on page 6-155.• 6.11 About debugging TrustZone enabled targets on page 6-160.• 6.12 About debugging a Unified Extensible Firmware Interface (UEFI) on page 6-162.• 6.13 About debugging MMUs on page 6-163.• 6.14 About Debug and Trace Services Layer (DTSL) on page 6-165.• 6.15 About CoreSight™ Target Access Library on page 6-166.• 6.16 About debugging caches on page 6-167.• 6.17 About DS-5 Debugger support for overlays on page 6-170.
ARM DUI0446Z Copyright © 2010-2016 ARM Limited or its affiliates. All rightsreserved.
6-142
Non-Confidential
6.1 About endiannessThe term endianness is used to describe the ordering of individually addressable quantities, which meansbytes and halfwords in the ARM architecture. The term byte-ordering can also be used rather thanendian.
If an image is loaded to the target on connection, the debugger automatically selects the endianness ofthe image otherwise it selects the current endianness of the target. If the debugger detects a conflict thena warning message is generated.
You can use the set endian command to modify the default debugger setting.
Related informationDS-5 Debugger commands.
6 Debugging Embedded Systems6.1 About endianness
ARM DUI0446Z Copyright © 2010-2016 ARM Limited or its affiliates. All rightsreserved.
6-143
Non-Confidential
6.2 About accessing AHB, APB, and AXI busesARM-based systems connect the processors, memories and peripherals using buses. Examples ofcommon bus types include AMBA High-performance Bus (AHB), Advanced Peripheral Bus (APB), andAdvanced eXtensible Interface (AXI).
In some systems, these buses are accessible from the debug interface. Where this is the case, then DS-5Debugger provides access to these buses when performing bare-metal or kernel debugging. Buses areexposed within the debugger as additional address spaces. Accesses to these buses are availableirrespective of whether the processor is running or halted.
Within a debug session in DS-5 Debugger you can discover which buses are available using the infomemory command. The address and description columns in the output of this command explain whateach address space represents and how the debugger accesses it.
You can use AHB:, APB:, and AXI: address prefixes for these buses anywhere in the debugger where younormally enter an address or expression. For example, assuming that the debugger provides an APBaddress space, then you can print the contents of address zero using the following command:
x/1 APB:0x0
Each address space has a size, which is the number of bits that comprise the address. Common addressspace size on embedded and low-end devices is 32-bits, higher-end devices that require more memorymight use > 32-bits. As an example, some devices based around ARM architecture ARMv7 make use ofLPAE (Large Physical Address Extensions) to extend physical addresses on the AXI bus to 40-bits, eventhough virtual addresses within the processor are 32-bits.
The exact topology of the buses and their connection to the debug interface is dependent on your system.See the CoreSight specifications for your hardware for more information. Typically, the debug access tothese buses bypass the processor, and so does not take into account memory mappings or caches withinthe processor itself. It is implementation dependent on whether accesses to the buses occur before or afterany other caches in the system, such as L2 or L3 caches. The debugger does not attempt to achievecoherency between caches in your system when accessing these buses and it is your responsibility to takethis into account and manually perform any clean or flush operations as required.
For example, to achieve cache coherency when debugging an image with the processors level 1 cacheenabled, you must clean and invalidate portions of the L1 cache prior to modifying any of yourapplication code or data using the AHB address space. This ensures that any existing changes in thecache are written out to memory before writing to that address space, and that the processor correctlyreads your modification when execution resumes.
The behavior when accessing unallocated addresses is undefined, and depending on your system can leadto locking up the buses. It is recommended that you only access those specific addresses that are definedin your system. You can use the memory command to redefine the memory regions within the debuggerand modifying access rights to control the addresses. You can use the x command with the count optionto limit the amount of memory that is read.
Related references11.6 Commands view on page 11-275.
Related informationDS-5 Debugger commands.
6 Debugging Embedded Systems6.2 About accessing AHB, APB, and AXI buses
ARM DUI0446Z Copyright © 2010-2016 ARM Limited or its affiliates. All rightsreserved.
6-144
Non-Confidential
6.3 About virtual and physical memoryProcessors that contain a Memory Management Unit (MMU) provide two views of memory, virtual andphysical. The virtual address is the address prior to address translation in the MMU and the physicaladdress is the address after translation.
Normally when the debugger accesses memory, it uses virtual addresses. However, if the MMU isdisabled, then the mapping is flat and the virtual address is the same as the physical address.
To force the debugger to use physical addresses, prefix the addresses with P:.
For example:
P:0x8000P:0+main creates a physical address with the address offset of main()
If your processor also contains TrustZone technology, then you have access to Secure and Normalworlds, each with their own separate virtual and physical address mappings. In this case, the addressprefix P: is not available, and instead you must use NP: for normal physical and SP: for secure physical.
Note
• Processors that are compliant with ARM Architectures prior to ARMv6 do not support physicaladdressing in this manner. This includes the ARM7 and ARM9 family of processors.
• Physical address access is not enabled for all operations. For example, the ARM hardware does notsupport setting breakpoints via a physical address.
When memory is accessed via a physical address, the caches are not flushed. Hence, results mightdiffer depending on whether you view memory through the physical or virtual addresses (assumingthey are addressing the same memory addresses).
Related references11.6 Commands view on page 11-275.
Related informationDS-5 Debugger commands.
6 Debugging Embedded Systems6.3 About virtual and physical memory
ARM DUI0446Z Copyright © 2010-2016 ARM Limited or its affiliates. All rightsreserved.
6-145
Non-Confidential
6.4 About address spaces
You can use address space prefixes in DS-5 Debugger to refer to different addresses spaces. You can usethese address space prefixes for various debugging activities such as to:
• set breakpoint in a specific memory space• read or write memory• load symbols associated with a specific memory space.
DS-5 Debugger also uses these prefixes when reporting the current memory space where the executionstopped.
Note
The address spaces can be different on different targets. The availability of an address space depends onwhat architecture features are implemented, such as security extensions.
Address spaces in ARMv7 based processors
The following address space prefixes might be available for ARMv7 based processors:
• S: This corresponds to the secure address space.• H: This corresponds to the hypervisor address space.• N: This corresponds to the non-secure address space.• SP: This corresponds to secure world physical memory.• NP: This corresponds to non-secure world physical memory.
The following are examples of DS-5 Debugger commands with address spaces for ARMv7 basedprocessors:
• break S:main• x N:0x80000000• add-symbol-file foo.axf SP:0.
When execution stops, DS-5 Debugger reports the current memory space, for example:• Execution stopped in SVC mode at S:0x80000000• Execution stopped in SYS mode at breakpoint 1: S:0x80000BA8.
Address spaces in ARMv8 based processors
The following address space prefixes might be available for ARMv8 based processors when in theAArch64 execution state:
• EL3: This corresponds to the EL3 translation regime. This is a secure address space.• EL2: This corresponds to the EL2 translation regime. This is a non-secure address space.• EL1S: This corresponds to the Secure EL1 and Secure EL0 translation regimes.• EL1N: This corresponds to the Non-secure EL1 and Non-secure EL0 translation regimes.• SP: This corresponds to Secure world physical memory.• NP: This corresponds to Non-secure world physical memory.
The following address space prefixes might be available for ARMv8 based processors when in theAArch32 execution state:
• S: This corresponds to the EL3, Secure EL1, and Secure EL0 translation regimes.• H: This corresponds to the EL2 translation regime. This is a Non-secure address space.• N: This corresponds to the Non-secure EL1 and Non-secure EL0 translation regimes.• SP: This corresponds to Secure world physical memory.• NP: This corresponds to Non-secure world physical memory.
6 Debugging Embedded Systems6.4 About address spaces
ARM DUI0446Z Copyright © 2010-2016 ARM Limited or its affiliates. All rightsreserved.
6-146
Non-Confidential
The following are examples of DS-5 Debugger commands with address spaces for ARMv8 basedprocessors:
• break EL1N:main• x EL1S:0x80000000• add-symbol-file foo.axf SP:0.
When execution stops, DS-5 Debugger reports the current memory space, for example:
• Execution stopped in EL3h mode at: EL3:0x0000000080001500• Execution stopped in EL1h mode at breakpoint 2.2: EL1N:0x0000000080000F6C
If the core is stopped in exception level EL3, the debugger cannot reliably determine whether thetranslation regime at EL1/EL0 is configured for secure or non-secure access. This is because the securemonitor can change this at run-time when switching between secure and non-secure worlds. Memoryaccesses from EL3, such as setting software breakpoints at EL1S: or EL1N: addresses, might causecorruption or the target to lockup.
The memory spaces for the EL1 and EL0 exception levels have the same prefix because the sametranslation tables are used for both EL0 and EL1. These translation tables are used for either SecureEL1/EL0 or Non-secure EL1/EL0. The consequence of this is that if the core, in AArch64 state, isstopped in EL0 in secure state, then the debugger reports: Execution stopped in EL0h mode at:EL1S:0x0000000000000000.
Note
The reported EL1S: here refers to the memory space that is common to EL0 and EL1. It does not refer tothe exception level.
Related concepts6.2 About accessing AHB, APB, and AXI buses on page 6-144.6.3 About virtual and physical memory on page 6-145.6.5 About debugging hypervisors on page 6-148.
6 Debugging Embedded Systems6.4 About address spaces
ARM DUI0446Z Copyright © 2010-2016 ARM Limited or its affiliates. All rightsreserved.
6-147
Non-Confidential
6.5 About debugging hypervisorsARM processors that support virtualization extensions have the ability to run multiple guest operatingsystems beneath a hypervisor. The hypervisor is the software that arbitrates amongst the guest operatingsystems and controls access to the hardware.
DS-5 Debugger provides basic support for bare-metal hypervisor debugging. When connected to aprocessor that supports virtualization extensions, the debugger enables you to distinguish betweenhypervisor and guest memory, and to set breakpoints that only apply when in hypervisor mode or withina specific guest operating system.
A hypervisor typically provides separate address spaces for itself as well as for each guest operatingsystem. Unless informed otherwise, all memory accesses by the debugger occur in the current context. Ifyou are stopped in hypervisor mode then memory accesses use the hypervisor memory space, and ifstopped in a guest operating system then memory accesses use the address space of the guest operatingsystem. To force access to a particular address space, you must prefix the address with either H: forhypervisor or N: for guest operating system.
Note
It is only possible to access the address space of the guest operating system that is currently scheduled torun within the hypervisor. It is not possible to specify a different guest operating system.
Similarly, hardware and software breakpoints can be configured to match on hypervisor or guestoperating systems using the same address prefixes. If no address prefix is used then the breakpointapplies to the address space that is current when the breakpoint is first set. For example, if a softwarebreakpoint is set in memory that is shared between hypervisor and a guest operating system, then thepossibility exists for the breakpoint to be hit from the wrong mode, and in this case the debugger may notrecognize your breakpoint as the reason for stopping.
For hardware breakpoints only, not software breakpoints, you can additionally configure them to matchonly within a specific guest operating system. This feature uses the architecturally defined VirtualMachine ID (VMID) register to spot when a specific guest operating system is executing. The hypervisoris responsible for assigning unique VMIDs to each guest operating system setting this in the VMIDregister when that guest operating system executes. In using this feature, it is your responsibility tounderstand which VMID is associated with each guest operating system that you want to debug.Assuming a VMID is known, you can apply a breakpoint to it within the Breakpoints view or by usingthe break-stop-on-vmid command.
When debugging a system that is running multiple guest operating systems, you can optionally enablethe set print current-vmid setting to receive notifications in the console when the debugger stopsand the current VMID changes. You can also obtain the VMID within DS-5 scripts using the $vmiddebugger variable.
Related references11.6 Commands view on page 11-275.
Related informationDS-5 Debugger commands.
6 Debugging Embedded Systems6.5 About debugging hypervisors
ARM DUI0446Z Copyright © 2010-2016 ARM Limited or its affiliates. All rightsreserved.
6-148
Non-Confidential
6.6 About debugging big.LITTLE systems
A big.LITTLE system is designed to optimize both high performance and low power consumption over awide variety of workloads. It achieves this by including one or more high performance processorsalongside one or more low power processors. The system transitions the workload between theprocessors as necessary to achieve this goal.
big.LITTLE systems are typically configured in a Symmetric MultiProcessing (SMP) configuration. Anoperating system or hypervisor controls which processors are powered up or down at any given time andassists in migrating tasks between them.
For bare-metal debugging on big.LITTLE systems, you can establish an SMP connection within DS-5Debugger. In this case all the processors in the system are brought under the control of the debugger. Thedebugger monitors the power state of each processor as it runs and displays it in the Debug Controlview and on the command -line. Processors that are powered-down are visible to the debugger but cannotbe accessed.
For Linux application debugging on big.LITTLE systems, you can establish a gdbserver connectionwithin DS-5 Debugger. Linux applications are typically unaware of whether they are running on a bigprocessor or a little processor because this is hidden by the operating system. There is therefore nodifference within the debugger when debugging a Linux application on a big.LITTLE system ascompared to application debug on any other system.
Related concepts6.7 About debugging bare-metal symmetric multiprocessing systems on page 6-150.
Related references11.6 Commands view on page 11-275.
Related informationDS-5 Debugger commands.
6 Debugging Embedded Systems6.6 About debugging big.LITTLE systems
ARM DUI0446Z Copyright © 2010-2016 ARM Limited or its affiliates. All rightsreserved.
6-149
Non-Confidential
6.7 About debugging bare-metal symmetric multiprocessing systems
DS-5 Debugger supports debugging bare-metal Symmetric MultiProcessing (SMP) systems. Thedebugger expects an SMP system to meet the following requirements:• The same ELF image running on all processors.• All processors must have identical debug hardware. For example, the number of hardware breakpoint
and watchpoint resources must be identical.• Breakpoints and watchpoints must only be set in regions where all processors have identical memory
maps, both physical and virtual. Processors with different instance of identical peripherals mapped atthe same address are considered to meet this requirement, as in the case of the private peripherals ofARM multicore processors.
Configuring and connecting
To enable SMP support in the debugger you must first configure a debug session in the DebugConfigurations dialog. Targets that support SMP debugging are identified by having SMP mentioned inthe Debug operation drop-down list.
Configuring a single SMP connection is all you require to enable SMP support in the debugger. Onconnection, you can then debug all of the SMP processors in your system by selecting them in the DebugControl view.
Note
It is recommended to always use an SMP connection when debugging an SMP system. Using a single-core connection instead of an SMP connection might result in other cores halting on softwarebreakpoints with no way to resume them.
Image and symbol loading
When debugging an SMP system, image and symbol loading operations apply to all the SMP processors.For image loading, this means that the image code and data are written to memory once through one ofthe processors, and are assumed to be accessible through the other processors at the same addressbecause they share the same memory. For symbol loading, this means that debug information is loadedonce and is available when debugging any of the processors.
Running, stopping and stepping
When debugging an SMP system, attempting to run one processor automatically starts running all theother processors in the system. Similarly, when one processor stops (either because you requested it orbecause of an event such as a breakpoint being hit), then all processors in the system stop.
For instruction level single-stepping (stepi and nexti commands), then the currently selected processorsteps one instruction. The exception to this is when a nexti operation is required to step over a functioncall in which case the debugger sets a breakpoint and then runs all processors. All other steppingcommands affect all processors.
Depending on your system, there might be a delay between one processor running or stopping andanother processor running or stopping. This delay can be very large because the debugger must manuallyrun and stop all the processors individually.
In rare cases, one processor might stop and one or more of the others fails to stop in response. This canoccur, for example, when a processor running code in secure mode has temporarily disabled debugability. When this occurs, the Debug Control view displays the individual state of each processor(running or stopped), so that you can see which ones have failed to stop. Subsequent run and stepoperations might not operate correctly until all the processors stop.
6 Debugging Embedded Systems6.7 About debugging bare-metal symmetric multiprocessing systems
ARM DUI0446Z Copyright © 2010-2016 ARM Limited or its affiliates. All rightsreserved.
6-150
Non-Confidential
Breakpoints, watchpoints, and signals
By default, when debugging an SMP system, breakpoint, watchpoint, and signal (vector catch)operations apply to all processors. This means that you can set one breakpoint to trigger when any of theprocessors execute code that meets the criteria. When the debugger stops due to a breakpoint,watchpoint, or signal, then the processor that causes the event is listed in the Commands view.
Breakpoints or watchpoints can be configured for one or more processors by selecting the requiredprocessor in the relevant Properties dialog box. Alternatively, you can use the break-stop-on-corescommand. This feature is not available for signals.
Examining target state
Views of the target state, including registers, call stack, memory, disassembly, expressions, and variablescontain content that is specific to a processor.
Views such as breakpoints, signals and commands are shared by all the processors in the SMP system,and display the same contents regardless of which processor is currently selected.
Trace
When you are using a connection that enables trace support then you are able to view trace for each ofthe processors in your system. By default, the Trace view shows trace for the processor that is currentlyselected in the Debug Control view. Alternatively, you can choose to link a Trace view to a specificprocessor by using the Linked: context toolbar option for that Trace view. Creating multiple Traceviews linked to specific processors enables you to view the trace from multiple processors at the sametime. The indexes in the Trace views do not necessarily represent the same point in time for differentprocessors.
Related concepts6.6 About debugging big.LITTLE systems on page 6-149.16.3 About loading an image on to the target on page 16-497.16.4 About loading debug information into the debugger on page 16-499.
Related references3.13 Setting a tracepoint on page 3-89.3.8 Conditional breakpoints on page 3-81.3.9 Assigning conditions to an existing breakpoint on page 3-82.3.12 Pending breakpoints and watchpoints on page 3-87.3.2 Running, stopping, and stepping through an application on page 3-72.11.4 Breakpoints view on page 11-268.11.6 Commands view on page 11-275.11.9 Disassembly view on page 11-285.11.15 Memory view on page 11-302.11.17 Modules view on page 11-312.11.18 Registers view on page 11-314.11.28 Variables view on page 11-337.
Related informationDS-5 Debugger commands.
6 Debugging Embedded Systems6.7 About debugging bare-metal symmetric multiprocessing systems
ARM DUI0446Z Copyright © 2010-2016 ARM Limited or its affiliates. All rightsreserved.
6-151
Non-Confidential
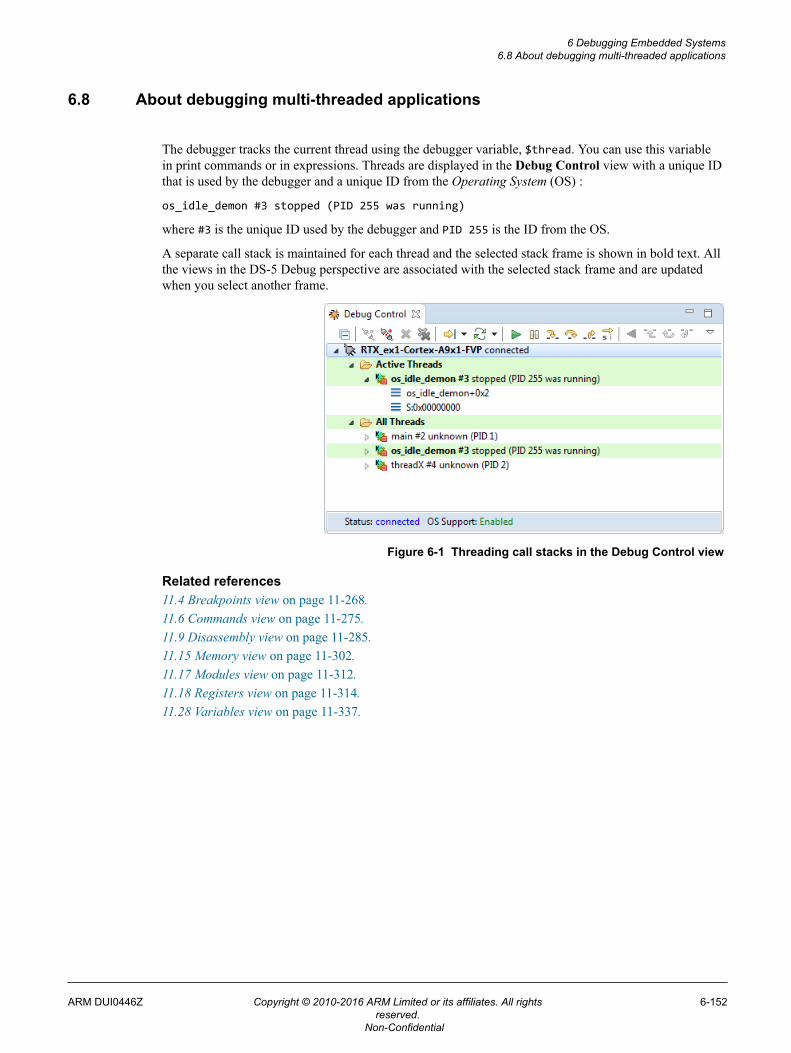
6.8 About debugging multi-threaded applications
The debugger tracks the current thread using the debugger variable, $thread. You can use this variablein print commands or in expressions. Threads are displayed in the Debug Control view with a unique IDthat is used by the debugger and a unique ID from the Operating System (OS) :
os_idle_demon #3 stopped (PID 255 was running)
where #3 is the unique ID used by the debugger and PID 255 is the ID from the OS.
A separate call stack is maintained for each thread and the selected stack frame is shown in bold text. Allthe views in the DS-5 Debug perspective are associated with the selected stack frame and are updatedwhen you select another frame.
Figure 6-1 Threading call stacks in the Debug Control view
Related references11.4 Breakpoints view on page 11-268.11.6 Commands view on page 11-275.11.9 Disassembly view on page 11-285.11.15 Memory view on page 11-302.11.17 Modules view on page 11-312.11.18 Registers view on page 11-314.11.28 Variables view on page 11-337.
6 Debugging Embedded Systems6.8 About debugging multi-threaded applications
ARM DUI0446Z Copyright © 2010-2016 ARM Limited or its affiliates. All rightsreserved.
6-152
Non-Confidential
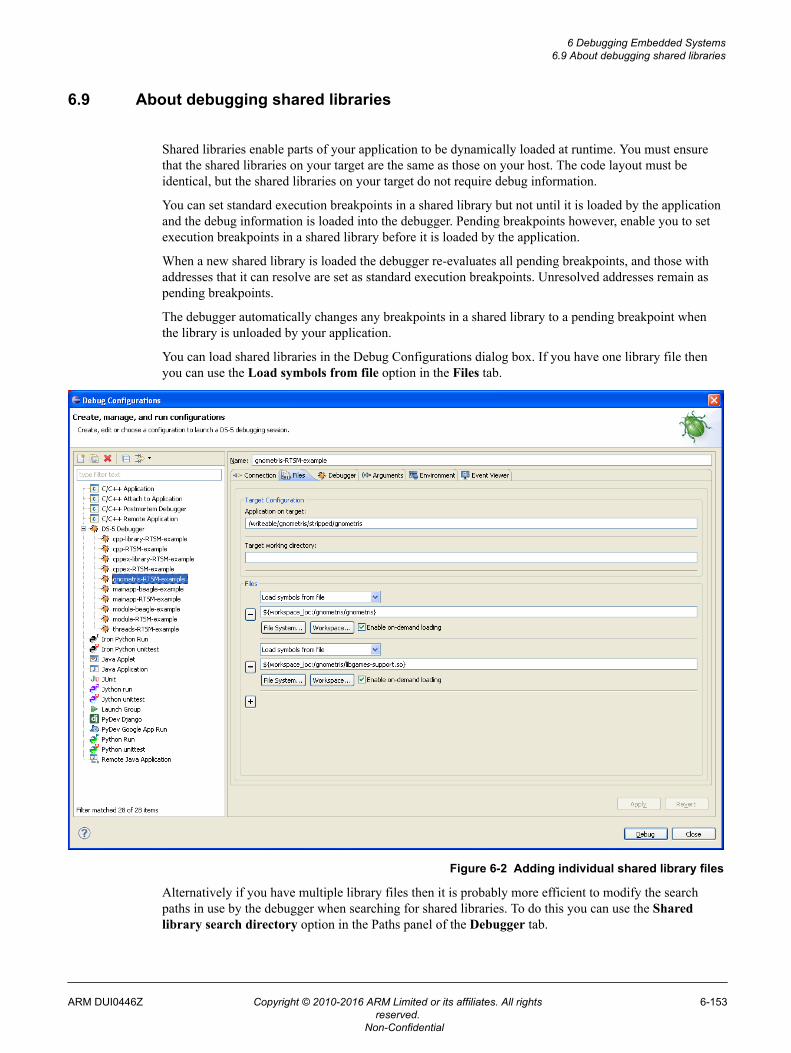
6.9 About debugging shared libraries
Shared libraries enable parts of your application to be dynamically loaded at runtime. You must ensurethat the shared libraries on your target are the same as those on your host. The code layout must beidentical, but the shared libraries on your target do not require debug information.
You can set standard execution breakpoints in a shared library but not until it is loaded by the applicationand the debug information is loaded into the debugger. Pending breakpoints however, enable you to setexecution breakpoints in a shared library before it is loaded by the application.
When a new shared library is loaded the debugger re-evaluates all pending breakpoints, and those withaddresses that it can resolve are set as standard execution breakpoints. Unresolved addresses remain aspending breakpoints.
The debugger automatically changes any breakpoints in a shared library to a pending breakpoint whenthe library is unloaded by your application.
You can load shared libraries in the Debug Configurations dialog box. If you have one library file thenyou can use the Load symbols from file option in the Files tab.
Figure 6-2 Adding individual shared library files
Alternatively if you have multiple library files then it is probably more efficient to modify the searchpaths in use by the debugger when searching for shared libraries. To do this you can use the Sharedlibrary search directory option in the Paths panel of the Debugger tab.
6 Debugging Embedded Systems6.9 About debugging shared libraries
ARM DUI0446Z Copyright © 2010-2016 ARM Limited or its affiliates. All rightsreserved.
6-153
Non-Confidential
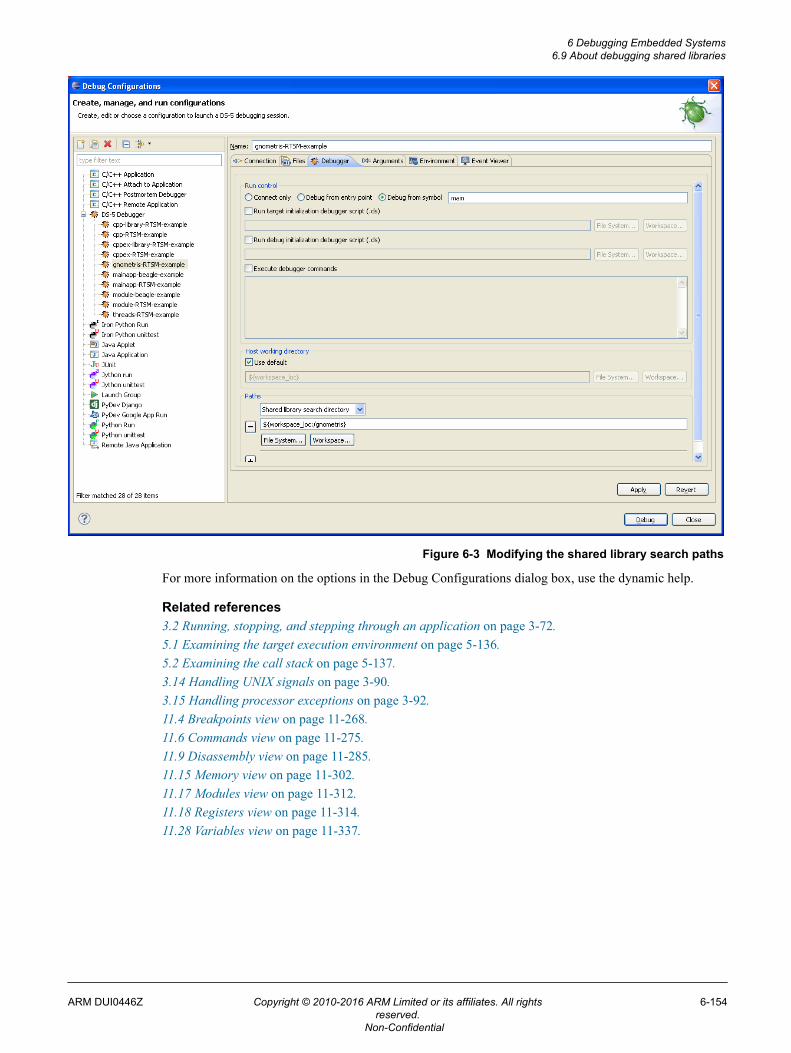
Figure 6-3 Modifying the shared library search paths
For more information on the options in the Debug Configurations dialog box, use the dynamic help.
Related references3.2 Running, stopping, and stepping through an application on page 3-72.5.1 Examining the target execution environment on page 5-136.5.2 Examining the call stack on page 5-137.3.14 Handling UNIX signals on page 3-90.3.15 Handling processor exceptions on page 3-92.11.4 Breakpoints view on page 11-268.11.6 Commands view on page 11-275.11.9 Disassembly view on page 11-285.11.15 Memory view on page 11-302.11.17 Modules view on page 11-312.11.18 Registers view on page 11-314.11.28 Variables view on page 11-337.
6 Debugging Embedded Systems6.9 About debugging shared libraries
ARM DUI0446Z Copyright © 2010-2016 ARM Limited or its affiliates. All rightsreserved.
6-154
Non-Confidential
6.10 About OS awareness
DS-5 provides support for a number of operating systems that can run on the target. This is called OSawareness and it provides a representation of the operating system threads and other relevant datastructures.
The OS awareness support in DS-5 Debugger depends on the OS version and the processor architectureon the target.
DS-5 Debugger provides OS awareness for:
• ThreadX 5.6: ARMv5, ARMv5T, ARMv5TE, ARMv5TEJ, ARMv6M, ARMv7M, ARMv7R,ARMv7A
• μC/OS-II 2.92: ARMv6M, ARMv7M, ARMv7R, ARMv7A• μC/OS-III 3.04: ARMv6M, ARMv7M, ARMv7R, ARMv7A• embOS 3.88: ARMv5, ARMv5T, ARMv5TE, ARMv5TEJ, ARMv6M, ARMv7M, ARMv7R,
ARMv7A• Keil CMSIS-RTOS RTX 4.7: Cortex-M0, Cortex-M0+, Cortex-M1, Cortex-M3, Cortex-M4, and
Cortex-A9 processors• FreeRTOS 8.0: ARMv6M, ARMv7M, ARMv7R, ARMv7A• Freescale MQX 4.0: Freescale-based Cortex-M4 and Cortex-A5 processors• Quadros RTXC 1.0.2: ARMv5, ARMv5T, ARMv5TE, ARMv5TEJ, ARMv7M, ARMv7R,
ARMv7A.• Nucleus RTOS 2014.06: ARMv5, ARMv5T, ARMv5TE, ARMv5TEJ, ARMv6M, ARMv7M,
ARMv7R, ARMv7A.• μC3 Standard: ARMv7R, ARMv7A.• μC3 Compact: ARMv6M, ARMv7M.
Note
• By default, OS awareness is not present for an architecture or processor that is not listed above.• OS awareness support for newer versions of the OS depends on the scope of changes to their internal
data structures.• OS awareness in DS-5 Debugger does not support the original non-CMSIS Keil RTX.• OS awareness for μC3 Standard requires you to set the vfp-flag parameter based on the --fpu
option that the μC3 Standard kernel was compiled with. You can set this using the OS Awareness tabin the Debug Configurations dialog box, or using the command set os vfp-flag. You can set thevalue to disabled, vfpv3_16, or vfpv3_32.
The Linux kernels that DS-5 Debugger provides OS awareness for are:• Linux 2.6.28, ARMv7A• Linux 2.6.38: ARMv7A• Linux 3.0: ARMv7A• Linux 3.11.0-rc6: ARMv7A• Linux 3.13.0-rc3: ARMv7A• Linux 3.6.0-rc6: ARMv7A• Linux 3.7.0: ARMv7A• Linux 3.9.0-rc3: ARMv7A• Linux 3.11.0-rc6: ARMv8A.
Note
Later versions of Linux are expected to work on ARMv7A and ARMv8A architectures.
This section contains the following subsections:• 6.10.1 About debugging FreeRTOS ™ on page 6-156.
6 Debugging Embedded Systems6.10 About OS awareness
ARM DUI0446Z Copyright © 2010-2016 ARM Limited or its affiliates. All rightsreserved.
6-155
Non-Confidential
• 6.10.2 About debugging a Linux kernel on page 6-156.• 6.10.3 About debugging Linux kernel modules on page 6-158.• 6.10.4 About debugging ThreadX on page 6-159.
6.10.1 About debugging FreeRTOS ™
FreeRTOS is an open-source real-time operating system.
DS-5 Debugger provides the following support for debugging FreeRTOS:• Supports FreeRTOS on Cortex-M cores.• View FreeRTOS tasks in the Debug Control view.• View FreeRTOS tasks and queues in the RTOS Data view.
To enable FreeRTOS support in DS-5™ Debugger, in the Debug Configuration dialog, select FreeRTOSin the OS tab. Debugger support is activated when FreeRTOS is initialized on the target device.
Note
Operating system support in the debugger is activated only when OS-specific debug symbols are loaded.Ensure that the debug symbols for the operating system are loaded before using any of the OS-specificviews and commands.
When building your FreeRTOS image, ensure that the following compiler flags are set:• -DportREMOVE_STATIC_QUALIFIER• -DINCLUDE_xTaskGetIdleTaskHandle• -DconfigQUEUE_REGISTRY_SIZE=n (where n >= 1)
If these flags are set incorrectly, FreeRTOS support might fail to activate in DS-5 Debugger. See thedocumentation supplied with FreeRTOS to view the details of these flags.
6.10.2 About debugging a Linux kernel
DS-5 supports source level debugging of a Linux kernel. The Linux kernel (and associated devicedrivers) can be debugged in the same way as a standard ELF format executable. For example, you can setbreakpoints in the kernel code, step through the source, inspect the call stack, and watch variables.
Note
User space parameters (marked __user) that are not currently mapped in cannot be read by the debugger.
To debug the kernel:1. Compile the kernel source using the following options:
• CONFIG_DEBUG_KERNEL=yEnables the kernel debug options.• CONFIG_DEBUG_INFO=yBuilds vmlinux with debugging information.• CONFIG_DEBUG_INFO_REDUCED=nIncludes full debugging information when compiling the kernel.• CONFIG_PERF_EVENTS=n
Disables the performance events subsystem. Some implementations of the performance eventssubsystem internally make use of hardware breakpoints, disrupting the use of hardwarebreakpoints set by the debugger. It is recommended to disable this option if you observe thedebugger failing to hit hardware breakpoints or failing to report kernel module load and unloadevents.
Note
If you are working with Streamline, this option must be enabled.
6 Debugging Embedded Systems6.10 About OS awareness
ARM DUI0446Z Copyright © 2010-2016 ARM Limited or its affiliates. All rightsreserved.
6-156
Non-Confidential
Compiling the kernel source generates a Linux kernel image and symbol files which contain debuginformation.
Note
Be aware that:• Other options might be required depending on the type of debugging you want to perform. Check
the kernel documentation for details.• A Linux kernel is always compiled with full optimizations and inlining enabled, therefore:
— Stepping through code might not work as expected due to the possible reordering of someinstructions.
— Some variables might be optimized out by the compiler and therefore not be available for thedebugger.
2. Load the Linux kernel on to the target.3. Load kernel debug information into the debugger.
Note
If the Linux kernel you are debugging runs on multiple cores, then it is recommended to select anSMP connection type when connecting the debugger. Using a single-core connection instead of anSMP connection might result in other cores halting on software breakpoints with no way to resumethem.
4. Debug the kernel as required.
Related concepts6.10.3 About debugging Linux kernel modules on page 6-158.6.7 About debugging bare-metal symmetric multiprocessing systems on page 6-150.
Related tasks2.6 Configuring a connection to a Linux kernel on page 2-48.
Related references3.2 Running, stopping, and stepping through an application on page 3-72.5.1 Examining the target execution environment on page 5-136.5.2 Examining the call stack on page 5-137.3.14 Handling UNIX signals on page 3-90.3.15 Handling processor exceptions on page 3-92.11.41 Debug Configurations - Files tab on page 11-361.11.42 Debug Configurations - Debugger tab on page 11-364.11.4 Breakpoints view on page 11-268.11.6 Commands view on page 11-275.11.9 Disassembly view on page 11-285.11.15 Memory view on page 11-302.11.17 Modules view on page 11-312.11.18 Registers view on page 11-314.11.28 Variables view on page 11-337.
Related informationDebugging a loadable kernel module.
6 Debugging Embedded Systems6.10 About OS awareness
ARM DUI0446Z Copyright © 2010-2016 ARM Limited or its affiliates. All rightsreserved.
6-157
Non-Confidential
6.10.3 About debugging Linux kernel modules
Linux kernel modules provide a way to extend the functionality of the kernel, and are typically used forthings such as device and file system drivers. Modules can either be built into the kernel or can becompiled as a loadable module and then dynamically inserted and removed from a running kernel duringdevelopment without having to frequently recompile the kernel. However, some modules must be builtinto the kernel and are not suitable for loading dynamically. An example of a built-in module is one thatis required during kernel boot and must be available prior to the root file system being mounted.
You can set source-level breakpoints in a module after loading the module debug information into thedebugger. For example, you can load the debug information using add-symbol-file modex.ko. To set asource-level breakpoint in a module before it is loaded into the kernel, use break -p to create a pendingbreakpoint. When the kernel loads the module, the debugger loads the symbols and applies the pendingbreakpoint.
When debugging a module, you must ensure that the module on your target is the same as that on yourhost. The code layout must be identical, but the module on your target does not require debuginformation.
Built-in moduleTo debug a module that has been built into the kernel, the procedure is the same as for debugging thekernel itself:1. Compile the kernel together with the module.2. Load the kernel image on to the target.3. Load the related kernel image with debug information into the debugger4. Debug the module as you would for any other kernel code.
Built-in (statically linked) modules are indistinguishable from the rest of the kernel code, so are not listedby the info os-modules command and do not appear in the Modules view.
Loadable moduleThe procedure for debugging a loadable kernel module is more complex. From a Linux terminal shell,you can use the insmod and rmmod commands to insert and remove a module. Debug information forboth the kernel and the loadable module must be loaded into the debugger. When you insert and removea module the debugger automatically resolves memory locations for debug information and existingbreakpoints. To do this, the debugger intercepts calls within the kernel to insert and remove modules.This introduces a small delay for each action whilst the debugger stops the kernel to interrogate variousdata structures. For more information on debugging a loadable kernel module, see the tutorial in GettingStarted with DS-5.
Note
A connection must be established and Operating System (OS) support enabled within the debuggerbefore a loadable module can be detected. OS support is automatically enabled when a Linux kernelimage is loaded into the debugger. However, you can manually control this by using the set oscommand.
Related concepts6.10.2 About debugging a Linux kernel on page 6-156.6.7 About debugging bare-metal symmetric multiprocessing systems on page 6-150.
Related tasks2.6 Configuring a connection to a Linux kernel on page 2-48.
Related references3.2 Running, stopping, and stepping through an application on page 3-72.
6 Debugging Embedded Systems6.10 About OS awareness
ARM DUI0446Z Copyright © 2010-2016 ARM Limited or its affiliates. All rightsreserved.
6-158
Non-Confidential
5.1 Examining the target execution environment on page 5-136.5.2 Examining the call stack on page 5-137.3.14 Handling UNIX signals on page 3-90.3.15 Handling processor exceptions on page 3-92.11.4 Breakpoints view on page 11-268.11.6 Commands view on page 11-275.11.9 Disassembly view on page 11-285.11.15 Memory view on page 11-302.11.17 Modules view on page 11-312.11.18 Registers view on page 11-314.11.28 Variables view on page 11-337.
Related informationDebugging a loadable kernel module.
6.10.4 About debugging ThreadX
ThreadX is a real-time operating system from Express Logic, Inc.
DS-5 Debugger provides the following ThreadX RTOS visibility:• Comprehensive thread list with thread status and objects on which the threads are blocked/suspended.• All major ThreadX objects including semaphores, mutexes, memory pools, message queues, event
flags, and timers.• Stack usage for individual threads.• Call frames and local variables for all threads.
To enable ThreadX support in DS-5 Debugger, in the Debug Configuration dialog, select ThreadX inthe OS Awareness tab. ThreadX OS awareness is activated when ThreadX is initialized on the targetdevice.
6 Debugging Embedded Systems6.10 About OS awareness
ARM DUI0446Z Copyright © 2010-2016 ARM Limited or its affiliates. All rightsreserved.
6-159
Non-Confidential
6.11 About debugging TrustZone enabled targets
ARM TrustZone® is a security technology designed into some ARM processors. For example, theCortex™-A class processors. It segments execution and resources such as memory and peripherals intosecure and normal worlds.
When connected to a target that supports TrustZone and where access to the secure world is permitted,then the debugger provides access to both secure and normal worlds. In this case, all addresses andaddress-related operations are specific to a single world. This means that any commands you use thatrequire an address or expression must also specify the world that they apply to, with a prefix. Forexample N:0x1000 or S:0x1000.
Where:
N:For an address in Normal World memory.
S:For an address in Secure World memory.
If you want to specify an address in the current world, then you can omit the prefix.
When loading images and debug information it is important that you load them into the correct world.The debug launcher panel does not provide a way to directly specify an address world for images anddebug information, so to achieve this you must use scripting commands instead. The Debugger tab in thedebugger launcher panel provides an option to run a debug initialization script or a set of arbitrarydebugger commands on connection. Here are some example commands:• Load image only to normal world (applying zero offset to addresses in the image)
load myimage.axf N:0
• Load debug information only to secure world (applying zero offset to addresses in the debuginformation)
file myimage.axf S:0
• Load image and debug information to secure world (applying zero offset to addresses)
loadfile myimage.axf S:0
When an operation such as loading debug symbols or setting a breakpoint needs to apply to both normaland secure worlds then you must perform the operation twice, once for the normal world and once for thesecure world.
Registers such as $PC have no world. To access the content of memory from an address in a register thatis not in the current world, you can use an expression, N:0+$PC. This is generally not necessary forexpressions involving debug information, because these are associated with a world when they areloaded.
Related references11.4 Breakpoints view on page 11-268.11.6 Commands view on page 11-275.11.9 Disassembly view on page 11-285.11.15 Memory view on page 11-302.11.17 Modules view on page 11-312.11.18 Registers view on page 11-314.11.28 Variables view on page 11-337.
Related informationDS-5 Debugger commands.
6 Debugging Embedded Systems6.11 About debugging TrustZone enabled targets
ARM DUI0446Z Copyright © 2010-2016 ARM Limited or its affiliates. All rightsreserved.
6-160
Non-Confidential

ARM Security Technology Building a Secure System using TrustZone Technology.Technical Reference Manual.Architecture Reference Manual.
6 Debugging Embedded Systems6.11 About debugging TrustZone enabled targets
ARM DUI0446Z Copyright © 2010-2016 ARM Limited or its affiliates. All rightsreserved.
6-161
Non-Confidential
6.12 About debugging a Unified Extensible Firmware Interface (UEFI)UEFI defines a software interface to control the start-up of complex microprocessor systems. UEFI onARM allows you to control the booting of ARM-based servers and client computing devices.
DS-5 provides a complete UEFI development environment which enables you to:• Fetch the UEFI source code via the Eclipse Git plug-in.• Build the source code using ARM Compiler.• Download the executables to a software model (a Cortex-A9x4 FVP is provided with DS-5) or to a
hardware target (available separately).• Run/debug the code using DS-5 Debugger.• Debug dynamically loaded modules at source-level using Jython scripts.
For more information, see this blog: UEFI Debug Made Easy
6 Debugging Embedded Systems6.12 About debugging a Unified Extensible Firmware Interface (UEFI)
ARM DUI0446Z Copyright © 2010-2016 ARM Limited or its affiliates. All rightsreserved.
6-162
Non-Confidential
6.13 About debugging MMUsDS-5 Debugger provides various features to debug Memory Management Unit (MMU) related issues.
A Memory Management Unit is a hardware feature that controls virtual to physical address translation,access permissions, and memory attributes. The MMU is configured by system control registers andtranslation tables stored in memory.
A device can contain any number of MMUs. If a device has cascaded MMUs, then the output address ofone MMU is used as the input address to another MMU. A given translation depends on the context inwhich it occurs and the set of MMUs that it passes through.
For example, a processor that implements the ARMv7A hypervisor extensions, such as Cortex-A15,includes at least three MMUs. Typically one is used for hypervisor memory, one for virtualization andone for normal memory accesses within an OS. When in hypervisor state, memory accesses pass onlythrough the hypervisor MMU. When in normal state, memory accesses pass first through the normalMMU and then through the virtualization MMU. For more information see the ARM ArchitectureReference Manual.
DS-5 Debugger provides visibility of MMU translation tables for some versions of the ARMArchitecture. To help you debug MMU related issues, DS-5 Debugger enables you to:• Convert a virtual address to a physical address.• Convert a physical address to a virtual address.• View the MMU configuration registers and override their values.• View the translation tables as a tree structure.• View the virtual memory layout and attributes as a table.
You can access these features using the MMU view in the graphical debugger or using the MMUcommands from the command line.
Cache and MMU data in DS-5 Debugger
In some specific circumstances, DS-5 Debugger cannot provide a fully accurate view of the translationtables due to its limited visibility of the target state.
The MMU hardware on the target performs a translation table walk by doing one or more translationtable lookups. These lookups require accessing memory by physical address (or intermediate physicaladdress for two stage translations). However, to read or modify translation table entries, the CPUaccesses memory by virtual address. In each of these cases, the accessed translation table entries arepermitted to reside in the CPU's data caches. This means that if a translation table entry resides in aregion of memory marked as write-back cacheable and the CPU's data cache is enabled, then anymodification to a translation table entry might not be written to the physical memory immediately. This isnot a problem for the MMU hardware, which has awareness of the CPU's data caches.
To perform translation tables walks, DS-5 Debugger must also access memory by physical address. Itdoes this by disabling the MMU. Because the MMU is disabled, these memory accesses might not takeinto account the contents of CPU's data caches. Hence these physical memory accesses might return staledata.
To avoid stale translation tables entries in DS-5 Debugger:• When walking translation tables where the debugger has data cache awareness, you can enable cache-
aware physical memory accesses. Use the command:
set mmu use-cache-for-phys-reads true• If you think that the translation table entries contain stale data, then you can use the debugger to
manually clean and invalidate the contents of the CPU caches. Use the command:
6 Debugging Embedded Systems6.13 About debugging MMUs
ARM DUI0446Z Copyright © 2010-2016 ARM Limited or its affiliates. All rightsreserved.
6-163
Non-Confidential
cache flush Note
Flushing large caches might take a long time.
Related concepts6.16 About debugging caches on page 6-167.
Related references11.16 MMU view on page 11-308.
Related informationDS-5 Debugger MMU commands.
6 Debugging Embedded Systems6.13 About debugging MMUs
ARM DUI0446Z Copyright © 2010-2016 ARM Limited or its affiliates. All rightsreserved.
6-164
Non-Confidential
6.14 About Debug and Trace Services Layer (DTSL)Debug and Trace Services Layer (DTSL) is a software layer within the DS-5 Debugger stack. It sitsbetween the debugger and the RDDI target access API.
DTSL takes responsibility for:
• Low level debugger component creation and configuration. For example, CoreSight componentconfiguration, which can also involve live re-configuration.
• Target access and debug control.• Capture and control of trace data with:
— in-target trace capture components, such as ETB— off-target trace capture device, such as DSTREAM™.
• Delivery of trace streams to the debugger or other 3rd party trace consumers.
DTSL is implemented as a set of Java classes which are typically implemented (and possibly extended)by Jython scripts. A typical DTSL instance is a combination of Java and Jython.
A simple example of this is when DTSL connects to a simple platform containing a Cortex-A8, ETM,and ETB. When the DTSL connection is activated it runs a Jython script to create the DTSLconfiguration. This configuration is populated with a Java Device object called Cortex-A8, aTraceSource object called ETM, and a TraceCaptureDevice object called ETB. The Debugger, or anotherprogram using DTSL, can then access the DTSL configuration to retrieve these objects and performdebug and trace operations.
Note
DTSL Jython Scripting should not be confused with DS-5 Debugger Jython Scripting. They both useJython but operate at different levels within the software stack. It is however possible for a debuggerJython Script to use DTSL functionality.
ARM has made DTSL available for your own use so that you can create Java or Jython programs toaccess and control the target platform.
For details, see the DTSL documents and files provided with DS-5 here:
<DS-5 Install folder>\sw\DTSL
Related referencesChapter 15 Debug and Trace Services Layer (DTSL) on page 15-439.
6 Debugging Embedded Systems6.14 About Debug and Trace Services Layer (DTSL)
ARM DUI0446Z Copyright © 2010-2016 ARM Limited or its affiliates. All rightsreserved.
6-165
Non-Confidential
6.15 About CoreSight™ Target Access LibraryCoreSight on-target access library allows you to interact directly with CoreSight devices. This supportsuse-cases such as enabling flight-recorder trace in a production system without the need to connect anexternal debugger.
The library offers a flexible programming interface allowing a variety of use cases and experimentation.
It also offers some advantages compared to a register-level interface. For example, it can:• Manage any unlocking and locking of CoreSight devices via the lock register, OS Lock register,
programming bit, power-down bit.• Attempt to ensure that the devices are programmed correctly and in a suitable sequence.• Handle variations between devices, and where necessary, work around known issues. For example,
between variants of ETM/PTMs.• Become aware of the trace bus topology and can generally manage trace links automatically. For
example enabling only funnel ports in use.• Manage “claim bits” that coordinate internal and external use of CoreSight devices.
For details, see the CoreSight example provided with DS-5 here:
<DS-5 Install folder>/examples/CoreSight_Access_Library.zip
6 Debugging Embedded Systems6.15 About CoreSight™ Target Access Library
ARM DUI0446Z Copyright © 2010-2016 ARM Limited or its affiliates. All rightsreserved.
6-166
Non-Confidential
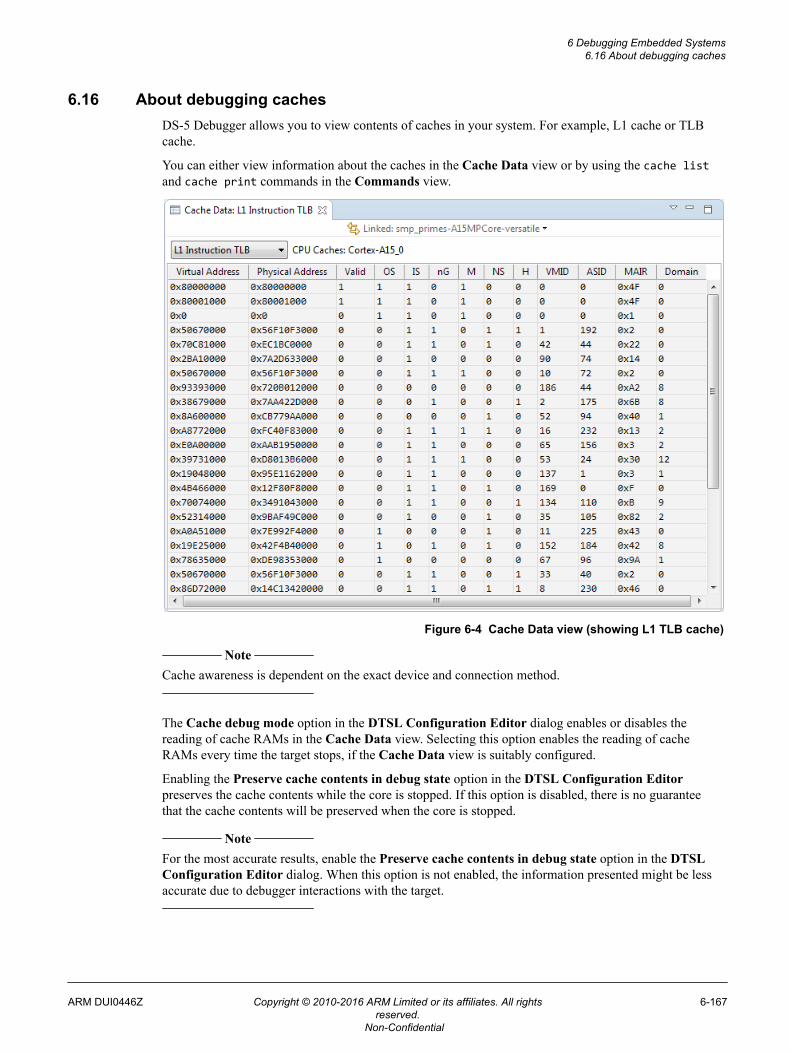
6.16 About debugging cachesDS-5 Debugger allows you to view contents of caches in your system. For example, L1 cache or TLBcache.
You can either view information about the caches in the Cache Data view or by using the cache listand cache print commands in the Commands view.
Figure 6-4 Cache Data view (showing L1 TLB cache)
Note
Cache awareness is dependent on the exact device and connection method.
The Cache debug mode option in the DTSL Configuration Editor dialog enables or disables thereading of cache RAMs in the Cache Data view. Selecting this option enables the reading of cacheRAMs every time the target stops, if the Cache Data view is suitably configured.
Enabling the Preserve cache contents in debug state option in the DTSL Configuration Editorpreserves the cache contents while the core is stopped. If this option is disabled, there is no guaranteethat the cache contents will be preserved when the core is stopped.
Note
For the most accurate results, enable the Preserve cache contents in debug state option in the DTSLConfiguration Editor dialog. When this option is not enabled, the information presented might be lessaccurate due to debugger interactions with the target.
6 Debugging Embedded Systems6.16 About debugging caches
ARM DUI0446Z Copyright © 2010-2016 ARM Limited or its affiliates. All rightsreserved.
6-167
Non-Confidential
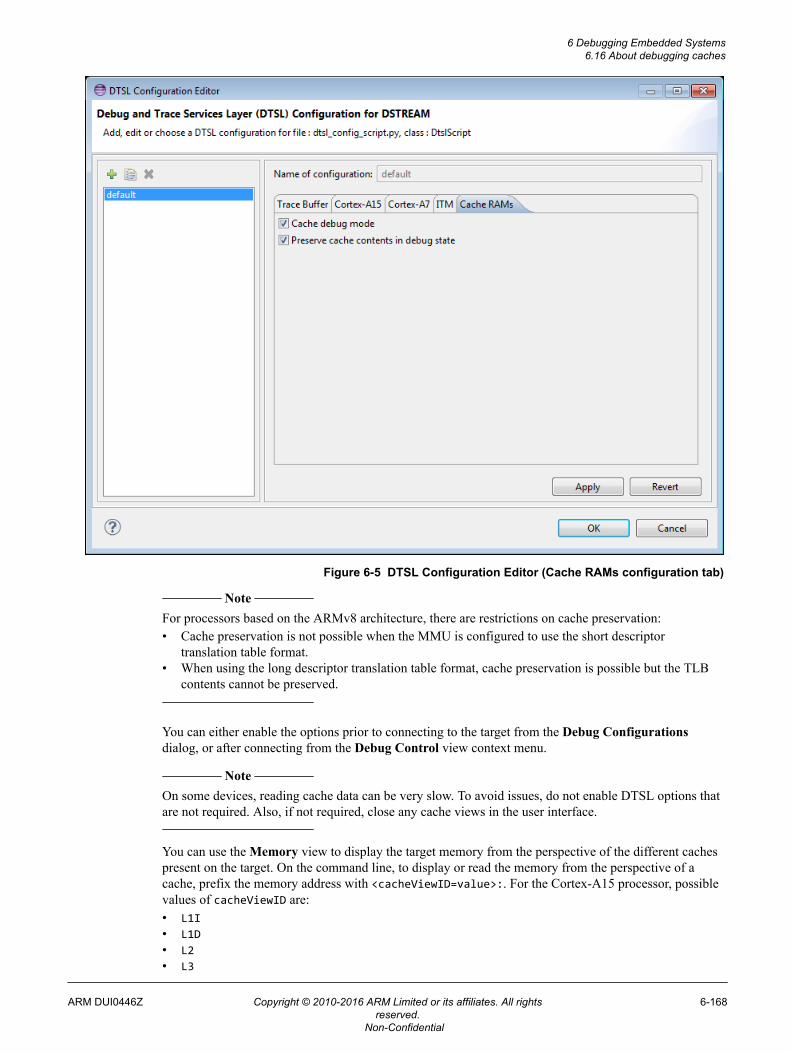
Figure 6-5 DTSL Configuration Editor (Cache RAMs configuration tab)
Note
For processors based on the ARMv8 architecture, there are restrictions on cache preservation:• Cache preservation is not possible when the MMU is configured to use the short descriptor
translation table format.• When using the long descriptor translation table format, cache preservation is possible but the TLB
contents cannot be preserved.
You can either enable the options prior to connecting to the target from the Debug Configurationsdialog, or after connecting from the Debug Control view context menu.
Note
On some devices, reading cache data can be very slow. To avoid issues, do not enable DTSL options thatare not required. Also, if not required, close any cache views in the user interface.
You can use the Memory view to display the target memory from the perspective of the different cachespresent on the target. On the command line, to display or read the memory from the perspective of acache, prefix the memory address with <cacheViewID=value>:. For the Cortex-A15 processor, possiblevalues of cacheViewID are:• L1I• L1D• L2• L3
6 Debugging Embedded Systems6.16 About debugging caches
ARM DUI0446Z Copyright © 2010-2016 ARM Limited or its affiliates. All rightsreserved.
6-168
Non-Confidential
For example:
# Display memory from address 0x9000 from the perspective of the L1D cache.x/16w N<cacheViewID=L1D>:0x9000
# Dump memory to myFile.bin, from address 0x80009000 from the perspective of the L2 cache.dump binary memory myFile.bin S<cacheViewID=L2>:0x80009000 0x10000
# Append to myFile.bin, memory from address 0x80009000 from the perspective of the L3 cache.append memory myFile.bin <cacheViewID=L3>:0x80009000 0x10000
Related references11.21 Cache Data view on page 11-321.11.15 Memory view on page 11-302.11.46 DTSL Configuration Editor dialog box on page 11-372.
Related informationDS-5 Debugger cache commands.DS-5 Debugger memory commands.
6 Debugging Embedded Systems6.16 About debugging caches
ARM DUI0446Z Copyright © 2010-2016 ARM Limited or its affiliates. All rightsreserved.
6-169
Non-Confidential
6.17 About DS-5 Debugger support for overlaysOverlaying is a programming method that allows applications to share execution regions of memorybetween different pieces of code at runtime. A piece of code can be transferred to the overlay region tobe executed when needed. This piece of code is replaced with another when needed.
Code does not need to be stored in memory and could reside in other storage such as off-chip flashmemory. Embedded systems, especially systems without support for virtual memory addressing andsystems with limited memory, sometimes use overlays.
An overlaid application consists of:
• Several overlays – These are blocks of code that are not resident in memory all the time.• The overlay manager (must be part of the non-overlaid code) – The overlay manager takes care of
loading and unloading different overlays as they are needed.• Several overlay regions – These are regions in memory that overlays are loaded into as needed. Each
overlay region can contain different overlays at different times.• Some non-overlaid code – This is code that is permanently resident in memory.• Data (both RO and RW) – Data is never overlaid.
As a developer, you must decide which functions from your application are used in overlays. You mustalso decide which functions are used in the same overlay.
You can specify the functions to overlay by annotating the function declarations in your source code. Theannotation indicates which overlay each function must be in.
During compilation, the linker assigns overlays to a particular region. When overlays are loaded, it canonly be loaded into that region. The linker also detects direct calls between overlays, and betweenoverlays and non-overlaid code. The linker then redirects the calls through veneers, which call theoverlay manager to automatically load the target overlay.
DS-5 Debugger automatically enables overlay support on the presence of linker generated tables andfunctions as described by the following symbols:
• Region$$Count$$AutoOverlay• LoadAddr$$Table$$AutoOverlay• CurrLoad$$Table$$AutoOverlay• __ARM_notify_overlay_loaded
After loading your overlay-enabled application in DS-5, you can work with overlays from both thecommand-line console and from the user interface:• To see detailed information about the currently loaded overlays and the functions within each overlay,
use the Overlays on page 11-320 view. You can also use the info overlays command to viewinformation about the currently loaded overlays and functions within each overlay.
• To enable or disable overlay support, use the set overlays enable command with the on, off, orauto options. The default setting is auto.
See the overlay_manager example that is provided with DS-5 for a reference implementation ofoverlays.
Related references11.20 Overlays view on page 11-320.
Related informationDS-5 Debugger command: info overlays.DS-5 Debugger command: set overlays enabled.
6 Debugging Embedded Systems6.17 About DS-5 Debugger support for overlays
ARM DUI0446Z Copyright © 2010-2016 ARM Limited or its affiliates. All rightsreserved.
6-170
Non-Confidential
Chapter 7Debugging with Scripts
Describes how to use scripts containing debugger commands to enable you to automate debuggingoperations.
It contains the following sections:• 7.1 Exporting DS-5 Debugger commands generated during a debug session on page 7-172.• 7.2 Creating a DS-5 Debugger script on page 7-173.• 7.3 Creating a CMM-style script on page 7-174.• 7.4 Support for importing and translating CMM scripts on page 7-175.• 7.5 About Jython scripts on page 7-177.• 7.6 Jython script concepts and interfaces on page 7-179.• 7.7 Creating Jython projects in Eclipse for DS-5 on page 7-180.• 7.8 Creating a Jython script on page 7-183.• 7.9 Running a script on page 7-185.• 7.10 Use case scripts on page 7-187.• 7.11 Metadata for use case scripts on page 7-188.• 7.12 Definition block for use case scripts on page 7-189.• 7.13 Defining the Run method for use case scripts on page 7-191.• 7.14 Defining the options for use case scripts on page 7-192.• 7.15 Defining the validation method for use case scripts on page 7-195.• 7.16 Example use case script definition on page 7-196.• 7.17 Multiple use cases in a single script on page 7-197.• 7.18 usecase list command on page 7-198.• 7.19 usecase help command on page 7-199.• 7.20 usecase run command on page 7-200.
ARM DUI0446Z Copyright © 2010-2016 ARM Limited or its affiliates. All rightsreserved.
7-171
Non-Confidential
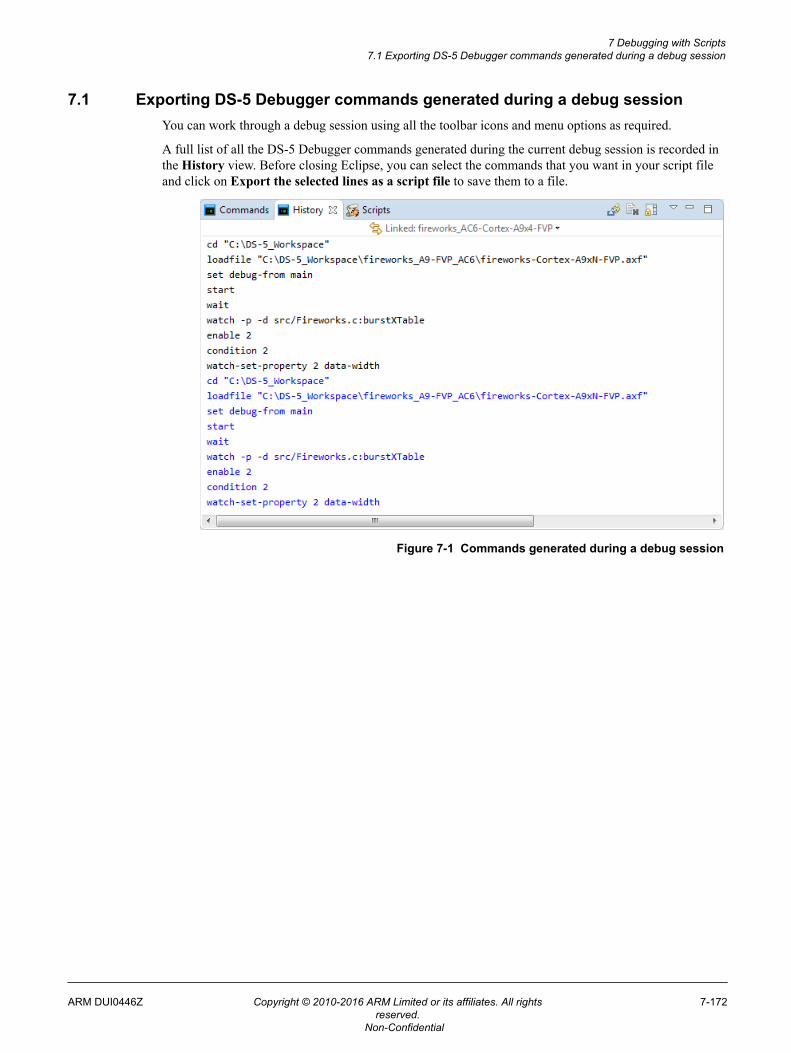
7.1 Exporting DS-5 Debugger commands generated during a debug sessionYou can work through a debug session using all the toolbar icons and menu options as required.
A full list of all the DS-5 Debugger commands generated during the current debug session is recorded inthe History view. Before closing Eclipse, you can select the commands that you want in your script fileand click on Export the selected lines as a script file to save them to a file.
Figure 7-1 Commands generated during a debug session
7 Debugging with Scripts7.1 Exporting DS-5 Debugger commands generated during a debug session
ARM DUI0446Z Copyright © 2010-2016 ARM Limited or its affiliates. All rightsreserved.
7-172
Non-Confidential
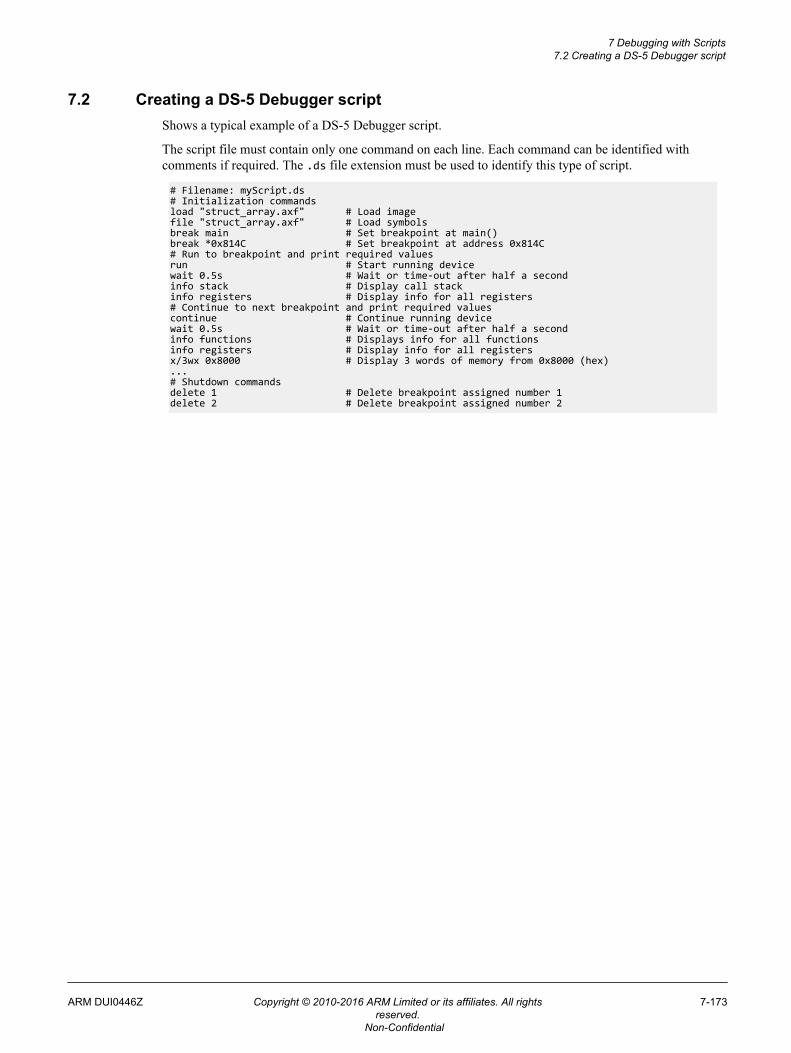
7.2 Creating a DS-5 Debugger scriptShows a typical example of a DS-5 Debugger script.
The script file must contain only one command on each line. Each command can be identified withcomments if required. The .ds file extension must be used to identify this type of script.
# Filename: myScript.ds# Initialization commandsload "struct_array.axf" # Load imagefile "struct_array.axf" # Load symbolsbreak main # Set breakpoint at main()break *0x814C # Set breakpoint at address 0x814C# Run to breakpoint and print required valuesrun # Start running devicewait 0.5s # Wait or time-out after half a secondinfo stack # Display call stackinfo registers # Display info for all registers# Continue to next breakpoint and print required valuescontinue # Continue running devicewait 0.5s # Wait or time-out after half a secondinfo functions # Displays info for all functionsinfo registers # Display info for all registersx/3wx 0x8000 # Display 3 words of memory from 0x8000 (hex)...# Shutdown commandsdelete 1 # Delete breakpoint assigned number 1delete 2 # Delete breakpoint assigned number 2
7 Debugging with Scripts7.2 Creating a DS-5 Debugger script
ARM DUI0446Z Copyright © 2010-2016 ARM Limited or its affiliates. All rightsreserved.
7-173
Non-Confidential
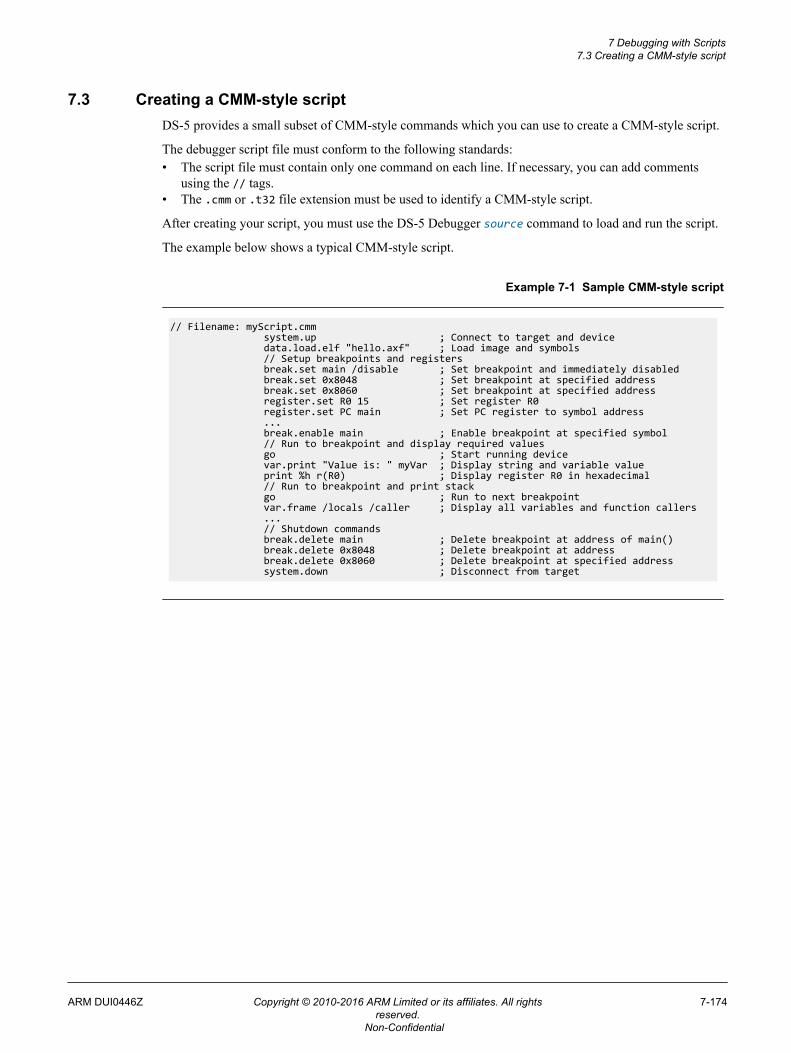
7.3 Creating a CMM-style scriptDS-5 provides a small subset of CMM-style commands which you can use to create a CMM-style script.
The debugger script file must conform to the following standards:• The script file must contain only one command on each line. If necessary, you can add comments
using the // tags.• The .cmm or .t32 file extension must be used to identify a CMM-style script.
After creating your script, you must use the DS-5 Debugger source command to load and run the script.
The example below shows a typical CMM-style script.
Example 7-1 Sample CMM-style script
// Filename: myScript.cmm system.up ; Connect to target and device data.load.elf "hello.axf" ; Load image and symbols // Setup breakpoints and registers break.set main /disable ; Set breakpoint and immediately disabled break.set 0x8048 ; Set breakpoint at specified address break.set 0x8060 ; Set breakpoint at specified address register.set R0 15 ; Set register R0 register.set PC main ; Set PC register to symbol address ... break.enable main ; Enable breakpoint at specified symbol // Run to breakpoint and display required values go ; Start running device var.print "Value is: " myVar ; Display string and variable value print %h r(R0) ; Display register R0 in hexadecimal // Run to breakpoint and print stack go ; Run to next breakpoint var.frame /locals /caller ; Display all variables and function callers ... // Shutdown commands break.delete main ; Delete breakpoint at address of main() break.delete 0x8048 ; Delete breakpoint at address break.delete 0x8060 ; Delete breakpoint at specified address system.down ; Disconnect from target
7 Debugging with Scripts7.3 Creating a CMM-style script
ARM DUI0446Z Copyright © 2010-2016 ARM Limited or its affiliates. All rightsreserved.
7-174
Non-Confidential
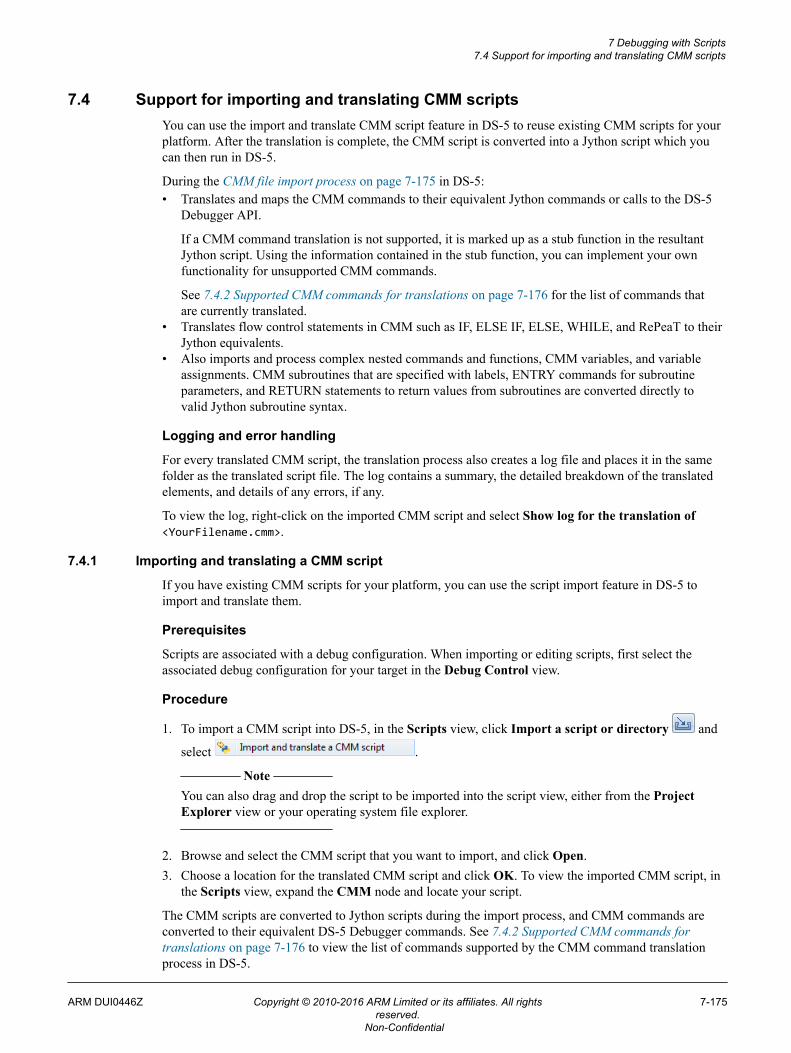
7.4 Support for importing and translating CMM scriptsYou can use the import and translate CMM script feature in DS-5 to reuse existing CMM scripts for yourplatform. After the translation is complete, the CMM script is converted into a Jython script which youcan then run in DS-5.
During the CMM file import process on page 7-175 in DS-5:• Translates and maps the CMM commands to their equivalent Jython commands or calls to the DS-5
Debugger API.
If a CMM command translation is not supported, it is marked up as a stub function in the resultantJython script. Using the information contained in the stub function, you can implement your ownfunctionality for unsupported CMM commands.
See 7.4.2 Supported CMM commands for translations on page 7-176 for the list of commands thatare currently translated.
• Translates flow control statements in CMM such as IF, ELSE IF, ELSE, WHILE, and RePeaT to theirJython equivalents.
• Also imports and process complex nested commands and functions, CMM variables, and variableassignments. CMM subroutines that are specified with labels, ENTRY commands for subroutineparameters, and RETURN statements to return values from subroutines are converted directly tovalid Jython subroutine syntax.
Logging and error handling
For every translated CMM script, the translation process also creates a log file and places it in the samefolder as the translated script file. The log contains a summary, the detailed breakdown of the translatedelements, and details of any errors, if any.
To view the log, right-click on the imported CMM script and select Show log for the translation of<YourFilename.cmm>.
7.4.1 Importing and translating a CMM script
If you have existing CMM scripts for your platform, you can use the script import feature in DS-5 toimport and translate them.
Prerequisites
Scripts are associated with a debug configuration. When importing or editing scripts, first select theassociated debug configuration for your target in the Debug Control view.
Procedure
1. To import a CMM script into DS-5, in the Scripts view, click Import a script or directory and
select . Note
You can also drag and drop the script to be imported into the script view, either from the ProjectExplorer view or your operating system file explorer.
2. Browse and select the CMM script that you want to import, and click Open.3. Choose a location for the translated CMM script and click OK. To view the imported CMM script, in
the Scripts view, expand the CMM node and locate your script.
The CMM scripts are converted to Jython scripts during the import process, and CMM commands areconverted to their equivalent DS-5 Debugger commands. See 7.4.2 Supported CMM commands fortranslations on page 7-176 to view the list of commands supported by the CMM command translationprocess in DS-5.
7 Debugging with Scripts7.4 Support for importing and translating CMM scripts
ARM DUI0446Z Copyright © 2010-2016 ARM Limited or its affiliates. All rightsreserved.
7-175
Non-Confidential
Related references7.4 Support for importing and translating CMM scripts on page 7-175.7.4.2 Supported CMM commands for translations on page 7-176.11.23 Scripts view on page 11-326.
7.4.2 Supported CMM commands for translations
The following CMM commands are supported by the translation process.
• Break.Set - Set a breakpoint or watchpoint.• Break.Delete - Delete an address or symbol breakpoint or watchpoint.• pBreak.Delete - Delete a source level breakpoint or watchpoint.• Core or Core.Select - Switch to the numbered core in the connection.• Data.Load - Load an image.• Data.Load.Elf - Load an ELF format file.• Data.Load.Bin - Load a binary format file.• Data.Load.auto - Load a file after automatically detecting the file format.• Data.Long - Read a 32-bit value from memory.• Data.Set - Write byte-wise to memory.• Go.Direct or Go - Continue to run the core (additionally set temporary breakpoints before running).• Print - Print the output.• Register - Read a register.• Register.Set - Write a register.• System.ResetTarget or Sys.ResetTarget - Reset the target on the current connection.• Wait - Wait until a specified condition is true or for a set time period.
For detailed descriptions and formats for these individual commands, check the documentation providedwith your debugger.
Related tasks7.4.1 Importing and translating a CMM script on page 7-175.
Related references7.4 Support for importing and translating CMM scripts on page 7-175.11.23 Scripts view on page 11-326.
Related references11.23 Scripts view on page 11-326.
7 Debugging with Scripts7.4 Support for importing and translating CMM scripts
ARM DUI0446Z Copyright © 2010-2016 ARM Limited or its affiliates. All rightsreserved.
7-176
Non-Confidential
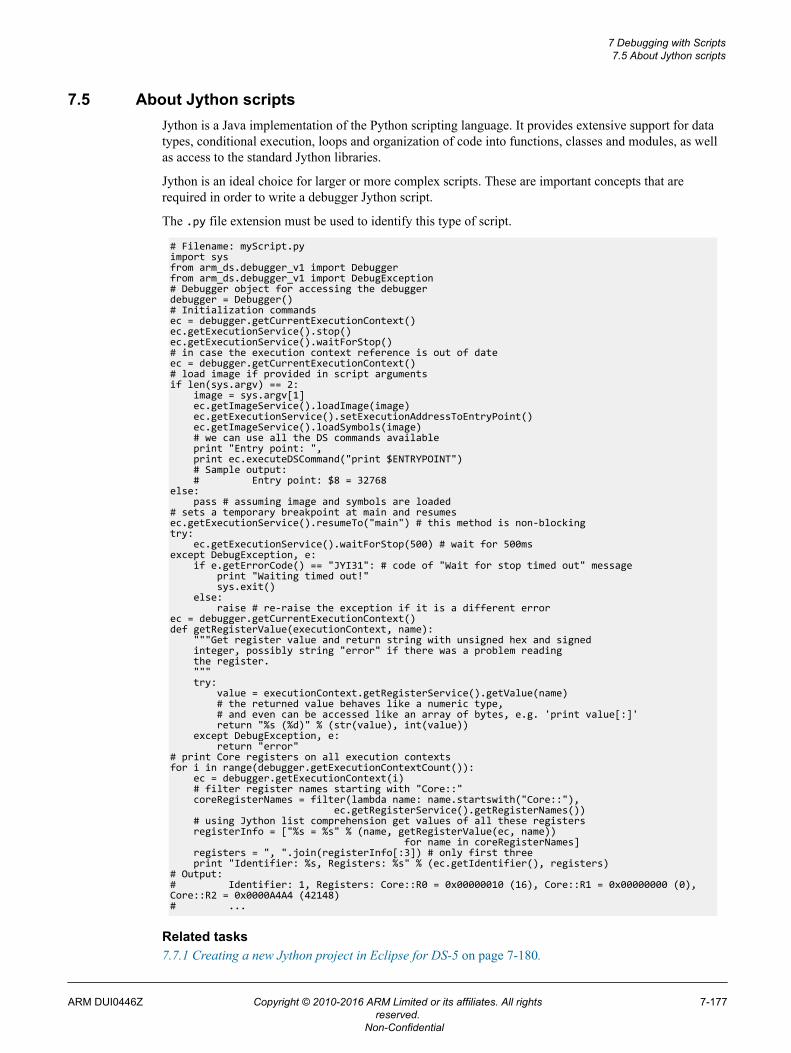
7.5 About Jython scriptsJython is a Java implementation of the Python scripting language. It provides extensive support for datatypes, conditional execution, loops and organization of code into functions, classes and modules, as wellas access to the standard Jython libraries.
Jython is an ideal choice for larger or more complex scripts. These are important concepts that arerequired in order to write a debugger Jython script.
The .py file extension must be used to identify this type of script.
# Filename: myScript.pyimport sysfrom arm_ds.debugger_v1 import Debuggerfrom arm_ds.debugger_v1 import DebugException# Debugger object for accessing the debuggerdebugger = Debugger()# Initialization commandsec = debugger.getCurrentExecutionContext()ec.getExecutionService().stop()ec.getExecutionService().waitForStop()# in case the execution context reference is out of dateec = debugger.getCurrentExecutionContext()# load image if provided in script argumentsif len(sys.argv) == 2: image = sys.argv[1] ec.getImageService().loadImage(image) ec.getExecutionService().setExecutionAddressToEntryPoint() ec.getImageService().loadSymbols(image) # we can use all the DS commands available print "Entry point: ", print ec.executeDSCommand("print $ENTRYPOINT") # Sample output: # Entry point: $8 = 32768else: pass # assuming image and symbols are loaded# sets a temporary breakpoint at main and resumesec.getExecutionService().resumeTo("main") # this method is non-blockingtry: ec.getExecutionService().waitForStop(500) # wait for 500msexcept DebugException, e: if e.getErrorCode() == "JYI31": # code of "Wait for stop timed out" message print "Waiting timed out!" sys.exit() else: raise # re-raise the exception if it is a different errorec = debugger.getCurrentExecutionContext()def getRegisterValue(executionContext, name): """Get register value and return string with unsigned hex and signed integer, possibly string "error" if there was a problem reading the register. """ try: value = executionContext.getRegisterService().getValue(name) # the returned value behaves like a numeric type, # and even can be accessed like an array of bytes, e.g. 'print value[:]' return "%s (%d)" % (str(value), int(value)) except DebugException, e: return "error"# print Core registers on all execution contextsfor i in range(debugger.getExecutionContextCount()): ec = debugger.getExecutionContext(i) # filter register names starting with "Core::" coreRegisterNames = filter(lambda name: name.startswith("Core::"), ec.getRegisterService().getRegisterNames()) # using Jython list comprehension get values of all these registers registerInfo = ["%s = %s" % (name, getRegisterValue(ec, name)) for name in coreRegisterNames] registers = ", ".join(registerInfo[:3]) # only first three print "Identifier: %s, Registers: %s" % (ec.getIdentifier(), registers)# Output:# Identifier: 1, Registers: Core::R0 = 0x00000010 (16), Core::R1 = 0x00000000 (0), Core::R2 = 0x0000A4A4 (42148)# ...
Related tasks7.7.1 Creating a new Jython project in Eclipse for DS-5 on page 7-180.
7 Debugging with Scripts7.5 About Jython scripts
ARM DUI0446Z Copyright © 2010-2016 ARM Limited or its affiliates. All rightsreserved.
7-177
Non-Confidential

7.7.2 Configuring an existing project to use the DS-5 Jython interpreter on page 7-181.7.8 Creating a Jython script on page 7-183.7.9 Running a script on page 7-185.
Related references7.6 Jython script concepts and interfaces on page 7-179.11.39 Script Parameters dialog box on page 11-357.
7 Debugging with Scripts7.5 About Jython scripts
ARM DUI0446Z Copyright © 2010-2016 ARM Limited or its affiliates. All rightsreserved.
7-178
Non-Confidential
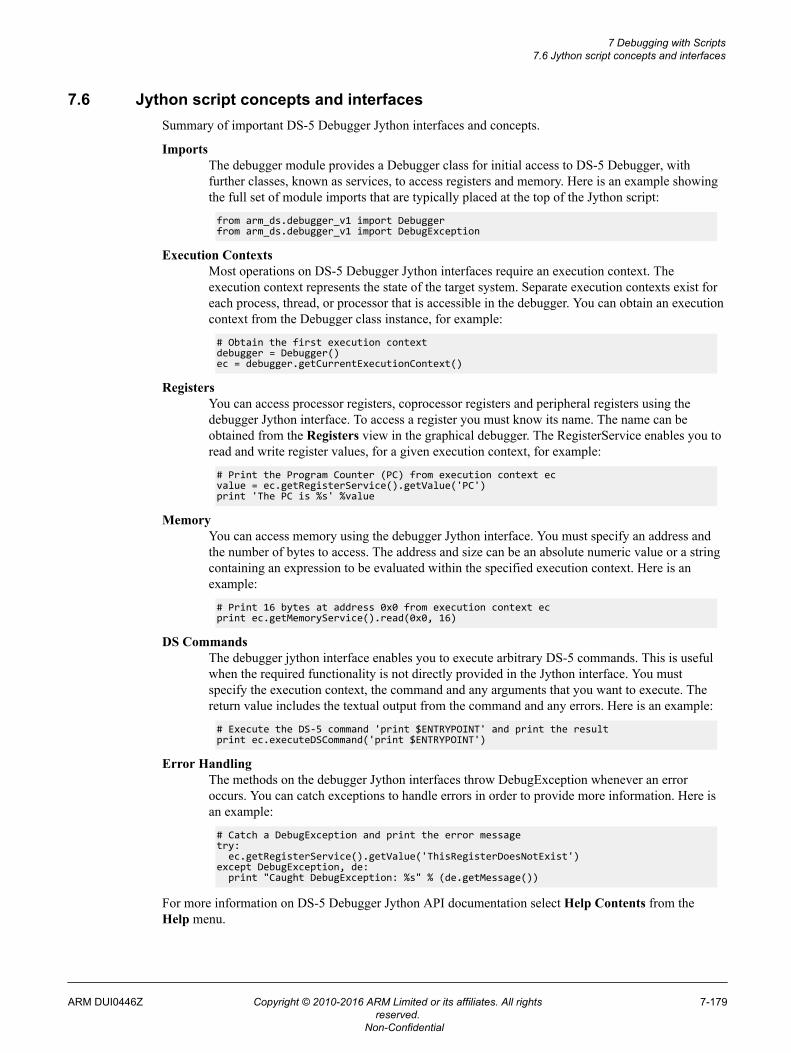
7.6 Jython script concepts and interfacesSummary of important DS-5 Debugger Jython interfaces and concepts.
ImportsThe debugger module provides a Debugger class for initial access to DS-5 Debugger, withfurther classes, known as services, to access registers and memory. Here is an example showingthe full set of module imports that are typically placed at the top of the Jython script:
from arm_ds.debugger_v1 import Debuggerfrom arm_ds.debugger_v1 import DebugException
Execution ContextsMost operations on DS-5 Debugger Jython interfaces require an execution context. Theexecution context represents the state of the target system. Separate execution contexts exist foreach process, thread, or processor that is accessible in the debugger. You can obtain an executioncontext from the Debugger class instance, for example:
# Obtain the first execution contextdebugger = Debugger()ec = debugger.getCurrentExecutionContext()
RegistersYou can access processor registers, coprocessor registers and peripheral registers using thedebugger Jython interface. To access a register you must know its name. The name can beobtained from the Registers view in the graphical debugger. The RegisterService enables you toread and write register values, for a given execution context, for example:
# Print the Program Counter (PC) from execution context ecvalue = ec.getRegisterService().getValue('PC')print 'The PC is %s' %value
MemoryYou can access memory using the debugger Jython interface. You must specify an address andthe number of bytes to access. The address and size can be an absolute numeric value or a stringcontaining an expression to be evaluated within the specified execution context. Here is anexample:
# Print 16 bytes at address 0x0 from execution context ecprint ec.getMemoryService().read(0x0, 16)
DS CommandsThe debugger jython interface enables you to execute arbitrary DS-5 commands. This is usefulwhen the required functionality is not directly provided in the Jython interface. You mustspecify the execution context, the command and any arguments that you want to execute. Thereturn value includes the textual output from the command and any errors. Here is an example:
# Execute the DS-5 command 'print $ENTRYPOINT' and print the resultprint ec.executeDSCommand('print $ENTRYPOINT')
Error HandlingThe methods on the debugger Jython interfaces throw DebugException whenever an erroroccurs. You can catch exceptions to handle errors in order to provide more information. Here isan example:
# Catch a DebugException and print the error messagetry: ec.getRegisterService().getValue('ThisRegisterDoesNotExist')except DebugException, de: print "Caught DebugException: %s" % (de.getMessage())
For more information on DS-5 Debugger Jython API documentation select Help Contents from theHelp menu.
7 Debugging with Scripts7.6 Jython script concepts and interfaces
ARM DUI0446Z Copyright © 2010-2016 ARM Limited or its affiliates. All rightsreserved.
7-179
Non-Confidential
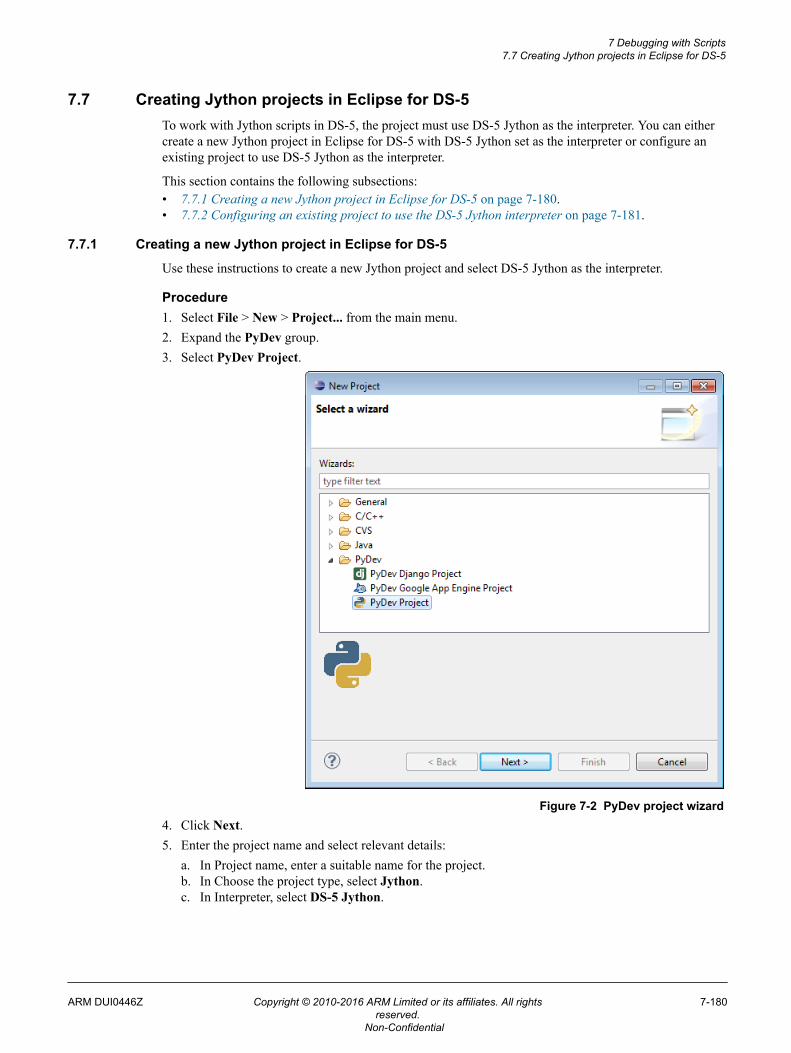
7.7 Creating Jython projects in Eclipse for DS-5To work with Jython scripts in DS-5, the project must use DS-5 Jython as the interpreter. You can eithercreate a new Jython project in Eclipse for DS-5 with DS-5 Jython set as the interpreter or configure anexisting project to use DS-5 Jython as the interpreter.
This section contains the following subsections:• 7.7.1 Creating a new Jython project in Eclipse for DS-5 on page 7-180.• 7.7.2 Configuring an existing project to use the DS-5 Jython interpreter on page 7-181.
7.7.1 Creating a new Jython project in Eclipse for DS-5
Use these instructions to create a new Jython project and select DS-5 Jython as the interpreter.
Procedure1. Select File > New > Project... from the main menu.2. Expand the PyDev group.3. Select PyDev Project.
Figure 7-2 PyDev project wizard4. Click Next.5. Enter the project name and select relevant details:
a. In Project name, enter a suitable name for the project.b. In Choose the project type, select Jython.c. In Interpreter, select DS-5 Jython.
7 Debugging with Scripts7.7 Creating Jython projects in Eclipse for DS-5
ARM DUI0446Z Copyright © 2010-2016 ARM Limited or its affiliates. All rightsreserved.
7-180
Non-Confidential
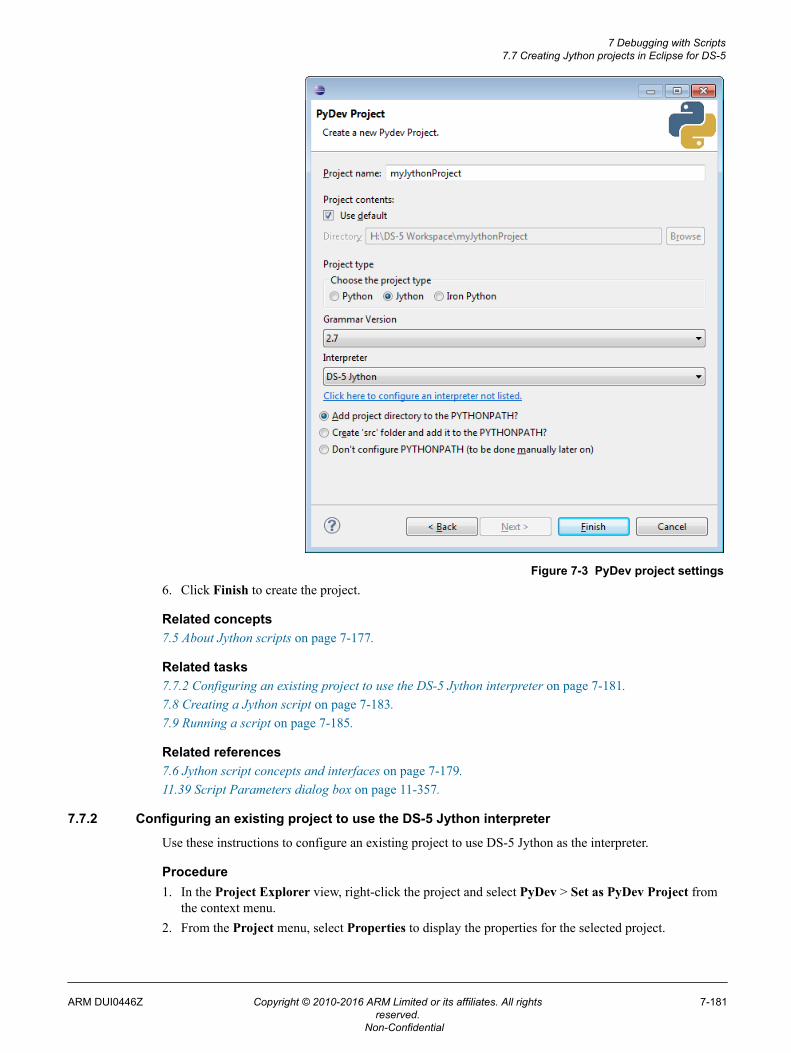
Figure 7-3 PyDev project settings6. Click Finish to create the project.
Related concepts7.5 About Jython scripts on page 7-177.
Related tasks7.7.2 Configuring an existing project to use the DS-5 Jython interpreter on page 7-181.7.8 Creating a Jython script on page 7-183.7.9 Running a script on page 7-185.
Related references7.6 Jython script concepts and interfaces on page 7-179.11.39 Script Parameters dialog box on page 11-357.
7.7.2 Configuring an existing project to use the DS-5 Jython interpreter
Use these instructions to configure an existing project to use DS-5 Jython as the interpreter.
Procedure1. In the Project Explorer view, right-click the project and select PyDev > Set as PyDev Project from
the context menu.2. From the Project menu, select Properties to display the properties for the selected project.
7 Debugging with Scripts7.7 Creating Jython projects in Eclipse for DS-5
ARM DUI0446Z Copyright © 2010-2016 ARM Limited or its affiliates. All rightsreserved.
7-181
Non-Confidential
Note
You can also right-click a project and select Properties to display the properties for the selectedproject.
3. In the Properties dialog box, select PyDev - Interpreter/Grammar.4. In Choose the project type, select Jython.5. In Interpreter, select DS-5 Jython.6. Click OK to apply these settings and close the dialog box.7. Add a Python source file to the project.
Note
The .py file extension must be used to identify this type of script.
Related concepts7.5 About Jython scripts on page 7-177.
Related tasks7.7.1 Creating a new Jython project in Eclipse for DS-5 on page 7-180.7.8 Creating a Jython script on page 7-183.7.9 Running a script on page 7-185.
Related references7.6 Jython script concepts and interfaces on page 7-179.11.39 Script Parameters dialog box on page 11-357.
7 Debugging with Scripts7.7 Creating Jython projects in Eclipse for DS-5
ARM DUI0446Z Copyright © 2010-2016 ARM Limited or its affiliates. All rightsreserved.
7-182
Non-Confidential
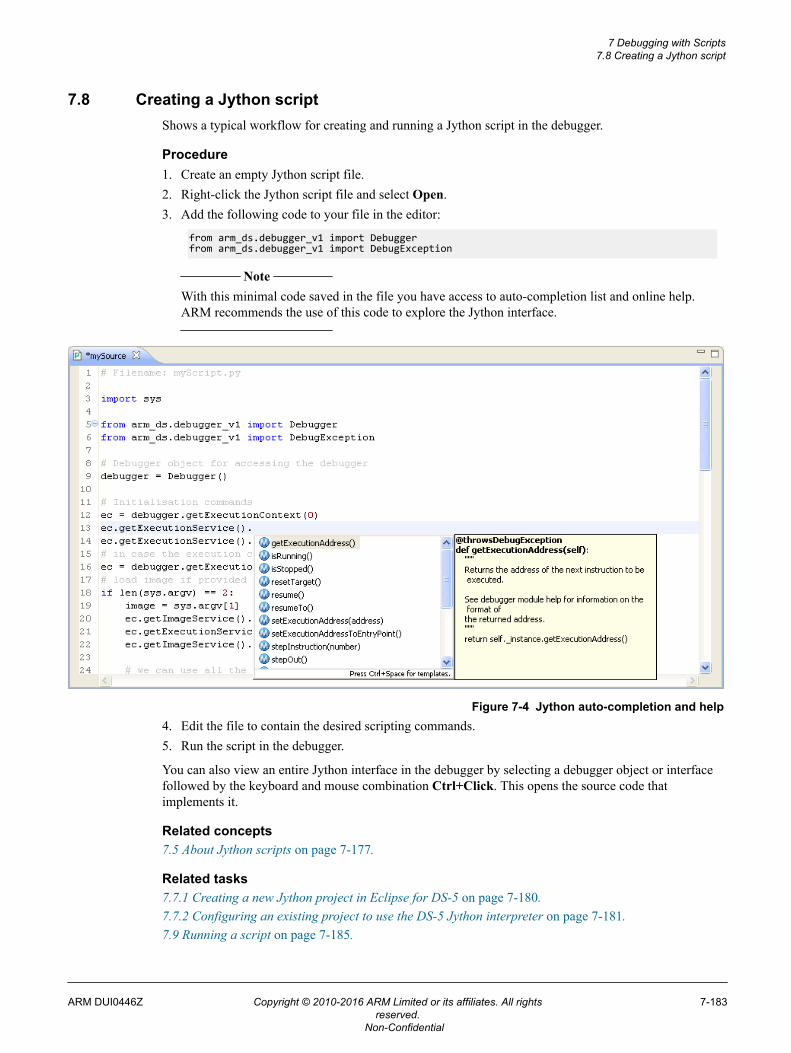
7.8 Creating a Jython scriptShows a typical workflow for creating and running a Jython script in the debugger.
Procedure1. Create an empty Jython script file.2. Right-click the Jython script file and select Open.3. Add the following code to your file in the editor:
from arm_ds.debugger_v1 import Debuggerfrom arm_ds.debugger_v1 import DebugException
Note
With this minimal code saved in the file you have access to auto-completion list and online help.ARM recommends the use of this code to explore the Jython interface.
Figure 7-4 Jython auto-completion and help4. Edit the file to contain the desired scripting commands.5. Run the script in the debugger.
You can also view an entire Jython interface in the debugger by selecting a debugger object or interfacefollowed by the keyboard and mouse combination Ctrl+Click. This opens the source code thatimplements it.
Related concepts7.5 About Jython scripts on page 7-177.
Related tasks7.7.1 Creating a new Jython project in Eclipse for DS-5 on page 7-180.7.7.2 Configuring an existing project to use the DS-5 Jython interpreter on page 7-181.7.9 Running a script on page 7-185.
7 Debugging with Scripts7.8 Creating a Jython script
ARM DUI0446Z Copyright © 2010-2016 ARM Limited or its affiliates. All rightsreserved.
7-183
Non-Confidential

Related references7.6 Jython script concepts and interfaces on page 7-179.11.39 Script Parameters dialog box on page 11-357.
7 Debugging with Scripts7.8 Creating a Jython script
ARM DUI0446Z Copyright © 2010-2016 ARM Limited or its affiliates. All rightsreserved.
7-184
Non-Confidential
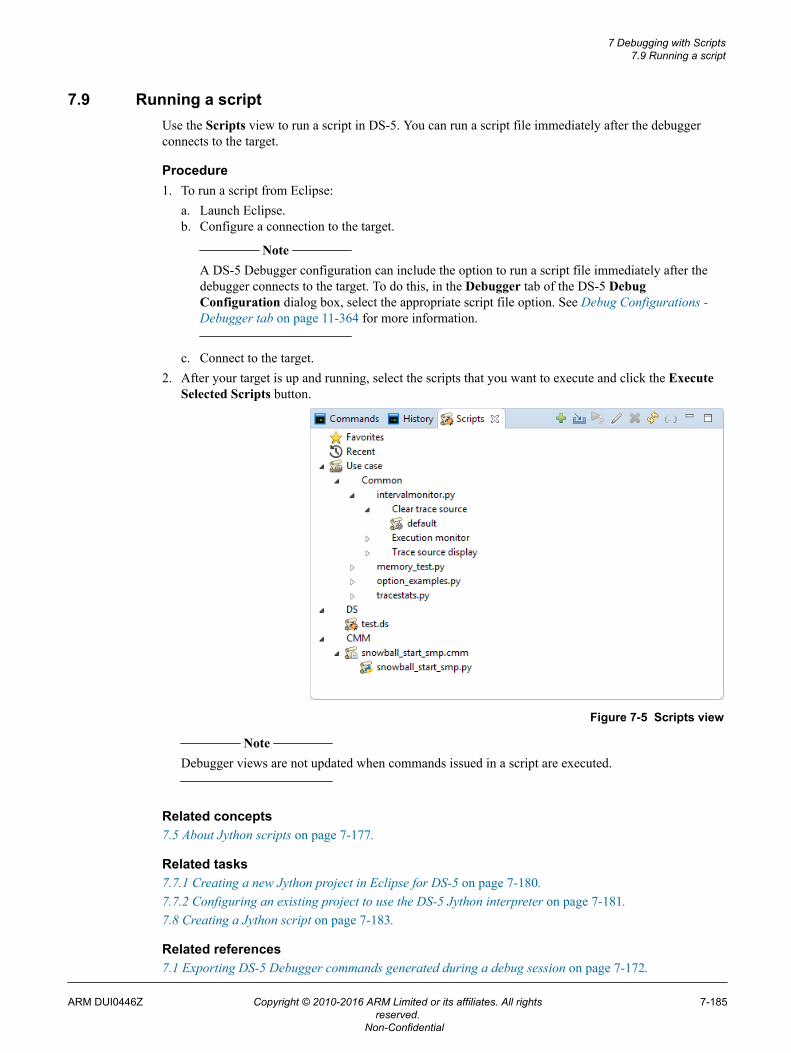
7.9 Running a scriptUse the Scripts view to run a script in DS-5. You can run a script file immediately after the debuggerconnects to the target.
Procedure1. To run a script from Eclipse:
a. Launch Eclipse.b. Configure a connection to the target.
Note
A DS-5 Debugger configuration can include the option to run a script file immediately after thedebugger connects to the target. To do this, in the Debugger tab of the DS-5 DebugConfiguration dialog box, select the appropriate script file option. See Debug Configurations -Debugger tab on page 11-364 for more information.
c. Connect to the target.2. After your target is up and running, select the scripts that you want to execute and click the Execute
Selected Scripts button.
Figure 7-5 Scripts view
Note
Debugger views are not updated when commands issued in a script are executed.
Related concepts7.5 About Jython scripts on page 7-177.
Related tasks7.7.1 Creating a new Jython project in Eclipse for DS-5 on page 7-180.7.7.2 Configuring an existing project to use the DS-5 Jython interpreter on page 7-181.7.8 Creating a Jython script on page 7-183.
Related references7.1 Exporting DS-5 Debugger commands generated during a debug session on page 7-172.
7 Debugging with Scripts7.9 Running a script
ARM DUI0446Z Copyright © 2010-2016 ARM Limited or its affiliates. All rightsreserved.
7-185
Non-Confidential

7.2 Creating a DS-5 Debugger script on page 7-173.7.3 Creating a CMM-style script on page 7-174.11.6 Commands view on page 11-275.11.14 History view on page 11-300.7.6 Jython script concepts and interfaces on page 7-179.11.39 Script Parameters dialog box on page 11-357.
Related informationDS-5 Debugger commands.
7 Debugging with Scripts7.9 Running a script
ARM DUI0446Z Copyright © 2010-2016 ARM Limited or its affiliates. All rightsreserved.
7-186
Non-Confidential
7.10 Use case scriptsUse case scripts provide an extension to existing scripts that can be used in DS-5.
DS-5 provides many pre-defined platform and model configurations in the configuration database forconnecting to and debugging a range of targets. The configuration database can be extended using thePlatform Configuration Editor or Model Configuration editor.
When a connection to a configuration is established, you can then run a use case script to invoke custombehavior. You can use Jython and access the ARM Debug and Trace Services Layer (DTSL) libraries anddebugger APIs. You can use use case scripts to provide a complex trace configuration, trace pinmultiplexing or configure multiple Coresight components within a single script.
Use case scripts provide a simple but highly configurable way to implement user-defined functionalitywithout having to write any boilerplate code for setting up, configuring and maintaining a script. Usecase scripts still have access to the full scripting APIs.
The benefits of use case scripts include:
Use case scripts work with DS-5There are built-in functions within DS-5 to query, list, and run use case scripts including those inconfiguration databases and platform specific scripts. Use case scripts are analyzed andvalidated before they are run. A clear error message is reported if there are errors in theconstruction of the script.
Built-in functionalityUse case scripts take a set of options to configure the values given to the script on the commandline and have a built-in mechanism to save and load sets of options. A trace configuration for aparticular target or a complex set of options to recreate a bug can be saved and loaded when thescript is run.
FlexibilityUse case scripts provide an easy way of changing the number of arguments, options, and namesof methods as the script develops. You can define positional arguments to use case scripts. It iseasy to add, remove or modify positional arguments. When running the script from thecommand line, you must specify values for the positional arguments. Multiple use cases aresupported within a single use case script to allow sharing of common code, where each use caseprovides a single piece of functionality.
7 Debugging with Scripts7.10 Use case scripts
ARM DUI0446Z Copyright © 2010-2016 ARM Limited or its affiliates. All rightsreserved.
7-187
Non-Confidential
7.11 Metadata for use case scriptsA use case definition block is a comment block that is usually at the start of the script.
The definition block can define various metadata:• The title of the use case.• A brief description of the use case.• Where the options must be retrieved from for the use case.• The method to validate the use case.• A multiline help text which can provide usage text and a more verbose description of the use case.• The entry point to the use case.
Only the entry point is required to define a use case. Other metadata definitions are optional.
7 Debugging with Scripts7.11 Metadata for use case scripts
ARM DUI0446Z Copyright © 2010-2016 ARM Limited or its affiliates. All rightsreserved.
7-188
Non-Confidential
7.12 Definition block for use case scriptsEach use case definition block must begin with a USECASE header line to define the start of a use case.Without the header, DS-5 does not recognize the script as a use case script.
Tags describe the content of a use case. Each tag is surrounded by dollar ($) signs to distinguish themfrom any other text. All tags are defined $<tag>$ <value> with the exception of the $Help$ tag. If a tagis defined in the use case definition block it can only be present once. Duplicate names of tags are notaccepted in a single use case.
Only the $Run$ tag which describes the entry point or main method to the use case needs to be definedfor a valid use case. To report meaningful help when searching for use case scripts on the DS-5command-line, it is recommended that you also define the $Title$ and $Description$ tags in each usecase.
Run
The $Run$ tag specifies the name of the entry point to a single use case. When you run a use case on thecommand line, it calls the method with the $Run$ tag. For details of how to define the entry point, andhow to supply additional arguments to the method, see 7.13 Defining the Run method for use case scriptson page 7-191.
Example 7-2 Examples
...$Run$ mainMethod...
Title
The $Title$ tag specifies the title in a use case definition block. This is a single line string which is thetitle of this use case script and is displayed when searching for use case scripts on the command-line.
Example 7-3 Examples
...$Title$ Usecase Title...
Description
The $Description$ tag specifies the description in a use case definition block. This is a single linestring which is the description of this use case and is displayed when searching for use case scripts on thecommand-line.
Example 7-4 Examples
...$Description$ A brief description of this use case...
7 Debugging with Scripts7.12 Definition block for use case scripts
ARM DUI0446Z Copyright © 2010-2016 ARM Limited or its affiliates. All rightsreserved.
7-189
Non-Confidential
Options
The $Options$ tag specifies a method within the use case script, which can be called to retrieve a list ofoptions. For a description of how to define the options function, and how to construct a list of options,see 7.14 Defining the options for use case scripts on page 7-192.
Example 7-5 Examples
...$Options$ myOptions...
Validation
The $Validation$ tag specifies the validation method in the use case definition block. You must specifythis to validate the options provided when the script is run. For a description of how to define thevalidation function, see 7.15 Defining the validation method for use case scripts on page 7-195.
Example 7-6 Examples
...$Validation$ myValidation...
Help
The use of $Help$ tags is slightly different from the use of other tags. The $Help$ tag enables writing amultiline block of text, which appears in the output when a user requests help about the use case script.This can be used to provide usage description, parameters for the use case scripts, or a more verbose helptext.
To define a block of help text, enclose the block in $Help$ tags. Formatting, such as new lines andspaces are preserved in the $Help$ block. Everything, including the definition of other tags, areconsumed within a $Help$ block. The $Help$ block must be completed before other tags or code isdefined.
Example 7-7 Examples
$Help$This is part of the help text...$Help$
7 Debugging with Scripts7.12 Definition block for use case scripts
ARM DUI0446Z Copyright © 2010-2016 ARM Limited or its affiliates. All rightsreserved.
7-190
Non-Confidential
7.13 Defining the Run method for use case scriptsThe method named in the $Run$ tag must have at least one parameter, called options, which providesaccess to the script options.
Example 7-8 Examples
...$Run$ mainMethod...
def mainMethod(options): print "Running the main method"
It is possible to define an entry point to the use case that requires more than one parameter. Thedefinition of the $Run$ tag only defines the function name. The definition of the function within thescript defines how many parameters are needed.
Example 7-9 Examples
...$Run$ main...
# main method with positional argumentsdef main(options, filename, value): print "Running the main method" # Using the positional arguments supplied to the script. print "Using file: " + filename + " and value: " + value
In this example main requires two parameters, filename and value which must be supplied on thecommand-line when the use case script is run.
7 Debugging with Scripts7.13 Defining the Run method for use case scripts
ARM DUI0446Z Copyright © 2010-2016 ARM Limited or its affiliates. All rightsreserved.
7-191
Non-Confidential
7.14 Defining the options for use case scriptsEach use case has a list of options which specify a set of values which can be supplied on the command-line to a particular use case to configure what values are supplied when use case is run.
When you define options, you can group or nest them to organize and provide a more descriptive set ofoptions.
The method which provides the options is defined with the $Options$ tag in a use case definition block.The $Options$ tag provides the name of a method in the script which returns a single list of options.
Example 7-10 Examples
...$Options$ myOptions...
def myOptions(): return [list_of_options]
It is important that the function that supplies the options takes no arguments and returns a list of optionsin the same format as described below. If the $Options$ tag is defined, and the function named in thistag is not present in the script or the function used to supply the options takes arguments, then an erroroccurs when running the script.
There are 5 types of option that can be used to define options to a use case script. These are:
• UseCaseScript.booleanOption.• UseCaseScript.enumOption.• UseCaseScript.radioEnumOption.• UseCaseScript.integerOption.• UseCaseScript.stringOption.
All of these options require:• A variable name, that is used to refer to the option in a use case script.• A display name.• A default value that must be of the same type as the defined option.
UseCaseScript.booleanOptionDescribes a boolean. Possible values are True or False.
UseCaseScript.integerOptionDescribes a whole integer value such as: 4, 99 or 100001. In addition to the fields required by alloptions, a minimum and a maximum value can be supplied which restricts the range of integersthis option allows. Additionally, an output format of the integer option can be defined, whichcan be either decimal (base 10) or hexadecimal (base 16).
UseCaseScript.stringOptionDescribes a string such as traceCapture or etmv4 which can be used, for example, to refer tothe Coresight components in the current system by name.
UseCaseScript.enumOptionUseCaseScript.radioEnumOption
Both these describe enumerations. These can be used to describe a list of values that are allowedfor this option. Enumeration values can be strings or integers.
Example 7-11 Examples
UseCaseScript.booleanOption(name="timestamps", displayName="Enable global timestamping", defaultValue=True)
7 Debugging with Scripts7.14 Defining the options for use case scripts
ARM DUI0446Z Copyright © 2010-2016 ARM Limited or its affiliates. All rightsreserved.
7-192
Non-Confidential
Defines a boolean option “timestamps” which is true by default.
UseCaseScript.stringOption(name="traceBuffer", "Trace Capture Method", defaultValue="none")
Defines a string option “traceBuffer” with a default value “none”.
UseCaseScript.integerOption(name="cores", displayName="Number of cores", defaultValue=1, min=1, max=16, format=UseCaseScript.DEC)
Defines an integer option “cores” with a default value of 1, minimum value of 1 and maximum value of16. The output format is in decimal (base 10).
UseCaseScript.integerOption(name="retries", displayName="Attempts to retry", defaultValue=5, min=1, format=UseCaseScript.HEX)
Defines an integer option “retries” with a default value of 5, minimum value of 1 and no maximumvalue. The output will be in hexadecimal (base 16).
UseCaseScript.enumOption(name="contextid", displayName="Context ID Size", values = [("8", "8 bits"), ("16", "16 bits"), ("32", "32 bits")] , defaultValue="32")
Defines an enumeration “contextid” with default value of “32”, the values are restricted to members ofthe enumeration: "8", "16" or "32".
Nesting OptionsOptions can be organized or grouped using the following:• UseCaseScript.tabSet.• UseCaseScript.tabPage.• UseCaseScript.infoOption.• UseCaseScript.optionGroup.
The groups are not associated with a value, and do not require a default. You can use the groups with theoption names to construct a complete set of options.
To specify the nesting of options, each option can include an optional childOptions keyword which is alist of other options which are nested within this option. An example set of nested options can be seenbelow.
Example 7-12 Examples
The following example shows an options method, complete with a set of options.
def myOptions(): return [ UseCaseScript.optionGroup( name="options", displayName="Usecase Options", childOptions=[ UseCaseScript.optionGroup( name="connection", displayName="Connection Options", childOptions=[ UseCaseScript.integerOption( name="cores", displayName="Number of cores", defaultValue=1, min=1, max=16), UseCaseScript.stringOption( name="traceBuffer", displayName="Trace Capture Method", defaultValue="none"), ] ), UseCaseScript.enumOption( name="contextID", displayName="Context ID Size", values = [("8", "8 bits"), ("16", "16 bits"), ("32", "32
7 Debugging with Scripts7.14 Defining the options for use case scripts
ARM DUI0446Z Copyright © 2010-2016 ARM Limited or its affiliates. All rightsreserved.
7-193
Non-Confidential
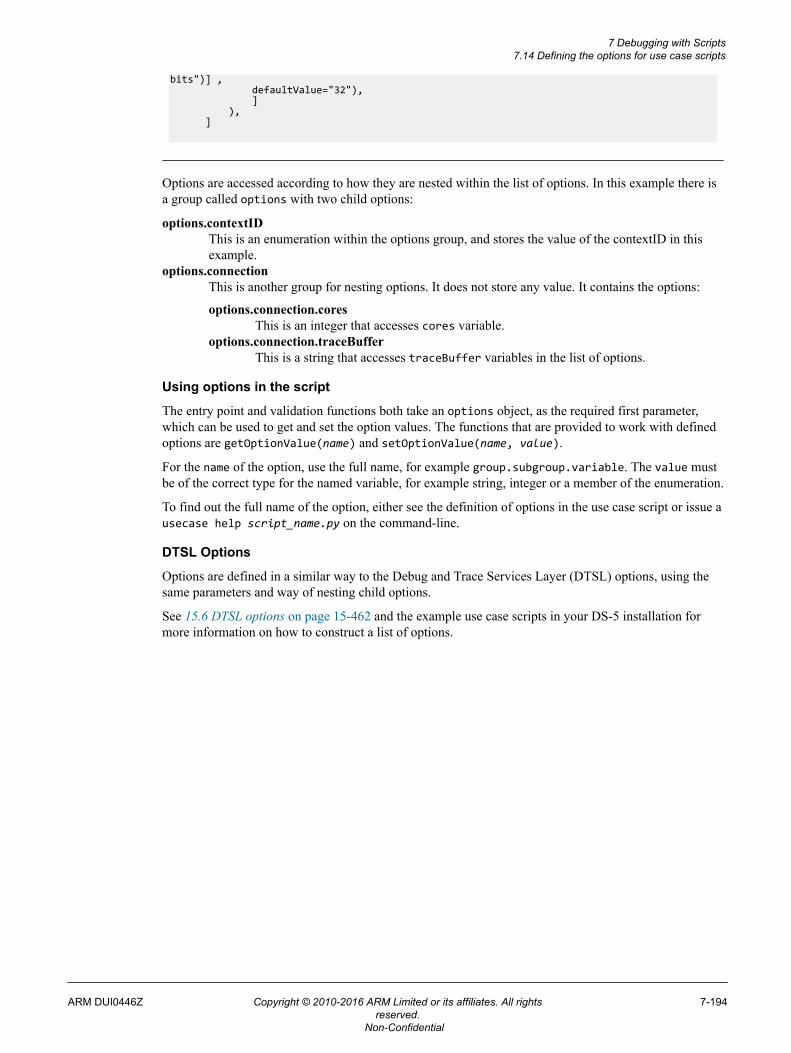
bits")] , defaultValue="32"), ] ), ]
Options are accessed according to how they are nested within the list of options. In this example there isa group called options with two child options:
options.contextIDThis is an enumeration within the options group, and stores the value of the contextID in thisexample.
options.connectionThis is another group for nesting options. It does not store any value. It contains the options:
options.connection.coresThis is an integer that accesses cores variable.
options.connection.traceBufferThis is a string that accesses traceBuffer variables in the list of options.
Using options in the script
The entry point and validation functions both take an options object, as the required first parameter,which can be used to get and set the option values. The functions that are provided to work with definedoptions are getOptionValue(name) and setOptionValue(name, value).
For the name of the option, use the full name, for example group.subgroup.variable. The value mustbe of the correct type for the named variable, for example string, integer or a member of the enumeration.
To find out the full name of the option, either see the definition of options in the use case script or issue ausecase help script_name.py on the command-line.
DTSL Options
Options are defined in a similar way to the Debug and Trace Services Layer (DTSL) options, using thesame parameters and way of nesting child options.
See 15.6 DTSL options on page 15-462 and the example use case scripts in your DS-5 installation formore information on how to construct a list of options.
7 Debugging with Scripts7.14 Defining the options for use case scripts
ARM DUI0446Z Copyright © 2010-2016 ARM Limited or its affiliates. All rightsreserved.
7-194
Non-Confidential
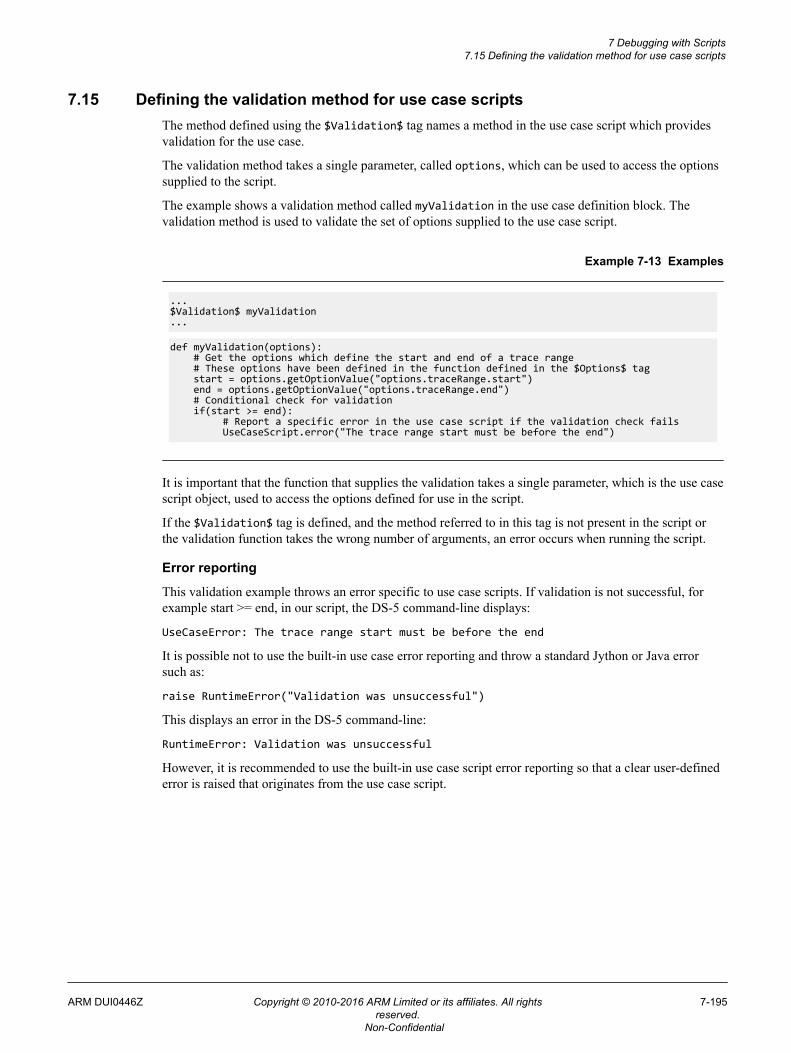
7.15 Defining the validation method for use case scriptsThe method defined using the $Validation$ tag names a method in the use case script which providesvalidation for the use case.
The validation method takes a single parameter, called options, which can be used to access the optionssupplied to the script.
The example shows a validation method called myValidation in the use case definition block. Thevalidation method is used to validate the set of options supplied to the use case script.
Example 7-13 Examples
...$Validation$ myValidation...
def myValidation(options): # Get the options which define the start and end of a trace range # These options have been defined in the function defined in the $Options$ tag start = options.getOptionValue("options.traceRange.start") end = options.getOptionValue("options.traceRange.end") # Conditional check for validation if(start >= end): # Report a specific error in the use case script if the validation check fails UseCaseScript.error("The trace range start must be before the end")
It is important that the function that supplies the validation takes a single parameter, which is the use casescript object, used to access the options defined for use in the script.
If the $Validation$ tag is defined, and the method referred to in this tag is not present in the script orthe validation function takes the wrong number of arguments, an error occurs when running the script.
Error reporting
This validation example throws an error specific to use case scripts. If validation is not successful, forexample start >= end, in our script, the DS-5 command-line displays:
UseCaseError: The trace range start must be before the end
It is possible not to use the built-in use case error reporting and throw a standard Jython or Java errorsuch as:
raise RuntimeError("Validation was unsuccessful")
This displays an error in the DS-5 command-line:
RuntimeError: Validation was unsuccessful
However, it is recommended to use the built-in use case script error reporting so that a clear user-definederror is raised that originates from the use case script.
7 Debugging with Scripts7.15 Defining the validation method for use case scripts
ARM DUI0446Z Copyright © 2010-2016 ARM Limited or its affiliates. All rightsreserved.
7-195
Non-Confidential
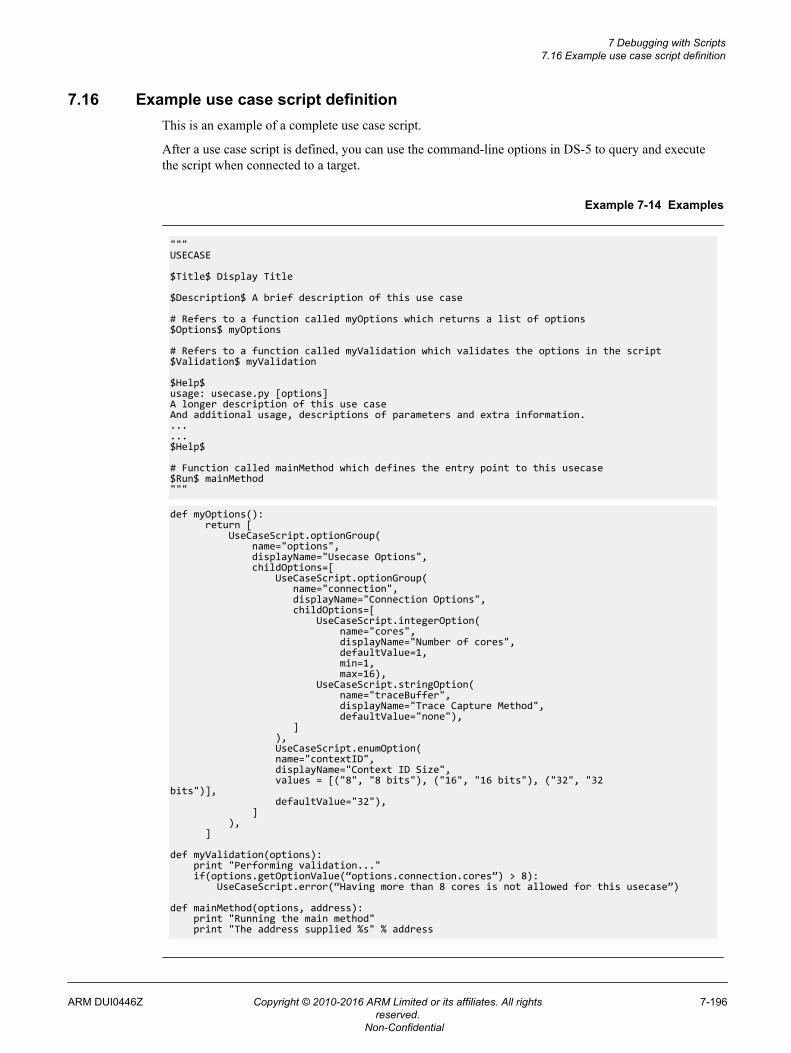
7.16 Example use case script definitionThis is an example of a complete use case script.
After a use case script is defined, you can use the command-line options in DS-5 to query and executethe script when connected to a target.
Example 7-14 Examples
"""USECASE
$Title$ Display Title
$Description$ A brief description of this use case
# Refers to a function called myOptions which returns a list of options$Options$ myOptions
# Refers to a function called myValidation which validates the options in the script $Validation$ myValidation
$Help$usage: usecase.py [options] A longer description of this use caseAnd additional usage, descriptions of parameters and extra information.......$Help$
# Function called mainMethod which defines the entry point to this usecase$Run$ mainMethod"""
def myOptions(): return [ UseCaseScript.optionGroup( name="options", displayName="Usecase Options", childOptions=[ UseCaseScript.optionGroup( name="connection", displayName="Connection Options", childOptions=[ UseCaseScript.integerOption( name="cores", displayName="Number of cores", defaultValue=1, min=1, max=16), UseCaseScript.stringOption( name="traceBuffer", displayName="Trace Capture Method", defaultValue="none"), ] ), UseCaseScript.enumOption( name="contextID", displayName="Context ID Size", values = [("8", "8 bits"), ("16", "16 bits"), ("32", "32 bits")], defaultValue="32"), ] ), ] def myValidation(options): print "Performing validation..." if(options.getOptionValue(“options.connection.cores”) > 8): UseCaseScript.error(“Having more than 8 cores is not allowed for this usecase”)
def mainMethod(options, address): print "Running the main method" print "The address supplied %s" % address
7 Debugging with Scripts7.16 Example use case script definition
ARM DUI0446Z Copyright © 2010-2016 ARM Limited or its affiliates. All rightsreserved.
7-196
Non-Confidential
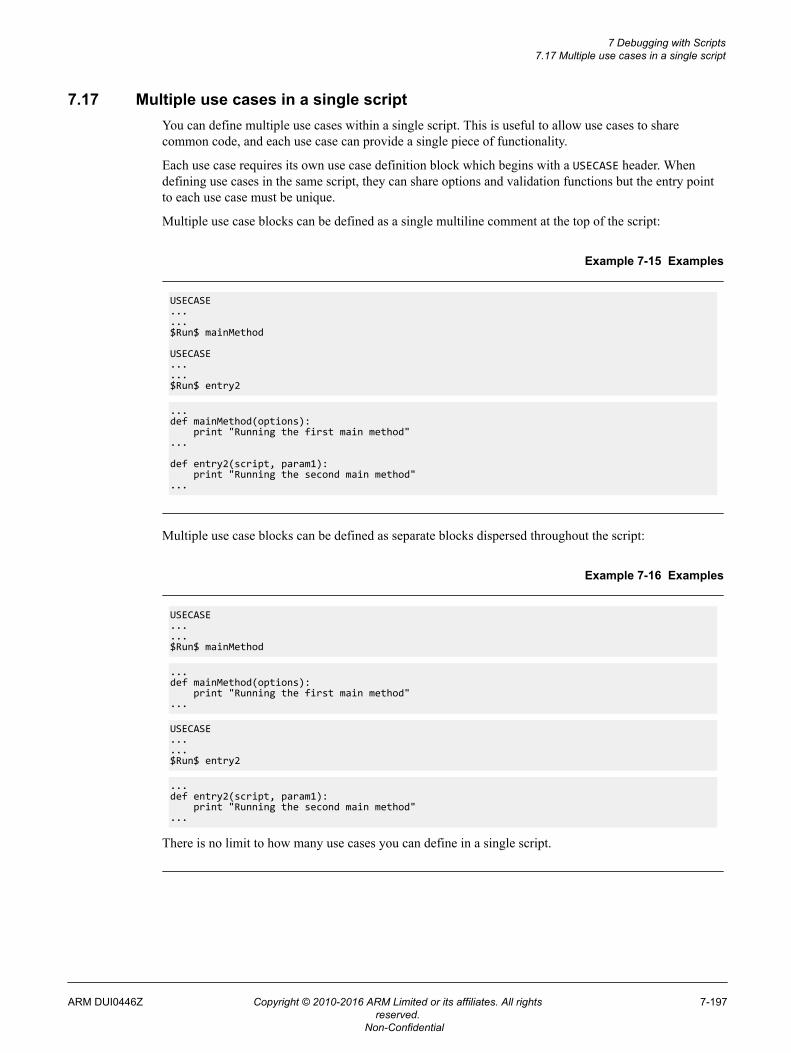
7.17 Multiple use cases in a single scriptYou can define multiple use cases within a single script. This is useful to allow use cases to sharecommon code, and each use case can provide a single piece of functionality.
Each use case requires its own use case definition block which begins with a USECASE header. Whendefining use cases in the same script, they can share options and validation functions but the entry pointto each use case must be unique.
Multiple use case blocks can be defined as a single multiline comment at the top of the script:
Example 7-15 Examples
USECASE......$Run$ mainMethod
USECASE......$Run$ entry2
...def mainMethod(options): print "Running the first main method"...
def entry2(script, param1): print "Running the second main method"...
Multiple use case blocks can be defined as separate blocks dispersed throughout the script:
Example 7-16 Examples
USECASE......$Run$ mainMethod
...def mainMethod(options): print "Running the first main method"...
USECASE......$Run$ entry2
...def entry2(script, param1): print "Running the second main method"...
There is no limit to how many use cases you can define in a single script.
7 Debugging with Scripts7.17 Multiple use cases in a single script
ARM DUI0446Z Copyright © 2010-2016 ARM Limited or its affiliates. All rightsreserved.
7-197
Non-Confidential
7.18 usecase list commandThe usecase list command allows the user to search for use case scripts in various locations.
The output reports the location searched for use cases and, if any use case scripts are found, prints a tablelisting:• The script name.• Entry points to the script. Each entry point defines a single use case.• The title of each use case.• The description of each use case, if defined.
If a usecase list command is issued without any parameters on the command line, DS-5 reports all theuse case scripts it finds in the current directory.
A usecase list path/to/directory/ command lists any use case scripts it finds in the directoryspecified. The usecase list command accepts relative paths to locations as well as tilde (~) as the userhome directory on Unix based systems.
Several use cases are shipped with DS-5 and are found in the default configuration database under /Scripts/usecase/. When creating a use case it can be added to /Scripts/usecase/ in the defaultdatabase, or a custom user database. These scripts are also listed by the usecase list -s command.
Use case scripts might be platform specific, and use cases can be defined as only visible for the currenttarget. A use case script created in the configuration database in /Boards/<Manufacturer>/<Platform>/ is only visible when a connection is made to the <Manufacturer>/<Platform>configuration.
usecase list -p lists all use case scripts associated with the current platform. For example if aconnection was made to the configuration in /ARM FVP (Installed with DS-5)/VE_AEMv8x1/ and theusecase list -p was run, only use case scripts in this directory for the current configuration are listed.
Issuing usecase list -a lists all scripts in the current working directory, in /Scripts/usecase/ in theconfiguration database, and those for the current platform.
7 Debugging with Scripts7.18 usecase list command
ARM DUI0446Z Copyright © 2010-2016 ARM Limited or its affiliates. All rightsreserved.
7-198
Non-Confidential
7.19 usecase help commandThe usecase help command is available to print help on how to use the use case scripts and informationabout the options available.
The syntax for running usecase help is:
usecase help [flag] script_name [entry_point]
Where:
flag
-pTo run a script for the current platform.
-sTo run a script in the /Scripts/usecase/ directory in the configuration database.
entry_pointIs the name of the entry point or main method defined in the use case. If a use case script definesmore than one entry point, then you must specify the entry_point parameter.
script_nameIs the name of the use case script.
Running use case help on a valid script prints:
• Text defined in a $Help$ block in the use case script.• A set of built-in options that are defined in every use case script.• A list of information about the options defined in this use case.
For each option the help text lists:• The display name of the option.• The unique option name for getting or setting options.• The type of option, which is integer, string, boolean, or enumeration.• The default value of the option.
For enumeration options, a list of the enumerated values are listed. For integer options, the maximumand minimum values are displayed, if they have been specified.
7 Debugging with Scripts7.19 usecase help command
ARM DUI0446Z Copyright © 2010-2016 ARM Limited or its affiliates. All rightsreserved.
7-199
Non-Confidential
7.20 usecase run commandThe usecase run command runs the script from the specified entry point.
The basic syntax for running a use case script from the command-line is:
usecase run script_name [options]
The options that you can use are defined in the method with the $Options$ tag of the current use casewithin the script. You can get more information about them using the usecase help command.
The syntax for setting options on the command line is --options.name=value or --options.namevalue. If you do not specify a value for an option explicitly, the option takes the default value defined inthe script.
Note
The examples use options as the name of the top level group of options. However, you can give adifferent name to the top level group of options in the use case script.
When issuing the usecase run command, rather than specifying an absolute path to a script, specify a -p or -s flag before the script name. For example, issue usecase run -p script_name [options] torun a use case script for the current platform.
If there is more than one use case defined in a single script, the entry point or main method to use whenrunning the script must be defined. For scripts with multiple use cases the syntax is usecase runscript_name entry_point [options].
If the entry point to the use case accepts positional arguments, you must specify them on the command-line when the script is run. For example, if the main method in the use case script positional.py in thecurrent working directory is defined as follows:
...$Run$ main...
def main(script, filename, value): print("Running the main method")
The syntax to run the script is:
usecase run positional.py [options] filename value
Example 7-17 Examples
usecase run myscript.py --options.enableETM=True --options.enableETM.timestamping=True --options.traceCapture "DSTREAM"
Runs a use case script called myscript.py in the current working directory, setting the options definedfor this use case.
usecase run multipleEntry.py mainOne --options.traceCapture "ETR"
Runs a use case script called multipleEntry.py in the current working directory. The entry point to thisuse case script is mainOne. A single option is specified after the entry point.
usecase run -s multipleScript.py mainTwo filename.txt 100
Runs a use case script in the /Scripts/usecase/ directory in the configuration database calledmultipleScript.py in the current working directory. The entry point to this use case script is mainTwowhich defines two positional arguments. No options are supplied to the script.
7 Debugging with Scripts7.20 usecase run command
ARM DUI0446Z Copyright © 2010-2016 ARM Limited or its affiliates. All rightsreserved.
7-200
Non-Confidential
Saving options
On the command-line, providing a long list of options might be tedious to type in every time the script isrun over different connections. A solution to this is to use the built-in functionality --save-options.
For example, you can run the script usecase run script_name --option1=..., --option2=... --save-options=/path/to/options.txt where options.txt is the file in which to save the options.This saves the options to this use case script, at runtime, to options.txt.
If you do not specify an option on the command-line, its default value is saved to the specified file.
Loading options
After saving options to a file, there is a similar mechanism for loading them back in. Issuing usecaserun script_name --load-options=path/to/options.txt loads the options in from options.txtand, if successful, runs the script.
You can combine options by providing options on the command-line and loading them from a file.Options from the command-line override those from a file.
Example:
The options file options.txt for myscript.py contains two option values:• options.a=10.• options.b=20.
Running usecase run myscript.py --load-options=options.txt results in options.a having thevalue 10 and options.b having the value 20, loaded from the specified file. If an option is set on thecommand-line, for example usecase run --options.b=99 --load-options=options.txt, itoverrides those options retrieved from the file. options.a takes the value 10, but options.b takes thenew value 99 provided on the command-line and not the one stored in the file. This is useful for storing astandard set of options for a single use case and modifying only those necessary at runtime.
Showing options
When running a script, the user might want to see what options are being used, especially if the optionsare loaded from an external file. The built-in option --show-options displays the name and value of alloptions being used in the script when the script is run.
Example 7-18 Examples
usecase run script_name --show-options
Prints out a list of the default options for this script.
usecase run script_name --option1=x, --option2=y --show-options
Prints out a list of options for the script, with updated values for option1 and option2.
usecase run script_name --load-options=file --show-options
Prints out a list of options taking their values from the supplied file. If an option is not defined in theloaded file, its default value is printed.
7 Debugging with Scripts7.20 usecase run command
ARM DUI0446Z Copyright © 2010-2016 ARM Limited or its affiliates. All rightsreserved.
7-201
Non-Confidential
Chapter 8Running DS-5 Debugger from the operating systemcommand-line or from a script
This chapter describes how to use DS-5 Debugger from the operating system command-line or from ascript.
It contains the following sections:• 8.1 Overview: Running DS-5 Debugger from the command-line or from a script on page 8-203.• 8.2 Command-line debugger options on page 8-204.• 8.3 Running a debug session from a script on page 8-209.• 8.4 Specifying a custom configuration database using the command-line on page 8-211.• 8.5 Capturing trace data using the command-line debugger on page 8-213.• 8.6 DS-5 Debugger command-line console keyboard shortcuts on page 8-215.
ARM DUI0446Z Copyright © 2010-2016 ARM Limited or its affiliates. All rightsreserved.
8-202
Non-Confidential
8.1 Overview: Running DS-5 Debugger from the command-line or from a scriptDS-5 Debugger can operate in a command-line only mode, with no graphical user interface.
This is very useful when automating debug and trace activities. By automating a debug session, you cansave significant time and avoid repetitive tasks such as stepping through code at source level. Thisbecomes particularly useful when you need to run multiple tests as part of regression testing.
This mode has the advantage of being extremely lightweight and therefore faster. However, by extension,it also lacks the enhancements that a GUI brings when connecting to a target device such as being able tosee synchronization between your source code, disassembly, variables, registers, and memory as you stepthrough execution.
If you want, you can drive the operation of DS-5 Debugger with individual commands in an interactiveway. However, DS-5 Debugger when used from the command-line, is typically driven from scripts. WithDS-5 Debugger, you might first carry out the required debug tasks in the graphical debugger. Thisgenerates a record of each debug task, which can then be exported from the History view as a (.ds)script.
You can edit scripts using the Scripts view. Alternatively, a debug script can be written manually usingthe DS-5 Debugger commands for reference.
DS-5 also supports Jython (.py) scripts which provide more capability than the native DS-5 scriptinglanguage. These can be loaded into DS-5 Debugger to automate the debugger to carry out more complextasks.
See Command-line debugger options on page 8-204 for syntax and instructions on how to launch DS-5Debugger from the command line.
Related tasks8.4 Specifying a custom configuration database using the command-line on page 8-211.
Related references8.2 Command-line debugger options on page 8-204.
Related informationDS-5 Debugger commands.
8 Running DS-5 Debugger from the operating system command-line or from a script8.1 Overview: Running DS-5 Debugger from the command-line or from a script
ARM DUI0446Z Copyright © 2010-2016 ARM Limited or its affiliates. All rightsreserved.
8-203
Non-Confidential
8.2 Command-line debugger optionsThe options listed below allow you to run DS-5 Debugger from the command-line without a graphicaluser interface.
If you are using Windows, use the DS-5 Command Prompt. On Linux, set the required environmentvariables, and use the UNIX shell.
Launch the command-line debugger using the following syntax:
debugger [--option arg] ...
Where:debugger
Invokes the DS-5 command-line debugger.--option arg
The debugger option and its arguments. This can either be to configure the command-linedebugger, or to connect to a target.
...Additional options, if you need to specify any.
Note
Once connected to your target, use any of the DS-5 Debugger commands to access the target and startdebugging.
For example, info registers displays all application level registers.
Options--browse
Browses for available connections and lists targets that match the connection type specified inthe configuration database entry.
Note
You must specify --cdb-entry arg to use --browse.
--cdb-entry argSpecifies a target from the configuration database that the debugger can connect to.
Use arg to specify the target configuration. arg is a string, concatenated using entries in eachlevel of the configuration database. The syntax of arg is:
"Manufacturer::Platform::Project type::Executionenvironment::Activity::Connection type".
Use --cdb-list to determine the entries in the configuration database that the debugger canconnect to. You can specify partial entries such as "ARM Development Boards" or "ARMDevelopment Boards::Versatile Express A9x4" and press Enter to view the next possibleentries.
For example, to connect to a ARM Versatile Express A9x4 target using DSTREAM and a USBconnection, first use --cdb-list to identify the entries in the configuration database within ARMDevelopment Boards, then use:
debugger --cdb-entry "ARM Development Boards::Versatile Express A9x4::Bare Metal Debug::Bare Metal SMP Debug of all cores::Debug Cortex-A9x4 SMP::DSTREAM" --cdb-entry-param "Connection=USB:000271"
--cdb-entry-param argSpecifies connection parameters for the debugger.
8 Running DS-5 Debugger from the operating system command-line or from a script8.2 Command-line debugger options
ARM DUI0446Z Copyright © 2010-2016 ARM Limited or its affiliates. All rightsreserved.
8-204
Non-Confidential
Use arg to specify the parameters and their values. The syntax for arg is comma separated pairsof parameters and values: "param1=value1". Use --cdb-list to identify what parameters thedebugger needs. Parameters that the debugger might need are:
ConnectionSpecifies the TCP address or the USB port number of the debug adapter to connect to.
AddressSpecifies the address for a gdbserver connection.
PortSpecifies the port for a gdbserver connection.
dtsl_options_fileSpecifies a file containing the DTSL options.
Model parametersSpecifies parameters for a model connection. The model parameters depend on thespecific model that the debugger connects to. See the documentation on the model forthe parameters and how to configure them. The debugger uses the default modelparameter values if you do not specify them.
Use --cdb-entry-param for each parameter.
For example --cdb-entry-param "Connection=TestTarget" --cdb-entry-param"dtsl_options_file=my_dtsl_settings.dtslprops"
--cdb-list filterLists the entries in the configuration database. This option does not connect to any target.The configuration database has a tree data structure, where each entry has entries within it. --cdb-list identifies the entries in each level of the database. The levels are:1. Manufacturer2. Platform3. Project type4. Execution environment5. Activity6. Connection type.Use filter to specify the entries in each level, to identify the target and how to connect to it.filter is a string concatenated using entries in successive levels of the configuration database.The full syntax of filter is: "Manufacturer::Platform::Project type::Executionenvironment::Activity::Connection type".If you specify an incomplete filter, then --cdb-list shows the entries in the next level of theconfiguration database. So if you do not specify a filter, --cdb-list shows theManufacturer entries from the first level of the configuration database. If you specify a filterusing entries from the first and second levels of the database, then --cdb-list shows theProject type entries within the specified Platform. If you specify the complete filter then--cdb-list lists the parameters that need to be specified using --cdb-list-param.
Note
• The entries in the configuration database are case-sensitive.• Connection type refers to DSTREAM or RVI, so there is no Connection type when
connecting to a model.
To list all first level entries in the configuration database, use:
debugger --cdb-list
For example, to list all the configuration database entries for the manufacturer Altera, use:
debugger --cdb-list="Altera"
8 Running DS-5 Debugger from the operating system command-line or from a script8.2 Command-line debugger options
ARM DUI0446Z Copyright © 2010-2016 ARM Limited or its affiliates. All rightsreserved.
8-205
Non-Confidential
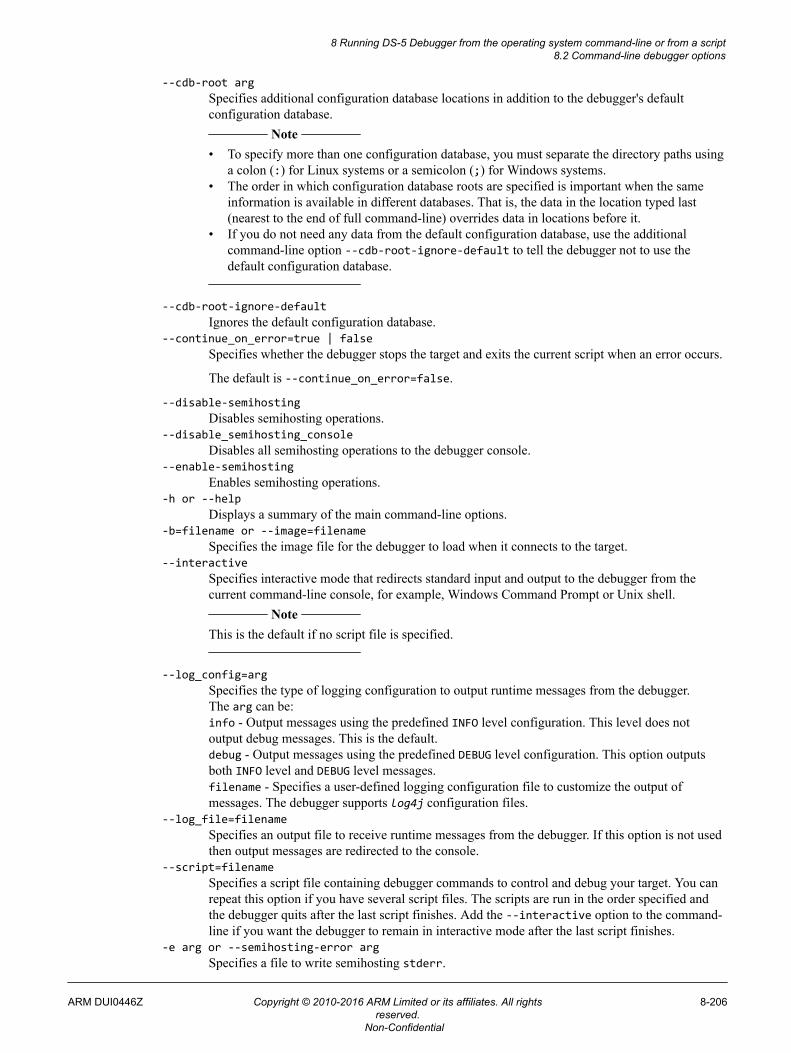
--cdb-root argSpecifies additional configuration database locations in addition to the debugger's defaultconfiguration database.
Note
• To specify more than one configuration database, you must separate the directory paths usinga colon (:) for Linux systems or a semicolon (;) for Windows systems.
• The order in which configuration database roots are specified is important when the sameinformation is available in different databases. That is, the data in the location typed last(nearest to the end of full command-line) overrides data in locations before it.
• If you do not need any data from the default configuration database, use the additionalcommand-line option --cdb-root-ignore-default to tell the debugger not to use thedefault configuration database.
--cdb-root-ignore-defaultIgnores the default configuration database.
--continue_on_error=true | falseSpecifies whether the debugger stops the target and exits the current script when an error occurs.
The default is --continue_on_error=false.
--disable-semihostingDisables semihosting operations.
--disable_semihosting_consoleDisables all semihosting operations to the debugger console.
--enable-semihostingEnables semihosting operations.
-h or --helpDisplays a summary of the main command-line options.
-b=filename or --image=filenameSpecifies the image file for the debugger to load when it connects to the target.
--interactiveSpecifies interactive mode that redirects standard input and output to the debugger from thecurrent command-line console, for example, Windows Command Prompt or Unix shell.
Note
This is the default if no script file is specified.
--log_config=argSpecifies the type of logging configuration to output runtime messages from the debugger.The arg can be:info - Output messages using the predefined INFO level configuration. This level does notoutput debug messages. This is the default.debug - Output messages using the predefined DEBUG level configuration. This option outputsboth INFO level and DEBUG level messages.filename - Specifies a user-defined logging configuration file to customize the output ofmessages. The debugger supports log4j configuration files.
--log_file=filenameSpecifies an output file to receive runtime messages from the debugger. If this option is not usedthen output messages are redirected to the console.
--script=filenameSpecifies a script file containing debugger commands to control and debug your target. You canrepeat this option if you have several script files. The scripts are run in the order specified andthe debugger quits after the last script finishes. Add the --interactive option to the command-line if you want the debugger to remain in interactive mode after the last script finishes.
-e arg or --semihosting-error argSpecifies a file to write semihosting stderr.
8 Running DS-5 Debugger from the operating system command-line or from a script8.2 Command-line debugger options
ARM DUI0446Z Copyright © 2010-2016 ARM Limited or its affiliates. All rightsreserved.
8-206
Non-Confidential
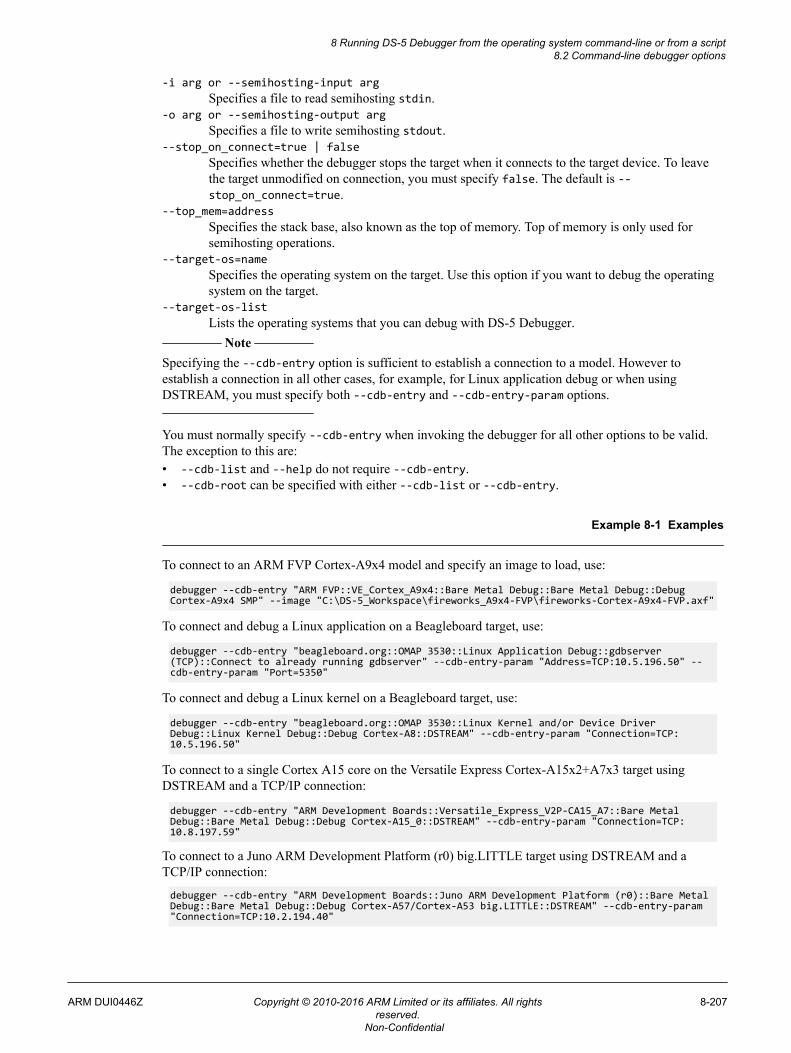
-i arg or --semihosting-input argSpecifies a file to read semihosting stdin.
-o arg or --semihosting-output argSpecifies a file to write semihosting stdout.
--stop_on_connect=true | falseSpecifies whether the debugger stops the target when it connects to the target device. To leavethe target unmodified on connection, you must specify false. The default is --stop_on_connect=true.
--top_mem=addressSpecifies the stack base, also known as the top of memory. Top of memory is only used forsemihosting operations.
--target-os=nameSpecifies the operating system on the target. Use this option if you want to debug the operatingsystem on the target.
--target-os-listLists the operating systems that you can debug with DS-5 Debugger.
Note
Specifying the --cdb-entry option is sufficient to establish a connection to a model. However toestablish a connection in all other cases, for example, for Linux application debug or when usingDSTREAM, you must specify both --cdb-entry and --cdb-entry-param options.
You must normally specify --cdb-entry when invoking the debugger for all other options to be valid.The exception to this are:• --cdb-list and --help do not require --cdb-entry.• --cdb-root can be specified with either --cdb-list or --cdb-entry.
Example 8-1 Examples
To connect to an ARM FVP Cortex-A9x4 model and specify an image to load, use:
debugger --cdb-entry "ARM FVP::VE_Cortex_A9x4::Bare Metal Debug::Bare Metal Debug::Debug Cortex-A9x4 SMP" --image "C:\DS-5_Workspace\fireworks_A9x4-FVP\fireworks-Cortex-A9x4-FVP.axf"
To connect and debug a Linux application on a Beagleboard target, use:
debugger --cdb-entry "beagleboard.org::OMAP 3530::Linux Application Debug::gdbserver (TCP)::Connect to already running gdbserver" --cdb-entry-param "Address=TCP:10.5.196.50" --cdb-entry-param "Port=5350"
To connect and debug a Linux kernel on a Beagleboard target, use:
debugger --cdb-entry "beagleboard.org::OMAP 3530::Linux Kernel and/or Device Driver Debug::Linux Kernel Debug::Debug Cortex-A8::DSTREAM" --cdb-entry-param "Connection=TCP:10.5.196.50"
To connect to a single Cortex A15 core on the Versatile Express Cortex-A15x2+A7x3 target usingDSTREAM and a TCP/IP connection:
debugger --cdb-entry "ARM Development Boards::Versatile_Express_V2P-CA15_A7::Bare Metal Debug::Bare Metal Debug::Debug Cortex-A15_0::DSTREAM" --cdb-entry-param "Connection=TCP:10.8.197.59"
To connect to a Juno ARM Development Platform (r0) big.LITTLE target using DSTREAM and aTCP/IP connection:
debugger --cdb-entry "ARM Development Boards::Juno ARM Development Platform (r0)::Bare Metal Debug::Bare Metal Debug::Debug Cortex-A57/Cortex-A53 big.LITTLE::DSTREAM" --cdb-entry-param "Connection=TCP:10.2.194.40"
8 Running DS-5 Debugger from the operating system command-line or from a script8.2 Command-line debugger options
ARM DUI0446Z Copyright © 2010-2016 ARM Limited or its affiliates. All rightsreserved.
8-207
Non-Confidential
Tip
Once a debugger connection has been established, type quit when you want to exit theconnection.
Related tasks2.2 Launching DS-5 and connecting to DS-5 Debugger on page 2-36.
Related references8.6 DS-5 Debugger command-line console keyboard shortcuts on page 8-215.7.1 Exporting DS-5 Debugger commands generated during a debug session on page 7-172.3.17 Using semihosting to access resources on the host computer on page 3-95.
Related informationDS-5 Debugger commands.
8 Running DS-5 Debugger from the operating system command-line or from a script8.2 Command-line debugger options
ARM DUI0446Z Copyright © 2010-2016 ARM Limited or its affiliates. All rightsreserved.
8-208
Non-Confidential
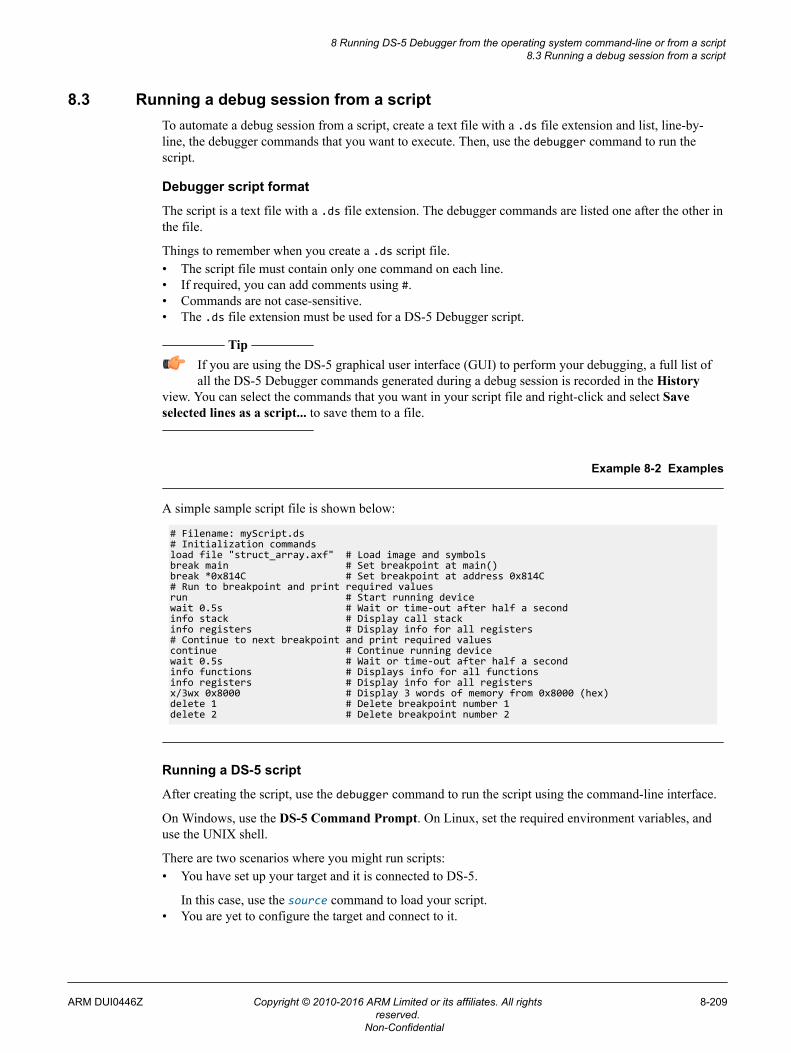
8.3 Running a debug session from a scriptTo automate a debug session from a script, create a text file with a .ds file extension and list, line-by-line, the debugger commands that you want to execute. Then, use the debugger command to run thescript.
Debugger script format
The script is a text file with a .ds file extension. The debugger commands are listed one after the other inthe file.
Things to remember when you create a .ds script file.• The script file must contain only one command on each line.• If required, you can add comments using #.• Commands are not case-sensitive.• The .ds file extension must be used for a DS-5 Debugger script.
Tip
If you are using the DS-5 graphical user interface (GUI) to perform your debugging, a full list ofall the DS-5 Debugger commands generated during a debug session is recorded in the History
view. You can select the commands that you want in your script file and right-click and select Saveselected lines as a script... to save them to a file.
Example 8-2 Examples
A simple sample script file is shown below:
# Filename: myScript.ds# Initialization commandsload file "struct_array.axf" # Load image and symbolsbreak main # Set breakpoint at main()break *0x814C # Set breakpoint at address 0x814C# Run to breakpoint and print required valuesrun # Start running devicewait 0.5s # Wait or time-out after half a secondinfo stack # Display call stackinfo registers # Display info for all registers# Continue to next breakpoint and print required valuescontinue # Continue running devicewait 0.5s # Wait or time-out after half a secondinfo functions # Displays info for all functionsinfo registers # Display info for all registersx/3wx 0x8000 # Display 3 words of memory from 0x8000 (hex)delete 1 # Delete breakpoint number 1delete 2 # Delete breakpoint number 2
Running a DS-5 script
After creating the script, use the debugger command to run the script using the command-line interface.
On Windows, use the DS-5 Command Prompt. On Linux, set the required environment variables, anduse the UNIX shell.
There are two scenarios where you might run scripts:• You have set up your target and it is connected to DS-5.
In this case, use the source command to load your script.• You are yet to configure the target and connect to it.
8 Running DS-5 Debugger from the operating system command-line or from a script8.3 Running a debug session from a script
ARM DUI0446Z Copyright © 2010-2016 ARM Limited or its affiliates. All rightsreserved.
8-209
Non-Confidential
In this case, you have to use the appropriate debugger options and arguments to configure andconnect to your target. Along with the configuration options, use the --script= filename option torun your script.
For example:
debugger --cdb-entry "ARM Development Boards::Versatile Express A9x4::Bare MetalDebug::Bare Metal SMP Debug of all cores::Debug Cortex-A9x4 SMP::DSTREAM"--cdb-entry-param "Connection=TCP:10.5.20.64" --cdb-entry-param "dtsl_options_file=C:\DS-5_Workspace\my_dtsl_settings.dtslprops" --script= C:\DS-5_Workspace\my_script.txt
See Specifying a custom configuration database using the command-line on page 8-211 andCapturing trace data using the command-line debugger on page 8-213 for examples of howdebugger options and arguments are used.
8 Running DS-5 Debugger from the operating system command-line or from a script8.3 Running a debug session from a script
ARM DUI0446Z Copyright © 2010-2016 ARM Limited or its affiliates. All rightsreserved.
8-210
Non-Confidential
8.4 Specifying a custom configuration database using the command-lineSome targets might not be available in the default DS-5 configuration database. For example, a customtarget which is available only to you. In this case, you can specify a custom configuration database whichcontains the details for your target.
Use the DS-5 Debugger command-line options to view the entries in your custom configuration databaseand determine the connection names. Then, use additional commands and options to specify the detailsof your configuration database and connect to your target.
Procedure1. Launch a DS-5 command-line console.
• On Windows, select Start > All Programs > ARM DS-5 > DS-5 Command Prompt.• On Linux:
— Add the DS-5_install_directory/bin directory to your PATH environment variable. If it isalready configured, then you can skip this step.
— Open a terminal.2. List the entries in the user-specified configuration databases. Use the following syntax:
• On Windows, enter: debugger --cdb-list --cdb-root path_to_cdb1[;path_to_cdb2]. Forexample, debugger --cdb-list --cdb-root C:\DS-5_Workspace\MyConfigDB1;DS-5_Workspace\MyConfigDB2
• On Linux, enter: debugger --cdb-list --cdb-root path_to_cdb1[:path_to_cdb2]. Forexample, debugger --cdb-list --cdb-root /DS-5_Workspace/MyConfigDB1:DS-5_Workspace/MyConfigDB2
Where:debugger
Is the command to invoke the DS-5 Debugger.--cdb-list
Is the option to list the entries in the configuration database.--cdb-root
Is the option to specify the path to one or more configuration databases.path_to_cdb1 and path_to_cdb2
Are the directory paths to the configuration databases. Note
DS-5 Debugger processes configuration databases from left to right. The information fromprocessed databases are replaced with information from databases that are processed later.
For example, if you want to produce a modified Cortex-A15 processor definition withdifferent registers, then those changes can be added to a new database that resides at the endof the list on the command-line.
3. When you have determined the details of your target, use the following command-line syntax toconnect to the target in your custom configuration database:debugger --cdb-entry "Manufacturer::Platform::Project type::Executionenvironment::Activity::Connection type" --cdb-root path_to_cdb1
For example, on Windows:
debugger --cdb-entry "ARM Development Boards::Versatile Express A9x4::Bare MetalDebug::Bare Metal SMP Debug of all cores::Debug Cortex-A9x4 SMP::DSTREAM" --cdb-entry-param "Connection=USB:000271" --cdb-root C:\DS-5_Workspace\MyConfigDB1
Where:debugger
Is the command to invoke DS-5 Debugger.
8 Running DS-5 Debugger from the operating system command-line or from a script8.4 Specifying a custom configuration database using the command-line
ARM DUI0446Z Copyright © 2010-2016 ARM Limited or its affiliates. All rightsreserved.
8-211
Non-Confidential
--cdb-entrySpecifies the target to connect to.
Manufacturer::Platform::Project type::Execution environment::Activity::Connectiontype
Correspond to the entries in your custom configuration database. The entries have a tree datastructure, where each entry has entries within it.
--cdb-rootIs the command to specify your custom configuration database.
path_to_cdb1Is the directory path to your configuration database.
Note
• If you do not need any data from the default configuration database, use the additional commandline option --cdb-root-ignore-default to tell the debugger not to use the default configurationdatabase.
• To specify more than one configuration database, you must separate the directory paths using acolon or semicolon for a Linux or Windows system respectively.
• If connection parameters are required, specify them using the --cdb-entry-param option.
Related concepts8.1 Overview: Running DS-5 Debugger from the command-line or from a script on page 8-203.
Related references8.2 Command-line debugger options on page 8-204.
8 Running DS-5 Debugger from the operating system command-line or from a script8.4 Specifying a custom configuration database using the command-line
ARM DUI0446Z Copyright © 2010-2016 ARM Limited or its affiliates. All rightsreserved.
8-212
Non-Confidential
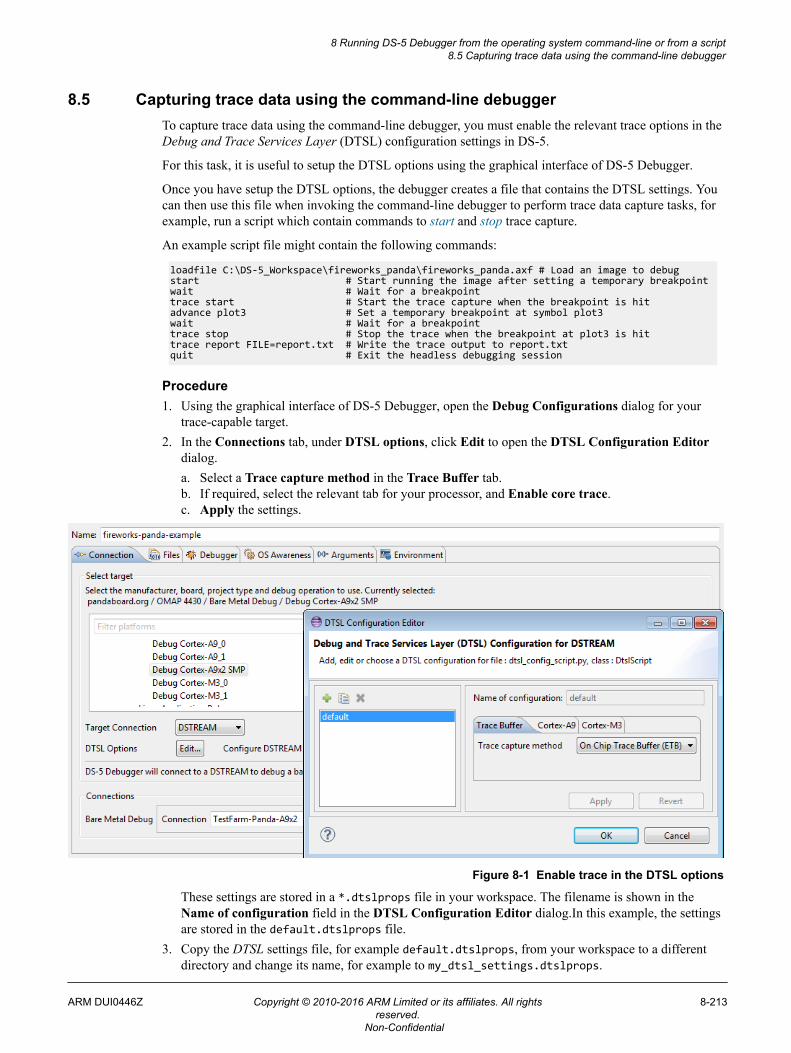
8.5 Capturing trace data using the command-line debuggerTo capture trace data using the command-line debugger, you must enable the relevant trace options in theDebug and Trace Services Layer (DTSL) configuration settings in DS-5.
For this task, it is useful to setup the DTSL options using the graphical interface of DS-5 Debugger.
Once you have setup the DTSL options, the debugger creates a file that contains the DTSL settings. Youcan then use this file when invoking the command-line debugger to perform trace data capture tasks, forexample, run a script which contain commands to start and stop trace capture.
An example script file might contain the following commands:
loadfile C:\DS-5_Workspace\fireworks_panda\fireworks_panda.axf # Load an image to debugstart # Start running the image after setting a temporary breakpointwait # Wait for a breakpointtrace start # Start the trace capture when the breakpoint is hitadvance plot3 # Set a temporary breakpoint at symbol plot3wait # Wait for a breakpoint trace stop # Stop the trace when the breakpoint at plot3 is hittrace report FILE=report.txt # Write the trace output to report.txtquit # Exit the headless debugging session
Procedure1. Using the graphical interface of DS-5 Debugger, open the Debug Configurations dialog for your
trace-capable target.2. In the Connections tab, under DTSL options, click Edit to open the DTSL Configuration Editor
dialog.a. Select a Trace capture method in the Trace Buffer tab.b. If required, select the relevant tab for your processor, and Enable core trace.c. Apply the settings.
Figure 8-1 Enable trace in the DTSL options
These settings are stored in a *.dtslprops file in your workspace. The filename is shown in theName of configuration field in the DTSL Configuration Editor dialog.In this example, the settingsare stored in the default.dtslprops file.
3. Copy the DTSL settings file, for example default.dtslprops, from your workspace to a differentdirectory and change its name, for example to my_dtsl_settings.dtslprops.
8 Running DS-5 Debugger from the operating system command-line or from a script8.5 Capturing trace data using the command-line debugger
ARM DUI0446Z Copyright © 2010-2016 ARM Limited or its affiliates. All rightsreserved.
8-213
Non-Confidential
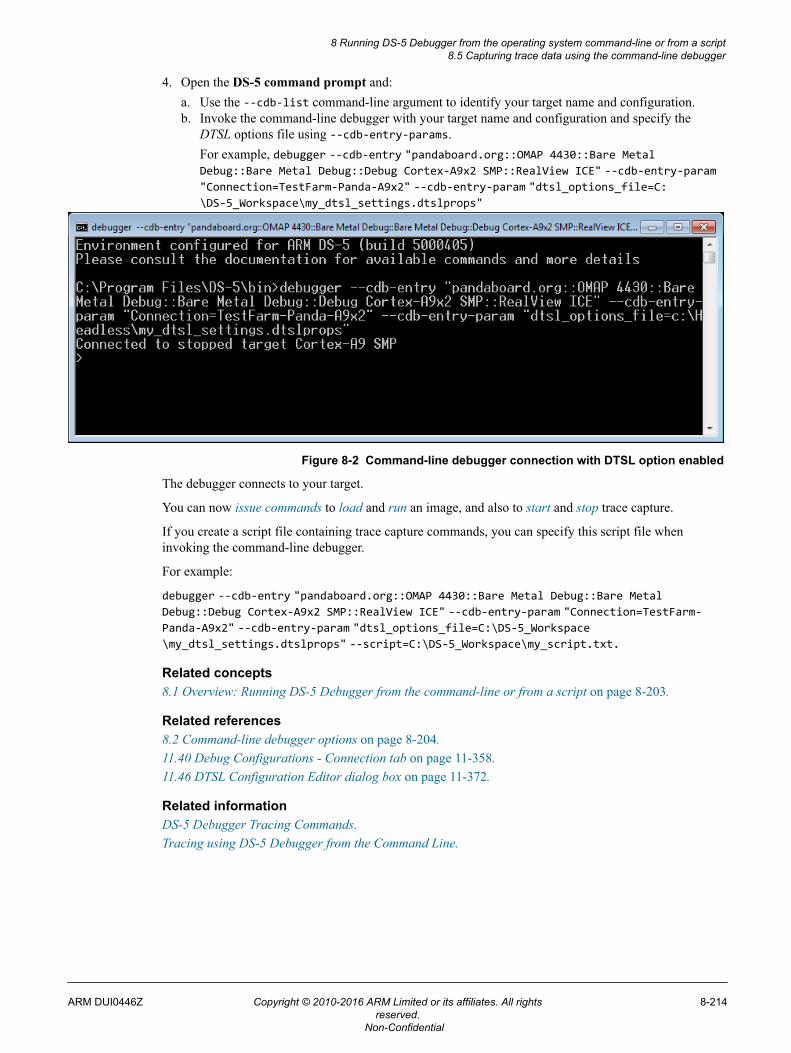
4. Open the DS-5 command prompt and:a. Use the --cdb-list command-line argument to identify your target name and configuration.b. Invoke the command-line debugger with your target name and configuration and specify the
DTSL options file using --cdb-entry-params.For example, debugger --cdb-entry "pandaboard.org::OMAP 4430::Bare MetalDebug::Bare Metal Debug::Debug Cortex-A9x2 SMP::RealView ICE" --cdb-entry-param"Connection=TestFarm-Panda-A9x2" --cdb-entry-param "dtsl_options_file=C:\DS-5_Workspace\my_dtsl_settings.dtslprops"
Figure 8-2 Command-line debugger connection with DTSL option enabled
The debugger connects to your target.
You can now issue commands to load and run an image, and also to start and stop trace capture.
If you create a script file containing trace capture commands, you can specify this script file wheninvoking the command-line debugger.
For example:
debugger --cdb-entry "pandaboard.org::OMAP 4430::Bare Metal Debug::Bare MetalDebug::Debug Cortex-A9x2 SMP::RealView ICE" --cdb-entry-param "Connection=TestFarm-Panda-A9x2" --cdb-entry-param "dtsl_options_file=C:\DS-5_Workspace\my_dtsl_settings.dtslprops" --script=C:\DS-5_Workspace\my_script.txt.
Related concepts8.1 Overview: Running DS-5 Debugger from the command-line or from a script on page 8-203.
Related references8.2 Command-line debugger options on page 8-204.11.40 Debug Configurations - Connection tab on page 11-358.11.46 DTSL Configuration Editor dialog box on page 11-372.
Related informationDS-5 Debugger Tracing Commands.Tracing using DS-5 Debugger from the Command Line.
8 Running DS-5 Debugger from the operating system command-line or from a script8.5 Capturing trace data using the command-line debugger
ARM DUI0446Z Copyright © 2010-2016 ARM Limited or its affiliates. All rightsreserved.
8-214
Non-Confidential
8.6 DS-5 Debugger command-line console keyboard shortcutsDS-5 Debugger provides editing features, a command history, and common keyboard shortcuts to usewhen debugging from the command-line.
Each command you enter is stored in the command history. Use the UP and DOWN arrow keys tonavigate through the command history, to find and reissue a previous command.
To make editing commands and navigating the command history easier, you can use the followingkeyboard shortcuts:
Ctrl+AMove the cursor to the start of the line.
Ctrl+DQuit the debugger console.
Ctrl+EMove the cursor to the end of the line.
Ctrl+NSearch forward through the command history for the currently entered text.
Ctrl+PSearch back through the command history for the currently entered text.
Ctrl+WDelete the last word.
DOWN arrowNavigate down through the command history.
UP arrowNavigate up through the command history.
Related tasks8.2 Command-line debugger options on page 8-204.
8 Running DS-5 Debugger from the operating system command-line or from a script8.6 DS-5 Debugger command-line console keyboard shortcuts
ARM DUI0446Z Copyright © 2010-2016 ARM Limited or its affiliates. All rightsreserved.
8-215
Non-Confidential
Chapter 9Working with the Snapshot Viewer
This chapter describes how to work with the Snapshot Viewer.
It contains the following sections:• 9.1 About the Snapshot Viewer on page 9-217.• 9.2 Components of a Snapshot Viewer initialization file on page 9-219.• 9.3 Connecting to the Snapshot Viewer on page 9-222.• 9.4 Considerations when creating debugger scripts for the Snapshot Viewer on page 9-223.
ARM DUI0446Z Copyright © 2010-2016 ARM Limited or its affiliates. All rightsreserved.
9-216
Non-Confidential
9.1 About the Snapshot ViewerUse the Snapshot Viewer to analyze a snapshot representation of the application state of one or moreprocessors in scenarios where interactive debugging is not possible.
To enable debugging of an application using the Snapshot Viewer, you must have the following data:
• Register Values• Memory Values• Debug Symbols.
If you are unable to provide all of this data, then the level of debug that is available is compromised.Capturing this data is specific to your application, and no tools are provided to help with this. You mighthave to install exception or signal handlers to catch erroneous situations in your application and dumpthe required data out.
You must also consider how to get the dumped data from your device onto a workstation that isaccessible by the debugger. Some suggestions on how to do this are to:• Write the data to a file on the host workstation using semihosting.• Send the data over a UART to a terminal.• Send the data over a socket using TCP/IP.
Register values
Register values are used to emulate the state of the original system at a particular point in time. The mostimportant registers are those in the current processor mode. For example, on an ARMv4 architectureprocessor these registers are R0-R15 and also the Program Status Registers (PSRs):
• Current Program Status Register (CPSR)• Application Program Status Register (APSR)• Saved Program Status Register (SPSR).
Be aware that on many ARM processors, an exception, a data abort, causes a switch to a differentprocessor mode. In this case, you must ensure that the register values you use reflect the correct mode inwhich the exception occurred, rather than the register values within your exception handler.
If your application uses floating-point data and your device contains vector floating-point hardware, thenyou must also provide the Snapshot Viewer with the contents of the vector floating-point registers. Theimportant registers to capture are:• Floating-point Status and Control Register (FPSCR)• Floating-Point EXCeption register (FPEXC)• Single precision registers (Sn)• Double precision registers (Dn)• Quad precision registers (Qn).
Memory values
The majority of the application state is usually stored in memory in the form of global variables, the heapand the stack. Due to size constraints, it is often difficult to provide the Snapshot Viewer with a copy ofthe entire contents of memory. In this case, you must carefully consider the areas of memory that are ofparticular importance.
If you are debugging a crash, the most useful information to find out is often the call stack, because thisshows the calling sequence of each function prior to the exception and the values of all the respectivefunction parameters. To show the call stack, the debugger must know the current stack pointer and haveaccess to the contents of the memory that contains the stack. By default, on ARM processors, the stackgrows downwards, you must provide the memory starting from the current stack pointer and going up inmemory until the beginning of the stack is reached. If you are unable to provide the entire contents of thestack, then a smaller portion starting at the current stack pointer is still useful because it provides themost recent function calls.
9 Working with the Snapshot Viewer9.1 About the Snapshot Viewer
ARM DUI0446Z Copyright © 2010-2016 ARM Limited or its affiliates. All rightsreserved.
9-217
Non-Confidential
If your application uses global (extern or file static) data, then providing the corresponding memoryvalues enables you to view the variables within the debugger.
If you have local or global variables that point to heap data, then you might want to follow the relevantpointers in the debugger to examine the data. To do this you must have provided the contents of the heapto the Snapshot Viewer. Be aware that heap can often occupy a large memory range, so it might not bepossible to capture the entire heap. The layout of the heap in memory and the data structures that controlheap allocation are often specific to the application or the C library, see the relevant documentation formore information.
To debug at the disassembly level, the debugger must have access to the memory values where theapplication code is located. It is often not necessary to capture the contents of the memory containing thecode, because identical data can often be extracted directly from the image using processing tools such asfromelf. However, some complications to be aware of are:• Self-modifying code where the values in the image and memory can vary.• Dynamic relocation of the memory address within the image at runtime.
Debug symbolsThe debugger requires debug information to display high-level information about your application, forexample:• Source code• Variable values and types• Structures• Call stack.
This information is stored by the compiler and linker within the application image, so you must ensurethat you have a local debug copy of the same image that you are running on your device. The amount ofdebug information that is stored in the image, and therefore the resulting quality of your debug session,can be affected by the debug and optimization settings passed to the compiler and linker.
It is common to strip out as much of the debug information as possible when running an image on anembedded device. In such cases, try to use the original unstripped image for debugging purposes.
Related tasks9.3 Connecting to the Snapshot Viewer on page 9-222.
Related references9.2 Components of a Snapshot Viewer initialization file on page 9-219.9.4 Considerations when creating debugger scripts for the Snapshot Viewer on page 9-223.
9 Working with the Snapshot Viewer9.1 About the Snapshot Viewer
ARM DUI0446Z Copyright © 2010-2016 ARM Limited or its affiliates. All rightsreserved.
9-218
Non-Confidential
9.2 Components of a Snapshot Viewer initialization fileDescribes the groups and sections used to create a Snapshot Viewer initialization file.
The Snapshot Viewer initialization file is a simple text file consisting of one or more sections thatemulate the state of the original system. Each section uses an option=value structure.
Before creating a Snapshot Viewer initialization file you must ensure that you have:
• One or more binary files containing a snapshot of the application that you want to analyze. Note
The binary files must be formatted correctly in accordance with the following restrictions.
• Details of the type of processor.• Details of the memory region addresses and offset values.• Details of the last known register values.
To create a Snapshot Viewer initialization file, you must add grouped sections as required from thefollowing list and save the file with .ini for the file extension.[device]
A section for information about the processor or device. The following options can be used:name
This is the name that is reported from RDDI and is used to identify the device. Thisvalue is necessary and must be unique to each device.
classThe general type of device, for example core, or trace_source.
typeThe specific device type, for example Cortex-A9, or ETM.
locationThis describes how the agent that produced the snapshot locates the device.
[dump]One or more sections for contiguous memory regions stored in a binary file. The followingoptions can be used:file
Location of the binary file.address
Memory start address for the specified region.length
Length of the region. If none specified then the default is the rest of file from the offsetvalue.
offsetOffset of the specified region from the start of the file. If none specified then the defaultis zero.
9 Working with the Snapshot Viewer9.2 Components of a Snapshot Viewer initialization file
ARM DUI0446Z Copyright © 2010-2016 ARM Limited or its affiliates. All rightsreserved.
9-219
Non-Confidential
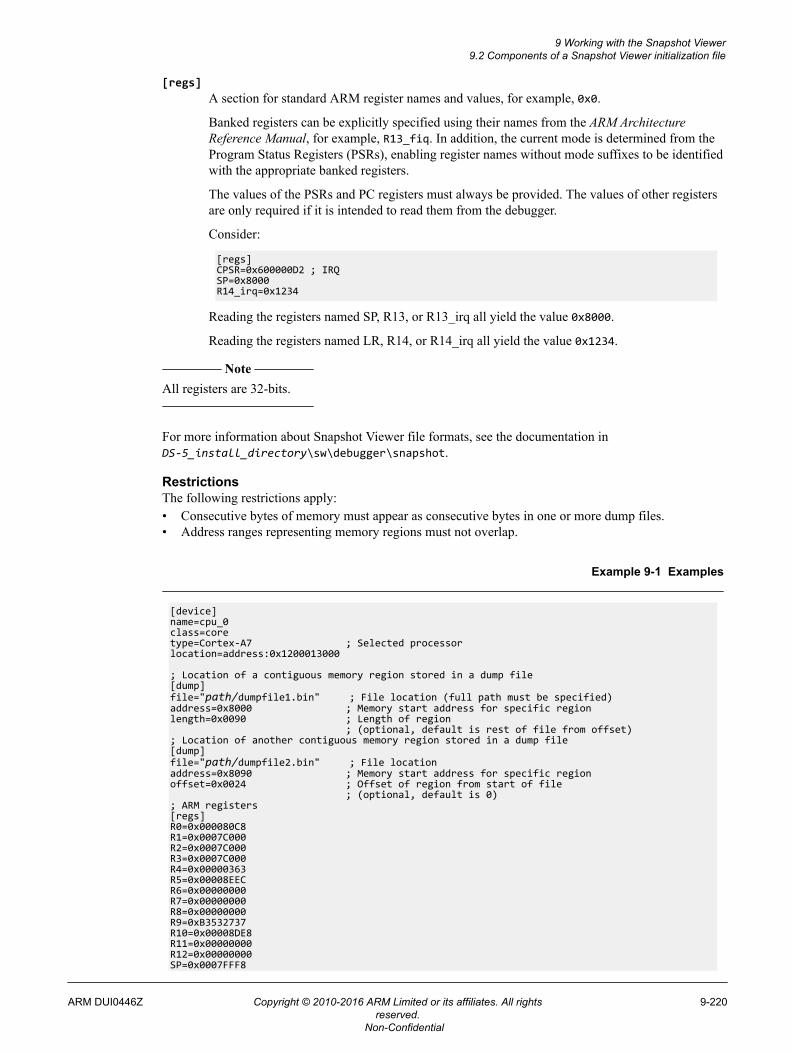
[regs]A section for standard ARM register names and values, for example, 0x0.
Banked registers can be explicitly specified using their names from the ARM ArchitectureReference Manual, for example, R13_fiq. In addition, the current mode is determined from theProgram Status Registers (PSRs), enabling register names without mode suffixes to be identifiedwith the appropriate banked registers.
The values of the PSRs and PC registers must always be provided. The values of other registersare only required if it is intended to read them from the debugger.
Consider:
[regs]CPSR=0x600000D2 ; IRQSP=0x8000R14_irq=0x1234
Reading the registers named SP, R13, or R13_irq all yield the value 0x8000.
Reading the registers named LR, R14, or R14_irq all yield the value 0x1234.
Note
All registers are 32-bits.
For more information about Snapshot Viewer file formats, see the documentation inDS-5_install_directory\sw\debugger\snapshot.
RestrictionsThe following restrictions apply:• Consecutive bytes of memory must appear as consecutive bytes in one or more dump files.• Address ranges representing memory regions must not overlap.
Example 9-1 Examples
[device]name=cpu_0class=coretype=Cortex-A7 ; Selected processorlocation=address:0x1200013000
; Location of a contiguous memory region stored in a dump file[dump]file="path/dumpfile1.bin" ; File location (full path must be specified)address=0x8000 ; Memory start address for specific regionlength=0x0090 ; Length of region ; (optional, default is rest of file from offset); Location of another contiguous memory region stored in a dump file[dump]file="path/dumpfile2.bin" ; File locationaddress=0x8090 ; Memory start address for specific regionoffset=0x0024 ; Offset of region from start of file ; (optional, default is 0); ARM registers[regs]R0=0x000080C8R1=0x0007C000R2=0x0007C000R3=0x0007C000R4=0x00000363R5=0x00008EECR6=0x00000000R7=0x00000000R8=0x00000000R9=0xB3532737R10=0x00008DE8R11=0x00000000R12=0x00000000SP=0x0007FFF8
9 Working with the Snapshot Viewer9.2 Components of a Snapshot Viewer initialization file
ARM DUI0446Z Copyright © 2010-2016 ARM Limited or its affiliates. All rightsreserved.
9-220
Non-Confidential
LR=0x0000808DPC=0x000080B8
Related concepts9.1 About the Snapshot Viewer on page 9-217.
Related tasks9.3 Connecting to the Snapshot Viewer on page 9-222.
Related references9.4 Considerations when creating debugger scripts for the Snapshot Viewer on page 9-223.
Related informationARM Architecture Reference Manual.
9 Working with the Snapshot Viewer9.2 Components of a Snapshot Viewer initialization file
ARM DUI0446Z Copyright © 2010-2016 ARM Limited or its affiliates. All rightsreserved.
9-221
Non-Confidential
9.3 Connecting to the Snapshot ViewerDescribes how to launch the debugger from a command-line console and connect to the SnapshotViewer.
A Snapshot Viewer provides a virtual target that you can use to analyze a snapshot of a known systemstate using the debugger.
Prerequisites
Before connecting you must ensure that you have a Snapshot Viewer initialization file containing staticinformation about a target at a specific point in time. For example, the contents of registers, memory andprocessor state.
Procedure• Launch the debugger in the command-line console using --target command-line option to pass the
Snapshot Viewer initialization file to the debugger.
debugger --target=int.ini --script=int.cmm
Related concepts9.1 About the Snapshot Viewer on page 9-217.
Related tasks8.2 Command-line debugger options on page 8-204.
Related references9.2 Components of a Snapshot Viewer initialization file on page 9-219.9.4 Considerations when creating debugger scripts for the Snapshot Viewer on page 9-223.8.6 DS-5 Debugger command-line console keyboard shortcuts on page 8-215.
9 Working with the Snapshot Viewer9.3 Connecting to the Snapshot Viewer
ARM DUI0446Z Copyright © 2010-2016 ARM Limited or its affiliates. All rightsreserved.
9-222
Non-Confidential
9.4 Considerations when creating debugger scripts for the Snapshot ViewerShows a typical example of an initialization file for use with the Snapshot Viewer.
The Snapshot Viewer uses an initialization file that emulates the state of the original system. Thesymbols are loaded from the image using the data.load.elf command with the /nocode /noregarguments.
The snapshot data and registers are read-only and so the commands you can use are limited.
The following example shows a script using CMM-style commands to analyze the contents of thetypes_m3.axf image.
var.print "Connect and load symbols:"system.updata.load.elf "types_m3.axf" /nocode /noreg;Arrays and pointers to arraysvar.print ""var.print "Arrays and pointers to arrays:"var.print "Value of i_array[9999] is " i_array[9999]var.print "Value of *(i_array+9999) is " *(i_array+9999)var.print "Value of d_array[1][5] is " d_array[1][5]var.print "Values of *((*d_array)+9) is " *((*d_array)+9)var.print "Values of *((*d_array)) is " *((*d_array))var.print "Value of &d_array[5][5] is " &d_array[5][5];Display 0x100 bytes from address in register PCvar.print ""var.print "Display 0x100 bytes from address in register PC:"data.dump r(PC)++0x100;Structures and bit-fieldsvar.print ""var.print "Structures and bit-fields:"var.print "Value of values2.no is " values2.novar.print "Value of ptr_values->no is " ptr_values->novar.print "Value of values2.name is " values2.namevar.print "Value of ptr_values->name is " ptr_values->namevar.print "Value of values2.name[0] is " values2.name[0]var.print "Value of (*ptr_values).name is " (*ptr_values).namevar.print "Value of values2.f1 is " values2.f1var.print "Value of values2.f2 is " values2.f2var.print "Value of ptr_values->f1 is " ptr_values->f1var.print ""var.print "Disconnect:"system.down
Related concepts9.1 About the Snapshot Viewer on page 9-217.
Related tasks9.3 Connecting to the Snapshot Viewer on page 9-222.
Related references9.2 Components of a Snapshot Viewer initialization file on page 9-219.
9 Working with the Snapshot Viewer9.4 Considerations when creating debugger scripts for the Snapshot Viewer
ARM DUI0446Z Copyright © 2010-2016 ARM Limited or its affiliates. All rightsreserved.
9-223
Non-Confidential
Chapter 10Platform Configuration
You can configure models and hardware platforms using DS-5.
It contains the following sections:• 10.1 DS-5 Configuration perspective on page 10-225.• 10.2 About importing platform and model configurations on page 10-226.• 10.3 About platform bring-up in DS-5 on page 10-228.• 10.4 ARM debug and trace architecture on page 10-229.• 10.5 About the Platform Configuration Editor view on page 10-230.• 10.6 Creating a platform configuration on page 10-231.• 10.7 Editing a platform configuration in the PCE on page 10-236.• 10.8 About the device hierarchy in the PCE view on page 10-242.• 10.9 Manual platform configuration on page 10-244.• 10.10 Configuring your debug hardware unit for platform autodetection on page 10-246.• 10.11 Creating a new model configuration on page 10-248.• 10.12 Importing a custom model on page 10-250.• 10.13 Model Devices and Cluster Configuration on page 10-252.• 10.14 Adding a configuration database to DS-5 on page 10-253.• 10.15 Configuration Database panel on page 10-255.• 10.16 Extending your configuration database on page 10-257.
ARM DUI0446Z Copyright © 2010-2016 ARM Limited or its affiliates. All rightsreserved.
10-224
Non-Confidential
10.1 DS-5 Configuration perspectiveThe DS-5 Configuration perspective enables you to import and manage configurations for models andhardware platforms.
To access the DS-5 Configuration perspective, click Window > Open Perspective > DS-5Configuration from the main menu.
Use the DS-5 Configuration perspective to:
• Create a new DS-5 Debug Configuration Database• View and configure models in the Model Configurations Editor.• View and configure platforms in the Platform Configurations Editor.• Import the configurations of your custom models and platforms into your DS-5 Debug Configuration
Database.• Create a launch configuration for the new model or platform configuration.
From the DS-5 Configuration perspective, you can use the Tools menu to access the following tools:• Debug Hardware Firmware Installer• Debug Hardware Configure IP.
10 Platform Configuration10.1 DS-5 Configuration perspective
ARM DUI0446Z Copyright © 2010-2016 ARM Limited or its affiliates. All rightsreserved.
10-225
Non-Confidential
10.2 About importing platform and model configurationsThe Platform Configuration Editor and Model Configuration Editor views enable you to import platformand model information into DS-5. This enables you to easily provide debug and trace support forplatforms and models through RVI, DSTREAM, VSTREAM, or model connections.
The DS-5 Configuration Database holds the platform configuration and connection settings in DS-5. Youcan create new platform configurations in a new configuration database, which can extend the defaultconfiguration database.
Note
If there is already a configuration for your platform in the DS-5 Configuration Database, then you canuse the existing configuration to connect to the platform, as described in 2.3 Configuring a connection toa bare-metal hardware target on page 2-38. You do not have to use the Platform Configuration Editorunless you want to modify the platform configuration.
To create a new configuration, DS-5 uses information from:
• A configuration file, for a platform, created and saved using the Platform Configuration Editor.• A configuration file, for a model that provides a CADI server, created and saved using the Model
Configuration Editor. The model can be already running or you can specify the path and filename tothe executable file.
You can create the following debug operations:
• Single processor and Symmetric MultiProcessing (SMP) bare-metal debug for hardware and models.• Single processor and SMP Linux kernel debug for hardware.• Linux application debug configurations for hardware.• big.LITTLE configurations for cores that support big.LITTLE operation, such as Cortex-A15/Cortex-
A7.
For hardware targets where a trace subsystem is present, appropriate Debug and Trace Services Layer(DTSL) options are produced. These can include:
• Selection of on-chip (Embedded Trace Buffer (ETB), Micro Trace Buffer (MTB), Trace MemoryController (TMC) or other on-chip buffer) or off-chip (DSTREAMtrace buffer) trace capture.
• Cycle-accurate trace capture.• Trace capture range.• Configuration and capture of Instruction Trace Macrocell (ITM) trace to be handled by the DS-5
Event Viewer.
The Platform Configuration Editor does not create debug operations that configure non-instruction tracemacrocells other than ITM.
For SMP configurations, the Cross Trigger Interface (CTI) synchronization is used on targets where asuitable CTI is present.
Using a CTI produces a much tighter synchronization with a very low latency in the order of cycles butthe CTI must be fully implemented and connected in line with the ARM reference designs, and must notbe used for any other purpose. Synchronization without using a CTI has a much higher latency, butmakes no assumptions about implementation or usage.
You might have to manually configure off-chip TPIU trace for multiplexed pins and also performcalibrations to cope with signal timing issues.
10 Platform Configuration10.2 About importing platform and model configurations
ARM DUI0446Z Copyright © 2010-2016 ARM Limited or its affiliates. All rightsreserved.
10-226
Non-Confidential
If you experience any problems or need to produce other configurations, contact your supportrepresentative.
Note
It is only possible to import platforms or models that can be auto-configured using DS-5. DS-5 producesa basic configuration with appropriate processor and CP15 register sets.
Related tasks10.6 Creating a platform configuration on page 10-231.10.14 Adding a configuration database to DS-5 on page 10-253.
Related references10.15 Configuration Database panel on page 10-255.
10 Platform Configuration10.2 About importing platform and model configurations
ARM DUI0446Z Copyright © 2010-2016 ARM Limited or its affiliates. All rightsreserved.
10-227
Non-Confidential
10.3 About platform bring-up in DS-5Effective debug and trace support requires that the debugger has the necessary information about theplatform it needs to debug.
The complexity of modern System-on-Chip (SoC) based platforms is increasing. The debugger needs toknow:
• What devices are present on the SoC.• The type and configuration details of each device.• The base addresses of the CoreSight components.• The type and index of the Access Ports (AP) to access the various CoreSight components.• How the different devices relate or connect to each other (their topology).
DS-5 Debugger can automatically detect most of this information. However, it is common that thedebugger is unable to detect certain features on a complex SoC. The reasons might be:• The SoC does not make the information available to the debugger.• The information from the SoC might be missing when parts of the SoC are powered down.• Devices inside the SoC might interfere with topology detection.
DS-5 Debugger provides a simple and efficient platform bring-up process for all ARM CoreSight-basedSoCs.
DS-5 Debugger does not make any assumptions about the platform configuration. Hence if it only haslimited information about the platform, it can only provided limited debug and trace functionality. Henceit is common for the debugger to provide limited trace functionality for certain processors on theplatform. You can augment the automatically detected platform configuration by manually providingdata based on your knowledge of the SoC. This enables you to provide any missing parts of the topologydefinition. This is preferable because the DTSL scripts can be generated based on the augmentedinformation rather than requiring manual editing.
10 Platform Configuration10.3 About platform bring-up in DS-5
ARM DUI0446Z Copyright © 2010-2016 ARM Limited or its affiliates. All rightsreserved.
10-228
Non-Confidential
10.4 ARM debug and trace architectureModern ARM processors consist of several debug and trace components. Knowledge of what thesecomponents do and how they connect to each other is important for creating a platform configuration.
Debug units, such as DSTREAM, use JTAG to connect directly to physical devices. To detect thedevices, the debug unit sends clock signals around the JTAG scan chain, which passes through all thephysical devices in sequence. The physical devices on the JTAG scan chain can include:
• Legacy ARM processors, such as ARM7, ARM9, and ARM11 processors.• ARM CoreSight Debug Access Port (DAP).• Unknown or custom devices that are not based on ARM.
ARM Cortex processors and CoreSight devices are not present directly on the JTAG scan chain. Instead,ARM CoreSight Debug Access Ports provide access to CoreSight Memory Access Ports, which in turnprovide access to additional JTAG devices or memory-mapped virtual devices, such as ARM Cortexprocessors and CoreSight devices. Each virtual device provides memory-mapped registers that adebugger can use to control and configure the device, or to read information from it.
There are different types of CoreSight devices.• Embedded Trace Macrocell (ETM) and Program Flow Trace Macrocell (PTM) are trace sources that
attach directly to a Cortex processor and non-invasively generate information about the operationsperformed by the processor. Each Cortex processor has its own revision of ETM or PTM that hasspecific functionality for that processor.
• Instrumentation Trace Macrocell (ITM) and System Trace Macrocell (STM) are trace sources thatgenerate trace information about software and hardware events occurring across the System-on-Chip.
• Embedded Trace Buffer (ETB), Trace Memory Controller (TMC) and Trace Port Interface Unit(TPIU) are trace sinks that receive trace information generated by the trace sources. Trace sinks eitherstore the trace information or route it to a physical trace port.
• Funnels and Replicators are trace links that route trace information from trace sources to trace sinks.• Cross Trigger Interface (CTI) devices route events between other devices. The CTI network has a
variety of uses, including:— Halting processors when trace buffers become full.— Routing trace triggers.— Ensuring tight synchronization between processors, for example when one processor in a cluster
halts, the other processors in the cluster halt with minimal latency.
A debugger needs to know details of the physical JTAG scan chain, and it needs details of individualCortex processors and CoreSight devices, including CoreSight AP index, ROM table base address,device type, revision, and implementation detail. However, a debugger also needs to know how devicesare connected to each other. For example which processors are part of the same cluster, how the CTInetwork can pass event information between devices, and the topology of the trace sub-system. Withoutthis information, a debugger might not be able to provide all of the control and configuration servicesthat are available.
Related concepts1.2 Overview: ARM® CoreSight™ debug and trace components on page 1-22.
10 Platform Configuration10.4 ARM debug and trace architecture
ARM DUI0446Z Copyright © 2010-2016 ARM Limited or its affiliates. All rightsreserved.
10-229
Non-Confidential
10.5 About the Platform Configuration Editor viewThe Platform Configuration Editor (PCE) view enables you to create or modify debug configurations forconnecting to your platform.
In the PCE view, you can:
• Review the devices on your development platform.• Modify device information or add new devices that the debugger was unable to autodetect.• Configure your debug hardware unit, and target-related features that are appropriate to correctly
debug on your development platform.• Review or modify the debug activities for the various processors on the platform.• Build and save the platform configuration to an RDDI configuration file. The RDDI configuration
file is used by the debugger to connect to the target processors on your development platform.
PCE enables you to easily specify the debug topology by defining the connections between the variousprocessors, CoreSight components, and debug IP on the platform. This enables DS-5 Debugger to createthe appropriate DTSL scripts that are necessary for the debug connection to the platform.
Note
DS-5 Debugger connects to the platform to autodetect the devices on the platform. DS-5 Debugger doesnot maintain the connection to the target after reading the device information from the platform.
10 Platform Configuration10.5 About the Platform Configuration Editor view
ARM DUI0446Z Copyright © 2010-2016 ARM Limited or its affiliates. All rightsreserved.
10-230
Non-Confidential
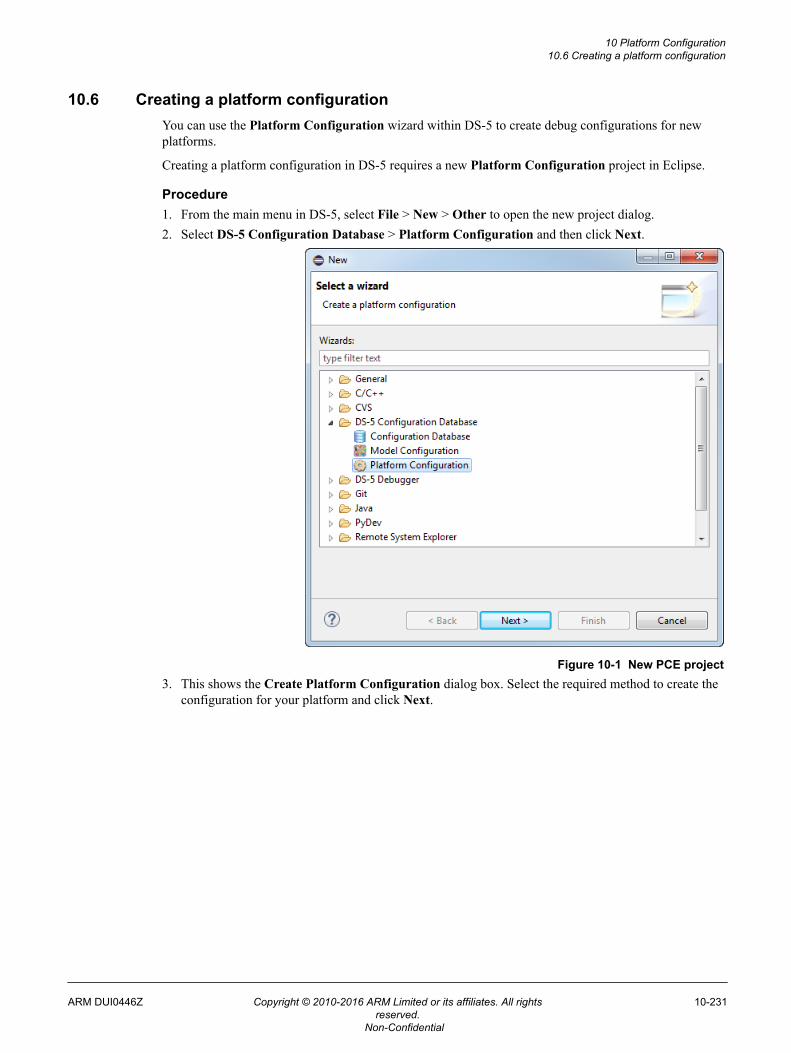
10.6 Creating a platform configurationYou can use the Platform Configuration wizard within DS-5 to create debug configurations for newplatforms.
Creating a platform configuration in DS-5 requires a new Platform Configuration project in Eclipse.
Procedure1. From the main menu in DS-5, select File > New > Other to open the new project dialog.2. Select DS-5 Configuration Database > Platform Configuration and then click Next.
Figure 10-1 New PCE project3. This shows the Create Platform Configuration dialog box. Select the required method to create the
configuration for your platform and click Next.
10 Platform Configuration10.6 Creating a platform configuration
ARM DUI0446Z Copyright © 2010-2016 ARM Limited or its affiliates. All rightsreserved.
10-231
Non-Confidential
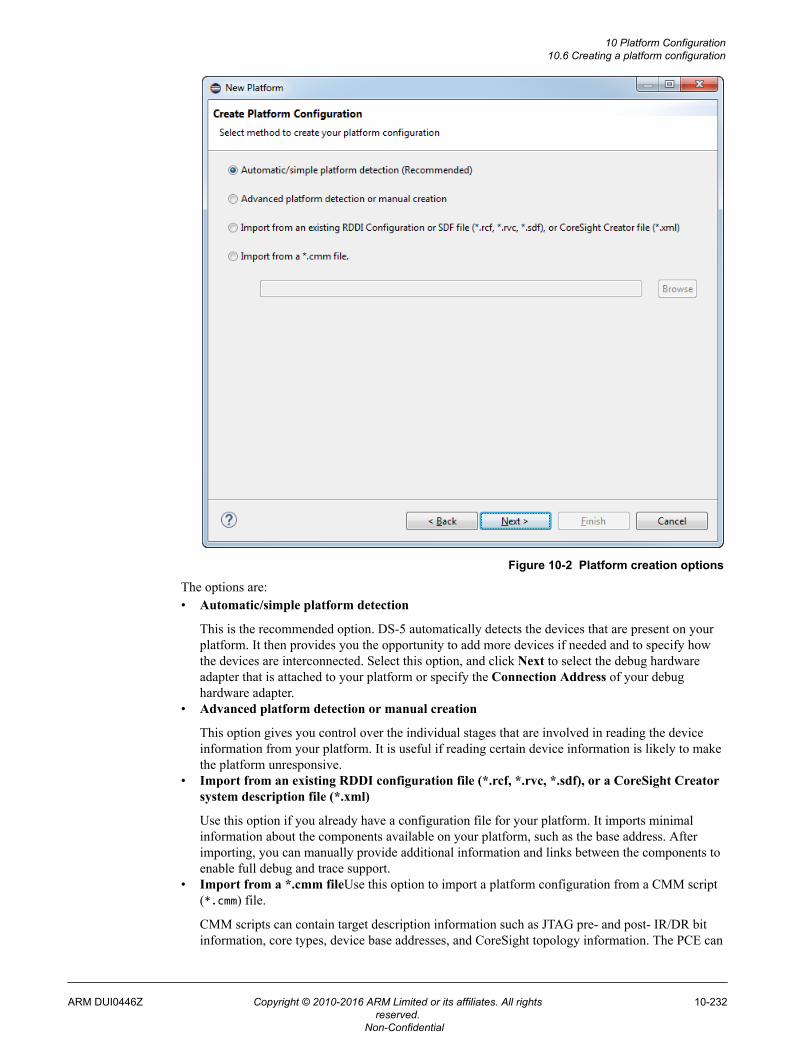
Figure 10-2 Platform creation options
The options are:• Automatic/simple platform detection
This is the recommended option. DS-5 automatically detects the devices that are present on yourplatform. It then provides you the opportunity to add more devices if needed and to specify howthe devices are interconnected. Select this option, and click Next to select the debug hardwareadapter that is attached to your platform or specify the Connection Address of your debughardware adapter.
• Advanced platform detection or manual creation
This option gives you control over the individual stages that are involved in reading the deviceinformation from your platform. It is useful if reading certain device information is likely to makethe platform unresponsive.
• Import from an existing RDDI configuration file (*.rcf, *.rvc, *.sdf), or a CoreSight Creatorsystem description file (*.xml)
Use this option if you already have a configuration file for your platform. It imports minimalinformation about the components available on your platform, such as the base address. Afterimporting, you can manually provide additional information and links between the components toenable full debug and trace support.
• Import from a *.cmm fileUse this option to import a platform configuration from a CMM script(*.cmm) file.
CMM scripts can contain target description information such as JTAG pre- and post- IR/DR bitinformation, core types, device base addresses, and CoreSight topology information. The PCE can
10 Platform Configuration10.6 Creating a platform configuration
ARM DUI0446Z Copyright © 2010-2016 ARM Limited or its affiliates. All rightsreserved.
10-232
Non-Confidential
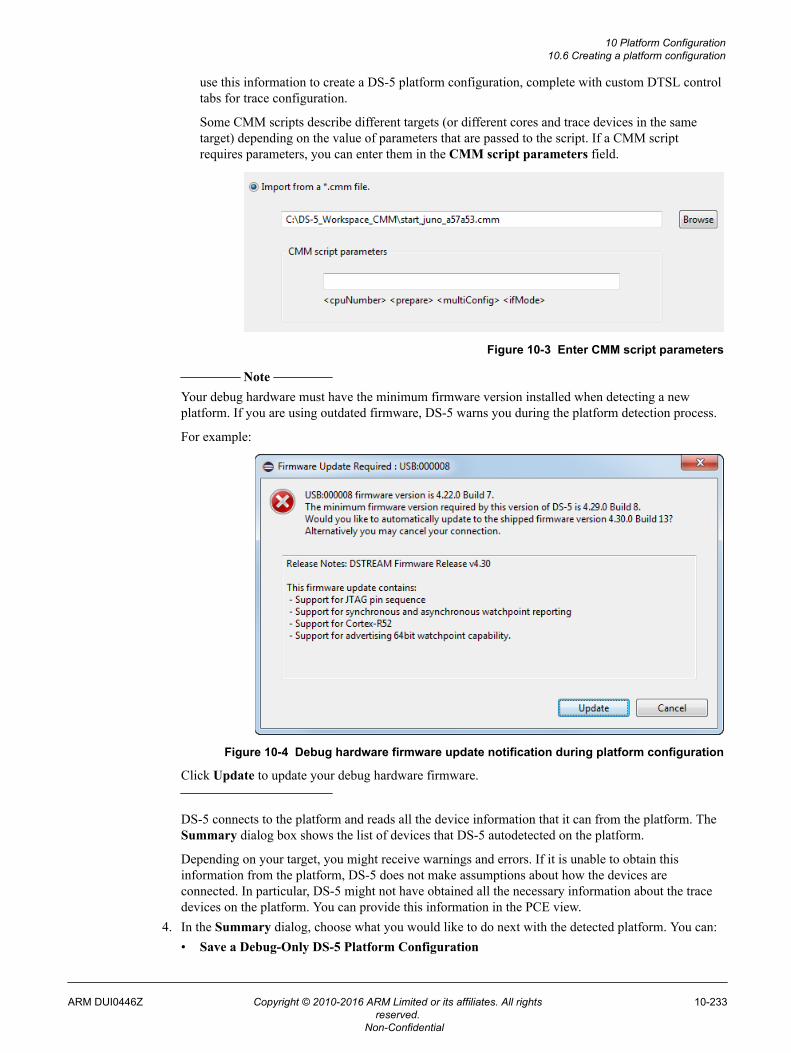
use this information to create a DS-5 platform configuration, complete with custom DTSL controltabs for trace configuration.
Some CMM scripts describe different targets (or different cores and trace devices in the sametarget) depending on the value of parameters that are passed to the script. If a CMM scriptrequires parameters, you can enter them in the CMM script parameters field.
Figure 10-3 Enter CMM script parameters
Note
Your debug hardware must have the minimum firmware version installed when detecting a newplatform. If you are using outdated firmware, DS-5 warns you during the platform detection process.
For example:
Figure 10-4 Debug hardware firmware update notification during platform configuration
Click Update to update your debug hardware firmware.
DS-5 connects to the platform and reads all the device information that it can from the platform. TheSummary dialog box shows the list of devices that DS-5 autodetected on the platform.
Depending on your target, you might receive warnings and errors. If it is unable to obtain thisinformation from the platform, DS-5 does not make assumptions about how the devices areconnected. In particular, DS-5 might not have obtained all the necessary information about the tracedevices on the platform. You can provide this information in the PCE view.
4. In the Summary dialog, choose what you would like to do next with the detected platform. You can:• Save a Debug-Only DS-5 Platform Configuration
10 Platform Configuration10.6 Creating a platform configuration
ARM DUI0446Z Copyright © 2010-2016 ARM Limited or its affiliates. All rightsreserved.
10-233
Non-Confidential
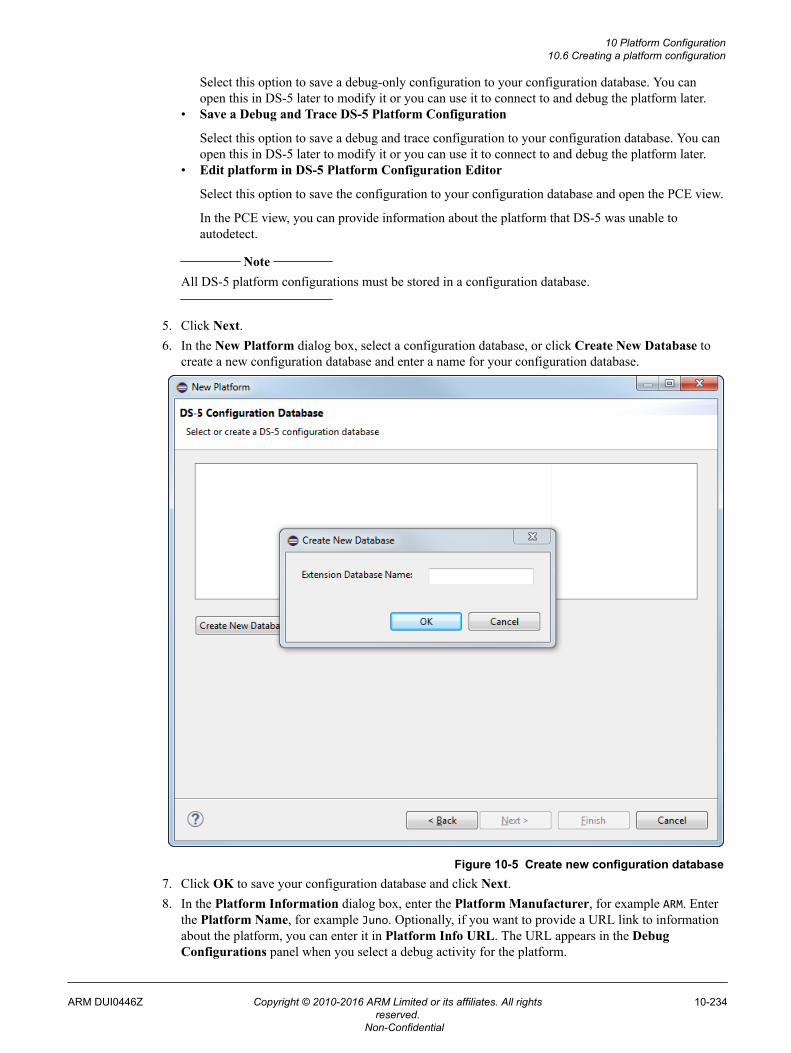
Select this option to save a debug-only configuration to your configuration database. You canopen this in DS-5 later to modify it or you can use it to connect to and debug the platform later.
• Save a Debug and Trace DS-5 Platform Configuration
Select this option to save a debug and trace configuration to your configuration database. You canopen this in DS-5 later to modify it or you can use it to connect to and debug the platform later.
• Edit platform in DS-5 Platform Configuration Editor
Select this option to save the configuration to your configuration database and open the PCE view.
In the PCE view, you can provide information about the platform that DS-5 was unable toautodetect.
Note
All DS-5 platform configurations must be stored in a configuration database.
5. Click Next.6. In the New Platform dialog box, select a configuration database, or click Create New Database to
create a new configuration database and enter a name for your configuration database.
Figure 10-5 Create new configuration database7. Click OK to save your configuration database and click Next.8. In the Platform Information dialog box, enter the Platform Manufacturer, for example ARM. Enter
the Platform Name, for example Juno. Optionally, if you want to provide a URL link to informationabout the platform, you can enter it in Platform Info URL. The URL appears in the DebugConfigurations panel when you select a debug activity for the platform.
10 Platform Configuration10.6 Creating a platform configuration
ARM DUI0446Z Copyright © 2010-2016 ARM Limited or its affiliates. All rightsreserved.
10-234
Non-Confidential
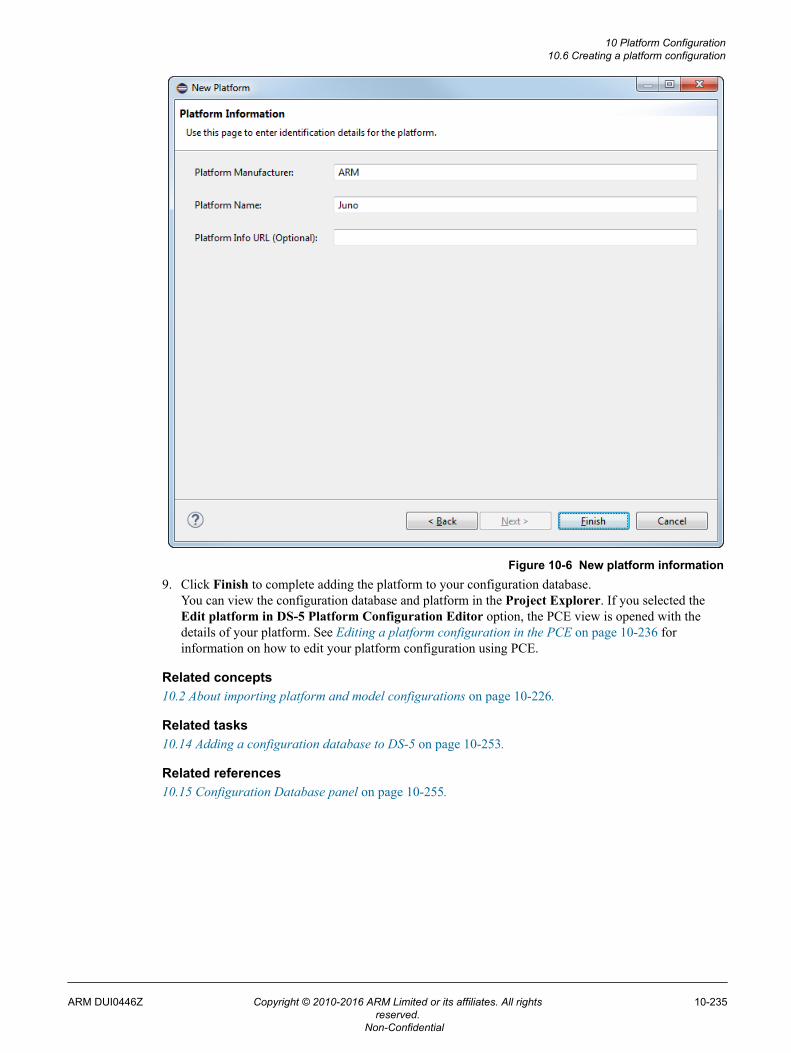
Figure 10-6 New platform information9. Click Finish to complete adding the platform to your configuration database.
You can view the configuration database and platform in the Project Explorer. If you selected theEdit platform in DS-5 Platform Configuration Editor option, the PCE view is opened with thedetails of your platform. See Editing a platform configuration in the PCE on page 10-236 forinformation on how to edit your platform configuration using PCE.
Related concepts10.2 About importing platform and model configurations on page 10-226.
Related tasks10.14 Adding a configuration database to DS-5 on page 10-253.
Related references10.15 Configuration Database panel on page 10-255.
10 Platform Configuration10.6 Creating a platform configuration
ARM DUI0446Z Copyright © 2010-2016 ARM Limited or its affiliates. All rightsreserved.
10-235
Non-Confidential
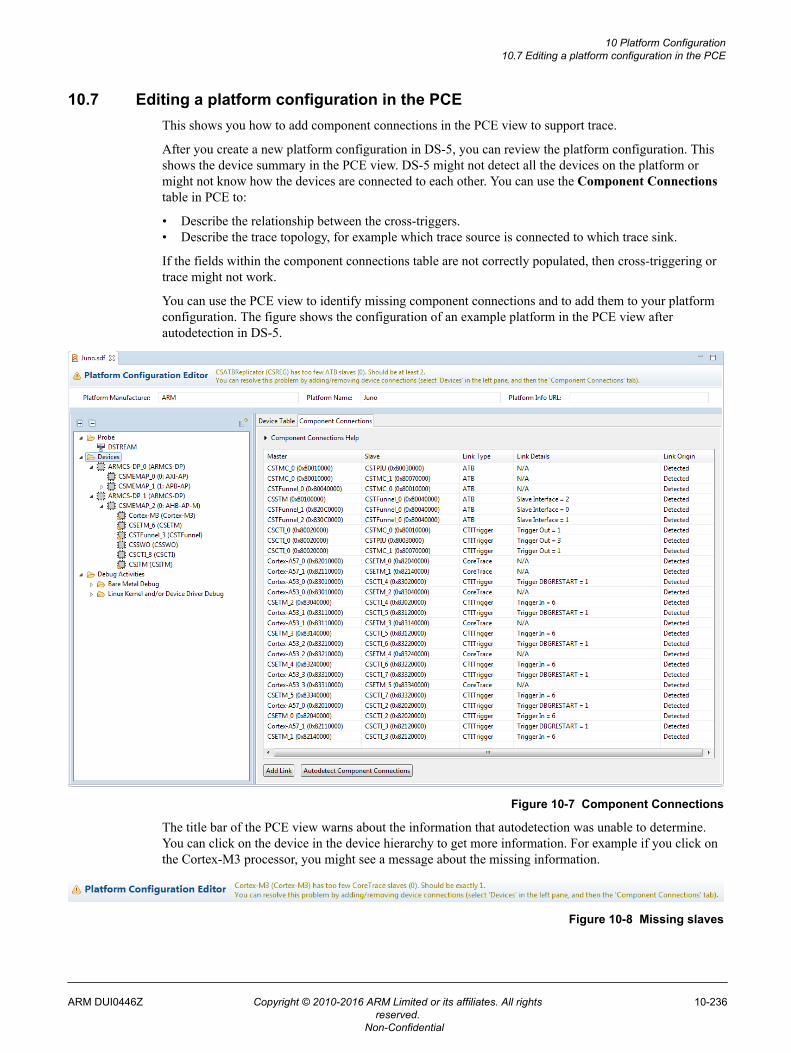
10.7 Editing a platform configuration in the PCEThis shows you how to add component connections in the PCE view to support trace.
After you create a new platform configuration in DS-5, you can review the platform configuration. Thisshows the device summary in the PCE view. DS-5 might not detect all the devices on the platform ormight not know how the devices are connected to each other. You can use the Component Connectionstable in PCE to:
• Describe the relationship between the cross-triggers.• Describe the trace topology, for example which trace source is connected to which trace sink.
If the fields within the component connections table are not correctly populated, then cross-triggering ortrace might not work.
You can use the PCE view to identify missing component connections and to add them to your platformconfiguration. The figure shows the configuration of an example platform in the PCE view afterautodetection in DS-5.
Figure 10-7 Component Connections
The title bar of the PCE view warns about the information that autodetection was unable to determine.You can click on the device in the device hierarchy to get more information. For example if you click onthe Cortex-M3 processor, you might see a message about the missing information.
Figure 10-8 Missing slaves
10 Platform Configuration10.7 Editing a platform configuration in the PCE
ARM DUI0446Z Copyright © 2010-2016 ARM Limited or its affiliates. All rightsreserved.
10-236
Non-Confidential
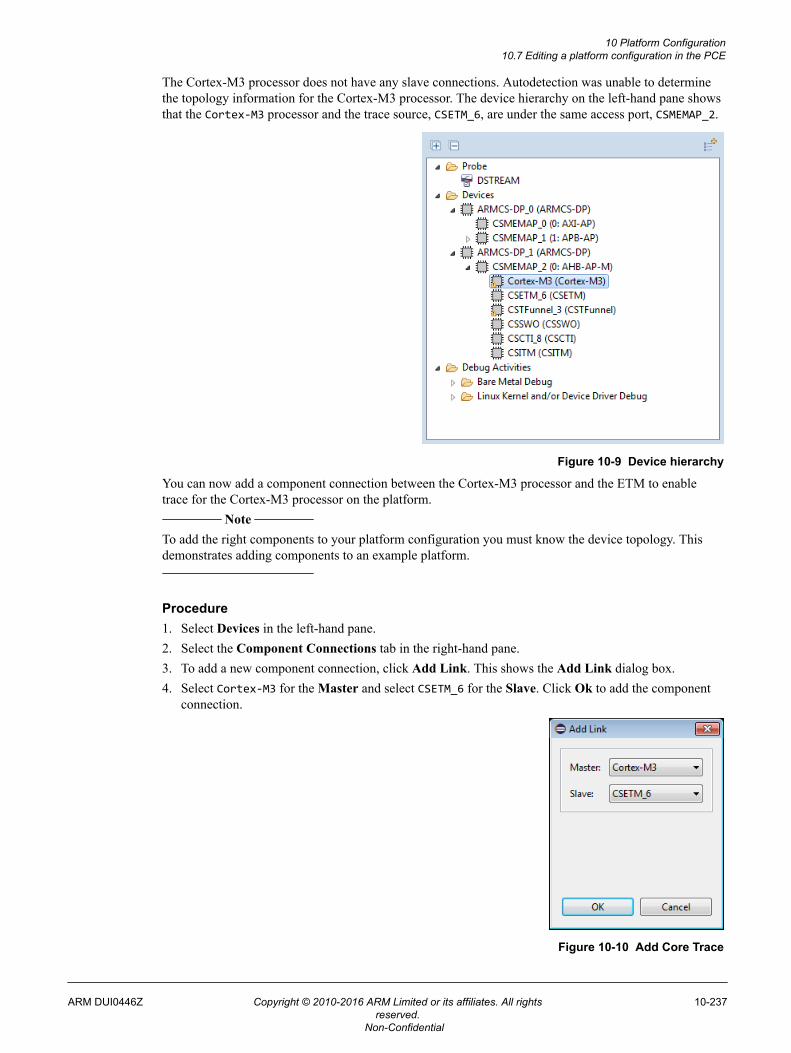
The Cortex-M3 processor does not have any slave connections. Autodetection was unable to determinethe topology information for the Cortex-M3 processor. The device hierarchy on the left-hand pane showsthat the Cortex-M3 processor and the trace source, CSETM_6, are under the same access port, CSMEMAP_2.
Figure 10-9 Device hierarchy
You can now add a component connection between the Cortex-M3 processor and the ETM to enabletrace for the Cortex-M3 processor on the platform.
Note
To add the right components to your platform configuration you must know the device topology. Thisdemonstrates adding components to an example platform.
Procedure1. Select Devices in the left-hand pane.2. Select the Component Connections tab in the right-hand pane.3. To add a new component connection, click Add Link. This shows the Add Link dialog box.4. Select Cortex-M3 for the Master and select CSETM_6 for the Slave. Click Ok to add the component
connection.
Figure 10-10 Add Core Trace
10 Platform Configuration10.7 Editing a platform configuration in the PCE
ARM DUI0446Z Copyright © 2010-2016 ARM Limited or its affiliates. All rightsreserved.
10-237
Non-Confidential
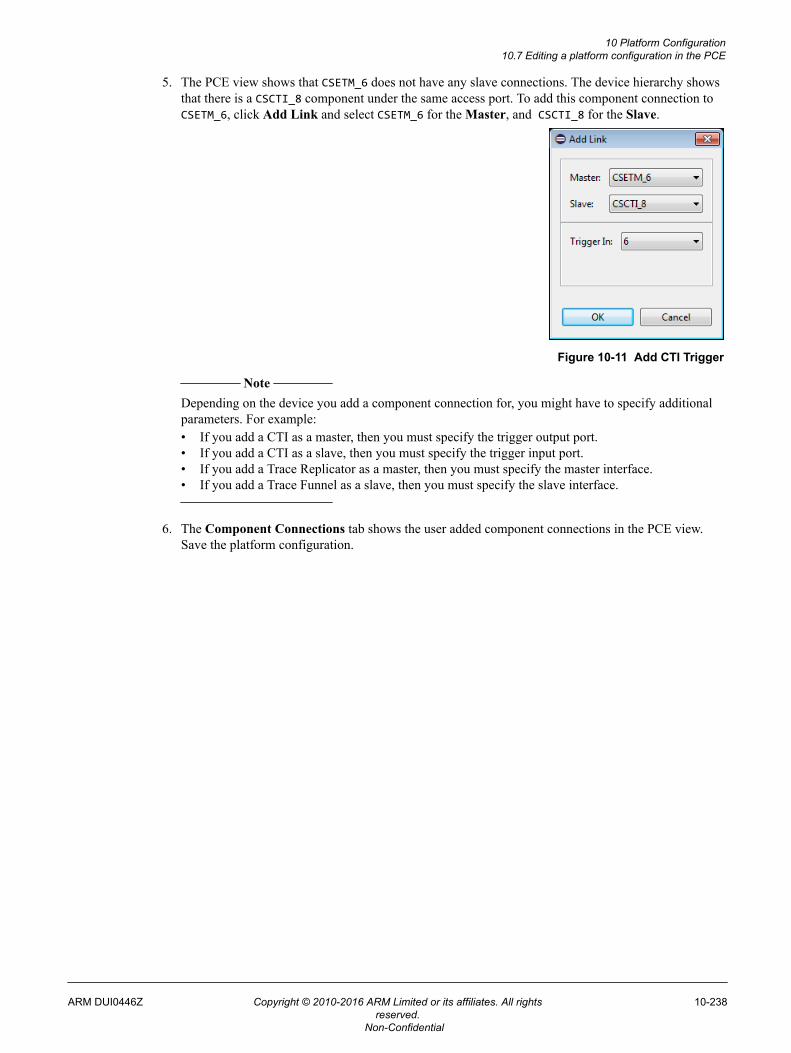
5. The PCE view shows that CSETM_6 does not have any slave connections. The device hierarchy showsthat there is a CSCTI_8 component under the same access port. To add this component connection toCSETM_6, click Add Link and select CSETM_6 for the Master, and CSCTI_8 for the Slave.
Figure 10-11 Add CTI Trigger
Note
Depending on the device you add a component connection for, you might have to specify additionalparameters. For example:• If you add a CTI as a master, then you must specify the trigger output port.• If you add a CTI as a slave, then you must specify the trigger input port.• If you add a Trace Replicator as a master, then you must specify the master interface.• If you add a Trace Funnel as a slave, then you must specify the slave interface.
6. The Component Connections tab shows the user added component connections in the PCE view.Save the platform configuration.
10 Platform Configuration10.7 Editing a platform configuration in the PCE
ARM DUI0446Z Copyright © 2010-2016 ARM Limited or its affiliates. All rightsreserved.
10-238
Non-Confidential
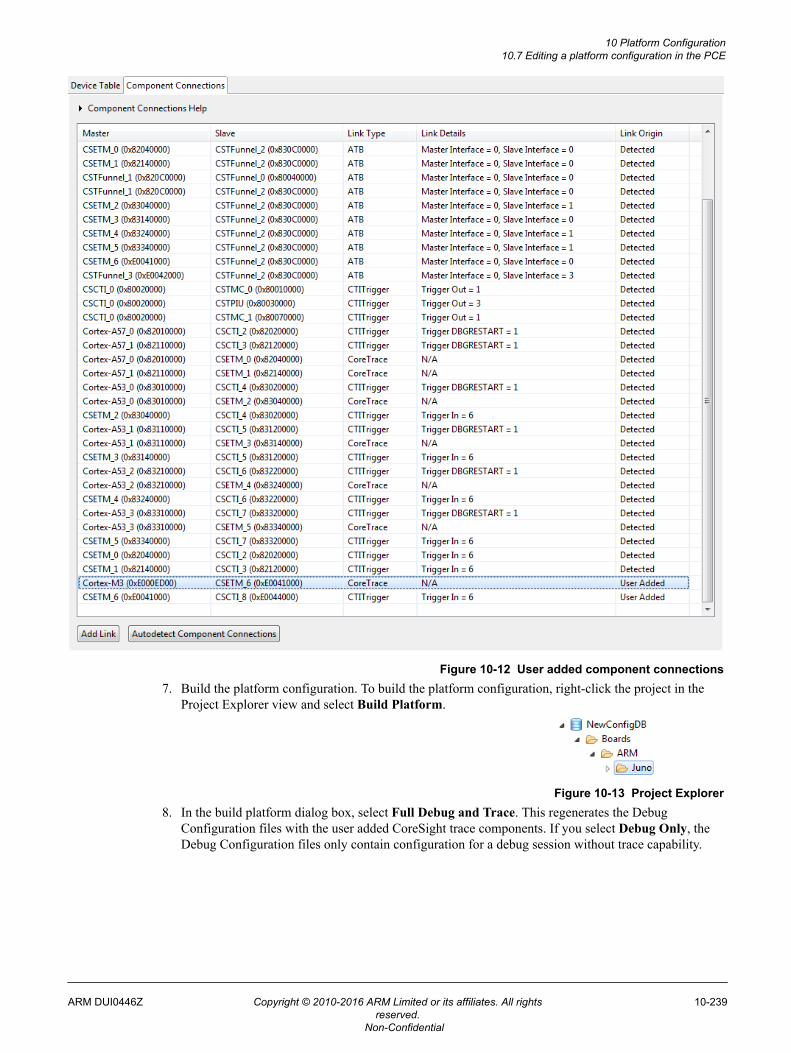
Figure 10-12 User added component connections7. Build the platform configuration. To build the platform configuration, right-click the project in the
Project Explorer view and select Build Platform.
Figure 10-13 Project Explorer8. In the build platform dialog box, select Full Debug and Trace. This regenerates the Debug
Configuration files with the user added CoreSight trace components. If you select Debug Only, theDebug Configuration files only contain configuration for a debug session without trace capability.
10 Platform Configuration10.7 Editing a platform configuration in the PCE
ARM DUI0446Z Copyright © 2010-2016 ARM Limited or its affiliates. All rightsreserved.
10-239
Non-Confidential
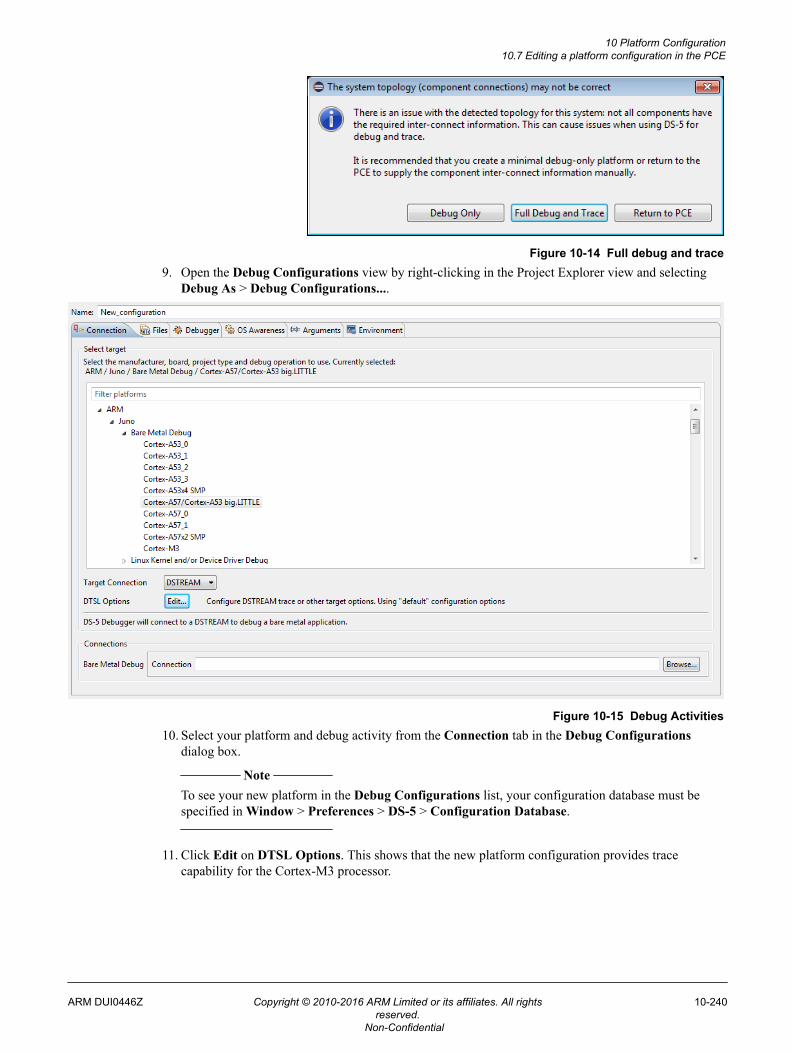
Figure 10-14 Full debug and trace9. Open the Debug Configurations view by right-clicking in the Project Explorer view and selecting
Debug As > Debug Configurations....
Figure 10-15 Debug Activities10. Select your platform and debug activity from the Connection tab in the Debug Configurations
dialog box. Note
To see your new platform in the Debug Configurations list, your configuration database must bespecified in Window > Preferences > DS-5 > Configuration Database.
11. Click Edit on DTSL Options. This shows that the new platform configuration provides tracecapability for the Cortex-M3 processor.
10 Platform Configuration10.7 Editing a platform configuration in the PCE
ARM DUI0446Z Copyright © 2010-2016 ARM Limited or its affiliates. All rightsreserved.
10-240
Non-Confidential
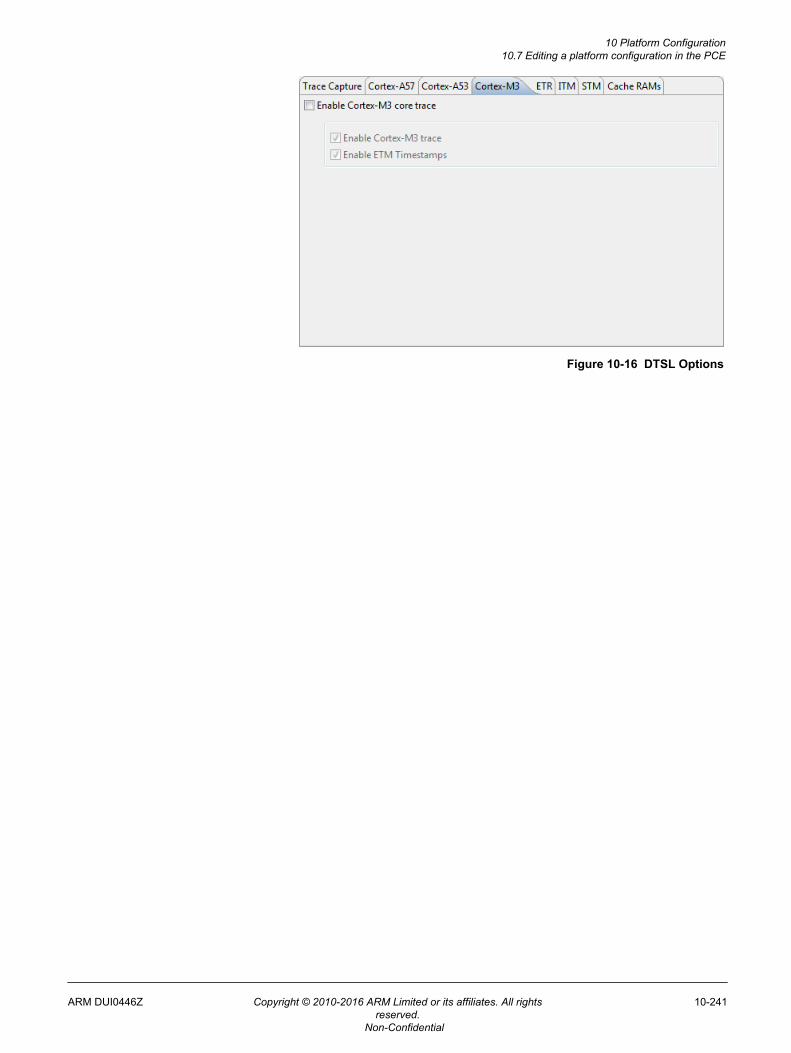
Figure 10-16 DTSL Options
10 Platform Configuration10.7 Editing a platform configuration in the PCE
ARM DUI0446Z Copyright © 2010-2016 ARM Limited or its affiliates. All rightsreserved.
10-241
Non-Confidential
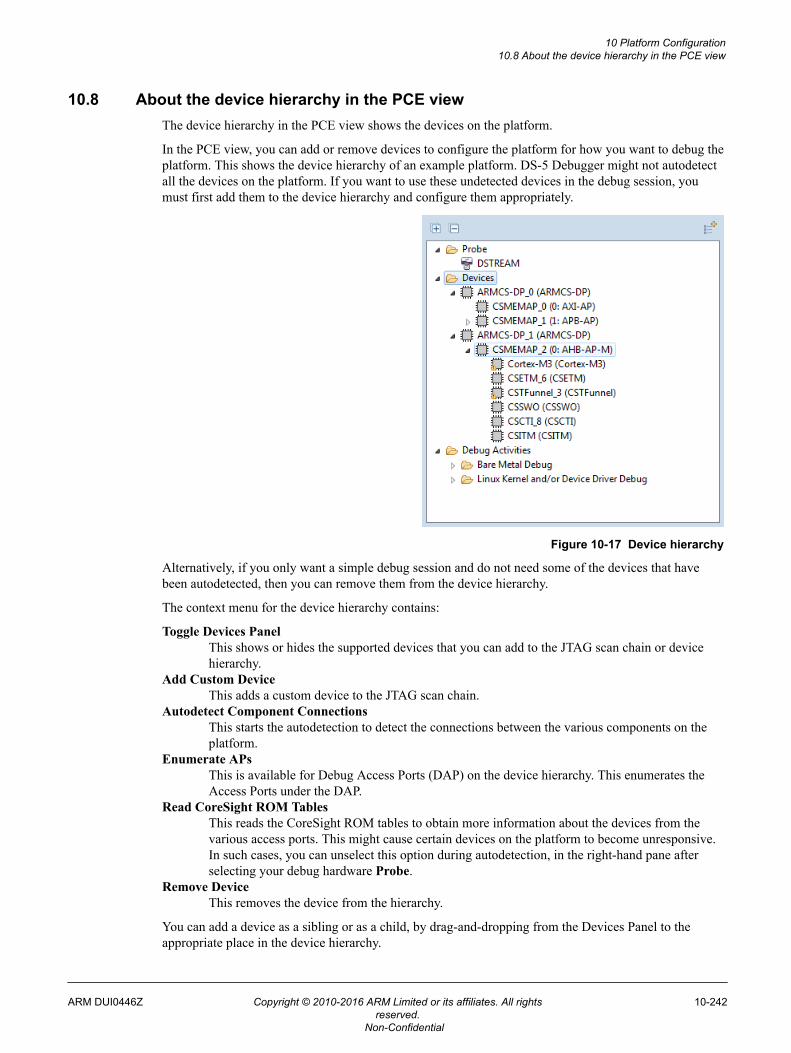
10.8 About the device hierarchy in the PCE viewThe device hierarchy in the PCE view shows the devices on the platform.
In the PCE view, you can add or remove devices to configure the platform for how you want to debug theplatform. This shows the device hierarchy of an example platform. DS-5 Debugger might not autodetectall the devices on the platform. If you want to use these undetected devices in the debug session, youmust first add them to the device hierarchy and configure them appropriately.
Figure 10-17 Device hierarchy
Alternatively, if you only want a simple debug session and do not need some of the devices that havebeen autodetected, then you can remove them from the device hierarchy.
The context menu for the device hierarchy contains:
Toggle Devices PanelThis shows or hides the supported devices that you can add to the JTAG scan chain or devicehierarchy.
Add Custom DeviceThis adds a custom device to the JTAG scan chain.
Autodetect Component ConnectionsThis starts the autodetection to detect the connections between the various components on theplatform.
Enumerate APsThis is available for Debug Access Ports (DAP) on the device hierarchy. This enumerates theAccess Ports under the DAP.
Read CoreSight ROM TablesThis reads the CoreSight ROM tables to obtain more information about the devices from thevarious access ports. This might cause certain devices on the platform to become unresponsive.In such cases, you can unselect this option during autodetection, in the right-hand pane afterselecting your debug hardware Probe.
Remove DeviceThis removes the device from the hierarchy.
You can add a device as a sibling or as a child, by drag-and-dropping from the Devices Panel to theappropriate place in the device hierarchy.
10 Platform Configuration10.8 About the device hierarchy in the PCE view
ARM DUI0446Z Copyright © 2010-2016 ARM Limited or its affiliates. All rightsreserved.
10-242
Non-Confidential
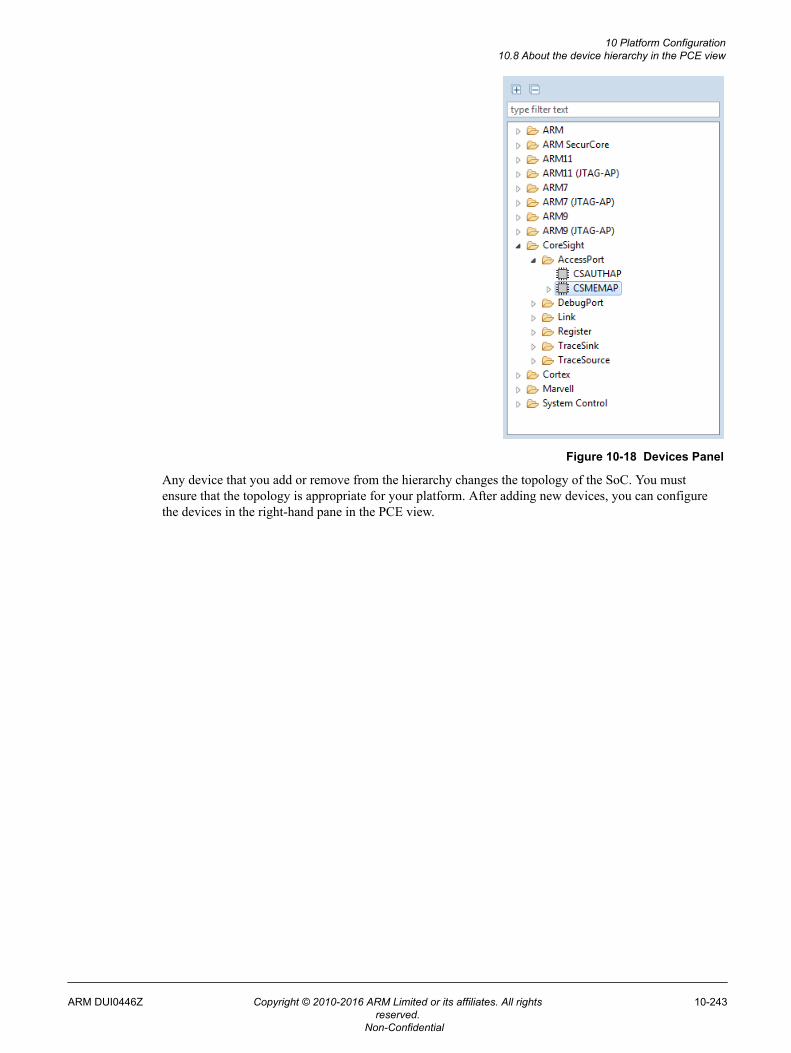
Figure 10-18 Devices Panel
Any device that you add or remove from the hierarchy changes the topology of the SoC. You mustensure that the topology is appropriate for your platform. After adding new devices, you can configurethe devices in the right-hand pane in the PCE view.
10 Platform Configuration10.8 About the device hierarchy in the PCE view
ARM DUI0446Z Copyright © 2010-2016 ARM Limited or its affiliates. All rightsreserved.
10-243
Non-Confidential
10.9 Manual platform configurationYou can manually create the platform configuration if DS-5 does not automatically detect the platformconfiguration.
DS-5 uses all the information that it reads from the platform to create a custom platform configuration.However, sometimes it is not possible for DS-5 to read all of the information that it needs from aplatform. There could be many reasons for this:
• JTAG routing or security devices might prevent DS-5 from discovering details of physical JTAGdevices.
• Debug or trace might be partially or fully disabled.• Devices might be powered down, or their clocks might be disabled. This can make devices
unresponsive to requests for information, and can affect individual devices, entire clusters, or all thedevices in a ROM table.
• ROM tables might be missing, incomplete, or at the wrong address.• Integration Test registers might not be fully implemented, or their operation might be limited by other
devices.• The platform might contain unsupported devices.
Autoconfiguring the platform might cause the target to stop and reset. If you do not want to reset thetarget, you can manually create the platform configuration using DS-5.
To manually create the platform configuration:
1. Select Advanced platform detection or manual creation from the New Platform dialog box, asshown in 10.6 Creating a platform configuration on page 10-231.
2. Provide the necessary topology information using PCE in DS-5.3. This creates a new System Description File (.sdf). Save and build the sdf file.To provide the necessary topology information using PCE, refer to the topology diagram for yourplatform to know how to describe the configuration. When you know the topology, you can add thecomponents using these steps:1. Create the JTAG scan chain, by adding all the devices that are on the scan chain. You can drag-and-
drop devices to the scan chain from the device panel on page 10-242 into the Devices folder in thePCE view. The devices must be in the right order on the JTAG scan chain.
Note
You can also add custom or unsupported devices to the JTAG scan chain. To add a custom device,right-click on the Devices folder and select Add Custom Device. You must specify the correct JTAGInstruction Register (IR) length for these devices. You can provide any name for the custom device.You cannot debug a custom device. However, adding the custom device in the correct order and withthe correct length enables you to debug the supported devices in the same scan chain. It is notpossible to consolidate unknown devices on the scan chain. For example two custom devices withinstructions lengths of 4 and 5 bits cannot be replaced by a single custom device of instruction length9 bits.
2. Before you can add CoreSight devices or Cortex processors to the device hierarchy, you must add aCoreSight Debug Access Port (DAP), for example ARMCS-DP. For each DAP, you must add theCoreSight Memory Access Ports (AP) that you need, for example CSMEMAP. You must specify thecorrect index and type of each AP.
3. Add the Cortex processors and CoreSight devices to the correct AP on the correct DAP. To do this,drag-and-drop them from the devices panel into the correct AP. Since the CoreSight devices arememory-mapped, you can add them in any order. However, you must ensure that the device type andROM table base address are correct.
4. Add the component connection information to specify how the devices are connected to each other.10.7 Editing a platform configuration in the PCE on page 10-236 describes this.
10 Platform Configuration10.9 Manual platform configuration
ARM DUI0446Z Copyright © 2010-2016 ARM Limited or its affiliates. All rightsreserved.
10-244
Non-Confidential

If you do not need trace support, then you do not need to provide details and topology for trace devices.DS-5 will read as much information as it can. You must always review the information that has beencollected before deciding what further information is necessary. If DS-5 fails to read information, itmight be an indication of a deeper problem than missing information.
For example, if DS-5 fails to discover the base addresses because the devices are completely powereddown, it might not be possible to provide debug support even if the information is provided manually.This is because the powered down devices are not responsive to the debugger. You might need toperform other operations, such as enabling clocks or powering processor clusters, before debug and traceare possible.
10 Platform Configuration10.9 Manual platform configuration
ARM DUI0446Z Copyright © 2010-2016 ARM Limited or its affiliates. All rightsreserved.
10-245
Non-Confidential
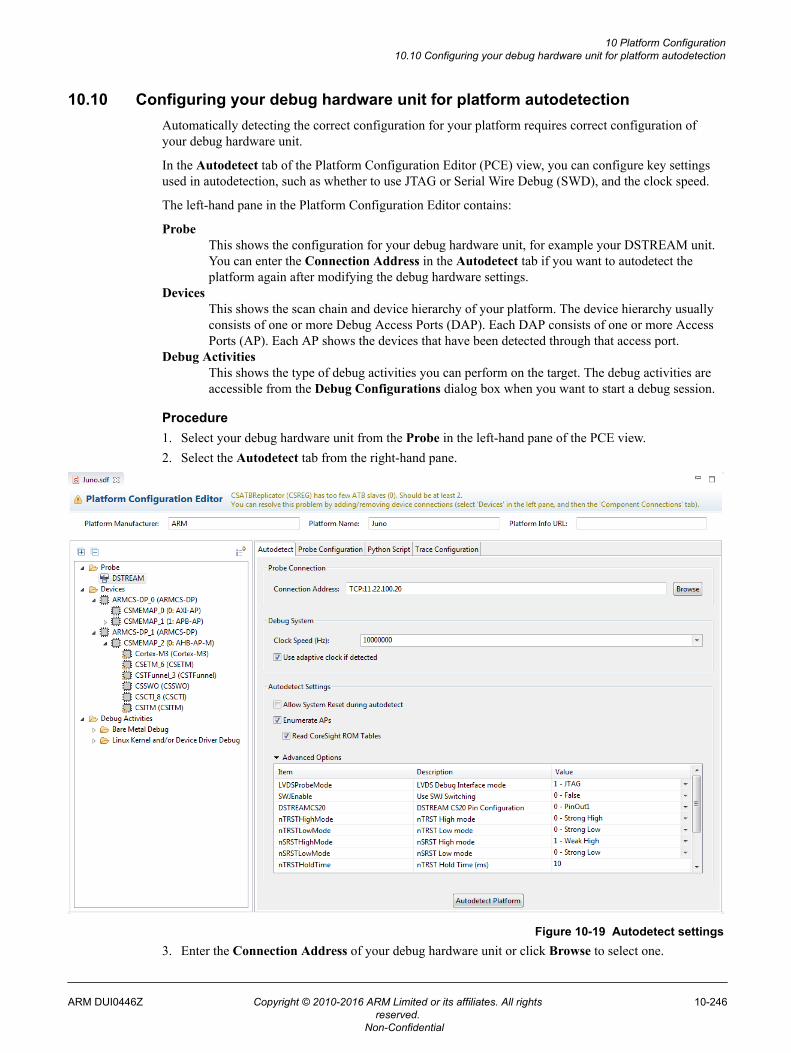
10.10 Configuring your debug hardware unit for platform autodetectionAutomatically detecting the correct configuration for your platform requires correct configuration ofyour debug hardware unit.
In the Autodetect tab of the Platform Configuration Editor (PCE) view, you can configure key settingsused in autodetection, such as whether to use JTAG or Serial Wire Debug (SWD), and the clock speed.
The left-hand pane in the Platform Configuration Editor contains:
ProbeThis shows the configuration for your debug hardware unit, for example your DSTREAM unit.You can enter the Connection Address in the Autodetect tab if you want to autodetect theplatform again after modifying the debug hardware settings.
DevicesThis shows the scan chain and device hierarchy of your platform. The device hierarchy usuallyconsists of one or more Debug Access Ports (DAP). Each DAP consists of one or more AccessPorts (AP). Each AP shows the devices that have been detected through that access port.
Debug ActivitiesThis shows the type of debug activities you can perform on the target. The debug activities areaccessible from the Debug Configurations dialog box when you want to start a debug session.
Procedure1. Select your debug hardware unit from the Probe in the left-hand pane of the PCE view.2. Select the Autodetect tab from the right-hand pane.
Figure 10-19 Autodetect settings3. Enter the Connection Address of your debug hardware unit or click Browse to select one.
10 Platform Configuration10.10 Configuring your debug hardware unit for platform autodetection
ARM DUI0446Z Copyright © 2010-2016 ARM Limited or its affiliates. All rightsreserved.
10-246
Non-Confidential
4. Expand Advanced Options to configure your debug hardware unit appropriately. Here you can setthe LVDS Debug Interface Mode to either JTAG or SWD for connecting to the target. If you use aJTAG connection, then you must set the JTAG type and clock speed appropriately. Other options thatare important for autodetection include the reset hold and delay times, drive strengths, reset behaviorduring autodetection, and cable pin configurations.
Note
If your target supports both JTAG and SWD, you must first enable Use SWJ Switching. The ProbeConfigurations tab provides these settings and other configuration options for your debug hardwareunit.
5. Click Autodetect Platform to automatically detect the platform.The debug hardware unit interrogates the scan chain at the current clock speed. If the clock speed istoo high, some devices on the scan chain might not be detected. If you suspect that this is happening,decrease the clock speed.
6. Click on Devices in the left-had pane to review the automatically detected platform configuration.7. Add any missing topology links for the platform in the Component Connections tab.8. Build the platform configuration by right-clicking the platform configuration project in the Project
Explorer view and selecting Build Platform.
10 Platform Configuration10.10 Configuring your debug hardware unit for platform autodetection
ARM DUI0446Z Copyright © 2010-2016 ARM Limited or its affiliates. All rightsreserved.
10-247
Non-Confidential
10.11 Creating a new model configurationDS-5 Debugger provides built-in support for connecting to a large range of ARM FastModel products.To use any other simulation model with DS-5 Debugger you must first create and import the modelconfiguration into a DS-5 Configuration database.
Procedure1. Open the Configuration Perspective.2. Select File > New > Configuration Database to open the New Configuration Database dialog.3. Enter a name for the new database and click Finish.4. In the Project Explorer view, right click and select New > Model Configuration from the context
menu to open the New Model dialog.5. Select the database in which to create the new model entry, then click Next. This opens the Select
Method for Connecting to Model dialog.6. Select the method for connecting to the model. The options are:
a. Launch and connect to a specific model. Click Next to select a specific model from the filesystem. Click File to browse for a model, for example from the DS-5 installation.
b. Browse for model running on local host. Click Next to browse for models running on the localhost. Then click Browse to display the list of running models. Select the model from the ModelBrowser dialog.
7. Click Finish to connect to the model. This opens the Models Configuration Editor, where you canview and edit the devices in the model.
8. Click Save to save the changes to the model to the .mdf file.9. Click Import to create DS-5 Configuration database files. This adds the configuration to the DS-5
preferences.
10 Platform Configuration10.11 Creating a new model configuration
ARM DUI0446Z Copyright © 2010-2016 ARM Limited or its affiliates. All rightsreserved.
10-248
Non-Confidential
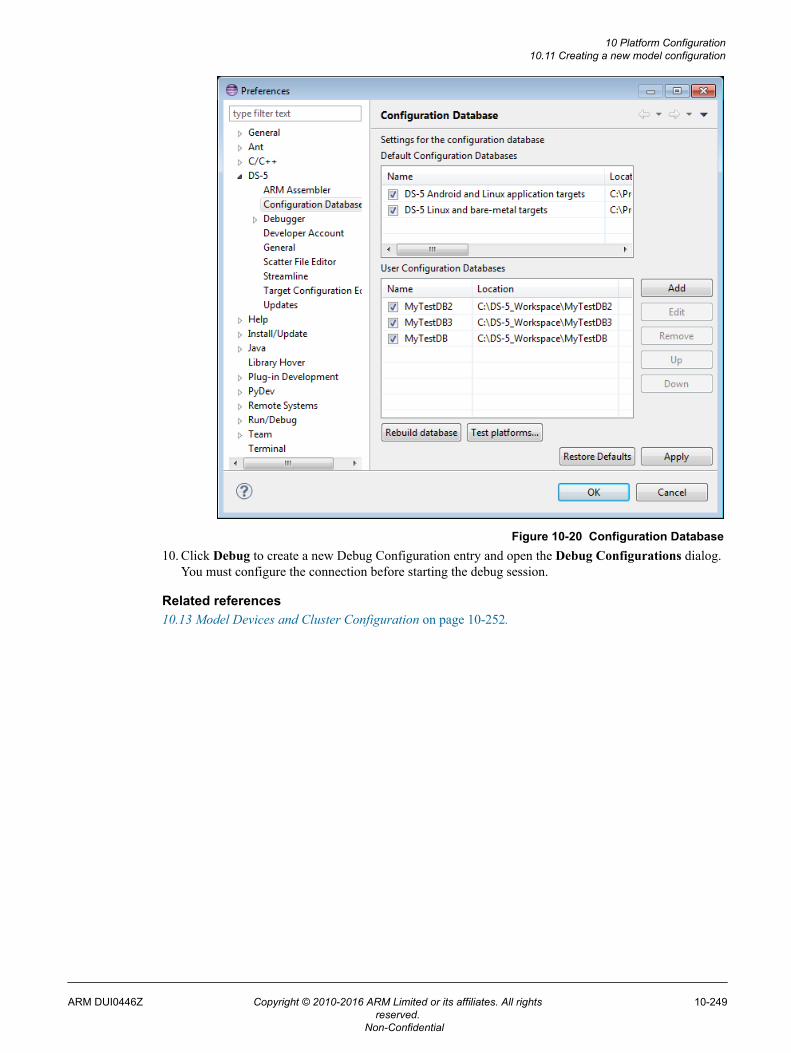
Figure 10-20 Configuration Database10. Click Debug to create a new Debug Configuration entry and open the Debug Configurations dialog.
You must configure the connection before starting the debug session.
Related references10.13 Model Devices and Cluster Configuration on page 10-252.
10 Platform Configuration10.11 Creating a new model configuration
ARM DUI0446Z Copyright © 2010-2016 ARM Limited or its affiliates. All rightsreserved.
10-249
Non-Confidential
10.12 Importing a custom modelIf you have built your own custom CADI-compliant model, to connect to it using DS-5, you have tocreate a new entry in the DS-5 configuration database. Depending on how the model is defined in theconfiguration database, DS-5 can either launch the model or can connect to an already running model.
Note
ARM FVPs not provided with DS-5 installation must be defined in the PATH environment variable ofyour OS to be available for DS-5.
You must add the DS-5_install_directory/bin directory to your PATH environment variable andrestart Eclipse.
• For Windows, enter set PATH=<your model path>\bin;%PATH%• For Linux, enter export PATH=<your model path>/bin:$PATH
To ensure that the modified path is available in future sessions:• For Windows, right-click My Computer > Properties > Advanced system settings > Environment
Variables and under User Variables, create a PATH variable with the value <your model path>\bin, or else append ;<your model path>\bin to any existing PATH variable.
• For Linux, set up the PATH in the appropriate shell configuration file. For example, in .bashrc, addthe line export PATH=<your model path>/bin:$PATH
For the models you build yourself, follow the instructions as described in this topic.
Procedure1. Launch your model and start the CADI server.
• If your model is a library file:— On Windows, select Start > All Programs > ARM DS-5 > DS-5 Command Prompt and
enter model_shell -m <your model path and name> -S.
— On Linux, open a new terminal and run: DS-5_install_directory/bin/model_shell -m<your model path and name> -S
• If your model is an executable file, at the command prompt, enter <your model path and name>-S.
Note
For more information about options available with the model_shell utility in DS-5, entermodel_shell --help at the DS-5 command prompt.
2. Launch DS-5 and open the DS-5 Configuration perspective. Create a new model configuration asshown in 10.11 Creating a new model configuration on page 10-248.a. Browse the list of models running on the local host.b. If there is more than one active CADI-compliant model simulation, DS-5 lists the available
connections. Select the one you want to connect to.c. If needed, select a core to modify.d. If needed, enter the name of the Platform Manufacturer.
Note
If you do not enter a name for the platform manufacturer, you can find the platform you addedlisted under Imported in the list of platforms in the Debug Configurations dialog.
e. Enter the name of the Platform.
10 Platform Configuration10.12 Importing a custom model
ARM DUI0446Z Copyright © 2010-2016 ARM Limited or its affiliates. All rightsreserved.
10-250
Non-Confidential
3. Rebuild the DS-5 Configuration database:• From the DS-5 menu, select Window > Preferences > DS-5 > Configuration Database and
click Rebuild database.
Your model is now available as one of the targets in the configuration database. Use the DebugConfigurations dialog to create, manage, and run configurations for this target.
Related concepts2.1 Overview: Debug connections in DS-5 Debugger on page 2-34.10.2 About importing platform and model configurations on page 10-226.
Related tasks2.7.2 Configuring a connection to a built-in Fixed Virtual Platform (FVP) model for Linux applicationdebug on page 2-53.2.5 Configuring a connection to a Linux application using gdbserver on page 2-46.2.6 Configuring a connection to a Linux kernel on page 2-48.2.3 Configuring a connection to a bare-metal hardware target on page 2-38.8.4 Specifying a custom configuration database using the command-line on page 8-211.
Related informationComponent Architecture Debug Interface Developer Guide.
10 Platform Configuration10.12 Importing a custom model
ARM DUI0446Z Copyright © 2010-2016 ARM Limited or its affiliates. All rightsreserved.
10-251
Non-Confidential
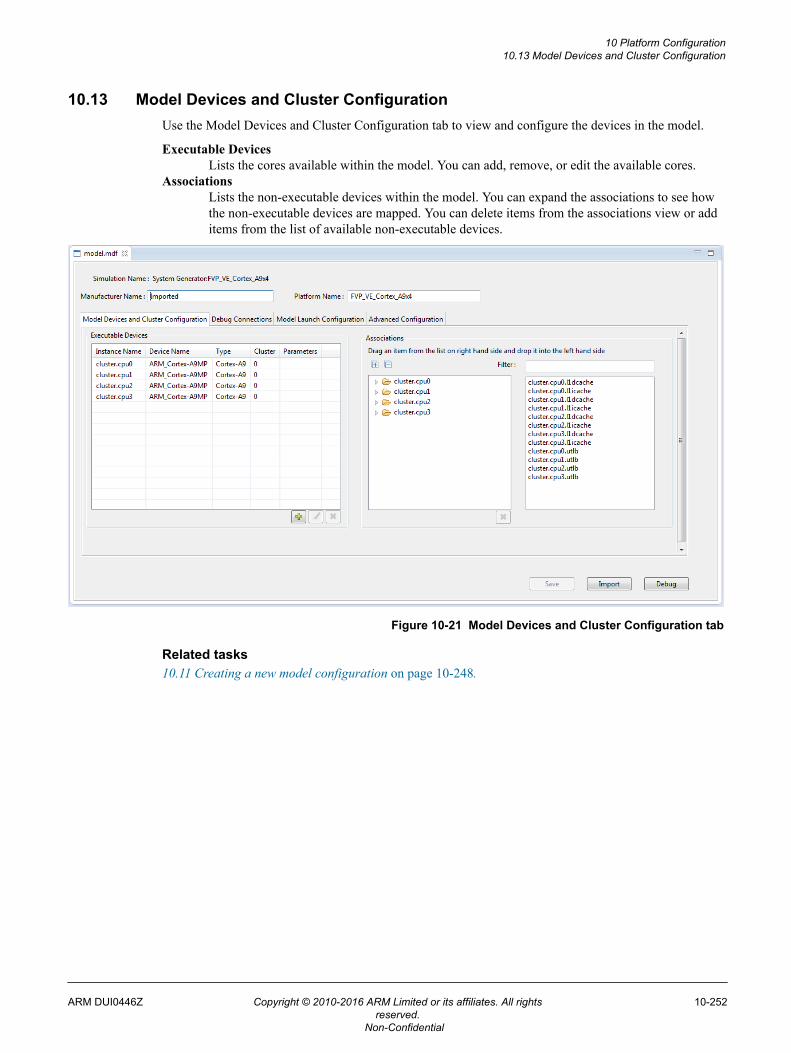
10.13 Model Devices and Cluster ConfigurationUse the Model Devices and Cluster Configuration tab to view and configure the devices in the model.
Executable DevicesLists the cores available within the model. You can add, remove, or edit the available cores.
AssociationsLists the non-executable devices within the model. You can expand the associations to see howthe non-executable devices are mapped. You can delete items from the associations view or additems from the list of available non-executable devices.
Figure 10-21 Model Devices and Cluster Configuration tab
Related tasks10.11 Creating a new model configuration on page 10-248.
10 Platform Configuration10.13 Model Devices and Cluster Configuration
ARM DUI0446Z Copyright © 2010-2016 ARM Limited or its affiliates. All rightsreserved.
10-252
Non-Confidential
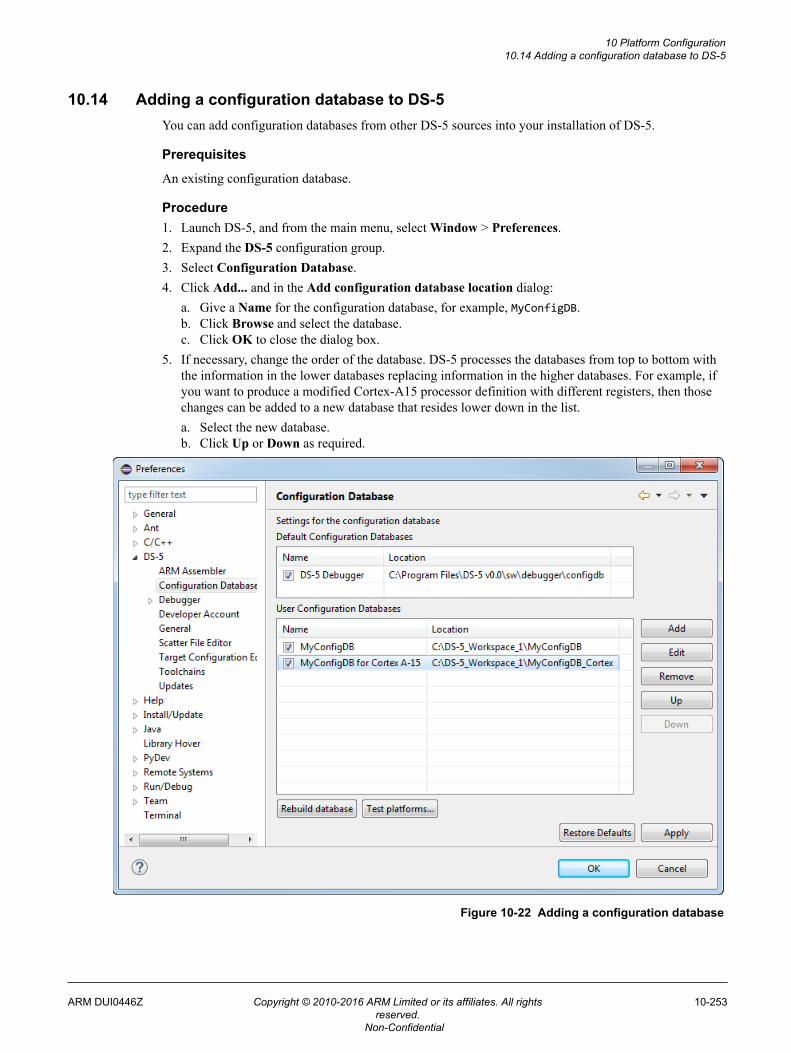
10.14 Adding a configuration database to DS-5You can add configuration databases from other DS-5 sources into your installation of DS-5.
Prerequisites
An existing configuration database.
Procedure1. Launch DS-5, and from the main menu, select Window > Preferences.2. Expand the DS-5 configuration group.3. Select Configuration Database.4. Click Add... and in the Add configuration database location dialog:
a. Give a Name for the configuration database, for example, MyConfigDB.b. Click Browse and select the database.c. Click OK to close the dialog box.
5. If necessary, change the order of the database. DS-5 processes the databases from top to bottom withthe information in the lower databases replacing information in the higher databases. For example, ifyou want to produce a modified Cortex-A15 processor definition with different registers, then thosechanges can be added to a new database that resides lower down in the list.a. Select the new database.b. Click Up or Down as required.
Figure 10-22 Adding a configuration database
10 Platform Configuration10.14 Adding a configuration database to DS-5
ARM DUI0446Z Copyright © 2010-2016 ARM Limited or its affiliates. All rightsreserved.
10-253
Non-Confidential
Note
DS-5 provides built-in databases containing a default set of target configurations. You can enableor disable built-in databases, but you cannot delete them.
6. Click Rebuild database....7. Click OK to close the dialog box and save the settings.
After you have successfully added your configuration database, you can view your platforms in theDebug Configuration dialog, under the Manufacturer area you specified.
Related concepts10.2 About importing platform and model configurations on page 10-226.
Related tasks10.6 Creating a platform configuration on page 10-231.
Related references10.15 Configuration Database panel on page 10-255.
10 Platform Configuration10.14 Adding a configuration database to DS-5
ARM DUI0446Z Copyright © 2010-2016 ARM Limited or its affiliates. All rightsreserved.
10-254
Non-Confidential
10.15 Configuration Database panelUse the Configuration Database panel to manage the configuration database settings.
Default Configuration DatabasesDisplays the default DS-5 configuration databases.
Note
ARM recommends that you do not disable these.
User Configuration DatabasesEnables you to add your own configuration database.
AddOpens a dialog box in which you can select a configuration database to add.
EditOpens a dialog box in which you can modify the name and location of the selectedconfiguration database.
RemoveRemoves the selected configuration database.
UpMoves the selected configuration database up the list.
DownMoves the selected configuration database down the list.
Note
Databases process from top to bottom with information in the lower databases replacinginformation in higher databases. For example, if you produced a modified coredefinition with different registers, you would add it to the database at the bottom of thelist so that the database uses it instead of the core definitions in the shipped database.
Rebuild databaseRebuilds the configuration database.
Test platforms...Enables you to select which platforms to test, then tests them, and reports any errors found.
Restore DefaultsRemoves all the configuration databases from the field text that do not belong to the DS-5default system.
ApplySaves the current configuration database settings.
10 Platform Configuration10.15 Configuration Database panel
ARM DUI0446Z Copyright © 2010-2016 ARM Limited or its affiliates. All rightsreserved.
10-255
Non-Confidential
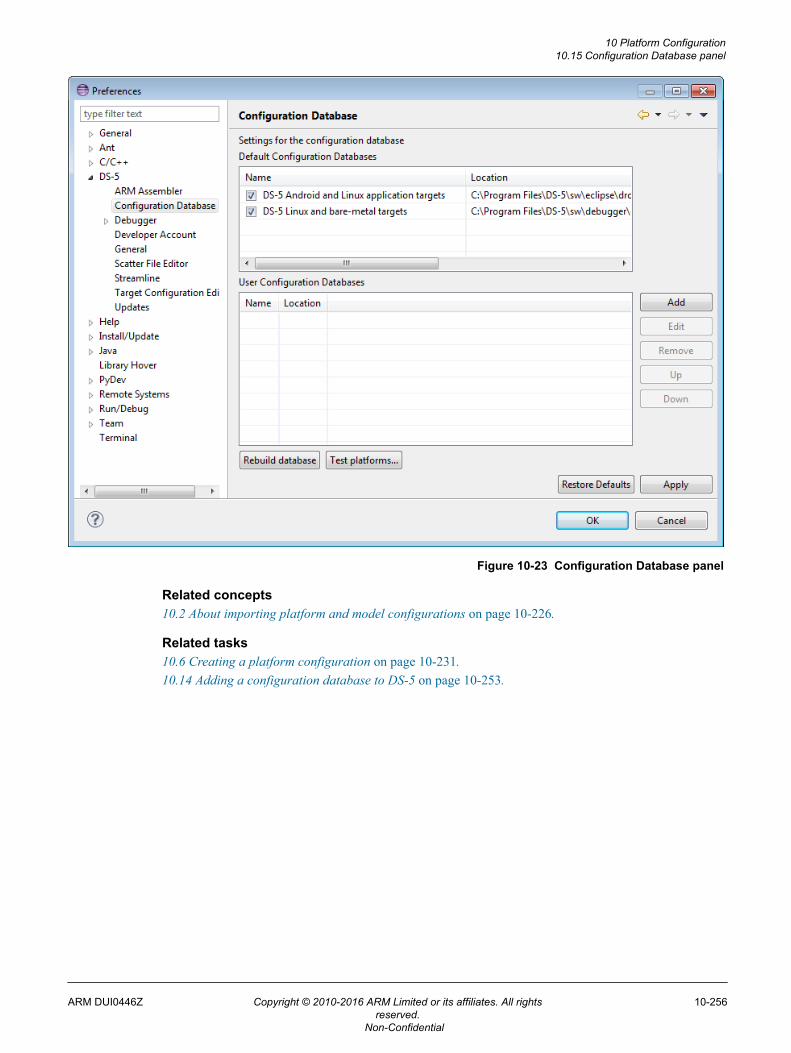
Figure 10-23 Configuration Database panel
Related concepts10.2 About importing platform and model configurations on page 10-226.
Related tasks10.6 Creating a platform configuration on page 10-231.10.14 Adding a configuration database to DS-5 on page 10-253.
10 Platform Configuration10.15 Configuration Database panel
ARM DUI0446Z Copyright © 2010-2016 ARM Limited or its affiliates. All rightsreserved.
10-256
Non-Confidential
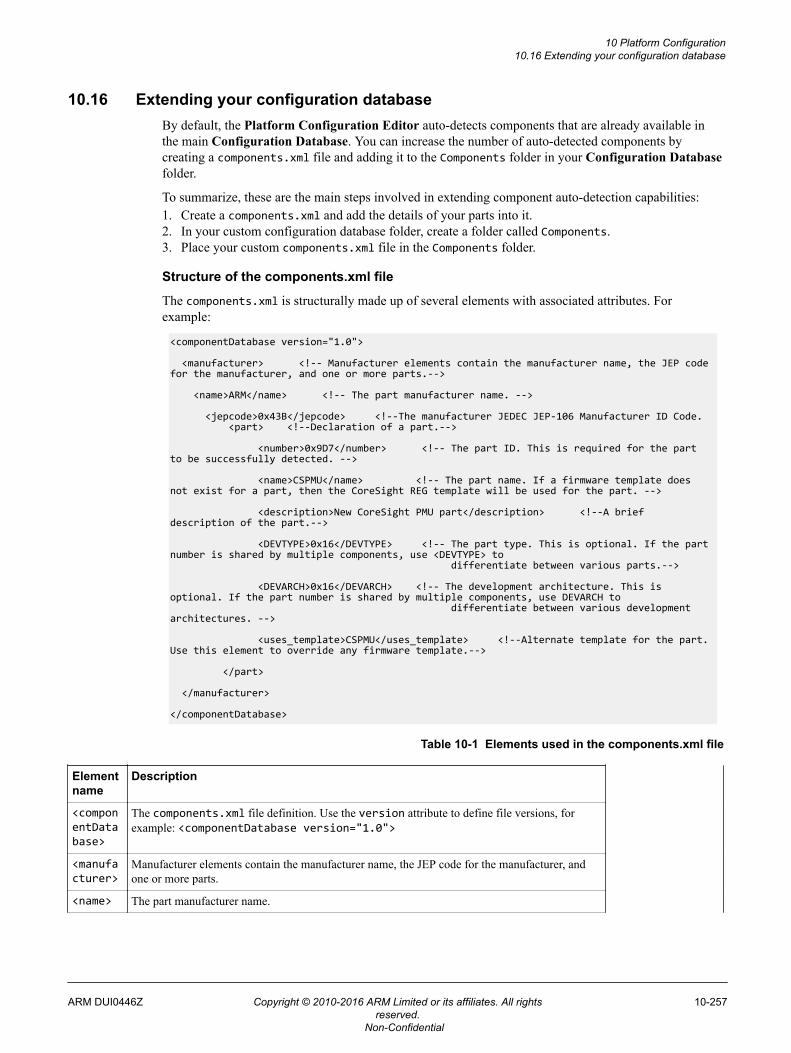
10.16 Extending your configuration databaseBy default, the Platform Configuration Editor auto-detects components that are already available inthe main Configuration Database. You can increase the number of auto-detected components bycreating a components.xml file and adding it to the Components folder in your Configuration Databasefolder.
To summarize, these are the main steps involved in extending component auto-detection capabilities:1. Create a components.xml and add the details of your parts into it.2. In your custom configuration database folder, create a folder called Components.3. Place your custom components.xml file in the Components folder.
Structure of the components.xml file
The components.xml is structurally made up of several elements with associated attributes. Forexample:
<componentDatabase version="1.0">
<manufacturer> <!-- Manufacturer elements contain the manufacturer name, the JEP code for the manufacturer, and one or more parts.-->
<name>ARM</name> <!-- The part manufacturer name. -->
<jepcode>0x43B</jepcode> <!--The manufacturer JEDEC JEP-106 Manufacturer ID Code. <part> <!--Declaration of a part.-->
<number>0x9D7</number> <!-- The part ID. This is required for the part to be successfully detected. -->
<name>CSPMU</name> <!-- The part name. If a firmware template does not exist for a part, then the CoreSight REG template will be used for the part. -->
<description>New CoreSight PMU part</description> <!--A brief description of the part.-->
<DEVTYPE>0x16</DEVTYPE> <!-- The part type. This is optional. If the part number is shared by multiple components, use <DEVTYPE> to differentiate between various parts.-->
<DEVARCH>0x16</DEVARCH> <!-- The development architecture. This is optional. If the part number is shared by multiple components, use DEVARCH to differentiate between various development architectures. -->
<uses_template>CSPMU</uses_template> <!--Alternate template for the part. Use this element to override any firmware template.-->
</part>
</manufacturer>
</componentDatabase>
Table 10-1 Elements used in the components.xml file
Elementname
Description
<componentDatabase>
The components.xml file definition. Use the version attribute to define file versions, forexample: <componentDatabase version="1.0">
<manufacturer>
Manufacturer elements contain the manufacturer name, the JEP code for the manufacturer, andone or more parts.
<name> The part manufacturer name.
10 Platform Configuration10.16 Extending your configuration database
ARM DUI0446Z Copyright © 2010-2016 ARM Limited or its affiliates. All rightsreserved.
10-257
Non-Confidential
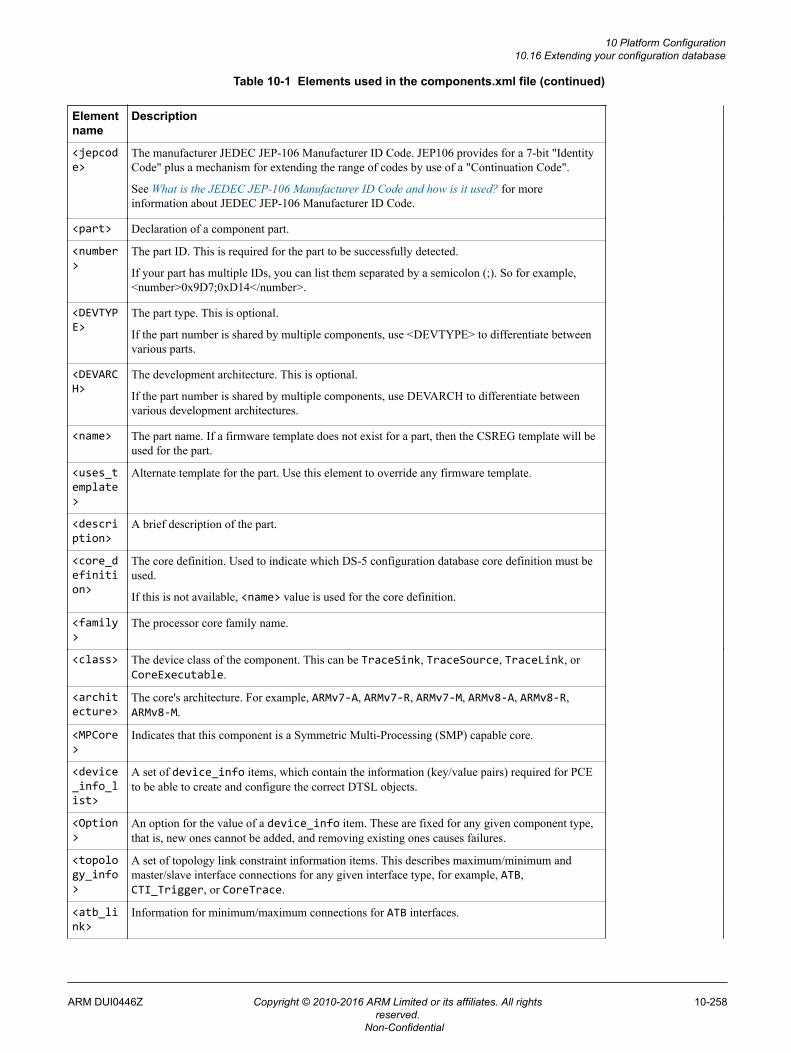
Table 10-1 Elements used in the components.xml file (continued)
Elementname
Description
<jepcode>
The manufacturer JEDEC JEP-106 Manufacturer ID Code. JEP106 provides for a 7-bit "IdentityCode" plus a mechanism for extending the range of codes by use of a "Continuation Code".
See What is the JEDEC JEP-106 Manufacturer ID Code and how is it used? for moreinformation about JEDEC JEP-106 Manufacturer ID Code.
<part> Declaration of a component part.
<number>
The part ID. This is required for the part to be successfully detected.
If your part has multiple IDs, you can list them separated by a semicolon (;). So for example,<number>0x9D7;0xD14</number>.
<DEVTYPE>
The part type. This is optional.
If the part number is shared by multiple components, use <DEVTYPE> to differentiate betweenvarious parts.
<DEVARCH>
The development architecture. This is optional.
If the part number is shared by multiple components, use DEVARCH to differentiate betweenvarious development architectures.
<name> The part name. If a firmware template does not exist for a part, then the CSREG template will beused for the part.
<uses_template>
Alternate template for the part. Use this element to override any firmware template.
<description>
A brief description of the part.
<core_definition>
The core definition. Used to indicate which DS-5 configuration database core definition must beused.
If this is not available, <name> value is used for the core definition.
<family>
The processor core family name.
<class> The device class of the component. This can be TraceSink, TraceSource, TraceLink, orCoreExecutable.
<architecture>
The core's architecture. For example, ARMv7-A, ARMv7-R, ARMv7-M, ARMv8-A, ARMv8-R,ARMv8-M.
<MPCore>
Indicates that this component is a Symmetric Multi-Processing (SMP) capable core.
<device_info_list>
A set of device_info items, which contain the information (key/value pairs) required for PCEto be able to create and configure the correct DTSL objects.
<Option>
An option for the value of a device_info item. These are fixed for any given component type,that is, new ones cannot be added, and removing existing ones causes failures.
<topology_info>
A set of topology link constraint information items. This describes maximum/minimum andmaster/slave interface connections for any given interface type, for example, ATB,CTI_Trigger, or CoreTrace.
<atb_link>
Information for minimum/maximum connections for ATB interfaces.
10 Platform Configuration10.16 Extending your configuration database
ARM DUI0446Z Copyright © 2010-2016 ARM Limited or its affiliates. All rightsreserved.
10-258
Non-Confidential
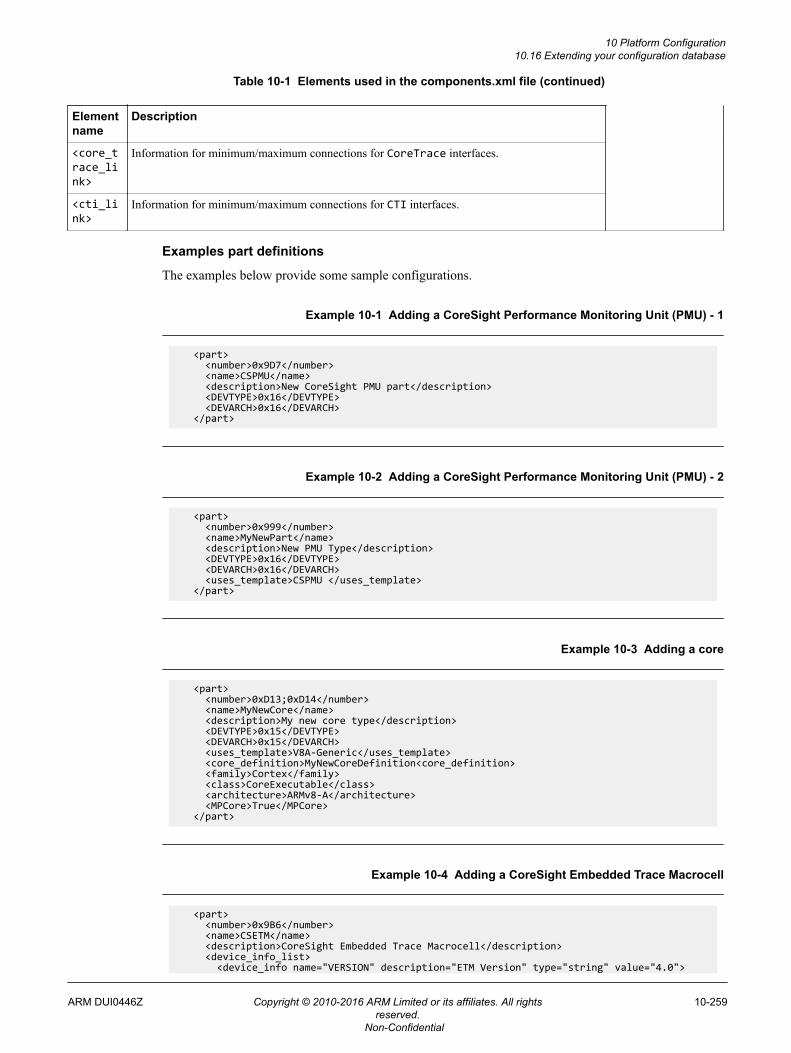
Table 10-1 Elements used in the components.xml file (continued)
Elementname
Description
<core_trace_link>
Information for minimum/maximum connections for CoreTrace interfaces.
<cti_link>
Information for minimum/maximum connections for CTI interfaces.
Examples part definitions
The examples below provide some sample configurations.
Example 10-1 Adding a CoreSight Performance Monitoring Unit (PMU) - 1
<part> <number>0x9D7</number> <name>CSPMU</name> <description>New CoreSight PMU part</description> <DEVTYPE>0x16</DEVTYPE> <DEVARCH>0x16</DEVARCH> </part>
Example 10-2 Adding a CoreSight Performance Monitoring Unit (PMU) - 2
<part> <number>0x999</number> <name>MyNewPart</name> <description>New PMU Type</description> <DEVTYPE>0x16</DEVTYPE> <DEVARCH>0x16</DEVARCH> <uses_template>CSPMU </uses_template> </part>
Example 10-3 Adding a core
<part> <number>0xD13;0xD14</number> <name>MyNewCore</name> <description>My new core type</description> <DEVTYPE>0x15</DEVTYPE> <DEVARCH>0x15</DEVARCH> <uses_template>V8A-Generic</uses_template> <core_definition>MyNewCoreDefinition<core_definition> <family>Cortex</family> <class>CoreExecutable</class> <architecture>ARMv8-A</architecture> <MPCore>True</MPCore> </part>
Example 10-4 Adding a CoreSight Embedded Trace Macrocell
<part> <number>0x9B6</number> <name>CSETM</name> <description>CoreSight Embedded Trace Macrocell</description> <device_info_list> <device_info name="VERSION" description="ETM Version" type="string" value="4.0">
10 Platform Configuration10.16 Extending your configuration database
ARM DUI0446Z Copyright © 2010-2016 ARM Limited or its affiliates. All rightsreserved.
10-259
Non-Confidential
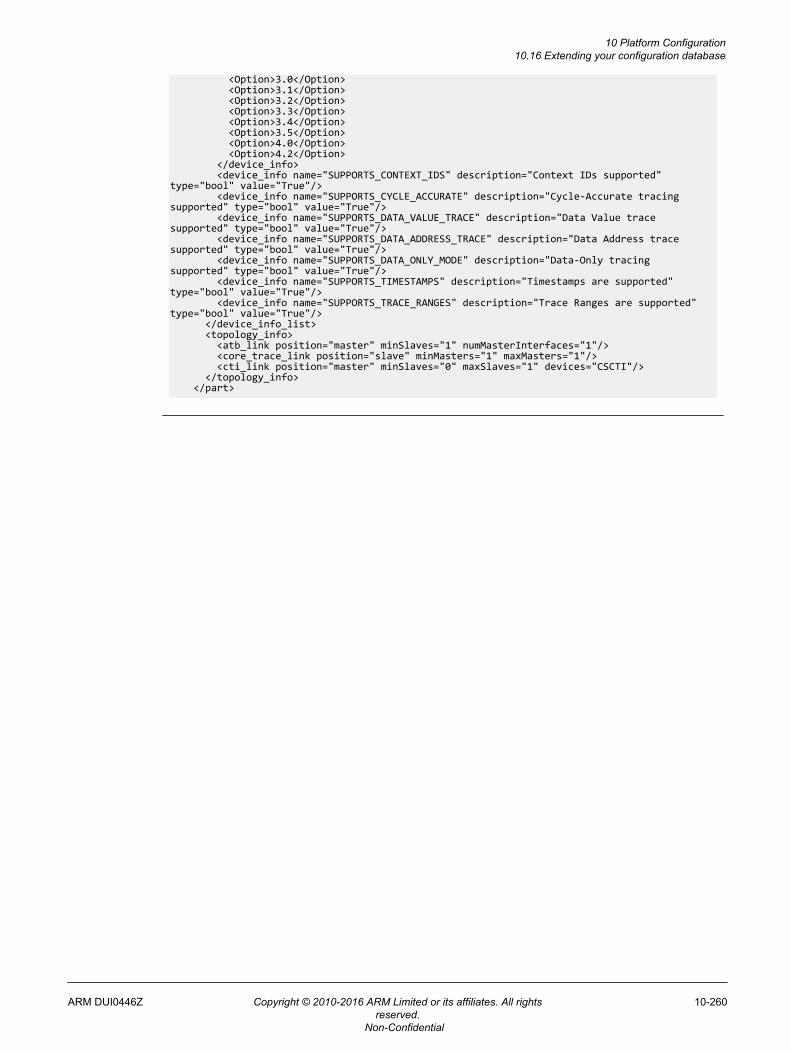
<Option>3.0</Option> <Option>3.1</Option> <Option>3.2</Option> <Option>3.3</Option> <Option>3.4</Option> <Option>3.5</Option> <Option>4.0</Option> <Option>4.2</Option> </device_info> <device_info name="SUPPORTS_CONTEXT_IDS" description="Context IDs supported" type="bool" value="True"/> <device_info name="SUPPORTS_CYCLE_ACCURATE" description="Cycle-Accurate tracing supported" type="bool" value="True"/> <device_info name="SUPPORTS_DATA_VALUE_TRACE" description="Data Value trace supported" type="bool" value="True"/> <device_info name="SUPPORTS_DATA_ADDRESS_TRACE" description="Data Address trace supported" type="bool" value="True"/> <device_info name="SUPPORTS_DATA_ONLY_MODE" description="Data-Only tracing supported" type="bool" value="True"/> <device_info name="SUPPORTS_TIMESTAMPS" description="Timestamps are supported" type="bool" value="True"/> <device_info name="SUPPORTS_TRACE_RANGES" description="Trace Ranges are supported" type="bool" value="True"/> </device_info_list> <topology_info> <atb_link position="master" minSlaves="1" numMasterInterfaces="1"/> <core_trace_link position="slave" minMasters="1" maxMasters="1"/> <cti_link position="master" minSlaves="0" maxSlaves="1" devices="CSCTI"/> </topology_info> </part>
10 Platform Configuration10.16 Extending your configuration database
ARM DUI0446Z Copyright © 2010-2016 ARM Limited or its affiliates. All rightsreserved.
10-260
Non-Confidential
Chapter 11DS-5 Debug Perspectives and Views
Describes the DS-5 Debug perspective and related views in the Eclipse Integrated DevelopmentEnvironment (IDE).
It contains the following sections:• 11.1 App Console view on page 11-263.• 11.2 ARM Asm Info view on page 11-265.• 11.3 ARM assembler editor on page 11-266.• 11.4 Breakpoints view on page 11-268.• 11.5 C/C++ editor on page 11-272.• 11.6 Commands view on page 11-275.• 11.7 Debug Control view on page 11-278.• 11.8 Stack view on page 11-282.• 11.9 Disassembly view on page 11-285.• 11.10 Events view on page 11-289.• 11.11 Event Viewer Settings dialog box on page 11-291.• 11.12 Expressions view on page 11-294.• 11.13 Functions view on page 11-298.• 11.14 History view on page 11-300.• 11.15 Memory view on page 11-302.• 11.16 MMU view on page 11-308.• 11.17 Modules view on page 11-312.• 11.18 Registers view on page 11-314.• 11.19 OS Data view on page 11-319.• 11.20 Overlays view on page 11-320.• 11.21 Cache Data view on page 11-321.• 11.22 Screen view on page 11-323.
ARM DUI0446Z Copyright © 2010-2016 ARM Limited or its affiliates. All rightsreserved.
11-261
Non-Confidential

• 11.23 Scripts view on page 11-326.• 11.24 Target Console view on page 11-328.• 11.25 Target view on page 11-329.• 11.26 Trace view on page 11-331.• 11.27 Trace Control view on page 11-334.• 11.28 Variables view on page 11-337.• 11.29 Timed Auto-Refresh Properties dialog box on page 11-343.• 11.30 Memory Exporter dialog box on page 11-344.• 11.31 Memory Importer dialog box on page 11-345.• 11.32 Fill Memory dialog box on page 11-346.• 11.33 Export Trace Report dialog box on page 11-347.• 11.34 Breakpoint Properties dialog box on page 11-349.• 11.35 Watchpoint Properties dialog box on page 11-352.• 11.36 Tracepoint Properties dialog box on page 11-353.• 11.37 Manage Signals dialog box on page 11-354.• 11.38 Functions Filter dialog box on page 11-356.• 11.39 Script Parameters dialog box on page 11-357.• 11.40 Debug Configurations - Connection tab on page 11-358.• 11.41 Debug Configurations - Files tab on page 11-361.• 11.42 Debug Configurations - Debugger tab on page 11-364.• 11.43 Debug Configurations - OS Awareness tab on page 11-367.• 11.44 Debug Configurations - Arguments tab on page 11-368.• 11.45 Debug Configurations - Environment tab on page 11-370.• 11.46 DTSL Configuration Editor dialog box on page 11-372.• 11.47 About the Remote System Explorer on page 11-374.• 11.48 Remote Systems view on page 11-375.• 11.49 Remote System Details view on page 11-376.• 11.50 Target management terminal for serial and SSH connections on page 11-377.• 11.51 Remote Scratchpad view on page 11-378.• 11.52 Remote Systems terminal for SSH connections on page 11-379.• 11.53 Terminal Settings dialog box on page 11-380.• 11.54 Debug Hardware Configure IP view on page 11-382.• 11.55 Debug Hardware Firmware Installer view on page 11-384.• 11.56 Connection Browser dialog box on page 11-387.• 11.57 DS-5 Debugger menu and toolbar icons on page 11-388.
11 DS-5 Debug Perspectives and Views
ARM DUI0446Z Copyright © 2010-2016 ARM Limited or its affiliates. All rightsreserved.
11-262
Non-Confidential
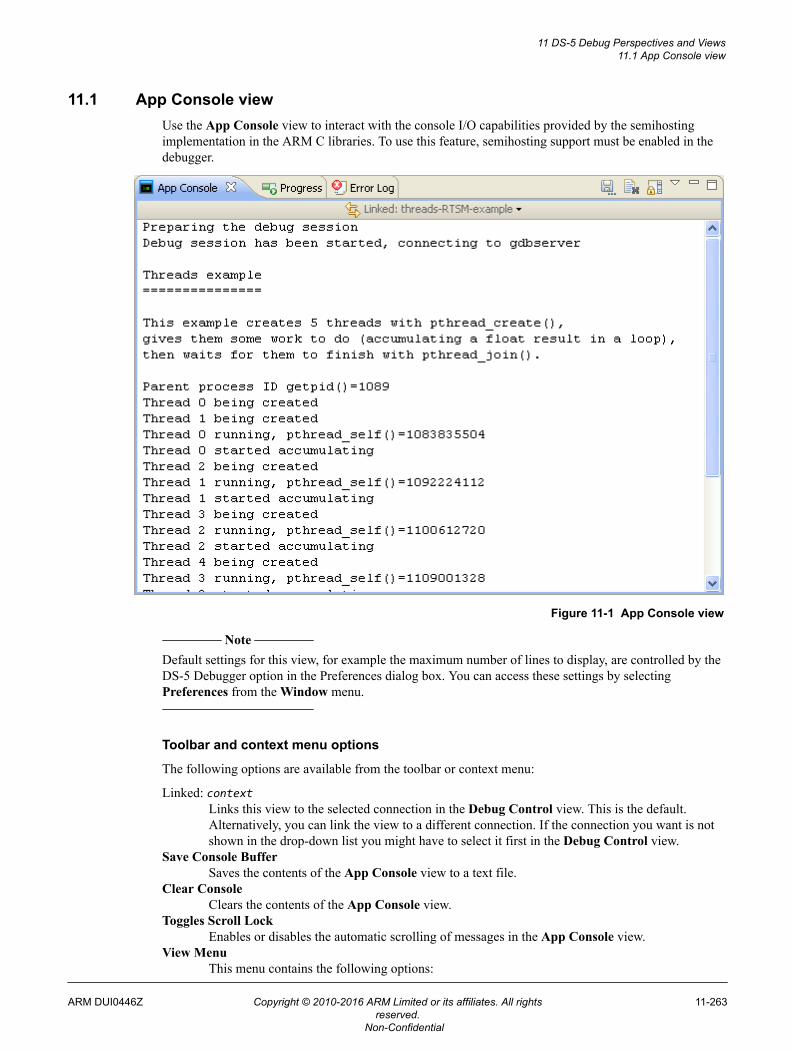
11.1 App Console viewUse the App Console view to interact with the console I/O capabilities provided by the semihostingimplementation in the ARM C libraries. To use this feature, semihosting support must be enabled in thedebugger.
Figure 11-1 App Console view
Note
Default settings for this view, for example the maximum number of lines to display, are controlled by theDS-5 Debugger option in the Preferences dialog box. You can access these settings by selectingPreferences from the Window menu.
Toolbar and context menu options
The following options are available from the toolbar or context menu:
Linked: contextLinks this view to the selected connection in the Debug Control view. This is the default.Alternatively, you can link the view to a different connection. If the connection you want is notshown in the drop-down list you might have to select it first in the Debug Control view.
Save Console BufferSaves the contents of the App Console view to a text file.
Clear ConsoleClears the contents of the App Console view.
Toggles Scroll LockEnables or disables the automatic scrolling of messages in the App Console view.
View MenuThis menu contains the following options:
11 DS-5 Debug Perspectives and Views11.1 App Console view
ARM DUI0446Z Copyright © 2010-2016 ARM Limited or its affiliates. All rightsreserved.
11-263
Non-Confidential
New App Console ViewDisplays a new instance of the App Console view.
Bring to Front for WriteIf enabled, the debugger automatically changes the focus to this view when asemihosting application prompts for input.
CopyCopies the selected text.
PastePastes text that you have previously copied. You can paste text only when the applicationdisplays a semihosting prompt.
Select AllSelects all text.
Related references3.17 Using semihosting to access resources on the host computer on page 3-95.3.18 Working with semihosting on page 3-97.Chapter 11 DS-5 Debug Perspectives and Views on page 11-261.
11 DS-5 Debug Perspectives and Views11.1 App Console view
ARM DUI0446Z Copyright © 2010-2016 ARM Limited or its affiliates. All rightsreserved.
11-264
Non-Confidential
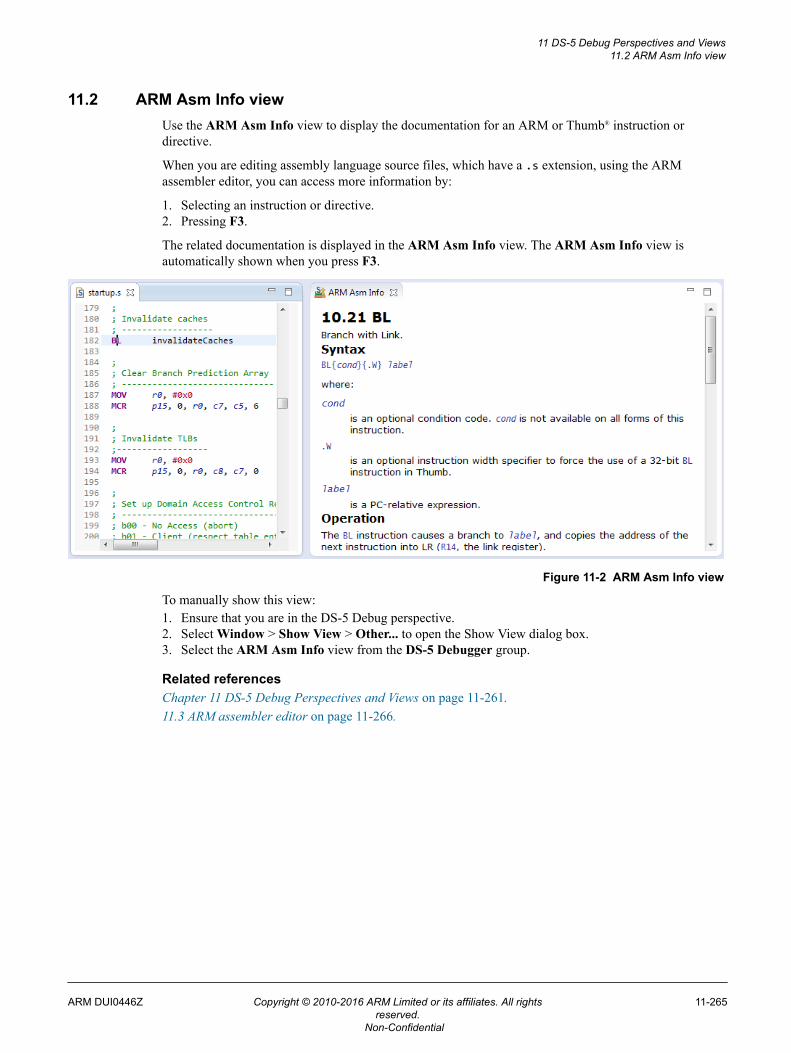
11.2 ARM Asm Info viewUse the ARM Asm Info view to display the documentation for an ARM or Thumb® instruction ordirective.
When you are editing assembly language source files, which have a .s extension, using the ARMassembler editor, you can access more information by:
1. Selecting an instruction or directive.2. Pressing F3.
The related documentation is displayed in the ARM Asm Info view. The ARM Asm Info view isautomatically shown when you press F3.
Figure 11-2 ARM Asm Info view
To manually show this view:1. Ensure that you are in the DS-5 Debug perspective.2. Select Window > Show View > Other... to open the Show View dialog box.3. Select the ARM Asm Info view from the DS-5 Debugger group.
Related referencesChapter 11 DS-5 Debug Perspectives and Views on page 11-261.11.3 ARM assembler editor on page 11-266.
11 DS-5 Debug Perspectives and Views11.2 ARM Asm Info view
ARM DUI0446Z Copyright © 2010-2016 ARM Limited or its affiliates. All rightsreserved.
11-265
Non-Confidential
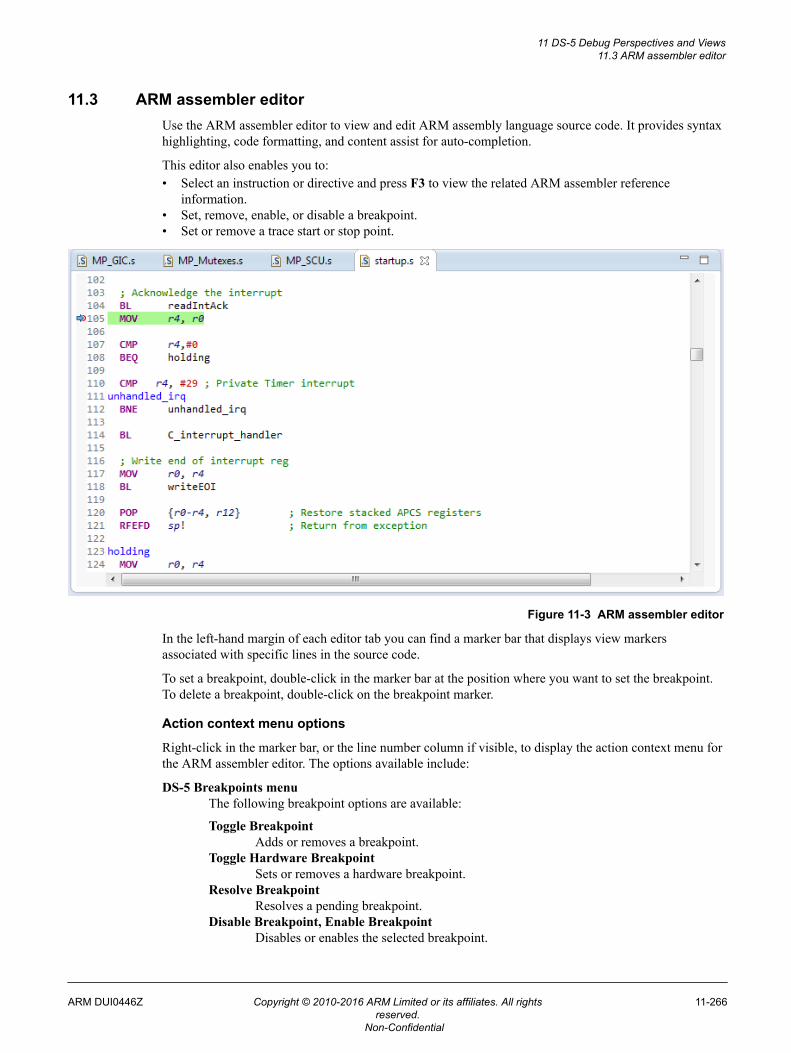
11.3 ARM assembler editorUse the ARM assembler editor to view and edit ARM assembly language source code. It provides syntaxhighlighting, code formatting, and content assist for auto-completion.
This editor also enables you to:• Select an instruction or directive and press F3 to view the related ARM assembler reference
information.• Set, remove, enable, or disable a breakpoint.• Set or remove a trace start or stop point.
Figure 11-3 ARM assembler editor
In the left-hand margin of each editor tab you can find a marker bar that displays view markersassociated with specific lines in the source code.
To set a breakpoint, double-click in the marker bar at the position where you want to set the breakpoint.To delete a breakpoint, double-click on the breakpoint marker.
Action context menu options
Right-click in the marker bar, or the line number column if visible, to display the action context menu forthe ARM assembler editor. The options available include:
DS-5 Breakpoints menuThe following breakpoint options are available:
Toggle BreakpointAdds or removes a breakpoint.
Toggle Hardware BreakpointSets or removes a hardware breakpoint.
Resolve BreakpointResolves a pending breakpoint.
Disable Breakpoint, Enable BreakpointDisables or enables the selected breakpoint.
11 DS-5 Debug Perspectives and Views11.3 ARM assembler editor
ARM DUI0446Z Copyright © 2010-2016 ARM Limited or its affiliates. All rightsreserved.
11-266
Non-Confidential
Toggle Trace Start PointSets or removes a trace start point.
Toggle Trace Stop PointSets or removes a trace stop point.
Toggle Trace Trigger PointStarts a trace trigger point at the selected address.
Breakpoint Properties...Displays the Breakpoint Properties dialog box for the selected breakpoint. This enablesyou to control breakpoint activation.
Default Breakpoint TypeThe following breakpoint options are available:
DS-5 C/C++ BreakpointSelect to use the DS-5 Debug perspective breakpoint scheme. This is the default for theDS-5 Debug perspective.
Note
The Default Breakpoint Type selected causes the top-level Toggle Breakpoint menu in thiscontext menu and the double-click action in the left-hand ruler to toggle either CDT Breakpointsor DS-5 Breakpoints. This menu is also available from the Run menu in the main menu bar atthe top of the C/C++, Debug, and DS-5 Debug perspectives.
The menu options under DS-5 Breakpoints do not honor this setting and always refer to DS-5Breakpoints.
Show Line NumbersShow or hide line numbers.
For more information on the other options not listed here, see the dynamic help.
Related references3.13 Setting a tracepoint on page 3-89.3.8 Conditional breakpoints on page 3-81.3.9 Assigning conditions to an existing breakpoint on page 3-82.3.12 Pending breakpoints and watchpoints on page 3-87.Chapter 11 DS-5 Debug Perspectives and Views on page 11-261.5.1 Examining the target execution environment on page 5-136.5.2 Examining the call stack on page 5-137.11.2 ARM Asm Info view on page 11-265.
11 DS-5 Debug Perspectives and Views11.3 ARM assembler editor
ARM DUI0446Z Copyright © 2010-2016 ARM Limited or its affiliates. All rightsreserved.
11-267
Non-Confidential
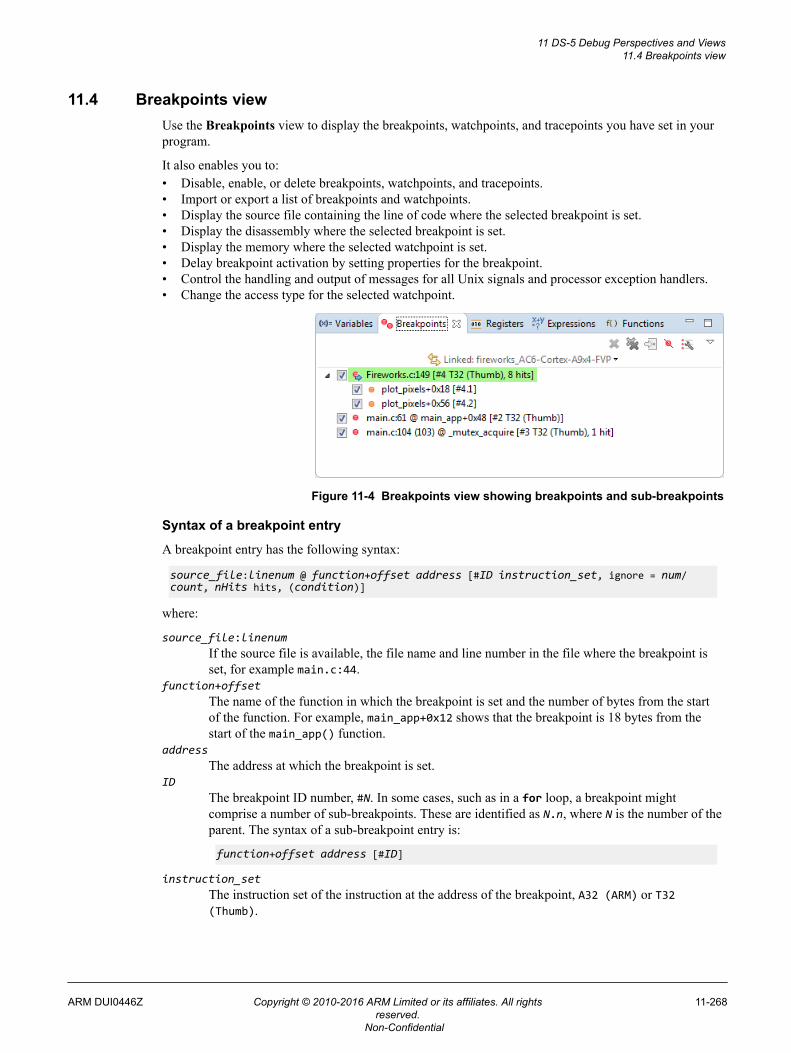
11.4 Breakpoints viewUse the Breakpoints view to display the breakpoints, watchpoints, and tracepoints you have set in yourprogram.
It also enables you to:• Disable, enable, or delete breakpoints, watchpoints, and tracepoints.• Import or export a list of breakpoints and watchpoints.• Display the source file containing the line of code where the selected breakpoint is set.• Display the disassembly where the selected breakpoint is set.• Display the memory where the selected watchpoint is set.• Delay breakpoint activation by setting properties for the breakpoint.• Control the handling and output of messages for all Unix signals and processor exception handlers.• Change the access type for the selected watchpoint.
Figure 11-4 Breakpoints view showing breakpoints and sub-breakpoints
Syntax of a breakpoint entry
A breakpoint entry has the following syntax:
source_file:linenum @ function+offset address [#ID instruction_set, ignore = num/count, nHits hits, (condition)]
where:
source_file:linenumIf the source file is available, the file name and line number in the file where the breakpoint isset, for example main.c:44.
function+offsetThe name of the function in which the breakpoint is set and the number of bytes from the startof the function. For example, main_app+0x12 shows that the breakpoint is 18 bytes from thestart of the main_app() function.
addressThe address at which the breakpoint is set.
IDThe breakpoint ID number, #N. In some cases, such as in a for loop, a breakpoint mightcomprise a number of sub-breakpoints. These are identified as N.n, where N is the number of theparent. The syntax of a sub-breakpoint entry is:
function+offset address [#ID]
instruction_setThe instruction set of the instruction at the address of the breakpoint, A32 (ARM) or T32(Thumb).
11 DS-5 Debug Perspectives and Views11.4 Breakpoints view
ARM DUI0446Z Copyright © 2010-2016 ARM Limited or its affiliates. All rightsreserved.
11-268
Non-Confidential
ignore = num/countAn ignore count, if set, where:
num equals count initially, and decrements on each pass until it reaches zero.
count is the value you have specified for the ignore count.
nHits hitsA counter that increments each time the breakpoint is hit. This is not displayed until the first hit.If you set an ignore count, hits count does not start incrementing until the ignore countreaches zero.
conditionThe stop condition you have specified.
Syntax of a watchpoint entry
A watchpoint entry has the following syntax:
name type @ address [#ID]
where:
nameThe name of the variable where the watchpoint is set.
typeThe access type of the watchpoint.
addressThe address at which the watchpoint is set.
IDThe watchpoint ID number.
Syntax of a tracepoint entry
A tracepoint entry has the following syntax:
source_file:linenum
where:
source_file:linenumIf the source file is available, the file name and line number in the file where the tracepoint isset.
Toolbar and context menu options
The following options are available from the toolbar or context menu:
Linked: contextLinks this view to the selected connection in the Debug Control view. This is the default.Alternatively, you can link the view to a different connection. If the connection you want is notshown in the drop-down list you might have to select it first in the Debug Control view.
DeleteRemoves the selected breakpoints, watchpoints, and tracepoints.
Delete AllRemoves all breakpoints, watchpoints, and tracepoints.
Go to FileDisplays the source file containing the line of code where the selected breakpoint or tracepoint isset. This option is disabled for a watchpoint.
Skip All BreakpointsDeactivates all currently set breakpoints or watchpoints. The debugger remembers the enabledand disabled state of each breakpoint or watchpoint, and restores that state when you reactivatethem again.
11 DS-5 Debug Perspectives and Views11.4 Breakpoints view
ARM DUI0446Z Copyright © 2010-2016 ARM Limited or its affiliates. All rightsreserved.
11-269
Non-Confidential
Show in DisassemblyDisplays the disassembly where the selected breakpoint is set. This option is disabled for atracepoint.
Show in MemoryDisplays the memory where the selected watchpoint is set. This option is disabled for atracepoint.
ResolveRe-evaluates the address of the selected breakpoint or watchpoint. If the address can beresolved, the breakpoint or watchpoint is set, otherwise it remains pending.
Enable BreakpointsEnables the selected breakpoints, watchpoints, and tracepoints.
Disable BreakpointsDisables the selected breakpoints, watchpoints, and tracepoints.
CopyCopies the selected breakpoints, watchpoints, and tracepoints. You can also use the standardkeyboard shortcut to do this.
PastePastes the copied breakpoints, watchpoints, and tracepoints. They are enabled by default. Youcan also use the standard keyboard shortcut to do this.
Select allSelects all breakpoints, watchpoints, and tracepoints. You can also use the standard keyboardshortcut to do this.
Properties...Displays the Properties dialog box for the selected breakpoint, watchpoint or tracepoint. Thisenables you to control activation or change the access type for the selected watchpoint.
View MenuThe following View Menu options are available:
New Breakpoints ViewDisplays a new instance of the Breakpoints view.
Import BreakpointsImports a list of breakpoints and watchpoints from a file.
Export BreakpointsExports the current list of breakpoints and watchpoints to a file.
Alphanumeric SortSorts the list alphanumerically based on the string displayed in the view.
Ordered SortSorts the list in the order they have been set.
Auto Update Breakpoint Line NumbersAutomatically updates breakpoint line numbers in the Breakpoints view when changesoccur in the source file.
Manage SignalsDisplays the Manage Signals dialog box.
Related concepts6.8 About debugging multi-threaded applications on page 6-152.6.9 About debugging shared libraries on page 6-153.6.10.2 About debugging a Linux kernel on page 6-156.6.10.3 About debugging Linux kernel modules on page 6-158.6.11 About debugging TrustZone enabled targets on page 6-160.
Related references3.13 Setting a tracepoint on page 3-89.3.8 Conditional breakpoints on page 3-81.3.9 Assigning conditions to an existing breakpoint on page 3-82.
11 DS-5 Debug Perspectives and Views11.4 Breakpoints view
ARM DUI0446Z Copyright © 2010-2016 ARM Limited or its affiliates. All rightsreserved.
11-270
Non-Confidential

3.12 Pending breakpoints and watchpoints on page 3-87.Chapter 11 DS-5 Debug Perspectives and Views on page 11-261.5.1 Examining the target execution environment on page 5-136.5.2 Examining the call stack on page 5-137.
11 DS-5 Debug Perspectives and Views11.4 Breakpoints view
ARM DUI0446Z Copyright © 2010-2016 ARM Limited or its affiliates. All rightsreserved.
11-271
Non-Confidential
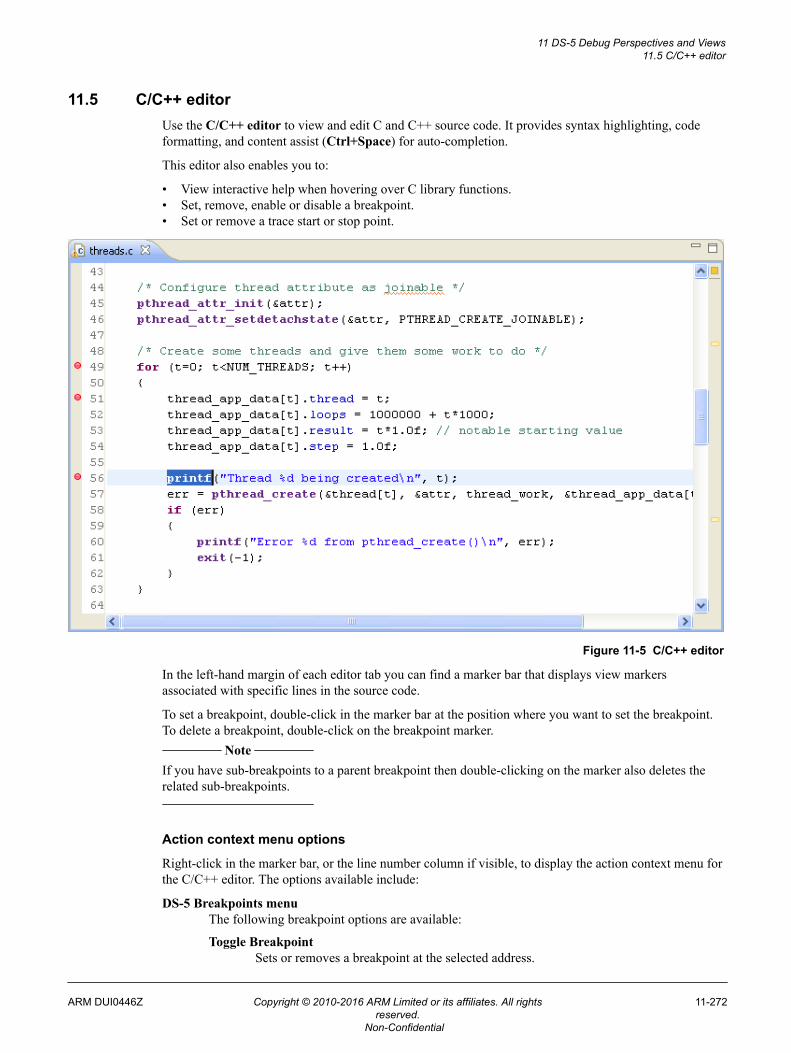
11.5 C/C++ editorUse the C/C++ editor to view and edit C and C++ source code. It provides syntax highlighting, codeformatting, and content assist (Ctrl+Space) for auto-completion.
This editor also enables you to:
• View interactive help when hovering over C library functions.• Set, remove, enable or disable a breakpoint.• Set or remove a trace start or stop point.
Figure 11-5 C/C++ editor
In the left-hand margin of each editor tab you can find a marker bar that displays view markersassociated with specific lines in the source code.
To set a breakpoint, double-click in the marker bar at the position where you want to set the breakpoint.To delete a breakpoint, double-click on the breakpoint marker.
Note
If you have sub-breakpoints to a parent breakpoint then double-clicking on the marker also deletes therelated sub-breakpoints.
Action context menu options
Right-click in the marker bar, or the line number column if visible, to display the action context menu forthe C/C++ editor. The options available include:
DS-5 Breakpoints menuThe following breakpoint options are available:
Toggle BreakpointSets or removes a breakpoint at the selected address.
11 DS-5 Debug Perspectives and Views11.5 C/C++ editor
ARM DUI0446Z Copyright © 2010-2016 ARM Limited or its affiliates. All rightsreserved.
11-272
Non-Confidential
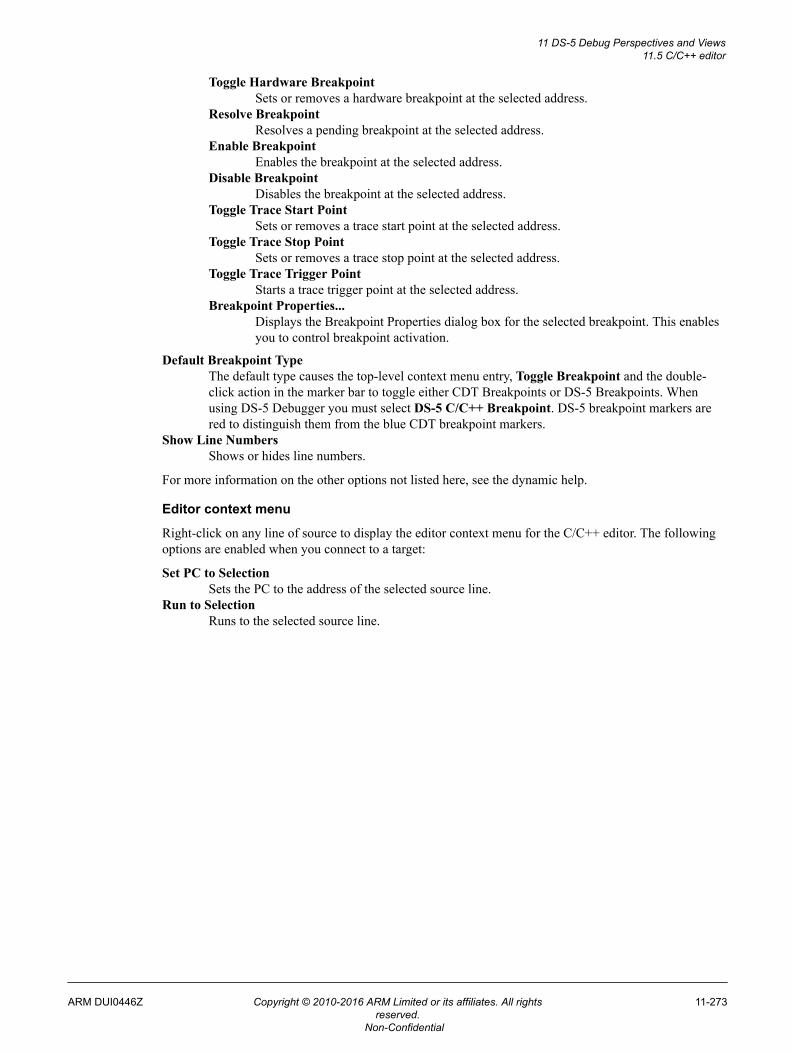
Toggle Hardware BreakpointSets or removes a hardware breakpoint at the selected address.
Resolve BreakpointResolves a pending breakpoint at the selected address.
Enable BreakpointEnables the breakpoint at the selected address.
Disable BreakpointDisables the breakpoint at the selected address.
Toggle Trace Start PointSets or removes a trace start point at the selected address.
Toggle Trace Stop PointSets or removes a trace stop point at the selected address.
Toggle Trace Trigger PointStarts a trace trigger point at the selected address.
Breakpoint Properties...Displays the Breakpoint Properties dialog box for the selected breakpoint. This enablesyou to control breakpoint activation.
Default Breakpoint TypeThe default type causes the top-level context menu entry, Toggle Breakpoint and the double-click action in the marker bar to toggle either CDT Breakpoints or DS-5 Breakpoints. Whenusing DS-5 Debugger you must select DS-5 C/C++ Breakpoint. DS-5 breakpoint markers arered to distinguish them from the blue CDT breakpoint markers.
Show Line NumbersShows or hides line numbers.
For more information on the other options not listed here, see the dynamic help.
Editor context menu
Right-click on any line of source to display the editor context menu for the C/C++ editor. The followingoptions are enabled when you connect to a target:
Set PC to SelectionSets the PC to the address of the selected source line.
Run to SelectionRuns to the selected source line.
11 DS-5 Debug Perspectives and Views11.5 C/C++ editor
ARM DUI0446Z Copyright © 2010-2016 ARM Limited or its affiliates. All rightsreserved.
11-273
Non-Confidential
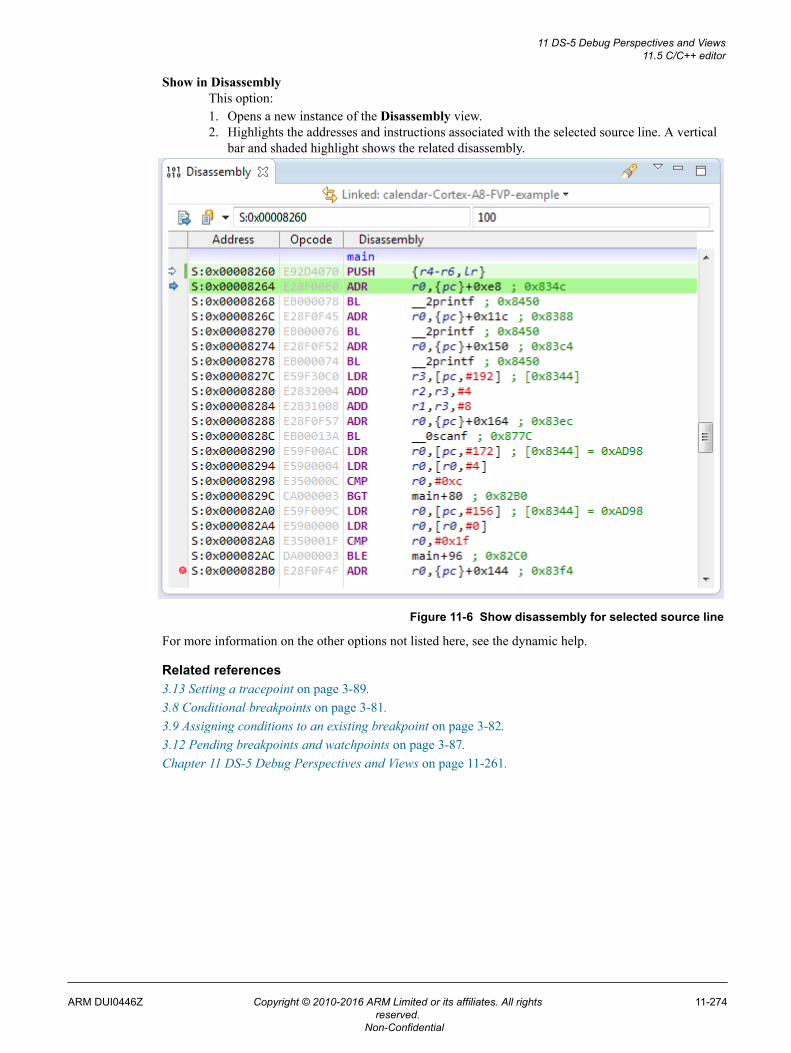
Show in DisassemblyThis option:1. Opens a new instance of the Disassembly view.2. Highlights the addresses and instructions associated with the selected source line. A vertical
bar and shaded highlight shows the related disassembly.
Figure 11-6 Show disassembly for selected source line
For more information on the other options not listed here, see the dynamic help.
Related references3.13 Setting a tracepoint on page 3-89.3.8 Conditional breakpoints on page 3-81.3.9 Assigning conditions to an existing breakpoint on page 3-82.3.12 Pending breakpoints and watchpoints on page 3-87.Chapter 11 DS-5 Debug Perspectives and Views on page 11-261.
11 DS-5 Debug Perspectives and Views11.5 C/C++ editor
ARM DUI0446Z Copyright © 2010-2016 ARM Limited or its affiliates. All rightsreserved.
11-274
Non-Confidential
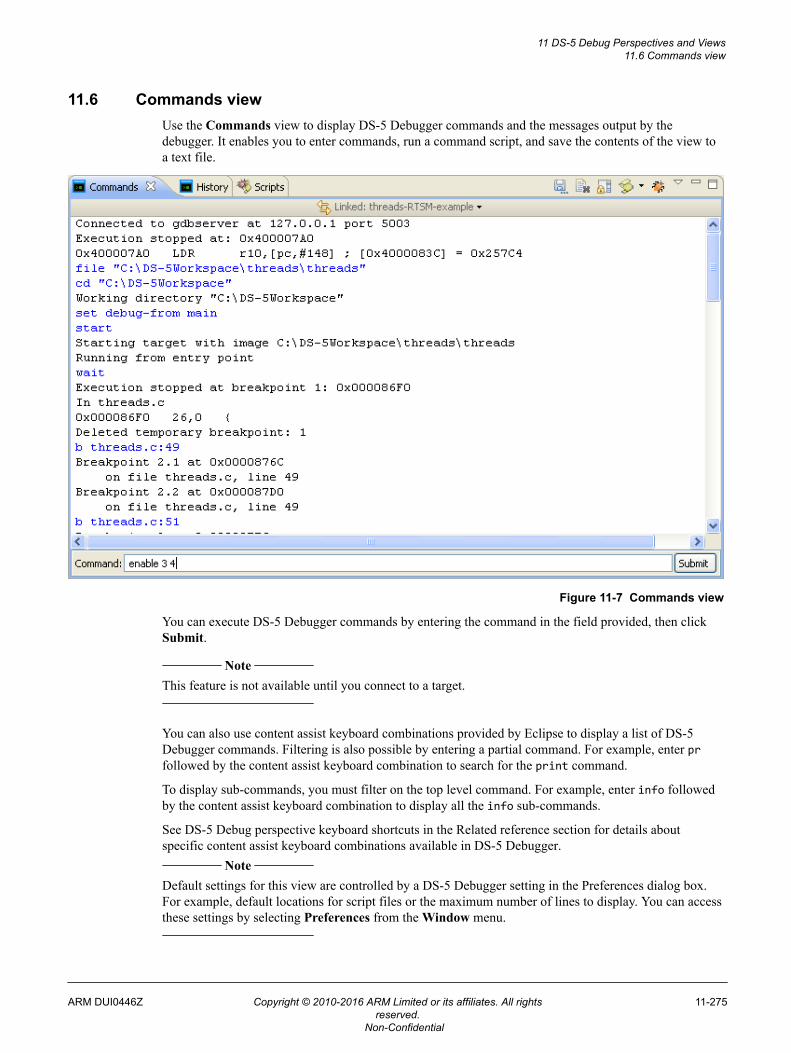
11.6 Commands viewUse the Commands view to display DS-5 Debugger commands and the messages output by thedebugger. It enables you to enter commands, run a command script, and save the contents of the view toa text file.
Figure 11-7 Commands view
You can execute DS-5 Debugger commands by entering the command in the field provided, then clickSubmit.
Note
This feature is not available until you connect to a target.
You can also use content assist keyboard combinations provided by Eclipse to display a list of DS-5Debugger commands. Filtering is also possible by entering a partial command. For example, enter prfollowed by the content assist keyboard combination to search for the print command.
To display sub-commands, you must filter on the top level command. For example, enter info followedby the content assist keyboard combination to display all the info sub-commands.
See DS-5 Debug perspective keyboard shortcuts in the Related reference section for details aboutspecific content assist keyboard combinations available in DS-5 Debugger.
Note
Default settings for this view are controlled by a DS-5 Debugger setting in the Preferences dialog box.For example, default locations for script files or the maximum number of lines to display. You can accessthese settings by selecting Preferences from the Window menu.
11 DS-5 Debug Perspectives and Views11.6 Commands view
ARM DUI0446Z Copyright © 2010-2016 ARM Limited or its affiliates. All rightsreserved.
11-275
Non-Confidential
Toolbar and context menu options
The following options are available from the toolbar or context menu:
Linked: contextLinks this view to the selected connection in the Debug Control view. This is the default.Alternatively you can link the view to a different connection. If the connection you want is notshown in the drop-down list you might have to select it first in the Debug Control view.
Save Console BufferSaves the contents of the Commands view to a text file.
Clear ConsoleClears the contents of the Commands view.
Toggles Scroll LockEnables or disables the automatic scrolling of messages in the Commands view.
Script menuA menu of options that enable you to manage and run command scripts:
<Recent scripts list>A list of the recently run scripts.
<Recent favorites list>A list of the scripts you have added to your favorites list.
Run Script File...Displays the Open dialog box to select and run a script file.
Organize Favorites...Displays the Scripts view, where you can organize your scripts.
Show Command History ViewDisplays the History view.
CopyCopies the selected commands. You can also use the standard keyboard shortcut to do this.
PastePastes the command that you have previously copied into the Command field. You can also usethe standard keyboard shortcut to do this.
Select allSelects all output in the Commands view. You can also use the standard keyboard shortcut to dothis.
Save selected lines as a script...Displays the Save As dialog box to save the selected commands to a script file.
When you click Save on the Save As dialog box, you are given the option to add the script fileto your favorites list. Click OK to add the script to your favorites list. Favorites are displayed inthe Scripts view.
Execute selected linesRuns the selected commands.
New Commands ViewDisplays a new instance of the Commands view.
Related concepts6.8 About debugging multi-threaded applications on page 6-152.6.9 About debugging shared libraries on page 6-153.6.10.2 About debugging a Linux kernel on page 6-156.6.10.3 About debugging Linux kernel modules on page 6-158.6.11 About debugging TrustZone enabled targets on page 6-160.
Related references16.2 DS-5 Debug perspective keyboard shortcuts on page 16-496.3.13 Setting a tracepoint on page 3-89.
11 DS-5 Debug Perspectives and Views11.6 Commands view
ARM DUI0446Z Copyright © 2010-2016 ARM Limited or its affiliates. All rightsreserved.
11-276
Non-Confidential

3.8 Conditional breakpoints on page 3-81.3.9 Assigning conditions to an existing breakpoint on page 3-82.3.12 Pending breakpoints and watchpoints on page 3-87.Chapter 11 DS-5 Debug Perspectives and Views on page 11-261.
Related informationDS-5 Debugger commands.
11 DS-5 Debug Perspectives and Views11.6 Commands view
ARM DUI0446Z Copyright © 2010-2016 ARM Limited or its affiliates. All rightsreserved.
11-277
Non-Confidential
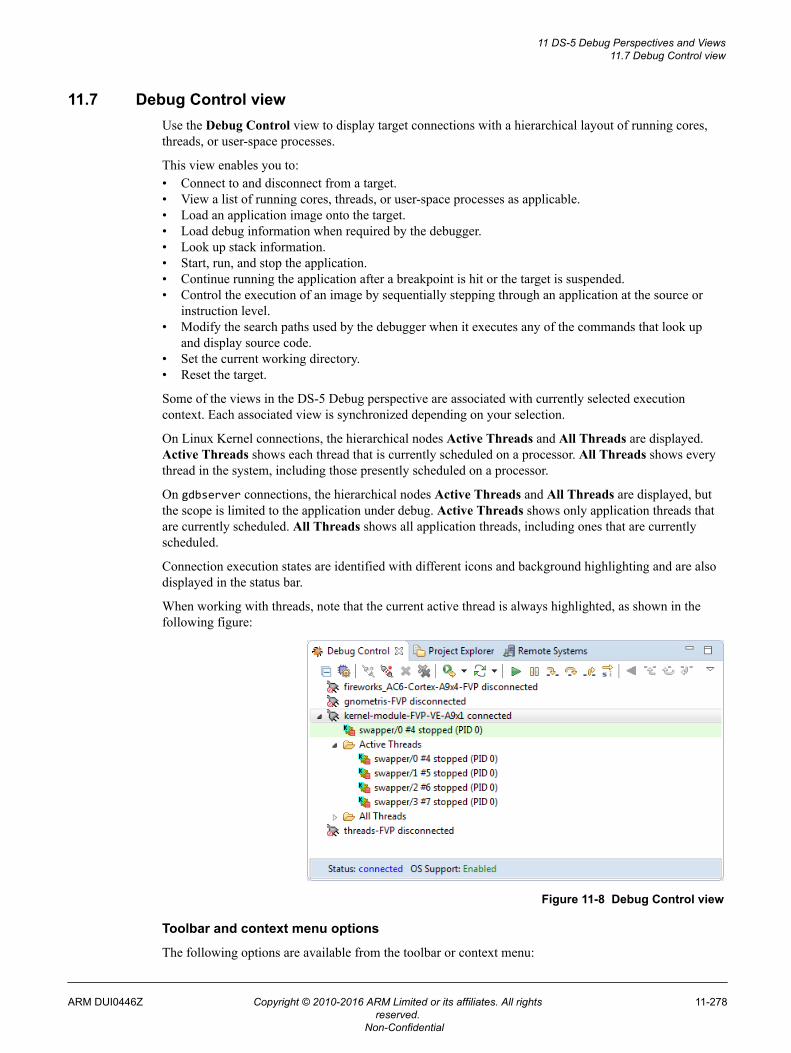
11.7 Debug Control viewUse the Debug Control view to display target connections with a hierarchical layout of running cores,threads, or user-space processes.
This view enables you to:• Connect to and disconnect from a target.• View a list of running cores, threads, or user-space processes as applicable.• Load an application image onto the target.• Load debug information when required by the debugger.• Look up stack information.• Start, run, and stop the application.• Continue running the application after a breakpoint is hit or the target is suspended.• Control the execution of an image by sequentially stepping through an application at the source or
instruction level.• Modify the search paths used by the debugger when it executes any of the commands that look up
and display source code.• Set the current working directory.• Reset the target.
Some of the views in the DS-5 Debug perspective are associated with currently selected executioncontext. Each associated view is synchronized depending on your selection.
On Linux Kernel connections, the hierarchical nodes Active Threads and All Threads are displayed.Active Threads shows each thread that is currently scheduled on a processor. All Threads shows everythread in the system, including those presently scheduled on a processor.
On gdbserver connections, the hierarchical nodes Active Threads and All Threads are displayed, butthe scope is limited to the application under debug. Active Threads shows only application threads thatare currently scheduled. All Threads shows all application threads, including ones that are currentlyscheduled.
Connection execution states are identified with different icons and background highlighting and are alsodisplayed in the status bar.
When working with threads, note that the current active thread is always highlighted, as shown in thefollowing figure:
Figure 11-8 Debug Control view
Toolbar and context menu options
The following options are available from the toolbar or context menu:
11 DS-5 Debug Perspectives and Views11.7 Debug Control view
ARM DUI0446Z Copyright © 2010-2016 ARM Limited or its affiliates. All rightsreserved.
11-278
Non-Confidential
Collapse AllCollapses all expanded items.
Display Cores/Display ThreadsClick to toggle between viewing cores or threads. This option is only active for bare-metalconnections with OS awareness enabled.
Connect to TargetConnects to the selected target using the same launch configuration settings as the previousconnection.
Disconnect from TargetDisconnects from the selected target.
Remove ConnectionRemoves the selected target connection from the Debug Control view.
Remove All ConnectionsRemoves all target connections from the Debug Control view, except any that are connected tothe target.
Debug from menuThis menu lists the different actions that you can perform when a connection is established.
Reset menuThis menu lists the different types of reset that are available on your target.
ContinueContinues running the target.
Note
A Connect only connection might require setting the PC register to the start of the image beforerunning it.
InterruptInterrupts the target and stops the current application.
Step Source LineStep Instruction
This option depends on the stepping mode selected:• If source line mode is selected, steps at the source level including stepping into all function
calls where there is debug information.• If instruction mode is selected, steps at the instruction level including stepping into all
function calls.
Step Over Source LineStep Over Instruction
This option depends on the stepping mode selected:• If source line mode is selected, steps at the source level but stepping over all function calls.• If instruction mode is selected, steps at the instruction level but stepping over all function
calls.
Step OutContinues running to the next instruction after the selected stack frame finishes.
Stepping by Source Line (press to step by instruction)Stepping by Instruction (press to step by source line)
Toggles the stepping mode between source line and instruction.
The Disassembly view and the source editor view are automatically displayed when you step ininstruction mode.
The source editor view is automatically displayed when you step in source line mode. If thetarget stops in code such as a shared library, and the corresponding source is not available, thenthe source editor view is not displayed.
Reverse ContinueContinues running backwards through the code.
11 DS-5 Debug Perspectives and Views11.7 Debug Control view
ARM DUI0446Z Copyright © 2010-2016 ARM Limited or its affiliates. All rightsreserved.
11-279
Non-Confidential
Reverse Step Source LineReverse Step Instruction
This option depends on the stepping mode selected:• If source line mode is selected, steps backwards at the source level including stepping into
all function calls where there is debug information.• If instruction mode is selected, steps backwards at the instruction level including stepping
into all function calls.
Reverse Step Over Source LineReverse Step Over Instruction
This option depends on the stepping mode selected:• If source line mode is selected, steps backwards at the source level but stepping over all
function calls.• If instruction mode is selected, steps backwards at the instruction level but stepping over all
function calls.
Reverse Step OutContinues running backwards to the instruction before the start of the selected stack frame.
Debug Configurations...Displays the Debug Configurations dialog box, with the configuration for the selectedconnection displayed.
Launch in backgroundIf this option is disabled, the Progress Information dialog box is displayed when theapplication launches.
Show in StackOpens the Stack view, and displays the stack information for the selected execution context.
Reset DS-5 views to ‘Linked’Resets DS-5 views to link to the selected connection in the Debug Control view.
View CPU CachesDisplays the Cache Data view for a connected configuration.
View MenuThe following options are available:
Add Configuration (without connecting)...Displays the Add Launch Configuration dialog box. The dialog box lists anyconfigurations that are not already listed in the Debug Control view.
Select one or more configurations, then click OK. The selected configurations areadded to the Debug Control view, but remain disconnected.
Load...Displays a dialog box where you can select whether to load an image, debuginformation, an image and debug information, or additional debug information. Thisoption might be disabled for targets where this functionality is not supported.
Set Working Directory...Displays the Current Working Directory dialog box. Enter a new location for thecurrent working directory, then click OK.
Path Substitution...Displays the Path Substitution and Edit Substitute Path dialog box.
Use the Edit Substitute Path dialog box to associate the image path with a source filepath on the host. Click OK. The image and host paths are added to the PathSubstitution dialog box. Click OK when finished.
Threads PresentationDisplays either a flat or hierarchical presentation of the threads in the stack trace.
DTSL optionsOpens the DTSL Configuration Editor dialog to specify the DTSL options for thetarget connection.
11 DS-5 Debug Perspectives and Views11.7 Debug Control view
ARM DUI0446Z Copyright © 2010-2016 ARM Limited or its affiliates. All rightsreserved.
11-280
Non-Confidential

Related concepts6.8 About debugging multi-threaded applications on page 6-152.6.10.3 About debugging Linux kernel modules on page 6-158.6.10.2 About debugging a Linux kernel on page 6-156.6.9 About debugging shared libraries on page 6-153.
Related references11.8 Stack view on page 11-282.11.6 Commands view on page 11-275.16.2 DS-5 Debug perspective keyboard shortcuts on page 16-496.
11 DS-5 Debug Perspectives and Views11.7 Debug Control view
ARM DUI0446Z Copyright © 2010-2016 ARM Limited or its affiliates. All rightsreserved.
11-281
Non-Confidential
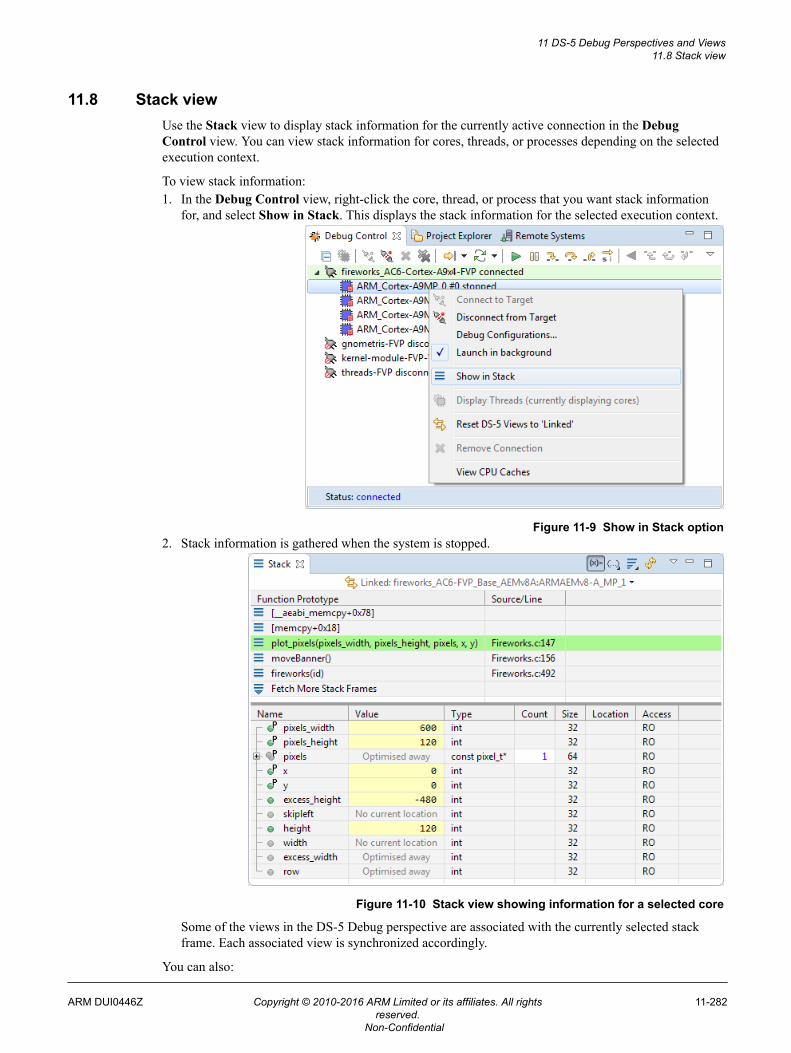
11.8 Stack viewUse the Stack view to display stack information for the currently active connection in the DebugControl view. You can view stack information for cores, threads, or processes depending on the selectedexecution context.
To view stack information:1. In the Debug Control view, right-click the core, thread, or process that you want stack information
for, and select Show in Stack. This displays the stack information for the selected execution context.
Figure 11-9 Show in Stack option2. Stack information is gathered when the system is stopped.
Figure 11-10 Stack view showing information for a selected core
Some of the views in the DS-5 Debug perspective are associated with the currently selected stackframe. Each associated view is synchronized accordingly.
You can also:
11 DS-5 Debug Perspectives and Views11.8 Stack view
ARM DUI0446Z Copyright © 2010-2016 ARM Limited or its affiliates. All rightsreserved.
11-282
Non-Confidential
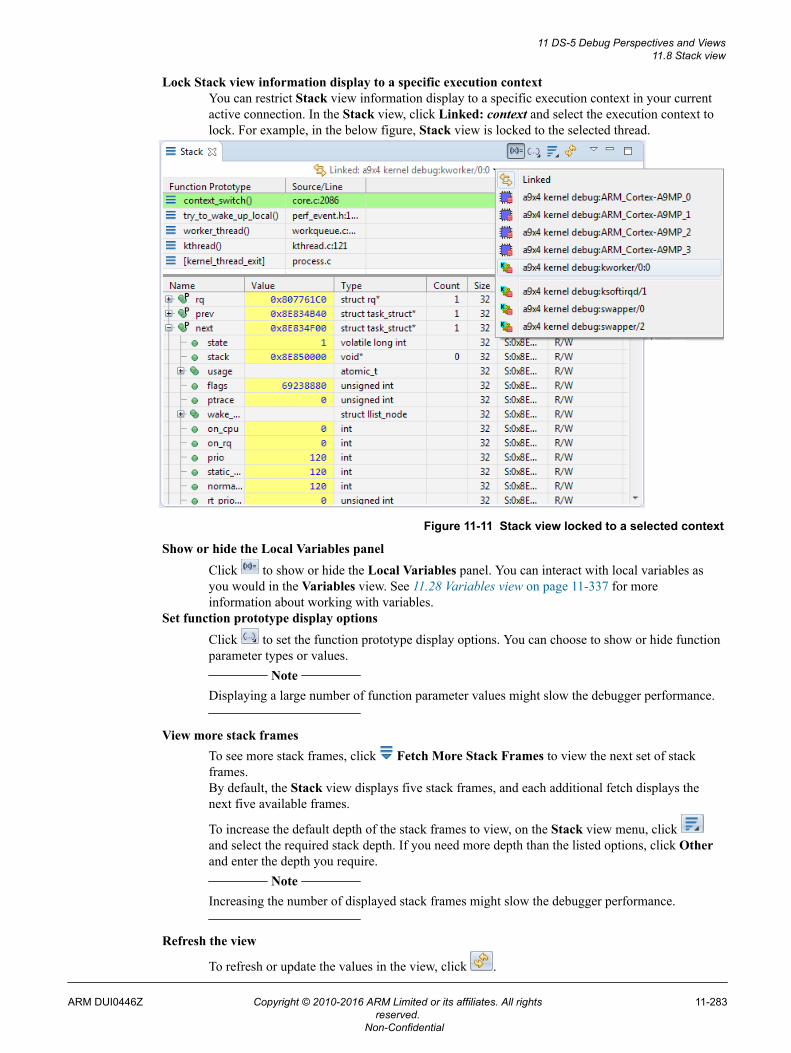
Lock Stack view information display to a specific execution contextYou can restrict Stack view information display to a specific execution context in your currentactive connection. In the Stack view, click Linked: context and select the execution context tolock. For example, in the below figure, Stack view is locked to the selected thread.
Figure 11-11 Stack view locked to a selected context
Show or hide the Local Variables panelClick to show or hide the Local Variables panel. You can interact with local variables asyou would in the Variables view. See 11.28 Variables view on page 11-337 for moreinformation about working with variables.
Set function prototype display optionsClick to set the function prototype display options. You can choose to show or hide functionparameter types or values.
Note
Displaying a large number of function parameter values might slow the debugger performance.
View more stack framesTo see more stack frames, click Fetch More Stack Frames to view the next set of stackframes.By default, the Stack view displays five stack frames, and each additional fetch displays thenext five available frames.
To increase the default depth of the stack frames to view, on the Stack view menu, click and select the required stack depth. If you need more depth than the listed options, click Otherand enter the depth you require.
Note
Increasing the number of displayed stack frames might slow the debugger performance.
Refresh the view
To refresh or update the values in the view, click .
11 DS-5 Debug Perspectives and Views11.8 Stack view
ARM DUI0446Z Copyright © 2010-2016 ARM Limited or its affiliates. All rightsreserved.
11-283
Non-Confidential
Show in DisassemblyRight-click a stack frame and select Show in Disassembly to open the Disassembly view andlocate the current instruction for that stack frame.
Show in MemoryRight-click a stack frame and select Show in Memory to open the Memory view and displaythe memory location used to store that stack frame.
Step Out to This FrameRight-click a stack frame and select Step Out to This Frame to run to the current instruction atthe selected stack frame.
Toolbar options
The following View Menu options are available:
New Stack ViewDisplays a new instance of the Stack view.
Freeze DataFreezes data to the currently selected execution context. This works as a toggle.
Update View When HiddenUpdates the view when it is hidden behind other views. By default, this view does not updatewhen hidden.
Related references11.7 Debug Control view on page 11-278.
11 DS-5 Debug Perspectives and Views11.8 Stack view
ARM DUI0446Z Copyright © 2010-2016 ARM Limited or its affiliates. All rightsreserved.
11-284
Non-Confidential
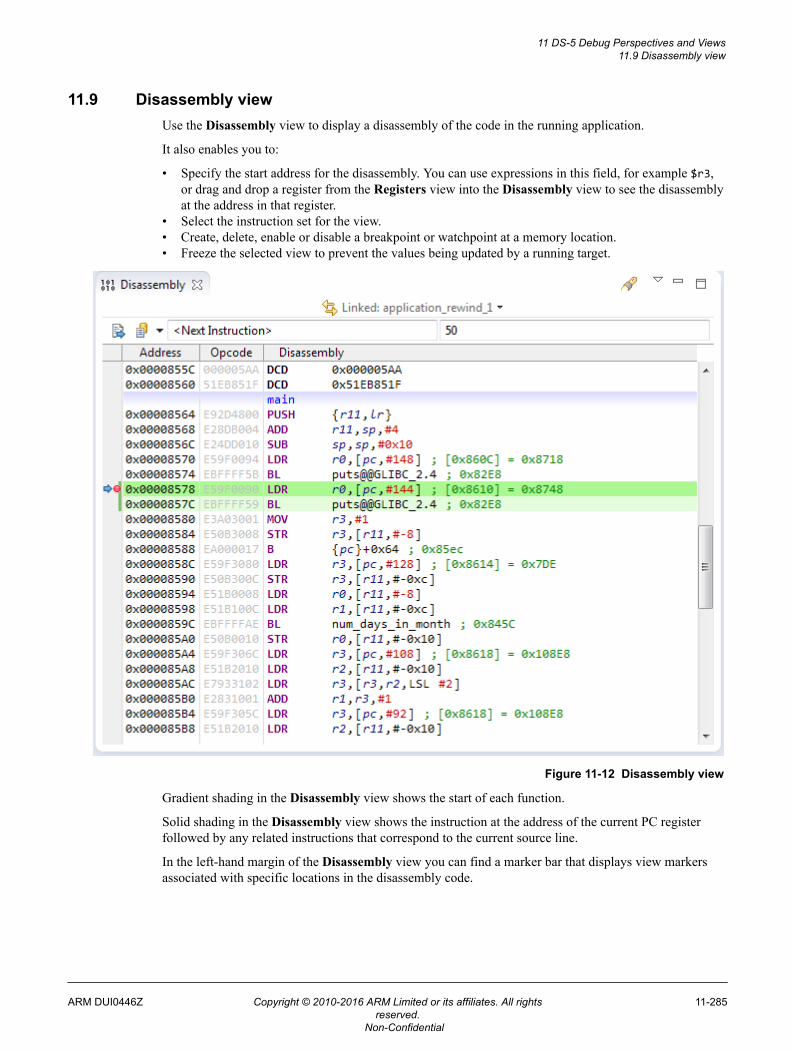
11.9 Disassembly viewUse the Disassembly view to display a disassembly of the code in the running application.
It also enables you to:
• Specify the start address for the disassembly. You can use expressions in this field, for example $r3,or drag and drop a register from the Registers view into the Disassembly view to see the disassemblyat the address in that register.
• Select the instruction set for the view.• Create, delete, enable or disable a breakpoint or watchpoint at a memory location.• Freeze the selected view to prevent the values being updated by a running target.
Figure 11-12 Disassembly view
Gradient shading in the Disassembly view shows the start of each function.
Solid shading in the Disassembly view shows the instruction at the address of the current PC registerfollowed by any related instructions that correspond to the current source line.
In the left-hand margin of the Disassembly view you can find a marker bar that displays view markersassociated with specific locations in the disassembly code.
11 DS-5 Debug Perspectives and Views11.9 Disassembly view
ARM DUI0446Z Copyright © 2010-2016 ARM Limited or its affiliates. All rightsreserved.
11-285
Non-Confidential
To set a breakpoint, double-click in the marker bar at the position where you want to set the breakpoint.To delete a breakpoint, double-click on the breakpoint marker.
Note
If you have sub-breakpoints to a parent breakpoint then double-clicking on the marker also deletes therelated sub-breakpoints.
Toolbar and context menu options
The following options are available from the toolbar or context menu:
Linked: contextLinks this view to the selected connection in the Debug Control view. This is the default.Alternatively you can link the view to a different connection. If the connection you want is notshown in the drop-down list you might have to select it first in the Debug Control view.
Next InstructionShows the disassembly for the instruction at the address of the program counter.
HistoryAddresses and expressions you specify in the Address field are added to the drop down box, andpersist until you clear the history list or exit Eclipse. If you want to keep an expression for lateruse, add it to the Expressions view.
Address fieldEnter the address for which you want to view the disassembly. You can specify the address as ahex number or as an expression, for example $PC+256, $lr, or main.
Context menu options are available for editing this field.
Size fieldThe number of instructions to display before and after the location specified in the Addressfield.
Context menu options are available for editing this field.
SearchSearches through debug information for symbols.
View MenuThe following View Menu options are available:
New Disassembly ViewDisplays a new instance of the Disassembly view.
Instruction SetThe instruction set to show in the view by default. Select one of the following:
[Auto]Auto detect the instruction set from the image.
A32 (ARM)ARM instruction set.
T32 (Thumb)Thumb instruction set.
T32EE (ThumbEE)ThumbEE instruction set.
Byte OrderSelects the byte order of the memory. The default is Auto (LE).
Clear HistoryClears the list of addresses and expressions in the History drop-down box.
Update View When HiddenEnables the updating of the view when it is hidden behind other views. By default thisview does not update when hidden.
11 DS-5 Debug Perspectives and Views11.9 Disassembly view
ARM DUI0446Z Copyright © 2010-2016 ARM Limited or its affiliates. All rightsreserved.
11-286
Non-Confidential
RefreshRefreshes the view.
Freeze DataToggles the freezing of data in the current view. This also disables and enables the Sizeand Type fields and the Refresh option.
Action context menuWhen you right-click in the left margin, the corresponding address and instruction is selectedand this context menu is displayed. The available options are:
CopyCopies the selected address.
PastePastes into the Address field the last address that you copied.
Select AllSelects all disassembly in the range specified by the Size field.
If you want to copy the selected lines of disassembly, you cannot use the Copy optionon this menu. Instead, use the copy keyboard shortcut for your host, Ctrl+C onWindows.
Run to SelectionRuns to the selected address
Set PC to SelectionSets the PC register to the selected address.
Show in SourceIf source code is available:1. Opens the corresponding source file in the C/C++ source editor view, if necessary.2. Highlights the line of source associated with the selected address.
Show in RegistersIf the memory address corresponds to a register, then displays the Registers view withthe related register selected.
Show in FunctionsIf the memory address corresponds to a function, then displays the Functions viewwith the related function selected.
Translate Address <address>Displays the MMU view and translates the selected address.
Toggle WatchpointSets or removes a watchpoint at the selected address.
Toggle BreakpointSets or removes a breakpoint at the selected address.
Toggle Hardware BreakpointSets or removes a hardware breakpoint at the selected address.
Toggle Trace Start PointSets or removes a trace start point at the selected address.
Toggle Trace Stop PointSets or removes a trace stop point at the selected address.
Toggle Trace Trigger PointStarts a trace trigger point at the selected address.
Editing context menu optionsThe following options are available on the context menu when you select the Address field orSize field for editing:
CutCopies and deletes the selected text.
CopyCopies the selected text.
11 DS-5 Debug Perspectives and Views11.9 Disassembly view
ARM DUI0446Z Copyright © 2010-2016 ARM Limited or its affiliates. All rightsreserved.
11-287
Non-Confidential
PastePastes text that you previously cut or copied.
DeleteDeletes the selected text.
Select AllSelects all the text.
Related concepts6.8 About debugging multi-threaded applications on page 6-152.6.9 About debugging shared libraries on page 6-153.6.10.2 About debugging a Linux kernel on page 6-156.6.10.3 About debugging Linux kernel modules on page 6-158.6.11 About debugging TrustZone enabled targets on page 6-160.
Related references3.13 Setting a tracepoint on page 3-89.3.8 Conditional breakpoints on page 3-81.3.9 Assigning conditions to an existing breakpoint on page 3-82.3.12 Pending breakpoints and watchpoints on page 3-87.Chapter 11 DS-5 Debug Perspectives and Views on page 11-261.
11 DS-5 Debug Perspectives and Views11.9 Disassembly view
ARM DUI0446Z Copyright © 2010-2016 ARM Limited or its affiliates. All rightsreserved.
11-288
Non-Confidential
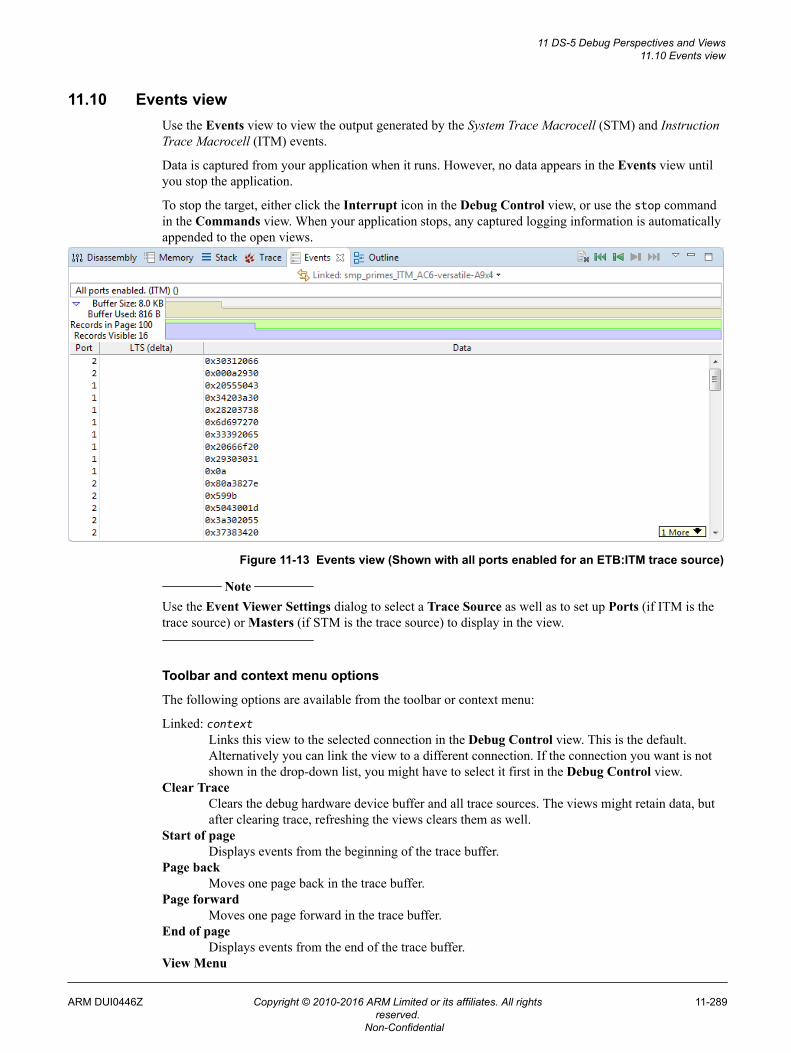
11.10 Events viewUse the Events view to view the output generated by the System Trace Macrocell (STM) and InstructionTrace Macrocell (ITM) events.
Data is captured from your application when it runs. However, no data appears in the Events view untilyou stop the application.
To stop the target, either click the Interrupt icon in the Debug Control view, or use the stop commandin the Commands view. When your application stops, any captured logging information is automaticallyappended to the open views.
Figure 11-13 Events view (Shown with all ports enabled for an ETB:ITM trace source)
Note
Use the Event Viewer Settings dialog to select a Trace Source as well as to set up Ports (if ITM is thetrace source) or Masters (if STM is the trace source) to display in the view.
Toolbar and context menu options
The following options are available from the toolbar or context menu:
Linked: contextLinks this view to the selected connection in the Debug Control view. This is the default.Alternatively you can link the view to a different connection. If the connection you want is notshown in the drop-down list, you might have to select it first in the Debug Control view.
Clear TraceClears the debug hardware device buffer and all trace sources. The views might retain data, butafter clearing trace, refreshing the views clears them as well.
Start of pageDisplays events from the beginning of the trace buffer.
Page backMoves one page back in the trace buffer.
Page forwardMoves one page forward in the trace buffer.
End of pageDisplays events from the end of the trace buffer.
View Menu
11 DS-5 Debug Perspectives and Views11.10 Events view
ARM DUI0446Z Copyright © 2010-2016 ARM Limited or its affiliates. All rightsreserved.
11-289
Non-Confidential
The following View Menu options are available:
New Events ViewDisplays a new instance of the Events view.
Find Global Timestamp...Displays the Search by Timestamp dialog which allows you to search through theentire trace buffer. The search results opens up the page where the timestamp is foundand selects the closest timestamp.
Update View When HiddenEnables the updating of the view when it is hidden behind other views. By default thisview does not update when hidden.
RefreshRefreshes the view.
Freeze DataToggles the freezing of data in the current view.
Events Settings...Displays the Settings dialog where you can select a trace source and set options for theselected trace source.
Open Trace Control ViewOpens the Trace Control view.
DTSL Options...Opens the DTSL Configuration Editor on page 11-372 dialog box.
Events context menuAdvance / Go back local timestamp amount
Displays the Advance / Go back local timestamp dialog box which allows you to moveforward or backward from the current record by a local timestamp amount. A negative numberindicates a movement backward. The search moves forward or backward from the currentrecord until the sum of intervening local timestamps is equal to or exceeds the specified value.
Global TimestampsTimestamps represent the approximate time when events are generated.
Synchronize TimestampsSynchronizes all Trace and Events views to display data around the same timestamp.
Set Timestamp OriginSets the selected event record as the timestamp origin.
Note
For a given connection, the timestamp origin is global for all Trace and Events views.
Clear Timestamp OriginClears the timestamp origin.
Timestamp Format: NumericSets the timestamp in numeric format. This is the raw timestamp value received from theITM/STM protocol.
Timestamp Format: (h:m:s)Sets the timestamp in hours:minutes:seconds format.
Related referencesChapter 11 DS-5 Debug Perspectives and Views on page 11-261.11.11 Event Viewer Settings dialog box on page 11-291.
Related informationCoreSight™ Components Technical Reference Manual.CoreSight™ System Trace Macrocell Technical Reference Manual.ARMv7-M Architecture Reference Manual Documentation.
11 DS-5 Debug Perspectives and Views11.10 Events view
ARM DUI0446Z Copyright © 2010-2016 ARM Limited or its affiliates. All rightsreserved.
11-290
Non-Confidential
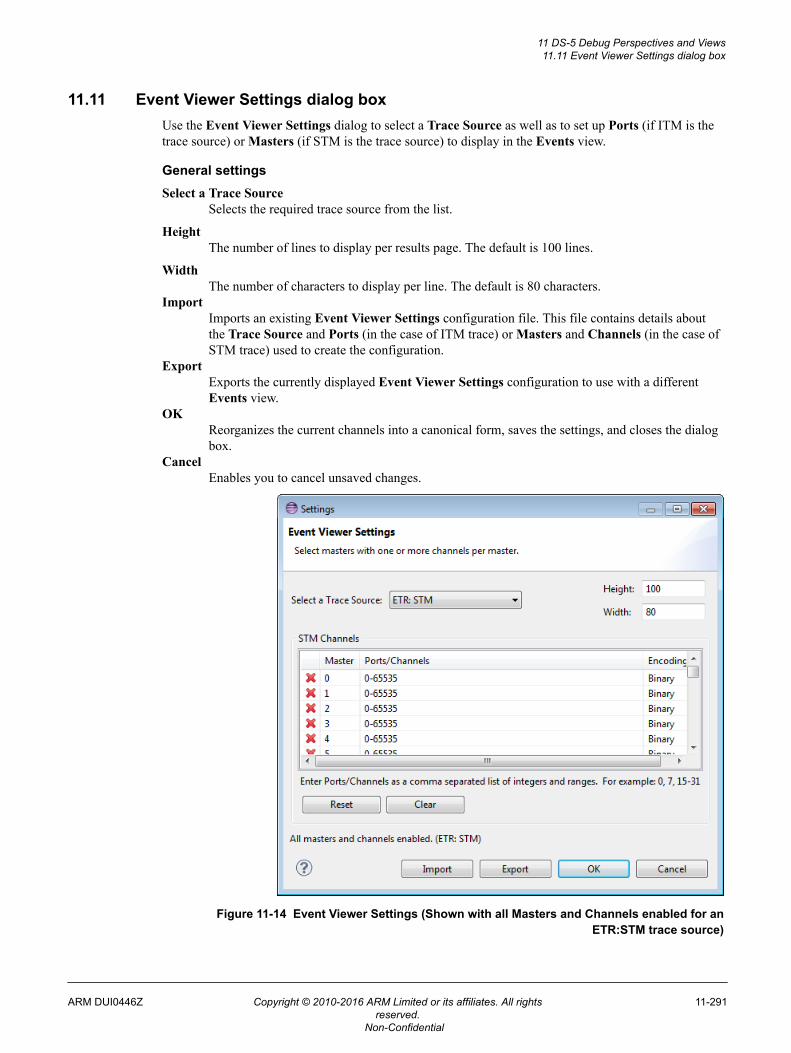
11.11 Event Viewer Settings dialog boxUse the Event Viewer Settings dialog to select a Trace Source as well as to set up Ports (if ITM is thetrace source) or Masters (if STM is the trace source) to display in the Events view.
General settingsSelect a Trace Source
Selects the required trace source from the list.
HeightThe number of lines to display per results page. The default is 100 lines.
WidthThe number of characters to display per line. The default is 80 characters.
ImportImports an existing Event Viewer Settings configuration file. This file contains details aboutthe Trace Source and Ports (in the case of ITM trace) or Masters and Channels (in the case ofSTM trace) used to create the configuration.
ExportExports the currently displayed Event Viewer Settings configuration to use with a differentEvents view.
OKReorganizes the current channels into a canonical form, saves the settings, and closes the dialogbox.
CancelEnables you to cancel unsaved changes.
Figure 11-14 Event Viewer Settings (Shown with all Masters and Channels enabled for anETR:STM trace source)
11 DS-5 Debug Perspectives and Views11.11 Event Viewer Settings dialog box
ARM DUI0446Z Copyright © 2010-2016 ARM Limited or its affiliates. All rightsreserved.
11-291
Non-Confidential

For ITM trace sourcesPorts
Click to add or delete a Port.Encoding
Select the type of encoding you want for the data associated with the port. The options availableare Binary, Text, and TAE.
ResetClick Reset to display and enable all available Ports for the selected ITM trace source.
Note
This clears any custom settings.
ClearClick to clear all Ports.
Show local timestampsSelect to display local timestamps. Local timestamps are expressed as an interval since the lastlocal timestamp. Local timestamps are available for CoreSight ITM trace and M-profile ITMtrace.
Show global timestamps (M-profile only)Select to display global timestamps. Global timestamps are expressed as a 48-bit or 64-bitcounter value.
Show event counter wrapping (M-profile only)Select to display event counter wrapping packets from the M-profile Data Watchpoint and Trace(DWT) unit.
Show exception tracing (M-profile only)Select to display exception trace packets from the M-profile DWT unit.
Show PC sampling (M-profile only)Select to display PC sampling packets from the M-profile DWT unit.
Show data tracing (M-profile only)Select to display data trace packets from the M-profile DWT unit.
For STM trace sourcesMasters
Click to add or delete Masters and Channels that you want to display in the Events view. Note
Masters are only available for STM trace.
EncodingSelect the type of encoding you want for the data associated with the channels. The optionsavailable are Binary and Text.
ResetClick Reset to display and enable all available Masters and Channels for the selected STMtrace source.
Note
This clears any custom settings.
ClearClick to clear all Masters and Channels.
Related references11.10 Events view on page 11-289.
11 DS-5 Debug Perspectives and Views11.11 Event Viewer Settings dialog box
ARM DUI0446Z Copyright © 2010-2016 ARM Limited or its affiliates. All rightsreserved.
11-292
Non-Confidential

Related informationCoreSight™ Components Technical Reference Manual.CoreSight™ System Trace Macrocell Technical Reference Manual.ARMv7-M Architecture Reference Manual Documentation.
11 DS-5 Debug Perspectives and Views11.11 Event Viewer Settings dialog box
ARM DUI0446Z Copyright © 2010-2016 ARM Limited or its affiliates. All rightsreserved.
11-293
Non-Confidential
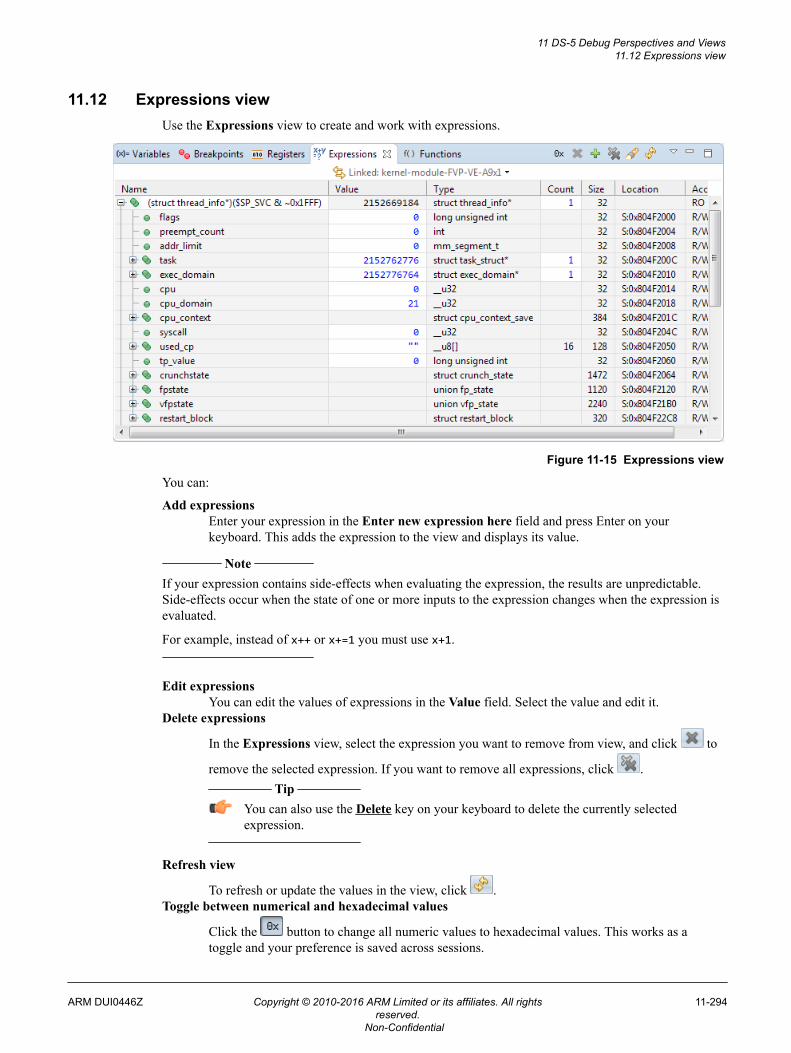
11.12 Expressions viewUse the Expressions view to create and work with expressions.
Figure 11-15 Expressions view
You can:
Add expressionsEnter your expression in the Enter new expression here field and press Enter on yourkeyboard. This adds the expression to the view and displays its value.
Note
If your expression contains side-effects when evaluating the expression, the results are unpredictable.Side-effects occur when the state of one or more inputs to the expression changes when the expression isevaluated.
For example, instead of x++ or x+=1 you must use x+1.
Edit expressionsYou can edit the values of expressions in the Value field. Select the value and edit it.
Delete expressions
In the Expressions view, select the expression you want to remove from view, and click to
remove the selected expression. If you want to remove all expressions, click . Tip
You can also use the Delete key on your keyboard to delete the currently selectedexpression.
Refresh view
To refresh or update the values in the view, click .Toggle between numerical and hexadecimal values
Click the button to change all numeric values to hexadecimal values. This works as atoggle and your preference is saved across sessions.
11 DS-5 Debug Perspectives and Views11.12 Expressions view
ARM DUI0446Z Copyright © 2010-2016 ARM Limited or its affiliates. All rightsreserved.
11-294
Non-Confidential
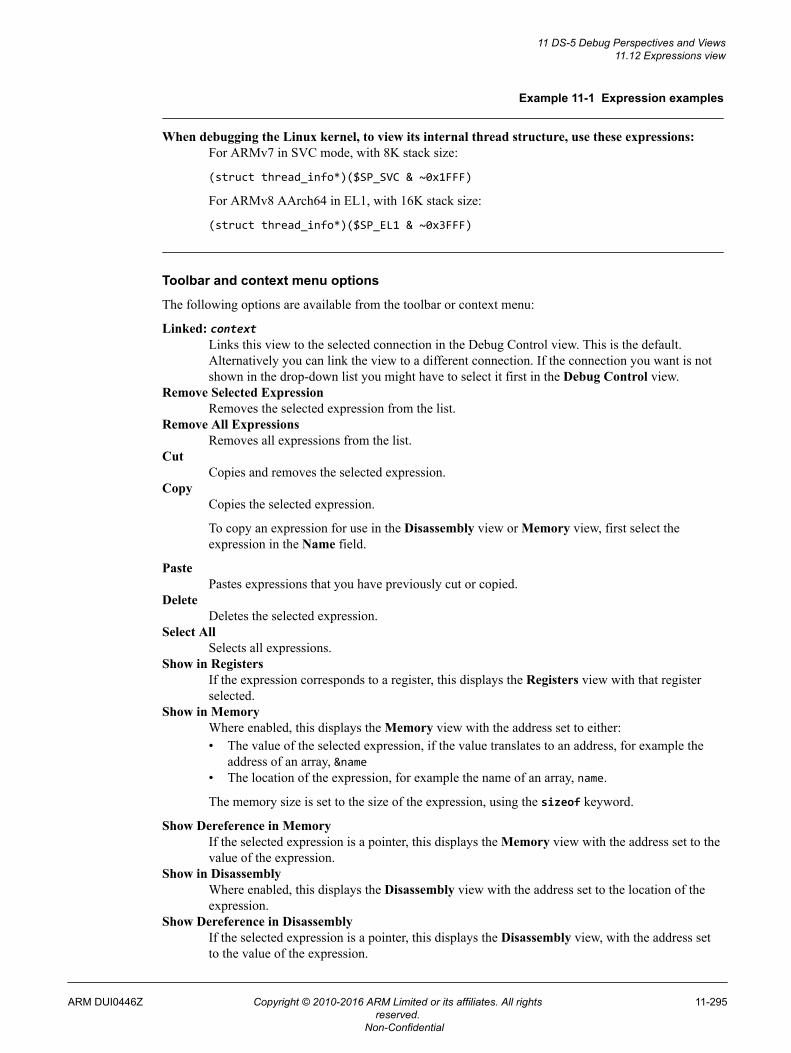
Example 11-1 Expression examples
When debugging the Linux kernel, to view its internal thread structure, use these expressions:For ARMv7 in SVC mode, with 8K stack size:
(struct thread_info*)($SP_SVC & ~0x1FFF)
For ARMv8 AArch64 in EL1, with 16K stack size:
(struct thread_info*)($SP_EL1 & ~0x3FFF)
Toolbar and context menu options
The following options are available from the toolbar or context menu:
Linked: contextLinks this view to the selected connection in the Debug Control view. This is the default.Alternatively you can link the view to a different connection. If the connection you want is notshown in the drop-down list you might have to select it first in the Debug Control view.
Remove Selected ExpressionRemoves the selected expression from the list.
Remove All ExpressionsRemoves all expressions from the list.
CutCopies and removes the selected expression.
CopyCopies the selected expression.
To copy an expression for use in the Disassembly view or Memory view, first select theexpression in the Name field.
PastePastes expressions that you have previously cut or copied.
DeleteDeletes the selected expression.
Select AllSelects all expressions.
Show in RegistersIf the expression corresponds to a register, this displays the Registers view with that registerselected.
Show in MemoryWhere enabled, this displays the Memory view with the address set to either:• The value of the selected expression, if the value translates to an address, for example the
address of an array, &name• The location of the expression, for example the name of an array, name.
The memory size is set to the size of the expression, using the sizeof keyword.
Show Dereference in MemoryIf the selected expression is a pointer, this displays the Memory view with the address set to thevalue of the expression.
Show in DisassemblyWhere enabled, this displays the Disassembly view with the address set to the location of theexpression.
Show Dereference in DisassemblyIf the selected expression is a pointer, this displays the Disassembly view, with the address setto the value of the expression.
11 DS-5 Debug Perspectives and Views11.12 Expressions view
ARM DUI0446Z Copyright © 2010-2016 ARM Limited or its affiliates. All rightsreserved.
11-295
Non-Confidential
Translate Variable AddressDisplays the MMU view and translates the address of the variable.
Toggle WatchpointDisplays the Add Watchpoint dialog to set a watchpoint on the selected variable, or removesthe watchpoint if one has been set.
Enable WatchpointEnables the watchpoint, if a watchpoint has been set on the selected variable.
Disable WatchpointDisables the watchpoint, if a watchpoint has been set on the selected variable.
Resolve WatchpointIf a watchpoint has been set on the selected variable, this re-evaluates the address of thewatchpoint. If the address can be resolved the watchpoint is set, otherwise it remains pending.
Watchpoint PropertiesDisplays the Watchpoint Properties dialog box. This enables you to control watchpointactivation.
Send toEnables you to add register filters to an Expressions view. Displays a sub menu that enables youto add to a specific Expressions view.
<Format list>A list of formats you can use for the expression value.
View MenuThe following View Menu options are available:
New Expressions ViewDisplays a new instance of the Expressions view.
Update View When HiddenEnables the updating of the view when it is hidden behind other views. By default, thisview does not update when hidden.
Freeze DataToggles the freezing of data in the current view. This also disables and enables theRefresh option.
Adding a new column header
Right-click on the column headers to select the columns that you want displayed:
NameAn expression that resolves to an address, such as main+1024, or a register, for example $R1.
ValueThe value of the expression. You can modify a value that has a white background. A yellowbackground indicates that the value has changed. This might result from you either performing adebug action such as stepping or by you editing the value directly.
If you freeze the view, then you cannot change a value.
TypeThe type associated with the value at the address identified by the expression.
CountThe number of array or pointer elements. You can edit a pointer element count.
SizeThe size of the expression in bits.
LocationThe address in hexadecimal identified by the expression, or the name of a register, if theexpression contains only a single register name.
AccessThe access type of the expression.
All columns are displayed by default.
11 DS-5 Debug Perspectives and Views11.12 Expressions view
ARM DUI0446Z Copyright © 2010-2016 ARM Limited or its affiliates. All rightsreserved.
11-296
Non-Confidential

Related references3.13 Setting a tracepoint on page 3-89.3.8 Conditional breakpoints on page 3-81.3.9 Assigning conditions to an existing breakpoint on page 3-82.3.12 Pending breakpoints and watchpoints on page 3-87.Chapter 11 DS-5 Debug Perspectives and Views on page 11-261.
11 DS-5 Debug Perspectives and Views11.12 Expressions view
ARM DUI0446Z Copyright © 2010-2016 ARM Limited or its affiliates. All rightsreserved.
11-297
Non-Confidential
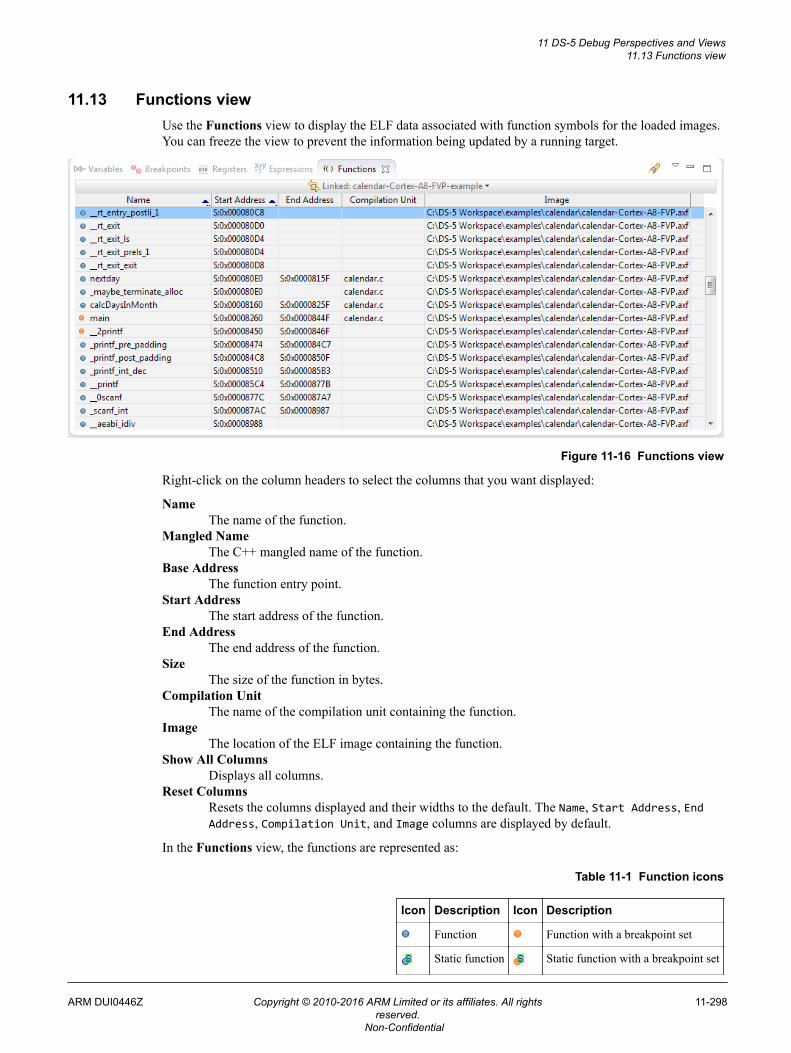
11.13 Functions viewUse the Functions view to display the ELF data associated with function symbols for the loaded images.You can freeze the view to prevent the information being updated by a running target.
Figure 11-16 Functions view
Right-click on the column headers to select the columns that you want displayed:
NameThe name of the function.
Mangled NameThe C++ mangled name of the function.
Base AddressThe function entry point.
Start AddressThe start address of the function.
End AddressThe end address of the function.
SizeThe size of the function in bytes.
Compilation UnitThe name of the compilation unit containing the function.
ImageThe location of the ELF image containing the function.
Show All ColumnsDisplays all columns.
Reset ColumnsResets the columns displayed and their widths to the default. The Name, Start Address, EndAddress, Compilation Unit, and Image columns are displayed by default.
In the Functions view, the functions are represented as:
Table 11-1 Function icons
Icon Description Icon Description
Function Function with a breakpoint set
Static function Static function with a breakpoint set
11 DS-5 Debug Perspectives and Views11.13 Functions view
ARM DUI0446Z Copyright © 2010-2016 ARM Limited or its affiliates. All rightsreserved.
11-298
Non-Confidential
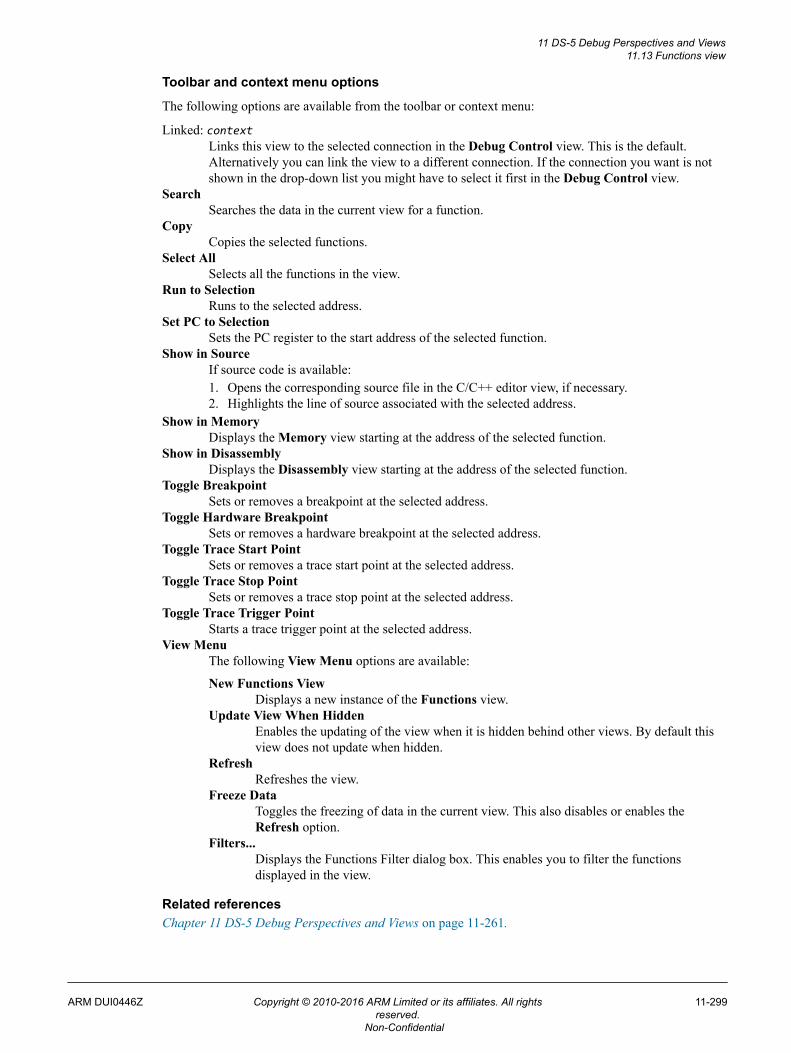
Toolbar and context menu options
The following options are available from the toolbar or context menu:
Linked: contextLinks this view to the selected connection in the Debug Control view. This is the default.Alternatively you can link the view to a different connection. If the connection you want is notshown in the drop-down list you might have to select it first in the Debug Control view.
SearchSearches the data in the current view for a function.
CopyCopies the selected functions.
Select AllSelects all the functions in the view.
Run to SelectionRuns to the selected address.
Set PC to SelectionSets the PC register to the start address of the selected function.
Show in SourceIf source code is available:1. Opens the corresponding source file in the C/C++ editor view, if necessary.2. Highlights the line of source associated with the selected address.
Show in MemoryDisplays the Memory view starting at the address of the selected function.
Show in DisassemblyDisplays the Disassembly view starting at the address of the selected function.
Toggle BreakpointSets or removes a breakpoint at the selected address.
Toggle Hardware BreakpointSets or removes a hardware breakpoint at the selected address.
Toggle Trace Start PointSets or removes a trace start point at the selected address.
Toggle Trace Stop PointSets or removes a trace stop point at the selected address.
Toggle Trace Trigger PointStarts a trace trigger point at the selected address.
View MenuThe following View Menu options are available:
New Functions ViewDisplays a new instance of the Functions view.
Update View When HiddenEnables the updating of the view when it is hidden behind other views. By default thisview does not update when hidden.
RefreshRefreshes the view.
Freeze DataToggles the freezing of data in the current view. This also disables or enables theRefresh option.
Filters...Displays the Functions Filter dialog box. This enables you to filter the functionsdisplayed in the view.
Related referencesChapter 11 DS-5 Debug Perspectives and Views on page 11-261.
11 DS-5 Debug Perspectives and Views11.13 Functions view
ARM DUI0446Z Copyright © 2010-2016 ARM Limited or its affiliates. All rightsreserved.
11-299
Non-Confidential
11.14 History viewUse the History view to display a list of the commands generated during the current debug session.
It also enables you to:• Clear its contents.• Select commands and save them as a script file. You can add the script file to your favorites list when
you click Save. Favorites are displayed in the Scripts view.• Enable or disable the automatic scrolling of messages.
Figure 11-17 History view
Note
Default settings for this view are controlled by a DS-5 Debugger setting in the Preferences dialog box.For example, the default location for script files. You can access these settings by selecting Preferencesfrom the Window menu.
Toolbar and context menu options
The following options are available from the toolbar or context menu:
Linked: contextLinks this view to the selected connection in the Debug Control view. This is the default.Alternatively you can link the view to a different connection. If the connection you want is notshown in the drop-down list you might have to select it first in the Debug Control view.
11 DS-5 Debug Perspectives and Views11.14 History view
ARM DUI0446Z Copyright © 2010-2016 ARM Limited or its affiliates. All rightsreserved.
11-300
Non-Confidential
Exports the selected lines as a scriptDisplays the Save As dialog box to save the selected commands to a script file.
When you click Save on the Save As dialog box, you are given the option to add the script fileto your favorites list. Click OK to add the script to your favorites list. Favorites are displayed inthe Scripts view.
Clear ConsoleClears the contents of the History view.
Toggles Scroll LockEnables or disables the automatic scrolling of messages in the History view.
CopyCopies the selected commands.
Select AllSelects all commands.
Save selected lines as a script...Displays the Save As dialog box to save the selected commands to a script file.
When you click Save on the Save As dialog box, you are given the option to add the script fileto your favorites list. Click OK to add the script to your favorites list. Favorites are displayed inthe Scripts view.
Execute selected linesRuns the selected commands.
New History ViewDisplays a new instance of the History view.
Related referencesChapter 11 DS-5 Debug Perspectives and Views on page 11-261.
11 DS-5 Debug Perspectives and Views11.14 History view
ARM DUI0446Z Copyright © 2010-2016 ARM Limited or its affiliates. All rightsreserved.
11-301
Non-Confidential
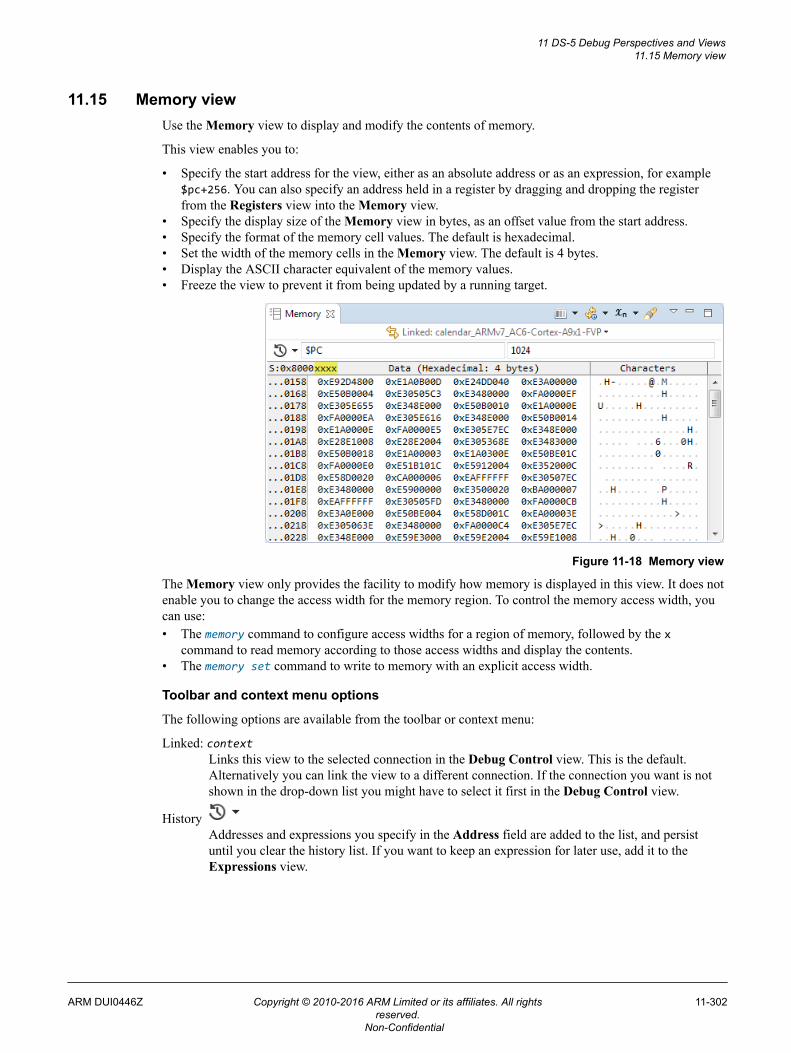
11.15 Memory viewUse the Memory view to display and modify the contents of memory.
This view enables you to:
• Specify the start address for the view, either as an absolute address or as an expression, for example$pc+256. You can also specify an address held in a register by dragging and dropping the registerfrom the Registers view into the Memory view.
• Specify the display size of the Memory view in bytes, as an offset value from the start address.• Specify the format of the memory cell values. The default is hexadecimal.• Set the width of the memory cells in the Memory view. The default is 4 bytes.• Display the ASCII character equivalent of the memory values.• Freeze the view to prevent it from being updated by a running target.
Figure 11-18 Memory view
The Memory view only provides the facility to modify how memory is displayed in this view. It does notenable you to change the access width for the memory region. To control the memory access width, youcan use:• The memory command to configure access widths for a region of memory, followed by the x
command to read memory according to those access widths and display the contents.• The memory set command to write to memory with an explicit access width.
Toolbar and context menu options
The following options are available from the toolbar or context menu:
Linked: contextLinks this view to the selected connection in the Debug Control view. This is the default.Alternatively you can link the view to a different connection. If the connection you want is notshown in the drop-down list you might have to select it first in the Debug Control view.
History Addresses and expressions you specify in the Address field are added to the list, and persistuntil you clear the history list. If you want to keep an expression for later use, add it to theExpressions view.
11 DS-5 Debug Perspectives and Views11.15 Memory view
ARM DUI0446Z Copyright © 2010-2016 ARM Limited or its affiliates. All rightsreserved.
11-302
Non-Confidential
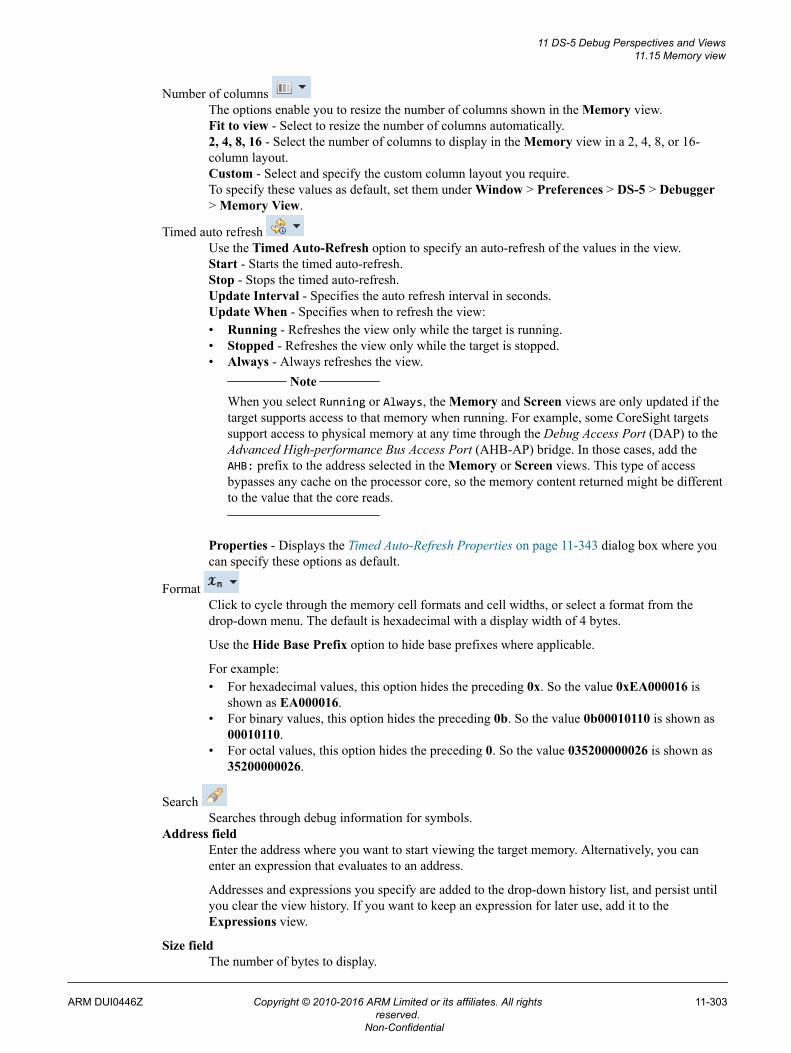
Number of columns The options enable you to resize the number of columns shown in the Memory view.Fit to view - Select to resize the number of columns automatically.2, 4, 8, 16 - Select the number of columns to display in the Memory view in a 2, 4, 8, or 16-column layout.Custom - Select and specify the custom column layout you require.To specify these values as default, set them under Window > Preferences > DS-5 > Debugger> Memory View.
Timed auto refresh Use the Timed Auto-Refresh option to specify an auto-refresh of the values in the view.Start - Starts the timed auto-refresh.Stop - Stops the timed auto-refresh.Update Interval - Specifies the auto refresh interval in seconds.Update When - Specifies when to refresh the view:• Running - Refreshes the view only while the target is running.• Stopped - Refreshes the view only while the target is stopped.• Always - Always refreshes the view.
Note
When you select Running or Always, the Memory and Screen views are only updated if thetarget supports access to that memory when running. For example, some CoreSight targetssupport access to physical memory at any time through the Debug Access Port (DAP) to theAdvanced High-performance Bus Access Port (AHB-AP) bridge. In those cases, add theAHB: prefix to the address selected in the Memory or Screen views. This type of accessbypasses any cache on the processor core, so the memory content returned might be differentto the value that the core reads.
Properties - Displays the Timed Auto-Refresh Properties on page 11-343 dialog box where youcan specify these options as default.
Format Click to cycle through the memory cell formats and cell widths, or select a format from thedrop-down menu. The default is hexadecimal with a display width of 4 bytes.
Use the Hide Base Prefix option to hide base prefixes where applicable.
For example:• For hexadecimal values, this option hides the preceding 0x. So the value 0xEA000016 is
shown as EA000016.• For binary values, this option hides the preceding 0b. So the value 0b00010110 is shown as
00010110.• For octal values, this option hides the preceding 0. So the value 035200000026 is shown as
35200000026.
Search Searches through debug information for symbols.
Address fieldEnter the address where you want to start viewing the target memory. Alternatively, you canenter an expression that evaluates to an address.
Addresses and expressions you specify are added to the drop-down history list, and persist untilyou clear the view history. If you want to keep an expression for later use, add it to theExpressions view.
Size fieldThe number of bytes to display.
11 DS-5 Debug Perspectives and Views11.15 Memory view
ARM DUI0446Z Copyright © 2010-2016 ARM Limited or its affiliates. All rightsreserved.
11-303
Non-Confidential
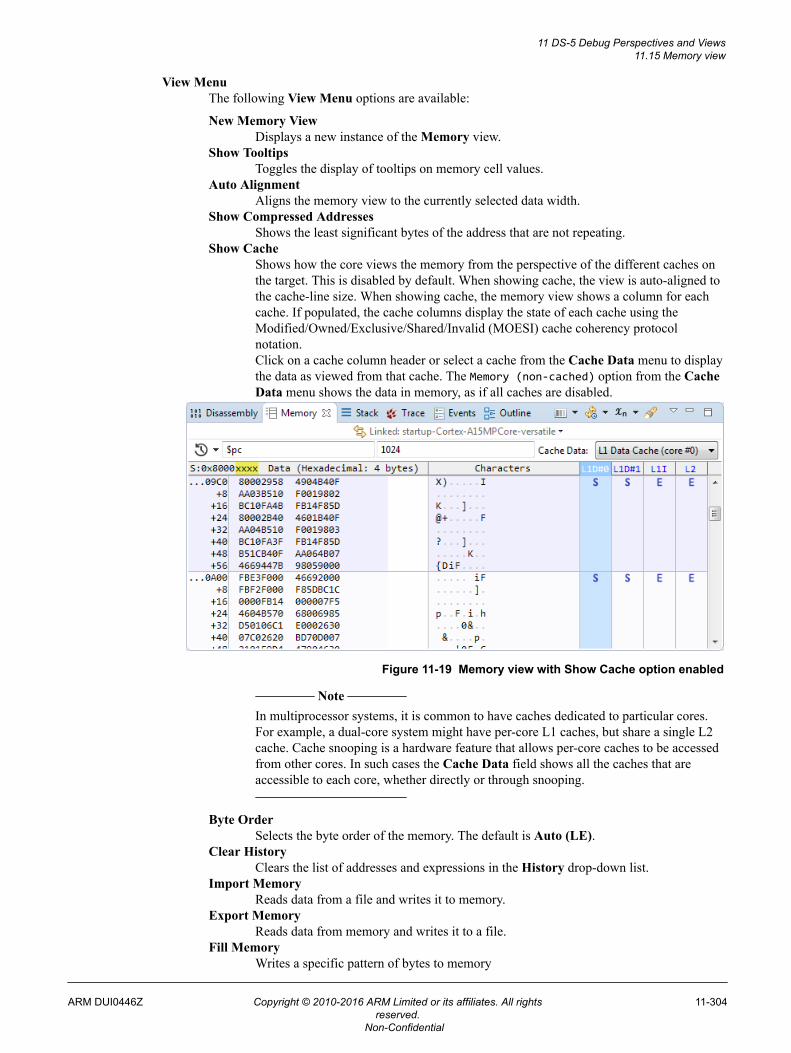
View MenuThe following View Menu options are available:
New Memory ViewDisplays a new instance of the Memory view.
Show TooltipsToggles the display of tooltips on memory cell values.
Auto AlignmentAligns the memory view to the currently selected data width.
Show Compressed AddressesShows the least significant bytes of the address that are not repeating.
Show CacheShows how the core views the memory from the perspective of the different caches onthe target. This is disabled by default. When showing cache, the view is auto-aligned tothe cache-line size. When showing cache, the memory view shows a column for eachcache. If populated, the cache columns display the state of each cache using theModified/Owned/Exclusive/Shared/Invalid (MOESI) cache coherency protocolnotation.Click on a cache column header or select a cache from the Cache Data menu to displaythe data as viewed from that cache. The Memory (non-cached) option from the CacheData menu shows the data in memory, as if all caches are disabled.
Figure 11-19 Memory view with Show Cache option enabled
Note
In multiprocessor systems, it is common to have caches dedicated to particular cores.For example, a dual-core system might have per-core L1 caches, but share a single L2cache. Cache snooping is a hardware feature that allows per-core caches to be accessedfrom other cores. In such cases the Cache Data field shows all the caches that areaccessible to each core, whether directly or through snooping.
Byte OrderSelects the byte order of the memory. The default is Auto (LE).
Clear HistoryClears the list of addresses and expressions in the History drop-down list.
Import MemoryReads data from a file and writes it to memory.
Export MemoryReads data from memory and writes it to a file.
Fill MemoryWrites a specific pattern of bytes to memory
11 DS-5 Debug Perspectives and Views11.15 Memory view
ARM DUI0446Z Copyright © 2010-2016 ARM Limited or its affiliates. All rightsreserved.
11-304
Non-Confidential
Update View When HiddenEnables the updating of the view when it is hidden behind other views. By default, thisview does not update when hidden.
RefreshRefreshes the view.
Freeze DataToggles the freezing of data in the current view. This also disables or enables theAddress and Size fields and the Refresh option.
Editing context menu optionsThe context menu of the column header enables you to toggle the display of the individualcolumns.
Reset ColumnsDisplays the default columns.
CharactersDisplays the Characters column.
The following options are available on the context menu when you select a memory cell value,the Address field, or the Size field for editing:
CutCopies and deletes the selected value.
CopyCopies the selected value.
PastePastes a value that you have previously cut or copied into the selected memory cell orfield.
DeleteDeletes the selected value.
Select AllSelects all the addresses.
The following additional options are available on the context menu when you select a memorycell value:
Toggle WatchpointSets or removes a watchpoint at the selected address. After a watchpoint is set, you can:• Enable Watchpoint - If disabled, enables the watchpoint at the selected address.• Disable Watchpoint - Disables the watchpoint at the selected address.• Remove Watchpoint - Removes the watchpoint at the selected address.• Watchpoint Properties - Displays and lets you change the watchpoint properties.
Translate Address <address>Displays the MMU view and translates the address of the selected value in memory.
Memory view default preferences
You can specify default preferences to apply to the Memory view. Specifying default options ensure thatyour preferences are applied across all debug connections.
To specify default options for the Memory view, set them under Window > Preferences > DS-5 >Debugger > Memory View.
11 DS-5 Debug Perspectives and Views11.15 Memory view
ARM DUI0446Z Copyright © 2010-2016 ARM Limited or its affiliates. All rightsreserved.
11-305
Non-Confidential
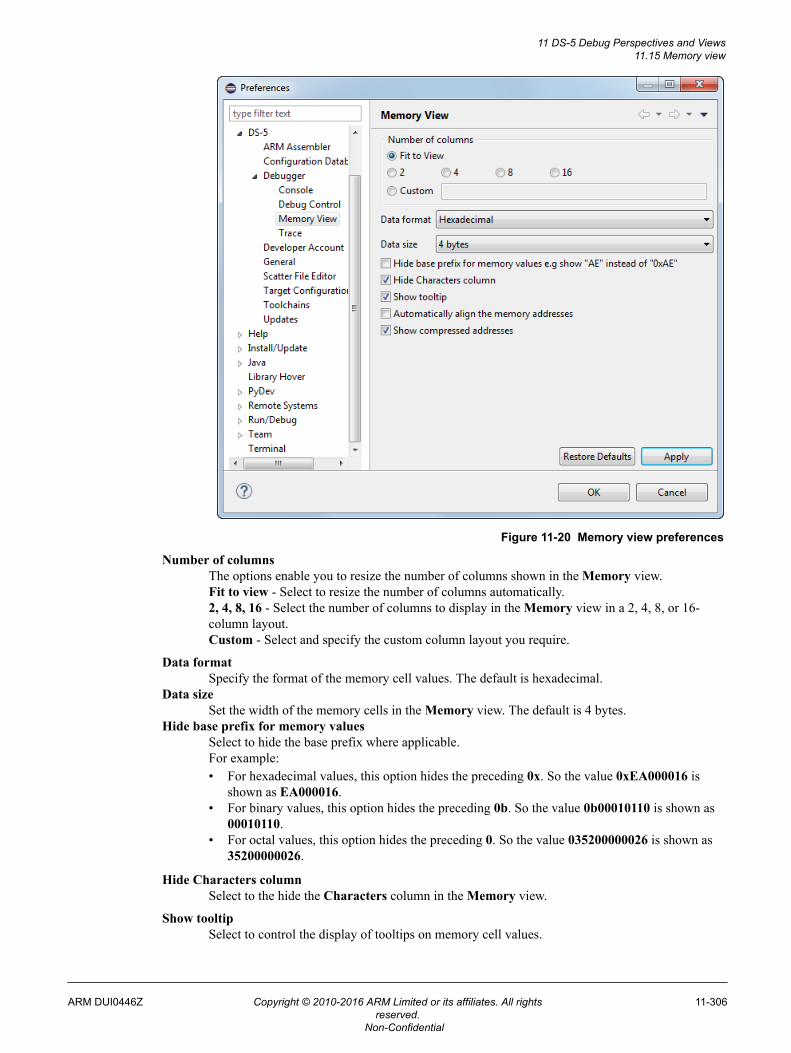
Figure 11-20 Memory view preferences
Number of columnsThe options enable you to resize the number of columns shown in the Memory view.Fit to view - Select to resize the number of columns automatically.2, 4, 8, 16 - Select the number of columns to display in the Memory view in a 2, 4, 8, or 16-column layout.Custom - Select and specify the custom column layout you require.
Data formatSpecify the format of the memory cell values. The default is hexadecimal.
Data sizeSet the width of the memory cells in the Memory view. The default is 4 bytes.
Hide base prefix for memory valuesSelect to hide the base prefix where applicable.For example:• For hexadecimal values, this option hides the preceding 0x. So the value 0xEA000016 is
shown as EA000016.• For binary values, this option hides the preceding 0b. So the value 0b00010110 is shown as
00010110.• For octal values, this option hides the preceding 0. So the value 035200000026 is shown as
35200000026.
Hide Characters columnSelect to the hide the Characters column in the Memory view.
Show tooltipSelect to control the display of tooltips on memory cell values.
11 DS-5 Debug Perspectives and Views11.15 Memory view
ARM DUI0446Z Copyright © 2010-2016 ARM Limited or its affiliates. All rightsreserved.
11-306
Non-Confidential
Automatically align the memory addressesAligns the memory view to the currently selected data width.
Show compressed addressesShows the least significant bytes of the address that are not repeating.
Related concepts6.8 About debugging multi-threaded applications on page 6-152.6.9 About debugging shared libraries on page 6-153.6.10.2 About debugging a Linux kernel on page 6-156.6.10.3 About debugging Linux kernel modules on page 6-158.6.11 About debugging TrustZone enabled targets on page 6-160.
Related references3.13 Setting a tracepoint on page 3-89.3.8 Conditional breakpoints on page 3-81.3.9 Assigning conditions to an existing breakpoint on page 3-82.3.12 Pending breakpoints and watchpoints on page 3-87.Chapter 11 DS-5 Debug Perspectives and Views on page 11-261.
11 DS-5 Debug Perspectives and Views11.15 Memory view
ARM DUI0446Z Copyright © 2010-2016 ARM Limited or its affiliates. All rightsreserved.
11-307
Non-Confidential
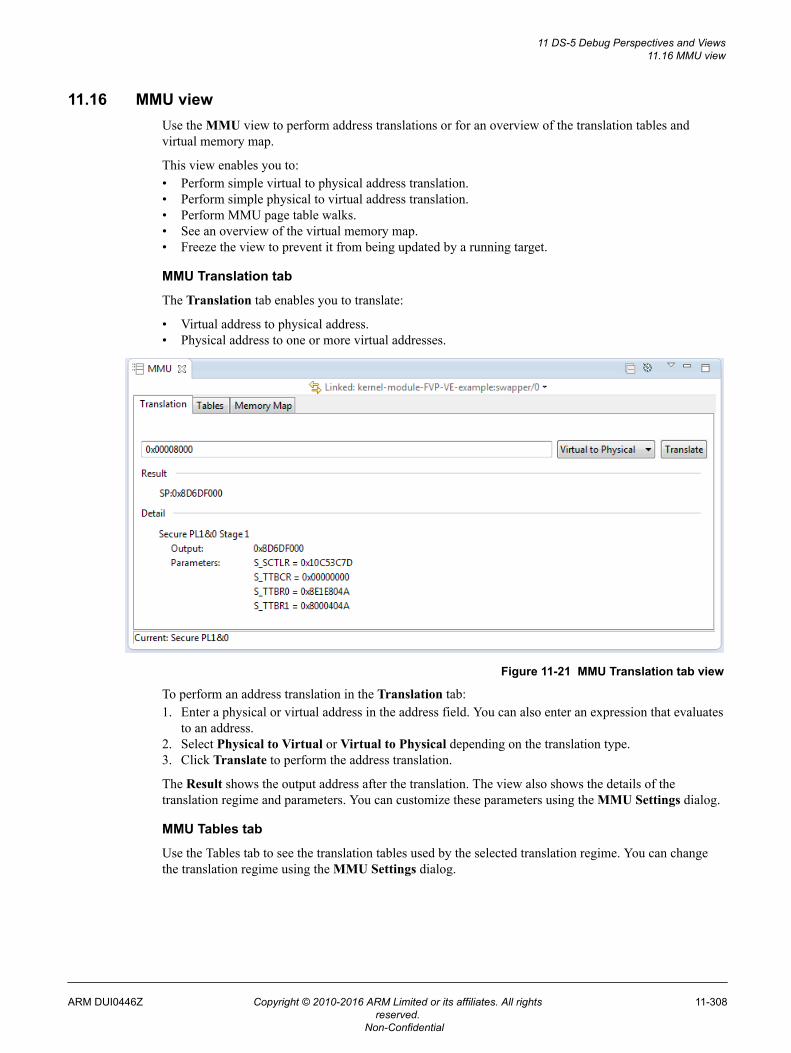
11.16 MMU viewUse the MMU view to perform address translations or for an overview of the translation tables andvirtual memory map.
This view enables you to:• Perform simple virtual to physical address translation.• Perform simple physical to virtual address translation.• Perform MMU page table walks.• See an overview of the virtual memory map.• Freeze the view to prevent it from being updated by a running target.
MMU Translation tab
The Translation tab enables you to translate:
• Virtual address to physical address.• Physical address to one or more virtual addresses.
Figure 11-21 MMU Translation tab view
To perform an address translation in the Translation tab:1. Enter a physical or virtual address in the address field. You can also enter an expression that evaluates
to an address.2. Select Physical to Virtual or Virtual to Physical depending on the translation type.3. Click Translate to perform the address translation.
The Result shows the output address after the translation. The view also shows the details of thetranslation regime and parameters. You can customize these parameters using the MMU Settings dialog.
MMU Tables tab
Use the Tables tab to see the translation tables used by the selected translation regime. You can changethe translation regime using the MMU Settings dialog.
11 DS-5 Debug Perspectives and Views11.16 MMU view
ARM DUI0446Z Copyright © 2010-2016 ARM Limited or its affiliates. All rightsreserved.
11-308
Non-Confidential
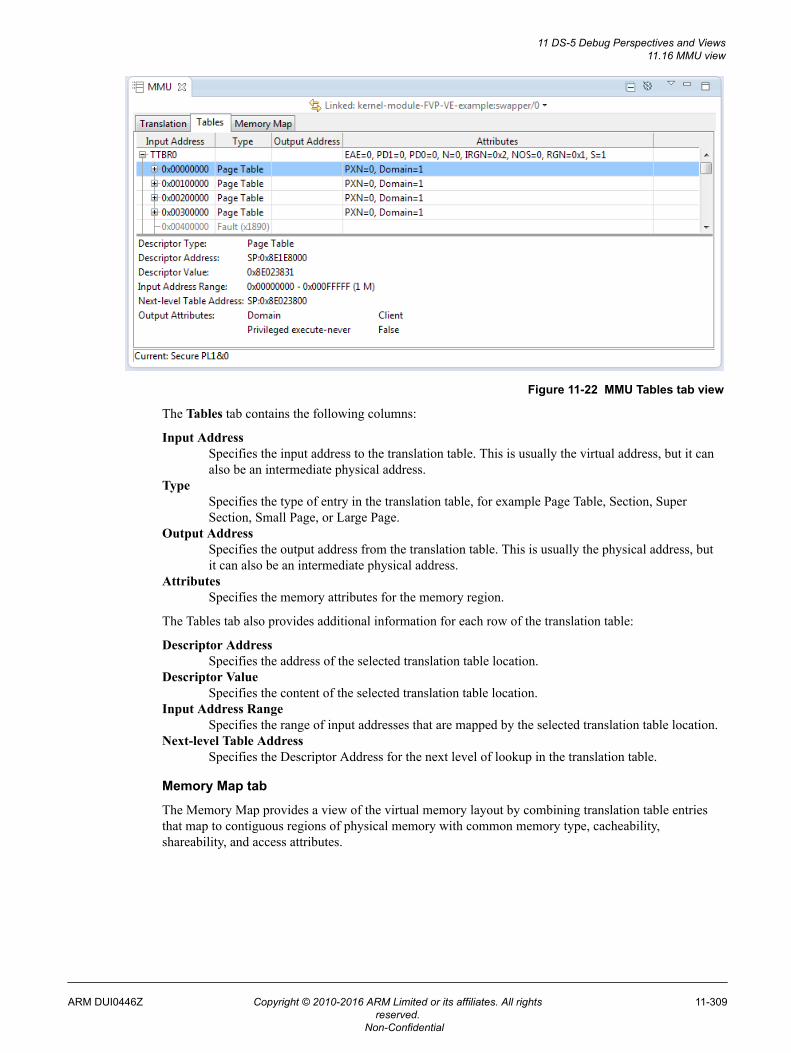
Figure 11-22 MMU Tables tab view
The Tables tab contains the following columns:
Input AddressSpecifies the input address to the translation table. This is usually the virtual address, but it canalso be an intermediate physical address.
TypeSpecifies the type of entry in the translation table, for example Page Table, Section, SuperSection, Small Page, or Large Page.
Output AddressSpecifies the output address from the translation table. This is usually the physical address, butit can also be an intermediate physical address.
AttributesSpecifies the memory attributes for the memory region.
The Tables tab also provides additional information for each row of the translation table:
Descriptor AddressSpecifies the address of the selected translation table location.
Descriptor ValueSpecifies the content of the selected translation table location.
Input Address RangeSpecifies the range of input addresses that are mapped by the selected translation table location.
Next-level Table AddressSpecifies the Descriptor Address for the next level of lookup in the translation table.
Memory Map tab
The Memory Map provides a view of the virtual memory layout by combining translation table entriesthat map to contiguous regions of physical memory with common memory type, cacheability,shareability, and access attributes.
11 DS-5 Debug Perspectives and Views11.16 MMU view
ARM DUI0446Z Copyright © 2010-2016 ARM Limited or its affiliates. All rightsreserved.
11-309
Non-Confidential
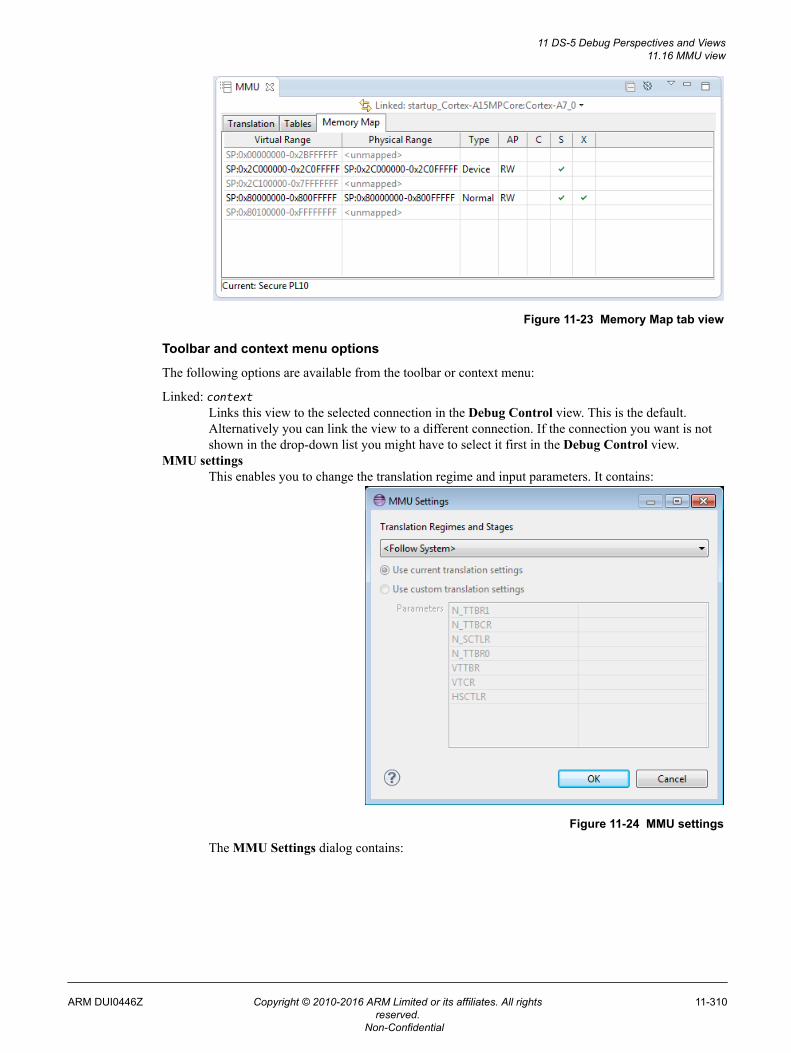
Figure 11-23 Memory Map tab view
Toolbar and context menu options
The following options are available from the toolbar or context menu:
Linked: contextLinks this view to the selected connection in the Debug Control view. This is the default.Alternatively you can link the view to a different connection. If the connection you want is notshown in the drop-down list you might have to select it first in the Debug Control view.
MMU settingsThis enables you to change the translation regime and input parameters. It contains:
Figure 11-24 MMU settings
The MMU Settings dialog contains:
11 DS-5 Debug Perspectives and Views11.16 MMU view
ARM DUI0446Z Copyright © 2010-2016 ARM Limited or its affiliates. All rightsreserved.
11-310
Non-Confidential
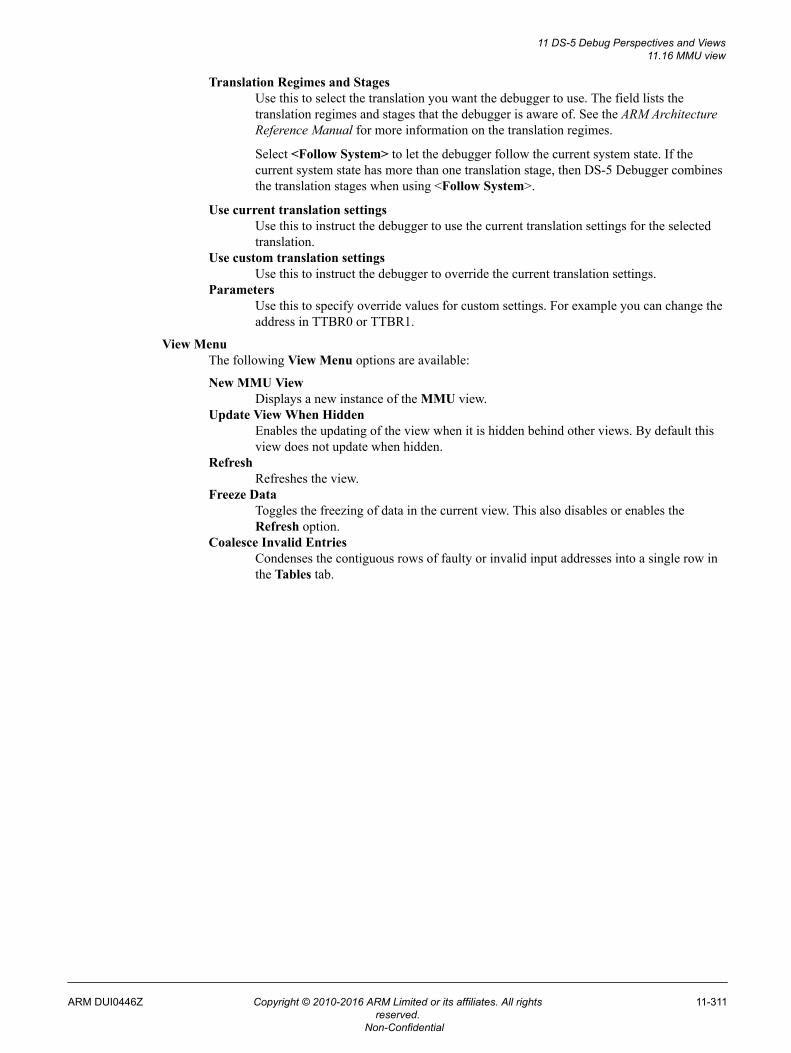
Translation Regimes and StagesUse this to select the translation you want the debugger to use. The field lists thetranslation regimes and stages that the debugger is aware of. See the ARM ArchitectureReference Manual for more information on the translation regimes.
Select <Follow System> to let the debugger follow the current system state. If thecurrent system state has more than one translation stage, then DS-5 Debugger combinesthe translation stages when using <Follow System>.
Use current translation settingsUse this to instruct the debugger to use the current translation settings for the selectedtranslation.
Use custom translation settingsUse this to instruct the debugger to override the current translation settings.
ParametersUse this to specify override values for custom settings. For example you can change theaddress in TTBR0 or TTBR1.
View MenuThe following View Menu options are available:
New MMU ViewDisplays a new instance of the MMU view.
Update View When HiddenEnables the updating of the view when it is hidden behind other views. By default thisview does not update when hidden.
RefreshRefreshes the view.
Freeze DataToggles the freezing of data in the current view. This also disables or enables theRefresh option.
Coalesce Invalid EntriesCondenses the contiguous rows of faulty or invalid input addresses into a single row inthe Tables tab.
11 DS-5 Debug Perspectives and Views11.16 MMU view
ARM DUI0446Z Copyright © 2010-2016 ARM Limited or its affiliates. All rightsreserved.
11-311
Non-Confidential
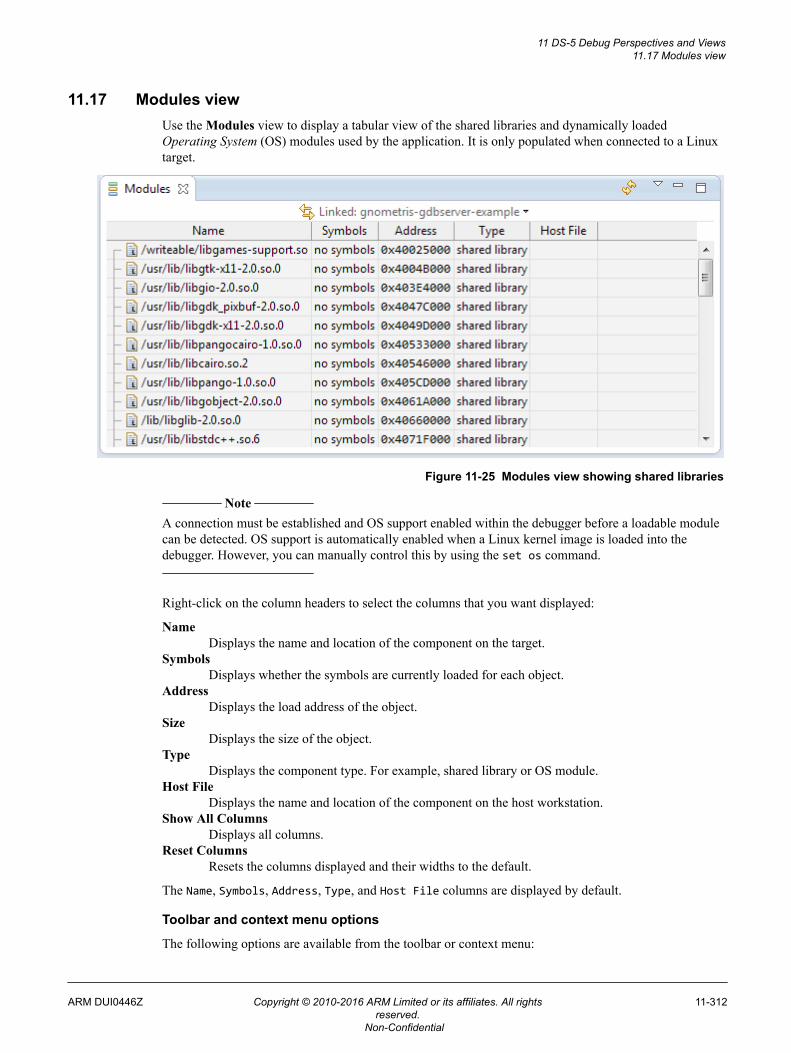
11.17 Modules viewUse the Modules view to display a tabular view of the shared libraries and dynamically loadedOperating System (OS) modules used by the application. It is only populated when connected to a Linuxtarget.
Figure 11-25 Modules view showing shared libraries
Note
A connection must be established and OS support enabled within the debugger before a loadable modulecan be detected. OS support is automatically enabled when a Linux kernel image is loaded into thedebugger. However, you can manually control this by using the set os command.
Right-click on the column headers to select the columns that you want displayed:
NameDisplays the name and location of the component on the target.
SymbolsDisplays whether the symbols are currently loaded for each object.
AddressDisplays the load address of the object.
SizeDisplays the size of the object.
TypeDisplays the component type. For example, shared library or OS module.
Host FileDisplays the name and location of the component on the host workstation.
Show All ColumnsDisplays all columns.
Reset ColumnsResets the columns displayed and their widths to the default.
The Name, Symbols, Address, Type, and Host File columns are displayed by default.
Toolbar and context menu options
The following options are available from the toolbar or context menu:
11 DS-5 Debug Perspectives and Views11.17 Modules view
ARM DUI0446Z Copyright © 2010-2016 ARM Limited or its affiliates. All rightsreserved.
11-312
Non-Confidential
Linked: contextLinks this view to the selected connection in the Debug Control view. This is the default.Alternatively you can link the view to a different connection. If the connection you want is notshown in the drop-down list you might have to select it first in the Debug Control view.
CopyCopies the selected data.
Select AllSelects all the displayed data.
Load SymbolsLoads debug information into the debugger from the source file displayed in the Host Filecolumn. This option is disabled if the host file is unknown before the file is loaded.
Add Symbol File...Opens a dialog box where you can select a file from the host workstation containing the debuginformation required by the debugger.
Discard SymbolsDiscards debug information relating to the selected file.
Show in MemoryDisplays the Memory view starting at the load address of the selected object.
Show in DisassemblyDisplays the Disassembly view starting at the load address of the selected object.
View MenuThe following View Menu options are available:
Update View When HiddenEnables the updating of the view when it is hidden behind other views. By default thisview does not update when hidden.
RefreshRefreshes the view.
Related concepts6.8 About debugging multi-threaded applications on page 6-152.6.9 About debugging shared libraries on page 6-153.6.10.2 About debugging a Linux kernel on page 6-156.6.10.3 About debugging Linux kernel modules on page 6-158.6.11 About debugging TrustZone enabled targets on page 6-160.
Related referencesChapter 11 DS-5 Debug Perspectives and Views on page 11-261.
11 DS-5 Debug Perspectives and Views11.17 Modules view
ARM DUI0446Z Copyright © 2010-2016 ARM Limited or its affiliates. All rightsreserved.
11-313
Non-Confidential
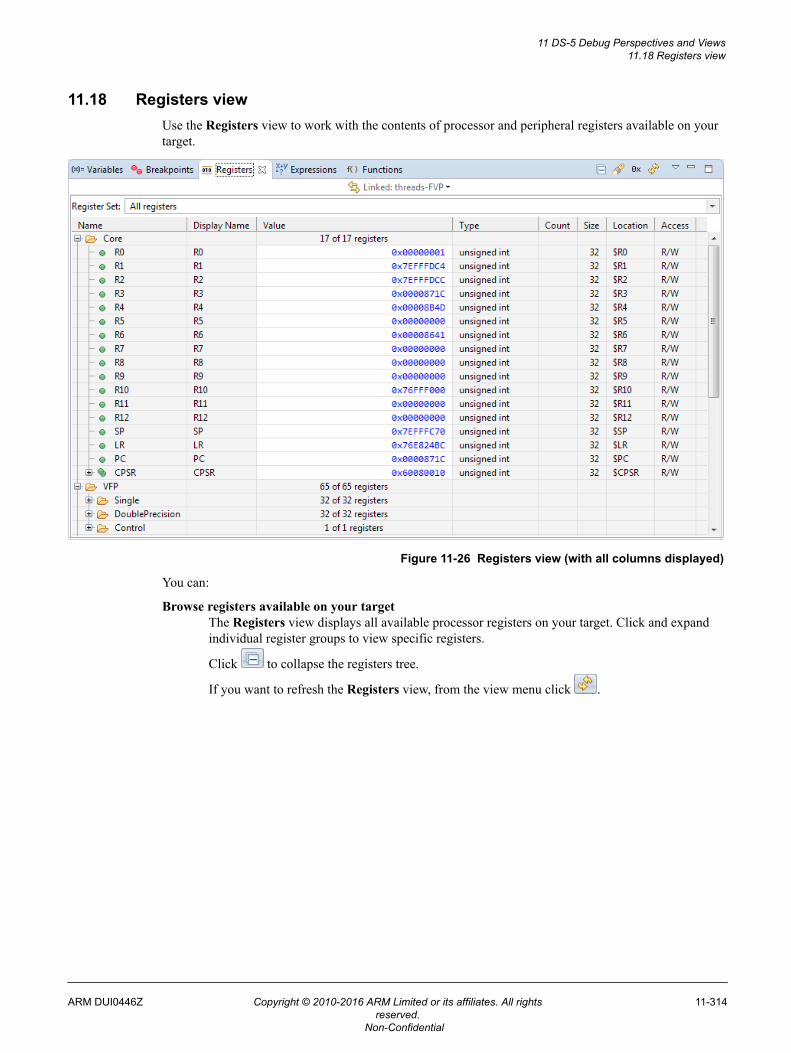
11.18 Registers viewUse the Registers view to work with the contents of processor and peripheral registers available on yourtarget.
Figure 11-26 Registers view (with all columns displayed)
You can:
Browse registers available on your targetThe Registers view displays all available processor registers on your target. Click and expandindividual register groups to view specific registers.
Click to collapse the registers tree.
If you want to refresh the Registers view, from the view menu click .
11 DS-5 Debug Perspectives and Views11.18 Registers view
ARM DUI0446Z Copyright © 2010-2016 ARM Limited or its affiliates. All rightsreserved.
11-314
Non-Confidential
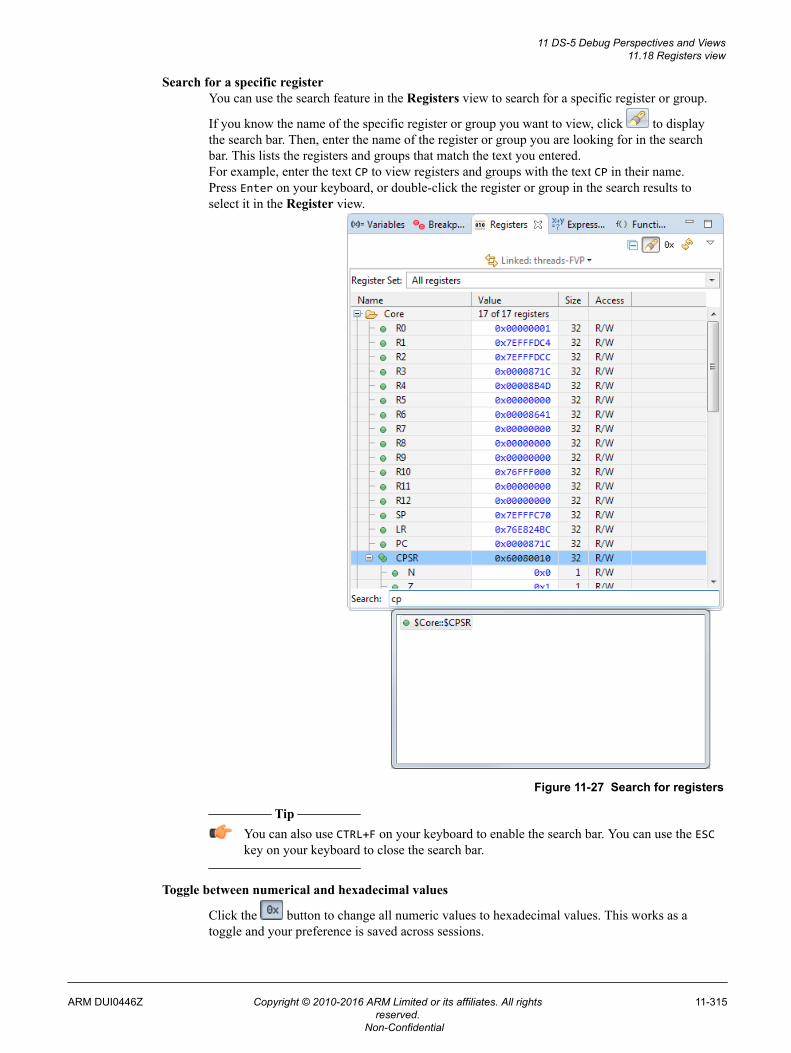
Search for a specific registerYou can use the search feature in the Registers view to search for a specific register or group.
If you know the name of the specific register or group you want to view, click to displaythe search bar. Then, enter the name of the register or group you are looking for in the searchbar. This lists the registers and groups that match the text you entered.For example, enter the text CP to view registers and groups with the text CP in their name.Press Enter on your keyboard, or double-click the register or group in the search results toselect it in the Register view.
Figure 11-27 Search for registers
Tip
You can also use CTRL+F on your keyboard to enable the search bar. You can use the ESCkey on your keyboard to close the search bar.
Toggle between numerical and hexadecimal values
Click the button to change all numeric values to hexadecimal values. This works as atoggle and your preference is saved across sessions.
11 DS-5 Debug Perspectives and Views11.18 Registers view
ARM DUI0446Z Copyright © 2010-2016 ARM Limited or its affiliates. All rightsreserved.
11-315
Non-Confidential
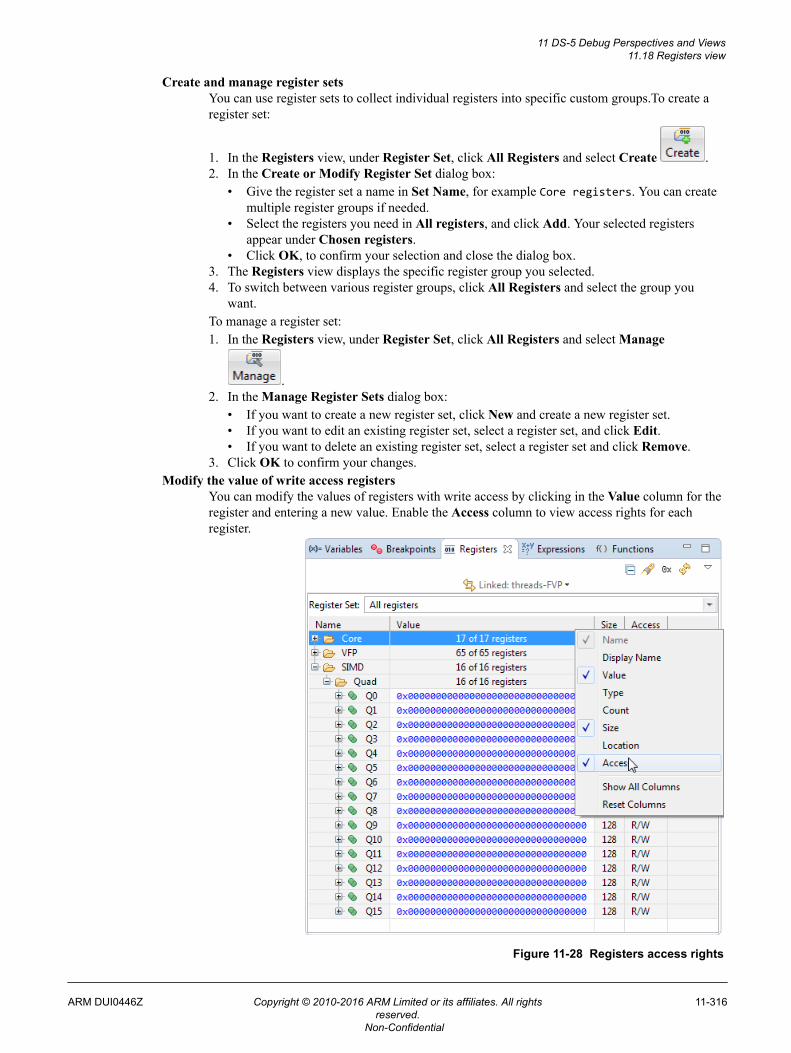
Create and manage register setsYou can use register sets to collect individual registers into specific custom groups.To create aregister set:
1. In the Registers view, under Register Set, click All Registers and select Create .2. In the Create or Modify Register Set dialog box:
• Give the register set a name in Set Name, for example Core registers. You can createmultiple register groups if needed.
• Select the registers you need in All registers, and click Add. Your selected registersappear under Chosen registers.
• Click OK, to confirm your selection and close the dialog box.3. The Registers view displays the specific register group you selected.4. To switch between various register groups, click All Registers and select the group you
want.To manage a register set:1. In the Registers view, under Register Set, click All Registers and select Manage
.2. In the Manage Register Sets dialog box:
• If you want to create a new register set, click New and create a new register set.• If you want to edit an existing register set, select a register set, and click Edit.• If you want to delete an existing register set, select a register set and click Remove.
3. Click OK to confirm your changes.Modify the value of write access registers
You can modify the values of registers with write access by clicking in the Value column for theregister and entering a new value. Enable the Access column to view access rights for eachregister.
Figure 11-28 Registers access rights
11 DS-5 Debug Perspectives and Views11.18 Registers view
ARM DUI0446Z Copyright © 2010-2016 ARM Limited or its affiliates. All rightsreserved.
11-316
Non-Confidential
Drag and drop an address held in a register from the Registers view to other viewsDrag and drop an address held in a register from this view into either the Memory view to seethe memory at that address, or into the Disassembly view to disassemble from that address.
Change the display format of register valuesYou can set the format of individual bits for Program Status Registers (PSRs).
Freeze the selected view to prevent the values being updated by a running targetSelect Freeze Data from the view menu to prevent values updating automatically when theview refreshes.
Toolbar and context menu options
The following options are available from the view or context menu:
Linked: contextLinks this view to the selected connection in the Debug Control view. This is the default.Alternatively you can link the view to a different connection. If the connection you want is notshown in the drop-down list you might have to select it first in the Debug Control view.
CopyCopies the selected registers. If a register contains bitfields, you must expand the bitfield tocopy the individual bitfield values.
It can be useful to copy registers to a text editor in order to compare the values when executionstops at another location.
Select AllSelects all registers currently expanded in the view.
Show Memory Pointed to By <register name>Displays the Memory view starting at the address held in the register.
Show Disassembly Pointed to By <register name>Displays the Disassembly view starting at the address held in the register.
Translate Address in <register name>Displays the MMU view and translates the address held in the register.
Send to <selection>Displays a sub menu that enables you to add register filters to a specific Expressions view.
<Format list>A list of formats you can use for the register values.
View MenuThe following View Menu options are available:
New Registers ViewCreates a new instance of the Registers view.
Freeze DataToggles the freezing of data in the current view. This also disables or enables theRefresh option.
Editing context menu optionsThe following options are available on the context menu when you select a register value forediting:
UndoReverts the last change you made to the selected value.
CutCopies and deletes the selected value.
CopyCopies the selected value.
PastePastes a value that you have previously cut or copied into the selected register value.
DeleteDeletes the selected value.
11 DS-5 Debug Perspectives and Views11.18 Registers view
ARM DUI0446Z Copyright © 2010-2016 ARM Limited or its affiliates. All rightsreserved.
11-317
Non-Confidential
Select AllSelects the whole value.
Adding a new column header
Right-click on the column headers to select the columns that you want displayed:
NameThe name of the register.
Use $register_name to reference a register. To refer to a register that has bitfields, such as aPSR, specify $register_name.bitfield_name. For example, to print the value of the M bitfieldof the CPSR, enter the following command in the Commands view:
print $CPSR.M
ValueThe value of the register. A yellow background indicates that the value has changed. This mightresult from you either performing a debug action such as stepping or by you editing the valuedirectly.
If you freeze the view, then you cannot change a register value.
TypeThe type of the register value.
CountThe number of array or pointer elements.
SizeThe size of the register in bits.
LocationThe name of the register or the bit range for a bitfield of a PSR. For example, bitfield M of theCPSR is displayed as $CPSR[4..0].
AccessThe access mode for the register.
Show All ColumnsDisplays all columns.
Reset ColumnsResets the columns displayed and their widths to the default.
The Name, Value, Size, and Access columns are displayed by default.
Related concepts6.8 About debugging multi-threaded applications on page 6-152.6.9 About debugging shared libraries on page 6-153.6.10.2 About debugging a Linux kernel on page 6-156.6.10.3 About debugging Linux kernel modules on page 6-158.6.11 About debugging TrustZone enabled targets on page 6-160.
Related references3.13 Setting a tracepoint on page 3-89.3.8 Conditional breakpoints on page 3-81.3.9 Assigning conditions to an existing breakpoint on page 3-82.3.12 Pending breakpoints and watchpoints on page 3-87.Chapter 11 DS-5 Debug Perspectives and Views on page 11-261.
11 DS-5 Debug Perspectives and Views11.18 Registers view
ARM DUI0446Z Copyright © 2010-2016 ARM Limited or its affiliates. All rightsreserved.
11-318
Non-Confidential
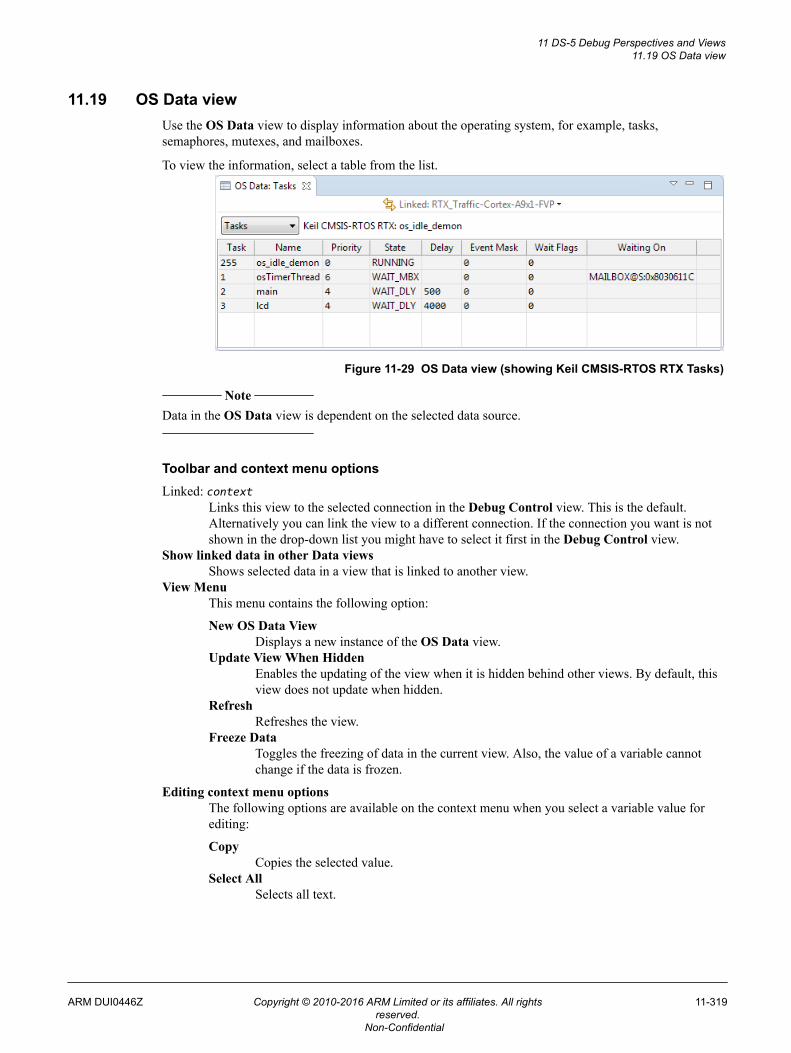
11.19 OS Data viewUse the OS Data view to display information about the operating system, for example, tasks,semaphores, mutexes, and mailboxes.
To view the information, select a table from the list.
Figure 11-29 OS Data view (showing Keil CMSIS-RTOS RTX Tasks)
Note
Data in the OS Data view is dependent on the selected data source.
Toolbar and context menu optionsLinked: context
Links this view to the selected connection in the Debug Control view. This is the default.Alternatively you can link the view to a different connection. If the connection you want is notshown in the drop-down list you might have to select it first in the Debug Control view.
Show linked data in other Data viewsShows selected data in a view that is linked to another view.
View MenuThis menu contains the following option:
New OS Data ViewDisplays a new instance of the OS Data view.
Update View When HiddenEnables the updating of the view when it is hidden behind other views. By default, thisview does not update when hidden.
RefreshRefreshes the view.
Freeze DataToggles the freezing of data in the current view. Also, the value of a variable cannotchange if the data is frozen.
Editing context menu optionsThe following options are available on the context menu when you select a variable value forediting:
CopyCopies the selected value.
Select AllSelects all text.
11 DS-5 Debug Perspectives and Views11.19 OS Data view
ARM DUI0446Z Copyright © 2010-2016 ARM Limited or its affiliates. All rightsreserved.
11-319
Non-Confidential
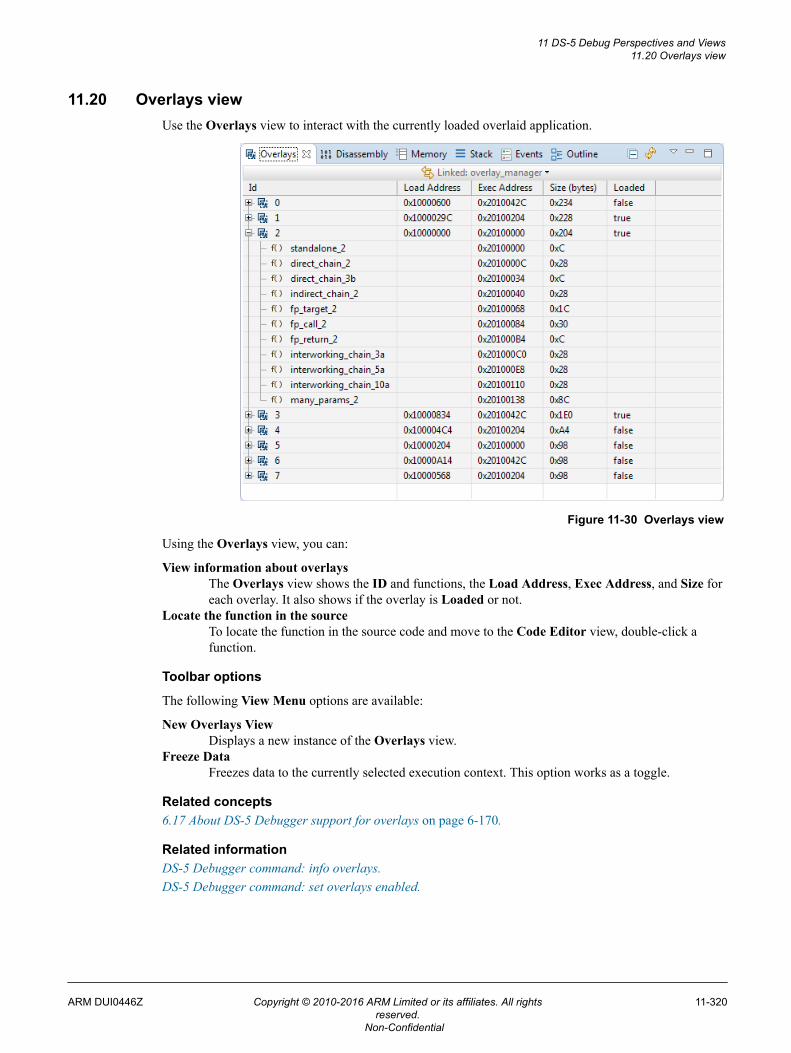
11.20 Overlays viewUse the Overlays view to interact with the currently loaded overlaid application.
Figure 11-30 Overlays view
Using the Overlays view, you can:
View information about overlaysThe Overlays view shows the ID and functions, the Load Address, Exec Address, and Size foreach overlay. It also shows if the overlay is Loaded or not.
Locate the function in the sourceTo locate the function in the source code and move to the Code Editor view, double-click afunction.
Toolbar options
The following View Menu options are available:
New Overlays ViewDisplays a new instance of the Overlays view.
Freeze DataFreezes data to the currently selected execution context. This option works as a toggle.
Related concepts6.17 About DS-5 Debugger support for overlays on page 6-170.
Related informationDS-5 Debugger command: info overlays.DS-5 Debugger command: set overlays enabled.
11 DS-5 Debug Perspectives and Views11.20 Overlays view
ARM DUI0446Z Copyright © 2010-2016 ARM Limited or its affiliates. All rightsreserved.
11-320
Non-Confidential
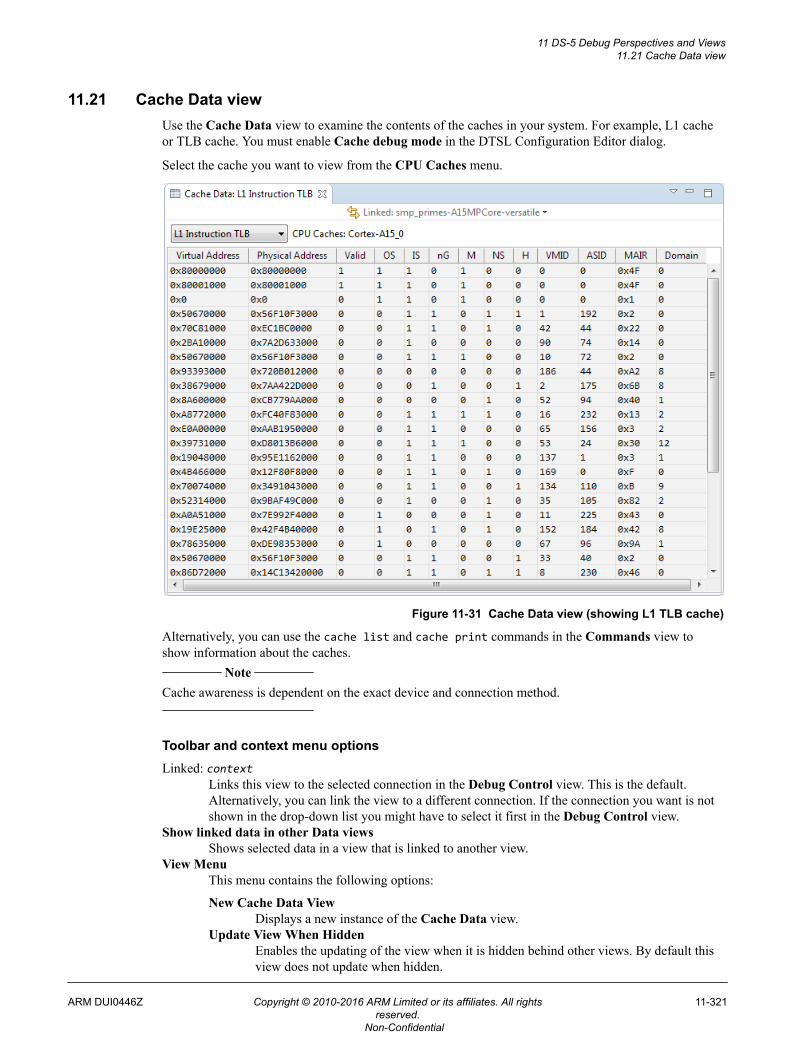
11.21 Cache Data viewUse the Cache Data view to examine the contents of the caches in your system. For example, L1 cacheor TLB cache. You must enable Cache debug mode in the DTSL Configuration Editor dialog.
Select the cache you want to view from the CPU Caches menu.
Figure 11-31 Cache Data view (showing L1 TLB cache)
Alternatively, you can use the cache list and cache print commands in the Commands view toshow information about the caches.
Note
Cache awareness is dependent on the exact device and connection method.
Toolbar and context menu optionsLinked: context
Links this view to the selected connection in the Debug Control view. This is the default.Alternatively, you can link the view to a different connection. If the connection you want is notshown in the drop-down list you might have to select it first in the Debug Control view.
Show linked data in other Data viewsShows selected data in a view that is linked to another view.
View MenuThis menu contains the following options:
New Cache Data ViewDisplays a new instance of the Cache Data view.
Update View When HiddenEnables the updating of the view when it is hidden behind other views. By default thisview does not update when hidden.
11 DS-5 Debug Perspectives and Views11.21 Cache Data view
ARM DUI0446Z Copyright © 2010-2016 ARM Limited or its affiliates. All rightsreserved.
11-321
Non-Confidential
RefreshRefreshes the view.
Freeze DataToggles the freezing of data in the current view. The value of a variable cannot changeif the data is frozen.
Editing context menu optionsThe following options are available on the context menu when you right-click a value:
CopyCopies the selected value.
Select AllSelects all text.
Related concepts6.16 About debugging caches on page 6-167.
Related references11.46 DTSL Configuration Editor dialog box on page 11-372.11.15 Memory view on page 11-302.
Related informationDS-5 Debugger cache commands.
11 DS-5 Debug Perspectives and Views11.21 Cache Data view
ARM DUI0446Z Copyright © 2010-2016 ARM Limited or its affiliates. All rightsreserved.
11-322
Non-Confidential
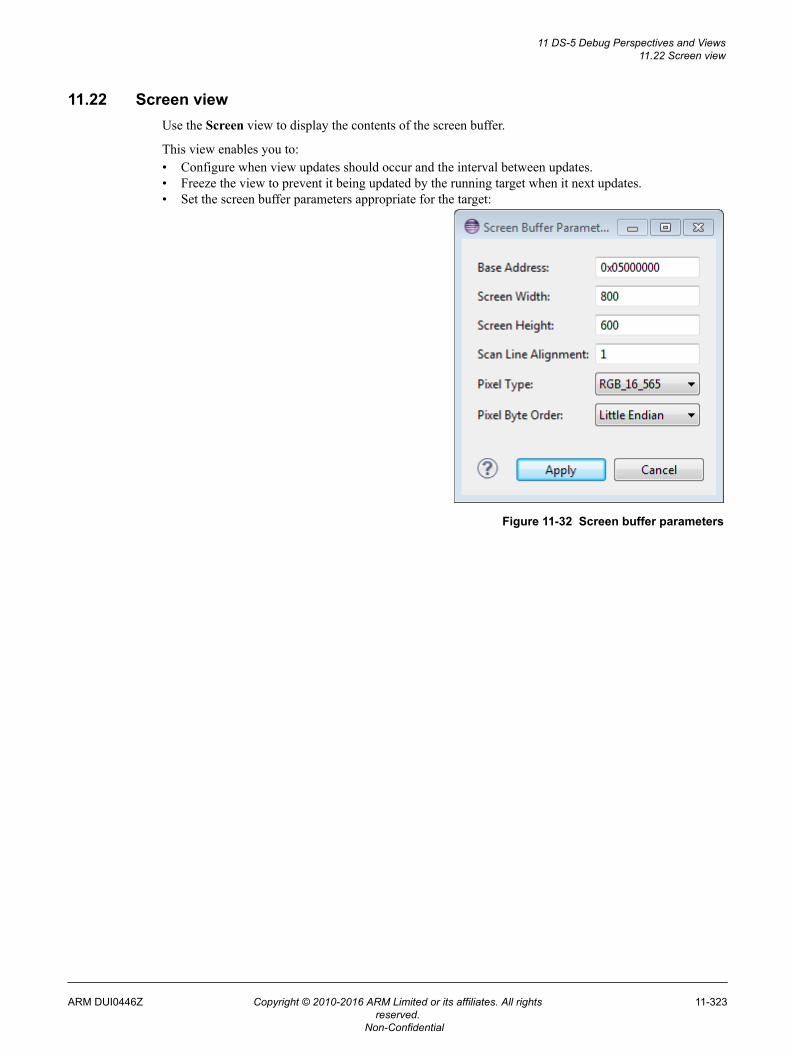
11.22 Screen viewUse the Screen view to display the contents of the screen buffer.
This view enables you to:• Configure when view updates should occur and the interval between updates.• Freeze the view to prevent it being updated by the running target when it next updates.• Set the screen buffer parameters appropriate for the target:
Figure 11-32 Screen buffer parameters
11 DS-5 Debug Perspectives and Views11.22 Screen view
ARM DUI0446Z Copyright © 2010-2016 ARM Limited or its affiliates. All rightsreserved.
11-323
Non-Confidential
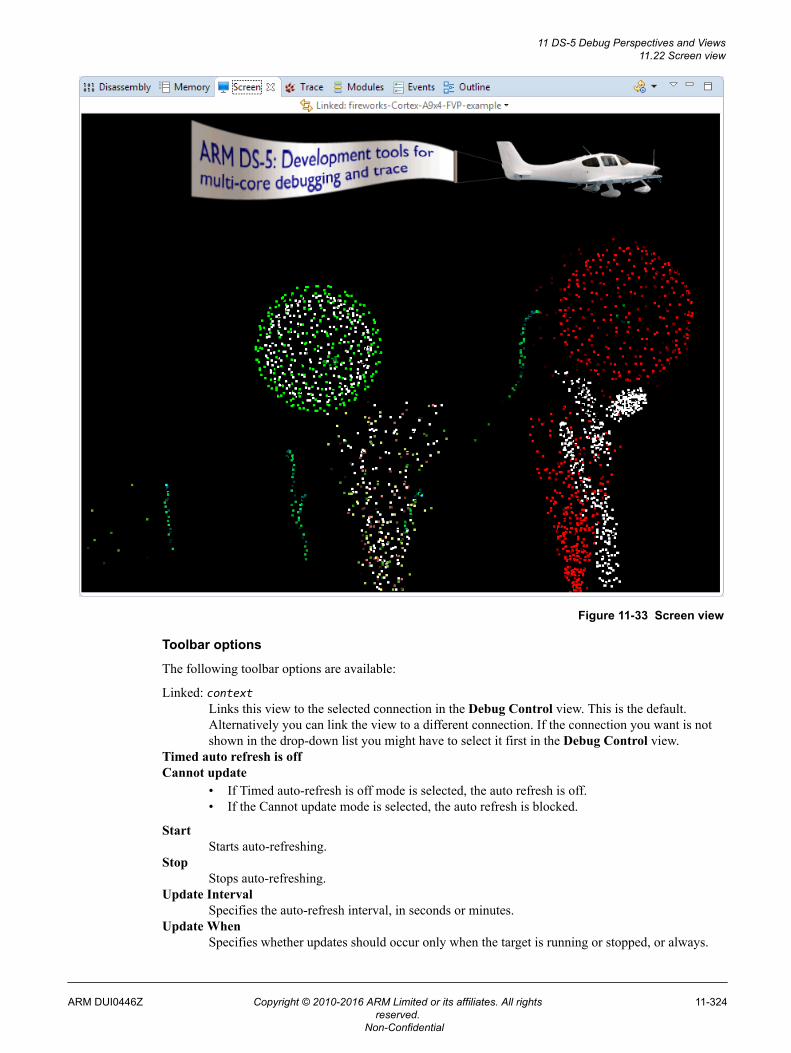
Figure 11-33 Screen view
Toolbar options
The following toolbar options are available:
Linked: contextLinks this view to the selected connection in the Debug Control view. This is the default.Alternatively you can link the view to a different connection. If the connection you want is notshown in the drop-down list you might have to select it first in the Debug Control view.
Timed auto refresh is offCannot update
• If Timed auto-refresh is off mode is selected, the auto refresh is off.• If the Cannot update mode is selected, the auto refresh is blocked.
StartStarts auto-refreshing.
StopStops auto-refreshing.
Update IntervalSpecifies the auto-refresh interval, in seconds or minutes.
Update WhenSpecifies whether updates should occur only when the target is running or stopped, or always.
11 DS-5 Debug Perspectives and Views11.22 Screen view
ARM DUI0446Z Copyright © 2010-2016 ARM Limited or its affiliates. All rightsreserved.
11-324
Non-Confidential
PropertiesDisplays the Timed Auto-Refresh Properties dialog box.
New Screen ViewCreates a new instance of the Screen view.
Set screen buffer parametersDisplays the Screen Buffer Parameters dialog box. The dialog box contains the followingparameters:
Base AddressSets the base address of the screen buffer.
Screen WidthSets the width of the screen in pixels.
Screen HeightSets the height of the screen in pixels.
Scan Line AlignmentSets the byte alignment required for each scan line.
Pixel TypeSelects the pixel type.
Pixel Byte OrderSelects the byte order of the pixels within the data.
Click Apply to save the settings and close the dialog box.
Click Cancel to close the dialog box without saving.
Update View When HiddenEnables the updating of the view when it is hidden behind other views. By default this viewdoes not update when hidden.
RefreshRefreshes the view.
Freeze DataToggles the freezing of data in the current view. This also disables or enables the Refreshoption.
The Screen view is not visible by default. To add this view:1. Ensure that you are in the DS-5 Debug perspective.2. Select Window > Show View to open the Show View dialog box.3. Select Screen view.
Related referencesChapter 11 DS-5 Debug Perspectives and Views on page 11-261.
11 DS-5 Debug Perspectives and Views11.22 Screen view
ARM DUI0446Z Copyright © 2010-2016 ARM Limited or its affiliates. All rightsreserved.
11-325
Non-Confidential
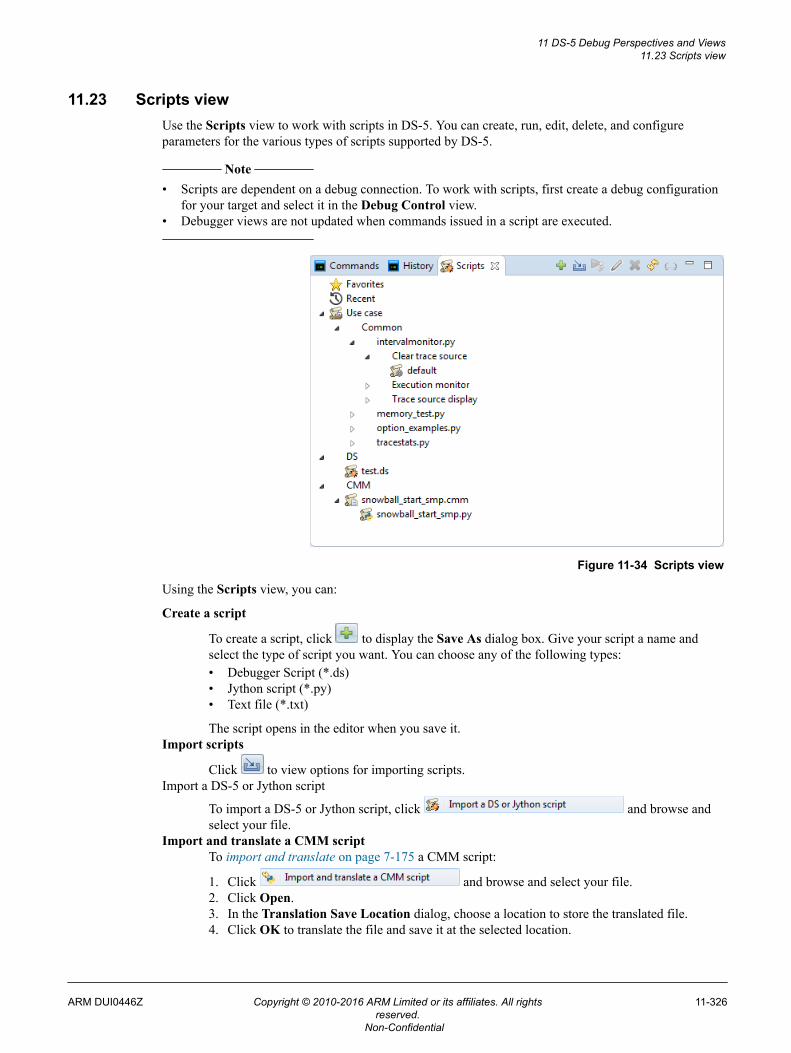
11.23 Scripts viewUse the Scripts view to work with scripts in DS-5. You can create, run, edit, delete, and configureparameters for the various types of scripts supported by DS-5.
Note
• Scripts are dependent on a debug connection. To work with scripts, first create a debug configurationfor your target and select it in the Debug Control view.
• Debugger views are not updated when commands issued in a script are executed.
Figure 11-34 Scripts view
Using the Scripts view, you can:
Create a script
To create a script, click to display the Save As dialog box. Give your script a name andselect the type of script you want. You can choose any of the following types:• Debugger Script (*.ds)• Jython script (*.py)• Text file (*.txt)
The script opens in the editor when you save it.Import scripts
Click to view options for importing scripts.Import a DS-5 or Jython script
To import a DS-5 or Jython script, click and browse andselect your file.
Import and translate a CMM scriptTo import and translate on page 7-175 a CMM script:
1. Click and browse and select your file.2. Click Open.3. In the Translation Save Location dialog, choose a location to store the translated file.4. Click OK to translate the file and save it at the selected location.
11 DS-5 Debug Perspectives and Views11.23 Scripts view
ARM DUI0446Z Copyright © 2010-2016 ARM Limited or its affiliates. All rightsreserved.
11-326
Non-Confidential
Add additional use case script directories
To add more use case script directories, click and eitherenter the folder location or click Browse to the script folder location.
Note
To change the location for other scripts that are supported in DS-5 Debugger, from the mainmenu, select Window > Preferences > DS-5 > Debugger > Console. Then, select the Use adefault script folder option, and either enter the folder location or click Browse to the scriptfolder location.
Execute your script
After connecting to your target, select your script and click to execute your script. You canalso double-click a script to run it.
Note
When working with use case scripts, you must select the use case configuration to run yourscript.
Edit your script
Select your script and click to open the script in the editor.Delete your script
Select the script that you want to delete and click . Confirm if you want to delete the scriptfrom the view, or if you want to delete from the disk, and click OK.
Refresh the script view
Click to refresh the view.Configure script options
Select a script, and click to configure script options.
Related concepts7.10 Use case scripts on page 7-187.
Related referencesChapter 7 Debugging with Scripts on page 7-171.Chapter 8 Running DS-5 Debugger from the operating system command-line or from a scripton page 8-202.7.4 Support for importing and translating CMM scripts on page 7-175.
11 DS-5 Debug Perspectives and Views11.23 Scripts view
ARM DUI0446Z Copyright © 2010-2016 ARM Limited or its affiliates. All rightsreserved.
11-327
Non-Confidential
11.24 Target Console viewUse the Target Console view to display messages from the target setup scripts.
Note
Default settings for this view are controlled by DS-5 Debugger options in the Preferences dialog box. Forexample, the default location for the console log. You can access these settings by selecting Preferencesfrom the Window menu.
Toolbar and context menu options
The following options are available from the toolbar or context menu:
Linked: contextLinks this view to the selected connection in the Debug Control view. This is the default.Alternatively you can link the view to a different connection. If the connection you want is notshown in the drop-down list you might have to select it first in the Debug Control view.
Save Console BufferSaves the contents of the Target Console view to a text file.
Clear ConsoleClears the contents of the Target Console view.
Toggles Scroll LockEnables or disables the automatic scrolling of messages in the Target Console view.
View MenuThis menu contains the following options:
New Target Console ViewDisplays a new instance of the Target Console view.
Bring to Front for WriteIf enabled, the debugger automatically changes the focus to this view when a targetscript prompts for input.
CopyCopies the selected text.
PastePastes text that you have previously copied.
Select AllSelects all text.
Related referencesChapter 11 DS-5 Debug Perspectives and Views on page 11-261.
11 DS-5 Debug Perspectives and Views11.24 Target Console view
ARM DUI0446Z Copyright © 2010-2016 ARM Limited or its affiliates. All rightsreserved.
11-328
Non-Confidential
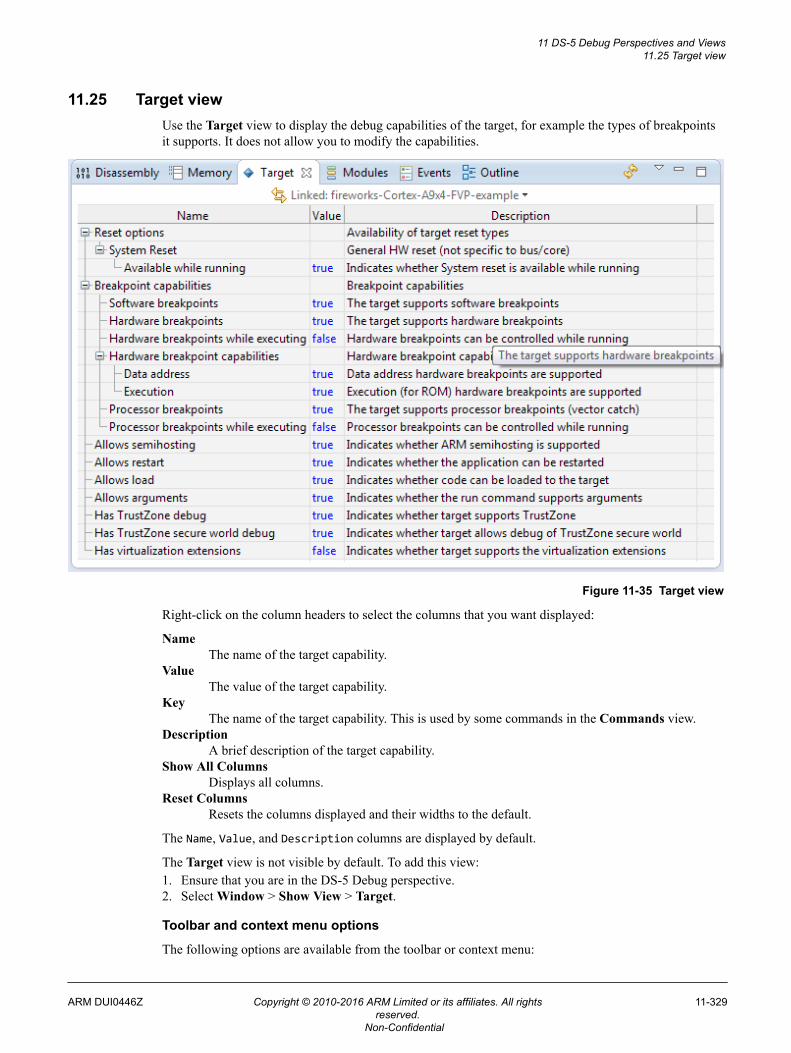
11.25 Target viewUse the Target view to display the debug capabilities of the target, for example the types of breakpointsit supports. It does not allow you to modify the capabilities.
Figure 11-35 Target view
Right-click on the column headers to select the columns that you want displayed:
NameThe name of the target capability.
ValueThe value of the target capability.
KeyThe name of the target capability. This is used by some commands in the Commands view.
DescriptionA brief description of the target capability.
Show All ColumnsDisplays all columns.
Reset ColumnsResets the columns displayed and their widths to the default.
The Name, Value, and Description columns are displayed by default.
The Target view is not visible by default. To add this view:1. Ensure that you are in the DS-5 Debug perspective.2. Select Window > Show View > Target.
Toolbar and context menu options
The following options are available from the toolbar or context menu:
11 DS-5 Debug Perspectives and Views11.25 Target view
ARM DUI0446Z Copyright © 2010-2016 ARM Limited or its affiliates. All rightsreserved.
11-329
Non-Confidential
Linked: contextLinks this view to the selected connection in the Debug Control view. This is the default.Alternatively you can link the view to a different connection. If the connection you want is notshown in the drop-down list you might have to select it first in the Debug Control view.
Refresh the Target CapabilitiesRefreshes the view.
View MenuThis menu contains the following option:
New Target ViewDisplays a new instance of the Target view.
CopyCopies the selected capabilities. To copy the capabilities in a group such as Breakpointcapabilities, you must first expand that group.
This is useful if you want to copy the capabilities to a text editor to save them for futurereference.
Select AllSelects all capabilities currently expanded in the view.
Related referencesChapter 11 DS-5 Debug Perspectives and Views on page 11-261.
11 DS-5 Debug Perspectives and Views11.25 Target view
ARM DUI0446Z Copyright © 2010-2016 ARM Limited or its affiliates. All rightsreserved.
11-330
Non-Confidential
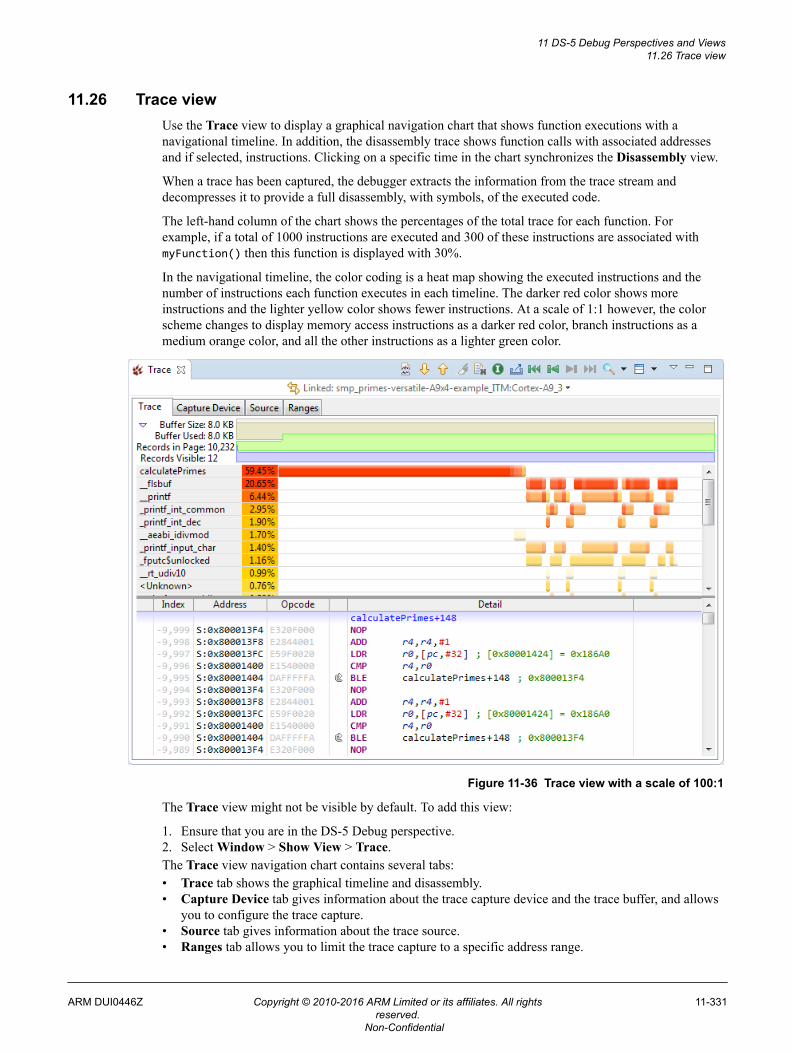
11.26 Trace viewUse the Trace view to display a graphical navigation chart that shows function executions with anavigational timeline. In addition, the disassembly trace shows function calls with associated addressesand if selected, instructions. Clicking on a specific time in the chart synchronizes the Disassembly view.
When a trace has been captured, the debugger extracts the information from the trace stream anddecompresses it to provide a full disassembly, with symbols, of the executed code.
The left-hand column of the chart shows the percentages of the total trace for each function. Forexample, if a total of 1000 instructions are executed and 300 of these instructions are associated withmyFunction() then this function is displayed with 30%.
In the navigational timeline, the color coding is a heat map showing the executed instructions and thenumber of instructions each function executes in each timeline. The darker red color shows moreinstructions and the lighter yellow color shows fewer instructions. At a scale of 1:1 however, the colorscheme changes to display memory access instructions as a darker red color, branch instructions as amedium orange color, and all the other instructions as a lighter green color.
Figure 11-36 Trace view with a scale of 100:1
The Trace view might not be visible by default. To add this view:
1. Ensure that you are in the DS-5 Debug perspective.2. Select Window > Show View > Trace.The Trace view navigation chart contains several tabs:• Trace tab shows the graphical timeline and disassembly.• Capture Device tab gives information about the trace capture device and the trace buffer, and allows
you to configure the trace capture.• Source tab gives information about the trace source.• Ranges tab allows you to limit the trace capture to a specific address range.
11 DS-5 Debug Perspectives and Views11.26 Trace view
ARM DUI0446Z Copyright © 2010-2016 ARM Limited or its affiliates. All rightsreserved.
11-331
Non-Confidential
The Trace tab also shows:
Buffer SizeSize of the trace buffer to store trace records. This is determined by the trace capture device. Thetrace records can be instruction records or non-instruction records.
Buffer UsedAmount of the trace buffer that is already used for trace records.
Records in PageThe total number of instruction records and non-instruction records in the current Trace view.
Records VisibleThe number of trace records visible in the disassembly area of the Trace view.
Toolbar and context menu options
The following options are available from the toolbar or context menu:
Linked: contextLinks this view to the selected connection in the Debug Control view. This is the default.Alternatively you can link the view to a different connection or processor in a SymmetricMultiProcessing (SMP) connection. If the connection you want is not shown in the drop-downlist you might have to select it first in the Debug Control view.
Updating view when hiddenNot updating view when hidden
Toggles the updating of the view when it is hidden behind other views. By default the view doesnot update when it is hidden, which might cause loss of trace data.
Show Next MatchMoves the focus of the navigation chart and disassembly trace to the next matching occurrencefor the selected function or instruction.
Show Previous MatchMoves the focus of the navigation chart and disassembly trace to the previous matchingoccurrence for the selected function or instruction.
Don’t mark other occurrences - click to start markingMark other occurrences - click to stop marking
When function trace is selected, marks all occurrences of the selected function with a shadedhighlight. This is disabled when instruction trace is selected.
Clear TraceClears the raw trace data that is currently contained in the trace buffer and the trace view.
Showing instruction trace - click to switch to functionsShowing function trace - click to switch to instructions
Toggles the disassembly trace between instructions and functions.Export Trace Report
Displays the Export Trace Report dialog box to save the trace data to a file.Home
Where enabled, moves the trace view to the beginning of the trace buffer. Changes might not bevisible if the trace buffer is too small.
Page BackWhere enabled, moves the trace view back one page. You can change the page size bymodifying the Set Maximum Instruction Depth setting.
Page ForwardWhere enabled, moves the trace view forward one page. You can change the page size bymodifying the Set Maximum Instruction Depth setting.
EndWhere enabled, moves the trace view to the end of the trace buffer. Changes might not be visibleif the trace buffer is too small.
Switch between navigation resolutionsChanges the timeline resolution in the navigation chart.
Switch between alternate viewsChanges the view to display the navigation chart, disassembly trace or both.
11 DS-5 Debug Perspectives and Views11.26 Trace view
ARM DUI0446Z Copyright © 2010-2016 ARM Limited or its affiliates. All rightsreserved.
11-332
Non-Confidential
Focus HereAt the top of the list, displays the function being executed in the selected time slot. Theremaining functions are listed in the order in which they are executed after the selected point intime. Any functions that do not appear after that point in time are placed at the bottom andordered by total time.
Order By Total TimeDisplays the functions ordered by the total time spent within the function. This is the defaultordering.
View MenuThe following View Menu options are available:
New Trace ViewDisplays a new instance of the Trace view.
Set Trace Page Size...Displays a dialog box in which you can enter the maximum number of instructions todisplay in the disassembly trace. The number must be within the range of 1,000 to1,000,000 instructions.
Find Trace Trigger EventEnables you to search for trigger events in the trace capture buffer.
Find Timestamp...Displays a dialog box in which you can enter either a numeric timestamp as a 64 bitvalue or in the h:m:s format.
Find Function...Enables you to search for a function by name in the trace buffer.
Find Instruction by Address...Enables you to search for an instruction by address in the trace buffer.
Find ETM data access in trace buffer...Enables you to search for a data value or range of values in the trace buffer.
Find Instruction Index...Enables you to search for an instruction by index. A positive index is relative to thestart of the trace buffer and a negative index is relative to the end.
DTSL Options...Displays a dialog box in which you can add, edit, or choose a DTSL configuration.
Note
This clears the trace buffer.
Open Trace Control ViewOpens the Trace Control View.
RefreshDiscards all the data in the view and rereads it from the current trace buffer.
Freeze DataToggles the freezing of data in the current view.
Trace Filter Settings...Displays a dialog box in which you can select the trace record types that you want tosee in the Trace view.
Related tasks8.5 Capturing trace data using the command-line debugger on page 8-213.
Related referencesChapter 11 DS-5 Debug Perspectives and Views on page 11-261.
11 DS-5 Debug Perspectives and Views11.26 Trace view
ARM DUI0446Z Copyright © 2010-2016 ARM Limited or its affiliates. All rightsreserved.
11-333
Non-Confidential
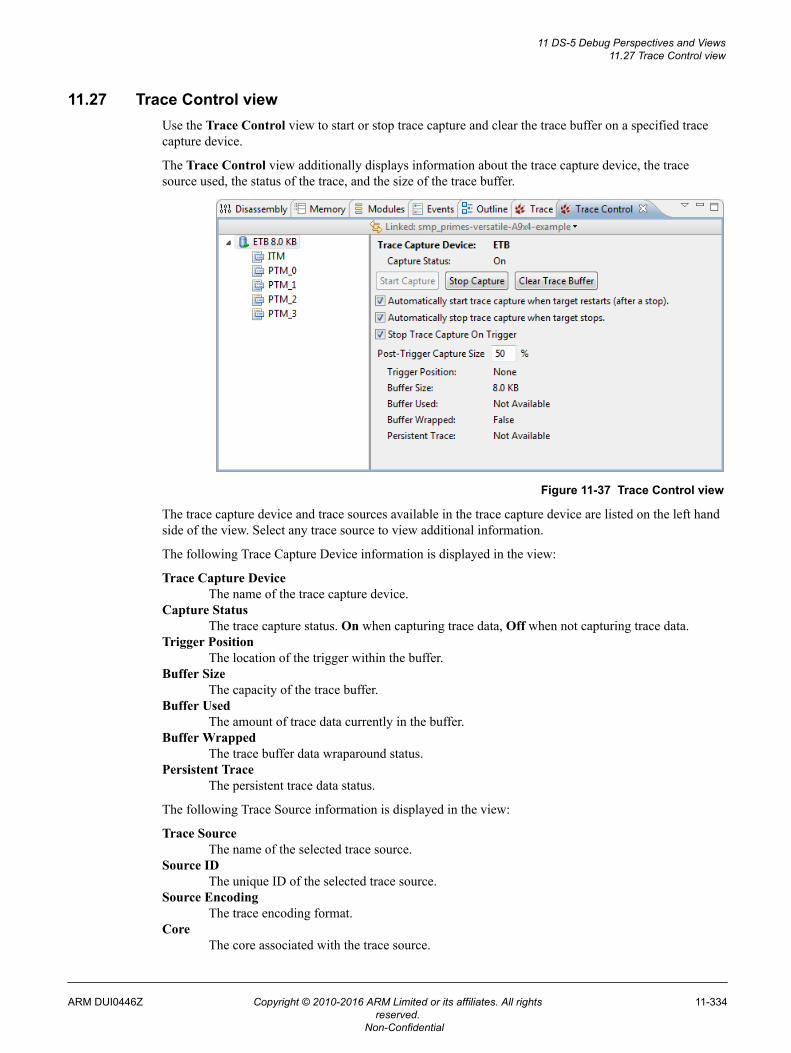
11.27 Trace Control viewUse the Trace Control view to start or stop trace capture and clear the trace buffer on a specified tracecapture device.
The Trace Control view additionally displays information about the trace capture device, the tracesource used, the status of the trace, and the size of the trace buffer.
Figure 11-37 Trace Control view
The trace capture device and trace sources available in the trace capture device are listed on the left handside of the view. Select any trace source to view additional information.
The following Trace Capture Device information is displayed in the view:
Trace Capture DeviceThe name of the trace capture device.
Capture StatusThe trace capture status. On when capturing trace data, Off when not capturing trace data.
Trigger PositionThe location of the trigger within the buffer.
Buffer SizeThe capacity of the trace buffer.
Buffer UsedThe amount of trace data currently in the buffer.
Buffer WrappedThe trace buffer data wraparound status.
Persistent TraceThe persistent trace data status.
The following Trace Source information is displayed in the view:
Trace SourceThe name of the selected trace source.
Source IDThe unique ID of the selected trace source.
Source EncodingThe trace encoding format.
CoreThe core associated with the trace source.
11 DS-5 Debug Perspectives and Views11.27 Trace Control view
ARM DUI0446Z Copyright © 2010-2016 ARM Limited or its affiliates. All rightsreserved.
11-334
Non-Confidential
Context IDsThe tracing context IDs availability status.
Cycle Accurate TraceThe cycle accurate trace support status.
Virtualization ExtensionsThe virtualization extensions availability status.
TimestampsTimestamp availability status for the trace.
Timestamp OriginWhether a timestamp origin for the trace is set or cleared. When set, timestamps are displayed asoffsets from the origin.
Trace TriggersTrace triggers support status.
Trace Start PointsTrace start points support status.
Trace Stop PointsTrace stop points support status.
Trace RangesTrace ranges support status.
Note
The information displayed varies depending on the trace source.
Trace Control view optionsStart Capture
Click Start Capture to start trace capture on the trace capture device. This is the same as thetrace start command.
Stop CaptureClick Stop Capture to stop trace capture on the trace capture device. This is the same as thetrace stop command.
Clear Trace BufferClick Clear Trace Buffer to empty the trace buffer on the trace capture device. This is the sameas the trace clear command.
Start trace capture when target restarts (after a stop)Select this option to automatically start trace capture after a target restarts after a stop.
Stop trace capture when target stopsSelect this option to automatically stop trace capture when a target stops.
Stop trace capture on triggerSelect this option to stop trace capture after a trace capture trigger has been hit.
Post-trigger capture sizeUse this option to control the percentage of the trace buffer that should be reserved for after atrigger point is hit. The range is from 0 to 99.
Note
The trace start and trace stop commands and the automatic start and stop trace options act asmaster switches. Trace triggers cannot override them.
Toolbar and context menu options
The following options are available from the toolbar or context menu:
11 DS-5 Debug Perspectives and Views11.27 Trace Control view
ARM DUI0446Z Copyright © 2010-2016 ARM Limited or its affiliates. All rightsreserved.
11-335
Non-Confidential

Linked: contextLinks this view to the selected connection in the Debug Control view. This is the default.Alternatively you can link the view to a specific connection or processor in a SymmetricMultiProcessing (SMP) connection. If the connection you want is not shown in the drop-downlist, you might have to select it first in the Debug Control view.
Related referencesChapter 11 DS-5 Debug Perspectives and Views on page 11-261.
11 DS-5 Debug Perspectives and Views11.27 Trace Control view
ARM DUI0446Z Copyright © 2010-2016 ARM Limited or its affiliates. All rightsreserved.
11-336
Non-Confidential
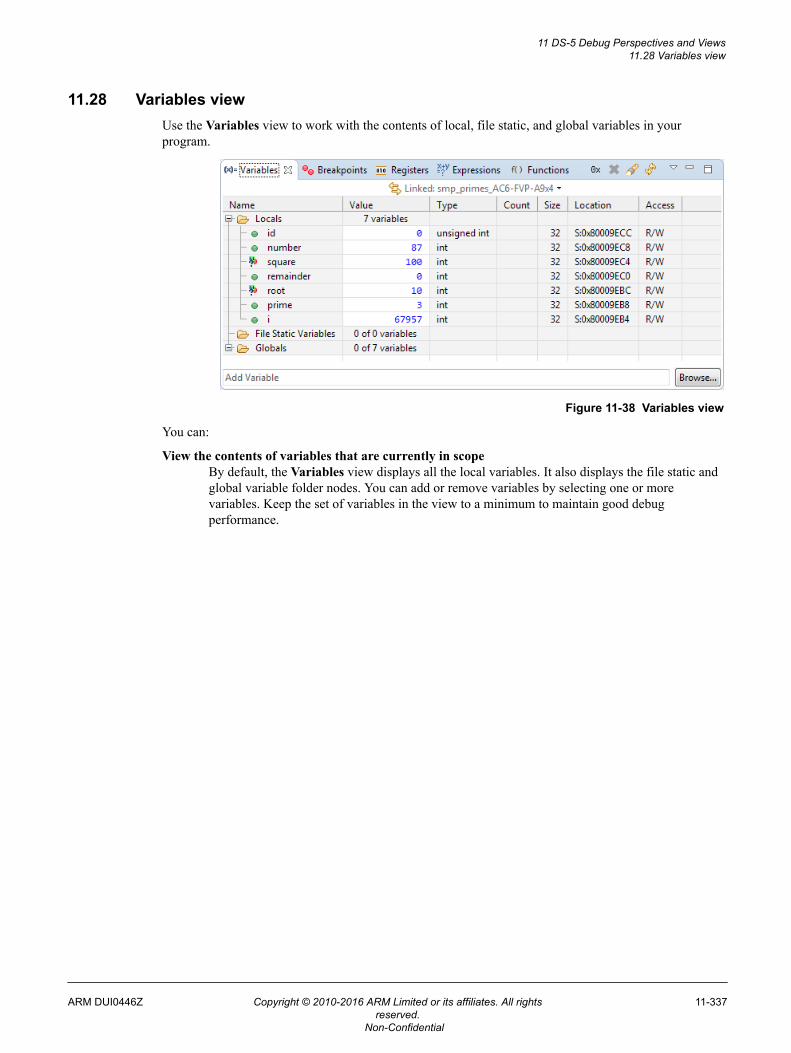
11.28 Variables viewUse the Variables view to work with the contents of local, file static, and global variables in yourprogram.
Figure 11-38 Variables view
You can:
View the contents of variables that are currently in scopeBy default, the Variables view displays all the local variables. It also displays the file static andglobal variable folder nodes. You can add or remove variables by selecting one or morevariables. Keep the set of variables in the view to a minimum to maintain good debugperformance.
11 DS-5 Debug Perspectives and Views11.28 Variables view
ARM DUI0446Z Copyright © 2010-2016 ARM Limited or its affiliates. All rightsreserved.
11-337
Non-Confidential
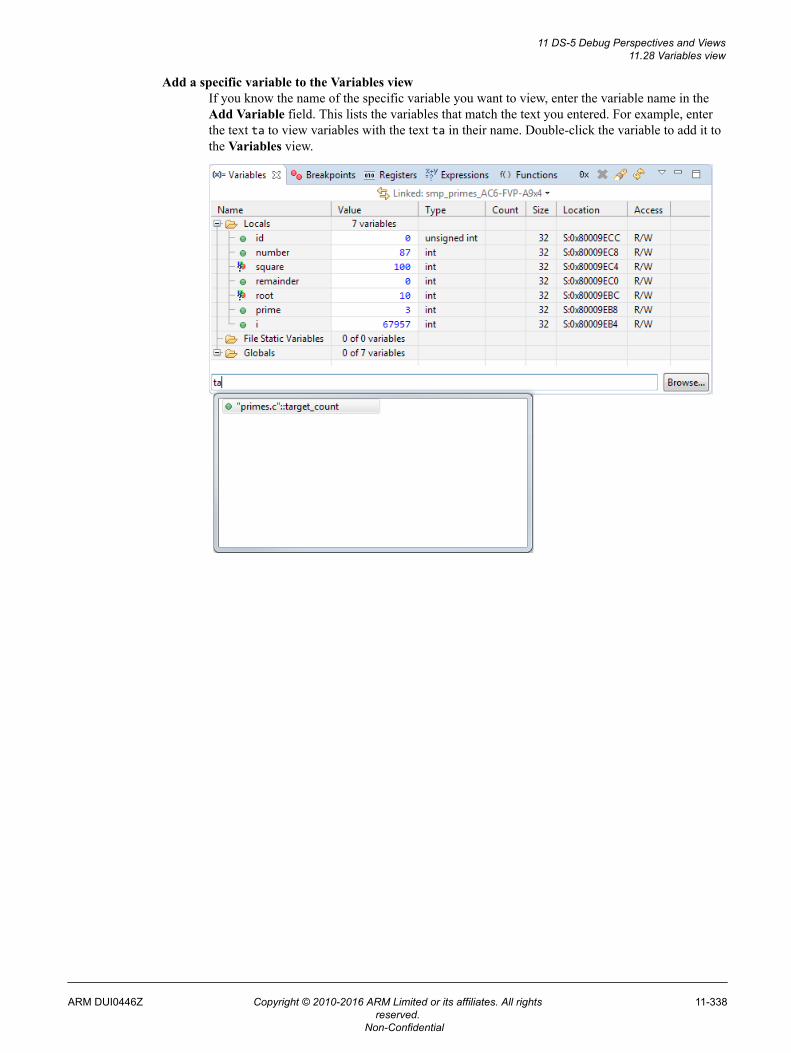
Add a specific variable to the Variables viewIf you know the name of the specific variable you want to view, enter the variable name in theAdd Variable field. This lists the variables that match the text you entered. For example, enterthe text ta to view variables with the text ta in their name. Double-click the variable to add it tothe Variables view.
11 DS-5 Debug Perspectives and Views11.28 Variables view
ARM DUI0446Z Copyright © 2010-2016 ARM Limited or its affiliates. All rightsreserved.
11-338
Non-Confidential
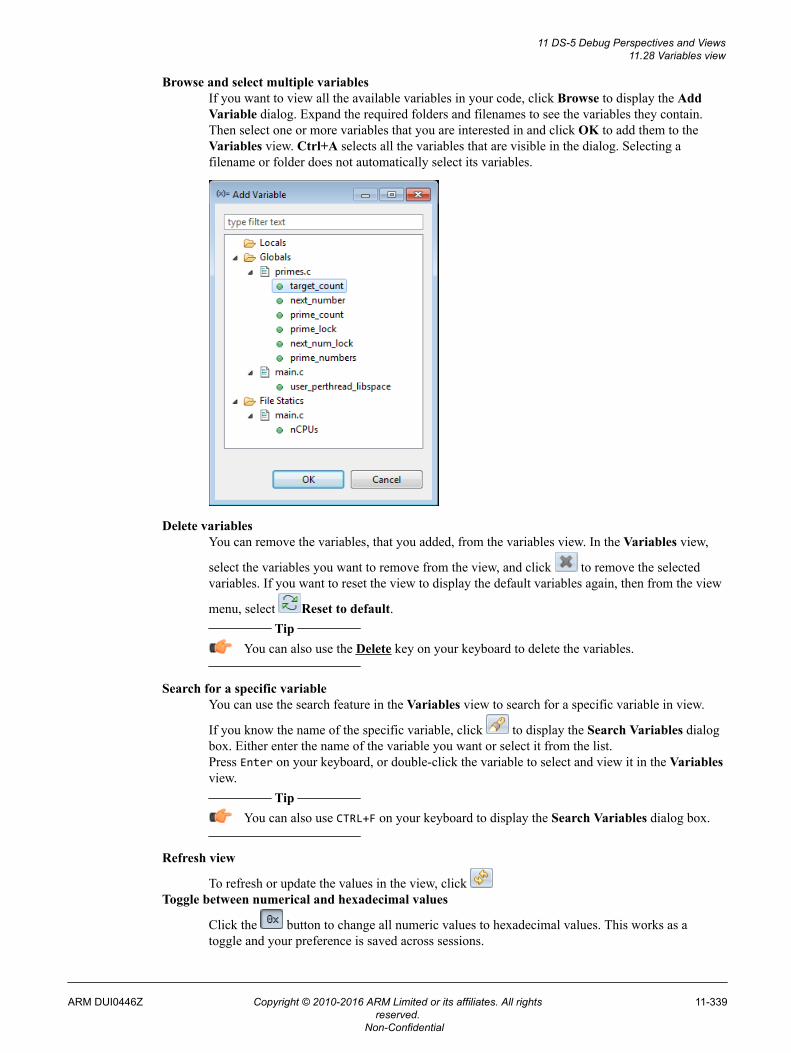
Browse and select multiple variablesIf you want to view all the available variables in your code, click Browse to display the AddVariable dialog. Expand the required folders and filenames to see the variables they contain.Then select one or more variables that you are interested in and click OK to add them to theVariables view. Ctrl+A selects all the variables that are visible in the dialog. Selecting afilename or folder does not automatically select its variables.
Delete variablesYou can remove the variables, that you added, from the variables view. In the Variables view,
select the variables you want to remove from the view, and click to remove the selectedvariables. If you want to reset the view to display the default variables again, then from the view
menu, select Reset to default. Tip
You can also use the Delete key on your keyboard to delete the variables.
Search for a specific variableYou can use the search feature in the Variables view to search for a specific variable in view.
If you know the name of the specific variable, click to display the Search Variables dialogbox. Either enter the name of the variable you want or select it from the list.Press Enter on your keyboard, or double-click the variable to select and view it in the Variablesview.
Tip
You can also use CTRL+F on your keyboard to display the Search Variables dialog box.
Refresh view
To refresh or update the values in the view, click Toggle between numerical and hexadecimal values
Click the button to change all numeric values to hexadecimal values. This works as atoggle and your preference is saved across sessions.
11 DS-5 Debug Perspectives and Views11.28 Variables view
ARM DUI0446Z Copyright © 2010-2016 ARM Limited or its affiliates. All rightsreserved.
11-339
Non-Confidential
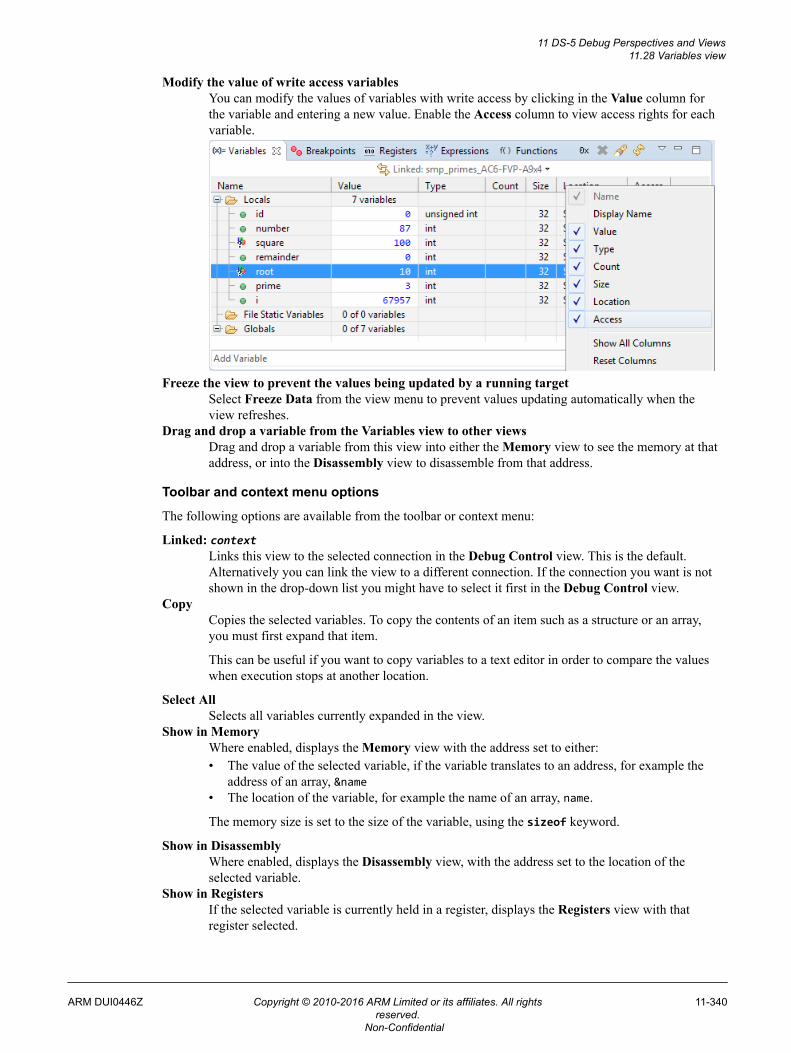
Modify the value of write access variablesYou can modify the values of variables with write access by clicking in the Value column forthe variable and entering a new value. Enable the Access column to view access rights for eachvariable.
Freeze the view to prevent the values being updated by a running targetSelect Freeze Data from the view menu to prevent values updating automatically when theview refreshes.
Drag and drop a variable from the Variables view to other viewsDrag and drop a variable from this view into either the Memory view to see the memory at thataddress, or into the Disassembly view to disassemble from that address.
Toolbar and context menu options
The following options are available from the toolbar or context menu:
Linked: contextLinks this view to the selected connection in the Debug Control view. This is the default.Alternatively you can link the view to a different connection. If the connection you want is notshown in the drop-down list you might have to select it first in the Debug Control view.
CopyCopies the selected variables. To copy the contents of an item such as a structure or an array,you must first expand that item.
This can be useful if you want to copy variables to a text editor in order to compare the valueswhen execution stops at another location.
Select AllSelects all variables currently expanded in the view.
Show in MemoryWhere enabled, displays the Memory view with the address set to either:• The value of the selected variable, if the variable translates to an address, for example the
address of an array, &name• The location of the variable, for example the name of an array, name.
The memory size is set to the size of the variable, using the sizeof keyword.
Show in DisassemblyWhere enabled, displays the Disassembly view, with the address set to the location of theselected variable.
Show in RegistersIf the selected variable is currently held in a register, displays the Registers view with thatregister selected.
11 DS-5 Debug Perspectives and Views11.28 Variables view
ARM DUI0446Z Copyright © 2010-2016 ARM Limited or its affiliates. All rightsreserved.
11-340
Non-Confidential
Show Dereference in MemoryIf the selected variable is a pointer, displays the Memory view with the address set to the valueof the variable.
Show Dereference in DisassemblyIf the selected variable is a pointer, displays the Disassembly view, with the address set to thevalue of the variable.
Translate Variable AddressDisplays the MMU view and translates the address of the variable.
Toggle WatchpointDisplays the Add Watchpoint dialog to set a watchpoint on the selected variable, or removesthe watchpoint if one has been set.
Enable WatchpointEnables the watchpoint, if a watchpoint has been set on the selected variable.
Disable WatchpointDisables the watchpoint, if a watchpoint has been set on the selected variable.
Resolve WatchpointIf a watchpoint has been set on the selected variable, re-evaluates the address of the watchpoint.If the address can be resolved the watchpoint is set, otherwise it remains pending.
Watchpoint PropertiesDisplays the Watchpoint Properties dialog box. This enables you to control watchpointactivation.
Send to <selection>Enables you to add variable filters to an Expressions view. Displays a sub menu that enablesyou to specify an Expressions view.
<Format list>A list of formats you can use for the variable value.
View MenuThe following View Menu options are available:
New Variables ViewDisplays a new instance of the Variables view.
Update View When HiddenEnables the updating of the view when it is hidden behind other views. By default, thisview does not update when hidden.
Reset to default variablesResets the view to show only the default variables.
Freeze DataToggles the freezing of data in the current view. You cannot modify the value of avariable if the data is frozen. This option also disables or enables the Refresh option.
If you freeze the data before you expand an item for the first time, for example an array,the view might show Pending.... Unfreeze the data to expand the item.
Editing context menu optionsThe following options are available on the context menu when you select a variable value forediting:
UndoReverts the last change you made to the selected value.
CutCopies and deletes the selected value.
CopyCopies the selected value.
PastePastes a value that you have previously cut or copied into the selected variable value.
DeleteDeletes the selected value.
11 DS-5 Debug Perspectives and Views11.28 Variables view
ARM DUI0446Z Copyright © 2010-2016 ARM Limited or its affiliates. All rightsreserved.
11-341
Non-Confidential
Select AllSelects the value.
Adding a new column header
Right-click on the column headers to select the columns that you want to display:
NameThe name of the variable.
ValueThe value of the variable.Read-only values are displayed with a grey background. A value that you can edit is initiallyshown with a white background. A yellow background indicates that the value has changed.This might result from you either performing a debug action such as stepping or by you editingthe value directly.
Note
If you freeze the view, then you cannot change a value.
TypeThe type of the variable.
CountThe number of array or pointer elements.
SizeThe size of the variable in bits.
LocationThe address of the variable.
AccessThe access mode for the variable.
Show All ColumnsDisplays all columns.
Reset ColumnsResets the columns displayed and their widths to the default.
Related concepts6.8 About debugging multi-threaded applications on page 6-152.6.9 About debugging shared libraries on page 6-153.6.10.2 About debugging a Linux kernel on page 6-156.6.10.3 About debugging Linux kernel modules on page 6-158.6.11 About debugging TrustZone enabled targets on page 6-160.
Related references3.13 Setting a tracepoint on page 3-89.3.8 Conditional breakpoints on page 3-81.3.9 Assigning conditions to an existing breakpoint on page 3-82.3.12 Pending breakpoints and watchpoints on page 3-87.Chapter 11 DS-5 Debug Perspectives and Views on page 11-261.
11 DS-5 Debug Perspectives and Views11.28 Variables view
ARM DUI0446Z Copyright © 2010-2016 ARM Limited or its affiliates. All rightsreserved.
11-342
Non-Confidential
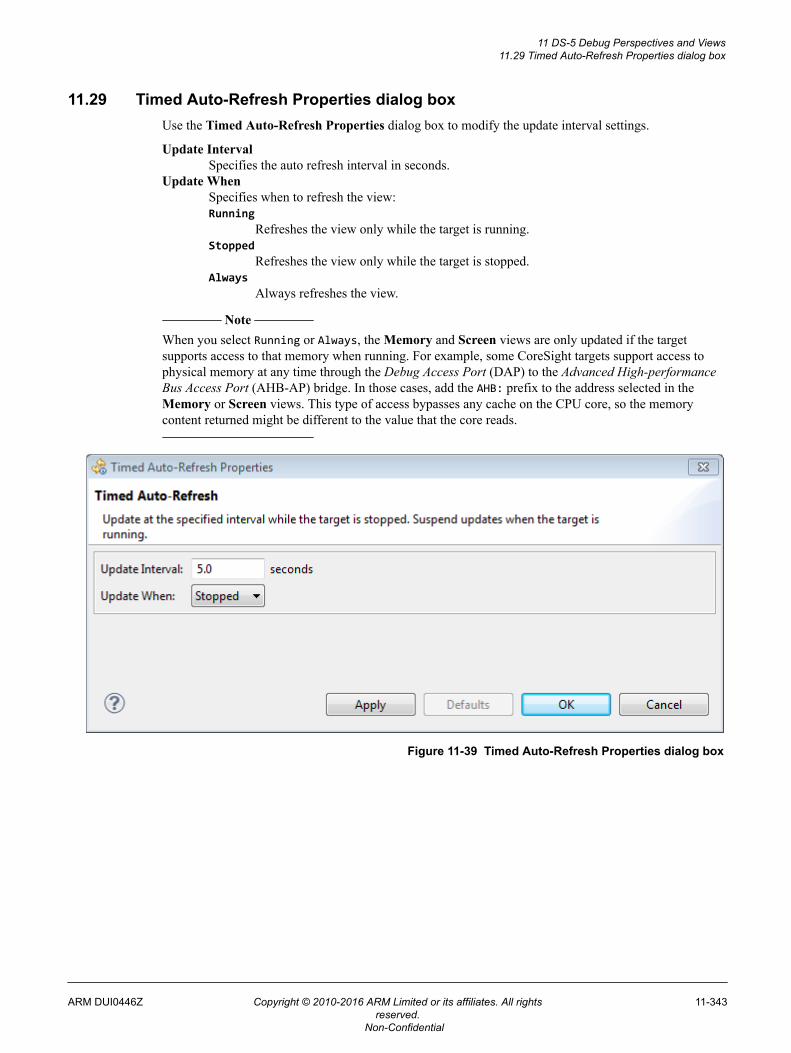
11.29 Timed Auto-Refresh Properties dialog boxUse the Timed Auto-Refresh Properties dialog box to modify the update interval settings.
Update IntervalSpecifies the auto refresh interval in seconds.
Update WhenSpecifies when to refresh the view:Running
Refreshes the view only while the target is running.Stopped
Refreshes the view only while the target is stopped.Always
Always refreshes the view.
Note
When you select Running or Always, the Memory and Screen views are only updated if the targetsupports access to that memory when running. For example, some CoreSight targets support access tophysical memory at any time through the Debug Access Port (DAP) to the Advanced High-performanceBus Access Port (AHB-AP) bridge. In those cases, add the AHB: prefix to the address selected in theMemory or Screen views. This type of access bypasses any cache on the CPU core, so the memorycontent returned might be different to the value that the core reads.
Figure 11-39 Timed Auto-Refresh Properties dialog box
11 DS-5 Debug Perspectives and Views11.29 Timed Auto-Refresh Properties dialog box
ARM DUI0446Z Copyright © 2010-2016 ARM Limited or its affiliates. All rightsreserved.
11-343
Non-Confidential
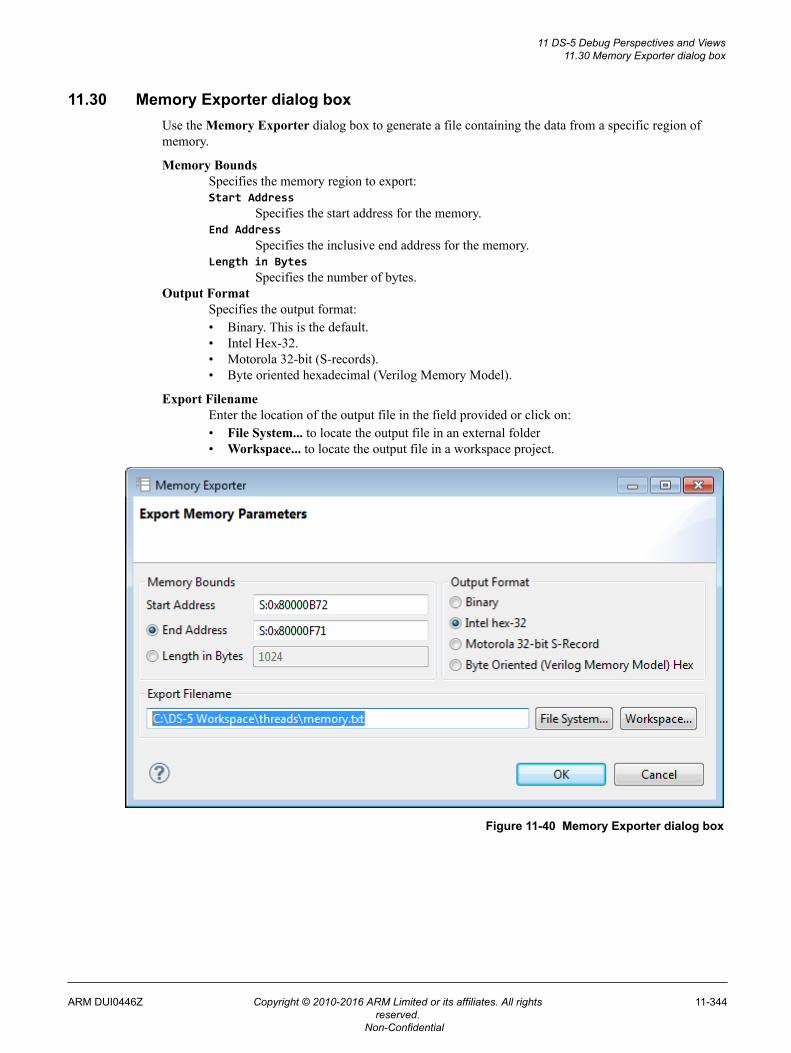
11.30 Memory Exporter dialog boxUse the Memory Exporter dialog box to generate a file containing the data from a specific region ofmemory.
Memory BoundsSpecifies the memory region to export:Start Address
Specifies the start address for the memory.End Address
Specifies the inclusive end address for the memory.Length in Bytes
Specifies the number of bytes.Output Format
Specifies the output format:• Binary. This is the default.• Intel Hex-32.• Motorola 32-bit (S-records).• Byte oriented hexadecimal (Verilog Memory Model).
Export FilenameEnter the location of the output file in the field provided or click on:• File System... to locate the output file in an external folder• Workspace... to locate the output file in a workspace project.
Figure 11-40 Memory Exporter dialog box
11 DS-5 Debug Perspectives and Views11.30 Memory Exporter dialog box
ARM DUI0446Z Copyright © 2010-2016 ARM Limited or its affiliates. All rightsreserved.
11-344
Non-Confidential
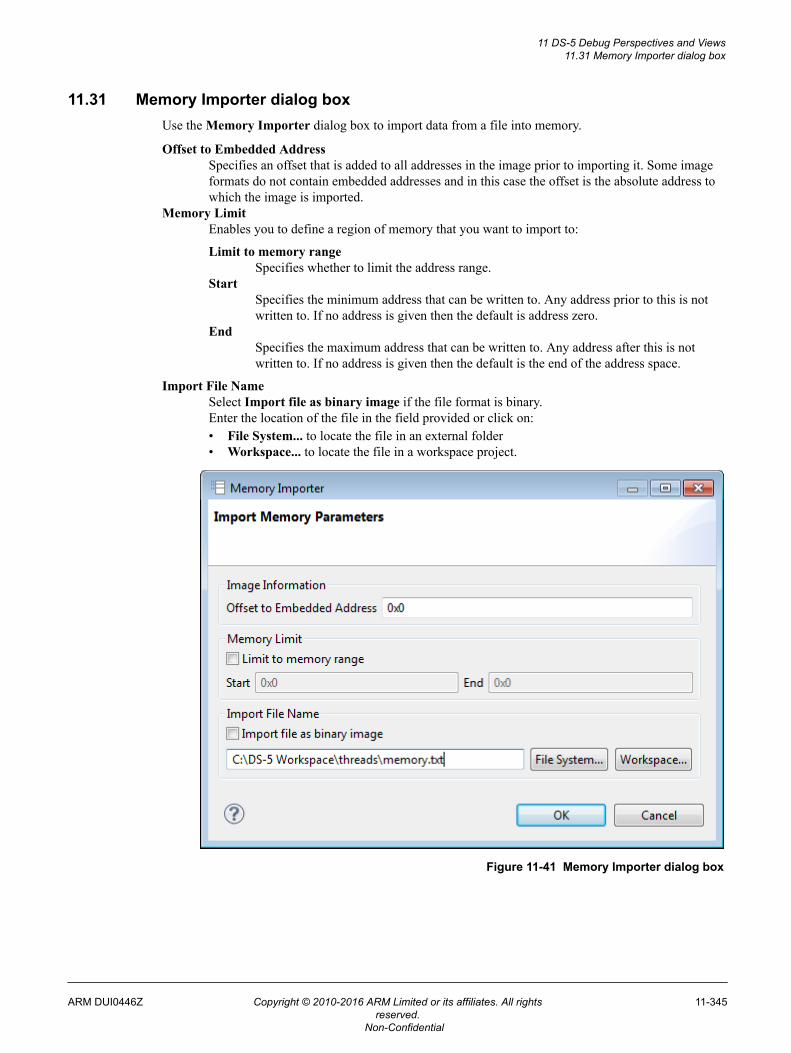
11.31 Memory Importer dialog boxUse the Memory Importer dialog box to import data from a file into memory.
Offset to Embedded AddressSpecifies an offset that is added to all addresses in the image prior to importing it. Some imageformats do not contain embedded addresses and in this case the offset is the absolute address towhich the image is imported.
Memory LimitEnables you to define a region of memory that you want to import to:
Limit to memory rangeSpecifies whether to limit the address range.
StartSpecifies the minimum address that can be written to. Any address prior to this is notwritten to. If no address is given then the default is address zero.
EndSpecifies the maximum address that can be written to. Any address after this is notwritten to. If no address is given then the default is the end of the address space.
Import File NameSelect Import file as binary image if the file format is binary.Enter the location of the file in the field provided or click on:• File System... to locate the file in an external folder• Workspace... to locate the file in a workspace project.
Figure 11-41 Memory Importer dialog box
11 DS-5 Debug Perspectives and Views11.31 Memory Importer dialog box
ARM DUI0446Z Copyright © 2010-2016 ARM Limited or its affiliates. All rightsreserved.
11-345
Non-Confidential
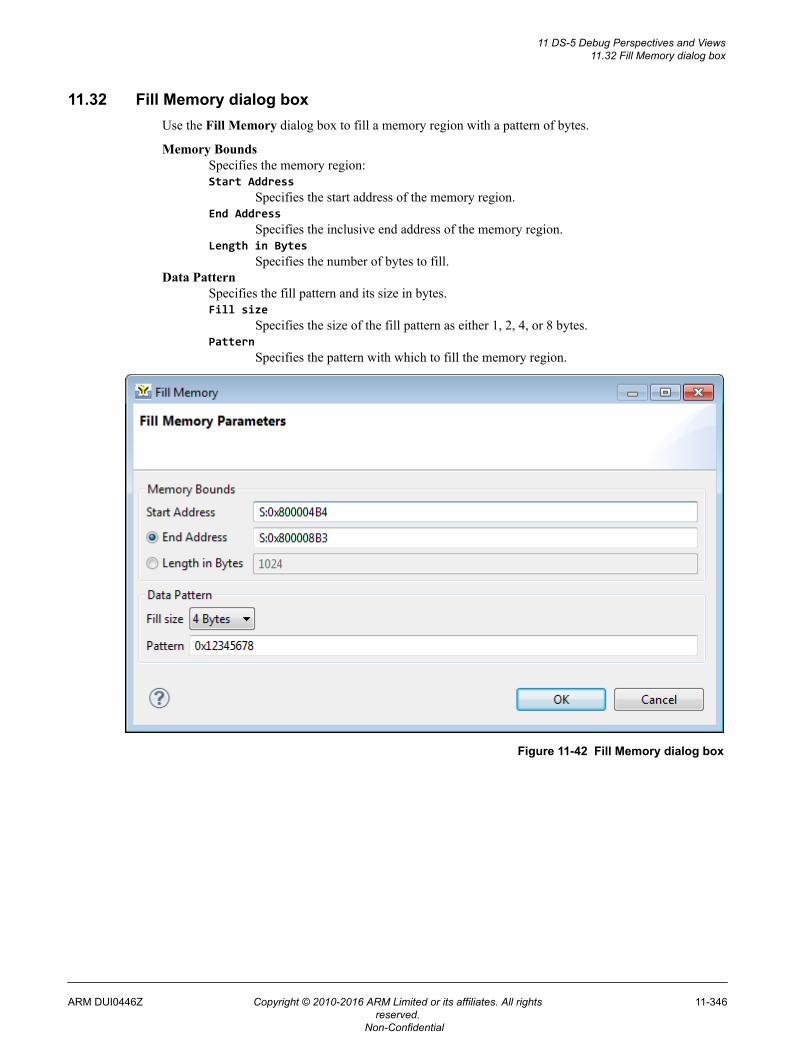
11.32 Fill Memory dialog boxUse the Fill Memory dialog box to fill a memory region with a pattern of bytes.
Memory BoundsSpecifies the memory region:Start Address
Specifies the start address of the memory region.End Address
Specifies the inclusive end address of the memory region.Length in Bytes
Specifies the number of bytes to fill.Data Pattern
Specifies the fill pattern and its size in bytes.Fill size
Specifies the size of the fill pattern as either 1, 2, 4, or 8 bytes.Pattern
Specifies the pattern with which to fill the memory region.
Figure 11-42 Fill Memory dialog box
11 DS-5 Debug Perspectives and Views11.32 Fill Memory dialog box
ARM DUI0446Z Copyright © 2010-2016 ARM Limited or its affiliates. All rightsreserved.
11-346
Non-Confidential
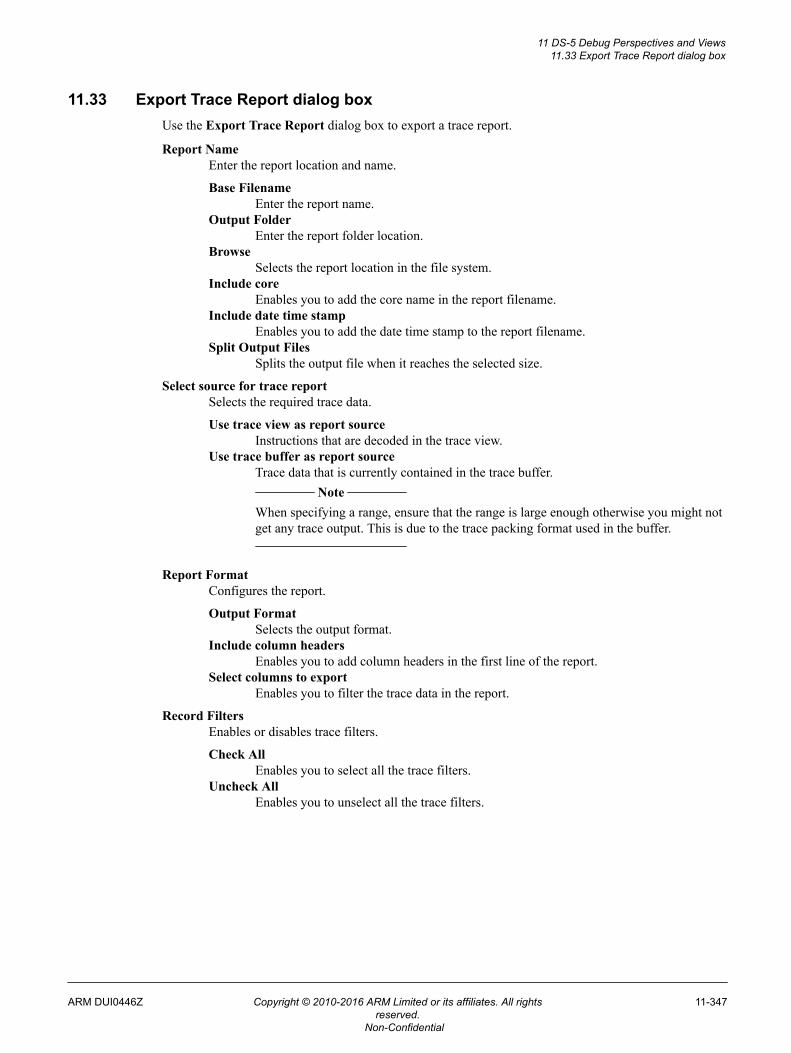
11.33 Export Trace Report dialog boxUse the Export Trace Report dialog box to export a trace report.
Report NameEnter the report location and name.
Base FilenameEnter the report name.
Output FolderEnter the report folder location.
BrowseSelects the report location in the file system.
Include coreEnables you to add the core name in the report filename.
Include date time stampEnables you to add the date time stamp to the report filename.
Split Output FilesSplits the output file when it reaches the selected size.
Select source for trace reportSelects the required trace data.
Use trace view as report sourceInstructions that are decoded in the trace view.
Use trace buffer as report sourceTrace data that is currently contained in the trace buffer.
Note
When specifying a range, ensure that the range is large enough otherwise you might notget any trace output. This is due to the trace packing format used in the buffer.
Report FormatConfigures the report.
Output FormatSelects the output format.
Include column headersEnables you to add column headers in the first line of the report.
Select columns to exportEnables you to filter the trace data in the report.
Record FiltersEnables or disables trace filters.
Check AllEnables you to select all the trace filters.
Uncheck AllEnables you to unselect all the trace filters.
11 DS-5 Debug Perspectives and Views11.33 Export Trace Report dialog box
ARM DUI0446Z Copyright © 2010-2016 ARM Limited or its affiliates. All rightsreserved.
11-347
Non-Confidential
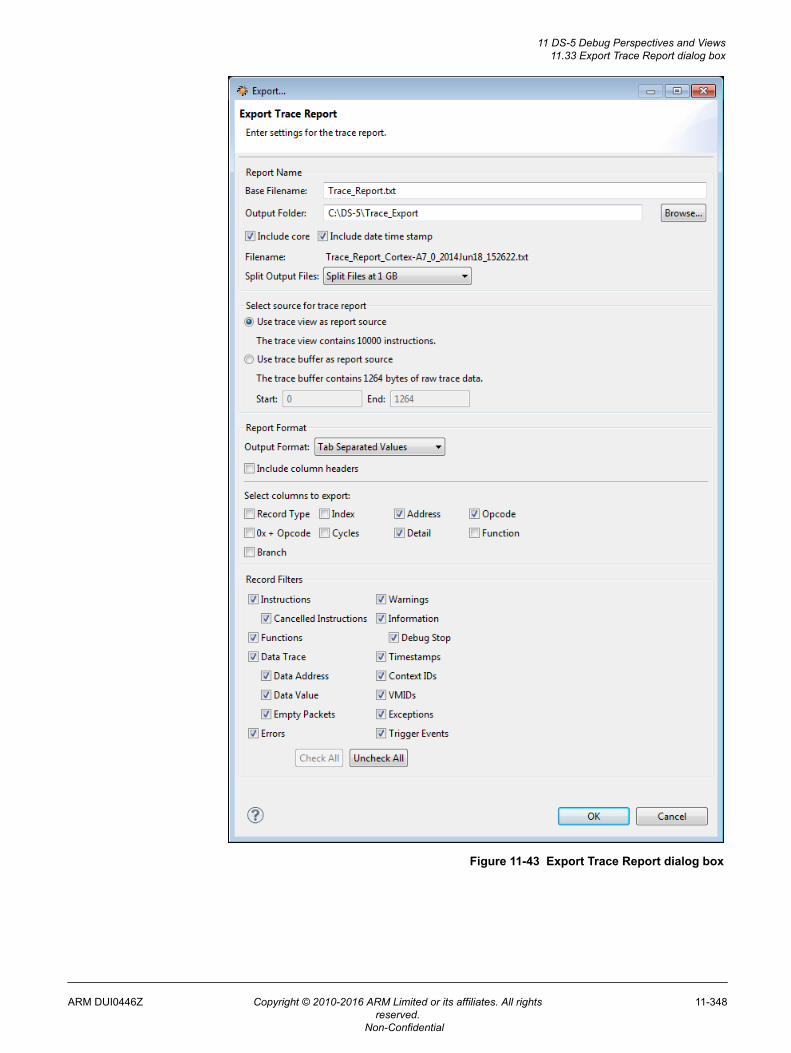
Figure 11-43 Export Trace Report dialog box
11 DS-5 Debug Perspectives and Views11.33 Export Trace Report dialog box
ARM DUI0446Z Copyright © 2010-2016 ARM Limited or its affiliates. All rightsreserved.
11-348
Non-Confidential
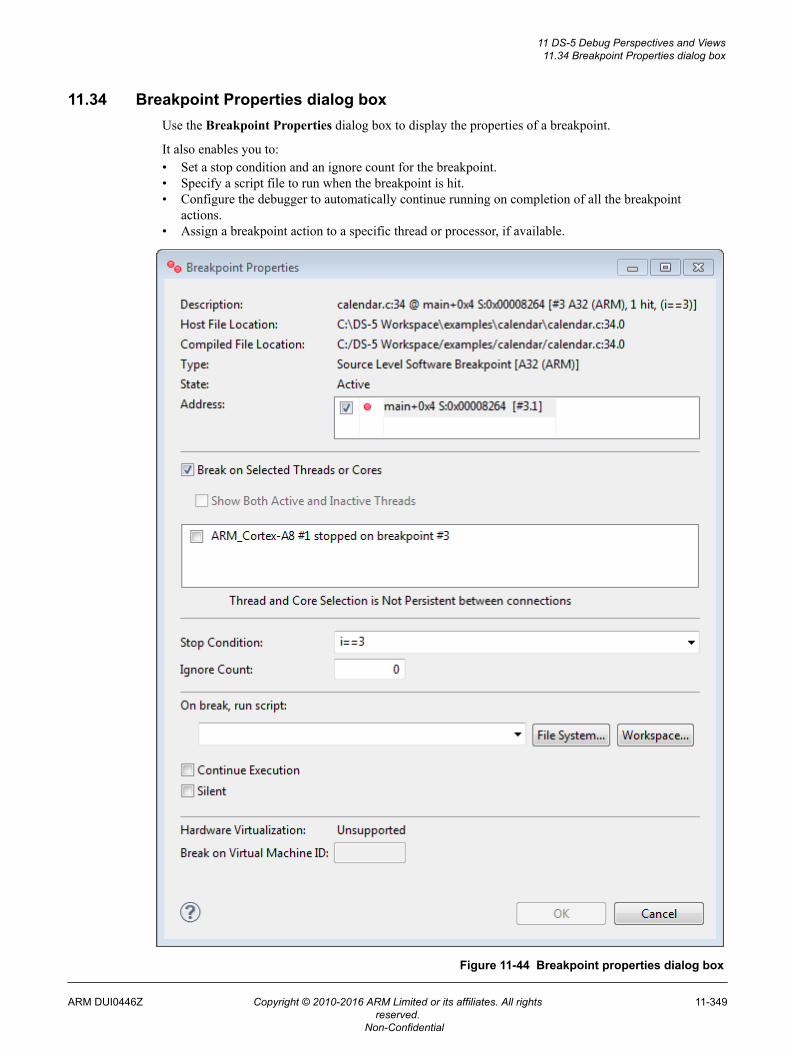
11.34 Breakpoint Properties dialog boxUse the Breakpoint Properties dialog box to display the properties of a breakpoint.
It also enables you to:• Set a stop condition and an ignore count for the breakpoint.• Specify a script file to run when the breakpoint is hit.• Configure the debugger to automatically continue running on completion of all the breakpoint
actions.• Assign a breakpoint action to a specific thread or processor, if available.
Figure 11-44 Breakpoint properties dialog box
11 DS-5 Debug Perspectives and Views11.34 Breakpoint Properties dialog box
ARM DUI0446Z Copyright © 2010-2016 ARM Limited or its affiliates. All rightsreserved.
11-349
Non-Confidential
Breakpoint information
The breakpoint information shows the basic properties of a breakpoint. It comprises:
Description• If the source file is available, the file name and line number in the file where the breakpoint
is set, for example calendar.c:34.• The name of the function in which the breakpoint is set and the number of bytes from the
start of the function. For example, main+0x4 shows that the breakpoint is 4 bytes from thestart of the main() function.
• The address at which the breakpoint is set.• A breakpoint ID number, #N. In some cases, such as in a for loop, a breakpoint might
comprise a number of sub-breakpoints. These are identified as N.n, where N is the number ofthe parent.
• The instruction set at the breakpoint, A32 (ARM) or T32 (Thumb).• An ignore count, if set. The display format is:
ignore = num/count
num equals count initially, and decrements on each pass until it reaches zero.
count is the value you have specified for the ignore count.• A hits count that increments each time the breakpoint is hit. This is not displayed until the
first hit. If you set an ignore count, hits count does not start incrementing until the ignorecount reaches zero.
• The stop condition you have specified, for example i==3.
Host File LocationThe location of the image on the host machine.
Compiled File LocationThe path that the image was compiled with. This can be relative or absolute. This location mightbe different from the host file location if you compile and debug the image on differentmachines.
TypeThis shows:• Whether or not the source file is available for the code at the breakpoint address, Source
Level if available or Address Level if not available.• If the breakpoint is on code in a shared object, Auto indicates that the breakpoint is
automatically set when that shared object is loaded.• If the breakpoint is Active, the type of the breakpoint, either Software Breakpoint or
Hardware Breakpoint.• The instruction set of the instruction at the address of the breakpoint, A32 (ARM) or T32
(Thumb).
StateIndicates one of the following:
ActiveThe image or shared object containing the address of the breakpoint is loaded, and thebreakpoint is set.
DisabledThe breakpoint is disabled.
No ConnectionThe breakpoint is in an application that is not connected to a target.
PendingThe image or shared object containing the address of the breakpoint has not yet beenloaded. The breakpoint becomes active when the image or shared object is loaded.
11 DS-5 Debug Perspectives and Views11.34 Breakpoint Properties dialog box
ARM DUI0446Z Copyright © 2010-2016 ARM Limited or its affiliates. All rightsreserved.
11-350
Non-Confidential
AddressA dialog box that displays one or more breakpoint or sub-breakpoint addresses. You can use thecheck boxes to enable or disable the breakpoints.
Breakpoint options
The following options are available for you to set:
Break on Selected Threads or CoresSelect this option if you want to set a breakpoint for a specific thread or processor. This option isdisabled if none are available.
Stop ConditionSpecify a C-style conditional expression for the selected breakpoint. For example, to activate thebreakpoint when the value of x equals 10, specify x==10.
Ignore CountSpecify the number of times the selected breakpoint is ignored before it is activated.
The debugger decrements the count on each pass. When it reaches zero, the breakpoint activates.Each subsequent pass causes the breakpoint to activate.
On break, run scriptSpecify a script file to run when the selected breakpoint is activated.
Note
Take care with the commands you use in a script that is attached to a breakpoint. For example, ifyou use the quit command in a script, the debugger disconnects from the target when thebreakpoint is hit.
Continue ExecutionSelect this option if you want to continue running the target after the breakpoint is activated.
SilentControls the printing of messages for the selected breakpoint in the Commands view.
Hardware VirtualizationIndicates whether Hardware Virtualization is supported.
Break on Virtual Machine IDIf Hardware Virtualization is supported, specify the Virtual Machine ID (VMID) of the guestoperating system to which the breakpoint applies.
11 DS-5 Debug Perspectives and Views11.34 Breakpoint Properties dialog box
ARM DUI0446Z Copyright © 2010-2016 ARM Limited or its affiliates. All rightsreserved.
11-351
Non-Confidential
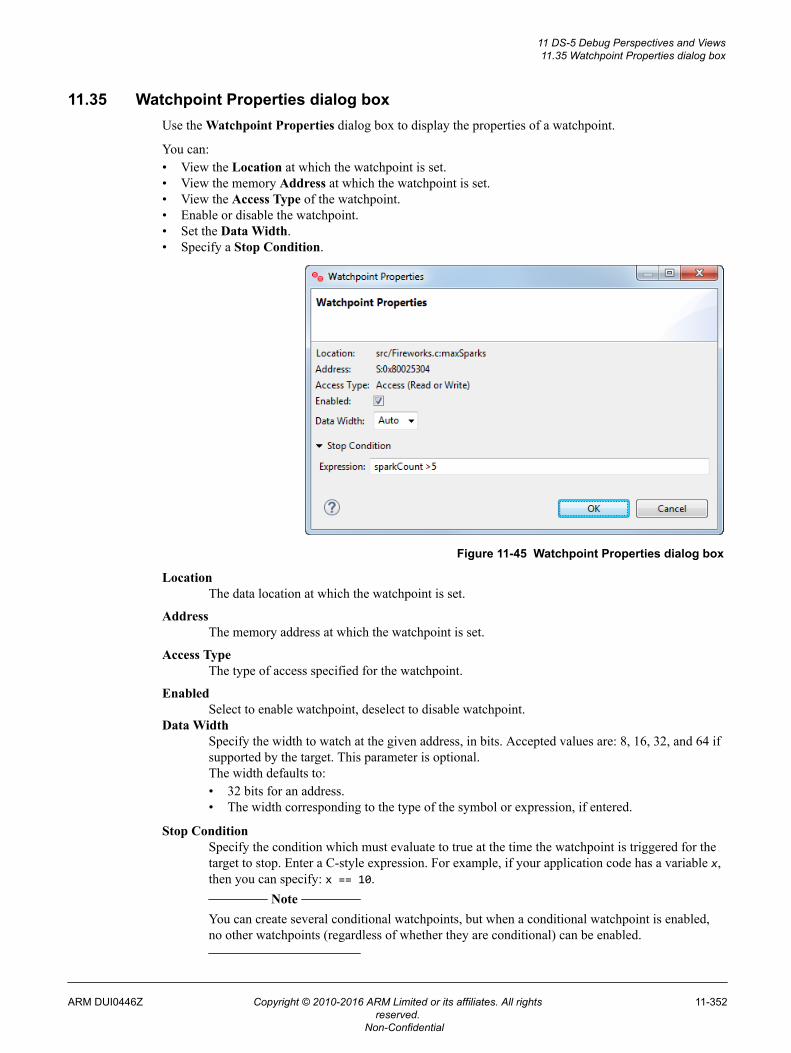
11.35 Watchpoint Properties dialog boxUse the Watchpoint Properties dialog box to display the properties of a watchpoint.
You can:• View the Location at which the watchpoint is set.• View the memory Address at which the watchpoint is set.• View the Access Type of the watchpoint.• Enable or disable the watchpoint.• Set the Data Width.• Specify a Stop Condition.
Figure 11-45 Watchpoint Properties dialog box
LocationThe data location at which the watchpoint is set.
AddressThe memory address at which the watchpoint is set.
Access TypeThe type of access specified for the watchpoint.
EnabledSelect to enable watchpoint, deselect to disable watchpoint.
Data WidthSpecify the width to watch at the given address, in bits. Accepted values are: 8, 16, 32, and 64 ifsupported by the target. This parameter is optional.The width defaults to:• 32 bits for an address.• The width corresponding to the type of the symbol or expression, if entered.
Stop ConditionSpecify the condition which must evaluate to true at the time the watchpoint is triggered for thetarget to stop. Enter a C-style expression. For example, if your application code has a variable x,then you can specify: x == 10.
Note
You can create several conditional watchpoints, but when a conditional watchpoint is enabled,no other watchpoints (regardless of whether they are conditional) can be enabled.
11 DS-5 Debug Perspectives and Views11.35 Watchpoint Properties dialog box
ARM DUI0446Z Copyright © 2010-2016 ARM Limited or its affiliates. All rightsreserved.
11-352
Non-Confidential
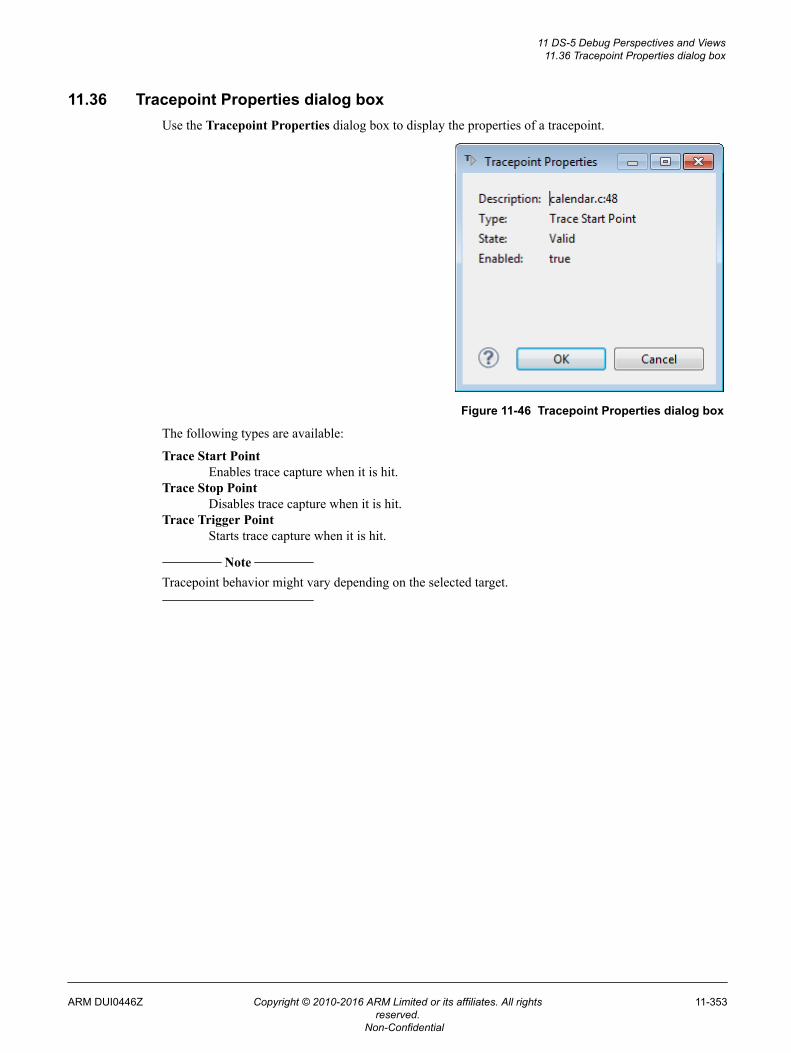
11.36 Tracepoint Properties dialog boxUse the Tracepoint Properties dialog box to display the properties of a tracepoint.
Figure 11-46 Tracepoint Properties dialog box
The following types are available:
Trace Start PointEnables trace capture when it is hit.
Trace Stop PointDisables trace capture when it is hit.
Trace Trigger PointStarts trace capture when it is hit.
Note
Tracepoint behavior might vary depending on the selected target.
11 DS-5 Debug Perspectives and Views11.36 Tracepoint Properties dialog box
ARM DUI0446Z Copyright © 2010-2016 ARM Limited or its affiliates. All rightsreserved.
11-353
Non-Confidential
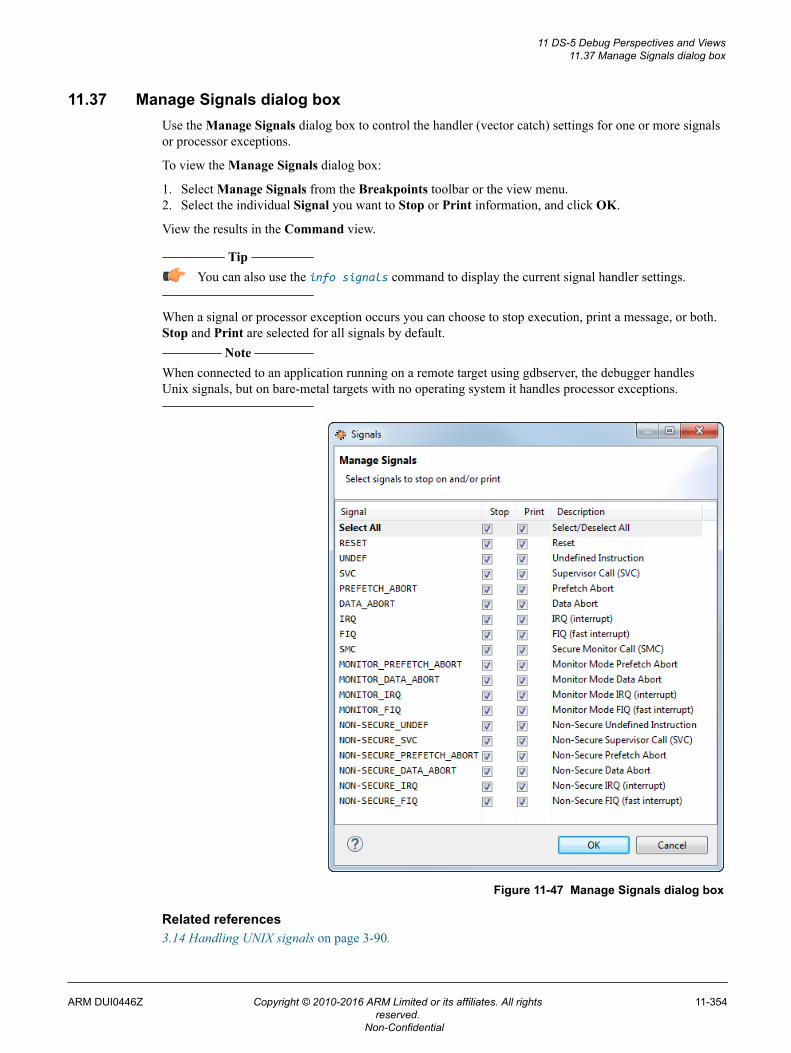
11.37 Manage Signals dialog boxUse the Manage Signals dialog box to control the handler (vector catch) settings for one or more signalsor processor exceptions.
To view the Manage Signals dialog box:
1. Select Manage Signals from the Breakpoints toolbar or the view menu.2. Select the individual Signal you want to Stop or Print information, and click OK.
View the results in the Command view.
Tip
You can also use the info signals command to display the current signal handler settings.
When a signal or processor exception occurs you can choose to stop execution, print a message, or both.Stop and Print are selected for all signals by default.
Note
When connected to an application running on a remote target using gdbserver, the debugger handlesUnix signals, but on bare-metal targets with no operating system it handles processor exceptions.
Figure 11-47 Manage Signals dialog box
Related references3.14 Handling UNIX signals on page 3-90.
11 DS-5 Debug Perspectives and Views11.37 Manage Signals dialog box
ARM DUI0446Z Copyright © 2010-2016 ARM Limited or its affiliates. All rightsreserved.
11-354
Non-Confidential

3.15 Handling processor exceptions on page 3-92.11.4 Breakpoints view on page 11-268.
11 DS-5 Debug Perspectives and Views11.37 Manage Signals dialog box
ARM DUI0446Z Copyright © 2010-2016 ARM Limited or its affiliates. All rightsreserved.
11-355
Non-Confidential
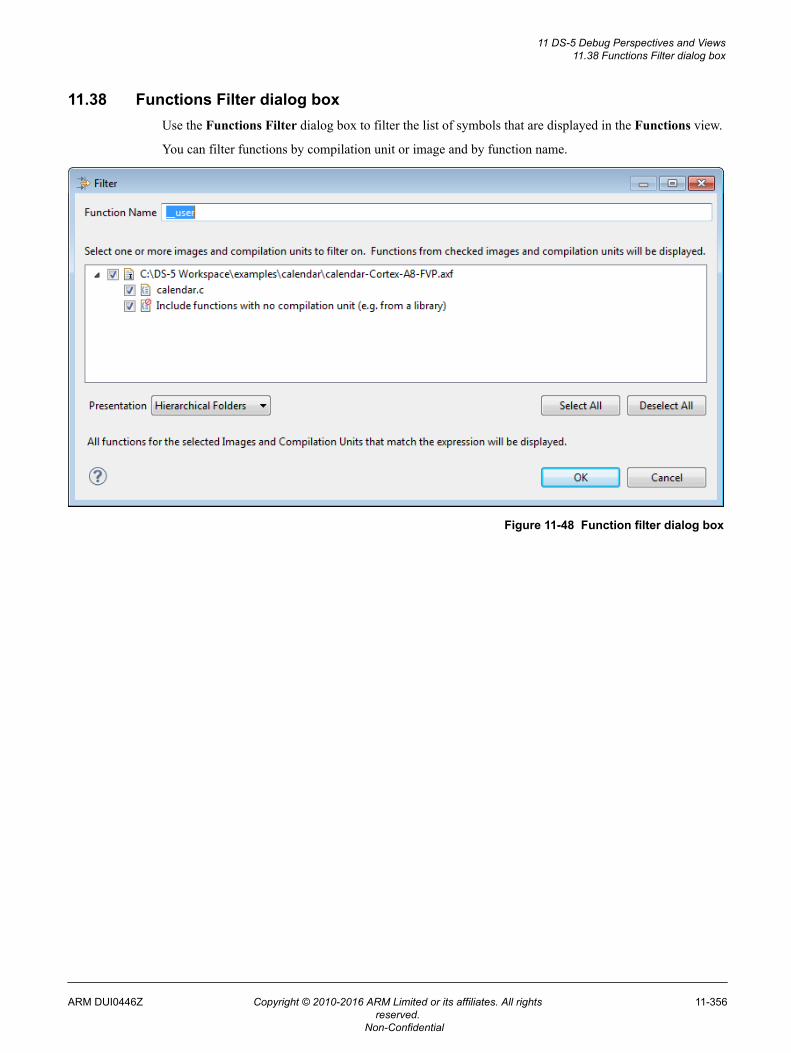
11.38 Functions Filter dialog boxUse the Functions Filter dialog box to filter the list of symbols that are displayed in the Functions view.
You can filter functions by compilation unit or image and by function name.
Figure 11-48 Function filter dialog box
11 DS-5 Debug Perspectives and Views11.38 Functions Filter dialog box
ARM DUI0446Z Copyright © 2010-2016 ARM Limited or its affiliates. All rightsreserved.
11-356
Non-Confidential
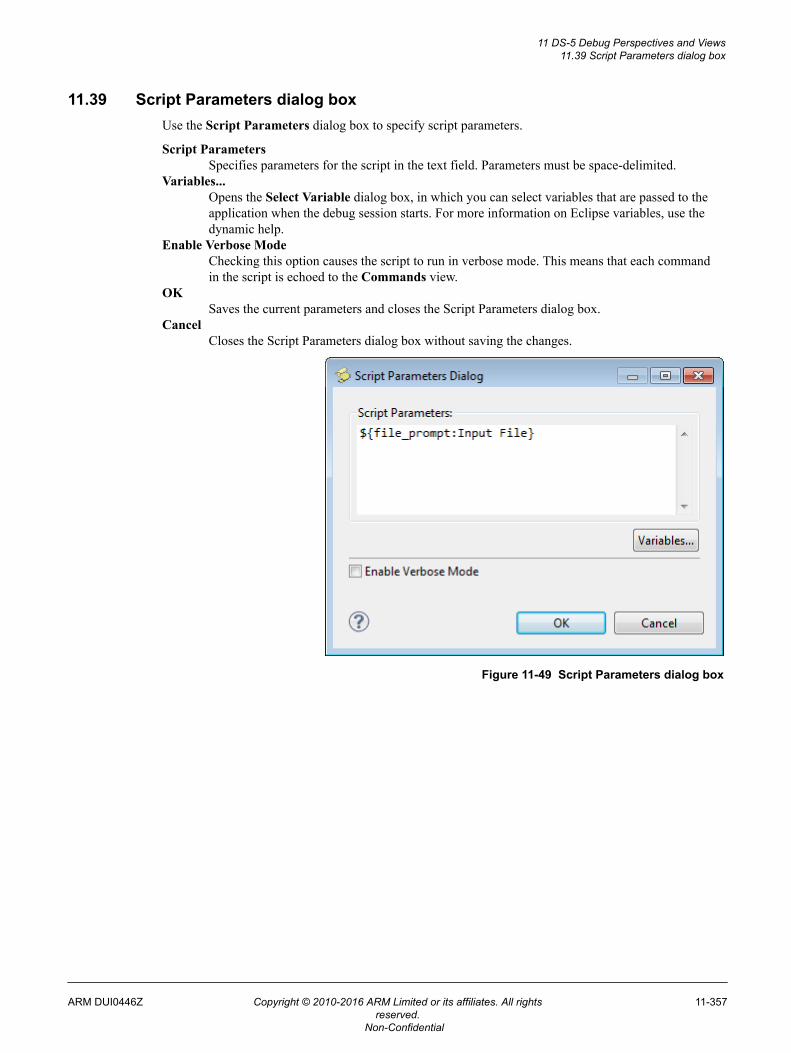
11.39 Script Parameters dialog boxUse the Script Parameters dialog box to specify script parameters.
Script ParametersSpecifies parameters for the script in the text field. Parameters must be space-delimited.
Variables...Opens the Select Variable dialog box, in which you can select variables that are passed to theapplication when the debug session starts. For more information on Eclipse variables, use thedynamic help.
Enable Verbose ModeChecking this option causes the script to run in verbose mode. This means that each commandin the script is echoed to the Commands view.
OKSaves the current parameters and closes the Script Parameters dialog box.
CancelCloses the Script Parameters dialog box without saving the changes.
Figure 11-49 Script Parameters dialog box
11 DS-5 Debug Perspectives and Views11.39 Script Parameters dialog box
ARM DUI0446Z Copyright © 2010-2016 ARM Limited or its affiliates. All rightsreserved.
11-357
Non-Confidential
11.40 Debug Configurations - Connection tabUse the Connection tab in the Debug Configurations dialog box to configure DS-5 Debugger targetconnections. Each configuration you create is associated with a single target processor.
If the development platform has multiple processors, then you must create a separate configuration foreach processor. Be aware that when connecting to multiple targets you cannot perform synchronizationor cross-triggering operations.
Note
Options in the Connection tab are dependent on the type of platform that you select.
Select targetThese options enable you to select the target manufacturer, board, project type, and debugoperation.
DTSL OptionsSelect Edit... to open a dialog box to configure additional debug and trace settings.
ConnectionsThese options enable you to configure the connection between the debugger and the target:
RSE connectionA list of Remote Systems Explorer (RSE) configurations that you have previously setup. Select the required RSE configuration that you want to use for this debugconfiguration. You must select an RSE connection to the target if your Linuxapplication debug operation is:• Download and debug application• Start gdbserver and debug target-resident application.
gdbserver (TCP)Specify the target IP address or name and the associated port number for the connectionbetween the debugger and gdbserver.The following options might also be available, depending on the debug operation youselected:• Select the Use Extended Mode checkbox if you want to restart an application under
debug. Be aware that this might not be fully implemented by gdbserver on alltargets.
• Select the Terminate gdbserver on disconnect checkbox to terminate gdbserverwhen you disconnect from the target.
• Select the Use RSE Host checkbox to connect to gdbserver using the RSEconfigured host.
gdbserver (serial)Specify the local serial port and connection speed for the serial connection between thedebugger and gdbserver.
For model connections, details for gdbserver are obtained automatically from thetarget.
Select the Use Extended Mode checkbox if you want to restart an application underdebug. Be aware that this might not be fully implemented by gdbserver on all targets.
Bare Metal DebugSpecify the target IP address or name of the debug hardware adapter. You can also clickon Browse... to display all the available debug hardware adapters on your local subnetor USB connections.
Model parametersSpecify the parameter for launching the model.
Model parameters (pre-configured to boot ARM Embedded application)
11 DS-5 Debug Perspectives and Views11.40 Debug Configurations - Connection tab
ARM DUI0446Z Copyright © 2010-2016 ARM Limited or its affiliates. All rightsreserved.
11-358
Non-Confidential
These options are only enabled for the pre-configured option that boots an ARM EmbeddedFixed Virtual Platform.
You can configure a Virtual File System (VFS) that enables a model to run an application andrelated shared library files from a directory on the local host. Alternatively, you can disable VFSand manually transfer the files to a directory on the model.
Enable virtual file system supportEnable or disable the use of Virtual File System (VFS).
Host mount pointSpecify the location of the file system on the local host. You can:• Enter the location in the field provided.• Click File System... to locate the directory in an external location from the
workspace.• Click Workspace... to locate the directory within your workspace.
Remote target mount pointDisplays the default location of the file system on the model. The default is the /writeable directory.
ApplySave the current configuration. This does not connect to the target.
RevertUndo any changes and revert to the last saved configuration.
DebugConnect to the target and close the Debug Configurations dialog box.
CloseClose the Debug Configurations dialog box.
11 DS-5 Debug Perspectives and Views11.40 Debug Configurations - Connection tab
ARM DUI0446Z Copyright © 2010-2016 ARM Limited or its affiliates. All rightsreserved.
11-359
Non-Confidential
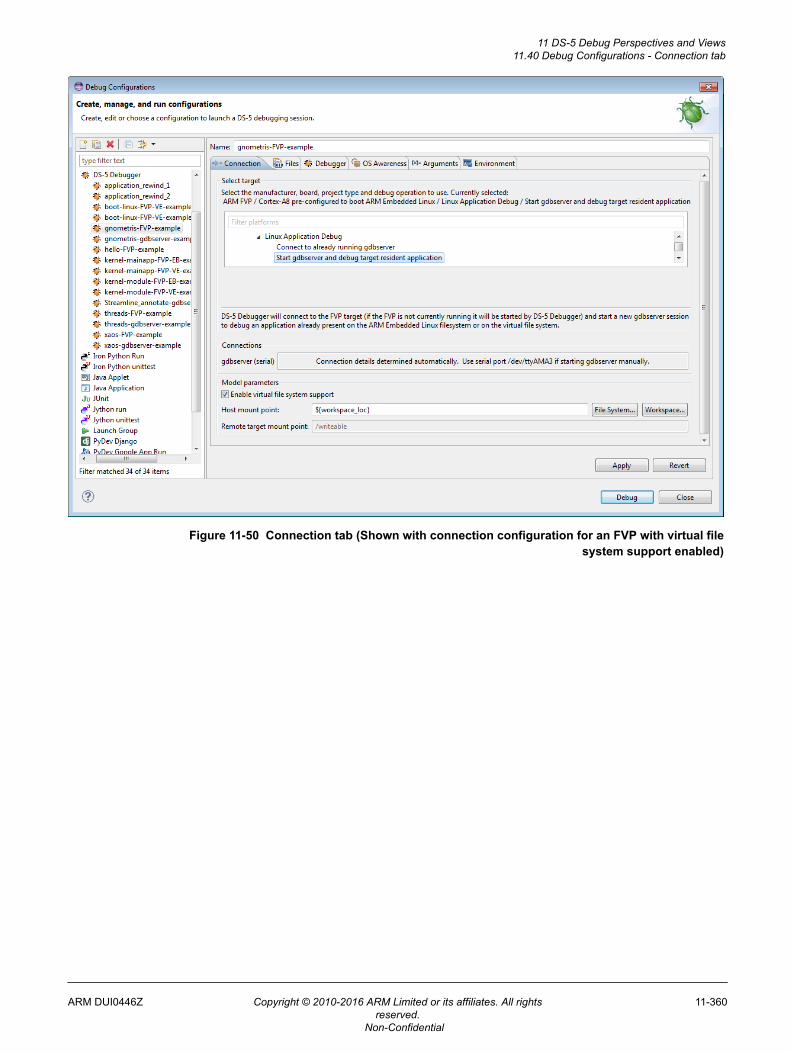
Figure 11-50 Connection tab (Shown with connection configuration for an FVP with virtual filesystem support enabled)
11 DS-5 Debug Perspectives and Views11.40 Debug Configurations - Connection tab
ARM DUI0446Z Copyright © 2010-2016 ARM Limited or its affiliates. All rightsreserved.
11-360
Non-Confidential
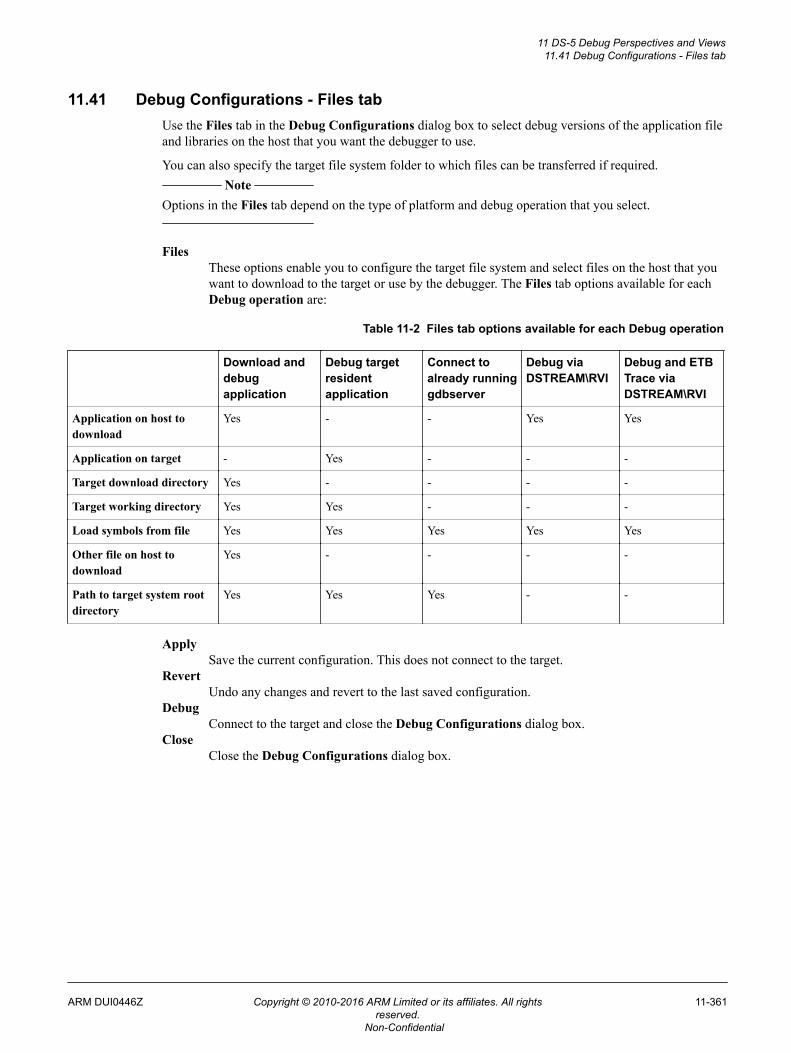
11.41 Debug Configurations - Files tabUse the Files tab in the Debug Configurations dialog box to select debug versions of the application fileand libraries on the host that you want the debugger to use.
You can also specify the target file system folder to which files can be transferred if required. Note
Options in the Files tab depend on the type of platform and debug operation that you select.
FilesThese options enable you to configure the target file system and select files on the host that youwant to download to the target or use by the debugger. The Files tab options available for eachDebug operation are:
Table 11-2 Files tab options available for each Debug operation
Download anddebugapplication
Debug targetresidentapplication
Connect toalready runninggdbserver
Debug viaDSTREAM\RVI
Debug and ETBTrace viaDSTREAM\RVI
Application on host todownload
Yes - - Yes Yes
Application on target - Yes - - -
Target download directory Yes - - - -
Target working directory Yes Yes - - -
Load symbols from file Yes Yes Yes Yes Yes
Other file on host todownload
Yes - - - -
Path to target system rootdirectory
Yes Yes Yes - -
ApplySave the current configuration. This does not connect to the target.
RevertUndo any changes and revert to the last saved configuration.
DebugConnect to the target and close the Debug Configurations dialog box.
CloseClose the Debug Configurations dialog box.
11 DS-5 Debug Perspectives and Views11.41 Debug Configurations - Files tab
ARM DUI0446Z Copyright © 2010-2016 ARM Limited or its affiliates. All rightsreserved.
11-361
Non-Confidential
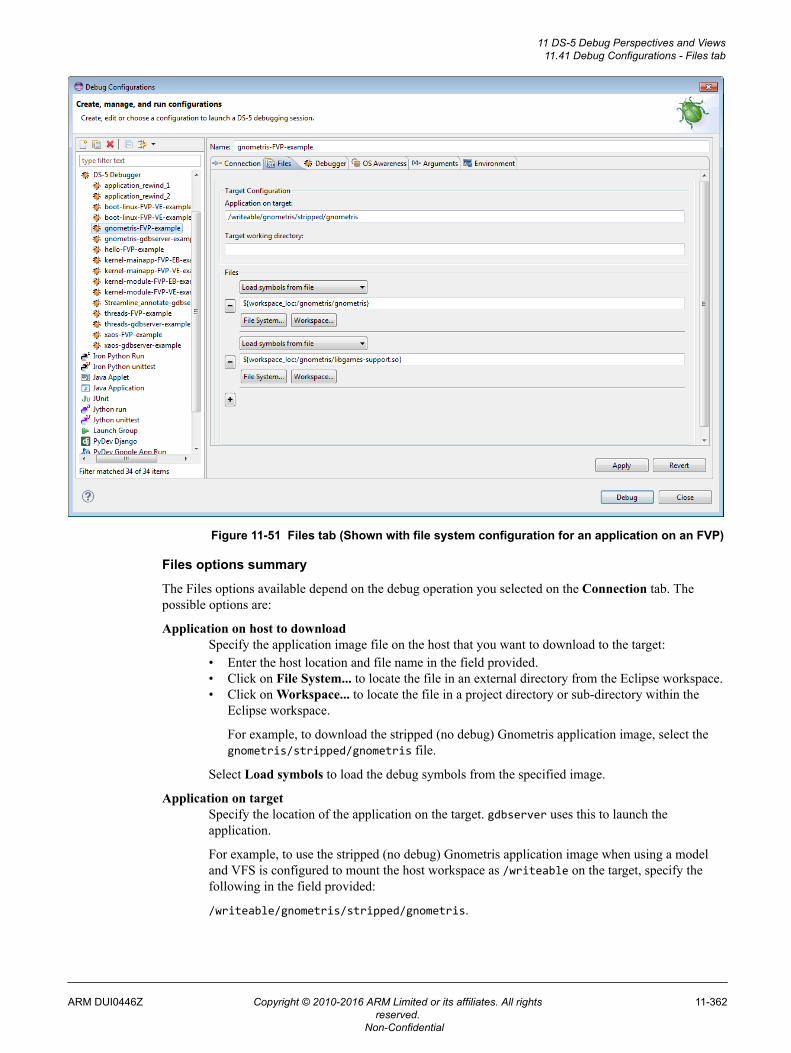
Figure 11-51 Files tab (Shown with file system configuration for an application on an FVP)
Files options summary
The Files options available depend on the debug operation you selected on the Connection tab. Thepossible options are:
Application on host to downloadSpecify the application image file on the host that you want to download to the target:• Enter the host location and file name in the field provided.• Click on File System... to locate the file in an external directory from the Eclipse workspace.• Click on Workspace... to locate the file in a project directory or sub-directory within the
Eclipse workspace.
For example, to download the stripped (no debug) Gnometris application image, select thegnometris/stripped/gnometris file.
Select Load symbols to load the debug symbols from the specified image.
Application on targetSpecify the location of the application on the target. gdbserver uses this to launch theapplication.
For example, to use the stripped (no debug) Gnometris application image when using a modeland VFS is configured to mount the host workspace as /writeable on the target, specify thefollowing in the field provided:
/writeable/gnometris/stripped/gnometris.
11 DS-5 Debug Perspectives and Views11.41 Debug Configurations - Files tab
ARM DUI0446Z Copyright © 2010-2016 ARM Limited or its affiliates. All rightsreserved.
11-362
Non-Confidential
Target download directoryIf the target has a preloaded image, then you might have to specify the location of thecorresponding image on your host.
The debugger uses the location of the application image on the target as the default currentworking directory. To change the default setting for the application that you are debugging, enterthe location in the field provided. The current working directory is used whenever theapplication references a file using a relative path.
Load symbols from fileSpecify the application image containing the debug information to load:• Enter the host location and file name in the field provided.• Click on File System... to locate the file in an external directory from the workspace.• Click on Workspace... to locate the file in a project directory or sub-directory within the
workspace.
For example, to load the debug version of Gnometris you must select the gnometris applicationimage that is available in the gnometris project root directory.
Although you can specify shared library files here, the usual method is to specify a path to yourshared libraries with the Shared library search directory option on the Debugger tab.
Note
Load symbols from file is selected by default.
Add peripheral description files from directoryA directory with configuration files defining peripherals that must be added before connectingto the target.
Other file on host to downloadSpecify other files that you want to download to the target:• Enter the host location and file name in the field provided.• Click on File System... to locate the file in an external directory from the workspace.• Click on Workspace... to locate the file in a project directory or sub-directory within the
workspace.
For example, to download the stripped (no debug) Gnometris shared library to the target you canselect the gnometris/stripped/libgames-support.so file.
Path to target system root directorySpecifies the system root directory to search for shared library symbols.
The debugger uses this directory to search for a copy of the debug versions of target sharedlibraries. The system root on the host workstation must contain an exact representation of thelibraries on the target root filesystem.
Target working directoryIf this field is not specified, the debugger uses the location of the application image on the targetas the default current working directory. To change the default setting for the application thatyou are debugging, enter the location in the field provided. The current working directory isused whenever the application refers to a file using a relative path.
Remove this resource file from the listTo remove a resource from the configuration settings, click this button next to the resource thatyou want to remove.
Add a new resource to the listTo add a new resource to the file settings, click this button and then configure the options asrequired.
Related concepts6.10.2 About debugging a Linux kernel on page 6-156.
11 DS-5 Debug Perspectives and Views11.41 Debug Configurations - Files tab
ARM DUI0446Z Copyright © 2010-2016 ARM Limited or its affiliates. All rightsreserved.
11-363
Non-Confidential
11.42 Debug Configurations - Debugger tabUse the Debugger tab in the Debug Configurations dialog box to specify the actions that you want thedebugger to do after connection to the target.
Run ControlThese options enable you to define the running state of the target when you connect:
Connect onlyConnect to the target, but do not run the application.
Note
The PC register is not set and pending breakpoints or watchpoints are subsequentlydisabled when a connection is established.
Debug from entry pointRun the application when a connection is established, then stop at the image entrypoint.
Debug from symbolRun the application when a connection is established, then stop at the address of thespecified symbol. The debugger must be able to resolve the symbol. If you specify a Cor C++ function name, then do not use the () suffix.
If the symbol can be resolved, execution stops at the address of that symbol.
If the symbol cannot be resolved, a message is displayed in the Commands viewwarning that the symbol cannot be found. The debugger then attempts to stop at theimage entry point.
Run target initialization debugger script (.ds / .py)Select this option to execute target initialization scripts (a file containing debuggercommands) immediately after connection. To select a file:• Enter the location and file name in the field provided.• Click on File System... to locate the file in an external directory from the
workspace.• Click on Workspace... to locate the file in a project directory or sub-directory
within the workspace.
Run debug initialization debugger script (.ds / .py)Select this option to execute debug initialization scripts (a file containing debuggercommands) after execution of any target initialization scripts and also running to animage entry point or symbol, if selected. To select a file:• Enter the location and file name in the field provided.• Click on File System... to locate the file in an external directory from the
workspace.• Click on Workspace... to locate the file in a project directory or sub-directory
within the workspace. Note
You might have to insert a wait command before a run or continue command toenable the debugger to connect and run the application to the specified function.
Execute debugger commandsEnter debugger commands in the field provided if you want to automatically executespecific debugger commands that run on completion of any initialization scripts. Eachline must contain only one debugger command.
11 DS-5 Debug Perspectives and Views11.42 Debug Configurations - Debugger tab
ARM DUI0446Z Copyright © 2010-2016 ARM Limited or its affiliates. All rightsreserved.
11-364
Non-Confidential
Host working directoryThe debugger uses the Eclipse workspace as the default working directory on the host.To change the default setting for the application that you are debugging, deselect theUse default check box and then:• Enter the location in the field provided.• Click on File System... to locate the external directory.• Click on Workspace... to locate the project directory.
PathsYou can modify the search paths on the host used by the debugger when it displays source code.
Source search directorySpecify a directory to search for source files:• Enter the location and file name in the field provided.• Click on File System... to locate the directory in an external location from the
workspace.• Click on Workspace... to locate the directory within the workspace.
Shared library search directorySpecify a directory to search for shared libraries:• Enter the location in the field provided.• Click on File System... to locate the directory in an external location from the
workspace.• Click on Workspace... to locate the directory within the workspace.
Remove this resource file from the listTo remove a search path from the configuration settings, click this button next to theresource that you want to remove.
Add a new resource to the listTo add a new search path to the configuration settings, click this button and thenconfigure the options as required.
ApplySave the current configuration. This does not connect to the target.
RevertUndo any changes and revert to the last saved configuration.
DebugConnect to the target and close the Debug Configurations dialog box.
CloseClose the Debug Configurations dialog box.
11 DS-5 Debug Perspectives and Views11.42 Debug Configurations - Debugger tab
ARM DUI0446Z Copyright © 2010-2016 ARM Limited or its affiliates. All rightsreserved.
11-365
Non-Confidential
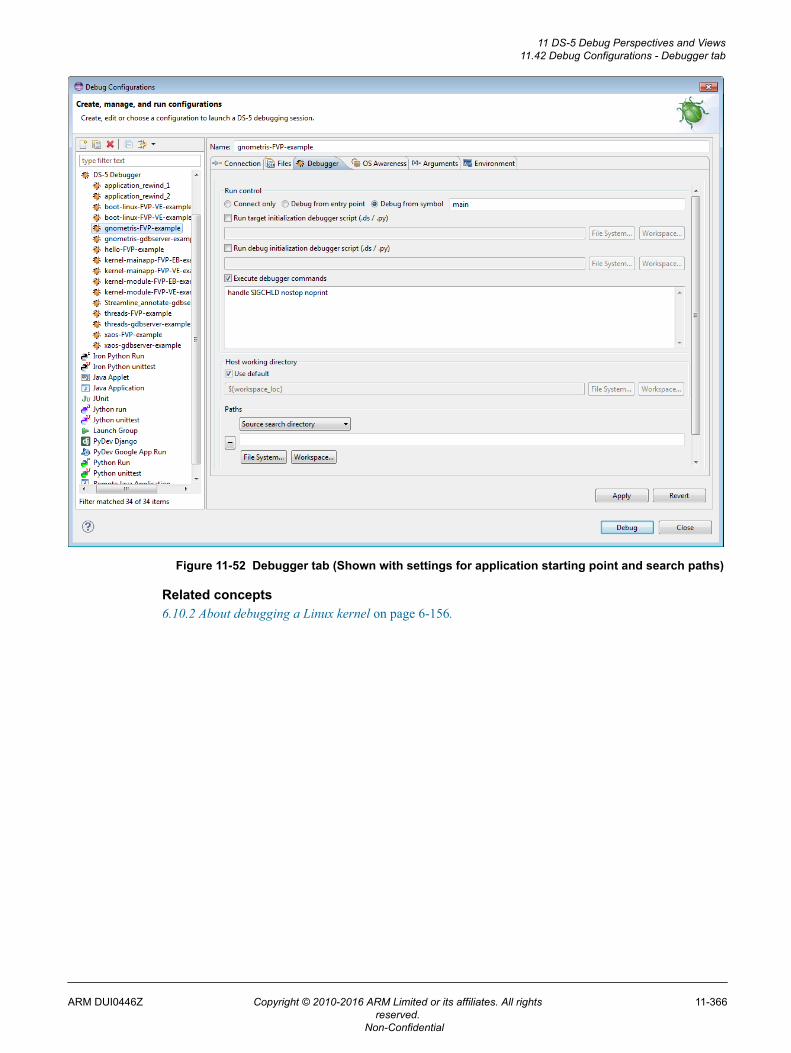
Figure 11-52 Debugger tab (Shown with settings for application starting point and search paths)
Related concepts6.10.2 About debugging a Linux kernel on page 6-156.
11 DS-5 Debug Perspectives and Views11.42 Debug Configurations - Debugger tab
ARM DUI0446Z Copyright © 2010-2016 ARM Limited or its affiliates. All rightsreserved.
11-366
Non-Confidential
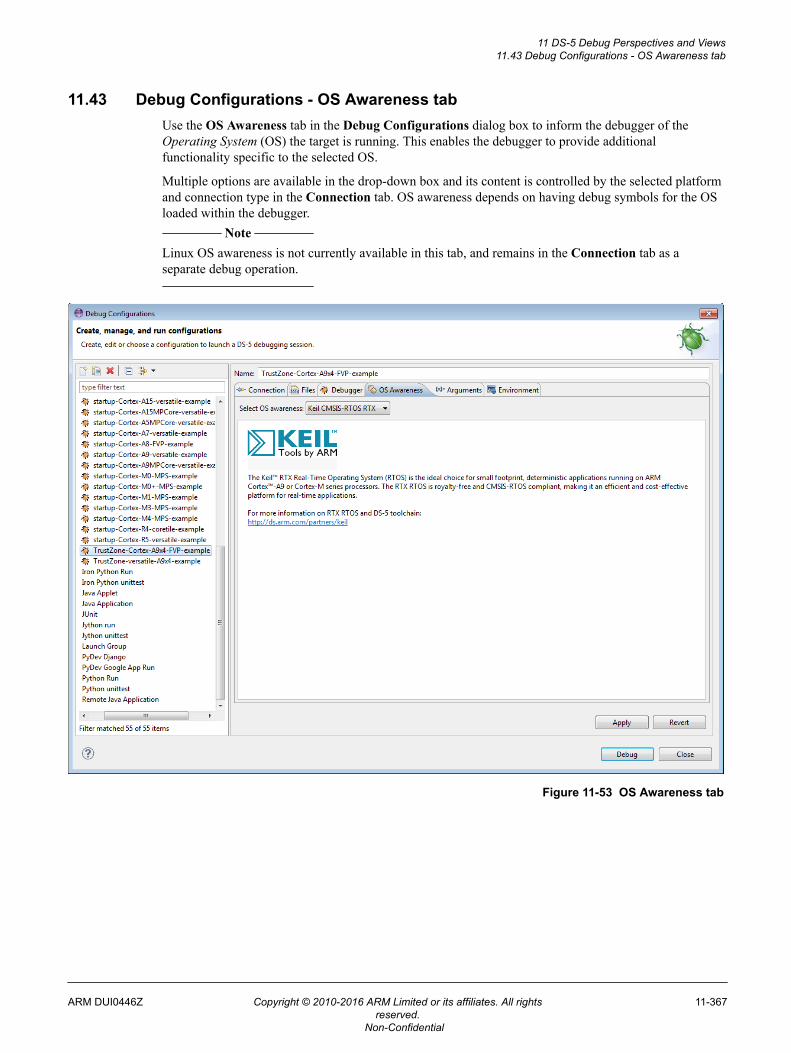
11.43 Debug Configurations - OS Awareness tabUse the OS Awareness tab in the Debug Configurations dialog box to inform the debugger of theOperating System (OS) the target is running. This enables the debugger to provide additionalfunctionality specific to the selected OS.
Multiple options are available in the drop-down box and its content is controlled by the selected platformand connection type in the Connection tab. OS awareness depends on having debug symbols for the OSloaded within the debugger.
Note
Linux OS awareness is not currently available in this tab, and remains in the Connection tab as aseparate debug operation.
Figure 11-53 OS Awareness tab
11 DS-5 Debug Perspectives and Views11.43 Debug Configurations - OS Awareness tab
ARM DUI0446Z Copyright © 2010-2016 ARM Limited or its affiliates. All rightsreserved.
11-367
Non-Confidential
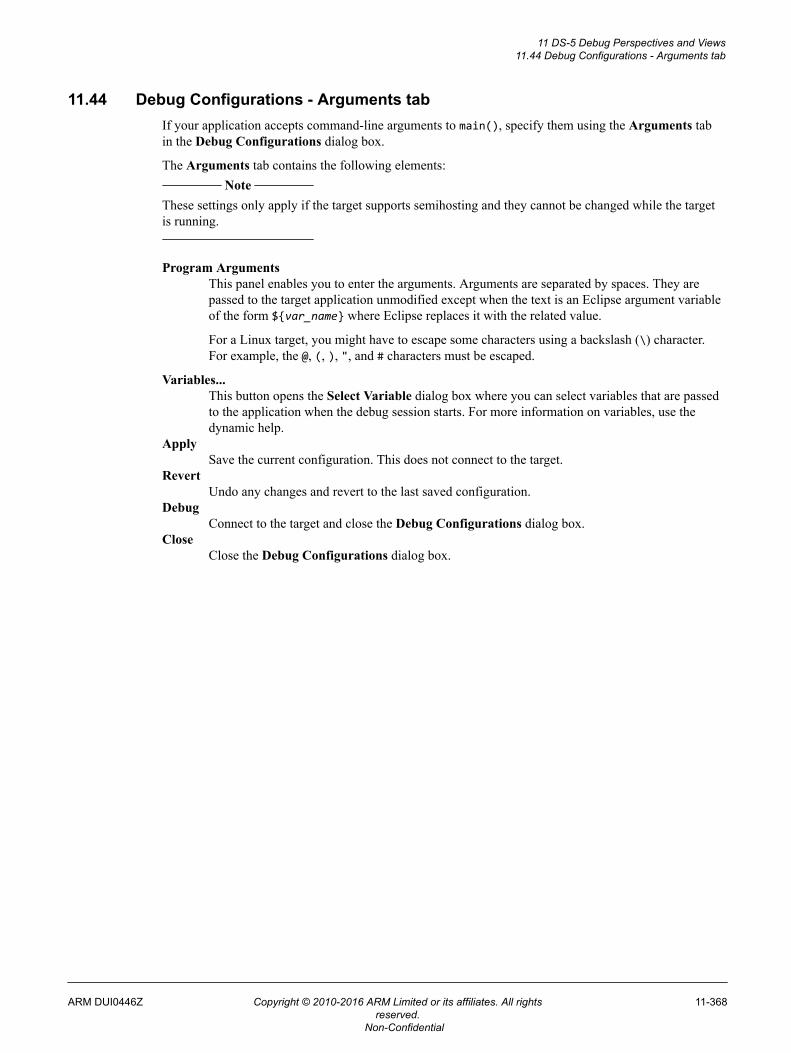
11.44 Debug Configurations - Arguments tabIf your application accepts command-line arguments to main(), specify them using the Arguments tabin the Debug Configurations dialog box.
The Arguments tab contains the following elements: Note
These settings only apply if the target supports semihosting and they cannot be changed while the targetis running.
Program ArgumentsThis panel enables you to enter the arguments. Arguments are separated by spaces. They arepassed to the target application unmodified except when the text is an Eclipse argument variableof the form ${var_name} where Eclipse replaces it with the related value.
For a Linux target, you might have to escape some characters using a backslash (\) character.For example, the @, (, ), ", and # characters must be escaped.
Variables...This button opens the Select Variable dialog box where you can select variables that are passedto the application when the debug session starts. For more information on variables, use thedynamic help.
ApplySave the current configuration. This does not connect to the target.
RevertUndo any changes and revert to the last saved configuration.
DebugConnect to the target and close the Debug Configurations dialog box.
CloseClose the Debug Configurations dialog box.
11 DS-5 Debug Perspectives and Views11.44 Debug Configurations - Arguments tab
ARM DUI0446Z Copyright © 2010-2016 ARM Limited or its affiliates. All rightsreserved.
11-368
Non-Confidential
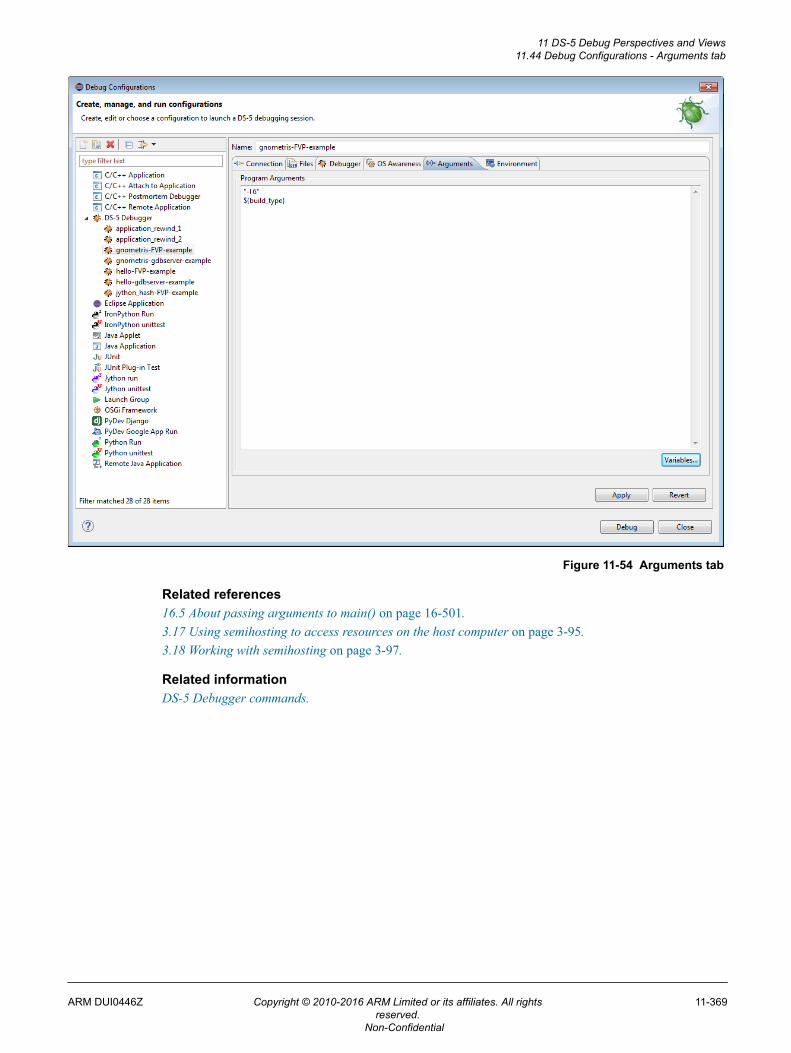
Figure 11-54 Arguments tab
Related references16.5 About passing arguments to main() on page 16-501.3.17 Using semihosting to access resources on the host computer on page 3-95.3.18 Working with semihosting on page 3-97.
Related informationDS-5 Debugger commands.
11 DS-5 Debug Perspectives and Views11.44 Debug Configurations - Arguments tab
ARM DUI0446Z Copyright © 2010-2016 ARM Limited or its affiliates. All rightsreserved.
11-369
Non-Confidential
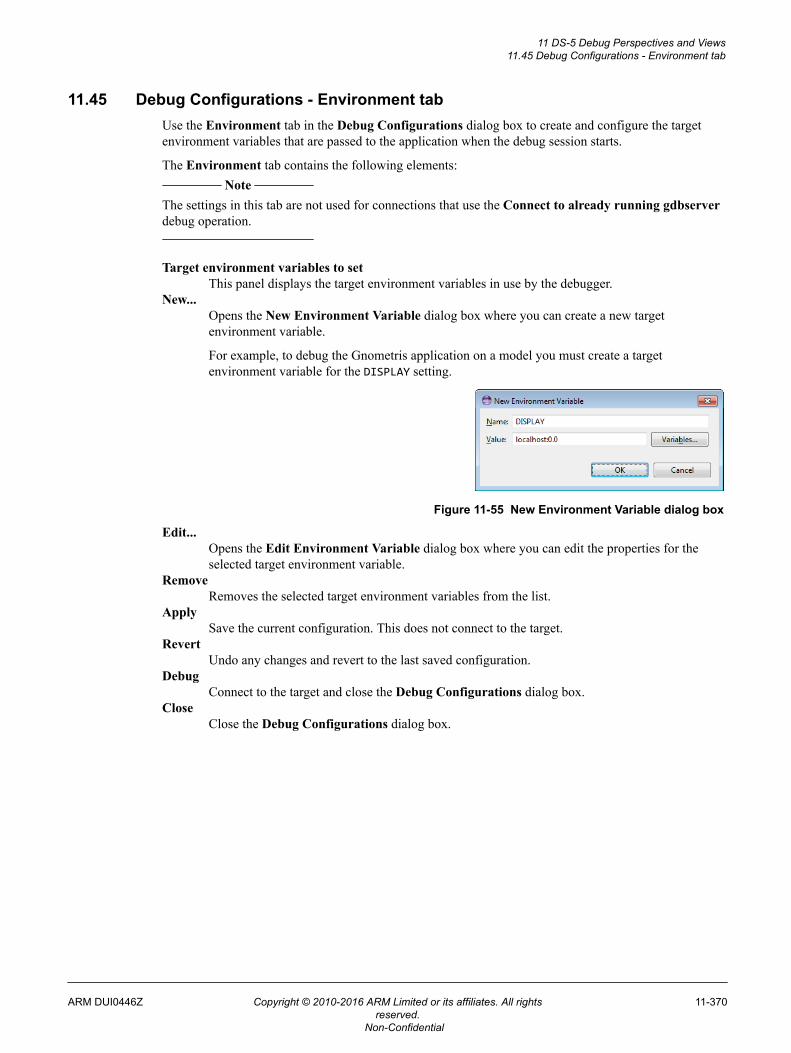
11.45 Debug Configurations - Environment tabUse the Environment tab in the Debug Configurations dialog box to create and configure the targetenvironment variables that are passed to the application when the debug session starts.
The Environment tab contains the following elements: Note
The settings in this tab are not used for connections that use the Connect to already running gdbserverdebug operation.
Target environment variables to setThis panel displays the target environment variables in use by the debugger.
New...Opens the New Environment Variable dialog box where you can create a new targetenvironment variable.
For example, to debug the Gnometris application on a model you must create a targetenvironment variable for the DISPLAY setting.
Figure 11-55 New Environment Variable dialog box
Edit...Opens the Edit Environment Variable dialog box where you can edit the properties for theselected target environment variable.
RemoveRemoves the selected target environment variables from the list.
ApplySave the current configuration. This does not connect to the target.
RevertUndo any changes and revert to the last saved configuration.
DebugConnect to the target and close the Debug Configurations dialog box.
CloseClose the Debug Configurations dialog box.
11 DS-5 Debug Perspectives and Views11.45 Debug Configurations - Environment tab
ARM DUI0446Z Copyright © 2010-2016 ARM Limited or its affiliates. All rightsreserved.
11-370
Non-Confidential
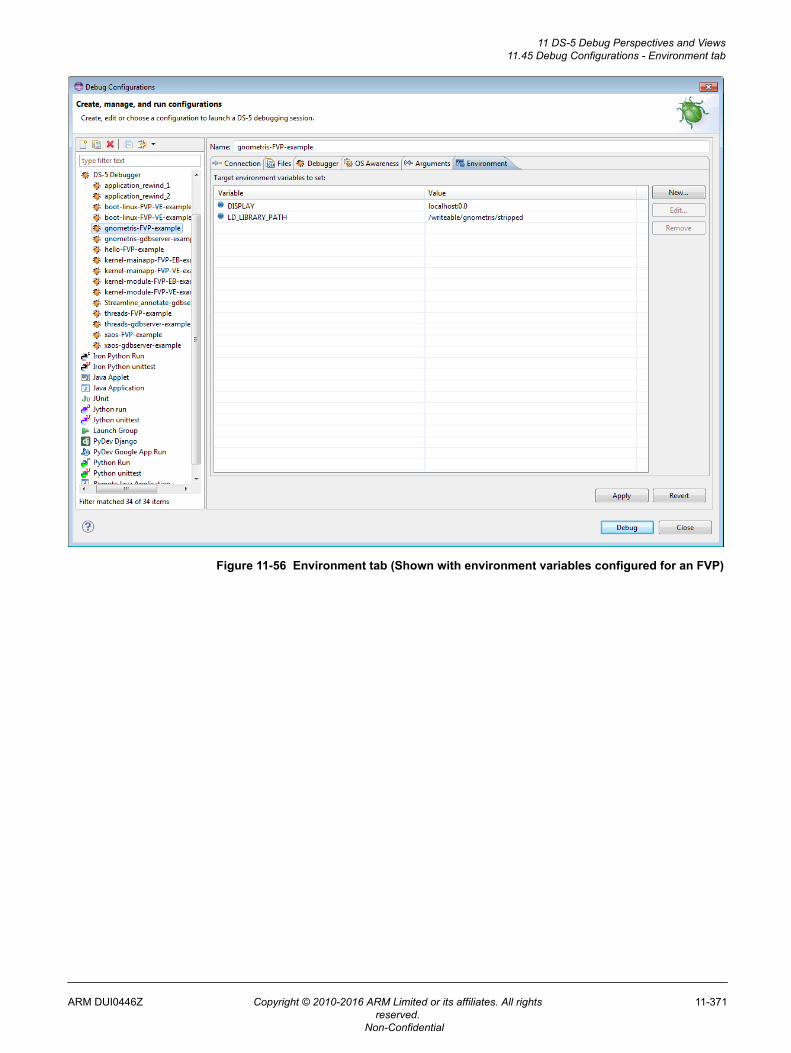
Figure 11-56 Environment tab (Shown with environment variables configured for an FVP)
11 DS-5 Debug Perspectives and Views11.45 Debug Configurations - Environment tab
ARM DUI0446Z Copyright © 2010-2016 ARM Limited or its affiliates. All rightsreserved.
11-371
Non-Confidential
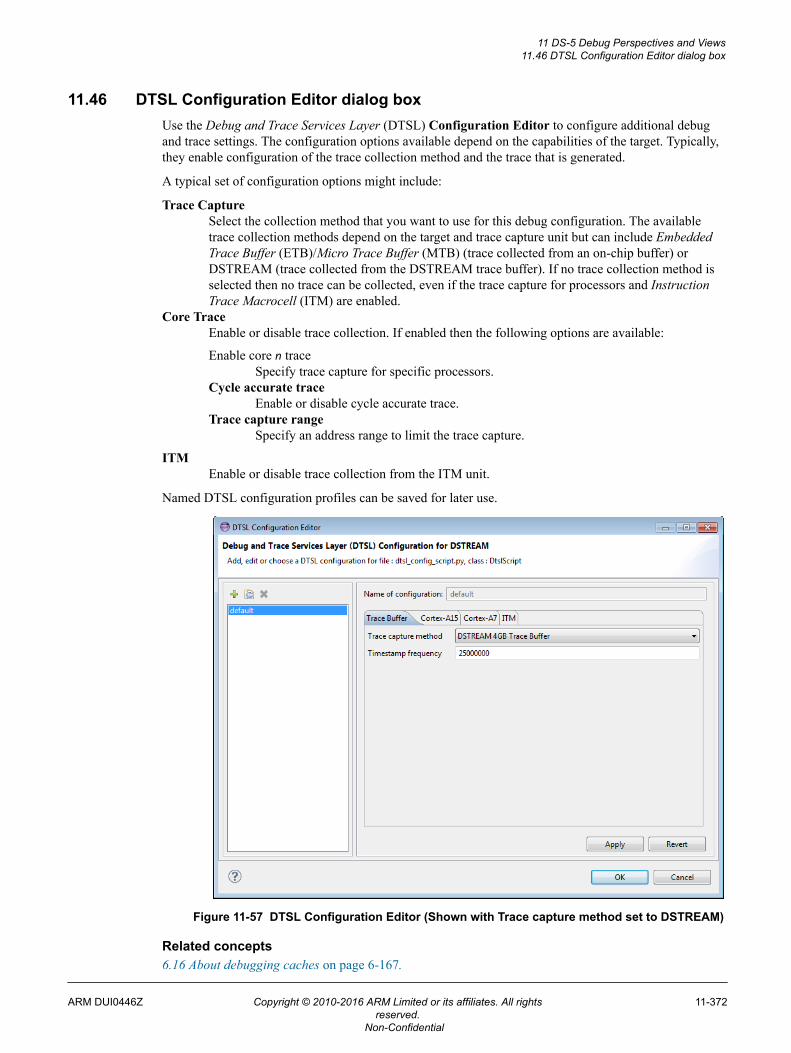
11.46 DTSL Configuration Editor dialog boxUse the Debug and Trace Services Layer (DTSL) Configuration Editor to configure additional debugand trace settings. The configuration options available depend on the capabilities of the target. Typically,they enable configuration of the trace collection method and the trace that is generated.
A typical set of configuration options might include:
Trace CaptureSelect the collection method that you want to use for this debug configuration. The availabletrace collection methods depend on the target and trace capture unit but can include EmbeddedTrace Buffer (ETB)/Micro Trace Buffer (MTB) (trace collected from an on-chip buffer) orDSTREAM (trace collected from the DSTREAM trace buffer). If no trace collection method isselected then no trace can be collected, even if the trace capture for processors and InstructionTrace Macrocell (ITM) are enabled.
Core TraceEnable or disable trace collection. If enabled then the following options are available:
Enable core n traceSpecify trace capture for specific processors.
Cycle accurate traceEnable or disable cycle accurate trace.
Trace capture rangeSpecify an address range to limit the trace capture.
ITMEnable or disable trace collection from the ITM unit.
Named DTSL configuration profiles can be saved for later use.
Figure 11-57 DTSL Configuration Editor (Shown with Trace capture method set to DSTREAM)
Related concepts6.16 About debugging caches on page 6-167.
11 DS-5 Debug Perspectives and Views11.46 DTSL Configuration Editor dialog box
ARM DUI0446Z Copyright © 2010-2016 ARM Limited or its affiliates. All rightsreserved.
11-372
Non-Confidential

Related references11.21 Cache Data view on page 11-321.
Related informationDS-5 Debugger cache commands.
11 DS-5 Debug Perspectives and Views11.46 DTSL Configuration Editor dialog box
ARM DUI0446Z Copyright © 2010-2016 ARM Limited or its affiliates. All rightsreserved.
11-373
Non-Confidential
11.47 About the Remote System ExplorerUse the Remote Systems Explorer (RSE) perspective to connect to and work with a variety of remotesystems.
It enables you to:
• Set up Linux SSH connections to remote targets using TCP/IP.• Create, copy, delete, and rename resources.• Set the read, write, and execute permissions for resources.• Edit files by double-clicking to open them in the C/C++ editor view.• Execute commands on the remote target.• View and kill running processes.• Transfer files between the host workstation and remote targets.• Launch terminal views.
Useful RSE views that can be added to the DS-5 Debug perspective are:
• Remote Systems.• Remote System Details.• Remote Scratchpad.• Terminals.
To add an RSE view to the DS-5 Debug perspective:1. Ensure that you are in the DS-5 perspective. You can change perspective by using the perspective
toolbar or you can select Window > Open Perspective from the main menu.2. Select Window > Show View > Other... to open the Show View dialog box.3. Select the required view from the Remote Systems group.4. Click OK.
11 DS-5 Debug Perspectives and Views11.47 About the Remote System Explorer
ARM DUI0446Z Copyright © 2010-2016 ARM Limited or its affiliates. All rightsreserved.
11-374
Non-Confidential
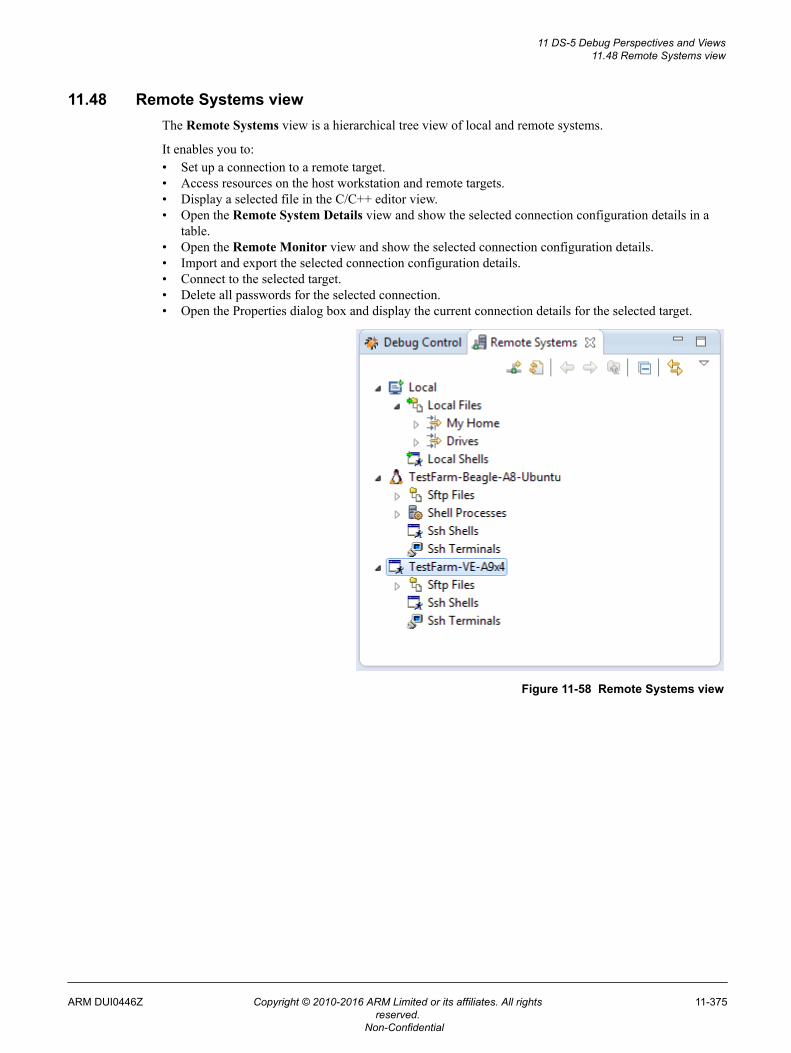
11.48 Remote Systems viewThe Remote Systems view is a hierarchical tree view of local and remote systems.
It enables you to:• Set up a connection to a remote target.• Access resources on the host workstation and remote targets.• Display a selected file in the C/C++ editor view.• Open the Remote System Details view and show the selected connection configuration details in a
table.• Open the Remote Monitor view and show the selected connection configuration details.• Import and export the selected connection configuration details.• Connect to the selected target.• Delete all passwords for the selected connection.• Open the Properties dialog box and display the current connection details for the selected target.
Figure 11-58 Remote Systems view
11 DS-5 Debug Perspectives and Views11.48 Remote Systems view
ARM DUI0446Z Copyright © 2010-2016 ARM Limited or its affiliates. All rightsreserved.
11-375
Non-Confidential
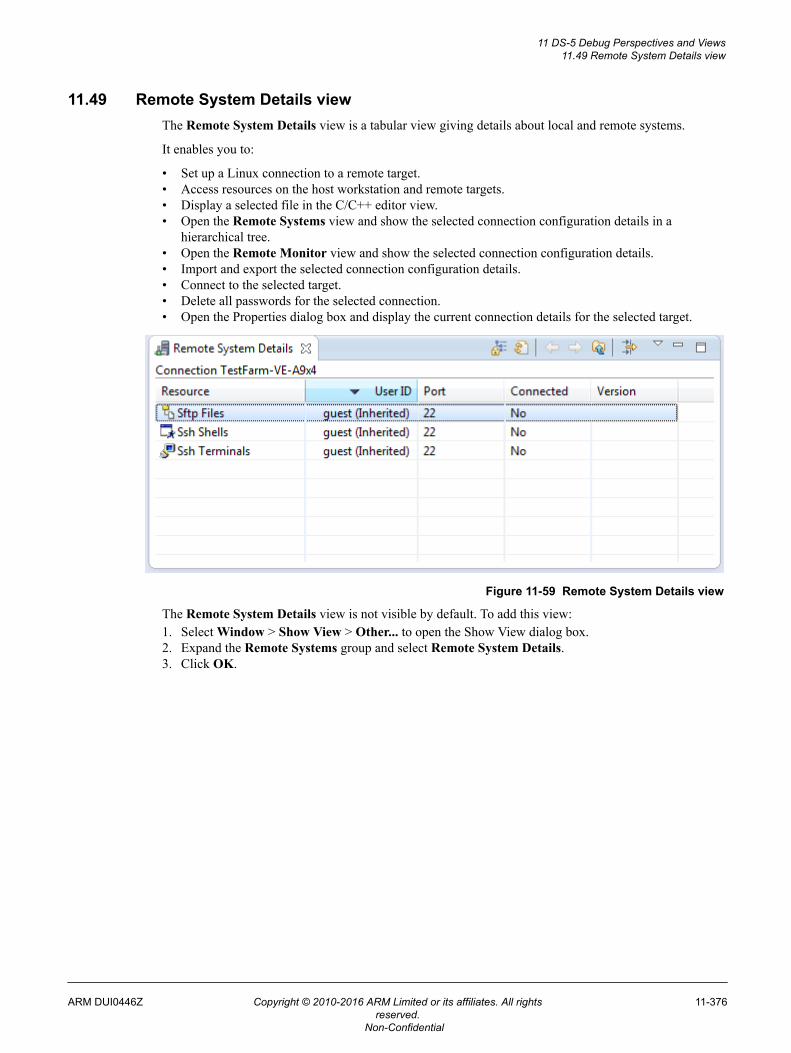
11.49 Remote System Details viewThe Remote System Details view is a tabular view giving details about local and remote systems.
It enables you to:
• Set up a Linux connection to a remote target.• Access resources on the host workstation and remote targets.• Display a selected file in the C/C++ editor view.• Open the Remote Systems view and show the selected connection configuration details in a
hierarchical tree.• Open the Remote Monitor view and show the selected connection configuration details.• Import and export the selected connection configuration details.• Connect to the selected target.• Delete all passwords for the selected connection.• Open the Properties dialog box and display the current connection details for the selected target.
Figure 11-59 Remote System Details view
The Remote System Details view is not visible by default. To add this view:1. Select Window > Show View > Other... to open the Show View dialog box.2. Expand the Remote Systems group and select Remote System Details.3. Click OK.
11 DS-5 Debug Perspectives and Views11.49 Remote System Details view
ARM DUI0446Z Copyright © 2010-2016 ARM Limited or its affiliates. All rightsreserved.
11-376
Non-Confidential
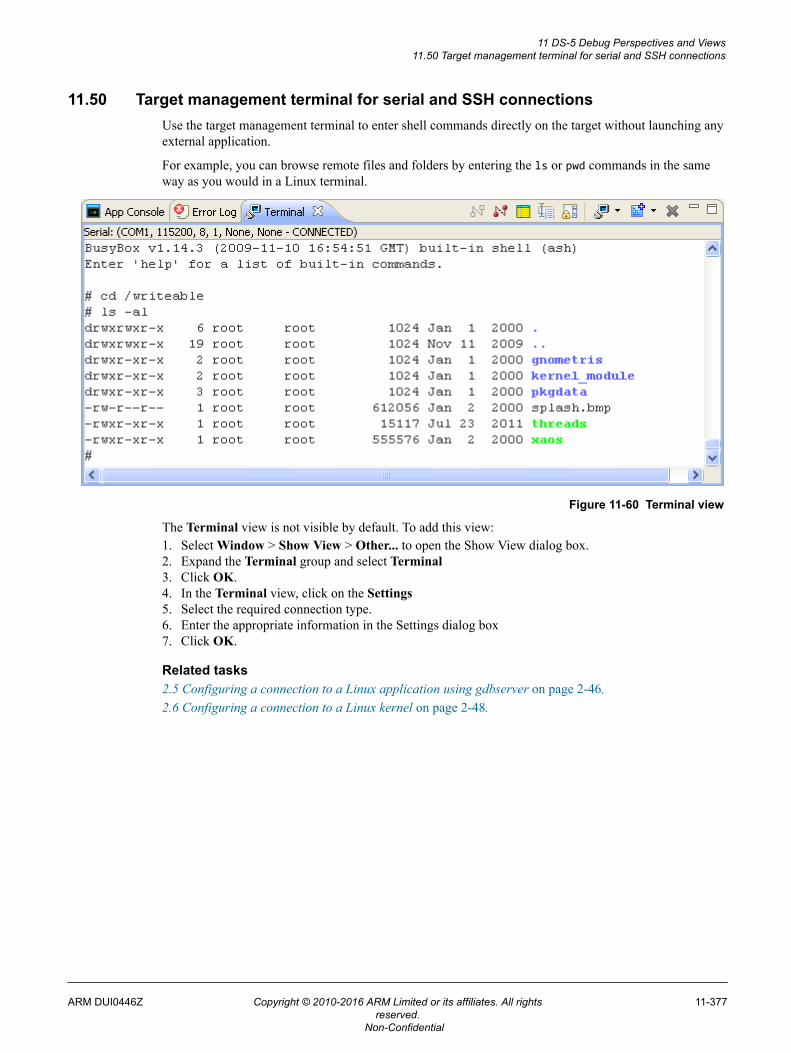
11.50 Target management terminal for serial and SSH connectionsUse the target management terminal to enter shell commands directly on the target without launching anyexternal application.
For example, you can browse remote files and folders by entering the ls or pwd commands in the sameway as you would in a Linux terminal.
Figure 11-60 Terminal view
The Terminal view is not visible by default. To add this view:1. Select Window > Show View > Other... to open the Show View dialog box.2. Expand the Terminal group and select Terminal3. Click OK.4. In the Terminal view, click on the Settings5. Select the required connection type.6. Enter the appropriate information in the Settings dialog box7. Click OK.
Related tasks2.5 Configuring a connection to a Linux application using gdbserver on page 2-46.2.6 Configuring a connection to a Linux kernel on page 2-48.
11 DS-5 Debug Perspectives and Views11.50 Target management terminal for serial and SSH connections
ARM DUI0446Z Copyright © 2010-2016 ARM Limited or its affiliates. All rightsreserved.
11-377
Non-Confidential
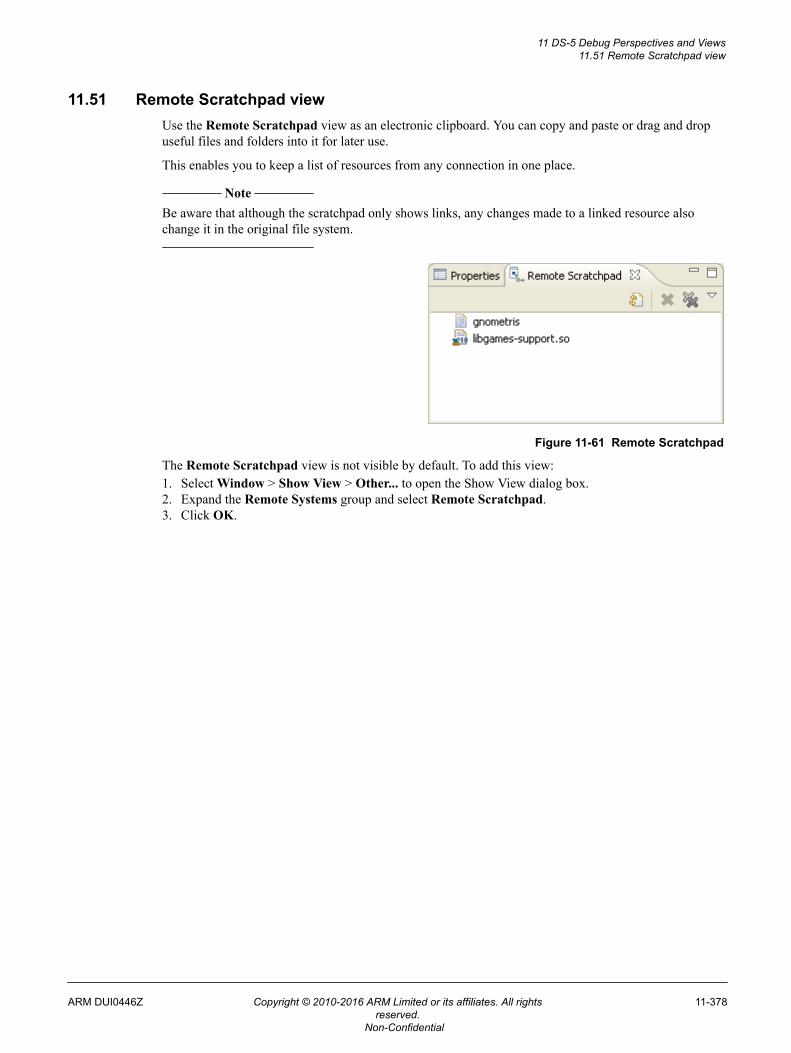
11.51 Remote Scratchpad viewUse the Remote Scratchpad view as an electronic clipboard. You can copy and paste or drag and dropuseful files and folders into it for later use.
This enables you to keep a list of resources from any connection in one place.
Note
Be aware that although the scratchpad only shows links, any changes made to a linked resource alsochange it in the original file system.
Figure 11-61 Remote Scratchpad
The Remote Scratchpad view is not visible by default. To add this view:1. Select Window > Show View > Other... to open the Show View dialog box.2. Expand the Remote Systems group and select Remote Scratchpad.3. Click OK.
11 DS-5 Debug Perspectives and Views11.51 Remote Scratchpad view
ARM DUI0446Z Copyright © 2010-2016 ARM Limited or its affiliates. All rightsreserved.
11-378
Non-Confidential
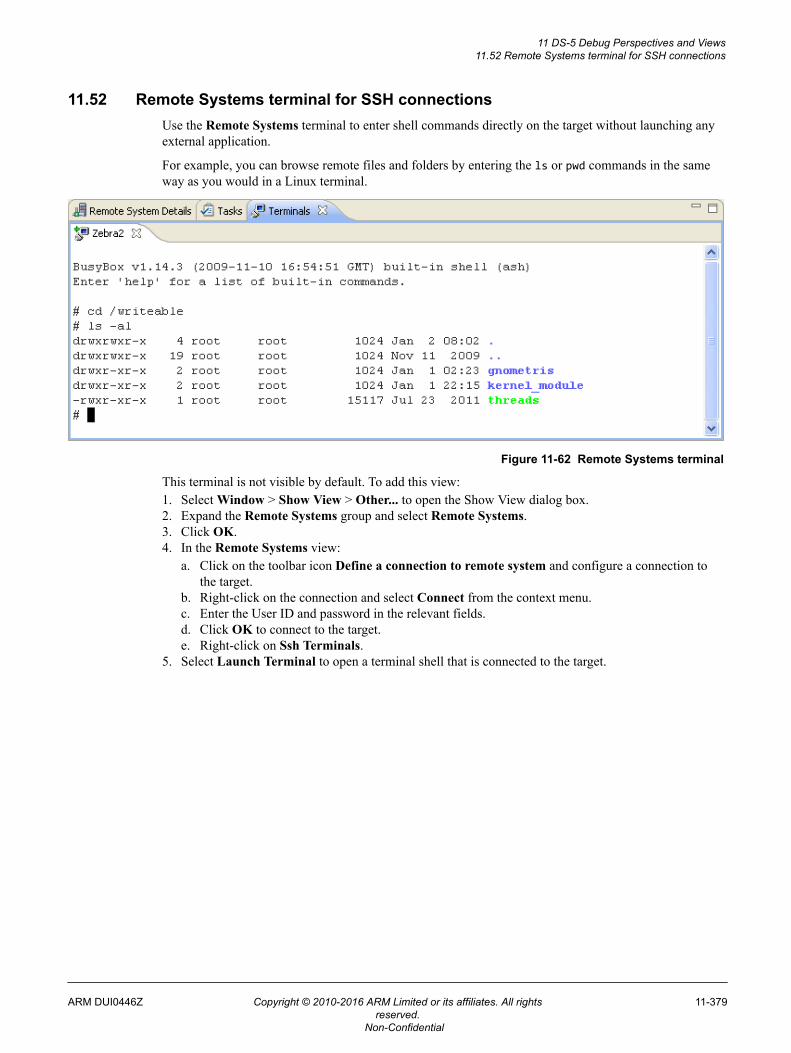
11.52 Remote Systems terminal for SSH connectionsUse the Remote Systems terminal to enter shell commands directly on the target without launching anyexternal application.
For example, you can browse remote files and folders by entering the ls or pwd commands in the sameway as you would in a Linux terminal.
Figure 11-62 Remote Systems terminal
This terminal is not visible by default. To add this view:1. Select Window > Show View > Other... to open the Show View dialog box.2. Expand the Remote Systems group and select Remote Systems.3. Click OK.4. In the Remote Systems view:
a. Click on the toolbar icon Define a connection to remote system and configure a connection tothe target.
b. Right-click on the connection and select Connect from the context menu.c. Enter the User ID and password in the relevant fields.d. Click OK to connect to the target.e. Right-click on Ssh Terminals.
5. Select Launch Terminal to open a terminal shell that is connected to the target.
11 DS-5 Debug Perspectives and Views11.52 Remote Systems terminal for SSH connections
ARM DUI0446Z Copyright © 2010-2016 ARM Limited or its affiliates. All rightsreserved.
11-379
Non-Confidential
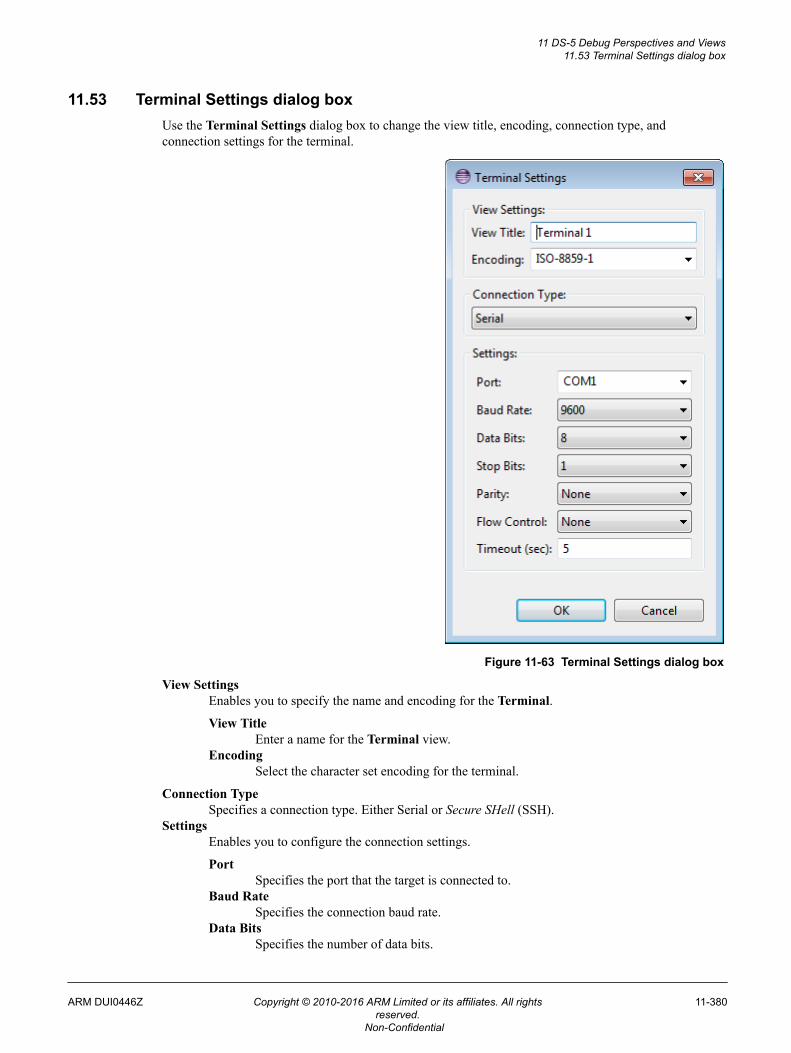
11.53 Terminal Settings dialog boxUse the Terminal Settings dialog box to change the view title, encoding, connection type, andconnection settings for the terminal.
Figure 11-63 Terminal Settings dialog box
View SettingsEnables you to specify the name and encoding for the Terminal.
View TitleEnter a name for the Terminal view.
EncodingSelect the character set encoding for the terminal.
Connection TypeSpecifies a connection type. Either Serial or Secure SHell (SSH).
SettingsEnables you to configure the connection settings.
PortSpecifies the port that the target is connected to.
Baud RateSpecifies the connection baud rate.
Data BitsSpecifies the number of data bits.
11 DS-5 Debug Perspectives and Views11.53 Terminal Settings dialog box
ARM DUI0446Z Copyright © 2010-2016 ARM Limited or its affiliates. All rightsreserved.
11-380
Non-Confidential

Stop BitsSpecifies the number of stop bits for each character.
ParitySpecifies the parity type:• None. This is the default.• Even.• Odd.• Mark.• Space.
Flow ControlSpecifies the flow control of the connection:• None. This is the default.• RTS/CTS.• Xon/Xoff.
Timeout (sec)Specifies the connections timeout in seconds.
11 DS-5 Debug Perspectives and Views11.53 Terminal Settings dialog box
ARM DUI0446Z Copyright © 2010-2016 ARM Limited or its affiliates. All rightsreserved.
11-381
Non-Confidential
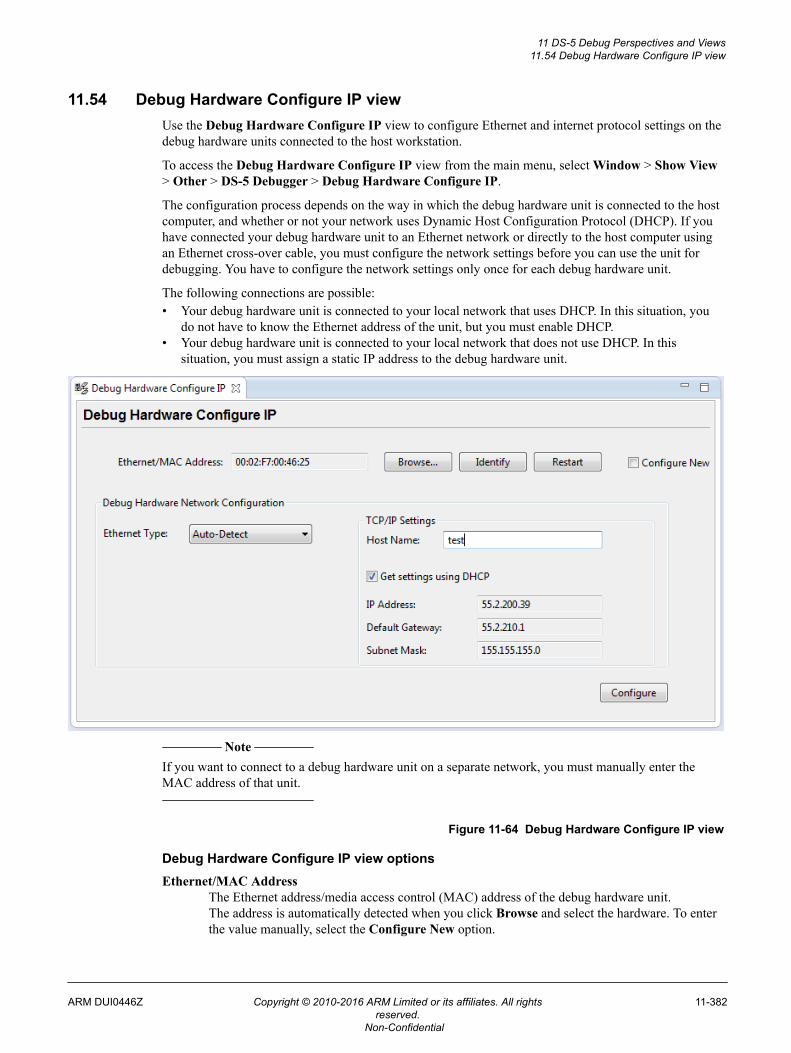
11.54 Debug Hardware Configure IP viewUse the Debug Hardware Configure IP view to configure Ethernet and internet protocol settings on thedebug hardware units connected to the host workstation.
To access the Debug Hardware Configure IP view from the main menu, select Window > Show View> Other > DS-5 Debugger > Debug Hardware Configure IP.
The configuration process depends on the way in which the debug hardware unit is connected to the hostcomputer, and whether or not your network uses Dynamic Host Configuration Protocol (DHCP). If youhave connected your debug hardware unit to an Ethernet network or directly to the host computer usingan Ethernet cross-over cable, you must configure the network settings before you can use the unit fordebugging. You have to configure the network settings only once for each debug hardware unit.
The following connections are possible:• Your debug hardware unit is connected to your local network that uses DHCP. In this situation, you
do not have to know the Ethernet address of the unit, but you must enable DHCP.• Your debug hardware unit is connected to your local network that does not use DHCP. In this
situation, you must assign a static IP address to the debug hardware unit.
Note
If you want to connect to a debug hardware unit on a separate network, you must manually enter theMAC address of that unit.
Figure 11-64 Debug Hardware Configure IP view
Debug Hardware Configure IP view optionsEthernet/MAC Address
The Ethernet address/media access control (MAC) address of the debug hardware unit.The address is automatically detected when you click Browse and select the hardware. To enterthe value manually, select the Configure New option.
11 DS-5 Debug Perspectives and Views11.54 Debug Hardware Configure IP view
ARM DUI0446Z Copyright © 2010-2016 ARM Limited or its affiliates. All rightsreserved.
11-382
Non-Confidential
BrowseClick to display the Connection Browser dialog. Use it to browse and select the debughardware unit in your local network or one that is connected to a USB port on the hostworkstation.
IdentifyClick to visually identify your debug hardware unit using the indicators available on the debughardware. On DSTREAM , the DSTREAM logo flashes during identification. On RVI™, allLEDs on the front panel flash during identification.
RestartClick to restart the selected debug hardware unit.
Configure NewSelect this option to manually configure a debug hardware unit that was not previouslyconfigured or is on a different subnet.
Ethernet TypeSelect the type of Ethernet you are connecting to. Auto-Detect is the default option. ForDSTREAM devices, ensure that this is set to Auto-Detect. For RVI, other available options are:10-MBit Half Duplex, 10-MBit Full Duplex, 100-MBit Half Duplex, and 100-MBit FullDuplex.
TCP/IP SettingsHost Name - The name of the debug hardware unit. This must contain only the alphanumericcharacters (A to Z, a to z, and 0 to 9) and the - character, and must be no more than 39characters long.Get settings using DHCP - Enables or disables the Dynamic Host Configuration Protocol(DHCP) on the debug hardware unit. If using DHCP, you must specify the hostname for yourdebug hardware unit.IP Address - The static IP address to use.Default Gateway - The default gateway to use.Subnet Mask - The subnet mask to use.
ConfigureClick to apply changes to the debug hardware unit.
Related references11.55 Debug Hardware Firmware Installer view on page 11-384.11.56 Connection Browser dialog box on page 11-387.
11 DS-5 Debug Perspectives and Views11.54 Debug Hardware Configure IP view
ARM DUI0446Z Copyright © 2010-2016 ARM Limited or its affiliates. All rightsreserved.
11-383
Non-Confidential
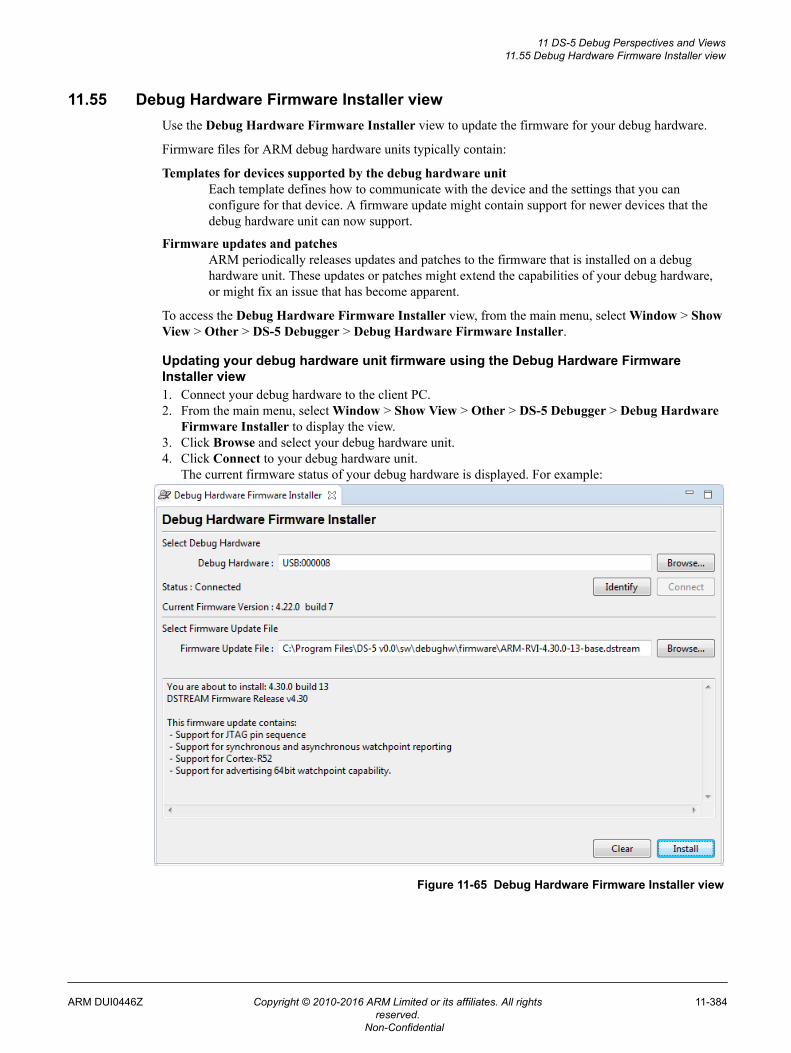
11.55 Debug Hardware Firmware Installer viewUse the Debug Hardware Firmware Installer view to update the firmware for your debug hardware.
Firmware files for ARM debug hardware units typically contain:
Templates for devices supported by the debug hardware unitEach template defines how to communicate with the device and the settings that you canconfigure for that device. A firmware update might contain support for newer devices that thedebug hardware unit can now support.
Firmware updates and patchesARM periodically releases updates and patches to the firmware that is installed on a debughardware unit. These updates or patches might extend the capabilities of your debug hardware,or might fix an issue that has become apparent.
To access the Debug Hardware Firmware Installer view, from the main menu, select Window > ShowView > Other > DS-5 Debugger > Debug Hardware Firmware Installer.
Updating your debug hardware unit firmware using the Debug Hardware FirmwareInstaller view1. Connect your debug hardware to the client PC.2. From the main menu, select Window > Show View > Other > DS-5 Debugger > Debug Hardware
Firmware Installer to display the view.3. Click Browse and select your debug hardware unit.4. Click Connect to your debug hardware unit.
The current firmware status of your debug hardware is displayed. For example:
Figure 11-65 Debug Hardware Firmware Installer view
11 DS-5 Debug Perspectives and Views11.55 Debug Hardware Firmware Installer view
ARM DUI0446Z Copyright © 2010-2016 ARM Limited or its affiliates. All rightsreserved.
11-384
Non-Confidential
Note
In DS-5, the latest firmware files are available at: DS-5_install_directory\sw\debughw\firmware\. If you want to choose a different firmware file, click Browse and select the new location and file.
5. Click Install. The firmware update process starts. When complete, a message is displayed indicatingthe status of the update.
Debug Hardware Firmware Installer view optionsSelect Debug Hardware
The currently selected debug hardware. You can either enter the IP address or host name of thedebug hardware unit, or use the Browse button and select the debug hardware unit.
BrowseClick to display the Connection Browser dialog. Use it to browse and select the debughardware unit in your local network or one that is connected to a USB port on the hostworkstation.
IdentifyClick to visually identify your debug hardware unit using the indicators available on the debughardware. On RVI, all LEDs on the front panel flash during identification. On DSTREAM, theDSTREAM logo flashes during identification.
ConnectClick to connect to your debug hardware. When connected, the dialog shows the currentfirmware status.
Select Firmware Update FileDS-5 automatically loads the firmware file supplied with your installation. If you want to use adifferent firmware file, use the Browse button and select the firmware file. When the file isselected, the dialog shows the selected firmware update file details.
BrowseClick to browse and select the firmware file.
ClearClick to clear the currently selected debug hardware and firmware file.
InstallClick to install the firmware file on the selected debug hardware.
Firmware file format
Firmware files have the following syntax: ARM-RVI-N.n.p-bld-type.unit
N.n.pIs the version of the firmware. For example, 4.5.0 is the first release of firmware version 4.5.
buildIs a build number.
TypeIs either:
baseThe first release of the firmware for version N.n.
patchUpdates to the corresponding N.n release of the firmware.
unitIdentifies the debug hardware unit, and is one of:
dstreamFor a DSTREAM debug and trace unit.
rviFor an RVI debug unit.
11 DS-5 Debug Perspectives and Views11.55 Debug Hardware Firmware Installer view
ARM DUI0446Z Copyright © 2010-2016 ARM Limited or its affiliates. All rightsreserved.
11-385
Non-Confidential

Related references11.54 Debug Hardware Configure IP view on page 11-382.11.56 Connection Browser dialog box on page 11-387.16.7 Updating multiple debug hardware units on page 16-503.
11 DS-5 Debug Perspectives and Views11.55 Debug Hardware Firmware Installer view
ARM DUI0446Z Copyright © 2010-2016 ARM Limited or its affiliates. All rightsreserved.
11-386
Non-Confidential
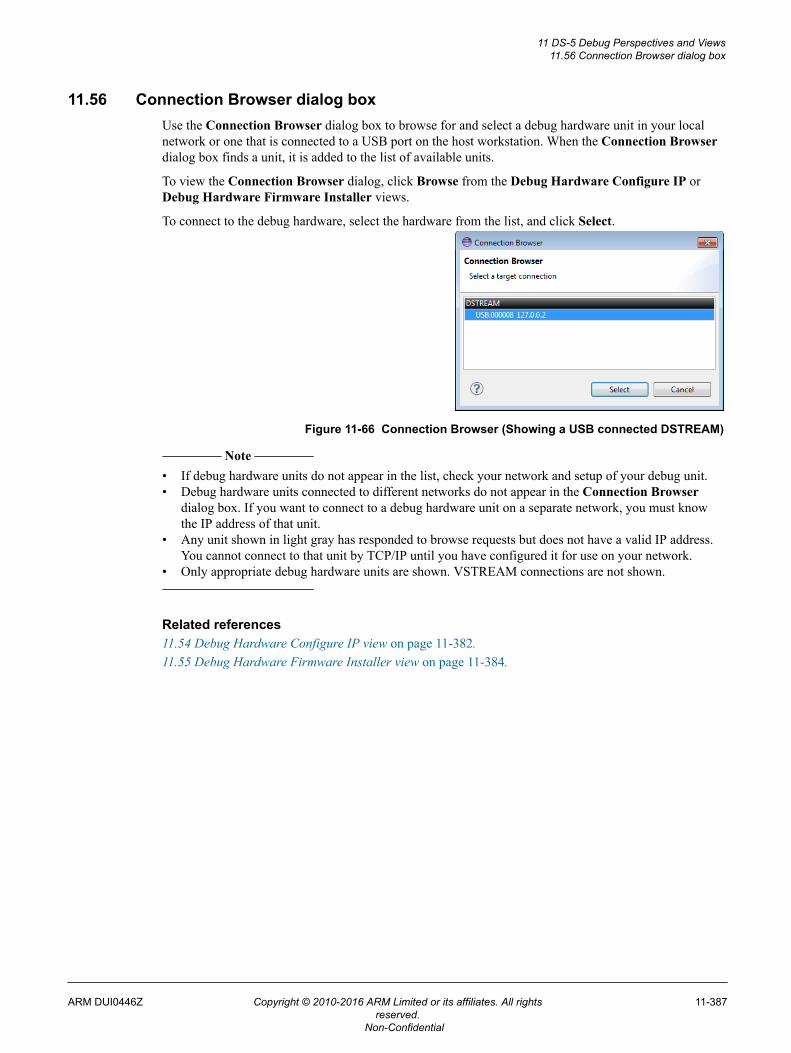
11.56 Connection Browser dialog boxUse the Connection Browser dialog box to browse for and select a debug hardware unit in your localnetwork or one that is connected to a USB port on the host workstation. When the Connection Browserdialog box finds a unit, it is added to the list of available units.
To view the Connection Browser dialog, click Browse from the Debug Hardware Configure IP orDebug Hardware Firmware Installer views.
To connect to the debug hardware, select the hardware from the list, and click Select.
Figure 11-66 Connection Browser (Showing a USB connected DSTREAM)
Note
• If debug hardware units do not appear in the list, check your network and setup of your debug unit.• Debug hardware units connected to different networks do not appear in the Connection Browser
dialog box. If you want to connect to a debug hardware unit on a separate network, you must knowthe IP address of that unit.
• Any unit shown in light gray has responded to browse requests but does not have a valid IP address.You cannot connect to that unit by TCP/IP until you have configured it for use on your network.
• Only appropriate debug hardware units are shown. VSTREAM connections are not shown.
Related references11.54 Debug Hardware Configure IP view on page 11-382.11.55 Debug Hardware Firmware Installer view on page 11-384.
11 DS-5 Debug Perspectives and Views11.56 Connection Browser dialog box
ARM DUI0446Z Copyright © 2010-2016 ARM Limited or its affiliates. All rightsreserved.
11-387
Non-Confidential
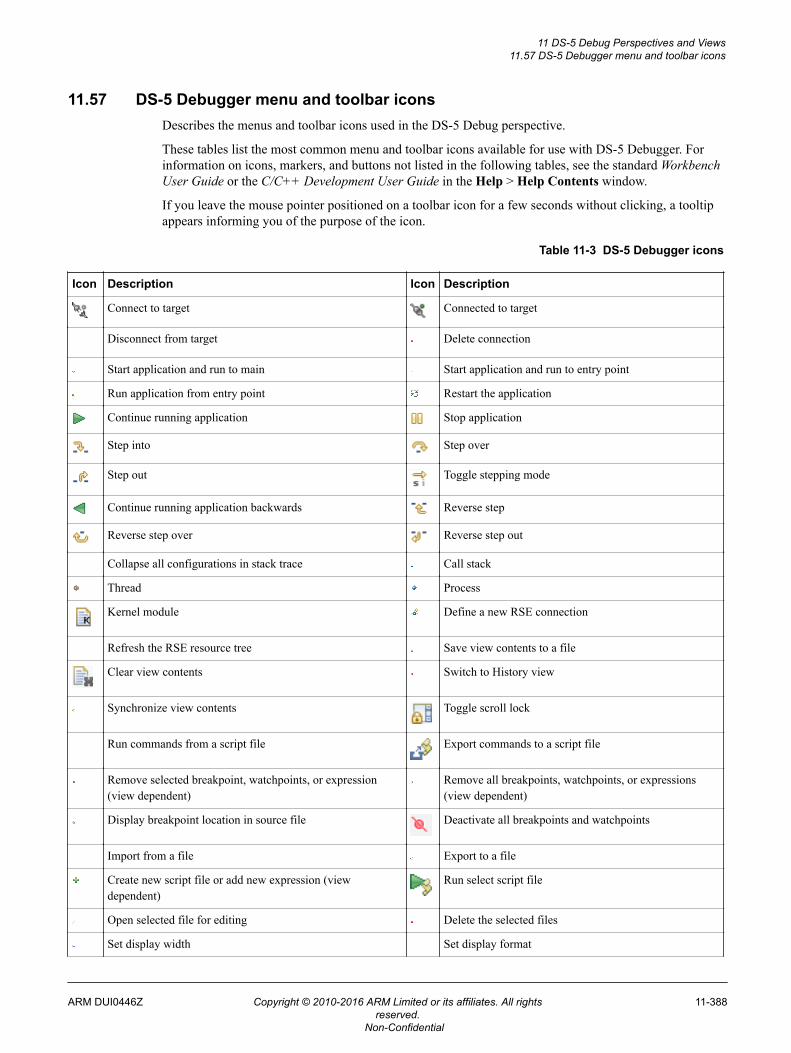
11.57 DS-5 Debugger menu and toolbar iconsDescribes the menus and toolbar icons used in the DS-5 Debug perspective.
These tables list the most common menu and toolbar icons available for use with DS-5 Debugger. Forinformation on icons, markers, and buttons not listed in the following tables, see the standard WorkbenchUser Guide or the C/C++ Development User Guide in the Help > Help Contents window.
If you leave the mouse pointer positioned on a toolbar icon for a few seconds without clicking, a tooltipappears informing you of the purpose of the icon.
Table 11-3 DS-5 Debugger icons
Icon Description Icon Description
Connect to target Connected to target
Disconnect from target Delete connection
Start application and run to main Start application and run to entry point
Run application from entry point Restart the application
Continue running application Stop application
Step into Step over
Step out Toggle stepping mode
Continue running application backwards Reverse step
Reverse step over Reverse step out
Collapse all configurations in stack trace Call stack
Thread Process
Kernel module Define a new RSE connection
Refresh the RSE resource tree Save view contents to a file
Clear view contents Switch to History view
Synchronize view contents Toggle scroll lock
Run commands from a script file Export commands to a script file
Remove selected breakpoint, watchpoints, or expression(view dependent)
Remove all breakpoints, watchpoints, or expressions(view dependent)
Display breakpoint location in source file Deactivate all breakpoints and watchpoints
Import from a file Export to a file
Create new script file or add new expression (viewdependent)
Run select script file
Open selected file for editing Delete the selected files
Set display width Set display format
11 DS-5 Debug Perspectives and Views11.57 DS-5 Debugger menu and toolbar icons
ARM DUI0446Z Copyright © 2010-2016 ARM Limited or its affiliates. All rightsreserved.
11-388
Non-Confidential
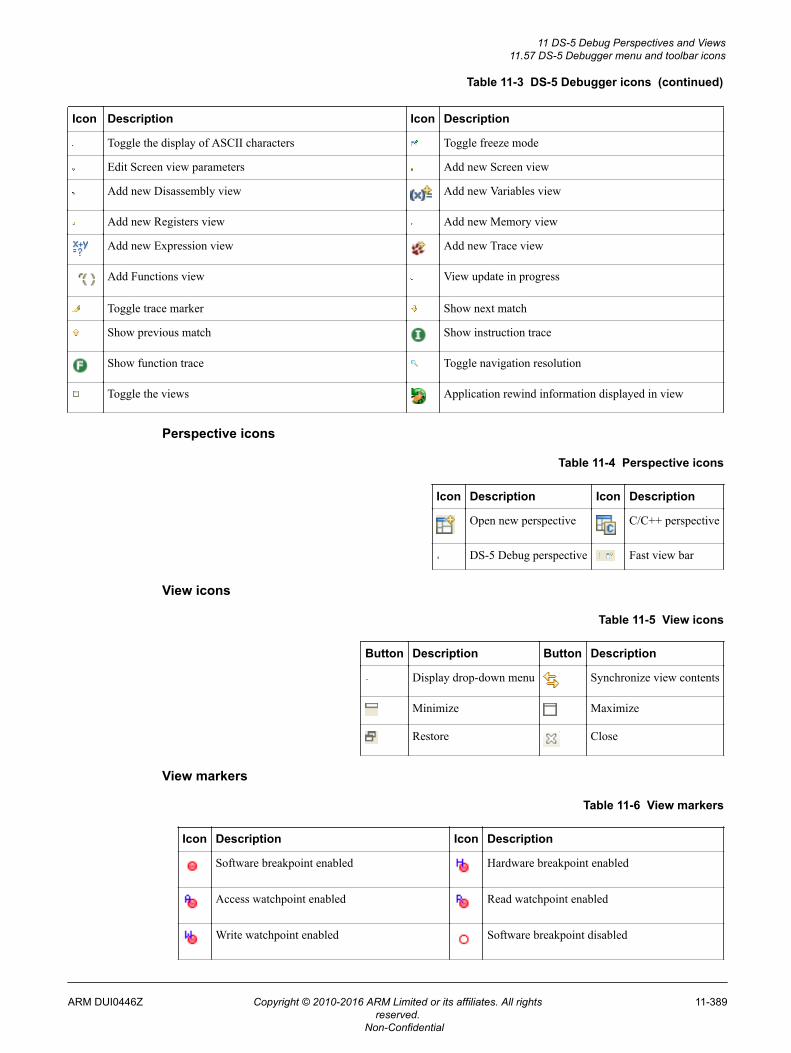
Table 11-3 DS-5 Debugger icons (continued)
Icon Description Icon Description
Toggle the display of ASCII characters Toggle freeze mode
Edit Screen view parameters Add new Screen view
Add new Disassembly view Add new Variables view
Add new Registers view Add new Memory view
Add new Expression view Add new Trace view
Add Functions view View update in progress
Toggle trace marker Show next match
Show previous match Show instruction trace
Show function trace Toggle navigation resolution
Toggle the views Application rewind information displayed in view
Perspective icons
Table 11-4 Perspective icons
Icon Description Icon Description
Open new perspective C/C++ perspective
DS-5 Debug perspective Fast view bar
View icons
Table 11-5 View icons
Button Description Button Description
Display drop-down menu Synchronize view contents
Minimize Maximize
Restore Close
View markers
Table 11-6 View markers
Icon Description Icon Description
Software breakpoint enabled Hardware breakpoint enabled
Access watchpoint enabled Read watchpoint enabled
Write watchpoint enabled Software breakpoint disabled
11 DS-5 Debug Perspectives and Views11.57 DS-5 Debugger menu and toolbar icons
ARM DUI0446Z Copyright © 2010-2016 ARM Limited or its affiliates. All rightsreserved.
11-389
Non-Confidential
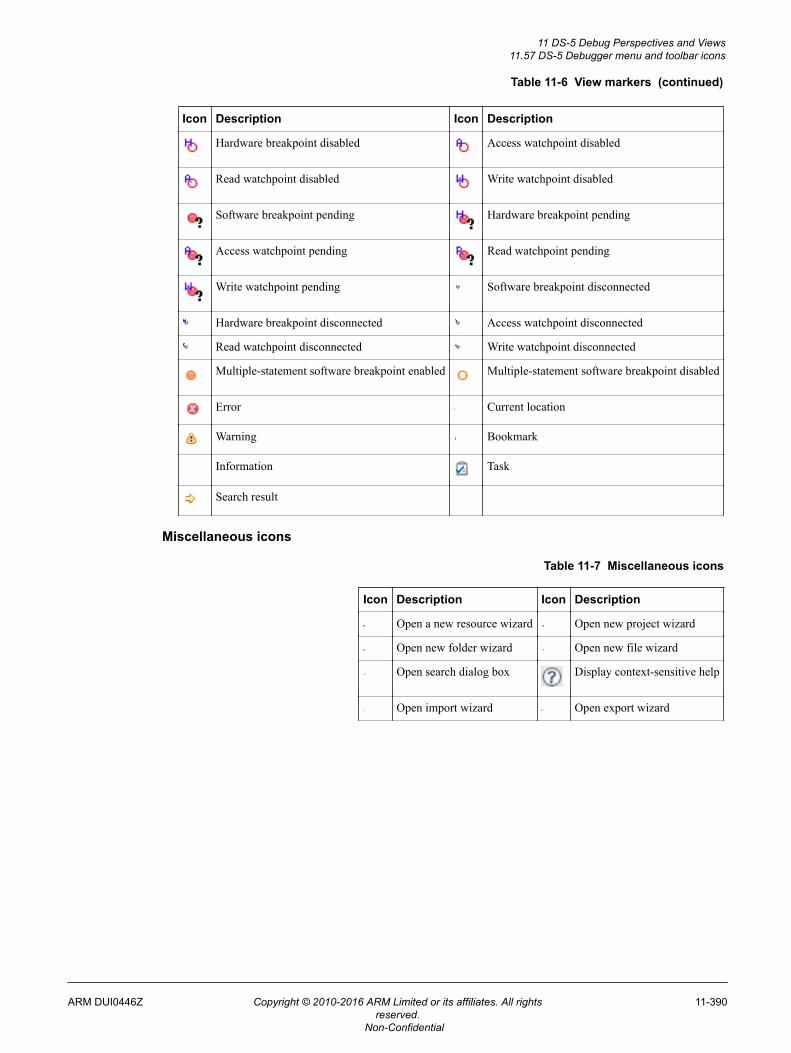
Table 11-6 View markers (continued)
Icon Description Icon Description
Hardware breakpoint disabled Access watchpoint disabled
Read watchpoint disabled Write watchpoint disabled
Software breakpoint pending Hardware breakpoint pending
Access watchpoint pending Read watchpoint pending
Write watchpoint pending Software breakpoint disconnected
Hardware breakpoint disconnected Access watchpoint disconnected
Read watchpoint disconnected Write watchpoint disconnected
Multiple-statement software breakpoint enabled Multiple-statement software breakpoint disabled
Error Current location
Warning Bookmark
Information Task
Search result
Miscellaneous icons
Table 11-7 Miscellaneous icons
Icon Description Icon Description
Open a new resource wizard Open new project wizard
Open new folder wizard Open new file wizard
Open search dialog box Display context-sensitive help
Open import wizard Open export wizard
11 DS-5 Debug Perspectives and Views11.57 DS-5 Debugger menu and toolbar icons
ARM DUI0446Z Copyright © 2010-2016 ARM Limited or its affiliates. All rightsreserved.
11-390
Non-Confidential
Chapter 12Troubleshooting
Describes how to diagnose problems when debugging applications using DS-5 Debugger.
It contains the following sections:• 12.1 ARM Linux problems and solutions on page 12-392.• 12.2 Enabling internal logging from the debugger on page 12-393.• 12.3 Target connection problems and solutions on page 12-394.
ARM DUI0446Z Copyright © 2010-2016 ARM Limited or its affiliates. All rightsreserved.
12-391
Non-Confidential
12.1 ARM Linux problems and solutionsLists possible problems when debugging a Linux application.
You might encounter the following problems when debugging a Linux application.
ARM Linux permission problem
If you receive a permission denied error message when starting an application on the target then youmight have to change the execute permissions on the application. :
chmod +x myImage
A breakpoint is not being hit
You must ensure that the application and shared libraries on your target are the same as those on yourhost. The code layout must be identical, but the application and shared libraries on your target do notrequire debug information.
Operating system support is not active
When Operating System (OS) support is required, the debugger activates it automatically where possible.If OS support is required but cannot be activated, the debugger produces an error. :
ERROR(CMD16-LKN36):! Failed to load image "gator.ko"! Unable to parse module because the operating system support is not active
OS support cannot be activated if:
• debug information in the vmlinux file does not correctly match the data structures in the kernelrunning on the target
• it is manually disabled by using the set os enabled off command.
To determine whether the kernel versions match:• stop the target after loading the vmlinux image• enter the print init_nsproxy.uts_ns->name command• verify that the $1 output is correct. :
$1 = {sysname = "Linux", nodename = "(none)", release = "3.4.0-rc3", version = "#1 SMP Thu Jan 24 00:46:06 GMT 2013", machine = "arm", domainname = "(none)"}
Related tasks2.5 Configuring a connection to a Linux application using gdbserver on page 2-46.2.6 Configuring a connection to a Linux kernel on page 2-48.
12 Troubleshooting12.1 ARM Linux problems and solutions
ARM DUI0446Z Copyright © 2010-2016 ARM Limited or its affiliates. All rightsreserved.
12-392
Non-Confidential
12.2 Enabling internal logging from the debuggerDescribes how to enable internal logging to help diagnose error messages.
On rare occasions an internal error might occur causing the debugger to generate an error messagesuggesting that you report it to your local support representatives. You can help to improve the debuggerby giving feedback with an internal log that captures the stacktrace and shows where in the debugger theerror occurs. To obtain the current version of DS-5, you can select About ARM DS-5 from the Helpmenu in Eclipse or open the product release notes.
To enable internal logging within Eclipse, enter the following in the Commands view of the DS-5 Debugperspective:1. To enable the output of logging messages from the debugger using the predefined DEBUG level
configuration:
log config debug
2. To redirect all logging messages from the debugger to a file:
log file debug.log
Note
Enabling internal logging can produce very large files and slow down the debugger significantly. Onlyenable internal logging when there is a problem.
Related references11.6 Commands view on page 11-275.
12 Troubleshooting12.2 Enabling internal logging from the debugger
ARM DUI0446Z Copyright © 2010-2016 ARM Limited or its affiliates. All rightsreserved.
12-393
Non-Confidential
12.3 Target connection problems and solutionsLists possible problems when connecting to a target.
Failing to make a connectionThe debugger might fail to connect to the selected debug target because of the following reasons:• you do not have a valid license to use the debug target• the debug target is not installed or the connection is disabled• the target hardware is in use by another user• the connection has been left open by software that exited incorrectly• the target has not been configured, or a configuration file cannot be located• the target hardware is not powered up ready for use• the target is on a scan chain that has been claimed for use by something else• the target hardware is not connected• you want to connect through gdbserver but the target is not running gdbserver• there is no ethernet connection from the host to the target• the port number in use by the host and the target are incorrect
Check the target connections and power up state, then try and reconnect to the target.
Debugger connection settingsWhen debugging a bare-metal target the debugger might fail to connect because of the following reasons:• Heap Base address is incorrect• Stack Base (top of memory) address is incorrect• Heap Limit address is incorrect• Incorrect vector catch settings.
Check that the memory map settings are correct for the selected target. If set incorrectly, the applicationmight crash because of stack corruption or because the application overwrites its own code.
Related tasks2.5 Configuring a connection to a Linux application using gdbserver on page 2-46.2.6 Configuring a connection to a Linux kernel on page 2-48.
12 Troubleshooting12.3 Target connection problems and solutions
ARM DUI0446Z Copyright © 2010-2016 ARM Limited or its affiliates. All rightsreserved.
12-394
Non-Confidential
Chapter 13File-based Flash Programming in ARM DS-5
Describes the file-based flash programming options available in DS-5.
It contains the following sections:• 13.1 About file-based flash programming in ARM® DS-5 on page 13-396.• 13.2 Flash programming configuration on page 13-398.• 13.3 Creating an extension database for flash programming on page 13-400.• 13.4 About using or extending the supplied ARM® Keil® flash method on page 13-401.• 13.5 About creating a new flash method on page 13-403.• 13.6 About testing the flash configuration on page 13-407.• 13.7 About flash method parameters on page 13-408.• 13.8 About getting data to the flash algorithm on page 13-409.• 13.9 About interacting with the target on page 13-410.
ARM DUI0446Z Copyright © 2010-2016 ARM Limited or its affiliates. All rightsreserved.
13-395
Non-Confidential
13.1 About file-based flash programming in ARM® DS-5The DS-5 configdb platform entry for a board can contain a flash definition section. This section candefine one or more areas of flash, each with its own flash method and configuration parameters.
Flash methods are implemented in Jython and are typically located within the configdb. Each flashmethod is implemented with a specific technique of programming flash.
These techniques might involve:
• Running an external program supplied by a third party to program a file into flash.• Copying a file to a file system mount point. For example, as implemented in the ARM Versatile
Express designs.• Download a code algorithm into the target system and to keep running that algorithm on a data set
(typically a flash sector) until the entire flash device has been programmed.
Note
You can use the DS-5 Debugger info flash command to view the flash configuration for your board.
Examples of downloading a code algorithm into the target system are the Keil flash programmingalgorithms which are fully supported by DS-5 Debugger. For the Keil flash method, one of the methodconfiguration items is the algorithm to use to perform the flash programming. These algorithms allfollow the same top level software interface and so the same DS-5 Keil flash method can be used toprogram different types of flash. This means that DS-5 Debugger should be able to make direct use ofany existing Keil flash algorithm.
Note
All flash methods which directly interact with the target should do so using the DS-5 Debugger's DTSLconnection.
Flash programming supported featuresThe following features are available in file flash programming operations:• Supports ELF files (.axf) programming into flash.• Supports ELF files containing multiple flash areas which can each be programmed into a flash device
or possible several different flash devices.• Supports many and varied flash programming methods.• Supports all Keil flash programming algorithms.• Supports target board setup and teardown to prepare it for flash programming.• Supports DS-5 configuration database to learn about target flash devices and the options required for
flash programming on a specific board or system on chip.• Supports default flash options modification.• Supports graphical progress reporting within Eclipse and on a text only type console when used with
the debugger outside Eclipse, along with the ability to cancel the programming operation.• Supports a simple flash programming user interface where you can specify minimal configurations or
options.• Supports displaying warning and error messages to the user.
Note
An example, flash_example-FVP-A9x4, is provided with DS-5. This example shows two ways ofprogramming flash devices using DS-5, one using a Keil Flash Method and the other using a CustomFlash Method written in Jython. For convenience, the Cortex-A9x4 FVP model supplied with DS-5 isused as the target device. This example can be used as a template for creating new flash algorithms. Thereadme.html provided with the example contains basic information on how to use the example.
13 File-based Flash Programming in ARM DS-513.1 About file-based flash programming in ARM® DS-5
ARM DUI0446Z Copyright © 2010-2016 ARM Limited or its affiliates. All rightsreserved.
13-396
Non-Confidential
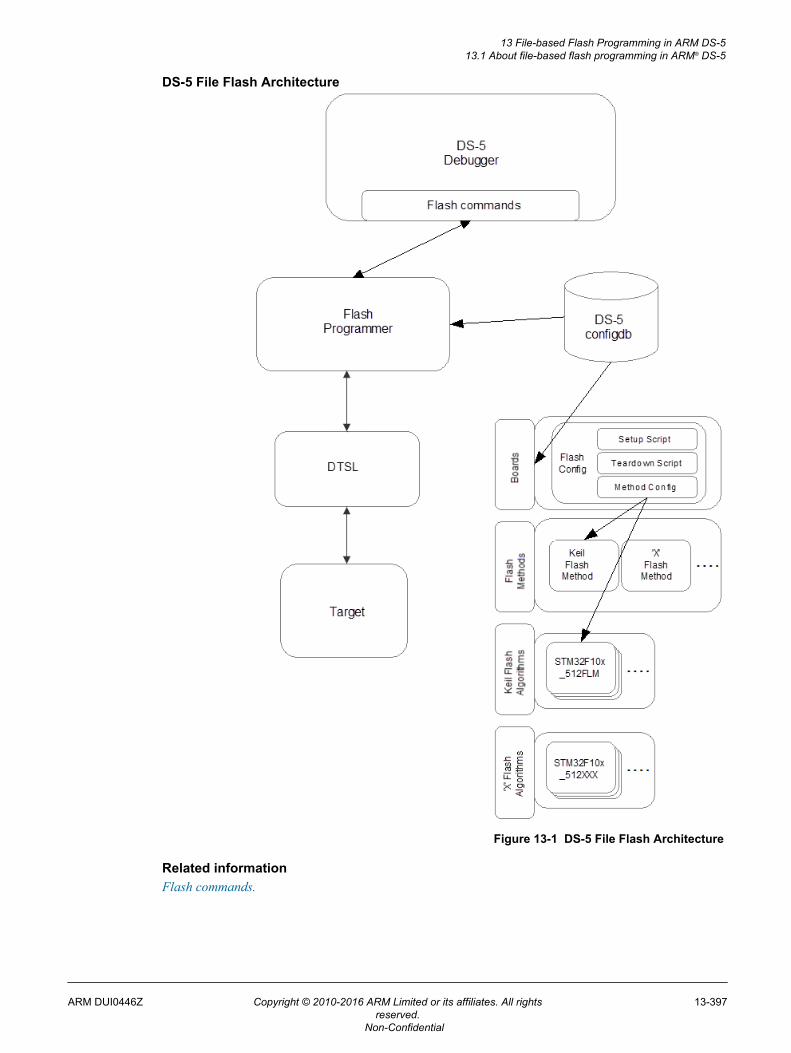
DS-5 File Flash Architecture
Figure 13-1 DS-5 File Flash Architecture
Related informationFlash commands.
13 File-based Flash Programming in ARM DS-513.1 About file-based flash programming in ARM® DS-5
ARM DUI0446Z Copyright © 2010-2016 ARM Limited or its affiliates. All rightsreserved.
13-397
Non-Confidential
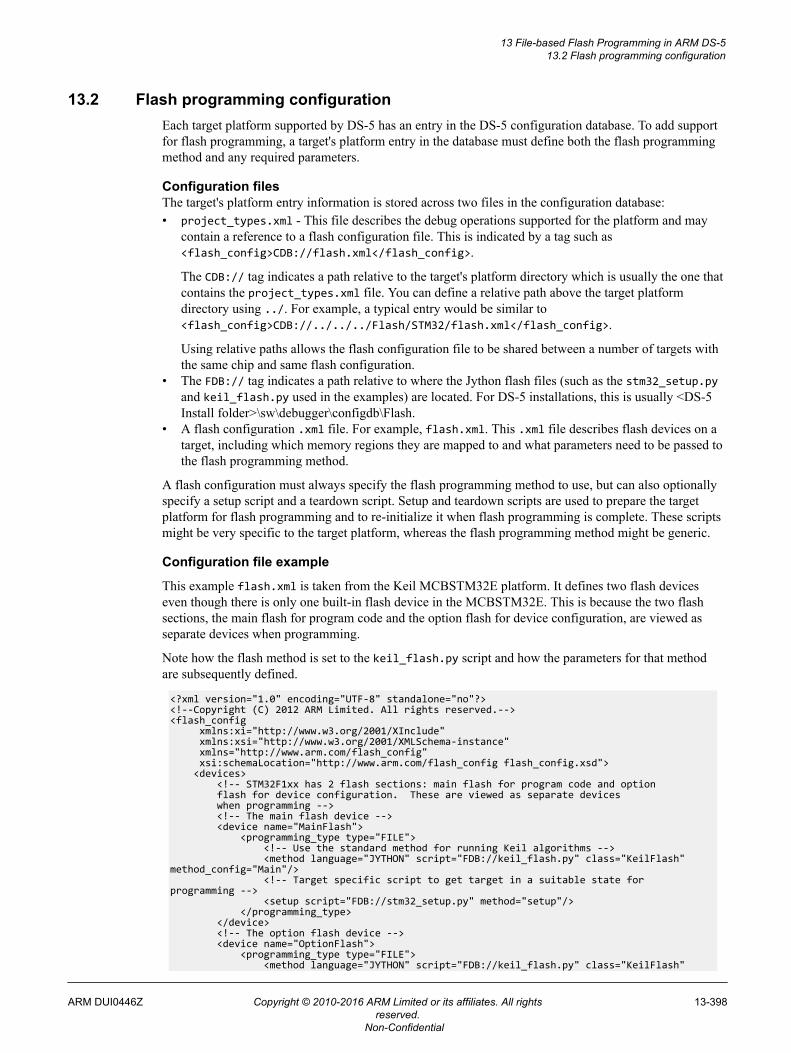
13.2 Flash programming configurationEach target platform supported by DS-5 has an entry in the DS-5 configuration database. To add supportfor flash programming, a target's platform entry in the database must define both the flash programmingmethod and any required parameters.
Configuration filesThe target's platform entry information is stored across two files in the configuration database:• project_types.xml - This file describes the debug operations supported for the platform and may
contain a reference to a flash configuration file. This is indicated by a tag such as<flash_config>CDB://flash.xml</flash_config>.
The CDB:// tag indicates a path relative to the target's platform directory which is usually the one thatcontains the project_types.xml file. You can define a relative path above the target platformdirectory using ../. For example, a typical entry would be similar to<flash_config>CDB://../../../Flash/STM32/flash.xml</flash_config>.
Using relative paths allows the flash configuration file to be shared between a number of targets withthe same chip and same flash configuration.
• The FDB:// tag indicates a path relative to where the Jython flash files (such as the stm32_setup.pyand keil_flash.py used in the examples) are located. For DS-5 installations, this is usually <DS-5Install folder>\sw\debugger\configdb\Flash.
• A flash configuration .xml file. For example, flash.xml. This .xml file describes flash devices on atarget, including which memory regions they are mapped to and what parameters need to be passed tothe flash programming method.
A flash configuration must always specify the flash programming method to use, but can also optionallyspecify a setup script and a teardown script. Setup and teardown scripts are used to prepare the targetplatform for flash programming and to re-initialize it when flash programming is complete. These scriptsmight be very specific to the target platform, whereas the flash programming method might be generic.
Configuration file example
This example flash.xml is taken from the Keil MCBSTM32E platform. It defines two flash deviceseven though there is only one built-in flash device in the MCBSTM32E. This is because the two flashsections, the main flash for program code and the option flash for device configuration, are viewed asseparate devices when programming.
Note how the flash method is set to the keil_flash.py script and how the parameters for that methodare subsequently defined.
<?xml version="1.0" encoding="UTF-8" standalone="no"?><!--Copyright (C) 2012 ARM Limited. All rights reserved.--><flash_config xmlns:xi="http://www.w3.org/2001/XInclude" xmlns:xsi="http://www.w3.org/2001/XMLSchema-instance" xmlns="http://www.arm.com/flash_config" xsi:schemaLocation="http://www.arm.com/flash_config flash_config.xsd"> <devices> <!-- STM32F1xx has 2 flash sections: main flash for program code and option flash for device configuration. These are viewed as separate devices when programming --> <!-- The main flash device --> <device name="MainFlash"> <programming_type type="FILE"> <!-- Use the standard method for running Keil algorithms --> <method language="JYTHON" script="FDB://keil_flash.py" class="KeilFlash" method_config="Main"/> <!-- Target specific script to get target in a suitable state for programming --> <setup script="FDB://stm32_setup.py" method="setup"/> </programming_type> </device> <!-- The option flash device --> <device name="OptionFlash"> <programming_type type="FILE"> <method language="JYTHON" script="FDB://keil_flash.py" class="KeilFlash"
13 File-based Flash Programming in ARM DS-513.2 Flash programming configuration
ARM DUI0446Z Copyright © 2010-2016 ARM Limited or its affiliates. All rightsreserved.
13-398
Non-Confidential
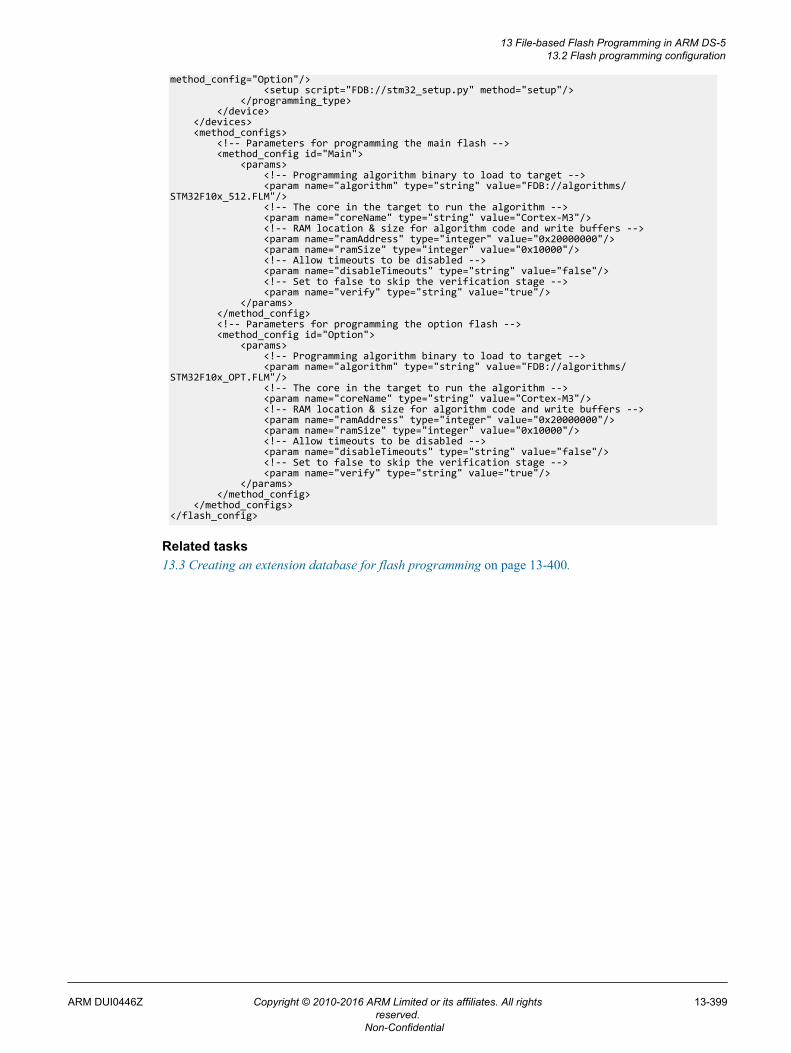
method_config="Option"/> <setup script="FDB://stm32_setup.py" method="setup"/> </programming_type> </device> </devices> <method_configs> <!-- Parameters for programming the main flash --> <method_config id="Main"> <params> <!-- Programming algorithm binary to load to target --> <param name="algorithm" type="string" value="FDB://algorithms/STM32F10x_512.FLM"/> <!-- The core in the target to run the algorithm --> <param name="coreName" type="string" value="Cortex-M3"/> <!-- RAM location & size for algorithm code and write buffers --> <param name="ramAddress" type="integer" value="0x20000000"/> <param name="ramSize" type="integer" value="0x10000"/> <!-- Allow timeouts to be disabled --> <param name="disableTimeouts" type="string" value="false"/> <!-- Set to false to skip the verification stage --> <param name="verify" type="string" value="true"/> </params> </method_config> <!-- Parameters for programming the option flash --> <method_config id="Option"> <params> <!-- Programming algorithm binary to load to target --> <param name="algorithm" type="string" value="FDB://algorithms/STM32F10x_OPT.FLM"/> <!-- The core in the target to run the algorithm --> <param name="coreName" type="string" value="Cortex-M3"/> <!-- RAM location & size for algorithm code and write buffers --> <param name="ramAddress" type="integer" value="0x20000000"/> <param name="ramSize" type="integer" value="0x10000"/> <!-- Allow timeouts to be disabled --> <param name="disableTimeouts" type="string" value="false"/> <!-- Set to false to skip the verification stage --> <param name="verify" type="string" value="true"/> </params> </method_config> </method_configs></flash_config>
Related tasks13.3 Creating an extension database for flash programming on page 13-400.
13 File-based Flash Programming in ARM DS-513.2 Flash programming configuration
ARM DUI0446Z Copyright © 2010-2016 ARM Limited or its affiliates. All rightsreserved.
13-399
Non-Confidential
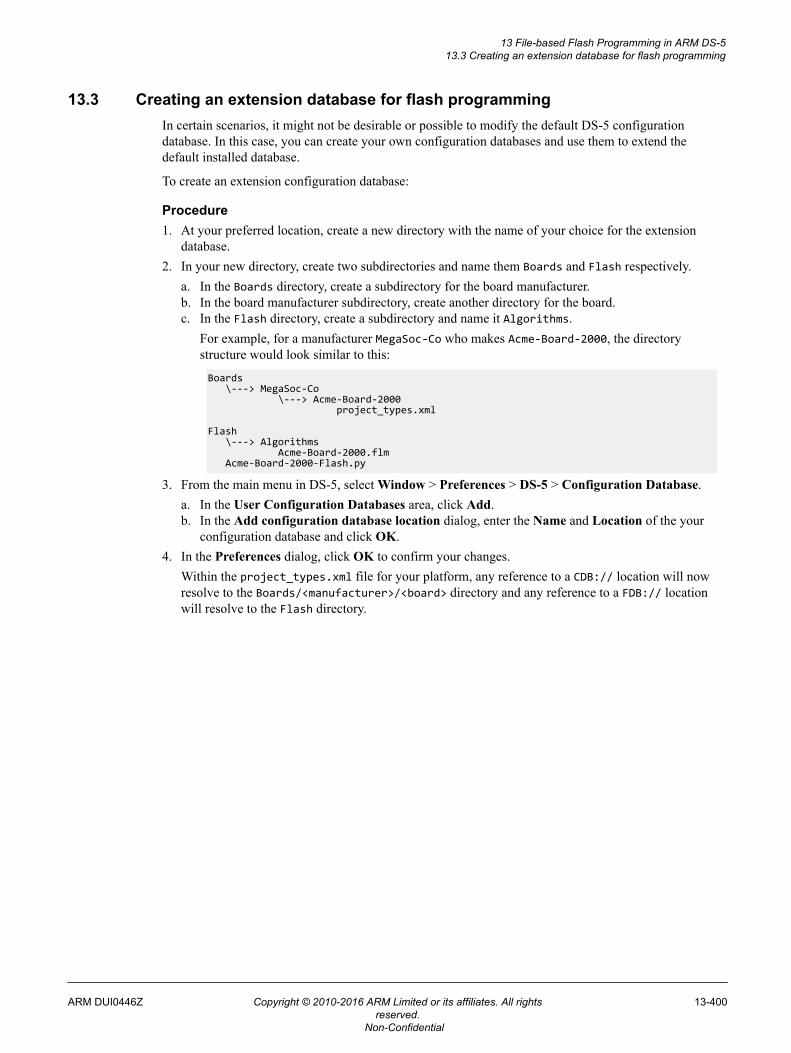
13.3 Creating an extension database for flash programmingIn certain scenarios, it might not be desirable or possible to modify the default DS-5 configurationdatabase. In this case, you can create your own configuration databases and use them to extend thedefault installed database.
To create an extension configuration database:
Procedure1. At your preferred location, create a new directory with the name of your choice for the extension
database.2. In your new directory, create two subdirectories and name them Boards and Flash respectively.
a. In the Boards directory, create a subdirectory for the board manufacturer.b. In the board manufacturer subdirectory, create another directory for the board.c. In the Flash directory, create a subdirectory and name it Algorithms.
For example, for a manufacturer MegaSoc-Co who makes Acme-Board-2000, the directorystructure would look similar to this:
Boards \---> MegaSoc-Co \---> Acme-Board-2000 project_types.xml
Flash \---> Algorithms Acme-Board-2000.flm Acme-Board-2000-Flash.py
3. From the main menu in DS-5, select Window > Preferences > DS-5 > Configuration Database.a. In the User Configuration Databases area, click Add.b. In the Add configuration database location dialog, enter the Name and Location of the your
configuration database and click OK.4. In the Preferences dialog, click OK to confirm your changes.
Within the project_types.xml file for your platform, any reference to a CDB:// location will nowresolve to the Boards/<manufacturer>/<board> directory and any reference to a FDB:// locationwill resolve to the Flash directory.
13 File-based Flash Programming in ARM DS-513.3 Creating an extension database for flash programming
ARM DUI0446Z Copyright © 2010-2016 ARM Limited or its affiliates. All rightsreserved.
13-400
Non-Confidential
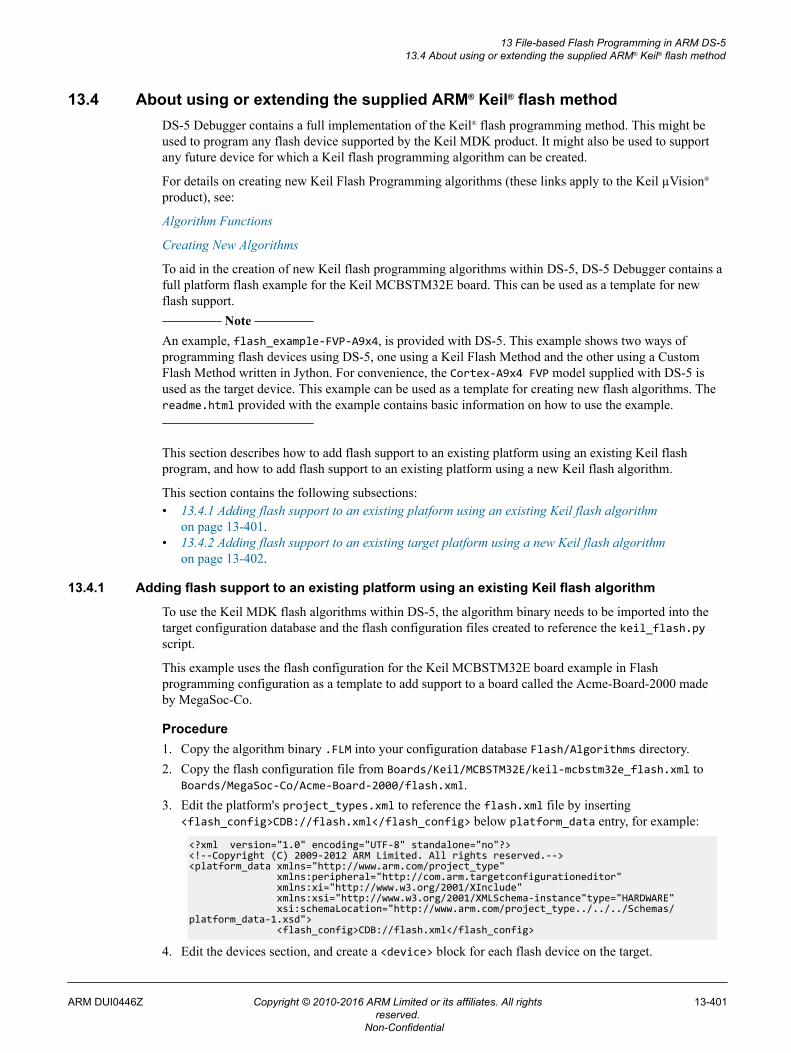
13.4 About using or extending the supplied ARM® Keil® flash methodDS-5 Debugger contains a full implementation of the Keil® flash programming method. This might beused to program any flash device supported by the Keil MDK product. It might also be used to supportany future device for which a Keil flash programming algorithm can be created.
For details on creating new Keil Flash Programming algorithms (these links apply to the Keil µVision®
product), see:
Algorithm Functions
Creating New Algorithms
To aid in the creation of new Keil flash programming algorithms within DS-5, DS-5 Debugger contains afull platform flash example for the Keil MCBSTM32E board. This can be used as a template for newflash support.
Note
An example, flash_example-FVP-A9x4, is provided with DS-5. This example shows two ways ofprogramming flash devices using DS-5, one using a Keil Flash Method and the other using a CustomFlash Method written in Jython. For convenience, the Cortex-A9x4 FVP model supplied with DS-5 isused as the target device. This example can be used as a template for creating new flash algorithms. Thereadme.html provided with the example contains basic information on how to use the example.
This section describes how to add flash support to an existing platform using an existing Keil flashprogram, and how to add flash support to an existing platform using a new Keil flash algorithm.
This section contains the following subsections:• 13.4.1 Adding flash support to an existing platform using an existing Keil flash algorithm
on page 13-401.• 13.4.2 Adding flash support to an existing target platform using a new Keil flash algorithm
on page 13-402.
13.4.1 Adding flash support to an existing platform using an existing Keil flash algorithm
To use the Keil MDK flash algorithms within DS-5, the algorithm binary needs to be imported into thetarget configuration database and the flash configuration files created to reference the keil_flash.pyscript.
This example uses the flash configuration for the Keil MCBSTM32E board example in Flashprogramming configuration as a template to add support to a board called the Acme-Board-2000 madeby MegaSoc-Co.
Procedure1. Copy the algorithm binary .FLM into your configuration database Flash/Algorithms directory.2. Copy the flash configuration file from Boards/Keil/MCBSTM32E/keil-mcbstm32e_flash.xml to
Boards/MegaSoc-Co/Acme-Board-2000/flash.xml.3. Edit the platform's project_types.xml to reference the flash.xml file by inserting
<flash_config>CDB://flash.xml</flash_config> below platform_data entry, for example:
<?xml version="1.0" encoding="UTF-8" standalone="no"?><!--Copyright (C) 2009-2012 ARM Limited. All rights reserved.--><platform_data xmlns="http://www.arm.com/project_type" xmlns:peripheral="http://com.arm.targetconfigurationeditor" xmlns:xi="http://www.w3.org/2001/XInclude" xmlns:xsi="http://www.w3.org/2001/XMLSchema-instance"type="HARDWARE" xsi:schemaLocation="http://www.arm.com/project_type../../../Schemas/platform_data-1.xsd"> <flash_config>CDB://flash.xml</flash_config>
4. Edit the devices section, and create a <device> block for each flash device on the target.
13 File-based Flash Programming in ARM DS-513.4 About using or extending the supplied ARM® Keil® flash method
ARM DUI0446Z Copyright © 2010-2016 ARM Limited or its affiliates. All rightsreserved.
13-401
Non-Confidential
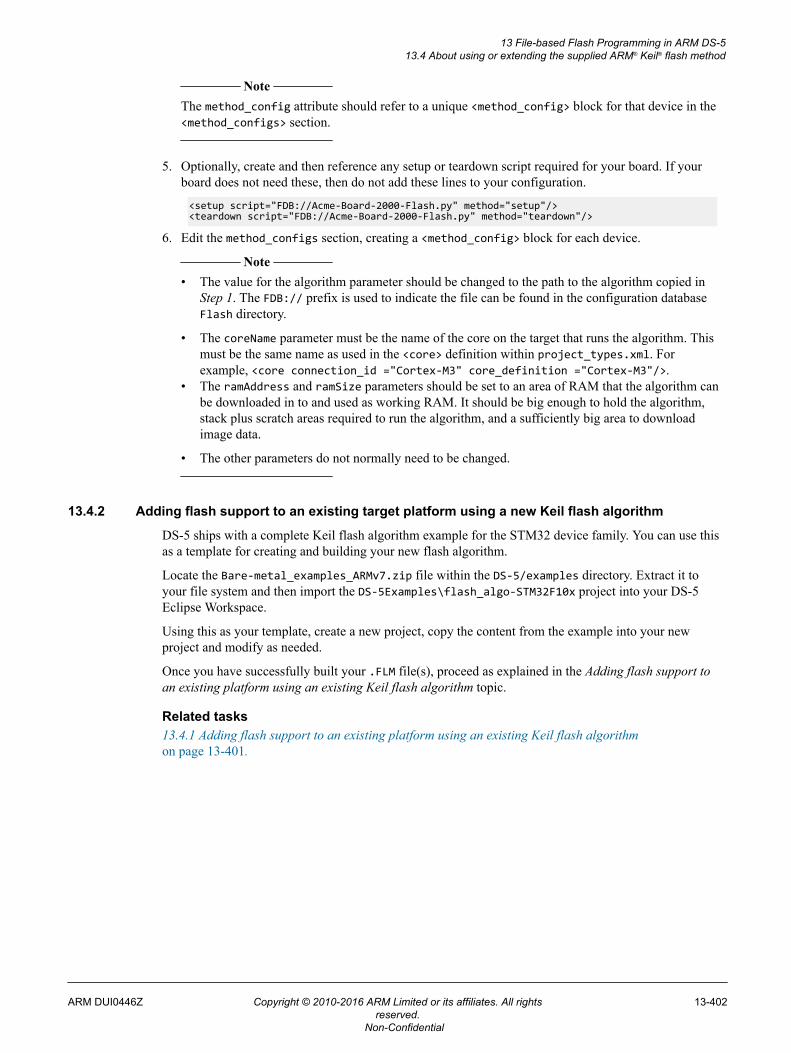
Note
The method_config attribute should refer to a unique <method_config> block for that device in the<method_configs> section.
5. Optionally, create and then reference any setup or teardown script required for your board. If yourboard does not need these, then do not add these lines to your configuration.
<setup script="FDB://Acme-Board-2000-Flash.py" method="setup"/><teardown script="FDB://Acme-Board-2000-Flash.py" method="teardown"/>
6. Edit the method_configs section, creating a <method_config> block for each device. Note
• The value for the algorithm parameter should be changed to the path to the algorithm copied inStep 1. The FDB:// prefix is used to indicate the file can be found in the configuration databaseFlash directory.
• The coreName parameter must be the name of the core on the target that runs the algorithm. Thismust be the same name as used in the <core> definition within project_types.xml. Forexample, <core connection_id ="Cortex-M3" core_definition ="Cortex-M3"/>.
• The ramAddress and ramSize parameters should be set to an area of RAM that the algorithm canbe downloaded in to and used as working RAM. It should be big enough to hold the algorithm,stack plus scratch areas required to run the algorithm, and a sufficiently big area to downloadimage data.
• The other parameters do not normally need to be changed.
13.4.2 Adding flash support to an existing target platform using a new Keil flash algorithm
DS-5 ships with a complete Keil flash algorithm example for the STM32 device family. You can use thisas a template for creating and building your new flash algorithm.
Locate the Bare-metal_examples_ARMv7.zip file within the DS-5/examples directory. Extract it toyour file system and then import the DS-5Examples\flash_algo-STM32F10x project into your DS-5Eclipse Workspace.
Using this as your template, create a new project, copy the content from the example into your newproject and modify as needed.
Once you have successfully built your .FLM file(s), proceed as explained in the Adding flash support toan existing platform using an existing Keil flash algorithm topic.
Related tasks13.4.1 Adding flash support to an existing platform using an existing Keil flash algorithmon page 13-401.
13 File-based Flash Programming in ARM DS-513.4 About using or extending the supplied ARM® Keil® flash method
ARM DUI0446Z Copyright © 2010-2016 ARM Limited or its affiliates. All rightsreserved.
13-402
Non-Confidential
13.5 About creating a new flash methodIf the Keil flash method is inappropriate for your requirements, it is necessary to create a new customflash method for your use.
Programming methods are implemented in Jython (Python, utilizing the Jython runtime). The use ofJython allows access to the DTSL APIs used by DS-5 Debugger. DS-5 includes the PyDev tools to assistin writing Python scripts.
In a DS-5 install, the configdb\Flash\flashprogrammer directory holds a number of Python fileswhich contain utility methods used in the examples.
This section describes a default implementation of com.arm.debug.flashprogrammer.FlashMethodv1and creating a flash method using a Python script.
This section contains the following subsections:• 13.5.1 About using the default implementation FlashMethodv1 on page 13-403.• 13.5.2 About creating the flash method Python script on page 13-404.
13.5.1 About using the default implementation FlashMethodv1
Flash programming methods are written as Python classes that are required to implement thecom.arm.debug.flashprogrammer.IFlashMethod interface. This interface defines the methods theflash programming layer of DS-5 Debugger might invoke.
See the flash_method_v1.py file in the <Install folder>\sw\debugger\configdb\Flash\flashprogrammer for a default implementation ofcom.arm.debug.flashprogrammer.FlashMethodv1. This has empty implementations of all functions -this allows a Python class derived from this object to only implement the required functions.
Running a flash programming method is split into three phases:1. Setup - the setup() function prepares the target for performing flash programming. This might
involve:• Reading and validating parameters passed from the configuration file.• Opening a connection to the target.• Preparing the target state, for example, to initialize the flash controller.• Loading any flash programming algorithms to the target.
2. Programming - the program() function is called for each section of data to be written. Images mighthave multiple load regions, so the program() function might be called several times. The data towrite is passed to this function and the method writes the data into flash at this stage.
3. Teardown - the teardown() function is called after all sections have been programmed. At this stage,the target state can be restored (for example, take the flash controller out of write mode or reset thetarget) and any debug connection closed.
Note
The setup() and teardown() functions are not to be confused with the target platform optionalsetup() and teardown() scripts. The setup() and teardown() functions defined in the flashmethod class are for the method itself and not the board.
13 File-based Flash Programming in ARM DS-513.5 About creating a new flash method
ARM DUI0446Z Copyright © 2010-2016 ARM Limited or its affiliates. All rightsreserved.
13-403
Non-Confidential
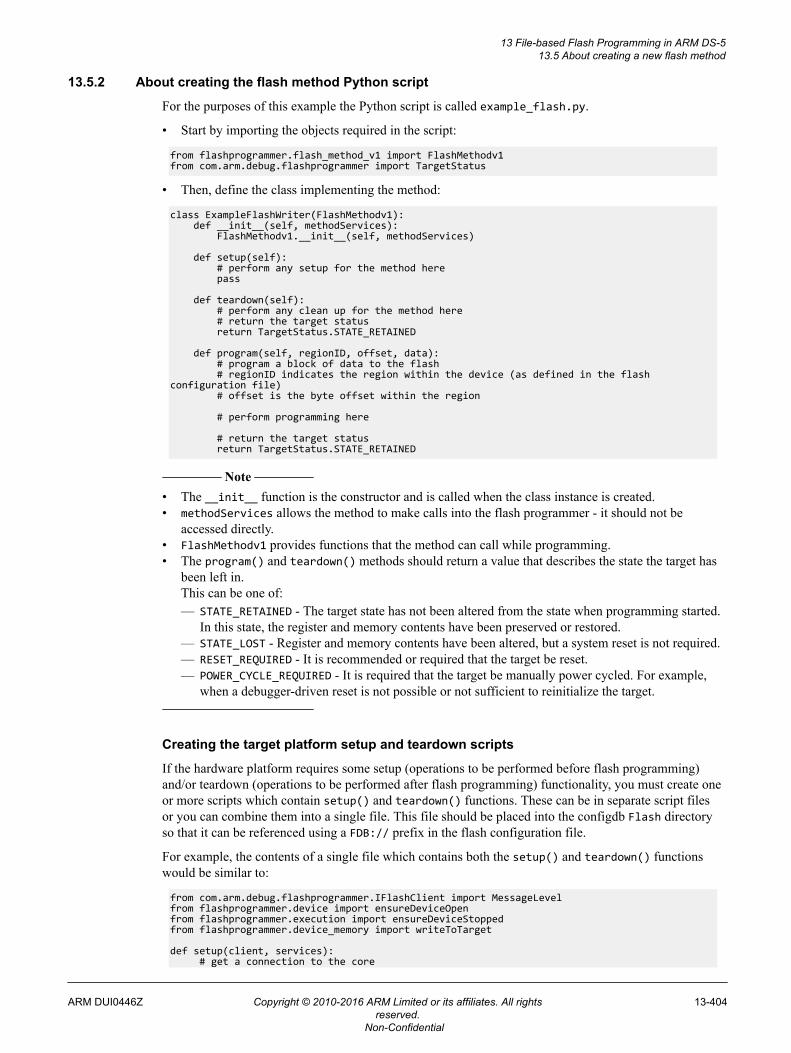
13.5.2 About creating the flash method Python script
For the purposes of this example the Python script is called example_flash.py.
• Start by importing the objects required in the script:
from flashprogrammer.flash_method_v1 import FlashMethodv1from com.arm.debug.flashprogrammer import TargetStatus
• Then, define the class implementing the method:
class ExampleFlashWriter(FlashMethodv1): def __init__(self, methodServices): FlashMethodv1.__init__(self, methodServices) def setup(self): # perform any setup for the method here pass def teardown(self): # perform any clean up for the method here # return the target status return TargetStatus.STATE_RETAINED def program(self, regionID, offset, data): # program a block of data to the flash # regionID indicates the region within the device (as defined in the flash configuration file) # offset is the byte offset within the region # perform programming here # return the target status return TargetStatus.STATE_RETAINED
Note
• The __init__ function is the constructor and is called when the class instance is created.• methodServices allows the method to make calls into the flash programmer - it should not be
accessed directly.• FlashMethodv1 provides functions that the method can call while programming.• The program() and teardown() methods should return a value that describes the state the target has
been left in.This can be one of:— STATE_RETAINED - The target state has not been altered from the state when programming started.
In this state, the register and memory contents have been preserved or restored.— STATE_LOST - Register and memory contents have been altered, but a system reset is not required.— RESET_REQUIRED - It is recommended or required that the target be reset.— POWER_CYCLE_REQUIRED - It is required that the target be manually power cycled. For example,
when a debugger-driven reset is not possible or not sufficient to reinitialize the target.
Creating the target platform setup and teardown scripts
If the hardware platform requires some setup (operations to be performed before flash programming)and/or teardown (operations to be performed after flash programming) functionality, you must create oneor more scripts which contain setup() and teardown() functions. These can be in separate script filesor you can combine them into a single file. This file should be placed into the configdb Flash directoryso that it can be referenced using a FDB:// prefix in the flash configuration file.
For example, the contents of a single file which contains both the setup() and teardown() functionswould be similar to:
from com.arm.debug.flashprogrammer.IFlashClient import MessageLevel from flashprogrammer.device import ensureDeviceOpen from flashprogrammer.execution import ensureDeviceStopped from flashprogrammer.device_memory import writeToTarget
def setup(client, services): # get a connection to the core
13 File-based Flash Programming in ARM DS-513.5 About creating a new flash method
ARM DUI0446Z Copyright © 2010-2016 ARM Limited or its affiliates. All rightsreserved.
13-404
Non-Confidential
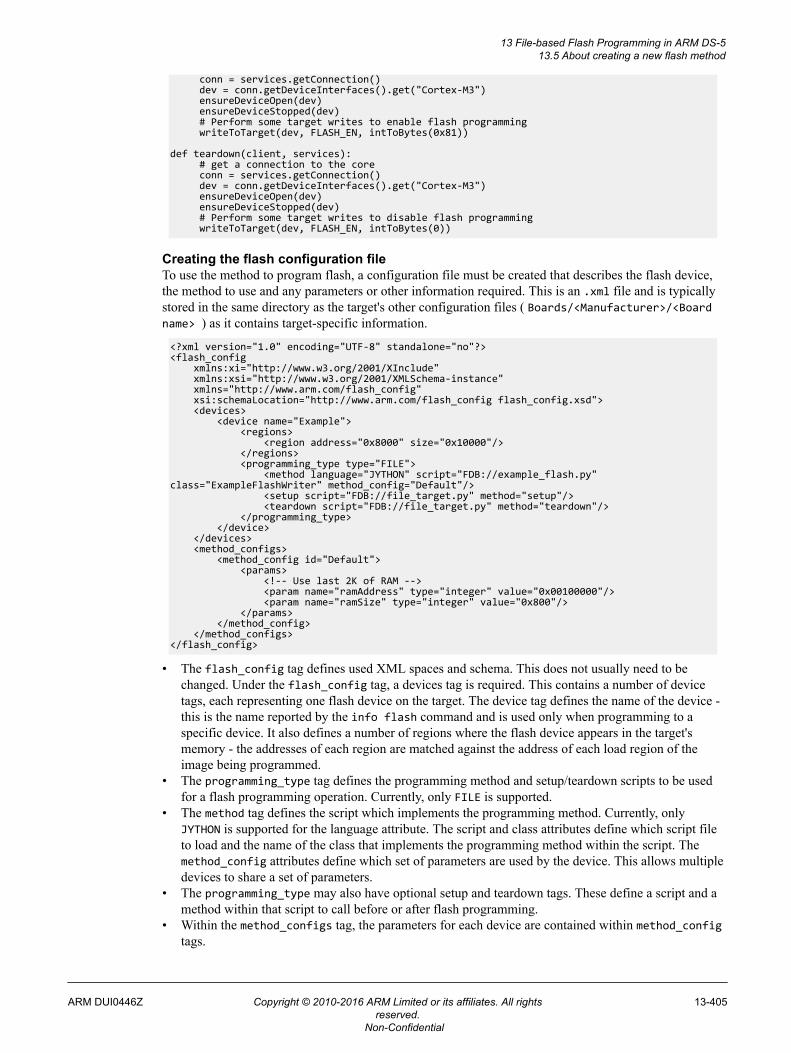
conn = services.getConnection() dev = conn.getDeviceInterfaces().get("Cortex-M3") ensureDeviceOpen(dev) ensureDeviceStopped(dev) # Perform some target writes to enable flash programming writeToTarget(dev, FLASH_EN, intToBytes(0x81))
def teardown(client, services): # get a connection to the core conn = services.getConnection() dev = conn.getDeviceInterfaces().get("Cortex-M3") ensureDeviceOpen(dev) ensureDeviceStopped(dev) # Perform some target writes to disable flash programming writeToTarget(dev, FLASH_EN, intToBytes(0))
Creating the flash configuration fileTo use the method to program flash, a configuration file must be created that describes the flash device,the method to use and any parameters or other information required. This is an .xml file and is typicallystored in the same directory as the target's other configuration files ( Boards/<Manufacturer>/<Boardname> ) as it contains target-specific information.
<?xml version="1.0" encoding="UTF-8" standalone="no"?> <flash_config xmlns:xi="http://www.w3.org/2001/XInclude" xmlns:xsi="http://www.w3.org/2001/XMLSchema-instance" xmlns="http://www.arm.com/flash_config" xsi:schemaLocation="http://www.arm.com/flash_config flash_config.xsd"> <devices> <device name="Example"> <regions> <region address="0x8000" size="0x10000"/> </regions> <programming_type type="FILE"> <method language="JYTHON" script="FDB://example_flash.py" class="ExampleFlashWriter" method_config="Default"/> <setup script="FDB://file_target.py" method="setup"/> <teardown script="FDB://file_target.py" method="teardown"/> </programming_type> </device> </devices> <method_configs> <method_config id="Default"> <params> <!-- Use last 2K of RAM --> <param name="ramAddress" type="integer" value="0x00100000"/> <param name="ramSize" type="integer" value="0x800"/> </params> </method_config> </method_configs> </flash_config>
• The flash_config tag defines used XML spaces and schema. This does not usually need to bechanged. Under the flash_config tag, a devices tag is required. This contains a number of devicetags, each representing one flash device on the target. The device tag defines the name of the device -this is the name reported by the info flash command and is used only when programming to aspecific device. It also defines a number of regions where the flash device appears in the target'smemory - the addresses of each region are matched against the address of each load region of theimage being programmed.
• The programming_type tag defines the programming method and setup/teardown scripts to be usedfor a flash programming operation. Currently, only FILE is supported.
• The method tag defines the script which implements the programming method. Currently, onlyJYTHON is supported for the language attribute. The script and class attributes define which script fileto load and the name of the class that implements the programming method within the script. Themethod_config attributes define which set of parameters are used by the device. This allows multipledevices to share a set of parameters.
• The programming_type may also have optional setup and teardown tags. These define a script and amethod within that script to call before or after flash programming.
• Within the method_configs tag, the parameters for each device are contained within method_configtags.
13 File-based Flash Programming in ARM DS-513.5 About creating a new flash method
ARM DUI0446Z Copyright © 2010-2016 ARM Limited or its affiliates. All rightsreserved.
13-405
Non-Confidential
• Parameters must have a unique name and a default value. You can override the value passed to themethod. See the help for the flash load command within the DS-5 Debugger.
• Where the configuration file references another file, for example, the script files, the FDB:// prefixindicates that the file is located in the Flash subdirectory of the configuration database. If there aremultiple databases, then the Flash subdirectory of each database is searched until the file is found.
• The last file that needs to be changed is the project_types.xml file in the target's directory to tellDS-5 that the flash configuration can be found in the file created above. The following line should beadded under the top-level platform_data tag:
<flash_config>CDB://flash.xml</flash_config>
The CDB:// prefix tells DS-5 that the flash.xml file is located in the same directory as theproject_types.xml file.
13 File-based Flash Programming in ARM DS-513.5 About creating a new flash method
ARM DUI0446Z Copyright © 2010-2016 ARM Limited or its affiliates. All rightsreserved.
13-406
Non-Confidential
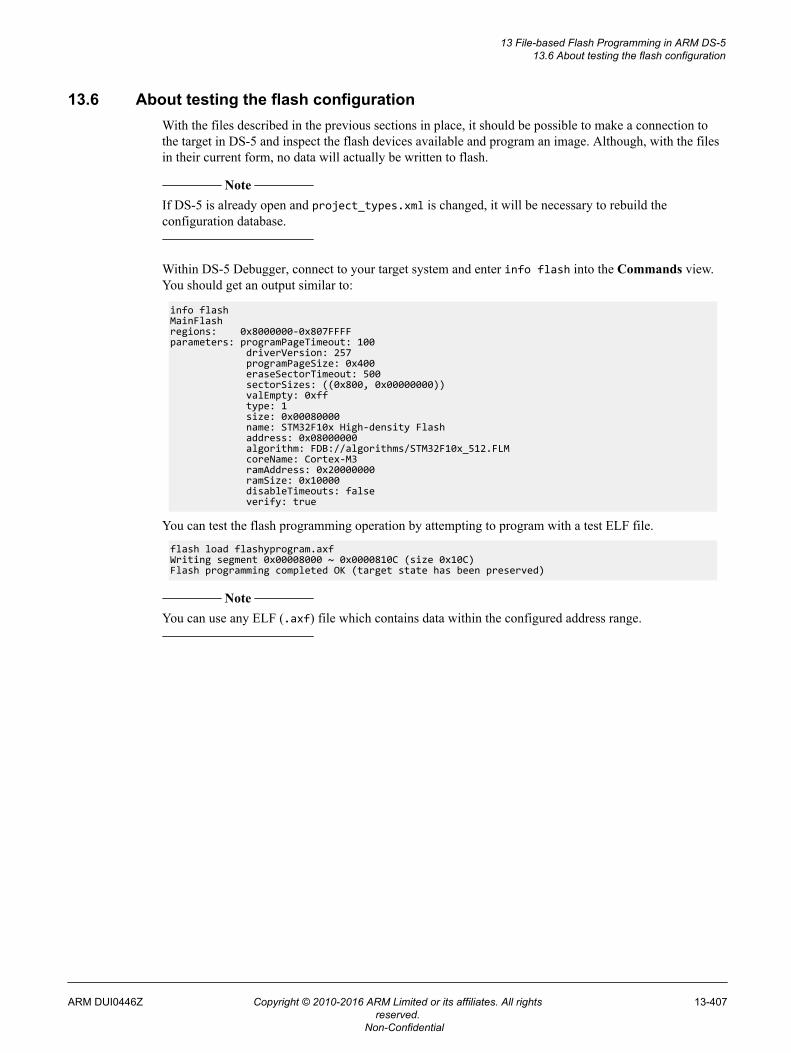
13.6 About testing the flash configurationWith the files described in the previous sections in place, it should be possible to make a connection tothe target in DS-5 and inspect the flash devices available and program an image. Although, with the filesin their current form, no data will actually be written to flash.
Note
If DS-5 is already open and project_types.xml is changed, it will be necessary to rebuild theconfiguration database.
Within DS-5 Debugger, connect to your target system and enter info flash into the Commands view.You should get an output similar to:
info flashMainFlashregions: 0x8000000-0x807FFFFparameters: programPageTimeout: 100 driverVersion: 257 programPageSize: 0x400 eraseSectorTimeout: 500 sectorSizes: ((0x800, 0x00000000)) valEmpty: 0xff type: 1 size: 0x00080000 name: STM32F10x High-density Flash address: 0x08000000 algorithm: FDB://algorithms/STM32F10x_512.FLM coreName: Cortex-M3 ramAddress: 0x20000000 ramSize: 0x10000 disableTimeouts: false verify: true
You can test the flash programming operation by attempting to program with a test ELF file.
flash load flashyprogram.axfWriting segment 0x00008000 ~ 0x0000810C (size 0x10C)Flash programming completed OK (target state has been preserved)
Note
You can use any ELF (.axf) file which contains data within the configured address range.
13 File-based Flash Programming in ARM DS-513.6 About testing the flash configuration
ARM DUI0446Z Copyright © 2010-2016 ARM Limited or its affiliates. All rightsreserved.
13-407
Non-Confidential
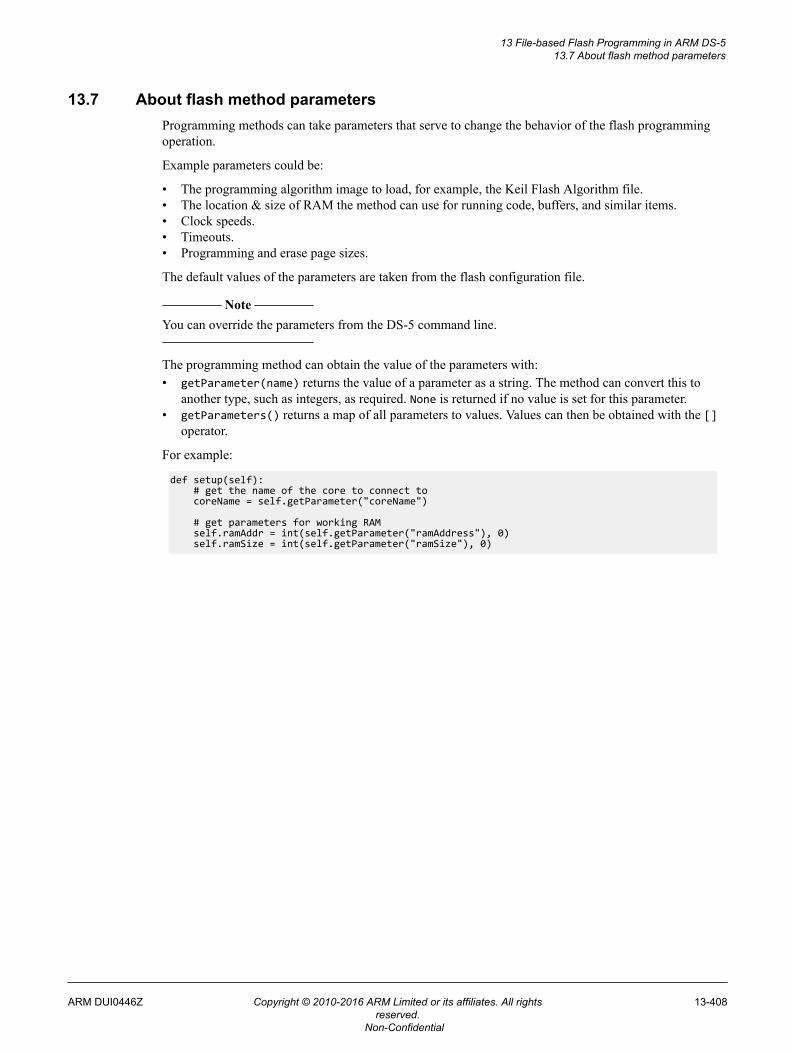
13.7 About flash method parametersProgramming methods can take parameters that serve to change the behavior of the flash programmingoperation.
Example parameters could be:
• The programming algorithm image to load, for example, the Keil Flash Algorithm file.• The location & size of RAM the method can use for running code, buffers, and similar items.• Clock speeds.• Timeouts.• Programming and erase page sizes.
The default values of the parameters are taken from the flash configuration file.
Note
You can override the parameters from the DS-5 command line.
The programming method can obtain the value of the parameters with:• getParameter(name) returns the value of a parameter as a string. The method can convert this to
another type, such as integers, as required. None is returned if no value is set for this parameter.• getParameters() returns a map of all parameters to values. Values can then be obtained with the []
operator.
For example:
def setup(self): # get the name of the core to connect to coreName = self.getParameter("coreName") # get parameters for working RAM self.ramAddr = int(self.getParameter("ramAddress"), 0) self.ramSize = int(self.getParameter("ramSize"), 0)
13 File-based Flash Programming in ARM DS-513.7 About flash method parameters
ARM DUI0446Z Copyright © 2010-2016 ARM Limited or its affiliates. All rightsreserved.
13-408
Non-Confidential
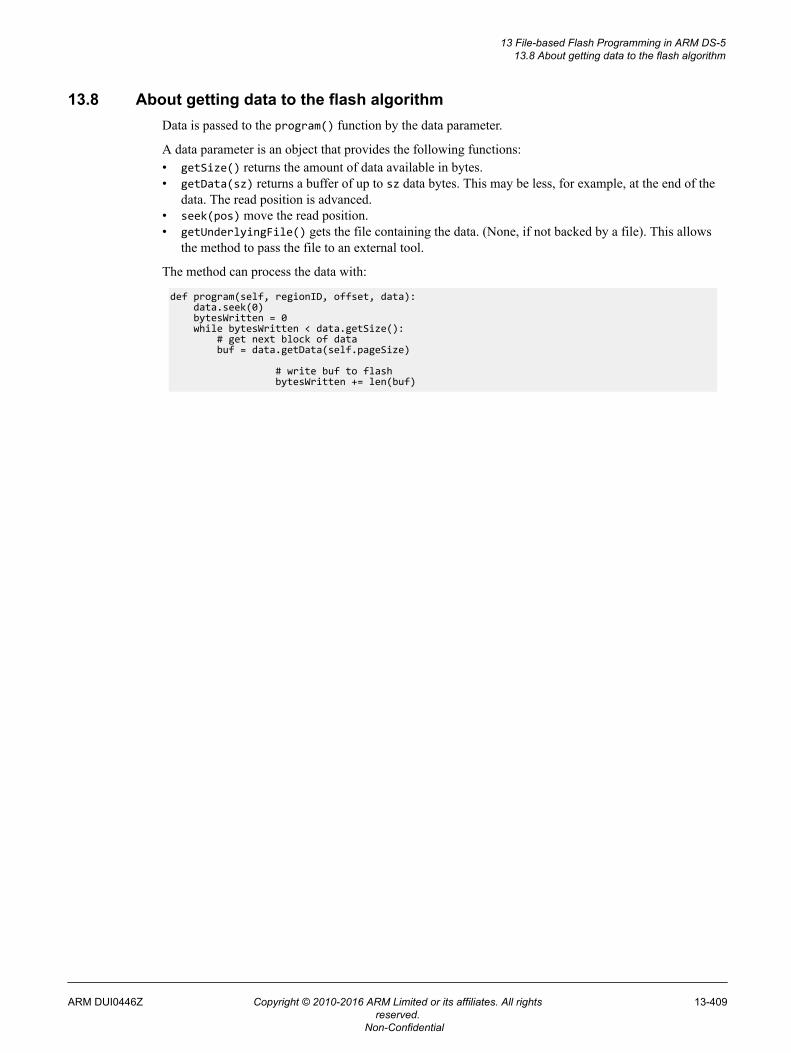
13.8 About getting data to the flash algorithmData is passed to the program() function by the data parameter.
A data parameter is an object that provides the following functions:• getSize() returns the amount of data available in bytes.• getData(sz) returns a buffer of up to sz data bytes. This may be less, for example, at the end of the
data. The read position is advanced.• seek(pos) move the read position.• getUnderlyingFile() gets the file containing the data. (None, if not backed by a file). This allows
the method to pass the file to an external tool.
The method can process the data with:
def program(self, regionID, offset, data): data.seek(0) bytesWritten = 0 while bytesWritten < data.getSize(): # get next block of data buf = data.getData(self.pageSize) # write buf to flash bytesWritten += len(buf)
13 File-based Flash Programming in ARM DS-513.8 About getting data to the flash algorithm
ARM DUI0446Z Copyright © 2010-2016 ARM Limited or its affiliates. All rightsreserved.
13-409
Non-Confidential
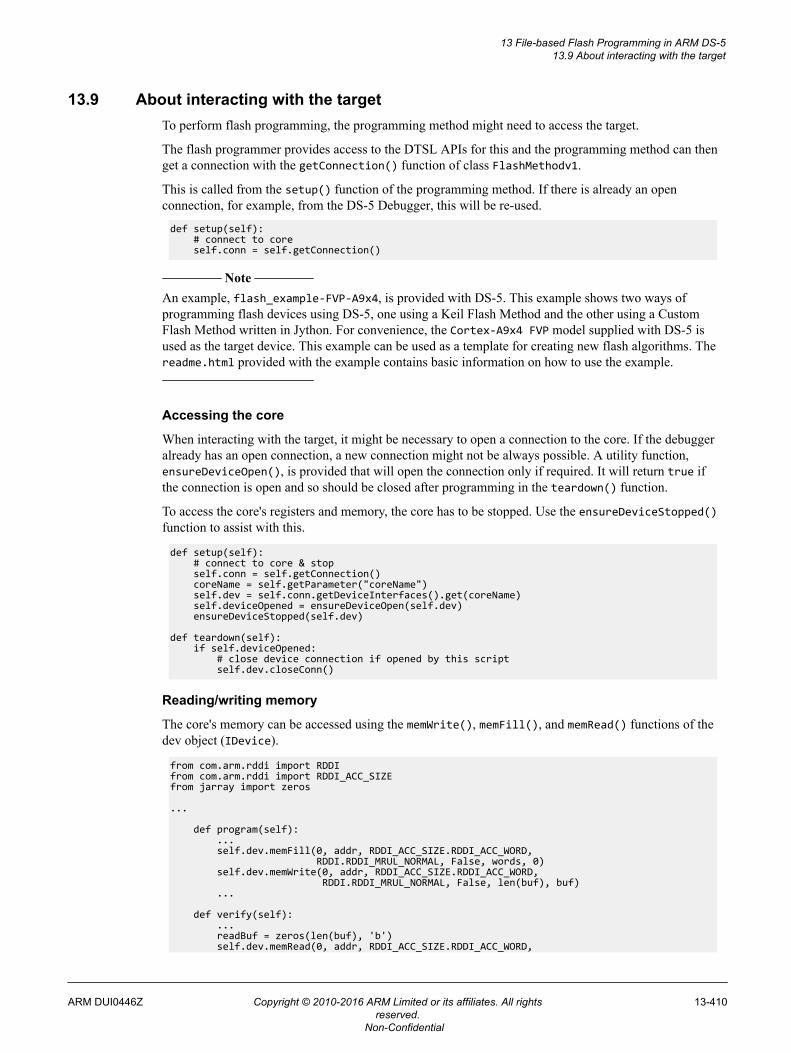
13.9 About interacting with the targetTo perform flash programming, the programming method might need to access the target.
The flash programmer provides access to the DTSL APIs for this and the programming method can thenget a connection with the getConnection() function of class FlashMethodv1.
This is called from the setup() function of the programming method. If there is already an openconnection, for example, from the DS-5 Debugger, this will be re-used.
def setup(self): # connect to core self.conn = self.getConnection()
Note
An example, flash_example-FVP-A9x4, is provided with DS-5. This example shows two ways ofprogramming flash devices using DS-5, one using a Keil Flash Method and the other using a CustomFlash Method written in Jython. For convenience, the Cortex-A9x4 FVP model supplied with DS-5 isused as the target device. This example can be used as a template for creating new flash algorithms. Thereadme.html provided with the example contains basic information on how to use the example.
Accessing the core
When interacting with the target, it might be necessary to open a connection to the core. If the debuggeralready has an open connection, a new connection might not be always possible. A utility function,ensureDeviceOpen(), is provided that will open the connection only if required. It will return true ifthe connection is open and so should be closed after programming in the teardown() function.
To access the core's registers and memory, the core has to be stopped. Use the ensureDeviceStopped()function to assist with this.
def setup(self): # connect to core & stop self.conn = self.getConnection() coreName = self.getParameter("coreName") self.dev = self.conn.getDeviceInterfaces().get(coreName) self.deviceOpened = ensureDeviceOpen(self.dev) ensureDeviceStopped(self.dev) def teardown(self): if self.deviceOpened: # close device connection if opened by this script self.dev.closeConn()
Reading/writing memory
The core's memory can be accessed using the memWrite(), memFill(), and memRead() functions of thedev object (IDevice).
from com.arm.rddi import RDDI from com.arm.rddi import RDDI_ACC_SIZE from jarray import zeros ... def program(self): ... self.dev.memFill(0, addr, RDDI_ACC_SIZE.RDDI_ACC_WORD, RDDI.RDDI_MRUL_NORMAL, False, words, 0) self.dev.memWrite(0, addr, RDDI_ACC_SIZE.RDDI_ACC_WORD, RDDI.RDDI_MRUL_NORMAL, False, len(buf), buf) ... def verify(self): ... readBuf = zeros(len(buf), 'b') self.dev.memRead(0, addr, RDDI_ACC_SIZE.RDDI_ACC_WORD,
13 File-based Flash Programming in ARM DS-513.9 About interacting with the target
ARM DUI0446Z Copyright © 2010-2016 ARM Limited or its affiliates. All rightsreserved.
13-410
Non-Confidential
RDDI.RDDI_MRUL_NORMAL, len(readBuf), readBuf) ...
Utility routines to make the method code clearer are provided in device_memory:
from flashprogrammer.device_memory import writeToTarget, readFromTarget ... def program(self): ... writeToTarget(self.dev, address, buf) ... def verify(self): ... readBuf = readFromTarget(self.dev, addr, count) ...
Reading and writing registers
The core's registers can be read using the regReadList() and written using the regWriteList()functions of Idevice.
Note
You must be careful to only pass integer values and not long values.
These registers are accessed by using numeric IDs. These IDs are target specific. For example, R0 isregister 1 on a Cortex-A device, but register 0 on a Cortex-M device.
execution.py provides functions that map register names to numbers and allow reading or writing byname.• writeRegs(device, regs) writes a number of registers to a device. regs is a list of (name, value)
pairs. For example:
writeRegs (self.dev, [ ("R0", 0), ("R1", 1234), ("PC", 0x8000) ]
will set R0, R1, and PC (R15).• readReg(device, reg) reads a named register. For example:
value = readReg ("R0")
will read R0 and return its value.
Running code on the core
The core can be started and stopped via the go() and stop() functions. Breakpoints can be set with thesetSWBreak() or setHWBreak() functions and cleared with the clearSWBreak() or clearHWBreak()functions. As it may take some time to reach the breakpoint, before accessing the target further, the scriptshould wait for the breakpoint to be hit and the core stopped.
13 File-based Flash Programming in ARM DS-513.9 About interacting with the target
ARM DUI0446Z Copyright © 2010-2016 ARM Limited or its affiliates. All rightsreserved.
13-411
Non-Confidential
execution.py provides utility methods to assist with running code on the target.
• To request the core to stop and wait for the stop status event to be received, and raise an error if noevent is received before timeout elapses.
stopDevice(device, timeout=1.0):
• To check the device's status and calls stopDevice() if it is not stopped.
ensureDeviceStopped(device, timeout=1.0):
• To start the core and wait for it to stop, forces the core to stop and raise an error if it doesn't stopbefore timeout elapses. The caller must set the registers appropriately and have set a breakpoint orvector catch to cause the core to stop at the desired address.
runAndWaitForStop(device, timeout=1.0):
• To set a software breakpoint at addr, start the core and wait for it to stop by callingrunAndWaitForStop(). The caller must set the registers appropriately.
runToBreakpoint(device, addr, bpFlags = RDDI.RDDI_BRUL_STD, timeout=1.0):
Flash programming algorithms are often implemented as functions that are run on the target itself. Thesefunctions may take parameters where the parameters are passed through registers.
funcCall() allows methods to call functions that follow AAPCS (with some restrictions):
• Up to the first four parameters are passed in registers R0-R3.• Any parameters above this are passed via the stack.• Only integers up to 32-bit or pointer parameters are supported. Floating point or 64-bit integers are
not supported.• The result is returned in R0.
We can use the above to simulate flash programming by writing the data to RAM. Seeexample_method_1.py. This:• Connects to the target on setup().• Fills the destination RAM with 0s to simulate erase.• Writes data to a write buffer in working RAM.• Runs a routine that copies the data from the write buffer to the destination RAM.• Verifies the write by reading from the destination RAM.
Loading programming algorithm images onto the target
Programming algorithms are often compiled into .elf images.
FlashMethodv1.locateFile() locates a file for example, from a parameter, resolving any FDB://prefix to absolute paths.
symfile.py provides a class, SymbolFileReader, that allows the programming method to load an imagefile and get the locations of symbols. For example, to get the location of a function:
# load the algorithm image algorithmFile = self.locateFile(self.getParameter('algorithm')) algoReader = SymbolFileReader(algorithmFile) # Find the address of the Program() function funcInfo = algoReader.getFunctionInfo()['Program'] programAddr = funcInfo['address'] if funcInfo['thumb']: # set bit 0 if symbol is thumb programAddr |= 1
image_loader.py provides routines to load the image to the target:
# load algorithm into working RAM algoAddr = self.ramAddr + 0x1000 # allow space for stack, buffers etc loadAllCodeSegmentsToTarget(self.dev, algoReader, algoAddr)
13 File-based Flash Programming in ARM DS-513.9 About interacting with the target
ARM DUI0446Z Copyright © 2010-2016 ARM Limited or its affiliates. All rightsreserved.
13-412
Non-Confidential
If the algorithm binary was linked as position independent, the addresses of the symbols are relative tothe load address and this offset should be applied when running the code on the target:
programAddr += algoAddr args = [ writeBuffer, destAddr, pageSize ] funcCall(self.dev, programAddr, args, self.stackTop)
Progress reporting
Flash programming can be a slow process, so it is desirable to have progress reporting features. Themethod can do this by calling operationStarted(). This returns an object with functions:
• progress() - update the reported progress.• complete() - report the operation as completed, with a success or failure.
Progress reporting can be added to the program() function in the previous example:
def program(self, regionID, offset, data): # calculate the address to write to region = self.getRegion(regionID) addr = region.getAddress() + offset # Report progress, assuming erase takes 20% of the time, program 50% # and verify 30% progress = self.operationStarted( 'Programming 0x%x bytes to 0x%08x' % (data.getSize(), addr), 100) self.doErase(addr, data.getSize()) progress.progress('Erasing completed', 20) self.doWrite(addr, data) progress.progress('Writing completed', 20+50) self.doVerify(addr, data) progress.progress('Verifying completed', 20+50+30) progress.completed(OperationResult.SUCCESS, 'All done') # register values have been changed return TargetStatus.STATE_LOST
The above example only has coarse progress reporting, only reporting at the end of each phase. Betterresolution can be achieved by allowing each sub-task to have a progress monitor. subOperation()creates a child progress monitor.
Care should be taken to ensure completed() is called on the progress monitor when an error occurs. It isrecommended that a try: except: block is placed around the code after a progress monitor is created.
import java.lang.Exception def program(self, regionID, offset, data): progress = self.operationStarted( 'Programming 0x%x bytes to 0x%08x' % (data.getSize(), addr), 100) try: # Do programming except (Exception, java.lang.Exception), e: # exceptions may be derived from Java Exception or Python Exception # report failure to progress monitor & rethrow progress.completed(OperationResult.FAILURE, 'Failed') raise
Note
import java.lang.Exception - If you omit import and a Java exception is thrown, you may get aconfusing error report from Jython indicating that it cannot find the Java namespace. Further, the pythonline location indicated as the source of the error will not be accurate.
13 File-based Flash Programming in ARM DS-513.9 About interacting with the target
ARM DUI0446Z Copyright © 2010-2016 ARM Limited or its affiliates. All rightsreserved.
13-413
Non-Confidential
CancellationIf you wish to abort a long-running flash operation, programming methods can call isCancelled() tocheck if the operation is canceled. If this returns true, the method stops programming.
Note
The teardown() functions are still called.
MessagesThe programming method can report messages by calling the following:• warning() - reports a warning message.• info() - reports an informational message.• debug() - reports a debug message - not normally displayed.
Locating and resolving files
FlashMethodv1.locateFile() locates a file for example, from a parameter, resolving any FDB://prefix to absolute paths.
This searches paths of all flash subdirectories of every configuration database configured in DS-5.
For example:
<DS5_INSTALL_DIR>/sw/debugger/configdb/Flash/
c:\MyDB\Flash
Error handling
Exceptions are thrown when errors occur. Errors from the API calls made by the programming methodwill be com.arm.debug.flashprogrammer.FlashProgrammerException (or derived from this).Methods may also report errors using Python's raise keyword. For example, if verification fails:
# compare contentsres = compareBuffers(buf, readBuf)if res != len(buf): raise FlashProgrammerRuntimeException, "Verify failed at address: %08x" %(addr + res)
If a programming method needs to ensure that a cleanup occurs when an exception is thrown, thefollowing code forms a template:
import java.lang.Exception ... try: # Do programming except (Exception, java.lang.Exception), e: # exceptions may be derived from Java Exception or Python Exception # report failure to progress monitor & rethrow # Handle errors here # Rethrow original exception raise finally: # This is always executed on success or failure # Close resources here
See the Progress handler section for example usage. Note
import java.lang.Exception - If you omit import and a Java exception is thrown, you may get aconfusing error report from Jython indicating that it cannot find the Java namespace. Further, the pythonline location indicated as the source of the error will not be accurate.
13 File-based Flash Programming in ARM DS-513.9 About interacting with the target
ARM DUI0446Z Copyright © 2010-2016 ARM Limited or its affiliates. All rightsreserved.
13-414
Non-Confidential
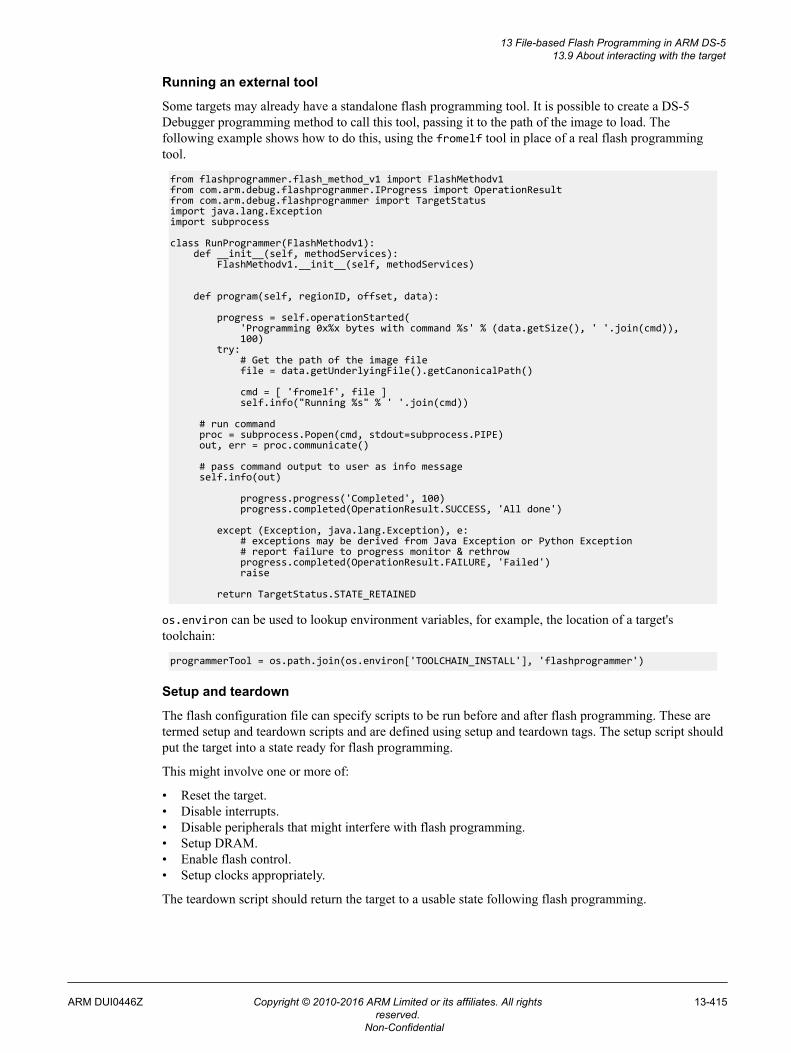
Running an external tool
Some targets may already have a standalone flash programming tool. It is possible to create a DS-5Debugger programming method to call this tool, passing it to the path of the image to load. Thefollowing example shows how to do this, using the fromelf tool in place of a real flash programmingtool.
from flashprogrammer.flash_method_v1 import FlashMethodv1 from com.arm.debug.flashprogrammer.IProgress import OperationResult from com.arm.debug.flashprogrammer import TargetStatus import java.lang.Exception import subprocess class RunProgrammer(FlashMethodv1): def __init__(self, methodServices): FlashMethodv1.__init__(self, methodServices) def program(self, regionID, offset, data): progress = self.operationStarted( 'Programming 0x%x bytes with command %s' % (data.getSize(), ' '.join(cmd)), 100) try: # Get the path of the image file file = data.getUnderlyingFile().getCanonicalPath() cmd = [ 'fromelf', file ] self.info("Running %s" % ' '.join(cmd)) # run command proc = subprocess.Popen(cmd, stdout=subprocess.PIPE) out, err = proc.communicate() # pass command output to user as info message self.info(out) progress.progress('Completed', 100) progress.completed(OperationResult.SUCCESS, 'All done') except (Exception, java.lang.Exception), e: # exceptions may be derived from Java Exception or Python Exception # report failure to progress monitor & rethrow progress.completed(OperationResult.FAILURE, 'Failed') raise return TargetStatus.STATE_RETAINED
os.environ can be used to lookup environment variables, for example, the location of a target'stoolchain:
programmerTool = os.path.join(os.environ['TOOLCHAIN_INSTALL'], 'flashprogrammer')
Setup and teardown
The flash configuration file can specify scripts to be run before and after flash programming. These aretermed setup and teardown scripts and are defined using setup and teardown tags. The setup script shouldput the target into a state ready for flash programming.
This might involve one or more of:
• Reset the target.• Disable interrupts.• Disable peripherals that might interfere with flash programming.• Setup DRAM.• Enable flash control.• Setup clocks appropriately.
The teardown script should return the target to a usable state following flash programming.
13 File-based Flash Programming in ARM DS-513.9 About interacting with the target
ARM DUI0446Z Copyright © 2010-2016 ARM Limited or its affiliates. All rightsreserved.
13-415
Non-Confidential
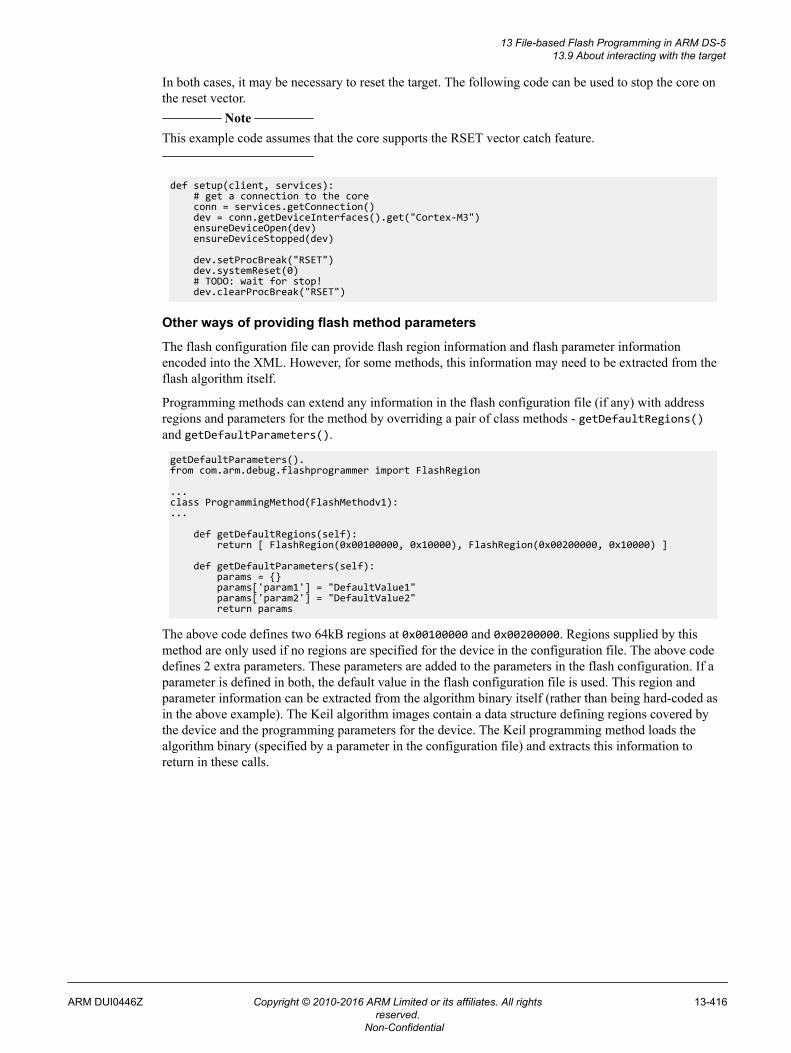
In both cases, it may be necessary to reset the target. The following code can be used to stop the core onthe reset vector.
Note
This example code assumes that the core supports the RSET vector catch feature.
def setup(client, services): # get a connection to the core conn = services.getConnection() dev = conn.getDeviceInterfaces().get("Cortex-M3") ensureDeviceOpen(dev) ensureDeviceStopped(dev) dev.setProcBreak("RSET") dev.systemReset(0) # TODO: wait for stop! dev.clearProcBreak("RSET")
Other ways of providing flash method parameters
The flash configuration file can provide flash region information and flash parameter informationencoded into the XML. However, for some methods, this information may need to be extracted from theflash algorithm itself.
Programming methods can extend any information in the flash configuration file (if any) with addressregions and parameters for the method by overriding a pair of class methods - getDefaultRegions()and getDefaultParameters().
getDefaultParameters(). from com.arm.debug.flashprogrammer import FlashRegion ... class ProgrammingMethod(FlashMethodv1): ... def getDefaultRegions(self): return [ FlashRegion(0x00100000, 0x10000), FlashRegion(0x00200000, 0x10000) ] def getDefaultParameters(self): params = {} params['param1'] = "DefaultValue1" params['param2'] = "DefaultValue2" return params
The above code defines two 64kB regions at 0x00100000 and 0x00200000. Regions supplied by thismethod are only used if no regions are specified for the device in the configuration file. The above codedefines 2 extra parameters. These parameters are added to the parameters in the flash configuration. If aparameter is defined in both, the default value in the flash configuration file is used. This region andparameter information can be extracted from the algorithm binary itself (rather than being hard-coded asin the above example). The Keil algorithm images contain a data structure defining regions covered bythe device and the programming parameters for the device. The Keil programming method loads thealgorithm binary (specified by a parameter in the configuration file) and extracts this information toreturn in these calls.
13 File-based Flash Programming in ARM DS-513.9 About interacting with the target
ARM DUI0446Z Copyright © 2010-2016 ARM Limited or its affiliates. All rightsreserved.
13-416
Non-Confidential
Chapter 14Writing OS Awareness for DS-5 Debugger
Describes the OS awareness feature available in DS-5.
It contains the following sections:• 14.1 About Writing operating system awareness for DS-5 Debugger on page 14-418.• 14.2 Creating an OS awareness extension on page 14-419.• 14.3 Implementing the OS awareness API on page 14-423.• 14.4 Enabling the OS awareness on page 14-425.• 14.5 Implementing thread awareness on page 14-430.• 14.6 Implementing data views on page 14-433.• 14.7 Advanced OS awareness extension on page 14-436.• 14.8 Programming advice and noteworthy information on page 14-438.
ARM DUI0446Z Copyright © 2010-2016 ARM Limited or its affiliates. All rightsreserved.
14-417
Non-Confidential
14.1 About Writing operating system awareness for DS-5 DebuggerDS-5 Debugger offers an Application Programming Interface (API) for third parties to contributeawareness for their operating systems (OS).
The OS awareness extends the debugger to provide a representation of the OS threads - or tasks - andother relevant data structures, typically semaphores, mutexes, or queues.
Thread-awareness, in particular, enables the following features in the debugger:
• Setting breakpoints for a particular thread, or a group of threads.• Displaying the call stack for a specific thread.• For any given thread, inspecting local variables and register values at a selected stack frame.
To illustrate different stages of the implementation, this chapter explains how to add support for afictional OS named myos.
The steps can be summarized as follows:1. Create a new configuration database folder to host the OS awareness extension and add it to the DS-5
Debugger preferences in Eclipse.2. Create the files extension.xml and messages.properties so that the extension appears on the OS
Awareness tab in the Debug configuration dialog.3. Add provider.py and implement the awareness enablement logic.4. Add contexts.py and implement the thread awareness.5. Add tasks.py to contribute a table to the RTOS Data view, showing detailed information about
tasks.
14 Writing OS Awareness for DS-5 Debugger14.1 About Writing operating system awareness for DS-5 Debugger
ARM DUI0446Z Copyright © 2010-2016 ARM Limited or its affiliates. All rightsreserved.
14-418
Non-Confidential
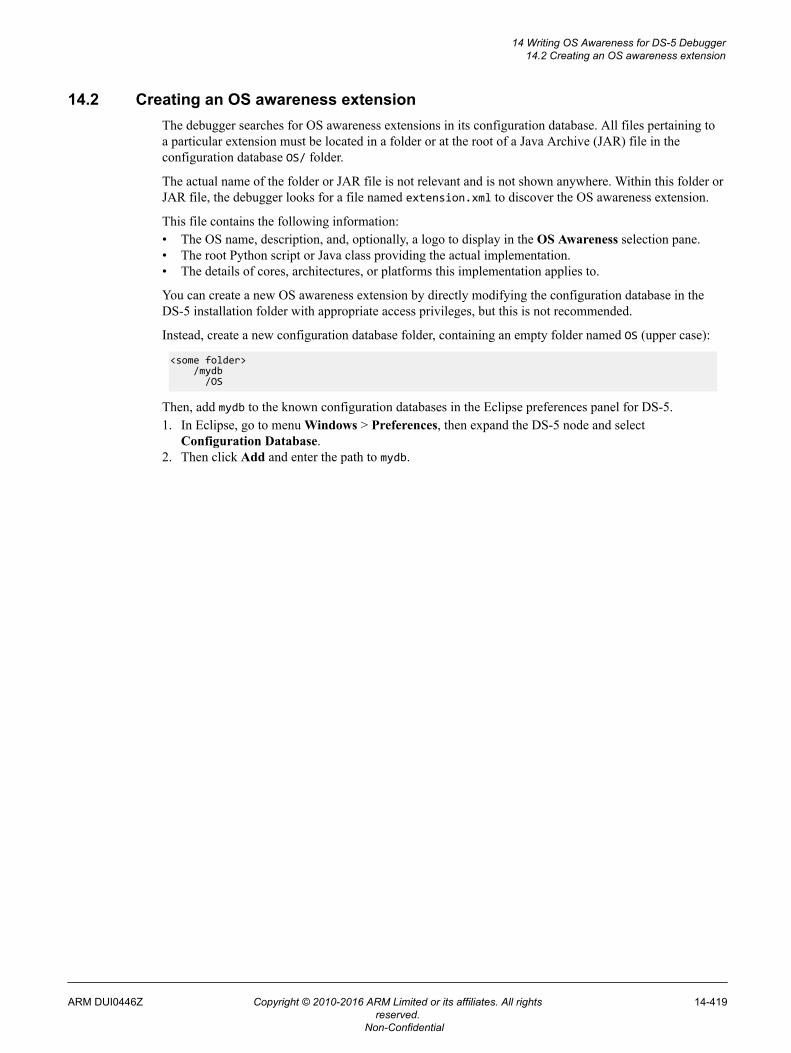
14.2 Creating an OS awareness extensionThe debugger searches for OS awareness extensions in its configuration database. All files pertaining toa particular extension must be located in a folder or at the root of a Java Archive (JAR) file in theconfiguration database OS/ folder.
The actual name of the folder or JAR file is not relevant and is not shown anywhere. Within this folder orJAR file, the debugger looks for a file named extension.xml to discover the OS awareness extension.
This file contains the following information:• The OS name, description, and, optionally, a logo to display in the OS Awareness selection pane.• The root Python script or Java class providing the actual implementation.• The details of cores, architectures, or platforms this implementation applies to.
You can create a new OS awareness extension by directly modifying the configuration database in theDS-5 installation folder with appropriate access privileges, but this is not recommended.
Instead, create a new configuration database folder, containing an empty folder named OS (upper case):
<some folder> /mydb /OS
Then, add mydb to the known configuration databases in the Eclipse preferences panel for DS-5.1. In Eclipse, go to menu Windows > Preferences, then expand the DS-5 node and select
Configuration Database.2. Then click Add and enter the path to mydb.
14 Writing OS Awareness for DS-5 Debugger14.2 Creating an OS awareness extension
ARM DUI0446Z Copyright © 2010-2016 ARM Limited or its affiliates. All rightsreserved.
14-419
Non-Confidential
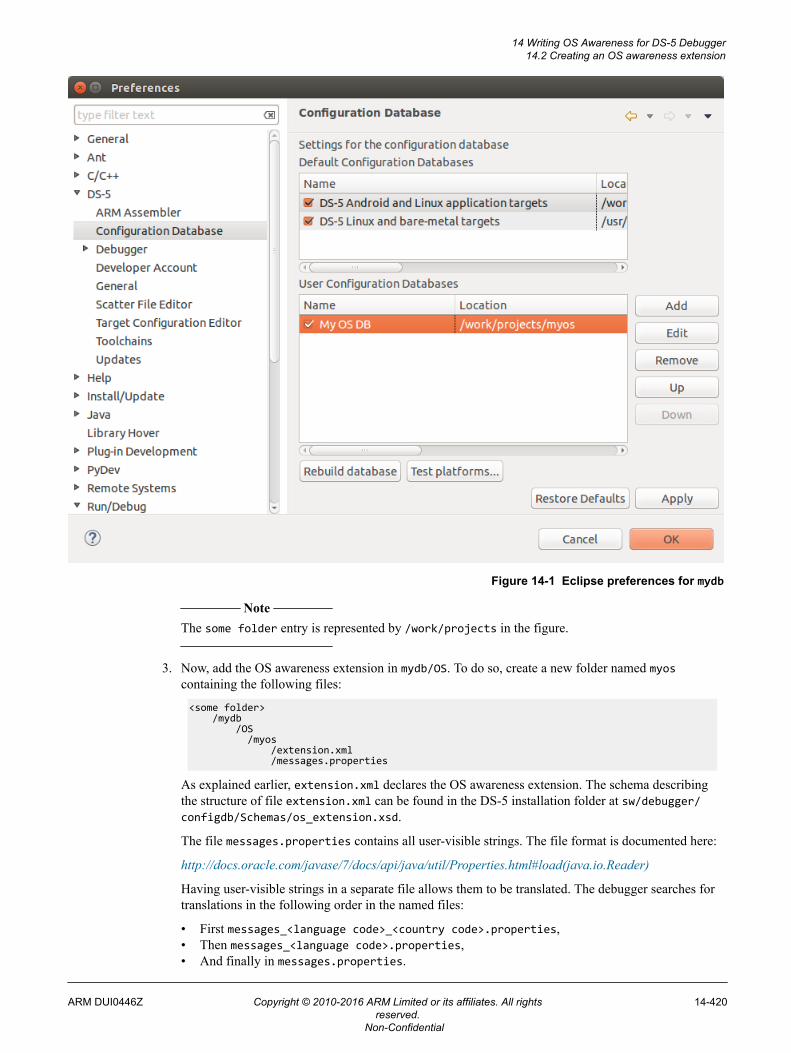
Figure 14-1 Eclipse preferences for mydb
Note
The some folder entry is represented by /work/projects in the figure.
3. Now, add the OS awareness extension in mydb/OS. To do so, create a new folder named myoscontaining the following files:
<some folder> /mydb /OS /myos /extension.xml /messages.properties
As explained earlier, extension.xml declares the OS awareness extension. The schema describingthe structure of file extension.xml can be found in the DS-5 installation folder at sw/debugger/configdb/Schemas/os_extension.xsd.
The file messages.properties contains all user-visible strings. The file format is documented here:
http://docs.oracle.com/javase/7/docs/api/java/util/Properties.html#load(java.io.Reader)
Having user-visible strings in a separate file allows them to be translated. The debugger searches fortranslations in the following order in the named files:
• First messages_<language code>_<country code>.properties,• Then messages_<language code>.properties,• And finally in messages.properties.
14 Writing OS Awareness for DS-5 Debugger14.2 Creating an OS awareness extension
ARM DUI0446Z Copyright © 2010-2016 ARM Limited or its affiliates. All rightsreserved.
14-420
Non-Confidential
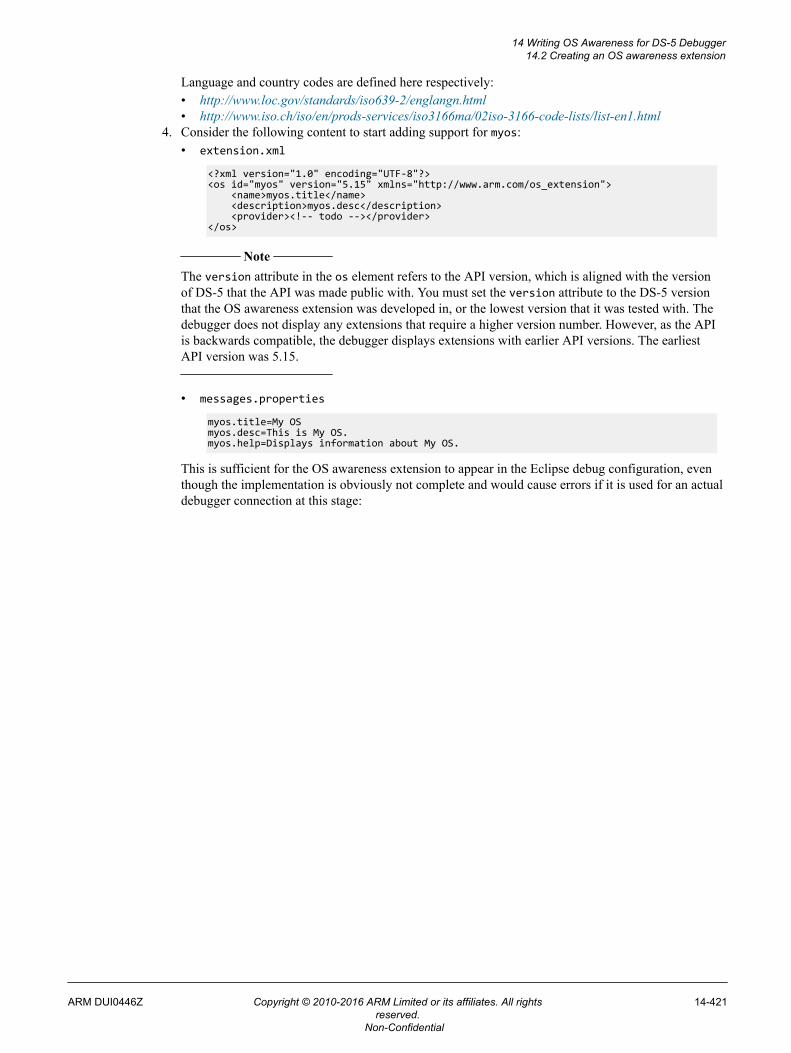
Language and country codes are defined here respectively:• http://www.loc.gov/standards/iso639-2/englangn.html• http://www.iso.ch/iso/en/prods-services/iso3166ma/02iso-3166-code-lists/list-en1.html
4. Consider the following content to start adding support for myos:• extension.xml
<?xml version="1.0" encoding="UTF-8"?><os id="myos" version="5.15" xmlns="http://www.arm.com/os_extension"> <name>myos.title</name> <description>myos.desc</description> <provider><!-- todo --></provider></os>
Note
The version attribute in the os element refers to the API version, which is aligned with the versionof DS-5 that the API was made public with. You must set the version attribute to the DS-5 versionthat the OS awareness extension was developed in, or the lowest version that it was tested with. Thedebugger does not display any extensions that require a higher version number. However, as the APIis backwards compatible, the debugger displays extensions with earlier API versions. The earliestAPI version was 5.15.
• messages.properties
myos.title=My OSmyos.desc=This is My OS.myos.help=Displays information about My OS.
This is sufficient for the OS awareness extension to appear in the Eclipse debug configuration, eventhough the implementation is obviously not complete and would cause errors if it is used for an actualdebugger connection at this stage:
14 Writing OS Awareness for DS-5 Debugger14.2 Creating an OS awareness extension
ARM DUI0446Z Copyright © 2010-2016 ARM Limited or its affiliates. All rightsreserved.
14-421
Non-Confidential
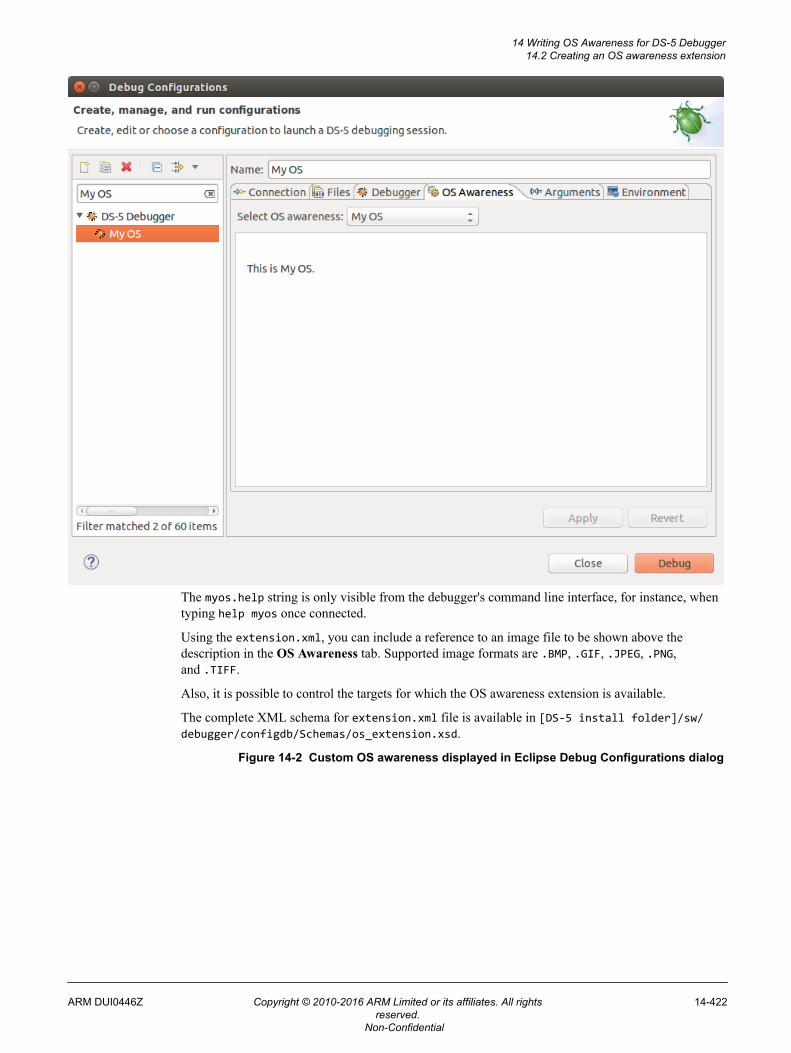
The myos.help string is only visible from the debugger's command line interface, for instance, whentyping help myos once connected.
Using the extension.xml, you can include a reference to an image file to be shown above thedescription in the OS Awareness tab. Supported image formats are .BMP, .GIF, .JPEG, .PNG,and .TIFF.
Also, it is possible to control the targets for which the OS awareness extension is available.
The complete XML schema for extension.xml file is available in [DS-5 install folder]/sw/debugger/configdb/Schemas/os_extension.xsd.
Figure 14-2 Custom OS awareness displayed in Eclipse Debug Configurations dialog
14 Writing OS Awareness for DS-5 Debugger14.2 Creating an OS awareness extension
ARM DUI0446Z Copyright © 2010-2016 ARM Limited or its affiliates. All rightsreserved.
14-422
Non-Confidential
14.3 Implementing the OS awareness APIThe OS awareness API consists of callbacks that the debugger makes at specific times. For eachcallback, the debugger provides a means for the implementation to retrieve information about the targetand resolve variables and pointers, through an expression evaluator.
The API exists primarily as a set of Java interfaces since the debugger itself is written in Java. However,the debugger provides a Python interpreter and bindings to translate calls between Python and Java,allowing the Java interfaces to be implemented by Python scripts. This section and the next ones refer tothe Java interfaces but explain how to implement the extension in Python.
Note
A Python implementation does not require any particular build or compilation environment, as opposedto a Java implementation. On the other hand, investigating problems within Python code is moredifficult, and you are advised to read the Programming advice and noteworthy information section beforestarting to write your own Python implementation.
The detailed Java interfaces to implement are available in the DS-5 installation folder under sw/eclipse/dropins/plugins, within the com.arm.debug.extension.source_<version>.jar file.
Note
You are encouraged to read the Javadoc documentation on Java interfaces as it contains essentialinformation that is not presented here.
The Java interface of immediate interest at this point is IOSProvider, in the packagecom.arm.debug.extension.os. This interface must be implemented by the provider instance that wasleft out with a todo comment in extension.xml.
First, add the simplest implementation to the configuration database entry:
<some folder> /mydb /OS /myos /extension.xml /messages.properties /provider.py
• extension.xml
<?xml version="1.0" encoding="UTF-8"?><os id="myos" version="5.15" xmlns="http://www.arm.com/os_extension"> <name>myos.title</name> <description>myos.desc</description> <provider>provider.py</provider></os>
• provider.py
# this script implements the Java interface IOSProviderdef areOSSymbolsLoaded(debugger): return False
def isOSInitialised(debugger): return False
def getOSContextProvider(): return None
def getDataModel(): return None
14 Writing OS Awareness for DS-5 Debugger14.3 Implementing the OS awareness API
ARM DUI0446Z Copyright © 2010-2016 ARM Limited or its affiliates. All rightsreserved.
14-423
Non-Confidential
This is enough to make the OS awareness implementation valid. A debug configuration with this OSawareness selected works, although this does not add anything on top of a plain bare-metal connection.However, this illustrates the logical lifecycle of the OS awareness:1. Ensure debug information for the OS is available. On loading symbols, the debugger calls
areOSSymbolsLoaded(); the implementation returns true if it recognizes symbols as belonging tothe OS, enabling the next callback.
2. Ensure the OS is initialized. Once the symbols for the OS are available, the debugger callsisOSInitialised(), immediately if the target is stopped or whenever the target stops next. This isan opportunity for the awareness implementation to check that the OS has reached a state wherethreads and other data structures are ready to be read, enabling the next two callbacks.
3. Retrieve information about threads and other data structures. Once the OS is initialized, the debuggercalls out to getOSContextProvider() and getDataModel() to read information from the target. Inreality, the debugger may call out to getOSContextProvider() and getDataModel() earlier on, butdoes not use the returned objects to read from the target until areOSSymbolsLoaded() andisOSInitialised() both returned true.
14 Writing OS Awareness for DS-5 Debugger14.3 Implementing the OS awareness API
ARM DUI0446Z Copyright © 2010-2016 ARM Limited or its affiliates. All rightsreserved.
14-424
Non-Confidential
14.4 Enabling the OS awarenessThe below implementation in provider.py, assumes myos has a global variable called tasks listing theOS tasks in an array and another global variable scheduler_running indicating that the OS has startedscheduling tasks.
# this script implements the Java interface IOSProviderfrom osapi import DebugSessionException
def areOSSymbolsLoaded(debugger): return debugger.symbolExists("tasks") \ and debugger.symbolExists("scheduler_running")
def isOSInitialised(debugger): try: result = debugger.evaluateExpression("scheduler_running") return result.readAsNumber() == 1 except DebugSessionException: return False
def getOSContextProvider(): return None
def getDataModel(): return None
The osapi module in the import statement at the top of provider.py is a collection of wrappers aroundJava objects and utility functions. The file osapi.py itself can be found in JAR filecom.arm.debug.extension_<version>.jar.
Connecting to a running target and loading symbols manually for the OS shows bothareOSSymbolsLoaded() and isOSInitialised() stages distinctly.• On connecting to the target running the OS, without loading symbols, the Debug Control view
displays Waiting for symbols to be loaded.
14 Writing OS Awareness for DS-5 Debugger14.4 Enabling the OS awareness
ARM DUI0446Z Copyright © 2010-2016 ARM Limited or its affiliates. All rightsreserved.
14-425
Non-Confidential
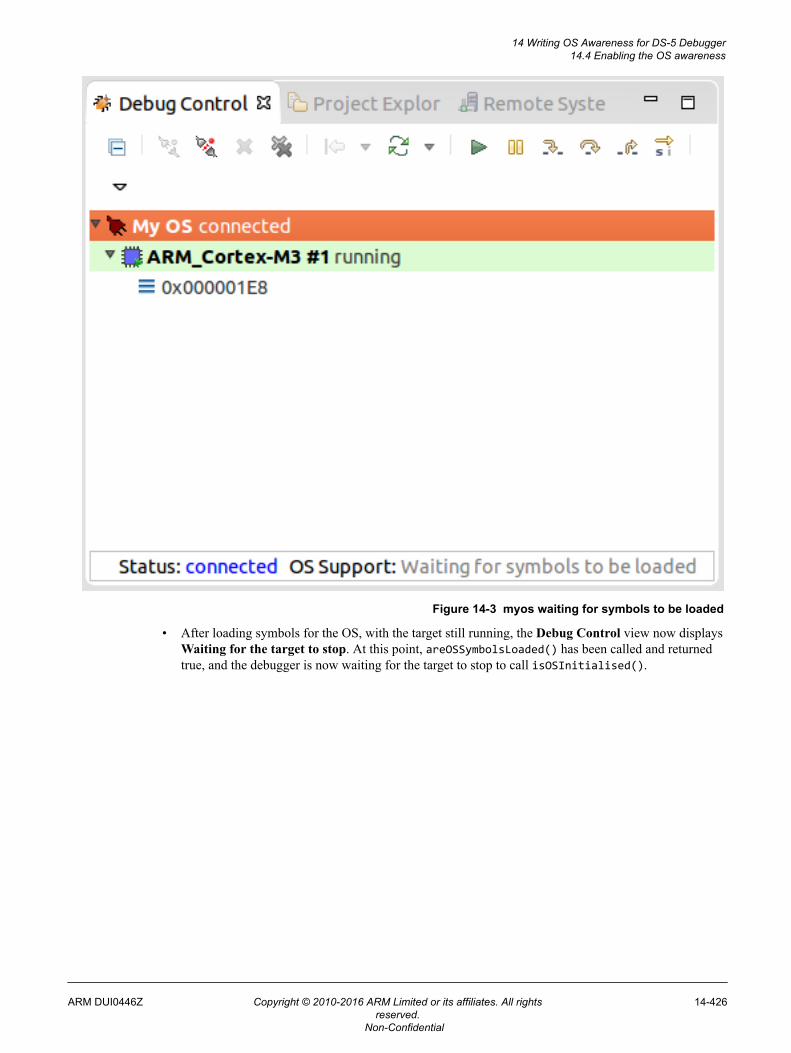
Figure 14-3 myos waiting for symbols to be loaded
• After loading symbols for the OS, with the target still running, the Debug Control view now displaysWaiting for the target to stop. At this point, areOSSymbolsLoaded() has been called and returnedtrue, and the debugger is now waiting for the target to stop to call isOSInitialised().
14 Writing OS Awareness for DS-5 Debugger14.4 Enabling the OS awareness
ARM DUI0446Z Copyright © 2010-2016 ARM Limited or its affiliates. All rightsreserved.
14-426
Non-Confidential
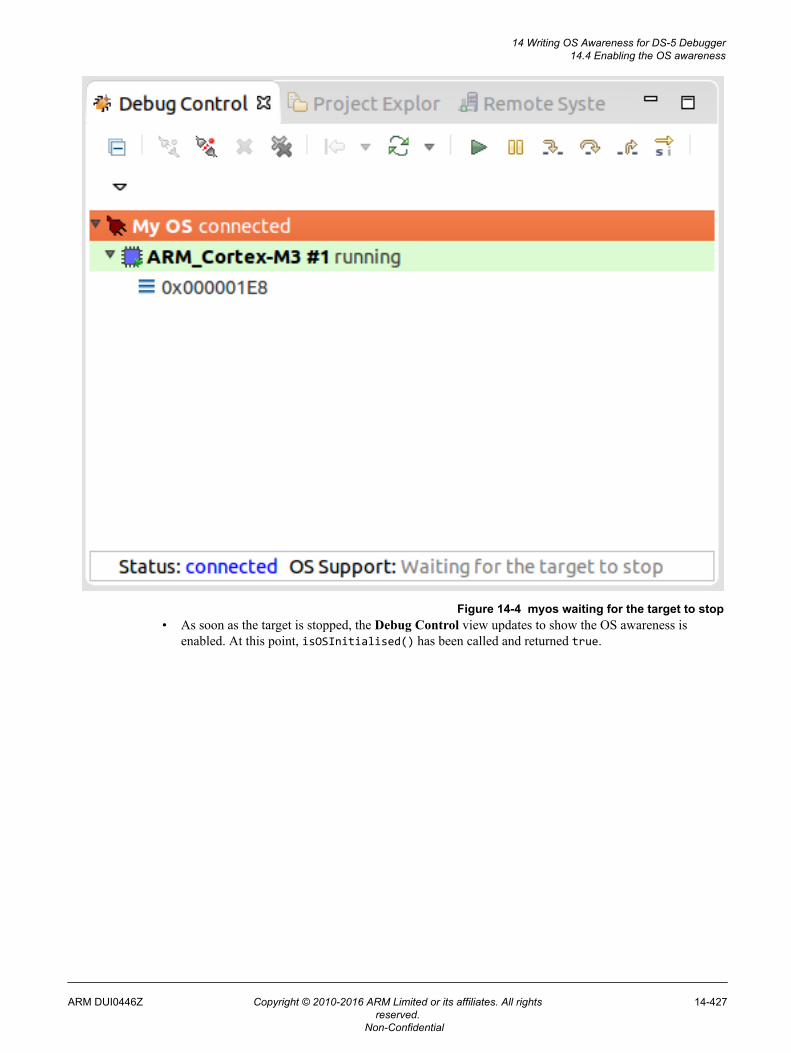
Figure 14-4 myos waiting for the target to stop• As soon as the target is stopped, the Debug Control view updates to show the OS awareness is
enabled. At this point, isOSInitialised() has been called and returned true.
14 Writing OS Awareness for DS-5 Debugger14.4 Enabling the OS awareness
ARM DUI0446Z Copyright © 2010-2016 ARM Limited or its affiliates. All rightsreserved.
14-427
Non-Confidential
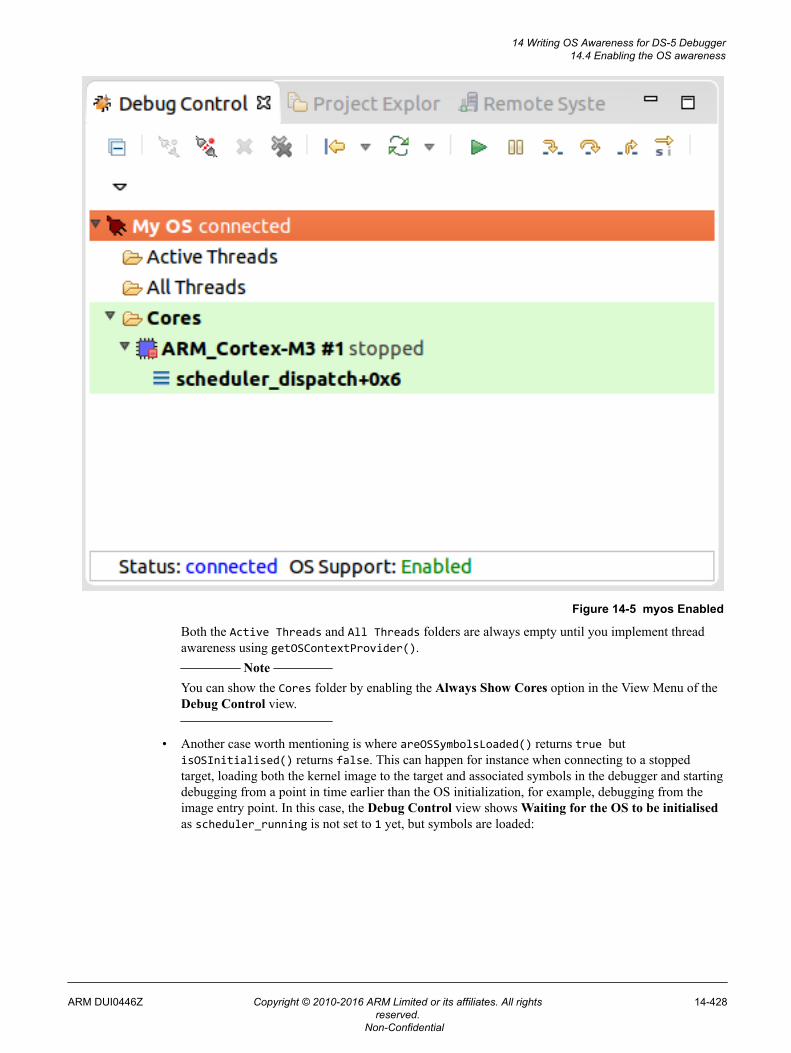
Figure 14-5 myos Enabled
Both the Active Threads and All Threads folders are always empty until you implement threadawareness using getOSContextProvider().
Note
You can show the Cores folder by enabling the Always Show Cores option in the View Menu of theDebug Control view.
• Another case worth mentioning is where areOSSymbolsLoaded() returns true butisOSInitialised() returns false. This can happen for instance when connecting to a stoppedtarget, loading both the kernel image to the target and associated symbols in the debugger and startingdebugging from a point in time earlier than the OS initialization, for example, debugging from theimage entry point. In this case, the Debug Control view shows Waiting for the OS to be initialisedas scheduler_running is not set to 1 yet, but symbols are loaded:
14 Writing OS Awareness for DS-5 Debugger14.4 Enabling the OS awareness
ARM DUI0446Z Copyright © 2010-2016 ARM Limited or its affiliates. All rightsreserved.
14-428
Non-Confidential
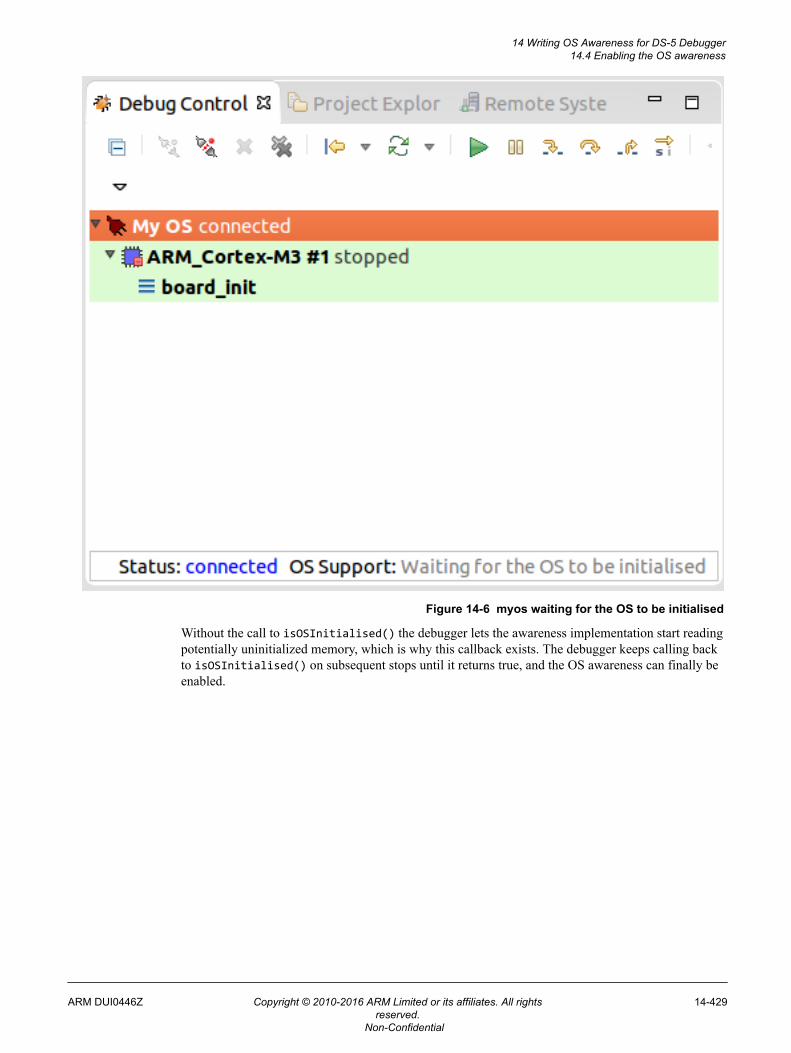
Figure 14-6 myos waiting for the OS to be initialised
Without the call to isOSInitialised() the debugger lets the awareness implementation start readingpotentially uninitialized memory, which is why this callback exists. The debugger keeps calling backto isOSInitialised() on subsequent stops until it returns true, and the OS awareness can finally beenabled.
14 Writing OS Awareness for DS-5 Debugger14.4 Enabling the OS awareness
ARM DUI0446Z Copyright © 2010-2016 ARM Limited or its affiliates. All rightsreserved.
14-429
Non-Confidential
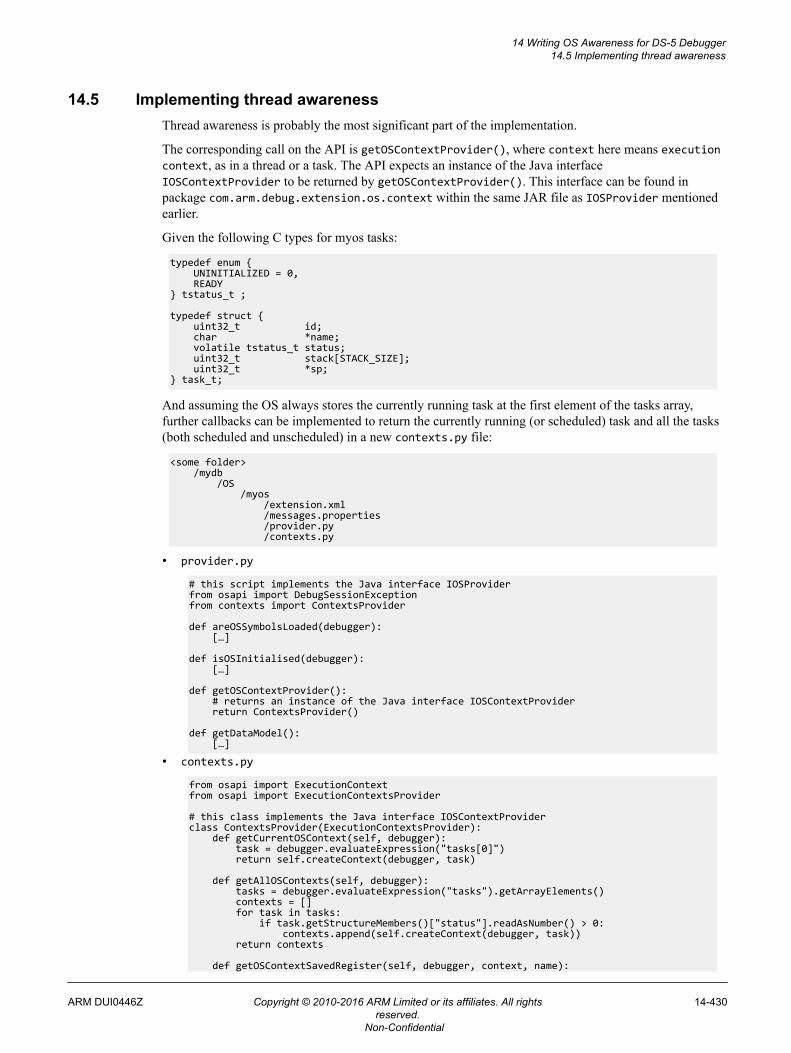
14.5 Implementing thread awarenessThread awareness is probably the most significant part of the implementation.
The corresponding call on the API is getOSContextProvider(), where context here means executioncontext, as in a thread or a task. The API expects an instance of the Java interfaceIOSContextProvider to be returned by getOSContextProvider(). This interface can be found inpackage com.arm.debug.extension.os.context within the same JAR file as IOSProvider mentionedearlier.
Given the following C types for myos tasks:
typedef enum { UNINITIALIZED = 0, READY} tstatus_t ;
typedef struct { uint32_t id; char *name; volatile tstatus_t status; uint32_t stack[STACK_SIZE]; uint32_t *sp;} task_t;
And assuming the OS always stores the currently running task at the first element of the tasks array,further callbacks can be implemented to return the currently running (or scheduled) task and all the tasks(both scheduled and unscheduled) in a new contexts.py file:
<some folder> /mydb /OS /myos /extension.xml /messages.properties /provider.py /contexts.py
• provider.py
# this script implements the Java interface IOSProviderfrom osapi import DebugSessionExceptionfrom contexts import ContextsProvider
def areOSSymbolsLoaded(debugger): […]
def isOSInitialised(debugger): […]
def getOSContextProvider(): # returns an instance of the Java interface IOSContextProvider return ContextsProvider()
def getDataModel(): […]
• contexts.py
from osapi import ExecutionContextfrom osapi import ExecutionContextsProvider
# this class implements the Java interface IOSContextProviderclass ContextsProvider(ExecutionContextsProvider): def getCurrentOSContext(self, debugger): task = debugger.evaluateExpression("tasks[0]") return self.createContext(debugger, task) def getAllOSContexts(self, debugger): tasks = debugger.evaluateExpression("tasks").getArrayElements() contexts = [] for task in tasks: if task.getStructureMembers()["status"].readAsNumber() > 0: contexts.append(self.createContext(debugger, task)) return contexts def getOSContextSavedRegister(self, debugger, context, name):
14 Writing OS Awareness for DS-5 Debugger14.5 Implementing thread awareness
ARM DUI0446Z Copyright © 2010-2016 ARM Limited or its affiliates. All rightsreserved.
14-430
Non-Confidential
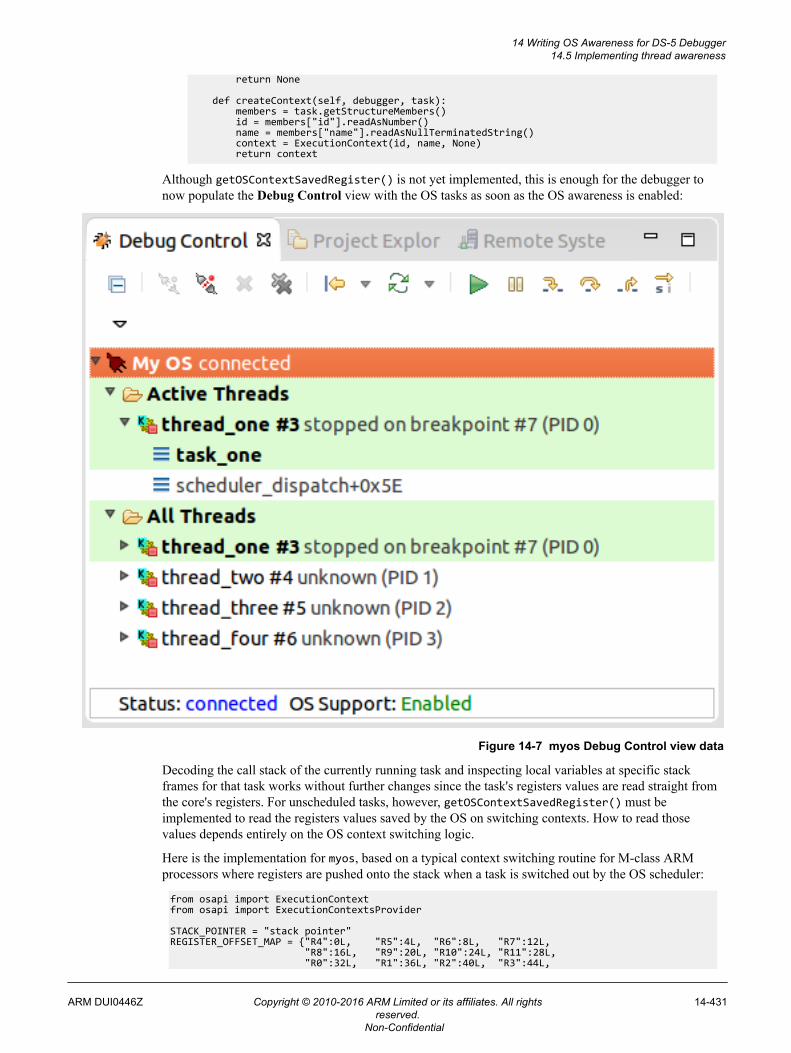
return None
def createContext(self, debugger, task): members = task.getStructureMembers() id = members["id"].readAsNumber() name = members["name"].readAsNullTerminatedString() context = ExecutionContext(id, name, None) return context
Although getOSContextSavedRegister() is not yet implemented, this is enough for the debugger tonow populate the Debug Control view with the OS tasks as soon as the OS awareness is enabled:
Figure 14-7 myos Debug Control view data
Decoding the call stack of the currently running task and inspecting local variables at specific stackframes for that task works without further changes since the task's registers values are read straight fromthe core's registers. For unscheduled tasks, however, getOSContextSavedRegister() must beimplemented to read the registers values saved by the OS on switching contexts. How to read thosevalues depends entirely on the OS context switching logic.
Here is the implementation for myos, based on a typical context switching routine for M-class ARMprocessors where registers are pushed onto the stack when a task is switched out by the OS scheduler:
from osapi import ExecutionContextfrom osapi import ExecutionContextsProvider
STACK_POINTER = "stack pointer"REGISTER_OFFSET_MAP = {"R4":0L, "R5":4L, "R6":8L, "R7":12L, "R8":16L, "R9":20L, "R10":24L, "R11":28L, "R0":32L, "R1":36L, "R2":40L, "R3":44L,
14 Writing OS Awareness for DS-5 Debugger14.5 Implementing thread awareness
ARM DUI0446Z Copyright © 2010-2016 ARM Limited or its affiliates. All rightsreserved.
14-431
Non-Confidential
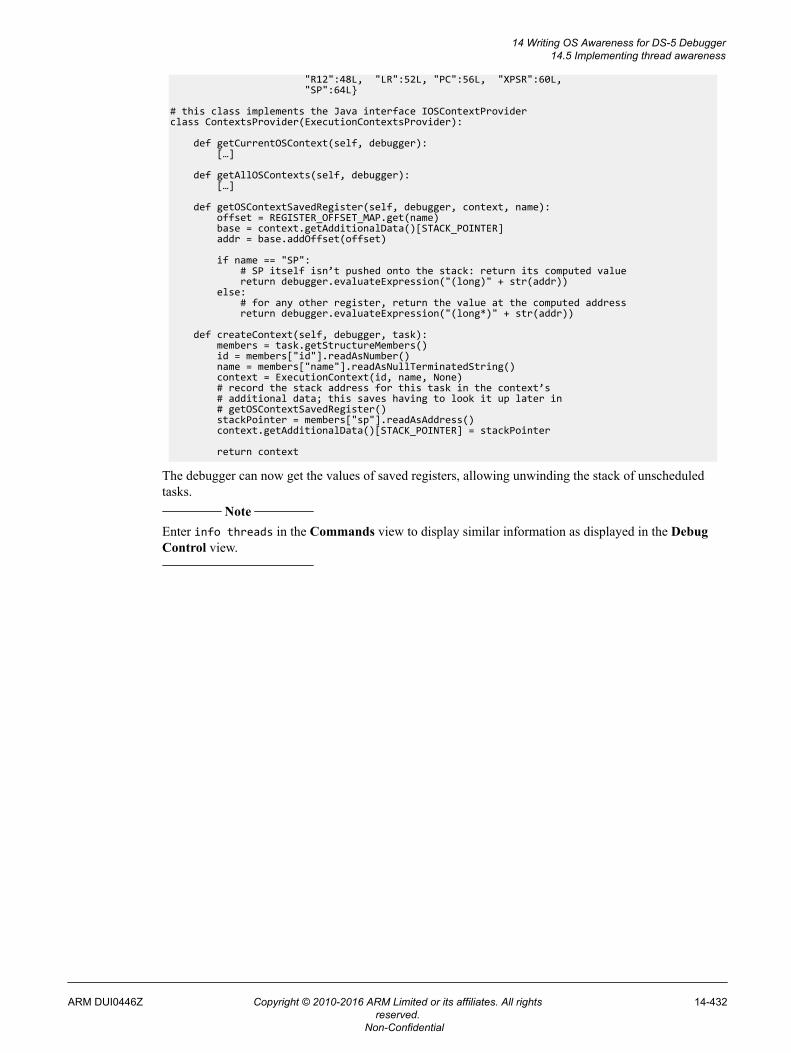
"R12":48L, "LR":52L, "PC":56L, "XPSR":60L, "SP":64L}
# this class implements the Java interface IOSContextProviderclass ContextsProvider(ExecutionContextsProvider):
def getCurrentOSContext(self, debugger): […]
def getAllOSContexts(self, debugger): […]
def getOSContextSavedRegister(self, debugger, context, name): offset = REGISTER_OFFSET_MAP.get(name) base = context.getAdditionalData()[STACK_POINTER] addr = base.addOffset(offset)
if name == "SP": # SP itself isn’t pushed onto the stack: return its computed value return debugger.evaluateExpression("(long)" + str(addr)) else: # for any other register, return the value at the computed address return debugger.evaluateExpression("(long*)" + str(addr))
def createContext(self, debugger, task): members = task.getStructureMembers() id = members["id"].readAsNumber() name = members["name"].readAsNullTerminatedString() context = ExecutionContext(id, name, None) # record the stack address for this task in the context’s # additional data; this saves having to look it up later in # getOSContextSavedRegister() stackPointer = members["sp"].readAsAddress() context.getAdditionalData()[STACK_POINTER] = stackPointer return context
The debugger can now get the values of saved registers, allowing unwinding the stack of unscheduledtasks.
Note
Enter info threads in the Commands view to display similar information as displayed in the DebugControl view.
14 Writing OS Awareness for DS-5 Debugger14.5 Implementing thread awareness
ARM DUI0446Z Copyright © 2010-2016 ARM Limited or its affiliates. All rightsreserved.
14-432
Non-Confidential
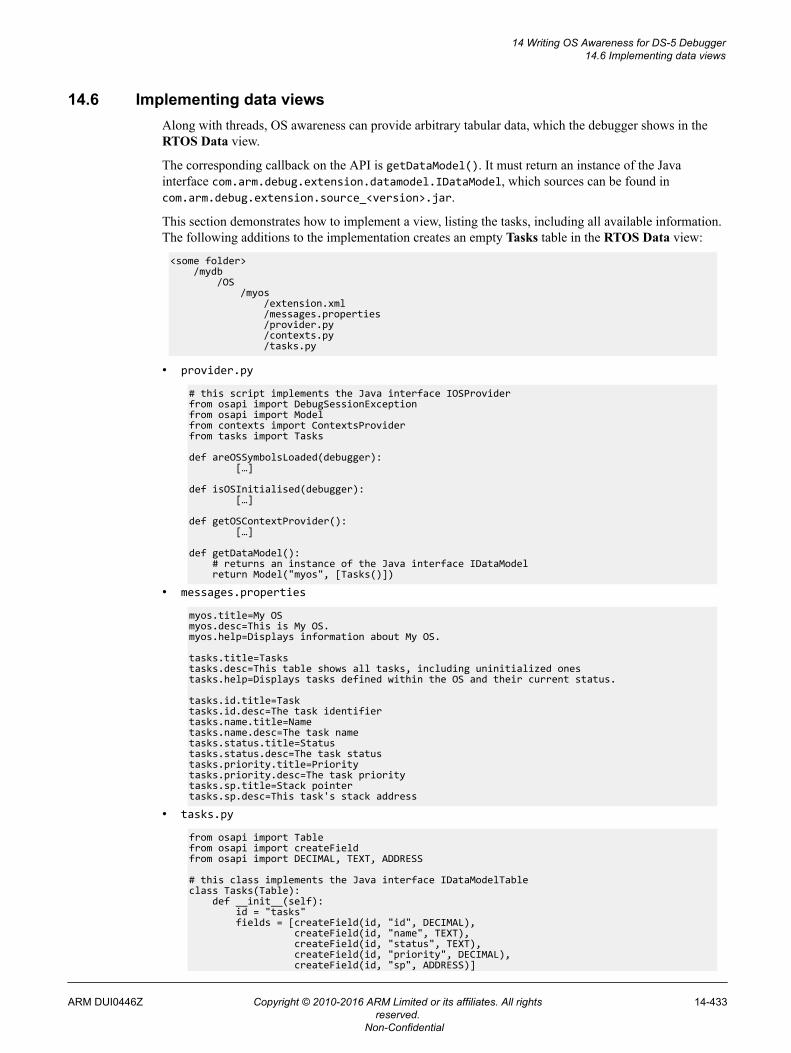
14.6 Implementing data viewsAlong with threads, OS awareness can provide arbitrary tabular data, which the debugger shows in theRTOS Data view.
The corresponding callback on the API is getDataModel(). It must return an instance of the Javainterface com.arm.debug.extension.datamodel.IDataModel, which sources can be found incom.arm.debug.extension.source_<version>.jar.
This section demonstrates how to implement a view, listing the tasks, including all available information.The following additions to the implementation creates an empty Tasks table in the RTOS Data view:
<some folder> /mydb /OS /myos /extension.xml /messages.properties /provider.py /contexts.py /tasks.py
• provider.py
# this script implements the Java interface IOSProviderfrom osapi import DebugSessionExceptionfrom osapi import Modelfrom contexts import ContextsProviderfrom tasks import Tasks
def areOSSymbolsLoaded(debugger): […]
def isOSInitialised(debugger): […]
def getOSContextProvider(): […]
def getDataModel(): # returns an instance of the Java interface IDataModel return Model("myos", [Tasks()])
• messages.properties
myos.title=My OSmyos.desc=This is My OS.myos.help=Displays information about My OS.
tasks.title=Taskstasks.desc=This table shows all tasks, including uninitialized onestasks.help=Displays tasks defined within the OS and their current status.
tasks.id.title=Tasktasks.id.desc=The task identifiertasks.name.title=Nametasks.name.desc=The task nametasks.status.title=Statustasks.status.desc=The task statustasks.priority.title=Prioritytasks.priority.desc=The task prioritytasks.sp.title=Stack pointertasks.sp.desc=This task's stack address
• tasks.py
from osapi import Tablefrom osapi import createFieldfrom osapi import DECIMAL, TEXT, ADDRESS
# this class implements the Java interface IDataModelTableclass Tasks(Table): def __init__(self): id = "tasks" fields = [createField(id, "id", DECIMAL), createField(id, "name", TEXT), createField(id, "status", TEXT), createField(id, "priority", DECIMAL), createField(id, "sp", ADDRESS)]
14 Writing OS Awareness for DS-5 Debugger14.6 Implementing data views
ARM DUI0446Z Copyright © 2010-2016 ARM Limited or its affiliates. All rightsreserved.
14-433
Non-Confidential
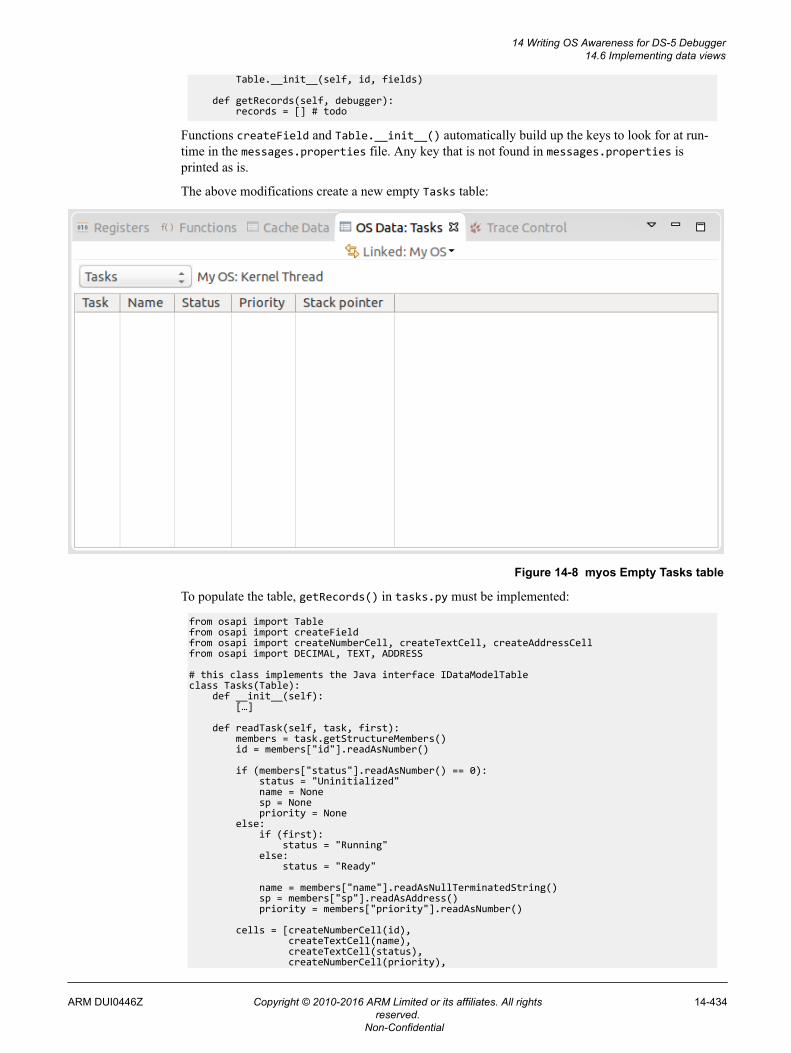
Table.__init__(self, id, fields)
def getRecords(self, debugger): records = [] # todo
Functions createField and Table.__init__() automatically build up the keys to look for at run-time in the messages.properties file. Any key that is not found in messages.properties isprinted as is.
The above modifications create a new empty Tasks table:
Figure 14-8 myos Empty Tasks table
To populate the table, getRecords() in tasks.py must be implemented:
from osapi import Tablefrom osapi import createFieldfrom osapi import createNumberCell, createTextCell, createAddressCellfrom osapi import DECIMAL, TEXT, ADDRESS
# this class implements the Java interface IDataModelTableclass Tasks(Table): def __init__(self): […]
def readTask(self, task, first): members = task.getStructureMembers() id = members["id"].readAsNumber()
if (members["status"].readAsNumber() == 0): status = "Uninitialized" name = None sp = None priority = None else: if (first): status = "Running" else: status = "Ready"
name = members["name"].readAsNullTerminatedString() sp = members["sp"].readAsAddress() priority = members["priority"].readAsNumber()
cells = [createNumberCell(id), createTextCell(name), createTextCell(status), createNumberCell(priority),
14 Writing OS Awareness for DS-5 Debugger14.6 Implementing data views
ARM DUI0446Z Copyright © 2010-2016 ARM Limited or its affiliates. All rightsreserved.
14-434
Non-Confidential
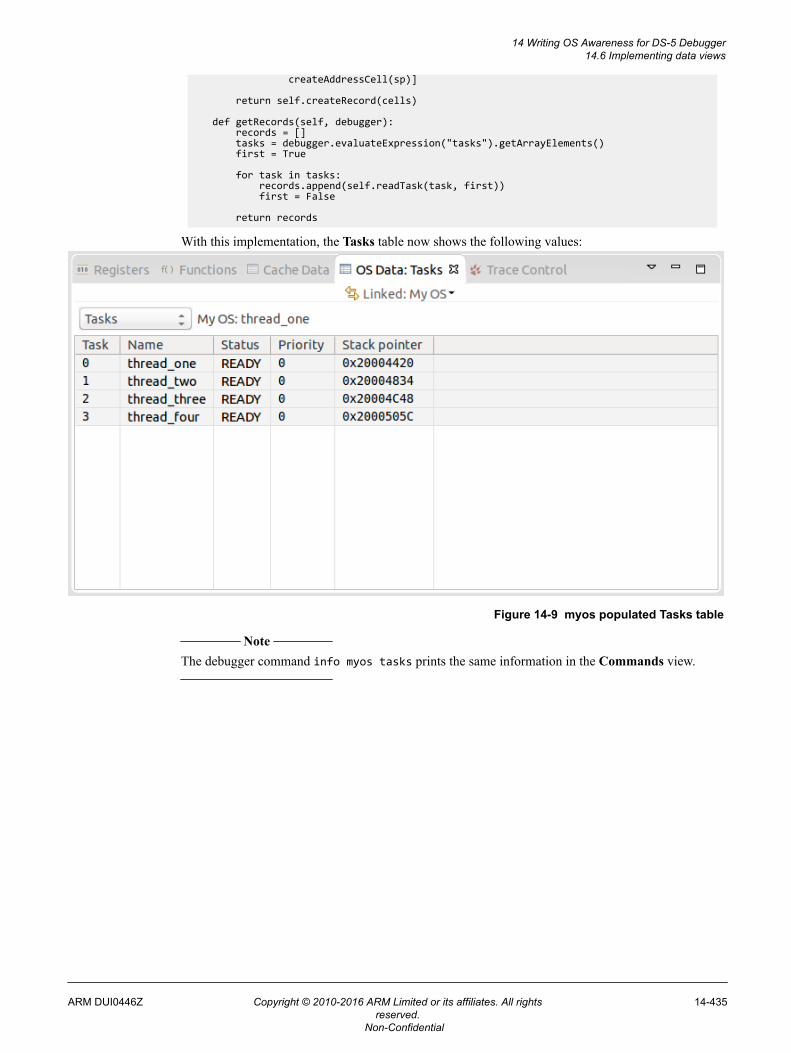
createAddressCell(sp)] return self.createRecord(cells) def getRecords(self, debugger): records = [] tasks = debugger.evaluateExpression("tasks").getArrayElements() first = True for task in tasks: records.append(self.readTask(task, first)) first = False return records
With this implementation, the Tasks table now shows the following values:
Figure 14-9 myos populated Tasks table
Note
The debugger command info myos tasks prints the same information in the Commands view.
14 Writing OS Awareness for DS-5 Debugger14.6 Implementing data views
ARM DUI0446Z Copyright © 2010-2016 ARM Limited or its affiliates. All rightsreserved.
14-435
Non-Confidential
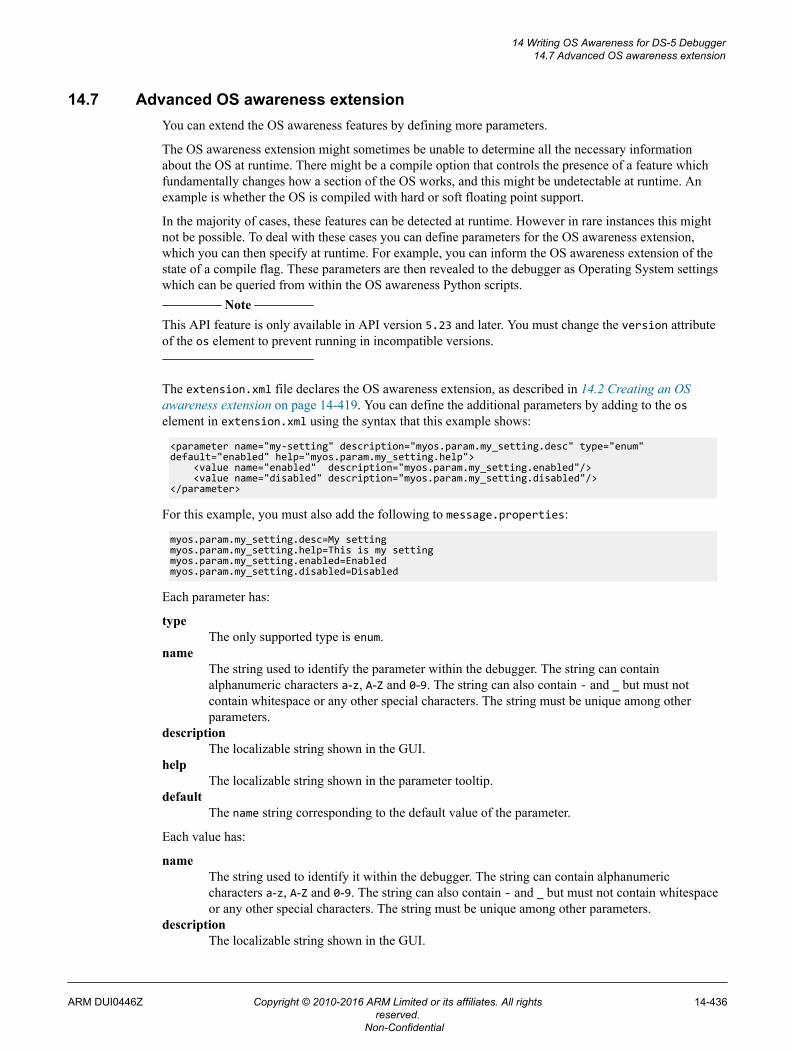
14.7 Advanced OS awareness extensionYou can extend the OS awareness features by defining more parameters.
The OS awareness extension might sometimes be unable to determine all the necessary informationabout the OS at runtime. There might be a compile option that controls the presence of a feature whichfundamentally changes how a section of the OS works, and this might be undetectable at runtime. Anexample is whether the OS is compiled with hard or soft floating point support.
In the majority of cases, these features can be detected at runtime. However in rare instances this mightnot be possible. To deal with these cases you can define parameters for the OS awareness extension,which you can then specify at runtime. For example, you can inform the OS awareness extension of thestate of a compile flag. These parameters are then revealed to the debugger as Operating System settingswhich can be queried from within the OS awareness Python scripts.
Note
This API feature is only available in API version 5.23 and later. You must change the version attributeof the os element to prevent running in incompatible versions.
The extension.xml file declares the OS awareness extension, as described in 14.2 Creating an OSawareness extension on page 14-419. You can define the additional parameters by adding to the oselement in extension.xml using the syntax that this example shows:
<parameter name="my-setting" description="myos.param.my_setting.desc" type="enum" default="enabled" help="myos.param.my_setting.help"> <value name="enabled" description="myos.param.my_setting.enabled"/> <value name="disabled" description="myos.param.my_setting.disabled"/></parameter>
For this example, you must also add the following to message.properties:
myos.param.my_setting.desc=My settingmyos.param.my_setting.help=This is my settingmyos.param.my_setting.enabled=Enabledmyos.param.my_setting.disabled=Disabled
Each parameter has:
typeThe only supported type is enum.
nameThe string used to identify the parameter within the debugger. The string can containalphanumeric characters a-z, A-Z and 0-9. The string can also contain - and _ but must notcontain whitespace or any other special characters. The string must be unique among otherparameters.
descriptionThe localizable string shown in the GUI.
helpThe localizable string shown in the parameter tooltip.
defaultThe name string corresponding to the default value of the parameter.
Each value has:
nameThe string used to identify it within the debugger. The string can contain alphanumericcharacters a-z, A-Z and 0-9. The string can also contain - and _ but must not contain whitespaceor any other special characters. The string must be unique among other parameters.
descriptionThe localizable string shown in the GUI.
14 Writing OS Awareness for DS-5 Debugger14.7 Advanced OS awareness extension
ARM DUI0446Z Copyright © 2010-2016 ARM Limited or its affiliates. All rightsreserved.
14-436
Non-Confidential
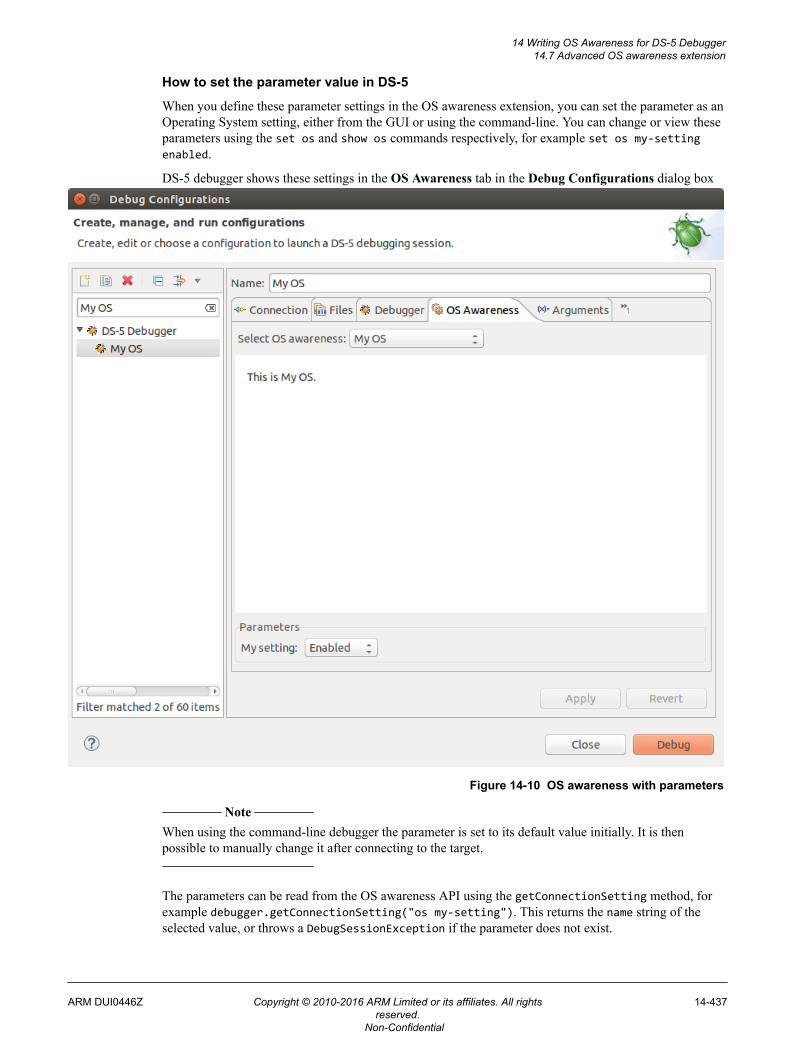
How to set the parameter value in DS-5
When you define these parameter settings in the OS awareness extension, you can set the parameter as anOperating System setting, either from the GUI or using the command-line. You can change or view theseparameters using the set os and show os commands respectively, for example set os my-settingenabled.
DS-5 debugger shows these settings in the OS Awareness tab in the Debug Configurations dialog box
Figure 14-10 OS awareness with parameters
Note
When using the command-line debugger the parameter is set to its default value initially. It is thenpossible to manually change it after connecting to the target.
The parameters can be read from the OS awareness API using the getConnectionSetting method, forexample debugger.getConnectionSetting("os my-setting"). This returns the name string of theselected value, or throws a DebugSessionException if the parameter does not exist.
14 Writing OS Awareness for DS-5 Debugger14.7 Advanced OS awareness extension
ARM DUI0446Z Copyright © 2010-2016 ARM Limited or its affiliates. All rightsreserved.
14-437
Non-Confidential
14.8 Programming advice and noteworthy informationInvestigating issues in Python code for an OS awareness extension can sometimes be difficult.
Here are a few recommendations to make debugging easier:• Start Eclipse from a console.
Python print statements go to the Eclipse process standard output/error streams, which are notvisible unless Eclipse is started from a console.— On Linux, open a new terminal and run:
<DS-5 installation folder>/bin/eclipse
— On Windows, open command prompt and run:
<DS-5 installation folder>\bin\eclipsec
Note the trailing c in eclipsec.• Use the Error Log view.Most errors that occur in the debugger are logged in details in the Error
Log view. The full stack trace of an error is particularly useful as it often contains references to thelocation in the source files that generated the error.
• Turn on verbose error logging in the debugger
Although most errors are logged in the Error Log view, any error happening in the debugger eventprocessing logic is not. One alternative is to turn on verbose error logging to print the full stack traceof errors in the Console view.
To turn on verbose error logging, execute the following command early in the debug session:
log config infoex Note
— It is worth understanding that an OS awareness implementation interacts at the deepest level withthe debugger, and some errors may cause the debugger to lose control of the target.
— Also note that semihosting is not available when OS awareness is specified.
14 Writing OS Awareness for DS-5 Debugger14.8 Programming advice and noteworthy information
ARM DUI0446Z Copyright © 2010-2016 ARM Limited or its affiliates. All rightsreserved.
14-438
Non-Confidential
Chapter 15Debug and Trace Services Layer (DTSL)
Describes the DS-5 Debugger Debug and Trace Services Layer (DTSL).
DTSL is a software layer that sits between the debugger and the RDDI target access API. DS-5Debugger uses DTSL to:
• Create target connections.• Configure the target platform to be ready for debug operations.• Communicate with the debug components on the target.
As a power user of DS-5 Debugger, you might need to use DTSL:• As part of new platform support.• To extend the capabilities of DS-5 Debugger.• To add support for custom debug components.• To create your own Java or Jython programs which interact with your target.
It contains the following sections:• 15.1 Additional DTSL documentation and files on page 15-440.• 15.2 Need for DTSL on page 15-441.• 15.3 DS-5 configuration database on page 15-446.• 15.4 DTSL as used by DS-5 Debugger on page 15-452.• 15.5 Main DTSL classes and hierarchy on page 15-454.• 15.6 DTSL options on page 15-462.• 15.7 DTSL support for SMP and AMP configurations on page 15-468.• 15.8 DTSL Trace on page 15-472.• 15.9 Extending the DTSL object model on page 15-479.• 15.10 Debugging DTSL Jython code within DS-5 Debugger on page 15-484.• 15.11 DTSL in stand-alone mode on page 15-488.
ARM DUI0446Z Copyright © 2010-2016 ARM Limited or its affiliates. All rightsreserved.
15-439
Non-Confidential
15.1 Additional DTSL documentation and filesAdditional DTSL documents and files are provided in <DS-5 Install folder>\sw\DTSL.
The following documents are useful for understanding DTSL. Make sure you have access to them.
DTSL object level documentationDTSL is mainly written in Java, so the documentation takes the form of Javadoc files. TheDTSL Javadoc is provided both as a PDF (DTSLJavaDocs.pdf) and as HTML files (insidecom.arm.debug.dtsl.docs.zip). You can view the HTML files directly in a browser, or usethem from within the Eclipse environment.
Certain classes in the DTSL Javadocs are marked as Deprecated. These classes must not be usedin new DTSL code. They are only provided in the documentation in case you encounter themwhen inspecting older DTSL code.
RDDI API documentationDTSL is designed to use RDDI-DEBUG as its native target connection API. Some of the RDDI-DEBUG API is therefore referred to from within DTSL. For completeness, the RDDIdocumentation is included with the DTSL documentation.
The RDDI documentation is provided in HTML format in <DS-5 Install folder>\sw\debugger\RDDI\docs\html. To access the documentation, open index.html.
Also, make sure you have access to DTSLExamples.zip. This contains example DTSL code, in additionto the DS-5 configdb entries discussed in this document. This document assumes that you have added theexamples to your Eclipse installation by importing the Eclipse projects contained in this file.
Related informationARM Architecture Reference Manual ARMv7-A and ARMv7-R edition.ARM Debug Interface Architecture Specification.
15 Debug and Trace Services Layer (DTSL)15.1 Additional DTSL documentation and files
ARM DUI0446Z Copyright © 2010-2016 ARM Limited or its affiliates. All rightsreserved.
15-440
Non-Confidential
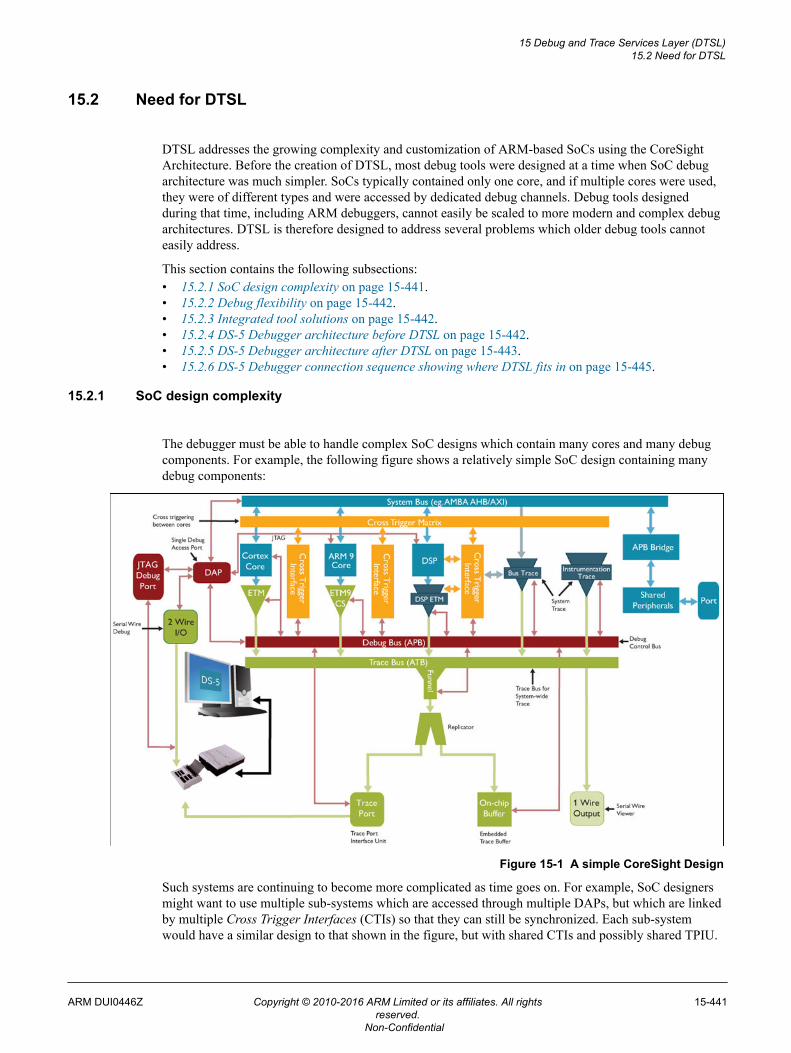
15.2 Need for DTSL
DTSL addresses the growing complexity and customization of ARM-based SoCs using the CoreSightArchitecture. Before the creation of DTSL, most debug tools were designed at a time when SoC debugarchitecture was much simpler. SoCs typically contained only one core, and if multiple cores were used,they were of different types and were accessed by dedicated debug channels. Debug tools designedduring that time, including ARM debuggers, cannot easily be scaled to more modern and complex debugarchitectures. DTSL is therefore designed to address several problems which older debug tools cannoteasily address.
This section contains the following subsections:• 15.2.1 SoC design complexity on page 15-441.• 15.2.2 Debug flexibility on page 15-442.• 15.2.3 Integrated tool solutions on page 15-442.• 15.2.4 DS-5 Debugger architecture before DTSL on page 15-442.• 15.2.5 DS-5 Debugger architecture after DTSL on page 15-443.• 15.2.6 DS-5 Debugger connection sequence showing where DTSL fits in on page 15-445.
15.2.1 SoC design complexity
The debugger must be able to handle complex SoC designs which contain many cores and many debugcomponents. For example, the following figure shows a relatively simple SoC design containing manydebug components:
Figure 15-1 A simple CoreSight Design
Such systems are continuing to become more complicated as time goes on. For example, SoC designersmight want to use multiple sub-systems which are accessed through multiple DAPs, but which are linkedby multiple Cross Trigger Interfaces (CTIs) so that they can still be synchronized. Each sub-systemwould have a similar design to that shown in the figure, but with shared CTIs and possibly shared TPIU.
15 Debug and Trace Services Layer (DTSL)15.2 Need for DTSL
ARM DUI0446Z Copyright © 2010-2016 ARM Limited or its affiliates. All rightsreserved.
15-441
Non-Confidential
Because system designs are so complicated, and vary so greatly, DTSL is designed to provide a layer ofabstraction between the details of a particular system and the tools which provide debuggingfunctionality to the user. For example, a debug tool using DTSL knows that there is a source of trace datafor a particular core, and can access that data, but does not have to handle the complexities of systemconfiguration and tool set-up in order to get that data. It does not have to know how to, for example,program up CoreSight Funnels, collect trace data from a DSTREAM, or demultiplex the TPIU traceprotocol.
15.2.2 Debug flexibility
DTSL is designed to address the problems associated with the following:• SoC designers sometimes add their own components, which are not part of any ARM standard.
Debug tools might need to interact with these components to access the target.• CoreSight designs can be very flexible, and early implementations might have design issues that the
debug tool needs to work around.• CoreSight designs can contain components which can be interconnected in many ways.
15.2.3 Integrated tool solutions
CoreSight designs can contain shared debug resources which need to be managed and used from multipletools. For example, the system might be able to generate trace from several trace sources, such as ARMcores + DSP. In legacy designs, the trace paths would be independent and each debug tool would have itsown connection to the respective sub-system. In a typical CoreSight system, the trace data is merged by aFunnel component and delivered to a single trace storage device though a single interface. The trace datais then uploaded and de-multiplexed. The trace data might need to be delivered to several different debugtools, such as ARM DS-5 and DSP Debug Tool.
DTSL addresses the tool integration problem that this situation raises.
15.2.4 DS-5 Debugger architecture before DTSL
Before DTSL first became available, the early DS-5 Debugger Software stack was as shown in thefollowing figure:
15 Debug and Trace Services Layer (DTSL)15.2 Need for DTSL
ARM DUI0446Z Copyright © 2010-2016 ARM Limited or its affiliates. All rightsreserved.
15-442
Non-Confidential
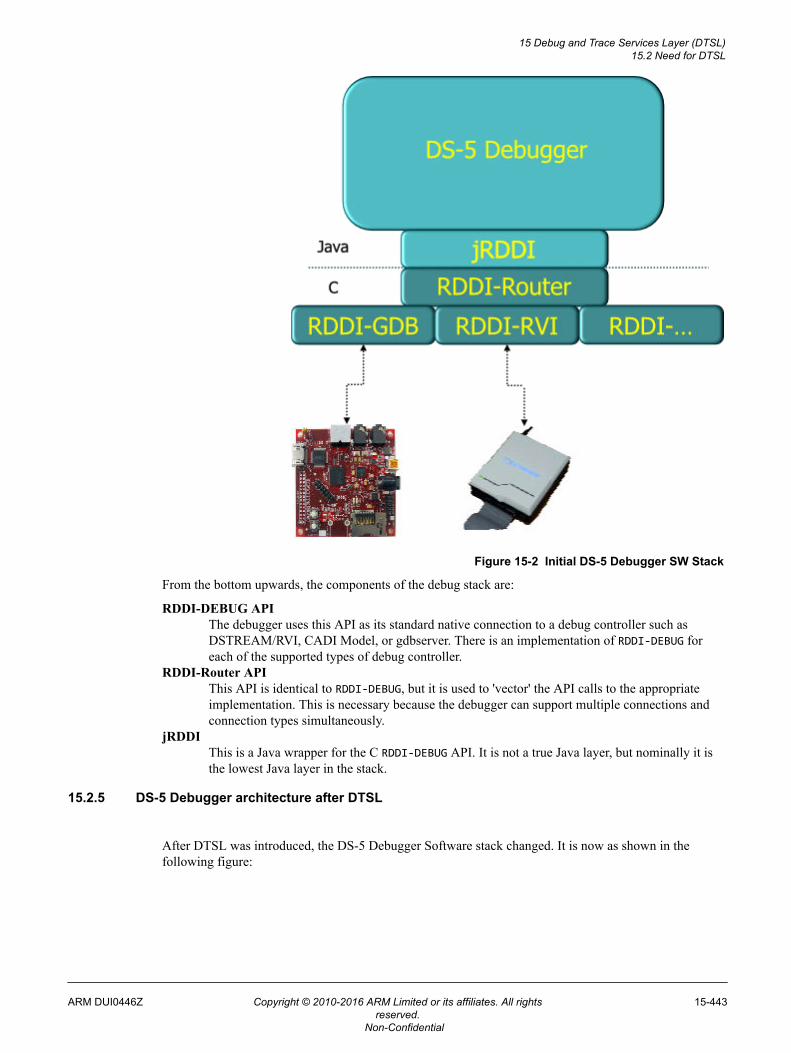
Figure 15-2 Initial DS-5 Debugger SW Stack
From the bottom upwards, the components of the debug stack are:
RDDI-DEBUG APIThe debugger uses this API as its standard native connection to a debug controller such asDSTREAM/RVI, CADI Model, or gdbserver. There is an implementation of RDDI-DEBUG foreach of the supported types of debug controller.
RDDI-Router APIThis API is identical to RDDI-DEBUG, but it is used to 'vector' the API calls to the appropriateimplementation. This is necessary because the debugger can support multiple connections andconnection types simultaneously.
jRDDIThis is a Java wrapper for the C RDDI-DEBUG API. It is not a true Java layer, but nominally it isthe lowest Java layer in the stack.
15.2.5 DS-5 Debugger architecture after DTSL
After DTSL was introduced, the DS-5 Debugger Software stack changed. It is now as shown in thefollowing figure:
15 Debug and Trace Services Layer (DTSL)15.2 Need for DTSL
ARM DUI0446Z Copyright © 2010-2016 ARM Limited or its affiliates. All rightsreserved.
15-443
Non-Confidential
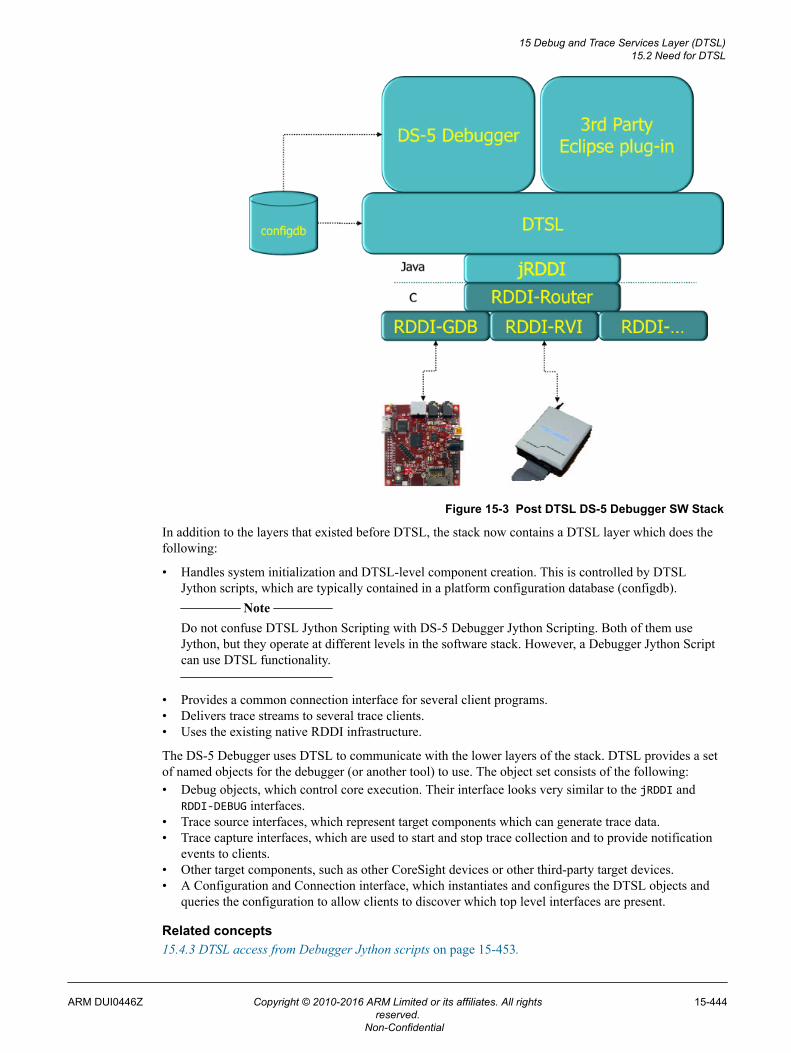
Figure 15-3 Post DTSL DS-5 Debugger SW Stack
In addition to the layers that existed before DTSL, the stack now contains a DTSL layer which does thefollowing:
• Handles system initialization and DTSL-level component creation. This is controlled by DTSLJython scripts, which are typically contained in a platform configuration database (configdb).
Note
Do not confuse DTSL Jython Scripting with DS-5 Debugger Jython Scripting. Both of them useJython, but they operate at different levels in the software stack. However, a Debugger Jython Scriptcan use DTSL functionality.
• Provides a common connection interface for several client programs.• Delivers trace streams to several trace clients.• Uses the existing native RDDI infrastructure.
The DS-5 Debugger uses DTSL to communicate with the lower layers of the stack. DTSL provides a setof named objects for the debugger (or another tool) to use. The object set consists of the following:• Debug objects, which control core execution. Their interface looks very similar to the jRDDI and
RDDI-DEBUG interfaces.• Trace source interfaces, which represent target components which can generate trace data.• Trace capture interfaces, which are used to start and stop trace collection and to provide notification
events to clients.• Other target components, such as other CoreSight devices or other third-party target devices.• A Configuration and Connection interface, which instantiates and configures the DTSL objects and
queries the configuration to allow clients to discover which top level interfaces are present.
Related concepts15.4.3 DTSL access from Debugger Jython scripts on page 15-453.
15 Debug and Trace Services Layer (DTSL)15.2 Need for DTSL
ARM DUI0446Z Copyright © 2010-2016 ARM Limited or its affiliates. All rightsreserved.
15-444
Non-Confidential
15.2.6 DS-5 Debugger connection sequence showing where DTSL fits in
The sequence below outlines the DS-5 Debugger connection sequence when connecting to a target, andwhere DTSL fits in.1. The user creates an Eclipse launch configuration by selecting a platform (board) and a debug
operation from the DS-5 configdb. The user also specifies other debugger configuration parameterssuch as which file (.axf) to debug.
2. The user activates a launch configuration, either from the launch configuration editor or by selectinga previously prepared launch configuration.
3. The debugger launcher code locates the platform (board) entry in the DS-5 Debugger configdb andlocates the DTSL configuration script. This script is run, and it creates the DTSL configuration.
4. The debugger connects to the DTSL configuration created by the script. It locates, by name, theobject or objects identified by the debug operation specified in the configdb platform entry. It usesthese objects to access the target device, including access to memory, registers, and execution state.
15 Debug and Trace Services Layer (DTSL)15.2 Need for DTSL
ARM DUI0446Z Copyright © 2010-2016 ARM Limited or its affiliates. All rightsreserved.
15-445
Non-Confidential
15.3 DS-5 configuration database
All use cases of DTSL potentially require the use of the DS-5 configuration database (configdb). ARMtherefore recommends that you have a basic understanding of the configuration database.
DS-5 Debugger uses a configuration database, called configdb, to store information on how to connectto platforms. This information is split across several top-level locations in the database, each of whichcan contain the following:
Board informationManufacturer, name, list of SoCs, list of Flash, DTSL initialization Jython scripts.
SoC informationCore information. For example, a SoC may contain + Cortex-M3.
Core informationRegister sets for the core, and other information such as TrustZone support.
Flash informationInformation on flash types and programming algorithms.
Common scripts (Jython)Jython scripts which might be of use to several database entries.
This information is mainly stored as XML files, located in sub-directories of the top-level locations.
The configuration database is located at <DS-5 install folder>\sw\debugger\configdb.
DS-5 allows you to configure one or more extension configdb locations, which are typically used to addmore board definitions or flash support to DS-5.
This section contains the following subsections:• 15.3.1 Modifying DS-5 configdb on page 15-446.• 15.3.2 Configdb board files on page 15-447.• 15.3.3 About project_types.xml on page 15-447.• 15.3.4 About the keil-mcbstm32e.py script on page 15-448.• 15.3.5 DTSL script on page 15-450.
15.3.1 Modifying DS-5 configdb
The DS-5 configdb is usually installed into a read-only location, to prevent accidental modification ofthe installed files. However, DS-5 allows the user to install configdb extensions, which can be in awriteable location. The configdb extensions can also override the entries in the installed directories. Tomodify an installed configdb board entry (directory), you need to copy the installed entry into yourDocuments folder or home directory, modify it, and tell DS-5 to add it as a configdb extension.
For example, to modify the Keil MCBSTM32E platform files:1. Create a configdb directory in your Documents folder or in another writeable location.2. Create a Boards directory inside the configdb directory.3. Copy the Keil/MSCSTM32E directory into the Boards directory.4. Modify the copied configdb files.5. Tell DS-5 about the new configdb extension. To do this:
a. Select Window > Preferences.b. Expand the DS-5 entry in the Preferences window.c. Select the Configuration Database entry.d. Click the Add... button to add the location of the new configuration database to the User
Configuration Databases list.
15 Debug and Trace Services Layer (DTSL)15.3 DS-5 configuration database
ARM DUI0446Z Copyright © 2010-2016 ARM Limited or its affiliates. All rightsreserved.
15-446
Non-Confidential
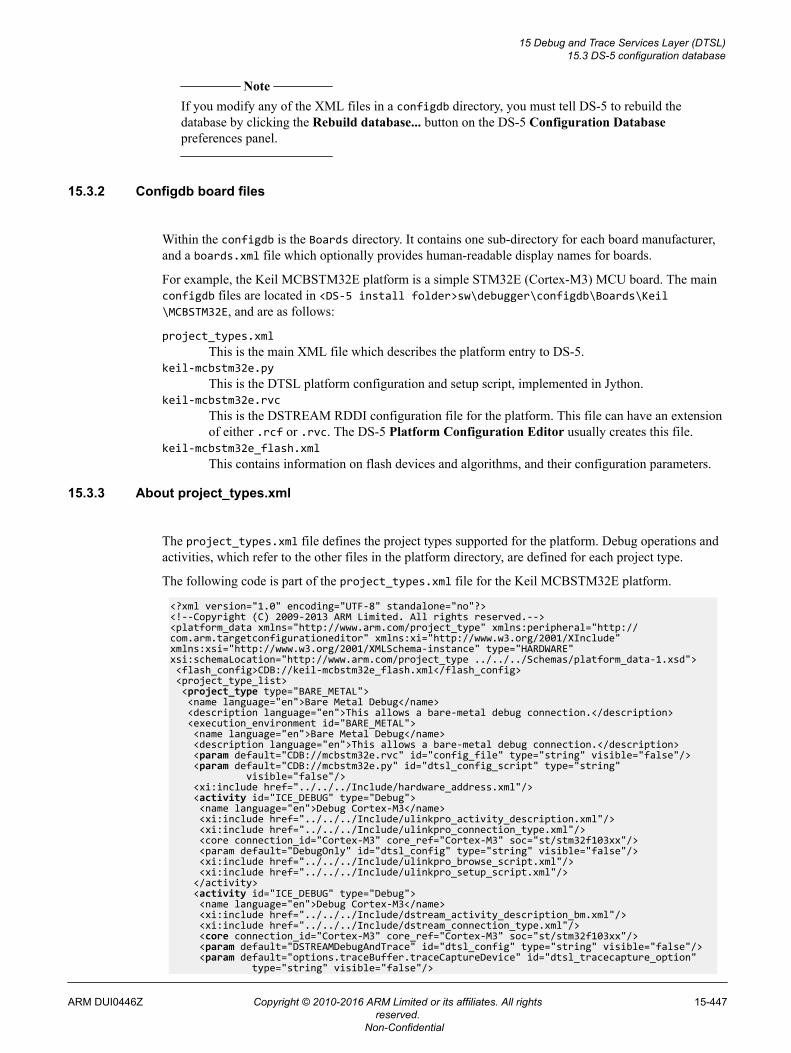
Note
If you modify any of the XML files in a configdb directory, you must tell DS-5 to rebuild thedatabase by clicking the Rebuild database... button on the DS-5 Configuration Databasepreferences panel.
15.3.2 Configdb board files
Within the configdb is the Boards directory. It contains one sub-directory for each board manufacturer,and a boards.xml file which optionally provides human-readable display names for boards.
For example, the Keil MCBSTM32E platform is a simple STM32E (Cortex-M3) MCU board. The mainconfigdb files are located in <DS-5 install folder>sw\debugger\configdb\Boards\Keil\MCBSTM32E, and are as follows:
project_types.xmlThis is the main XML file which describes the platform entry to DS-5.
keil-mcbstm32e.pyThis is the DTSL platform configuration and setup script, implemented in Jython.
keil-mcbstm32e.rvcThis is the DSTREAM RDDI configuration file for the platform. This file can have an extensionof either .rcf or .rvc. The DS-5 Platform Configuration Editor usually creates this file.
keil-mcbstm32e_flash.xmlThis contains information on flash devices and algorithms, and their configuration parameters.
15.3.3 About project_types.xml
The project_types.xml file defines the project types supported for the platform. Debug operations andactivities, which refer to the other files in the platform directory, are defined for each project type.
The following code is part of the project_types.xml file for the Keil MCBSTM32E platform.
<?xml version="1.0" encoding="UTF-8" standalone="no"?><!--Copyright (C) 2009-2013 ARM Limited. All rights reserved.--><platform_data xmlns="http://www.arm.com/project_type" xmlns:peripheral="http://com.arm.targetconfigurationeditor" xmlns:xi="http://www.w3.org/2001/XInclude" xmlns:xsi="http://www.w3.org/2001/XMLSchema-instance" type="HARDWARE" xsi:schemaLocation="http://www.arm.com/project_type ../../../Schemas/platform_data-1.xsd"> <flash_config>CDB://keil-mcbstm32e_flash.xml</flash_config> <project_type_list> <project_type type="BARE_METAL"> <name language="en">Bare Metal Debug</name> <description language="en">This allows a bare-metal debug connection.</description> <execution_environment id="BARE_METAL"> <name language="en">Bare Metal Debug</name> <description language="en">This allows a bare-metal debug connection.</description> <param default="CDB://mcbstm32e.rvc" id="config_file" type="string" visible="false"/> <param default="CDB://mcbstm32e.py" id="dtsl_config_script" type="string" visible="false"/> <xi:include href="../../../Include/hardware_address.xml"/> <activity id="ICE_DEBUG" type="Debug"> <name language="en">Debug Cortex-M3</name> <xi:include href="../../../Include/ulinkpro_activity_description.xml"/> <xi:include href="../../../Include/ulinkpro_connection_type.xml"/> <core connection_id="Cortex-M3" core_ref="Cortex-M3" soc="st/stm32f103xx"/> <param default="DebugOnly" id="dtsl_config" type="string" visible="false"/> <xi:include href="../../../Include/ulinkpro_browse_script.xml"/> <xi:include href="../../../Include/ulinkpro_setup_script.xml"/> </activity> <activity id="ICE_DEBUG" type="Debug"> <name language="en">Debug Cortex-M3</name> <xi:include href="../../../Include/dstream_activity_description_bm.xml"/> <xi:include href="../../../Include/dstream_connection_type.xml"/> <core connection_id="Cortex-M3" core_ref="Cortex-M3" soc="st/stm32f103xx"/> <param default="DSTREAMDebugAndTrace" id="dtsl_config" type="string" visible="false"/> <param default="options.traceBuffer.traceCaptureDevice" id="dtsl_tracecapture_option" type="string" visible="false"/>
15 Debug and Trace Services Layer (DTSL)15.3 DS-5 configuration database
ARM DUI0446Z Copyright © 2010-2016 ARM Limited or its affiliates. All rightsreserved.
15-447
Non-Confidential
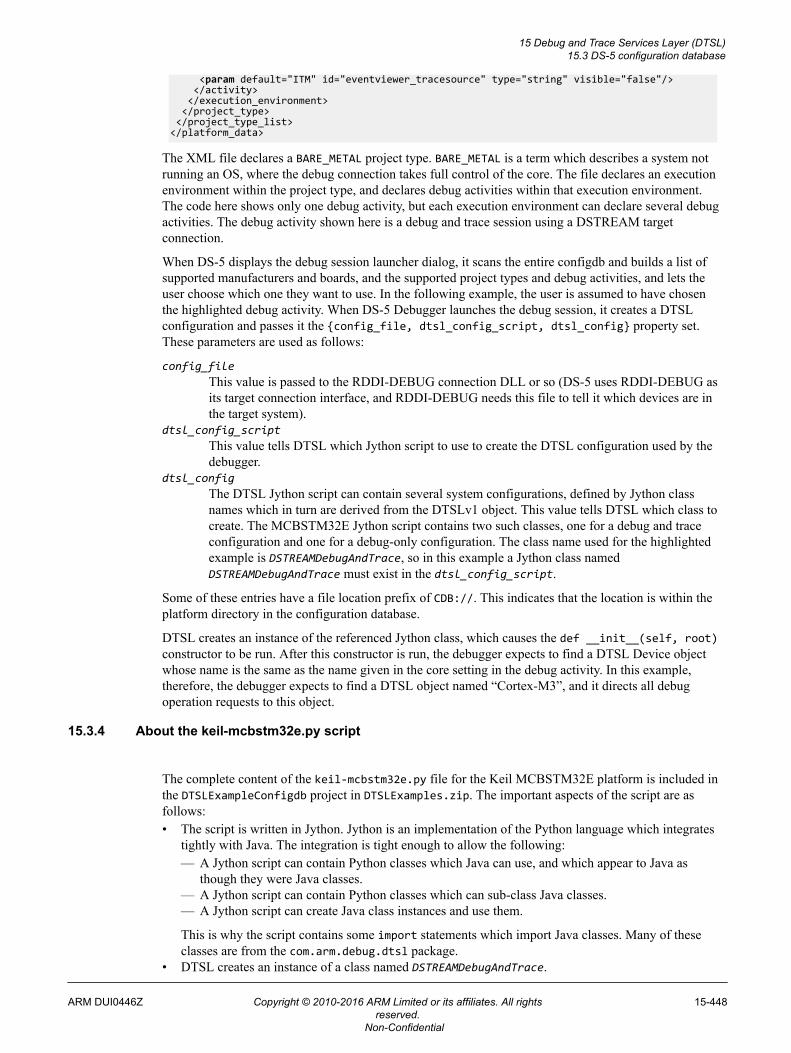
<param default="ITM" id="eventviewer_tracesource" type="string" visible="false"/> </activity> </execution_environment> </project_type> </project_type_list></platform_data>
The XML file declares a BARE_METAL project type. BARE_METAL is a term which describes a system notrunning an OS, where the debug connection takes full control of the core. The file declares an executionenvironment within the project type, and declares debug activities within that execution environment.The code here shows only one debug activity, but each execution environment can declare several debugactivities. The debug activity shown here is a debug and trace session using a DSTREAM targetconnection.
When DS-5 displays the debug session launcher dialog, it scans the entire configdb and builds a list ofsupported manufacturers and boards, and the supported project types and debug activities, and lets theuser choose which one they want to use. In the following example, the user is assumed to have chosenthe highlighted debug activity. When DS-5 Debugger launches the debug session, it creates a DTSLconfiguration and passes it the {config_file, dtsl_config_script, dtsl_config} property set.These parameters are used as follows:
config_fileThis value is passed to the RDDI-DEBUG connection DLL or so (DS-5 uses RDDI-DEBUG asits target connection interface, and RDDI-DEBUG needs this file to tell it which devices are inthe target system).
dtsl_config_scriptThis value tells DTSL which Jython script to use to create the DTSL configuration used by thedebugger.
dtsl_configThe DTSL Jython script can contain several system configurations, defined by Jython classnames which in turn are derived from the DTSLv1 object. This value tells DTSL which class tocreate. The MCBSTM32E Jython script contains two such classes, one for a debug and traceconfiguration and one for a debug-only configuration. The class name used for the highlightedexample is DSTREAMDebugAndTrace, so in this example a Jython class namedDSTREAMDebugAndTrace must exist in the dtsl_config_script.
Some of these entries have a file location prefix of CDB://. This indicates that the location is within theplatform directory in the configuration database.
DTSL creates an instance of the referenced Jython class, which causes the def __init__(self, root)constructor to be run. After this constructor is run, the debugger expects to find a DTSL Device objectwhose name is the same as the name given in the core setting in the debug activity. In this example,therefore, the debugger expects to find a DTSL object named “Cortex-M3”, and it directs all debugoperation requests to this object.
15.3.4 About the keil-mcbstm32e.py script
The complete content of the keil-mcbstm32e.py file for the Keil MCBSTM32E platform is included inthe DTSLExampleConfigdb project in DTSLExamples.zip. The important aspects of the script are asfollows:• The script is written in Jython. Jython is an implementation of the Python language which integrates
tightly with Java. The integration is tight enough to allow the following:— A Jython script can contain Python classes which Java can use, and which appear to Java as
though they were Java classes.— A Jython script can contain Python classes which can sub-class Java classes.— A Jython script can create Java class instances and use them.
This is why the script contains some import statements which import Java classes. Many of theseclasses are from the com.arm.debug.dtsl package.
• DTSL creates an instance of a class named DSTREAMDebugAndTrace.
15 Debug and Trace Services Layer (DTSL)15.3 DS-5 configuration database
ARM DUI0446Z Copyright © 2010-2016 ARM Limited or its affiliates. All rightsreserved.
15-448
Non-Confidential
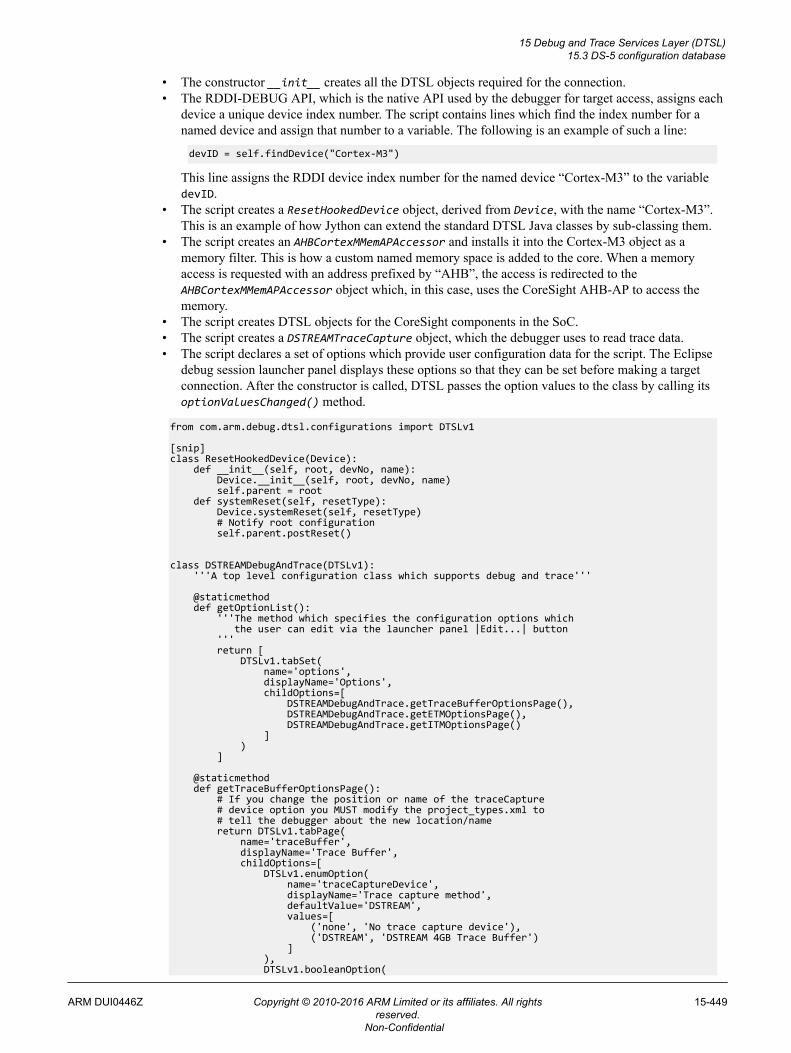
• The constructor __init__ creates all the DTSL objects required for the connection.• The RDDI-DEBUG API, which is the native API used by the debugger for target access, assigns each
device a unique device index number. The script contains lines which find the index number for anamed device and assign that number to a variable. The following is an example of such a line:
devID = self.findDevice("Cortex-M3")
This line assigns the RDDI device index number for the named device “Cortex-M3” to the variabledevID.
• The script creates a ResetHookedDevice object, derived from Device, with the name “Cortex-M3”.This is an example of how Jython can extend the standard DTSL Java classes by sub-classing them.
• The script creates an AHBCortexMMemAPAccessor and installs it into the Cortex-M3 object as amemory filter. This is how a custom named memory space is added to the core. When a memoryaccess is requested with an address prefixed by “AHB”, the access is redirected to theAHBCortexMMemAPAccessor object which, in this case, uses the CoreSight AHB-AP to access thememory.
• The script creates DTSL objects for the CoreSight components in the SoC.• The script creates a DSTREAMTraceCapture object, which the debugger uses to read trace data.• The script declares a set of options which provide user configuration data for the script. The Eclipse
debug session launcher panel displays these options so that they can be set before making a targetconnection. After the constructor is called, DTSL passes the option values to the class by calling itsoptionValuesChanged() method.
from com.arm.debug.dtsl.configurations import DTSLv1
[snip]class ResetHookedDevice(Device): def __init__(self, root, devNo, name): Device.__init__(self, root, devNo, name) self.parent = root def systemReset(self, resetType): Device.systemReset(self, resetType) # Notify root configuration self.parent.postReset()
class DSTREAMDebugAndTrace(DTSLv1): '''A top level configuration class which supports debug and trace'''
@staticmethod def getOptionList(): '''The method which specifies the configuration options which the user can edit via the launcher panel |Edit...| button ''' return [ DTSLv1.tabSet( name='options', displayName='Options', childOptions=[ DSTREAMDebugAndTrace.getTraceBufferOptionsPage(), DSTREAMDebugAndTrace.getETMOptionsPage(), DSTREAMDebugAndTrace.getITMOptionsPage() ] ) ] @staticmethod def getTraceBufferOptionsPage(): # If you change the position or name of the traceCapture # device option you MUST modify the project_types.xml to # tell the debugger about the new location/name return DTSLv1.tabPage( name='traceBuffer', displayName='Trace Buffer', childOptions=[ DTSLv1.enumOption( name='traceCaptureDevice', displayName='Trace capture method', defaultValue='DSTREAM', values=[ ('none', 'No trace capture device'), ('DSTREAM', 'DSTREAM 4GB Trace Buffer') ] ), DTSLv1.booleanOption(
15 Debug and Trace Services Layer (DTSL)15.3 DS-5 configuration database
ARM DUI0446Z Copyright © 2010-2016 ARM Limited or its affiliates. All rightsreserved.
15-449
Non-Confidential
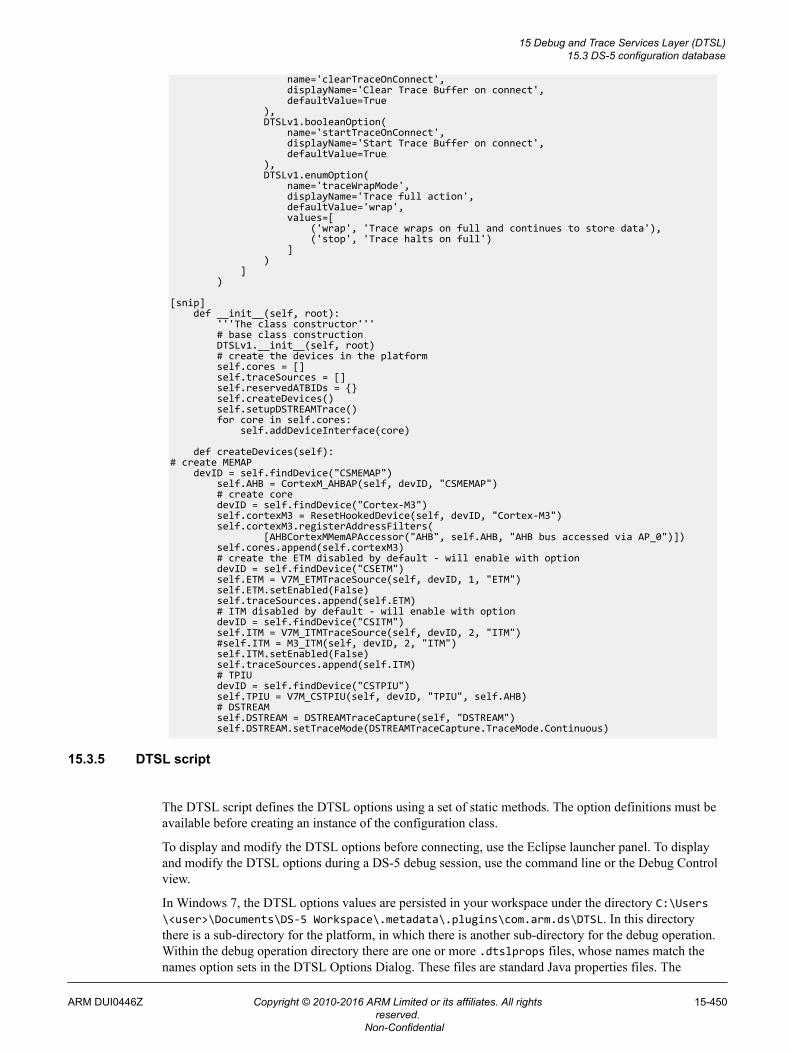
name='clearTraceOnConnect', displayName='Clear Trace Buffer on connect', defaultValue=True ), DTSLv1.booleanOption( name='startTraceOnConnect', displayName='Start Trace Buffer on connect', defaultValue=True ), DTSLv1.enumOption( name='traceWrapMode', displayName='Trace full action', defaultValue='wrap', values=[ ('wrap', 'Trace wraps on full and continues to store data'), ('stop', 'Trace halts on full') ] ) ] ) [snip] def __init__(self, root): '''The class constructor''' # base class construction DTSLv1.__init__(self, root) # create the devices in the platform self.cores = [] self.traceSources = [] self.reservedATBIDs = {} self.createDevices() self.setupDSTREAMTrace() for core in self.cores: self.addDeviceInterface(core)
def createDevices(self):# create MEMAP devID = self.findDevice("CSMEMAP") self.AHB = CortexM_AHBAP(self, devID, "CSMEMAP") # create core devID = self.findDevice("Cortex-M3") self.cortexM3 = ResetHookedDevice(self, devID, "Cortex-M3") self.cortexM3.registerAddressFilters( [AHBCortexMMemAPAccessor("AHB", self.AHB, "AHB bus accessed via AP_0")]) self.cores.append(self.cortexM3) # create the ETM disabled by default - will enable with option devID = self.findDevice("CSETM") self.ETM = V7M_ETMTraceSource(self, devID, 1, "ETM") self.ETM.setEnabled(False) self.traceSources.append(self.ETM) # ITM disabled by default - will enable with option devID = self.findDevice("CSITM") self.ITM = V7M_ITMTraceSource(self, devID, 2, "ITM") #self.ITM = M3_ITM(self, devID, 2, "ITM") self.ITM.setEnabled(False) self.traceSources.append(self.ITM) # TPIU devID = self.findDevice("CSTPIU") self.TPIU = V7M_CSTPIU(self, devID, "TPIU", self.AHB) # DSTREAM self.DSTREAM = DSTREAMTraceCapture(self, "DSTREAM") self.DSTREAM.setTraceMode(DSTREAMTraceCapture.TraceMode.Continuous)
15.3.5 DTSL script
The DTSL script defines the DTSL options using a set of static methods. The option definitions must beavailable before creating an instance of the configuration class.
To display and modify the DTSL options before connecting, use the Eclipse launcher panel. To displayand modify the DTSL options during a DS-5 debug session, use the command line or the Debug Controlview.
In Windows 7, the DTSL options values are persisted in your workspace under the directory C:\Users\<user>\Documents\DS-5 Workspace\.metadata\.plugins\com.arm.ds\DTSL. In this directorythere is a sub-directory for the platform, in which there is another sub-directory for the debug operation.Within the debug operation directory there are one or more .dtslprops files, whose names match thenames option sets in the DTSL Options Dialog. These files are standard Java properties files. The
15 Debug and Trace Services Layer (DTSL)15.3 DS-5 configuration database
ARM DUI0446Z Copyright © 2010-2016 ARM Limited or its affiliates. All rightsreserved.
15-450
Non-Confidential
following is the default properties file for the Keil MCBSTM32E Platform, Bare Metal Project, Debugand Trace Debug operation:
options.ETM.cortexM3coreTraceEnabled=trueoptions.ITM.itmTraceEnabled=trueoptions.ITM.itmTraceEnabled.itmowner=Targetoptions.ITM.itmTraceEnabled.itmowner.target.targetITMATBID=2options.ITM.itmTraceEnabled.itmowner.debugger.DWTENA=trueoptions.ITM.itmTraceEnabled.itmowner.debugger.PRIVMASK.[15\:8]=trueoptions.ITM.itmTraceEnabled.itmowner.debugger.PRIVMASK.[23\:16]=trueoptions.ITM.itmTraceEnabled.itmowner.debugger.PRIVMASK.[31\:24]=trueoptions.ITM.itmTraceEnabled.itmowner.debugger.PRIVMASK.[7\:0]=trueoptions.ITM.itmTraceEnabled.itmowner.debugger.STIMENA=0xFFFFFFFFoptions.ITM.itmTraceEnabled.itmowner.debugger.TSENA=trueoptions.ITM.itmTraceEnabled.itmowner.debugger.TSPrescale=noneoptions.traceBuffer.traceCaptureDevice.clearTraceOnConnect=trueoptions.traceBuffer.traceCaptureDevice.startTraceOnConnect=trueoptions.traceBuffer.traceCaptureDevice.traceWrapMode=wrapoptions.traceBuffer.traceCaptureDevice=DSTREAM
The names of the options exactly match the name hierarchy defined in the DTSL script (see the fullDTSL script source code to create the configuration options).
When DS-5 Debugger displays the options, it calls the getOptionList() method in the DTSLconfiguration class to retrieve a data description of the options. It matches these options with thepersisted values from the .dtslprops file and transforms this data into an interactive dialog type displayfor the user. When the user saves the options, the .dtslprops file is updated. After the DTSLconfiguration instance is created, DTSL calls the optionValuesChanged() method to inform theinstance of the configuration settings values. During the debug session, the user can change any optionwhich is marked with an isDynamic=True property.
Related references15.6 DTSL options on page 15-462.
15 Debug and Trace Services Layer (DTSL)15.3 DS-5 configuration database
ARM DUI0446Z Copyright © 2010-2016 ARM Limited or its affiliates. All rightsreserved.
15-451
Non-Confidential
15.4 DTSL as used by DS-5 Debugger
This section contains the following subsections:• 15.4.1 Eclipse debug session launcher dialog on page 15-452.• 15.4.2 Connecting to DTSL on page 15-452.• 15.4.3 DTSL access from Debugger Jython scripts on page 15-453.
15.4.1 Eclipse debug session launcher dialog
The Launcher dialog scans the entire DS-5 configdb, including extension directories, and builds a list ofsupported manufacturers and boards, along with the supported project types and debug activities, asdeclared in the project_types.xml files in each Board directory. This list is displayed to the user, whothen chooses the combination of manufacturer, board, project type and debug activity they want to use.When the user chooses a {Manufacturer, Board, Project Type, Debug Operation}, the launcherinspects the referenced {dtsl_config_script, dtsl_config}, that is, the script and the class, to see if anyDTSL options are specified. If so, the Launcher displays an Edit... button so that the user can change thevalues for the DTSL options.
15.4.2 Connecting to DTSL
To use DTSL, a client must create a DTSLConnection object using the DTSL ConnectionManager class(com.arm.debug.dtsl.ConnectionManager). ConnectionManager has static methods that allow theDTSLConnection object to be created from a set of connection parameters. After a ConnectionManagerobject is obtained, calling its connect() method creates the DTSLConfiguration object which containsall the target component objects.
When the DTSL ConnectionManager class creates a new DTSLConnection, it assigns a unique key to it.It constructs this key from the connection properties:
• dtsl_config_script: the absolute path to the DTSL Jython script• dtsl_config: the Jython DTSL class name• config_file: the absolute path to the RDDI configuration file• dtsl_config_options: optional DTSL options (a hash of the content of the DTSL options file)• rddi_retarget_address: optional re-target address for the RDDI configuration• possibly other input.
If the DTSL ConnectionManager detects an attempt to connect to an already existing DTSLConnection(that is, the connection key matches an existing DTSLConnection instance) then DTSL returns thealready existing instance. There can only be one DTSLConnection with any given key.
A DTSLConnection can also be created by obtaining an existing DTSL instance key and requesting aconnection to that instance. Both DS-5 Debugger and third-party Eclipse plugins can therefore connect toan existing DTSLConnection instance. If the DS-5 Debugger creates the DTSLConnection instance for aplatform, then a third-party plugin can connect to the same instance by one of two methods:• Use an identical set of connection properties.• Arrange to get the DTSLConnection instance key from the debugger, and use that key to make the
connection.
DTSL reference-counts connections to a platform instance and only closes the DTSLConnection instancewhen all clients have disconnected.
15 Debug and Trace Services Layer (DTSL)15.4 DTSL as used by DS-5 Debugger
ARM DUI0446Z Copyright © 2010-2016 ARM Limited or its affiliates. All rightsreserved.
15-452
Non-Confidential
15.4.3 DTSL access from Debugger Jython scripts
DTSL uses Jython scripting to create the DTSL configuration. The configuration typically stores objectsfor each debug component in the target system.
DS-5 Debugger also uses Jython scripting, but at a different level, to DTSL, in the debugger softwarestack. In debugger scripting, the debugger provides an object interface to the debugger features. Forexample, a debugger script can:• load .axf files• determine the current execution context• read registers• set breakpoints• control execution.
These operations cause operations on the objects in the DTSL configuration, but there is not always adirect mapping from debugger operations to DTSL object operations. This is especially true for SMPsystems.
Sometimes, however, it makes sense for a debugger script to access low level DTSL objects. Forexample, a user with in-depth CoreSight experience might want to manually program up a PTMsequencer, or directly drive CTI inputs. In such cases, the debugger script can get the DTSLconfiguration, locate the objects of interest and call their methods directly. Although this is a verypowerful feature, it must be used with care, because the debugger has no way of knowing that suchoperations have taken place. In many cases this does not matter, especially if the DTSL objects beingused are not directly used by the debugger. However, more care is required when directly accessing coreobjects used by the debugger.
The following is an example of how a debugger Jython script might get access to a DTSL object called“PTM”:
from arm_ds.debugger_v1 import Debuggerfrom com.arm.debug.dtsl import ConnectionManagerfrom com.arm.debug.dtsl.interfaces import IConfiguration
# Connect to DS-5 Debugger debugger = Debugger() assert isinstance(debugger, Debugger) if not debugger.isConnected(): return # Access the underlying DTSL configuration dtslConnectionConfigurationKey = debugger.getConnectionConfigurationKey() dtslConnection = ConnectionManager.openConnection(dtslConnectionConfigurationKey) dtslConfiguration = dtslConnection.getConfiguration() assert isinstance(dtslConfiguration, IConfiguration) deviceList = dtslConfiguration.getDevices() for device in deviceList: assert isinstance(device, IDevice) if device.getName() == "PTM": …
15 Debug and Trace Services Layer (DTSL)15.4 DTSL as used by DS-5 Debugger
ARM DUI0446Z Copyright © 2010-2016 ARM Limited or its affiliates. All rightsreserved.
15-453
Non-Confidential
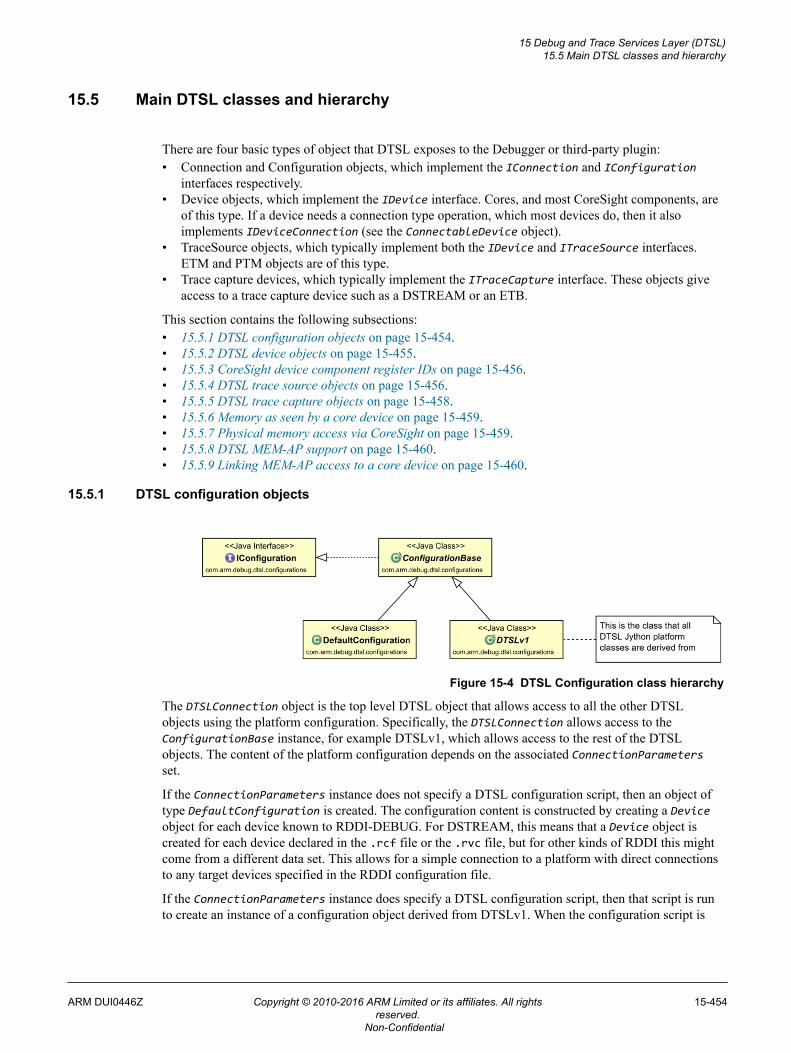
15.5 Main DTSL classes and hierarchy
There are four basic types of object that DTSL exposes to the Debugger or third-party plugin:• Connection and Configuration objects, which implement the IConnection and IConfiguration
interfaces respectively.• Device objects, which implement the IDevice interface. Cores, and most CoreSight components, are
of this type. If a device needs a connection type operation, which most devices do, then it alsoimplements IDeviceConnection (see the ConnectableDevice object).
• TraceSource objects, which typically implement both the IDevice and ITraceSource interfaces.ETM and PTM objects are of this type.
• Trace capture devices, which typically implement the ITraceCapture interface. These objects giveaccess to a trace capture device such as a DSTREAM or an ETB.
This section contains the following subsections:• 15.5.1 DTSL configuration objects on page 15-454.• 15.5.2 DTSL device objects on page 15-455.• 15.5.3 CoreSight device component register IDs on page 15-456.• 15.5.4 DTSL trace source objects on page 15-456.• 15.5.5 DTSL trace capture objects on page 15-458.• 15.5.6 Memory as seen by a core device on page 15-459.• 15.5.7 Physical memory access via CoreSight on page 15-459.• 15.5.8 DTSL MEM-AP support on page 15-460.• 15.5.9 Linking MEM-AP access to a core device on page 15-460.
15.5.1 DTSL configuration objects
Figure 15-4 DTSL Configuration class hierarchy
The DTSLConnection object is the top level DTSL object that allows access to all the other DTSLobjects using the platform configuration. Specifically, the DTSLConnection allows access to theConfigurationBase instance, for example DTSLv1, which allows access to the rest of the DTSLobjects. The content of the platform configuration depends on the associated ConnectionParametersset.
If the ConnectionParameters instance does not specify a DTSL configuration script, then an object oftype DefaultConfiguration is created. The configuration content is constructed by creating a Deviceobject for each device known to RDDI-DEBUG. For DSTREAM, this means that a Device object iscreated for each device declared in the .rcf file or the .rvc file, but for other kinds of RDDI this mightcome from a different data set. This allows for a simple connection to a platform with direct connectionsto any target devices specified in the RDDI configuration file.
If the ConnectionParameters instance does specify a DTSL configuration script, then that script is runto create an instance of a configuration object derived from DTSLv1. When the configuration script is
15 Debug and Trace Services Layer (DTSL)15.5 Main DTSL classes and hierarchy
ARM DUI0446Z Copyright © 2010-2016 ARM Limited or its affiliates. All rightsreserved.
15-454
Non-Confidential
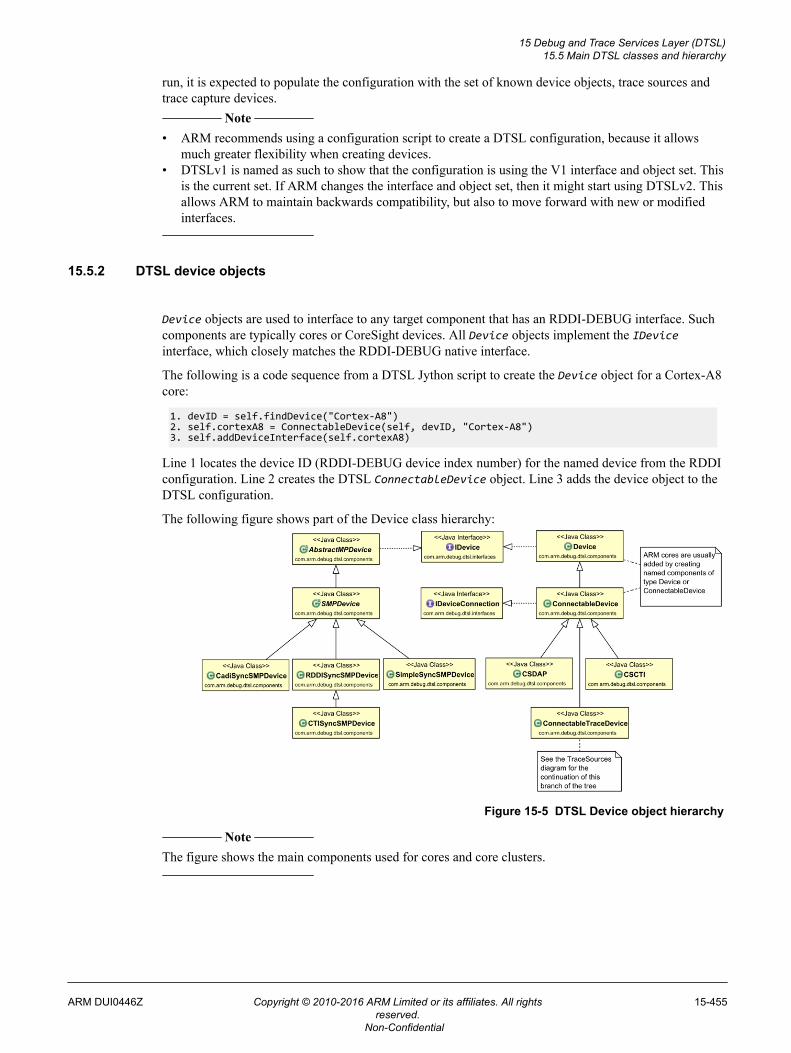
run, it is expected to populate the configuration with the set of known device objects, trace sources andtrace capture devices.
Note
• ARM recommends using a configuration script to create a DTSL configuration, because it allowsmuch greater flexibility when creating devices.
• DTSLv1 is named as such to show that the configuration is using the V1 interface and object set. Thisis the current set. If ARM changes the interface and object set, then it might start using DTSLv2. Thisallows ARM to maintain backwards compatibility, but also to move forward with new or modifiedinterfaces.
15.5.2 DTSL device objects
Device objects are used to interface to any target component that has an RDDI-DEBUG interface. Suchcomponents are typically cores or CoreSight devices. All Device objects implement the IDeviceinterface, which closely matches the RDDI-DEBUG native interface.
The following is a code sequence from a DTSL Jython script to create the Device object for a Cortex-A8core:
1. devID = self.findDevice("Cortex-A8")2. self.cortexA8 = ConnectableDevice(self, devID, "Cortex-A8")3. self.addDeviceInterface(self.cortexA8)
Line 1 locates the device ID (RDDI-DEBUG device index number) for the named device from the RDDIconfiguration. Line 2 creates the DTSL ConnectableDevice object. Line 3 adds the device object to theDTSL configuration.
The following figure shows part of the Device class hierarchy:
Figure 15-5 DTSL Device object hierarchy
Note
The figure shows the main components used for cores and core clusters.
15 Debug and Trace Services Layer (DTSL)15.5 Main DTSL classes and hierarchy
ARM DUI0446Z Copyright © 2010-2016 ARM Limited or its affiliates. All rightsreserved.
15-455
Non-Confidential
15.5.3 CoreSight device component register IDs
The documentation for a CoreSight component lists its component registers and their address offsets. Forexample, the CoreSight STM component has a Trace Control and Status Register called STMTCSR whichhas an offset of 0xE80. To access this register through the IDevice interface, you need to know itsregister ID. To determine the ID, divide the documented offset by four. For example, the register ID forthe STMTCSR register is 0x3A0, which is 0xE80/4.
15.5.4 DTSL trace source objects
These objects represent sources of trace data within the platform. These could be ARM devices such as:• ETM• PTM• ITM• STM• MTB (previously known as BBB)• custom trace components that output data onto the CoreSight ATB.
These devices must implement the ITraceSource interface to be recognized as a trace source and toprovide ATB ID information. They typically also implement IDevice. Most of these types of device onlyimplement the register access methods from IDevice to allow configuration and control of the device,and they usually have a partner class which defines the names of the registers supported. For example,the STMTraceSource class has a partner class called STMRegisters which, for convenience, defines theSTM register set IDs and many of their bit fields.
The class hierarchy for trace source objects is shown in the following figure:
15 Debug and Trace Services Layer (DTSL)15.5 Main DTSL classes and hierarchy
ARM DUI0446Z Copyright © 2010-2016 ARM Limited or its affiliates. All rightsreserved.
15-456
Non-Confidential
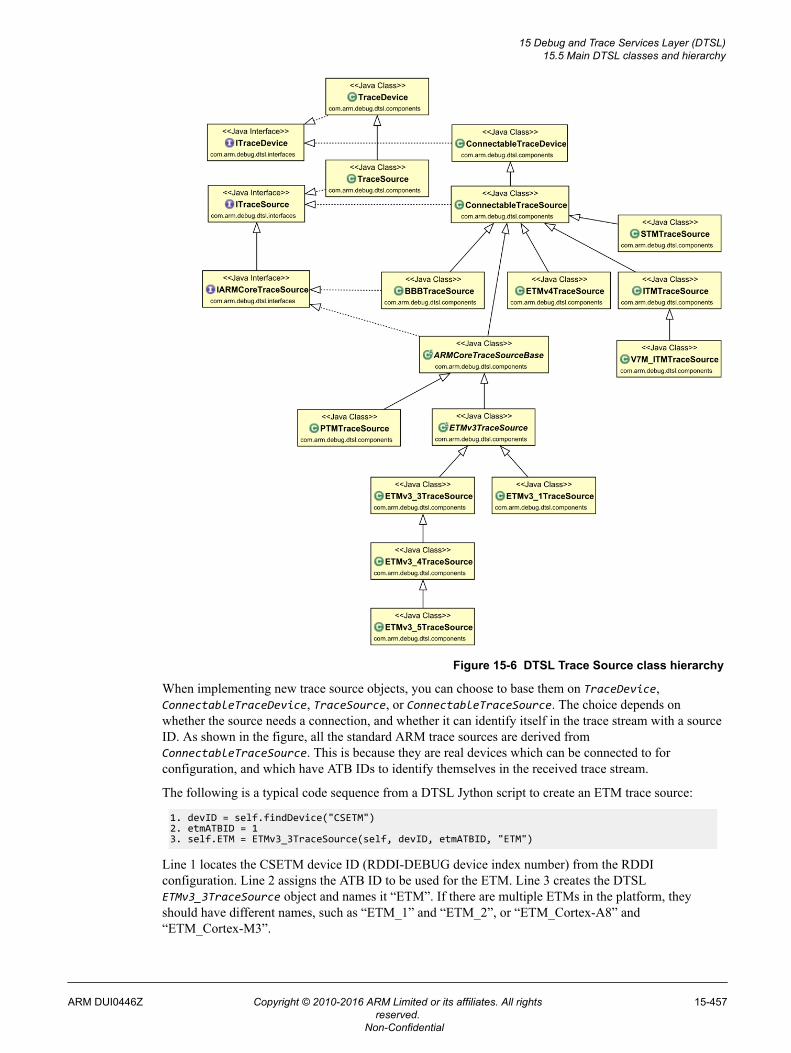
Figure 15-6 DTSL Trace Source class hierarchy
When implementing new trace source objects, you can choose to base them on TraceDevice,ConnectableTraceDevice, TraceSource, or ConnectableTraceSource. The choice depends onwhether the source needs a connection, and whether it can identify itself in the trace stream with a sourceID. As shown in the figure, all the standard ARM trace sources are derived fromConnectableTraceSource. This is because they are real devices which can be connected to forconfiguration, and which have ATB IDs to identify themselves in the received trace stream.
The following is a typical code sequence from a DTSL Jython script to create an ETM trace source:
1. devID = self.findDevice("CSETM")2. etmATBID = 13. self.ETM = ETMv3_3TraceSource(self, devID, etmATBID, "ETM")
Line 1 locates the CSETM device ID (RDDI-DEBUG device index number) from the RDDIconfiguration. Line 2 assigns the ATB ID to be used for the ETM. Line 3 creates the DTSLETMv3_3TraceSource object and names it “ETM”. If there are multiple ETMs in the platform, theyshould have different names, such as “ETM_1” and “ETM_2”, or “ETM_Cortex-A8” and“ETM_Cortex-M3”.
15 Debug and Trace Services Layer (DTSL)15.5 Main DTSL classes and hierarchy
ARM DUI0446Z Copyright © 2010-2016 ARM Limited or its affiliates. All rightsreserved.
15-457
Non-Confidential
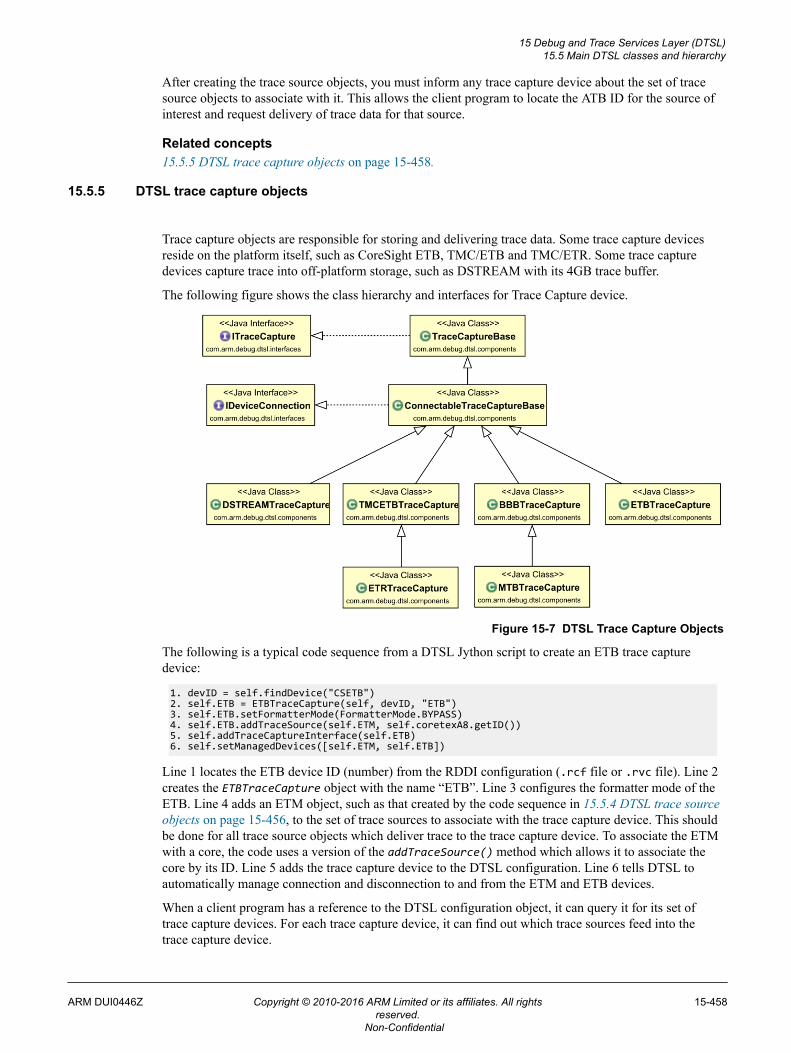
After creating the trace source objects, you must inform any trace capture device about the set of tracesource objects to associate with it. This allows the client program to locate the ATB ID for the source ofinterest and request delivery of trace data for that source.
Related concepts15.5.5 DTSL trace capture objects on page 15-458.
15.5.5 DTSL trace capture objects
Trace capture objects are responsible for storing and delivering trace data. Some trace capture devicesreside on the platform itself, such as CoreSight ETB, TMC/ETB and TMC/ETR. Some trace capturedevices capture trace into off-platform storage, such as DSTREAM with its 4GB trace buffer.
The following figure shows the class hierarchy and interfaces for Trace Capture device.
Figure 15-7 DTSL Trace Capture Objects
The following is a typical code sequence from a DTSL Jython script to create an ETB trace capturedevice:
1. devID = self.findDevice("CSETB")2. self.ETB = ETBTraceCapture(self, devID, "ETB")3. self.ETB.setFormatterMode(FormatterMode.BYPASS)4. self.ETB.addTraceSource(self.ETM, self.coretexA8.getID())5. self.addTraceCaptureInterface(self.ETB)6. self.setManagedDevices([self.ETM, self.ETB])
Line 1 locates the ETB device ID (number) from the RDDI configuration (.rcf file or .rvc file). Line 2creates the ETBTraceCapture object with the name “ETB”. Line 3 configures the formatter mode of theETB. Line 4 adds an ETM object, such as that created by the code sequence in 15.5.4 DTSL trace sourceobjects on page 15-456, to the set of trace sources to associate with the trace capture device. This shouldbe done for all trace source objects which deliver trace to the trace capture device. To associate the ETMwith a core, the code uses a version of the addTraceSource() method which allows it to associate thecore by its ID. Line 5 adds the trace capture device to the DTSL configuration. Line 6 tells DTSL toautomatically manage connection and disconnection to and from the ETM and ETB devices.
When a client program has a reference to the DTSL configuration object, it can query it for its set oftrace capture devices. For each trace capture device, it can find out which trace sources feed into thetrace capture device.
15 Debug and Trace Services Layer (DTSL)15.5 Main DTSL classes and hierarchy
ARM DUI0446Z Copyright © 2010-2016 ARM Limited or its affiliates. All rightsreserved.
15-458
Non-Confidential
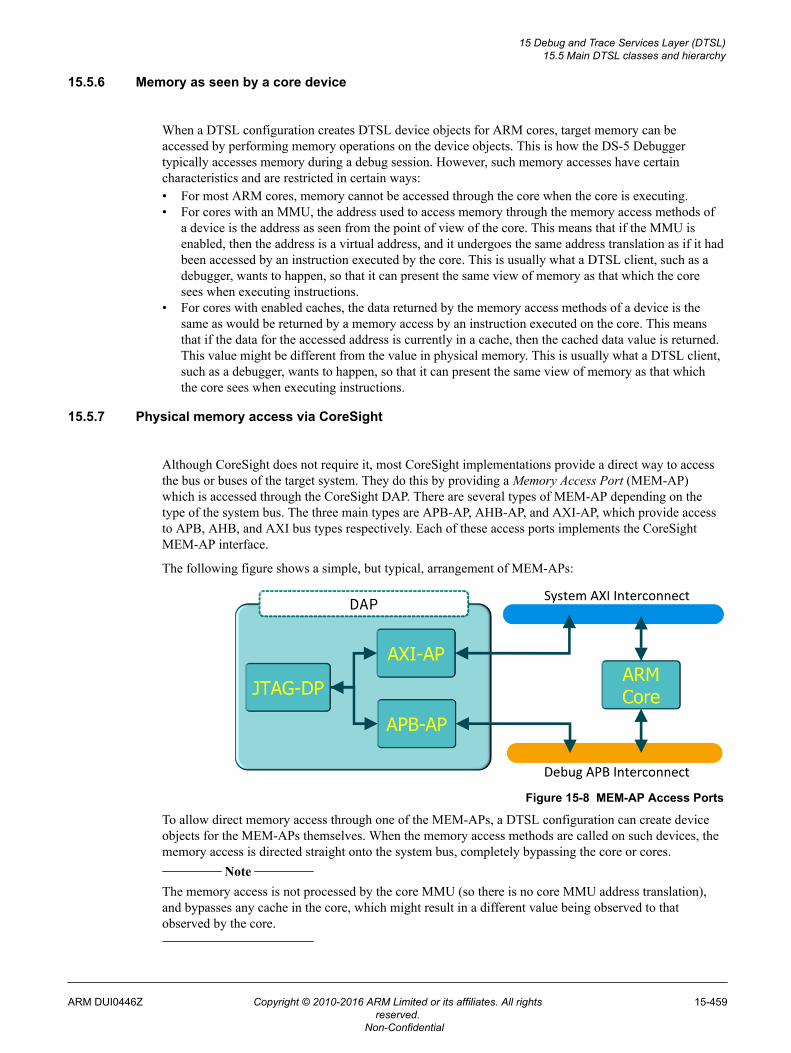
15.5.6 Memory as seen by a core device
When a DTSL configuration creates DTSL device objects for ARM cores, target memory can beaccessed by performing memory operations on the device objects. This is how the DS-5 Debuggertypically accesses memory during a debug session. However, such memory accesses have certaincharacteristics and are restricted in certain ways:• For most ARM cores, memory cannot be accessed through the core when the core is executing.• For cores with an MMU, the address used to access memory through the memory access methods of
a device is the address as seen from the point of view of the core. This means that if the MMU isenabled, then the address is a virtual address, and it undergoes the same address translation as if it hadbeen accessed by an instruction executed by the core. This is usually what a DTSL client, such as adebugger, wants to happen, so that it can present the same view of memory as that which the coresees when executing instructions.
• For cores with enabled caches, the data returned by the memory access methods of a device is thesame as would be returned by a memory access by an instruction executed on the core. This meansthat if the data for the accessed address is currently in a cache, then the cached data value is returned.This value might be different from the value in physical memory. This is usually what a DTSL client,such as a debugger, wants to happen, so that it can present the same view of memory as that whichthe core sees when executing instructions.
15.5.7 Physical memory access via CoreSight
Although CoreSight does not require it, most CoreSight implementations provide a direct way to accessthe bus or buses of the target system. They do this by providing a Memory Access Port (MEM-AP)which is accessed through the CoreSight DAP. There are several types of MEM-AP depending on thetype of the system bus. The three main types are APB-AP, AHB-AP, and AXI-AP, which provide accessto APB, AHB, and AXI bus types respectively. Each of these access ports implements the CoreSightMEM-AP interface.
The following figure shows a simple, but typical, arrangement of MEM-APs:
Figure 15-8 MEM-AP Access Ports
To allow direct memory access through one of the MEM-APs, a DTSL configuration can create deviceobjects for the MEM-APs themselves. When the memory access methods are called on such devices, thememory access is directed straight onto the system bus, completely bypassing the core or cores.
Note
The memory access is not processed by the core MMU (so there is no core MMU address translation),and bypasses any cache in the core, which might result in a different value being observed to thatobserved by the core.
15 Debug and Trace Services Layer (DTSL)15.5 Main DTSL classes and hierarchy
ARM DUI0446Z Copyright © 2010-2016 ARM Limited or its affiliates. All rightsreserved.
15-459
Non-Confidential
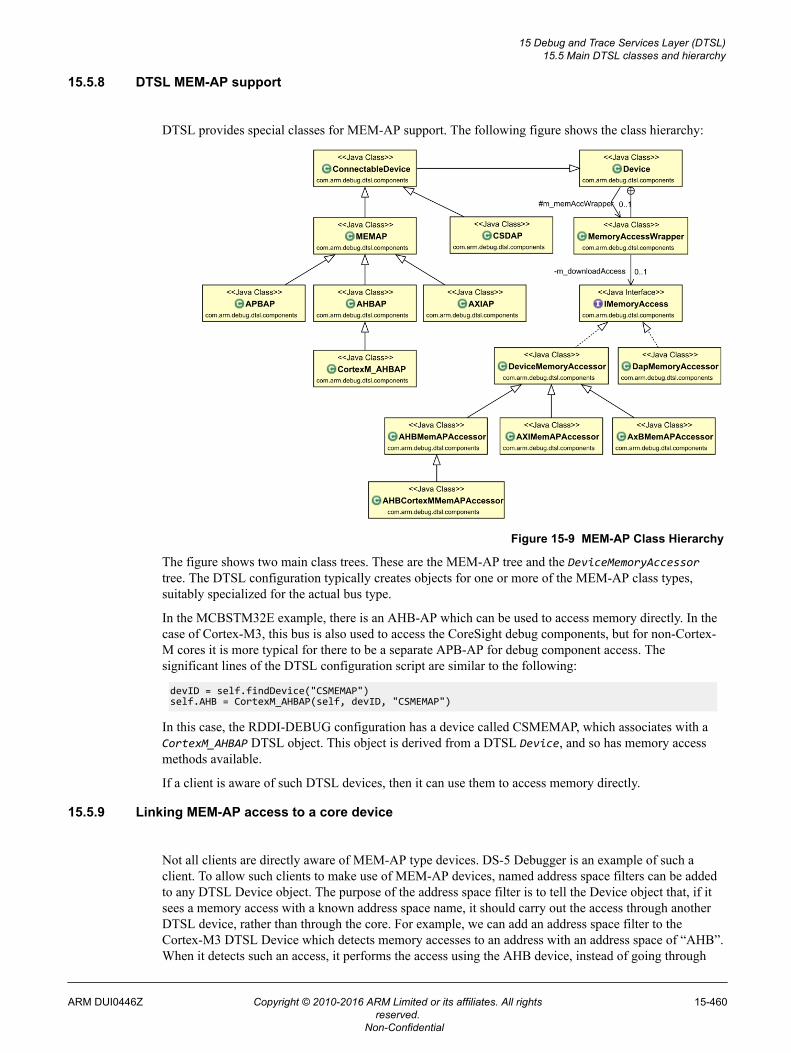
15.5.8 DTSL MEM-AP support
DTSL provides special classes for MEM-AP support. The following figure shows the class hierarchy:
Figure 15-9 MEM-AP Class Hierarchy
The figure shows two main class trees. These are the MEM-AP tree and the DeviceMemoryAccessortree. The DTSL configuration typically creates objects for one or more of the MEM-AP class types,suitably specialized for the actual bus type.
In the MCBSTM32E example, there is an AHB-AP which can be used to access memory directly. In thecase of Cortex-M3, this bus is also used to access the CoreSight debug components, but for non-Cortex-M cores it is more typical for there to be a separate APB-AP for debug component access. Thesignificant lines of the DTSL configuration script are similar to the following:
devID = self.findDevice("CSMEMAP")self.AHB = CortexM_AHBAP(self, devID, "CSMEMAP")
In this case, the RDDI-DEBUG configuration has a device called CSMEMAP, which associates with aCortexM_AHBAP DTSL object. This object is derived from a DTSL Device, and so has memory accessmethods available.
If a client is aware of such DTSL devices, then it can use them to access memory directly.
15.5.9 Linking MEM-AP access to a core device
Not all clients are directly aware of MEM-AP type devices. DS-5 Debugger is an example of such aclient. To allow such clients to make use of MEM-AP devices, named address space filters can be addedto any DTSL Device object. The purpose of the address space filter is to tell the Device object that, if itsees a memory access with a known address space name, it should carry out the access through anotherDTSL device, rather than through the core. For example, we can add an address space filter to theCortex-M3 DTSL Device which detects memory accesses to an address with an address space of “AHB”.When it detects such an access, it performs the access using the AHB device, instead of going through
15 Debug and Trace Services Layer (DTSL)15.5 Main DTSL classes and hierarchy
ARM DUI0446Z Copyright © 2010-2016 ARM Limited or its affiliates. All rightsreserved.
15-460
Non-Confidential
the Cortex-M3. For DS-5 Debugger, this means that the user can prefix an address with AHB: (forexample, AHB:0x20000000), and the access is performed using the AHB-AP.
The following code shows how the address space filter is added to the Cortex-M3 object:
devID = self.findDevice("CSMEMAP")self.AHB = CortexM_AHBAP(self, devID, "CSMEMAP")devID = self.findDevice("Cortex-M3")self.cortexM3 = ResetHookedDevice(self, devID, "Cortex-M3")self.cortexM3.registerAddressFilters( [AHBCortexMMemAPAccessor("AHB", self.AHB, "AHB bus accessed via AP_0")])
Any number of address filters can be added, but each filter name (DS-5 Debugger address prefix) mustbe unique.
To determine the supported address spaces for an object which implements IDevice, call thegetAddressSpaces() method. When a client matches against an address space, it can map the addressspace to a rule parameter which is passed into the IDevice memory access methods. The ruleparameter is then used to direct the memory access to the appropriate device.
15 Debug and Trace Services Layer (DTSL)15.5 Main DTSL classes and hierarchy
ARM DUI0446Z Copyright © 2010-2016 ARM Limited or its affiliates. All rightsreserved.
15-461
Non-Confidential
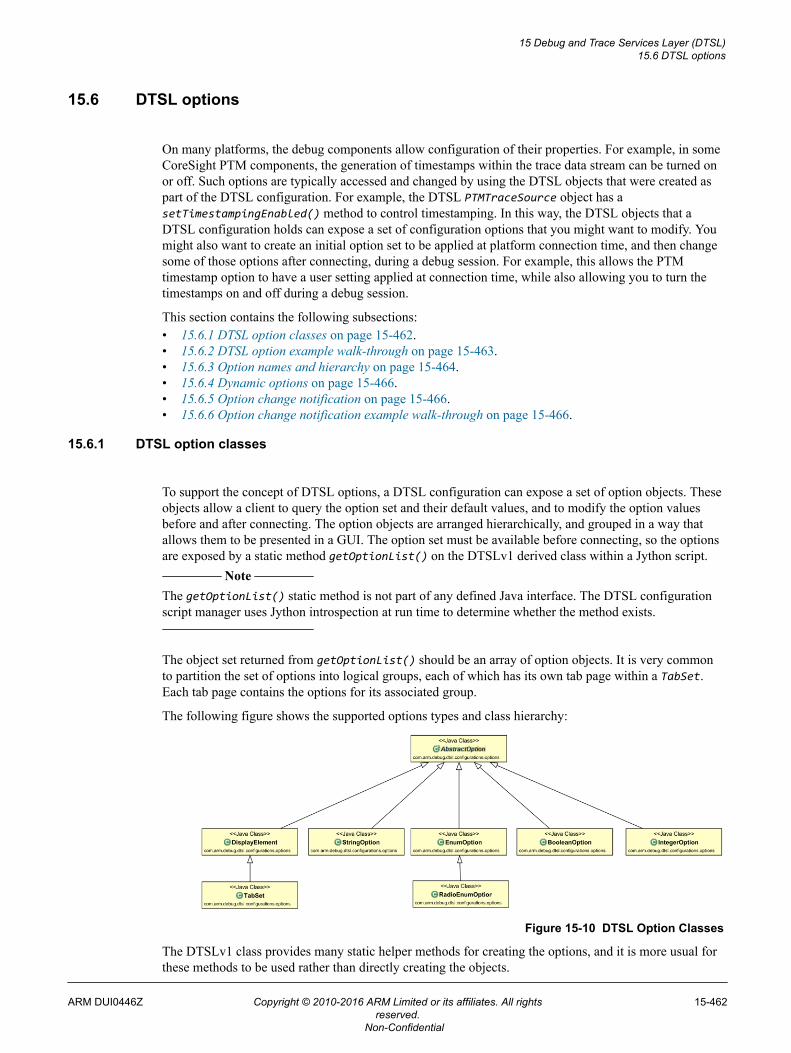
15.6 DTSL options
On many platforms, the debug components allow configuration of their properties. For example, in someCoreSight PTM components, the generation of timestamps within the trace data stream can be turned onor off. Such options are typically accessed and changed by using the DTSL objects that were created aspart of the DTSL configuration. For example, the DTSL PTMTraceSource object has asetTimestampingEnabled() method to control timestamping. In this way, the DTSL objects that aDTSL configuration holds can expose a set of configuration options that you might want to modify. Youmight also want to create an initial option set to be applied at platform connection time, and then changesome of those options after connecting, during a debug session. For example, this allows the PTMtimestamp option to have a user setting applied at connection time, while also allowing you to turn thetimestamps on and off during a debug session.
This section contains the following subsections:• 15.6.1 DTSL option classes on page 15-462.• 15.6.2 DTSL option example walk-through on page 15-463.• 15.6.3 Option names and hierarchy on page 15-464.• 15.6.4 Dynamic options on page 15-466.• 15.6.5 Option change notification on page 15-466.• 15.6.6 Option change notification example walk-through on page 15-466.
15.6.1 DTSL option classes
To support the concept of DTSL options, a DTSL configuration can expose a set of option objects. Theseobjects allow a client to query the option set and their default values, and to modify the option valuesbefore and after connecting. The option objects are arranged hierarchically, and grouped in a way thatallows them to be presented in a GUI. The option set must be available before connecting, so the optionsare exposed by a static method getOptionList() on the DTSLv1 derived class within a Jython script.
Note
The getOptionList() static method is not part of any defined Java interface. The DTSL configurationscript manager uses Jython introspection at run time to determine whether the method exists.
The object set returned from getOptionList() should be an array of option objects. It is very commonto partition the set of options into logical groups, each of which has its own tab page within a TabSet.Each tab page contains the options for its associated group.
The following figure shows the supported options types and class hierarchy:
Figure 15-10 DTSL Option Classes
The DTSLv1 class provides many static helper methods for creating the options, and it is more usual forthese methods to be used rather than directly creating the objects.
15 Debug and Trace Services Layer (DTSL)15.6 DTSL options
ARM DUI0446Z Copyright © 2010-2016 ARM Limited or its affiliates. All rightsreserved.
15-462
Non-Confidential
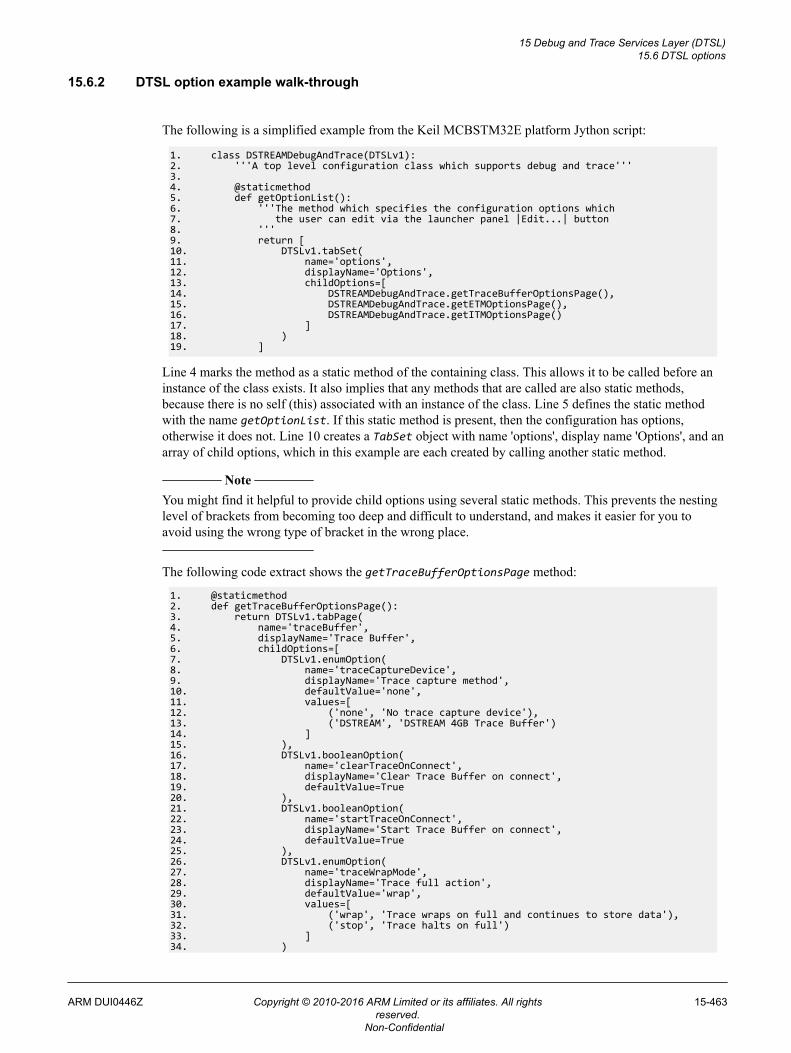
15.6.2 DTSL option example walk-through
The following is a simplified example from the Keil MCBSTM32E platform Jython script:
1. class DSTREAMDebugAndTrace(DTSLv1):2. '''A top level configuration class which supports debug and trace'''3.4. @staticmethod5. def getOptionList():6. '''The method which specifies the configuration options which7. the user can edit via the launcher panel |Edit...| button8. '''9. return [10. DTSLv1.tabSet(11. name='options',12. displayName='Options',13. childOptions=[14. DSTREAMDebugAndTrace.getTraceBufferOptionsPage(),15. DSTREAMDebugAndTrace.getETMOptionsPage(),16. DSTREAMDebugAndTrace.getITMOptionsPage()17. ]18. )19. ]
Line 4 marks the method as a static method of the containing class. This allows it to be called before aninstance of the class exists. It also implies that any methods that are called are also static methods,because there is no self (this) associated with an instance of the class. Line 5 defines the static methodwith the name getOptionList. If this static method is present, then the configuration has options,otherwise it does not. Line 10 creates a TabSet object with name 'options', display name 'Options', and anarray of child options, which in this example are each created by calling another static method.
Note
You might find it helpful to provide child options using several static methods. This prevents the nestinglevel of brackets from becoming too deep and difficult to understand, and makes it easier for you toavoid using the wrong type of bracket in the wrong place.
The following code extract shows the getTraceBufferOptionsPage method:
1. @staticmethod2. def getTraceBufferOptionsPage():3. return DTSLv1.tabPage(4. name='traceBuffer',5. displayName='Trace Buffer',6. childOptions=[7. DTSLv1.enumOption(8. name='traceCaptureDevice',9. displayName='Trace capture method',10. defaultValue='none',11. values=[12. ('none', 'No trace capture device'),13. ('DSTREAM', 'DSTREAM 4GB Trace Buffer')14. ]15. ),16. DTSLv1.booleanOption(17. name='clearTraceOnConnect',18. displayName='Clear Trace Buffer on connect',19. defaultValue=True20. ),21. DTSLv1.booleanOption(22. name='startTraceOnConnect',23. displayName='Start Trace Buffer on connect',24. defaultValue=True25. ),26. DTSLv1.enumOption(27. name='traceWrapMode',28. displayName='Trace full action',29. defaultValue='wrap',30. values=[31. ('wrap', 'Trace wraps on full and continues to store data'),32. ('stop', 'Trace halts on full')33. ]34. )
15 Debug and Trace Services Layer (DTSL)15.6 DTSL options
ARM DUI0446Z Copyright © 2010-2016 ARM Limited or its affiliates. All rightsreserved.
15-463
Non-Confidential
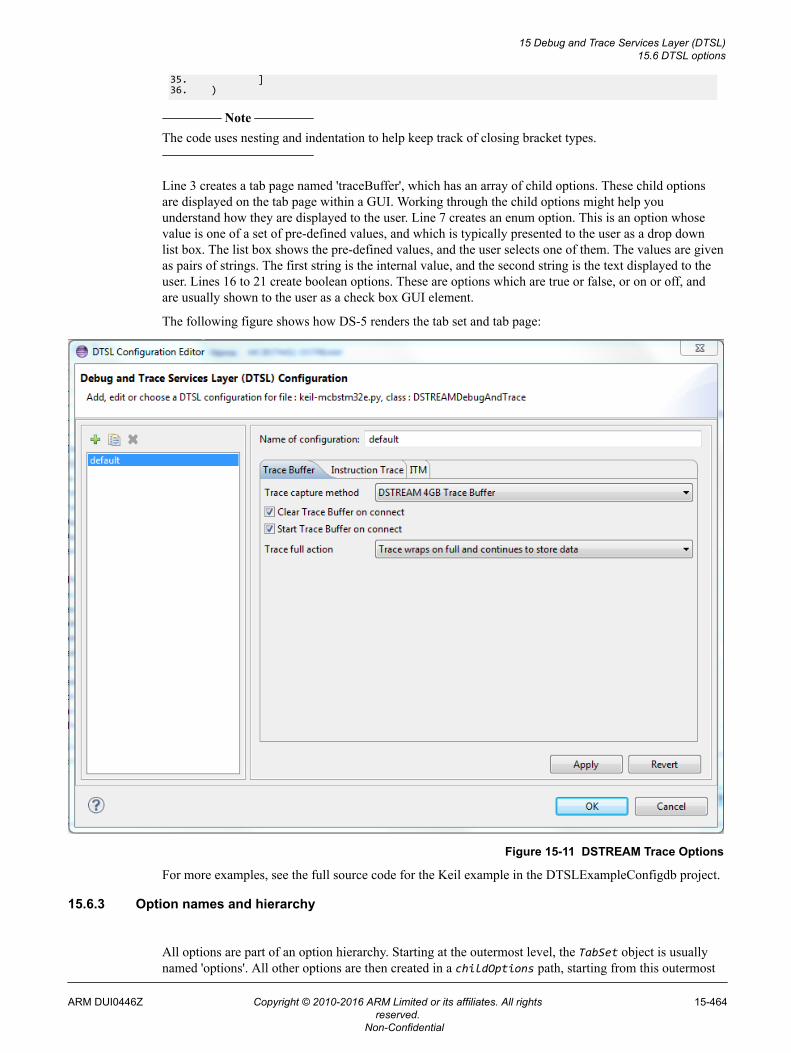
35. ]36. )
Note
The code uses nesting and indentation to help keep track of closing bracket types.
Line 3 creates a tab page named 'traceBuffer', which has an array of child options. These child optionsare displayed on the tab page within a GUI. Working through the child options might help youunderstand how they are displayed to the user. Line 7 creates an enum option. This is an option whosevalue is one of a set of pre-defined values, and which is typically presented to the user as a drop downlist box. The list box shows the pre-defined values, and the user selects one of them. The values are givenas pairs of strings. The first string is the internal value, and the second string is the text displayed to theuser. Lines 16 to 21 create boolean options. These are options which are true or false, or on or off, andare usually shown to the user as a check box GUI element.
The following figure shows how DS-5 renders the tab set and tab page:
Figure 15-11 DSTREAM Trace Options
For more examples, see the full source code for the Keil example in the DTSLExampleConfigdb project.
15.6.3 Option names and hierarchy
All options are part of an option hierarchy. Starting at the outermost level, the TabSet object is usuallynamed 'options'. All other options are then created in a childOptions path, starting from this outermost
15 Debug and Trace Services Layer (DTSL)15.6 DTSL options
ARM DUI0446Z Copyright © 2010-2016 ARM Limited or its affiliates. All rightsreserved.
15-464
Non-Confidential
level. The 'name path' for an option consists of all the internal names (not the display names) in thehierarchy between the outermost level and the option in question, joined by the '.' character. Forexample, in the previous code samples, the option which indicates the currently selected trace capturedevice has the name path 'options.traceBuffer.traceCaptureDevice'. The components of this namepath, joined by '.', are as follows:
optionsThe internal name of the outermost TabSet.
traceBufferThe internal name of the child option for the trace buffer tab page object.
traceCaptureDeviceThe internal name of the EnumOption for the currently selected trace capture device.
The full path name is important for at least three reasons:• It can be used from the DS-5 Debugger command line, to read or modify the option value, using the
commands show dtsl-options or set dtsl-options.• It can be used in the project_types.xml file to direct the DS-5 Debugger to relevant options, such
as which trace capture device to use (if any).• It can be used in the getOptionValue and setOptionValue methods of the configuration, to read or
modify an option's value.
Note
The full path option name is case sensitive.
Here is an example output from the show dtsl-options command to see the list of available DTSLoptions and their current values.
Command: show dtsl-optionsdtsl-options options.ETM.cortexM3coreTraceEnabled: value is "true"dtsl-options options.ITM.itmTraceEnabled: value is "true"dtsl-options options.ITM.itmTraceEnabled.itmowner: value is "Target" (read only)dtsl-options options.ITM.itmTraceEnabled.itmowner.debugger.DWTENA: value is "true"dtsl-options options.ITM.itmTraceEnabled.itmowner.debugger.PRIVMASK.[15:8]: value is "true"dtsl-options options.ITM.itmTraceEnabled.itmowner.debugger.PRIVMASK.[23:16]: value is "true"dtsl-options options.ITM.itmTraceEnabled.itmowner.debugger.PRIVMASK.[31:24]: value is "true"dtsl-options options.ITM.itmTraceEnabled.itmowner.debugger.PRIVMASK.[7:0]: value is "true"dtsl-options options.ITM.itmTraceEnabled.itmowner.debugger.STIMENA: value is "0xFFFFFFFF"dtsl-options options.ITM.itmTraceEnabled.itmowner.debugger.TSENA: value is "true"dtsl-options options.ITM.itmTraceEnabled.itmowner.debugger.TSPrescale: value is "none"dtsl-options options.ITM.itmTraceEnabled.itmowner.target.targetITMATBID:value is "2" (read only)dtsl-options options.traceBuffer.clearTraceOnConnect: value is "true" (read only)dtsl-options options.traceBuffer.startTraceOnConnect: value is "true" (read only)dtsl-options options.traceBuffer.traceCaptureDevice: value is "DSTREAM" (read only)dtsl-options options.traceBuffer.traceWrapMode: value is "wrap" (read only)dtsl-options options.ucProbe.ucProbeEnabled: value is "false"dtsl-options options.ucProbe.ucProbeEnabled.PORT: value is "9930" (read only)
Here is an example of the set dtsl-options command to change the current value of any non read-only option:
Command: set dtsl-options options.ITM.itmTraceEnabled falseDTSL Configuration Option "options.ITM.itmTraceEnabled" set to false
15 Debug and Trace Services Layer (DTSL)15.6 DTSL options
ARM DUI0446Z Copyright © 2010-2016 ARM Limited or its affiliates. All rightsreserved.
15-465
Non-Confidential
15.6.4 Dynamic options
Some option values can be modified dynamically, after connecting to the platform. For a DS-5 Debugsession, this means the option can be changed during the debug session, using either the DS-5 Debuggercommand line or the DTSL Options... menu selection with the Debug Control View.
Not all options can be modified after connecting. For example, the trace capture device cannot typicallychange during the debug session, although the option to enable ITM trace can change. Even if an optioncan be changed, it might not apply the change immediately. For example, most trace-related dynamicoptions apply changes only when tracing is started or restarted.
To mark an option as dynamic, add the 'isDynamic=True' parameter to the option constructor. Forexample, the ITM option to generate timestamps could be created as follows:
DTSLv1.booleanOption( name='TSENA', displayName = 'Enable differential timestamps', defaultValue=True, isDynamic=True)
When DS-5 Debugger displays the options during a debug session, it only allows the dynamic options tobe changed. All the options are shown to the user, but the non-dynamic ones are grayed out and cannotbe changed.
15.6.5 Option change notification
Shortly after the DTSL configuration instance (the object derived from DTSLv1) is created, the optionvalues are given to the instance by calling its optionValuesChanged method. This method inspects thecurrent option values and configures the platform components accordingly.
Note
The optionValuesChanged method is called after the constructor is called, but before the DTSLcomponents are connected to the target platform. This means that the DTSL objects can be configuredwith their settings, but cannot send the settings to the target components.
If the options are changed during a debug session, then the optionValuesChanged method is calledagain, to inform the DTSL components that the options have changed.
Note
Currently, the call to the optionValuesChanged method does not indicate which options have changed.A future version of DTSL will address this.
15.6.6 Option change notification example walk-through
These Jython code snippets are from the Keil MCBSTM32E platform Jython script and theDSTREAMDebugAndTrace class:
1. def optionValuesChanged(self):2. '''Callback to update the configuration state after options are changed.3. This will be called:4. * after construction but before device connection5. * during a debug session should the user change the DTSL options6. '''7. obase = "options"8. if self.isConnected():9. self.updateDynamicOptions(obase)10. else:11. self.setInitialOptions(obase)
15 Debug and Trace Services Layer (DTSL)15.6 DTSL options
ARM DUI0446Z Copyright © 2010-2016 ARM Limited or its affiliates. All rightsreserved.
15-466
Non-Confidential
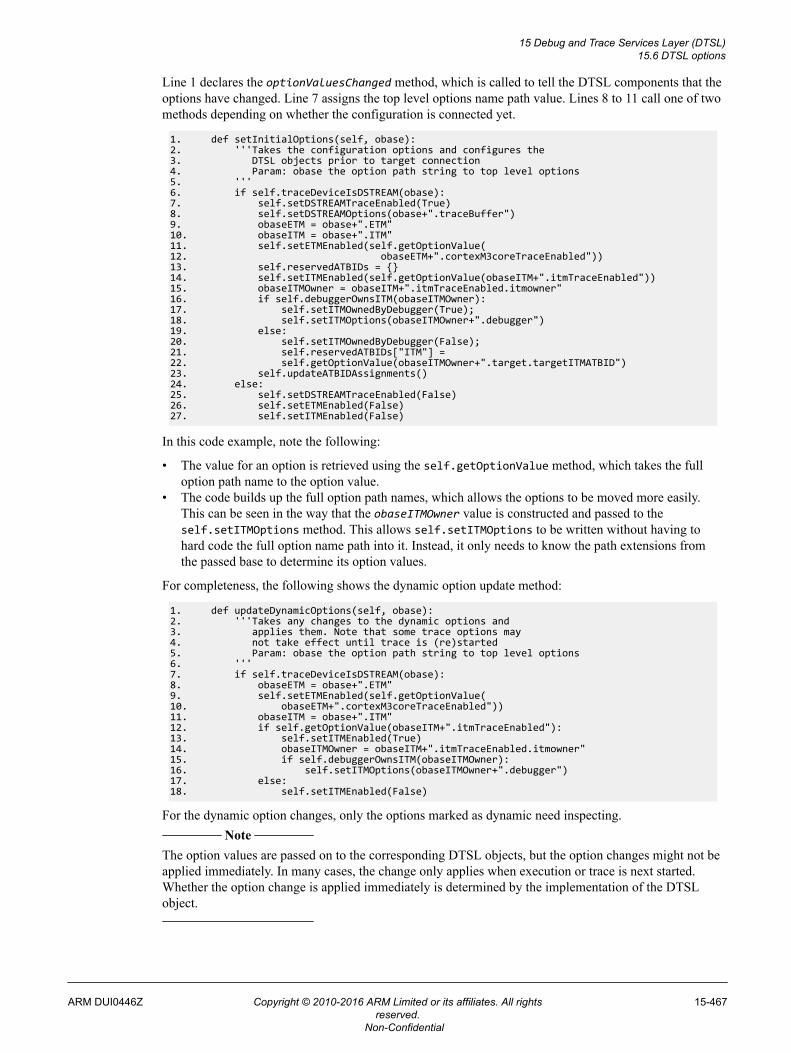
Line 1 declares the optionValuesChanged method, which is called to tell the DTSL components that theoptions have changed. Line 7 assigns the top level options name path value. Lines 8 to 11 call one of twomethods depending on whether the configuration is connected yet.
1. def setInitialOptions(self, obase):2. '''Takes the configuration options and configures the3. DTSL objects prior to target connection4. Param: obase the option path string to top level options5. '''6. if self.traceDeviceIsDSTREAM(obase):7. self.setDSTREAMTraceEnabled(True)8. self.setDSTREAMOptions(obase+".traceBuffer")9. obaseETM = obase+".ETM"10. obaseITM = obase+".ITM"11. self.setETMEnabled(self.getOptionValue(12. obaseETM+".cortexM3coreTraceEnabled"))13. self.reservedATBIDs = {}14. self.setITMEnabled(self.getOptionValue(obaseITM+".itmTraceEnabled"))15. obaseITMOwner = obaseITM+".itmTraceEnabled.itmowner"16. if self.debuggerOwnsITM(obaseITMOwner):17. self.setITMOwnedByDebugger(True);18. self.setITMOptions(obaseITMOwner+".debugger")19. else:20. self.setITMOwnedByDebugger(False);21. self.reservedATBIDs["ITM"] =22. self.getOptionValue(obaseITMOwner+".target.targetITMATBID")23. self.updateATBIDAssignments()24. else:25. self.setDSTREAMTraceEnabled(False)26. self.setETMEnabled(False)27. self.setITMEnabled(False)
In this code example, note the following:
• The value for an option is retrieved using the self.getOptionValue method, which takes the fulloption path name to the option value.
• The code builds up the full option path names, which allows the options to be moved more easily.This can be seen in the way that the obaseITMOwner value is constructed and passed to theself.setITMOptions method. This allows self.setITMOptions to be written without having tohard code the full option name path into it. Instead, it only needs to know the path extensions fromthe passed base to determine its option values.
For completeness, the following shows the dynamic option update method:
1. def updateDynamicOptions(self, obase):2. '''Takes any changes to the dynamic options and3. applies them. Note that some trace options may4. not take effect until trace is (re)started5. Param: obase the option path string to top level options6. '''7. if self.traceDeviceIsDSTREAM(obase):8. obaseETM = obase+".ETM"9. self.setETMEnabled(self.getOptionValue(10. obaseETM+".cortexM3coreTraceEnabled"))11. obaseITM = obase+".ITM"12. if self.getOptionValue(obaseITM+".itmTraceEnabled"):13. self.setITMEnabled(True)14. obaseITMOwner = obaseITM+".itmTraceEnabled.itmowner"15. if self.debuggerOwnsITM(obaseITMOwner):16. self.setITMOptions(obaseITMOwner+".debugger")17. else:18. self.setITMEnabled(False)
For the dynamic option changes, only the options marked as dynamic need inspecting. Note
The option values are passed on to the corresponding DTSL objects, but the option changes might not beapplied immediately. In many cases, the change only applies when execution or trace is next started.Whether the option change is applied immediately is determined by the implementation of the DTSLobject.
15 Debug and Trace Services Layer (DTSL)15.6 DTSL options
ARM DUI0446Z Copyright © 2010-2016 ARM Limited or its affiliates. All rightsreserved.
15-467
Non-Confidential
15.7 DTSL support for SMP and AMP configurations
From the point of view of DS-5 Debugger, Symmetric Multi Processing (SMP) refers to a set ofarchitecturally identical cores which are tightly coupled together and used as a single multi-coreexecution block. From the point of view of the debugger, they must be started and halted together.
In larger systems, there may be several SMP sets, each of which is referred to as a cluster. Typically, acluster is a set of 4 cores in an SMP configuration. All cores in the SMP cluster also have the same viewof memory and run the same image.
From the point of view of DS-5 Debugger, Asymmetric Multi Processing (AMP) refers to a set of coreswhich are operating in an uncoupled manner. The cores can be of different architectures { Cortex-A8,Cortex-M3}, or of the same architecture but not operating in an SMP configuration. From the point ofview of the debugger, it depends on the application whether the cores need to be started or haltedtogether.
From the point of view of DTSL, the cores in the set (SMP or AMP) are part of the same configdbplatform. Using project_types.xml, the platform exposes a set of debug operations which cover thesupported use cases. All of these use cases must be provided for by the same Jython DTSL configurationclass. This is because, although there can be multiple clients using DTSL (for example, one debuggercontrolling a Cortex-A8 and another controlling a Cortex-M3), there is only one set of target debughardware (for example, only one TPIU). There must therefore be a single DTSL instance in control of thedebug hardware.
In SMP systems, there is usually a hardware mechanism which keeps the set of cores at the sameexecution state. Some AMP systems must also have synchronized execution state, and the multi-client,single DTSL instance architecture supports this. The single DTSL instance is always aware of the targetexecution state, and can typically arrange for a single execution state between all AMP cores.
This section contains the following subsections:• 15.7.1 AMP systems and synchronized execution on page 15-468.• 15.7.2 Execution synchronization levels on page 15-469.• 15.7.3 Software synchronization on page 15-469.• 15.7.4 Tight synchronization on page 15-469.• 15.7.5 Hardware synchronization on page 15-469.• 15.7.6 SMP states on page 15-470.• 15.7.7 Use of CTI for SMP execution synchronization on page 15-470.
15.7.1 AMP systems and synchronized execution
If a platform contains multiple cores, then when the first DTSL client connects, the DTSL configurationcreates devices for all of the cores. The client uses the devices for the cores it wants to control. When asecond client connects to the same platform, it must present an identical set of connection parameters.The DTSL connection manager therefore returns the same DTSL configuration instance that was createdby the first client connection. The second client can use the devices for the cores it wants to control. Inthis way, two clients can use the same DTSL configuration instance, including any DTSL options.
If execution synchronization is not required, a simple DTSL configuration is enough, with core executionstate being independent. However, if synchronized execution state is required, then the created objectmodel must provide this. The execution synchronization can be implemented with features in thehardware, or by creating a software object model hierarchy which arranges for a shared execution state.
15 Debug and Trace Services Layer (DTSL)15.7 DTSL support for SMP and AMP configurations
ARM DUI0446Z Copyright © 2010-2016 ARM Limited or its affiliates. All rightsreserved.
15-468
Non-Confidential
15.7.2 Execution synchronization levels
The level at which DTSL can perform synchronized execution status depends heavily on both theexecution controller (for example, the JTAG control box) and the on-chip debug hardware. However,there are roughly three different levels (or qualities) of synchronization:• Software synchronization• Tight synchronization• Hardware synchronization
15.7.3 Software synchronization
This is the lowest level or quality of synchronization. 'Software' refers to the DTSL software running onthe host debugger computer. At this level, the synchronization is of the following form:
Synchronized startThis is achieved by asking each device to start executing, by calling the go() method on eachdevice in turn.
Synchronized stopThis is achieved by asking each device to stop executing, by calling the stop() method on eachdevice in turn. If one device is seen to be stopped (by DTSL receiving aRDDI_EVENT_TYPE.RDDI_PROC_STATE_STOPPED stopped event), then the DTSL configurationmust request all other devices to stop.
This synchronization is done on the host computer, so there can be hundreds of milliseconds betweeneach core actually stopping. Whether this is a problem depends on how the target application handlesother cores not responding (if they communicate with each other at all).
15.7.4 Tight synchronization
With tight synchronization, the execution controller (JTAG box such as DSTREAM) can manage thesynchronization. This can typically be further divided into several sub-levels of support:• The execution controller supports the RDDI Debug_Synchronize() call. In this case, the
synchronized start and stop functionality is implemented in the execution controller. The controller ismuch 'closer' to the target system, so it can typically synchronize down to sub-millisecond intervals.
• The execution controller can define one or more sets of cores which form a cluster. When any one ofthe cores in a set is seen to halt execution, the others are automatically halted. This typically providessynchronized stop down to a sub-millisecond interval. DSTREAM supports this technique.
• The execution controller supports Debug_Synchronize(), but cannot define clusters. In this case, theDTSL configuration must be written so that if it sees any core in a synchronized group as halted, itissues the RDDI Debug_Synchronize() call to halt the others in the group. In a group of severaldevices, the time interval between the first halting and the others halting may be hundreds ofmilliseconds, but the interval between the others halting is typically sub-millisecond.
15.7.5 Hardware synchronization
With hardware synchronization, the target provides synchronization features on-chip. This is typicallythe case for ARM CoreSight systems that use the Cross Trigger Interface (CTI) to propagate debug haltand go requests between cores. This ability relies on the hardware design implementing this feature, andso might not be available on all CoreSight designs.
Related concepts15.7.7 Use of CTI for SMP execution synchronization on page 15-470.
15 Debug and Trace Services Layer (DTSL)15.7 DTSL support for SMP and AMP configurations
ARM DUI0446Z Copyright © 2010-2016 ARM Limited or its affiliates. All rightsreserved.
15-469
Non-Confidential
15.7.6 SMP states
For SMP systems, DTSL presents a single device to the client (see SMPDevice and its relations in theDTSL Java docs), and the client controls execution state through this device. This SMPDevice is a 'front'for the set of real devices which form an SMP group. When the SMPDevice reports the execution state tothe client, there is the possibility of inconsistent states. Ideally, for an SMP group, all the cores have thesame state, either executing or halted. In practice, this might not be the case. To allow for this possibility,the SMPDevice can report an inconsistent state to the client (debugger). This represents the case when notall cores are in the same state. Normally, DTSL provides a time window within which it expects all coresto get into the same state. If all cores become consistent within this time window, then DTSL reports aconsistent state to the client, otherwise it reports an inconsistent state. This allows the client to reflect thetrue state of the system to the user, but still allows the state to be reported as consistent if consistency isachieved at some future time.
15.7.7 Use of CTI for SMP execution synchronization
Cross Trigger Interface (CTI) is part of the ARM Embedded Cross Trigger (ECT) system. Eachcomponent in the system can have a CTI which allows inputs and outputs to be routed (or channeled)between the components. The channeling is done by the Cross Trigger Matrix (CTM), which is part ofthe ECT. The CTM supports a fixed number of channels onto which the CTIs can output or input signals.There may be many signals in the system which can be routed between components, and the CTIs can betold which signals to route by assigning them to a channel.
For example, in many systems, each core in the SMP group has a CTI connected to the following signals:
Table 15-1 CTI Signal Connections
Name Direction Purpose
DBGTRIGGER Output from core to CTI Indicates that the core is going to enter debug state (is going to stop executing)
EDBGRQ Input to core from CTI An external request for the core to enter debug state (stop executing)
DBGRESTART Input to core from CTI An external request for the core to exit debug state (start executing)
For synchronized execution to work, the DTSL configuration assigns two channels, one of which is forstop requests and the other of which is for start requests. The CTI or CTIs are configured to connect theabove signals onto these channels.
15 Debug and Trace Services Layer (DTSL)15.7 DTSL support for SMP and AMP configurations
ARM DUI0446Z Copyright © 2010-2016 ARM Limited or its affiliates. All rightsreserved.
15-470
Non-Confidential
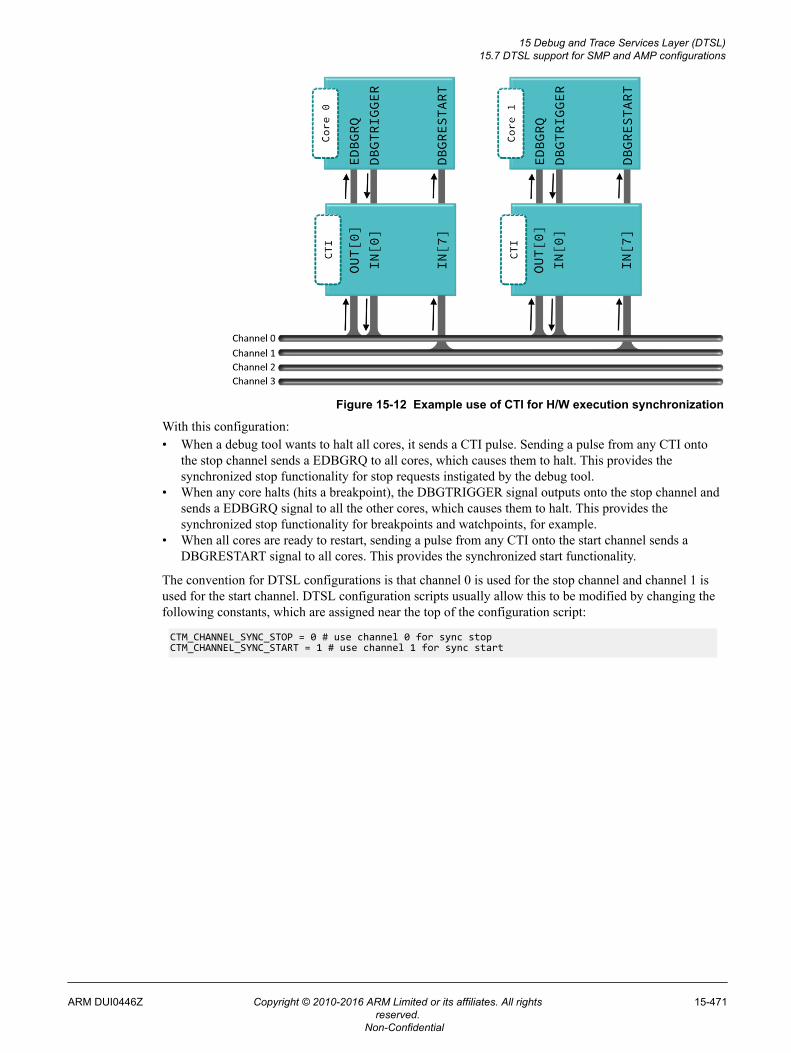
Figure 15-12 Example use of CTI for H/W execution synchronization
With this configuration:• When a debug tool wants to halt all cores, it sends a CTI pulse. Sending a pulse from any CTI onto
the stop channel sends a EDBGRQ to all cores, which causes them to halt. This provides thesynchronized stop functionality for stop requests instigated by the debug tool.
• When any core halts (hits a breakpoint), the DBGTRIGGER signal outputs onto the stop channel andsends a EDBGRQ signal to all the other cores, which causes them to halt. This provides thesynchronized stop functionality for breakpoints and watchpoints, for example.
• When all cores are ready to restart, sending a pulse from any CTI onto the start channel sends aDBGRESTART signal to all cores. This provides the synchronized start functionality.
The convention for DTSL configurations is that channel 0 is used for the stop channel and channel 1 isused for the start channel. DTSL configuration scripts usually allow this to be modified by changing thefollowing constants, which are assigned near the top of the configuration script:
CTM_CHANNEL_SYNC_STOP = 0 # use channel 0 for sync stopCTM_CHANNEL_SYNC_START = 1 # use channel 1 for sync start
15 Debug and Trace Services Layer (DTSL)15.7 DTSL support for SMP and AMP configurations
ARM DUI0446Z Copyright © 2010-2016 ARM Limited or its affiliates. All rightsreserved.
15-471
Non-Confidential
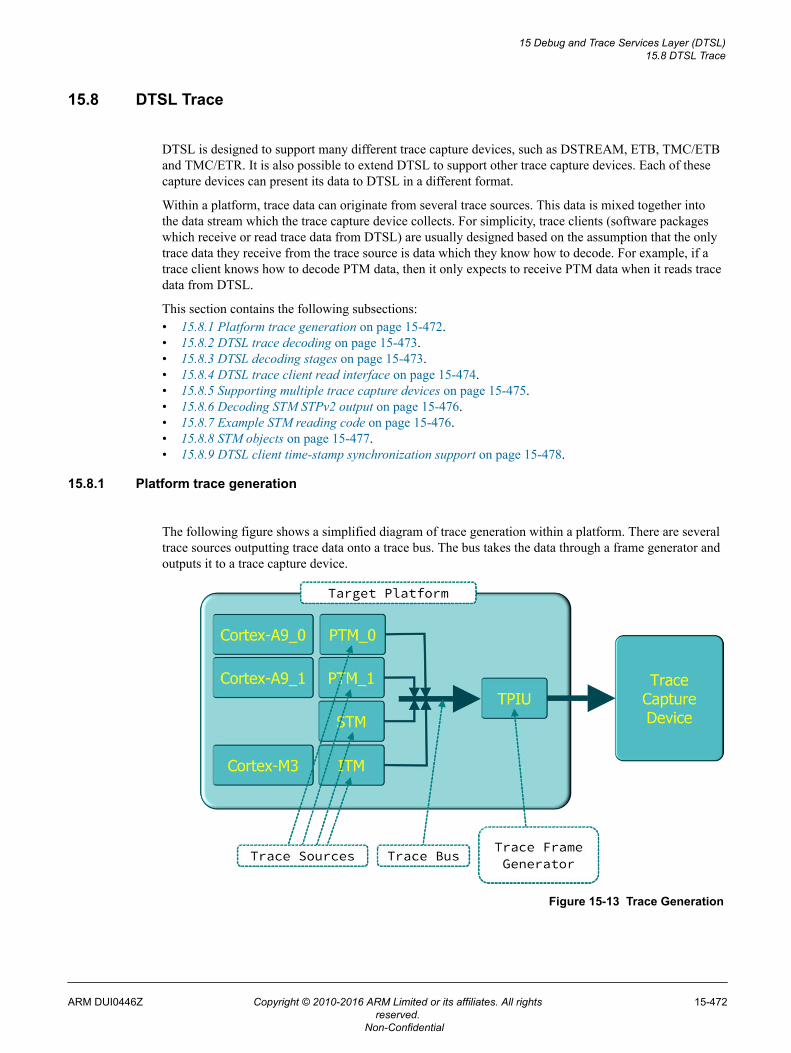
15.8 DTSL Trace
DTSL is designed to support many different trace capture devices, such as DSTREAM, ETB, TMC/ETBand TMC/ETR. It is also possible to extend DTSL to support other trace capture devices. Each of thesecapture devices can present its data to DTSL in a different format.
Within a platform, trace data can originate from several trace sources. This data is mixed together intothe data stream which the trace capture device collects. For simplicity, trace clients (software packageswhich receive or read trace data from DTSL) are usually designed based on the assumption that the onlytrace data they receive from the trace source is data which they know how to decode. For example, if atrace client knows how to decode PTM data, then it only expects to receive PTM data when it reads tracedata from DTSL.
This section contains the following subsections:• 15.8.1 Platform trace generation on page 15-472.• 15.8.2 DTSL trace decoding on page 15-473.• 15.8.3 DTSL decoding stages on page 15-473.• 15.8.4 DTSL trace client read interface on page 15-474.• 15.8.5 Supporting multiple trace capture devices on page 15-475.• 15.8.6 Decoding STM STPv2 output on page 15-476.• 15.8.7 Example STM reading code on page 15-476.• 15.8.8 STM objects on page 15-477.• 15.8.9 DTSL client time-stamp synchronization support on page 15-478.
15.8.1 Platform trace generation
The following figure shows a simplified diagram of trace generation within a platform. There are severaltrace sources outputting trace data onto a trace bus. The bus takes the data through a frame generator andoutputs it to a trace capture device.
Figure 15-13 Trace Generation
15 Debug and Trace Services Layer (DTSL)15.8 DTSL Trace
ARM DUI0446Z Copyright © 2010-2016 ARM Limited or its affiliates. All rightsreserved.
15-472
Non-Confidential
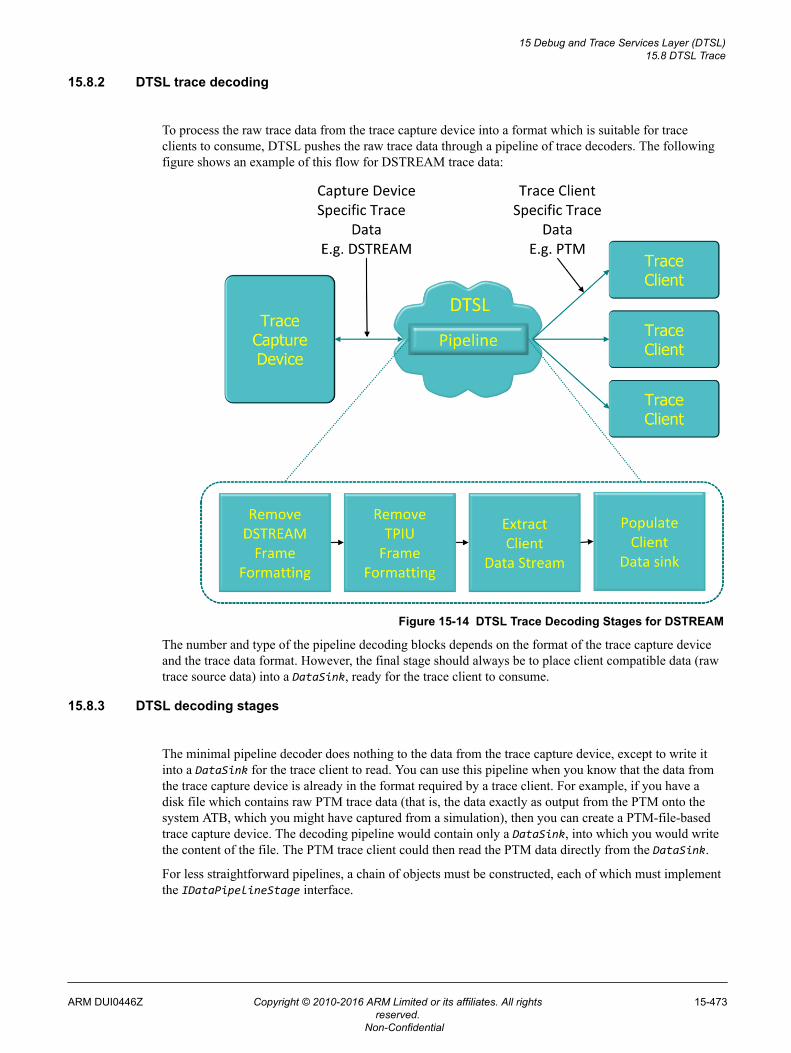
15.8.2 DTSL trace decoding
To process the raw trace data from the trace capture device into a format which is suitable for traceclients to consume, DTSL pushes the raw trace data through a pipeline of trace decoders. The followingfigure shows an example of this flow for DSTREAM trace data:
Figure 15-14 DTSL Trace Decoding Stages for DSTREAM
The number and type of the pipeline decoding blocks depends on the format of the trace capture deviceand the trace data format. However, the final stage should always be to place client compatible data (rawtrace source data) into a DataSink, ready for the trace client to consume.
15.8.3 DTSL decoding stages
The minimal pipeline decoder does nothing to the data from the trace capture device, except to write itinto a DataSink for the trace client to read. You can use this pipeline when you know that the data fromthe trace capture device is already in the format required by a trace client. For example, if you have adisk file which contains raw PTM trace data (that is, the data exactly as output from the PTM onto thesystem ATB, which you might have captured from a simulation), then you can create a PTM-file-basedtrace capture device. The decoding pipeline would contain only a DataSink, into which you would writethe content of the file. The PTM trace client could then read the PTM data directly from the DataSink.
For less straightforward pipelines, a chain of objects must be constructed, each of which must implementthe IDataPipelineStage interface.
15 Debug and Trace Services Layer (DTSL)15.8 DTSL Trace
ARM DUI0446Z Copyright © 2010-2016 ARM Limited or its affiliates. All rightsreserved.
15-473
Non-Confidential
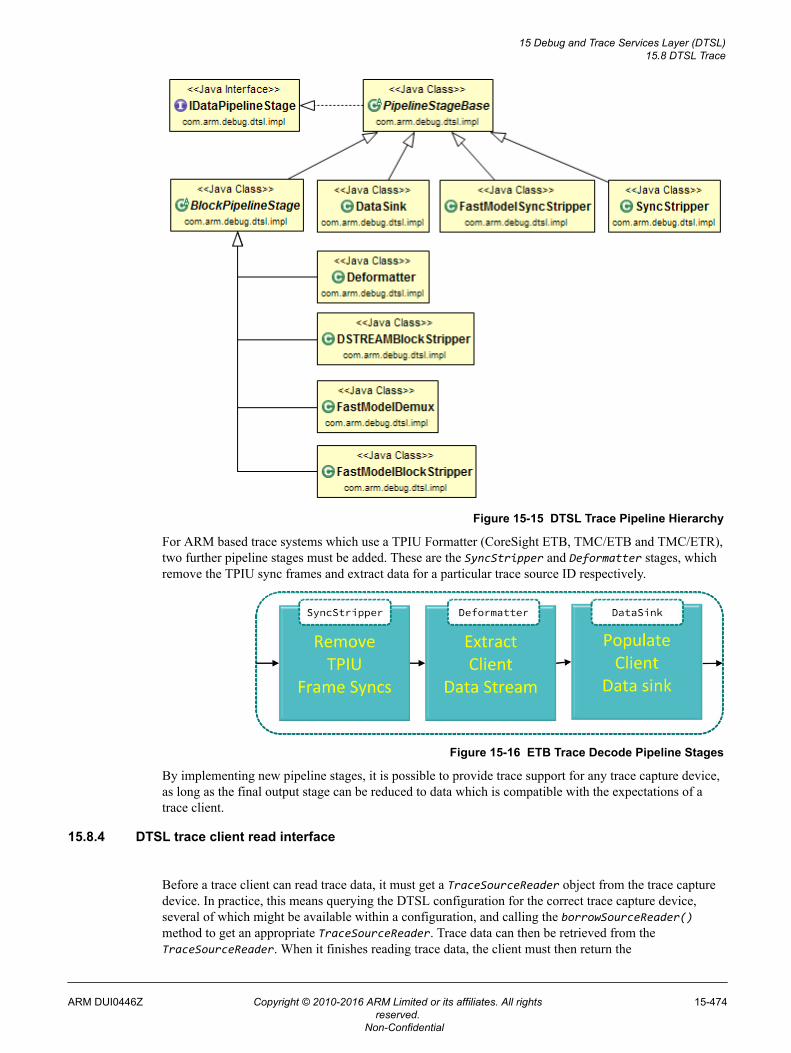
Figure 15-15 DTSL Trace Pipeline Hierarchy
For ARM based trace systems which use a TPIU Formatter (CoreSight ETB, TMC/ETB and TMC/ETR),two further pipeline stages must be added. These are the SyncStripper and Deformatter stages, whichremove the TPIU sync frames and extract data for a particular trace source ID respectively.
Figure 15-16 ETB Trace Decode Pipeline Stages
By implementing new pipeline stages, it is possible to provide trace support for any trace capture device,as long as the final output stage can be reduced to data which is compatible with the expectations of atrace client.
15.8.4 DTSL trace client read interface
Before a trace client can read trace data, it must get a TraceSourceReader object from the trace capturedevice. In practice, this means querying the DTSL configuration for the correct trace capture device,several of which might be available within a configuration, and calling the borrowSourceReader()method to get an appropriate TraceSourceReader. Trace data can then be retrieved from theTraceSourceReader. When it finishes reading trace data, the client must then return the
15 Debug and Trace Services Layer (DTSL)15.8 DTSL Trace
ARM DUI0446Z Copyright © 2010-2016 ARM Limited or its affiliates. All rightsreserved.
15-474
Non-Confidential
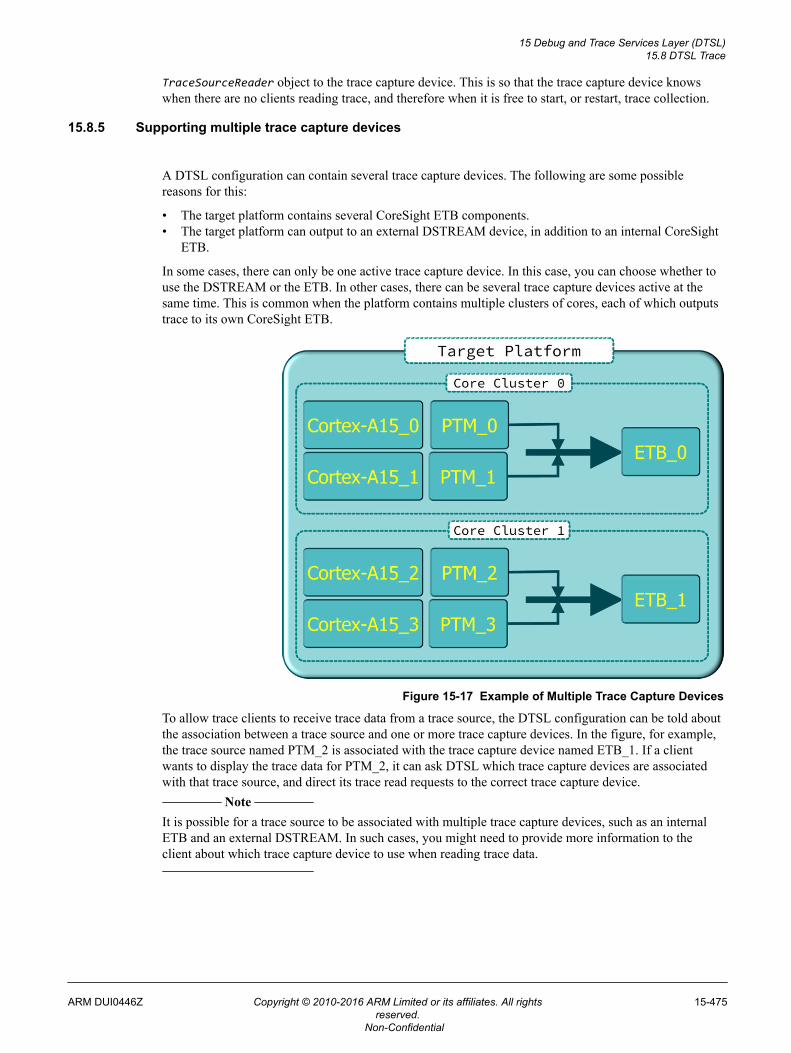
TraceSourceReader object to the trace capture device. This is so that the trace capture device knowswhen there are no clients reading trace, and therefore when it is free to start, or restart, trace collection.
15.8.5 Supporting multiple trace capture devices
A DTSL configuration can contain several trace capture devices. The following are some possiblereasons for this:
• The target platform contains several CoreSight ETB components.• The target platform can output to an external DSTREAM device, in addition to an internal CoreSight
ETB.
In some cases, there can only be one active trace capture device. In this case, you can choose whether touse the DSTREAM or the ETB. In other cases, there can be several trace capture devices active at thesame time. This is common when the platform contains multiple clusters of cores, each of which outputstrace to its own CoreSight ETB.
Figure 15-17 Example of Multiple Trace Capture Devices
To allow trace clients to receive trace data from a trace source, the DTSL configuration can be told aboutthe association between a trace source and one or more trace capture devices. In the figure, for example,the trace source named PTM_2 is associated with the trace capture device named ETB_1. If a clientwants to display the trace data for PTM_2, it can ask DTSL which trace capture devices are associatedwith that trace source, and direct its trace read requests to the correct trace capture device.
Note
It is possible for a trace source to be associated with multiple trace capture devices, such as an internalETB and an external DSTREAM. In such cases, you might need to provide more information to theclient about which trace capture device to use when reading trace data.
15 Debug and Trace Services Layer (DTSL)15.8 DTSL Trace
ARM DUI0446Z Copyright © 2010-2016 ARM Limited or its affiliates. All rightsreserved.
15-475
Non-Confidential
15.8.6 Decoding STM STPv2 output
The ARM STM CoreSight component generates a STPv2 compatible data stream as its output. TheSTPv2 specification is a MIPI Alliance specification which is not publicly available. To allow clients toconsume STM output, DTSL has a built-in decoder which turns STPv2 into an STM object stream.
To consume STM output, a client should do the following:• Create an object which implements the ISTMSourceMatcher interface. This object tells the decoder
which STM master IDs and channel IDs to decode. The STM package includes threeimplementations of the ISTMSourceMatcher interface. These are STMSourceMatcherRange,STMSourceMatcherSet, and STMSourceMatcherSingle. If none of these implementations coversyour needs, you can also create a new class which implements the ISTMSourceMatcher interface.
• Create an STMChannelReader object, specifying the trace capture device object and the sourcematcher object.
• Create an object which implements the ISTMObjectReceiver interface, to receive the STM objects.• When trace data is available, get hold of an ISourceReader object. Pass this, along with the
ISTMObjectReceiver object, to the read method on the STMChannelReader object. The readmethod decodes the trace into an STM object stream, and passes these objects to theISTMObjectReceiver.
Related concepts15.8.4 DTSL trace client read interface on page 15-474.
15.8.7 Example STM reading code
The following is some Java code which shows an example of STM Object reading. This could also beimplemented in Jython.
In this case, the STMTraceReader object implements the ISTMObjectReceiver interface itself. Thismeans that the code can pass the object to the STMChannelReader read method as the class to receive theSTMObjects.
The example code creates an STMSourceMatcherRange object with a parameter set which matchesagainst all Masters and Channels.
The STPv2 packet protocol outputs a SYNC packet which allows the decoder to synchronize the binarydata stream to the start of a packet. When decoding arbitrary data streams, the decoder needs tosynchronize to the stream before starting to decode the STPv2 packets. Once the stream is synchronized,there is no need to resynchronize, as long as contiguous data is being decoded.
The decoder has two ways to handle errors in the STPv2 packets stream:• Throw an STMDecodeException or an STMParseException. The advantage of this method is that the
errors are detected immediately, but the disadvantage is that you cannot continue processing STPv2packets (there is no way to resume decoding after the last error position).
• Insert an STMDecodeError object into the generated STMObject set. The advantage of this method isthat the full data stream is decoded, but the disadvantage is that the error is not processed by theclient until the generated STMDecodeError is processed.
/** * Class to read STM trace data and to get it processed into a * text stream. */public class STMTraceReader implements ISTMObjectReceiver { /** * The trace device - ETB or DSTREAM or ..... */ private ITraceCapture traceDevice; /** * A list of STMObjects that gets generated for us */ private List<STMObject> stmObjects;
15 Debug and Trace Services Layer (DTSL)15.8 DTSL Trace
ARM DUI0446Z Copyright © 2010-2016 ARM Limited or its affiliates. All rightsreserved.
15-476
Non-Confidential
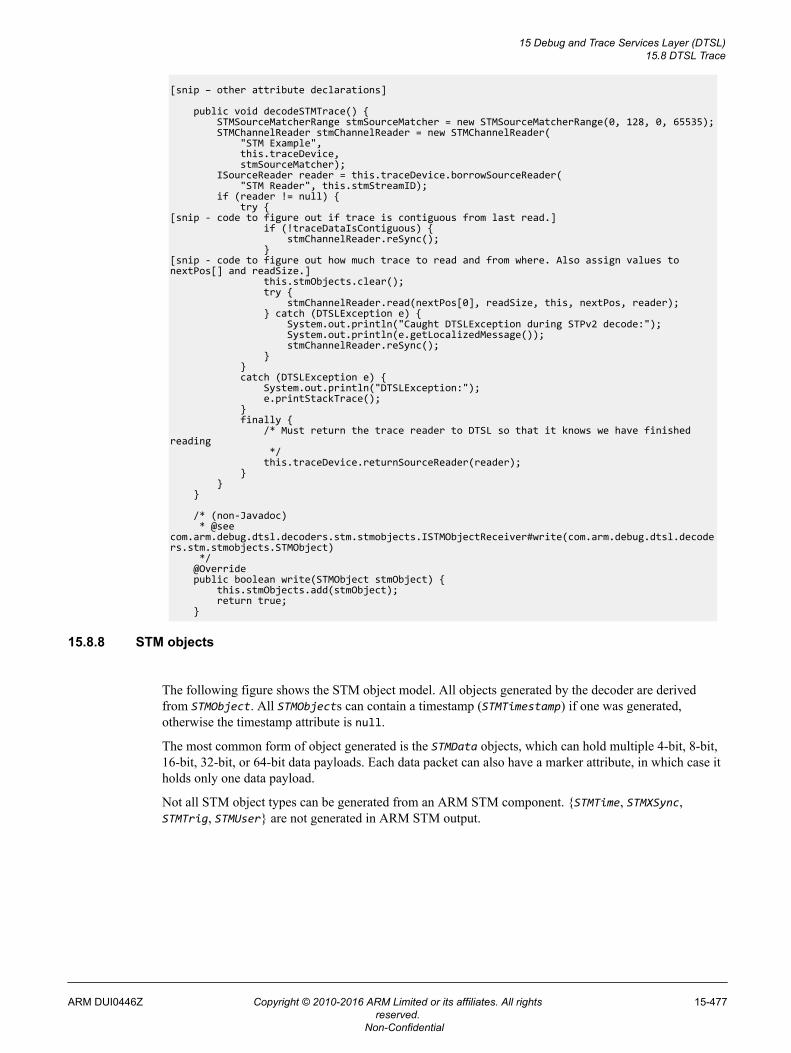
[snip – other attribute declarations]
public void decodeSTMTrace() { STMSourceMatcherRange stmSourceMatcher = new STMSourceMatcherRange(0, 128, 0, 65535); STMChannelReader stmChannelReader = new STMChannelReader( "STM Example", this.traceDevice, stmSourceMatcher); ISourceReader reader = this.traceDevice.borrowSourceReader( "STM Reader", this.stmStreamID); if (reader != null) { try {[snip - code to figure out if trace is contiguous from last read.] if (!traceDataIsContiguous) { stmChannelReader.reSync(); }[snip - code to figure out how much trace to read and from where. Also assign values to nextPos[] and readSize.] this.stmObjects.clear(); try { stmChannelReader.read(nextPos[0], readSize, this, nextPos, reader); } catch (DTSLException e) { System.out.println("Caught DTSLException during STPv2 decode:"); System.out.println(e.getLocalizedMessage()); stmChannelReader.reSync(); } } catch (DTSLException e) { System.out.println("DTSLException:"); e.printStackTrace(); } finally { /* Must return the trace reader to DTSL so that it knows we have finished reading */ this.traceDevice.returnSourceReader(reader); } } } /* (non-Javadoc) * @see com.arm.debug.dtsl.decoders.stm.stmobjects.ISTMObjectReceiver#write(com.arm.debug.dtsl.decoders.stm.stmobjects.STMObject) */ @Override public boolean write(STMObject stmObject) { this.stmObjects.add(stmObject); return true; }
15.8.8 STM objects
The following figure shows the STM object model. All objects generated by the decoder are derivedfrom STMObject. All STMObjects can contain a timestamp (STMTimestamp) if one was generated,otherwise the timestamp attribute is null.
The most common form of object generated is the STMData objects, which can hold multiple 4-bit, 8-bit,16-bit, 32-bit, or 64-bit data payloads. Each data packet can also have a marker attribute, in which case itholds only one data payload.
Not all STM object types can be generated from an ARM STM component. {STMTime, STMXSync,STMTrig, STMUser} are not generated in ARM STM output.
15 Debug and Trace Services Layer (DTSL)15.8 DTSL Trace
ARM DUI0446Z Copyright © 2010-2016 ARM Limited or its affiliates. All rightsreserved.
15-477
Non-Confidential
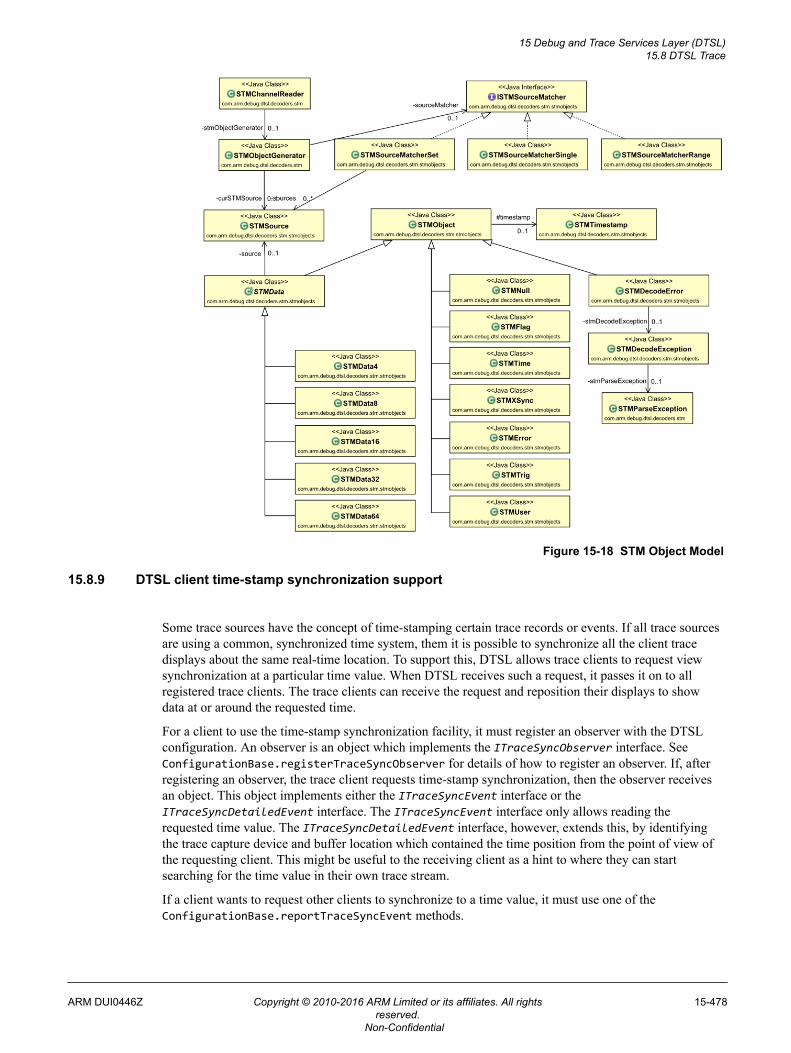
Figure 15-18 STM Object Model
15.8.9 DTSL client time-stamp synchronization support
Some trace sources have the concept of time-stamping certain trace records or events. If all trace sourcesare using a common, synchronized time system, them it is possible to synchronize all the client tracedisplays about the same real-time location. To support this, DTSL allows trace clients to request viewsynchronization at a particular time value. When DTSL receives such a request, it passes it on to allregistered trace clients. The trace clients can receive the request and reposition their displays to showdata at or around the requested time.
For a client to use the time-stamp synchronization facility, it must register an observer with the DTSLconfiguration. An observer is an object which implements the ITraceSyncObserver interface. SeeConfigurationBase.registerTraceSyncObserver for details of how to register an observer. If, afterregistering an observer, the trace client requests time-stamp synchronization, then the observer receivesan object. This object implements either the ITraceSyncEvent interface or theITraceSyncDetailedEvent interface. The ITraceSyncEvent interface only allows reading therequested time value. The ITraceSyncDetailedEvent interface, however, extends this, by identifyingthe trace capture device and buffer location which contained the time position from the point of view ofthe requesting client. This might be useful to the receiving client as a hint to where they can startsearching for the time value in their own trace stream.
If a client wants to request other clients to synchronize to a time value, it must use one of theConfigurationBase.reportTraceSyncEvent methods.
15 Debug and Trace Services Layer (DTSL)15.8 DTSL Trace
ARM DUI0446Z Copyright © 2010-2016 ARM Limited or its affiliates. All rightsreserved.
15-478
Non-Confidential
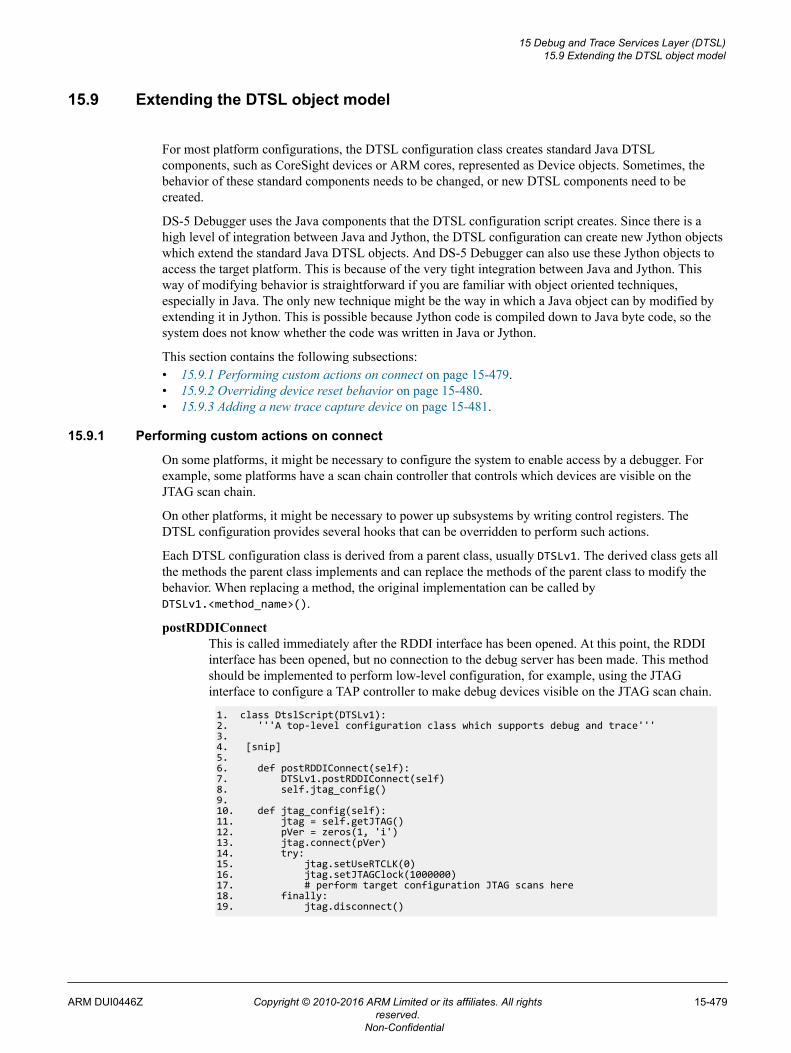
15.9 Extending the DTSL object model
For most platform configurations, the DTSL configuration class creates standard Java DTSLcomponents, such as CoreSight devices or ARM cores, represented as Device objects. Sometimes, thebehavior of these standard components needs to be changed, or new DTSL components need to becreated.
DS-5 Debugger uses the Java components that the DTSL configuration script creates. Since there is ahigh level of integration between Java and Jython, the DTSL configuration can create new Jython objectswhich extend the standard Java DTSL objects. And DS-5 Debugger can also use these Jython objects toaccess the target platform. This is because of the very tight integration between Java and Jython. Thisway of modifying behavior is straightforward if you are familiar with object oriented techniques,especially in Java. The only new technique might be the way in which a Java object can by modified byextending it in Jython. This is possible because Jython code is compiled down to Java byte code, so thesystem does not know whether the code was written in Java or Jython.
This section contains the following subsections:• 15.9.1 Performing custom actions on connect on page 15-479.• 15.9.2 Overriding device reset behavior on page 15-480.• 15.9.3 Adding a new trace capture device on page 15-481.
15.9.1 Performing custom actions on connect
On some platforms, it might be necessary to configure the system to enable access by a debugger. Forexample, some platforms have a scan chain controller that controls which devices are visible on theJTAG scan chain.
On other platforms, it might be necessary to power up subsystems by writing control registers. TheDTSL configuration provides several hooks that can be overridden to perform such actions.
Each DTSL configuration class is derived from a parent class, usually DTSLv1. The derived class gets allthe methods the parent class implements and can replace the methods of the parent class to modify thebehavior. When replacing a method, the original implementation can be called byDTSLv1.<method_name>().
postRDDIConnectThis is called immediately after the RDDI interface has been opened. At this point, the RDDIinterface has been opened, but no connection to the debug server has been made. This methodshould be implemented to perform low-level configuration, for example, using the JTAGinterface to configure a TAP controller to make debug devices visible on the JTAG scan chain.
1. class DtslScript(DTSLv1):2. '''A top-level configuration class which supports debug and trace'''3. 4. [snip] 5. 6. def postRDDIConnect(self):7. DTSLv1.postRDDIConnect(self)8. self.jtag_config()9.10. def jtag_config(self):11. jtag = self.getJTAG()12. pVer = zeros(1, 'i')13. jtag.connect(pVer)14. try:15. jtag.setUseRTCLK(0)16. jtag.setJTAGClock(1000000)17. # perform target configuration JTAG scans here18. finally:19. jtag.disconnect()
15 Debug and Trace Services Layer (DTSL)15.9 Extending the DTSL object model
ARM DUI0446Z Copyright © 2010-2016 ARM Limited or its affiliates. All rightsreserved.
15-479
Non-Confidential
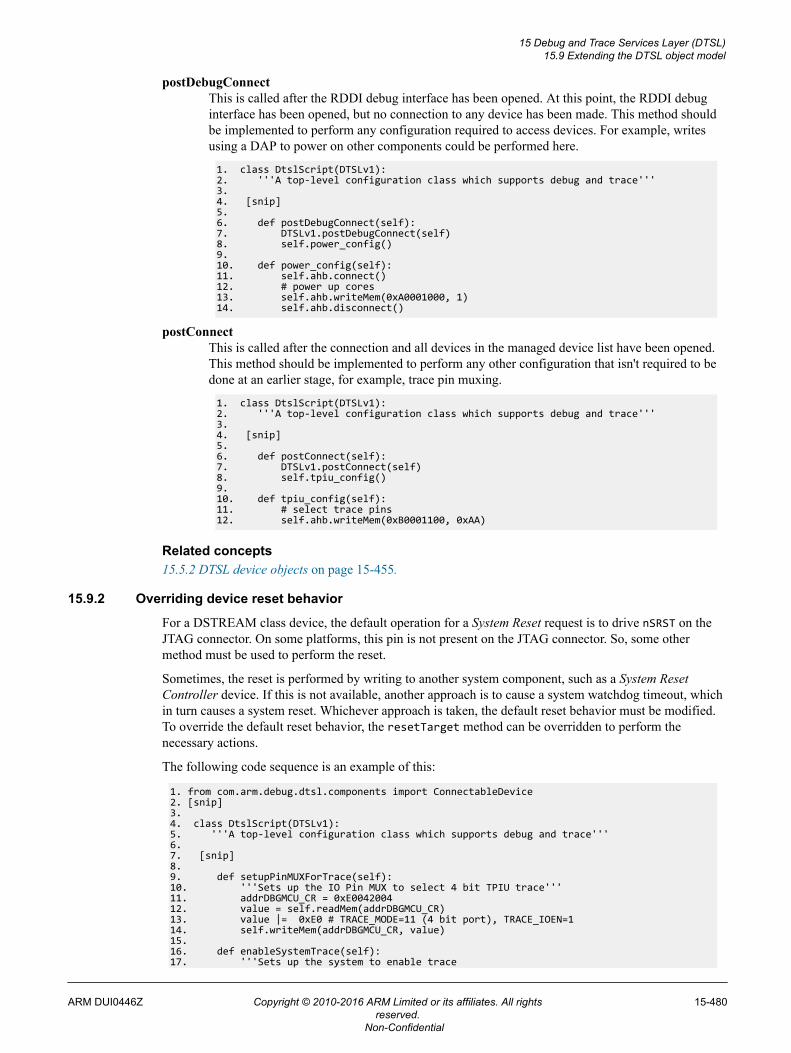
postDebugConnectThis is called after the RDDI debug interface has been opened. At this point, the RDDI debuginterface has been opened, but no connection to any device has been made. This method shouldbe implemented to perform any configuration required to access devices. For example, writesusing a DAP to power on other components could be performed here.
1. class DtslScript(DTSLv1):2. '''A top-level configuration class which supports debug and trace'''3. 4. [snip] 5. 6. def postDebugConnect(self):7. DTSLv1.postDebugConnect(self)8. self.power_config()9.10. def power_config(self):11. self.ahb.connect()12. # power up cores 13. self.ahb.writeMem(0xA0001000, 1) 14. self.ahb.disconnect()
postConnectThis is called after the connection and all devices in the managed device list have been opened.This method should be implemented to perform any other configuration that isn't required to bedone at an earlier stage, for example, trace pin muxing.
1. class DtslScript(DTSLv1):2. '''A top-level configuration class which supports debug and trace'''3. 4. [snip] 5. 6. def postConnect(self):7. DTSLv1.postConnect(self)8. self.tpiu_config()9.10. def tpiu_config(self):11. # select trace pins12. self.ahb.writeMem(0xB0001100, 0xAA)
Related concepts15.5.2 DTSL device objects on page 15-455.
15.9.2 Overriding device reset behavior
For a DSTREAM class device, the default operation for a System Reset request is to drive nSRST on theJTAG connector. On some platforms, this pin is not present on the JTAG connector. So, some othermethod must be used to perform the reset.
Sometimes, the reset is performed by writing to another system component, such as a System ResetController device. If this is not available, another approach is to cause a system watchdog timeout, whichin turn causes a system reset. Whichever approach is taken, the default reset behavior must be modified.To override the default reset behavior, the resetTarget method can be overridden to perform thenecessary actions.
The following code sequence is an example of this:
1. from com.arm.debug.dtsl.components import ConnectableDevice2. [snip]3. 4. class DtslScript(DTSLv1):5. '''A top-level configuration class which supports debug and trace'''6. 7. [snip] 8. 9. def setupPinMUXForTrace(self):10. '''Sets up the IO Pin MUX to select 4 bit TPIU trace'''11. addrDBGMCU_CR = 0xE004200412. value = self.readMem(addrDBGMCU_CR)13. value |= 0xE0 # TRACE_MODE=11 (4 bit port), TRACE_IOEN=114. self.writeMem(addrDBGMCU_CR, value)15.16. def enableSystemTrace(self):17. '''Sets up the system to enable trace
15 Debug and Trace Services Layer (DTSL)15.9 Extending the DTSL object model
ARM DUI0446Z Copyright © 2010-2016 ARM Limited or its affiliates. All rightsreserved.
15-480
Non-Confidential
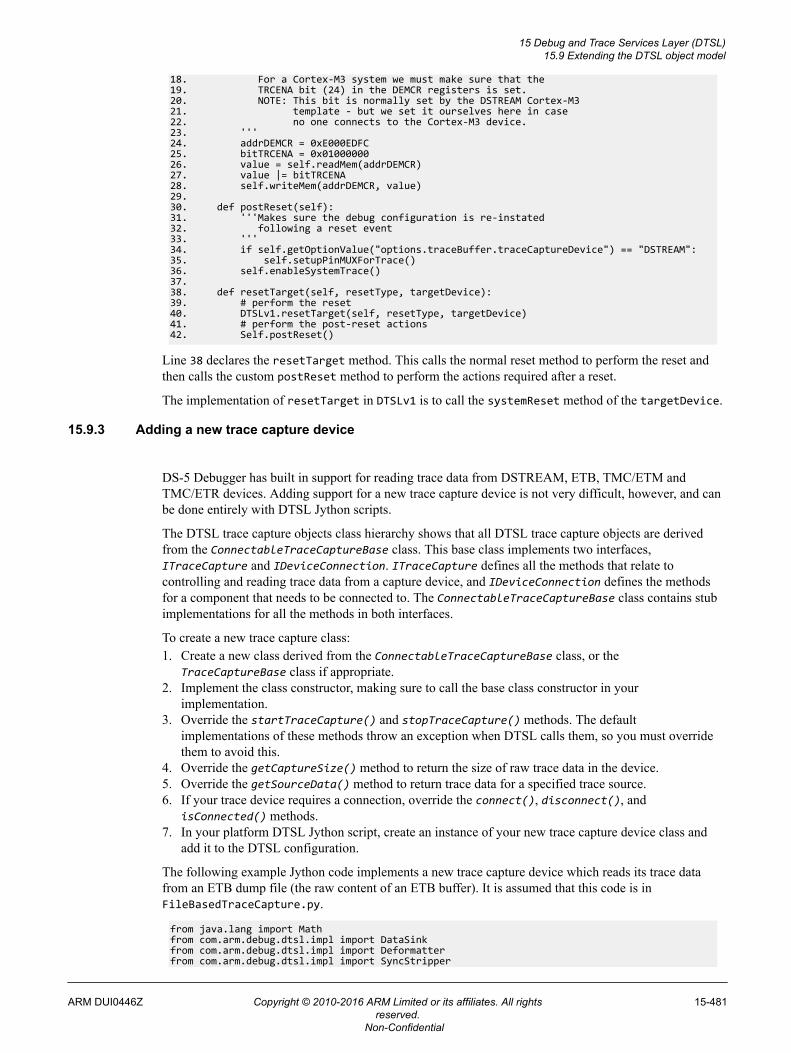
18. For a Cortex-M3 system we must make sure that the19. TRCENA bit (24) in the DEMCR registers is set.20. NOTE: This bit is normally set by the DSTREAM Cortex-M321. template - but we set it ourselves here in case22. no one connects to the Cortex-M3 device.23. '''24. addrDEMCR = 0xE000EDFC25. bitTRCENA = 0x0100000026. value = self.readMem(addrDEMCR)27. value |= bitTRCENA28. self.writeMem(addrDEMCR, value)29.30. def postReset(self):31. '''Makes sure the debug configuration is re-instated32. following a reset event33. '''34. if self.getOptionValue("options.traceBuffer.traceCaptureDevice") == "DSTREAM":35. self.setupPinMUXForTrace()36. self.enableSystemTrace()37. 38. def resetTarget(self, resetType, targetDevice):39. # perform the reset40. DTSLv1.resetTarget(self, resetType, targetDevice)41. # perform the post-reset actions42. Self.postReset()
Line 38 declares the resetTarget method. This calls the normal reset method to perform the reset andthen calls the custom postReset method to perform the actions required after a reset.
The implementation of resetTarget in DTSLv1 is to call the systemReset method of the targetDevice.
15.9.3 Adding a new trace capture device
DS-5 Debugger has built in support for reading trace data from DSTREAM, ETB, TMC/ETM andTMC/ETR devices. Adding support for a new trace capture device is not very difficult, however, and canbe done entirely with DTSL Jython scripts.
The DTSL trace capture objects class hierarchy shows that all DTSL trace capture objects are derivedfrom the ConnectableTraceCaptureBase class. This base class implements two interfaces,ITraceCapture and IDeviceConnection. ITraceCapture defines all the methods that relate tocontrolling and reading trace data from a capture device, and IDeviceConnection defines the methodsfor a component that needs to be connected to. The ConnectableTraceCaptureBase class contains stubimplementations for all the methods in both interfaces.
To create a new trace capture class:1. Create a new class derived from the ConnectableTraceCaptureBase class, or the
TraceCaptureBase class if appropriate.2. Implement the class constructor, making sure to call the base class constructor in your
implementation.3. Override the startTraceCapture() and stopTraceCapture() methods. The default
implementations of these methods throw an exception when DTSL calls them, so you must overridethem to avoid this.
4. Override the getCaptureSize() method to return the size of raw trace data in the device.5. Override the getSourceData() method to return trace data for a specified trace source.6. If your trace device requires a connection, override the connect(), disconnect(), and
isConnected() methods.7. In your platform DTSL Jython script, create an instance of your new trace capture device class and
add it to the DTSL configuration.
The following example Jython code implements a new trace capture device which reads its trace datafrom an ETB dump file (the raw content of an ETB buffer). It is assumed that this code is inFileBasedTraceCapture.py.
from java.lang import Mathfrom com.arm.debug.dtsl.impl import DataSinkfrom com.arm.debug.dtsl.impl import Deformatterfrom com.arm.debug.dtsl.impl import SyncStripper
15 Debug and Trace Services Layer (DTSL)15.9 Extending the DTSL object model
ARM DUI0446Z Copyright © 2010-2016 ARM Limited or its affiliates. All rightsreserved.
15-481
Non-Confidential
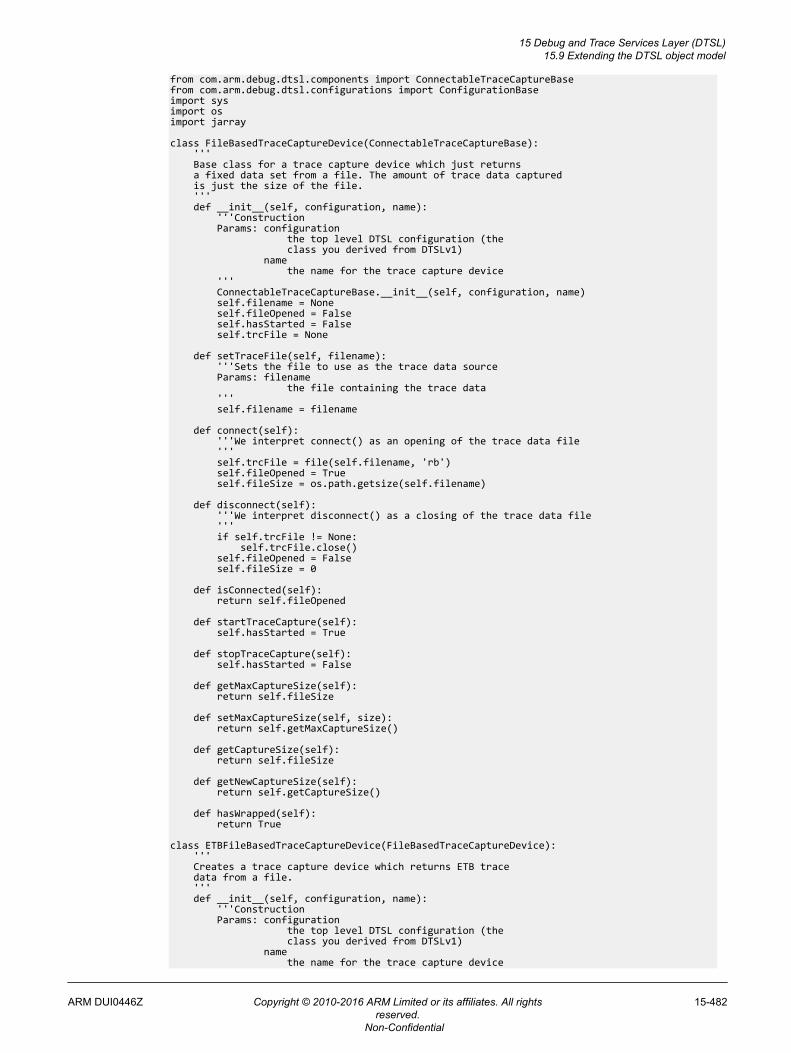
from com.arm.debug.dtsl.components import ConnectableTraceCaptureBasefrom com.arm.debug.dtsl.configurations import ConfigurationBaseimport sysimport osimport jarray
class FileBasedTraceCaptureDevice(ConnectableTraceCaptureBase): ''' Base class for a trace capture device which just returns a fixed data set from a file. The amount of trace data captured is just the size of the file. ''' def __init__(self, configuration, name): '''Construction Params: configuration the top level DTSL configuration (the class you derived from DTSLv1) name the name for the trace capture device ''' ConnectableTraceCaptureBase.__init__(self, configuration, name) self.filename = None self.fileOpened = False self.hasStarted = False self.trcFile = None
def setTraceFile(self, filename): '''Sets the file to use as the trace data source Params: filename the file containing the trace data ''' self.filename = filename def connect(self): '''We interpret connect() as an opening of the trace data file ''' self.trcFile = file(self.filename, 'rb') self.fileOpened = True self.fileSize = os.path.getsize(self.filename)
def disconnect(self): '''We interpret disconnect() as a closing of the trace data file ''' if self.trcFile != None: self.trcFile.close() self.fileOpened = False self.fileSize = 0
def isConnected(self): return self.fileOpened
def startTraceCapture(self): self.hasStarted = True
def stopTraceCapture(self): self.hasStarted = False
def getMaxCaptureSize(self): return self.fileSize
def setMaxCaptureSize(self, size): return self.getMaxCaptureSize()
def getCaptureSize(self): return self.fileSize
def getNewCaptureSize(self): return self.getCaptureSize()
def hasWrapped(self): return True
class ETBFileBasedTraceCaptureDevice(FileBasedTraceCaptureDevice): ''' Creates a trace capture device which returns ETB trace data from a file. ''' def __init__(self, configuration, name): '''Construction Params: configuration the top level DTSL configuration (the class you derived from DTSLv1) name the name for the trace capture device
15 Debug and Trace Services Layer (DTSL)15.9 Extending the DTSL object model
ARM DUI0446Z Copyright © 2010-2016 ARM Limited or its affiliates. All rightsreserved.
15-482
Non-Confidential
''' FileBasedTraceCaptureDevice.__init__(self, configuration, name)
def getSourceData(self, streamID, position, size, data, nextPos): '''Reads the ETB trace data from the file Params: streamID for file formats which contain multiple streams, this identifies the stream for which data should be returned from position the byte index position to read from size the max size of data (in bytes) we should return data where to write the extracted data nextPos an array into which we set entry [0] to the next position to read from i.e. the position parameter value which will return data that immediately follows the last entry written into data ''' # We assume that size is small enough to allow to read an entire # data block in one operation self.trcFile.seek(position) rawdata = jarray.array(self.trcFile.read(size), 'b') nextPos[0] = position+size dest = DataSink(0, 0, size, data) # We assume the file contains TPIU frames with sync sequences # Se we set up a processing chain as follows: # file data -> strip syncs -> de formatter -> to our caller deformatter = Deformatter(dest, streamID) syncStripper = SyncStripper(deformatter) syncStripper.forceSync(True) syncStripper.push(rawdata) syncStripper.flush() return dest.size()
We can use the new trace capture device in the platform DTSL Jython code:
from FileBasedTraceCapture import ETBFileBasedTraceCaptureDevice[snip] self.etbFileCaptureDevice = ETBFileBasedTraceCaptureDevice(self, 'ETB(FILE)') self.etbFileCaptureDevice.setTraceFile('c:\\etbdump.bin') self.addTraceCaptureInterface(self.etbFileCaptureDevice)
We can add it to the configuration as though it were an ETB or DSTREAM device.
Related concepts15.5.5 DTSL trace capture objects on page 15-458.
15 Debug and Trace Services Layer (DTSL)15.9 Extending the DTSL object model
ARM DUI0446Z Copyright © 2010-2016 ARM Limited or its affiliates. All rightsreserved.
15-483
Non-Confidential
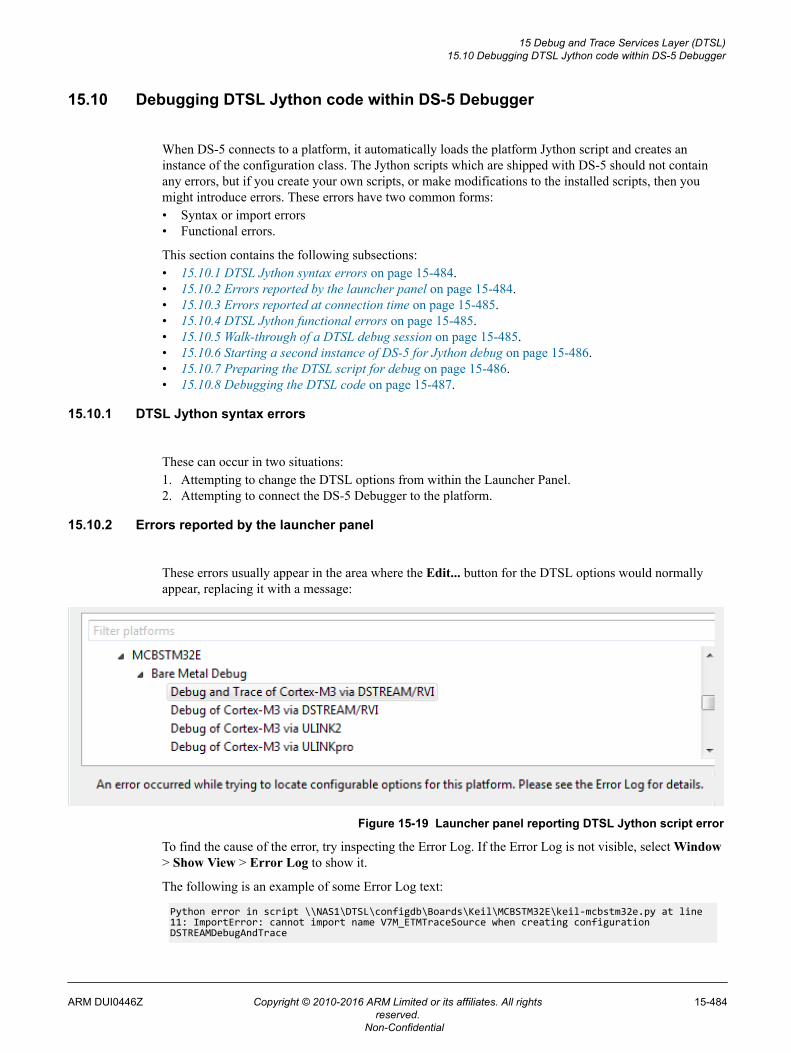
15.10 Debugging DTSL Jython code within DS-5 Debugger
When DS-5 connects to a platform, it automatically loads the platform Jython script and creates aninstance of the configuration class. The Jython scripts which are shipped with DS-5 should not containany errors, but if you create your own scripts, or make modifications to the installed scripts, then youmight introduce errors. These errors have two common forms:• Syntax or import errors• Functional errors.
This section contains the following subsections:• 15.10.1 DTSL Jython syntax errors on page 15-484.• 15.10.2 Errors reported by the launcher panel on page 15-484.• 15.10.3 Errors reported at connection time on page 15-485.• 15.10.4 DTSL Jython functional errors on page 15-485.• 15.10.5 Walk-through of a DTSL debug session on page 15-485.• 15.10.6 Starting a second instance of DS-5 for Jython debug on page 15-486.• 15.10.7 Preparing the DTSL script for debug on page 15-486.• 15.10.8 Debugging the DTSL code on page 15-487.
15.10.1 DTSL Jython syntax errors
These can occur in two situations:1. Attempting to change the DTSL options from within the Launcher Panel.2. Attempting to connect the DS-5 Debugger to the platform.
15.10.2 Errors reported by the launcher panel
These errors usually appear in the area where the Edit... button for the DTSL options would normallyappear, replacing it with a message:
Figure 15-19 Launcher panel reporting DTSL Jython script error
To find the cause of the error, try inspecting the Error Log. If the Error Log is not visible, select Window> Show View > Error Log to show it.
The following is an example of some Error Log text:
Python error in script \\NAS1\DTSL\configdb\Boards\Keil\MCBSTM32E\keil-mcbstm32e.py at line 11: ImportError: cannot import name V7M_ETMTraceSource when creating configuration DSTREAMDebugAndTrace
15 Debug and Trace Services Layer (DTSL)15.10 Debugging DTSL Jython code within DS-5 Debugger
ARM DUI0446Z Copyright © 2010-2016 ARM Limited or its affiliates. All rightsreserved.
15-484
Non-Confidential
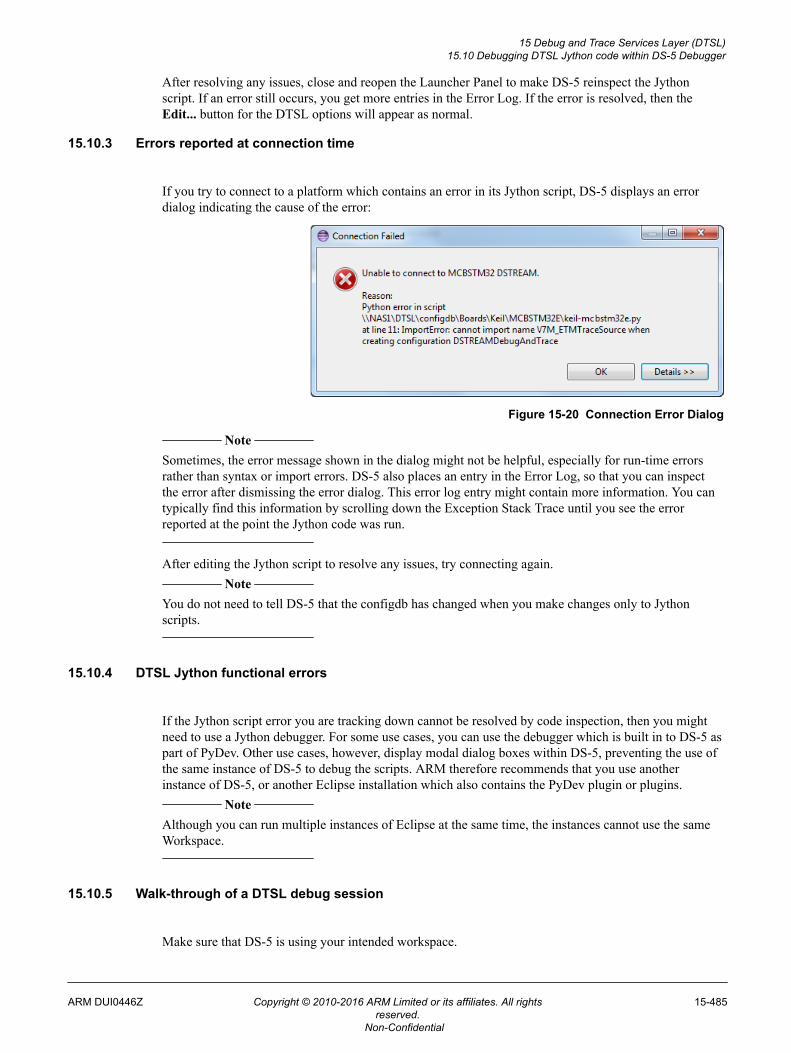
After resolving any issues, close and reopen the Launcher Panel to make DS-5 reinspect the Jythonscript. If an error still occurs, you get more entries in the Error Log. If the error is resolved, then theEdit... button for the DTSL options will appear as normal.
15.10.3 Errors reported at connection time
If you try to connect to a platform which contains an error in its Jython script, DS-5 displays an errordialog indicating the cause of the error:
Figure 15-20 Connection Error Dialog
Note
Sometimes, the error message shown in the dialog might not be helpful, especially for run-time errorsrather than syntax or import errors. DS-5 also places an entry in the Error Log, so that you can inspectthe error after dismissing the error dialog. This error log entry might contain more information. You cantypically find this information by scrolling down the Exception Stack Trace until you see the errorreported at the point the Jython code was run.
After editing the Jython script to resolve any issues, try connecting again. Note
You do not need to tell DS-5 that the configdb has changed when you make changes only to Jythonscripts.
15.10.4 DTSL Jython functional errors
If the Jython script error you are tracking down cannot be resolved by code inspection, then you mightneed to use a Jython debugger. For some use cases, you can use the debugger which is built in to DS-5 aspart of PyDev. Other use cases, however, display modal dialog boxes within DS-5, preventing the use ofthe same instance of DS-5 to debug the scripts. ARM therefore recommends that you use anotherinstance of DS-5, or another Eclipse installation which also contains the PyDev plugin or plugins.
Note
Although you can run multiple instances of Eclipse at the same time, the instances cannot use the sameWorkspace.
15.10.5 Walk-through of a DTSL debug session
Make sure that DS-5 is using your intended workspace.
15 Debug and Trace Services Layer (DTSL)15.10 Debugging DTSL Jython code within DS-5 Debugger
ARM DUI0446Z Copyright © 2010-2016 ARM Limited or its affiliates. All rightsreserved.
15-485
Non-Confidential
The debug session involves modifying a DTSL Jython script, so make sure that you are using a writeablecopy of the DS-5 configdb.
Related concepts15.3.1 Modifying DS-5 configdb on page 15-446.
15.10.6 Starting a second instance of DS-5 for Jython debug
When you start a second instance of DS-5, with the first instance still running, you are asked to use adifferent workspace. Choose a suitable location for this second workspace.
In this second instance of DS-5, switch to the PyDev perspective. To enable the toolbar buttons thatallow you to start and stop the PyDev debug server:• Select Window > Customize Perspective....• Click the Command Groups Availability tab.• Scroll down through the Available Command Groups and select the PyDev Debug entry.• Click the Tool Bar Visibility tab.• Make sure that the PyDev Debug entry, and the two End Debug Server and Start Debug Server
entries, are selected.
On the toolbar, you should see two new icons to stop and start the debug server.
Click the green P-bug icon to start the PyDev debug server. You should see a console view reporting theport number on which the debugger is listening (5678 by default). The DS-5 instance is ready to acceptremote debug connections.
Switch to the Debug perspective. Eclipse does not automatically switch to the Debug perspective when aconnection is made to the PyDev debugger. So if you do not switch to the Debug perspective yourself,then you cannot notice the connection.
15.10.7 Preparing the DTSL script for debug
When a Jython script is being debugged, it is normally launched by PyDev, and PyDev can optionallycreate a debug session for the script. When DS-5 launches the Jython script, however, this does nothappen. This is not a problem, however, because the script itself can register with the PyDev debuggerafter it is launched. To do this in your script:• Extend the import list for the script to import pydevd. If you are using a second DS-5 instance to host
the PyDev debugger, then add the following to the top of the DTSL script:
import pydevd
If you are using another Eclipse (non-DS-5) to host the PyDev debugger, then import the pydevdfrom that Eclipse instance. Locate the pydev plugin pysrc directory and add its path to the importpath before importing pydevd. For example, if the Eclipse is installed in C:\Users\john\eclipse,then the code would be as follows:
import sys;sys.path.append(r'C:\Users\john\eclipse\plugins\org.python.pydev_2.7.4.2013051601\pysrc')import pydevd
where pydev_xyz depends on the version of pydev installed within Eclipse.• Insert the following line at the location where you want the PyDev debugger to gain control of the
script:
pydevd.settrace(stdoutToServer=True, stderrToServer=True)
This causes a break into the debugger at that location, and redirects all standard output from the scriptto the debugger console. This allows you to place print statements into the script and see them in the
15 Debug and Trace Services Layer (DTSL)15.10 Debugging DTSL Jython code within DS-5 Debugger
ARM DUI0446Z Copyright © 2010-2016 ARM Limited or its affiliates. All rightsreserved.
15-486
Non-Confidential
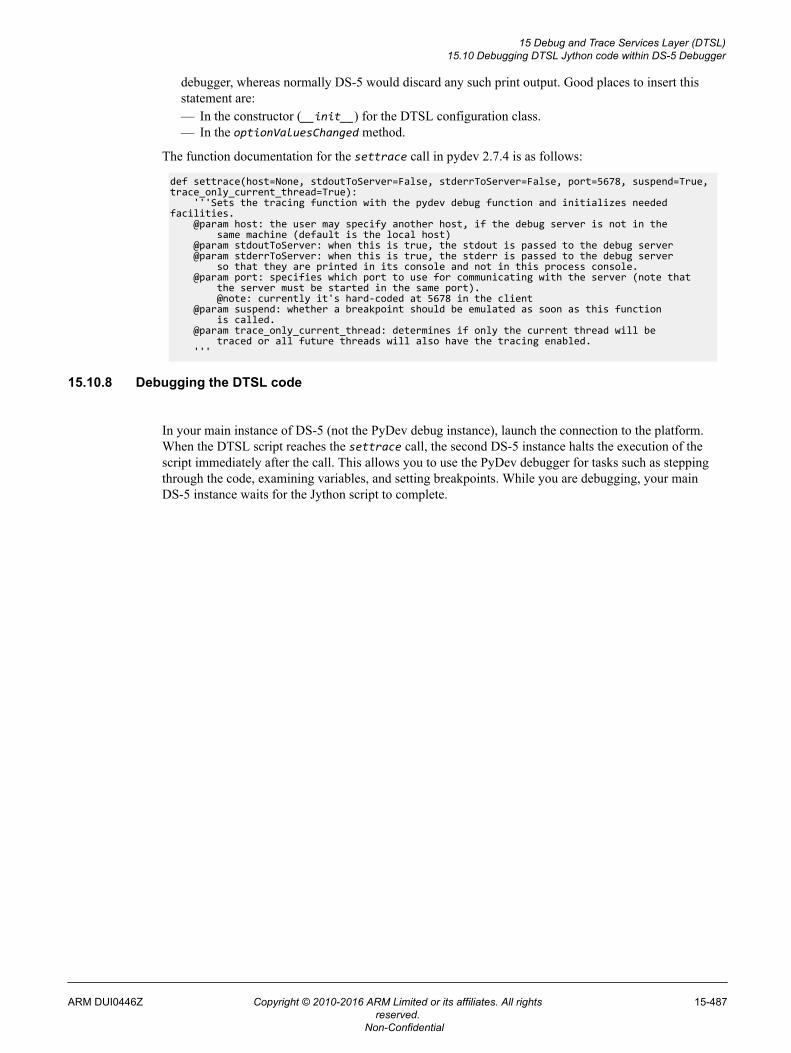
debugger, whereas normally DS-5 would discard any such print output. Good places to insert thisstatement are:— In the constructor (__init__) for the DTSL configuration class.— In the optionValuesChanged method.
The function documentation for the settrace call in pydev 2.7.4 is as follows:
def settrace(host=None, stdoutToServer=False, stderrToServer=False, port=5678, suspend=True, trace_only_current_thread=True): '''Sets the tracing function with the pydev debug function and initializes needed facilities. @param host: the user may specify another host, if the debug server is not in the same machine (default is the local host) @param stdoutToServer: when this is true, the stdout is passed to the debug server @param stderrToServer: when this is true, the stderr is passed to the debug server so that they are printed in its console and not in this process console. @param port: specifies which port to use for communicating with the server (note that the server must be started in the same port). @note: currently it's hard-coded at 5678 in the client @param suspend: whether a breakpoint should be emulated as soon as this function is called. @param trace_only_current_thread: determines if only the current thread will be traced or all future threads will also have the tracing enabled. '''
15.10.8 Debugging the DTSL code
In your main instance of DS-5 (not the PyDev debug instance), launch the connection to the platform.When the DTSL script reaches the settrace call, the second DS-5 instance halts the execution of thescript immediately after the call. This allows you to use the PyDev debugger for tasks such as steppingthrough the code, examining variables, and setting breakpoints. While you are debugging, your mainDS-5 instance waits for the Jython script to complete.
15 Debug and Trace Services Layer (DTSL)15.10 Debugging DTSL Jython code within DS-5 Debugger
ARM DUI0446Z Copyright © 2010-2016 ARM Limited or its affiliates. All rightsreserved.
15-487
Non-Confidential
15.11 DTSL in stand-alone mode
DTSL is commonly used by DS-5 Debugger, both within the Eclipse environment and in the consoleversion of the debugger. However, it can also be used in 'stand-alone' mode, completely outside ofEclipse. This allows you to use the DTSL API to take care of the target connection and configurationwhen writing your program. The rest of your program can concentrate on the main function of yourapplication.
DTSL is mainly written in Java and Jython. There are therefore two kinds of stand-alone program, thosewritten in Jython and those in Java. The DTSLExamples.zip file contains examples of both kinds ofprogram, which you can look at to help you decide the best route for your application. The programs areeasy to compare because they both do essentially the same things.
This section contains the following subsections:• 15.11.1 Comparing Java with Jython for DTSL development on page 15-488.• 15.11.2 DTSL as used by a stand-alone Jython program on page 15-489.• 15.11.3 Installing the Jython example within Eclipse on page 15-489.• 15.11.4 Running the Jython program on page 15-490.• 15.11.5 Invoking the Jython program on page 15-490.• 15.11.6 About the Jython program on page 15-490.• 15.11.7 DTSL as used by a stand-alone Java program on page 15-491.• 15.11.8 Installing the Java example within Eclipse on page 15-491.• 15.11.9 Running the Java program on page 15-492.• 15.11.10 Invoking the Java program on page 15-493.• 15.11.11 About the Java program on page 15-493.
15.11.1 Comparing Java with Jython for DTSL development
The advantages of Java are:
• The Javadoc for DTSL is directly available, which helps greatly when writing DTSL Java programsin environments such as Eclipse.
• Java programs seem to have faster start-up times than Jython programs.• The Eclipse Java development environment might be considered more mature than the Python PyDev
Eclipse development environment.
The advantages of Jython are:
• There are probably more people familiar with Python than with Java.• Python is not a statically-typed language. So it is easier to write Python code without always having
to create variables of specific types.
The disadvantages of Jython are:• There is no DTSL Javadoc support, because the PyDev editor does not understand how to extract the
Javadoc information from the Java .jar files.• Python is not a statically-typed language, so it is hard for the PyDev editor to know the type of a
variable. Using 'assert isinstance(<variable>,<type>)' works around this to an extent, and thiscode appears many times in the example. After the PyDev editor sees it, it knows the type of thevariable and so can provide code completion facilities. However, you still do not get access to theJavadoc within the editor. If you want to access the Javadoc, you must do it by some other method,such as through a web browser.
• Jython can be slower than Java. For example, if Jython is used as part of a trace decoding pipeline, itcan significantly slow down trace processing.
15 Debug and Trace Services Layer (DTSL)15.11 DTSL in stand-alone mode
ARM DUI0446Z Copyright © 2010-2016 ARM Limited or its affiliates. All rightsreserved.
15-488
Non-Confidential
15.11.2 DTSL as used by a stand-alone Jython program
The example Jython application demonstrates how to do the following:
• Create a DTSL configuration instance for the requested platform.• Connect to a core device, such as a Cortex-M3 or other such ARM core.• Perform the following operations:
— Get control of the core following a reset.— Read and write registers on the core.— Read and write memory through the core.— Single step instructions on the core.— Start and stop core execution.
The example application connects to and controls the ARM core only. However, it can just as easilyconnect to any of the devices in the configuration, such as CoreSight components (PTM or ETB), andconfigure and control those devices as well.
Note
The example is a complete stand-alone application. It cannot be run when a DS-5 Debugger connectionis made to the same target. However, a DS-5 Debugger Jython script can access the DTSL configuration.If you do this, take care not to interfere with the debugger.
15.11.3 Installing the Jython example within Eclipse
Make sure you have Jython installed. To download Jython, and for installation instructions, go to http://www.jython.org/. This document is written with reference to Jython 2.5.3, but later versions should alsowork.
Make sure you have the PyDev plugin installed into your Eclipse IDE. To download PyDev, and forinstallation instructions, go to http://pydev.org/. Make sure you configure PyDev to know about theJython version you have installed.
The example project DTSLPythonExample is in the DTSLExamples.zip file. You can importDTSLPythonExample directly into your Eclipse workspace. You must also import DTSL.zip into yourEclipse workspace. After importing them, change the project configuration to refer to your DTSL librarylocation:
1. Select the DTSLPythonExample within the Eclipse Project Explorer, right click it, and selectProperties.
2. Select 'PyDev – PYTHONPATH' from the properties list.3. Click the String Substitution Variables tab.4. Replace the DTSL variable value with the path to your DTSL library location.The example project also contains two launch configurations for running the program. One configurationuses the DS-5 configdb board specification, and the other refers directly to the files in the configdb. Theproject contains a configdb extension, which contains the Keil MCBSTM32 entries compatible with thisproject.
Note
If you use your own Eclipse (non DS-5) installation, then you must set the DS-5 installation locationwithin the DS-5 preferences. This value is used within the provided launch configurations.
The readme.txt file contained within the project has more information.
Related references15.1 Additional DTSL documentation and files on page 15-440.
15 Debug and Trace Services Layer (DTSL)15.11 DTSL in stand-alone mode
ARM DUI0446Z Copyright © 2010-2016 ARM Limited or its affiliates. All rightsreserved.
15-489
Non-Confidential
15.11.4 Running the Jython program
To run the example in Eclipse:
1. Import the supplied launch configurations.2. Modify the program arguments to refer to your installed DS-5 location.3. Run or debug the application.
To run the example use:
• dtslexample.bat from Windows• dtslexample from Linux.
Before running the file, edit it and change the program parameters to suit the target system you areconnecting to. You might need to make the following changes:• Change the location of jython.bat to match your Jython installation. DS-5 does contain part of a
Jython installation, but it lacks the main jython.bat executable, so you must install your own.• Change the defined location of the Eclipse workspace.• Change the location of the DS-5 configuration database to include the database installed by DS-5 and
any further extensions you require (the location within a workspace of DTSLExampleConfigdb\configdb is an extension required to run the example).
• Change the connection address for the DSTREAM box to match your box. If you are using a USBconnection then the code --connectionAddress "USB" can be left unchanged, but if you are using aTCP connection then you must change it to be of the form --connectionAddress "TCP:<host-name|ip-address>", for example --connectionAddress "TCP:DS-Tony" or --connectionAddress "TCP:192.168.1.32".
• Change the manufacturer to match the directory name of your platform in the Boards sub-directory ofthe DS-5 config database.
• Change the board name to match the name of the board directory within the manufacturer directory.• Change the debug operation to match one of the activity names contained in a bare metal debug
section of the project_types.xml file. For example:
<activity id="ICE_DEBUG" type="Debug">
<name language="en">Debug Cortex-M3</name>
When you run the dtslexample.py script, it connects to the target and runs through a series of register,memory, and execution operations. By default, the script assumes that there is RAM at 0x20000000, andthat there is 64KB of it. This is correct for the Keil MCBSTM32 board. To change these values, use the--ramStart and --ramSize options.
15.11.5 Invoking the Jython program
For information on the full set of program arguments, run the program with the --help parameter.
There are two ways to invoke the program:• Specify the DTSL connection properties directly, using the {--rddiConfigFile, --dtslScript, --
dtslClass, --connectionType, --connectionAddress, --device} parameters.• Specify the DS-5 configdb parameters (equivalent to using the Eclipse launcher) using the {--
configdb, --manufacturer, --board, --debugOperation, --connectionType, --connectionAddress} parameters, and let the program extract the DTSL connection properties fromthe DS-5 configdb.
15.11.6 About the Jython program
• The main program is in the dtslexample.py source file.• The project is set up to use the DTSL libraries from the DTSL Eclipse project.
15 Debug and Trace Services Layer (DTSL)15.11 DTSL in stand-alone mode
ARM DUI0446Z Copyright © 2010-2016 ARM Limited or its affiliates. All rightsreserved.
15-490
Non-Confidential
• The DTSL interaction flow is as follows:1. Connecting to DTSL. This involves forming the ConnectionParameters set and passing it to the
DTSL static ConnectionManager.openConnection() method. See the Python methodconnectToDTSL() for details.
2. Accessing the DTSL connection configuration and locating the DTSL object with the namerequested in either:— the --device parameter— the core specified in the DS-5 configdb platform debug operation.
3. Connecting to the core located in step 2.4. Performing the operations on the core, which is represented by a DTSL object that implements the
IDevice interface. The DTSL Javadoc lists the full set of operations available on such an object.The example uses some of the more common operations, but does not cover all of them.
5. Disconnecting from the core.6. Disconnecting from DTSL.
• The IDevice interface is a Java interface, so there are some operations which take Java parameterssuch as StringBuilder objects. This is not a problem for Jython because you can create such Javaobjects within your Jython program. Most of the memory operations use Java byte[] arrays totransport the data. Interfacing these between Jython and Java is relatively simple, but be sure toinspect the example code carefully if you want to understand how to do this.
• The IDevice Java interface wraps the RDDI-DEBUG C interface thinly, which means that many ofthe RDDI constants are used directly rather than being wrapped. This is why the example usesconstants such as RDDI_ACC_SIZE.RDDI_ACC_DEF.
15.11.7 DTSL as used by a stand-alone Java program
The example Java application shows you how to do the following:
• Create a DTSL configuration instance for the requested platform.• Connect to a core device, such as a Cortex-M3 or other such ARM core.• Perform the following operations:
— Get control of the core following a reset.— Read and write registers on the core.— Read and write memory through the core.— Single step instructions on the core.— Start and stop core execution.
The example application connects to and controls the ARM core only. However, it can just as easilyconnect to any of the devices in the configuration, such as CoreSight components (PTM or ETB), andconfigure and control those devices as well.
Note
The example is a complete stand-alone application. It cannot be run when a DS-5 Debugger connectionis made to the same target. However, a DS-5 Debugger Jython script can access the DTSL configuration.If you do this, take care not to interfere with the debugger.
15.11.8 Installing the Java example within Eclipse
The example project DTSLJavaExample is in the DTSLExamples.zip file. You can importDTSLJavaExample directly into your Eclipse workspace. You must also import DTSL.zip into yourEclipse workspace. After importing it, change the project configuration to refer to your DTSL librarylocation:
15 Debug and Trace Services Layer (DTSL)15.11 DTSL in stand-alone mode
ARM DUI0446Z Copyright © 2010-2016 ARM Limited or its affiliates. All rightsreserved.
15-491
Non-Confidential
1. Select the DTSLJavaExample within the Eclipse Project Explorer, right click it, and selectProperties.
2. Select 'Java Build Path' from the properties list.3. Click the Libraries tab.4. Replace all the referenced DTSL\libs .jar files with new entries which have the correct paths.The example project also contains two launch configurations for running the program. One configurationuses the DS-5 configdb board specification, and the other refers directly to the files in the configdb. Theproject contains a configdb extension, which contains the Keil MCBSTM32 entries compatible with thisproject.
Note
If you use your own Eclipse (non DS-5) installation, then you must set the DS-5 installation locationwithin the DS-5 preferences. This value is used within the provided launch configurations.
The readme.txt file contained within the project has more information.
Related references15.1 Additional DTSL documentation and files on page 15-440.
15.11.9 Running the Java program
To run the example in Eclipse:
1. Import the supplied launch configurations.2. Modify the program arguments to refer to your installed DS-5 location.3. Run or debug the application.
To run the example use:
• dtslexample.bat from Windows• dtslexample from Linux.
Before running the batch file, edit it and change the program parameters to suit the target system you areconnecting to. You might need to make the following changes:• Change the defined location of the Eclipse workspace.• Change the location of the DS-5 configuration database to include the database installed by DS-5.• Change the connection address for the DSTREAM box to match your box. If you are using a USB
connection then the code --connectionAddress "USB" can be left unchanged, but if you are using aTCP connection then you must change it to be of the form --connectionAddress "TCP:<host-name|ip-address>", for example --connectionAddress "TCP:DS-Tony" or --connectionAddress "TCP:192.168.1.32".
• Change the manufacturer to match the directory name of your platform in the Boards sub-directory ofthe DS-5 config database.
• Change the board name to match the name of the board directory within the manufacturer directory.• Change the debug operation to match one of the activity names contained in a bare metal debug
section of the project_types.xml file. For example:
<activity id="ICE_DEBUG" type="Debug">
<name language="en">Debug Cortex-M3</name>
When you run the DTSLExample.java program, it connects to the target and runs through a series ofregister, memory, and execution operations. By default, the program assumes that there is RAM at0x20000000, and that there is 64KB of it. This is correct for the Keil MCBSTM32 board. To changethese values, use the --ramStart and --ramSize options.
15 Debug and Trace Services Layer (DTSL)15.11 DTSL in stand-alone mode
ARM DUI0446Z Copyright © 2010-2016 ARM Limited or its affiliates. All rightsreserved.
15-492
Non-Confidential
15.11.10 Invoking the Java program
For information on the full set of program arguments, run the program with the --help parameter.
There are two ways to invoke the program:• Specify the DTSL connection properties directly, using the {--rddiConfigFile, --dtslScript, --
dtslClass, --connectionType, --connectionAddress, --device} parameters.• Specify the DS-5 configdb parameters (equivalent to using the Eclipse launcher) using the {--
configdb, --manufacturer, --board, --debugOperation, --connectionType, --connectionAddress} parameters, and let the program extract the DTSL connection properties fromthe DS-5 configdb.
15.11.11 About the Java program
• The main program is in the DTSLExample.java source file.• The project is set up to use the DTSL libraries from the DTSL Eclipse project.• The DTSL interaction flow is as follows:
1. Connecting to DTSL. This involves forming the ConnectionParameters set and passing it to theDTSL static ConnectionManager.openConnection() method. See the connectToDTSL()method for details.
2. Accessing the DTSL connection configuration and locating the DTSL object with the namerequested in either:— the --device parameter— the core specified in the DS-5 configdb platform debug operation.
3. Connecting to the core located in step 2.4. Performing the operations on the core, which is represented by a DTSL object that implements the
IDevice interface. The DTSL Javadoc lists the full set of operations available on such an object.The example uses some of the more common operations, but does not cover all of them.
5. Disconnecting from the core.6. Disconnecting from DTSL.
• The IDevice Java interface (used for all target devices) wraps the RDDI-DEBUG C interface thinly,which means that many of the RDDI constants are used directly rather than being wrapped. That iswhy the example uses constants such as RDDI_ACC_SIZE.RDDI_ACC_DEF.
15 Debug and Trace Services Layer (DTSL)15.11 DTSL in stand-alone mode
ARM DUI0446Z Copyright © 2010-2016 ARM Limited or its affiliates. All rightsreserved.
15-493
Non-Confidential
Chapter 16Reference
Lists other information that might be useful when working with DS-5 Debugger.
It contains the following sections:• 16.1 Standards compliance in DS-5 Debugger on page 16-495.• 16.2 DS-5 Debug perspective keyboard shortcuts on page 16-496.• 16.3 About loading an image on to the target on page 16-497.• 16.4 About loading debug information into the debugger on page 16-499.• 16.5 About passing arguments to main() on page 16-501.• 16.6 Running an image on page 16-502.• 16.7 Updating multiple debug hardware units on page 16-503.
ARM DUI0446Z Copyright © 2010-2016 ARM Limited or its affiliates. All rightsreserved.
16-494
Non-Confidential
16.1 Standards compliance in DS-5 DebuggerDS-5 Debugger conforms to various formats and protocols.
Executable and Linkable Format (ELF)The debugger can read executable images in ELF format.
DWARFThe debugger can read debug information from ELF images in the DWARF 2, DWARF 3, andDWARF 4 formats.
Note
The DWARF 2 and DWARF 3 standards are ambiguous in some areas such as debug frame data.This means that there is no guarantee that the debugger can consume the DWARF produced byall third-party tools.
Trace ProtocolsThe debugger can interpret trace that complies with the Embedded Trace Macrocell (ETM) (v3and above), Instrumentation Trace Macrocell (ITM), and System Trace Macrocell (STM)protocols.
Related informationELF for the ARM Architecture.DWARF for the ARM Architecture.The DWARF Debugging Standard.International Organization for Standardization.
16 Reference16.1 Standards compliance in DS-5 Debugger
ARM DUI0446Z Copyright © 2010-2016 ARM Limited or its affiliates. All rightsreserved.
16-495
Non-Confidential
16.2 DS-5 Debug perspective keyboard shortcutsYou can use various keyboard shortcuts in the DS-5 Debug perspective.
You can access the dynamic help in any view or dialog box by using the following:• On Windows, use the F1 key• On Linux, use the Shift+F1 key combination.
The following keyboard shortcuts are available when you connect to a target:
Commands viewYou can use:
Ctrl+SpaceAccess the content assist for autocompletion of commands.
EnterExecute the command that is entered in the adjacent field.
DOWN arrowNavigate down through the command history.
UP arrowNavigate up through the command history.
Debug Control viewYou can use:
F5Step at source level including stepping into all function calls where there is debuginformation.
ALT+F5Step at instruction level including stepping into all function calls where there is debuginformation.
F6Step at source or instruction level but stepping over all function calls.
F7Continue running to the next instruction after the selected stack frame finishes.
F8Continue running the target.
Note
A Connect only connection might require setting the PC register to the start of theimage before running it.
F9Interrupt the target and stop the current application if it is running.
Related tasks2.2 Launching DS-5 and connecting to DS-5 Debugger on page 2-36.
Related references11.6 Commands view on page 11-275.
16 Reference16.2 DS-5 Debug perspective keyboard shortcuts
ARM DUI0446Z Copyright © 2010-2016 ARM Limited or its affiliates. All rightsreserved.
16-496
Non-Confidential
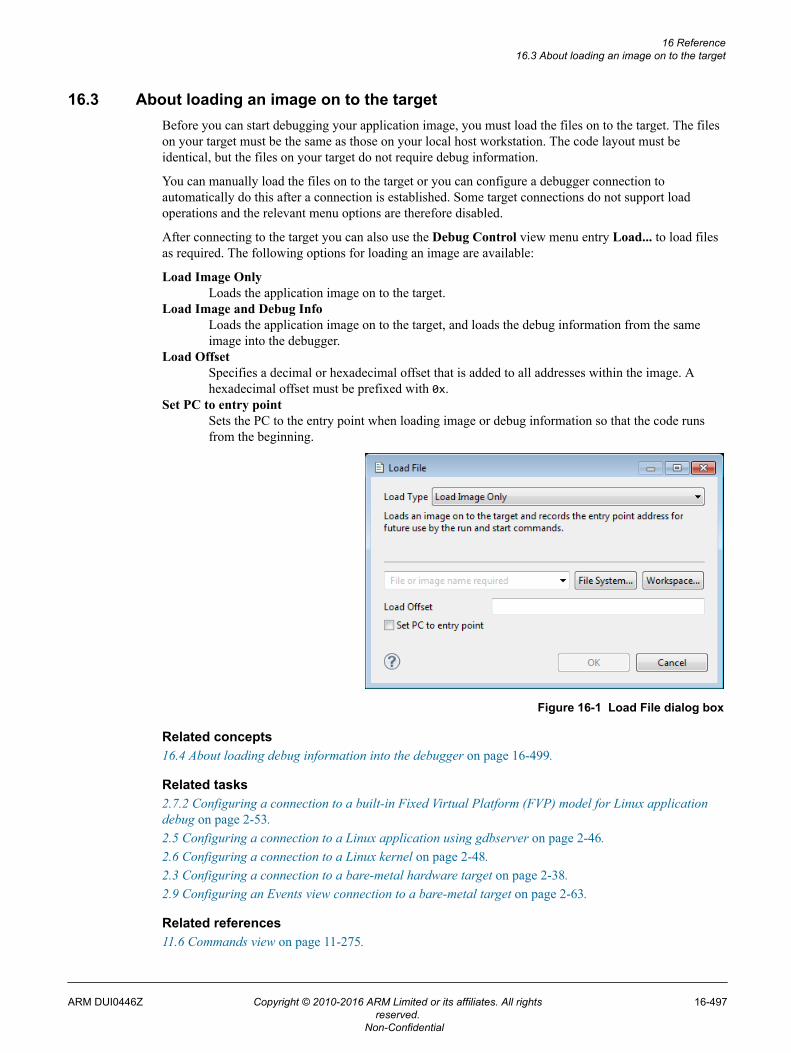
16.3 About loading an image on to the targetBefore you can start debugging your application image, you must load the files on to the target. The fileson your target must be the same as those on your local host workstation. The code layout must beidentical, but the files on your target do not require debug information.
You can manually load the files on to the target or you can configure a debugger connection toautomatically do this after a connection is established. Some target connections do not support loadoperations and the relevant menu options are therefore disabled.
After connecting to the target you can also use the Debug Control view menu entry Load... to load filesas required. The following options for loading an image are available:
Load Image OnlyLoads the application image on to the target.
Load Image and Debug InfoLoads the application image on to the target, and loads the debug information from the sameimage into the debugger.
Load OffsetSpecifies a decimal or hexadecimal offset that is added to all addresses within the image. Ahexadecimal offset must be prefixed with 0x.
Set PC to entry pointSets the PC to the entry point when loading image or debug information so that the code runsfrom the beginning.
Figure 16-1 Load File dialog box
Related concepts16.4 About loading debug information into the debugger on page 16-499.
Related tasks2.7.2 Configuring a connection to a built-in Fixed Virtual Platform (FVP) model for Linux applicationdebug on page 2-53.2.5 Configuring a connection to a Linux application using gdbserver on page 2-46.2.6 Configuring a connection to a Linux kernel on page 2-48.2.3 Configuring a connection to a bare-metal hardware target on page 2-38.2.9 Configuring an Events view connection to a bare-metal target on page 2-63.
Related references11.6 Commands view on page 11-275.
16 Reference16.3 About loading an image on to the target
ARM DUI0446Z Copyright © 2010-2016 ARM Limited or its affiliates. All rightsreserved.
16-497
Non-Confidential

Related informationDS-5 Debugger commands.
16 Reference16.3 About loading an image on to the target
ARM DUI0446Z Copyright © 2010-2016 ARM Limited or its affiliates. All rightsreserved.
16-498
Non-Confidential
16.4 About loading debug information into the debuggerAn executable image contains symbolic references, such as function and variable names, in addition tothe application code and data. These symbolic references are generally referred to as debug information.Without this information, the debugger is unable to debug at the source level.
To debug an application at source level, the image file and shared object files must be compiled withdebug information, and a suitable level of optimization. For example, when compiling with either theARM or the GNU compiler you can use the following options:
-g -O0
Debug information is not loaded when an image is loaded to a target, but is a separate action. A typicalload sequence is:1. Load the main application image.2. Load any shared objects.3. Load the symbols for the main application image.4. Load the symbols for shared objects.
Loading debug information increases memory use and can take a long time. To minimize these costs, thedebugger loads debug information incrementally as it is needed. This is called on-demand loading.Certain operations, such as listing all the symbols in an image, load additional data into the debugger andtherefore incur a small delay. Loading of debug information can occur at any time, on-demand, so youmust ensure that your images remain accessible to the debugger and do not change during your debugsession.
Images and shared objects might be preloaded onto the target, such as an image in a ROM device or anOS-aware target. The corresponding image file and any shared object files must contain debuginformation, and be accessible from your local host workstation. You can then configure a connection tothe target loading only the debug information from these files. Use the Load symbols from file optionon the debug configuration Files tab as appropriate for the target environment.
After connecting to the target you can also use the view menu entry Load... in the Debug Control viewto load files as required. The following options for loading debug information are available:
Add Symbols FileLoads additional debug information into the debugger.
Load Debug InfoLoads debug information into the debugger.
Load Image and Debug InfoLoads the application image on to the target, and loads the debug information from the sameimage into the debugger.
Load OffsetSpecifies a decimal or hexadecimal offset that is added to all addresses within the image. Ahexadecimal offset must be prefixed with 0x.
Set PC to entry pointSets the PC to the entry point when loading image or debug information so that the code runsfrom the beginning.
Note
The option is not available for the Add Symbols File option.
16 Reference16.4 About loading debug information into the debugger
ARM DUI0446Z Copyright © 2010-2016 ARM Limited or its affiliates. All rightsreserved.
16-499
Non-Confidential
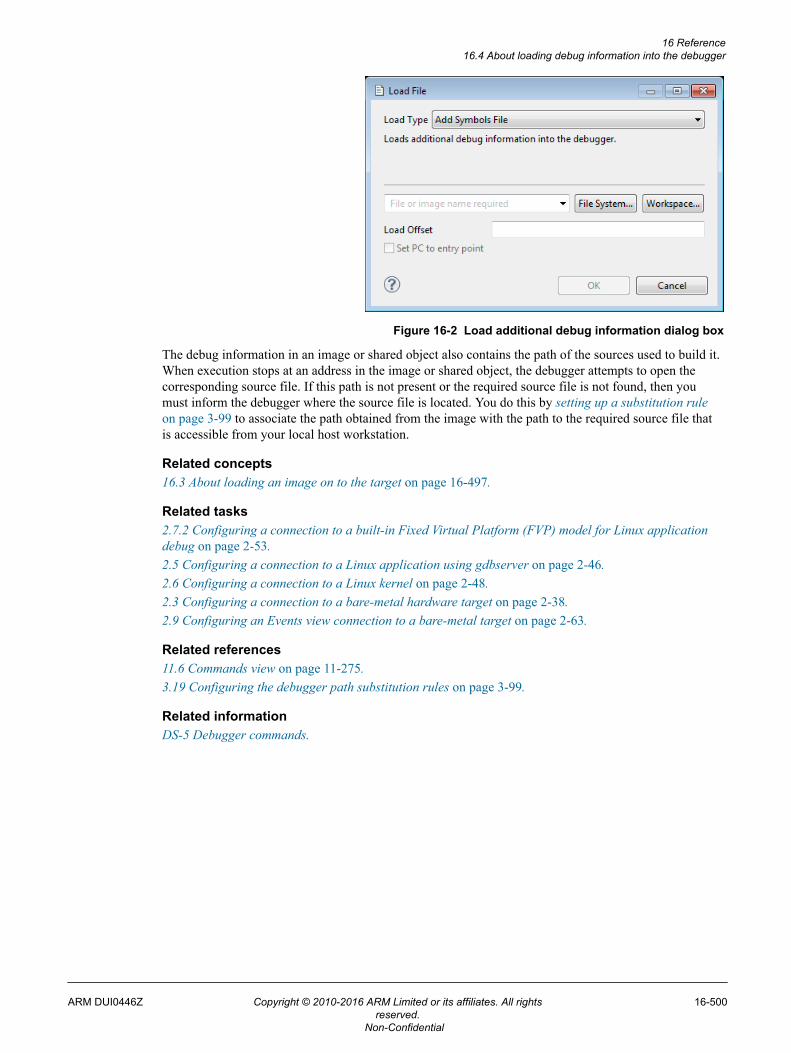
Figure 16-2 Load additional debug information dialog box
The debug information in an image or shared object also contains the path of the sources used to build it.When execution stops at an address in the image or shared object, the debugger attempts to open thecorresponding source file. If this path is not present or the required source file is not found, then youmust inform the debugger where the source file is located. You do this by setting up a substitution ruleon page 3-99 to associate the path obtained from the image with the path to the required source file thatis accessible from your local host workstation.
Related concepts16.3 About loading an image on to the target on page 16-497.
Related tasks2.7.2 Configuring a connection to a built-in Fixed Virtual Platform (FVP) model for Linux applicationdebug on page 2-53.2.5 Configuring a connection to a Linux application using gdbserver on page 2-46.2.6 Configuring a connection to a Linux kernel on page 2-48.2.3 Configuring a connection to a bare-metal hardware target on page 2-38.2.9 Configuring an Events view connection to a bare-metal target on page 2-63.
Related references11.6 Commands view on page 11-275.3.19 Configuring the debugger path substitution rules on page 3-99.
Related informationDS-5 Debugger commands.
16 Reference16.4 About loading debug information into the debugger
ARM DUI0446Z Copyright © 2010-2016 ARM Limited or its affiliates. All rightsreserved.
16-500
Non-Confidential
16.5 About passing arguments to main()ARM DS-5 Debugger enables you to pass arguments to the main() function of your application.
You can use one of the following methods:• Using the Arguments tab in the Debug Configuration dialog box.• On the command-line (or in a script), you can use either:
— set semihosting args <arguments>— run <arguments>.
Note
Semihosting must be active for these to work with bare-metal images.
Related references3.17 Using semihosting to access resources on the host computer on page 3-95.3.18 Working with semihosting on page 3-97.11.44 Debug Configurations - Arguments tab on page 11-368.
Related informationDS-5 Debugger commands.
16 Reference16.5 About passing arguments to main()
ARM DUI0446Z Copyright © 2010-2016 ARM Limited or its affiliates. All rightsreserved.
16-501
Non-Confidential
16.6 Running an imageThis describes how to run an application image on a target.
Use the Debug Configurations dialog box to set up a connection and define the run control options thatyou want the debugger to do after connection. To do this select Debug Configurations... from the Runmenu.
After connection, you can control the debug session by using the toolbar icons in the Debug Controlview.
Prerequisites
Before you can run an image it must be loaded onto the target. An image can either be preloaded on atarget or loaded onto the target as part of the debug session.
Note
The files that resides on the target do not have to contain debug information, however, to be able todebug them you must have the corresponding files with debug information on your local hostworkstation.
Related references11.6 Commands view on page 11-275.11.40 Debug Configurations - Connection tab on page 11-358.11.41 Debug Configurations - Files tab on page 11-361.11.42 Debug Configurations - Debugger tab on page 11-364.11.44 Debug Configurations - Arguments tab on page 11-368.11.45 Debug Configurations - Environment tab on page 11-370.
Related informationDS-5 Debugger commands.
16 Reference16.6 Running an image
ARM DUI0446Z Copyright © 2010-2016 ARM Limited or its affiliates. All rightsreserved.
16-502
Non-Confidential
16.7 Updating multiple debug hardware unitsTo update multiple debug hardware units, use the dbghw_batchupdater command line utility.
The command line utility, dbghw_batchupdater, enables you to:• Install firmware on a group of DSTREAM or RVI units.• View the firmware versions on a group of DSTREAM or RVI units.
The input to dbghw_batchupdater is a file containing a list of DSTREAM or RVI units. Each line in theinput file is a string that specifies a single DSTREAM or RVI connection. Firmware images are availablewithin a subdirectory of the DS-5 installation.
Syntax
dbghw_batchupdater -list file [-option]...
Where:
list file Specifies the file containing a list of DSTREAM or RVI connection strings.option: log file
Specifies an output file to log the status of the update.updatefile file
Specifies a file containing the path to the firmware.i
Installs the firmware on the units. To install the firmware, you must also specify theupdatefile option.
vLists the firmware versions.
hDisplays help information. This is the default if no arguments are specified.
Example 16-1 Examples
# Input file C:\input_file.txt contains:# TCP:ds-sheep1# TCP:DS-Rhubarb
# List firmware versions.dbghw_batchupdater -list "C:\input_file.txt" -v Versions queried on 2014-06-10 10:42:36TCP:ds-sheep1: 4.18.0 Engineer build 3TCP:DS-Rhubarb: 4.17.0 build 27
# Install firmware on DSTREAMsdbghw_batchupdater.exe –list “C:\input_file.txt” -i –updatefile “C:\Program Files\DS-5\sw\debughw\firmware\ARM-RVI-4.17.0-27-base.dstream” –log out.log
Related references11.54 Debug Hardware Configure IP view on page 11-382.11.55 Debug Hardware Firmware Installer view on page 11-384.
16 Reference16.7 Updating multiple debug hardware units
ARM DUI0446Z Copyright © 2010-2016 ARM Limited or its affiliates. All rightsreserved.
16-503
Non-Confidential